Goodbody Stockbrokers (trading as Goodbody) is regulated by the Central Bank of Ireland. For the attention of US clients of Goodbody Securities Inc, this third-party research report has been produced by our affiliate Goodbody Stockbrokers. Please see the end of this report for analyst certifications and other important disclosures. Irish Property A detailed analysis of the prospects for Irish Property Foundations of recovery Economic Research 27 Sep 2013 New property cycle begins as domestic demand starts to recover Following record falls in property prices (commercial -67%, residential -50%) and construction output (-80%), we believe the property market is set for better times. This will be driven by domestic demand returning to growth in 2014 and continued strength in FDI. As a result, supply-demand imbalances will start to emerge in some segments of the property market, especially in Greater Dublin. Commercial property assets, particularly offices, offer significant value Our analysis shows that the office market, particularly in Dublin, offers the best investment prospects. This is based on limited availability of quality stock in key locations, with no new builds on the horizon and increasing demand from the IT/Financial sectors as Dublin becomes a hub for such activities. All of which will put upward pressure on rents which remain at half of peak 2007 levels. Returns are also attractive in other commercial market segments, but also face more fundamental challenges, particularly in the retail sector. Dublin to lead housing recovery with total completions of 25k by 2020 Based on relatively conservative assumptions, Irish housing demand is expected to increase from the current level of less than 10k p.a. to 26-36k by 2026, with over a third of this in Dublin. These demand projections underpin our house completion forecasts of c.25k by 2020 and 33k in 2026. The strong demand for housing in Greater Dublin, coupled with limited supply, means that prices will experience the most upward pressure in the capital. Indeed, recent pricing trends suggest that this has already begun. Market conditions in other parts of Ireland will be more challenging given excess supply, especially in the West & Border counties. Scope for Irish construction sector to grow strongly Construction activity in Ireland now represents only 7% of GNP, down from 25% at the peak and versus a European LT average of 12%. The strong demand that we see in both the housing and office markets, coupled with a recovery in other segments of the construction sector, underpins our forecast for construction output growth of 10% p.a. which implies the sector accounting for 11% of GNP by 2020. Opportunity knocks on playing the Irish property recovery Our detailed analysis gives us increasing comfort that the Irish property sector has turned the corner. From an investment perspective, this can be played a number of ways : (i) directly through the underlying asset, especially Dublin Offices where we see returns of circa 10% p.a; (ii) via a REIT; (iii) construction related stocks, especially Grafton as it has the biggest exposure at over 20% of sales, (iv) Financials stocks, particularly Bank of Ireland, where risks to forecasts are to the upside; (v) the balance sheet of the banks, in particular the BKIR cocos and covered bonds, and;(vi) through the sovereign, as a general play on Ireland. 0 50 100 150 200 250 300 350 400 450 Index (1983=100) GDP Housebuilding Comm property prices (real) Resi prices (real) GNP Source: CSO, DoELG, IPD, Goodbody Ireland's property crash in an historical context Residential prices have halved Real commercial property prices are 25% below 1983 levels Housebuilding at record lows -6 -4 -2 0 2 4 6 8 10 12 14 1985 1987 1989 1991 1993 1995 1997 1999 2001 2003 2005 2007 2009 2011 2013 % Commercial yield 10-year bond yield Spread Average spread Source: IPD, FactSet, Goodbody Commercial yields at a record high relative to bond yields 0% 5% 10% 15% 20% 25% 30% 1997 1999 2001 2003 2005 2007 2009 2011 2013 2015 2017 2019 % of GNP Base case Conservative Optimistic EU historical average Source: CSO, Euroconstruct, Goodbody Scope for significant growth in construction - scenario analysis Economists Dermot O'Leary +353-1-641-9167 [email protected] Juliet Tennent +353-1-641-9469 [email protected]

Welcome message from author
This document is posted to help you gain knowledge. Please leave a comment to let me know what you think about it! Share it to your friends and learn new things together.
Transcript

Goodbody Stockbrokers (trading as Goodbody) is regulated by the Central Bank of Ireland. For the attention of US clients of Goodbody
Securities Inc, this third-party research report has been produced by our affiliate Goodbody Stockbrokers. Please see the end of this
report for analyst certifications and other important disclosures.
Irish Property A detailed analysis of the prospects for Irish Property
Foundations of recovery
Economic Research 27 Sep 2013
New property cycle begins as domestic demand starts to recover
Following record falls in property prices (commercial -67%, residential -50%) and
construction output (-80%), we believe the property market is set for better times.
This will be driven by domestic demand returning to growth in 2014 and continued
strength in FDI. As a result, supply-demand imbalances will start to emerge in
some segments of the property market, especially in Greater Dublin.
Commercial property assets, particularly offices, offer significant value
Our analysis shows that the office market, particularly in Dublin, offers the best
investment prospects. This is based on limited availability of quality stock in key
locations, with no new builds on the horizon and increasing demand from the
IT/Financial sectors as Dublin becomes a hub for such activities. All of which will
put upward pressure on rents which remain at half of peak 2007 levels. Returns
are also attractive in other commercial market segments, but also face more
fundamental challenges, particularly in the retail sector.
Dublin to lead housing recovery with total completions of 25k by 2020
Based on relatively conservative assumptions, Irish housing demand is expected to
increase from the current level of less than 10k p.a. to 26-36k by 2026, with over
a third of this in Dublin. These demand projections underpin our house completion
forecasts of c.25k by 2020 and 33k in 2026. The strong demand for housing in
Greater Dublin, coupled with limited supply, means that prices will experience the
most upward pressure in the capital. Indeed, recent pricing trends suggest that
this has already begun. Market conditions in other parts of Ireland will be more
challenging given excess supply, especially in the West & Border counties.
Scope for Irish construction sector to grow strongly
Construction activity in Ireland now represents only 7% of GNP, down from 25% at
the peak and versus a European LT average of 12%. The strong demand that we
see in both the housing and office markets, coupled with a recovery in other
segments of the construction sector, underpins our forecast for construction output
growth of 10% p.a. which implies the sector accounting for 11% of GNP by 2020.
Opportunity knocks on playing the Irish property recovery
Our detailed analysis gives us increasing comfort that the Irish property sector has
turned the corner. From an investment perspective, this can be played a number
of ways : (i) directly through the underlying asset, especially Dublin Offices where
we see returns of circa 10% p.a; (ii) via a REIT; (iii) construction related stocks,
especially Grafton as it has the biggest exposure at over 20% of sales, (iv)
Financials stocks, particularly Bank of Ireland, where risks to forecasts are to the
upside; (v) the balance sheet of the banks, in particular the BKIR cocos and
covered bonds, and;(vi) through the sovereign, as a general play on Ireland.
0
50
100
150
200
250
300
350
400
450
Index (
1983=
100)
GDP Housebuilding Comm property prices (real) Resi prices (real) GNP
Source: CSO, DoELG, IPD, Goodbody
Ireland's property crash in an historical context
Residential prices have halved
Real commercial property prices
are 25% below 1983 levels
Housebuilding at record lows
-6
-4
-2
0
2
4
6
8
10
12
14
1985 1987 1989 1991 1993 1995 1997 1999 2001 2003 2005 2007 2009 2011 2013
%
Commercial yield 10-year bond yield Spread Average spread
Source: IPD, FactSet, Goodbody
Commercial yields at a record high relative to bond yields
0%
5%
10%
15%
20%
25%
30%
1997 1999 2001 2003 2005 2007 2009 2011 2013 2015 2017 2019
% o
f G
NP
Base case Conservative Optimistic EU historical average
Source: CSO, Euroconstruct, Goodbody
Scope for significant growth in construction - scenario analysis
Economists
Dermot O'Leary
+353-1-641-9167
Juliet Tennent
+353-1-641-9469

Goodbody Economy - Ireland
Page 2 27 Sep. 2013
Key Themes
The property industry has arguably played the most influential role in the Irish economy over recent
years. Between 2002 and 2007, it played a crucial role in growth in employment, tax revenues, credit
and output. From 2007 onwards, the industry collapse triggered knock-on implications for the banks,
household wealth and the depth of the recession. Prices and output in the sector now appear to be
stabilising. This report provides a comprehensive analysis of the prospects for the sector. Given the
importance of the economic cycle to developments in the sector, the report begins with an updated view
on the economic outlook. This is followed by a detailed appraisal of the prospects for the commercial
property market as well as a forecast of potential construction output.
Ireland & Property – beginning a new cycle
Property cycles have been an important feature of Irish economic history. The reasons for their
frequency in Ireland may partly be explained by both government intervention (property tax
reliefs for example) and, in some cases, a lack thereof. In the most recent instance,
inappropriately low interest rates stoked an unprecedented boom that government policy did
little to counteract until it was too late, thus sowing the seeds for a bust of equally
unprecedented magnitude.
While Ireland is still dealing with the after-effects of this crash, it is important to recognise the
inherent cyclical nature of property. Historical analysis of price and output changes, coupled
with evidence of an improvement in the wider economy, suggests that a new cycle may be
taking hold. On the former, commercial property prices are now 25% below 1983 levels in real
terms. Growth in house prices is now in line with the growth in incomes over the last thirty
years, while housebuilding is back at levels last seen in the early 1960s. A gradual economic
recovery should be enough to maintain a new property cycle in the coming years.
An urban-led recovery
Ireland is in the midst of a gradual recovery from a very painful recession. The severity of the
recession was a function of the very unbalanced position of the Irish economy prior to the
international financial crisis. At that time, investment accounted for 31% of GNP, relative to a
long-term average of 23%. Within this, construction investment was the key outlier,
representing 25% of GNP, relative to a long-term average of 14%. A rebalancing was overdue.
This rebalancing has now fully played out. Investment currently accounts for just 13% of GNP,
the lowest since at least 1970. Construction investment stands at just 7% of GNP, half its long-
term average. Recent evidence suggests that both business investment and construction are
growing again and are forecast, in 2014, to contribute to the first year of growth in domestic
demand since 2007.
By historical standards, the recovery in the Irish economy is expected to be a muted one, due
to the ongoing deleveraging in the household sector. Recovery is also not anticipated to be
evenly balanced across the Irish economy for two reasons. Firstly, the collapse in construction
will have longer lasting effects in some parts of the country due to the oversupply of properties
and the lingering impact of unemployment. Secondly, urban areas have been taking a
disproportionate share of the foreign direct investment coming into Ireland, thus contributing to
a recovery in labour markets and overall economic output in these areas. Prospects for recovery
in property markets must be seen in this context
Commercial property – a classic cyclical industry
Commercial property is highly correlated with the economic cycle. Over the past thirty years,
commercial property values have tended to lead cycles in domestic demand, while commercial
construction has tended to lag. Although the most recent cycle was the fourth in the last thirty
years, it was the most severe by far. Commercial property values fell by a total of 67% from
the peak, returning values to 1998 levels in nominal terms.

Goodbody Economy - Ireland
27 Sep. 2013 Page 3
From an investment point of view, there are three ingredients in determining the likely medium
term performance of commercial property: (1) Income; (2) Flows and; (3) Timing. The average
equivalent yield on commercial property in Ireland currently stands at 8.8%. Relative to Irish
government bonds, commercial property yields are at the highest level in at least thirty years.
While some of this reflects expectations of falling rents once leases come to an end (market
rents have fallen by 50% over recent years), even allowing for this, a reversionary yield of
6.8% remains attractive. Investors obviously perceive value, based on investment in Irish
commercial property of over €1bn this year. Historical precedence suggests that the market has
reached a turning point in terms of values and rents.
Given the scale and nature of foreign direct investment coming into the country and the
expected ongoing reduction in vacancy rates, the office sector offers the best prospects for
growth over the coming years. The Dublin office market is no stranger to boom and bust cycles,
with one typically occurring every decade. No new office building is expected until at least
2016, while the last completion occurred in early 2011. While headline vacancy rates are high,
there is a limited amount of large office accommodation available in the capital. The latest data
show that rents and capital values have started to increase and we expect a further reduction in
vacancy rates will lead to a continuation of this trend.
Retail remains the weakest sector of the commercial property market, with rents and capital
values continuing to fall sharply in 2013. While yields are at attractive levels, the industry faces
continuing difficulties with low levels of consumer spending, “strategic examinerships” and a
continued shift to online and out of city centre locations. Industrial rents have grown for two
consecutive quarters and there is a notable pick-up in transactions. There are reasons to be
cautiously optimistic on the sector.
Residential property – A regional story
One must be careful in assessing the prospects for the “Irish housing market”. More than any
other market, the prospects differ depending on the geographic location and the type of
property in question. National statistics suggest that prices rose on an annual basis in June
2013 for the first time in five and a half years. However, this is being driven by Dublin, where
prices are rising at an annual pace of 11%, whereas prices continue to fall outside the capital.
Based on our analysis of supply and demand, we believe this multi-speed market will continue.
After a 50% fall, residential property prices are below long-term averages (based on various
valuation metrics), but not dramatically so. Relative to disposable income per capita, house
prices are estimated to be 10% below the long-term average, while rental yields are modestly
above the long-term spread to government bond yields. Historical analysis suggests that
Ireland’s crash is the largest in any developed economy since 1970. That same historical
evidence also suggests that real price growth averages 6% per annum in the five years
following the trough. A similar occurrence in Ireland would mean that 40% of the drop in prices
would be recovered within five years, leaving prices still down 30% from the peak.
Census 2011 revealed that 12% of homes were vacant, with significant variations by location
and type (25% for apartments & 10% for houses). Based on assumptions for household
formation, we have estimated the time required to work off excess stock and thus recommence
building. The Greater Dublin area requires building to start immediately, while in parts of the
country (Border counties), no net new building will be required until the end of the decade.
Combining household formation and the likely evolution of the vacant stock, the period from
2011-2016 requires new build in the range of 9,000-10,000, in line with current output levels.
However, we estimate that all of this supply should be within in the Greater Dublin area. As
supply is worked through and the number of households continues to rise, we estimate that
housing demand will rise to 21,000-26,000 units in the period from 2016 to 2021, before rising
further to 26,000-36,000 in 2021-2026. This underpins our forecast for 25,000 completions by
2021 and 33,000 by 2026.

Goodbody Economy - Ireland
Page 4 27 Sep. 2013
Strong growth potential in construction sector from here
The value of construction output has fallen by 80% since 2007. As a result, construction output
now amounts to just 7% of GNP, half its long-term average. While a period of undershoot was
required following the boom of the 2000s, there is scope for significant growth from this level
over the medium term. As a comparison, construction accounts for 10% of GDP on average
across Europe, while the long term average stands at 11%-12%.
All components of construction output have fallen sharply over recent years, but the collapse in
residential construction output has had the biggest effect on total output, falling from 14% of
GNP to just 4%. Non-residential activity is estimated at 1% of GNP, relative to a European
average of 3%, while civil engineering represents just 1.7% of GNP (2.5% in Europe).
We posit three scenarios for construction output over the period to 2020. In the base case,
construction output rises to 11% of GDP, translating into 10% annual growth in output. Under a
more conservative scenario, which may come about due to continuing capital constraints in the
sector for example, output grows to just 9% of GNP by 2020. Even under this scenario, output
would grow at an annual pace of 7%. A more optimistic scenario that sees construction back to
13% of GNP, would see 13% per annum compound growth over the period
Returning the construction sector to “normal” levels could have a profound impact on
employment in the sector. A normal level of output could lead to construction employment
growing to 157,000, relative to the current level of c.100,000.
How to play Irish property
There are a number of ways for investors to play the recovery in Irish property, ranging from
low income/low risk approaches like covered bonds to direct property or direct equity exposure.
Equity: REITs, introduced to Ireland for the first time earlier this year, are the purest play on
recovery in the Irish property market. At the current time, there is only one REIT on the market
(Green). The banks also offer a leveraged play on recovery in the sector. Improving property
trends provide more comfort on credit loss forecasts, strengthening our positive Bank of Ireland
investment case. We have upgraded our PT from 23c to 26c. Among the construction stocks,
Grafton has the largest exposure to an Irish recovery, which represents 20% of group sales.
Credit: We would recommend that investors consider new ACS issues from the banks given the
improving backdrop for the underlying collateral. We particularly like Bank of Ireland’s 2016
contingent convertible securities which are yielding 7.5%. Basel III transition rules Core Equity
Tier 1 ratios provide almost €3.5-4.0bn of capital protection to the 8.25% trigger on the cocos.
Direct Property & Loans: In this instance, most focus will be on the commercial side given
the larger bite-size, especially Dublin Offices where we see returns of circa 10% p.a. Disposals
from deleveraging banks will also provide opportunities.
Sovereign: The collapse in the property market has played a significant role in the
deterioration in the public finances over recent years, whether in relation to collapse in tax
revenues coming from the sector or the recapitalisation of the banking system. A recovery in
the sector should reduce contingent liabilities in the banking system and also in NAMA. It should
also help to improve the government fiscal position.

Goodbody Economy - Ireland
27 Sep. 2013 Page 5
Contents
Key Themes 2
Introduction - Ireland & property – A volatile relationship 7
Macroeconomic backdrop 9
Commercial property 16
The office market 19
When will building start again? 25
Retail Market 27
The Industrial Market - Showing signs of stabilisation 29
Irish residential property market 31
Estimating medium-term housing demand 39
The Construction Sector 44
Where next for the construction sector? 49
How to play Irish Property 51
Appendix – Glossary of Property Terms 56

Goodbody Economy - Ireland
Page 6 27 Sep. 2013

Goodbody Economy - Ireland
27 Sep. 2013 Page 7
Introduction - Ireland & property – A volatile relationship
Ireland has a long and colourful history with property. The country boasts one of the highest home
ownership rates in the world, partly reflecting cultural legacies but also due to government policy that
encourages ownership of property over rental. Government policy also incentivised construction of a
whole array of residential and non-residential building in the period from the mid-1980s to 2006
(property tax incentives). Public infrastructure spending has also been through a number of cycles,
ranging from the boom of the early 2000s to the recent dearth in activity.
Property cycles have been an important and frequent feature of Irish economic history. The reasons for
their scale and frequency may partly be explained by both government intervention and the lack thereof.
For instance, the most recent boom and bust episode in the Irish property market was partly fuelled by
inappropriate interest rates, but also government policy which did little to counteract this buoyancy. This
led to a boom in property construction, values, property-related taxation and speculation of epic
proportions. The subsequent collapse has been equally spectacular.
The following chart illustrates longer-term developments for five main variables in the Irish property
market – economic growth (GDP & GNP), house-building, commercial property prices and house prices.
We have rebased all variables to 1983. The scale of recent decline is stark when put in this context.
House building is at the lowest level during this time period, despite continued growth in the population
over recent years. Commercial prices, in real terms, are now more that 25% below 1983 levels, while
real residential property prices have fallen to 1998 levels. All variables have fallen below the growth in
real GDP over the period, while house price growth is now exactly in line with real GNP growth (a more
appropriate variable for income growth for Ireland).
Ireland’s property crash in a historical context
Source: CSO, DoELG, IPD, Goodbody
0
50
100
150
200
250
300
350
400
450
Index (
1983=
100)
GDP Housebuilding Comm property prices (real) Resi prices (real) GNP
Residential prices have halved
Real commercial property prices are 25% below 1983 levels
Housebuilding at record lows

Goodbody Economy - Ireland
Page 8 27 Sep. 2013
The nature of property markets is that they are inherently prone to cycles. These cycles differ in scale
and duration, but typically follow a consistent pattern. At first, low interest rates and economic growth
fuel an increase in demand for property. This pushes prices upwards, increasing the incentive to build.
Expectations of a continued rise in prices fuel an increase in speculation. At this stage, policymakers,
particularly central bankers, step in to slow the economy. This reduces the profit on speculation and
building, which leads to a slowdown in investment. Demand for property also falls and consequently
prices begin to decline. Eventually, they reach a level that is attractive once again, economic growth
resumes and a new cycle begins.
Calling turning points in property cycles is difficult, but it is clear from our historical analysis that
property prices and activity have fallen well below the decline in economic activity generally, as
measured by GDP. Relative to GNP, commercial prices, non-residential building and residential
construction remain substantially below levels justified by the developments in the broader economy.
Although the Irish economy is still dealing with the after-effects of the property collapse, particularly in
relation to unemployment and household debt, there are strong indications that the economic cycle has
turned. The recovery will be uneven, a backdrop likely to be mirrored in the property sector. While not
uniform across the country, our analysis suggests that a new property cycle has begun.

Goodbody Economy - Ireland
27 Sep. 2013 Page 9
Macroeconomic backdrop
A recovery is in train but it is uneven
Ireland is in the midst of a shallow recovery from a very painful recession. While supply-side drivers
(population, productivity, competitiveness) remain supportive of growth, the economy continues to be
held back by a combination of deleveraging, fiscal consolidation and low levels of new bank lending.
Nevertheless, significant progress has been made since the arrival of the Troika in November 2010 to
return public finances to health, rehabilitate the banking system and improve the competitive position of
the Irish economy. While this period of restructuring and reform has been painful, the country is set to
reap the benefits over the coming years.
Post strong export-led growth in the 1995-2001 period, Irish economic growth was driven by domestic
factors from 2003 to 2007. A rapid expansion in credit was a key ingredient, which fuelled growth in
household debt, construction activity and speculation. The resultant boom meant that the Irish economy
become very unbalanced in the period immediately prior to the international financial crisis. This is
illustrated in the chart below, which shows that investment accounted for 31% of GNP at the peak,
relative to a long-term average of 23% of GNP. Construction investment was key in this; construction
output grew to a peak of 25% of GNP (long-term average is 14% of GNP). The rebalancing witnessed
since the peak was necessary, and extremely painful. However, recent trends suggest that this
rebalancing has now been completed and both construction and non-construction investment is on the
increase again and will contribute to growth overall. History suggests that investment recoveries can be
quite vigorous in the aftermath of a collapse.
Rebalancing Act – Investment & Construction to GNP
Source: CSO, Goodbody
Private sector deleveraging remains both the biggest constraint on domestic spending and the key risk
to bank balance sheets. However, while this is likely to restrain growth, deleveraging does not preclude
a modest growth outturn.
0%
5%
10%
15%
20%
25%
30%
35%
1970 1973 1976 1979 1982 1985 1988 1991 1994 1997 2000 2003 2006 2009 2012
% o
f G
NP
Investment/GNP Construction/GNP Average Average

Goodbody Economy - Ireland
Page 10 27 Sep. 2013
Excessive growth in prices relative to euro area peers during this period led to a deterioration in
competitiveness that the country has been trying to regain over recent years. In this regard, Ireland has
seen the most rapid reduction in unit labour costs since the beginning of the crisis in the euro area.
Allied to permanent attractions like an English-speaking, well-educated workforce, a business-friendly
climate and an attractive corporation tax rate, Ireland has been able to return to export-led growth.
Although exports have slowed in 2013 on the back of industry-specific issues in the pharmaceutical
sector (the “patent cliff”), we expect that net exports will continue to be a key contributor to growth in
the coming years, albeit with a small contribution from domestic demand, starting in 2014.
Economic recovery now in train
Source: Goodbody
Irish economic growth forecasts
2010 2011 2012 2013f 2014f 2015f
Consumption 0.9% -1.6% -0.3% -0.7% 0.8% 1.1%
Government -6.9% -2.8% -3.7% -1.9% -1.5% -1.3%
Investment -22.6% -9.5% -1.0% -3.9% 6.4% 7.7%
Domestic Demand -5.0% -3.0% -1.1% -1.4% 1.1% 1.5%
Exports 6.4% 5.4% 1.6% 0.6% 3.7% 3.9%
Imports 3.6% -0.4% 0.0% 0.5% 2.4% 3.0%
GDP -1.1% 2.2% 0.2% 0.5% 2.4% 2.6%
GNP 0.5% -1.6% 1.8% 2.9% 1.9% 1.9%
Source: CSO, Goodbody estimates
-12%
-10%
-8%
-6%
-4%
-2%
0%
2%
4%
6%
8%
10%
2005 2006 2007 2008 2009 2010 2011 2012 2013f 2014f 2015f
% Y
oY
GDP Domestic demand

Goodbody Economy - Ireland
27 Sep. 2013 Page 11
Recent evidence suggests that recovery is being driven by the urban centres, particularly Dublin. There
are two main reasons for this trend:
The collapse in construction has had a disproportionate impact in rural locations. In Q4 2006,
one in seven workers (15%) was employed in the construction sector outside the Greater
Dublin area, relative to 10% in Greater Dublin.
Dublin has been able to attract a disproportionate amount of the FDI coming into Ireland,
mainly due to the growth in the Information and Communications Technology (ICT) sector in
the capital.
The second point here is key, as economic policy in Ireland is geared towards putting in place the
conditions to engineer an export-led recovery. The IDA is the body responsible for attracting FDI into
Ireland and has been instrumental in the substantial growth in multinationals based in the country. As
the Irish economy has developed over the last three decades, the focus for the IDA has changed too.
The following chart shows how this focus has shifted from manufacturing in the 1970s and 1980s to the
internet activities of the early 2000s. The current focus for the IDA is now the so-called “Smart
Economy” industries including ICT, medical technologies and finance.
Evolution of FDI focus in Ireland
Source: IDA
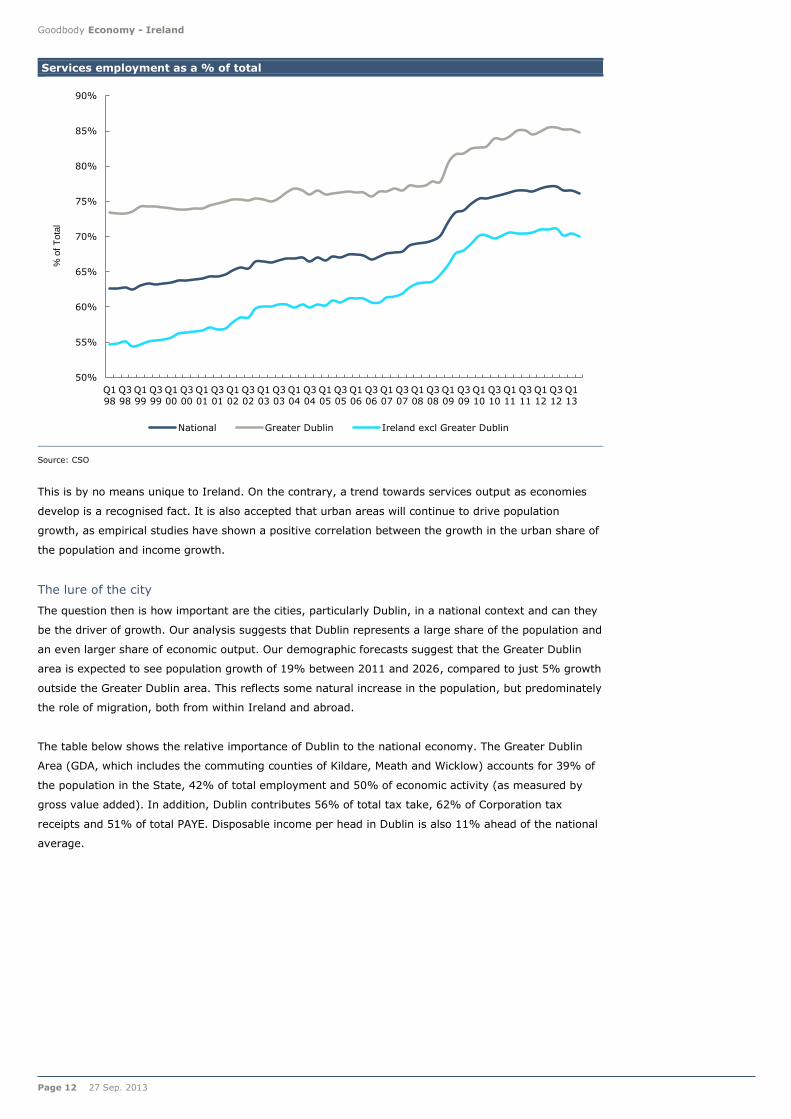
It is no surprise that the regional employment patterns reflect the shifts seen above as well as the
general increase in wealth levels. Specifically, the Irish economy has become predominately a service
economy. As of the second quarter of 2013, 76% of those employed in Ireland worked in the services
sector, relative to 66% ten years earlier. In Greater Dublin, the services sector is even more important,
representing 85% of the total (75% ten years earlier). This compares to just 70% outside of the Greater
Dublin area.
Goodbody Economy - Ireland
Page 12 27 Sep. 2013
Services employment as a % of total
Source: CSO
This is by no means unique to Ireland. On the contrary, a trend towards services output as economies
develop is a recognised fact. It is also accepted that urban areas will continue to drive population
growth, as empirical studies have shown a positive correlation between the growth in the urban share of
the population and income growth.
The lure of the city
The question then is how important are the cities, particularly Dublin, in a national context and can they
be the driver of growth. Our analysis suggests that Dublin represents a large share of the population and
an even larger share of economic output. Our demographic forecasts suggest that the Greater Dublin
area is expected to see population growth of 19% between 2011 and 2026, compared to just 5% growth
outside the Greater Dublin area. This reflects some natural increase in the population, but predominately
the role of migration, both from within Ireland and abroad.
The table below shows the relative importance of Dublin to the national economy. The Greater Dublin
Area (GDA, which includes the commuting counties of Kildare, Meath and Wicklow) accounts for 39% of
the population in the State, 42% of total employment and 50% of economic activity (as measured by
gross value added). In addition, Dublin contributes 56% of total tax take, 62% of Corporation tax
receipts and 51% of total PAYE. Disposable income per head in Dublin is also 11% ahead of the national
average.
50%
55%
60%
65%
70%
75%
80%
85%
90%
Q1
98
Q3
98
Q1
99
Q3
99
Q1
00
Q3
00
Q1
01
Q3
01
Q1
02
Q3
02
Q1
03
Q3
03
Q1
04
Q3
04
Q1
05
Q3
05
Q1
06
Q3
06
Q1
07
Q3
07
Q1
08
Q3
08
Q1
09
Q3
09
Q1
10
Q3
10
Q1
11
Q3
11
Q1
12
Q3
12
Q1
13
% o
f T
ota
l
National Greater Dublin Ireland excl Greater Dublin

Goodbody Economy - Ireland
27 Sep. 2013 Page 13
Regional analysis of the Irish economy (% of Total)
Population GVA Employment Unemployed Labour force
Disp. Income
per head*
Dublin 28 42 30 24 29 111
Mid East 12 8 12 13 12 100
Greater Dublin 39 50 42 37 41 108
Mid-West 8 7 8 9 8 99
South East 11 7 10 14 11 94
South West 14 18 15 12 15 99
Southern & Eastern 73 82 75 72 74 103
Border 11 7 10 11 10 90
Midland 6 4 6 8 6 89
West 10 8 10 9 10 96
Border, Midland & West 27 18 25 28 26 92
Source: Goodbody, CSO
*% of state average
Dublin is also the most attractive location for foreign direct investment into the country. The following
table is taken from a study completed for the Dublin Regional Authority (Dublin’s Role in the Irish and
Global Economy 2012, Brendan Williams et al). It shows that while Dublin’s share of IDA-supported
businesses is high at 47%, the capital particularly dominates in certain sectors, namely in the areas of
financial services (86% of total) and entertainment and media (83% of total). In an answer to a recent
Dail question, the Minister for Jobs, Enterprise & Innovation Richard Bruton confirmed that the FDI bias
towards Dublin has continued in 2013. Of a total of 275 site visits conducted by potential investors to
the end of August 2013, 152 or 55% had been to Dublin. This was in line with the trends seen in 2012,
when 52% of the 379 site visits conducted were to Dublin. Other urban centres of Cork (10%), Limerick
(7%) and Galway (4%) account for a further 20% of visits in 2013 with Waterford seeing almost 5% of
visits.
IDA site locations by sector type
Total Dublin Cork Galway Limerick Waterford Other
Financial Services 219 86% 2% 1% 1% 1% 8%
ICT 159 48% 19% 10% 5% 1% 18%
Industrial products &
services 96 15% 16% 7% 4% 5% 53%
Pharma 82 29% 27% 0% 0% 6% 38%
Medical Technologies 76 11% 11% 17% 7% 3% 53%
Consumer goods 56 25% 11% 0% 4% 9% 52%
Business services 40 48% 25% 3% 5% 3% 17%
Chemicals 20 30% 25% 0% 15% 0% 30%
Entertainment & media 6 83% 17% 0% 0% 0% 0%
Total 754 47% 13% 5% 3% 3% 29%
Source: Dublin Regional Authority
We believe that Dublin will continue to benefit from what is described as clustering or agglomeration
effects. This is the process by which commercial activity tends to cluster together, thus enjoying
economies of scale and access to a pool of skilled labour and complementary services and infrastructure.
This process tends to be self-reinforcing (i.e. success breeds success). In Dublin, the process could be
described as the Google-effect; multinationals in the IT sector have been attracted to Dublin due to the
success of Google, among others. Dublin, being the only city in Ireland of global scale, is also able to
attract highly skilled migrants to work in these industries.
Goodbody Economy - Ireland
Page 14 27 Sep. 2013
A “smart” economy needs an educated workforce…
In December 2008, the Irish government of the time set out its strategy for the development of the Irish
economy over the medium-term. While it included measures to stabilise the economy and the public
finances, it also to build a “Smart Economy” with a “thriving enterprise sector, high quality employment,
secure energy supplies, an attractive environment, and first-class infrastructure”. The strategy focuses
on four forms of capital accumulation that will drive economic growth – (i) human capital; (ii) physical
capital; (iii) environmental capital, and; (iv) social capital. The development of human capital is key
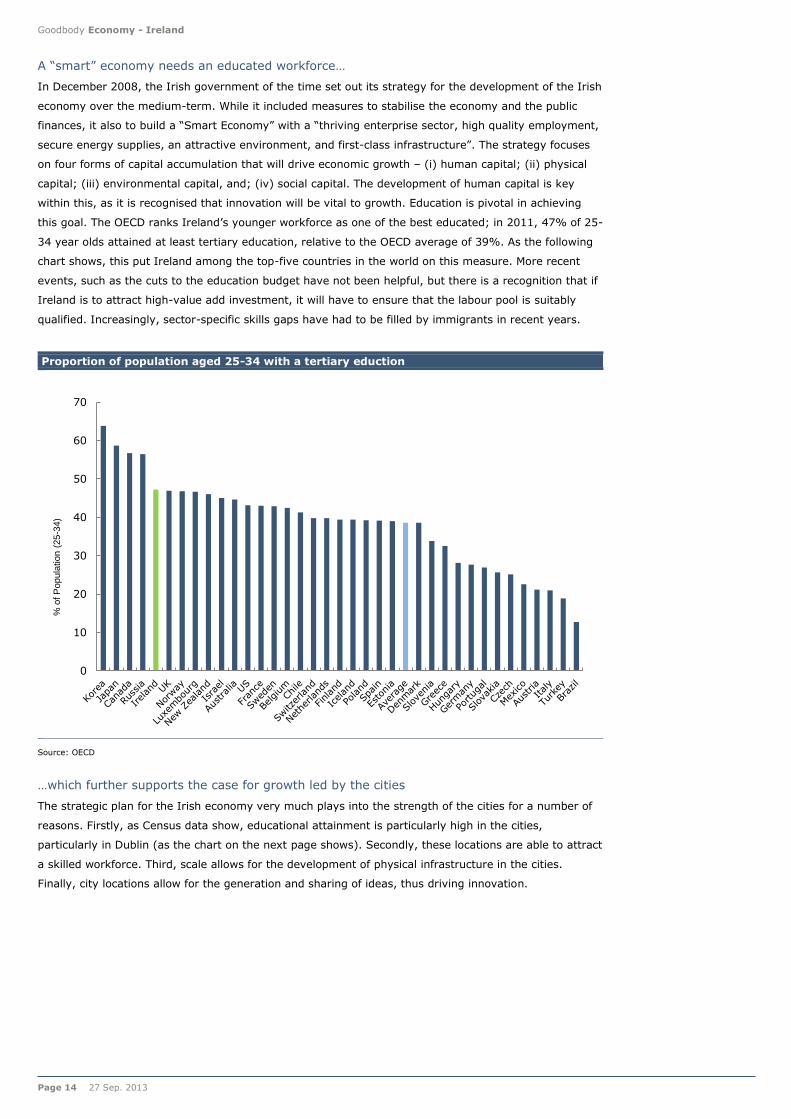
within this, as it is recognised that innovation will be vital to growth. Education is pivotal in achieving
this goal. The OECD ranks Ireland’s younger workforce as one of the best educated; in 2011, 47% of 25-
34 year olds attained at least tertiary education, relative to the OECD average of 39%. As the following
chart shows, this put Ireland among the top-five countries in the world on this measure. More recent
events, such as the cuts to the education budget have not been helpful, but there is a recognition that if
Ireland is to attract high-value add investment, it will have to ensure that the labour pool is suitably
qualified. Increasingly, sector-specific skills gaps have had to be filled by immigrants in recent years.
Proportion of population aged 25-34 with a tertiary eduction
Source: OECD
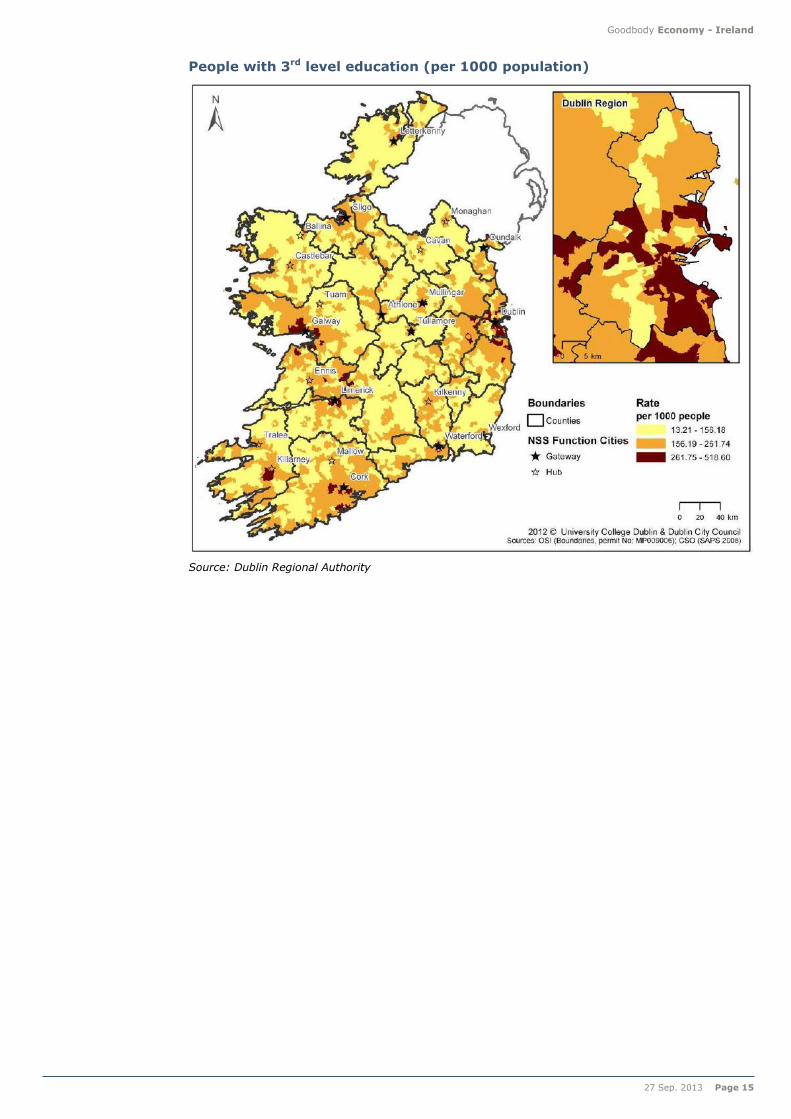
…which further supports the case for growth led by the cities
The strategic plan for the Irish economy very much plays into the strength of the cities for a number of
reasons. Firstly, as Census data show, educational attainment is particularly high in the cities,
particularly in Dublin (as the chart on the next page shows). Secondly, these locations are able to attract
a skilled workforce. Third, scale allows for the development of physical infrastructure in the cities.
Finally, city locations allow for the generation and sharing of ideas, thus driving innovation.
0
10
20
30
40
50
60
70
% o
f P
opula
tion (
25
-34)
Goodbody Economy - Ireland
27 Sep. 2013 Page 15
People with 3rd level education (per 1000 population)
Source: Dublin Regional Authority
Goodbody Economy - Ireland
Page 16 27 Sep. 2013
Commercial property
A play on the economic cycle
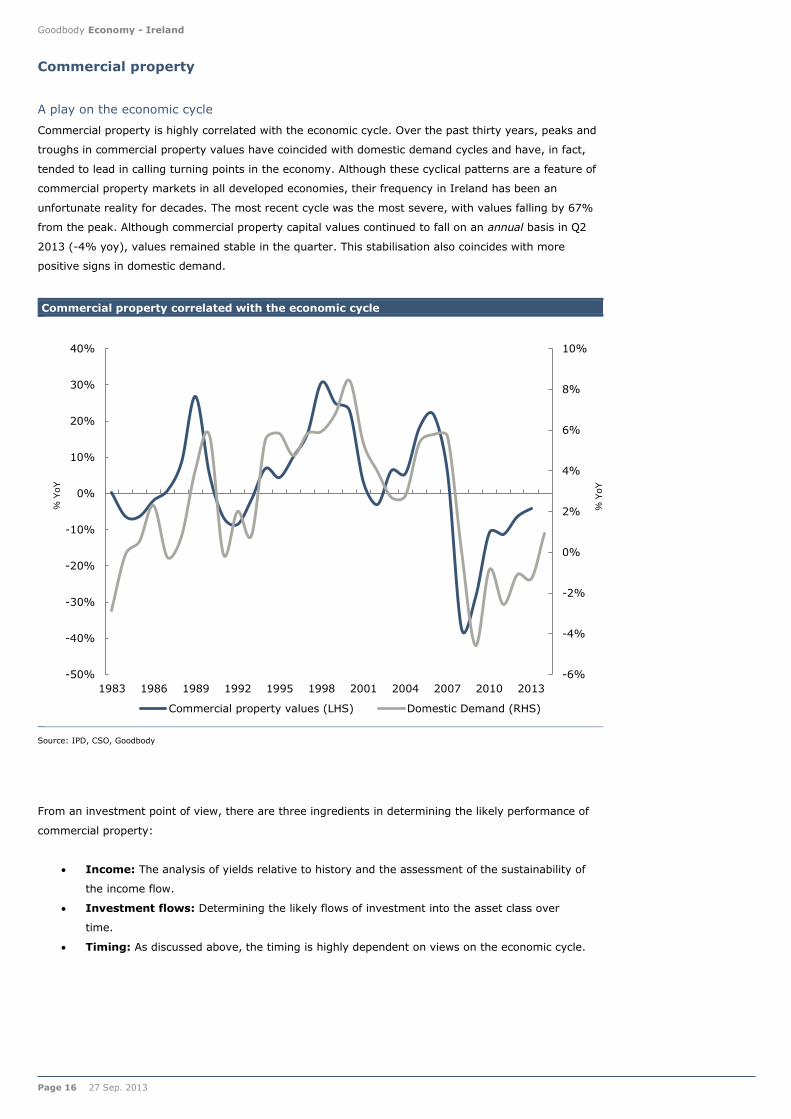
Commercial property is highly correlated with the economic cycle. Over the past thirty years, peaks and
troughs in commercial property values have coincided with domestic demand cycles and have, in fact,
tended to lead in calling turning points in the economy. Although these cyclical patterns are a feature of
commercial property markets in all developed economies, their frequency in Ireland has been an
unfortunate reality for decades. The most recent cycle was the most severe, with values falling by 67%
from the peak. Although commercial property capital values continued to fall on an annual basis in Q2
2013 (-4% yoy), values remained stable in the quarter. This stabilisation also coincides with more
positive signs in domestic demand.
Commercial property correlated with the economic cycle
Source: IPD, CSO, Goodbody
From an investment point of view, there are three ingredients in determining the likely performance of
commercial property:
Income: The analysis of yields relative to history and the assessment of the sustainability of
the income flow.
Investment flows: Determining the likely flows of investment into the asset class over
time.
Timing: As discussed above, the timing is highly dependent on views on the economic cycle.
-6%
-4%
-2%
0%
2%
4%
6%
8%
10%
-50%
-40%
-30%
-20%
-10%
0%
10%
20%
30%
40%
1983 1986 1989 1992 1995 1998 2001 2004 2007 2010 2013
% Y
oY
% Y
oY
Commercial property values (LHS) Domestic Demand (RHS)

Goodbody Economy - Ireland
27 Sep. 2013 Page 17
Income – Yields are at attractive levels
Total returns (see Glossary in Appendix for definitions of these commercial property terms) on Irish
property for the year to June 2013 were 5.3% with attractive income returns of approx. 9.9% off-setting
declines in capital values.
The recent stabilisation in capital values is being led by yield movements, which reflect the current
strong demand for property assets. Property Equivalent Yields have reached a turning point and have
now decreased by 20bp from a peak of 9.0% at end Q1 2013, having increased by 500bp from 4% at
the end of the property boom. At 8.8%, property equivalent yields compare favourably with yields on
other asset classes, with Irish 10 year bond yields now down to 4%. Even allowing for a risk premium of
4% over bond yields, current market pricing means hurdle rates for property investment will be
exceeded.
Commercial yields at a record high relative to bond yields
Source: IPD, FactSet, Goodbody
An initial yield (Rental Income/Gross Capital Value) of c.9.2% is clearly attractive, and is the primary
reason for the strong interest in the market. Investors, however, are not only concerned about the initial
level of income but also the sustainability of this income. With rents down by 50% since 2008, current
rental levels will not be sustained when leases come up for renewal. The Reversionary Yield (Rental
Value/Gross Capital Value) captures this phenomenon, but, at 6.8%, even this yield suggests that
commercial property represents a good investment.
The decline in rental values is likely to continue to impact on property market returns over the next few
years as existing leases approach expiry or break options. To gauge underlying yield movements since
the market peak, the chart below shows CBRE calculations of the yield on prime properties on the basis
of current market values and current market rents. There has been a substantial increase in income
yields, but the majority of markets are now seeing a hardening of yields.
-6
-4
-2
0
2
4
6
8
10
12
14
1985 1987 1989 1991 1993 1995 1997 1999 2001 2003 2005 2007 2009 2011 2013
%
Commercial yield 10-year bond yield Spread Average spread

Goodbody Economy - Ireland
Page 18 27 Sep. 2013
CBRE Ireland Equivalent Yield Series (%)
Peak Jul-13 Trending
Retail
Shops
Prime High Street 2.50 5.75 Stronger
Good Secondary High Street 3.50 7.00 Stronger
Prime Provincial 3.25 8.00 Stronger
Shopping Centres
Prime High Street 3.50 7.50 Stronger
Secondary 4.25 9.50 Stronger
Offices
Prime City Centre Dublin 4.25 6.25 Stronger
Secondary City Centre Dublin 4.25 7.50 Stronger
Suburban Dublin 5.00 8.50 Stronger
Primes Provincial 5.75 9.50 Stronger
Industrial
Prime Dublin 4.75 8.75 Stronger
Secondary Dublin 4.75 10.75 Stronger
Prime Provincial 5.75 12.00 Stable
Source: CBRE
Investment flows picking up strongly
Following an almost complete cessation in 2011, commercial property investment has picked up strongly
since the second half of 2012. Total investment in commercial property (not including loan sales) was
estimated by Savills to be €575m in 2011. The total for the first half of 2013 (€610m) already exceeds
this level and is expected to well over €1bn by the end of this year. Highlighting the preference for
offices, over 60% of the total investment since 2011 has been into this sector.
Investment in commercial property
Source: Savills
0
100
200
300
400
500
600
700
2009 2010 2011 2012 2013 (H1)
Euro
(m
)
Domestic Non-Domestic Unknown

Goodbody Economy - Ireland
27 Sep. 2013 Page 19
Occupier analysis
Unlike the much improved official dataset of the Irish residential market, the Irish non-residential
property market suffers from a lack of detailed data. This makes analysis of the sector more difficult, but
the in-house analysis and data within the various commercial property companies, along with yield and
rental data from IPD enables us to paint a relatively detailed picture of the commercial property market
in Ireland. Our analysis is divided in to the three main components of the commercial market:
Office
Retail
Industrial
The office market
A brief description
Ireland’s office market is dominated by the Dublin region, with the capital accounting for between 75%-
80% of the total office stock in the country (source: DTZ Sherry Fitzgerald & DKM). Given this, we focus
on the underlying supply and demand fundamentals, as well as trends and prospects for the capital in
our assessment of the office sector.
Location of Dublin office space
Source: Lisney
According to Lisney, the Dublin office market currently consists of 3.6m square metres of space.
Reflecting the boom in office construction since the upturn in the Irish economy from the mid-1990s
onwards, the majority (73%) of this space was built since 1990 and over half (53%) built since 2000.
From a geographical perspective, 63% of the space is located in the city centre, with the South Suburbs
at 18%, the North Suburbs at 18% and the West Suburbs at 8%.
Historical review of the Dublin office construction market reveals a series of volatile cycles that follow
economic cycles with a lag of 12-24 months. Since the 1960s, peaks are observed approximately every
ten years (1964, 1972/1973, 1982, 1991, 2001 and 2008). This is not uncommon in office markets
internationally, with studies showing that typical office market cycles last between 10-12 years.
City Region
63%
South Suburbs
18%
North Suburbs
11%
West Suburbs
8%

Goodbody Economy - Ireland
Page 20 27 Sep. 2013
Booms & busts in Dublin office construction
Source: Lisney
Rents
Office rents experienced similarly volatile cycles, with annual growth of 20% achieved in the ten years
since 1970. These peaks were closely aligned with economic cycle. Since 1970, office rents have
endured four periods of declines, with the most severe by far being the most recent cycle, where rents
declined by 50%. In previous cycles, rents declined for three to four years before growing modestly at
first and then accelerating quite dramatically thereafter. This is a reflection of the lagged nature of new
commercial building construction, whereby new activity is triggered by actual increased demand and
rental levels, but reflecting the time involved in planning, developing, finishing and letting, supply does
not immediately follow.
-50.0
0.0
50.0
100.0
150.0
200.0
250.0
300.0
350.0
Thousands (
sqm
)
1st boom (1971-1975)
2nd boom (1980-1982)
3rd boom (1990-1991)
4th boom (1996-2001)
5th boom (2006-2008)

Goodbody Economy - Ireland
27 Sep. 2013 Page 21
Real office rents* (1970-2012)
Source: Lisney, CSO *deflated by CPI
Current rental levels
After peaking at €670 per square metre in 2007, prime office rents fell to a trough of €320 per square
metre by early 2012. Recently, rents have trended above this level but remain more than 50% below
the 2007 peak. Indeed, prime office rents remain at levels last seen in 1998.
Rental growth from this point will be driven by supply and demand. In relation to the latter, one of the
determinants of office space demand will be cost. At the peak of the boom, Ireland was one of the most
expensive locations in Europe for office space. This is no longer the case.
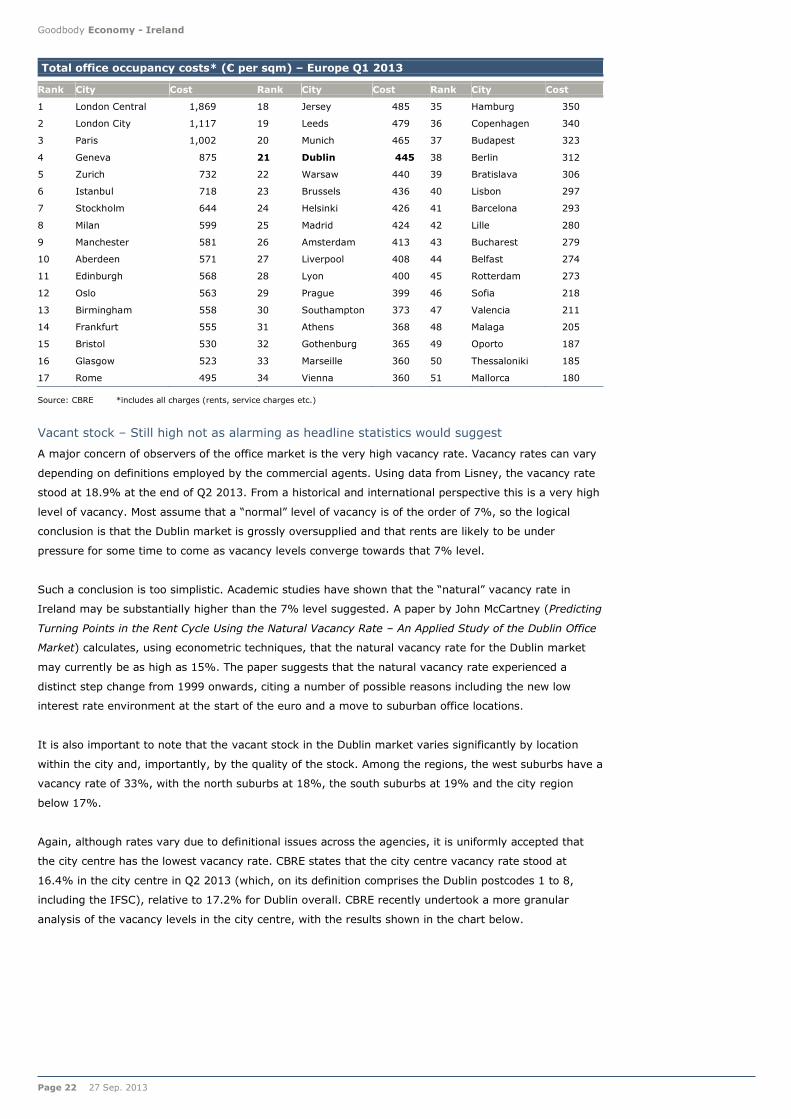
In 2008, Ireland was listed as the 14th most expensive office location in the world according to CBRE. In
the latest CBRE report, Ireland has fallen out of the top 50. Among European locations, Ireland is mid-
table, ranking 21st out of the fifty cities analysed. This puts Ireland on a par with Leeds in the UK and
Munich in Germany. In 2008, office costs in Ireland were on a par with Hong Kong, Abu Dhabi, Paris and
Midtown Manhattan. In other words, Ireland is now a much more attractive location from a cost
perspective relative to five years ago.
0
50
100
150
200
250
300
Dec
70
Dec
72
Dec
74
Dec
76
Dec
78
Dec
80
Dec
82
Dec
84
Dec
86
Dec
88
Dec
90
Dec
92
Dec
94
Dec
96
Dec
98
Dec
00
Dec
02
Dec
04
Dec
06
Dec
08
Dec
10
Dec
12
Index (
1970=
100)
Goodbody Economy - Ireland
Page 22 27 Sep. 2013
Total office occupancy costs* (€ per sqm) – Europe Q1 2013
Rank City Cost Rank City Cost Rank City Cost
1 London Central 1,869 18 Jersey 485 35 Hamburg 350
2 London City 1,117 19 Leeds 479 36 Copenhagen 340
3 Paris 1,002 20 Munich 465 37 Budapest 323
4 Geneva 875 21 Dublin 445 38 Berlin 312
5 Zurich 732 22 Warsaw 440 39 Bratislava 306
6 Istanbul 718 23 Brussels 436 40 Lisbon 297
7 Stockholm 644 24 Helsinki 426 41 Barcelona 293
8 Milan 599 25 Madrid 424 42 Lille 280
9 Manchester 581 26 Amsterdam 413 43 Bucharest 279
10 Aberdeen 571 27 Liverpool 408 44 Belfast 274
11 Edinburgh 568 28 Lyon 400 45 Rotterdam 273
12 Oslo 563 29 Prague 399 46 Sofia 218
13 Birmingham 558 30 Southampton 373 47 Valencia 211
14 Frankfurt 555 31 Athens 368 48 Malaga 205
15 Bristol 530 32 Gothenburg 365 49 Oporto 187
16 Glasgow 523 33 Marseille 360 50 Thessaloniki 185
17 Rome 495 34 Vienna 360 51 Mallorca 180
Source: CBRE *includes all charges (rents, service charges etc.)
Vacant stock – Still high not as alarming as headline statistics would suggest
A major concern of observers of the office market is the very high vacancy rate. Vacancy rates can vary
depending on definitions employed by the commercial agents. Using data from Lisney, the vacancy rate
stood at 18.9% at the end of Q2 2013. From a historical and international perspective this is a very high
level of vacancy. Most assume that a “normal” level of vacancy is of the order of 7%, so the logical
conclusion is that the Dublin market is grossly oversupplied and that rents are likely to be under
pressure for some time to come as vacancy levels converge towards that 7% level.
Such a conclusion is too simplistic. Academic studies have shown that the “natural” vacancy rate in
Ireland may be substantially higher than the 7% level suggested. A paper by John McCartney (Predicting
Turning Points in the Rent Cycle Using the Natural Vacancy Rate – An Applied Study of the Dublin Office
Market) calculates, using econometric techniques, that the natural vacancy rate for the Dublin market
may currently be as high as 15%. The paper suggests that the natural vacancy rate experienced a
distinct step change from 1999 onwards, citing a number of possible reasons including the new low
interest rate environment at the start of the euro and a move to suburban office locations.
It is also important to note that the vacant stock in the Dublin market varies significantly by location
within the city and, importantly, by the quality of the stock. Among the regions, the west suburbs have a
vacancy rate of 33%, with the north suburbs at 18%, the south suburbs at 19% and the city region
below 17%.
Again, although rates vary due to definitional issues across the agencies, it is uniformly accepted that
the city centre has the lowest vacancy rate. CBRE states that the city centre vacancy rate stood at
16.4% in the city centre in Q2 2013 (which, on its definition comprises the Dublin postcodes 1 to 8,
including the IFSC), relative to 17.2% for Dublin overall. CBRE recently undertook a more granular
analysis of the vacancy levels in the city centre, with the results shown in the chart below.

Goodbody Economy - Ireland
27 Sep. 2013 Page 23
Vacancy in Dublin offices varies significantly
Source: Lisney
Vacancy rates by quality of office space
Source: CBRE
Lisney has analysed Dublin city centre in even more detail by drilling down into what is considered as
the Central Business District (CBD) comprising of Dublin postal codes 1, 2 and 4, which accounts for
over 80% of the available office space in the city. Analysis of this area is key, as recent trends suggest
that occupiers prefer to take up the quality locations in the CBD first. In this regard, there is 309,450
sqm of space available in the CBD, accounting for 46% of the total available space in the capital.
However, almost one-third (29%) of this space is described as Grade C or obsolete, relative to 16% that
is described as obsolete for Dublin as a whole.
Vacant office space in Dublin
Grade A Grade B Grade C Total
Dublin 1 39,050 40,800 2,900 82,750
Dublin 2 31,250 58,750 57,600 147,600
Dublin 4 34,000 16,500 28,600 79,100
Total city centre 104,300 116,050 89,100 309,450
Non-city centre 215,700 128,950 15,900 360,550
Total Dublin 320,000 245,000 105,000 670,000
% of Total
% of Total Dublin
Dublin 1 47% 49% 4% 12%
Dublin 2 21% 40% 39% 22%
Dublin 4 43% 21% 36% 12%
Total city centre 34% 38% 29% 46%
Non-city centre 60% 36% 4% 54%
Total Dublin 48% 37% 16% 100%
Source: Lisney
Grade A: New modern accommodation, Grade B: Modern, previously occupied and of an acceptable standard, Grade C: Obsolete
Take-up levels
Take-up in the Dublin market is usually calculated on a gross basis (i.e. does not include those offices
that have been vacated in the period). Average annual take-up over the 1994-2012 period amounted to
163,500 sqm. Excluding the boom years of 2005-2007, this average drops to 153,000 sqm (Lisney).
Take up in the first half of 2013 amounted to 61,000 sqm, slightly ahead of the same period of 2012.
For the whole of 2012, take-up amounted to 142,000 sqm, only slightly below the long-term average.
Take-up for 2013 is expected to amount to close to last year’s level.
As one might expect, take-up has been dominated by Grade A and Grade B space over the recent years.
In 2012, these two categories accounted for 97% of the total take-up. Dublin city centre has been the
favoured location for tenants, with 61% of total take-up in 2012 and 55% in 2011, albeit helped by a
small number of large transactions (for example, Google in 2011 and the Central Bank in 2012).
0%
5%
10%
15%
20%
25%
30%
35%
40%
City
Region
North
Suburbs
Dublin
overall
South
Suburbs
West
Suburbs
Va
ca
ncy r
ate
(e
nd
-20
12
)
Sourc
e:
Lisne
y
Dublin
1/3/7 Dublin 2/4 Dublin 6/8 IFSC City Centre
overall
0%
5%
10%
15%
20%
25%
30%
Va
ca
ncy r
ate
Total Grade A
Sourc
e:
CBRE

Goodbody Economy - Ireland
Page 24 27 Sep. 2013
Office take-up by location
Source: Lisney
Given the emergence of the IT hub in Dublin, it is no surprise that the IT sector has been the biggest
source of demand. This was particularly the case in 2011 with the 19,000 sqm lease by Google, with a
more broad-based demand seen in 2012 across the different business sectors. More recently, the IT and
financial sectors dominated take-up in Q2 2013, accounting for 39% and 26% respectively.
Dublin office take-up by sector (% of total)
2003 2004 2005 2006 2007 2008 2009 2010 2011 2012
Professional
Services 10% 35% 27% 11% 11% 21% 17% 13% 6% 4%
Financial 28% 9% 26% 33% 45% 24% 17% 17% 18% 19%
State 18% 4% 5% 16% 10% 11% 8% 6% 6% 17%
IT 12% 19% 21% 11% 14% 20% 26% 32% 39% 26%
Pharmaceutical/
Health/life
sciences
6% 3% 4% 4% 9% 5% 5% 9% 5% 8%
Media
2% 0% 4%
Education
11% 3%
Other 26% 30% 18% 25% 10% 19% 27% 21% 16% 19%
Total ('000
sqm) 149 189 206 234 299 181 84 124 164 142
Source: Lisney
0
50
100
150
200
250
300
350
2003 2004 2005 2006 2007 2008 2009 2010 2011 2012
'000 s
qm
City Centre North Suburbs South Suburbs West Suburbs

Goodbody Economy - Ireland
27 Sep. 2013 Page 25
When will building start again?
No new office buildings have emerged in the capital since the first half of 2011. This marks the most
prolonged period of drought in the new office construction sector in history. With no plans in the public
domain as yet, it is likely that no new space will come on stream until at least 2016. This is because of
the time lag involved in commercial construction activity. As a comparison, in the ten years to 1999
annual office completions amounted to an average 43 buildings per year in Dublin at an average size of
4,000 sqm.
The key reason for the complete absence of new construction is that at current rents, it is not
economical to build. Based on the vacant stock analysis, one could conclude that there is little need for
new building until this stock is used up. However, there are a number of reasons to believe that new
developments could be needed sooner than one would think:
Time lag – Given the time lag involved in completing a commercial building, the market
dynamics are often very different at the end of the process relative to the start.
A higher “natural” vacancy rate – We have shown that while the current vacancy rate
may appear high at a headline level, it is in fact closer to the “natural rate” for Dublin than
one would assume.
Lack of large spaces – While there is a relatively large amount of office space available in
the city, there is only limited choice if tenants are looking for particularly large space. CBRE
recently noted that there are just 17 buildings across Dublin that could accommodate space
requirements over 7,000 sqm. In total, this space accounts for just a quarter of the total
vacant space available. The IDA has recently stated that the availability of large office space
in the CBD may indeed act as a constraint towards attracting inward foreign direct
investment.
Vacancy rates could fall quite quickly in the absence of new building activity
Although agents tend to focus on “take-up” when discussing occupancy in the office market, a more
relevant variable in assessing trends in the vacancy rate is net absorption. This measures the change in
occupied office space and thus takes into account movement by companies to alternative office
accommodation which leads to no net change in occupied space and the closure of businesses, thus
adding to the available office stock. .
Office take-up versus net absorption
Source: Lisney, Goodbody
Vacancy rate forecasts
Source: Lisney, Goodbody
We have assumed that take-up runs at the twenty-year average of 150,000 sqm over the four years to
2016. Under this assumption, net absorption amounts to 70,000 sqm on average. With no new office
space assumed over the period, the vacancy rate is forecast to fall to 10.5% by the end of 2016. If take-
up was to exceed the long-term average and rise to 200,000 sqm per annum, the vacancy rate would
fall much quicker to 4.9% at the end of 2016. If take-up was to slow significantly to just 100,000sqm
per annum, the vacancy rate would fall to just 16% by the end of the period.
-50
0
50
100
150
200
250
300
350
1992 1996 2000 2004 2008 2012 2016f
'000 s
qm
Take-up Net absorption0%
5%
10%
15%
20%
25%
1987 1991 1995 1999 2003 2007 2011 2015f
Vacancy r
ate
150,000sqm annual take-up
100,000sqm annual take-up
200,000sqm annual take-up
Sourc

Goodbody Economy - Ireland
Page 26 27 Sep. 2013
Building viability
So when will it be financially viable to build in the capital. Lisney has developed a very useful matrix,
which using current building costs and allowing for current market terms, including a two-year rent-free
period, calculates the appropriate rental level based on varying assumptions for the yield and the cost of
land.
At current rental values (c.€320 per sqm) and at the current rental yield of 6.25% in the city centre
region, it is not financially viable to develop and build an office location in the capital. However, as our
analysis of historical cycles shows, rental values can move up quite quickly, meaning that a viable rental
level can be achieved even prior to the completion of the building if the planning stage was to be
commenced straight away.
Lisney suggest that a headline rent of c.€360 per sqm is required to justify development. The
assumptions underlying this calculation include prevailing lease terms (including a 24-month rent-free
period), developer profit on costs at 15%, a yield of 6.25% and a site value of €10m per acre. Rents,
therefore, must increase by just 12% to make building viable (recent transactions suggest a €10m per
acre site cost is a reasonable assumption even though a recent transaction in Ballsbridge took place at a
price of €11.5m per acre).
Office market conclusions
Given the likely trajectory of the economy, particularly in Dublin, and the expected downward trend in
vacancy rates, the office market offers the best risk/reward investment prospects in the short-term.
High-single digit total returns are expected from this asset class, but the risk bias is to the upside, given
the expected continued high level of interest in the sector.
Office-building viability matrix (rent per sqm)
5.50% 5.75% 6.00% 6.25% 6.50% 6.75% 7.00%
5,000,000 274 290 305 320 335 351 367
7,000,000 288 304 320 336 352 369 385
8,000,000 295 311 327 344 361 378 395
9,000,000 302 319 335 352 369 386 404
10,000,000 309 326 343 360 377 395 413
11,000,000 316 333 350 368 386 404 422
12,000,000 322 340 358 376 394 412 431
13,000,000 329 348 365 384 403 422 440
14,000,000 336 355 372 392 411 431 449
15,000,000 343 362 381 400 420 440 459
Source: Lisney
Note: Green areas are financially viable combinations of yield and land cost, Red areas are unviable
Pric
e p
er a
cre
Yield

Goodbody Economy - Ireland
27 Sep. 2013 Page 27
Retail Market
Conditions in the Retail Market remain challenging with retailers continuing to face a weak economic
backdrop in the domestic economy. The most recent figures show core retail sales (ex-motor trades)
remain 18% below the peak levels of 2007. Broader consumption data display similar trends with the Q2
national accounts showing consumption rising by a modest 0.3% yoy in nominal terms (-1.3% yoy in
real terms), which is 14% lower than peak 2007 levels. The severity of the collapse in consumer
spending has seen retail rents fall almost 50% from 2008 peak levels and capital values fall 70% from
peak 2007 levels. This has translated into equivalent rental yields, which recovered as capital values fell,
averaging c.8% since H2 2009 from a low of 3.4% during the boom years. This recovery in equivalent
yields has seen Dublin’s ranking on the Cushman & Wakefield Most Expensive Retail Location fall
consistently since 2008 when it peaked at number 5, ahead of London, Tokyo and Sydney. It now stands
at 17.
Most expensive retail locations
Rank 2008 2012
1 New York Hong Kong
2 Hong Kong New York
3 Paris Paris
4 Milan Tokyo
5 Dublin Sydney
6 London London
7 Tokyo Zurich
8 Zurich Milan
9 Sydney Seoul
10 Seoul Munich
11 Athens Vienna
12 Munich Sao Paulo
13 Vienna Moscow
14 Moscow Beijing
15 Madrid Barcelona
16 Singapore Singapore
17 New Delhi Dublin
18 Amsterdam Amsterdam
19 Copenhagen Kuala Lumper
20 Prague Toronto
Source: Cushman & Wakefield
Despite this recovery in rental yields and valuations in retail property, actual rents and capital values
remain under pressure, with the latest set of data from IPD showing rentals (-6% yoy) and capital
values (-8% yoy) continuing to fall on an annual basis in Q2. While there are some sectors of the retail
market showing tentative signs of stabilisation, thus far this is confined to prime high street sites and
larger shopping centres particularly in the capital, where prime rents are bottoming. Activity levels and
rental yields in secondary locations outside the capital remain weak with vacancy levels high. This
reflects the challenging conditions and uncertain outlook that the retail sector in Ireland still faces with
consumer spending yet to initiate a recovery.

Goodbody Economy - Ireland
Page 28 27 Sep. 2013
Retail rents and capital values remain under pressure
Source: IPD
Rents followed retails sales lower
Source: IPD
The most recent retail figures show that core retail sales (ex-motor trades) remain 18% below the peak
levels seen in 2007. Broader consumption data display similar trends, with the Q2 national accounts
showing consumption rising by a modest 0.3% yoy in nominal terms (-1.3% yoy in real terms), which is
14% lower than peak 2007 levels. Against this negative backdrop retailers are continuing to struggle
and liquidation, receiverships and the exit of non-domestic retailers from the Irish market has continued.
There has also been an increase in strategic examinerships, which has seen some larger retail players
successfully securing rent reductions.
Regional high street vacancy
Source: CBRE
Bouncing along the bottom
The outlook for the retail property market is closely correlated with the consumer. Here underlying
drivers are showing tentative signs of stability. The most important of these are in relation to the labour
market where employments grew at 1.8% yoy in Q2 and unemployment has fallen to 13.7% from a high
of 15% in Q1 2012. However, the high debt burden being carried by households (203% of disposable
income) will continue to weigh on Irish consumers in the medium term and we expect consumption to
remain negative for the rest of 2013, prior to very slowly recovering in 2015. This will see retail rents
and valuations remain under pressure.
0
100
200
300
400
500
600
700
800
900
2Q
1983
4Q
1986
2Q
1990
4Q
1993
2Q
1997
4Q
2000
2Q
2004
4Q
2007
2Q
2011
Index levle
RENTAL INDEX CAPITAL GROWTH
50
60
70
80
90
100
110
120
130
1Q
2005
1Q
2006
1Q
2007
1Q
2008
1Q
2009
1Q
2010
1Q
2011
1Q
2012
1Q
2013
Index level
Rental Index Retail Index (Value)
0% 5% 10% 15% 20% 25%
Sligo - Grafton/Castle…
Limerick - O'Connell…
Sligo - O'Connell Street
Cork - St Patricks Street
Dublin - Grafton Street
Dublin - Henry/Mary…
Galway - Wiliam Street
Kilarney - New Street
Kilkenny - High Street
Galway - High Street
Kilarney - Main Street
Galway - Shop Street
Galway - Main Guard…
Q3 2012 Q1 2013
Goodbody Economy - Ireland
27 Sep. 2013 Page 29
In conjunction with the weak consumer, retail property faces other challenges. The 6 year slump in
retailing has seen a number of structural changes to the overall retail landscape that also negatively
impact the outlook for rental and capital growth. Amongst these are (i) turnover based rents; (ii) shorter
lease length, (iii) pop-up shops on temporary, low rent, leases and (iv) further strategic examinerships
by large retailers attempting to force rents down. On a broader basis the expansion of online retailing
also poses a threat to the sector
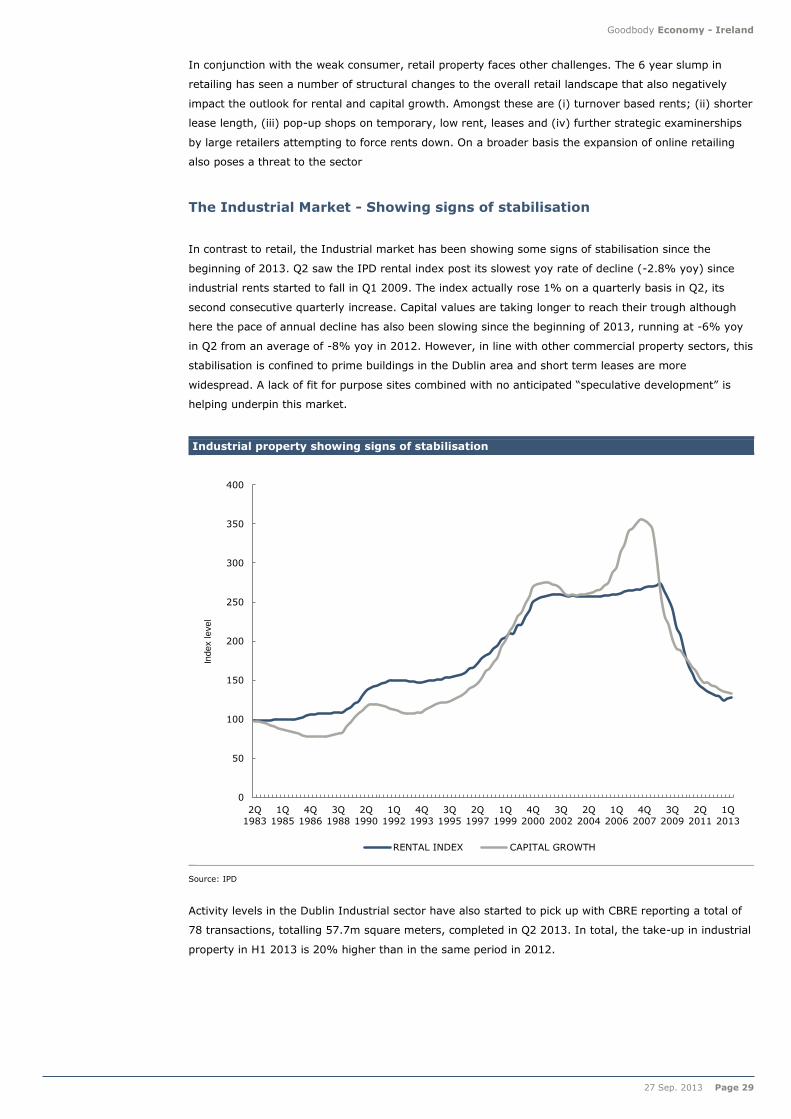
The Industrial Market - Showing signs of stabilisation
In contrast to retail, the Industrial market has been showing some signs of stabilisation since the
beginning of 2013. Q2 saw the IPD rental index post its slowest yoy rate of decline (-2.8% yoy) since
industrial rents started to fall in Q1 2009. The index actually rose 1% on a quarterly basis in Q2, its
second consecutive quarterly increase. Capital values are taking longer to reach their trough although
here the pace of annual decline has also been slowing since the beginning of 2013, running at -6% yoy
in Q2 from an average of -8% yoy in 2012. However, in line with other commercial property sectors, this
stabilisation is confined to prime buildings in the Dublin area and short term leases are more
widespread. A lack of fit for purpose sites combined with no anticipated “speculative development” is
helping underpin this market.
Industrial property showing signs of stabilisation
Source: IPD
Activity levels in the Dublin Industrial sector have also started to pick up with CBRE reporting a total of
78 transactions, totalling 57.7m square meters, completed in Q2 2013. In total, the take-up in industrial
property in H1 2013 is 20% higher than in the same period in 2012.
0
50
100
150
200
250
300
350
400
2Q
1983
1Q
1985
4Q
1986
3Q
1988
2Q
1990
1Q
1992
4Q
1993
3Q
1995
2Q
1997
1Q
1999
4Q
2000
3Q
2002
2Q
2004
1Q
2006
4Q
2007
3Q
2009
2Q
2011
1Q
2013
Index l
evel
RENTAL INDEX CAPITAL GROWTH

Goodbody Economy - Ireland
Page 30 27 Sep. 2013
Industrial take-up
Source: CBRE
Capital values, which are 63% below peak levels, are attracting a growing number of occupiers who
want to purchase buildings. This will provide some support for capital values. CBRE reports that almost
half (47%) of transactions in 2013 were property sales, with the remainder being lease agreements, an
increase from the 32% seen in H1 2012.
CBRE also reports that activity is being driven by large corporate transactions, many of which are part of
the multi-national sector, suggesting that the industrial market is benefitting from the solid performance
of the external sector in a way that the retail market is not. The continued success of the IDA and
Enterprise Ireland in attracting and retaining FDI and domestic exporters provides support. The shift to
non-store retailing and the resulting distribution requirements provides further opportunities for the
industrial market.
0
10
20
30
40
50
60
70
Q2 2011 Q3 2011 Q4 2011 Q1 2012 Q2 2012 Q3 2012 Q4 2012 Q1 2013 Q2 2013
'000s S
quare
M

Goodbody Economy - Ireland
27 Sep. 2013 Page 31
Irish residential property market
While housing booms and busts have featured in a whole swathe of developed economies during the
2003-2012 period, the magnitude of Ireland’s has few, if any, precedents. Official data show that after
increasing by almost three-fold (270%) in the ten years to 2007, house prices halved over the following
five years. There is also reason to believe that the price declines have been even more severe, given the
increasing prevalence of cash transactions, which are not included in the official statistics. Following this
unprecedented crash, house prices in Ireland started to stabilise in the third quarter of 2012 and
registered a first annual increase in five years in June 2013.
Peak to trough price declines in recent housing busts
Source: ECB, Case-Shiller
Is residential property now cheap?
After a halving of prices, is residential property in Ireland now cheap? To assess this question, we look at
two long-term valuation metrics.
The first is house prices relative to incomes. While this is complicated by the lack of a consistent long-
term average earnings series, we have used the national accounts on disposable incomes and divided it
by the total population to get a per capita disposable income metric. This has the disadvantage of
biasing the house price to income ratio upwards, but the advantage of a consistent series back to 1970.
For the house price data, we have used Department of the Environment and Local Government (DoELG)
data on new house prices from 1975 to 1995, permanent tsb from 1996 to 2004 and the CSO from 2005
to 2013.
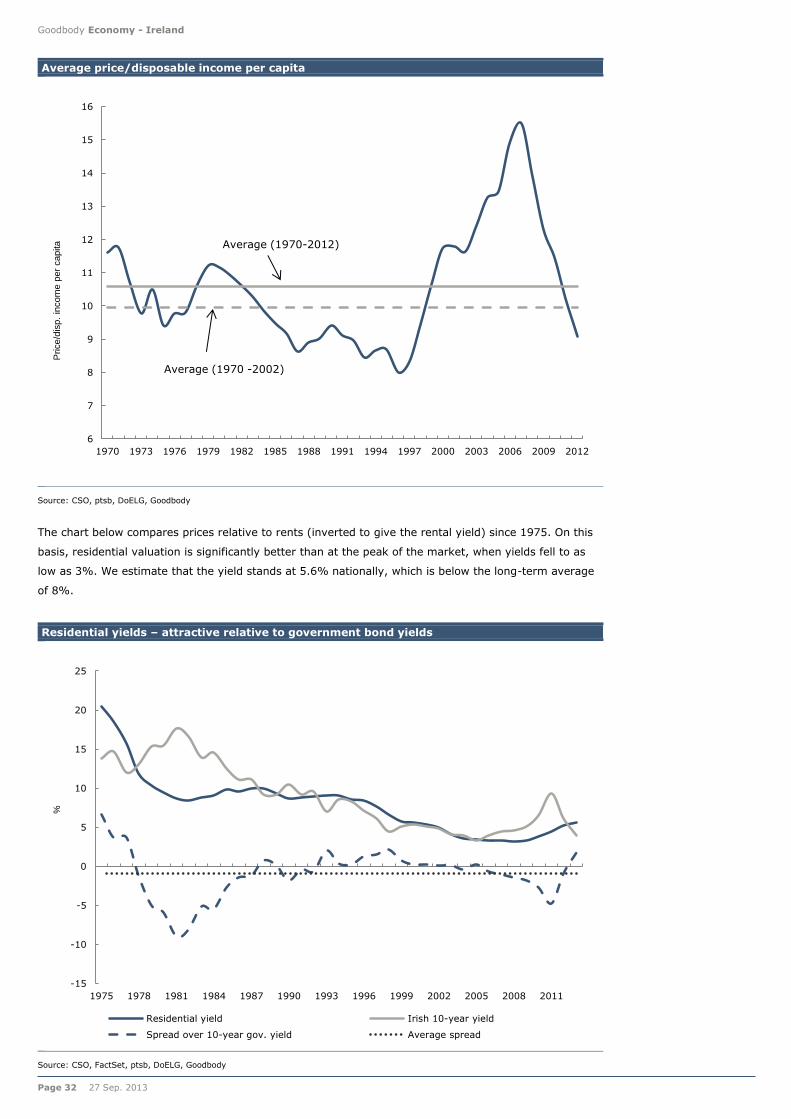
Between 1970 and 2013, Irish house prices averaged 11 times average per capita disposable income.
However, if the peak is excluded, the true long-term average is closer to 10 times. During that time
period, the ratio troughed at 8 times in 1996 and reached a peak of 16 times in 2007. The ratio
currently stands at 9 times. While the ratio is at its lowest level since 1997, it is just 10% below its long-
term average, so cheap but only modestly so. For the ratio to return to its long-term average over the
next five years, under the assumption of a modest 1% average annual growth in per capita disposable
income, house prices would have to grow by 5% per annum over the period.
-60%
-50%
-40%
-30%
-20%
-10%
0%
Portugal Netherlands Cyprus UK US Spain Ireland
Goodbody Economy - Ireland
Page 32 27 Sep. 2013
Average price/disposable income per capita
Source: CSO, ptsb, DoELG, Goodbody
The chart below compares prices relative to rents (inverted to give the rental yield) since 1975. On this
basis, residential valuation is significantly better than at the peak of the market, when yields fell to as
low as 3%. We estimate that the yield stands at 5.6% nationally, which is below the long-term average
of 8%.
Residential yields – attractive relative to government bond yields
Source: CSO, FactSet, ptsb, DoELG, Goodbody
6
7
8
9
10
11
12
13
14
15
16
1970 1973 1976 1979 1982 1985 1988 1991 1994 1997 2000 2003 2006 2009 2012
Price/d
isp.
incom
e p
er
capita
Average (1970-2012)
Average (1970 -2002)
-15
-10
-5
0
5
10
15
20
25
1975 1978 1981 1984 1987 1990 1993 1996 1999 2002 2005 2008 2011
%
Residential yield Irish 10-year yield
Spread over 10-year gov. yield Average spread

Goodbody Economy - Ireland
27 Sep. 2013 Page 33
On this basis, Irish residential property cannot be described as exceptionally cheap. As a comparison,
the average rental yield in the UK is estimated at 6.1% (Source: Countrywide). However, there are
significant variations in these yields across the country. Daft.ie reports a range from 3.6% for a five-bed
property in Dublin, to 10.6% for a one-bedroom property in Waterford. In this regard, national statistics
are misleading. As the following table shows, the significant improvement in overall rental yields since
2007 masks differing performances across regions and property types.
Snapshot of residential yields
2-Bed 5-Bed Average
2007 2013 2007 2013 2007 2013
Dublin City Centre 4.1% 7.8% * * 3.5% 7.8%
North Dublin City 3.6% 7.9% 1.9% 5.4% 3.3% 6.7%
South Dublin City 3.8% 6.7% 4.2% 4.4% 3.9% 5.9%
North Dublin County 4.0% 7.4% 2.1% 6.4% 3.7% 6.4%
South Dublin County 3.4% 6.0% 4.9% 3.6% 3.3% 5.4%
West Dublin County 4.2% 8.2% 2.8% 4.4% 3.9% 7.0%
Dublin Commuter Counties 3.6% 7.5% 2.9% 4.1% 3.2% 5.6%
West Leinster 3.3% 7.1% 2.5% 3.8% 2.9% 5.6%
South East Leinster 3.5% 7.7% 2.9% 4.4% 3.0% 5.7%
Munster 3.8% 6.6% 2.8% 3.9% 3.1% 5.1%
Cork City 3.6% 8.0% 2.7% 4.7% 3.5% 6.2%
Limerick City 3.9% 8.2% 3.1% 5.5% 3.7% 6.4%
Waterford City 3.7% 7.9% 3.3% 4.1% 3.4% 6.5%
Connacht/Ulster 3.4% 7.2% 2.5% 4.6% 2.9% 5.7%
Galway City 3.1% 7.8% 2.4% 4.9% 3.1% 7.1%
Average 3.6% 7.1% 2.6% 4.8% 3.1% 5.7%
Source: daft.ie
Historical precedents
There is a long history of house price corrections internationally. We have analysed ten of the largest
corrections in the last four decades to gauge: (i) the scale of crash; (ii) the duration of an “average”
correction, and; (iii) the usual path of house prices following a crash. During these episodes, real house
prices troughed after six years on average, with the average fall estimated at 36%. The following chart
shows the “average” price crash, relative to the recent Irish experience. By duration, the six years it has
taken for Irish house prices to reach a trough is in line with historical experience, but the price decline
(51%) is much more severe.

Goodbody Economy - Ireland
Page 34 27 Sep. 2013
International real property price cycles since 1970
Source: CSO, BIS, Goodbody
After reaching a trough, price recoveries can be quite strong, with the average annual price growth in
the following five years standing at 7%. As a result of the recovery, real prices return to pre-crash peaks
eight years after the trough (thus 14 years after the peak) on average.
Averages can sometimes be misleading, as they include varied experiences across different cycles. The
following table shows that the magnitude of price crashes we analysed varied from 29% in the UK crash
of the late 1980s to a 48% collapse in the Netherlands in the late 1970s. The duration of these price
declines varied from four years in Spain (1978) to ten years in Switzerland (1989). For our purposes,
the most interesting information can be gleaned from the post-crash recoveries. Annual real price
growth in the five years following the trough ranged between 2% and 8%. The final column of the table
shows how much of the price decline was recovered in the five years after prices bottomed. In three
instances (Spain, Denmark and the UK), prices recovered to the pre-crash peak five years after the
trough. Over the entire ten examples, prices had recovered 62% of the price declines suffered in the
crash. In the two largest crashes (Netherlands and Finland), prices had recovered 40% of their price
falls, leaving prices still 30% below peak levels.
40
50
60
70
80
90
100
110
0 1 2 3 4 5 6 7 8 9 10 11 12 13 14 15
Axis
Title
Average Property Cycles for UK, Netherlands, Switzerland, Belgium, Finland, Sweden, Denmark,
Norway, New Zealand
Ireland's Current Cycle

Goodbody Economy - Ireland
27 Sep. 2013 Page 35
Large house price crashes & recoveries since 1970 (real terms)
Fall from peak to
trough
Years to reach
trough
Average annual
increase 5 years
after trough
% of price drop
recovered after
five years
New Zealand (1974) 36% 6 5% 50%
Netherlands (1978) 48% 7 6% 38%
Spain (1978) 33% 4 8% 101%
Belgium (1979) 36% 6 6% 59%
Sweden (1979) 38% 6 6% 57%
Denmark (1986) 32% 7 8% 103%
Norway (1987) 36% 6 8% 82%
Switzerland (1989) 37% 10 2% 19%
Finland (1989) 48% 6 7% 39%
UK (1989) 29% 6 8% 109%
Average 37% 6 6% 62%
Ireland (2007) 51% 6 ?? ??
Source: Goodbody
It is worth noting that in the stress tests carried out by the Irish Central Bank in March 2011, a very
gradual recovery in house prices was assumed. In 2018, prices are forecast to be 44% and 55% below
the peak in the base and adverse scenarios, respectively. Based on historical experience this appears
overly conservative, possibly pointing to lower loss given defaults (LGDs).
Irish housing market – a regional story
Although prices officially fell by a greater extent in Dublin (57%) relative to the rest of the country
(49%), the Dublin market has been in recovery mode for a year, whereas outside of Dublin prices are
only modestly above the trough. The latest data for August show that prices rose by 11% yoy in the
capital, the fastest rate of growth since May 2007. Outside the capital, prices were still falling by 2%
yoy. Our forecasts suggest that this two-speed market will continue over the coming years.
Residential price inflation forecasts (end-year)
2010 2011 2012 2013 2014 2015
National -10% -17% -4% 3% 4% 5%
Dublin -11% -19% -2% 9% 8% 7%
Outside Dublin -10% -15% -6% -2% 1% 3%
Source: CSO, Goodbody

Goodbody Economy - Ireland
Page 36 27 Sep. 2013
Dublin leading the recovery in prices
Source: CSO
Lack of supply leading prices higher in Dublin
This divergent performance can partly be explained by the different supply dynamics in the region. We
look at two measures of supply, (i) levels of stock for sale, and (ii) vacancy trends, and find that on both
measures supply in Dublin is considerably tighter than elsewhere in the country.
(i) Stock for sale
Data from Daft.ie show that the stock of homes for sale has fallen nationally from a peak of 63,000, in
late 2009, to its current level of 41,000. This is double the level seen in early 2007 when stock levels
troughed. The following chart illustrates how the supply for sale has changed across the regions since it
troughed. In Dublin, the stock for sale is now just 10% above the lowest level in contrast to stock
outside the capital, which has doubled since 2007. These supply differentials will be key to price
performance over the coming years.
-30%
-20%
-10%
0%
10%
20%
30%
Jan
06
May
06
Sep
06
Jan
07
May
07
Sep
07
Jan
08
May
08
Sep
08
Jan
09
May
09
Sep
09
Jan
10
May
10
Sep
10
Jan
11
May
11
Sep
11
Jan
12
May
12
Sep
12
Jan
13
May
13
Sep
13
% Y
oY
Non-Dublin houses Dublin Houses

Goodbody Economy - Ireland
27 Sep. 2013 Page 37
Housing stock for sale
Source: Daft.ie, Goodbody
(ii) Vacancy trends
Due to the boom in residential construction output in the years leading up to 2006, Ireland has an
exceptionally young housing stock. In the seven year period running from 2000 to the peak in 2006, a
total of 480,000 housing units were built in Ireland. As a result, 27% of the total housing stock was built
during that period. Relative to the size of the population, Ireland was building 21 units per thousand of
the population per annum, relative to a European average of 5. Since then, output has fallen by 90% to
an all-time low of 8,000 units, equivalent to just 2 units per thousand of the population. The European
average currently stands at 3 per thousand.
The construction boom resulted in a large oversupply of residential properties in Ireland, the extent of
which is subject to contentious debate. There are two primary sources of data on this topic where
notwithstanding the limitations of each, tighter supply in Dublin versus the rest of the country is
apparent. These are:
(1) The unfinished housing development reports (the National Housing Development
Surveys) from the Department of the Environment and Local Government, and;
(2) Census data on vacant housing.
(1) National Housing Development Surveys (NHDS)
The NHDS is limited to incomplete housing developments that contain two or more dwellings, which
were either commenced at the time of the survey or finished in the three years prior to it and where
10% were vacant. The motivation of the survey was to determine the scale of unfinished housing
developments rather than the scale of vacant housing per se. It does not, for example, include one-off
units, vacant second-hand units or any developments completed more than three years prior to the
survey being taken.
0
50
100
150
200
250
300
350
400
Jan
07
May
07
Sep
07
Jan
08
May
08
Sep
08
Jan
09
May
09
Sep
09
Jan
10
May
10
Sep
10
Jan
11
May
11
Sep
11
Jan
12
May
12
Sep
12
Jan
13
May
13
Index (
Jan.
2007=
100)
National Dublin Munster Conn-Ulst Leinster
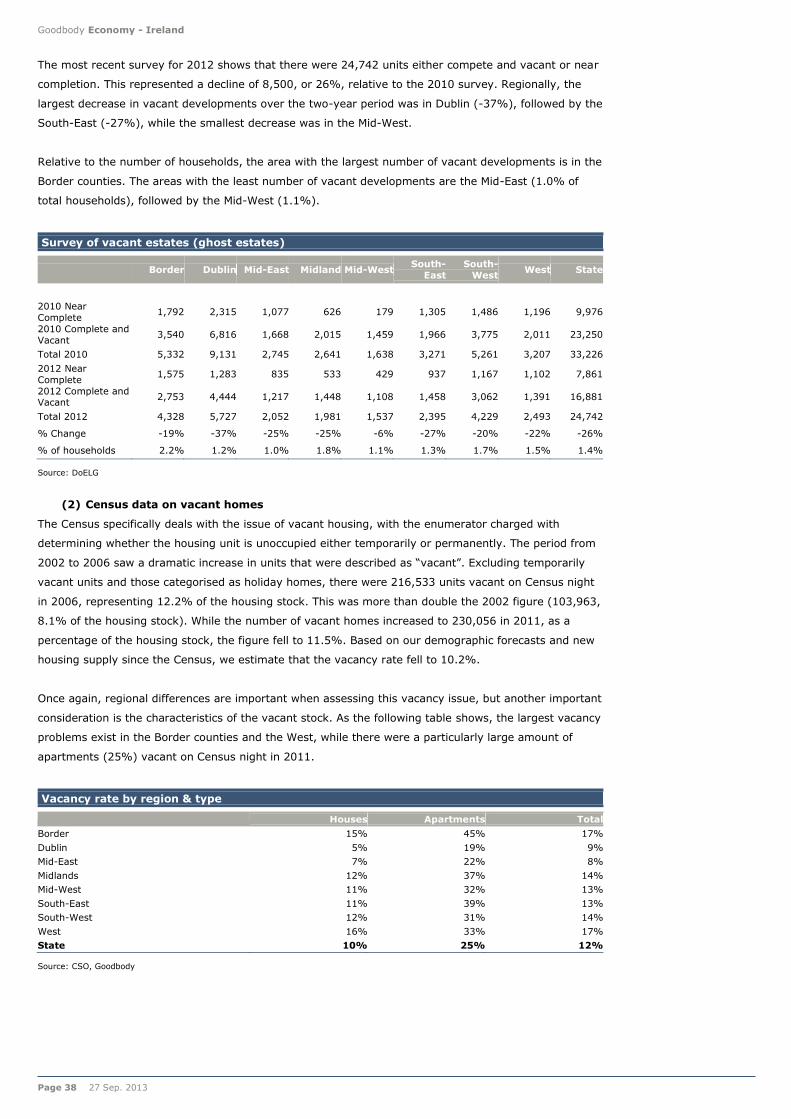
Goodbody Economy - Ireland
Page 38 27 Sep. 2013
The most recent survey for 2012 shows that there were 24,742 units either compete and vacant or near
completion. This represented a decline of 8,500, or 26%, relative to the 2010 survey. Regionally, the
largest decrease in vacant developments over the two-year period was in Dublin (-37%), followed by the
South-East (-27%), while the smallest decrease was in the Mid-West.
Relative to the number of households, the area with the largest number of vacant developments is in the
Border counties. The areas with the least number of vacant developments are the Mid-East (1.0% of
total households), followed by the Mid-West (1.1%).
Survey of vacant estates (ghost estates)
Border Dublin Mid-East Midland Mid-West South-
East
South-
West West State
2010 Near
Complete 1,792 2,315 1,077 626 179 1,305 1,486 1,196 9,976
2010 Complete and
Vacant 3,540 6,816 1,668 2,015 1,459 1,966 3,775 2,011 23,250
Total 2010 5,332 9,131 2,745 2,641 1,638 3,271 5,261 3,207 33,226
2012 Near
Complete 1,575 1,283 835 533 429 937 1,167 1,102 7,861
2012 Complete and Vacant
2,753 4,444 1,217 1,448 1,108 1,458 3,062 1,391 16,881
Total 2012 4,328 5,727 2,052 1,981 1,537 2,395 4,229 2,493 24,742
% Change -19% -37% -25% -25% -6% -27% -20% -22% -26%
% of households 2.2% 1.2% 1.0% 1.8% 1.1% 1.3% 1.7% 1.5% 1.4%
Source: DoELG
(2) Census data on vacant homes
The Census specifically deals with the issue of vacant housing, with the enumerator charged with
determining whether the housing unit is unoccupied either temporarily or permanently. The period from
2002 to 2006 saw a dramatic increase in units that were described as “vacant”. Excluding temporarily
vacant units and those categorised as holiday homes, there were 216,533 units vacant on Census night
in 2006, representing 12.2% of the housing stock. This was more than double the 2002 figure (103,963,
8.1% of the housing stock). While the number of vacant homes increased to 230,056 in 2011, as a
percentage of the housing stock, the figure fell to 11.5%. Based on our demographic forecasts and new
housing supply since the Census, we estimate that the vacancy rate fell to 10.2%.
Once again, regional differences are important when assessing this vacancy issue, but another important
consideration is the characteristics of the vacant stock. As the following table shows, the largest vacancy
problems exist in the Border counties and the West, while there were a particularly large amount of
apartments (25%) vacant on Census night in 2011.
Vacancy rate by region & type
Houses Apartments Total
Border 15% 45% 17%
Dublin 5% 19% 9%
Mid-East 7% 22% 8%
Midlands 12% 37% 14%
Mid-West 11% 32% 13%
South-East 11% 39% 13%
South-West 12% 31% 14%
West 16% 33% 17%
State 10% 25% 12%
Source: CSO, Goodbody
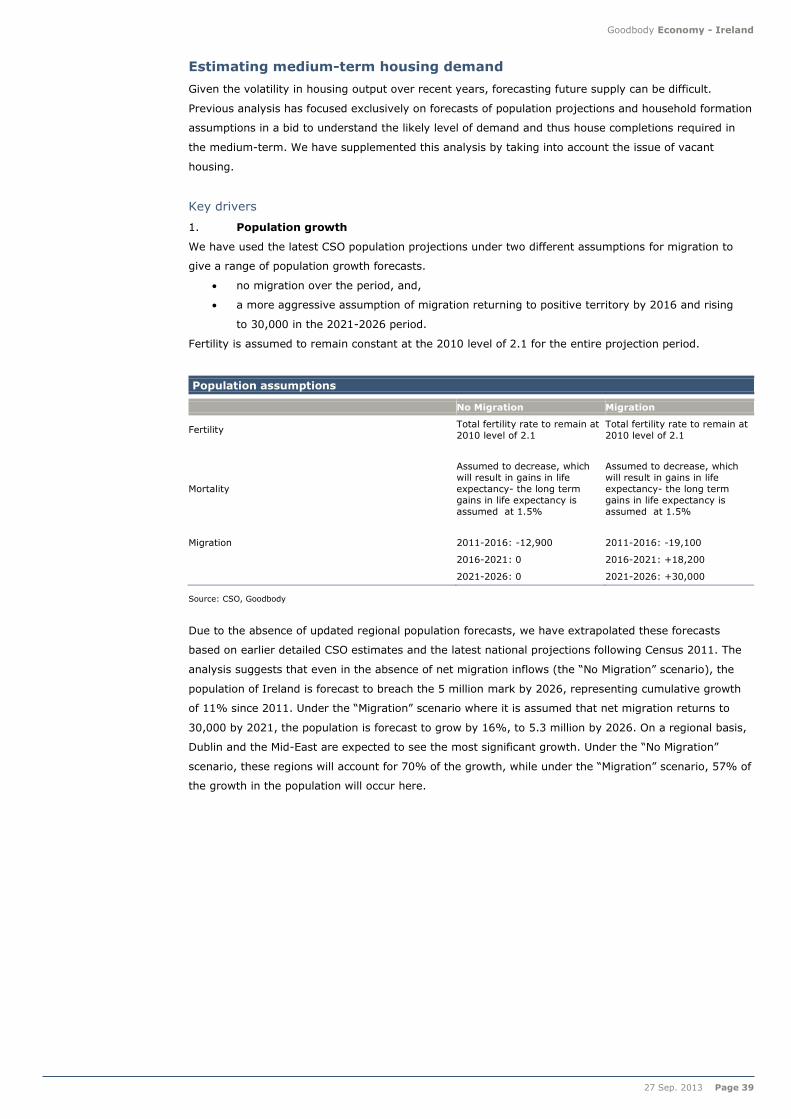
Goodbody Economy - Ireland
27 Sep. 2013 Page 39
Estimating medium-term housing demand
Given the volatility in housing output over recent years, forecasting future supply can be difficult.
Previous analysis has focused exclusively on forecasts of population projections and household formation
assumptions in a bid to understand the likely level of demand and thus house completions required in
the medium-term. We have supplemented this analysis by taking into account the issue of vacant
housing.
Key drivers
1. Population growth
We have used the latest CSO population projections under two different assumptions for migration to
give a range of population growth forecasts.
no migration over the period, and,
a more aggressive assumption of migration returning to positive territory by 2016 and rising
to 30,000 in the 2021-2026 period.
Fertility is assumed to remain constant at the 2010 level of 2.1 for the entire projection period.
Population assumptions
No Migration Migration
Fertility Total fertility rate to remain at
2010 level of 2.1
Total fertility rate to remain at
2010 level of 2.1
Mortality
Assumed to decrease, which
will result in gains in life
expectancy- the long term
gains in life expectancy is
assumed at 1.5%
Assumed to decrease, which
will result in gains in life
expectancy- the long term
gains in life expectancy is
assumed at 1.5%
Migration 2011-2016: -12,900 2011-2016: -19,100
2016-2021: 0 2016-2021: +18,200
2021-2026: 0 2021-2026: +30,000
Source: CSO, Goodbody
Due to the absence of updated regional population forecasts, we have extrapolated these forecasts
based on earlier detailed CSO estimates and the latest national projections following Census 2011. The
analysis suggests that even in the absence of net migration inflows (the “No Migration” scenario), the
population of Ireland is forecast to breach the 5 million mark by 2026, representing cumulative growth
of 11% since 2011. Under the “Migration” scenario where it is assumed that net migration returns to
30,000 by 2021, the population is forecast to grow by 16%, to 5.3 million by 2026. On a regional basis,
Dublin and the Mid-East are expected to see the most significant growth. Under the “No Migration”
scenario, these regions will account for 70% of the growth, while under the “Migration” scenario, 57% of
the growth in the population will occur here.
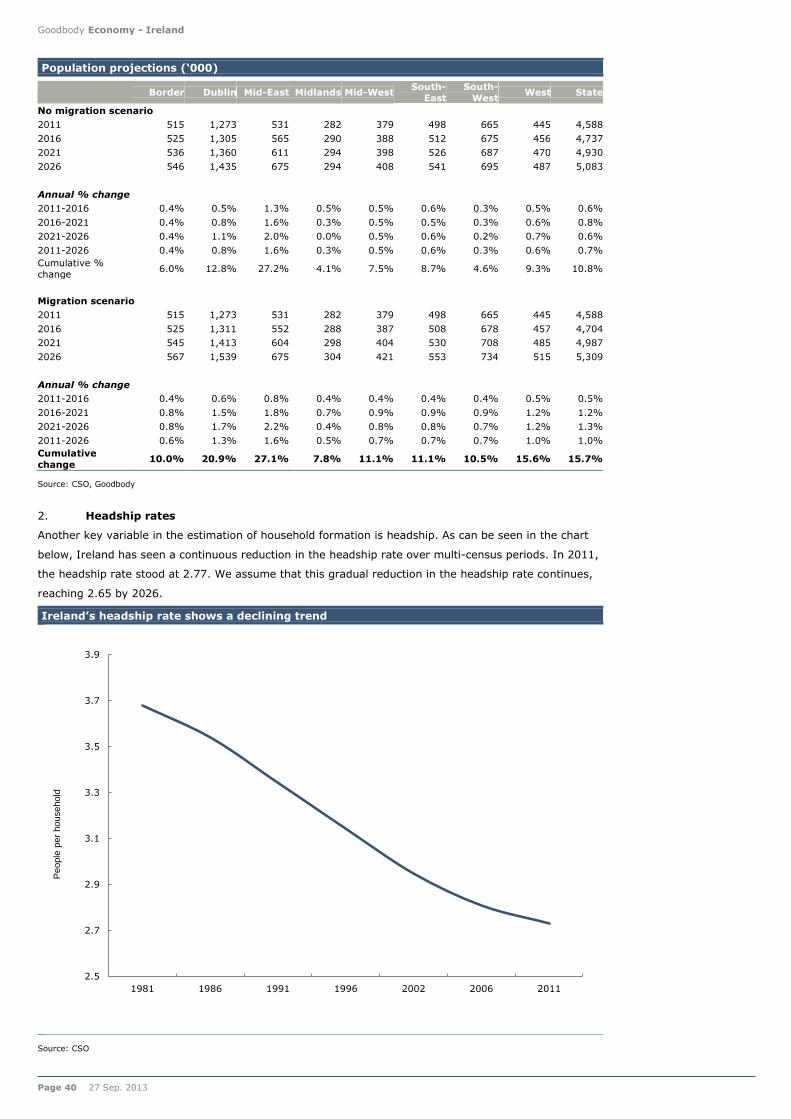
Goodbody Economy - Ireland
Page 40 27 Sep. 2013
Population projections (‘000)
Border Dublin Mid-East Midlands Mid-West
South-
East
South-
West West State
No migration scenario
2011 515 1,273 531 282 379 498 665 445 4,588
2016 525 1,305 565 290 388 512 675 456 4,737
2021 536 1,360 611 294 398 526 687 470 4,930
2026 546 1,435 675 294 408 541 695 487 5,083
Annual % change
2011-2016 0.4% 0.5% 1.3% 0.5% 0.5% 0.6% 0.3% 0.5% 0.6%
2016-2021 0.4% 0.8% 1.6% 0.3% 0.5% 0.5% 0.3% 0.6% 0.8%
2021-2026 0.4% 1.1% 2.0% 0.0% 0.5% 0.6% 0.2% 0.7% 0.6%
2011-2026 0.4% 0.8% 1.6% 0.3% 0.5% 0.6% 0.3% 0.6% 0.7%
Cumulative %
change 6.0% 12.8% 27.2% 4.1% 7.5% 8.7% 4.6% 9.3% 10.8%
Migration scenario
2011 515 1,273 531 282 379 498 665 445 4,588
2016 525 1,311 552 288 387 508 678 457 4,704
2021 545 1,413 604 298 404 530 708 485 4,987
2026 567 1,539 675 304 421 553 734 515 5,309
Annual % change
2011-2016 0.4% 0.6% 0.8% 0.4% 0.4% 0.4% 0.4% 0.5% 0.5%
2016-2021 0.8% 1.5% 1.8% 0.7% 0.9% 0.9% 0.9% 1.2% 1.2%
2021-2026 0.8% 1.7% 2.2% 0.4% 0.8% 0.8% 0.7% 1.2% 1.3%
2011-2026 0.6% 1.3% 1.6% 0.5% 0.7% 0.7% 0.7% 1.0% 1.0%
Cumulative
change 10.0% 20.9% 27.1% 7.8% 11.1% 11.1% 10.5% 15.6% 15.7%
Source: CSO, Goodbody
2. Headship rates
Another key variable in the estimation of household formation is headship. As can be seen in the chart
below, Ireland has seen a continuous reduction in the headship rate over multi-census periods. In 2011,
the headship rate stood at 2.77. We assume that this gradual reduction in the headship rate continues,
reaching 2.65 by 2026.
Ireland’s headship rate shows a declining trend
Source: CSO
2.5
2.7
2.9
3.1
3.3
3.5
3.7
3.9
1981 1986 1991 1996 2002 2006 2011
People
per
household

Goodbody Economy - Ireland
27 Sep. 2013 Page 41
Based on these assumptions, the annual household projections are shown in the table below. Under the
“No Migration” assumption, the average annual household change in the period from 2011 to 2026 is
estimated at 18,000, while in the “Migration” scenario, the annual increase is estimated at 23,000.
Under the latter scenario, net migration is assumed to increase gradually over the period, thus leading
to the gradual increase in household formation.
Household formation forecasts
Border Dublin Mid-East Midlands
Mid-
West
South-
East
South-
West West State
Av.
Hhold
size
No migration scenario
2011 186 467 181 100 138 181 241 160 1,654 2.77
2016 192 478 207 106 142 188 247 167 1,735 2.73
2021 199 505 227 109 148 195 255 175 1,833 2.69
2026 206 542 255 111 154 204 262 184 1,918 2.65
Annual change in households
2011-2016 1 2 5 1 1 1 1 1 16
2016-2021 1 5 4 1 1 2 2 2 20
2021-2026 1 7 6 0 1 2 1 2 17
Migration scenario
2011 186 467 181 100 138 181 241 160 1,654 2.77
2016 192 480 202 106 142 186 248 167 1,723 2.73
2021 203 525 225 111 150 197 263 180 1,854 2.69
2026 214 581 255 115 159 209 277 194 2,003 2.65
Annual change in households
2011-2016 1 3 4 1 1 1 1 1 14
2016-2021 2 9 4 1 2 2 3 3 26
2021-2026 2 11 6 1 2 2 3 3 30
Source: CSO, Goodbody
Obsolete stock
A certain percentage of the housing stock will become obsolete every year. Recent years has seen this
estimate to be quite large in Ireland due to the redevelopment of certain areas of Dublin for example. An
average of 0.7% of the stock per annum is often assumed in these calculations, but due to the relative
youth of Ireland’s housing stock, and in a bid to be conservative, we have assumed that 0.3% of the
housing stock becomes obsolete every year.
How much of this future demand can be met from current vacant stock?
Although the characteristics of vacant properties will be a determinant of the likely future supply (the
“wrong properties in the wrong places”), we have attempted here to estimate likely future demand for
additional housing based on calculations of vacant homes. By using estimates of vacant housing, we can
calculate the “excess supply” by region. In this analysis, we assume a “normal” vacancy rate of 7% (in
line with the average vacancy rate across European countries). Any vacant units over and above this
number are assumed to be part of the excess stock.
Our analysis suggests that the vacancy rate is above the “normal” level of 7% in six of the eight regions
identified. Dublin is assumed to be in line with the normal vacancy level, while the Mid-East is assumed
to be below normal. The greatest excess supply is found in the West and Border counties, in line with
the earlier analysis. Combining this with the household formation calculations, we can calculate when
this excess stock will be used up and thus when building will be required to recommence in these areas.

Goodbody Economy - Ireland
Page 42 27 Sep. 2013
Years to work through excess supply by region
Source: CSO, Goodbody
Housing demand calculations
Border Dublin Mid-East Midlands Mid-West
South-East
South-West
West State
Total Stock 248 529 205 120 170 223 306 211 2,013
Vacancy Rate 2013 15.3% 7.1% 4.5% 12.0% 11.9% 11.3% 12.1% 15.3% 10.7%
"Excess" vacancy
rate 8.3% 0.1% -2.5% 5.0% 4.9% 4.3% 5.1% 8.3% 3.7%
Obsolete units
(0.3% of stock per
annum)
1 2 1 0 1 1 1 1 6
Housing supply needs
No Migration scenario
2011-2016 - 4 6 - - - - - 10
2016-2021 - 7 5 1 2 2 3 2 21
2021-2026 2 9 6 1 2 2 2 2 26
Migration scenario
2011-2016 - 4 5 - - - - - 9
2016-2021 - 11 5 1 2 3 4 3 29
2021-2026 3 13 7 1 2 3 4 3 36
Source: Goodbody
0 1 2 3 4 5 6 7 8 9
Dublin
Mid-East
Midlands
South-East
Mid-West
South-West
West
Border

Goodbody Economy - Ireland
27 Sep. 2013 Page 43
Housing demand amounting to between 26,000 and 36,000 per annum
The final factor that will influence the housing supply forecast is the replacement of the obsolete stock.
Due to the relative youth of the Irish housing stock, we have conservatively assumed that 0.3% of the
housing stock becomes obsolete every year, leading to an annual need of 6,000 units for this purpose.
The period from 2011 to 2016 will largely be about working through the vacant stock of housing outside
the Greater-Dublin area. Aside from the Border counties, most of this oversupply will have been used
up, thus necessitating a pick-up in new construction activity.
On a national basis, we assume that just 9,000-10,000 units are required over the 2011-2016 period. In
2016-2021, demand increases from 21,000-29,000, before increasing further to 26,000-36,000.
Therefore, our forecasts imply that after a relatively flat outturn for 2013, and modest growth in 2014,
house construction increases significantly from 2015 onwards to meet growing demand.
Capacity constraints in the construction sector?
While our demand forecasts suggest a need for housing construction in the Greater Dublin area in
particular from this point onwards, there is a genuine concern that the industry will not be able to supply
these needs. Working capital remains a major concern in the industry, while in parts of the country it is
simply not economical to build given current prices and costs. This conclusion cannot be reached in
Greater Dublin, where we believe we will see an increase in development given evidence of price
inflation.
This demand analysis acts as the basis for our forecasts for housing completions over the medium term.
On this basis, our forecasts suggest completions can grow to 24,000 units by 2020.
Housing completions forecasts
2012 2013 2014 2015 2016 2017 2018 2019 2020
National 8,488 8,729 9,266
10,431
12,556
15,141
17,850
21,053
24,421
Source: DoELG, Goodbody
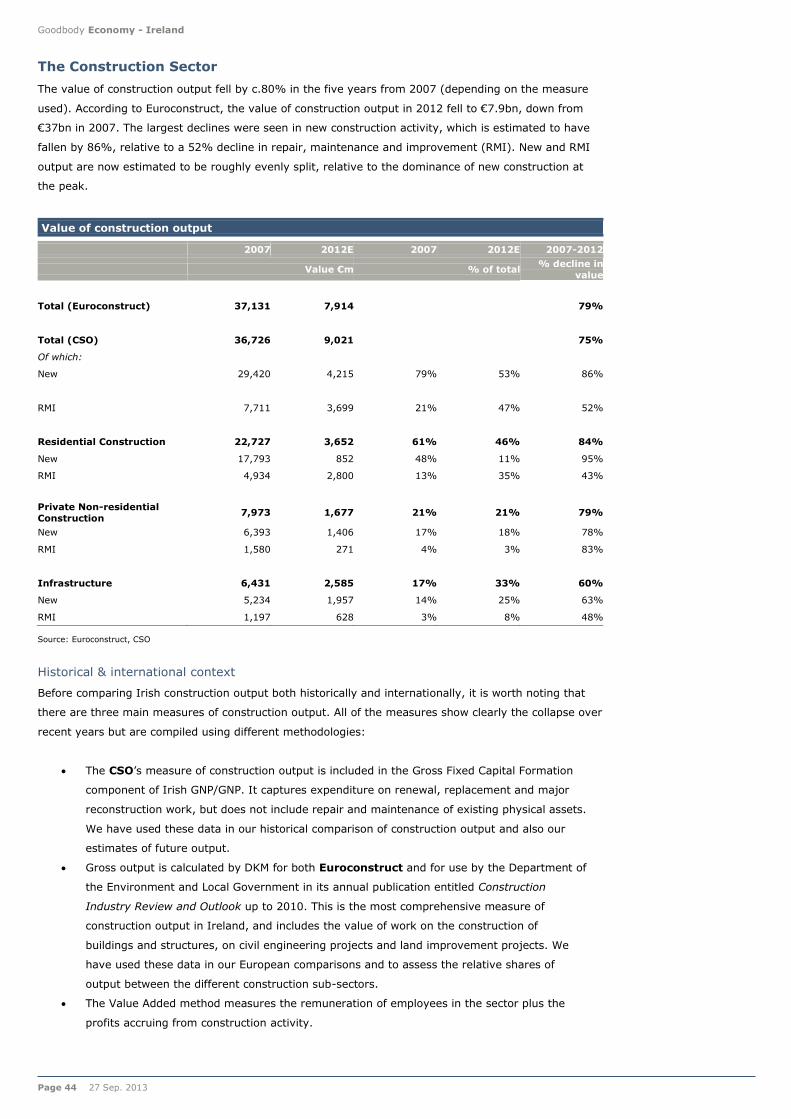
Goodbody Economy - Ireland
Page 44 27 Sep. 2013
The Construction Sector
The value of construction output fell by c.80% in the five years from 2007 (depending on the measure
used). According to Euroconstruct, the value of construction output in 2012 fell to €7.9bn, down from
€37bn in 2007. The largest declines were seen in new construction activity, which is estimated to have
fallen by 86%, relative to a 52% decline in repair, maintenance and improvement (RMI). New and RMI
output are now estimated to be roughly evenly split, relative to the dominance of new construction at
the peak.
Value of construction output
2007 2012E 2007 2012E 2007-2012
Value €m % of total % decline in
value
Total (Euroconstruct) 37,131 7,914 79%
Total (CSO) 36,726 9,021 75%
Of which:
New 29,420 4,215 79% 53% 86%
RMI 7,711 3,699 21% 47% 52%
Residential Construction 22,727 3,652 61% 46% 84%
New 17,793 852 48% 11% 95%
RMI 4,934 2,800 13% 35% 43%
Private Non-residential
Construction 7,973 1,677 21% 21% 79%
New 6,393 1,406 17% 18% 78%
RMI 1,580 271 4% 3% 83%
Infrastructure 6,431 2,585 17% 33% 60%
New 5,234 1,957 14% 25% 63%
RMI 1,197 628 3% 8% 48%
Source: Euroconstruct, CSO
Historical & international context
Before comparing Irish construction output both historically and internationally, it is worth noting that
there are three main measures of construction output. All of the measures show clearly the collapse over
recent years but are compiled using different methodologies:
The CSO’s measure of construction output is included in the Gross Fixed Capital Formation
component of Irish GNP/GNP. It captures expenditure on renewal, replacement and major
reconstruction work, but does not include repair and maintenance of existing physical assets.
We have used these data in our historical comparison of construction output and also our
estimates of future output.
Gross output is calculated by DKM for both Euroconstruct and for use by the Department of
the Environment and Local Government in its annual publication entitled Construction
Industry Review and Outlook up to 2010. This is the most comprehensive measure of
construction output in Ireland, and includes the value of work on the construction of
buildings and structures, on civil engineering projects and land improvement projects. We
have used these data in our European comparisons and to assess the relative shares of
output between the different construction sub-sectors.
The Value Added method measures the remuneration of employees in the sector plus the
profits accruing from construction activity.

Goodbody Economy - Ireland
27 Sep. 2013 Page 45
As a percentage of total economy output, the construction sector grew to a record of 25% of GNP in
2006, with residential construction accounting for 60% of this output. As the following chart shows, this
was substantially ahead of the long-term average (14% of GNP), highlighting very clearly the
unbalanced nature of the Irish economy at that point in time. Following the collapse in output over
recent years, construction output has fallen to a record low of 7% of GNP. Just as the level of output in
the construction sector in 2006 was unsustainably high, the current output of the sector is unsustainably
low. Stripping out the boom years of the 2000s, the long-term average output of the sector amounts to
12% of GNP.
Construction at record lows relative to GNP
Source: CSO, Goodbody
Residential construction had the furthest to fall
Although non-residential output grew strongly in the years leading up to the peak, residential
construction provided the biggest contribution to GNP growth. In 2006, residential construction
accounted for 15% of GNP, up from 9% in 2000 and compared to a long-term average of 6.5% of GNP.
Following its peak in 2006, residential construction provided the largest drag on the Irish economy. New
residential construction output and RMI now represent just 1% of GNP each, relative to 13% and 2% in
2006, respectively. This stems from a fall in the number of house completions from 93,000 in 2006 to
8,500 in 2012 and a 30% decline in tender prices over the period (Source: Society of Chartered
Surveyors). As the chart shows, new house build is currently running at levels last seen in the 1960s,
when the population was 40% below its current level.
0%
5%
10%
15%
20%
25%
30%
Residential Roads Other construction
Long-term average Average (1970-2000)

Goodbody Economy - Ireland
Page 46 27 Sep. 2013
Housing completions back at 1960s levels
Source: DoELG, Goodbody
A European perspective
In 2007, all categories of construction accounted for a bigger share of total economic output in Ireland
relative to Europe. The vast majority of the overdependence on construction related to residential
activity (specifically on new residential construction). Despite this, construction output now remains
substantially below European averages in all subsectors (note the charts below use Eurocontruct data so
differ slightly from the analysis based on CSO data above). Both residential and non-residential
construction is c.2 percentage points below the European average, while, despite a 60% reduction since
2007, civil engineering still represents 1.7% of GNP in Ireland, relative to 2.5% of GDP for Europe
overall.
Construction output compared (2007)
Source: Euroconstruct, CSO, IMF, Goodbody
Construction output compared (2013e)
Source: Euroconstruct, Goodbody
0
10
20
30
40
50
60
70
80
90
100
1960 1964 1968 1972 1976 1980 1984 1988 1992 1996 2000 2004 2008 2012
No o
f units
12.4
5.7 3.9 3.2
22.9
14.0
4.9 4.0
0
5
10
15
20
25
Totalconstruction
Residential Non-residential Civil
% o
f G
DP
(G
NP
)
European average Ireland
Source:
Euroconstr
uct, CSO,
IMF
9.4
4.0
3.1 2.5
5.2
2.3
1.3 1.7
0
1
2
3
4
5
6
7
8
9
10
Totalconstruction
Residential Non-residential Civil
% o
f G
DP
(G
NP
)
European average Ireland
Source:
Euroconstr
uct, CSO,
IMF
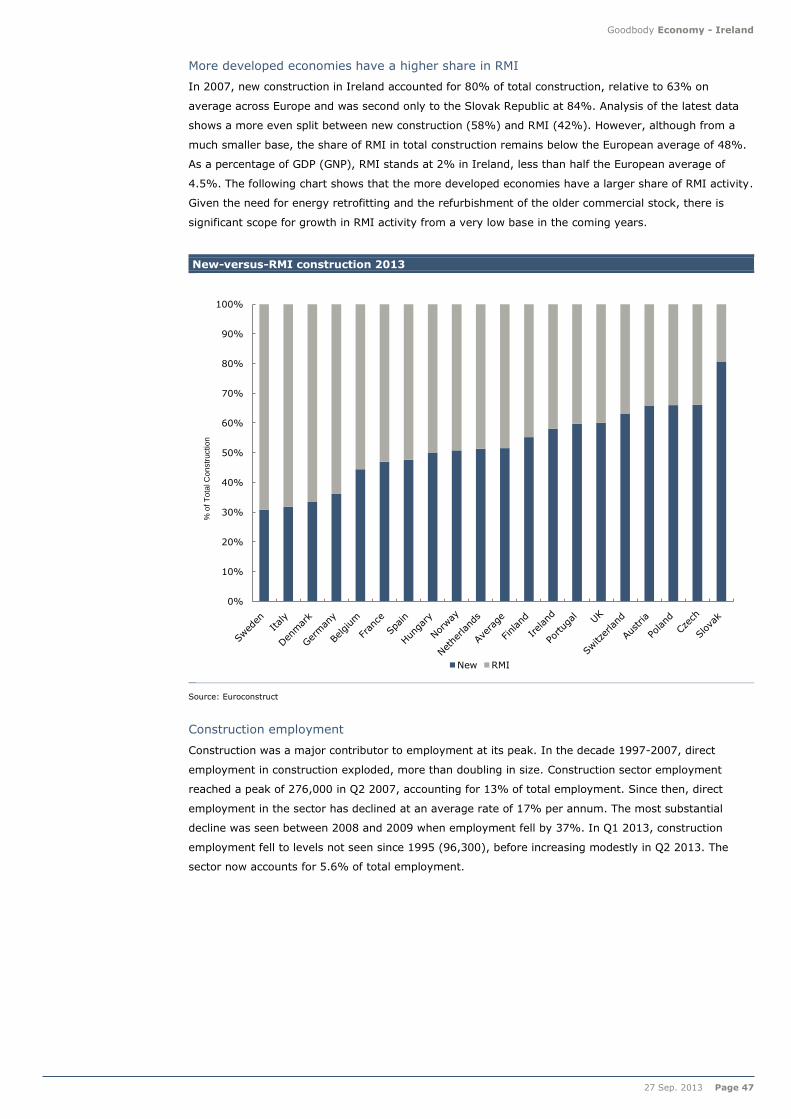
Goodbody Economy - Ireland
27 Sep. 2013 Page 47
More developed economies have a higher share in RMI
In 2007, new construction in Ireland accounted for 80% of total construction, relative to 63% on
average across Europe and was second only to the Slovak Republic at 84%. Analysis of the latest data
shows a more even split between new construction (58%) and RMI (42%). However, although from a
much smaller base, the share of RMI in total construction remains below the European average of 48%.
As a percentage of GDP (GNP), RMI stands at 2% in Ireland, less than half the European average of
4.5%. The following chart shows that the more developed economies have a larger share of RMI activity.
Given the need for energy retrofitting and the refurbishment of the older commercial stock, there is
significant scope for growth in RMI activity from a very low base in the coming years.
New-versus-RMI construction 2013
Source: Euroconstruct
Construction employment
Construction was a major contributor to employment at its peak. In the decade 1997-2007, direct
employment in construction exploded, more than doubling in size. Construction sector employment
reached a peak of 276,000 in Q2 2007, accounting for 13% of total employment. Since then, direct
employment in the sector has declined at an average rate of 17% per annum. The most substantial
decline was seen between 2008 and 2009 when employment fell by 37%. In Q1 2013, construction
employment fell to levels not seen since 1995 (96,300), before increasing modestly in Q2 2013. The
sector now accounts for 5.6% of total employment.
0%
10%
20%
30%
40%
50%
60%
70%
80%
90%
100%
% o
f T
ota
l C
on
str
uctio
n
New RMI
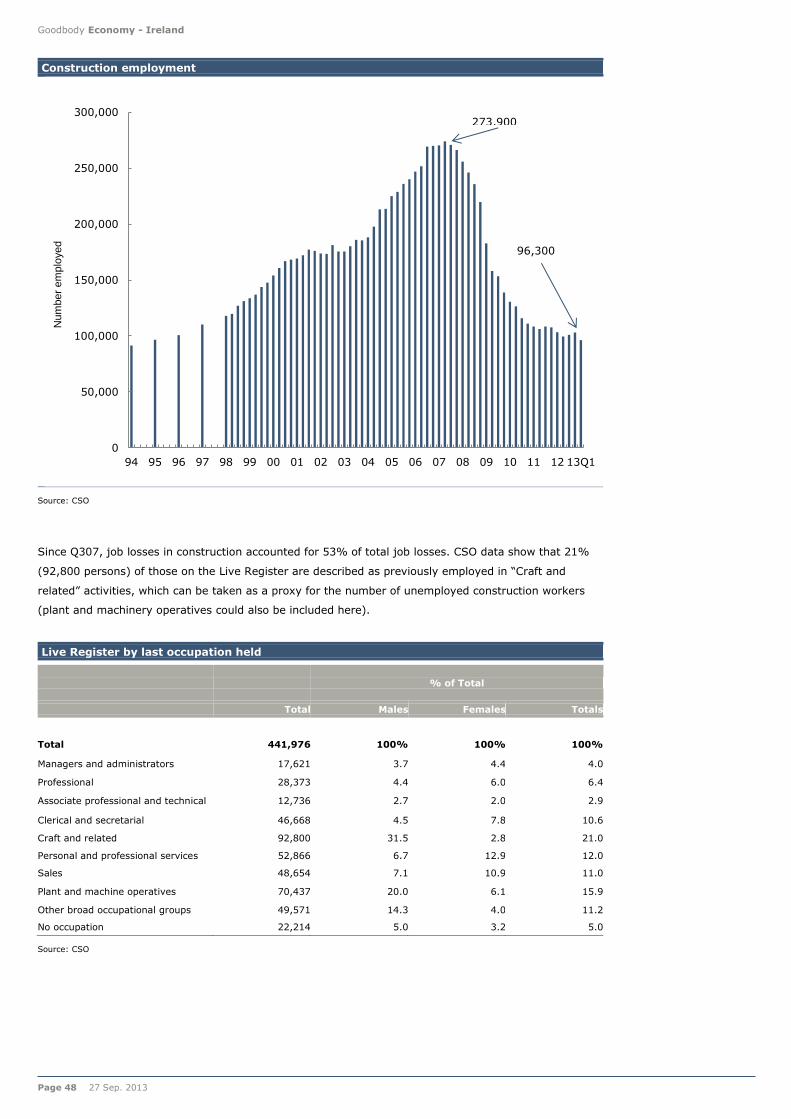
Goodbody Economy - Ireland
Page 48 27 Sep. 2013
Construction employment
Source: CSO
Since Q307, job losses in construction accounted for 53% of total job losses. CSO data show that 21%
(92,800 persons) of those on the Live Register are described as previously employed in “Craft and
related” activities, which can be taken as a proxy for the number of unemployed construction workers
(plant and machinery operatives could also be included here).
Live Register by last occupation held
% of Total
Total Males Females Totals
Total 441,976 100% 100% 100%
Managers and administrators 17,621 3.7 4.4 4.0
Professional 28,373 4.4 6.0 6.4
Associate professional and technical 12,736 2.7 2.0 2.9
Clerical and secretarial 46,668 4.5 7.8 10.6
Craft and related 92,800 31.5 2.8 21.0
Personal and professional services 52,866 6.7 12.9 12.0
Sales 48,654 7.1 10.9 11.0
Plant and machine operatives 70,437 20.0 6.1 15.9
Other broad occupational groups 49,571 14.3 4.0 11.2
No occupation 22,214 5.0 3.2 5.0
Source: CSO
0
50,000
100,000
150,000
200,000
250,000
300,000
94 95 96 97 98 99 00 01 02 03 04 05 06 07 08 09 10 11 12 13Q1
Num
ber
em
plo
yed
273,900
96,300

Goodbody Economy - Ireland
27 Sep. 2013 Page 49
Where next for the construction sector?
Both historical and international comparisons suggest that the construction sector is well below “normal”
levels, but what is normal? Historically, construction has represented a relatively large share of output in
Ireland; as shown earlier, construction has averaged 14% of GNP since 1970. Excluding the boom years
from 2000, construction has averaged 12% of GNP in Ireland. Analysis of European data show that
construction accounted for 11% of GDP between 1995 and 2004 (i.e. prior to the large boom period). On
this basis, we assume 11% is a “normal” level of output for the construction sector, and assume that the
sector grows to this level by 2020. Our analysis also includes a more optimistic and more conservative
scenario:
Base: Construction grows to 11% of GNP by 2020
Conservative: Construction grows to 9% of GNP by 2020.
Optimistic: Construction grows to 13% of GNP by 2020.
Scenario analysis of construction output
Source: CSO, Euroconstruct, Goodbody
Scope for significant construction output growth…
From this medium-term analysis, we can derive estimates of the medium-term growth potential for the
sector as well as the likely impact on both employment levels and the public finances. The table on the
next page shows that under the base scenario, the value of construction output would grow by 10% per
annum over the period to 2020 to achieve an output level of 11% of GNP. Under the more conservative
scenario, which may come about as a result of capacity constraints in the sector or continued lack of
access to bank credit, construction output could still grow by a relatively robust 7% per annum. A more
optimistic scenario that brings output closer in line to the long-term Irish average would lead to growth
of 13% per annum.
0%
5%
10%
15%
20%
25%
30%
% o
f G
NP
Base case Conservative Optimistic EU historical average

Goodbody Economy - Ireland
Page 50 27 Sep. 2013
…and employment gains
In relation to employment, we have used calculations carried out by the Construction Industry Council
for workers per million euro of output. These estimates were based on a detailed analysis of construction
work in the various construction subsectors. Based on the expected mix of construction output in 2020,
we estimate that an employment level of 7.9 construction workers per million euro of output. Under this
assumption, construction employment would grow by 6% per annum over the period to 2020. While this
may appear to be an aggressive assumption, employment levels at the end of the period would still be
more than 40% below their 2007 peak at that stage, and construction employment would still only
represent 7% of total employment, in line with the European average.
Scenario analysis for construction output & employment
Construction
output (value
€m)
% of GNP
Average
annual
growth
Employment
('000)
Average
annual
growth
% of total
employment
Base
19,877 11% 10% 157 6% 7%
Optimistic
23,490 13% 13% 185 8% 9%
Conservative
16,263 9% 7% 128 3% 6%
Source: Goodbody
Using our base case assumption of €20bn construction output in 2020, the following table illustrates the
potential growth in the individual sub-sectors of construction over that period. Over that time, we
assume that the number of new house builds rises to 24,000 as detailed in the residential section of the
report. In value terms, this translates into forecast growth of 21% per annum over the period to 2020.
Assuming a more modest growth in residential RMI leads to 10% per annum growth in residential
construction overall. Civil engineering is forecast to grow by 5% per annum, though given the current
low level of non-residential construction, our forecasts suggest that this sector could grow by 17% per
annum over the period.
Construction sub-sector growth (base case)
Annual average
growth
Residential 10%
New res 21%
Res RMI 5%
Commercial 17%
Civil 5%
Source: Goodbody estimates
Construction output shares in 2020
While the concept of construction sector reaching an optimal size is an appealing one, we do not
automatically assume that this will be an easy task. The collapse in the property market over recent
years has obviously had a detrimental impact on the solvency of a significant number of participants
within it. Secondly, access to development finance remains quite difficult. Given the potential for market
failure in the private sector, the public sector, including NAMA, will have to take an active role in
kickstarting activity in the sector. Fortunately, NAMA is already involved in this process, while the
Government has recently committed to working with the industry to return it to more normal levels (see
Ireland’s Construction Sector: Outlook and Strategic Plan to 2015, Forfas)
Res42%
Non-res35%
Civil
23%

Goodbody Economy - Ireland
27 Sep. 2013 Page 51
How to play Irish Property
Our detailed analysis gives us increasing comfort that the Irish construction sector has turned the
corner. There are a number of ways for investors to play the recovery in Irish property, ranging from low
income/low risk approaches like covered bonds to direct property or direct equity exposure. Specific
avenues include : (i) directly through the underlying asset, especially Dublin Offices where we see
returns of circa 10% p.a.; (ii) a REIT; (iii) construction-related stocks, especially Grafton as it has the
biggest exposure at over 20% of sales, (iv) the Financials, particularly Bank of Ireland, where risks to
forecasts are to the upside; (v) the balance sheet of the banks, in particularly the cocos and covered
bonds, and; (vi) the Irish sovereign
Equity exposure – REITs, financial and buildings materials plays
Whilst investing in the underlying property asset class itself is the most direct way to play the recovering
market in Ireland, there are a number of equities that have extensive leverage into any upside in
property prices.
REITs – A direct property play through equity – Yield play and capital growth
Legislation on REITs was introduced to Ireland earlier this year. Whilst dating as far back to as the 1960s
in the US, the UK only introduced REITs legislation in 2007. Under the Irish legislation, neither
Corporation or Capital Gains Tax is payable on the property rental business provided the REIT is:
1) Resident in Ireland
2) Is listed on the main Stock Exchange of an EU member state
3) Derives at least 75% of profits and holds 75% of its assets from a property rental business
4) Holds a minimum of 3 properties
5) Maintains a minimum 1.25 to 1 income to interest cost ratio
6) Maintains an LTV of no more than 50%
7) Distributes at least 85% of its net income as dividends
No Irish CGT applies to the sale of REIT shares by non-resident investors, though 1% stamp duty is
payable on the transfer of REIT shares.
There is only one listed REIT in Ireland - Green REIT - which came to the stock market in July 2013. It
raised €310m in its IPO and is targeting total shareholder returns of 10-15% per annum (pretax) when
fully invested. It is anticipating to have invested the cash proceeds of the IPO by mid-next year and will
gear up thereafter, running to total assets of about €450m. Management indicated that about 70% of
assets will be income producing and given current valuations, they would be hoping to generate a
running yield of about 9%, so 6.0-6.5% across the whole portfolio (70% * 9%). With an 85%
distribution policy, this implies and expected dividend payout of c.5% per annum. On this basis, the
trend guided capital appreciation is 5-10% per annum.
Green REIT’s management track record is well known to investors. Its current share price of €1.20 puts
it on a 24% premium to NAV, bearing in mind the NAV is still 100% cash. This compares to a selection
of European REITs which currently trade at 0.9x.
Further new issues are possible in due course and the REITs vehicle should prove attractive in particular
for yield-hungry equity investors, but with material exposure to NAV growth.

Goodbody Economy - Ireland
Page 52 27 Sep. 2013
REIT Comparative table
Source: Factset
Financials – Leveraged into recovering asset prices and economy
There are three main domestic Irish banks, though post the financial meltdown in Ireland, only one –
Bank of Ireland (BoI) - is predominately privately owned (the State retains a 15% stake). AIB and PTSB
are over 99% owned by the State. We like the BOI equity story and rate the shares a Buy.
Property based lending (mortgages and commercial real estate) accounts for at least three-quarters of
the loan books of the banks, so any recovery on asset prices will be keenly watched in the context of
prospective loan losses and capital requirements at the banks. Should property prices start to appreciate
this may positively impact the loss given default (and indirectly the probability of default) on asset
quality. In addition, any improvement in the level of new business activity will also be important in
leading to improved margins across the sector.
At a minimum, improving property trends provide more comfort on credit loss forecasts, strengthening
our BoI investment case. We have upgraded our PT from 23c to 26c. The impact on tangible net asset
value (TNAV) in 2016 would be material, particularly if revenue momentum also improved, which would
also raise multiples. We are forecasting that BoI loses €93m in H2, with the risk bias that it actually
turns a profit in Q4, which is likely to be very well received by the market. We anticipate that BoI may
consider a capital raise in Q4 (November IMS might be appropriate timing) as part of a process to pay
down its government owned preference shares.
We would be optimistic of AIB’s return to the market in due course though the bank is likely to re-
evaluate its capital structure ahead of that time, particularly in relation to its preference shares
(€3.5bn). The company is guiding pre-provision profits this year, with which we agree and a return to
profitability in 2014. On the latter, we still envisage the bank making modest losses in 2014, though it
should be approaching breakeven in H214. Improving property trends would be very beneficial for the
AIB story.
Price M.Cap (€) 2013 2014 2013 2014 2013 2014 2013 2014 2013 2014
Land Seecurities GB 11.19 8,768 25.1 23.6 1.0 x 0.9 x 3.9% 3.9% 3.2% 3.3% 80% 79%
British Land GB 7.16 7,106 20.2 18.8 1.0 x 0.9 x 4.9% 4.9% 4.3% 4.5% 88% 85%
Gecina FR 91.57 5,752 18.0 17.2 0.9 x 0.9 x 5.0% 5.1% 4.9% 5.0% 88% 86%
Hammerson GB 6.20 4,419 24.4 22.3 1.0 x 0.9 x 3.9% 4.1% 3.5% 3.8% 85% 84%
Intu Properties GB 3.83 3,705 21.5 21.0 0.9 x 0.9 x 4.2% 4.1% 4.5% 4.5% 97% 95%
ICADE FR 68.97 3,586 14.9 14.2 1.2 x 1.3 x 8.3% 9.1% 5.4% 5.7% 81% 81%
Corio N.V. REIT NEL 32.18 3,095 12.0 12.1 0.8 x 0.8 x 6.4% 6.2% 7.3% 7.2% 88% 87%
Segro GB 3.49 2,591 17.4 17.3 1.0 x 1.0 x 5.8% 5.6% 4.9% 5.0% 86% 86%
Great Portland Estates GB 6.80 2,339 62.0 53.0 1.2 x 1.0 x 1.9% 2.0% 1.5% 1.5% 91% 79%
Shaftesbury GB 7.41 1,871 52.2 47.7 1.2 x 1.1 x 2.3% 2.3% 2.0% 2.0% 102% 97%
Eurocommercial Properties NEL 29.50 1,209 15.1 14.6 0.9 x 0.9 x 5.7% 5.8% 6.5% 6.7% 99% 98%
Wereldhave N.V. NEL 52.90 1,147 16.5 15.5 0.8 x 0.8 x 5.0% 5.5% 6.2% 6.1% 102% 94%
Befimmo SICAFI BEL 50.76 1,074 13.0 13.4 1.0 x 1.0 x 7.4% 7.2% 6.7% 6.6% 87% 89%
UK Comm Prop. Tst GB 0.88 1,053 18.3 18.8 7.9% 7.9% 145% 148%
alstria office REIT GER 8.51 672 13.8 13.3 0.8 x 0.8 x 5.6% 5.8% 6.4% 6.6% 88% 88%
Aedifica BEL 48.92 483 25.0 24.0 3.8% 3.8% 94% 92%
Societe de la Tour Eiffel FR 48.25 300 9.7 10.4 0.8 x 0.8 x 8.5% 7.5% 6.6% 6.6% 64% 69%
Assura Group GB 0.41 215 18.8 17.2 3.5% 3.6% 65% 63%
Montea C.V.A. BEL 30.29 200 14.0 12.3 6.7% 7.0% 94% 86%
Prime Office REIT GER 3.60 187 23.6 0.5 x 0.5 x 0.1% 2.0% 1.3% 2.1% 416% 49%
NewRiver Retail GB 2.65 177 13.9 12.7 0.9 x 0.9 x 6.7% 7.1% 7.3% 7.6% 102% 97%
Warehouses Est.Bel BEL 51.00 161
Average (ALL) 21.3 20.2 0.9 x 0.9 x 5.0% 5.2% 5.0% 5.1% 107% 87%
Average (Large Cap) 23.6 22.1 1.0 x 0.9 x 5.0% 5.1% 4.9% 5.0% 94% 92%
Average (Small Cap) 15.9 16.2 0.8 x 0.7 x 5.3% 5.6% 5.1% 5.4% 132% 78%
P/E P/Book ROE Div Yield Payout Ratio

Goodbody Economy - Ireland
27 Sep. 2013 Page 53
BOI Financial Summary (€m)
Source: Goodbody and Company result s
AIB Financial Summary (€m)
Source: Goodbody and Company Results
The leverage into the improving property and macro picture can also be played through the general
insurance sector’s FBD Holdings. This general insurer is the third largest player in the domestic market
and improving insurable values will have a positive impact on potential premiums in due course. Whilst
only 15-20% of premiums are directly related to housing (and more the cost of construction than the
house value per se), any rise in asset values is likely to have positive implications for insurable values
also in the commercial sector and other asset classes. Insurance accounts for about 95% of FBDs
operating profit and it is all Ireland-centric. We currently have a Buy recommendation on FBD with a
€18.40 price target.
Building materials & Construction – Grafton has largest exposure
The other sector that will naturally draw investors will be construction or building materials stocks with a
large Irish exposure.
As expected, construction companies with an exposure to Ireland have seen significant declines in
revenues. Coupled with expansion in other geographic markets the importance of Ireland has
diminished. In terms of our covered building materials stocks Grafton has the highest exposure to
Ireland at over 20% of group sales.
Percentage of group revenue from Ireland
Source: Goodbody
Peak to trough decline in Irish revenues
Source: Goodbody
Our current company forecasts assume Irish sales will grow by 6% per annum over the period 2013-17.
The analysis in this report more than underpins such growth assumptions given that completions are
expected to grow by circa 15% p.a. while general construction output has the potential to grow by 10%
per annum. In addition, Grafton has the scope to continue to gain market share as competitors’ ability to
grow is likely to be constrained by access to finance to fund working capital. Indeed, there is the
potential for upside to company forecasts with every 1% of extra growth in Ireland yielding operating
profit of €1-2m.
FY11a FY12a FY13f FY14f FY15f
Net Interest Income 1,983 1,746 1,988 2,193 2,291
Government guarantee fees -449 -388 -140 -35 -9
Non Interest Income 524 522 635 695 750
Total Income 2,058 1,880 2,483 2,853 3,033
Operating Costs -1,647 -1,638 -1,560 -1,500 -1,535
Operating Surplus 411 242 923 1,353 1,498
Bad Debts (Incl deleveraging) -2,534 -2,050 -1,406 -892 -682
Underlying Pretax Profits -2,123 -1,808 -483 460 815
Taxation Credit 234 337 58 -46 -90
Net exceptionals -121
Net profit ex-exceptionals -1,890 -1,471 -546 414 726
Basic EPS (Cent) -5.5 -4.9 -1.8 1.4 2.4
NAV 24.9 19.8 19.4 20.1 21.9
FY11a FY12a FY13f FY14f FY15f
Net Interest Income Pre ELG 1,838 1,494 1,499 1,654 1,823
ELG Costs -488 -388 -200 -100 -25
Net Interest Income Post ELG 1,350 1,106 1,299 1,554 1,798
Non Interest Income 438 318 540 490 530
Total Income 1,788 1,424 1,839 2,044 2,328
Operating Costs -1,720 -1,739 -1,515 -1,370 -1,390
Operating Surplus 68 -315 324 674 938
Bad Debts (including disposals) -8,483 -3,491 -1,562 -953 -731
Underlying Pretax Profits -8,414 -3,806 -1,238 -279 207
Gains/Restructuring costs 4,935 -24 -100 0 0
Reported Pretax Profits -3,479 -3,830 -1,338 -279 207
Taxation Credit 1,188 183 93 21 -10
Profit for the period -2,291 -3,647 -1,245 -258 197
22%
6%
4% 3% 3%
0%
5%
10%
15%
20%
25%
Grafton Abbey Kingspan CRH SIG
% o
f to
tal
-91%
-76%
-68%
-61%
-52%
-100%
-90%
-80%
-70%
-60%
-50%
-40%
-30%
-20%
-10%
0%
Abbey Kingspan CRH Grafton SIG
Peak t
o t
rough d
ecline
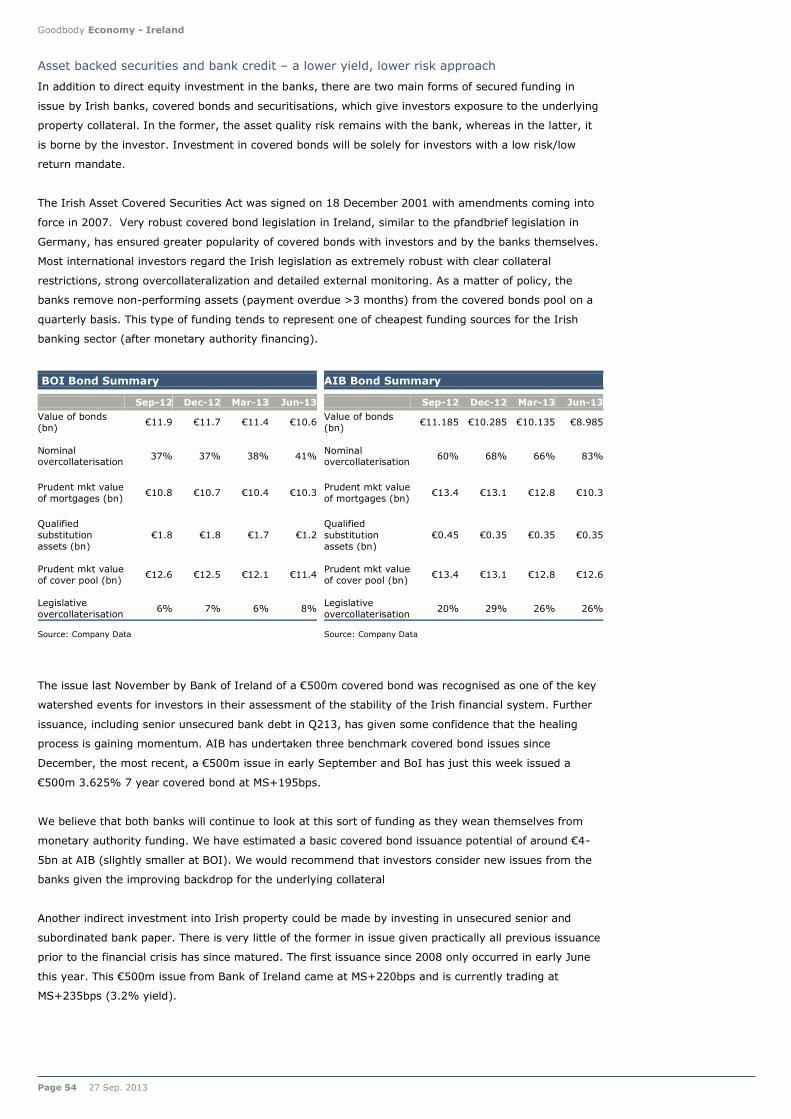
Goodbody Economy - Ireland
Page 54 27 Sep. 2013
Asset backed securities and bank credit – a lower yield, lower risk approach
In addition to direct equity investment in the banks, there are two main forms of secured funding in
issue by Irish banks, covered bonds and securitisations, which give investors exposure to the underlying
property collateral. In the former, the asset quality risk remains with the bank, whereas in the latter, it
is borne by the investor. Investment in covered bonds will be solely for investors with a low risk/low
return mandate.
The Irish Asset Covered Securities Act was signed on 18 December 2001 with amendments coming into
force in 2007. Very robust covered bond legislation in Ireland, similar to the pfandbrief legislation in
Germany, has ensured greater popularity of covered bonds with investors and by the banks themselves.
Most international investors regard the Irish legislation as extremely robust with clear collateral
restrictions, strong overcollateralization and detailed external monitoring. As a matter of policy, the
banks remove non-performing assets (payment overdue >3 months) from the covered bonds pool on a
quarterly basis. This type of funding tends to represent one of cheapest funding sources for the Irish
banking sector (after monetary authority financing).
BOI Bond Summary
Sep-12 Dec-12 Mar-13 Jun-13
Value of bonds
(bn) €11.9 €11.7 €11.4 €10.6
Nominal overcollaterisation
37% 37% 38% 41%
Prudent mkt value
of mortgages (bn) €10.8 €10.7 €10.4 €10.3
Qualified
substitution
assets (bn)
€1.8 €1.8 €1.7 €1.2
Prudent mkt value
of cover pool (bn) €12.6 €12.5 €12.1 €11.4
Legislative
overcollaterisation 6% 7% 6% 8%
Source: Company Data
AIB Bond Summary
Sep-12 Dec-12 Mar-13 Jun-13
Value of bonds
(bn) €11.185 €10.285 €10.135 €8.985
Nominal overcollaterisation
60% 68% 66% 83%
Prudent mkt value
of mortgages (bn) €13.4 €13.1 €12.8 €10.3
Qualified
substitution
assets (bn)
€0.45 €0.35 €0.35 €0.35
Prudent mkt value
of cover pool (bn) €13.4 €13.1 €12.8 €12.6
Legislative
overcollaterisation 20% 29% 26% 26%
Source: Company Data
The issue last November by Bank of Ireland of a €500m covered bond was recognised as one of the key
watershed events for investors in their assessment of the stability of the Irish financial system. Further
issuance, including senior unsecured bank debt in Q213, has given some confidence that the healing
process is gaining momentum. AIB has undertaken three benchmark covered bond issues since
December, the most recent, a €500m issue in early September and BoI has just this week issued a
€500m 3.625% 7 year covered bond at MS+195bps.
We believe that both banks will continue to look at this sort of funding as they wean themselves from
monetary authority funding. We have estimated a basic covered bond issuance potential of around €4-
5bn at AIB (slightly smaller at BOI). We would recommend that investors consider new issues from the
banks given the improving backdrop for the underlying collateral
Another indirect investment into Irish property could be made by investing in unsecured senior and
subordinated bank paper. There is very little of the former in issue given practically all previous issuance
prior to the financial crisis has since matured. The first issuance since 2008 only occurred in early June
this year. This €500m issue from Bank of Ireland came at MS+220bps and is currently trading at
MS+235bps (3.2% yield).

Goodbody Economy - Ireland
27 Sep. 2013 Page 55
Elsewhere, there are a few subordinated bank bonds in issue, all at BOI. BOI’s 12/2022s and 02/2020s
are offering yields of 7.7% while the bank’s shorter dated 2016 contingent convertible securities are also
yielding 7.6%. On the latter, we estimate Basel III transition rules Core Equity Tier 1 ratios of 14-17%
out to 2017. These capital ratios provide almost €3.5-4.0bn of capital protection to the cocos, which is
very attractive to us. We would recommend investors buy the BKIR coco.
Sovereign exposure
The purest way of playing a general Irish recovery is the buy the Irish sovereign. Sovereign yields have
fallen dramatically over recent years, but still offer value relative to “semi-core” markets such as
Germany. An improving property market could have a number of important implications. Firstly, the
Irish state has a significant contingent exposure to property by way of NAMA and the stakes in the
banks. Secondly, the ballooning of the primary deficit since 2008 was very much linked to the collapse in
the property market. Improving trends in property should improve the solvency position of the Irish
state.
Property transactions and loan purchases – Direct gearing to upturn
The most direct investment proposition for most investors looking to gain exposure to the recovering
property market will be the underlying asset itself. In this instance, most focus will be on the commercial
side given the larger bite-size.
Total returns have been positive for seven consecutive quarters (including Q213) and, importantly, in
the most recent quarter, capital values started to show a modest improvement. Total returns in Q2 were
2.3%. IPD calculates that the average equivalent yield in Q2 was 8.7% which reflects the degree of
over-renting in the market. Prime Dublin central business district yields for properties let on market
rents are now just 6.5% and are anticipated to continue contracting over the coming month reflecting
the strong demand from investors attracted to the sector by high income returns.
CBRE noted that c.€970m of transactions have been completed in the first eight months of the year (of
deals over €1m) and believes that activity levels are likely to remain strong over the coming months.
The ending of the capital gains tax waiver at the end of this year will put pressure on many vendors and
purchasers to get property transactions completed by then.
Some investors are more likely to be interested in buying commercial property loans directly. Whilst this
approach will incorporate some evaluation of credit risk as well as a view on the underlying collateral
and cash flows, this approach may prove attractive for investors seeking potentially higher returns than
direct property investment given possible purchase below the underlying collateral value.
According to our estimates, there is about c.€58bn of commercial real estate investment lending across
the domestic financial system relating to Ireland. Clearly, not all is earmarked for deleveraging, but loan
portfolios from NAMA, IBRC, Danske and Lloyds Ireland are on the block. In addition, whilst there is no
formal deleveraging earmarked by the domestic banks, there may be some churn should owners receive
bids from third party investors or require re-financings that generate transactions. As such, the potential
pool of investment opportunities for purchasing loan books looks interesting (will be key for the REITs as
well).

Goodbody Economy - Ireland
Page 56 27 Sep. 2013
Appendix – Glossary of Property Terms
IPD Return Terms
Total return is calculated as the change in capital value, less any capital expenditure incurred, plus net
income, expressed as a percentage of capital employed over the period concerned.
Income return is calculated as net income expressed as a percentage of capital employed over the
period concerned.
Capital growth is calculated as the change in capital value, less any capital expenditure incurred,
expressed as a percentage of capital employed over the period concerned.
Capital employed is defined as the value of assets held at the beginning of the computation period
plus purchase, development and other capital expenditure during the period.
Property Terms
Rent, Passing Rent, Current Rent is the annual rent payable under a lease.
Rental Value, ERV, Estimated Rental Value, OMRV, Open Market Rental Value is the annual
rent that would be payable if the property was available to rent today
Over-rented is when the Passing Rent is higher than Rental Value
Reversionary is when Rental Value is higher than Passing Rent
Rack-rented is when the Passing Rent is equal to the Rental Value
Capital Value, Market Value is the estimate of the price that the property would sell at on the open
market
Gross Value of a Property is the Market Value of the Property plus acquisition Costs
Initial Yield is calculated as Rent (Passing Rent) over the Gross Value of the Property
Reversionary Yield is calculated as Rental Value over the Gross Value of the Property
Equivalent Yield lies somewhere in between the initial yield and reversionary yield. It encapsulates the
DCF of the property (the discount rate which equates the NPV of future income flows to the Gross Capital
Value), with rents rising (or falling) from the current Passing Rent to the underlying Rental Value, less
costs that are incurred along the way.
Market Yields are quoted on the assumption that a property is rack-rented

Goodbody Economy - Ireland
27 Sep. 2013 Page 57
Appendix – Geographical descriptions
Border, Midland & West Southern & Eastern
Border Dublin
Cavan Dublin City
Donegal Dun-Laoghaire-Rathdown
Leitrim Fingal
Louth South Dublin
Monaghan
Sligo
Midlands Mid-East
Laois Kildare
Longford Meath
Offaly Wicklow
Westmeath
West Mid-West
Galway City Clare
Galway County Limerick City
Mayo Limerick County
Roscommon North Tipperary
South East
Carlow
Kilkenny
South Tipperary
Waterford City
Waterford County
Wexford
South-West
Cork City
Cork County
Kerry

Goodbody
Analyst Certification
The named Research Analyst certifies that: (1) All of the views expressed in this research report accurately reflect my personal views about
any and all of the subject securities and issuers. (2) No part of my remuneration was, is, or will be, directly or indirectly, related to the
specific recommendations or views expressed by me in this report.
Regulatory Information
Goodbody Stockbrokers is part of the Fexco group of companies. Goodbody Stockbrokers is regulated by the Central Bank of Ireland and is a
member firm of the Irish Stock Exchange and the London Stock Exchange. This publication has been approved by Goodbody Stockbrokers.
The information has been taken from sources we believe to be reliable, we do not guarantee their accuracy or completeness and any such
information may be incomplete or condensed. All opinions and estimates constitute best judgement at the time of publication and are
subject to change without notice. The information, tools and material presented in this document are provided to you for information
purposes only and are not to be used or considered as an offer or the solicitation of an offer to sell or to buy or subscribe for securities.
Conflicts of Interest
Goodbody Stockbrokers has procedures and policies in place to identify and manage any potential conflicts of interest that arise in
connection with its research business. Goodbody Stockbrokers’ analysts and other staff who are involved in the preparation and
dissemination of research operate and have a management reporting line that is independent to its Corporate Finance business. Information
barriers are in place between the Corporate Finance arm and the Research arm to ensure that any confidential and or price sensitive
information is handled in an appropriate manner.
Our Investment Research Conflicts of Interest Policy is available at Conflicts of Interest
Investors should be aware, that, where appropriate, research may be disclosed to the issuer(s) in advance of publication in order to correct
factual inaccuracies only and not to materially amend the research in any way. Goodbody Stockbrokers is satisfied that it has operational
procedures in place, which ensure that such disclosures will not compromise the report’s objectivity.
Goodbody Stockbrokers and its associated companies may from time to time perform investment banking or corporate finance services,
including underwriting, managing or advising on a public offering for, or solicit business from any company recommended in this report.
Goodbody Stockbrokers may have acted, in the past 12 months, as lead manager / co-lead manager in the securities of any company
named in this report.
Goodbody Stockbrokers is a registered market maker in the majority of companies listed on the Irish Stock Exchange and their equivalent
on the London Stock Exchange and may hold positions in any of the companies mentioned in this report from time to time. A complete list of
the companies that Goodbody Stockbrokers makes a market in is available at Regulatory Disclosures

Goodbody
Other disclosures
A description of this company is available at Company Descriptions All prices used in this report are as at close of business of the previous working day unless otherwise indicated. A summary of our standard valuation methods are available at Valuation Methodologies A summary of share price recommendations and whether material investment banking services have been provided to these companies is available at Regulatory Disclosures Other important disclosures are available at Regulatory Disclosures Goodbody Stockbrokers updates its recommendations on a regular basis. A breakdown of all recommendations provided by Goodbody Stockbrokers is available at Regulatory Disclosures Where Goodbody Stockbrokers has provided investment banking services to an issuer, details of the proportion of buys, adds, reduces and sells attributed to that issuer will also be included. This is updated on a quarterly basis. Recommendation Definitions Goodbody Stockbrokers uses the terms “Buy”, “Sell” and “Hold. The term “Buy” means that the analyst expects the security to appreciate in excess of 10% over a twelve month period. The term “Sell” means that the security is expected to decline in excess of 10% over the next twelve months. The term “Hold” means that the analyst expects the security to neither appreciate more than 10%, or depreciate more than 10% over the next twelve months. On 27th of November, 2012, the terms “Add” and “Reduce” were removed from the Recommendation Definitions and both were replaced with the “Hold” recommendation. Any Previous Recommendation that refers to either an “Add” means that the analyst expected the security to appreciate by up to 15% over a twelve month period. Any Previous Recommendation to “Reduce” means that the analyst expected the security to decline by up to 15% over the next twelve months. In the event that a stock is delisted the firm will automatically cease coverage. If however the firm ceases to cover a stock for any other reason the firm will disclose this fact. Distribution of research to clients of Goodbody Securities Inc (GSI) in the US GSI distributes third-party research produced by its affiliate, Goodbody Stockbrokers GSI is a member of FINRA and SIPC. GSI does not act as a market-maker. Neither GSI nor its affiliates hold a proprietary position and/or controls on a discretionary basis more than 1% of the total issued share capital of this company/these companies. This information was current as of the last business day of the month preceding the date of the report. An affiliate of GSI may have acted, in the past 12 months, as lead manager/co-lead manager of a publicly disclosed offer of the securities in this company. Investors should be aware that an affiliate of GSI may have provided investment banking or non-investment-banking services to, and received compensation from this company in the past 12 months or may provide such services in the next three months. The term investment banking services includes acting as broker as well as the provision of corporate finance services, such as underwriting and managing or advising on a public offer. All transactions by US persons involving securities of companies discussed in this report are to be effected through GSI. Disclaimer While all reasonable care has been taken in the production and dissemination of this report it is not to be relied upon in substitution for the exercise of independent judgement. Nothing in this report constitutes investment, legal, accounting or tax advice, or a representation that any investment or strategy is suitable or appropriate to your individual circumstances, or otherwise constitutes a personal recommendation to you. Private customers having access, should not act upon it in anyway but should consult with their independent professional advisors. The price, value and income of certain investments may rise or may be subject to sudden and large falls in value. You may not recover the total amount originally invested. Past performance should not be taken as an indication or guarantee of future performance; neither should simulated performance. The value of securities may be subject to exchange rate fluctuation that may have a positive or adverse effect on the price or income of such securities. All material presented in this report, unless specifically indicated otherwise is copyright to Goodbody Stockbrokers. None of the material, nor its content, nor any copy of it, may be altered in any way, transmitted to, copied or distributed to any other party, without the prior express written permission of Goodbody Stockbrokers.
Goodbody, Ballsbridge Park, Ballsbridge, Dublin 4, Ireland T (+353 1) 6670400 W www.goodbody.ie E [email protected]
Related Documents