The Voice of the Business Community Economic Outlook and Member Survey Winter 15

Economic Outlook and Member Survey 2015
Dec 14, 2015
Economic Outlook and Member Survey 2015
Welcome message from author
This document is posted to help you gain knowledge. Please leave a comment to let me know what you think about it! Share it to your friends and learn new things together.
Transcript

T h e V o i c e o f t h e B u s i n e s s C o m m u n i t y
Economic Outlook and Member Survey
Winter 15

E X E C U T I V E S U M M A R Y
Conducted in January 2015 by the St. John’s Board of Trade, this survey provides an overview of the business climate for the coming year. More than 100 local businesses, comprised of all sectors of the economy, responded to the survey. Despite economic uncertainty caused by a recent drop in oil prices, businesses still remain cautiously optimistic. Approximately 80 per cent of business owners characterize local economic conditions as “good” or “excellent.” The biggest challenge for business owners in 2015 is competition.
Business owners cited a growth of existing business and staff/management skills as the main factors driving local economic success.
H I G H L I G H T S 88 per cent of businesses report their company’s financial position as about the same or better than last year. 75 per cent of businesses say their gross revenue for 2014 was about the same or better than 2013. 55 per cent of businesses believe that competition is a factor that could hinder growth. 40 per cent of businesses believe immigration is a very important means of meeting future labour requirements. 58 per cent of businesses believe that Newfoundland and Labrador requires an international recruitment strategy.
E C O N O M I C G R O W T H P R O J E C T I O N S
Over the first 11 months of 2014, prices for oil declined by 5.6 per cent and iron ore prices fell by 26.5 per cent. As a result GDP has been negatively impacted1. Many economic growth projections for 2015 were conducted in the fall of 2014, before the price of oil started to drop. As a result, the falling price was not taken into consideration and real GDP projections were higher. RBC Economic Group’s Provincial Outlook for Canada forecasts a provincial real GDP growth of 1.1 per cent for 20152. The Conference Board of Canada predicts a real GDP growth of 3.4 per cent in 20153. More recently the
1 http://www.fin.gov.nl.ca/fin/publications/EconomicReview_2014.pdf 2 RBC Economic Group. Provincial Outlook for Canada: http://www.rbc.com/newsroom/_assets-custom/pdf/20141212-provfcst.pdf 3 Conference Board of Canada. Brighter Days Ahead for Provincial Economies: http://www.conferenceboard.ca/press/newsrelease/14-11-27/brighter_days_ahead_for_provincial_economies.aspx

Atlantic Provinces Economic Council (APEC) released their economic outlook and expects the Newfoundland and Labrador economy to grow 1.5 per cent in 2015 with little change expected in overall resource output or investment spending4.
D E M O G R A P H I C S
As we look to the future, demographic trends continue to be a concern for Newfoundland and Labrador. These trends will result in rising health care costs, a shrinking tax base, increased per capita debt, difficulty finding successors for retiring small business owners, and a lack of qualified, skilled workers across all sectors. As of October 2014, the province’s population was estimated at 526,837, a decrease from the previous year5. This is attributed to a net increase in interprovincial out-migration. From July 2014 to September 2014, the province had a net loss of 658 people due to interprovincial outmigration6. Nearly 250,000 people have left the province since 1992. As of July 2012, the median age in the province was 44.2 years – the oldest in Canada. Provincially, the fertility rate is consistently among the lowest in Canada at 1.45 births per woman7. According to the Government of Newfoundland and Labrador population projection for 2035 are projected to decline to 496, 084.
4 APEC economic outlook: https://www.apec-econ.ca/about/news/view/?do-load=1&news.id=136 5 Statistics Canada Demography Division. Estimation of Population, Canada, Provinces and Territories: http://www5.statcan.gc.ca/cansim/a26?lang=eng&retrLang=eng&id=0510005&paSer=&pattern=&stByVal=1&p1=1&p2=31&tabMode=dataTable&csid= 6 Statistics Canada. Interprovincial Migrants, Canada, Provinces and Territories: http://www5.statcan.gc.ca/cansim/a26?lang=eng&retrLang=eng&id=0510017&paSer=&pattern=&stByVal=1&p1=1&p2=31&tabMode=dataTable&csid= 7 Statistics Canada. Births and Total Fertility Rate, By Province and Territory: http://www.statcan.gc.ca/tables-tableaux/sum-som/l01/cst01/hlth85b-eng.htm
Newfoundland and Labrador has among the lowest fertility
rate in Canada at 1.45 births per woman.
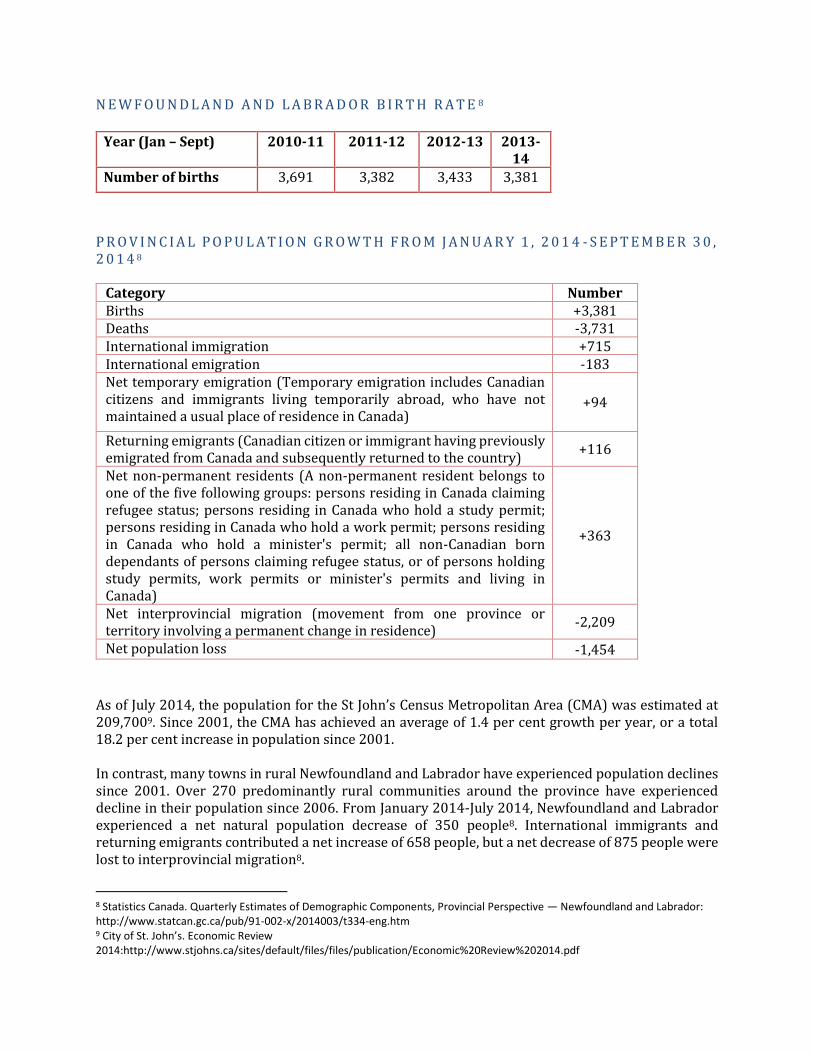
N E W F O U N D L A N D A N D L A B R A D O R B I R T H R A T E 8
P R O V I N C I A L P O P U L A T I O N G R O W T H F R O M J A N U A R Y 1 , 2 0 1 4 - S E P T E M B E R 3 0 , 2 0 1 4 8
As of July 2014, the population for the St John’s Census Metropolitan Area (CMA) was estimated at 209,7009. Since 2001, the CMA has achieved an average of 1.4 per cent growth per year, or a total 18.2 per cent increase in population since 2001.
In contrast, many towns in rural Newfoundland and Labrador have experienced population declines since 2001. Over 270 predominantly rural communities around the province have experienced decline in their population since 2006. From January 2014-July 2014, Newfoundland and Labrador experienced a net natural population decrease of 350 people8. International immigrants and returning emigrants contributed a net increase of 658 people, but a net decrease of 875 people were lost to interprovincial migration8.
8 Statistics Canada. Quarterly Estimates of Demographic Components, Provincial Perspective — Newfoundland and Labrador: http://www.statcan.gc.ca/pub/91-002-x/2014003/t334-eng.htm 9 City of St. John’s. Economic Review 2014:http://www.stjohns.ca/sites/default/files/files/publication/Economic%20Review%202014.pdf
Year (Jan – Sept) 2010-11 2011-12 2012-13 2013-14
Number of births 3,691 3,382 3,433 3,381
Category Number Births +3,381 Deaths -3,731 International immigration +715 International emigration -183 Net temporary emigration (Temporary emigration includes Canadian citizens and immigrants living temporarily abroad, who have not maintained a usual place of residence in Canada)
+94
Returning emigrants (Canadian citizen or immigrant having previously emigrated from Canada and subsequently returned to the country)
+116
Net non-permanent residents (A non-permanent resident belongs to one of the five following groups: persons residing in Canada claiming refugee status; persons residing in Canada who hold a study permit; persons residing in Canada who hold a work permit; persons residing in Canada who hold a minister's permit; all non-Canadian born dependants of persons claiming refugee status, or of persons holding study permits, work permits or minister's permits and living in Canada)
+363
Net interprovincial migration (movement from one province or territory involving a permanent change in residence)
-2,209
Net population loss -1,454
I M M I G R A T I O N
Prior to 2007, an average of 450 immigrants came to the Newfoundland and Labrador annually. Since then, annual immigration has been increasing and, in 2013, 825 immigrants arrived in the province, the highest ever-annual total. In 2014 the Province successfully negotiated with the Federal Government an increase of 67 per cent in the Provincial Nominee Program, increasing the province’s overall annual quota to 1,050. 10
L A B O U R M A R K E T
After many years of strong growth the province saw a decline in employment in 2014. Average employment has decreased from January to October 2014 by 5,400 over the same period during the previous year. Full-time positions decreased by 7,100 during the first ten months of 2014, while part-time positions grew by 1,60011. The participation rate fell by 0.7 per cent in the first 10 months of 2014, plus an additional decline in the population aged 15 and above, resulted in a 1.4 per cent decline in the labour force11. While the province saw a decline in employment in 2014 the St. John’s Census Metropolitan Area (CMA) performed well in 2014 as employment increased by 1.9 per cent (or 2,000). The unemployment rate in the province for 2014 is anticipated to average 12.2 per cent, a 0.8 percentage increase for the same period in 201311. In December 2014, the unemployment rate increased by 0.3 per cent, reaching 11.112. The average national unemployment rate for the first two
10 Government of Newfoundland and Labrador. http://www.releases.gov.nl.ca/releases/2014/aes/1230n04.aspx 11 Government of Newfoundland and Labrador. The Economic Review: http://www.fin.gov.nl.ca/fin/publications/EconomicReview_2014.pdf 12 Newfoundland & Labrador Statistics Agency. Unemployment Rate, Monthly: http://www.stats.gov.nl.ca/Statistics/Labour/ PDF/UnempRate_Monthly.pdf

months of 2014 was 7 per cent, while the St. John’s CMA had an unemployment rate of 5.9 per cent as of January 20159. Youth unemployment remains high, sitting at 12.2 per cent as of December 2014, however, the rate experienced a decrease of 2.7 per cent over the previous year13. A skills mismatch is recognized, with prospective employees lacking the skills, talents, or experience to succeed. Newfoundland and Labrador Labour Market Outlook 2020 forecasted that 77,000 jobs will be vacant in the coming eight years; however, based on current participation rates in the province we can expect to be short 24,466 people out of the 77,000 new jobs14.
A V E R A G E W A G E S
For 2015, the Conference Board of Canada had predicted modest wage increases in Canada of 2.9 per cent for non-unionized employees15.
13 Newfoundland & Labrador Statistics Agency. Labour Force Characteristics : Youth - Age Group 15 to 24 Years: http://www.stats.gov.nl.ca/statistics/Labour/PDF/LFC_NL_Youth_Monthly.pdf 14 This was calculated by using growth in population (15 years and over), and a static participation rate. (As of December 2012, the participation rate for the Province was 62.2 per cent). 15 The Globe and Mail. Canadian Wages to Get ‘Moderate’ Hike in 2015, Report Finds: http://www.theglobeandmail.com/report-on-business/economy/canadian-wages-to-get-moderate-hike-in-2015-report-finds/article21378373/
The unemployment rate in the St. John’s Census Metropolitan Area (CMA) decreased by 0.2 per cent to 5.9 per cent, the lowest unemployment rate in at least 40 years and the 11th lowest
unemployment rate among CMAs in Canada9.

H O U R L Y E A R N I N G S 16
Occupational Classification
December 2013 ($)
December 2014 ($)
Per cent change in hourly wage
Management 36.63
41.39 13.0
Business, finance and administrative 22.79
21.88 -4.0
Natural and applied sciences 35.66 33.03 -7.4
Health 30.21 30.85 2.1
Social science, education, government services and religion
34.27 35.71 4.2
Art, culture, recreation and sport 24.11 24.13 0.1
Sales and service 15.37 16.29 6.0
Trades, transport and equipment operators 25.61 26.21 2.3
Primary industry 27.13 25.27 -6.9
Processing, manufacturing and utilities 19.51 24.98 28.0
O T H E R E C O N O M I C I N D I C A T O R S
C O N S T R U C T I O N A N D D E V E L O P M E N T
Building permits in the St. John’s CMA for November 2014 were valued at $31.4 million, down 32.7 per cent from November 201317. The values of these permits are the second highest of all Atlantic
16 Statistics Canada. Average Hourly Wages of Employees by Selected Characteristics and Occupation, Unadjusted Data, by
Province: http://www.statcan.gc.ca/tables-tableaux/sum-som/l01/cst01/labr69b-eng.htm 17 Statistics Canada. Value of Building Permits, Census Metropolitan Area (Monthly): http://www.statcan.gc.ca/tables-tableaux/sum-som/l01/cst01/econ68a-eng.htm
Canadian CMAs, behind Halifax, Nova Scotia16. Approximately 80 per cent of construction expenditures in 2014 were anticipated to come from the private sector 11.
M O T O R V E H I C L E S A L E S
New motor vehicle sales totaled 30,620 during the first 10 months of 201418. In the same period in 2013 the number of units sold was 31,309, and 29,549 units were sold during the period in 201218.
C O N S U M E R P R I C E I N D E X ( C P I )
The Consumer Price Index (CPI) is a unit of measurement used to estimate the inflation rate. In Newfoundland and Labrador consumers paid 2.0 per cent more for goods and services in the January to March period in 2014 than they did in the previous year19. The Department of Finance’s March 2014 forecast expected CPI to average to 1.7 per cent18.
R E T A I L A N D W H O L E S A L E T R A D E
Retail sales for January-March 2014 in the province were posted at $1.796 billion, compared to $1.759 billion during the same period in the previous year20. Growth in sales were recorded in most
18 Statistics Canada. New Motor Vehicle Sales, Canada, Provinces and Territories: http://www5.statcan.gc.ca/cansim/a26?lang=eng&retrLang=eng&id=0790003&paSer=&pattern=&stByVal=1&p1=1&p2=37&tabMode=dataTable&csid= 19 Department of Finance, Economic Research and Analysis Division. Consumer Price Index Commentary, January - March, 2014: http://www.economics.gov.nl.ca/EB-cpi.asp 20 Department of Finance, Economic Research and Analysis Division. Retail Sales Commentary, January - March 2014: http://www.economics.gov.nl.ca/eb-retail.asp

types of retail trade, with gains mainly driven by motor vehicle and parts stores and health and personal care stores. Retail trade was up 3.9 per cent in the St. John’s CMA19.
R E TA I L S AL E S BY IN D U S TRY N E WF O UN D L A N D A N D L A BRA D OR : J A N UA RY TO M AR C H 1 9
Retail Sales Trade Group ($ millions)
2013 2014 Actual Change Per cent Change
Motor vehicle and parts dealers 412.7 406.5 -6.2 -1.5%
Gasoline stations 264.5 316.3 51.7 19.6%
Furniture, home furnishings and electronics
64.6 62.6 -2.0 -3.1%
Building and outdoor home supplies
98.1 89.4 -8.7 -8.9%
Health and personal care 129.0 131.1 2.1 1.6%
Clothing and accessories 50.8 51.6 0.8 1.6%
Sporting goods, hobby, music and bookstores
19.3 20.4 1.1 5.7%
Food and beverage 443.9 439.2 -4.7 -1.1%
General merchandise 250.2 253.1 2.9 1.1%
Miscellaneous 26.0 26.3 0.3 1.0%
TOTAL 1,759.2 1,796.4 37.2 2.1%
R E A L E S T A T E A N D H O U S I N G
The average price of housing sales in December 2014 was $273,769, showing a decrease of 5.4 per cent from 201321. The average residential price in St. John’s was $317,800 during the first nine months of 2014, roughly the same level as the same period for 201311. Housing starts decreased by 1,023 in the province in 2014, to 2,86222.
21 Newfoundland and Labrador Association of Realtors. Newfoundland and Labrador home sales up in December: http://creastats.crea.ca/stjo/ 22 Newfoundland and Labrador Statistics Agency. Quarterly Housing Starts: http://www.stats.gov.nl.ca/statistics/Industry/PDF/Housing_Starts.pdf

C A P I T A L E X P E N D I T U R E
Capital expenditure in 2014 is estimated to stand at $12.4 billion, with the most significant contributors being in the oil and gas extraction, mining, and utilities sectors11.
M A J O R C A P I T A L P R O J E C T S 1 1
Hebron offshore project will spend $14 billion in construction with a schedule to
produce oil by 2017.
Muskrat Falls project, Phase I with construction estimated at $6.2 billion
Hibernia Southern Extension and Husky’s South White Rose Extension, at a cost of
$1.7 billion and $1.2 billion, respectively.
For a complete listing of major capital projects visit: http://economics.gov.nl.ca/E2014/InventoryOfMajorCapitalProjects.pdf
C O M M O D I T I E S P R O D U C T I O N
Oil production is the largest contributor to provincial GDP. Offshore oil royalties accounted for 28 per cent of provincial revenues in 2013-1411. The price of Brent Crude oil ended 2013 at US$108.56 per barrel11. This is a major difference from the price of Brent crude in January 2015, which was US$49.23 per barrel23. An estimated 79.1 million barrels of oil were produced in the province in 2014, a decline from the 83.6 million produced in 201311. Mining in the province performed moderately well, despite poor market conditions in 2014. Mineral shipments are expected to total $3.0 billion for 2014, a decrease of 17.6 per cent from 201311. Exploration in the sector continued to advance in 2014, but poor iron ore market conditions slowed the growth of potential projects11. Exploration expenditures are estimated
23 Bloomberg. Energy and Oil Prices: http://www.bloomberg.com/energy/

to reach $84.1 million in 2014, a decrease from last year’s $104.0 million11. Phase I construction of Vale’s Long Harbour nickel processing facility was completed October 2013, with the facility employing 475 people when operational11. In July 2014, the facility was successful in the production of first nickel11. The engineering design of Phase 2 has commenced; Phase 2 is anticipated to take 18 months to complete11.
Oil production in the January-September period in 2014 was 59.0 million barrels, down 9.2 per cent (6.0 million barrels) relative to the same period in 201311. The Hibernia field produced 32.8 million barrels of oil in January - September 2014, down 12.3
per cent (4.6 million barrels) from January - September 201311. Terra Nova produced 10.9 million barrels of oil in January - September 2014, down 12.2 per cent
(1.5 million barrels) from January – September 201311. White Rose (including North Amethyst) produced 15.3 million barrels of oil in January -
September 2014, up 0.7 per cent (110,000 barrels) from January – September 201311.
The provincial Department of Finance’s March 2014 forecast projected annual oil production to be 85.1 million barrels in 2014, 1.8 per cent higher than 2013, mainly due to increased production at Terra Nova which will be partially offset by natural declines at Hibernia24.
24 Department of Finance, Economic Research and Analysis Division. Oil Production Commentary, May 2014: http://www.economics.gov.nl.ca/EB-Oil.asp
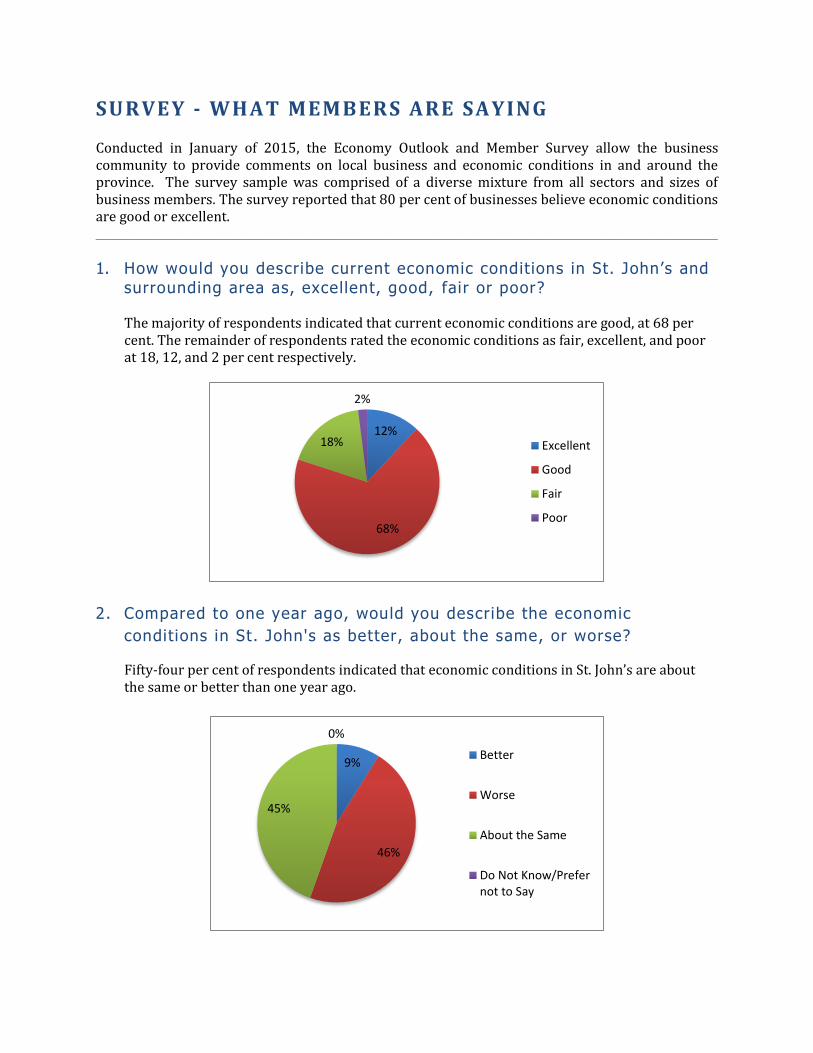
SURVEY - WHAT MEMBERS ARE SAYING Conducted in January of 2015, the Economy Outlook and Member Survey allow the business community to provide comments on local business and economic conditions in and around the province. The survey sample was comprised of a diverse mixture from all sectors and sizes of business members. The survey reported that 80 per cent of businesses believe economic conditions are good or excellent. _____________________________________________________________________________________
1. How would you describe current economic conditions in St. John’s and surrounding area as, excellent, good, fair or poor? The majority of respondents indicated that current economic conditions are good, at 68 per cent. The remainder of respondents rated the economic conditions as fair, excellent, and poor at 18, 12, and 2 per cent respectively.
2. Compared to one year ago, would you describe the economic
conditions in St. John's as better, about the same, or worse?
Fifty-four per cent of respondents indicated that economic conditions in St. John’s are about the same or better than one year ago.
12%
68%
18%
2%
Excellent
Good
Fair
Poor
9%
46%
45%
0%
Better
Worse
About the Same
Do Not Know/Prefernot to Say
3. What has contributed to your impression that the economic conditions in St. John's and surrounding areas are better/ worse/ about the same compared to one year ago?
Respondents that indicated conditions are better than one year ago stated the following reasons: improved weather conditions, improved transportation, as well as construction and development. For those who responded that conditions are worse than one year ago stated the following reasons: dropping price of oil and government over spending.
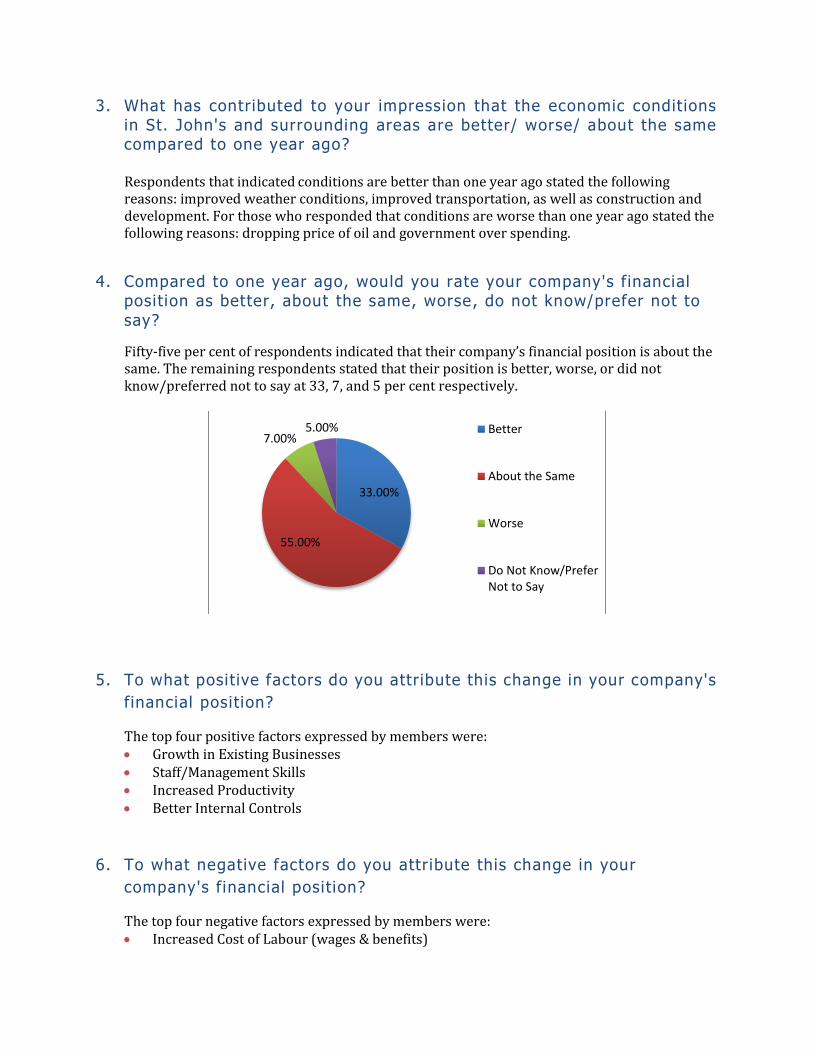
4. Compared to one year ago, would you rate your company's financial position as better, about the same, worse, do not know/prefer not to
say?
Fifty-five per cent of respondents indicated that their company’s financial position is about the same. The remaining respondents stated that their position is better, worse, or did not know/preferred not to say at 33, 7, and 5 per cent respectively.
5. To what positive factors do you attribute this change in your company's
financial position?
The top four positive factors expressed by members were: Growth in Existing Businesses Staff/Management Skills Increased Productivity Better Internal Controls
6. To what negative factors do you attribute this change in your
company's financial position?
The top four negative factors expressed by members were: Increased Cost of Labour (wages & benefits)
33.00%
55.00%
7.00%5.00% Better
About the Same
Worse
Do Not Know/PreferNot to Say

Decline in Existing Business Other Decreased Productivity
7. Would you describe your company's gross revenue for 2014 compared to 2013, as greater, about the same, less, or do not know/prefer not to say? Forty-six per cent of respondents rate their company’s gross revenue for 2014 as greater than 2013. Twenty-nine per cent believed it was about the same, 14 per cent did not know or preferred not to say, and 3.5 per cent stated it was less than 2013.
8. Compared to exactly one year ago has the number of people your company employs in Newfoundland and Labrador increased, stayed the same or decreased? Forty-nine per cent of respondents stated that the number of people their company employs has stayed the same. Approximately 17 per cent of the member respondents stated that the number had decreased, and 15 per cent said the number employed has increased since one year ago.
46.00%
29.00%
3.50% 14.00%
Greater
About the Same
Less
Do Not Know/PreferNot to Say
15.00%
16.95%49.00%
Increased
Decreased
Stayed the Same

9. Looking forward one year, do you anticipate that the number of people your company wil l employ in Newfoundland and Labrador will increase, decrease, or stay the same? The majority of survey participants indicated that they anticipate that the number of people employed in Newfoundland and Labrador will stay the same at 55 per cent. Thirty-six per cent stated that they anticipate the number will increase, and 9 per cent stated that they anticipate it will decrease.
10. Are there any factors that you feel will hinder your company's
economic growth?
The majority of member participants felt that there are factors that will hinder their
company’s economic growth, at 59 per cent.
36.00%
9.00%
55.00%
Increase
Decrease
Stay the Same
59.00%
41.00% Yes
No

11. If yes, what are these factors?
Of those who responded yes, the top four factors were: Competition Labour Issues Cost of Production Access to Financing
12. Comparing 2014 to 2013 did your company's/organization's overall spending increase, stay the same, decreased, or do not know/prefer not to say?
Thirty-seven per cent of respondents stated that their organization’s overall spending increased. The remaining participants responded that their overall spending stayed the same, did not know or preferred not to say, and decreased at 34, 18, and 11 per cent respectively.
13. Using a scale of 1 to 10 where 1 is not at all concerned and 10 is very concerned, how concerned are you about your business' abil i ty to find qualif ied employees?
Twenty per cent of respondents rated their level of concern as a seven on a scale on one to 10. Compared to the same time in the previous year, approximately 38 per cent of respondents rated their level of concern as a three on a scale from one to five. The average level of concern of member participants totaled 5.8 for this year.
37.00%
34.00%
11.00%
18.00%
Increase
Stay the Same
Decrease
Do Not Know/PreferNot to Say
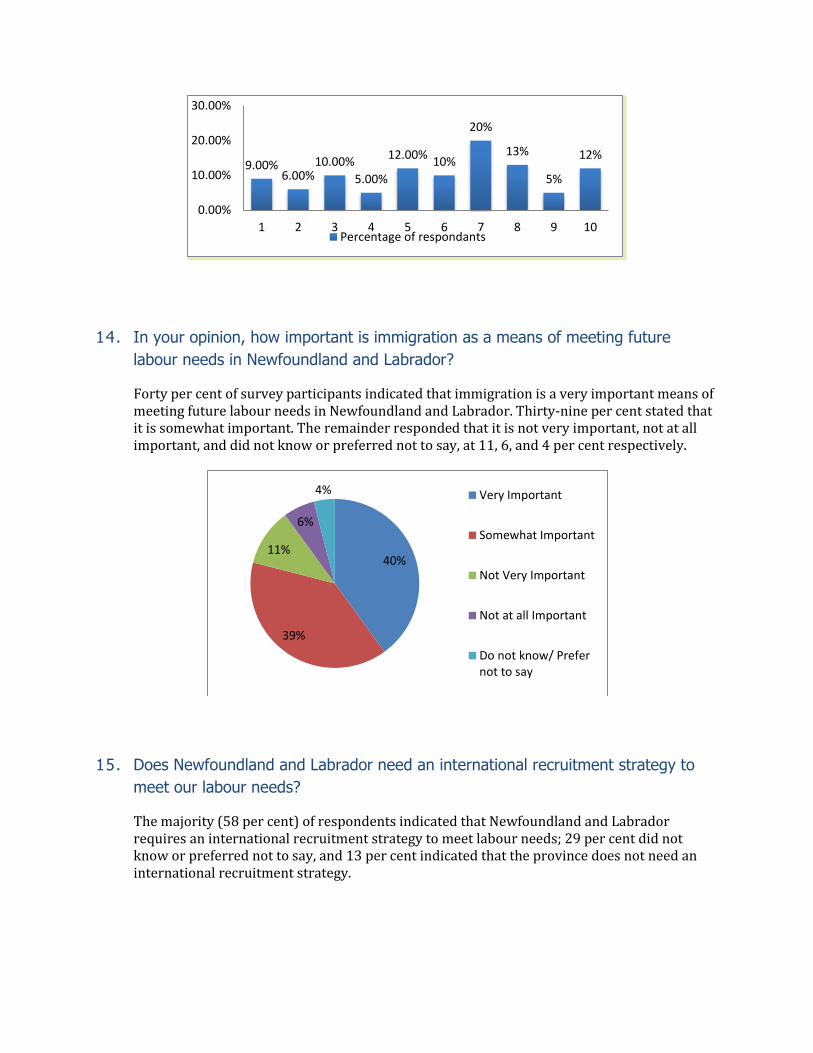
14. In your opinion, how important is immigration as a means of meeting future
labour needs in Newfoundland and Labrador?
Forty per cent of survey participants indicated that immigration is a very important means of meeting future labour needs in Newfoundland and Labrador. Thirty-nine per cent stated that it is somewhat important. The remainder responded that it is not very important, not at all important, and did not know or preferred not to say, at 11, 6, and 4 per cent respectively.
15. Does Newfoundland and Labrador need an international recruitment strategy to
meet our labour needs?
The majority (58 per cent) of respondents indicated that Newfoundland and Labrador requires an international recruitment strategy to meet labour needs; 29 per cent did not know or preferred not to say, and 13 per cent indicated that the province does not need an international recruitment strategy.
9.00%6.00%
10.00%
5.00%
12.00%10%
20%
13%
5%
12%
0.00%
10.00%
20.00%
30.00%
1 2 3 4 5 6 7 8 9 10Percentage of respondants
40%
39%
11%
6%
4% Very Important
Somewhat Important
Not Very Important
Not at all Important
Do not know/ Prefernot to say

16. In what industry do you operate?
The five most popular industries selected were: Professional, Scientific, and Technical Services Other Services (Except Public Administration) Real Estate, Rental, and Leasing Finance and Insurance Construction
58%13%
29%Yes
No
Do not know/ Prefernot to say
Related Documents