Economic Outlook An overview of Indian economy December 2018

Welcome message from author
This document is posted to help you gain knowledge. Please leave a comment to let me know what you think about it! Share it to your friends and learn new things together.
Transcript
Economic Outlook
An overview of Indian economy
December 2018
Economic Outlook
AJSH & Co LLP Mercurius Advisory Services Pvt Ltd Page 1
Dec 2018
Introduction The year 2017 witnessed a number of key structural initiatives to strengthen the roots across macro-economic parameters to ascertain sustainable growth in the future. The growth in the first half of the year suffered despite global support. However, the weakness seen in the beginning of 2017 seems to have bottomed out as 2018 set in. With recent global developments contributing to a significant rebalancing of portfolios as a result of rapidly changing risk perceptions and appetites, the Indian macroeconomic environment has looked turbulent during the past quarter. Apparently, the economy seems to be on the path to recovery, with indicators of industrial production, stock market index, auto sales and exports showing some proliferation. We believe that India’s economic outlook remains promising for FY 2017-18 and is expected to further strengthen in FY 2018-19. However, the signs of green shoots should not be taken for granted as downside risks remain.
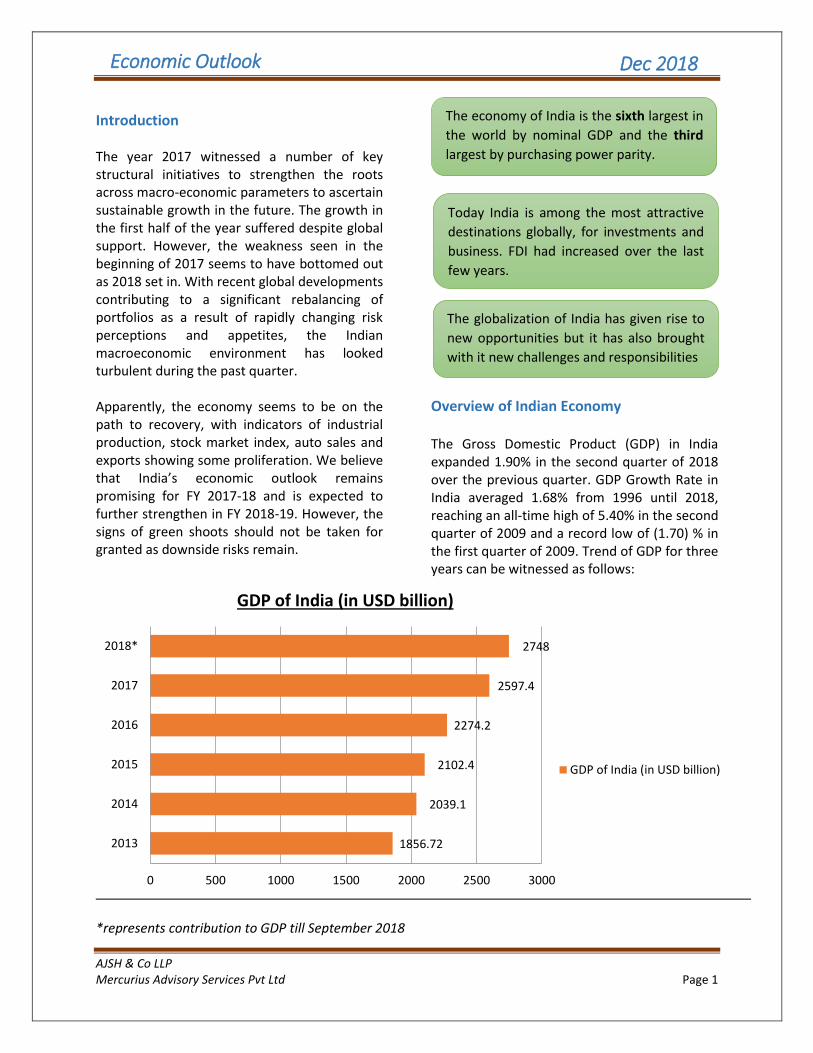
Overview of Indian Economy The Gross Domestic Product (GDP) in India expanded 1.90% in the second quarter of 2018 over the previous quarter. GDP Growth Rate in India averaged 1.68% from 1996 until 2018, reaching an all-time high of 5.40% in the second quarter of 2009 and a record low of (1.70) % in the first quarter of 2009. Trend of GDP for three years can be witnessed as follows:
*represents contribution to GDP till September 2018
1856.72
2039.1
2102.4
2274.2
2597.4
2748
0 500 1000 1500 2000 2500 3000
2013
2014
2015
2016
2017
2018*
GDP of India (in USD billion)
The economy of India is the sixth largest in
the world by nominal GDP and the third
largest by purchasing power parity.
Today India is among the most attractive
destinations globally, for investments and
business. FDI had increased over the last
few years.
The globalization of India has given rise to
new opportunities but it has also brought
with it new challenges and responsibilities
GDP of India (in USD billion)
Economic Outlook
AJSH & Co LLP Mercurius Advisory Services Pvt Ltd Page 2
Dec 2018
India GDP growth rate
In India, the growth rate in GDP measures the
change in the seasonally adjusted value of the
goods and services produced by the Indian
economy during the quarter. India is the world’s
sixth largest economy by nominal GDP and the
second most populous.
The most important and the fastest growing
sector of Indian economy are services. Trade,
hotels, transport and communication; financing,
insurance, real estate, business services,
community, social and personal services, retail
markets, automobile and telecommunication
account for more than 60% of GDP. Agriculture,
forestry and fishing constitute around 12% of
the output, but employs more than 50% of the
labor force. Manufacturing accounts for 15% of
GDP, construction for another 8% and mining,
quarrying, electricity, gas and water supply for
the remaining 5%.
India ranks 139th in per capita GDP (nominal)
with $2,134 and 122nd in per capita GDP
[Purchasing Power Parity (PPP)] with $7,783 as
of 2018. After the 1991 economic liberalization,
India achieved 6-7% average GDP growth
annually and became the world’s fastest
growing economy surpassing China. With latest
technological advancements, infrastructural
developments and accelerating stream of
revenue from diversified sectors as well as
industries, India is all set to be on the top charts
transcending all other economies around the
world revenue from diversified sectors as well
as industries, India is all set to be on the top
charts transcending all other economies around
the world.
Market analysis- Currency
Analyzing the market involves inspection of
various aspects and their performance
throughout the years. One such aspect that
affects the economy the maximum is the value
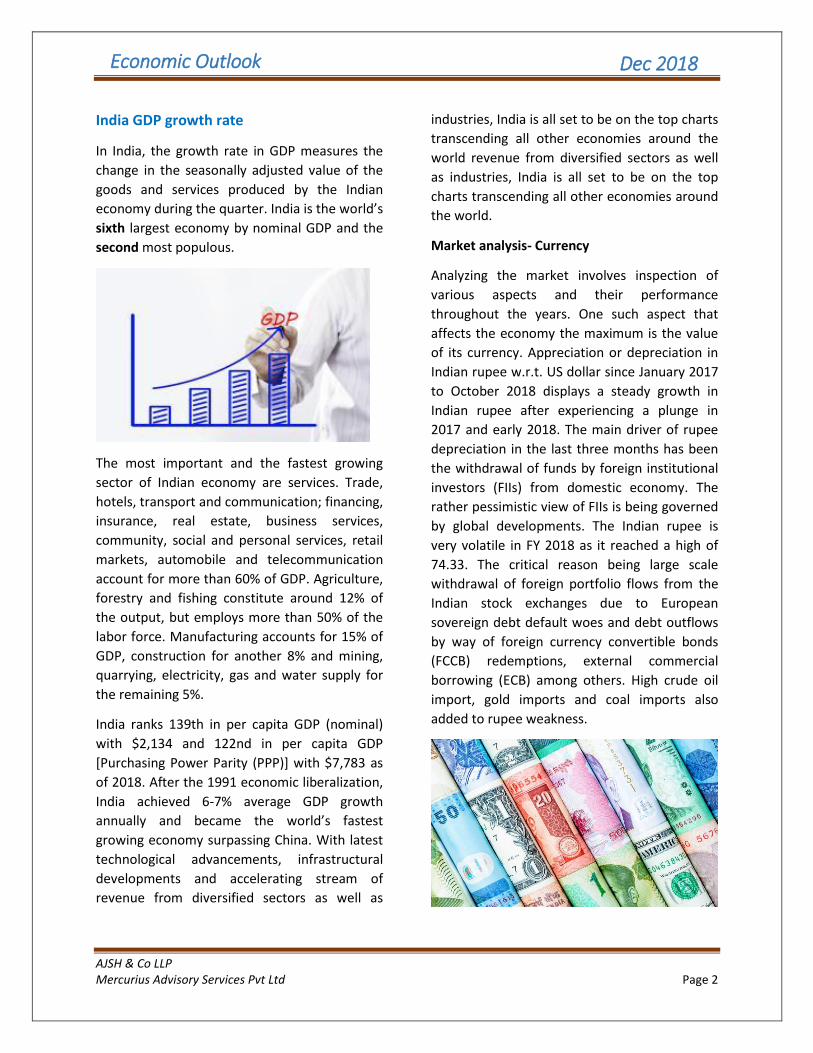
of its currency. Appreciation or depreciation in
Indian rupee w.r.t. US dollar since January 2017
to October 2018 displays a steady growth in
Indian rupee after experiencing a plunge in
2017 and early 2018. The main driver of rupee
depreciation in the last three months has been
the withdrawal of funds by foreign institutional
investors (FIIs) from domestic economy. The
rather pessimistic view of FIIs is being governed
by global developments. The Indian rupee is
very volatile in FY 2018 as it reached a high of
74.33. The critical reason being large scale
withdrawal of foreign portfolio flows from the
Indian stock exchanges due to European
sovereign debt default woes and debt outflows
by way of foreign currency convertible bonds
(FCCB) redemptions, external commercial
borrowing (ECB) among others. High crude oil
import, gold imports and coal imports also
added to rupee weakness.
Economic Outlook
AJSH & Co LLP Mercurius Advisory Services Pvt Ltd Page 3
Dec 2018
The condition of value of currency w.r.t. dollar (United States), euro (Europe) and pound (United
Kingdom) can be shown as under:
Indian rupee v / s US dollar
USD INR conversion rate Indian rupee v / s European euro
EURO INR conversion rate
Economic Outlook
AJSH & Co LLP Mercurius Advisory Services Pvt Ltd Page 4
Dec 2018
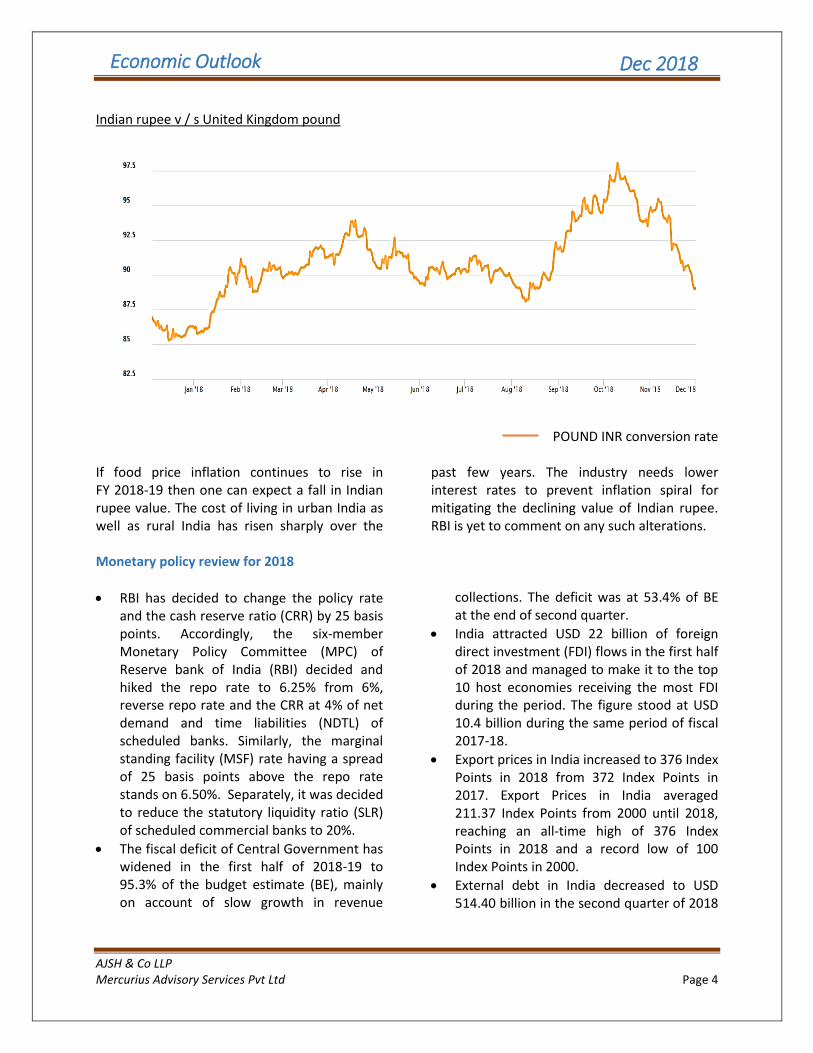
Indian rupee v / s United Kingdom pound
POUND INR conversion rate
If food price inflation continues to rise in FY 2018-19 then one can expect a fall in Indian rupee value. The cost of living in urban India as well as rural India has risen sharply over the
past few years. The industry needs lower interest rates to prevent inflation spiral for mitigating the declining value of Indian rupee. RBI is yet to comment on any such alterations.
Monetary policy review for 2018
RBI has decided to change the policy rate and the cash reserve ratio (CRR) by 25 basis points. Accordingly, the six-member Monetary Policy Committee (MPC) of Reserve bank of India (RBI) decided and hiked the repo rate to 6.25% from 6%, reverse repo rate and the CRR at 4% of net demand and time liabilities (NDTL) of scheduled banks. Similarly, the marginal standing facility (MSF) rate having a spread of 25 basis points above the repo rate stands on 6.50%. Separately, it was decided to reduce the statutory liquidity ratio (SLR) of scheduled commercial banks to 20%.
The fiscal deficit of Central Government has widened in the first half of 2018-19 to 95.3% of the budget estimate (BE), mainly on account of slow growth in revenue
collections. The deficit was at 53.4% of BE at the end of second quarter.
India attracted USD 22 billion of foreign direct investment (FDI) flows in the first half of 2018 and managed to make it to the top 10 host economies receiving the most FDI during the period. The figure stood at USD 10.4 billion during the same period of fiscal 2017-18.
Export prices in India increased to 376 Index Points in 2018 from 372 Index Points in 2017. Export Prices in India averaged 211.37 Index Points from 2000 until 2018, reaching an all-time high of 376 Index Points in 2018 and a record low of 100 Index Points in 2000.
External debt in India decreased to USD 514.40 billion in the second quarter of 2018
Economic Outlook
AJSH & Co LLP Mercurius Advisory Services Pvt Ltd Page 5
Dec 2018
from USD 529.68 billion in the first quarter of 2018.
Annual consumer inflation in India fell to 3.31% in October of 2018 from a downwardly revised 3.7% in September and below market expectations of 3.67%. It is the lowest inflation rate since September of 2017, mainly due to a drop in cost of food.
External risks to the Indian economy are intensifying. Adverse feedback loops between sovereign and financial market stress in the Euro area are resulting in increased risk aversion, financial market volatility, and perverse moments in capital flows.
RBI has been following a neutral policy stance for some time now. This means that with inflation being at an all-time low of 4.0% and the growth projections of the Indian economy being at a constant 7.30%, RBI will try not to destabilize the delicate balance by either infusing or removing too much funds from the markets. To end this, Central Bank has increased the repo rate and reverse repo rate on August 1 2018 by 25 basis points taking them to 6.50% and 6.25%, respectively. It has also increased the bank rate and MSF rate to 6.75% each ensuring that the government’s requirement for more liquidity for industry growth is fulfilled also without the risk of increase in inflation being too high.
Industry analysis Agriculture
Agriculture is the primary source of livelihood for about 58% of India’s population. Gross Value Added (GVA) by agriculture, forestry and fishing is estimated at USD 274.23 billion in FY18.
The Indian food industry is poised for huge growth, increasing its contribution to world food trade every year due to its immense potential for value addition, particularly within the food processing industry. The Indian food and grocery market is the world’s sixth largest, with retail contributing 70% of the sales. The Indian food processing industry accounts for 32% of the country’s total food market, one of the largest industries in India and is ranked fifth in terms of production, consumption, export and expected growth. It contributes around 8.80 and 8.39% of GVA in manufacturing and agriculture respectively, 13% of India’s exports and 6% of total industrial investment.
*Represents forecasted contribution to GDP by agriculture sector
0
20
40
60
80
100
120
Q1 Q2 Q3* Q4*
2018
2019*
Contribution made to GDP by agriculture
sector (in USD billion)
Economic Outlook
AJSH & Co LLP Mercurius Advisory Services Pvt Ltd Page 6
Dec 2018
India is expected to achieve the ambitious goal of doubling farm income by 2022. The agriculture sector in India is expected to generate better momentum in the next few years due to increased investments in agricultural infrastructure such as irrigation facilities, warehousing and cold storage. Furthermore, the growing use of genetically modified crops will likely improve the yield for Indian farmers. India is expected to be self-sufficient in pulses in the coming few years due to concerted efforts of scientists to get early-maturing varieties of pulses and the increase in minimum support price.
Telecommunication The Indian telecom industry is one of the fastest
growing in the world. According to the Telecom
Regulatory Authority of India (TRAI), the
number of telephone subscriber base in the
country reached USD 17.04 billion as on
September 2018, an increase of 0.83% from
USD 16.90 billion in July 2018. The wireless
subscriber base has increased to USD 16.73
billion at the end of September 2018 from USD
16.58 billion in July 2018, registering a growth
of 0.85%.
Big Market Players Performance
Company’s contributing major stakes to GDP for
second quarter ending September 2018 are
displayed as follows:
Vodafone Idea: Vodafone India and Idea cellular have merged into ‘Vodafone Idea’ to become India’s largest telecom industry as of September 2018. Vodafone possesses 45.1% stake whereas Aditya Birla Group have a share of 26% in the company.
Reliance Jio: Reliance Jio has partnered with Samsung Electronics to set up a nationwide Internet of Things (IoT) network. This is a strong affirmation of Jio’s ability to ride out the testing times and
emerge competitively enhanced even when the phase draws inevitably to a close.
Bharti Airtel: Following companies have
considerable share in Bharti Airtel:
Bharti Group (45.48%)
Pastel Ltd (14.79%)
Indian Continent Investment (6.65%)
Aggressive expanding of 4G capabilities and
offering continuous highest data speed to
customers is the key priority and reason
behind Airtel’s success.
Bharat Sanchar Nigam Limited (BSNL): Being entirely owned by the government and operating in an overcrowded sector, BSNL is among very few companies which have the capability to maintain and grow quality operations at a realized rate and still turn in reasonable profits. BSNL is expected to launch its 5G services by 2020.
Mahanagar Telephone Nigam Ltd (MTNL): With two major stakeholders Government (56.3%) and Life Insurance Corporation (18.8%) MTNL is undertaking a process to finalize the tender to select the equipment vendor for adding 4G services within six to eight months after radio waves are allocated. This will help the service provider to compete in the market as the mobile
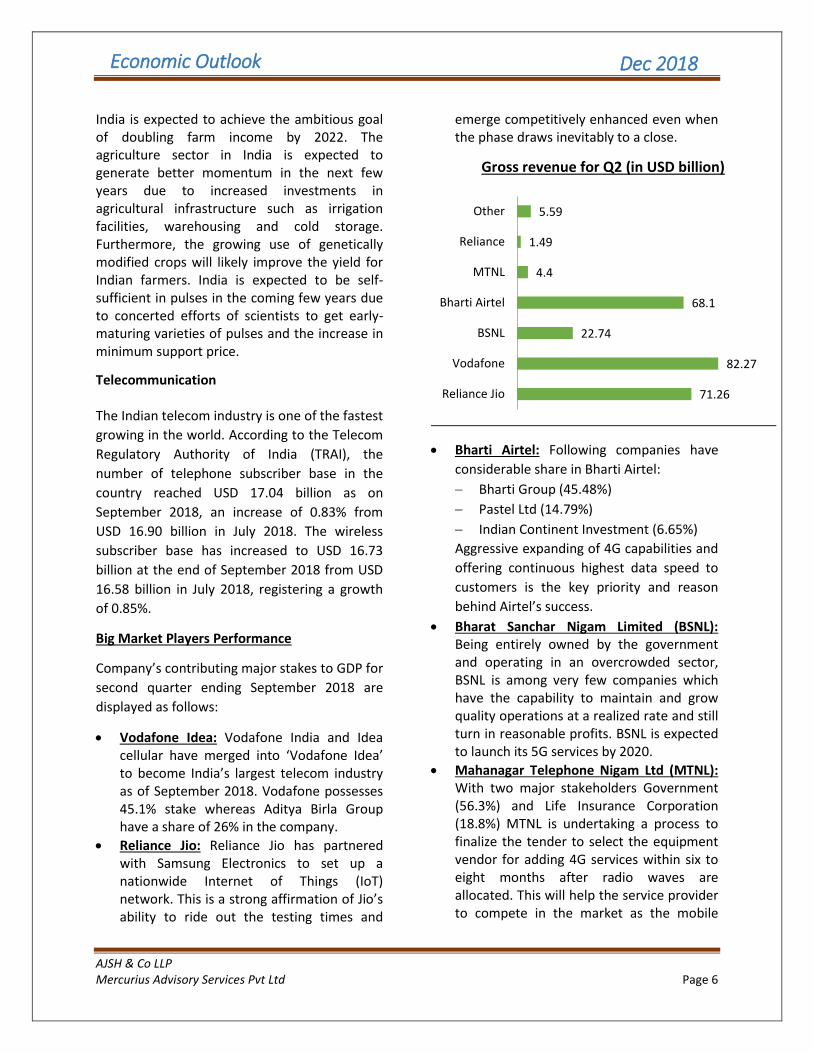
71.26
82.27
22.74
68.1
4.4
1.49
5.59
Reliance Jio
Vodafone
BSNL
Bharti Airtel
MTNL
Reliance
Other
Gross revenue for Q2 (in USD billion)
Economic Outlook
AJSH & Co LLP Mercurius Advisory Services Pvt Ltd Page 7
Dec 2018
business is highly titled towards the newer technology.
Others: Others include small service providers contributing a minute share to the GDP.
Overview of telecom industry
Total subscriber base reaches USD 17.04
billion.
Wireless subscription reaches USD 16.73 billion.
Wireline subscription declines to 38%. 9.85 billion additional wireless connections. Overall tele-density reaches USD 1.31 billion
Automobiles
During Q2 FY18, growth momentum in automobile volumes continued to remain strong across segments on the back of improving economic environment. Sequentially, the volumes have remained stable.
Operating margins were under pressure on account of higher raw material costs for most manufacturers. While price hikes will absorb the impact partially for two-wheeler and connected vehicle (CV) manufacturers, passenger car players will continue to witness pressures as intense competition has restricted any price hikes.
While CV volumes continued to remain strong on the back of robust industrial activity, two-wheeler and passenger car volumes were driven by increasing rural penetration.
During April-September 2018, automobile production increased 13.32% YoY to reach 16.65 million units.
During April-September 2018, highest YoY growth in domestic sales among all the categories was recorded in commercial vehicles at 37.82% followed by 36.50% year-on-year growth in the sales of three-wheelers.
The passenger vehicle sales in India crossed the 3.2 million units at the end of second quarter of FY18.
Automobile exports grew 24.34% during April-September 2018.
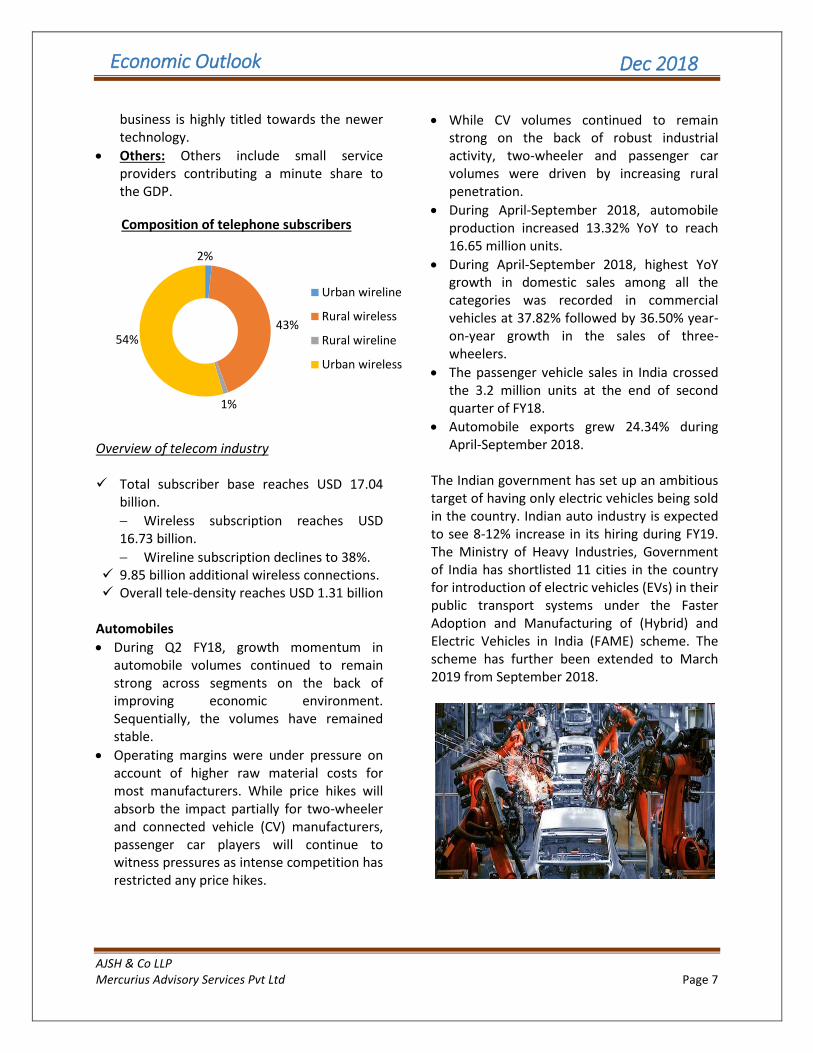
The Indian government has set up an ambitious target of having only electric vehicles being sold in the country. Indian auto industry is expected to see 8-12% increase in its hiring during FY19. The Ministry of Heavy Industries, Government of India has shortlisted 11 cities in the country for introduction of electric vehicles (EVs) in their public transport systems under the Faster Adoption and Manufacturing of (Hybrid) and Electric Vehicles in India (FAME) scheme. The scheme has further been extended to March 2019 from September 2018.
2%
43%
1%
54%
Urban wireline
Rural wireless
Rural wireline
Urban wireless
Composition of telephone subscribers
Economic Outlook
AJSH & Co LLP Mercurius Advisory Services Pvt Ltd Page 8
Dec 2018
Service
The services sector is not only the dominant sector in India’s GDP, but has also attracted significant foreign investment flows, contributed significantly to exports as well as provided large-scale employment. India’s services sector covers a wide variety of activities such as trade, hotel and restaurants, transport, storage and communication, financing, insurance, real estate, business services, community, social and personal services, and services associated with construction.
The services sector is the key driver of India’s
economic growth. The sector has contributed
55.65% of India’s GVA at current price in Q1
2018-19 and employed 28.6% of the total
population. Net service exports stood at USD
18.7 billion in Q1 2018-19.
Some of the developments and major
investments by companies in the services sector
in the recent past are as follows:
Leisure and business travel and tourism
spending are expected to increase to USD
216.9 billion and US$ 12.4 billion in 2018,
respectively.
Indian healthcare companies are entering
into merger and acquisitions with domestic
and foreign companies to drive growth and
gain new markets.
India’s earnings from medical tourism could
exceed USD 9 billion by 2020.
The Indian facilities management market is
expected to grow at 17% CAGR between
2015 and 2020 and surpass the USD 19
billion mark supported by booming real
estate, retail, and hospitality sectors.
0
5
10
15
20
25
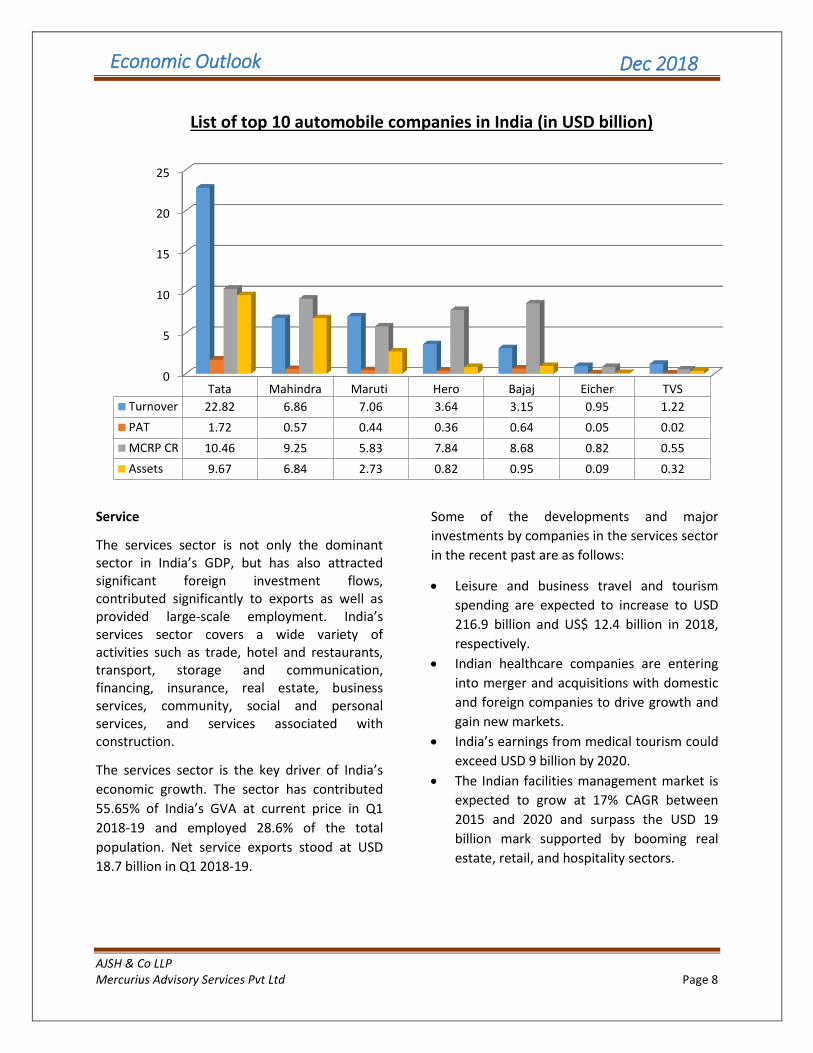
Tata Mahindra Maruti Hero Bajaj Eicher TVS
Turnover 22.82 6.86 7.06 3.64 3.15 0.95 1.22
PAT 1.72 0.57 0.44 0.36 0.64 0.05 0.02
MCRP CR 10.46 9.25 5.83 7.84 8.68 0.82 0.55
Assets 9.67 6.84 2.73 0.82 0.95 0.09 0.32
List of top 10 automobile companies in India (in USD billion)
Economic Outlook
AJSH & Co LLP Mercurius Advisory Services Pvt Ltd Page 9
Dec 2018
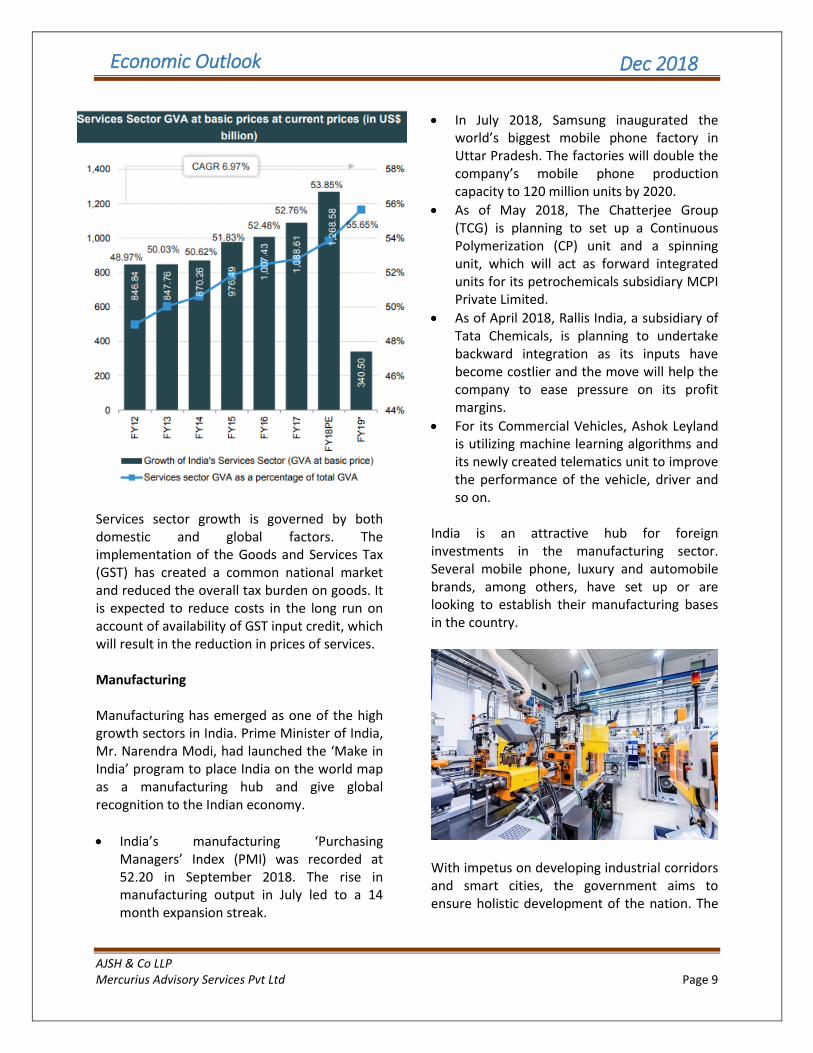
Services sector growth is governed by both domestic and global factors. The implementation of the Goods and Services Tax (GST) has created a common national market and reduced the overall tax burden on goods. It is expected to reduce costs in the long run on account of availability of GST input credit, which will result in the reduction in prices of services. Manufacturing Manufacturing has emerged as one of the high growth sectors in India. Prime Minister of India, Mr. Narendra Modi, had launched the ‘Make in India’ program to place India on the world map as a manufacturing hub and give global recognition to the Indian economy.
India’s manufacturing ‘Purchasing Managers’ Index (PMI) was recorded at 52.20 in September 2018. The rise in manufacturing output in July led to a 14 month expansion streak.
In July 2018, Samsung inaugurated the world’s biggest mobile phone factory in Uttar Pradesh. The factories will double the company’s mobile phone production capacity to 120 million units by 2020.
As of May 2018, The Chatterjee Group (TCG) is planning to set up a Continuous Polymerization (CP) unit and a spinning unit, which will act as forward integrated units for its petrochemicals subsidiary MCPI Private Limited.
As of April 2018, Rallis India, a subsidiary of Tata Chemicals, is planning to undertake backward integration as its inputs have become costlier and the move will help the company to ease pressure on its profit margins.
For its Commercial Vehicles, Ashok Leyland is utilizing machine learning algorithms and its newly created telematics unit to improve the performance of the vehicle, driver and so on.
India is an attractive hub for foreign investments in the manufacturing sector. Several mobile phone, luxury and automobile brands, among others, have set up or are looking to establish their manufacturing bases in the country.
With impetus on developing industrial corridors and smart cities, the government aims to ensure holistic development of the nation. The
Economic Outlook
AJSH & Co LLP Mercurius Advisory Services Pvt Ltd Page 10
Dec 2018
corridors would further assist in integrating, monitoring and developing a promising environment for the industrial development and will promote advance practices in manufacturing. Retail sector The Indian retail industry has emerged as one of the most dynamic and fast-paced industries due to the entry of several new players. It accounts for over 10% of the country’s Gross Domestic Product (GDP) and around 8% of the employment. India is the world’s fifth largest global destination in the retail space. The Indian retail trading has received Foreign Direct Investment (FDI) equity inflows totaling USD 1.42 billion during April 2000–June 2018, according to the Department of Industrial Policies and Promotion (DIPP). With the rising need for consumer goods in different sectors including consumer electronics and home appliances, many companies have invested in the Indian retail space in the past few months. Some of the major investments are mentioned below:
Google and Paytm Mall to acquire 7-10%
stake in future retail with investment of USD 522.08-596.66 million.
India’s retail sector attracted USD 147.40 million investments in FY18, at a growth rate of 35% YoY from USD 104.34 million in FY17.
E-commerce is expanding steadily in the country. Customers have the ever increasing choice of products at the lowest rates. E-commerce is probably creating the biggest revolution in the retail industry, and this trend would continue in the years to come. India's e-commerce industry is forecasted to reach USD 53 billion by 2018. Retailers should leverage the digital retail channels (e-commerce), which would enable them to spend less money on real estate while reaching out to more customers in tier-2 and tier-3 cities. Both organized and unorganized retail companies have to work together to ensure better prospects for the overall retail industry, while generating new benefits for their customers. Nevertheless, the long-term outlook for the industry is positive, supported by rising incomes, favorable demographics, entry of foreign players, and increasing urbanization.
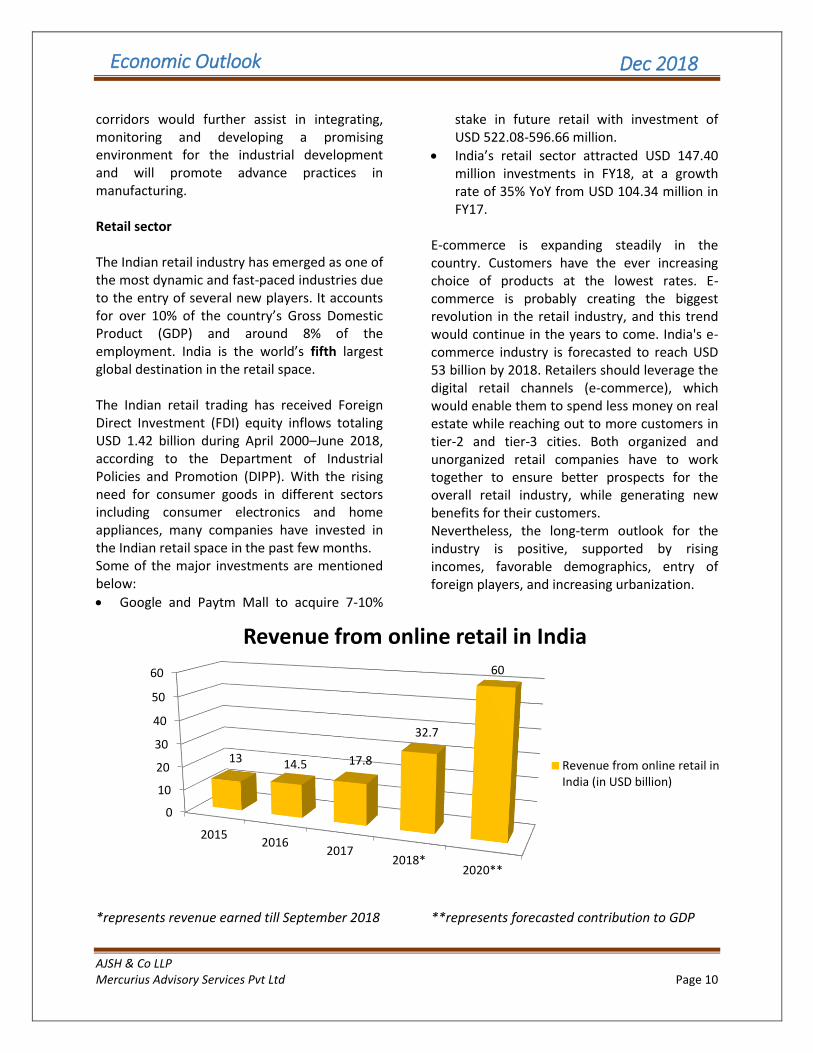
*represents revenue earned till September 2018
**represents forecasted contribution to GDP
0
10
20
30
40
50
60
20152016
20172018*
2020**
13 14.5 17.8
32.7
60
Revenue from online retail in India
Revenue from online retail inIndia (in USD billion)
Economic Outlook
AJSH & Co LLP Mercurius Advisory Services Pvt Ltd Page 11
Dec 2018
Conclusion Growth of eight infrastructure sectors
improved sequentially to 4.8% in October on the back of strong cement, coal and crude oil output. India’s infrastructure sector growth slowed to 4.3% in September hit by a decline in crude oil and fertilizer production and sluggish performance of coal, steel, refinery products and natural gas sectors.
India's economy grew at 7.1% in July-September, remaining ahead of China to retain the tag of the world's fastest growing major economy. The GDP at constant prices had grown at 6.3% in July-September quarter of the last fiscal, according to government data released.
Banks' total credit to industry, retail and services doubled to 15.6% on year as of first week of November amid acceleration in consumption and revival of investment sentiment. While plain vanilla loans which banks normally give out increased by 15% investments in the form of commercial papers and bonds rose up by 22% taking the non-food credit growth to 15.6%, according to the latest data released by the Reserve Bank.
Government of India is taking all possible actions to stabilize Indian economy from time-to-time.
Forecast Economic growth will slow somewhat but remain robust, at close to 7.5% in 2019 and 2020. Higher oil prices and the rupee depreciation are putting pressure on demand, inflation, current account and public finances. But with crude oil prices shifting from INR 75.55 per litre to INR 67.38 per litre after the end of second quarter and appreciation in value of rupee from INR 74.35 against US dollar to INR 69.81 after the end of Q2 provides significance evidence to the fact that the economy will boom in later quarters (Q3 and Q4) of 2018 and will continue to flourish in the year 2019. Business investment and exports will be strong, as past structural reforms – including the new Insolvency and Bankruptcy Code, smoother implementation of GST, better roads, electricity and bank recapitalization that are paying off. Monetary policy will need to be tightened as inflation expectations are trending up and there are several upside risks to inflation. Containing the relatively high public debt-to-GDP ratio would require controlling contingent liabilities, such as those stemming from public enterprises and banks. Further subsidy reform would help make social spending more effective. Improving public banks’ governance is also crucial to avoid a new wave of non-performing loans and to support the investment recovery.
Sources
Wikipedia, economic times, times of India, ceicdata, ibef, gktoday, business standard, trai,
statista, bank bazaar, bookmyforex and cso
Economic Outlook
AJSH & Co LLP Mercurius Advisory Services Pvt Ltd Page 12
Dec 2018
DISCLAIMER
The contents herein are solely meant for communicating information and not as professional advice.
It may contain confidential or legally privileged information. The addressee is hereby notified that
any disclosure, copy, or distribution of this material or the contents there of may be unlawful and is
strictly prohibited. Also the contents cannot be considered as any opinion/ advice and should not be
used as basis for any decision. Before taking any decision/ advice please consult a qualified
professional advisor. While due care has been taken to ensure the accuracy of information
contained herein, no warranty, express or implied, is being made by us as regards the accuracy and
adequacy of the information contained herein. AJSH & Co LLP and Mercurius Advisory Services shall
not be responsible for any loss whatsoever sustained by any person who relies on this material.
ABOUT US
AJSH & Co LLP (“AJSH”) is an independent firm of Business Advisors and Chartered Accountants with its corporate office situated at New Delhi. AJSH has brought together a team of highly qualified and experienced consultants from diverse professional fields and expertise. We cater to Indian and multinational corporates, high net worth individuals, financial institutions, start-ups and expatriates.
We specialize in the fields of accounting, auditing and assurance, taxation, foreign investments along with a host of other financial services. AJSH is an ISO 9001:2015 certified firm and is also registered with Public Company Accounting Oversight Board (USA). We have clients in India, USA, Africa, Australia, Europe, Hong Kong, Japan, China, Malaysia, Singapore and Thailand. Thus, we work across several different time zones based on our client needs.
We are a member firm of TIAG (USA). TIAG is a worldwide alliance of independent accounting firms with more than 120 member firms based in over 70 countries and UTN. We are also a member of United Tax Network (UTN) representing from India, getting the firm’s foothold in Western Countries.
Mercurius Advisory Services (“MAS”) is a team of eminent and trained advisors and consultants, specializing in the field of outsourcing services based in New Delhi, India. It offers a comprehensive suite of professional consultancy services to its clients ranging from accounting, finance and taxation to legal consultancy and human resource management.
MAS has achieved an exponential growth in its international accounting and business consulting practice and has position itself amongst one of the most reputed accounting companies in India.
MAS, inter alia, provide low cost accounting solutions to its clients across the globe on an outsourced basis. We support our clients to streamline their day-to-day business operations and lower their overhead costs without compromising on quality or productivity. Our clientele ranges from start-ups to large established business houses that operate across the globe in various sectors.
MAS is also a member firm of TIAG (USA) and holds ISO certificate 27001:2013.
Economic Outlook
AJSH & Co LLP Mercurius Advisory Services Pvt Ltd Page 13
Dec 2018
Connect with us
Contact us
Ankit Jain Siddhartha Havelia Address
+91 98106 61322 +91 98113 25385 C-7/227, Sector-7
[email protected] [email protected] Rohini, New Delhi-110085
[email protected] [email protected] T: +91-11-4559 6689
C-7/227, Sector-7, Rohini, New Delhi-110085, T: +91-11-4559 6689
www.ajsh.in
www.mas.net.in
[email protected] [email protected]
https://www.linkedin.com/compa
ny/ajsh-&-co
https://www.linkedin.com/company/
mercurius-advisory-services
Related Documents