Economic Models of Biofuels and Policy Analysis John Miranowski,* Professor of Economics Iowa State University *With Alicia Rosburg, Research Assistant Jittinan Aukayanagul, Post-Doctoral Associate

Economic Models of Biofuels and Policy Analysis John Miranowski,* Professor of Economics Iowa State University *With Alicia Rosburg, Research Assistant.
Dec 20, 2015
Welcome message from author
This document is posted to help you gain knowledge. Please leave a comment to let me know what you think about it! Share it to your friends and learn new things together.
Transcript

Economic Models of Biofuels and Policy Analysis
John Miranowski,* Professor of Economics
Iowa State University
*With Alicia Rosburg, Research AssistantJittinan Aukayanagul, Post-Doctoral Associate

Economic challenges of cellulosic feedstock supply, logistics, and modeling efforts
Importance of corn yield growth and fertilizer use to land use change
Handling of risk and uncertainty in biofuel investment decisions
Economic Models of Biofuels and Policy Analysis

How do we establish biomass feedstock supply chain for commercial, cellulosic biofuel plant?
Logistics of biomass supply ◦ Transportation and storage of low-stability, low-density
material
◦ Direct delivery vs. intermediate consolidator in feedstock supply chain
How do we develop technology and platforms for cellulosic biofuel production?◦ Conversion of multiple feedstocks
◦ Yield of biomass feedstock
Cellulosic Ethanol Industry Policy Challenges

What intervention to create sustainable market?
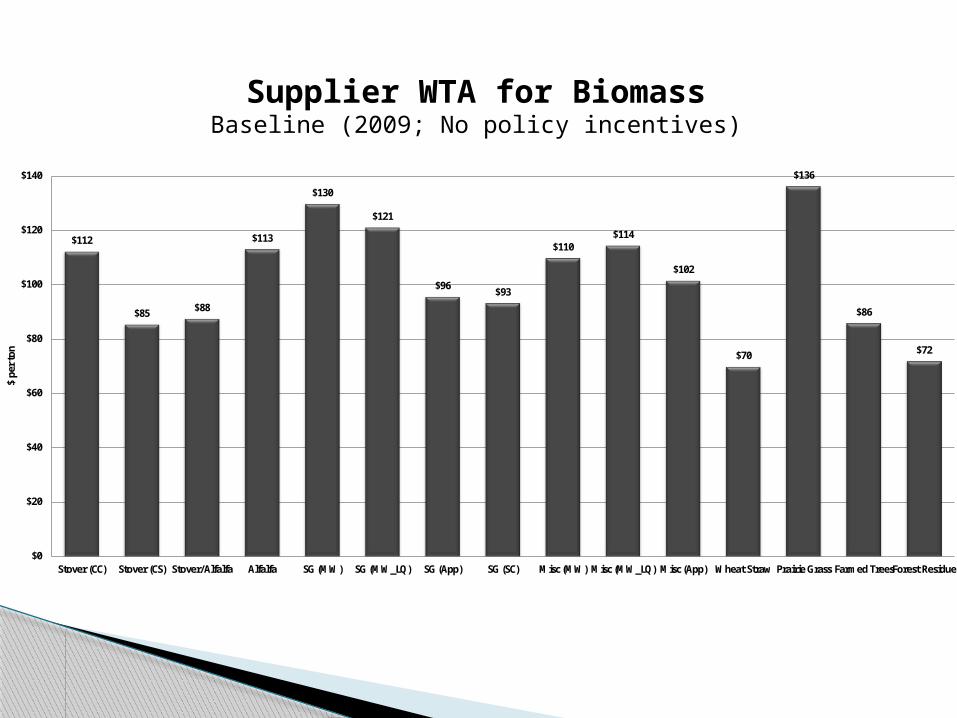
Maximum price processor is willing to pay must equal minimum price biomass supplier is willing to accept for market to exist
Considering commercial scale plant and MC of supplying last unit to biofuel plant
If WTA>WTP => government incentive (tax or carbon credit, or mandate to make WTA=WTP
Market Viability
$112
$85 $88
$113
$130
$121
$96$93
$110$114
$102
$70
$136
$86
$72
$0
$20
$40
$60
$80
$100
$120
$140
Stover (CC) Stover (CS) Stover/Alfalfa Alfalfa SG (MW) SG (MW_LQ) SG (App) SG (SC) Misc (MW) Misc (MW_LQ) Misc (App) Wheat Straw Prairie Grass Farmed TreesForest Residue
$ pe
r ton
Supplier WTA for BiomassBaseline (2009; No policy incentives)
$128
$101 $102
$127
$144
$134
$109 $108
$123$128
$116
$83
$150
$102
$88
$0
$20
$40
$60
$80
$100
$120
$140
$160
Stover (CC) Stover (CS) Stover/Alfalfa Alfalfa SG (MW) SG (MW_LQ) SG (App) SG (SC) Misc (MW) Misc (MW_LQ) Misc (App) Wheat Straw Prairie Grass Farmed TreesForest Residue
$ pe
r ton
Gap between Supplier WTA and Processor WTPBaseline (2009, No policy incentives)

$57
$30 $31
$56
$73
$63
$38 $37
$52
$58
$45
$12
$80
$32
$18
$0
$10
$20
$30
$40
$50
$60
$70
$80
$90
Stover (CC) Stover (CS) Stover/Alfalfa Alfalfa SG (MW) SG (MW_LQ) SG (App) SG (SC) Misc (MW) Misc (MW_LQ) Misc (App) Wheat Straw Prairie Grass Farmed TreesForest Residue
$ pe
r ton
Gap between Supplier WTA and Processor WTP Blender’s Credit (2009, $75 oil)

$151
$120$124
$162
$181
$169
$137 $135
$154$161
$145
$105
$189
$91
$124
$0
$20
$40
$60
$80
$100
$120
$140
$160
$180
$200
Stover (CC) Stover (CS) Stover/Alfalfa Alfalfa SG (MW) SG (MW_LQ) SG (App) SG (SC) Misc (MW) Misc(MW_LQ)
Misc (App) Wheat Straw Prairie Grass Farmed Trees ForestResidue
$ pe
r to
n C
O 2e
Carbon Credit Needed for Feedstock MarketBaseline (2009, No policy incentives)
Modeling indirect land use change controversial◦ Pecuniary externality captured in market◦ Do not target ILUC for other energy forms◦ Attempting to measure the unmeasureable
Economic models focus on existing cropland, conversion, and expansion◦ Yield growth◦ Crop and input substitution◦ Changing cropping practices◦ Cropland expansion
Land Use Change Controversy

Study of differing rates of corn yield growth, nitrogen use, and cropland needs
Yield increases reduce total cropland needs but impact on land use depends on yield increase, fertilizer increase, and prices
Corn Yields, Fertilizer, and Land Use Dynamics

150
170
190
210
230
250
270
Yiel
d (b
ushe
ls/a
cre)
US Corn Yield Forecasts by Model and Data Window
AR (1970-2009) AR (1999-2009) LT (1970-2009) LT (1999-2009)

150
170
190
210
230
250
270
290
310
Yiel
d (b
ushe
ls/ac
re)
Iowa Corn Yield Forecasts by Model and Data Window
AR (1970-2009) AR (1999-2009) LT (1970-2009) LT (1999-2009)

Annual Yield Increase Rate by State IA IL NE MN IN SD KS
1970-2009 1.63% 1.63% 1.84% 1.89% 1.55% 2.89% 1.33%
1999–2009 2.18% 2.18% 2.65% 1.77% 1.90% 2.09% 1.02%
OH WI MO MI TX ND OK
1970-2009 1.67% 1.39% 1.70% 1.68% 1.50% 2.08% 1.00%
1999–2009 2.36% 1.17% 2.37% 2.13% 1.28% 0.48% -1.67%
State Trends – AR Model
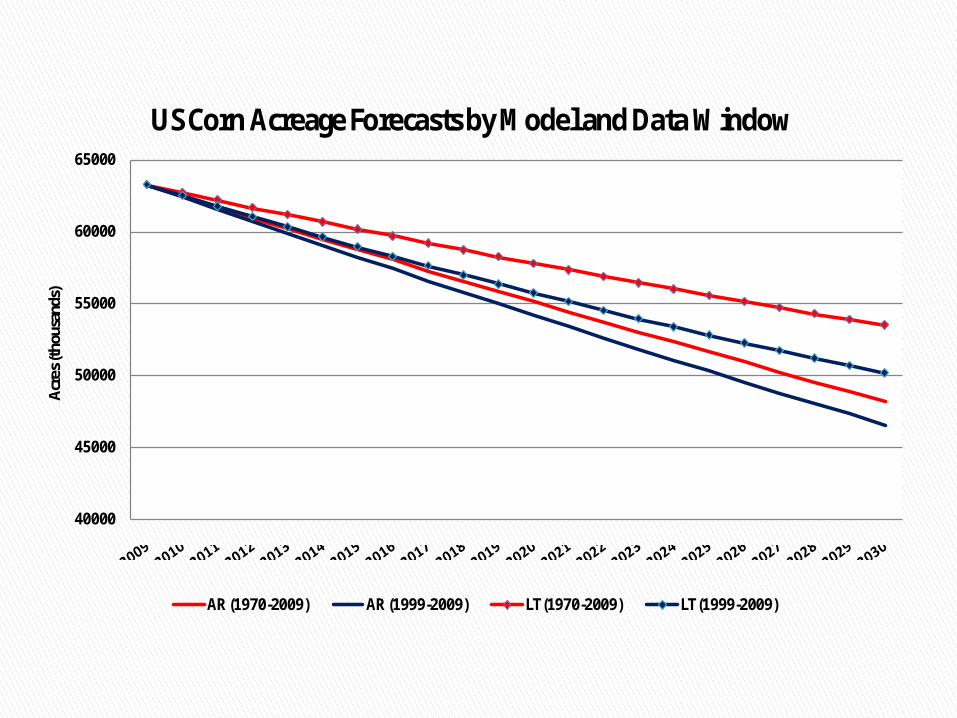
40000
45000
50000
55000
60000
65000
Acre
s (th
ousa
nds)
US Corn Acreage Forecasts by Model and Data Window
AR (1970-2009) AR (1999-2009) LT (1970-2009) LT (1999-2009)

Nitrogen use model
◦ N rates based on historical data using trend model
◦ N use per acre has been increasing slowly, if at all
Will corn yield increases require greater N use rates than forecast below?
Important in GHG LCA for corn ethanol in RFS.2
Implications of Nitrogen Use

0.50
0.55
0.60
0.65
0.70
0.75
0.80
0.85
0.90
Nitr
ogen
(lbs
/bus
hel)
US Nitrogen Use Forecasts by Model and Data Window
AR (1970-2009) AR (1999-2009) LT (1970-2009) LT (1999-2009)
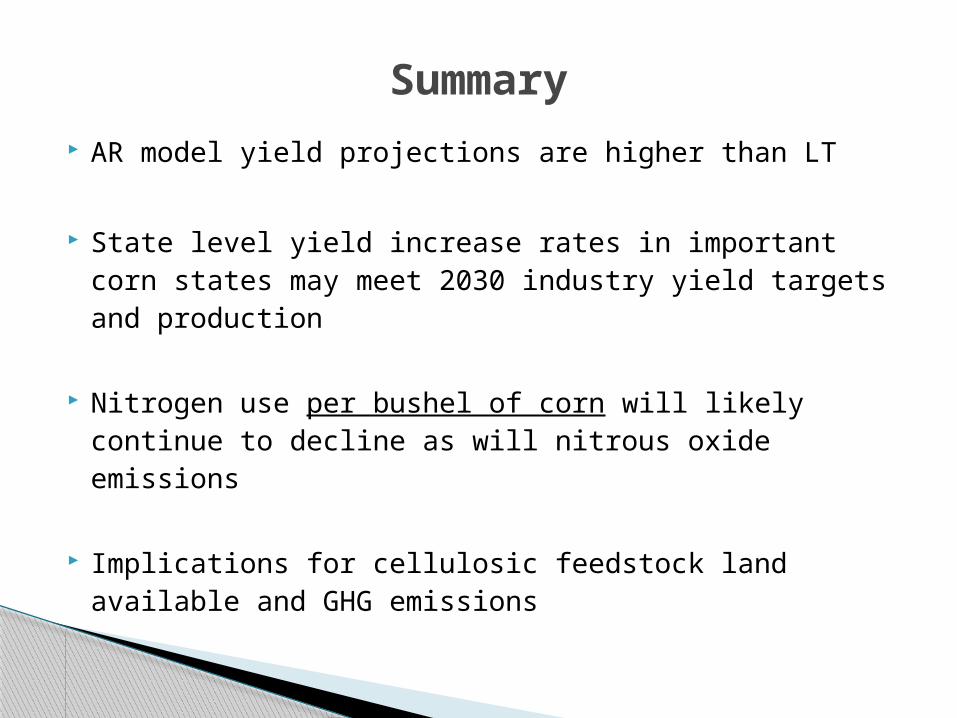
AR model yield projections are higher than LT
State level yield increase rates in important corn states may meet 2030 industry yield targets and production
Nitrogen use per bushel of corn will likely continue to decline as will nitrous oxide emissions
Implications for cellulosic feedstock land available and GHG emissions
Summary
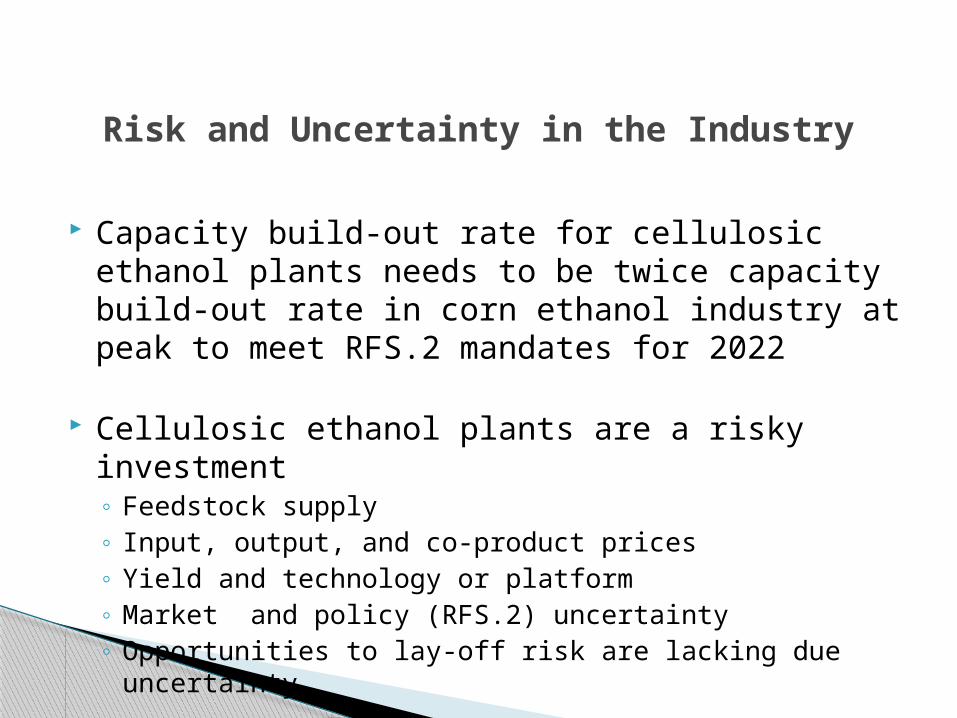
Capacity build-out rate for cellulosic ethanol plants needs to be twice capacity build-out rate in corn ethanol industry at peak to meet RFS.2 mandates for 2022
Cellulosic ethanol plants are a risky investment◦ Feedstock supply◦ Input, output, and co-product prices ◦ Yield and technology or platform◦ Market and policy (RFS.2) uncertainty◦ Opportunities to lay-off risk are lacking due uncertainty
Risk and Uncertainty in the Industry
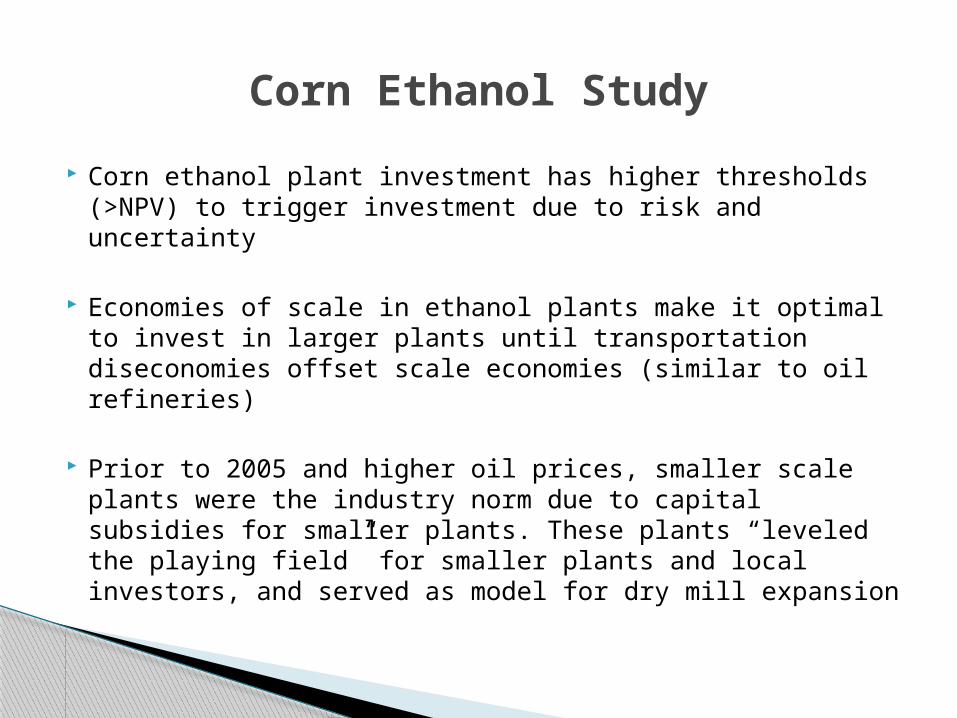
Corn ethanol plant investment has higher thresholds (>NPV) to trigger investment due to risk and uncertainty
Economies of scale in ethanol plants make it optimal to invest in larger plants until transportation diseconomies offset scale economies (similar to oil refineries)
Prior to 2005 and higher oil prices, smaller scale plants were the industry norm due to capital subsidies for smaller plants. These plants “leveled the playing field” for smaller plants and local investors, and served as model for dry mill expansion
Corn Ethanol Study

Capital as opposed to output subsidies for early cellulosic ethanol plant investment?
Magnitude of shock required to spur firms to invest in cellulosic industry may be large, especially given size and uncertainty surrounding RFS.2
Number of firms in industry relative to magnitude of shock will determine number of new cellulosic plants that will enter or exit
Jump-Starting Cellulosic Industry

Any questions, comments, discussion?
Thank you!

$0
$50
$100
$150
$200
$250
Stover(CC)
Stover(CS)
SG (MW) SG(MW_2)
SG (App) SG (SC) Misc(MW)
Misc(MW_2)
Misc(App)
WheatStraw
FarmedTrees
ForestResidue
PrairieGrass
$ pe
r ton
CO
2e
$60 Oil $75 Oil $90 Oil
Carbon Credit Needed for Feedstock Market by Oil PriceBaseline (2009, No policy incentives)

Processor Derived Demand for Biomass:
Supplier Marginal Cost of Producing Biomass:
WTA = {(CES+COpp)/YB+CHM+CNR+CS+DFC+DVC*D}
Market Viability if: WTP ≥ WTA
Simple LR Breakeven Model:
* *gas V BP O I O EWTP P E T V V C C Y

Renewable Fuels Standard (RFS.2)
◦ 36 billion gallons by 2022 Maximum of 15 billion gallons of corn-based ethanol counts 21 billion gallons of advanced biofuels by 2022
◦ Low Carbon Fuel Standard (LCFS) Minimum GHG reduction standards (relative to 2005)
Food, Conservation, and Energy Act of 2008 (FCEA)
◦ $1.01 per gallon tax credit for cellulosic ethanol production
2008 Farm Bill - Biomass Crop Assistance Program (BCAP)
◦ Up to $45 per ton of biomass for collection, harvest, storage and transportation (CHST payments) – 2 year limit
◦ Payments up to 75% of establishment costs for perennial crops
If current policy incentives are continued, cellulosic biofuels will play a key role in renewable energy
◦ Corn stover, woody biomass, perennial grasses
Current Biofuel Policy Incentives

Simulation for Carbon Price Needed to Sustain a Switchgrass Market by Region
Producer’s Credit Only($75/barrel oil, 23 MPG, 2009)

Annual yield increase rate from data:
◦ 1970-2009: 1.70%◦ 1999-2009: 1.92%
Annual yield increase rates needed to achieve proposed yield targets by 2030:
◦ 260 by 2030: 2.18%◦ 280 by 2030: 2.54%◦ 300 by 2030: 2.88%
U.S. Yield – AR Model

Annual yield increments from data (bu/year):
◦ 1970-2009: 1.92 ◦ 1999-2009: 2.80
Annual yield increments needed to achieve proposed yield targets by 2030:
◦ 260 by 2030: 4.51◦ 280 by 2030: 5.47◦ 300 by 2030: 6.42
U.S. Yield – Linear Trend
Related Documents