Economic Losses Due to Delayed Conception in Dairy Animals of Small Farmers in District Gujranwala By Sadaf Ali B.Sc.(Hons.) Agricultural and Resource Economics 2005-ag-2119 MASTER OF SCIENCE (Hons.) IN Agricultural Economics DEPARTMENT OF AGRICULTURAL ECONOMICS FACULTY OF AGRICUTURAL ECONOMICS & RURAL SOCIOLOGY UNIVERSITY OF AGRICULTURE, FAISALABAD PAKISTAN 2011

Welcome message from author
This document is posted to help you gain knowledge. Please leave a comment to let me know what you think about it! Share it to your friends and learn new things together.
Transcript

Economic Losses Due to Delayed Conception in Dairy Animals of Small Farmers in District
Gujranwala
By
Sadaf Ali B.Sc.(Hons.)
Agricultural and Resource Economics 2005-ag-2119
MASTER OF SCIENCE (Hons.) IN
Agricultural Economics
DEPARTMENT OF AGRICULTURAL ECONOMICS
FACULTY OF AGRICUTURAL ECONOMICS & RURAL SOCIOLOGY
UNIVERSITY OF AGRICULTURE, FAISALABAD PAKISTAN
2011

DECLARATION
I hereby, declare that the contents of this thesis “Economic losses due to delayed Conception
in Dairy Animals of Small Farmers in District Gujranwala” are product of my own research
and no part has been copied from any publication source (except the references, standard
mathematical or genetic models/ equations/ formulate/ protocols etc.) I further declare that
this work has not been submitted for award of any other diploma/ degree. The University
may take action if the information provided is found inaccurate at any stage. (In case of any
default the scholar will be proceeded against as per HEC plagiarism policy).
______________________________
SIGNATURE OF THE STUDENT
Name: Sadaf Ali
Regd. No. 2005-ag-2119

Acknowledgements
Up and above every thing, all glory to Thee O’ ALLAH, The Beneficent, The Merciful, The Omnipotent, The Omnipresent and The Compassionate. Whose blessings and exaltations flourished my thoughts and thrive my ambitions to have a cherished fruits of my modest efforts in the form of this write‐up from the blooming spring of blossoming knowledge. I offer my humblest thanks from the deepest core of my heart to the HOLY PROPHET MUHAMMAD (peace be upon him), the most perfect and excelled among and ever born on the surface of earth, who is forever a torch of guidance and knowledge and wisdom for humanity as a whole. Acknowledgement is not simply a formality but it is backed by all emotional associations; I have the people who have helped me to complete my research work. I am greatly Indebted to my supervisor, Prof. Dr. Muhammad Ashfaq, Chairman Department of Agricultural Economics for his kind guidance and encouragement, which has really been a source of inspiration and motivation throughout my work. I have no appropriate words to manifest my feelings of respect, gratefulness and obligation for his valuable suggestions and cooperation, which enabled me to achieve my aim. I would like to thanks International Center for Development and Decent Work (ICDD), Germany for their financial support in this regard. With this support all of my research work has been accomplished in a well‐organised manner. I am very thankful to my supervisory committee, namely Dr. Khalid Mushtaq and Dr. Khuda Bakhsh for their guidance in this research work. Special thanks goes to Dr. Khuda bakhsh whose encouragement, advice and friendship have been invaluable in my graduate career thus far. Heartiest gratitude to Dr. Khaleel Ahmad, Assisstant Director (ARES), Punjab Small Holder Dairy development, Gujranwala for his precious idea regarding this research work and his cooperation. I would like to thank all of the graduate students and faculty with whom I have worked with at U.A.F. and who have been so helpful and supportive. Specially, I thank Dr. Bakht Baidar Khan, Senior Professor Faculty of Animal Husbandry on whom I can always rely, regardless
of the task or time of day. Mr. Bill MCD Stevenson, Head of Milk Collection and Dairy Development, Nestle, Pakistan deserves special thanks for his help and continuous support
with this work, especially with chapter 4. Mr. Bill’s patience and time in helping with Chapter 4, especially, is greatly appreciated. I am also very thankful to Mr. Rick Thompson, Dr. Faisal Nawaz and Dr. Azeem, nestle, Pakistan for their willingness to helpand availability

to bounce ideas off of. More generally, I would like to thank all of my friends for all of their support and encouragement.

List of Contents
Sr. No. TITLE Page No.CHAPTER
1 INTRODUCTION 1.1 Components and Mechanisms Concerned with Economic Effects of the Reproductive Performance 1.1.1 Extra Expenditures due to the Low Reproductive Performance 1.1.2 Reduced Incomes due to Longer Calving Intervals 1.2 Scope of the Study
01 06
06 07 08
CHAPTER 2
REVIEW OF LITERATURE 10
CHAPTER 3
METHODOLOGY 3.1 Selection of the Study Area 3.1.1 Identification of the Small Farmers having Dairy Animals 3.2 Socio Economic Characteristics 3.2.1 Land Holding 3.2.2 Herd Size 3.2.3 Milch Animals 3.2.4 Age of the Farmer 3.2.5 Educational Status 3.2.6 Farming Experience 3.2.7 Household Size 3.3 Estimation of Dairy Farm Costs 3.3.1 Fixed Costs (a) Interest and Depreciation on Capital 3.3.2 Variable Costs (a) Labor Cost (b) Fodder Cost (c) Concentrate Feeding Cost (d) Veterinary Care Cost (e) Breeding Cost 3.4 Estimation of Milk Production 3.5 Cost of Milk Production 3.6 Marketable Surplus 3.7 Gross Income from Livestock 3.8 Gross Income from Crops 3.9 Gross Farm Income 3.10 Share of Livestock Income in the Total Farm Income 3.11 Estimation of Factors Causing Variation in Livestock Income of the Farmers 3.12 Estimation of the Losses due to Delayed Conception 3.12.1 Voluntary Waiting Period 3.12.2 Age of Maturity 3.12.3 Number of Days Delayed 3.12.4 Extra Feed Cost 3.12.5 Value of Milk Loss
29 29 29 31 31 31 31 31 31 32 32 32 32 33 33 33 34 35 35 36 36 37 37 37 37 37 38 38
39 39 39 39 40 40

3.12.6 Extra Labor Cost 3.12.7 Extra Treatment Cost 3.12.8 Extra Breeding Cost 3.12.9 Value of Calf Loss 3.12.10 Total Loss due to Delayed Conception 3.12.11 Per Day Loss due to Delayed Conception
40 40 41 41 41 41
CHAPTER 4
RESULTS AND DISCUSSION 4.1 Socio-Economic Characteristics 4.1.1 Relationship between farming experience and DCAs of the farmers 4.1.2 Relationship between age and DCAs of the farmers 4.1.3 Relationship between education level and DCAs of the farmers 4.1.4 Relationship between occupation and DCAs of the farmers 4.1.5 Relationship between working time hours and DCAs of the farmers 4.1.6 Relationship between family size and DCAs of the farmers 4.2 Farm Size and Income 4.2.1 Cultivated area of the respondents 4.3 Share of various crops in Farm Income 4.4 Livestock Situation 4.4.1 Adult cows 4.4.2 Cow heifers 4.4.3 Adult buffaloes 4.4.4 Buffalo heifers 4.5 Labor used in Livestock Production 4.6 Variable Costs in Animal Rearing 4.7 Compostion of Dairy Animals at the Farm 4.8 Milk Production and Consumption 4.8.1 Milk production and consumption of cow 4.8.2 Milk production and consumption of buffalo 4.9 Cost of production of milk (per liter) 4.10 Share of Livestock Income in Total farm Income 4.11 Economic Losses due to Delayed Conception 4.11.1 Economic losses due to delayed conception of heifers 4.11.2 Economic losses due to delayed conception of lactating animals 4.12 Reasons for Delayed Conception (Farmer’s Perceptions) 4.12.1 Reasons for Delayed Conception in Heifers 4.12.2 Reasons for Delayed Conception in Lactating Animals 4.13 Factors causing variation in livestock income of the farmers 4.14 Farmer’s perception about dairy farming 4.15 Reasons for not Visiting the Model Farm
42 42 42 43 43 44 44 45 45 46 46 47 47 48 48 49 50 51 52 53 53 54 54 55 55 55 57 59 59 60 60 61 63
CHAPTER 5
SUMMARY AND SUGGESTIONS 5.1 Summary 5.2 Suggestions
64 64 67
LITERATURE CITED 68

List of Tables
List of Figures
Figure No. TITLE Page No. 4.1 Delayed conception losses of heifers associated with days delayed 57 4.2 Delayed conception losses in lactating animals associated with days delayed 59
Table No. TITLE Page No. 1.1 Livestock population in pakistan (000 heads) 02 3.1 Name of tehsils visited in the survey 29 3.2 Name of villages and number of farmers visited in the survey 30 4.1 Distribution of the respondents according to their farming experience 42 4.2 Distribution of the respondents according to their age 43 4.3 Distribution of the respondent according to their education level 43 4.4 Distribution of the respondents according to their major occupation 44 4.5 Distribution of the respondents according to their working time hours in farming 44 4.6 Distribution of the respondents according to their family size 45 4.7 Farm size and total crop income of the respondent 45 4.8 Total cultivated area of the respondent 46 4.9 Cropping pattern and farm income 47 4.10 Total number of adult cows 48 4.11 Total number of cow heifers 48 4.12 Total number of adult buffaloes 49 4.13 Total number of buffalo heifers 49 4.14 Sale and purchase of the animals during last year 50 4.15 Discriptive statistics of composition of labor used in livestock 51 4.16 Discriptive statistics of animal’s feeding, veterinary care and breeding costs 52 4.17 Status of the respondent having dairy animals 53 4.18 Cow milk production and consumption 53 4.19 Buffalo milk production and consumption 54 4.20 Cost of production of cow and buffalo milk (per liter) 54 4.21 Share of livestock income in total farm income 55 4.22 Economic losses of delayed conception in heifers 56 4.23 Economic losses of delayed conception in lactating animals 58 4.24 Reasons for delayed conception in heifers 59 4.25 Reasons for delayed conception in lactating animals 60 4.26 Coefficients of regression 61 4.27 Farm related characteristics 62 4.28 Farm related characteristics: if you do not visit the model farm then give reason? 63

1
CHAPTER 1 INTRODUCTION
Livestock plays a considerable role in the life of farmers in Pakistan and also in other
countries of the region. They provide food, income, employment and so many other things
for rural development. Within the agriculture sector, livestock subsector plays a vital role in
economic development of the country. However, despite the increasing contribution of the
livestock sector, it has not yet attained the level needed to provide sufficient milk and meat
for the growing population. The contribution of livestock to value added in the agricultural
sector is around 53.2% equivalent to 11.4% of national GDP and has grown by 4.5% in
2009-10 as against 3.5% during the last year. Livestock sector employs approximately 35
million people and produces almost $500 million of products. Gross value addition of
livestock at current factor cost has increased from Rs. 1304.6 billion during 2008-09 to Rs.
1537.5 billion in 2009-10 showing an increase of 17.8% as compared to previous year
(Government of Pakistan, 2011).
Pakistan is among the most populous countries of the world. The human population is
increasing at the rate of 2.1%, which is the highest among the countries of this region, such
as China 0.5%, India 1.3% and Bangladesh 1.4%. Due to rapid increase in human population,
requirements for milk and meat in addition to cereals have proportionately ancreased. To
meet these requirements, we need to make the production performance of our livestock
resources much more efficient (World Bank, 2010).
Apart from the above-mentioned factors, the increased pressure of urbanization, increased
per capita income, better education level and nutritional awareness have resulted in gigantic
increase in the use of food products of animal’s origin in daily diet. This increase in demand
for food coupled with insufficient per capita availability of milk and meat has forced
consumers to pay higher prices for these products. The migration of rural population to urban
areas for better employment opportunities, health and living facilities are some of the
additional factors that are causing more demands for food of animal's origin in urban areas.
The higher prices of animal food products have changed the milk utilization and marketing
behaviour in rural areas. An enormous and constant increase in milk flow from rural areas to
urban areas has been reported.

2
Many efforts to improve the situation of the dairy farmers have been made by Government of
Pakistan and international agencies (FAO, ADB , IFAD) over the past two decades but their
impacts are not really encouraging as desired by the funding agencies (Teufel, 1998).
Pakistan is the 4th largest producer of milk in the world. Despite the well recognized
importance of milk, its productivity per animal is too low as compared to its potential.
Pakistan has very low milk yield per animal which is mainly due to underfeeding and low
genetic potential of existing stock. Dairy sector in Pakistan is mostly unorganized and
operates on non commercial basis while a bit part of this sector is contributing only a little
portion of total production of milk in the country (Javed et al. 2000).
Table 1.1: Livestock population in pakistan (000 heads)
Years Buffalo Cow Sheep Goat Camel
2001-02 24030 22858 24398 50917 758
2002-03 24754 23303 24566 52763 751
2003-04 25513 23757 24744 54679 743
2004-05 26295 24218 24923 56665 736
2005-06 27339 29564 26490 53789 921
2006-07 28146 30674 26794 55244 933
2007-08 29001 31829 27111 56741 945
2008-09 29883 33029 27432 58279 958
2009-10 30842 34310 27832 59972 100
Source: (Government of Pakistan, 2011).
This table shows that the population of buffaloes, cows and sheep has been increasing
significantly with the passage of time. This picture probably is encouraging and shows the
importance of this sector for the country’s development.
Dairy sector in Pakistan plays a significant role in national economy. It is estimated that
every third household in the country supports a milch animal and the average herd size is 2 to
3 buffaloes and 5 to 6 sheeps/goats in their backyards and are deriving 20 to 25 percent
income from it. The annual milk production stands at about 37 billion litres, making Pakistan
the 4th largest milk producing countryin the world. About 5.5 million landless/smallholder
farmers are responsible for the bulk of milk produced in the country. However, 93% of these

3
farmers have an average herd size of 2 to 3 milch animals and milk remains to be the
mainstay of their household income. However, despite having great value, milk production
per animal is less in Pakistan due to many factors like low genetic potential, late age at
maturity, long calving intervals, high economic losses due to disease, unorganised marketing
system, lack of extension services and farming on traditional lines. People in Pakistan have
inherited traditions of rearing dairy animals and livestock production has remained a
complementary activity to crop production. Dairy animals have a central position in livestock
farming (Bilal, 2004).
The importance of the livestock sector to Punjab’s economy is no secret. It employs about
75% of the rural work force in the province; the industry itself is highly scrappy with most
farmers having less than five animals. This sector could benefit from investment in
infrastructure that would update and manage some of the main processes involved. Punjab
possesses the 2nd largest buffalo population in the world (Niaz, 2010).
The feeds and feeding of dairy animals account for more than 65% of the total production
cost. Milk is the only saleable product that provides daily income to the farmers. The feed
nutrients are first utilized for maintenance and those excess over maintenance requirements
are utilised for growth and/or production. The maintenance cost is therefore a sort of tax on
the dairyman. Though high producing dairy animals consume more feed than low producing
animals, the additional milk they produce, pays much more than the extra feed cost incurred
on high producing animals. Highly productive animals are therefore essential for an
economic and efficient dairy productive system. An efficient feeding system not only helps
in increase the milk production but can also save feed by encouraging early growth of dairy
animals and thus reducing the age at first calving and providing sound reproductive health to
obtain maximum yeild in their entire productive life.
Pakistan is sanctified by a large herd well adapted to the local environmental conditions.
Pakistan is home tract of the finest buffalo breeds of the world i.e. Nilli-Ravi and Kundhi.
Likewise, Sahiwal and Red Sindhi cattle are renowned milch breeds of zebu cattle with
identified resistance to hot weather and ticks. Even though, Pakistan ranks 4th in the milk
production in the world, low productivity per animal is the main issue of our dairy livestock.
This low productivity can be credited to many factors including poor genetic potential of

4
90% of animals, poor nutrition, inadequate veterinary health services, delayed puberty, long
calving interval, acute shortage of quality breeding bulls and inefficient marketing. Livestock
sector is still largely dependent on low technology and capital investment. Most of the dairy
animals (>50 %) are owned and reared by smallholders keeping less then six animals per
family in subsistence production system. Hardly 5% have more than 100 animals and are
busy in their farming business at commercial level (LDDB, 2010).
In Pakistan, the dairy sector has futile to draw the due attaraction of the policy makers. This
dairy sector is steadily shifting from non-commercial to commercial sector. Pakistan is still
importing powdered milk in order to fullfil the domestic needs even though after being one
of the foremost milk producers in the world. At farm level the production of milk has the
poorest connection of the Pakistan's dairy industry due to which stable fresh milk supply at
reasonable prices can not be entertained. Several factors have been responsible for the
relatively retarded growth of this sector (Burki et al. 2005).
In Pakistan, at present majority of the farmers keep their animals both for domestic and
commercial purpose. Mixed farming (crop + livestock) is practiced in the Punjab province. In
Punjab, almost every farmer has kept livestock along with other agricultural enterprises to
fulfill their domestic needs, efficient use of farm wastes and surplus hours of farm labour.
The landless farmers mainly keep their animals for earning livelihood and to meet the daily
family requirements through sale of milk and animals. This category of farmers mostly
depends on grazing their animals along canal banks and water channels; and feeding on
fodder obtained in return of their services rendered for land owners; and in most of the cases
their animals remain under fed. Only lactating animals get attention of their owners for
proper feeding whilst dry animals are almost remain neglected. These types of feeding
practices definitely lead to underfeeding and poor exploitation of their genetic potential.
Most of the households having dairy animals belong to the category of subsistence or near
subsistence, having high risks in the milk production, because milk income entertain
frequently as agriculture or labor income. Thus, tries to boost up the production of the dairy
industry of small farmers are not only important to raise the yield of milk in the country, but
can also turn into an helpful instrument to increase rural household incomes improvished.
5
Reproductive traits in dairy cattle are not only a measure of fertility but also of productivity
and production potential of an animal for life. Fertility can be defined as the capability to
conceive and produce a feasible calf following an aptly timed insemination (Royal et al.
2000). Efficiency of about fertility can be improved by means of better management (Biffani
et al. 2003). Low fertility is of economic importance for dairy companies, because it results
in a shift in calving pattern, higher levels of involuntary replacement, hormonal therapy,
veterinary intervention, and reduction in annual production of milk (Esslemont and Peeler
1993). In Malawi, in an effort to improve milk production, dairy cattle production has
sometimes been directed at increasing milk production per animal (Chagunda et al. 2004).
In order to determine the profitability of a dairy farm, the reproductive efficiency plays a key
role. There are several factors that cause a decrease in reproductive efficiency like high age at
first calving, longer calving interval, late maturity and dry period. Due to the involvement of
these factors, the farm income is affected by the reduction in milk production and less
number of calves is produced by the animals. The major cause for the late maturity is poor
feeding which results in at least loss of one lactation per animal under local environmental
conditions. According to the surveys report, the average calving interval is about 18 to 24
months which can be improved to 12 to 14 months with better management of the animals of
the farm. It is anticipated that each animal losses 2 to 3 lactations due to poor reproductive
efficiency, which largly change the economics of dairy farming in the country.
The issue of fertility in high yielding dairy cows is foremost in the minds of both pedigree
breeders and commercial milk producers working in the global dairy industry. The
‘Holsteiniziation’ of the global dairy herd has resulted in attainment of unprecedented levels
of milk output per cow per lactation. This should contribute to increased efficiency of
production on farms by reducing maintenance and fixed costs per unit of milk produced.
However, efficiency of reproduction is also a critical parameter in sustaining long-term
profitability on any dairy enterprise.
Efficient and accurate oestrus detection is the most important factor limiting reproduction in
most dairy animals/herds. Failure to observe animals in oestrus delays first service, lengthens
oestrus interval, and is one of the primary factors lengthening projected average minimum
calving to conception interval by increasing the number of days open. It contributes more to

6
lengthy calving intervals than conception failure. In addition, inaccurate oestrus detection
lowers conception rate. As many as 1/3rd of dairy herds have a significant oestrus detection
accuracy problem.
1.1 Components and Mechanisms concerned with Economic Effects of the
Reproductive Performance
Decreasing reproductive efficiency of a dairy herd affects its profitability through compact
incomes and extra expenditures. Compact incomes are anticipated losses in comparison to a
most favorable or a reference level in reproduction (Seegers et al. 1994).
1.1.1 Extra expenditures due to the low reproductive performance
These costs according to the extra expenditures indirectly result from terminology oftenly
used by the economists of animal health (Seegers et al. 1994). Their estimation is not
complicated from the data like pricing lists or bills. More in detail, such types of
expenditures consist of:
Exrat breeding costs
Extra treatment costs
Extra feeding costs
Extra labor costs
1.1.2 Reduced incomes due to longer calving intervals
These are caused by lower productivity (i.e. lower output/input or outputs/fixed costs ratios
in the production process). They are corresponding to the “preventable losses” in the
terminology used by the economists of the animal health (Seegers et al. 1994).
Calf cropreduction
Milk yield reduction
Lengthened calving intervals
As discussed above, poor reproductive efficiency is caused by high age at first calving,
longer calving interval, delayed maturity and dry period. These factors lead to reduction in
the milk production at the farm as well as curtail lactation period coupled with reduced

7
calvings. Poor and underfeeding are the principal causes of delayed puberty resulting in at
least loss of one lactation per animal under local management conditions. Under field
conditions, the average calving interval is around 18 to 24 months which can be reduced to
12 to 14 months with improved management of the farm animals. It has been estimated that
during productive life, each animal loses 2 to 3 lactations and among other things, it is
usually caused by poor reproductive efficiency which badly affects the economics of dairy
farming.
Low reproductive efficiency due either to delayed first service, missed oestrus, or multiple
services per conception continues to be a major problem in dairy herds. Inefficient
reproductive performance results in excessively late age at first calving and long lactations.
Both of these things are costly to the dairy producers because of the high replacement costs,
breeding expenses and fewer calves being born (Oudah et al. 2001). Several reports have
showed that poor reproductive performance, manifested as lengthened calving intervals, can
result in reduction of milk yield, increased replacement costs and culling rates (Pryce et al.
2000; Kadarmideen et al. 2003 and Sewalem et al. 2008). Beever (2006) reported that
average dairy herd fertility is declining, with more services per successful conception,
lengthened calving intervals and increased culling due to failure to rebreed, all adding
considerable costs to milk production. Genetics, management and nutrition have all
contributed to this decline in fertility.
What is the value of an increase (or decrease) in pregnancy rate? Depending upon milk price
and milk yield, each 1% increase (or decrease) in pregnancy rate results in the gain (or loss)
of approximately $12 to $25 per cow per year (Overton, 2001, 2005, 2008). Because as
pregnancy rate increases, over time, the average days in milk for the milking herd will
decrease, leading to higher average milk production per day of lactation, more time per
lifetime spent in the most profitable portion of lactation, and less veterinary and breeding
costs. As pregnancy rate decreases, average days in milk increases, leading to increased
management, feed, and veterinary costs for cows in the least profitable portion of lactation
(Joseph and Amin 2009).

8
All over the world, the poor reproductive efficiency of dairy animals has become a leading
problem. Increase in calving intervals due to the decrease in rate of conception over the
previous decades has been entrenched by different studies (Royal et al. 2000; Lucy, 2001;
Hare et al. 2006). Nowadays in the field, it is not rare to encounter farmers having given up
any pro-active managerial attitude towards reproduction, preferring to cope passively with
what will happen: i.e. to cull more and more so called infertile cows, and to raise more and
more heifers or to purchase more and more replacement stock. A sizeable proportion of
farmers seem not to be aware of the losses due to suboptimal reproductive performance of
their herd, or they behave like that. However, most of the farmers and advisors are still
willing to work otherwise and they ask for relevant and consistent support.
1.2 Scope of the Study
In Pakistan, dairy farmers are now suffering a decline in their income due to the high cost of
milk production of acceptable quality. In addition, fertility in terms of heat detection,
submission rate and pregnancy rate is often seen as another concern of dairy farmers.
Economic losses due to delayed conception in dairy animals were estimated in different
countries. One day of delay in conception was calculated to cause $2.03 (Lineweaver,
1975), $1.24 (DeVries and Conlin, 2003) loss in the United States and £2.41 loss in the UK
(Esslemont et al. 2000) for an average milking cow. Esslemont et al. (2000) also reported a
loss of £6.52 per day for a high producing cow to become pregnant between 206 and 235
days post-calving (Kafi et al. 2007).
Regardless of significant improvements in the Pakistani dairy herd management during the
last three decades, the opportunity of extensive usage of artificial insemination has
remained a confront for the dairy sector. There is a stern need to explore factors restricting
more widespread application of artificial insemination in Pakistani dairy herds. To our
knowledge, no report has been published on the economic losses associated with delayed
conception under Pakistani intensive dairy management and its impact on the income level of
the farmers. Therefore, the following study will be carried out to determine the economic
losses associated with delayed conception in dairy animals and its impact on the income level
of the farmers.

9
OBJECTIVES
The objectives of the study are:
To estimate the share of livestock income in the total income of the farm
To estimate the composition of labor used in livestock
To estimate the economic losses associated with delayed conception
To investigate the reasons for delayed conception

10
CHAPTER 2
REVIEW OF LITERATURE
Louca and Legates (1968) estimated that a 12 month calving interval (CI) was best for
second lactation and older animals and a 13 month CI was acceptable for first lactation cattle.
In this paper, they cited the lack of experimental data that supported particular losses related
with increasing days open. These authors also cited four papers, published by a variety of
researchers over the period extending from 1929 to 1961, which held the same opinion:
“…that the calving interval should not be the same for all cows, but the length should
depend on the age of the cow and her producing ability, and that there was general agreement
that a calving interval of 12 months was desirable.”
Schaeffer and Henderson (1972) studied the genetic and environmental associations of days
dry and days open with the production of milk. Age and calving month extensively
influenced dry period length. Within herd heritability calculations of dry days were 0.15,
0.33, and 0.34 for 2nd, 3rd and later lactations. Within herd heritability calculations of days
open were effectively zero. As the open period length increased, cumulative production of
milk also increased at each succeeding stage of lactation.
Coppock et al. (1974) studied the effects of length of dry period on disorders at calving and
subsequent milk production. Cows were assigned to treatment group dry periods of 20, 30,
40, 50, and 60 days by modulus 5 of their index numbers. Cows which averaged 10 to 40
days dry produced from 450 to 680 kg less milk in the following lactation than cows with
average dry periods of 40 days or longer. Although there was some gain in milk production
during the previous lactation from the longer lactation – shorter dry periods, it was less than
half the loss in the following lactation. The depressing effect of the short dry periods did not
carry over to the second lactation. Cows with dry periods of 40 ± 10 days produced as much
as cows with 50 days dry or more.
Gill and Allaire (1976) studied the relationships of management and breeding factors to
economic returns for dairy cows. A profit function was defined from production of milk,
reproductive performance, body weight, herd life, and prices for milk, feed energy, salvage
value, calves, and fixed costs. Statistics on individual cows were days in milk for each
11
lactation, milk yield, weight at first calving, maturity and fat percent, number of artificial
inseminations and age at each calving and at removal. Each trait values for maximizing a 2nd
trait are defined as most favorable. Most favorable percent for open days and dry days were
31.0 and 10.5 for profit / day-herd life. A little larger percentage was optimal for total profit-
life, milk-life, performance traits, and herd life. Optimal age at first calving was 22.5 to 23.5
months. Per day profit of herd life was $0.05 larger for cows calving in the 25th month of age
than those calving before? Age at first calving, Days open and days dry accounted for 0.9,
4.5, and 10.0% of deviation in herd life; for 0.6, 18.8, and 4.3% in milk per day-life; and 5.2,
8.3, and 8.1% of deviation in per day profit of herd life. Correlations between percent days
open and age at first calving and herd life were 0.05 and −0.10. Maximum profit per day-
herd life was estimated for cows with 25 month of age at first calving, 124 days open and 42
days dry while maximizing milk per day-life and herd life.
Pelissier (1976) studied that low breeding competence had been documented as one of the
serious problems disturbing the efficient production of milk. For this problem a study was
done in California and the author recognized the two main factors responsible for that
problem which were, delayed first service and low conception rates. Inefficiency of heat
detection was the main reason for delayed first service and also it contributed considerably to
the delay of following services.
James and Esslemont (1979) used a mathematical model to test the economic effect of
calving interval’s change under typical high yielding herd conditions at 1976 prices. The
outcome of first calving month was tested in a herd where four lactations were supposed to
follow at equivalent calving intervals. Under the given conditions, cows should calved at
320-day to 360-day intervals to maximize the annual margins over feed, but the month of
initial calving affects the complete level of margins over feed markedly (Maximum: £382·10
for 365-day interval for calving in November, Minimum: £318·10 for calving in April). This
means that absolute knowledge of the main input output factors is necessary before
recommendations can be made for an individual animal. The change in margin over feed for
each day's delay in conception varies broadly, with a loss as high as £1·80 per day's delay.
Olds et al. (1979) derived multiple regression equations from the data of 6,351 Holsteins for
first lactations and of 17,978 Holsteins for later lactations. Within the herds each day open

12
between 40 and 140 days during lactation resulted in an average of 4.5 kg less annual milk
production during current lactations of first calf heifers and 8.6 kg less for cows in later
lactations.
Holmann et al. (1983) estimated that the net value per day open was positive ($0.21 to $0.40)
for all milking animals when calving interval was extended from 12 to 13 months and on the
other side, the value per day open was negative (−$0.04 to −$0.23) when calving interval was
extended from 13 to 15 months. So, the 13 month calving interval appears to be most
favorable. Costs incurred with 13 months were small enough not to be a serious problem of
management when cows were fed according to the milk yield and when dry period was 65
days.
Dijkhuizen (1984) estimated that an optimal calving interval of one year or less than one year
was found, whereas the per day loss of lengthening the calving interval was estimated to 1–2
Dutch guilders (Dfl.). On an average, the estimated loss of per cow per year was Dfl. 63. Out
of which Dfl. 35.50 were resulted from sub-optimal interval and Dfl. 27.50 were estimated
due to reproductive failure by the forced replacement. Drugs cost and Veterinary treatment
costs were not included in this study. On an average, the total loss due to the reproductive
failure was estimated to about Dfl. 80 per cow per year. Lastly, loss differences between
farms have been calculated. The difference between 20% of the farms with the highest
estimated loss and 20% of the farms with the lowest estimated loss was greater than the
average loss.
Din (1984) concluded that average cost of maintaining a buffalo was Rs.4267 and Rs.2705
for a cow per year. Average milk produced per lactation of buffalo was 1020 liters and 394
liters of cow. In this area, farmers were found to earn 751.53 net profits by maintaining a
buffalo, but cow was found uneconomical. Farmer suffered a loss of Rs.286.83 on
maintaining a cow for a period of one year. The cost of milk production per liter for buffalo
and cow was Rs.3.14 and 4.69 respectively. The higher cost of milk production for cow was
manly due to poor yield of milk.
Keown and Everett (1984) studied the factors that were estimated for days carried calf for
milk, fat, and protein using a model that adjusted for the age-month and herd-year of
freshening. Factors developed show a close relationship between protein and milk with fat

13
factors being smaller. Factors also are smaller than others reported in the literature. First
lactation factors differed from second and third lactation factors. Analysis of days dry
indicated that optimum number of days dry between lactations 1 and 2, 2 and 3, and 3 and 4
for maximized subsequent yield was 51 to 60 d dry for all lactations. Calculated F values
showed greater significance for days dry than age-month of freshening. Optimum freshening
weight of a first calf heifer to maximize first lactation milk yield is between 544 and 567 kg.
The F values for weight at freshening were more significant than age-month of freshening.
Britt (1985) reported that the reproductive efficiency is essential for the benefit of dairy
farms, because it affects the production of milk per cow per day, voluntary and involuntary
culling rate and the number of replacements. High-yield dairy cattle breed at a satisfactory
pace if managed properly. There is a strong relationship between the reproductive
efficiency of animals and herd management. Thus, reproductive efficiency and take
advantage of the animal act positively in improving the detection rate of estrus, conception
rate, and in the management of cows. Pharmacological methods are now found
time control of estrus and insemination in groups of cows. It is reasonable to limit the
breeding herd in a week of each interval of 3 weeks. The main advantages of controlled
breedingare convenience and efficient use of labor for the detection of estrus
and insemination. Biotechnical methods such as embryo transfer and insertion of specific
genes can improve the rate of genetic improvement for economically important traits.
Bartlett et al. (1986) studied that a repeat-breeder cow with symptoms, defined as a cow that
was inseminated three or more times within the same breast. Repeat-breeder symptom was
found in 24% of 3,309 lactations of the cows. Cost related to unsuccessful inseminations
included delayed development costs, the additional number of services in addition to
the veterinary service and losses due to slaughter. Loss of milk with repeat
breeder symptoms was about $ 385. A calculated extra cost of $140 was linked with a second
insemination, $279 with third insemination, $429 with fourth insemination and $612 with
fifth insemination.
Jansen et al. (1987) studied the interactions between herd fertility and financial losses due to
reproductive failure in dairy herds. Financial losses connected with lengthened calving
intervals and forced replacements from reproductive failure were calculated. Parameters used

14
for herd fertility were calculated from artificial insemination and calving data (i.e. calving to
first service interval, non-return rate 56 days after first service, percentage of correct
inseminations carried out in the interval 18–24 days, fertility status, calving interval, an
estrus index and number of insemination per average cow present in the herd. The herd
fertility parameters were moderately-highly related to loss due to suboptimal calving interval
(r=0.20−0.79 in absolute values), but only slightly related to losses due to forced replacement
(r<0.17 in absolute values). Repeat abilities, calculated over a 3-year period, were high for
the interval to first service, non-return rate and the estrus index (0.52−0.67) and moderate for
percentage correct reinseminations, fertility status, calving interval and loss due to
suboptimal calving interval (0.38−0.48). Repeatability of loss due to forced replacement was
low (0.20). In a regression analysis no herd fertility parameter was fitted with respect to loss
from forced replacement. Loss due to suboptimal calving interval at herd level was best
estimated by the estrus index (R2=0.63), the addition of the interval to first service to the
regression equation explained a further 10% of the variation between herds. It is suggested
that the estrus index and the interval to first service should be presented as management aids
to monitor herd fertility.
Kumar and Gupta (1988) worked on the economics of milk production among the various
species of milk animal at different farming system with the seasonal fluctuation. The highest
yield per day of crossbred animals was found to be 8.58 liter by large farmers. Whilst the
milk production in case of upper medium, lower medium and small farmers ware 8.08, 7.24
and 6.2 liters, respectively. The average milk yield of local cow and buffalo was computed at
3.74 liters and 4.98 liters, respectively. With high genetic potential cross bred cow proved its
economic superiority by minimum cost per unit of milk produced and viability over the
others in the study areas.
Schmidt (1988) estimated that when the culling plan was based on age of the cow with $12
milk price and low feed prices, income over feed and variable expenses of cows for the
period of a 13-months calving interval was slightly lesser than those for the period of a 12-
months calving interval. Losses for each extra day of calving interval from 12 to 13 months
are ranged from 0 to $13. By increasing the calving interval to 14 months increased the
losses of associated with the animals per day open with a range of $.10 to $.71 in comparison
with a 12-months interval. Losses per day open for a 15-months calving interval were ranged

15
from $.18 to $.60 in comparison with a 12-months interval. Factors which reduce income
over feed expenses, such as low milk production, low milk prices, high feed prices, and
culling at an early age decrease the loss in income over feed and variable costs for 14- and
15-months calving intervals in comparison with a 12-months interval. When the strategy of
culling was based on lactation number of the animals, extending the calving interval of the
animals increased the income over feed and variable costs associated with the animals with
the greater effect occurring between 12 and 13 months. From the above results,
recommendations for a 12- to 13-months calving interval appear reasonable.
Bhogal et el. (1989) used a profit-maximizing linear program model to formulate most
favorable crop and milk production tactics for marginal and small farmers in meerut district.
The optimum plans developed suggest that the buffaloes, especially the murrah buffaloes,
were the most suitable milch animals and their number could profitably be raised to three per
farm. The considerable potential for increasing family income and employment through
optimum integration of crop and milk production activities is also established.
Nieuwhof et al. (1989) studied the effects of calving ages and calving intervals for cows in
first calving for five dairy cattle breeds. Mean age for Jerseys was lowest and was highest for
Ayrshires and Brown Swiss. Registered cows usually were older in age than others in
different parities. Important exception was that registered cows were younger than others at
first parity. Trends were positive in calving ages over time for given parities; if parity was
not included then trends were negative except for Jerseys and positive except for Ayrshires
and Holsteins. The calving interval lengths were shortest for Jerseys and longest for
Guernsey’s and Brown Swiss. There was a decrease in mean calving intervals from first to
second interval and then increased till sixth for all breeds. Calving intervals for Holsteins
were ranged from 393 days, following second parity to 405 days, following sixth. Registered
cows had longer calving intervals than others. Calving interval trends were generally positive
for given parities and significant only for Guernsey’s.
Erling et al. (1989) studied the result on net return per year by varying the conception time
from 60 days to 220 days after calving of the cows for different combinations. Early
conception was the very cost-effective for all combinations of characteristics. The
consequences of one day of delayed conception on net return per year ranged from 0.3 Sw. kr

16
to 11.6 Sw. kr keeping in view the calving month, lactation stage and lactation number,
parity and production level of the animal. The cyclic deviation in price of milk had a strong
impact on the association between net return per year and conception time.
Boichard (1990) used dynamic programming in order to estimate the economics of fertility in
dairy animals. The anticipated cash flow of a cow in the future, given the herd’s average
conception rate, were determined and maximized with van Arendonk model, which was used
to predict the replacement policy. The association of marginal cost with the decline in
fertility of the animal was calculated as the ratio of the difference between the expected cash
flow of a heifer at calving to the difference of respective average conception rates in the herd.
The projected outcomes had minimum value but considered all the consequences of a change
in fertility. Presently in the French conditions, the marginal value of 1% absolute change in
conception rate was estimated to be between 10 and 20 FF. This value decreased if the
average fertility level of the animal increased.
Weller and Folman (1990) studied the effect of days open and days to first insemination,
cumulatively on calf and milk production in the current lactation and following lactations.
For first group, most favorable days open were ranged from 110 days for low calf value
(500 kg milk) to 91days for high calf value (4000 kg milk). For second group, most favorable
days open ranged from 91 days for low calf value to 40 days for high calf value. Expected
production which was a function of days to first insemination and probability of conception,
which was varied from 0.4 to 0.6, and estrus detection, which was varied from 0.5 to 0.7.
Most favorable days to first insemination as a function of calf value and reproductive
management ranged from 95 to 65 days for first group and from 77 to less than 40 days for
second group. Most favorable days to first insemination were higher with lower value of calf
and better reproductive management. Expected losses from early first insemination (40 days
in milk), as compared with the most favorable, ranged up to 780 kg of FCM for first group
cows, while expected losses from late first insemination (120 days in milk) ranged up to
790 kg for second group cows.
Pardue and Bertrand (1990) concluded that milk prices, unstable market conditions and
several recent summer droughts which resulted in high feed prices. If milk prices increase
17
and South Carolina dairy producers continue to adapt to new technologies, they can share in
growing milk market.
Olynk and Wolf (1991) reported that reproductive management has received a great attention
in recent years. New programs and technologies have been developed to help dairy farm
managers in order to efficient breeding of cows and heifers. Due to the negative correlation
response of fertility and milk yield it becomes very difficult in order to get efficient breeding
of cows and heifers. Results from dairy farm surveys were used to estimate the economic
analyses of the programs of reproductive management. Programs related reproductive
management had significantly affects the costs especially labor costs. For example, visual
heat detection needs more labor hours per cow than the use of an estrus synchronization
program. So, visual heat detection programs were more sensitive to the cost of labor than
synchronization programs.
Shah et al. (1991) estimated the economic losses in Nili-Ravi buffaloes due to reproductive
failure in Pakistan. The most favorable calving interval for dairy buffaloes was found to be
12 to 13 months. Losses caused by sub-optimal calving intervals were Pakistani Rs. 9–14 per
extra day per calving interval. Losses for forced replacement as a result of reproductive
failure average Rs. 133 per buffalo present on the farm.
Chaudhry and Chaudhry (1992) concluded that milk price showed a positive correlation with
number of milk animals per farmer and negative relationship was observed with crop
intensities. Animals contributed 32.65% to total gross margin. It was concluded that dairy
animals were essential part of farm plans and were essentially needed for 3 main reasons: (1)
to secure net cash return (2) to provide employment for some of the excess family labor and
(3) to serve as useful outlet for crop byproducts. Increased net cash return can be achieved by
mixed farming through effective allocation of resources and improved marketing practices.
Esslemont (1992) used the calving index as a measure of herd fertility and neglects the
proportion of the herd that is culled and failing to conceive. On an average, calving interval
of the herd was 380.3 days, with 23.1% of culling rate. As a result 92.1% of the cows were
served and 85.3% of those which calved, conceived again, with an average of 1.9 services
per conception. In order to assess the herd fertility on financial basis, with costs associated to
18
calving interval, pregnancy rate and culling rate to give a fertility index, the average herd was
suffering a loss of 62 pounds/cow/year, compared with target levels.
Shah (1992) found the nutritional impact of modern dairy development processes on the rural
economy in India. It was a significant issue given that 70-80% of small and marginal farmers
and agricultural laborers were involved in dairying. Malnutrition among these classes was
widespread. However, a number of village studies have found that the food intake of landless
farmers was greater in the village. The extra income generated by the sale of milk allows the
purchase of other foods not produced by the farmers. On the other hand, it was also feared by
some experts that by providing better marketing for the sale of surplus milk through
cooperatives will further reduce the nutritional status of poor. Because at present available
surplus milk or its products were distributed among poor free of charge but with the better
marketing of the milk surplus than home consumption will be sold.
Tailor (1992) found in his study that average milk yield was 1300 liters, with lactation
duration of 275 days, dry period of 136 days calving interval of 411 days. The average cost
of milk product per kg in the two years, respectively, was Rs. 3.50 and Rs. 3.18 (having
average Rs. 3.34), the higher cost in 1988/89 was attributed to the higher price of dry fodder
in that year. The major contributor to maintenance cost of a sutri buffalo in all periods was
dry fodder, which accounted for 31.18, 44.07 and 32.25% of maintenance cost during
lactation, the dry period and inter-calving period, respectively. The net daily maintenance
cost of per buffalo was Rs. 16.79, Rs. 15.81 and Rs. 16.46, during above mentioned periods.
Profit during the inter-calving period was Rs.617 per buffalo producing 1600 kg of milk
during lactation.
Plaizier et al. (1996) studied the relationships between reproductive performance and net
revenue from dairy herds using statistics models. He used projected calving interval, adjusted
calving interval and involuntary culling rate in this study. Adjusted calving interval was
estimated by dividing the projected calving interval for pregnant cows by number of cows
that were not culled for reproductive failure. “The regression of adjusted calving interval on
net revenue had an R2 of 0.72, which was higher than the R2 of 0.59 obtained by the
regression of projected calving interval on net revenue. Hence, the estimation of financial
losses from suboptimal reproductive performance was more accurate when adjusted calving

19
interval was used as a measure of this performance than when projected calving interval was
used. This difference is because projected calving interval did not consider cows that were
culled for reproductive reasons, but those cows contributed to a reduction in profit because of
suboptimal reproductive performance. The highest R2 (0.78) was obtained with a model that
included projected calving interval and involuntary culling rate. However, use of that model
might not be practical because herd operators differ in their ability to distinguish between
involuntary and voluntary culling. The mean reduction in net revenue from a 1-d increase in
adjusted calving interval was estimated at $4.7 (Canadian) per cow.”
Chaudhry et al. (1997) studied the three groups of the dairy farmers subsistent, semi
commercial and commercial. These workers pointed out that benefit cost ratio (BCR) was
higher for commercial farmers than semi-commercial and subsistent farmers due to large
capital and better managemental control.
Kulak et al. (1997) the objectives of this study were to evaluate and compare alternative
measures of individual cow lifetime profitability and to determine what lifetime traits are
significantly related to profitability of dairy cattle. Profitability measures considered were: 1)
lifetime milk revenue minus lifetime feed costs (MMF); 2) lifetime profit (LP); 3) discounted
lifetime profit (DLP); 4) annualized DLP per year of total life (ADLPLTL); 5) annualized DLP
per year of productive life (ADLPLPL); 6) DLP adjusted for opportunity cost of postponed
replacement (DLPOC), and 7) economic efficiency (EF). Data for this study consisted of
1112 lifetime performance records of Holstein cows from the National Cooperative Dairy
Cattle Breeding Project, which was implemented by Agriculture Canada in 1972.
Correlations were highest among MMF, LP, and DLP. EF had slightly lower correlations
with MMF, LP, and DLP, but higher with ADLPLTL and ADLPLPL. ADLPLPL and DLPOC
had low correlations with all other measures. DLPOC was recommended as the best because
it considered the opportunity costs of postponed replacement. For DLPOC, average milk
revenue per lactation was found to be the most important income trait, followed by length of
productive life. Days dry (average over completed lactations) had the greatest negative
impact on profitability. Age at first calving and average number of veterinary treatments for
reproductive diseases over lactations were both negative contributions to profit. Lifetime
traits accounted for 65% of variation in DLPOC.
20
Nicholson et al. (1999) studied the livestock as a component of farm in the overall farming
system. One feature of this study, which was usually not measured, was that the small
farmers having less land holdings had numerous goals and these impel their decision-making
power, especially when they had choice of technology and enterprise mixes. There was need
to differentiate the dairy farming households not only in term of their resource availability
but also in term of their characteristics and objectives, production and management system .
Agarwal and Chandra (2000) conducted a study in the Farrukhabad district of Uttar Pardesh.
A sample of 100 households was selected with probability proportional to size of holding.
The households were classified into four categories, viz. landless milk producers, small
farmers, medium and large framers. The total gross cost per milch animal per day was Rs.
48.39 and Rs. 50.95 in crossbred cows and buffalos, respectively. Feed cost constituted two-
third of total gross cost both in cows and buffalos. The over all net return per day per milch
animal was Rs. 5.30 and Rs. 9.34 for crossbred cows and buffalos, respectively. Based on
these findings, it was concluded that crossbred cows are more suitable for medium farmers
and buffalos more suitable for large farmers.
Esslemont et al. (2000) estimated that per day loss due to per day of delay was £1.73 when
the calving interval was extended from 85 days to 100 days post-calving. This loss had risen
to £2.86 per day when calving interval was extended from 116 to 145 days post-calving and
£3.55 per day when it further extended up to the day when no extra milk came from the
current lactation. The loss of per day's delay varies broadly depending on the elements
included in the calculation. The net final value of a lost day was calculated at £2.30. The
costs cumulated over time reached at £253 when the calving interval extends by 3 months.
Jones (2000) performed an analysis by using a simple capital budgeting technique known as
net present value that summarizes for the costs one incurs on economic returns that were
received over time versus immediately. Consequences of this study were reliable with those
of preceding analysis that concluded that maximum net economic returns were earned when
the calving interval was 12 to 13 months instead of 18 months.
Khalid et al. (2000) reported that small scale dairy farms in India and Pakistan are not able to
generate family farm income. There existed a significant element of economics of scale
21
resulting in cost reduction by 30-50% between the small and large farms in India and
Pakistan.
Arbel et al. (2001) conducted a prospective trial where cattle were managed to attain calving
intervals of either 12 months or 14 months. They found that primiparous and multiparous
cows with extended lactations were more profitable. There data illustrated that, during the
first experimental lactation there were advantages of $0.19 per extra day of calving interval
in first calf heifers and $0.12 per extra day of calving interval in older animals. When the
first 150 days of the subsequent lactation was also included, the net return per day of CI was
$0.21 and $0.16 higher with extended calving interval in primiparous and multiparous
animals, respectively.
Lucy (2001) studied that the shift toward more productive cows and larger herds is associated
with a decrease in reproductive efficiency. The cows who gave highest production of milk
had the more incidence of infertility, but epidemiological studies suggested that, in addition
to milk production, many other factors were perhaps declining fertility in our dairy herds.
The physiology of dairy cows had changed over the past 50 years, and these physiological
changes along with high milk production might explain the decline in the fertility of the dairy
cows. New research had included critical areas in order to overcome such type of problems.
It is not an easy task to solve the reproductive loss in dairy cows because there are not so
many research studies regarding reproduction in postpartum dairy cows. So, the present
research will provide a base in this area and will need to be expanded.
DeVries and Conlin (2003) estimated that the net returns per cow per year at 65% estrous
detection efficiency were $1305.27 which at 35% of estrous detection efficiency decreased to
$1253.34. The overall average losses in net return per cow per year per point decrease from
65% to 55%, from 55% to 45%, and from 45% to 35% of the estrous detection efficiency
were $0.78, $1.71, and $2.71, respectively. Similarly, the average costs associated with extra
day open were $0.73, $1.13, and $1.24, respectively.
González-Recio et al. (2003) estimated a quadratic relationship between FCOST and INS.
Similar profitability was estimated for cows who needed one or 2 INS, but when >3 INS
were needed, profit decreased by >$205 (US dollars)/yr per cow. Cows that needed more INS
had higher milk yield per lactation, but also had a higher culling risk and lower productive
22
life and lifetime production, therefore, lower profit. Calving interval (CI) and INS economic
values were, respectively, −$4.90 and −$67.32 (US dollars)/yr per cow and per one unit of
change. The economic values of productive traits were $4.04, $1.02, and $1.19 (US
dollars)/yr per cow and per one unit of change for kg protein, kg fat, and days in milk,
respectively. A mature body weight economic value of −$0.67 (US dollars)/yr per cow and
per kg was estimated. The relative importance of fertility traits with respect to protein was
64% for CI and 24% for INS, although the CI economic value is highly influenced by
phenotypic standard deviation considered.
Mayne et al. (2003) studied that poor reproductive performance is a major problem on dairy
farms throughout the United Kingdom (UK) and has been identified as the single most
important problem in dairy herd management in Northern Ireland (AgriSearch Farm Survey).
In addition to the direct financial cost, estimated to be approximately £50 million per annum
in Northern Ireland (or £9000 per farm), infertility can result in increased management
complexity as a result of inability to achieve a compact calving pattern. This is a particular
problem in seasonal production systems where compact block calving is of critical
importance in maximizing milk production from grazed grass.
Österman (2003) showed that cows with a calving interval of 18 months had as high a
production level, articulated as per day milk of calving interval as cows with a 12 months
calving interval and concluded that an expansion of the calving interval would be vindicated.
He also reasoned that an extended calving interval would result in better efficiency of feed
and that a system with an extended calving interval was a less rigorous system with fewer
risk periods for the cow.
Sørensen and Østergaard (2003) analysed the economic consequences of postponed first
insemination of cows in dairy herds with different reproduction management, and to analyse
the sensitivity of the results to a further decrease in beef prices, using a model simulating
production and health in a dairy cattle herd. Three different period-to-first-insemination
scenarios were analysed. Period to first insemination was defined as days post partum for
initiating insemination at observed heat. The three scenarios consisted of a short period to
first insemination (70 days for primiparous and 35 days for older cows), a 70 days postponed
first insemination of primiparous cows and a scenario with 70 days postponed first
23
insemination for all cows. At a 70 days postponed first insemination for primiparous cows a
decrease in annual herd profit of 1% were found. A 70 days postponed first insemination for
all cows led to a decrease in annual herd profit by 3% at good reproductive efficiency and
4% at poor reproductive efficiency. The herd profit was calculated as the profit to cover
labour costs and fixed costs. Postponed inseminations might reduce labour per cow-year. The
reduction in labour per cow-year need to be 3.2 h at good reproductive efficiency and 4.3 h at
poor reproductive efficiency to counterbalance the reduction in herd profit by postponing
first insemination for all cows by 70 days. In a situation with a 50% decrease in beef prices in
a herd constrained by a milk quota (optimising profit per kg milk) herd profit was increased
by 0.8% at good reproductive efficiency and 0.3% at poor reproductive efficiency by
postponing first insemination for all cows by 70 days.
Syed et al. (2003) studied that average peak milk yield, lactation yield, yield per day of
calving interval, lactation length, dry period and calving interval were 10.5+or-0.27 kg,
2004+or-30.13 kg, 4.83+or-0.26 kg, 279+or-2.31 days, 136+or-2.01 days and 415+or-4.04
days, respectively. Peak milk yield (r=0.91; p=0.001) and lactation length (r=0.20; p=0.001)
were positively correlated with lactation yield. First derivative of the regression slope for
peak milk yield, lactation yield and yield per day of calving interval revealed 16.9 kg, 2663
kg and 5.59 kg, respectively to be the optimal limits for higher most economical milk
production. The positive sign of second derivative for lactation yield and yield per day of
calving interval suggested improvement in net profit with increase in lactation yield or yield
per day of calving interval. Better milk production performance of buffaloes was observed in
district Peshawar as compared to that in district Charsadda. Similarly, buffaloes maintained
in farms located in periurban area performed better as compared to those in rural areas.
Longer dry period (196+or-2.1 days) and calving interval (458+or-9.2 days) was found for
buffaloes maintained in district Charsadda than those in district Peshawar (88.4+or-1.4 days
and 391+or-6.9 days, respectively). In urban areas farmers were following 100% stall-
feeding practice, in periurban areas 30.2% and in rural areas only 3.67%. A higher proportion
of the farmers (89.9%) in the rural areas were growing their own fodder as compared to
urban areas (3.55%). Similarly, a higher proportion of the farmers (70.4%) in urban areas
were found to give dry roughages to their buffaloes as compared to farmers in rural areas
(2.10%). A higher proportion of the farms in urban areas were in poor condition (47.3%) as

24
compared to rural areas (16.2%). It was concluded from the study that buffaloes maintained
in farms located in urban and periurban areas had better performance than those in rural
areas. Improvement in peak and lactation yield and growing own fodder crops would
increase profit.
Beever (2004) realized some of the problems associated with inefficiencies in dairy farms
due to which the dairy farms profit margins were eroding. Poor reproductive management led
to very poor fertility in animals that caused many animals to be culled in premature age. At
the same time as culling rate increased, the sub-optimal herd health also increased veterinary
costs, reduction in total production and influence cow permanence. Increased culling
certainly increased the number of heifer replacements required to maintain herd size, adding
further costs.
DeVries (2004) estimated that the delayed replacement was not advantageous under policy
A. Optimal delayed entering of heifer’s increased net returns only for policy B by $1.66 per
slot per year. The small increase for policy B showed that the default prices and seasonality
in cow performance were near the point where optimal delayed replacement was
advantageous over immediate replacement. Delayed replacement resulted in decreases in
both returns and costs per slot per year. Annual cull rate due to delayed replacement was only
0.5% lower.
Groenendaal et al. (2004) described a user-friendly spreadsheet culling model that was
constructed to support economical, optimal breeding and replacement decisions on dairy
farms. The model was based on the marginal net revenue technique. Inputs for the model can
be entered for specific farm conditions, and the output is easily accessible. In the model, the
retention pay-off (RPO) value of individual dairy cows was calculated. The RPO value of a
cow is equal to the total additional profits that a producer can expect from trying to keep the
cow until her optimal age, taking into account the changes of involuntary removal compared
with her immediate replacement. To calculate the RPO values, the future production,
revenues, and costs of dairy cows at different levels of milk production with different
numbers of days open (DO) were determined. Furthermore, the ranges of carcass value, calf
revenues, and the range of involuntary disposal rates of cows within and across lactations
were taken into account. To illustrate the model, parameters in the model were chosen to

25
represent a typical Holstein dairy herd in Pennsylvania. The results of this model are very
comparable with earlier, more complex models that are more difficult to use on the farm. In
addition to using the RPO values to evaluate the decision to breed or replace a cow, the costs
per additional DO were estimated. Early conception was most profitable with the costs per
additional DO varying from $0 to more than $3/d. The model can be used as a decision-
supporting tool for producers, extension personnel, veterinarians, and consultants. In
addition, researchers, economists, and government organizations can use the model to
determine the costs of culling dairy cows in a disease control program.
Anomynous (2005) stated that as calving interval of the animals increased, annual milk yield
decreased and the number of dry days increased. Each extra day of calving interval costs
from £1.30 to £5.00 keeping in view the milk yield and length of extended period. The losses
from low yielding cows as a result of per day of delay were high than high yielding cows.
For prolonged calving intervals to be feasible, animals need to have very constant lactations
that entail very high standards of management. The breakeven point after which further
breeding of individual cows was not valuable, was from 10 months after calving, but depends
on milk yield.
DeVries (2006) studied that the profit of per cow per year had increased from $97 to $337
when the average days open decreased from 166 to 112 days along with pregnancy rates
increased from 9% to 36%. The cost per extra open day varied from $3.19 to $5.41 and
culling rates decreased from 47% to 32%. Heifer purchase cost increased from $2.11 to $7.46
per cow per year for each extra day open. Secondly, changes in milk sales ranged from an
increase of $0.51 to a decrease of $1.24 per extra day open. Cow sales increased from $0.80
to $2.20 per extra day open and calf sales decreased from -$0.43 to -$0.23 per extra day
open. Breeding cost and labor costs were also greater at greater days open. Feed costs varied
with milk sales.
Kafi et al. (2006) estimated that the net cost due to one day of delay in conception for a cow
producing 25 liters of milk in peak lactation was estimated at 40591.98 Rials (4.51 $US)
when conception was delayed from 85 days to 100 days post calving. And this loss increased
to 60120.89 Rials (6.68 $US) per day when conception occurred at 146 days to 175 days post
calving.
26
Seeger (2006) estimated the economic concequences due to non optimal reproductive
performance of a herd. He estimated the extra expenditures and losses in incomes due to this
problem. He used the simultaneous models in order to assess the effects of longer calving
intervals and extra expenses. In the literature, profit loss associated with a one-day increase
of calving interval may vary from negative values till 5 € or 6 $, depending of a large number
of factors. Given the quite absence of external validity of literature estimates, no universal set
of values can here be used. Neverthless, several quite useful recommendations for practice
have been stated from the results of the published studies.
Lee and Kim (2007) investigated the effects of the herd, cow parity, the insemination
protocol and season on the incidence of pregnancy loss (PL) in dairy herds. Furthermore, we
determined the downstream effects of PL on reproductive performance and its economic
impact. The overall incidence rate of PL was 6.9% in 1,001 pregnant cows and its incidence
peaked (p < 0.01) during the second trimester of gestation. GLIMMIX analysis revealed that
cow parity was the important risk factor for the PL. The odds ratio showed that the likelihood
of PL in cows with parities of 1 or 2 was decreased by 0.6 or 0.5 fold compared to the cows
with a parity of 3 or higher. Following PL, the mean rate of endometritis was 23.2% and
endometritis was more common (p < 0.05) when PL occurred during the third trimester than
during the first and second trimesters. The mean culling rate was 46.4% and this did not
differ with the period of PL. The overall mean intervals from PL to the first service and
conception were 63.4 and 101.8 days, respectively. The mean interval from PL to first
service was longer (p < 0.01) for cows with PL during the third trimester than for the cows
with PL during the first and second trimesters. The economic loss resulting from each PL
was estimated at approximately $2,333, and this was largely due to an extended calving
interval and increased culling. These results suggest that cow parity affects the incidence of
PL, which extends calving interval and causes severe economic loss of dairy herds.
Khan et al. (2008) studied the impact of delayed conception on calving interval of the
animal. He stated that as the calving interval increased due to delayed conception, a steady
trend was shown, in the low, moderate and high yielding buffaloes. There was a steady
decline in milk yield per day of calving interval with delayed conception, associated with
lengthend calving interval. An animal that conceive at a later stage of lactation showed a
decline in financial returns by 24% to 27% than those that conceived earlier.

27
Inchaisri et al. (2009) estimated that the economic losses due to non-optimal fertility in an
average reproductive performance cow were €34 per cow per year as compared to the losses
of €231 per cow per year in a good reproductive situation cow. These losses were due to the
decreased production of milk and increased non pregnant cows due to poor reproductive
performance. In the end, conception rates and rates of estrus detection had the greatest effect
on the loss of open days and on the calving interval.
Ansari-Lari (2010) showed that mean (+/-SD) days open, calving interval, and days to first
service for study herds were 134 (+/-89), 403 (+/-86), and 67 (+/-38) days, respectively.
Conception rates at the first service and the overall service-conception rate were 41.6% and
41%, respectively. The level of milk production and diseases had significant negative effects
on days open and service per conception (P < 0.05); statistical analysis showed that for every
100-kg increase in milk yield, days open will increase by about 0.3 days. However, no
significant effect of level of productivity was observed on days to first service. The results of
this study indicate that high milk production is a risk factor for decreasing fertility in Iran,
like many other parts of the world.
Yusuf et al. (2010) studied the effect of repeat breeding in dairy cows, including risk factors
and reproductive performance. He supposed that normal fertility in cows was subjected to
cows that become pregnant with three inseminations. On an average, first artificial
insemination, conception rate, milking days at first artificial insemination, calving to
conception interval and services per conception were 38.3%, 82+/-2 days, 125+/-3 days, and
2.0+/-0.1 times, respectively. In case of normal fertility, cows required 114+/-3 days to
conceive and 1.7+/-0.1 inseminations per pregnancy. While repeat breeders required more
days to conceive (211+/-10) and more numbers of inseminations per pregnancy (4.7+/-0.2).
Analysis showed that 94 days were required to become pregnant after calving for 50% of
normal fertility cows, compared to 155 days for repeat breeders. In case of repeated cows,
31.4, 50.0, and 58.1% of the cows became pregnant within 210, 300, and 435 days after
calving, respectively. In the end, repeat breeder dairy cows had poor reproductive
performance.
All the above studies showed the estimation of the economic losses due to delayed
conception in livestock. However, almost such work has not been done in Pakistan.

28
Therefore, the present study will estimate the economic losses due to delayed conception in
livestock, which will be an important thing regarding Pakistan.

29
CHAPTER 3
METHODOLOGY
A very important and significant thing in conducting any analytical study is to adopt a
systematic and appropriate technique. After formulating the study and specific objectives,
devising an appropriate methodology to conduct and complete the study is very important
step. Data collection, various related values and trends present in any type of data
(quantitative and qualitative) should carefully be applied and practiced. Presentation of data
and dissemination lead to successful completion of study (Akhtar, 1999). This study is based
on primary data collected from the field. In this chapter, the procedure used in drawing the
sample, method of estimation of cost of each input is discussed.
3.1 Selection of the Study Area
The present study involves the economic losses due to delayed conception in dairy animals.
Collection of primary data was done in Gujranwala District. Gujranwala District was selected
as the universe of the study. It is a multi-crop area where wheat, rice, sugarcane and maize
are grown and all types of fodder varieties were cultivated and fed to the animals.
3.1.1 Identification of the Small Farmers having Dairy Animals
Due to shortage of time and constraint of funds it was difficult to include all the dairy
farmers of District Gujranwala. Therefore, the present study was confined to the two tehsils
of District Gujranwala.
Table 3.1: Name of tehsils visited in the survey
Tehsil Name Frequency Percent
Gujranwala 40 50.0
Wazirabad 40 50.0
Total 80 100.0
Table 3.1 shows that two tehsils of district Gujranwala were selected randomly for this
survey. One was Gujranwala and the other Wazirabad. From each tehsil a sample size of 40
respondents was selected. And from each tehsil three villages were selected at random.
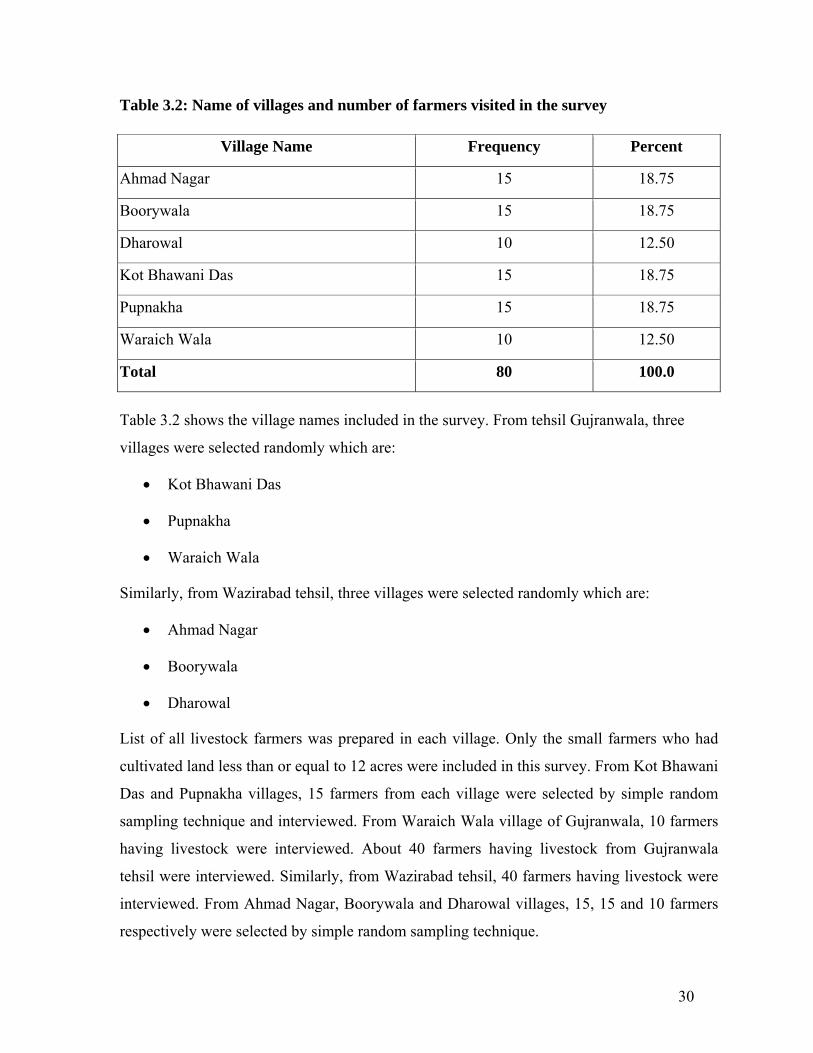
30
Table 3.2: Name of villages and number of farmers visited in the survey
Table 3.2 shows the village names included in the survey. From tehsil Gujranwala, three
villages were selected randomly which are:
Kot Bhawani Das
Pupnakha
Waraich Wala
Similarly, from Wazirabad tehsil, three villages were selected randomly which are:
Ahmad Nagar
Boorywala
Dharowal
List of all livestock farmers was prepared in each village. Only the small farmers who had
cultivated land less than or equal to 12 acres were included in this survey. From Kot Bhawani
Das and Pupnakha villages, 15 farmers from each village were selected by simple random
sampling technique and interviewed. From Waraich Wala village of Gujranwala, 10 farmers
having livestock were interviewed. About 40 farmers having livestock from Gujranwala
tehsil were interviewed. Similarly, from Wazirabad tehsil, 40 farmers having livestock were
interviewed. From Ahmad Nagar, Boorywala and Dharowal villages, 15, 15 and 10 farmers
respectively were selected by simple random sampling technique.
Village Name Frequency Percent
Ahmad Nagar 15 18.75
Boorywala 15 18.75
Dharowal 10 12.50
Kot Bhawani Das 15 18.75
Pupnakha 15 18.75
Waraich Wala 10 12.50
Total 80 100.0

31
Data were collected through a farm level survey of the target area using a pre-tested
questionnaire. The information about all the management practices was included in the
schedule. Such information like land use, involvement of labor employed and variable costs
associated with dairy production were the part of questionnaire.
3.2 Socio Economic Characteristics
Socio Economic Characteristics determine the status of an individual. These socio economic
characteristics may be very useful to enhance the incomes of different crops and livestock.
For the purpose of the present study, following socio economic indicators were used:
3.2.1 Land Holding
It means total area on which a farmer performs various operations in order to get income.
Dairy farmers were categorized on the basis of their land holding. The criteria used for this
were only the small farmers who had their land less than or equal to 12 acres.
3.2.2 Herd Size
Herd size indicates the number of milk animals kept by the dairy farmer. It is one of the most
important indicators, as size of the herd affects the nature of dairy business by changing the
scale of enterprise.
3.2.3 Milch Animals
Buffaloes and cows were the main milch animals in the study area. Although goat and sheep
were also present in that area but their representation in the incomes of the dairy farmers was
negligible. So, onlys cow and buffaloes were considered as milch animals in this study.
3.2.4 Age of the Farmer
It plays a significant role on the extent and efficiency of farmer’s participation in different
farm and nonfarm activities. In the present study the age was counted by the year.
3.2.5 Educational Status
Education is considered as one of the most important indicator which affects knowledge,
attitude and prestige of an individual. By using their knowledge, farmers can significantly
32
increase the profitability of crops and livestock. In the present study, education means years
that have been spent in school or college for the acquisition of knowledge.
3.2.6 Farming Experience
It is also an important factor, which has an impact on the farm production and profitability. It
tells us how wisely the resources are being utilized by the farmers on the basis of their past
experience. This factor is also important in relation to the productivity and profitability of the
farm.
3.2.7 Household Size
The labor which is involved in performing different farming operations is mostly taken from
the farmer’s family. Therefore, household size of the respondents has also considerable
impact on the income of the farmers.
3.3 Estimation of Dairy Farm Costs
Milk production costs have been estimated by multiplying the quantity of inputs with the
field prices of the inputs. Main costs incurred in milk production were labor cost, feed
(fodder + concentrate) cost, veterinary care cost and breeding cost. Total variable cost was
calculated by using the following formula
Total variable cost = Labor cost + Feed cost + Veterinary care cost + Breeding cost
Total expenditures on raising animals consisted of fixed and variable costs. Fixed costs
included interest and depreciation on the value of the animals, sheds and equipments.
Variable costs consisted of cost of green and dry fodders, concentrates, breeding, veterinary
care and labor. The procedure adopted to calculate the costs, their income and source and the
statistical techniques applied to obtain the end results were discussed as follows.
3.3.1 Fixed Costs
Fixed costs are those that do not change with the level of sales. If sales increase or decrease
but nothing else changes then fixed costs remain the same. Fixed costs included interest rate
and depreciation on the value of the animals, sheds and equipments.

33
(a) Interest and Depreciation on Capital
Interest and depreciation on the value of milch animals was as follows. Depreciation charges
for milch animals were arrived at by taking the difference in their values at the beginning and
that at the end of the year. Depreciation charges at the rate of 5.5% on the average value of
the animal during the milking period were estimated. Interest charge at 6% on the maximum
or minimum price of the animals was estimated (Ahmed, 1982). Thus, the depreciation and
interest charge on the capital were excluded in this study due to their equality according to
above reference and due to the respondents being small farmers. These fixed costs were not
included in this study because all the farmers were small and they had no well equipped
farms.
3.3.2 Variable Costs
Costs that change in proportion to sales are variable costs. Variable costs consisted of cost of
green and dry fodders, concentrates, breeding, labor, etc.
(a) Labor Cost
Labor cost was included as family labor cost and permanent hired labor cost in that area.
These costs were further divided on gender basis. For family labor, opportunity cost of
family labor was taken as equal to the earning of a permanent hired labor. While, for
permanent hired labor, the actual payment in cash and kind was taken. Per day labor cost for
adult animals and young stock was calculated by:
Per day labor cost = total labor cost during a year / 365 days
Per day labor cost for adults = per day labor cost * 65 /100
Per day labor cost for young stocks = per day labor cost * 30 /100
Per day labor cost per adult animal = per day labor cost for adults / No. of adult animals
Per day labor cost per young stock = per day labor cost for young stocks / No. of young
stocks
There are a 65: 30 ratios in lactating animals and young stock according to the utilization of
total expenses. Generally, 65% of the feed costs for a dairy herd that raises it own
replacements will be for the lactating animals, 30% for the heifers, and 5% for the dry
animals. We suggest using the market value for homegrown feeds fed to livestock. Feed
34
harvested by the lactating animals or heifers from pasture can be valued based on the value of
hay. Using the market value will help give a clearer picture of the competitiveness of the
dairy enterprise (Shoemaker et al. 2008).
(b) Fodder Cost
Feed costs included the cost of green fodders, dry fodders, concentrates, etc. Total fodder
cost per animal was calculated after determining the green fodder and dry fodder costs for the
following periods
Abundant period (maximum availability of green and dry fodder)
Scarcity period (less availability of the green and dry fodder)
Dry period (minimum availability of green and dry fodder)
Total quantities of green fodder and dry fodder were calculated for the abundant, scarcity and
dry period and multiplied by the price of that quantity with abundant season fodder
(Barseem) and dry season fodder (Sorghum). In the dry period the average of two prices was
used because the dry period included two dry months from each period Rabi and Kharif. Per
day prices of green fodder and dry fodder for abundant, scarcity and dry period were
multiplied by the lactation length to get total green fodder and dry fodder costs in abundant,
scarcity and dry period for the whole lactation length for milk yielding buffalo and cow. To
get the total fodder and forage cost for milk yielding buffalo and cow the costs of green
fodder and dry fodder in abundant, scarcity and dry period were accumulated.
Per day fodder cost = total fodder cost during a year / 365 days
Per day fodder cost for adults = per day fodder cost * 65 /100
Per day fodder cost for young stocks = per day fodder cost * 30 / 100
Per day fodder cost per adult animal = per day fodder cost for adults / No. of adult animals
Per day fodder cost per young stock = per day fodder cost for young stocks / No. of young
stock.

35
(c) Concentrate Feeding Cost
It included the value of concentrates given to milk animals. Concentrate feeding cost was
calculated by adding the value of following concentrates given to dairy animals:
Oil Seed Cake, Choker, Vanda, Wheat Grains, Gur, Salt and Oil.
Quantity of concentrate feeding for each factor was calculated on daily basis. Then it was
multiplied with 30 to calculate the quantity for whole month. Then it was multiplied with
number of months for which concentrate was fed to dairy animals to calculate the total
quantity of concentrate given. Total cost of concentrate feeding was calculated by
multiplying the total quantity of each concentrate with its value. Similarly above formulas
were used to calculate the per day concentrate feeding cost for adult wet animals only.
(d) Veterinary Care Cost
Veterinary cost incurred per milch animal consisted of following costs.
Vaccination cost
Treatment cost
Total annual veterinary cost was calculated as:
Total Veterinary care cost = (Vaccinations / Doses * Unit price) + (Treatment numbers *
Unit price) + Veterinarian fees
Per day veterinary cost was calculated as:
Per day veterinary care cost = Total veterinary cost per year / 365 days
Per day veterinary care cost for adults = per veterinary care cost * 65 /100
Per day veterinary care cost for young stock = per day veterinary care cost * 30 / 100
Per day veterinary care cost per adult animal = per day veterinary care cost for adults / No. of
adult animals
Per day veterinary care cost per young stock = per day veterinary care cost for young stock /
No. of young stock.

36
(e) Breeding Cost
Breeding Cost consists of payments made while practicing the natural or artificial breeding
of animals.
Breeding cost in cows was calculated as:
(Total services per conception in heifers * charges per service) + (Total services per
conception in adults * charges per service)
Similarly, breeding cost in buffaloes was calculated as:
(Total services per conception in heifers * charges per service) + (Total services per
conception in adults * charges per service)
Total Breeding Cost = Breeding cost in cows + Breeding cost in buffaloes
3.4 Estimation of Milk Production
The total milk production was calculated for the whole lactation length of milking animals
(buffaloes and cows).
Milk productivity of each animal was calculated as:
Milk productivity in 1st quarter of lactation length
Milk productivity in the 2nd quarter of lactation length
Milk productivity in the 3rd quarter of lactation length
Milk productivity in the 4th quarter of lactation length
To calculate the total milk production for the whole lactation length, daily milk yield in each
quarter was converted into month’s yield in each quarter and milk productivities for each
quarter were added up to get milk production for the whole lactation length for dairy animals.
The milk income was calculated as:
Income from cow milk = Daily production * Price per kg * No. of milking months
Income from buffalo milk = Daily production * Price per kg * No. of milking months
Total milk income = Income from cow milk + Income from buffalo milk

37
3.5 Cost of Milk Production
Cost of milk production per liter was calculated by using the following formula:
Cost of milk per kg = Total variable cost / Total milk production per year
Maqsood (1993) also calculated the per liter cost of milk according to the above mentioned
method.
3.6 Marketable Surplus
Marketable surplus is the quantity of milk produced which is available for sale by dairy
farmers after meeting their household needs. It affects the income of a dairy enterprise by
changing the amount of revenue generated from the sale of milk. Marketable surplus of a
dairy farm could be calculated as:
Marketable surplus = Quantity of milk produced – Quantity of milk consumed at home
3.7 Gross Income from Livestock
Gross income of each farmer was calculated by multiplying the total production of milk
during the whole lactation length with the existing milk prices.
Gross livestock income = (Total income from milk) + (Income from the sale and purchase of
the animals)
3.8 Gross Income from Crops
Gross income from each crop was determined by the following procedure:
Gross income = Total production of each crop * Price of one unit of output
Fodder and by product incomes were not included in the gross income of the crops because
these were used by the animals of the farmers and were included as the expenditures of the
feed cost of the animals.
3.9 Gross Farm Income
It is the sum of the gross income from crops and gross income from livestock
Farm income = Crop income + Livestock income

38
3.10 Share of livestock income in the total farm income
Share of livestock income in the total farm income was calculated as:
Share of livestock income = (gross livestock income / gross farm income) * 100
Regression analysis was applied to find out the impact of different factors causing variation
in the farm income due to livestock income.
3.11 Estimation of factors causing variation in livestock income of the
farmers
Regression analysis was applied to find the impact of different factors causing variation in
dairy incomes of the farmers was calculated by using following equations:
Model:
LnY = f (LnX1, LnX2, LnX3, LnX4, LnX5)
LnY = f (Ln feed cost, ln breed cost, Ln labor cost, Ln veterinary cost, Ln milk yield)
LnY = δo + δ1 LnX1 + δ2 LnX2 + δ3 LnX3 + δ4 LnX4 + δ5 LnX5
Where:
Dependent Variable
LnY = Natural logarithm of the livestock income of the respondents (Rs.)
Independent Variables
Ln(X1) = Natural logarithm of feeding cost
Ln(X2) = Natural logarithm of breeding cost
Ln(X3) = Natural logarithm of labor cost
Ln(X4) = Natural logarithm of veterinart cost
Ln(X5) = Natural logarithm of milk yield

39
3.12 Estimation of the Losses due to Delayed Conception
Delayed conception is defined as an interval of more than 90 days postpartum before a cow
or buffalo becomes pregnant again. Delayed conception is a common problem in heifers and
lactating animals in Pakistan due to several reasons.
3.12.1 Voluntary waiting period
In this study, only those animals are selected whose conception is delayed, those who have
got conceived after a number of services per conception after their voluntary waiting period
of 90 days after parturation. The aim of the study is to calculate the economic losses due to
delayed conception in dairy animals. For lactating animals, a voluntary waiting period of 90
days after postpartum is defined as the base line which is a reasonable index for
reproductivity. The lactating animals should normally get conceived in this time frame after
parturation. This time frame is known as the voluntary waiting period.
3.12.2 Age of Maturity
Age of maturity is a very important parameter of reproductive efficiency in heifers. Different
studies have been done in this perspective. (Kumar, 2004) studied about the age of maturity
in cows and buffaloes. He found that, the age of maturity in cows was 20 months and in
buffaloes it was 24 months of age which seems a bit on lower side. Thereforw, in this study,
as reportedly some workers age of maturity for cows has been considered as 30 months and
36 months for buffaloes due to our local environmental conditions.
3.12.3 Number of Days Delayed
Numbers of days delayed in heifers was counted from the age of maturity. First of all, the age
of the heifer at the time of first heat sign was noted and then the month in which first service
was done and then month of conception was noted after services per conception. In this way,
the number of days delayed were counted in heifers. Similarly, in case of lactating animals,
first heat sign after the voluntary waiting period was noted along with month in which first
service was done. And then the month of conception was noted after services per conception
having taken place after every 21 days.

40
3.12.4 Extra Feed Cost
The feeding system for lactating animals and heifers is based on the information provided by
the farmers on daily basis according to 65:30% shares in the overall feeding cost associated
with the animals as discussed earlier. The extra feed cost due to delay in conception was
calculated as:
Extra feed cost = Number of days delayed * per day feeding cost of the animal
3.12.5 Value of Milk Loss
When calving to conception period extends beyond 90 days, lactation period also extends.
The average extension has been recorded to be 0.7 of a day per day (Pasman, 1994). It is also
to be noted that due to extension in calving interval, the current milk yield period also
extends but the overall milk yield declines due to the delay in the initiation of the next
lactation (Kafi et al, 2007).
Milk price used was according to the information given by the farmers regarding per kg milk
price in their area. The milk loss due to delay in conception of animals was calculated by the
following formula.
Milk loss (kg) = (minimum milk yield + maximum milk yield) / 2
This milk loss varied according to the health and feeding conditions of the animals. The
quantity of milk lost was then multiplied by the milk price and number of days delayed in
order to get the value of milk loss.
Value of milk loss = Quantity of milk lost (kg) * Unit milk price * Days delayed
3.12.6 Extra Labor Cost
Extra labor cost in heifers and lactating animals due to delayed conception was calculated as:
Extra labor cost in heifers = Number of days delayed * per day labor cost per heifer
Extra labor cost in adult animals = Number of days delayed * per day labor cost per adult
animal
3.12.7 Extra Treatment Cost
Extra treatment cost in heifers and lactating animals was calculated as:
Extra Treatment Cost = Number of days delayed * per day treatment cost of the animal

41
3.12.8 Extra Breeding Cost
Extra breeding cost in heifers and lactating animals was calculated as:
Extra breeding cost = Number of services per conception * Price per service
3.12.9 Value of calf loss
The value of calf loss due to delayed conception was calculated as:
Value of calf loss = (calf birth weight + 300-400 gm weight gain per day * number of days
delayed) * Market price of beef.
3.12.10 Total Loss due to Delayed Conception
Total loss due to delayed conception was calculated as:
Total Loss = Extra feed cost + Extra labor cost + Extra treatment cost + Extra breeding cost +
Value of milk loss + Value of calf loss
3.12.11 Per Day Loss due to Delayed Conception
Per day loss = Total loss / Number of days delayed
An unplanned involuntary culling of the animals due to conception failure was not included
in present calculations.

42
CHAPTER 4
RESULTS AND DISCUSSION Analysis and interpretation of data are the most significant steps in any scientific research.
Without these steps generality and predictions can not be made which is the objective of the
research. The broad objectives of this study were to estimate the economic losses due to
delayed conception in dairy animals. In this chapter an effort has been made to discuss,
analyze and deduce relavent results in order to draw conclusions and devise suitable
suggestions in the field of study. If adopted the suggestions, may be helpful in improving the
reproductive performance of the animals in the universe of this study.
4.1 Socio-Economic Characteristics
4.1.1 Relationship between farming experience and DCAs of the farmers
Table 4.1 shows relationship between farming experience and total animals that had delayed
conceptions (DCA). The respondents having farming experience of up to 10 years, they had
40% of the delayed conception animals (DCA). Those with 11-20 years of farming
experience had 22.63% of delayed conception animals (DCA). Farmers with 21-30 years of
farming experience possessed 18.95% of DCA. Similarly, farmers with more than 30 years of
farming experience had 18.42% of DCA. This table shows that as the farming experience of
the respondents increases, the percentage of the DCA proportionately decreases. Since
experience of keeping dairy animals has a proven effect on the reproductive performance of
their animals, especially in enhancing the conception rate of their buffaloes and cows.
Table 4.1: Distribution of the respondents according to their farming experience
Farming Experience No. of farmers (%) %age of animals delayed
Up to 10 years 45.0 40.00
11-20 years 17.5 22.63
21-30 years 20.0 18.95
More than 30 years 17.5 18.42
Total 100.0 100.0

43
4.1.2 Relationship between age and DCAs of the farmers
Table 4.2 shows the association of the age of the respondents with the percent of DCA in
each age group. In age group of 21-30 years, 34.22% of the animals had delayed conception.
With more than 50 years old farmers, the percentage of DCA’s reduced to only 11.58. Since
advancing age helps gain more experience thus the farmers can better take care of their
animals, including the overall reproductive performance as well.
Table 4.2: Distribution of the respondents according to their age
Age No. of farmers (%) %age of animals delayed
21-30 years 13.75 34.22
31-40 years 21.25 22.10
41-50 years 32.50 32.10
More than 50 years 32.50 11.58
Total 100.0 100.0
4.1.3 Relationship between education level and DCAs of the farmers
Table 4.3 shows that education of farmers does have favourable effect on improving
conception rate of their dairy animals. About one-fourth of the animals had delayed
conception when their owners had no education, whereas the percentage of such animals was
reduced to 13.68 due to their owners who were educated to intermediate level.
Table 4.3: Distribution of the respondent according to their education level
Education Level No. of farmers (%) %age of animals delayed
Illiterate 25.0 23.68
Primary 18.75 21.60
Middle 20.0 19.47
Matriculation 21.25 21.57
F.A 15.0 13.68
Total 100.0 100.0

44
4.1.4 Relationship between occupation and DCAs of the farmers
Table 4.4 indicates wether the respondents are involved full time in farming or they devote
some time to other occupations. When full time is devoted to farming, certainly the
reproductive performance of such animals would be much better. 90% of the respondents
were devoting their time only in farming which was their major occupation also and they had
85.8% of the DCAs. 6.3% of the respondents were engaged in their jobs as well as in
farming. 3.7% of the respondents were engaged in the business like having shops in the
village and also spending their time in farming activities also.
Table 4.4: Distribution of the respondents according to their major occupation
Occupation No. of farmers (%) %age of animals delayed
Farming 90.0 85.8
Farming + Shopkeeper 3.7 4.2
Farming + Job 6.3 10.0
Total 100.0 100.0
4.1.5 Relationship between working time hours and DCAs of the farmers
Table 4.5 shows about the number of working hours spent in fields by the respondents.
88.75% of the respondents were spending 6-10 hours in their fields and they had 91.05% of
the DCAs. 7.5% of the respondents spent up to 5 hours in their farming activities and had
5.79% of the DCAs.
Table 4.5: Distribution of the respondents according to their working time hours in
farming
Working Time No. of farmers (%) %age of animals delayed
Up to 5 hrs 7.50 5.79
6-10 hrs 88.75 91.05
11-15 hrs 3.75 3.16
Total 80 100.0

45
While only 3.75% of the respondents were spending 11-15 hours in their fields having 3.16%
of the DCAs. Most of the respondents were spending 6-10 hours in agricultural activities.
4.1.6 Relationship between family size and DCAs of the farmers
Table 4.6 shows about the family size of the respondent. 32.5% of the respondents had their
family size of 5-10 members and they had 12.10% of the DCAs which is the least one. As the
family size increases, the percentage of DCAs also proportionately increases. With lesser
number of family members they can better take care of their animals including the overall
reproductive performance as well. With more than 15 family members, the percentage of
DCAs increased to 52.64.
Table 4.6: Distribution of the respondents according to their family size
Family Size No. of farmers (%) %age of animals delayed
5-10 32.5 12.10
11-15 55.0 35.26
More than 15 12.5 52.64
Total 100.0 100.0
4.2 Farm Size and Income
Table 4.7 shows the minimum and maximum farm size of the respondents. The minimum
area of the respondent was 0.5 acres while maximum farm size area was 12 acres. The mean
farm size area of the overall farmers was approximate 7 acres. Table 4.7 also shows the
descriptive statistics of the gross crop income of the respondents per year. All the
respondents had mean gross farm income Rs.412452 per year. The minimum gross farm
income earned by the farmer was Rs. 28000 and maximum gross income earned from crops
was Rs. 891000 per year.
Table 4.7: Farm size and total crop income of the respondents
Farm Size and income Minimum Maximum Mean Std. Deviation
Farm Size (acres) .50 12 7.0 3.60
Per Year Crop Income (Rs.) 28000 891000 412452 257048.15

46
4.2.1 Cultivated area of the respondents
Table 4.8 indicates that as the cultivated area increases, the number of DCAs also increases
proportionately. When cultivated area was up to 4 acres, the percentage of DCAs was only
8.95, which showed that farmers with small piece of land can better take care of their animals
regarding conception as well as reproductive management. While on the other hand, 48.95%
of the DCAs were in the group of 9-12 acres of cultivated land.
Table 4.8: Total Cultivated Area of the Respondent
Farm Area (acres) No. of farmers (%) %age of animals delayed
1-4 13.8 8.95
5-8 40.0 42.10
9-12 46.3 48.95
Total 80 100.0
4.3 Share of various crops in Farm Income
Table 4.9 shows about the crops sown by the farmers in that area and their share in total
cultivated area and total farm income. The mean area sown by the rice crop was 5.419 acres
which had a share of 73.81% in the total cultivated area of the farmer. The mean per acre
output of the rice was 38.30 monds in that area having price of Rs.1015.62 per mond of the
output. Mean output of rice of the farmers in that area was 213.437 monds. The share of rice
crop income in the total farm income was 30.03%. In case of Rabi and Kharif Fodder, the
mean area under rabi and kharif fodder was 1.3594 and 1.3656 acres of the farmer having
24.31% and 24.36% of share in the total cultivated area. The mean per acre output of the rabi
and kharif fodder was 633.87 and 602.12 monds having price of Rs.52 and Rs.63.25 per
mond of the output. Mean output of rabi and kharif fodder was 855.63 and 819.87 monds.
The share of both Rabi and kharif fodder in the farm income is missing in the table because
fodder revenue is not included in the farm income due to its use for the animals which is a
cost at the part of livestock. There is a significant difference in the prices of the Rabi and
kharif fodders because in kharif season there is the shortage of fodder due to which the prices
of the fodder goes up while in Rabi season abundant quantity of fodder is available. In case

47
of wheat crop, the mean area cultivated was 5.419 acres having 73.44% of share in the total
cultivated area. Mean per acre output of wheat was 35.11 monds with mean price per mond
of Rs.903.62. The mean output of wheat of the farmers was 190.45 monds. Share of wheat in
the total farm income was 21.73%. For sugarcane crop, the mean area cultivated was 0.18
acres with 1.83% of share in the total cultivated area. Per acre output of sugarcane was
101.25 monds with a price of Rs.32.50 per mond. Share of sugarcane in total farm income
was 2.30%. Similarly, the case for other crops is also shown in the table below.
Table 4.9: Cropping Pattern and Farm Income
Crops Mean
area
(acres)
Share in
total
area (%)
Per acre
output
(monds)
Output
(monds)
Price per
mond (Rs.)
Share in
total farm
income (%)
Kh
arif
C
rop
s Rice 5.419 73.81 38.30 213.44 1015.62 30.03
Fodder 1.3656 24.36 602.12 819.87 63.25 -
Rab
i C
rop
s Wheat 5.419 73.44 35.11 190.45 903.62 21.73
Sugarcane 1.12 11.32 623.1 684.62 200 14.1
Fodder 1.3594 24.31 633.87 855.63 52 -
Other .044 0.42 3.75 6.25 7.50 0.25
4.4 Livestock Situation
4.4.1 Adult cows
Table 4.10 shows that out of 80 respondents, 56 respondents had adult cows in their herds.
25% of the respondents had two cows in their herd. 23.2% of the respondents had three cows
in their herds. 21.4% of the respondents had 4 cows in their herds. 12.5% of the respondents
had only one cow in their herds. 7.1% of the respondents had five cows. 5.4% of the
respondents had six cows. 1.8% of the respondents had seven cows and 3.6% of the
respondents had nine cows in their herds in the study area. Overall, 70% of the respondents
had cows in their herds.

48
Table 4.10: Total Number of Adult Cows
No. of Adult Cows No. of farmers Percentage
1 7 12.5
2 14 25.0
3 13 23.2
4 12 21.4
5 4 7.1
6 3 5.4
7 1 1.8
9 2 3.6
Total 56 100.0
4.4.2 Cow heifers
Table 4.11 shows that out of 80 respondents, only 29 respondents had female cow heifers at
their farm. Further, 75.9% of the respondents had only one female cow heifer in their herds.
13.8% of the respondents had two female cow heifers. 6.9% of the respondents had three cow
heifers and 3.4% of the respondents had five female cow heifers in their herds in theat study
area. Overall, 36.25% of the respondents had female cow heifers in their herds.
Table 4.11: Total Number of Cow Heifers
No. of Cow Heifers No. of farmers Percentage
1 22 75.9
2 4 13.8
3 2 6.9
5 1 3.4
Total 29 100.0
4.4.3 Adult buffaloes
Table 4.12 shows that out of 80 respondents, all the respondents had buffaloas in their herd.
21.3% of the respondents had only one buffalo in their herd. 17.5% of the respondents had
three buffaloas in their herd at that time. 15% of the respondents had two buffaloas, 11.3% of
the respondents had four and five number of buffaloas each, 10% of the respondents had six
buffaloas in their herd. Similarly, 7.5%, 2.5% and 3.9% of the respondents had 7,8 and 9
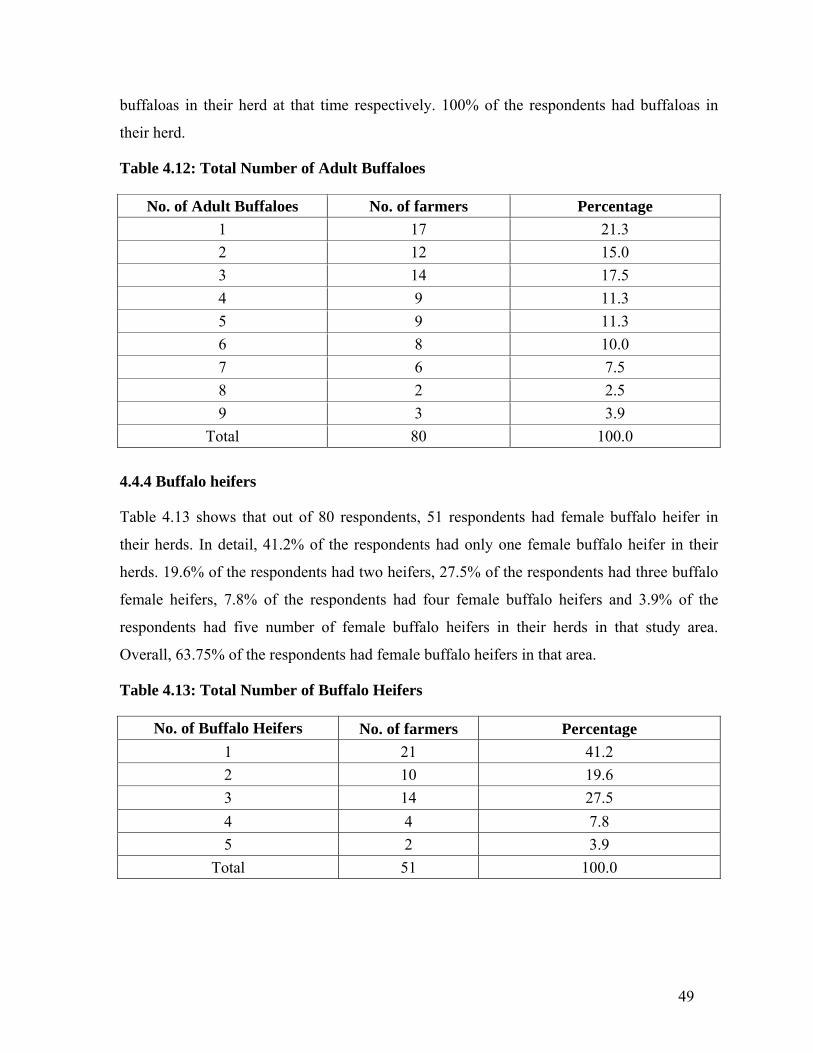
49
buffaloas in their herd at that time respectively. 100% of the respondents had buffaloas in
their herd.
Table 4.12: Total Number of Adult Buffaloes
No. of Adult Buffaloes No. of farmers Percentage
1 17 21.3
2 12 15.0
3 14 17.5
4 9 11.3
5 9 11.3
6 8 10.0
7 6 7.5
8 2 2.5
9 3 3.9
Total 80 100.0
4.4.4 Buffalo heifers
Table 4.13 shows that out of 80 respondents, 51 respondents had female buffalo heifer in
their herds. In detail, 41.2% of the respondents had only one female buffalo heifer in their
herds. 19.6% of the respondents had two heifers, 27.5% of the respondents had three buffalo
female heifers, 7.8% of the respondents had four female buffalo heifers and 3.9% of the
respondents had five number of female buffalo heifers in their herds in that study area.
Overall, 63.75% of the respondents had female buffalo heifers in that area.
Table 4.13: Total Number of Buffalo Heifers
No. of Buffalo Heifers No. of farmers Percentage
1 21 41.2
2 10 19.6
3 14 27.5
4 4 7.8
5 2 3.9
Total 51 100.0

50
Table 4.14: Sale and Purchase of Animals during the Last Year (Rs.)
Sale and Purchase of Animals (Rs.) Mean Std. Deviation
Sale and Purchase of the Animals 91490.91 79991.926
Table 4.14 shows the descriptive statistics of the sale and purchase of the animals of the
respondents during the last year. 68.75% of the respondents were involved in the sale and
purchase of the animals. The minimum value of the sale and purchase of the animals is -
81000 Rs. which shows that there were only purchases of the respondent occurred in the last
year. The maximum value of the sale and purchase of the animals was Rs. 310000 which
shows that sales of the animals were greater than purchases in the last year. The mean value
of the sale and purchase of the animals during the last year by the respondents was Rs.
91490.91 out of 80 respondents, 55 of the respondents sold and purchased animals during last
year which were 68.75% of all the respondents.
4.5 Labor used in Livestock production
Table 4.15 shows the composition of labor used for keeping livestock. There were two types
of labor used found in the area. Most people had their family labor engaged in livestock
raising. Of 80 respondents, 52 were using their family labor for the purpose, which were 65%
of the overall respondents. The mean number of family labor used for livestock was 1.08
persons. The mean family labor hours spent for managing livestock were 8.79 hours per day
with mean family wage rate of Rs. 170.83 per day in the study area. The mean family annual
labor cost paid by the respondents was Rs. 66576.92. Similarly, of 80 respondents, 32 were
using hired labor in livestock raising, which were 40% of the respondents in the area. The
mean number of hired labor used for livestock was 1.03 persons. The mean hired labor hours
spent for the purpose were 11.66 hours per day with mean hired labor wage rate of Rs.175
per day. The mean hired annual labor cost incurred by the respondent was Rs. 64875. The
mean per day labor cost for adult animals was Rs.35.20 per animal. Similarly, per day labor
cost for young stock was Rs.20.08 per animal in that area.

51
Table 4.15: Discriptive statistics of composition of labor used in livestock
Composition of Labor Min Max Mean Std. Dev. F
amil
y L
abor
Farmers having family labor 1 3 1.08 0.33
Family labor hours per day 4 13 8.79 2.5
Family labor wage per month (Rs.) 4000 6000 5125 803.6
Family labor wage per day (Rs.) 133.33 200 170.83 26.78
Family labor cost per year (Rs.) 24000 198000 66577 25100
Hir
ed L
abor
Farmers having hired labor 1 2 1.03 0.20
Hired labor hours per day 10 14 11.66 1.3
Hired labor wage per month (Rs.) 4000 7000 5250 783
Hired labor wage per day (Rs.) 133.33 233.33 175 26.1
Hired labor cost per year (Rs.) 48000 120000 64875 13753.1
Per day labor cost for adults 9 100 35.20 18.8
Per day labor cost for young stock 5 60 20.08 11.3
4.6 Variable Costs in Animal Rearing
Table 4.16 shows the different costs associated with livestock raising. First, the animals
feeding cost is shown in the table. Minimum annual feeding cost was Rs. 42400, while the
maximum feeding cost was Rs. 504300. The mean annual feeding cost was Rs. 240131. This
was the total cost incurred by the farmer during whole the year for keeping livestock. Mean
per day per animal feeding cost for the adult animals was Rs. 104. Similarly, per day per
animal mean feeding cost for young stock was Rs. 48. The mean veterinary care cost
incurred by the farmer for raising livestock for whole the year was Rs. 19330. Per day mean
veterinary care cost associated with adult animals was Rs. 7.71, while the same for young
stock was Rs. 3.50. Finally, mean annual breeding cost paid by the farmers was Rs. 2073.

52
Table 4.16: Discriptive statistics of animal’s feeding, veterinary care and breeding costs
Costs (Rs.) Minimum Maximum Mean Std. Dev.
Per day feeding cost for adults 70 173 104 20.153
Per day feeding cost for young stock 0 100 48 27.642
Total animal feeding cost per year 42400 504300 240131 119959.621
Per day veterinary cost for adults 2 23 7.71 3.953
Per day veterinary cost for young stock 0 15 3.50 2.801
Total veterinary care cost per year 2400 60000 19330 15755.585
Total breeding cost per year 400 7200 2073 1317.984
4.7 Compostion of Dairy Animals at the Farm
Table 4.17 shows the status of the respondent regarding dairy animals. Fifty-six of the
respondents had cows as given in the table below. The mean numbers of cows which a
farmer had were 3.30 cows. Fifty-two of the respondents had wet cows, which were 92.85%
of the cows. The mean number of wet cows kept by the farmers were 1.34 cows. In case of
dry cows, 26.78% of the respondents had dry cows in their herds. The mean number of dry
cows present in farmer’s herd were 1.20 cows. The mean number of cow young stock kept by
the farmer was 1.93, while mean number of cow sucklers kept by the farmer was 1.25.
Similarly, 100% of the respondents had buffaloes in their herds. The mean number of
buffaloas kept by the respondents in their herd was 6.99. All of the respondents had wet
buffaloes in their herd in the area. The mean number of wet buffaloas kept by the farmer was
2.85, which were the main source of income and home milk consumption of the respondents.
In case of dry buffaloes, 47.5% of the respondents had dry buffaloes in their herds. The
mean number of dry buffaloas of the respondent was 1.61. The mean number of buffalo
young stock kept by the farmer for raising purpose was 2.78, while mean number of buffalo
sucklers kept by the respondent in their herd in the area was 2.41.
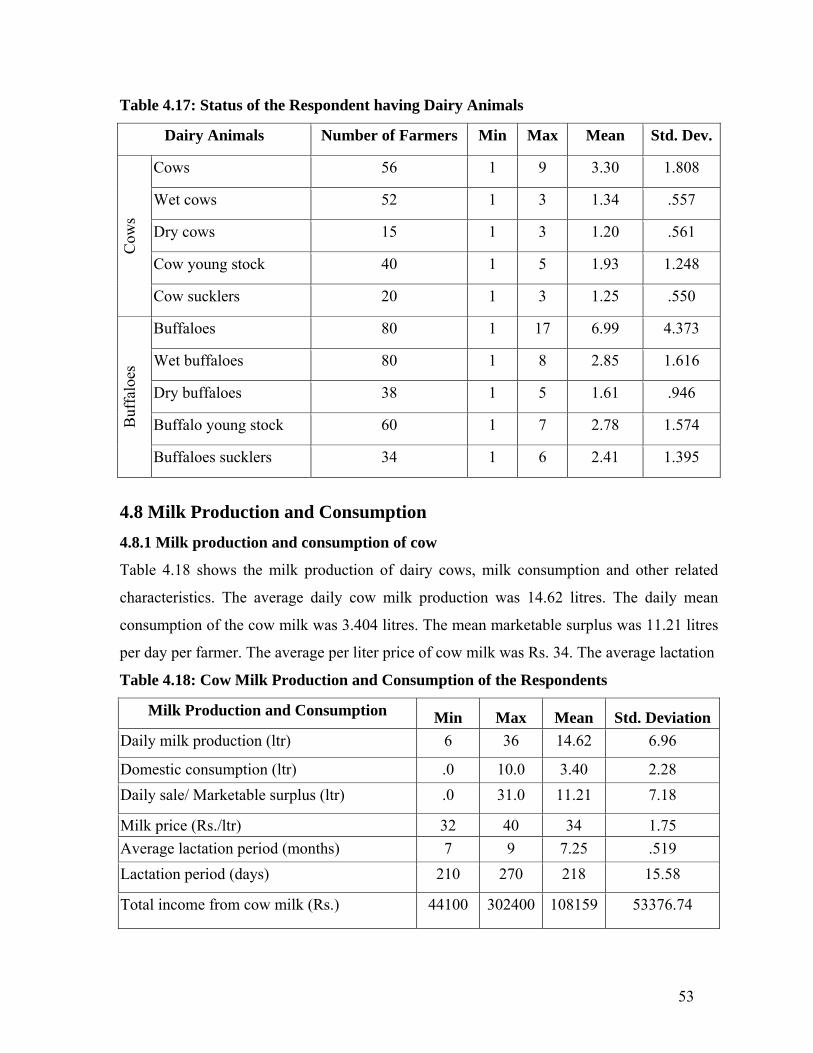
53
Table 4.17: Status of the Respondent having Dairy Animals
Dairy Animals Number of Farmers Min Max Mean Std. Dev.C
ows
Cows 56 1 9 3.30 1.808
Wet cows 52 1 3 1.34 .557
Dry cows 15 1 3 1.20 .561
Cow young stock 40 1 5 1.93 1.248
Cow sucklers 20 1 3 1.25 .550
Buf
falo
es
Buffaloes 80 1 17 6.99 4.373
Wet buffaloes 80 1 8 2.85 1.616
Dry buffaloes 38 1 5 1.61 .946
Buffalo young stock 60 1 7 2.78 1.574
Buffaloes sucklers 34 1 6 2.41 1.395
4.8 Milk Production and Consumption
4.8.1 Milk production and consumption of cow
Table 4.18 shows the milk production of dairy cows, milk consumption and other related
characteristics. The average daily cow milk production was 14.62 litres. The daily mean
consumption of the cow milk was 3.404 litres. The mean marketable surplus was 11.21 litres
per day per farmer. The average per liter price of cow milk was Rs. 34. The average lactation
Table 4.18: Cow Milk Production and Consumption of the Respondents
Milk Production and Consumption Min Max Mean Std. Deviation
Daily milk production (ltr) 6 36 14.62 6.96
Domestic consumption (ltr) .0 10.0 3.40 2.28
Daily sale/ Marketable surplus (ltr) .0 31.0 11.21 7.18
Milk price (Rs./ltr) 32 40 34 1.75
Average lactation period (months) 7 9 7.25 .519
Lactation period (days) 210 270 218 15.58
Total income from cow milk (Rs.) 44100 302400 108159 53376.74
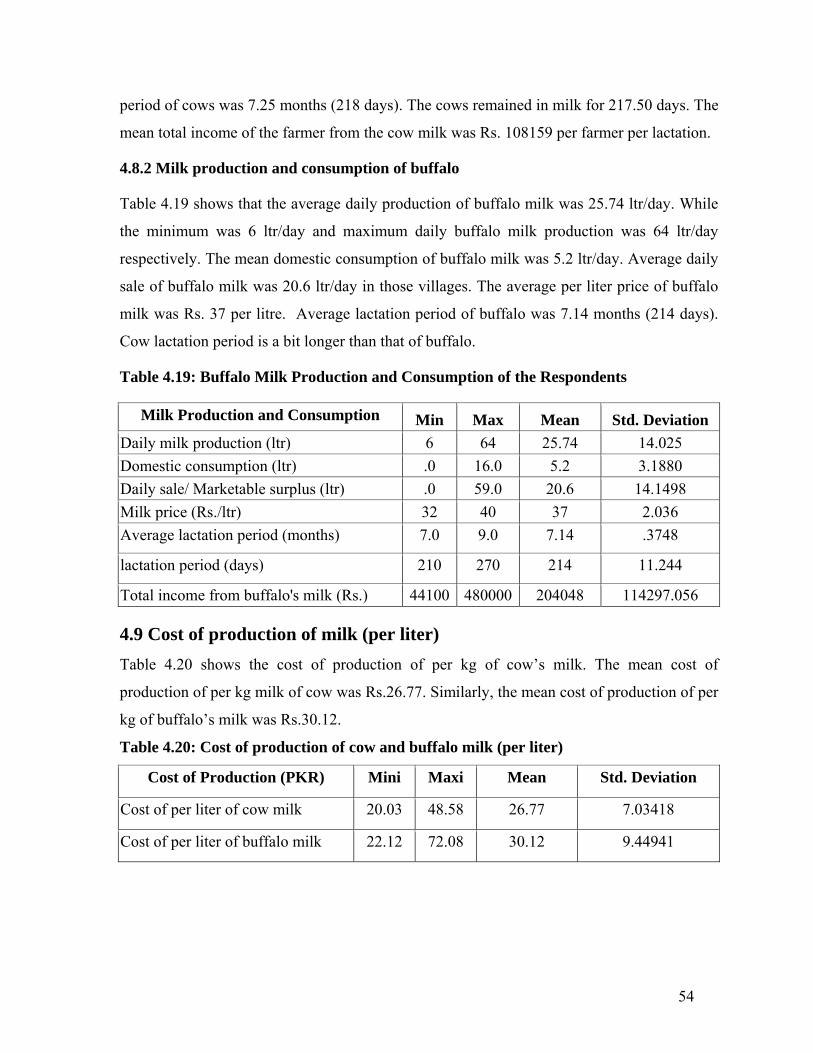
54
period of cows was 7.25 months (218 days). The cows remained in milk for 217.50 days. The
mean total income of the farmer from the cow milk was Rs. 108159 per farmer per lactation.
4.8.2 Milk production and consumption of buffalo
Table 4.19 shows that the average daily production of buffalo milk was 25.74 ltr/day. While
the minimum was 6 ltr/day and maximum daily buffalo milk production was 64 ltr/day
respectively. The mean domestic consumption of buffalo milk was 5.2 ltr/day. Average daily
sale of buffalo milk was 20.6 ltr/day in those villages. The average per liter price of buffalo
milk was Rs. 37 per litre. Average lactation period of buffalo was 7.14 months (214 days).
Cow lactation period is a bit longer than that of buffalo.
Table 4.19: Buffalo Milk Production and Consumption of the Respondents
Milk Production and Consumption Min Max Mean Std. Deviation
Daily milk production (ltr) 6 64 25.74 14.025
Domestic consumption (ltr) .0 16.0 5.2 3.1880
Daily sale/ Marketable surplus (ltr) .0 59.0 20.6 14.1498
Milk price (Rs./ltr) 32 40 37 2.036
Average lactation period (months) 7.0 9.0 7.14 .3748
lactation period (days) 210 270 214 11.244
Total income from buffalo's milk (Rs.) 44100 480000 204048 114297.056
4.9 Cost of production of milk (per liter)
Table 4.20 shows the cost of production of per kg of cow’s milk. The mean cost of
production of per kg milk of cow was Rs.26.77. Similarly, the mean cost of production of per
kg of buffalo’s milk was Rs.30.12.
Table 4.20: Cost of production of cow and buffalo milk (per liter)
Cost of Production (PKR) Mini Maxi Mean Std. Deviation
Cost of per liter of cow milk 20.03 48.58 26.77 7.03418
Cost of per liter of buffalo milk 22.12 72.08 30.12 9.44941

55
The per liter cost of production of cow milk is lower than that of buffalo because the
lactation period of cow is slightly higher than the buffalo. The feeding cost associated with
the cows is lower than that of buffaloes.
4.10 Share of Livestock Income in Total farm Income
Table 4.21 indicates the annual farm income of the respondents, which is the sum of income
from crop and livestock. The mean annual total livestock income of the respondents was Rs.
259762, while annual mean total farm income was Rs. 672214 respectively. The share of
livestock income in the overall income of the farm was 48%.
Table 4.21: Share of livestock income in total farm income
Share Minimum Maximum Mean Std. Deviation
Total livestock incomce (Rs.) 58800 624750 259762 121343.794
Total farm income (Rs.) 95000 1209000 672214 298286.953
Share of livestock income in total
farm income (%)
10.06 94.94 48 19.01827
4.11 Economic Losses due to Delayed Conception
4.11.1 Economic losses due to delayed conception of heifers
Table 4.22 shows the losses due to delayed conception in heifers. The mean number of
services per conception in heifers weas 3.81. The mean days delayed from the age of
maturity of the heifers to their conception were 198.8 days. This shows that for how many
days, the heifers were conceived after recommended age of maturity. The mean extra feeding
cost related to the number of days delayed (DD) was Rs. 11024.23. Similarly, mean extra
labor cost due to days delayed was Rs.3731.46. Extra treatment cost associated with heifers
due to days delayed was Rs.671 and extra breeding cost was Rs. 555.8. Milk loss of the
heifers in the next lactation due to days delayed was 7.19 liters with mean value Rs.30932
associated with this milk loss. Value of calf loss was Rs.17219.7 for the mean DD. Per day
Loss to the farmer due to delayed conception of heifers was Rs.292.8 and per day loss per
heifer in that study area was Rs.212.52. While total loss in heifers suffered by the farmers
due to mean DD was Rs.51978.2.
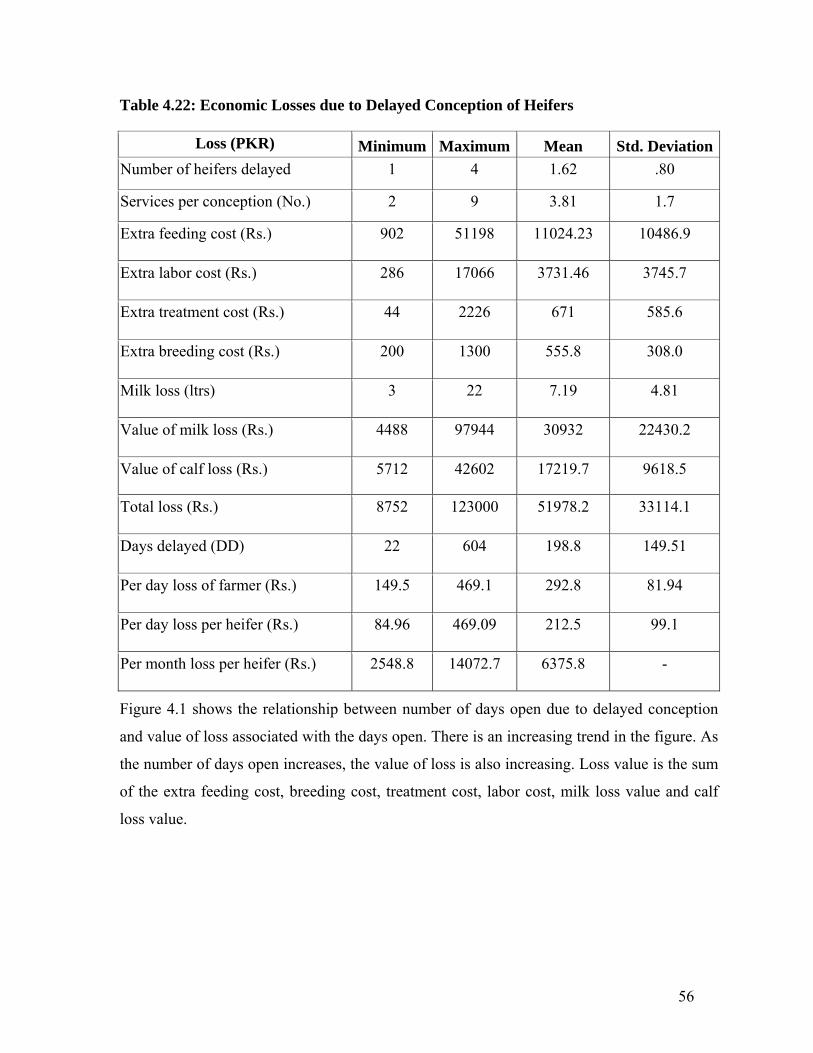
56
Table 4.22: Economic Losses due to Delayed Conception of Heifers
Loss (PKR) Minimum Maximum Mean Std. Deviation
Number of heifers delayed 1 4 1.62 .80
Services per conception (No.) 2 9 3.81 1.7
Extra feeding cost (Rs.) 902 51198 11024.23 10486.9
Extra labor cost (Rs.) 286 17066 3731.46 3745.7
Extra treatment cost (Rs.) 44 2226 671 585.6
Extra breeding cost (Rs.) 200 1300 555.8 308.0
Milk loss (ltrs) 3 22 7.19 4.81
Value of milk loss (Rs.) 4488 97944 30932 22430.2
Value of calf loss (Rs.) 5712 42602 17219.7 9618.5
Total loss (Rs.) 8752 123000 51978.2 33114.1
Days delayed (DD) 22 604 198.8 149.51
Per day loss of farmer (Rs.) 149.5 469.1 292.8 81.94
Per day loss per heifer (Rs.) 84.96 469.09 212.5 99.1
Per month loss per heifer (Rs.) 2548.8 14072.7 6375.8 -
Figure 4.1 shows the relationship between number of days open due to delayed conception
and value of loss associated with the days open. There is an increasing trend in the figure. As
the number of days open increases, the value of loss is also increasing. Loss value is the sum
of the extra feeding cost, breeding cost, treatment cost, labor cost, milk loss value and calf
loss value.

57
0
20
40
60
80
100
120
140
22 44 66 82 202 216 224 246 252 404 426 604
Number of Days Delayed
Val
ue
of Loss
(00
0 R
s.)
Figure 4.1: Delayed Conception Losses of Heifers Associated With Days Delayed
4.11.2 Economic losses due to delayed conception of lactating animals
Table 4.23 shows the losses due to delayed conception in lactating animals. The mean
number of services per conception in lactating animals were 5.25. The mean number of days
delayed after the 90 days recommended service period to the conception were 213.79 days.
The mean extra feeding cost of the lactating animals associated with the farmers was Rs.
22891.1 for the mean number of DD. Similarly, extra labor cost due to DD was Rs. 7185.
Extra treatment cost associated with animals due to DD was Rs. 1822 and extra breeding cost
was Rs. 783. The mean milk loss of the farmers in the next lactation due to DD was 10.2
liters. The mean value of milk loss was Rs. 35608 per farmer. Mean value of calf loss was
Rs. 24859.4. Per day Loss of the farmer due to delayed conception was Rs. 455.34 and per
day loss per lactating animals in that study area was Rs. 261.1 per day. While total losses in
lactating animals suffered by the farmers due to mean days open was Rs. 93147 per farmer.
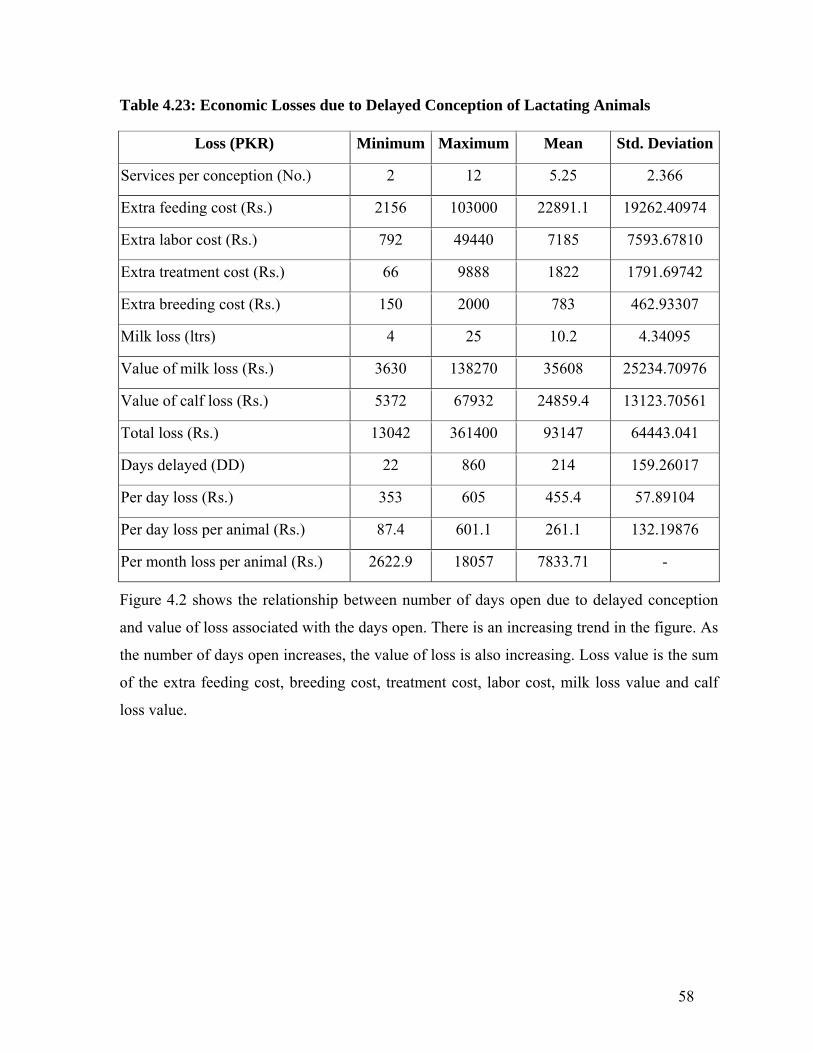
58
Table 4.23: Economic Losses due to Delayed Conception of Lactating Animals
Loss (PKR) Minimum Maximum Mean Std. Deviation
Services per conception (No.) 2 12 5.25 2.366
Extra feeding cost (Rs.) 2156 103000 22891.1 19262.40974
Extra labor cost (Rs.) 792 49440 7185 7593.67810
Extra treatment cost (Rs.) 66 9888 1822 1791.69742
Extra breeding cost (Rs.) 150 2000 783 462.93307
Milk loss (ltrs) 4 25 10.2 4.34095
Value of milk loss (Rs.) 3630 138270 35608 25234.70976
Value of calf loss (Rs.) 5372 67932 24859.4 13123.70561
Total loss (Rs.) 13042 361400 93147 64443.041
Days delayed (DD) 22 860 214 159.26017
Per day loss (Rs.) 353 605 455.4 57.89104
Per day loss per animal (Rs.) 87.4 601.1 261.1 132.19876
Per month loss per animal (Rs.) 2622.9 18057 7833.71 -
Figure 4.2 shows the relationship between number of days open due to delayed conception
and value of loss associated with the days open. There is an increasing trend in the figure. As
the number of days open increases, the value of loss is also increasing. Loss value is the sum
of the extra feeding cost, breeding cost, treatment cost, labor cost, milk loss value and calf
loss value.

59
0
50
100
150
200
250
300
350
400
22 74 96 112
134
148
156
170
224
260
304
336
410
486
494
824
Days Delayed
Loss
Val
ue
(000
Rs.
)
Figure 4.2: Delayed Conception Losses in Lactating Animals Associated With Days
Delayed
4.12 Reasons for Delayed Conception (Farmer’s Perceptions)
4.12.1 Reasons for Delayed Conception in Heifers
Table 4.24 shows the reasons for delayed conception in heifers. The major reason for delayed
conception in heifers was poor feeding and 70% of the respondents reported that their
animals were not fed up according to the requirements.
Table 4.24: Reasons for Delayed Conception in Heifers
Reasons Number of Farmers Percent
Poor Feeding 56 70
Diseased Condition 11 13.7
Poor Management 8 10.0
Inseminator Inefficiency 5 6.3
Total 80 100.0
After poor feeding the second most reason for delayed conception in heifers was diseased
conditions and 13.7% of the respondents reported that their animals had many health
problems. Animals were not healthy due to their genetics or some other diseases. Poor
management was also a reason for delayed conception in the study area and 10% of the
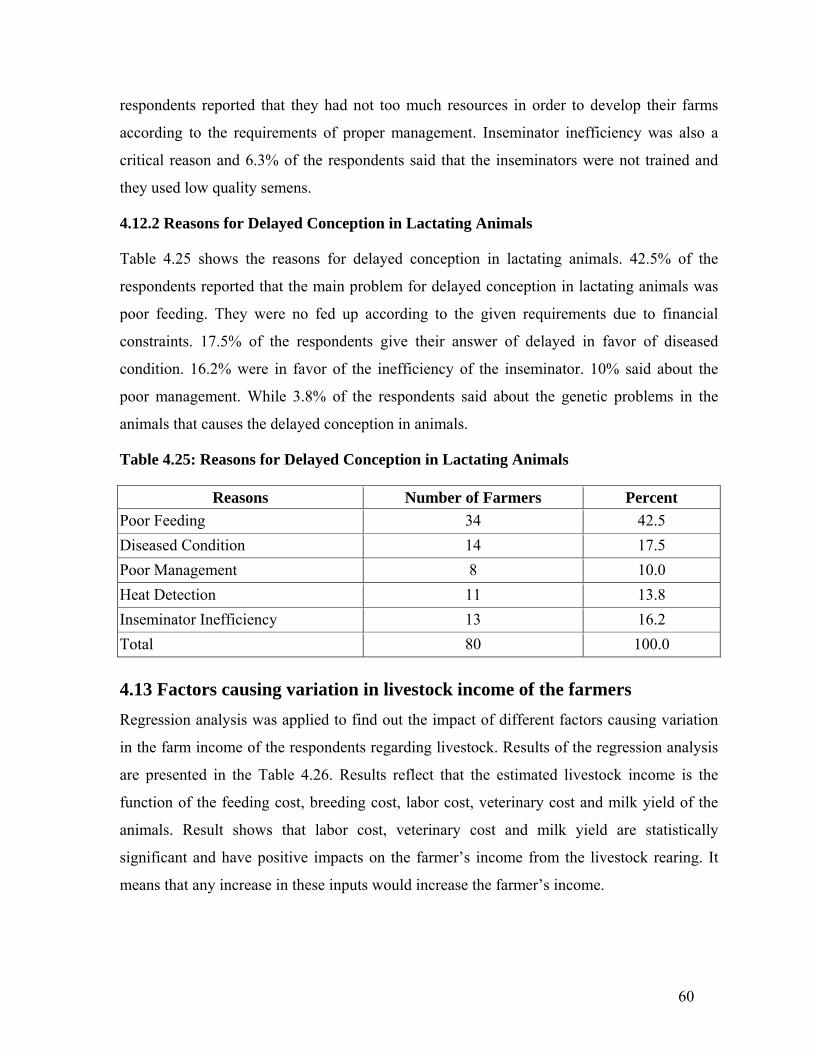
60
respondents reported that they had not too much resources in order to develop their farms
according to the requirements of proper management. Inseminator inefficiency was also a
critical reason and 6.3% of the respondents said that the inseminators were not trained and
they used low quality semens.
4.12.2 Reasons for Delayed Conception in Lactating Animals
Table 4.25 shows the reasons for delayed conception in lactating animals. 42.5% of the
respondents reported that the main problem for delayed conception in lactating animals was
poor feeding. They were no fed up according to the given requirements due to financial
constraints. 17.5% of the respondents give their answer of delayed in favor of diseased
condition. 16.2% were in favor of the inefficiency of the inseminator. 10% said about the
poor management. While 3.8% of the respondents said about the genetic problems in the
animals that causes the delayed conception in animals.
Table 4.25: Reasons for Delayed Conception in Lactating Animals
Reasons Number of Farmers Percent
Poor Feeding 34 42.5
Diseased Condition 14 17.5
Poor Management 8 10.0
Heat Detection 11 13.8
Inseminator Inefficiency 13 16.2
Total 80 100.0
4.13 Factors causing variation in livestock income of the farmers
Regression analysis was applied to find out the impact of different factors causing variation
in the farm income of the respondents regarding livestock. Results of the regression analysis
are presented in the Table 4.26. Results reflect that the estimated livestock income is the
function of the feeding cost, breeding cost, labor cost, veterinary cost and milk yield of the
animals. Result shows that labor cost, veterinary cost and milk yield are statistically
significant and have positive impacts on the farmer’s income from the livestock rearing. It
means that any increase in these inputs would increase the farmer’s income.

61
Table 4.26: Coefficients of regression of the farmers
Variables Coefficients Std. Error t-value Significance
Constant 6.0466 0.8654 6.9869 0.0000
Ln (feed cost) 0.1027 0.0874 1.1748 0.2438
Ln (breed cost) 0.1149 0.0665 1.7278 0.0881
Ln (labor cost) 0.1951 0.0922 2.1163 0.0376
Ln (veterinary cost) 0.2398 0.0553 4.3355 0.0000
Ln (milk yield) 0.2193 0.1058 2.0720 0.0417
R2 0.7395
Adjusted R2 0.7219
Std. Error 0.2856
F Change 42.0222
A one percent increase in labor cost, veterinary cost and milk yield would tend to increase
the income by 0.19, 0.23 and 0.22 percent respectively. Labor cost has positive impact on
livestock income because it directly affects the management of the dairy farm. As the number
of laborers increase at the farm, the dairy farm would be managed in a proper way. When the
management of the farm would be sured then the income from livestock also increases.
Similarly, veterinary cost has also positive impact on livestock income due to the better
health condition of the animals. Same was the case for milk yield. On the other hand, feed
cost which includes the fodder and concentrate cost and breeding cost also has a positive
impact on the livestock income but it is statistically insignificant.
4.14 Farmer’s perception about dairy farming
Table 4.27 shows the farm related characteristics of the respondents. 98.8% of the
respondents have no individual animal record in that area. All the farmers have their animals
tied. There is no concept of free grazing for the animals. 98.8% of the respondents said that if
animals are not tied, it has a positive impact on the health and productivity of the animals.
While only 1.3% of the respondents stay against this statement. 53.8% of the respondents
have no free access of water to their animals. They have to water their animals through
buckets or some other sources.

62
Table 4.27: Farm Related Characteristics
Characteristics Yes No
Frequency Percent Frequency Percent
Are animals tied? 100 100 0 0
If animals are not tied, it has positive
impact on health and productivity
79 98.8 1 1.3
Free water access 37 46.3 43 58.7
Do you know that free water access
contributes in productivity and health?
76 95 4 5
Have you farm fencing or not? 36 45 44 55
Farm has shed cooling system? 0 0 100 100
Have you taken dairy loan? 12 15 68 85
Do you visit any progressive/model
livestock farm?
12 15 68 85
If you visit model farm, do you Follow
model practices?
0 0 100 100
While 46.3% of the respondents has free water access to their animals. They have ponds at
their farms in order to water their animals. 95% of the respondents said that free water access
contributes to the health and productivity of the animals. While only 46.3% of the
respondents were providing free water access to their animals. There are the respondents who
put their answer against this statement; they are only 5% of the total respondents. 55% of the
respondents have no farm fencing at their farm. They have open farms, no wall boundary, no
fencing etc. while 45% of the respondents has farm fencing in that study area.There is no
farmer in that area that has shed cooling system. The entire farms are made up on traditional
basis. There are no as such equipments at their farms. 85% of the respondents are not taking
dairy loan for their enterprise. Only 15% of the respondents are getting dairy loan from
formal and informal ways. 85% of the respondents have never visited any progressive or
model livestock farm in their area. They say that they have no need to go to their farms. Only
15% of the respondents have visited the model livestock farms. The farmers who have visited
the model farms, they have not adopted the model farm practices due to financial constraints.
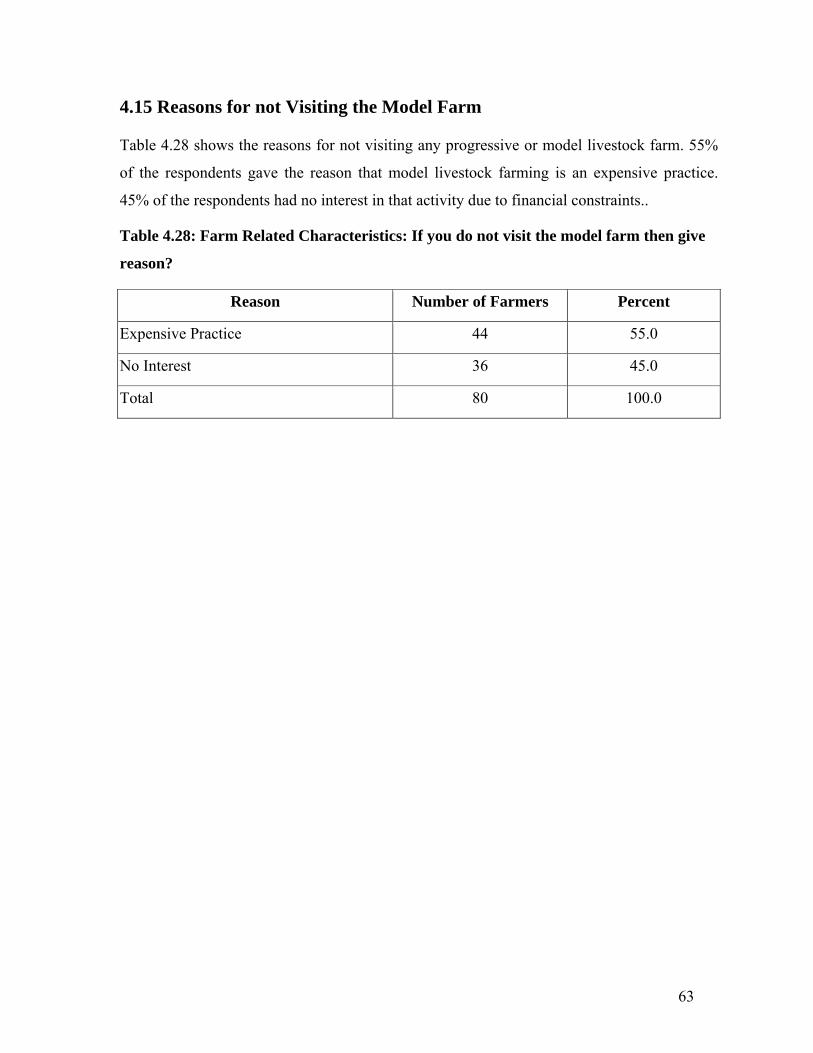
63
4.15 Reasons for not Visiting the Model Farm
Table 4.28 shows the reasons for not visiting any progressive or model livestock farm. 55%
of the respondents gave the reason that model livestock farming is an expensive practice.
45% of the respondents had no interest in that activity due to financial constraints..
Table 4.28: Farm Related Characteristics: If you do not visit the model farm then give
reason?
Reason Number of Farmers Percent
Expensive Practice 44 55.0
No Interest 36 45.0
Total 80 100.0

64
CHAPTER 5
SUMMARY AND SUGGESTIONS
5.1 Summary
The purpose of this study was to investigate the economic losses due to delayed conception
in dairy animals, composition of labor in livestock, share of livestock income in the overall
farm income and reasons for delayed conception of the small farmers in District Gujranwala
of Punjab. Collection of primary data was done. It was a multi-crop area where wheat, rice
and sugercane was grown and nearly all types of fodder varities were cultivated and fed to
the animals. Two tehsils were selected and from each tehsil, three villaged were selected
using simple random sampling technique. From each village farmers were selected by using
simple random sampling technique.
Data was collected through a farm level survey of the target area using a pre-tested
questionnaire. The information of all the management practices related to livestock was
included in the questionnair. Information includes like variable costs associated with
livestock, composition of labor, milk production, sale and purchase of the animals etc.
Only small farmers having less than or equal to 12 acres of land were interviewed in this
survey. Average land holding of the farmers was 6.95 acres. Most of the farmers had the land
size of 9-12 acres. Most of the farmers fall in the age group of 41-50 and above 50 years. In
the age group of more than 50 years, the percentage of animals delayed was less than other
age groups. In case of farming experience, most of the farmers had upto 10 years of farming
experience. With the increase in the farming experience the animals delayed were less than
the low farming experience. Most of the farmers were illiterate in that study area. Almost all
the farmers were engaged in the farming activities but a few were engaged in jobs and
business, such as shops in their houses for their daily income. Mostly farmers spent 6-10
hours were being spent in farm related activities. Most of the farmers had family size of 11-
15 persons.
Out of total, only 56 of the respondents had cows. The mean numbers of cows were 3.30
cows. 52 of them were wet cows which were 92.85% of the overall cows. The mean wet
cows kept by the farmer were 1.34 cows. 26.78% of the respondents had dry cows in their

65
herds. The mean dry cows in farmer’s herd were 1.20 cows. 71.42% of the farmers had cow
young stock both males and females. The mean number of cow young stock was 1.93 young
stocks per farmer. 35.71% of the respondents had cow suckers in their herds. The mean
numbers of cow sucklers kept by the farmer were 1.25. Similarly, all of the respondents had
buffaloes in their herds. The mean numbers of buffaloas kept by the respondents in their herd
were 6.99 buffaloes. All of the respondents had wet buffaloes. The mean numbers of wet
buffaloas kept by the farmers were 2.85 buffaloes which were the main source of income and
home consumption of the respondents. 47.5% of the respondents had dry buffaloes in their
herds. The mean numbers of dry buffaloas of the respondents were 1.61 buffaloes. 80% of
the respondents had buffalo young stock in their herds. The mean number of buffalo young
stock was 2.78 buffalo heifers of the farmers. Lastly, 42.5% of the respondents had buffalo
young suckers in their herds. The mean numbers of buffalo sucklers kept by the respondents
in their herd in that area were 2.41 suckers per farmer.
Average cow and buffalo milk production per day was 14.62 and 25.74 liters with average
daily consuption of 3.40 and 5.163 liters. Average price of cow and buffalo milk was Rs.34
and Rs.36.86. Average lactation period for cow and buffalo was 217.50 and 214.31 days. The
mean income of the farmer from the cow and buffalo milk was Rs.108158.65 and Rs.204048
during its lactation period. Average milk productivity was higher in case of buffaloes than
cows. The share of livestock income in the total farm income was 48.48% which shows the
importance of livestock sector in the farming system of the farmers. Mean cost of production
of cow and buffalo milk was Rs.26.77 and Rs.30.11 per liter.
On an average per day loss due to delayed conception in heifers suffered by the farmer was
Rs.292.81 with the average numbers of days delayed of 198.76. Mean services per
conception in heifers were 3.81. Per day loss per heifer was Rs.212.52. In case of lactating
animals, average per day loss per farmer due to delayed conception was Rs.455.34 with the
average numbers of days delayed of 213.79. Mean services per conception in lactating
animals were 5.25. Per day loss per lactating animal was Rs.261.12.
Main reason of delayed conception in heifers and lactating animals was only poor feeding.
While inseminator inefficiency, disease conditions and heat detection problems had also been
investigated in this survey. Similarly, other farm related characteristics were also mentioned
66
in this study. The main cause for all these losses was poor management. They were following
the traditional practices in order to rear their animals. They had no well equipped farms due
to financial constraints. Credit availability was limited with complicated process that's why
many farmers were refusing to avail this facility. Concentrates were fed up to the animals in
limited quantity due to their high prices which those farmers can not bear after certain limit.
The milk prices were not stable in that area. There was a lot of variability in milk prices due
to which the milkmen were getting a greater portion of profit than farmers.
Regression results related facotrs causing variation in livestock income show that a one
percent increase in labor cost, veterinary cost and milk yield would tend to increase the
income by 0.19, 0.23 and 0.22 percent respectively and these factors are statistically
significant. On the other hand, feed cost which includes the fodder and concentrate cost and
breeding cost also has a positive impact on the livestock income but it is statistically
insignificant.

67
5.2: Suggestions
Different costs like labor cost, feeding cost, breeding cost and veterinary cost have a
significant effect on the income of the farmers so there is a need to minimize these
costs in order to get maximum revenue from the animals.
Awareness must be created among the farmers regarding balanced rations and
minerals in order to improve production as well as fertility.
Livestock income is contributing a significant share in the income of the farmers in
the current study area. So a core attention is needed to improve this sector by
facilitating the basic needs and introducing better management practices.
Farmers should be trained in order to detect the heat of the animal at the proper time
with proper feed.
In order to overcome the poor reproductive efficiency, the inseminator should be
trained for insemination technique, semen handling and should be educated for semen
selection.
The habit among the farmers should be developed to maintain score cards which
would assist the producer, planner and researcher in discerning the characteristics,
fertility and performance of animals for future planning and improvement of
production.
Government should advise all scheduled banks to provide loan facilities to stock
producers on low interest rate and easy installments in order to expand the livestock
farming on scientific basis.

68
Literature Cited
Agarwal, O. and S. Chandra. 2000. A study of Milk Production Marketing Surplus and
seasonal Variation in Price The journal of Development studies. XII-XII: 105-110.
Ahmed, B.1982. Cost of production Per Kg of Cow Milk on Small Farms in Khushab Zone.
MS.c. (Hons) Thesis, Department of Agricultural Economics, University of
Agriculture, Faisalabad, Pakistan.
Akhtar, M. 1999. Changes in the major food grain production in Bangladesh and their
sources during the period from 1979/80 to 1998/99. Bangladesh Journal of.
Agricultural Economics, 25: 1-16.
Anonymous, 2005. Dairy Herd Fertility Challenge Note C - The Cost of Extended Calving
Intervals. CAFRE, 2005.
Anonymous, 2010. Reproductive Efficiency. Livestock and dairy development board,
Pakistan (LDDB). http://lddb.org.pk/index.php?link=reintro.
Ansari-Lari, M., M. Kafi, M. Sokhtanlo, H. N. Ahmadi. 2010. Reproductive performance of
Holstein dairy cows in Iran. Tropical Animals Health and Production, 42: 1277-1283.
Arbel, R., Y. Bigun, E. Ezra, H. Struman and D. Hojman. 2001. The effect of extended
calving interval in high lactating cows in milk production and profitability. Journal of
Dairy Science, 84: 600-608.
Bartlett, P. C., J. H. Kirk and E. C. Mather. 1986. Repeated insemination in Michigan
Holstein-Friesian cattle: Incidence, descriptive epidemiology and estimated economic
impact. Journal of Theriogenology, 26:309-322.
Beever, D. E. (2004). Opportunities to improve the performance and profitability of dairy
farms through better nutrition. Knowledge Agriculture, Perspectives Towards a New
Model of Milk Production, R Keenan & Co., Co Carlow, Ireland. 2004. pp. 6–8.
Beever, D. E. 2006. The impact of controlled nutrition during the dry period on dairy cow
health, fertility and performance. Animal Reproduction Science, 96: 212-226.
Biffani, S., A. B. Samore, F. Canavesi and M. Marusi. 2003. Data quality assessment and
preliminary investigations on fertility in the Italian Holstein Friesian. Interbull

69
Bulletin No. 30. Proceedings of the Interbull Technical Workshop. Beltsville, MD,
USA. March 2-3, 2003. pp 89-95
Bilal, M. Q. 2004. Dairy farminr (an Urdu publication), Zaraii Digest Publication, University
of Agriculture Faisalabad.
Boichard, D. 1990. Estimation of the economic value of conception rate in dairy cattle.
Journal of Livestock Production Science, 24:187-204.
Burki, A. A., M. A. Khan and F. Bari. 2005. The State of Pakistan’s Dairy Sector: An
Assessment CMER Working Paper No. 5-34, Centre for Management and Economic
Research, Lahore University of Management Sciences, Lahore.
Britt, J. H.1985. Enhanced reproduction and its economic implications. Journal of Dairy
Science, 68:1585-1592.
Chagunda, M. G. G., E. W. Bruns, C. B. A. Wollny and H. M. King. 2004. Effect of milk
yield-based selection on some reproductive traits of Holstein Friesian cows on large-
scale dairy farms in Malawi. Livestock Research for Rural Development, 16: 55-62.
Chaudary, M. A. and A. J. Chaudary. 1992. Farming system and resources allocation
;use of liner programming model on small farm in Pakistan. Journal of Rural
Development. And Administration. 24:18-29.
Chaudary, M. Z., R. E. McDdowells and S. K. Shah. 1997. Production and reproduction
performance of three generations of Holsteinx sahiwal. Eleventh Annual report, Live
stock production research institute, Bahadurnagar, Okara.
Coppock, C. E., R. W. Everett, R. P. Natzke and H.R. Ainslie. 1974. Effect of Dry Period
Length on Holstein Milk Production and Selected Disorders at Parturition. Journal of
Dairy Science, 57: 712-718.
DeVries and Conlin. 2003. Economic value of timely determination of unexpected decrease
in detection of estrus using control charts. Journal of Dairy Science, 86: 3516-3526.
DeVries, A. 2004. Economics of Delayed Replacement When Cow Performance is Seasonal.
Journal of Dairy Science, 87: 2947–2958.

70
DeVries, A. 2006. Determinants of the cost of days open in dairy cattle. Proceedings of the
11th International Symposium on Veterinary Epidemiology and Economics, 2006.
Dijkhuizen, A. A. 1984. Economic aspects of reproductive failure in dairy cattle. Journal of
Preventive Veterinary Medicine, 3: 251-263.
Din, Z. U. 1984. Economics of livestock production in Dere Ismail Khan, Msc thesis,
department of livestock management, faculty of Animal Husbandry, University of
Agriculture Faisalabad.
Enevoldsen, C., and J. T. Sørensen. 1992. Effects of dry period length on clinical mastitis and
other major clinical health disorders Journal of Dairy Science, 75: 1007-1014.
Erling, S., A. Pascal and Oltenacu. 1989. Economic Consequences of Different Calving
Intervals. Acta Agriculturae Scandinavica, 39: 407-420.
Esslemont, R. J. 1992. Measuring dairy herd fertility. Veterinary Record, 131: 209-212.
Esslemont, R. J., and E. J. Peeler. 1993. The scope for raising margins in dairy herds by
improving fertility and health. British Veterinary Journal, 149: 537-547.
Esslemont, R. J., M. A. Kossaibati, J. Allcock. 2000. Economics of fertility in dairy cows.
British society of animal science, 26: 19-28.
Gill, G. S. and F. R. Allaire. 1976. Relationship of Age at First Calving, Days Open, Days
Dry, and Herdlife to a Profit function for Dairy Cattle. Journal of Dairy Science,
59:1131-1139.
González-Recio, O., M.A. Pérez-Cabal and R. Alenda. 2003. Economic Value of Female
Fertility and its Relationship with Profit in Spanish Dairy Cattle. Journal of Dairy
Science , 87: 3053-3061.
Government of Pakistan (GOP) 2011. Economic Survey of Pakistan 2009-10, Finance
Division Economic Advisor’s wing, Islamabad.
Groenendaal, H. D., D. T. Galligan, H. A. Mulder. 2004. An economic spread sheet model to determine optimal breeding and replacement decisions for dairy cattle. Journal of Dairy Science, 87: 2146-2157.
Hare, E., H. D. Norman and J. R. Wright. 2006. Trends in calving ages and calving intervals
for dairy cattle breeds in the United States. Journal of Dairy Science, 89:365-370.

71
Holmann, J., C. R. Shumway, W. Blake, B. Schwart and E. Max Sudweeks. 1983. Economic
Value of Days Open for Holstein Cows of Alternative Milk Yields with Varying
Calving Intervals. Journal of Dairy Science,
67: 636-643.
Inchaisri, C., R. Jorritsma, P. L. A. M. Vos, G. C. van der Weijden and H. Hogeveen. 2009.
Economic consequences of reproductive performance in dairy cattle. Journal of
Theriogenology, 74: 835-46.
James, A. D. and R. J. Esslemont. 1979. The economics of calving intervals. British Society
of Animal Science, 29: 157-162.
Jansen, J., A. A. Dijkhuizen and J. Sol. 1987. Parameters to monitor dairy herd fertility and
their relation to financial loss from reproductive failure. Preventive Veterinary
Medicine, 4: 409-418.
Jones, L. B. 2000. Economic Consequences of Extending the Calving Intervals of Dairy
Cows Treated With Recombinant Bovine Somatotropin. British society of animal
science, 14: 11-17.
Joseph, C. and A. Amin. 2009. Heat Detection Accuracy and AI Technician Evaluation.
Western Dairy Management Conference, 177-129.
Kadarmideen, H. N., R. Thompson, M. P. Coffey and M. A. Kossaibati. 2003. Genetic
parameters and evaluations from single- and multiple-trait analysis of dairy cow
fertility and milk production. Livestock Production Science, 81: 183-195.
Kafi, M., M. Zibaei, and Rahbari. 2007. Accuracy of oestrus detection in cows and its
economic impact on Shiraz dairy farms. Iranian Journal of Veterinary Research,
University of Shiraz, 8: 11-18.
Keown, J. F. and R. W. Everett. 1984. Effect of Days Carried Calf, Days Dry, and Weight of
First Calf Heifers on Yield. Journal of Dairy Science, 69: 1891-1896.
Khalid, M. A. S., O. Gracia and T. Hemme. 2000 International comparativeness of small
scale dairy farm in India / Pakistan. Institute of Farm economics, federal Agriculture
research Centre (FAL), Bundesallee Braunschweing, Germany. www.pdffactory.com.

72
Khan, S., M. S. Qureshi, N. Ahmad, M. Amjed, F. R. Durrani and M. Younas. 2008. Effect
of Pregnancy on Lactation Milk Value in Dairy Buffaloes. Asian-Australian Journal
of Animal Sciences, 21: 523-531.
Kumar, P. and J. N. Gupta, 1988. Comparative cost of milk production from different species
of milch animals in India. Journal of Dairy Science, 41: 411-419.
Kumar, S. 2004. Status of reproductive problems in Indian buffaloes and strategies for their
management. Book: Buffalo Production under Different Climatic Regions. (S.S.
Kundu, A.K. Misra and P.S. Pathak: Editors). First edition Lucknow, International
Book Distributing Company.
Kulak, K.K., J.C.M. Dekkers, A.J. McAllister and A.J. Lee. Lifetime profitability measures
for dairy cows and their relationships to lifetime performance traits. Canadian
Journal of Animal Science, 77: 609-616.
Lee, J. and I. H. Kim. 2007. Pregnancy loss in dairy cows: the contributing factors, the
effects on reproductive performance and the economic impact. Journal of Veterinary
Science, 8:283-288.
Lineweaver, J. A. 1975. Potential income from increased reproductive efficiency. Journal of
Dairy Science, 58: 780-787.
Louca, A. and J. E. Legates. 1967. Production Losses in Dairy Cattle Due to Days Open.
Journal of Dairy Science, 51: 573-583.
Lucy, M. C. 2001. Reproductive Loss in High-Producing Dairy Cattle: Where Will It End?
Journal of Dairy Science, 84: 1277-93.
Maqsood, M. 1993. Economics of Milk Production at various levels of livestock holdings in
Okara District. Thesis. Department of Agricultural Economics, University of
Agriculture, Faisalabad.
Mayne, C. S., M. A. McCoy1, W. J. McCaughey, D. R. Mackey, M. Verner, A. Gordon, B.
W. Kennedy and F. J. Gordon. 2003. Dairy Herd Fertility - Examination of Effects of
Increasing Genetic Merit And Other Herd Factors on Reproductive Performance.
Agri. Search, 3: 1-20.

73
Nicholson, C. F., P. K. Thornton, L. Mohammed and R. W. Muinga. 1999. Small hold dairy
technology in coastal kenya an adoption and impact study. ILRI, Nairobi, Kenya. Pp-
49
Nieuwhof, G. J., R. L. Powell and H. D. Norman. 1989. Ages at Calving and Calving
Intervals for Dairy Cattle in the United States. Journal of Dairy Science, 72: 685-692.
Olds, D., T. Cooper and F. A. Thrift. 1979. Effect of Days Open on Economic Aspects of
Current Lactation. Journal of Dairy Science, 62: 1167-1170.
Olynk, N. J. and C. A. Wolf. 1991. Economic analysis of reproductive management
strategies on US commercial dairy farms. Journal of Dairy Science, 10: 4082-4091
Österman, S. 2003. Extended calving interval and increased milking frequency in dairy cows:
Effects on productivity and welfare. PhD thesis. Department of Animal Nutrition and
Management, Swedish University of Agricultural Sciences, Uppsala, Sweden.
Oudah, E. Z. M., N. A. Shalaby and M. A. Mustafa. 2001. Genetic and non-genetic factors
affecting days open, number of service per conception and age at first calving in a
herd of Holstein-Friesian cattle. Pakistan Journal of Biological Sciences, 4: 740–744.
Overton, M. W. 2001. Stochastic modeling of different approaches to dairy cattle
reproductive management. Journal of Dairy Science, 84: 268-278.
Overton, M. W. 2005. Dairy cattle reproduction: Measuring efficiency and economics. In:
Proc. ABS Global and Balchem. Western Dairy Management Conference
Symposium, 1-12.
Overton, M. W. 2008. Economics of dairy reproduction: An application of marginality. In:
Reproduction for Profit and Success Pre-Conference Seminar, American Association
of Bovine Practitioners, Charlotte, NC.
Pasman, E. J. 1994. The development of control prediction systems for milk yield and
mastitis from field area. PhD Thesis. Department of Agriculture, The University of
Reading.
Pardue, F. E. and J. A. Bertrand.1990 .Future Direction of the Dairy Industries in South
Carolina. Journal of Dairy Science, 73;271-276.

74
Pelissier, C. L. 1976. Dairy cattle breeding problems and their consequences. Journal of
Theriogenology, 6:575-583.
Plaizier, J. C. B., G. J. King, J. C. M. Dekkers and K. Lissemore. 1996. Estimation of
Economic Values of Indices for Reproductive Performance in Dairy Herds Using
Computer Simulation. Journal of Dairy Science, 80: 2775-2783.
Pryce, J. E., M. P. Coffey and S. Brotherstone. 2000. The genetic relationship between
calving interval, body condition score and linear type and management traits in
registered Holsteins. Journal of Dairy Science, 83: 2664–2671.
Royal, M. D., A. O. Darwash, A. P. F. Flint, R. Webb, J. A. Woolliams and G. E. Lamming.
2000. Declining fertility in dairy cattle:changes in traditional and endocrine
parameters of fertility. Journal of Animal Sciences, 70:487-501.
Schaeffer, L. R., and C. R. Henderson 1972. Effects of Days Dry and Days Open on Holstein
Milk Production. Journal of Dairy Science, 55:107-112
Schmidt, G. H. 1988. Effect of Length of Calving Intervals on Income Over Feed and
Variable Costs. Journal of Dairy Science, 72: 1605-1611.
Seegers, H. 1994. A framework for animal health management. Vet. Res, 25: 165-173.
Seegers, H. 2006. Economics of the Reproductive Performance of Dairy Herds. World
Buiatrics Congress, 2006.
Sewalem, A., F. Miglior, G. J. Kistemaker, P. Sullivan and B. J. Van Doormaal. 2008.
Relationship between reproduction traits and functional longevity in Canadian dairy
cattle. Journal of Dairy Science, 91: 1660–1668.
Shah, S., A. A. Dijkhuizen, A. H. Willemse and D. F. M. van de Wiel. 1991. Economic
aspects of reproductive failure in dairy buffaloes of Pakistan. Journal of Preventive
Veterinary Medicine, 11: 147-155.
Shah, D. 1992. Dairy Development as a mean of improving the nutritional status of rural
poor. Journal of Rural Development, 11: 229-238.
Shoemaker, D., E. Maurice, D. Breece, J. Woodruff, D. Rader, D. Marrison. 2008. 15
Measures of Dairy Farm Competitiveness. The Ohio State University.
75
Sørensen, J.T. and S. Østergaard. 2003. Economic consequences of postponed first insemination of cows in a dairy cattle herd. Livestock Production Science, 79: 145-153.
Syed, H. K., M. Farooq, M. A. Mian, M. Syed and S. Jamal. 2003. Milk production
performance and inter-relationship among traits of economic importance in buffaloes
maintained at commercial dairy farms. Livest. Res. Rural Develop. 15(10).
Tailor, N. 1992. Forages and Livestock Production, pp. 273. Advent Book Publication, New
York, USA.
Teufel, N. 1998. Village milk production in Pujab (Pakistan) GTZ: Vieh and Fisch,
Eschborn<Germany: 1-13.
Niaz, S. 2010. Overview of Livestock Sector. Punjab board of investment and trade
conference, 2010. www.pbit.gop.pk/.../0/.../livestock-sector-overview_mr-sudaif-
niaz_pbit.pdf.
Waithaka, M. M., J. N. Nyangaga, A. W. Wokabi, D. Njubi, K. G. Muriuki, L. N. Njoragi
and P. N. Wanjohi. 2002. Characteristics of dairy system in western Kenya region
SDP collaborative research report MoARD/KARI/ILRI.pp73
Weller, J. I. and Y. Folman. 1990. Effects of calf value and reproductive management on
optimum days to first breeding. Journal of Dairy Science, 73:1318-1326.
World Bank, 2010. Population growth (annual %). World development indicators.
http://data.worldbank.org/indicator/SP.POP.GROW.
Yusuf, M., T. Nakao, R. B. Ranasinghe, G. Gautam, S. T. Long, C. Yoshida, K. Koike, A.
Hayashi. 2010. Reproductive performance of repeat breeders in dairy herds. Journal
of Theriogenology, 73: 1220-1229.
Related Documents