Economic Impact of Tourism in New Mexico, 2016 September 2017

Welcome message from author
This document is posted to help you gain knowledge. Please leave a comment to let me know what you think about it! Share it to your friends and learn new things together.
Transcript

Economic Impact of Tourism in New Mexico, 2016 September 2017

1. Introduction
Introduction and definitions
| Tourism Economics 3
How visitor spending generates employment and income
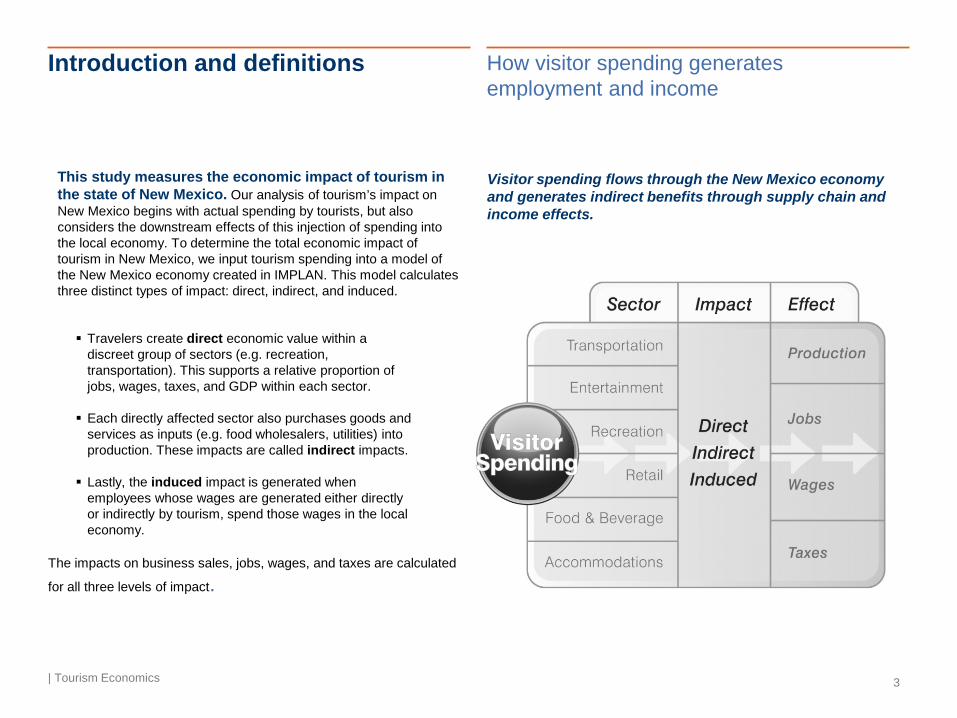
This study measures the economic impact of tourism in the state of New Mexico. Our analysis of tourism’s impact on New Mexico begins with actual spending by tourists, but also considers the downstream effects of this injection of spending into the local economy. To determine the total economic impact of tourism in New Mexico, we input tourism spending into a model of the New Mexico economy created in IMPLAN. This model calculates three distinct types of impact: direct, indirect, and induced.
Visitor spending flows through the New Mexico economy and generates indirect benefits through supply chain and income effects.
Travelers create direct economic value within a discreet group of sectors (e.g. recreation, transportation). This supports a relative proportion of jobs, wages, taxes, and GDP within each sector. Each directly affected sector also purchases goods and
services as inputs (e.g. food wholesalers, utilities) into production. These impacts are called indirect impacts. Lastly, the induced impact is generated when
employees whose wages are generated either directly or indirectly by tourism, spend those wages in the local economy.
The impacts on business sales, jobs, wages, and taxes are calculated
for all three levels of impact.
2. Key Findings

Draft | Tourism Economics 5
1) Tourism is a major contributor to New Mexico’s economy
Key facts about New Mexico’s tourism sector
In 2016, just over 35 million visitors spent $6.4 billion in New Mexico
Tourism spending was up 2.1% in 2016
Tourism spending supports 8.4% of all jobs in New Mexico
Tourism supports $841 in state and local taxes for every household in
New Mexico
Draft | Tourism Economics 6
2) Visitor spending generates income, jobs, and tax revenue
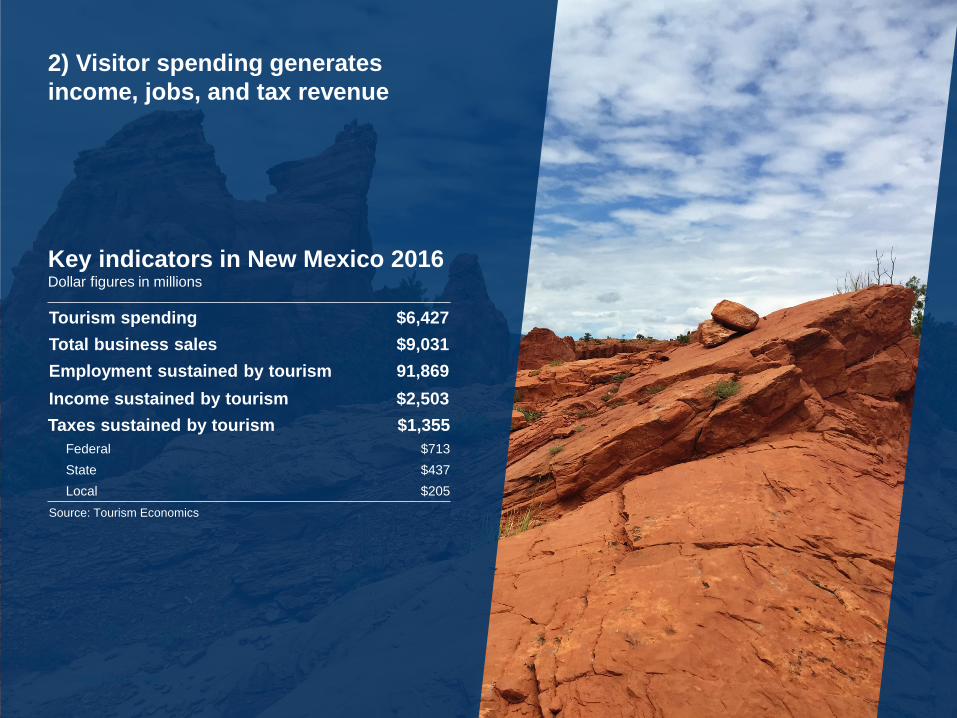
Tourism spending $6,427 Total business sales $9,031 Employment sustained by tourism 91,869 Income sustained by tourism $2,503 Taxes sustained by tourism $1,355
Federal $713 State $437 Local $205
Source: Tourism Economics
Key indicators in New Mexico 2016 Dollar figures in millions

Draft | Tourism Economics 7
3) Tourism indicators and economic impacts have steadily increased since 2011
10.6%
16.6%
7.9%
0%
2%
4%
6%
8%
10%
12%
14%
16%
18%
Visits Visitor spending Tourism employmentSource: Tourism Economics
Growth in key indicators Percent growth 2011-2016
3. Focus on 2016

Trends in New Mexico tourism
| Tourism Economics 9
Tourism spending reached $6.4 billion in 2016
Spending increased 2.1% in 2016
Spending and visitor growth was strongest from day visitors
Tourism spending is increasing – and has been for six straight years 1
Day visitors lead growth 3
Visitor spending growth led by spending on food & beverage and recreation
Spending growth is strong in key industry sectors 2
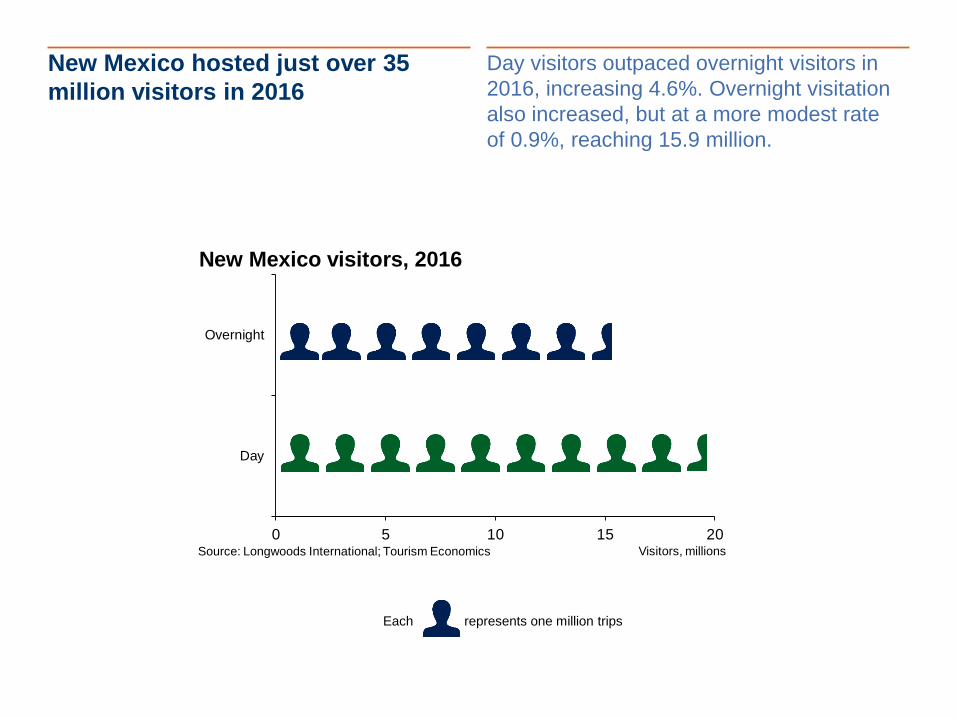
New Mexico hosted just over 35 million visitors in 2016
Day visitors outpaced overnight visitors in 2016, increasing 4.6%. Overnight visitation also increased, but at a more modest rate of 0.9%, reaching 15.9 million.
16
19
0 5 10 15 20
Overnight
Day
New Mexico visitors, 2016
Source: Longwoods International; Tourism Economics Visitors, millions
Each represents one million trips

2016 Visitor trends
| Tourism Economics 11
Visitation reached just over 35 million in 2016, increasing by 980,000
Visitor volume and spending expanded in 2016, driven primarily by strong consumer confidence and lower gas prices, as evidenced by the strength in day visitation growth (up 4.6% over 2015). An estimated 35 million visitors spent $6.4 billion in 2016, increases of 2.9% and 2.1% respectively from 2015.
$5,512 $5,722 $5,794 $6,074 $6,294 $6,427
30
32
34
36
$3,000
$4,000
$5,000
$6,000
$7,000
2011 2012 2013 2014 2015 2016
Total spending (left axis)
Total visitors (right axis)
Visitation and spending in New MexicoMillions
Source: Longwoods International; Tourism Economics
Millions

Visitation in 2016
| Tourism Economics 12
31.732.6
32.833.3
34.035.0
2.8%
0.7%
1.7%
2.1%
2.9%
0%
1%
2%
3%
4%
29
30
31
32
33
34
35
36
2011 2012 2013 2014 2015 2016
Total visitors (left axis)Growth (right axis)
Visitors to New MexicoVisitors, millions
Source: Longwoods International; Tourism Economics
Percent growth

Visitor spending growth
| Tourism Economics 13
$5,512 $5,722$5,794 $6,074 $6,294
$6,427
3.8%
1.3%
4.8%
3.6%
2.1%
0%
2%
4%
6%
$3,000
$4,000
$5,000
$6,000
$7,000
2011 2012 2013 2014 2015 2016
Total spending (left axis)Growth (right axis)
Visitor spending in New MexicoVisitor spending, millions
Source: Longwoods International; Tourism Economics
Percent growth
Visitor spending in New Mexico
| Tourism Economics 14
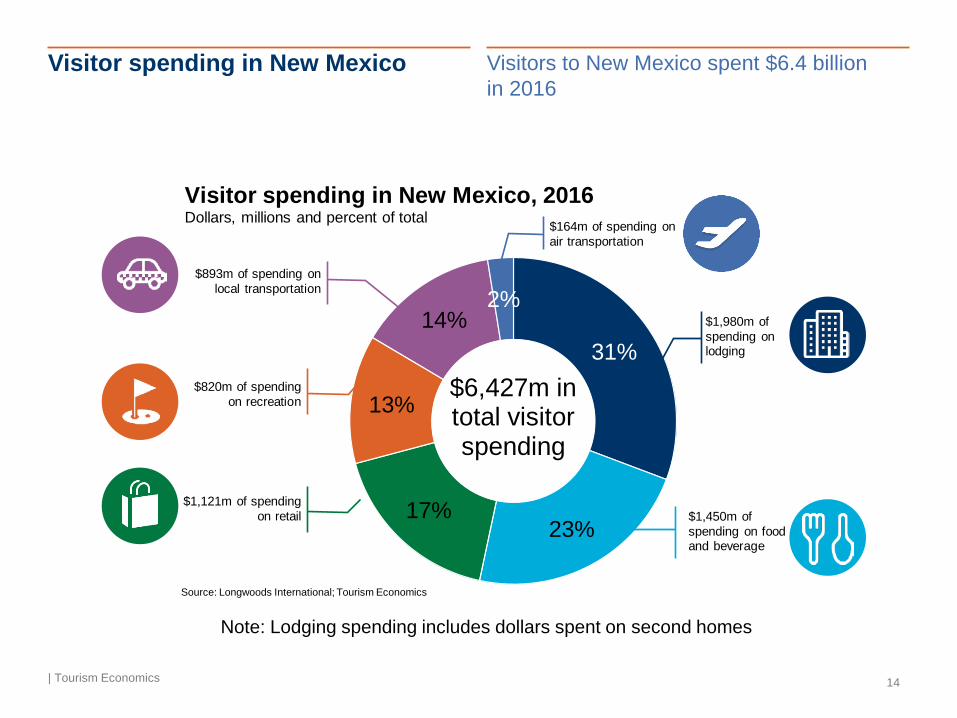
Visitors to New Mexico spent $6.4 billion in 2016
31%
23%17%
13%
14%2%
Source: Longwoods International; Tourism Economics
$1,980m of spending on lodging
$6,427m in total visitor spending
$1,450m of spending on food and beverage
$893m of spending on local transportation
$820m of spending on recreation
Visitor spending in New Mexico, 2016Dollars, millions and percent of total
$1,121m of spending on retail
$164m of spending on air transportation
Note: Lodging spending includes dollars spent on second homes

Tourism spending surpassed $6.4 billion in 2016
| Tourism Economics 15
Spending grew 2.1% year-over-year in 2016, led by increases in recreation and food & beverages
Lodging, which includes spending on second homes, represents the largest spending sector at nearly $2 billion, followed by spending on food and beverages ($1.5 billion). Visitor spending increased by $133 million in 2016, with spending on food and beverages and recreation contributing $85 million of the total increase. On average, each visitor spent about $183.50.
Visitor spending in New MexicoNominal dollars, millions 2016 2011-2016
2011 2012 2013 2014 2015 2016 Growth CAGRLodging* $1,626 $1,704 $1,761 $1,883 $1,952 $1,980 1.4% 4.0%Food and beverage $1,308 $1,327 $1,332 $1,352 $1,403 $1,450 3.3% 2.1%Retail $902 $966 $987 $1,073 $1,107 $1,121 1.3% 4.4%Recreation $744 $749 $751 $755 $782 $820 4.8% 2.0%Local transportation $749 $802 $798 $852 $889 $893 0.5% 3.6%Air transportation $183 $175 $165 $159 $161 $164 1.6% -2.2%Total $5,512 $5,722 $5,794 $6,074 $6,294 $6,427 2.1% 3.1%Source: Longwoods International; Tourism Economics
*Lodging includes spending on second homes

Tourism spending shares held steady
| Tourism Economics 16
Spending shares increased in both the food and beverage and recreation sectors, while retail’s share decreased to 17%. Despite minimal growth in lodging spending in 2016, the sector remains an integral part of New Mexico’s tourism economy.
14% 14% 14% 14% 14% 14%
13% 13% 13% 12% 12% 13%
16% 17% 17% 18% 18% 17%
24% 23% 23% 22% 22% 23%
30% 30% 30% 31% 31% 31%
3% 3% 3% 3% 3% 3%
0%
20%
40%
60%
80%
100%
2011 2012 2013 2014 2015 2016
Air transportationLodging*Food and beverageRetailRecreationLocal transportation
New Mexico visitor spendingPercent of total
Source: Longwoods International; Tourism Economics
*Note: Lodging includes visitor spending for second homes
Tourism spending by market
| Tourism Economics 17
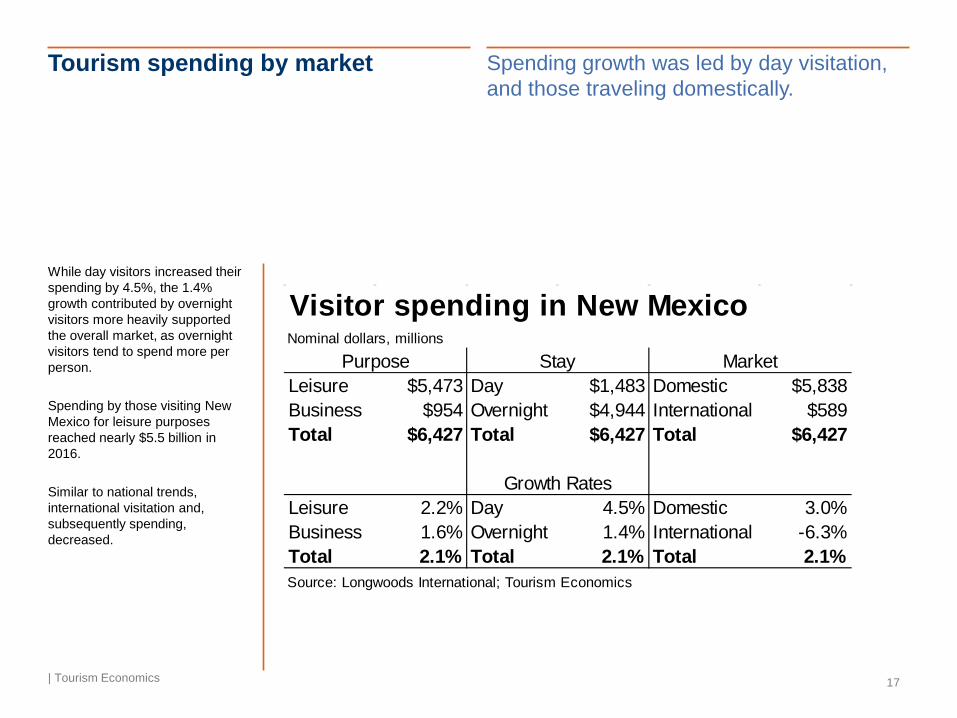
Spending growth was led by day visitation, and those traveling domestically.
While day visitors increased their spending by 4.5%, the 1.4% growth contributed by overnight visitors more heavily supported the overall market, as overnight visitors tend to spend more per person. Spending by those visiting New Mexico for leisure purposes reached nearly $5.5 billion in 2016. Similar to national trends, international visitation and, subsequently spending, decreased.
Visitor spending in New MexicoNominal dollars, millions
Leisure $5,473 Day $1,483 Domestic $5,838Business $954 Overnight $4,944 International $589Total $6,427 Total $6,427 Total $6,427
Leisure 2.2% Day 4.5% Domestic 3.0%Business 1.6% Overnight 1.4% International -6.3%Total 2.1% Total 2.1% Total 2.1%Source: Longwoods International; Tourism Economics
Purpose Stay Market
Growth Rates

Visitation segments – day and overnight
| Tourism Economics 18
Growth in day visitation far outpaced that of overnight visitors
Of the 35 million visitors to New Mexico, nearly 16 million stayed overnight—about 45%. Overnight spending reached nearly $5 billion in 2016. While day visitation accounts for about 55% of all visitors to New Mexico, those staying overnight contribute the most to total spending. Just over 75% of all spending can be attributed to overnight visitors.
Trips and SpendNominal dollars, millions
2011 2012 2013 2014 2015 2016Total 31.7 32.6 32.8 33.3 34.0 35.0Day 16.7 17.5 17.6 17.8 18.3 19.2Overnight 14.9 15.1 15.2 15.5 15.7 15.9
Total $5,512 $5,722 $5,794 $6,074 $6,294 $6,427Day $1,038 $1,154 $1,229 $1,336 $1,419 $1,483Overnight $4,474 $4,568 $4,566 $4,738 $4,875 $4,944
Per Traveler Spending $174 $176 $177 $182 $185 $184
Source: Longwoods International; Tourism Economics

Visitation segments – domestic and international
| Tourism Economics 19
Steep declines in visitors from Canada, a national trend, led to a slight decline overall in international visitation to New Mexico in 2016. Despite increasing just 0.5%, visitors from Mexico account for the largest share of international travel. Domestic visits and spending vastly outpace that of international visitors.
Trips and SpendNominal dollars, millions
2011 2012 2013 2014 2015 2016Total 31.7 32.6 32.8 33.3 34.0 35.0Domestic 31.2 32.0 32.2 32.7 33.4 34.4International 0.44 0.55 0.59 0.64 0.65 0.65
Total $5,512 $5,722 $5,794 $6,074 $6,294 $6,427Domestic $4,991 $5,153 $5,186 $5,463 $5,695 $5,866International $522 $569 $608 $611 $599 $561
Source: Longwoods International; Tourism Economics
Country of Origin Estimate 2016 GrowthCanada 123,817 -7.8%Mexico 349,331 0.5%Overseas 175,246 4.9%
Total 648,395 -0.1%
Source: Tourism Economics
International Volume Estimates

3) The Economic Impact of Tourism

Tourism’s impact on business sales (1 of 2)
| Tourism Economics 21
Spending in support of the tourism industry reached $6.4 billion in New Mexico, which supported a total of $9 billion in business sales when indirect and induced impacts are considered
Direct Indirect Induced TotalAgriculture, Fishing, Mining $5.3 $5.2 $10.5Construction and Utilities $129.4 $41.1 $170.5Manufacturing $42.7 $26.4 $69.1Wholesale Trade $23.9 $37.8 $61.8Air Transport $163.9 $2.6 $4.5 $171.0Other Transport $265.0 $66.3 $22.2 $353.5Retail Trade $1,121.0 $6.1 $127.6 $1,254.7Gasoline Stations $628.1 $0.6 $8.8 $637.5Communications $152.4 $58.8 $211.3Finance, Insurance and Real Estate $684.1 $312.5 $491.3 $1,487.9Business Services $264.3 $59.3 $323.5Education and Health Care $2.2 $250.3 $252.5Recreation and Entertainment $819.6 $17.5 $24.4 $861.5Lodging $1,295.4 $2.2 $1.3 $1,298.9Food & Beverage $1,449.9 $71.4 $119.8 $1,641.1Personal Services $41.6 $65.0 $106.6Government $77.0 $42.5 $119.5TOTAL $6,427.0 $1,218.1 $1,386.3 $9,031.4Source: Tourism Economics
Tourism industry generated business sales, millions

Tourism’s impact on business sales (2 of 2)
| Tourism Economics 22
While the majority of sales are in industries directly serving visitors, significant benefits accrue in sectors like finance, insurance and real estate from selling to tourism businesses
Food & Beverage
FIRE*
Lodging
Retail Trade
Recreation and Entertainment
Gasoline Stations
Other Transport
Business Services
Education and Health Care
Communications
Air Transport
Construction and Utilities
Government
Personal Services
Manufacturing
Wholesale Trade
Agriculture, Fishing, Mining
$0 $400 $800 $1,200 $1,600 $2,000
DirectIndirectInduced
Tourism industry generated business sales, 2016
Source: Tourism EconomicsDollars, millions*Finance, insurance and real estate

Tourism’s impact on GDP (Value Added) (1 of 2)
| Tourism Economics 23
Travel generated nearly $4.8 billion in state GDP in 2016, representing about 5.1% of the total New Mexico economy. This excludes all import leakages to arrive at the economic value generated by travel.
Direct Indirect Induced TotalAgriculture, Fishing, Mining $1.8 $1.9 $3.7Construction and Utilities $74.1 $23.6 $97.7Manufacturing $7.9 $4.7 $12.6Wholesale Trade $23.4 $37.0 $60.4Air Transport $83.5 $1.2 $2.0 $86.6Other Transport $155.6 $39.1 $12.6 $207.3Retail Trade $256.0 $4.4 $90.2 $350.6Gasoline Stations $65.1 $0.5 $7.1 $72.7Communications $66.3 $28.0 $94.3Finance, Insurance and Real Estate $523.6 $193.5 $310.6 $1,027.8Business Services $0.0 $163.1 $45.5 $208.7Education and Health Care $1.3 $161.3 $162.6Recreation and Entertainment $569.1 $7.0 $12.2 $588.3Lodging $846.7 $1.3 $0.8 $848.8Food & Beverage $744.0 $39.8 $61.8 $845.6Personal Services $31.6 $40.9 $72.5Government $38.9 $11.6 $50.4TOTAL $3,243.6 $695.1 $851.7 $4,790.4Source: Tourism Economics
Visitor generated value added, millions

Tourism’s impact on GDP (Value Added) (2 of 2)
| Tourism Economics 24
FIRE*Lodging
Food & BeverageRecreation and Entertainment
Retail TradeBusiness Services
Other TransportEducation and Health Care
Construction and UtilitiesCommunications
Air TransportGasoline StationsPersonal ServicesWholesale Trade
GovernmentManufacturing
Agriculture, Fishing, Mining
$0 $300 $600 $900 $1,200
DirectIndirectInduced
Visitor generated value added by industry, 2016
Source: Tourism EconomicsDollars, millions*Finance, Insurance and Real Estate
Tourism’s impact on local employment (1 of 2)
| Tourism Economics 25
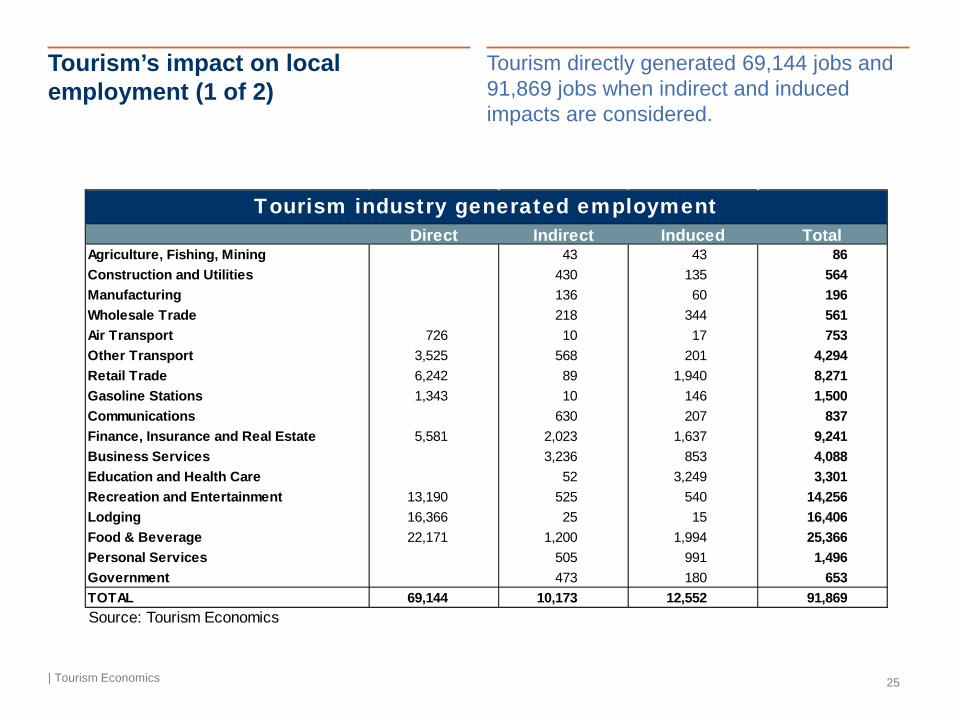
Tourism directly generated 69,144 jobs and 91,869 jobs when indirect and induced impacts are considered.
Direct Indirect Induced TotalAgriculture, Fishing, Mining 43 43 86Construction and Utilities 430 135 564Manufacturing 136 60 196Wholesale Trade 218 344 561Air Transport 726 10 17 753Other Transport 3,525 568 201 4,294Retail Trade 6,242 89 1,940 8,271Gasoline Stations 1,343 10 146 1,500Communications 630 207 837Finance, Insurance and Real Estate 5,581 2,023 1,637 9,241Business Services 3,236 853 4,088Education and Health Care 52 3,249 3,301Recreation and Entertainment 13,190 525 540 14,256Lodging 16,366 25 15 16,406Food & Beverage 22,171 1,200 1,994 25,366Personal Services 505 991 1,496Government 473 180 653TOTAL 69,144 10,173 12,552 91,869Source: Tourism Economics
Tourism industry generated employment

Tourism’s impact on local employment (2 of 2)
| Tourism Economics 26
Food & Beverage
Lodging
Recreation and Entertainment
FIRE*
Retail Trade
Other Transport
Business Services
Education and Health Care
Gasoline Stations
Personal Services
Communications
Air Transport
Government
Construction and Utilities
Wholesale Trade
Manufacturing
Agriculture, Fishing, Mining
0 5,000 10,000 15,000 20,000 25,000 30,000
DirectIndirectInduced
Tourism industry generated employment, 2016
Source: Tourism Economics Jobs*Finance, insurance and real estate

Tourism’s impact on local income (1 of 2)
| Tourism Economics 27
Tourism generated $1.6 billion in direct income and over $2.5 billion when indirect and induced impacts are considered
Direct Indirect Induced TotalAgriculture, Fishing, Mining $1.7 $3.6 $5.3Construction and Utilities $30.4 $9.1 $39.5Manufacturing $5.4 $2.5 $7.9Wholesale Trade $12.8 $20.2 $32.9Air Transport $40.0 $0.5 $0.9 $41.5Other Transport $114.2 $28.9 $9.3 $152.4Retail Trade $162.8 $3.1 $62.3 $228.1Gasoline Stations $38.7 $0.3 $4.2 $43.3Communications $32.0 $10.6 $42.6Finance, Insurance and Real Estate $79.2 $60.6 $55.4 $195.2Business Services $128.4 $34.5 $162.9Education and Health Care $1.4 $155.7 $157.1Recreation and Entertainment $300.3 $5.8 $7.5 $313.6Lodging $421.7 $0.6 $0.4 $422.7Food & Beverage $470.0 $25.4 $46.6 $542.0Personal Services $27.1 $37.7 $64.8Government $38.2 $12.4 $50.5TOTAL $1,627.0 $402.7 $472.9 $2,502.6Source: Tourism Economics
Tourism industry generated income, millions

Tourism’s impact on local income (2 of 2)
| Tourism Economics 28
Food & Beverage
Lodging
Recreation and Entertainment
Retail Trade
FIRE*
Business Services
Education and Health Care
Other Transport
Personal Services
Government
Gasoline Stations
Communications
Air Transport
Construction and Utilities
Wholesale Trade
Manufacturing
Agriculture, Fishing, Mining
$0 $100 $200 $300 $400 $500 $600
DirectIndirectInduced
Tourism industry generated wages, 2016
Source: Tourism EconomicsDollars, millions*Finance, insurance and real estate
Tourism’s impact on taxes
| Tourism Economics 29
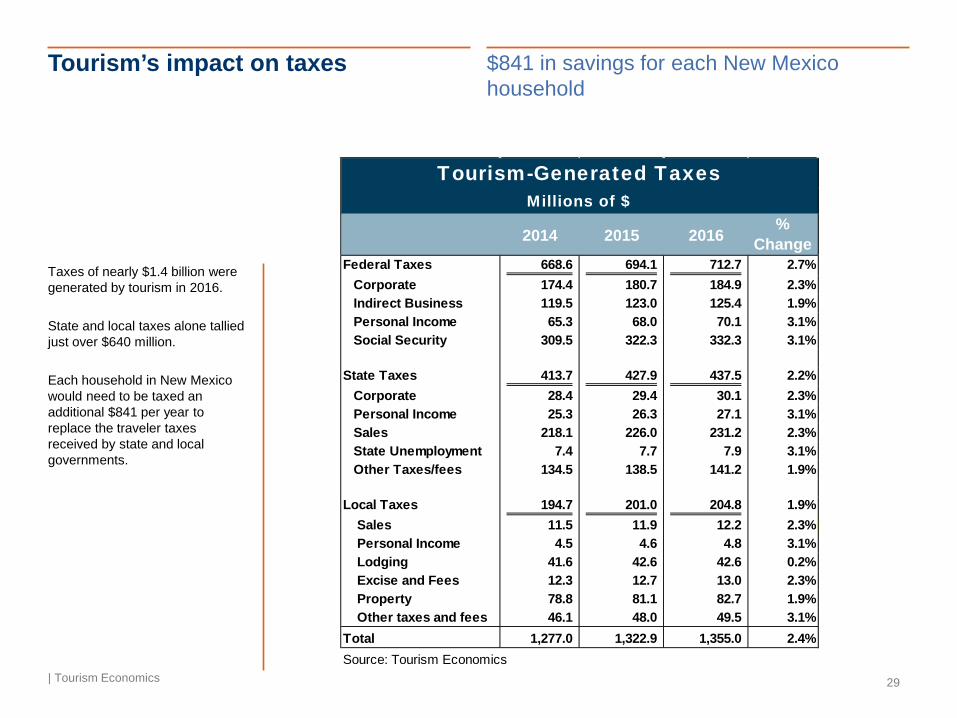
$841 in savings for each New Mexico household
Taxes of nearly $1.4 billion were generated by tourism in 2016. State and local taxes alone tallied just over $640 million. Each household in New Mexico would need to be taxed an additional $841 per year to replace the traveler taxes received by state and local governments.
2014 2015 2016%
ChangeFederal Taxes 668.6 694.1 712.7 2.7%
Corporate 174.4 180.7 184.9 2.3%Indirect Business 119.5 123.0 125.4 1.9%Personal Income 65.3 68.0 70.1 3.1%Social Security 309.5 322.3 332.3 3.1%
State Taxes 413.7 427.9 437.5 2.2%Corporate 28.4 29.4 30.1 2.3%Personal Income 25.3 26.3 27.1 3.1%Sales 218.1 226.0 231.2 2.3%State Unemployment 7.4 7.7 7.9 3.1%Other Taxes/fees 134.5 138.5 141.2 1.9%
Local Taxes 194.7 201.0 204.8 1.9% Sales 11.5 11.9 12.2 2.3% Personal Income 4.5 4.6 4.8 3.1% Lodging 41.6 42.6 42.6 0.2% Excise and Fees 12.3 12.7 13.0 2.3% Property 78.8 81.1 82.7 1.9% Other taxes and fees 46.1 48.0 49.5 3.1%Total 1,277.0 1,322.9 1,355.0 2.4%Source: Tourism Economics
Tourism-Generated TaxesMillions of $

4) Economic Impact in Context

The tourism sector is a major contributor to New Mexico’s economy
| Tourism Economics 31
The tourism sector sustains 4.8% of all income and 8.4% of all jobs in New Mexico
6.3%
3.1%
0.9%
0.8%
1.1%
0.9%
0% 2% 4% 6% 8% 10%
Employment
Income
Direct Indirect Induced
Share of total New Mexico employment and income supported by tourism
Percent of county totalSource: Tourism Economics; BEA
8.4% of total county employment
4.8% of total county wages

Figures in context
| Tourism Economics 32
The $2.5 billion in total wages generated by tourism is the equivalent of $3,275 for every household in New Mexico.
The number of jobs sustained by tourism (91,869) is just over the population of both Santa Fe and Taos combined (about 90,000).
Employment
Income
The $6.4 billion in tourism spending means that almost $730,600 was spent EVERY HOUR in New Mexico in 2016.
Tourism spending
About Tourism Economics
| Tourism Economics 33
Tourism Economics is an Oxford Economics company with a singular objective: combine an understanding of tourism dynamics with rigorous economics in order to answer the most important questions facing destinations, developers, and strategic planners. By combining quantitative methods with industry knowledge, Tourism Economics designs custom market strategies, destination recovery plans, tourism forecasting models, tourism policy analysis, and economic impact studies.
With over four decades of experience of our principal consultants, it is our passion to work as partners with our clients to achieve a destination’s full potential.
Oxford Economics is one of the world’s leading providers of economic analysis, forecasts and consulting advice. Founded in 1981 as a joint venture with Oxford University’s business college, Oxford Economics enjoys a reputation for high quality, quantitative analysis and evidence-based advice. For this, it draws on its own staff of more than 120 professional economists; a dedicated data analysis team; global modeling tools, and a range of partner institutions in Europe, the US and in the United Nations Project Link. Oxford Economics has offices in London, Oxford, Dubai, Philadelphia, and Belfast.
For more information:

County Results

Bernalillo County, Visitor Spending by Industry
| Tourism Economics 35
Year Lodging Food & Beverage Retail Recreation Transport Second
Homes Total Growth Rate
2016 $392.2 $522.9 $396.3 $281.5 $470.6 $46.7 $2,110.3 3.5%2015 $382.8 $499.8 $385.7 $262.3 $463.4 $45.7 $2,039.6 3.9%2014 $365.2 $484.3 $373.5 $254.2 $441.0 $44.7 $1,963.0 3.5%2013 $341.5 $481.8 $346.7 $251.1 $432.1 $43.6 $1,896.8 1.5%2012 $334.6 $475.2 $335.9 $245.0 $435.6 $41.7 $1,868.1 1.4%2011 $331.9 $471.8 $322.5 $250.8 $426.5 $39.3 $1,842.7
* Note: 2010 and 11 Lodging & FnB Spending data revised to reflect changes in state totals
Visitor Spending, (millions)Bernalillo County
$1,842.7$1,868.1
$1,896.8
$1,963.0
$2,039.6
$2,110.3
0.0%
0.5%
1.0%
1.5%
2.0%
2.5%
3.0%
3.5%
4.0%
4.5%
1,700.0
1,750.0
1,800.0
1,850.0
1,900.0
1,950.0
2,000.0
2,050.0
2,100.0
2,150.0
2011 2012 2013 2014 2015 2016
$ M
illio
ns
Total Growth Rate
$
19%
25%
13%
22%
19%2%
Source: Longwoods International; Tourism Economics
$2110.3m of
spending on Total
$522.9m of spending on food and beverage
$396.3m of spending on
retail
$470.6m of spending on local
transportation
$281.5m of spending on recreation
$46.7m of spending on second homes
$392.2m of spending on lodging

Bernalillo County, Tourism Impact
| Tourism Economics 36
3.7%
6.5%
0% 2% 4% 6% 8%
Labor Income
Employment
Tourism Share of County EconomyYear Direct Total (Dir, Ind, Induced)
County Tourism
Dependence2016 21,238 31,995 10.2%2015 20,777 32,320 10.3%2014 20,228 29,776 9.6%2013 19,911 29,608 9.6%2012 19,827 29,074 9.4%
Year Direct Total (Dir, Ind, Induced)
2016 $541.7 $956.32015 $514.5 $954.52014 $487.3 $844.12013 $476.0 $833.32012 $465.2 $805.4
Year Federal State Local Total
2016 $248.3 $154.6 $77.7 $480.62015 $236.0 $146.6 $72.9 $455.52014 $226.0 $141.2 $70.6 $437.72011 $214.5 $133.6 $69.0 $417.1
Tourism Labor Income (millions)
Total Tourism Tax Receipts (millions)
Bernalillo County
Bernalillo County
Tourism Employment
Catron County, Visitor Spending by Industry
| Tourism Economics 37
Year Lodging Food & Beverage Retail Recreation Transport Second
Homes Total Growth Rate
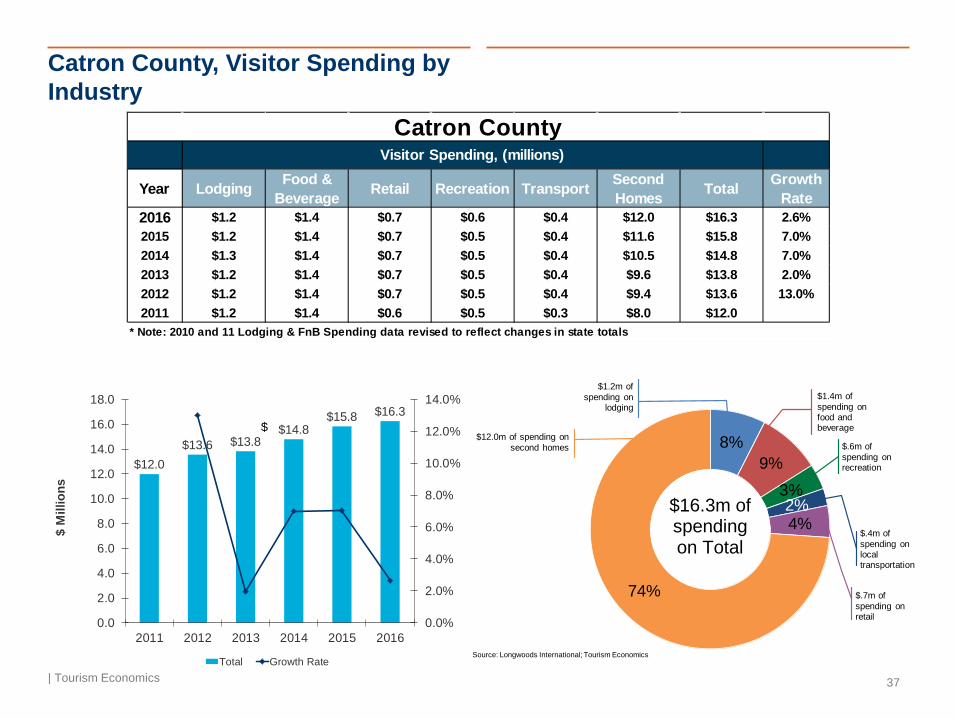
2016 $1.2 $1.4 $0.7 $0.6 $0.4 $12.0 $16.3 2.6%2015 $1.2 $1.4 $0.7 $0.5 $0.4 $11.6 $15.8 7.0%2014 $1.3 $1.4 $0.7 $0.5 $0.4 $10.5 $14.8 7.0%2013 $1.2 $1.4 $0.7 $0.5 $0.4 $9.6 $13.8 2.0%2012 $1.2 $1.4 $0.7 $0.5 $0.4 $9.4 $13.6 13.0%2011 $1.2 $1.4 $0.6 $0.5 $0.3 $8.0 $12.0
* Note: 2010 and 11 Lodging & FnB Spending data revised to reflect changes in state totals
Visitor Spending, (millions)Catron County
$12.0$13.6 $13.8
$14.8$15.8 $16.3
0.0%
2.0%
4.0%
6.0%
8.0%
10.0%
12.0%
14.0%
0.0
2.0
4.0
6.0
8.0
10.0
12.0
14.0
16.0
18.0
2011 2012 2013 2014 2015 2016
$ M
illio
ns
Total Growth Rate
$ 8%
9%3%2%4%
74%
Source: Longwoods International; Tourism Economics
$16.3m of spending on Total
$1.4m of spending on food and beverage
$.7m of spending on retail
$.4m of spending on local transportation
$.6m of spending on recreation
$12.0m of spending on second homes
$1.2m of spending on
lodging
Catron County, Tourism Impact
| Tourism Economics 38
10.6%
23.4%
0% 5% 10% 15% 20% 25%
Labor Income
Employment
Tourism Share of County EconomyYear Direct Total (Dir,
Ind, Induced)
County Tourism
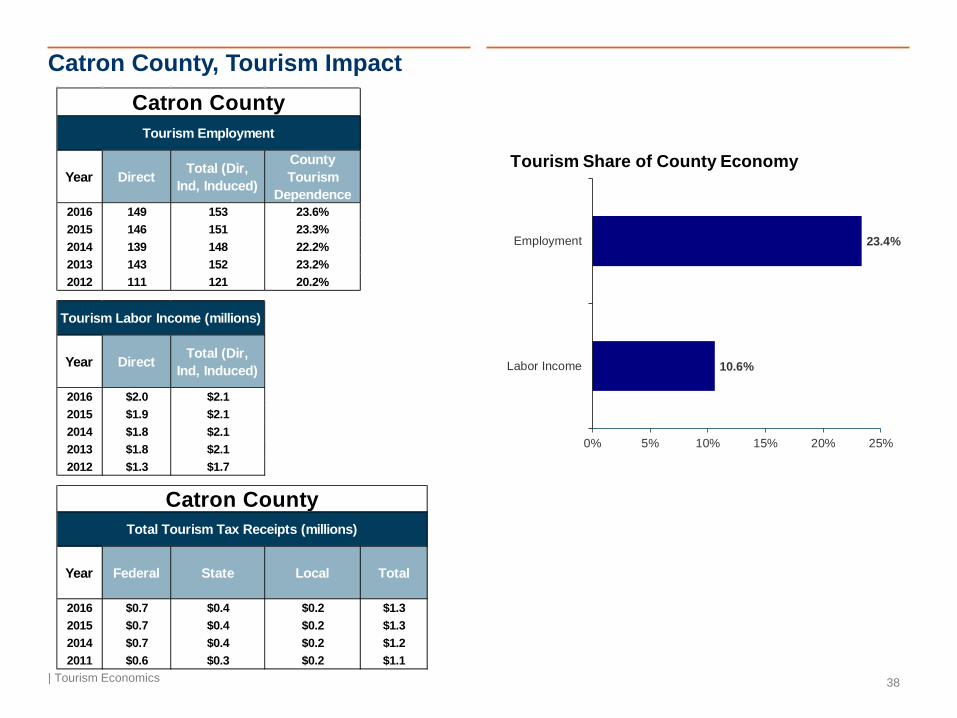
Dependence2016 149 153 23.6%2015 146 151 23.3%2014 139 148 22.2%2013 143 152 23.2%2012 111 121 20.2%
Year Direct Total (Dir, Ind, Induced)
2016 $2.0 $2.12015 $1.9 $2.12014 $1.8 $2.12013 $1.8 $2.12012 $1.3 $1.7
Year Federal State Local Total
2016 $0.7 $0.4 $0.2 $1.32015 $0.7 $0.4 $0.2 $1.32014 $0.7 $0.4 $0.2 $1.22011 $0.6 $0.3 $0.2 $1.1
Tourism Labor Income (millions)
Total Tourism Tax Receipts (millions)
Catron County
Catron County
Tourism Employment

Chaves County, Visitor Spending by Industry
| Tourism Economics 39
Year Lodging Food & Beverage Retail Recreation Transport Second
Homes Total Growth Rate
2016 $32.6 $39.9 $35.4 $14.7 $30.3 $5.0 $157.9 -0.5%2015 $34.1 $39.4 $35.1 $14.3 $30.8 $5.1 $158.7 -1.7%2014 $35.4 $39.4 $35.1 $14.4 $31.7 $5.4 $161.5 5.8%2013 $33.2 $37.4 $31.9 $14.2 $30.3 $5.5 $152.6 7.3%2012 $29.8 $36.5 $29.6 $13.8 $27.2 $5.3 $142.2 7.6%2011 $28.4 $35.8 $24.7 $12.7 $25.8 $4.8 $132.2
* Note: 2010 and 11 Lodging & FnB Spending data revised to reflect changes in state totals
Visitor Spending, (millions)Chaves County
$132.2$142.2
$152.6$161.5 $158.7 $157.9
-4.0%
-2.0%
0.0%
2.0%
4.0%
6.0%
8.0%
10.0%
0.0
20.0
40.0
60.0
80.0
100.0
120.0
140.0
160.0
180.0
2011 2012 2013 2014 2015 2016
$ M
illio
ns
Total Growth Rate
$
21%
25%
9%
19%
23%
3%
Source: Longwoods International; Tourism Economics
$157.9m of spending on Total
$39.9m of spending on food and beverage
$30.3m of spending on local
transportation
$14.7m of spending on
recreation
$35.4m of spending on retail
$5m of spending on second homes $32.6m of
spending on lodging

Chaves County, Tourism Impact
| Tourism Economics 40
6.2%
9.5%
0% 2% 4% 6% 8% 10%
Labor Income
Employment
Tourism Share of County EconomyYear Direct Total (Dir, Ind, Induced)
County Tourism
Dependence2016 2,058 2,431 11.6%2015 2,061 2,457 11.7%2014 2,079 2,607 12.6%2013 2,106 2,623 12.6%2012 1,970 2,449 11.5%
Year Direct Total (Dir, Ind, Induced)
2016 $45.0 $59.52015 $43.3 $58.32014 $42.7 $62.32013 $41.0 $59.92012 $38.2 $55.7
Year Federal State Local Total
2016 $18.9 $11.5 $5.0 $35.42015 $18.8 $11.7 $5.4 $36.02014 $18.8 $11.8 $5.4 $36.02011 $15.9 $10.0 $4.6 $30.5
Tourism Labor Income (millions)
Total Tourism Tax Receipts (millions)
Chaves County
Chaves County
Tourism Employment
Cibola County, Visitor Spending by Industry
| Tourism Economics 41
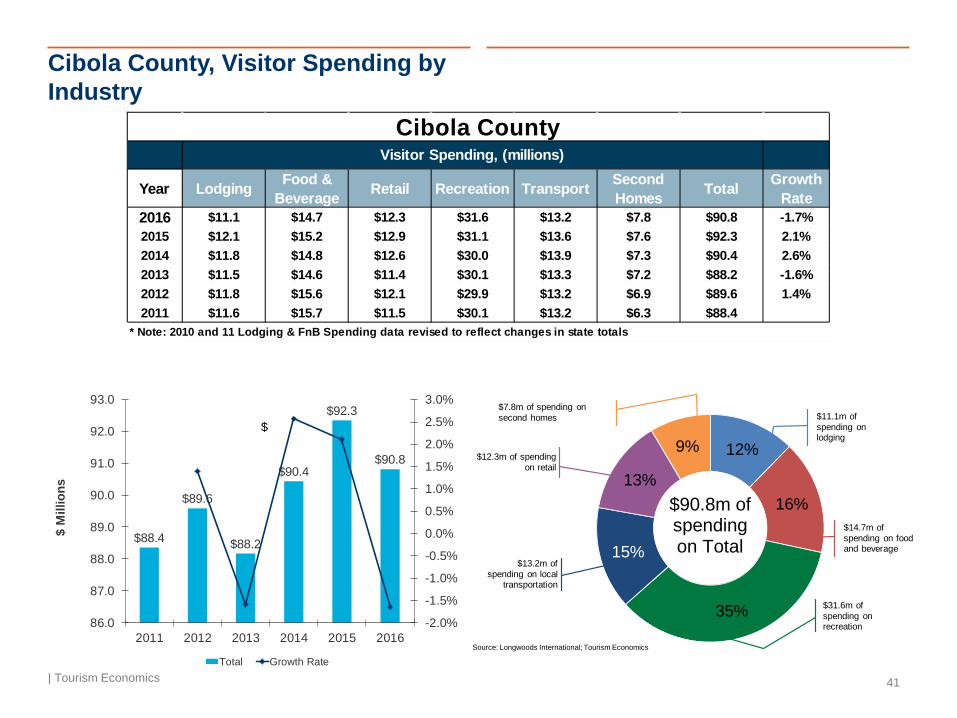
Year Lodging Food & Beverage Retail Recreation Transport Second
Homes Total Growth Rate
2016 $11.1 $14.7 $12.3 $31.6 $13.2 $7.8 $90.8 -1.7%2015 $12.1 $15.2 $12.9 $31.1 $13.6 $7.6 $92.3 2.1%2014 $11.8 $14.8 $12.6 $30.0 $13.9 $7.3 $90.4 2.6%2013 $11.5 $14.6 $11.4 $30.1 $13.3 $7.2 $88.2 -1.6%2012 $11.8 $15.6 $12.1 $29.9 $13.2 $6.9 $89.6 1.4%2011 $11.6 $15.7 $11.5 $30.1 $13.2 $6.3 $88.4
* Note: 2010 and 11 Lodging & FnB Spending data revised to reflect changes in state totals
Visitor Spending, (millions)Cibola County
$88.4
$89.6
$88.2
$90.4
$92.3
$90.8
-2.0%
-1.5%
-1.0%
-0.5%
0.0%
0.5%
1.0%
1.5%
2.0%
2.5%
3.0%
86.0
87.0
88.0
89.0
90.0
91.0
92.0
93.0
2011 2012 2013 2014 2015 2016
$ M
illio
ns
Total Growth Rate
$
12%
16%
35%
15%
13%
9%
Source: Longwoods International; Tourism Economics
$90.8m of spending on Total
$14.7m of spending on food and beverage
$12.3m of spending on retail
$13.2m of spending on local
transportation
$31.6m of spending on recreation
$7.8m of spending on second homes $11.1m of
spending on lodging
Cibola County, Tourism Impact
| Tourism Economics 42
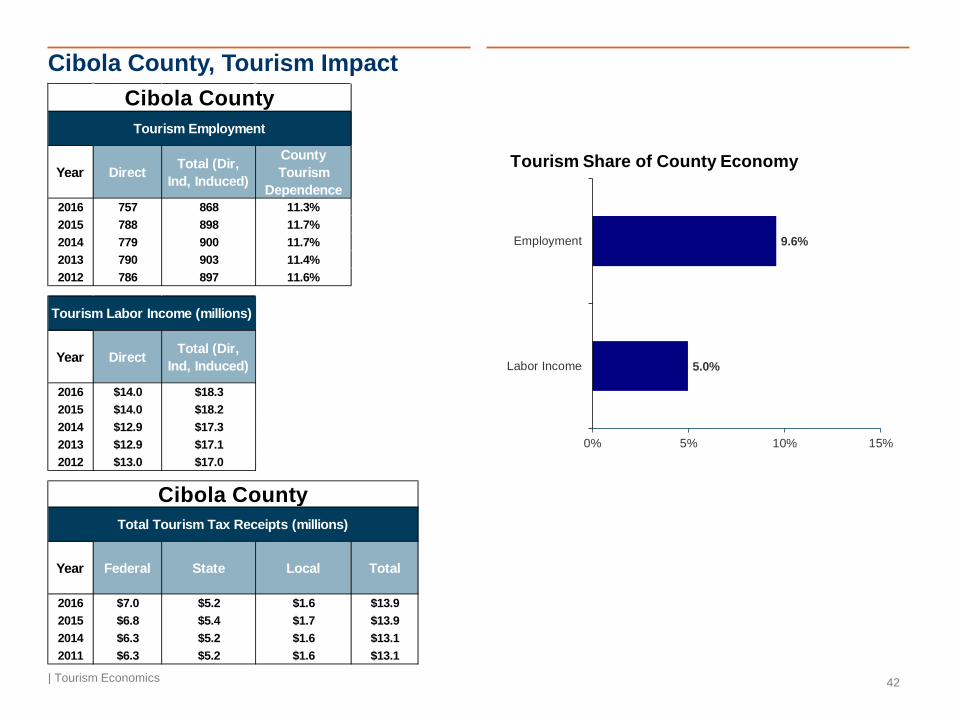
5.0%
9.6%
0% 5% 10% 15%
Labor Income
Employment
Tourism Share of County EconomyYear Direct Total (Dir,
Ind, Induced)
County Tourism
Dependence2016 757 868 11.3%2015 788 898 11.7%2014 779 900 11.7%2013 790 903 11.4%2012 786 897 11.6%
Year Direct Total (Dir, Ind, Induced)
2016 $14.0 $18.32015 $14.0 $18.22014 $12.9 $17.32013 $12.9 $17.12012 $13.0 $17.0
Year Federal State Local Total
2016 $7.0 $5.2 $1.6 $13.92015 $6.8 $5.4 $1.7 $13.92014 $6.3 $5.2 $1.6 $13.12011 $6.3 $5.2 $1.6 $13.1
Tourism Labor Income (millions)
Total Tourism Tax Receipts (millions)
Cibola County
Cibola County
Tourism Employment

Colfax County, Visitor Spending by Industry
| Tourism Economics 43
Year Lodging Food & Beverage Retail Recreation Transport Second
Homes Total Growth Rate
2016 $20.0 $18.6 $13.4 $10.1 $12.4 $31.3 $105.8 5.0%2015 $18.8 $17.6 $12.9 $9.3 $12.4 $29.7 $100.8 2.6%2014 $17.6 $16.5 $12.2 $9.7 $13.1 $29.2 $98.3 2.0%2013 $17.3 $17.0 $11.6 $9.3 $12.6 $28.6 $96.3 2.4%2012 $16.4 $16.5 $11.1 $9.2 $12.9 $28.0 $94.1 1.2%2011 $17.2 $17.3 $9.9 $9.4 $12.9 $26.2 $92.9
* Note: 2010 and 11 Lodging & FnB Spending data revised to reflect changes in state totals
Visitor Spending, (millions)Colfax County
$92.9$94.1
$96.3$98.3
$100.8
$105.8
0.0%
1.0%
2.0%
3.0%
4.0%
5.0%
6.0%
85.0
90.0
95.0
100.0
105.0
110.0
2011 2012 2013 2014 2015 2016
$ M
illio
ns
Total Growth Rate
$
19%
18%
9%12%
13%
29%
Source: Longwoods International; Tourism Economics
$105.8m of spending on Total
$18.6m of spending on food and beverage
$13.4m of spending on retail
$12.4m of spending on local
transportation
$10.1m of spending on recreation
$31.3m of spending on second homes
$20.0m of spending on lodging

Colfax County, Tourism Impact
| Tourism Economics 44
27.8%
36.6%
0% 10% 20% 30% 40%
Labor Income
Employment
Tourism Share of County EconomyYear Direct Total (Dir, Ind, Induced)
County Tourism
Dependence2016 1,758 1,890 37.0%2015 1,687 1,743 34.1%2014 1,702 1,821 36.0%2013 1,684 1,809 36.6%2012 1,565 1,692 33.4%
Year Direct Total (Dir, Ind, Induced)
2016 $40.5 $45.62015 $39.0 $41.12014 $36.2 $40.62013 $33.0 $37.52012 $32.8 $37.4
Year Federal State Local Total
2016 $14.3 $6.9 $3.4 $24.62015 $14.0 $6.6 $3.2 $23.82014 $13.1 $6.3 $3.1 $22.52011 $11.5 $5.9 $2.8 $20.2
Tourism Labor Income (millions)
Total Tourism Tax Receipts (millions)
Colfax County
Colfax County
Tourism Employment

Curry County, Visitor Spending by Industry
| Tourism Economics 45
Year Lodging Food & Beverage Retail Recreation Transport Second
Homes Total Growth Rate
2016 $22.9 $26.6 $23.9 $10.2 $18.5 $1.4 $103.5 2.7%2015 $22.4 $26.1 $23.4 $9.7 $17.8 $1.4 $100.7 1.4%2014 $22.0 $25.1 $23.3 $9.4 $18.4 $1.2 $99.4 -0.5%2013 $22.4 $26.8 $22.5 $9.9 $17.4 $0.9 $99.9 3.6%2012 $21.3 $26.0 $22.1 $9.7 $16.6 $0.6 $96.3 6.4%2011 $20.1 $25.6 $18.9 $9.3 $16.0 $0.5 $90.5
* Note: 2010 and 11 Lodging & FnB Spending data revised to reflect changes in state totals
Visitor Spending, (millions)Curry County
$90.5
$96.3
$99.9 $99.4$100.7
$103.5
-1.0%
0.0%
1.0%
2.0%
3.0%
4.0%
5.0%
6.0%
7.0%
80.0
85.0
90.0
95.0
100.0
105.0
2011 2012 2013 2014 2015 2016
$ M
illio
ns
Total Growth Rate
$
22%
26%
10%
18%
23%1%
Source: Longwoods International; Tourism Economics
$103.5m of spending on Total
$26.6m of spending on food and beverage
$23.9m of spending on retail
$18.5m of spending on local
transportation
$10.2m of spending on recreation
$1.4m of spending on second homes $22.9m of
spending on lodging

Curry County, Tourism Impact
| Tourism Economics 46
4.3%
7.3%
0% 2% 4% 6% 8%
Labor Income
Employment
Tourism Share of County EconomyYear Direct Total (Dir, Ind, Induced)
County Tourism
Dependence2016 1,237 1,666 9.8%2015 1,221 1,518 8.9%2014 1,230 1,671 10.0%2013 1,271 1,717 10.2%2012 1,189 1,662 9.9%
Year Direct Total (Dir, Ind, Induced)
2016 $25.9 $42.42015 $25.4 $36.72014 $25.4 $41.92013 $25.4 $41.72012 $24.0 $41.4
Year Federal State Local Total
2016 $12.0 $7.7 $3.7 $23.42015 $12.0 $7.7 $3.8 $23.52014 $11.7 $7.6 $3.6 $22.92011 $10.6 $6.9 $3.4 $20.9
Tourism Labor Income (millions)
Total Tourism Tax Receipts (millions)
Curry County
Curry County
Tourism Employment

De Baca County, Visitor Spending by Industry
| Tourism Economics 47
Year Lodging Food & Beverage Retail Recreation Transport Second
Homes Total Growth Rate
2016 $0.5 $0.7 $0.8 $0.1 $0.3 $1.8 $4.2 -0.8%2015 $0.5 $0.7 $0.8 $0.1 $0.3 $1.8 $4.2 1.0%2014 $0.5 $0.6 $0.7 $0.1 $0.3 $1.8 $4.2 3.1%2013 $0.6 $0.7 $0.7 $0.1 $0.3 $1.7 $4.1 -1.7%2012 $0.6 $0.7 $0.7 $0.1 $0.3 $1.7 $4.1 5.0%2011 $0.5 $0.7 $0.6 $0.1 $0.3 $1.7 $3.9
* Note: 2010 and 11 Lodging & FnB Spending data revised to reflect changes in state totals
Visitor Spending, (millions)De Baca County
$3.9
$4.1
$4.1
$4.2$4.2
$4.2
-2.0%
-1.0%
0.0%
1.0%
2.0%
3.0%
4.0%
5.0%
6.0%
3.83.83.93.94.04.04.14.14.24.24.34.3
2011 2012 2013 2014 2015 2016
$ M
illio
ns
Total Growth Rate
$
13%
16%
3%7%
18%
43%
Source: Longwoods International; Tourism Economics
$4.2m of spending on Total
$.7m of spending on food and beverage
$.8m of spending on
retail$.3m of spending on local transportation
$.1m of spending on recreation
$1.8m of spending on second homes
$.5m of spending on lodging

De Baca County, Tourism Impact
| Tourism Economics 48
3.6%
8.2%
0% 2% 4% 6% 8% 10%
Labor Income
Employment
Tourism Share of County EconomyYear Direct Total (Dir, Ind, Induced)
County Tourism
Dependence2016 37 40 8.2%2015 40 43 8.6%2014 39 46 9.6%2013 38 45 9.5%2012 36 44 9.1%
Year Direct Total (Dir, Ind, Induced)
2016 $0.6 $0.72015 $0.6 $0.72014 $0.6 $0.82013 $0.5 $0.82012 $0.5 $0.8
Year Federal State Local Total
2016 $0.2 $0.2 $0.1 $0.52015 $0.3 $0.2 $0.1 $0.52014 $0.3 $0.2 $0.1 $0.52011 $0.2 $0.2 $0.1 $0.5
Tourism Labor Income (millions)
Total Tourism Tax Receipts (millions)
De Baca County
De Baca County
Tourism Employment
Dona Ana County, Visitor Spending by Industry
| Tourism Economics 49
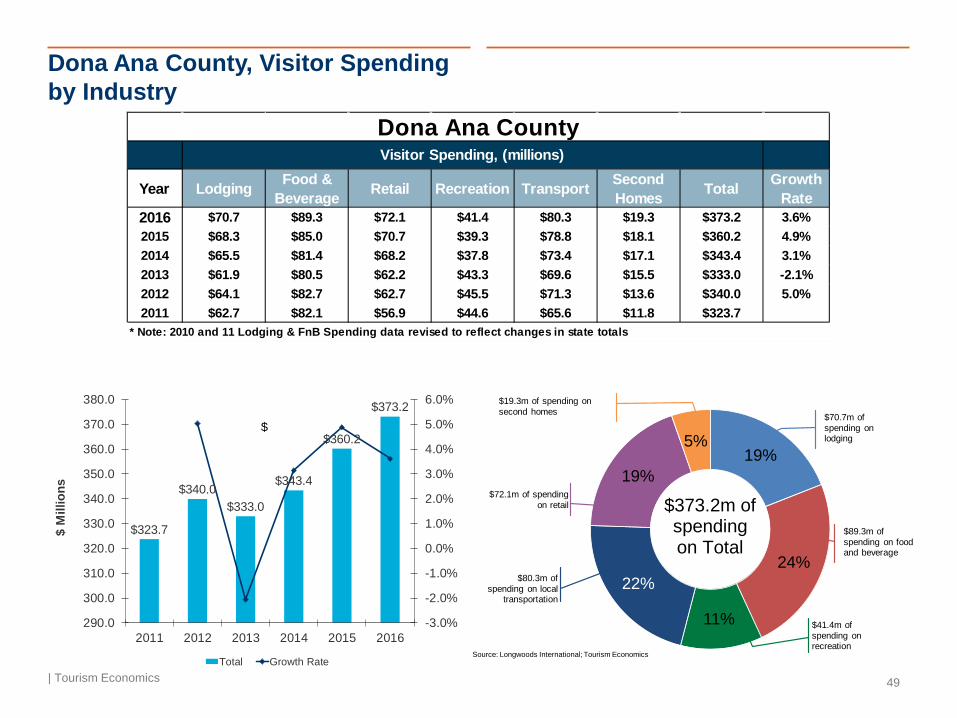
Year Lodging Food & Beverage Retail Recreation Transport Second
Homes Total Growth Rate
2016 $70.7 $89.3 $72.1 $41.4 $80.3 $19.3 $373.2 3.6%2015 $68.3 $85.0 $70.7 $39.3 $78.8 $18.1 $360.2 4.9%2014 $65.5 $81.4 $68.2 $37.8 $73.4 $17.1 $343.4 3.1%2013 $61.9 $80.5 $62.2 $43.3 $69.6 $15.5 $333.0 -2.1%2012 $64.1 $82.7 $62.7 $45.5 $71.3 $13.6 $340.0 5.0%2011 $62.7 $82.1 $56.9 $44.6 $65.6 $11.8 $323.7
* Note: 2010 and 11 Lodging & FnB Spending data revised to reflect changes in state totals
Visitor Spending, (millions)Dona Ana County
$323.7
$340.0$333.0
$343.4
$360.2
$373.2
-3.0%
-2.0%
-1.0%
0.0%
1.0%
2.0%
3.0%
4.0%
5.0%
6.0%
290.0
300.0
310.0
320.0
330.0
340.0
350.0
360.0
370.0
380.0
2011 2012 2013 2014 2015 2016
$ M
illio
ns
Total Growth Rate
$
19%
24%
11%
22%
19%
5%
Source: Longwoods International; Tourism Economics
$373.2m of spending on Total
$89.3m of spending on food and beverage
$72.1m of spending on retail
$80.3m of spending on local
transportation
$41.4m of spending on recreation
$19.3m of spending on second homes $70.7m of
spending on lodging

Dona Ana County, Tourism Impact
| Tourism Economics 50
3.2%
5.4%
0% 2% 4% 6%
Labor Income
Employment
Tourism Share of County EconomyYear Direct Total (Dir,
Ind, Induced)
County Tourism
Dependence2016 3,901 6,167 8.7%2015 3,759 6,163 8.7%2014 3,731 5,617 8.0%2013 3,778 5,761 8.3%2012 3,730 5,683 8.2%
Year Direct Total (Dir, Ind, Induced)
2016 $84.3 $171.22015 $80.1 $170.92014 $76.5 $146.72013 $77.2 $149.92012 $77.5 $148.9
Year Federal State Local Total
2016 $42.3 $28.0 $14.3 $84.62015 $41.3 $27.3 $14.1 $82.72014 $39.5 $26.1 $13.5 $79.12011 $38.8 $25.6 $13.6 $78.0
Tourism Labor Income (millions)
Total Tourism Tax Receipts (millions)
Dona Ana County
Dona Ana County
Tourism Employment

Eddy County, Visitor Spending by Industry
| Tourism Economics 51
Year Lodging Food & Beverage Retail Recreation Transport Second
Homes Total Growth Rate
2016 $57.9 $52.4 $42.6 $19.3 $34.4 $5.4 $211.9 -4.7%2015 $64.8 $54.7 $43.4 $18.6 $35.3 $5.4 $222.3 0.4%2014 $65.6 $54.0 $42.7 $18.6 $35.3 $5.2 $221.4 16.7%2013 $50.4 $48.8 $37.7 $16.5 $31.7 $4.7 $189.8 4.1%2012 $45.1 $48.4 $37.0 $16.7 $30.9 $4.4 $182.4 10.3%2011 $41.8 $44.0 $33.2 $15.3 $27.3 $3.8 $165.3
* Note: 2010 and 11 Lodging & FnB Spending data revised to reflect changes in state totals
Visitor Spending, (millions)Eddy County
$165.3$182.4 $189.8
$221.4 $222.3$211.9
-10.0%
-5.0%
0.0%
5.0%
10.0%
15.0%
20.0%
0.0
50.0
100.0
150.0
200.0
250.0
2011 2012 2013 2014 2015 2016
$ M
illio
ns
Total Growth Rate
$
27%
25%9%
16%
20%3%
Source: Longwoods International; Tourism Economics
$211.9m of spending on Total
$52.4m of spending on food and beverage
$42.6m of spending on retail
$34.4m of spending on local
transportation
$19.3m of spending on
recreation
$5.4m of spending on second homes
$57.9m of spending on lodging
Eddy County, Tourism Impact
| Tourism Economics 52
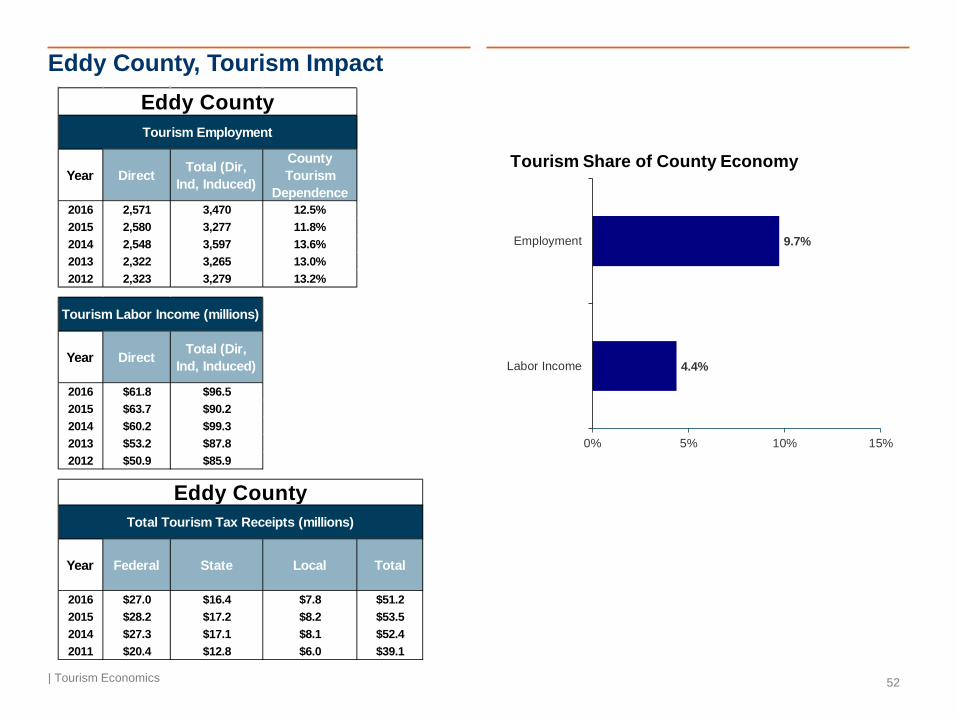
4.4%
9.7%
0% 5% 10% 15%
Labor Income
Employment
Tourism Share of County EconomyYear Direct Total (Dir,
Ind, Induced)
County Tourism
Dependence2016 2,571 3,470 12.5%2015 2,580 3,277 11.8%2014 2,548 3,597 13.6%2013 2,322 3,265 13.0%2012 2,323 3,279 13.2%
Year Direct Total (Dir, Ind, Induced)
2016 $61.8 $96.52015 $63.7 $90.22014 $60.2 $99.32013 $53.2 $87.82012 $50.9 $85.9
Year Federal State Local Total
2016 $27.0 $16.4 $7.8 $51.22015 $28.2 $17.2 $8.2 $53.52014 $27.3 $17.1 $8.1 $52.42011 $20.4 $12.8 $6.0 $39.1
Tourism Labor Income (millions)
Total Tourism Tax Receipts (millions)
Eddy County
Eddy County
Tourism Employment
Grant County, Visitor Spending by Industry
| Tourism Economics 53
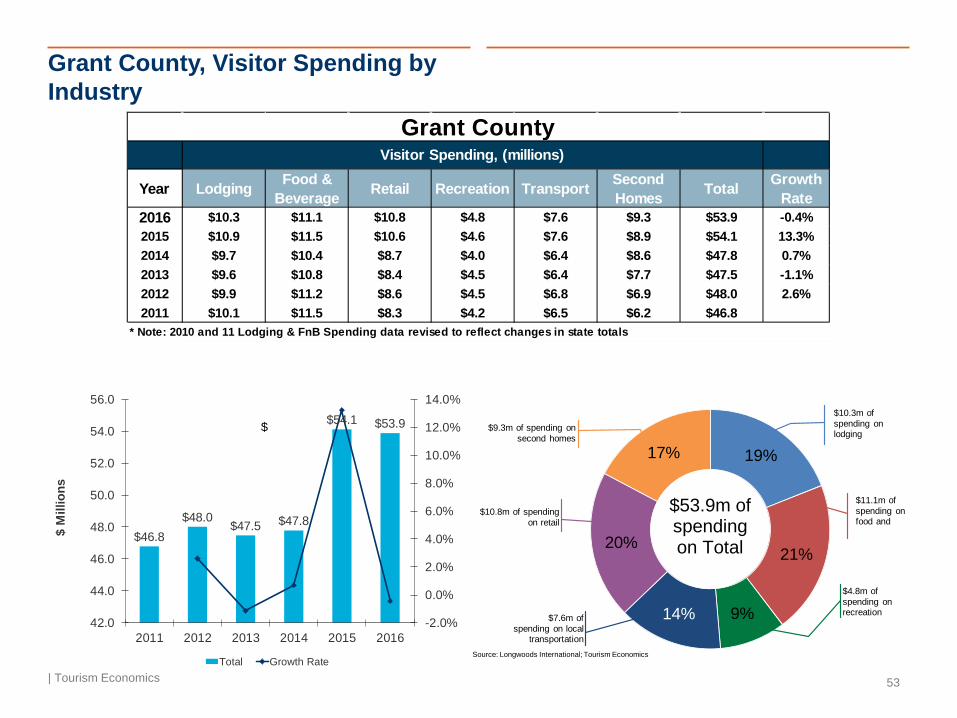
Year Lodging Food & Beverage Retail Recreation Transport Second
Homes Total Growth Rate
2016 $10.3 $11.1 $10.8 $4.8 $7.6 $9.3 $53.9 -0.4%2015 $10.9 $11.5 $10.6 $4.6 $7.6 $8.9 $54.1 13.3%2014 $9.7 $10.4 $8.7 $4.0 $6.4 $8.6 $47.8 0.7%2013 $9.6 $10.8 $8.4 $4.5 $6.4 $7.7 $47.5 -1.1%2012 $9.9 $11.2 $8.6 $4.5 $6.8 $6.9 $48.0 2.6%2011 $10.1 $11.5 $8.3 $4.2 $6.5 $6.2 $46.8
* Note: 2010 and 11 Lodging & FnB Spending data revised to reflect changes in state totals
Visitor Spending, (millions)Grant County
$46.8$48.0
$47.5 $47.8
$54.1 $53.9
-2.0%
0.0%
2.0%
4.0%
6.0%
8.0%
10.0%
12.0%
14.0%
42.0
44.0
46.0
48.0
50.0
52.0
54.0
56.0
2011 2012 2013 2014 2015 2016
$ M
illio
ns
Total Growth Rate
$
19%
21%
9%14%
20%
17%
Source: Longwoods International; Tourism Economics
$53.9m of spending on Total
$11.1m of spending on food and
$10.8m of spending on retail
$7.6m of spending on local
transportation
$4.8m of spending on recreation
$9.3m of spending on second homes
$10.3m of spending on lodging

Grant County, Tourism Impact
| Tourism Economics 54
3.2%
7.0%
0% 2% 4% 6% 8%
Labor Income
Employment
Tourism Share of County EconomyYear Direct Total (Dir,
Ind, Induced)
County Tourism
Dependence2016 640 776 8.3%2015 645 766 8.2%2014 632 789 8.2%2013 635 789 8.2%2012 679 830 8.8%
Year Direct Total (Dir, Ind, Induced)
2016 $11.2 $16.52015 $10.9 $15.42014 $10.8 $16.62013 $11.1 $16.72012 $12.1 $17.6
Year Federal State Local Total
2016 $5.1 $3.3 $1.4 $9.72015 $5.0 $3.3 $1.5 $9.82014 $4.8 $3.0 $1.5 $9.32011 $4.8 $3.1 $1.5 $9.3
Tourism Labor Income (millions)
Total Tourism Tax Receipts (millions)
Grant County
Grant County
Tourism Employment

Guadalupe County, Visitor Spending by Industry
| Tourism Economics 55
Year Lodging Food & Beverage Retail Recreation Transport Second
Homes Total Growth Rate
2016 $19.2 $15.9 $13.6 $6.4 $8.9 $4.2 $68.3 4.8%2015 $18.4 $15.3 $13.1 $5.9 $8.6 $3.9 $65.2 1.4%2014 $18.0 $15.2 $13.1 $5.9 $8.8 $3.2 $64.3 10.7%2013 $17.1 $11.8 $12.4 $6.1 $8.4 $2.3 $58.1 3.4%2012 $16.2 $11.7 $11.9 $5.9 $8.7 $1.7 $56.1 3.0%2011 $15.8 $11.8 $11.2 $5.9 $8.4 $1.4 $54.5
* Note: 2010 and 11 Lodging & FnB Spending data revised to reflect changes in state totals
Visitor Spending, (millions)Guadalupe County
$54.5 $56.1 $58.1$64.3 $65.2
$68.3
0.0%
2.0%
4.0%
6.0%
8.0%
10.0%
12.0%
0.0
10.0
20.0
30.0
40.0
50.0
60.0
70.0
80.0
2011 2012 2013 2014 2015 2016
$ M
illio
ns
Total Growth Rate
$
28%
24%9%
13%
20%
6%
Source: Longwoods International; Tourism Economics
$68.3m of spending on Total
$15.9m of spending on food and beverage
$13.6m of spending on retail
$8.9m of spending on local
transportation
$6.4m of spending on
recreation
$4.2m of spending on second homes $19.2m of
spending on lodging

Guadalupe County, Tourism Impact
| Tourism Economics 56
31.6%
51.6%
0% 20% 40% 60%
Labor Income
Employment
Tourism Share of County EconomyYear Direct Total (Dir,
Ind, Induced)
County Tourism
Dependence2016 813 855 64.6%2015 763 782 59.1%2014 723 766 58.4%2013 627 671 52.5%2012 588 632 49.4%
Year Direct Total (Dir, Ind, Induced)
2016 $14.6 $16.32015 $13.8 $14.52014 $12.6 $14.22013 $10.6 $12.22012 $10.2 $11.8
Year Federal State Local Total
2016 $6.4 $4.2 $1.4 $12.02015 $5.8 $4.0 $1.3 $11.12014 $5.4 $4.0 $1.2 $10.62011 $4.5 $3.4 $1.0 $8.9
Tourism Labor Income (millions)
Total Tourism Tax Receipts (millions)
Guadalupe County
Guadalupe County
Tourism Employment

Harding County, Visitor Spending by Industry
| Tourism Economics 57
Year Lodging Food & Beverage Retail Recreation Transport Second
Homes Total Growth Rate
2016 $0.0 $0.1 $0.1 $0.0 $0.1 $1.0 $1.4 2.5%2015 $0.0 $0.1 $0.1 $0.0 $0.1 $1.0 $1.4 1.8%2014 $0.0 $0.1 $0.1 $0.0 $0.1 $1.0 $1.3 12.1%2013 $0.0 $0.1 $0.1 $0.0 $0.1 $0.8 $1.2 11.0%2012 $0.0 $0.1 $0.1 $0.0 $0.1 $0.7 $1.1 10.8%2011 $0.0 $0.1 $0.1 $0.0 $0.1 $0.6 $1.0
* Note: 2010 and 11 Lodging & FnB Spending data revised to reflect changes in state totals
Visitor Spending, (millions)Harding County
$1.0$1.1
$1.2$1.3 $1.4 $1.4
0.0%
2.0%
4.0%
6.0%
8.0%
10.0%
12.0%
14.0%
0.0
0.2
0.4
0.6
0.8
1.0
1.2
1.4
1.6
2011 2012 2013 2014 2015 2016
$ M
illio
ns
Total Growth Rate
$ 3%6%
3%4%
9%
75%
Source: Longwoods International; Tourism Economics
$1.4m of spending on Total
$.1m of spending on food and beverage
$.1m of spending on retail
$.1m of spending on local transportation
$.0m of spending on recreation
$1.0m of spending on second homes
$.0m of spending on lodging

Harding County, Tourism Impact
| Tourism Economics 58
4.6%
10.5%
0% 5% 10% 15%
Labor Income
Employment
Tourism Share of County EconomyYear Direct Total (Dir,
Ind, Induced)
County Tourism
Dependence2016 16 19 9.6%2015 16 19 9.2%2014 16 21 12.6%2013 15 19 10.7%2012 13 16 9.1%
Year Direct Total (Dir, Ind, Induced)
2016 $0.2 $0.32015 $0.2 $0.32014 $0.2 $0.42013 $0.2 $0.32012 $0.2 $0.3
Year Federal State Local Total
2016 $0.1 $0.0 $0.0 $0.22015 $0.1 $0.0 $0.0 $0.22014 $0.1 $0.0 $0.0 $0.22011 $0.1 $0.0 $0.0 $0.1
Tourism Labor Income (millions)
Total Tourism Tax Receipts (millions)
Harding County
Harding County
Tourism Employment

Hidalgo County, Visitor Spending by Industry
| Tourism Economics 59
Year Lodging Food & Beverage Retail Recreation Transport Second
Homes Total Growth Rate
2016 $8.4 $9.8 $5.8 $2.8 $5.2 $1.1 $33.2 -9.4%2015 $10.9 $10.4 $6.3 $2.8 $5.3 $1.1 $36.7 -12.5%2014 $12.9 $11.8 $7.2 $3.2 $5.4 $1.4 $41.9 3.7%2013 $11.9 $11.7 $6.6 $3.2 $5.3 $1.7 $40.4 -2.1%2012 $12.0 $12.0 $6.6 $3.3 $5.9 $1.6 $41.3 5.3%2011 $11.2 $11.8 $6.1 $3.2 $5.4 $1.5 $39.2
* Note: 2010 and 11 Lodging & FnB Spending data revised to reflect changes in state totals
Visitor Spending, (millions)Hidalgo County
$39.2$41.3 $40.4 $41.9
$36.7$33.2
-14.0%-12.0%-10.0%-8.0%-6.0%-4.0%-2.0%0.0%2.0%4.0%6.0%8.0%
0.0
5.0
10.0
15.0
20.0
25.0
30.0
35.0
40.0
45.0
2011 2012 2013 2014 2015 2016
$ M
illio
ns
Total Growth Rate
$
25%
30%9%
16%
17%3%
Source: Longwoods International; Tourism Economics
$33.2m of spending on Total
$9.8m of spending on food and beverage
$5.8m of spending on
retail
$5.2m of spending on local
transportation
$2.8m of spending on
recreation
$1.1m of spending on second homes $8.4m of
spending on lodging
Hidalgo County, Tourism Impact
| Tourism Economics 60
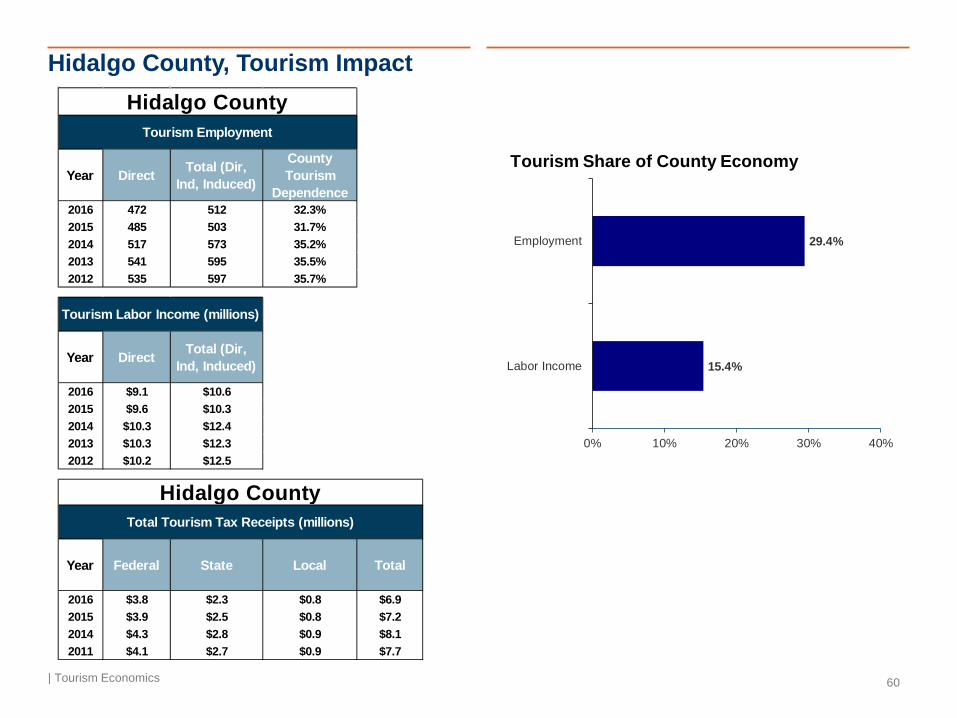
15.4%
29.4%
0% 10% 20% 30% 40%
Labor Income
Employment
Tourism Share of County EconomyYear Direct Total (Dir,
Ind, Induced)
County Tourism
Dependence2016 472 512 32.3%2015 485 503 31.7%2014 517 573 35.2%2013 541 595 35.5%2012 535 597 35.7%
Year Direct Total (Dir, Ind, Induced)
2016 $9.1 $10.62015 $9.6 $10.32014 $10.3 $12.42013 $10.3 $12.32012 $10.2 $12.5
Year Federal State Local Total
2016 $3.8 $2.3 $0.8 $6.92015 $3.9 $2.5 $0.8 $7.22014 $4.3 $2.8 $0.9 $8.12011 $4.1 $2.7 $0.9 $7.7
Tourism Labor Income (millions)
Total Tourism Tax Receipts (millions)
Hidalgo County
Hidalgo County
Tourism Employment
Lea County, Visitor Spending by Industry
| Tourism Economics 61
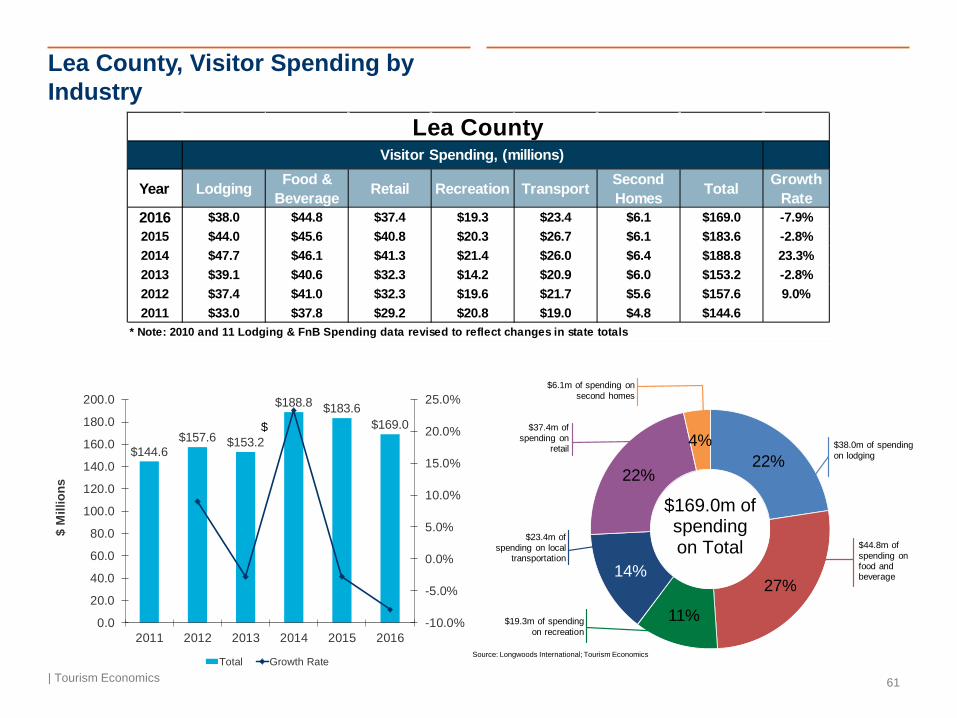
Year Lodging Food & Beverage Retail Recreation Transport Second
Homes Total Growth Rate
2016 $38.0 $44.8 $37.4 $19.3 $23.4 $6.1 $169.0 -7.9%2015 $44.0 $45.6 $40.8 $20.3 $26.7 $6.1 $183.6 -2.8%2014 $47.7 $46.1 $41.3 $21.4 $26.0 $6.4 $188.8 23.3%2013 $39.1 $40.6 $32.3 $14.2 $20.9 $6.0 $153.2 -2.8%2012 $37.4 $41.0 $32.3 $19.6 $21.7 $5.6 $157.6 9.0%2011 $33.0 $37.8 $29.2 $20.8 $19.0 $4.8 $144.6
* Note: 2010 and 11 Lodging & FnB Spending data revised to reflect changes in state totals
Visitor Spending, (millions)Lea County
$144.6$157.6 $153.2
$188.8 $183.6$169.0
-10.0%
-5.0%
0.0%
5.0%
10.0%
15.0%
20.0%
25.0%
0.0
20.0
40.0
60.0
80.0
100.0
120.0
140.0
160.0
180.0
200.0
2011 2012 2013 2014 2015 2016
$ M
illio
ns
Total Growth Rate
$
22%
27%
11%
14%
22%
4%
Source: Longwoods International; Tourism Economics
$169.0m of spending on Total $44.8m of
spending on food and beverage
$37.4m of spending on
retail
$23.4m of spending on local
transportation
$19.3m of spending on recreation
$6.1m of spending on second homes
$38.0m of spending on lodging

Lea County, Tourism Impact
| Tourism Economics 62
4.3%
8.4%
0% 2% 4% 6% 8% 10%
Labor Income
Employment
Tourism Share of County EconomyYear Direct Total (Dir,
Ind, Induced)
County Tourism
Dependence2016 2,323 3,209 9.6%2015 2,557 3,219 9.7%2014 2,492 3,698 11.7%2013 2,005 3,191 10.6%2012 2,232 3,854 13.5%
Year Direct Total (Dir, Ind, Induced)
2016 $54.7 $88.92015 $60.4 $85.62014 $58.7 $103.62013 $52.6 $96.02012 $59.2 $118.7
Year Federal State Local Total
2016 $23.5 $13.8 $6.9 $44.32015 $26.5 $15.3 $7.9 $49.72014 $26.6 $15.6 $8.1 $50.42011 $22.8 $12.7 $6.7 $42.2
Tourism Labor Income (millions)
Total Tourism Tax Receipts (millions)
Lea County
Lea County
Tourism Employment
Lincoln County, Visitor Spending by Industry
| Tourism Economics 63
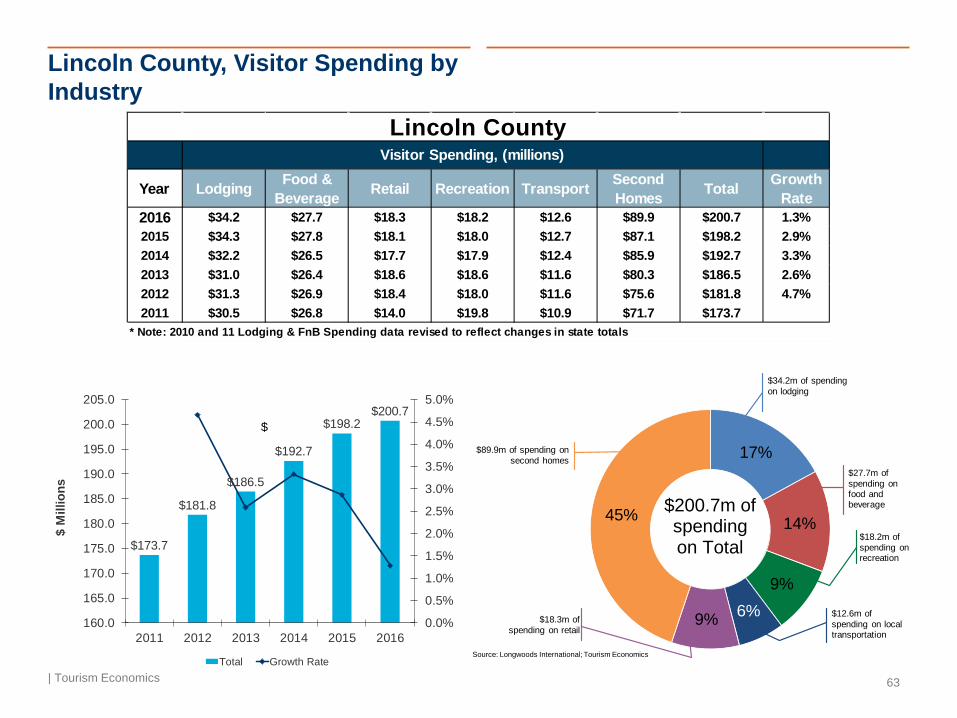
Year Lodging Food & Beverage Retail Recreation Transport Second
Homes Total Growth Rate
2016 $34.2 $27.7 $18.3 $18.2 $12.6 $89.9 $200.7 1.3%2015 $34.3 $27.8 $18.1 $18.0 $12.7 $87.1 $198.2 2.9%2014 $32.2 $26.5 $17.7 $17.9 $12.4 $85.9 $192.7 3.3%2013 $31.0 $26.4 $18.6 $18.6 $11.6 $80.3 $186.5 2.6%2012 $31.3 $26.9 $18.4 $18.0 $11.6 $75.6 $181.8 4.7%2011 $30.5 $26.8 $14.0 $19.8 $10.9 $71.7 $173.7
* Note: 2010 and 11 Lodging & FnB Spending data revised to reflect changes in state totals
Visitor Spending, (millions)Lincoln County
$173.7
$181.8
$186.5
$192.7
$198.2$200.7
0.0%
0.5%
1.0%
1.5%
2.0%
2.5%
3.0%
3.5%
4.0%
4.5%
5.0%
160.0
165.0
170.0
175.0
180.0
185.0
190.0
195.0
200.0
205.0
2011 2012 2013 2014 2015 2016
$ M
illio
ns
Total Growth Rate
$
17%
14%
9%6%9%
45%
Source: Longwoods International; Tourism Economics
$200.7m of spending on Total
$27.7m of spending on food and beverage
$18.3m of spending on retail
$12.6m of spending on local transportation
$18.2m of spending on recreation
$89.9m of spending on second homes
$34.2m of spending on lodging
Lincoln County, Tourism Impact
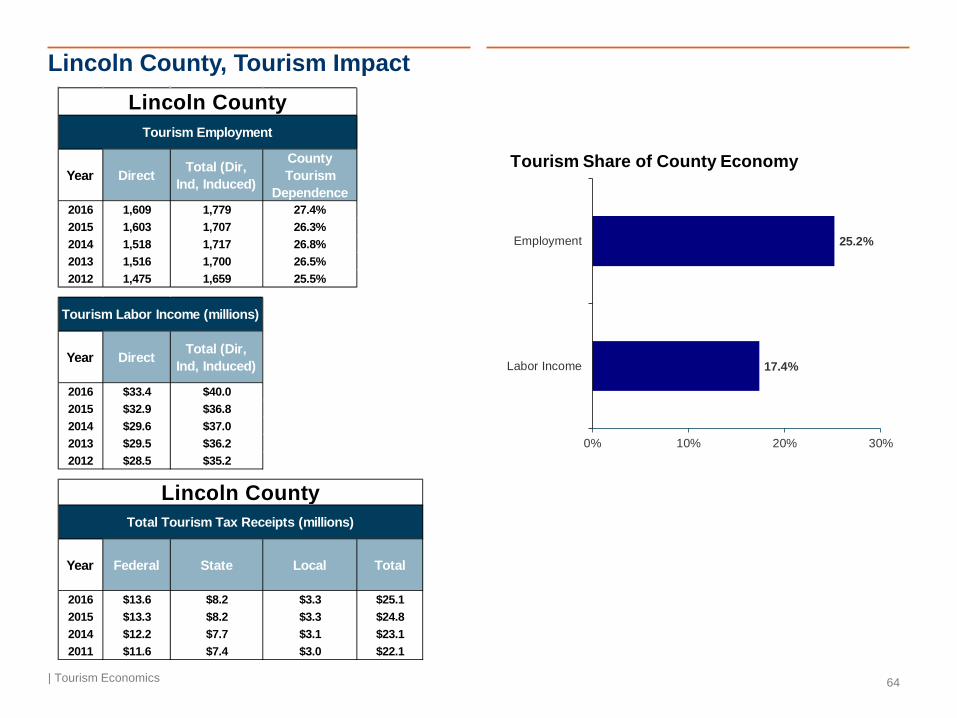
| Tourism Economics 64
17.4%
25.2%
0% 10% 20% 30%
Labor Income
Employment
Tourism Share of County EconomyYear Direct Total (Dir,
Ind, Induced)
County Tourism
Dependence2016 1,609 1,779 27.4%2015 1,603 1,707 26.3%2014 1,518 1,717 26.8%2013 1,516 1,700 26.5%2012 1,475 1,659 25.5%
Year Direct Total (Dir, Ind, Induced)
2016 $33.4 $40.02015 $32.9 $36.82014 $29.6 $37.02013 $29.5 $36.22012 $28.5 $35.2
Year Federal State Local Total
2016 $13.6 $8.2 $3.3 $25.12015 $13.3 $8.2 $3.3 $24.82014 $12.2 $7.7 $3.1 $23.12011 $11.6 $7.4 $3.0 $22.1
Tourism Labor Income (millions)
Total Tourism Tax Receipts (millions)
Lincoln County
Lincoln County
Tourism Employment
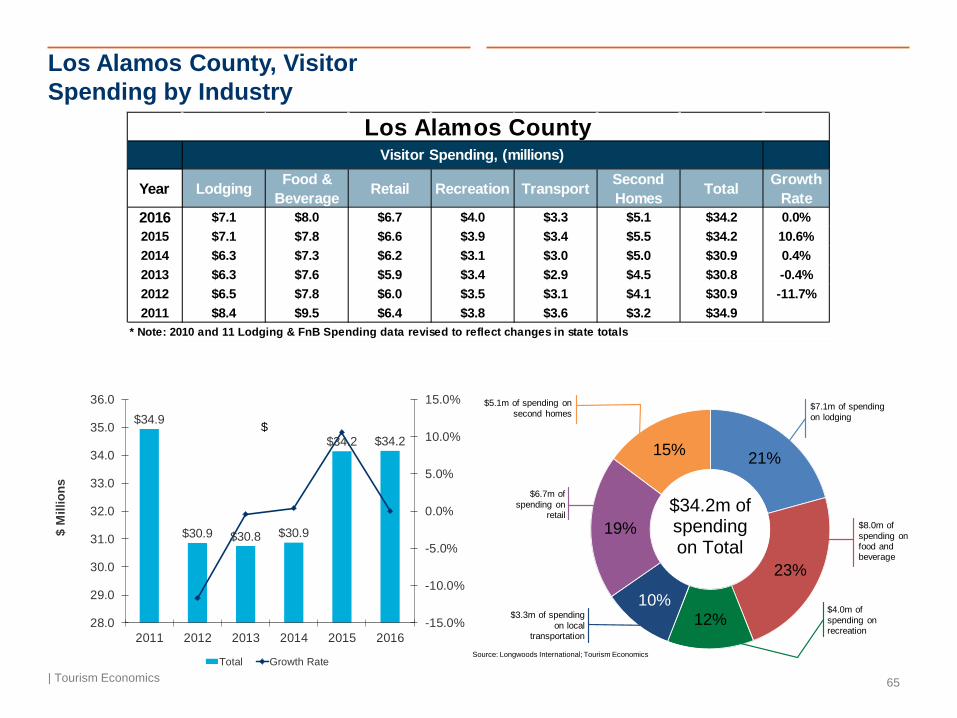
Los Alamos County, Visitor Spending by Industry
| Tourism Economics 65
Year Lodging Food & Beverage Retail Recreation Transport Second
Homes Total Growth Rate
2016 $7.1 $8.0 $6.7 $4.0 $3.3 $5.1 $34.2 0.0%2015 $7.1 $7.8 $6.6 $3.9 $3.4 $5.5 $34.2 10.6%2014 $6.3 $7.3 $6.2 $3.1 $3.0 $5.0 $30.9 0.4%2013 $6.3 $7.6 $5.9 $3.4 $2.9 $4.5 $30.8 -0.4%2012 $6.5 $7.8 $6.0 $3.5 $3.1 $4.1 $30.9 -11.7%2011 $8.4 $9.5 $6.4 $3.8 $3.6 $3.2 $34.9
* Note: 2010 and 11 Lodging & FnB Spending data revised to reflect changes in state totals
Visitor Spending, (millions)Los Alamos County
$34.9
$30.9 $30.8 $30.9
$34.2 $34.2
-15.0%
-10.0%
-5.0%
0.0%
5.0%
10.0%
15.0%
28.0
29.0
30.0
31.0
32.0
33.0
34.0
35.0
36.0
2011 2012 2013 2014 2015 2016
$ M
illio
ns
Total Growth Rate
$
21%
23%
12%10%
19%
15%
Source: Longwoods International; Tourism Economics
$34.2m of spending on Total
$8.0m of spending on food and beverage
$6.7m of spending on
retail
$3.3m of spending on local
transportation
$4.0m of spending on recreation
$5.1m of spending on second homes
$7.1m of spending on lodging

Los Alamos County, Tourism Impact
| Tourism Economics 66
0.6%
2.3%
0% 1% 1% 2% 2% 3%
Labor Income
Employment
Tourism Share of County EconomyYear Direct Total (Dir,
Ind, Induced)
County Tourism
Dependence2016 357 991 6.5%2015 353 949 6.2%2014 331 805 5.2%2013 345 833 5.2%2012 366 930 5.6%
Year Direct Total (Dir, Ind, Induced)
2016 $7.5 $31.92015 $6.9 $29.62014 $6.3 $24.02013 $6.7 $24.62012 $7.2 $27.9
Year Federal State Local Total
2016 $5.0 $3.3 $2.2 $10.52015 $4.9 $3.1 $2.0 $9.92014 $4.3 $2.7 $1.7 $8.72011 $5.4 $3.4 $2.1 $11.0
Tourism Labor Income (millions)
Total Tourism Tax Receipts (millions)
Los Alamos County
Los Alamos County
Tourism Employment
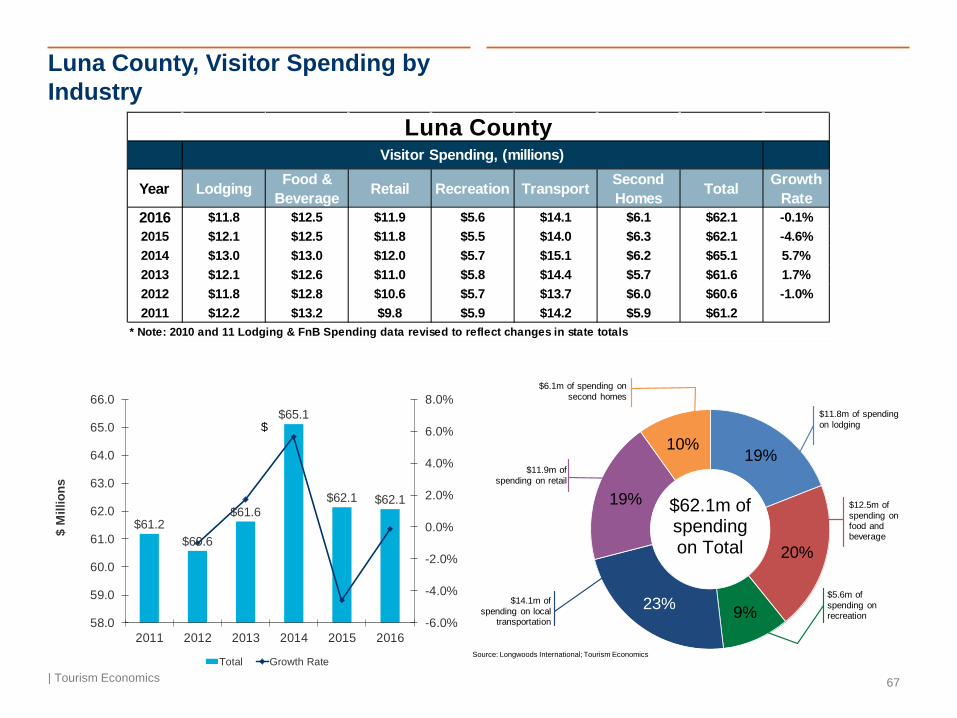
Luna County, Visitor Spending by Industry
| Tourism Economics 67
Year Lodging Food & Beverage Retail Recreation Transport Second
Homes Total Growth Rate
2016 $11.8 $12.5 $11.9 $5.6 $14.1 $6.1 $62.1 -0.1%2015 $12.1 $12.5 $11.8 $5.5 $14.0 $6.3 $62.1 -4.6%2014 $13.0 $13.0 $12.0 $5.7 $15.1 $6.2 $65.1 5.7%2013 $12.1 $12.6 $11.0 $5.8 $14.4 $5.7 $61.6 1.7%2012 $11.8 $12.8 $10.6 $5.7 $13.7 $6.0 $60.6 -1.0%2011 $12.2 $13.2 $9.8 $5.9 $14.2 $5.9 $61.2
* Note: 2010 and 11 Lodging & FnB Spending data revised to reflect changes in state totals
Visitor Spending, (millions)Luna County
$61.2$60.6
$61.6
$65.1
$62.1 $62.1
-6.0%
-4.0%
-2.0%
0.0%
2.0%
4.0%
6.0%
8.0%
58.0
59.0
60.0
61.0
62.0
63.0
64.0
65.0
66.0
2011 2012 2013 2014 2015 2016
$ M
illio
ns
Total Growth Rate
$
19%
20%
9%23%
19%
10%
Source: Longwoods International; Tourism Economics
$62.1m of spending on Total
$12.5m of spending on food and beverage
$11.9m of spending on retail
$14.1m of spending on local
transportation
$5.6m of spending on recreation
$6.1m of spending on second homes
$11.8m of spending on lodging

Luna County, Tourism Impact
| Tourism Economics 68
5.4%
9.9%
0% 5% 10% 15%
Labor Income
Employment
Tourism Share of County EconomyYear Direct Total (Dir,
Ind, Induced)
County Tourism
Dependence2016 786 939 12.0%2015 816 922 11.7%2014 884 1,173 15.3%2013 785 924 12.1%2012 757 903 11.8%
Year Direct Total (Dir, Ind, Induced)
2016 $14.2 $20.12015 $14.2 $18.22014 $14.9 $25.72013 $13.9 $19.02012 $13.6 $18.9
Year Federal State Local Total
2016 $6.3 $4.1 $1.7 $12.02015 $6.2 $4.0 $1.6 $11.92014 $7.1 $4.6 $2.0 $13.72011 $6.5 $4.2 $1.8 $12.5
Tourism Labor Income (millions)
Total Tourism Tax Receipts (millions)
Luna County
Luna County
Tourism Employment
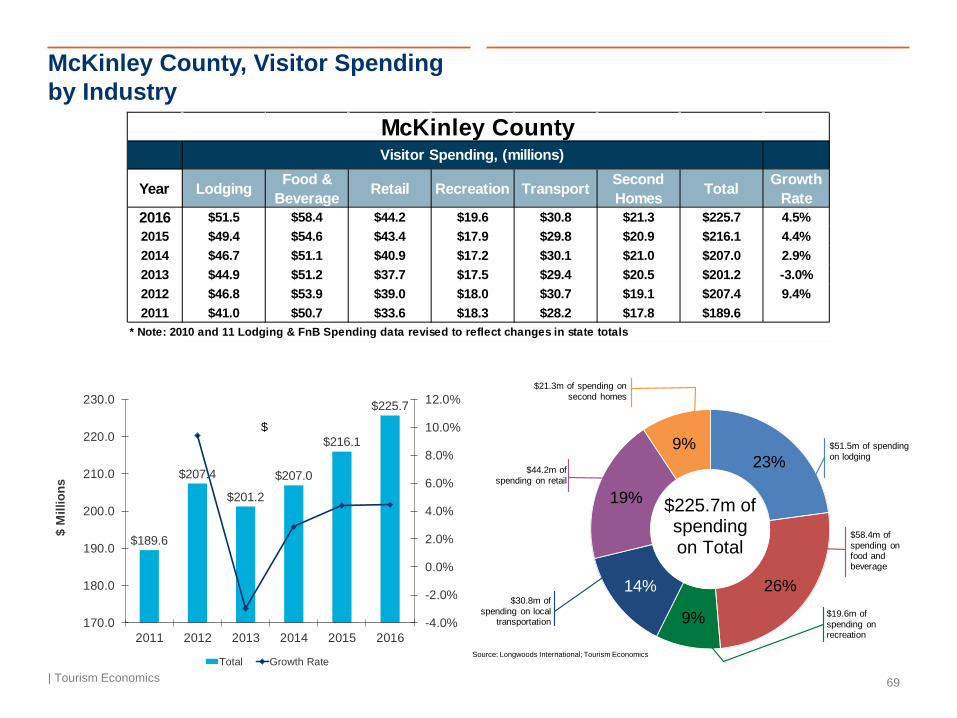
McKinley County, Visitor Spending by Industry
| Tourism Economics 69
Year Lodging Food & Beverage Retail Recreation Transport Second
Homes Total Growth Rate
2016 $51.5 $58.4 $44.2 $19.6 $30.8 $21.3 $225.7 4.5%2015 $49.4 $54.6 $43.4 $17.9 $29.8 $20.9 $216.1 4.4%2014 $46.7 $51.1 $40.9 $17.2 $30.1 $21.0 $207.0 2.9%2013 $44.9 $51.2 $37.7 $17.5 $29.4 $20.5 $201.2 -3.0%2012 $46.8 $53.9 $39.0 $18.0 $30.7 $19.1 $207.4 9.4%2011 $41.0 $50.7 $33.6 $18.3 $28.2 $17.8 $189.6
* Note: 2010 and 11 Lodging & FnB Spending data revised to reflect changes in state totals
Visitor Spending, (millions)McKinley County
$189.6
$207.4
$201.2
$207.0
$216.1
$225.7
-4.0%
-2.0%
0.0%
2.0%
4.0%
6.0%
8.0%
10.0%
12.0%
170.0
180.0
190.0
200.0
210.0
220.0
230.0
2011 2012 2013 2014 2015 2016
$ M
illio
ns
Total Growth Rate
$
23%
26%
9%
14%
19%
9%
Source: Longwoods International; Tourism Economics
$225.7m of spending on Total
$58.4m of spending on food and beverage
$44.2m of spending on retail
$30.8m of spending on local
transportation$19.6m of spending on recreation
$21.3m of spending on second homes
$51.5m of spending on lodging
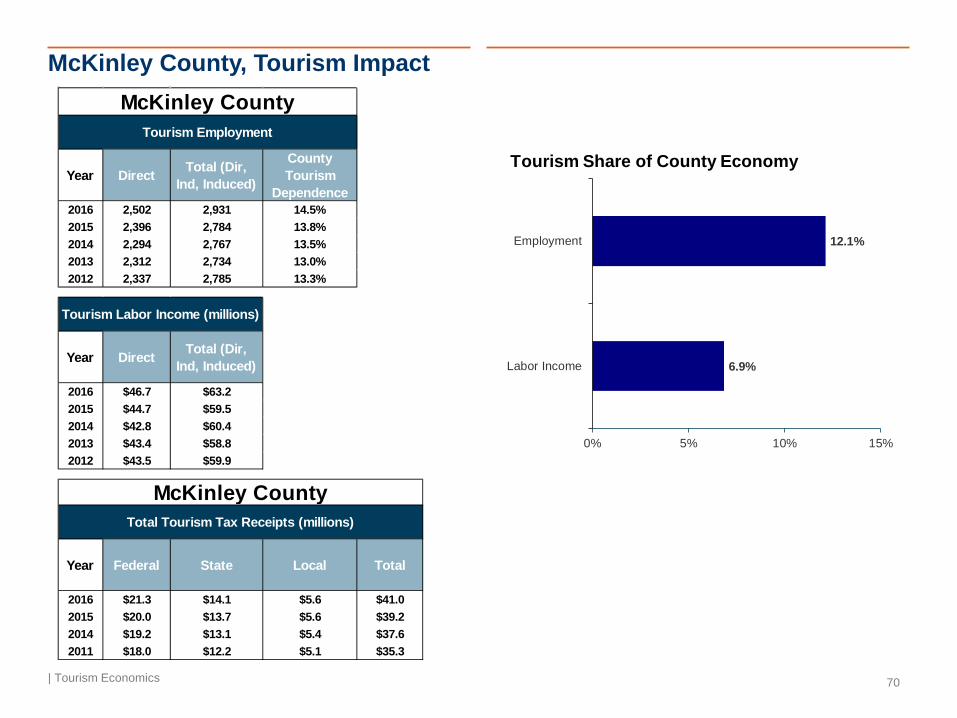
McKinley County, Tourism Impact
| Tourism Economics 70
6.9%
12.1%
0% 5% 10% 15%
Labor Income
Employment
Tourism Share of County EconomyYear Direct Total (Dir,
Ind, Induced)
County Tourism
Dependence2016 2,502 2,931 14.5%2015 2,396 2,784 13.8%2014 2,294 2,767 13.5%2013 2,312 2,734 13.0%2012 2,337 2,785 13.3%
Year Direct Total (Dir, Ind, Induced)
2016 $46.7 $63.22015 $44.7 $59.52014 $42.8 $60.42013 $43.4 $58.82012 $43.5 $59.9
Year Federal State Local Total
2016 $21.3 $14.1 $5.6 $41.02015 $20.0 $13.7 $5.6 $39.22014 $19.2 $13.1 $5.4 $37.62011 $18.0 $12.2 $5.1 $35.3
Tourism Labor Income (millions)
Total Tourism Tax Receipts (millions)
McKinley County
McKinley County
Tourism Employment

Mora County, Visitor Spending by Industry
| Tourism Economics 71
Year Lodging Food & Beverage Retail Recreation Transport Second
Homes Total Growth Rate
2016 $0.3 $0.6 $0.6 $0.3 $0.4 $7.4 $9.5 2.8%2015 $0.3 $0.5 $0.6 $0.3 $0.4 $7.1 $9.2 8.9%2014 $0.3 $0.5 $0.6 $0.3 $0.4 $6.4 $8.5 3.2%2013 $0.1 $0.4 $0.5 $0.3 $0.3 $6.6 $8.2 -2.7%2012 $0.2 $0.5 $0.4 $0.3 $0.5 $6.5 $8.4 6.4%2011 $0.2 $0.5 $0.6 $0.3 $0.3 $6.0 $7.9
* Note: 2010 and 11 Lodging & FnB Spending data revised to reflect changes in state totals
Visitor Spending, (millions)Mora County
$7.9
$8.4$8.2
$8.5
$9.2$9.5
-4.0%
-2.0%
0.0%
2.0%
4.0%
6.0%
8.0%
10.0%
7.0
7.5
8.0
8.5
9.0
9.5
10.0
2011 2012 2013 2014 2015 2016
$ M
illio
ns
Total Growth Rate
$ 3%6%
3%4%
6%
78%
Source: Longwoods International; Tourism Economics
$9.5m of spending on Total
$.6m of spending on food and beverage
$.6m of spending on retail
$.4m of spending on local transportation
$.3m of spending on recreation
$7.4m of spending on second homes
$.3m of spending on lodging

Mora County, Tourism Impact
| Tourism Economics 72
4.7%
9.1%
0% 2% 4% 6% 8% 10%
Labor Income
Employment
Tourism Share of County EconomyYear Direct Total (Dir,
Ind, Induced)
County Tourism
Dependence2016 64 70 10.1%2015 68 71 10.3%2014 63 70 10.4%2013 57 63 8.8%2012 70 76 10.8%
Year Direct Total (Dir, Ind, Induced)
2016 $1.0 $1.22015 $1.1 $1.22014 $1.0 $1.22013 $0.9 $1.12012 $1.1 $1.3
Year Federal State Local Total
2016 $0.4 $0.2 $0.1 $0.62015 $0.4 $0.2 $0.1 $0.72014 $0.4 $0.2 $0.1 $0.62011 $0.4 $0.2 $0.1 $0.7
Tourism Labor Income (millions)
Total Tourism Tax Receipts (millions)
Mora County
Mora County
Tourism Employment

Otero County, Visitor Spending by Industry
| Tourism Economics 73
Year Lodging Food & Beverage Retail Recreation Transport Second
Homes Total Growth Rate
2016 $28.9 $32.2 $24.5 $52.7 $27.9 $66.1 $232.2 5.1%2015 $27.8 $30.7 $23.5 $49.4 $26.8 $62.8 $221.0 1.7%2014 $27.5 $30.0 $23.1 $47.7 $28.2 $60.7 $217.2 5.2%2013 $26.0 $29.9 $21.2 $48.0 $24.2 $57.4 $206.6 -4.2%2012 $32.3 $32.1 $21.9 $47.6 $27.7 $54.1 $215.6 11.1%2011 $26.3 $29.8 $19.8 $46.5 $22.5 $49.1 $194.0
* Note: 2010 and 11 Lodging & FnB Spending data revised to reflect changes in state totals
Visitor Spending, (millions)Otero County
$194.0
$215.6
$206.6
$217.2$221.0
$232.2
-6.0%
-4.0%
-2.0%
0.0%
2.0%
4.0%
6.0%
8.0%
10.0%
12.0%
170.0
180.0
190.0
200.0
210.0
220.0
230.0
240.0
2011 2012 2013 2014 2015 2016
$ M
illio
ns
Total Growth Rate
$
12%
14%
23%12%
11%
28%
Source: Longwoods International; Tourism Economics
$232.2m of spending on Total
$32.2m of spending on food and beverage
$24.5m of spending on
retail
$27.9m of spending on local transportation
$52.7m of spending on recreation
$66.1m of spending on second homes
$28.9m of spending on lodging

Otero County, Tourism Impact
| Tourism Economics 74
9.2%
21.5%
0% 5% 10% 15% 20% 25%
Labor Income
Employment
Tourism Share of County EconomyYear Direct Total (Dir,
Ind, Induced)
County Tourism
Dependence2016 3,832 4,224 24.4%2015 3,529 3,902 22.5%2014 3,446 3,795 21.4%2013 3,561 3,908 22.2%2012 3,572 3,900 23.0%
Year Direct Total (Dir, Ind, Induced)
2016 $57.1 $72.22015 $54.0 $68.12014 $52.8 $65.82013 $52.3 $65.02012 $53.4 $65.4
Year Federal State Local Total
2016 $22.8 $13.1 $5.5 $41.42015 $21.6 $12.5 $5.2 $39.32014 $21.2 $12.3 $5.1 $38.62011 $20.7 $11.8 $5.0 $37.5
Tourism Labor Income (millions)
Total Tourism Tax Receipts (millions)
Otero County
Otero County
Tourism Employment

Quay County, Visitor Spending by Industry
| Tourism Economics 75
Year Lodging Food & Beverage Retail Recreation Transport Second
Homes Total Growth Rate
2016 $22.5 $19.0 $14.8 $7.1 $10.5 $10.8 $84.7 2.6%2015 $22.0 $18.5 $14.7 $6.8 $10.5 $10.1 $82.6 4.9%2014 $20.1 $17.9 $13.9 $6.3 $10.6 $9.9 $78.7 6.1%2013 $18.8 $17.4 $12.7 $6.4 $10.2 $8.8 $74.2 0.8%2012 $18.0 $17.9 $12.9 $6.3 $10.4 $8.3 $73.7 3.3%2011 $17.6 $17.3 $11.9 $6.3 $10.9 $7.4 $71.3
* Note: 2010 and 11 Lodging & FnB Spending data revised to reflect changes in state totals
Visitor Spending, (millions)Quay County
$71.3$73.7 $74.2
$78.7
$82.6$84.7
0.0%
1.0%
2.0%
3.0%
4.0%
5.0%
6.0%
7.0%
60.0
65.0
70.0
75.0
80.0
85.0
90.0
2011 2012 2013 2014 2015 2016
$ M
illio
ns
Total Growth Rate
$
27%
22%8%
12%
18%
13%
Source: Longwoods International; Tourism Economics
$84.7m of spending on Total
$19.0m of spending on food and beverage
$14.8m of spending on
retail
$10.5m of spending on local transportation
$7.1m of spending on recreation
$10.8m of spending on second homes
$22.5m of spending on lodging

Quay County, Tourism Impact
| Tourism Economics 76
19.8%
37.0%
0% 10% 20% 30% 40%
Labor Income
Employment
Tourism Share of County EconomyYear Direct Total (Dir,
Ind, Induced)
County Tourism
Dependence2016 931 967 36.4%2015 894 923 34.8%2014 852 919 35.0%2013 926 992 37.3%2012 907 983 37.5%
Year Direct Total (Dir, Ind, Induced)
2016 $15.3 $16.62015 $14.1 $15.22014 $13.5 $16.02013 $14.4 $16.92012 $14.2 $17.0
Year Federal State Local Total
2016 $6.9 $4.7 $1.4 $13.02015 $6.2 $4.6 $1.4 $12.22014 $6.0 $4.4 $1.4 $11.82011 $5.6 $4.2 $1.5 $11.2
Tourism Labor Income (millions)
Total Tourism Tax Receipts (millions)
Quay County
Quay County
Tourism Employment

Rio Arriba County, Visitor Spending by Industry
| Tourism Economics 77
Year Lodging Food & Beverage Retail Recreation Transport Second
Homes Total Growth Rate
2016 $15.5 $16.1 $11.7 $29.8 $7.2 $22.9 $103.3 2.5%2015 $15.5 $15.9 $11.6 $29.1 $7.3 $21.4 $100.8 2.3%2014 $14.0 $14.9 $11.1 $27.9 $12.1 $18.6 $98.5 3.4%2013 $13.9 $14.8 $10.3 $28.1 $12.0 $16.3 $95.3 3.2%2012 $12.4 $14.4 $10.3 $27.9 $12.9 $14.7 $92.4 -0.1%2011 $12.7 $14.8 $10.3 $27.2 $14.4 $13.1 $92.5
* Note: 2010 and 11 Lodging & FnB Spending data revised to reflect changes in state totals
Visitor Spending, (millions)Rio Arriba County
$92.5 $92.4
$95.3
$98.5
$100.8
$103.3
-0.5%
0.0%
0.5%
1.0%
1.5%
2.0%
2.5%
3.0%
3.5%
4.0%
86.0
88.0
90.0
92.0
94.0
96.0
98.0
100.0
102.0
104.0
106.0
2011 2012 2013 2014 2015 2016
$ M
illio
ns
Total Growth Rate
$
15%
16%
29%7%
11%
22%
Source: Longwoods International; Tourism Economics
$103.3m of spending on Total
$16.1m of spending on food and beverage
$11.7m of spending on
retail
$7.2m of spending on local transportation $29.8m of spending
on recreation
$22.9m of spending on second homes
$15.5m of spending on lodging
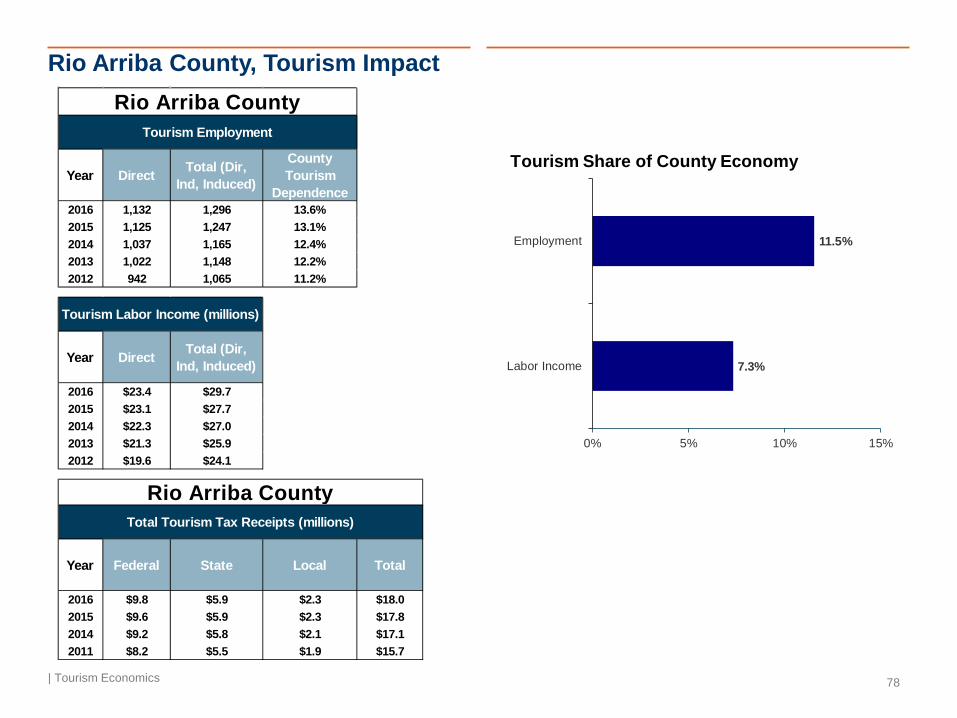
Rio Arriba County, Tourism Impact
| Tourism Economics 78
7.3%
11.5%
0% 5% 10% 15%
Labor Income
Employment
Tourism Share of County EconomyYear Direct Total (Dir,
Ind, Induced)
County Tourism
Dependence2016 1,132 1,296 13.6%2015 1,125 1,247 13.1%2014 1,037 1,165 12.4%2013 1,022 1,148 12.2%2012 942 1,065 11.2%
Year Direct Total (Dir, Ind, Induced)
2016 $23.4 $29.72015 $23.1 $27.72014 $22.3 $27.02013 $21.3 $25.92012 $19.6 $24.1
Year Federal State Local Total
2016 $9.8 $5.9 $2.3 $18.02015 $9.6 $5.9 $2.3 $17.82014 $9.2 $5.8 $2.1 $17.12011 $8.2 $5.5 $1.9 $15.7
Tourism Labor Income (millions)
Total Tourism Tax Receipts (millions)
Rio Arriba County
Rio Arriba County
Tourism Employment

Roosevelt County, Visitor Spending by Industry
| Tourism Economics 79
Year Lodging Food & Beverage Retail Recreation Transport Second
Homes Total Growth Rate
2016 $2.3 $5.6 $7.5 $3.0 $4.8 $0.7 $23.9 1.1%2015 $2.3 $5.6 $7.4 $2.9 $4.7 $0.7 $23.6 4.3%2014 $2.2 $5.4 $7.3 $2.8 $4.2 $0.7 $22.7 0.9%2013 $2.4 $5.3 $6.9 $2.9 $4.2 $0.7 $22.5 -2.4%2012 $1.9 $5.2 $7.0 $3.4 $4.9 $0.6 $23.0 6.8%2011 $2.1 $5.4 $6.7 $2.7 $4.2 $0.5 $21.5
* Note: 2010 and 11 Lodging & FnB Spending data revised to reflect changes in state totals
Visitor Spending, (millions)Roosevelt County
$21.5
$23.0
$22.5$22.7
$23.6$23.9
-4.0%
-2.0%
0.0%
2.0%
4.0%
6.0%
8.0%
20.0
20.5
21.0
21.5
22.0
22.5
23.0
23.5
24.0
24.5
2011 2012 2013 2014 2015 2016
$ M
illio
ns
Total Growth Rate
$ 10%
23%
13%20%
31%
3%
Source: Longwoods International; Tourism Economics
$23.9m of spending on Total
$5.6m of spending on food and beverage
$7.5m of spending on
retail
$4.8m of spending on local transportation $3.0m of spending
on recreation
$0.7m of spending on second homes $2.3m of
spending on lodging
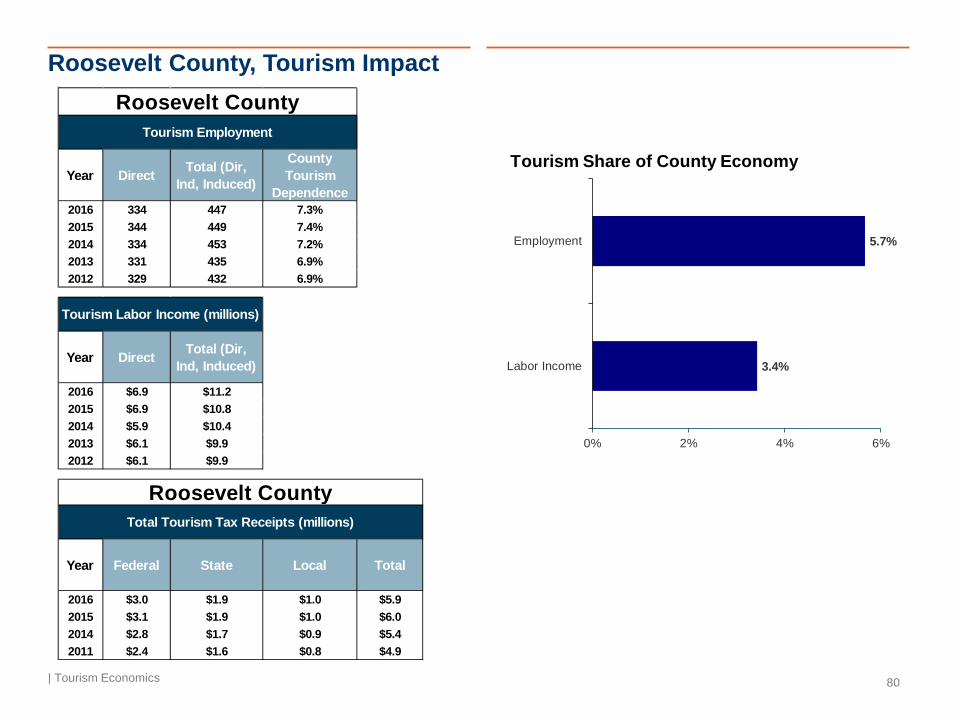
Roosevelt County, Tourism Impact
| Tourism Economics 80
3.4%
5.7%
0% 2% 4% 6%
Labor Income
Employment
Tourism Share of County EconomyYear Direct Total (Dir,
Ind, Induced)
County Tourism
Dependence2016 334 447 7.3%2015 344 449 7.4%2014 334 453 7.2%2013 331 435 6.9%2012 329 432 6.9%
Year Direct Total (Dir, Ind, Induced)
2016 $6.9 $11.22015 $6.9 $10.82014 $5.9 $10.42013 $6.1 $9.92012 $6.1 $9.9
Year Federal State Local Total
2016 $3.0 $1.9 $1.0 $5.92015 $3.1 $1.9 $1.0 $6.02014 $2.8 $1.7 $0.9 $5.42011 $2.4 $1.6 $0.8 $4.9
Tourism Labor Income (millions)
Total Tourism Tax Receipts (millions)
Roosevelt County
Roosevelt County
Tourism Employment

San Juan County, Visitor Spending by Industry
| Tourism Economics 81
Year Lodging Food & Beverage Retail Recreation Transport Second
Homes Total Growth Rate
2016 $46.9 $62.1 $61.0 $34.7 $58.1 $25.7 $288.4 -1.1%2015 $47.7 $61.7 $60.7 $34.5 $58.8 $28.1 $291.5 4.9%2014 $45.7 $58.5 $58.3 $33.7 $55.8 $25.9 $277.9 5.3%2013 $44.0 $58.8 $54.0 $33.7 $49.7 $23.6 $263.8 -0.3%2012 $43.5 $58.9 $53.5 $34.6 $51.9 $22.2 $264.5 6.1%2011 $41.0 $57.7 $50.0 $33.4 $46.6 $20.6 $249.4
* Note: 2010 and 11 Lodging & FnB Spending data revised to reflect changes in state totals
Visitor Spending, (millions)San Juan County
$249.4
$264.5 $263.8
$277.9
$291.5$288.4
-2.0%
-1.0%
0.0%
1.0%
2.0%
3.0%
4.0%
5.0%
6.0%
7.0%
220.0
230.0
240.0
250.0
260.0
270.0
280.0
290.0
300.0
2011 2012 2013 2014 2015 2016
$ M
illio
ns
Total Growth Rate
$
16%
22%
12%20%
21%
9%
Source: Longwoods International; Tourism Economics
$288.4m of spending on Total
$62.1m of spending on food and beverage
$61.0m of spending on
retail
$58.1m of spending on local
transportation $34.7m of spending on recreation
$25.7m of spending on second homes
$46.9m of spending on lodging

San Juan County, Tourism Impact
| Tourism Economics 82
3.2%
6.1%
0% 2% 4% 6% 8%
Labor Income
Employment
Tourism Share of County EconomyYear Direct Total (Dir,
Ind, Induced)
County Tourism
Dependence2016 2,924 4,259 8.5%2015 2,908 4,470 8.9%2014 2,788 4,060 8.2%2013 2,772 4,098 8.3%2012 2,687 3,802 7.9%
Year Direct Total (Dir, Ind, Induced)
2016 $66.7 $118.32015 $64.7 $124.32014 $61.5 $108.92013 $59.4 $108.02012 $58.3 $99.1
Year Federal State Local Total
2016 $31.6 $20.4 $9.8 $61.72015 $32.0 $20.8 $10.3 $63.02014 $29.4 $19.4 $9.3 $58.12011 $26.8 $17.7 $8.8 $53.3
Tourism Labor Income (millions)
Total Tourism Tax Receipts (millions)
San Juan County
San Juan County
Tourism Employment

San Miguel County, Visitor Spending by Industry
| Tourism Economics 83
Year Lodging Food & Beverage Retail Recreation Transport Second
Homes Total Growth Rate
2016 $14.6 $15.0 $12.5 $5.1 $9.6 $19.6 $76.4 3.1%2015 $14.0 $14.3 $12.3 $4.8 $9.6 $19.1 $74.1 5.0%2014 $12.6 $13.5 $11.7 $4.4 $9.5 $18.9 $70.6 1.3%2013 $12.6 $14.3 $11.0 $4.7 $8.9 $18.1 $69.7 5.4%2012 $11.4 $13.5 $10.5 $4.4 $8.8 $17.5 $66.1 3.4%2011 $12.0 $14.0 $8.7 $4.4 $8.7 $16.1 $63.9
* Note: 2010 and 11 Lodging & FnB Spending data revised to reflect changes in state totals
Visitor Spending, (millions)San Miguel County
$63.9
$66.1
$69.7$70.6
$74.1
$76.4
0.0%
1.0%
2.0%
3.0%
4.0%
5.0%
6.0%
56.058.060.062.064.066.068.070.072.074.076.078.0
2011 2012 2013 2014 2015 2016
$ M
illio
ns
Total Growth Rate
$
19%
20%
7%12%
16%
26%
Source: Longwoods International; Tourism Economics
$76.4m of spending on Total
$15.0m of spending on food and beverage
$12.5m of spending on
retail
$9.6m of spending on local transportation
$5.1m of spending on recreation
$19.6m of spending on second homes
$14.6m of spending on lodging

San Miguel County, Tourism Impact
| Tourism Economics 84
6.7%
7.1%
0% 2% 4% 6% 8%
Labor Income
Employment
Tourism Share of County EconomyYear Direct Total (Dir,
Ind, Induced)
County Tourism
Dependence2016 583 681 8.3%2015 553 654 8.0%2014 544 678 8.3%2013 554 691 8.6%2012 551 688 8.6%
Year Direct Total (Dir, Ind, Induced)
2016 $16.5 $20.22015 $15.2 $19.12014 $15.0 $20.02013 $15.2 $20.22012 $14.2 $19.3
Year Federal State Local Total
2016 $6.8 $4.2 $1.8 $12.82015 $6.4 $4.1 $1.7 $12.22014 $6.3 $3.9 $1.7 $12.02011 $5.8 $3.7 $1.7 $11.2
Tourism Labor Income (millions)
Total Tourism Tax Receipts (millions)
San Miguel County
San Miguel County
Tourism Employment

Sandoval County, Visitor Spending by Industry
| Tourism Economics 85
Year Lodging Food & Beverage Retail Recreation Transport Second
Homes Total Growth Rate
2016 $32.4 $41.0 $31.7 $66.1 $18.2 $31.3 $220.8 -0.5%2015 $33.0 $40.9 $31.5 $64.6 $18.5 $33.3 $221.9 3.5%2014 $32.4 $38.6 $30.2 $62.5 $17.6 $33.1 $214.4 1.4%2013 $31.1 $39.0 $28.9 $62.9 $17.1 $32.6 $211.5 -0.3%2012 $32.3 $39.6 $28.7 $62.3 $17.8 $31.3 $212.1 3.0%2011 $31.7 $39.9 $27.1 $60.9 $16.8 $29.6 $206.0
* Note: 2010 and 11 Lodging & FnB Spending data revised to reflect changes in state totals
Visitor Spending, (millions)Sandoval County
$206.0
$212.1 $211.5
$214.4
$221.9$220.8
-1.0%
-0.5%
0.0%
0.5%
1.0%
1.5%
2.0%
2.5%
3.0%
3.5%
4.0%
195.0
200.0
205.0
210.0
215.0
220.0
225.0
2011 2012 2013 2014 2015 2016
$ M
illio
ns
Total Growth Rate
$
15%
19%
30%
8%
14%
14%
Source: Longwoods International; Tourism Economics
$220.8m of spending on Total
$41.0m of spending on food and beverage
$31.7m of spending on
retail
$18.2m of spending on local
transportation
$66.1m of spending on recreation
$31.3m of spending on second homes
$32.4m of spending on lodging

Sandoval County, Tourism Impact
| Tourism Economics 86
4.6%
8.3%
0% 2% 4% 6% 8% 10%
Labor Income
Employment
Tourism Share of County EconomyYear Direct Total (Dir,
Ind, Induced)
County Tourism
Dependence2016 2,421 2,995 10.4%2015 2,469 2,912 10.1%2014 2,461 3,005 10.2%2013 2,468 3,043 10.3%2012 2,400 2,970 10.2%
Year Direct Total (Dir, Ind, Induced)
2016 $55.3 $77.42015 $56.7 $73.52014 $54.9 $75.22013 $53.8 $74.92012 $52.2 $73.1
Year Federal State Local Total
2016 $23.6 $14.4 $6.7 $44.72015 $23.9 $14.5 $6.6 $45.12014 $23.1 $14.0 $6.3 $43.42011 $22.5 $13.8 $6.3 $42.6
Tourism Labor Income (millions)
Total Tourism Tax Receipts (millions)
Sandoval County
Sandoval County
Tourism Employment

Santa Fe County, Visitor Spending by Industry
| Tourism Economics 87
Year Lodging Food & Beverage Retail Recreation Transport Second
Homes Total Growth Rate
2016 $244.2 $208.2 $126.5 $84.4 $98.3 $96.8 $858.5 3.7%2015 $237.7 $196.9 $126.1 $81.4 $97.3 $88.7 $828.1 6.7%2014 $220.6 $186.0 $121.9 $75.5 $87.4 $85.0 $776.4 5.9%2013 $205.5 $181.5 $109.4 $75.5 $81.4 $79.9 $733.1 2.6%2012 $198.4 $177.7 $105.1 $72.8 $84.6 $76.0 $714.7 3.3%2011 $193.5 $175.3 $104.0 $67.9 $80.7 $70.3 $691.7
* Note: 2010 and 11 Lodging & FnB Spending data revised to reflect changes in state totals
Visitor Spending, (millions)Santa Fe County
$691.7 $714.7 $733.1$776.4
$828.1 $858.5
0.0%
1.0%
2.0%
3.0%
4.0%
5.0%
6.0%
7.0%
0.0
100.0
200.0
300.0
400.0
500.0
600.0
700.0
800.0
900.0
1,000.0
2011 2012 2013 2014 2015 2016
$ M
illio
ns
Total Growth Rate
$
28%
24%10%
12%
15%
11%
Source: Longwoods International; Tourism Economics
$858.5m of spending on Total
$208.2m of spending on food and beverage
$126.5m of spending on
retail
$98.3m of spending on local
transportation
$84.4m of spending on recreation
$96.8m of spending on second homes $244.2m of
spending on lodging

Santa Fe County, Tourism Impact
| Tourism Economics 88
9.7%
13.2%
0% 5% 10% 15%
Labor Income
Employment
Tourism Share of County EconomyYear Direct Total (Dir,
Ind, Induced)
County Tourism
Dependence2016 8,076 9,793 16.2%2015 7,857 9,468 15.7%2014 7,778 9,788 16.1%2013 7,762 9,672 16.1%2012 7,605 9,453 15.6%
Year Direct Total (Dir, Ind, Induced)
2016 $254.3 $320.42015 $244.1 $305.52014 $238.8 $313.72013 $228.4 $298.62012 $223.1 $290.8
Year Federal State Local Total
2016 $102.2 $59.2 $26.2 $187.62015 $99.0 $57.9 $26.1 $183.02014 $96.7 $55.5 $25.7 $177.92011 $86.1 $49.9 $23.1 $159.1
Tourism Labor Income (millions)
Total Tourism Tax Receipts (millions)
Santa Fe County
Santa Fe County
Tourism Employment

Sierra County, Visitor Spending by Industry
| Tourism Economics 89
Year Lodging Food & Beverage Retail Recreation Transport Second
Homes Total Growth Rate
2016 $6.7 $7.2 $4.8 $4.9 $1.8 $24.2 $49.5 -1.0%2015 $6.6 $7.0 $4.8 $4.7 $1.8 $25.1 $49.9 4.8%2014 $6.2 $6.7 $4.0 $4.1 $1.4 $25.2 $47.7 2.0%2013 $5.8 $6.6 $3.8 $4.2 $1.7 $24.7 $46.7 3.2%2012 $5.8 $6.7 $3.9 $4.3 $2.4 $22.1 $45.3 6.1%2011 $5.7 $6.8 $3.8 $4.4 $1.9 $20.2 $42.7
* Note: 2010 and 11 Lodging & FnB Spending data revised to reflect changes in state totals
Visitor Spending, (millions)Sierra County
$42.7
$45.3
$46.7$47.7
$49.9 $49.5
-2.0%
-1.0%
0.0%
1.0%
2.0%
3.0%
4.0%
5.0%
6.0%
7.0%
38.0
40.0
42.0
44.0
46.0
48.0
50.0
52.0
2011 2012 2013 2014 2015 2016
$ M
illio
ns
Total Growth Rate
$
14%
14%
10%
3%10%
49%
Source: Longwoods International; Tourism Economics
$49.5m of spending on Total
$7.2m of spending on food and beverage
$4.8m of spending on retail
$1.8m of spending on local transportation
$4.9m of spending on recreation
$24.2m of spending on second homes
$6.7m of spending on lodging

Sierra County, Tourism Impact
| Tourism Economics 90
10.7%
16.3%
0% 5% 10% 15% 20%
Labor Income
Employment
Tourism Share of County EconomyYear Direct Total (Dir,
Ind, Induced)
County Tourism
Dependence2016 553 620 18.5%2015 591 644 19.2%2014 573 637 19.6%2013 592 650 20.4%2012 575 630 19.8%
Year Direct Total (Dir, Ind, Induced)
2016 $10.6 $13.12015 $10.7 $12.72014 $9.7 $12.12013 $9.9 $12.02012 $9.7 $11.7
Year Federal State Local Total
2016 $4.0 $2.2 $1.1 $7.22015 $4.1 $2.1 $1.0 $7.32014 $3.7 $2.0 $1.0 $6.72011 $3.2 $1.8 $0.9 $5.9
Tourism Labor Income (millions)
Total Tourism Tax Receipts (millions)
Sierra County
Sierra County
Tourism Employment

Socorro County, Visitor Spending by Industry
| Tourism Economics 91
Year Lodging Food & Beverage Retail Recreation Transport Second
Homes Total Growth Rate
2016 $12.5 $14.0 $10.8 $4.8 $7.5 $11.1 $60.7 1.5%2015 $12.5 $14.0 $10.7 $4.6 $7.5 $10.5 $59.8 7.1%2014 $12.2 $13.3 $10.3 $4.3 $6.7 $9.1 $55.8 4.9%2013 $11.4 $13.7 $9.8 $4.5 $6.6 $7.3 $53.2 -0.5%2012 $11.2 $14.3 $10.1 $4.7 $7.1 $6.1 $53.5 12.9%2011 $11.0 $13.2 $8.1 $4.2 $5.8 $5.1 $47.4
* Note: 2010 and 11 Lodging & FnB Spending data revised to reflect changes in state totals
Visitor Spending, (millions)Socorro County
$47.4$53.5 $53.2
$55.8$59.8 $60.7
-2.0%
0.0%
2.0%
4.0%
6.0%
8.0%
10.0%
12.0%
14.0%
0.0
10.0
20.0
30.0
40.0
50.0
60.0
70.0
2011 2012 2013 2014 2015 2016
$ M
illio
ns
Total Growth Rate
$
21%
23%
8%12%
18%
18%
Source: Longwoods International; Tourism Economics
$60.7m of spending on Total
$14.0m of spending on food and beverage
$10.8m of spending on retail
$7.5m of spending on local
transportation$4.8m of spending on recreation
$11.1m of spending on second homes
$12.5m of spending on lodging

Socorro County, Tourism Impact
| Tourism Economics 92
6.4%
12.8%
0% 5% 10% 15%
Labor Income
Employment
Tourism Share of County EconomyYear Direct Total (Dir,
Ind, Induced)
County Tourism
Dependence2016 687 755 14.6%2015 659 699 13.5%2014 652 733 13.9%2013 641 721 13.2%2012 641 718 13.4%
Year Direct Total (Dir, Ind, Induced)
2016 $12.2 $14.92015 $11.8 $13.42014 $11.8 $14.82013 $11.9 $14.82012 $11.9 $14.7
Year Federal State Local Total
2016 $5.3 $3.4 $1.3 $10.02015 $5.0 $3.4 $1.3 $9.72014 $5.0 $3.3 $1.3 $9.62011 $3.8 $2.8 $1.1 $7.7
Tourism Labor Income (millions)
Total Tourism Tax Receipts (millions)
Socorro County
Socorro County
Tourism Employment

Taos County, Visitor Spending by Industry
| Tourism Economics 93
Year Lodging Food & Beverage Retail Recreation Transport Second
Homes Total Growth Rate
2016 $56.3 $43.0 $35.8 $25.3 $24.1 $73.2 $257.8 4.5%2015 $52.8 $40.9 $34.2 $23.5 $23.2 $72.2 $246.8 4.4%2014 $49.4 $38.0 $32.1 $21.4 $20.6 $74.9 $236.4 3.4%2013 $47.0 $38.6 $30.4 $20.8 $20.1 $71.6 $228.5 5.5%2012 $43.3 $36.5 $28.0 $20.2 $18.6 $70.0 $216.6 2.7%2011 $45.7 $37.8 $24.9 $20.3 $18.0 $64.3 $210.9
* Note: 2010 and 11 Lodging & FnB Spending data revised to reflect changes in state totals
Visitor Spending, (millions)Taos County
$210.9 $216.6$228.5 $236.4 $246.8 $257.8
0.0%
1.0%
2.0%
3.0%
4.0%
5.0%
6.0%
0.0
50.0
100.0
150.0
200.0
250.0
300.0
2011 2012 2013 2014 2015 2016
$ M
illio
ns
Total Growth Rate
$
22%
17%
10%9%
14%
28%
Source: Longwoods International; Tourism Economics
$257.8m of spending on Total
$43.0m of spending on food and beverage
$35.8m of spending on
retail
$24.1m of spending on local
transportation$25.3m of spending on recreation
$73.2m of spending on second homes
$56.3m of spending on lodging
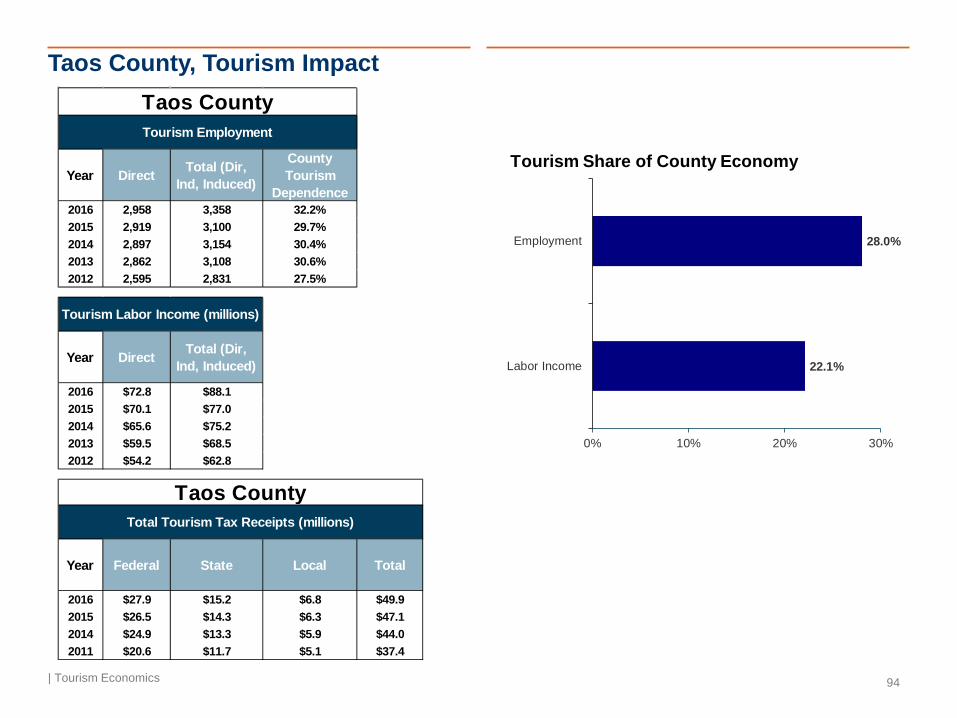
Taos County, Tourism Impact
| Tourism Economics 94
22.1%
28.0%
0% 10% 20% 30%
Labor Income
Employment
Tourism Share of County EconomyYear Direct Total (Dir,
Ind, Induced)
County Tourism
Dependence2016 2,958 3,358 32.2%2015 2,919 3,100 29.7%2014 2,897 3,154 30.4%2013 2,862 3,108 30.6%2012 2,595 2,831 27.5%
Year Direct Total (Dir, Ind, Induced)
2016 $72.8 $88.12015 $70.1 $77.02014 $65.6 $75.22013 $59.5 $68.52012 $54.2 $62.8
Year Federal State Local Total
2016 $27.9 $15.2 $6.8 $49.92015 $26.5 $14.3 $6.3 $47.12014 $24.9 $13.3 $5.9 $44.02011 $20.6 $11.7 $5.1 $37.4
Tourism Labor Income (millions)
Total Tourism Tax Receipts (millions)
Taos County
Taos County
Tourism Employment

Torrance County, Visitor Spending by Industry
| Tourism Economics 95
Year Lodging Food & Beverage Retail Recreation Transport Second
Homes Total Growth Rate
2016 $5.6 $6.6 $5.2 $2.5 $10.2 $9.9 $40.0 -0.5%2015 $5.9 $6.6 $5.2 $2.4 $11.0 $9.2 $40.2 2.5%2014 $5.9 $6.2 $4.9 $2.4 $11.0 $8.8 $39.2 2.9%2013 $5.9 $6.6 $4.8 $2.4 $10.2 $8.2 $38.1 12.4%2012 $5.3 $6.1 $4.4 $2.2 $9.1 $6.9 $33.9 3.7%2011 $5.3 $6.1 $4.6 $2.2 $8.9 $5.6 $32.7
* Note: 2010 and 11 Lodging & FnB Spending data revised to reflect changes in state totals
Visitor Spending, (millions)Torrance County
$32.7 $33.9
$38.1 $39.2 $40.2 $40.0
-2.0%
0.0%
2.0%
4.0%
6.0%
8.0%
10.0%
12.0%
14.0%
0.0
5.0
10.0
15.0
20.0
25.0
30.0
35.0
40.0
45.0
2011 2012 2013 2014 2015 2016
$ M
illio
ns
Total Growth Rate
$
14%
16%
6%
26%
13%
25%
Source: Longwoods International; Tourism Economics
$40.0m of spending on Total
$6.6m of spending on food and beverage
$5.2m of spending on
retail
$10.2m of spending on local
transportation
$2.5m of spending on recreation
$9.9m of spending on second homes
$5.6m of spending on lodging
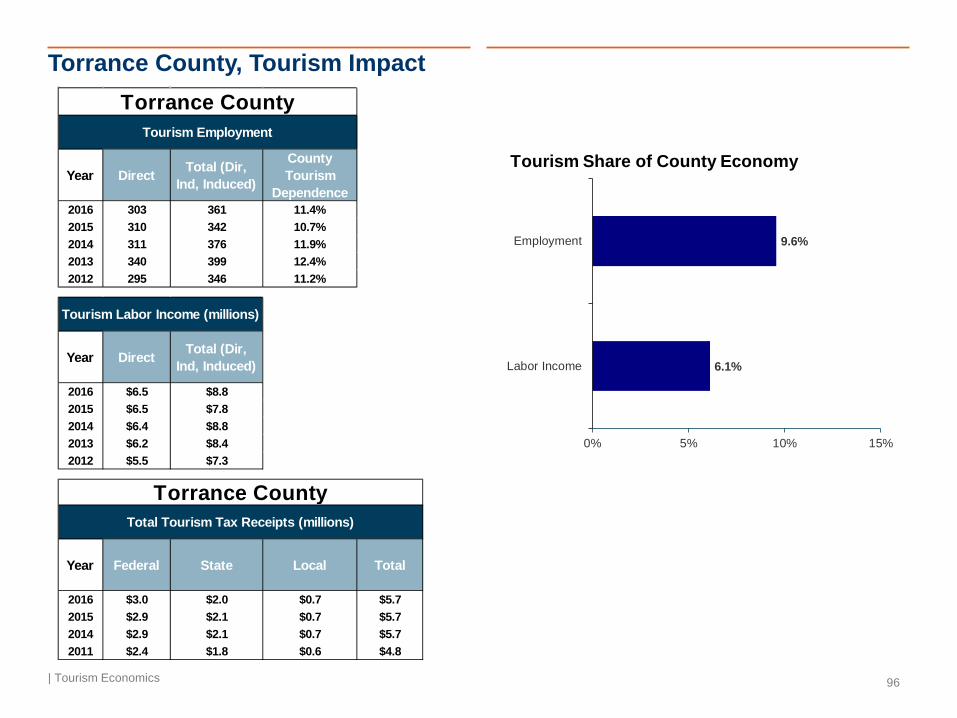
Torrance County, Tourism Impact
| Tourism Economics 96
6.1%
9.6%
0% 5% 10% 15%
Labor Income
Employment
Tourism Share of County EconomyYear Direct Total (Dir,
Ind, Induced)
County Tourism
Dependence2016 303 361 11.4%2015 310 342 10.7%2014 311 376 11.9%2013 340 399 12.4%2012 295 346 11.2%
Year Direct Total (Dir, Ind, Induced)
2016 $6.5 $8.82015 $6.5 $7.82014 $6.4 $8.82013 $6.2 $8.42012 $5.5 $7.3
Year Federal State Local Total
2016 $3.0 $2.0 $0.7 $5.72015 $2.9 $2.1 $0.7 $5.72014 $2.9 $2.1 $0.7 $5.72011 $2.4 $1.8 $0.6 $4.8
Tourism Labor Income (millions)
Total Tourism Tax Receipts (millions)
Torrance County
Torrance County
Tourism Employment
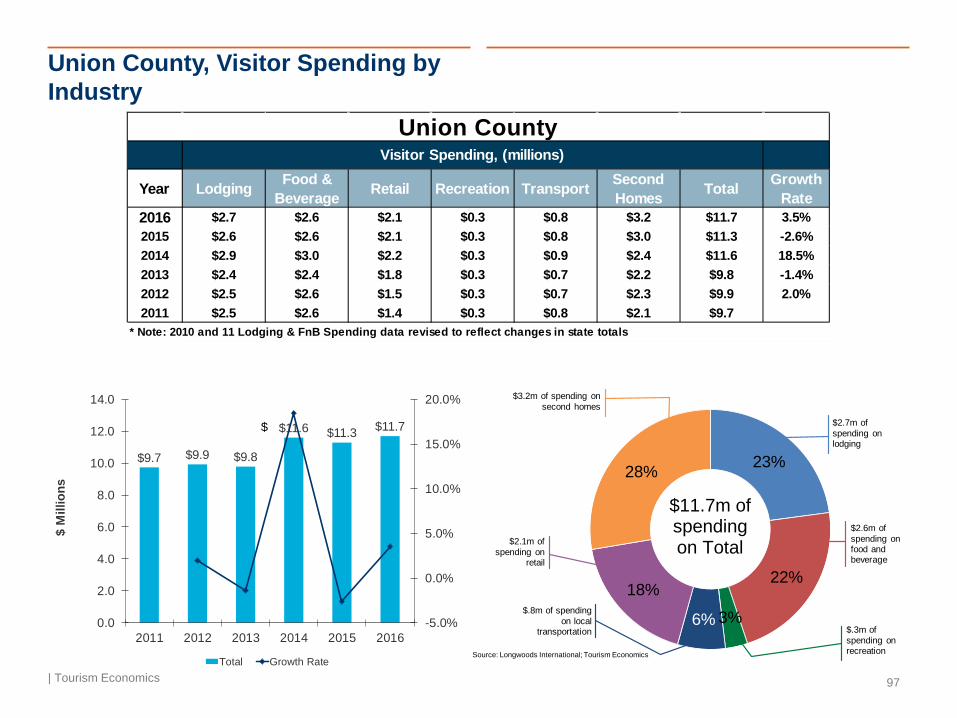
Union County, Visitor Spending by Industry
| Tourism Economics 97
Year Lodging Food & Beverage Retail Recreation Transport Second
Homes Total Growth Rate
2016 $2.7 $2.6 $2.1 $0.3 $0.8 $3.2 $11.7 3.5%2015 $2.6 $2.6 $2.1 $0.3 $0.8 $3.0 $11.3 -2.6%2014 $2.9 $3.0 $2.2 $0.3 $0.9 $2.4 $11.6 18.5%2013 $2.4 $2.4 $1.8 $0.3 $0.7 $2.2 $9.8 -1.4%2012 $2.5 $2.6 $1.5 $0.3 $0.7 $2.3 $9.9 2.0%2011 $2.5 $2.6 $1.4 $0.3 $0.8 $2.1 $9.7
* Note: 2010 and 11 Lodging & FnB Spending data revised to reflect changes in state totals
Visitor Spending, (millions)Union County
$9.7 $9.9 $9.8
$11.6 $11.3 $11.7
-5.0%
0.0%
5.0%
10.0%
15.0%
20.0%
0.0
2.0
4.0
6.0
8.0
10.0
12.0
14.0
2011 2012 2013 2014 2015 2016
$ M
illio
ns
Total Growth Rate
$
23%
22%
3%6%
18%
28%
Source: Longwoods International; Tourism Economics
$11.7m of spending on Total
$2.6m of spending on food and beverage
$2.1m of spending on
retail
$.8m of spending on local
transportation $.3m of spending on recreation
$3.2m of spending on second homes
$2.7m of spending on lodging
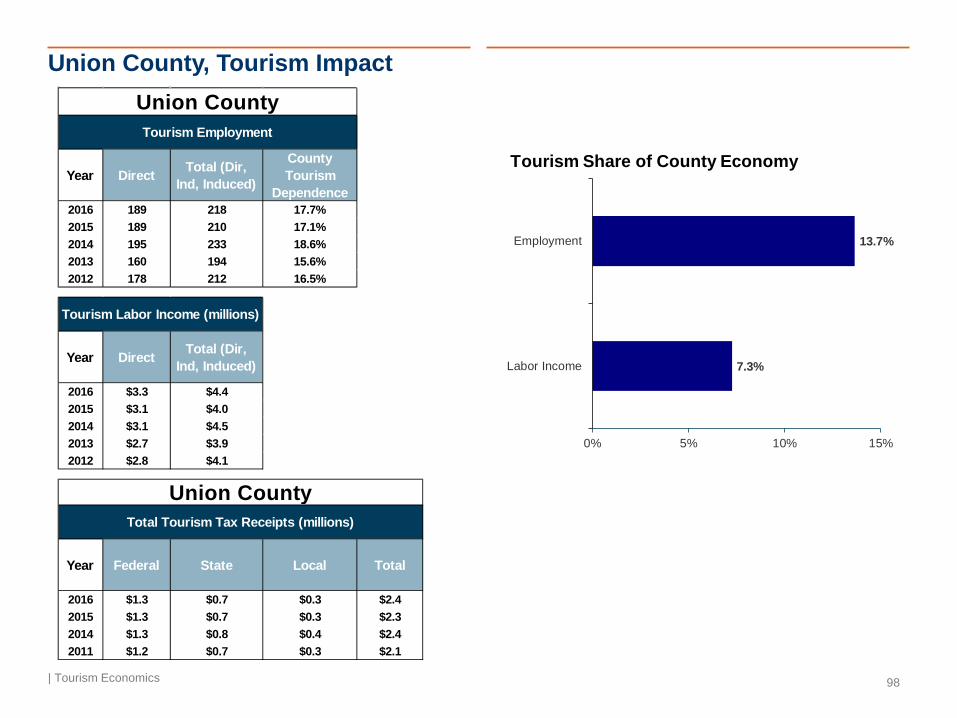
Union County, Tourism Impact
| Tourism Economics 98
7.3%
13.7%
0% 5% 10% 15%
Labor Income
Employment
Tourism Share of County EconomyYear Direct Total (Dir,
Ind, Induced)
County Tourism
Dependence2016 189 218 17.7%2015 189 210 17.1%2014 195 233 18.6%2013 160 194 15.6%2012 178 212 16.5%
Year Direct Total (Dir, Ind, Induced)
2016 $3.3 $4.42015 $3.1 $4.02014 $3.1 $4.52013 $2.7 $3.92012 $2.8 $4.1
Year Federal State Local Total
2016 $1.3 $0.7 $0.3 $2.42015 $1.3 $0.7 $0.3 $2.32014 $1.3 $0.8 $0.4 $2.42011 $1.2 $0.7 $0.3 $2.1
Tourism Labor Income (millions)
Total Tourism Tax Receipts (millions)
Union County
Union County
Tourism Employment

Valencia County, Visitor Spending by Industry
| Tourism Economics 99
Year Lodging Food & Beverage Retail Recreation Transport Second
Homes Total Growth Rate
2016 $14.1 $21.9 $25.4 $8.4 $11.3 $6.2 $87.4 0.4%2015 $14.3 $21.8 $25.4 $8.3 $11.4 $5.9 $87.1 5.6%2014 $14.2 $21.1 $24.9 $7.9 $9.8 $4.5 $82.4 5.4%2013 $13.4 $20.9 $23.2 $8.2 $8.8 $3.7 $78.2 1.4%2012 $12.9 $20.5 $22.3 $8.6 $8.7 $4.1 $77.1 4.9%2011 $11.8 $19.6 $22.7 $7.9 $7.4 $4.1 $73.6
* Note: 2010 and 11 Lodging & FnB Spending data revised to reflect changes in state totals
Visitor Spending, (millions)Valencia County
$73.6
$77.1$78.2
$82.4
$87.1 $87.4
0.0%
1.0%
2.0%
3.0%
4.0%
5.0%
6.0%
65.0
70.0
75.0
80.0
85.0
90.0
2011 2012 2013 2014 2015 2016
$ M
illio
ns
Total Growth Rate
$
16%
25%
10%13%
29%
7%
Source: Longwoods International; Tourism Economics
$87.4m of spending on Total
$21.9m of spending on food and beverage
$25.4m of spending on
retail
$11.3m of spending on local
transportation $8.4m of spending on recreation
$6.2m of spending on second homes
$14.1m of spending on lodging

Valencia County, Tourism Impact
| Tourism Economics 100
4.1%
6.8%
0% 2% 4% 6% 8%
Labor Income
Employment
Tourism Share of County EconomyYear Direct Total (Dir,
Ind, Induced)
County Tourism
Dependence2016 932 1,136 8.7%2015 924 1,098 8.4%2014 909 1,183 8.8%2013 876 1,136 8.6%2012 842 1,087 7.5%
Year Direct Total (Dir, Ind, Induced)
2016 $17.2 $25.12015 $17.4 $24.02014 $17.0 $27.22013 $16.5 $26.02012 $16.0 $24.9
Year Federal State Local Total
2016 $8.2 $5.6 $2.5 $16.32015 $8.3 $5.8 $2.6 $16.62014 $8.1 $5.6 $2.6 $16.42011 $7.4 $5.1 $2.4 $14.8
Tourism Labor Income (millions)
Total Tourism Tax Receipts (millions)
Valencia County
Valencia County
Tourism Employment

Related Documents