Economic Impact of the US Gaming Industry September 2014

Welcome message from author
This document is posted to help you gain knowledge. Please leave a comment to let me know what you think about it! Share it to your friends and learn new things together.
Transcript

Economic Impact of the
US Gaming Industry
September 2014

2
Methods
l Analysis includes:
■ Commercial casinos
■ Native American casinos
■ Card rooms (California, Florida, Minnesota, Washington)
l Analysis excludes:
■ Pari-mutuel gaming (e.g. horse racing)
■ Slots and video lottery terminals in bars and other non-casino locations

3
Estimating Direct Impacts
l Industry impacts include:
■ Casino revenues (including Native American)
■ Gaming manufacturers’ revenues
● Includes all U.S. sales/revenues of gaming manufacturers and excludes global sales outside the U.S.
l Ancillary spending impacts include:
■ Spending by casino patrons at leased third-party operations inside the casino
■ Off-site spending by casino patrons during their trip to the casino
l Metrics of industry impact and off-site spending impact include:
■ Spending/revenues
■ Jobs
■ Labor income

4
Types of Gaming Covered
l In addition to commercial casinos (including land-based, riverboat, dockside and racetrack casinos), Oxford Economics includes Native American casinos and card rooms in four states.
l Oxford Economics includes legalized internet gaming conducted by commercial casino operators and reported in state regulatory filings. For 2013, this includes Delaware, New Jersey and Nevada.
l Oxford Economics excludes pari-mutuel gaming (e.g. horse racing), cruise ship casinos, slots and video lottery terminals in bars and other non-casino locations, and lotteries.

5
Estimating Casino Revenue
l For the purpose of this analysis, total casino revenue is defined as revenue net of promotional allowances. It represents the amount spent by consumers at casinos, and is therefore equivalent to economic output.
l Oxford Economics estimated total casino revenue at the state level by integrating several sets of available information. These include:
■ Gaming revenue of commercial casinos consistent with state regulatory reporting, as gathered by the American Gaming Association for publication in the State of the States research, plus state reporting on gaming revenue at card clubs.
■ Gaming revenue of Native American casinos as reported by the National Indian Gaming Commission (“NIGC”) based on independent audit reports received by NIGC from tribes.
■ Survey responses reporting gaming and non-gaming revenue at the property level as gathered directly by Oxford Economics from national casino operators.
■ Data from Casino City on the number of slot machine and table game positions at casinos in each state.
■ State regulatory reporting on non-gaming revenue in Nevada and New Jersey.

6
Estimating Casino Employment & Labor Income
l Oxford Economics estimated casino employment and labor income at the state level by incorporating several additional sets of information. These include:
■ Bureau of Labor Statistics estimates of employment and annual wages in two industries (NAICS 71321 casinos except casinos hotels, and 72112 casino hotels) based on the Quarterly Census of Employment and Wages.
■ Survey responses reporting on payroll costs and employment at the property level as gathered directly by Oxford Economics from national casino operators.
■ Casino benchmark information, including the Indian Gaming Cost of Doing Business Report, 2014 edition, published by Joseph Eve, an accounting and advisory firm.
■ State regulatory reporting on casino operating expenses and profit margins in Nevada and New Jersey.

7
Casino Revenues
l Total casino revenues amounted to $81 billion in 2013 (net of promotional allowances).
l Survey respondent data provided breakdowns of total revenues:
■ Gaming revenues comprised 83% ($67 billion) of total revenues
■ Non-gaming revenues comprised 17% ($14 billion) of total revenues
● Food & beverage revenue, hotel revenue, and other revenue
Revenue Type(Net of promotional allowances)
Native American Casinos
Commercial Casinos
Industry Total
Share of Total Revenue
Gaming Revenue $28,032 $38,981 $67,012 83%
Non-Gaming Revenue $2,233 $11,853 $14,086 17%Food & Beverage Revenue $1,125 $4,536 $5,661 7%Room Revenue $376 $4,089 $4,465 6%Other Revenue $732 $3,228 $3,960 5%
Total Casino Revenue $30,265 $50,834 $81,098 100%

8
Gaming Manufacturers
l Data on gaming manufacturers’ revenue, employment, and labor income was based on survey responses from manufacturers as well as publicly available data from companies’ annual reports.
l Gaming manufacturer revenues are limited to sales in the US, and the analysis excludes any worldwide revenue/activity outside the US.
9
Ancillary Spending
l Ancillary spending includes purchases by casino patrons at retailers and businesses outside the casino and at businesses inside the casino owned by third-party operators.
l Existing research by the AGA indicates that the majority of casino patrons spends time outside the casino and spends money at restaurants or shops outside the casino during their casino trip.
l Since this casino patron spending is primarily driven by the patrons’ trips to the casino, it is included in the gaming industry’s direct impact as ancillary spending.
l Estimates of overall ancillary spending are based on Longwoods International’s Travel USA survey of domestic travel in 2013.
l Analysis is limited to travelers who indicated that a casino was the main purpose for their trip.

10
Summary Direct Impacts
l Total casino revenues (including Native American) amounted to more than $81 billion in 2013.
l In 2013, gaming manufacturers in the US had nearly $6 billion in revenues.
l Ancillary spending by casino patrons totaled more than $14 billion.
l The US gaming industry had a direct impact of nearly $102 billion in 2013.
l The analysis excludes capital spending on casino construction.
DescriptionDirect Revenues/
Spending($ Millions)
Casino Revenues $81,156Gaming Manufacturers Revenues $5,994Subtotal, Industry $87,150
Ancillary Spending $14,440
Total Direct Impacts $101,590
Industry Impacts
Ancillary Spending

11
Direct Jobs & Labor Income
l Casinos employed more than 554,000 employees with nearly $26 billion in labor income in 2013.
l Manufacturers directly employed almost 16,000 workers with approximately $1.1 billion in labor income.
l Off-site spending by casino patrons directly generated nearly 164,000 jobs and $6 billion in labor income in 2013.
l As a whole, the US gaming industry was responsible for employing approximately 734,000 workers with $33 billion in labor income.

12
Economic Impact Analysis
l Analysis of the direct effects of the casino industry serve as inputs for the economic impact model.
l Input-Output (I-O) model for the US and state economies calculates the downstream impacts of direct spending.
l Indirect impacts refer to supply chain effects.
l Induced impacts refer to additional impacts as employees spend in the local economy.

13
Main components of economic impacts l There are three main components of a project’s overall economic impact:
■ Direct impacts
■ Indirect impacts
■ Induced impacts
l Direct Impacts include direct spending and revenues.
l Industry impacts include casinos revenues (gaming and non-gaming), manufacturers revenue.
l Ancillary spending includes spending by casino patrons at third-party leased establishments inside the casino and other establishments outside the casino.
l Indirect Impacts include downstream supplier industry impacts. For example, the casinos and manufacturers might hire a third-party cleaning service, food and equipment delivery service, linen cleaning service, legal services, or marketing services.
l Induced Impacts arise as employees spend their wages in the local economy. For example, casino or manufacturer employees will spend money on rent, transportation, food & beverage, and entertainment.

14
Summary Economic Impacts l Direct industry revenues of $87 billion generated $51 billion in indirect impacts and $67 billion in induced impacts,
resulting in $205 billion in output. Ancillary spending of $14 billion generated $9 billion in indirect impacts and $11 billion in induced impacts, resulting in $35 billion in output. Overall, the total economic impact of the US gaming industry was nearly $240 billion in 2013.
l Direct industry employment of 570,000 jobs resulted in a total impact of more than 1.4 million jobs. Ancillary spending generated a total job impact of nearly 265,000 jobs. Taken together, the total job impact of the US gaming industry was more than 1.7 million jobs.
l Direct labor income of $27 billion resulted in a total impact of $60 billion, while ancillary spending generated $13 billion in total labor income. Overall, the US gaming industry generated nearly $74 billion in total labor income.
DescriptionOutput Impacts
($ Millions)Employment
Impacts
Labor Income Impacts
($ Millions)
Direct Impacts $87,150 570,252 $26,580Indirect Impacts $51,191 345,952 $15,224Induced Impacts $66,680 530,894 $18,676Subtotal $205,021 1,447,098 $60,481
Direct Impacts $14,440 163,678 $6,149Indirect Impacts $8,886 36,752 $2,835Induced Impacts $11,264 64,262 $4,038Subtotal $34,589 264,692 $13,022
Total Impact, US Gaming Industry $239,610 1,711,790 $73,503
Ancillary Spending Impacts
Industry Impacts

15
Detailed Economic Impacts - Output
DescriptionDirect Output
($ Millions)
Indirect Output
($ Millions)
Induced Output
($ Millions)
Total Output
($ Millions)
% of TotalOutput
Total, Casinos $81,156 $46,521 $61,929 $189,606 79%Commercial Casinos $50,833 $24,561 $35,347 $110,741 46%Native American Casinos $30,322 $21,960 $26,582 $78,865 33%
Gaming Manufacturers $5,994 $4,670 $4,751 $15,416 6%Subtotal, Industry $87,150 $51,191 $66,680 $205,021 86%
Ancillary Spending $14,440 $8,886 $11,264 $34,589 14%
Total, US Gaming Industry $101,590 $60,076 $77,944 $239,610 100%
Output Impacts

16
Detailed Economic Impacts - Employment
Description Direct Employment
Indirect Employment
Induced Employment
Total Employment
% of TotalEmployment
Total, Casinos 554,346 333,885 514,866 1,403,096 82%Commercial Casinos 370,269 118,541 179,954 668,765 39%Native American Casinos 184,077 215,343 334,911 734,331 43%
Gaming Manufacturers 15,906 12,068 16,028 44,002 3%Subtotal, Industry 570,252 345,952 530,894 1,447,098 85%
Ancillary Spending 163,678 36,752 64,262 264,692 15%
Total, US Gaming Industry 733,930 382,705 595,155 1,711,790 100%
Employment Impacts

17
Detailed Economic Impacts – Labor Income
DescriptionDirect
Labor Income($ Millions)
Indirect Labor Income
($ Millions)
Induced Labor Income
($ Millions)
Total Labor Income
($ Millions)
% of TotalLabor Income
Total, Casinos $25,521 $14,407 $17,932 $57,860 79%Commercial Casinos $17,366 $9,533 $12,080 $38,980 53%Native American Casinos $8,155 $4,874 $5,852 $18,881 26%
Gaming Manufacturers $1,059 $817 $744 $2,620 4%Subtotal, Industry $26,580 $15,224 $18,676 $60,481 82%
Ancillary Spending $6,149 $2,835 $4,038 $13,022 18%
Total, US Gaming Industry $32,729 $18,059 $22,714 $73,503 100%
Labor Income Impacts

18
Industry Distribution of Impacts
l The economic impacts of the US gaming industry are far reaching, as direct spending ripples through the national economy, generating positive impacts for numerous supplier industries.
l As shown on the following slides, impacted industries include:
■ Finance, insurance, and real estate ($31 billion in total output impacts): Insurance carriers, banks, funds and trusts, securities, real estate, consumer rentals, machinery and equipment rental and leasing
■ Business services ($21 billion in total output impacts): Legal, advertising, marketing, engineering, all other professional services, research and development, management, travel arrangement, business support, facilities services, administrative services, waste management
■ Education and health care ($11 billion in total output impacts): Private elementary and secondary schools, colleges, universities, physicians, home health care, nursing and residential care facilities, child care (e.g. spending by employees of casinos and other businesses supported by gaming)
■ Construction and utilities ($9 billion in total output impacts): New building construction, renovations, residential construction, electric and gas distribution
■ Communications ($7 billion in total output impacts): Telecommunications (corporate and personal), newspapers and periodicals, cable programming, data processing
■ Air transportation ($7 billion in total output impacts): Air travel
19
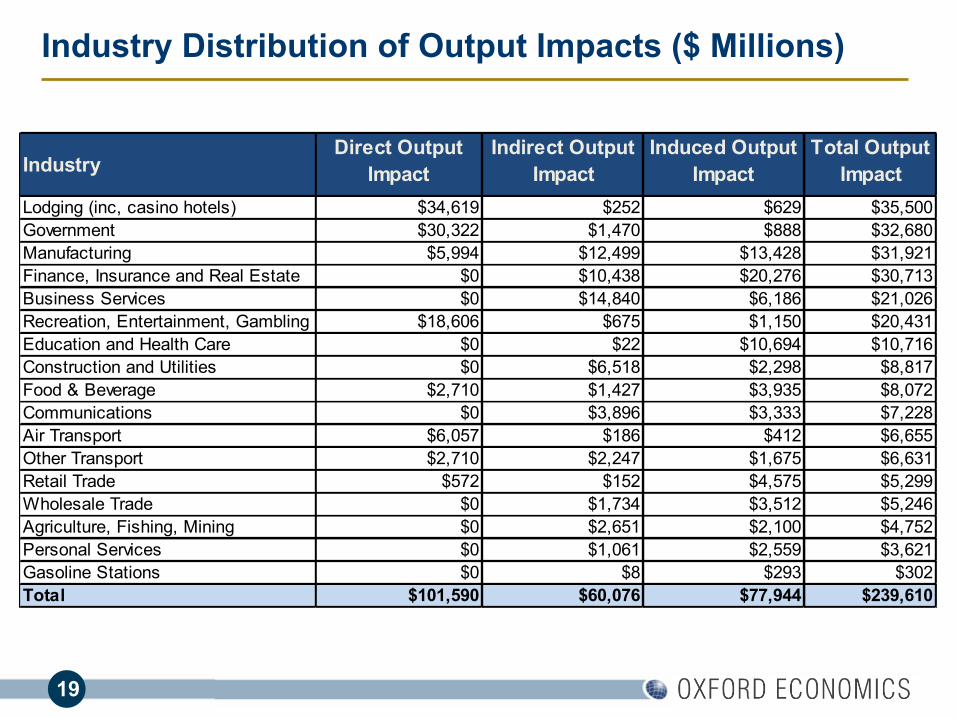
Industry Distribution of Output Impacts ($ Millions)
IndustryDirect Output
ImpactIndirect Output
ImpactInduced Output
ImpactTotal Output
ImpactLodging (inc, casino hotels) $34,619 $252 $629 $35,500Government $30,322 $1,470 $888 $32,680Manufacturing $5,994 $12,499 $13,428 $31,921Finance, Insurance and Real Estate $0 $10,438 $20,276 $30,713Business Services $0 $14,840 $6,186 $21,026Recreation, Entertainment, Gambling $18,606 $675 $1,150 $20,431Education and Health Care $0 $22 $10,694 $10,716Construction and Utilities $0 $6,518 $2,298 $8,817Food & Beverage $2,710 $1,427 $3,935 $8,072Communications $0 $3,896 $3,333 $7,228Air Transport $6,057 $186 $412 $6,655Other Transport $2,710 $2,247 $1,675 $6,631Retail Trade $572 $152 $4,575 $5,299Wholesale Trade $0 $1,734 $3,512 $5,246Agriculture, Fishing, Mining $0 $2,651 $2,100 $4,752Personal Services $0 $1,061 $2,559 $3,621Gasoline Stations $0 $8 $293 $302Total $101,590 $60,076 $77,944 $239,610
20
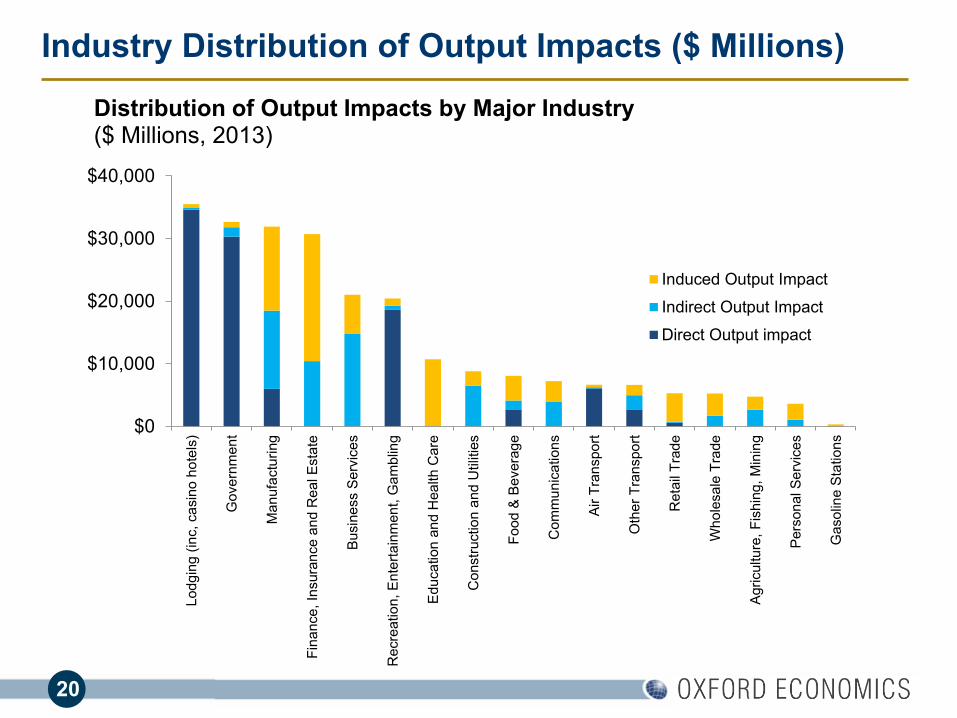
Industry Distribution of Output Impacts ($ Millions)
$0
$10,000
$20,000
$30,000
$40,000Lo
dgin
g (in
c, c
asin
o ho
tels
)
Gov
ernm
ent
Man
ufac
turin
g
Fina
nce,
Insu
ranc
e an
d R
eal E
stat
e
Bus
ines
s Se
rvic
es
Rec
reat
ion,
Ent
erta
inm
ent,
Gam
blin
g
Edu
catio
n an
d H
ealth
Car
e
Con
stru
ctio
n an
d U
tiliti
es
Food
& B
ever
age
Com
mun
icat
ions
Air
Tran
spor
t
Oth
er T
rans
port
Ret
ail T
rade
Who
lesa
le T
rade
Agr
icul
ture
, Fis
hing
, Min
ing
Per
sona
l Ser
vice
s
Gas
olin
e S
tatio
ns
Induced Output Impact
Indirect Output Impact
Direct Output impact
Distribution of Output Impacts by Major Industry($ Millions, 2013)

21
Industry Distribution of Labor Income Impacts ($Millions)
Industry Direct Labor Income
Indirect Labor Income
Induced Labor Income
Total Labor Income
Lodging (inc, casino hotels) $11,817 $72 $184 $12,073Business Services $0 $6,968 $3,064 $10,031Government $8,155 $724 $425 $9,304Recreation, Entertainment, Gambling $6,438 $296 $443 $7,177Education and Health Care $0 $10 $5,431 $5,442Finance, Insurance and Real Estate $0 $2,250 $3,168 $5,419Manufacturing $1,059 $1,518 $1,498 $4,076Other Transport $1,987 $904 $655 $3,547Food & Beverage $1,167 $563 $1,450 $3,181Retail Trade $307 $63 $1,886 $2,256Construction and Utilities $0 $1,690 $497 $2,187Personal Services $0 $669 $1,341 $2,011Communications $0 $1,213 $746 $1,960Air Transport $1,799 $42 $94 $1,936Wholesale Trade $0 $527 $1,200 $1,727Agriculture, Fishing, Mining $0 $545 $500 $1,045Gasoline Stations $0 $4 $130 $134Total $32,729 $18,059 $22,714 $73,503

22
Industry Distribution of Labor Income Impacts ($Millions)
$0
$2,000
$4,000
$6,000
$8,000
$10,000
$12,000
$14,000Lo
dgin
g (in
c, c
asin
o ho
tels
)
Bus
ines
s Se
rvic
es
Gov
ernm
ent
Rec
reat
ion,
Ent
erta
inm
ent,
Gam
blin
g
Edu
catio
n an
d H
ealth
Car
e
Fina
nce,
Insu
ranc
e an
d R
eal E
stat
e
Man
ufac
turin
g
Oth
er T
rans
port
Food
& B
ever
age
Ret
ail T
rade
Con
stru
ctio
n an
d U
tiliti
es
Per
sona
l Ser
vice
s
Com
mun
icat
ions
Air
Tran
spor
t
Who
lesa
le T
rade
Agr
icul
ture
, Fis
hing
, Min
ing
Gas
olin
e S
tatio
ns
Induced Labor Income
Indirect Labor Income
Direct Labor Income
Distribution of Labor Income Impacts by Major Industry($ Millions, 2013)

23
Industry Distribution of Employment Impacts
IndustryDirect
EmploymentIndirect
EmploymentInduced
EmploymentTotal
Employment
Lodging (inc, casino hotels) 254,489 2,375 6,671 263,535Business Services 0 141,868 66,066 207,934Government 184,077 9,349 7,255 200,681Recreation, Entertainment, Gambling 138,631 7,348 19,602 165,582Food & Beverage 39,444 22,227 75,210 136,880Education and Health Care 0 396 130,264 130,661Finance, Insurance and Real Estate 0 52,949 71,161 124,110Retail Trade 8,400 2,769 71,591 82,760Other Transport 44,454 17,077 15,525 77,056Manufacturing 15,906 30,107 26,282 72,295Personal Services 0 13,791 49,757 63,549Construction and Utilities 0 49,443 7,038 56,481Air Transport 48,529 563 1,427 50,519Wholesale Trade 0 9,094 18,666 27,760Agriculture, Fishing, Mining 0 12,341 13,559 25,899Communications 0 10,854 10,453 21,308Gasoline Stations 0 153 4,626 4,779Total 733,930 382,705 595,155 1,711,790

24
Industry Distribution of Employment Impacts
0
50,000
100,000
150,000
200,000
250,000
300,000Lo
dgin
g (in
c, c
asin
o ho
tels
)
Bus
ines
s Se
rvic
es
Gov
ernm
ent
Rec
reat
ion,
Ent
erta
inm
ent,
Gam
blin
g
Food
& B
ever
age
Edu
catio
n an
d H
ealth
Car
e
Fina
nce,
Insu
ranc
e an
d R
eal E
stat
e
Ret
ail T
rade
Oth
er T
rans
port
Man
ufac
turin
g
Per
sona
l Ser
vice
s
Con
stru
ctio
n an
d U
tiliti
es
Air
Tran
spor
t
Who
lesa
le T
rade
Agr
icul
ture
, Fis
hing
, Min
ing
Com
mun
icat
ions
Gas
olin
e S
tatio
ns
Induced Employment
Indirect Employment
Direct Employment
Distribution of Employment Impacts by Major Industry(Number of Jobs, 2013)
25
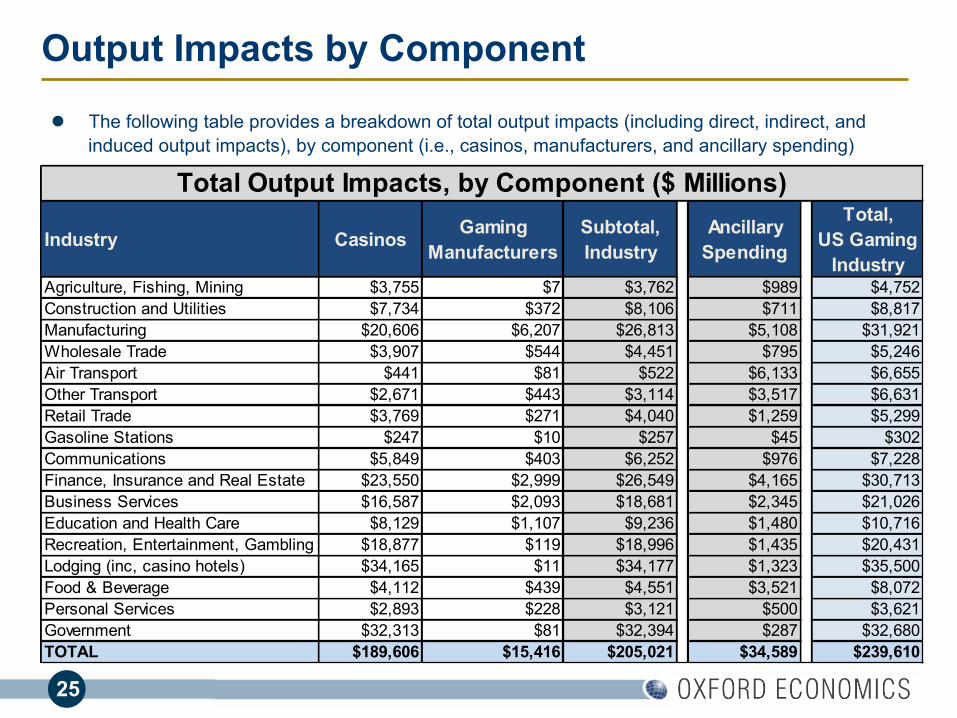
Output Impacts by Component
l The following table provides a breakdown of total output impacts (including direct, indirect, and induced output impacts), by component (i.e., casinos, manufacturers, and ancillary spending)
Industry Casinos Gaming Manufacturers
Subtotal, Industry
AncillarySpending
Total, US Gaming
IndustryAgriculture, Fishing, Mining $3,755 $7 $3,762 $989 $4,752Construction and Utilities $7,734 $372 $8,106 $711 $8,817Manufacturing $20,606 $6,207 $26,813 $5,108 $31,921Wholesale Trade $3,907 $544 $4,451 $795 $5,246Air Transport $441 $81 $522 $6,133 $6,655Other Transport $2,671 $443 $3,114 $3,517 $6,631Retail Trade $3,769 $271 $4,040 $1,259 $5,299Gasoline Stations $247 $10 $257 $45 $302Communications $5,849 $403 $6,252 $976 $7,228Finance, Insurance and Real Estate $23,550 $2,999 $26,549 $4,165 $30,713Business Services $16,587 $2,093 $18,681 $2,345 $21,026Education and Health Care $8,129 $1,107 $9,236 $1,480 $10,716Recreation, Entertainment, Gambling $18,877 $119 $18,996 $1,435 $20,431Lodging (inc, casino hotels) $34,165 $11 $34,177 $1,323 $35,500Food & Beverage $4,112 $439 $4,551 $3,521 $8,072Personal Services $2,893 $228 $3,121 $500 $3,621Government $32,313 $81 $32,394 $287 $32,680TOTAL $189,606 $15,416 $205,021 $34,589 $239,610
Total Output Impacts, by Component ($ Millions)

26
Employment Impacts by Component
l The following table provides a breakdown of total employment impacts (including direct, indirect, and induced jobs), by component (i.e., casinos, manufacturers, and ancillary spending)
Industry Casinos Gaming Manufacturers
Subtotal, Industry
AncillarySpending
Total, US Gaming
IndustryAgriculture, Fishing, Mining 22,210 16 22,227 3,673 25,899Construction and Utilities 54,099 393 54,491 1,990 56,481Manufacturing 49,673 16,295 65,968 6,327 72,295Wholesale Trade 23,159 1,483 24,643 3,117 27,760Air Transport 1,654 134 1,788 48,731 50,519Other Transport 25,349 1,542 26,891 50,165 77,056Retail Trade 64,485 1,853 66,338 16,422 82,760Gasoline Stations 4,206 51 4,257 523 4,779Communications 18,227 788 19,015 2,293 21,308Finance, Insurance and Real Estate 107,531 3,964 111,495 12,615 124,110Business Services 183,483 6,472 189,955 17,979 207,934Education and Health Care 111,893 4,778 116,671 13,990 130,661Recreation, Entertainment, Gambling 149,958 757 150,715 14,867 165,582Lodging (inc, casino hotels) 251,489 38 251,528 12,007 263,535Food & Beverage 81,962 3,673 85,635 51,245 136,880Personal Services 54,997 1,416 56,414 7,135 63,549Government 198,719 349 199,067 1,614 200,681TOTAL 1,403,096 44,002 1,447,098 264,692 1,711,790
Total Employment Impacts, by Component

27
Labor Income Impacts by Component
l The following table provides a breakdown of total labor income impacts (including direct, indirect, and induced labor income ), by component (i.e., casinos, manufacturers, and ancillary spending)
Industry Casinos Gaming Manufacturers
Subtotal, Industry
AncillarySpending
Total, US Gaming
IndustryAgriculture, Fishing, Mining $787 $0 $787 $258 $1,045Construction and Utilities $1,946 $38 $1,983 $203 $2,187Manufacturing $2,374 $1,084 $3,458 $618 $4,076Wholesale Trade $1,295 $100 $1,396 $332 $1,727Air Transport $108 $7 $114 $1,821 $1,936Other Transport $1,041 $87 $1,128 $2,419 $3,547Retail Trade $1,545 $54 $1,599 $657 $2,256Gasoline Stations $108 $2 $110 $24 $134Communications $1,619 $55 $1,674 $286 $1,960Finance, Insurance and Real Estate $4,176 $307 $4,483 $936 $5,419Business Services $8,161 $459 $8,620 $1,411 $10,031Education and Health Care $4,239 $248 $4,486 $955 $5,442Recreation, Entertainment, Gambling $6,544 $26 $6,571 $606 $7,177Lodging (inc, casino hotels) $11,629 $1 $11,630 $442 $12,073Food & Beverage $1,571 $75 $1,645 $1,535 $3,181Personal Services $1,608 $57 $1,665 $346 $2,011Government $9,111 $21 $9,132 $172 $9,304TOTAL $57,860 $2,620 $60,481 $13,022 $73,503
Total Labor Income Impacts, by Component ($ Millions)

28
Fiscal (Tax) Impact Analysis
l Hybrid approach: ■ Analysis of the certain direct taxes, such as gaming taxes and
available information on payments by Native American tribes, such as in accordance with state compacts; plus
■ IMPLAN framework of federal, state, and local tax categories
Federal taxes State taxes Local taxes
Corporate Indirect Business Personal Income Social Security
Gaming Hotel Sales Corporate Personal Income State Unemployment Dividends Other taxes and fees
Gaming Sales Property Excise and Fees Personal Income

29
Summary Fiscal (Tax) Impacts
l The US commercial casino industry generated more than $38 billion in total tax revenues in 2013.
■ More than $17 billion in federal taxes, including $7 billion in social security taxes
■ $11 billion in state and local taxes, including $4 billion in sales taxes and $1.5 billion in personal income tax revenues
■ $10 billion in gaming taxes
Tax Description Tax RevenuesFederal Taxes $17,294 Personal Income $5,918 Corporate $2,855 Indirect business $1,142 Social Security $7,477
State and Local Taxes $10,816 Sales $4,246 Personal Income $1,551 Corporate $437 Social Security $147 Excise and Fees $1,222 Property $3,928
Gaming Taxes $9,959
Total Taxes $38,069

30
Effective Tax Rate of Commercial Casinos
l Based on fiscal (tax) impact data from the IMPLAN input-output model, as well as state-reported data and survey response data from casino operators, Oxford Economics estimates that the effective tax rate for commercial casinos is 33%.
l On average, each $1 million in direct spending by commercial casinos in the US is subject to:
■ 16% in federal and state and local taxes
● including personal income taxes, sales taxes, property taxes, etc.
■ 17% in gaming taxes (not including local development fees, upfront license application fees, etc.)
l An estimated 33% effective tax rate is similar to previous research on casinos’ effective tax rates.

31
Casino employment in context
l Casinos provide more direct jobs than many categories of retail stores
92
139
197
292
445
501
505
554
676
865
0 200 400 600 800 1,000
Book stores
Jewelry and luggage stores
Shoe stores
Office supplies, stationary and giftstores
Furniture and furnishings stores
Electronics and appliance stores
Sporting goods and musicalinstrument stores
US gaming industry
Home improvement centers
Gasoline stations
Employment by business typeThousands of jobs, 2013
Source: Bureau of Labor Statistics; Oxford Economics

32
Casino employment in context
l Casinos are one of the largest recreational employers in the US
32
41
68
76
111
130
139
166
187
350
354
449
523
554
0 100 200 300 400 500 600
Marinas
Skiing facilities
Bowling centers
Taxi and limousine service
Performing arts
Spectator sports
Museums and historical sites
Airports and other air support
Aumusement parks and arcades
Golf courses and country clubs
Bars and night clubs
Airlines
Fitness rec. sports centers
US gaming industry
Employment by business typeThousands of jobs, 2013
Source: Bureau of Labor Statistics; Oxford Economics

33
Consumer spending at casinos in context
l Consumers spend almost as much at casinos as at hotels
$37
$44
$44
$46
$50
$55
$61
$62
$64
$77
$81
$82
$100
$0 $20 $40 $60 $80 $100 $120
Televisions
Boats, bicyles, and motorcycles
Fitness and sports centers
Amusement parks and campgrounds
Air transportation
Pets and related
Games, toys and hobbies
Sporting equipment
Spectator sports admissons
Jewelry and watches
US gaming industry
Hotels
Computers, software, accessories
Consumer spending by type of productIn billions of dollars, 2013
Source: Bureau of Economic Analysis; Oxford Economics

34
Casino employment in context
l Casino employment (554,346 jobs)
■ is equivalent to almost one in 25 leisure and hospitality jobs
l Direct employment (733,930 jobs)
■ is equivalent to almost one in 160 jobs in the service sector
■ would be almost enough to fill every seat in the Dallas Cowboys’ football stadium for every home game
■ is almost as many people as work in the District of Columbia (745,200 in 2013)
l Total employment (1.7 million jobs)
■ is equivalent to one in 80 nonfarm jobs
■ would rank 27th among US states measured by employment

35
Consumer spending on casino gaming
l Consumer spending on casino gaming increased to $67.0 billion in 2013
$30
$35
$40
$45
$50
$55
$60
$65
$70
02 03 04 05 06 07 08 09 10 11 12 13
Consumer spending on casino gamingIn billions, US gaming industry
Source: American Gaming Association; National Indian Gaming Commission; Oxford Economics
$67.0 billion

36
US gaming industry income
l Gaming industry income has increased ahead of its prior peak
$10
$15
$20
$25
$30
02 03 04 05 06 07 08 09 10 11 12 13
Gaming industry labor incomeIn billions
Source: Bureau of Labor Statistics; Oxford Economics
$25.5 billion

37
Fiscal impacts in context
l $38 billion into public budgets pays for a range of services including public safety, hospitals and schools, just to name a few. In fact, total tax revenues (federal, state and local, and gaming taxes) generated by the gaming industry are enough to pay for the salaries of more than 600,000 teachers.
l The $20.8 billion of state and local taxes, including gaming taxes, supported by the US gaming industry would cover the annual education cost for almost two million pupils.
l This implies that each direct gaming industry job is supporting state and local taxes equivalent to the cost of educating more than three school children for an entire school year.
■ This estimate is based on Census Bureau research that shows current spending per pupil for public elementary-secondary school (pre-k to 12th grade) averaged $10,608 in 2012. This spending covers costs such as teacher salaries and benefits, supplies, and support activities such as guidance counseling and building operations and maintenance.
■ 1,958,450 pupils / 554,346 direct gaming industry jobs = 3.5 pupils per job

38
Gaming taxes in context
l $9.9 billion in gaming taxes represents:
■ More than 2% of state and local government property tax revenues collected nationwide
■ Nearly 8% of state and local government education tax revenues collected nationwide
■ Nearly 9% of state and local government hospital tax revenues collected nationwide

39
Appendix

40
Detailed Tables – Output Impacts ($ Millions)
DescriptionDirect Output
ImpactsIndirect Output
ImpactsInduced Output
Impacts
Total Output
Impacts
Casinos $81,156 $46,521 $61,929 $189,606Gaming Manufacturers $5,994 $4,670 $4,751 $15,416Subtotal, Industry $87,150 $51,191 $66,680 $205,021
Ancillary Spending $14,440 $8,886 $11,264 $34,589
Total Output Impacts $101,590 $60,076 $77,944 $239,610
Industry Impacts
Ancillary Spending Impacts

41
Detailed Tables – Employment Impacts
DescriptionDirect
Employment Impacts
Indirect Employment
Impacts
Induced Employment
Impacts
Total Employment
Impacts
Casinos 554,346 333,885 514,866 1,403,096Gaming Manufacturers 15,906 12,068 16,028 44,002Subtotal, Industry 570,252 345,952 530,894 1,447,098
Ancillary Spending 163,678 36,752 64,262 264,692
Total Employment Impacts 733,930 382,705 595,155 1,711,790
Industry Impacts
Ancillary Spending Impacts

42
Detailed Tables – Labor Income Impacts ($ Millions)
DescriptionDirect Labor
Income Impacts
Indirect Labor Income Impacts
Induced Labor Income Impacts
Total Labor Income Impacts
Casinos $25,521 $14,407 $17,932 $57,860Gaming Manufacturers $1,059 $817 $744 $2,620Subtotal, Industry $26,580 $15,224 $18,676 $60,481
Ancillary Spending $6,149 $2,835 $4,038 $13,022
Total Labor Income Impacts $32,729 $18,059 $22,714 $73,503
Industry Impacts
Ancillary Spending Impacts

Related Documents