ECONOMIC IMPACT OF SMALL BUSINESS DEVELOPMENT CENTER COUNSELING ACTIVITIES IN THE UNITED STATES: 2010-2011 (REVISED) James J. Chrisman, Ph.D. 197 Edinburgh Drive Starkville, MS 39759 tel. 662-615-4373 [email protected] University Address (Day) Department of Management and Information Systems College of Business Mississippi State University Mississippi State, MS 39762-9581 tel: 662-325-1991 fax: 662-325-8651 [email protected] This report was prepared by the author acting as an independent consultant. Neither the project nor the contents of this report were endorsed or sponsored by Mississippi State University. Prepared August 23, 2012; Revised August 27, 2012

Welcome message from author
This document is posted to help you gain knowledge. Please leave a comment to let me know what you think about it! Share it to your friends and learn new things together.
Transcript

ECONOMIC IMPACT OF SMALL BUSINESS DEVELOPMENT CENTER
COUNSELING ACTIVITIES IN THE UNITED STATES: 2010-2011
(REVISED)
James J. Chrisman, Ph.D.
197 Edinburgh Drive
Starkville, MS 39759
tel. 662-615-4373
University Address (Day)
Department of Management and Information Systems
College of Business
Mississippi State University
Mississippi State, MS 39762-9581
tel: 662-325-1991
fax: 662-325-8651
This report was prepared by the author acting as an independent consultant.
Neither the project nor the contents of this report were endorsed or sponsored
by Mississippi State University.
Prepared August 23, 2012; Revised August 27, 2012

1
THE ECONOMIC IMPACT OF SMALL BUSINESS DEVELOPMENT CENTER
COUNSELING ACTIVITIES IN THE UNITED STATES: 2010-2011 (REVISED)
EXECUTIVE SUMMARY
This report presents the results of the 16th national study of the
economic impact of Small Business Development Center (SBDC) counseling
activities in the United States. The report analyzes the changes in sales and
employment, jobs and sales revenue maintained, and financing obtained by a
sample of 7,849 established businesses and 3,094 pre-ventures that received
five or more hours of counseling assistance (long-term clients) in 2010.
Data from 60 of the 63 SBDCs in the United States were used in the study.
The 10,943 usable responses represented 17.5% of the clients that were sent
questionnaires (62,523). The clients surveyed represented the entire long-term
client population of the 60 Small Business Development Center programs in the
United States that participated in the study. Analysis indicated that response
bias did not appear to be a threat to the study.
The performance improvements of the responding sample in the year after
receiving assistance were compared to the weighted average changes in
performance of all businesses in the United States. The incremental
improvements in the sample's performance -- over and above what they would have
been had they performed like the average business -- were extrapolated across
the entire long-term client population of the SBDC. To avoid overestimation of
the impact of the SBDC program, only those clients who indicated that the
SBDC's services were beneficial were used to calculate performance
improvements. These performance improvements were then used to estimate the
tax revenues generated for state and federal governments as a result of SBDC
counseling. The tax revenues generated by the long-term clients were compared
to the total cost of providing the services offered by the SBDC. To gain
additional insights, the financing obtained by clients as a direct result of
SBDC assistance was analyzed.

2
The 60 participating SBDCs counseled 62,523 long-term clients in 2010:
38,022 (60.8%) were classified as established businesses and 24,501 (39.2%)
were classified as pre-ventures. Most respondents (90%) indicated that the
service received from the SBDC was beneficial. Of the pre-venture clients, it
was estimated that about 59.2% started new businesses in 2010 or 2011.
Results indicate that, after adjustments, the long-term clients of the
SBDC generated a total of approximately $6.8 billion in sales and 75,166 new
full time equivalent jobs as a result of the assistance received (see Table 1).
The average cost of generating each job was $3,153. Based on clients’
assessments, we estimate that an additional $7.3 billion in sales and 83,268
jobs were saved due to SBDC counseling.1
The incremental performance improvements resulted in $286.9 million in
additional tax revenues from established businesses and $251.7 million from
pre-venture clients who started new businesses. This amounted to a total of
approximately $538.6 million in tax revenues, of which $319.8 million went to
the state governments and $218.8 million went to federal government. When
compared to the cost of operating the 60 SBDCs that participated in the study
($237.0 million), these counseling activities generated approximately $2.27 in
tax revenues for every $1 spent on the entire program. It should also be noted
that the tax revenues generated exceeded the direct cost of the counseling
provided to long-term clients by a ratio of 5.51 to 1.00.2
1 Tax revenues from jobs and revenues saved are not included in the estimates of impact
reported in this study. However, we estimate that the tax revenues maintained as a
result of the jobs and sales saved by clients totaled $590.5 million. This amount was
2.49 times larger than the national budget for the participating SBDCs in 2010. Thus, if
we include jobs and revenues saved, the combined benefit to cost ratio would be 4.76 to
1.00. Furthermore, counting total jobs saved and created, the cost per job would be
$1,496. 2 If we consider only the 10,943 clients who responded to the study, the tax revenues
these clients generated ($538.6 million X .175 = $94.3 million) were 97% of the long-
term counseling budget. Furthermore, the combined impact of the jobs and revenues
created and saved by those clients ($575.7 + $538.6) X .175 = $197.6 million) was 83% of
the total budget of the 60 participating SBDCs, 44% greater than the total counseling
budget, and 2.02 times greater than the portion of the budget spent on long-term
counseling.

3
Approximately $3.3 billion in financing was obtained by clients as a
result of the counseling received ($1.43 billion in SBA loans, $1.37 billion in
debt financing from other sources, and $0.53 billion in equity financing).
These figures suggest that every dollar expended on the operation of the SBDC
program in the U.S. was leveraged by approximately $14.05 in new capital raised
from external sources.

4
TABLE 1
IMPACT OF SBDC COUNSELING ON THE UNITED STATES ECONOMY
Established Firms New Firms All Firms
(N = 38,022) (N = 24,501) (N = 62,523)
_________________ ______________ ________________
Aggregate sales impact $4,265,806,000 $2,487,033,000 $6,752,839,000
Aggregate employment impact 32,167 new jobs 42,999 new jobs 75,166 new jobs
Sales revenues maintained $7,331,858,000
Jobs saved 83,268 jobs saved
State tax revenues generated $193,265,180 $126,520,910 $319,786,090
Federal tax revenues generated $ 93,637,010 $125,170,830 $218,807,840
Total tax revenues generated $286,902,190 $251,691,740 $538,593,930
Cost of all SBDC operations (63 Centers) $241,115,354
Benefit to cost ratio 1.19 to 1.00 1.04 to 1.00 2.23 to 1.00
Cost of SBDC operations (60 participating Centers) $236,996,128
Benefit to cost ratio 1.21 to 1.00 1.06 to 1.00 2.27 to 1.00
Cost per job generated $3,153 per job
Cost of all counseling $136,983,760
Benefit to cost ratio 2.09 to 1.00 1.84 to 1.00 3.93 to 1.00
Cost of long-term counseling $ 70,546,640 $ 27,122,780 $ 97,669,420
Benefit to cost ratio 4.07 to 1.00 9.28 to 1.00 5.51 to 1.00
SBA financing $1,098,364,300 $ 329,806,500 $1,428,170,800
Other debt financing $1,052,905,200 $ 314,628,600 $1,367,533,800
Equity financing $ 391,923,200 $ 141,790,700 $ 533,713,900
Total financing obtained $2,543,192,700 $ 786,225,800 $3,329,418,500
Financing "Leverage" 10.73 to 1.00 3.32 to 1.00 14.05 to 1.00

5
INTRODUCTION
This report describes the results of a study designed to assess the
economic impact of the long-term counseling activities of the Small Business
Development Center (SBDC) Program in the United States in 2010. Long-term
clients are defined as those who received a minimum of five hours of
counseling assistance from the SBDC. The economic impact of counseling
activities was analyzed by comparing the increases in sales and employment
experienced by SBDC clients between 2010 and 2011 with the average changes in
performance for all businesses in the states and territories served by the
program during this time period. The growth in sales and employment in excess
of national averages was used to calculate the incremental federal and state
tax revenues generated the year after counseling assistance was provided. The
tax revenues generated by SBDC-counseled clients were then compared to the
cost of the service to determine if it was cost effective.
To supplement this analysis, clients were also asked to estimate the
number of jobs saved and sales revenues maintained as a result of the
counseling. In addition to this, clients were asked to indicate whether the
SBDC program had assisted them to obtain financing and if so, the amount of
debt and equity financing they were able to obtain as a direct result of the
counseling received from the SBDC.
Finally, a host of qualitative questions were asked concerning the
availability of comparable assistance from private consultants and the quality
of the counselors.
The remainder of this report describes the methodology and results of
the study.
OVERVIEW: THE 2010-2011 NATIONAL IMPACT STUDY
In 2010, the 60 SBDCs (of 63) in the United States that participated in
this study provided long-term counseling assistance to a population of 62,523
clients, of which 38,022 were owners of established small businesses and

6
24,501 were seeking to start new businesses (pre-ventures).3 The entire
population of long-term clients of the 60 participating centers was sent a
questionnaire in the spring and summer of 2011. In the questionnaire clients
were asked to evaluate the SBDC's services, provide their sales revenues and
employment levels for 2010 and 2011, estimate jobs and sales revenues
maintained, and indicate the amount of financing they were able to obtain that
could be credited to the SBDC program (See Appendix 1).4 A total of 7,849
established business clients (20.6% response rate) and 3,094 pre-venture
clients (12.2% response rate) returned questionnaires. This represented a
17.5% overall response rate for the clients sent questionnaires (10,943 of
62,523). However, since approximately 5,388 (8.6%) questionnaires were
undeliverable, the effective response rate was 19.2%. Furthermore, because of
missing data and the decision to analyze only clients who indicated that the
SBDCs' services were beneficial, the effective sample sizes for the impact
estimates were 6,694 established business clients and 2,606 pre-venture
clients.5
SAMPLE SIZE
The procedures described below were utilized to determine if the number
of responding clients obtained from our sampling plan were sufficient to
obtain a statistically reliable sample.
3 The SBDCs in the United States in 2010 include: Alabama, Alaska, American Samoa,
Arizona, Arkansas, California-UC Merced, Northeastern California, California-Los
Angeles, California-San Diego/Imperial Counties, Northern California (Norcal),
California-Santa Ana Tri-county (now Orange County/Inland Empire), Colorado,
Connecticut, Delaware, District of Columbia, Florida, Georgia, Guam, Hawaii, Idaho,
Illinois, Indiana, Iowa, Kansas, Kentucky, Louisiana, Maine, Maryland, Massachusetts,
Michigan, Minnesota, Mississippi, Missouri, Montana, Nebraska, Nevada, New Hampshire,
New Jersey, New Mexico, New York, North Carolina, North Dakota, Ohio, Oklahoma,
Oregon, Pennsylvania, Puerto Rico, Rhode Island, South Carolina, South Dakota,
Tennessee, North Texas (Dallas), Texas-Houston, Northwest Texas (Lubbock), South Texas
Border (San Antonio), Utah, Vermont, Virgin Islands, Virginia, Washington, West
Virginia, Wisconsin, and Wyoming. The American Samoa, Connecticut, and district of
Columbia SBDCs did not participate in the study. 4 The questionnaire also included some questions intended for other research projects. Those questions are not analyzed in this study nor are they included in Appendix 1. 5 These figures represent the number of clients who indicated the service received was
beneficial. The effective sample sizes for the analyses conducted varied.

7
Confidence Interval of the Means. In order to determine if the number
of respondents was actually sufficient to obtain a reliable and valid
estimation of the average changes in sales revenue and employment of SBDC
clients, the following formula was used.
Z = (nE2/s2)1/2 (1)
where: n = effective sample sizes (6,694 established, 2,606 pre-ventures).
s = standard deviation of the sample (standardized value = 1).
Z = confidence interval for the mean.
E = amount of error in the mean to be tolerated (5% of s).
With sample sizes of 6,694 and 2,606 and a tolerated error of .05
standard deviation, it was determined that the confidence interval of the
sales and employment means for both the pre-venture and established business
respondents were reliable at the 99% level. In other words, we were 99%
confident that our sample means were no more than one-twentieth of one
standard deviation from the population means for the 60 centers that
participated in this study.
SAMPLE VALIDATION
Although we surveyed the entire population of long-term clients, when a
mail survey is conducted there is no way to ensure that 100% of those surveyed
will respond to the questionnaire. Therefore, it is necessary to conduct
statistical tests to ensure that respondents are representative of the
population, there is a minimum likelihood of response bias, and the data are
reliable. The following procedures were used.
Representativeness. Each center was asked to provide demographic
information (gender and ethnic background of client, industry in which
business competes) for all clients surveyed and for all respondents (See
Appendix 2).6 Comparisons and Chi-square goodness-of-fit tests using
6 The comparative statistical analysis of the population and respondents were
conducted with data from 59 state centers. The remaining state SBDCs did not provide
complete or usable demographic data for this analysis.

8
standardized data indicated that both the established business and pre-venture
respondents were proportionally representative of the population in terms of
the gender of the primary owner. Non-whites were under-represented among pre-
venture respondents (27.5% of the population but only 21.8% of the responses)
and manufacturing firms were over-represented among established business
respondents (12.6% of the population as opposed to 20.6% of the responses).
Response Bias. The questionnaire was sent to clients in several waves
in the spring and summer of 2012. Respondents were divided into groups of
early and late responders according to when they responded to the
questionnaire and compared in terms of their reported sales revenue,
employment, financing obtained, and evaluation of the SBDC's services. This
procedure made it possible to investigate the issue of response bias. Taken
together, t-tests and Analysis of Variance (ANOVA) indicated that early
responding established business clients evaluated the SBDC’s services more
favorably than late responding clients. Furthermore, early responding pre-
venture clients reported higher first-year sales than clients who responded
later. The evidence generally suggests a lack of an upward bias in the data
used to estimate the performance of the client population. However, given that
later responders could be expected to be more similar to non-respondents than
earlier responders, the findings should still be viewed with caution.
Reliability. The reliability of the questionnaire was assessed by a
point biserial correlation analysis comparing clients' perceptions of whether
the SBDC's services were beneficial and their (1) evaluations of the knowledge
and expertise of the counselors, (2) working relationships with the
counselors, and (3) willingness to recommend the SBDC to others. The results
of the respective comparisons were statistically significant at better than
the 1% level for both established business clients (r = .58; r = .58; r = .69)
and pre-venture clients (r = .60; r = .60; r = .71). Thus, clients' responses
to the questionnaire appeared to be reliable.

9
DATA ANALYSIS METHODS
The methods for estimating the economic impact of SBDC counseling
services are described below.
EXISTING BUSINESSES
For existing businesses that received at least five hours of assistance,
sales and employment changes between the year in which counseling was received
(2010) and the year after counseling was received (2011) were calculated. Two
part-time employees were considered equivalent to one full-time employee.7
Rates of sales and employment growth for the existing clients were
compared with the weighted average growth rates in the home states or
territories of the centers on each measure. Statewide averages were weighted
according to the number of clients served by each center as a proportion of
the total number of clients served by the SBDC system. This procedure guards
against potential biases that might exist if the number of clients counseled
across the states and territories varied in proportion to their populations.
The difference between the growth rate of clients and weighted average
growth rates for all businesses was used to estimate the incremental or
marginal changes in sales and employment growth of the sample.8 Only clients
who indicated that the SBDC's services were beneficial were used to calculate
incremental growth rates.9 The incremental growth rates were multiplied by
the average sales and employment of the respondents for the year before
counseling was received.
7 All employment data reported in this study refers to full-time equivalent jobs. 8 GSP growth among private industries between 2010 and 2011 was used as a surrogate for average state sales growth rates. We used data obtained from the Bureau of Economic
Analysis to estimate state sales growth rates. Average state employment growth rates
were obtained from the Bureau of Labor Statistics. The average growth rates were
computed using a weighting scheme that took into account the long-term client
population of the SBDCs. 9 Although reasons for client dissatisfaction may be unrelated to the quality of the
advice (e.g., it was not what the client wanted to hear), it did not seem appropriate
to count the performance improvements of clients who did not feel they received value
from the SBDC.

10
Weighted averages of each tax figure (sales taxes, state and federal
income taxes) were calculated based on the proportion of clients served by
each state or territory compared to the total number of clients served by the
centers to guard against potential bias that might exist if counseling
intensity differed by state or territory.10 The weighted average sales tax
rate was reduced by 25% to reflect the fact that not all businesses pay sales
taxes even though some of their sales may eventually "pass through" to the
final consumer. This adjustment may still overestimate taxes paid on sales.
However, this approach is more realistic and conservative in its assessment of
sales tax contributions than no adjustment, and still captures the added value
of those businesses whose sales are not directly taxed. Furthermore, any
overestimate must be weighed against the fact that other tax sources are not
measured in this study (e.g., payroll taxes, corporate income taxes, social
security payments).
Federal income tax data for 2010, the most recent year available, were
obtained from the Internal Revenue Service's Statistics of Income Bulletin
(Spring 2012). The estimated median (based on an analysis of tax brackets),
rather than the average, was used to be conservative and to better reflect the
types of employment opportunities offered by our respondents. The median
state income tax paid per return for each state was estimated by dividing the
median federal income taxed paid per return by the average federal income tax
paid per return within the state and multiplying that proportion by the
average state income tax paid per return. A weighted national average was
then computed based on the populations of clients served by each SBDC.11
10 Sales tax data were available for all 60 of the participating SBDCs. A total of 59
SBDCs supplied state income tax data. The average tax rates were computed using a
weighting scheme that took into account the long-term client population of the SBDCs.
Federal tax data were also available for all participating centers. 11 Each responding SBDC provided state or territory income tax data for the most recent
year available. In most cases this was 2010 or 2011; however, some states were only
able to obtain data for 2008 or 2009. Since experience shows that these numbers do not
vary much from year to year it is unlikely that this influenced the results.

11
Adjusted weighted sales tax rates and personal income taxes (state or
territory and federal) were multiplied by the average incremental improvements
in sales and employment respectively to arrive at the value added figures.
All these numbers were then multiplied by the total number of existing
business clients after adjusting for the proportion of the respondents who
indicated the SBDC's services were beneficial.12 The formula for the
calculations can be expressed as follows:
Average X Tax X Proportion of Clients X Total Number = Total Tax (2)
Growth Rate Satisfied w/Service of Clients Revenues
DATA ANALYSIS METHODS: PRE-VENTURE CLIENTS
Similar procedures were used for pre-venture clients who received at
least five hours of assistance, with the following exceptions. First, as pre-
ventures had no previous sales or employees from which to calculate growth,
the raw averages were used to assess economic impact. Second, this average
was adjusted to account for the total number of pre-venture clients who failed
or did not start a business between 2010 and 2011 (about 45.4% of the sample
did not start a business). This adjustment was made as follows:
Average Performance = AS X (NS/NP) (3)
where: AS = average performance (sales, employment) of successful pre-
ventures
NS = number of successful pre-ventures
NP = number of pre-ventures (successful + unsuccessful)
Once this adjustment was made, the average performance of the pre-
venture respondents was multiplied by the corresponding tax rates, the
proportion of pre-ventures who judged the SBDC's services to be beneficial,
and the total estimated number of pre-venture clients. This formula is shown
below.
Average X Tax X Proportion of Clients X Total = Total Tax (4)
Performance Rate Satisfied w/Service Clients Revenues
12
Aggregate figures for sales generated and jobs created were calculated using a similar formula: average performance X proportion of satisfied clients X total number
of clients (tax rate not included).

12
BENEFIT OF SBDC SERVICES TO COST
The tax revenue generated by the SBDC was divided by the total cost of
operating the participating centers to arrive at a benefit to cost ratio. We
also compared the tax impact with the entire SBDC budget for the full
complement of 63 centers. The total operating budget of the SBDC, per data
supplied by the Small Business Administration for fiscal year 2010, was used
for this calculation. This was a conservative approach since only part of the
budgets of the centers was used for counseling, and some of that amount was
spent on short-term rather than long-term clients.13 Thus, the calculations
compare the impact of assistance to long-term clients, which consumed a total
of 42% of the United States SBDC program’s budget, with the amount spent on
the entire SBDC operation.
To provide additional insights we also made cost-benefit comparisons
with the cost of the counseling for the participating centers, as well as the
portion of their counseling budget spent on assisting long-term established
and pre-venture clients.
OTHER ANALYSES
Evaluation of Quality of Counseling Services. Clients were asked
whether the services provided by the SBDC were beneficial. This question was
used to determine whether clients' performance improvements might have been
affected by SBDC counseling. As noted above, the performance improvements of
responding clients were adjusted to account for the proportion that believed
the SBDC's services were beneficial when extrapolating the results to the full
population of clients.
Clients were also asked to assess the knowledge and expertise of
counselors assigned to their cases as well as their working relationship with
the counselors. Clients evaluated their counselors’ knowledge/expertise and
13
Estimates of counseling budgets were made from data supplied by 59 centers and then applied to the entire budget for all 60 participating centers.

13
working relationship on a five-point scale: (1) poor, (2) below average, (3)
average, (4) above average, and (5) excellent. These questions provide
further evidence of the quality of the counseling services. In the main,
however, these questions were used to assess the reliability of the question
concerning whether the SBDC's services were beneficial.
Comparison with Private Consultants. Clients were asked if they could
have obtained assistance of the same quality from a private consultant at a
price they could afford. A primary rationale of government-funded programs is
that there is a paucity of private sector assistance available to resource
poor entrepreneurs. A major criticism of public programs is, on the other
hand, that they may squeeze out private sector initiatives by providing
unfair, subsidized competition. By analyzing the availability of alternative
sources of assistance, this question made it possible to test whether the
rationale for the SBDC program is valid, as well as whether criticisms about
unfair competition are warranted.
Revenue and Job Retention. Established business clients were asked to
estimate the number of full- and part-time jobs that were saved as a result of
the assistance received from the SBDC. We also asked clients to estimate the
amount of previous sales revenue maintained as a result of SBDC assistance.
The average responses were then directly extrapolated to the population of
established business clients.
Financing. Established business and pre-venture clients were asked to
estimate the amounts of SBA guaranteed loans, other loans, and equity
financing obtained directly as a consequence of SBDC counseling activities.
To remain conservative, only those clients who indicated that the SBDC
assisted them to obtain financing were used for this analysis. Extrapolation
to the entire client population was made after adjusting for the proportion of
clients who indicated the SBDC assisted them in raising capital.

14
RESULTS
The results of the analysis of the counseling services provided by the
SBDC to established business and pre-venture clients are presented below.
ESTABLISHED BUSINESSES
Perceptions of the Quality of Counseling. Of the 7,438 clients who
provided usable responses to the service evaluation question, 90% indicated
that the SBDC's services were beneficial. Furthermore, clients gave a rating
of 4.45 out of a possible 5.00 on the knowledge and expertise of their
counselors and a rating of 4.45 on their working relationship with the
counselors (See Table 2). Finally, 94% of the 7,434 responding established
business clients indicated that they would recommend the SBDC's services to
other business owners.
Comparison with Private Consultants. Results indicated that 72% of the
responding clients (n = 7,508) believed that it would not have been possible
for them to obtain private consulting services of a similar quality at a price
they could afford.
Economic Impact Estimates. Table 3 compares the 2010 and 2011 sales and
employment levels of established small business clients. As this Table shows,
these clients reported an average increase in sales of $161,163 (from $853,831
in 2010 to $1,014,994 in 2011). There was also an increase in the number of
individuals employed by clients in 2011 (8.59) compared to 2010 (7.56).
Table 4 compares the growth in sales and employment between 2010 and
2011 of SBDC clients with the growth experienced by the average business in
the United States. As shown, the sales of established business clients
increased by 18.9% compared to an increase of 4.3% for the average business in
the U.S. In addition, employment levels of established clients increased by
13.6% compared to a 1.2% increase for U.S. businesses in general.14
14
Again, the national figures were calculated by state averages weighted by the number of long-term clients served per SBDC.

15
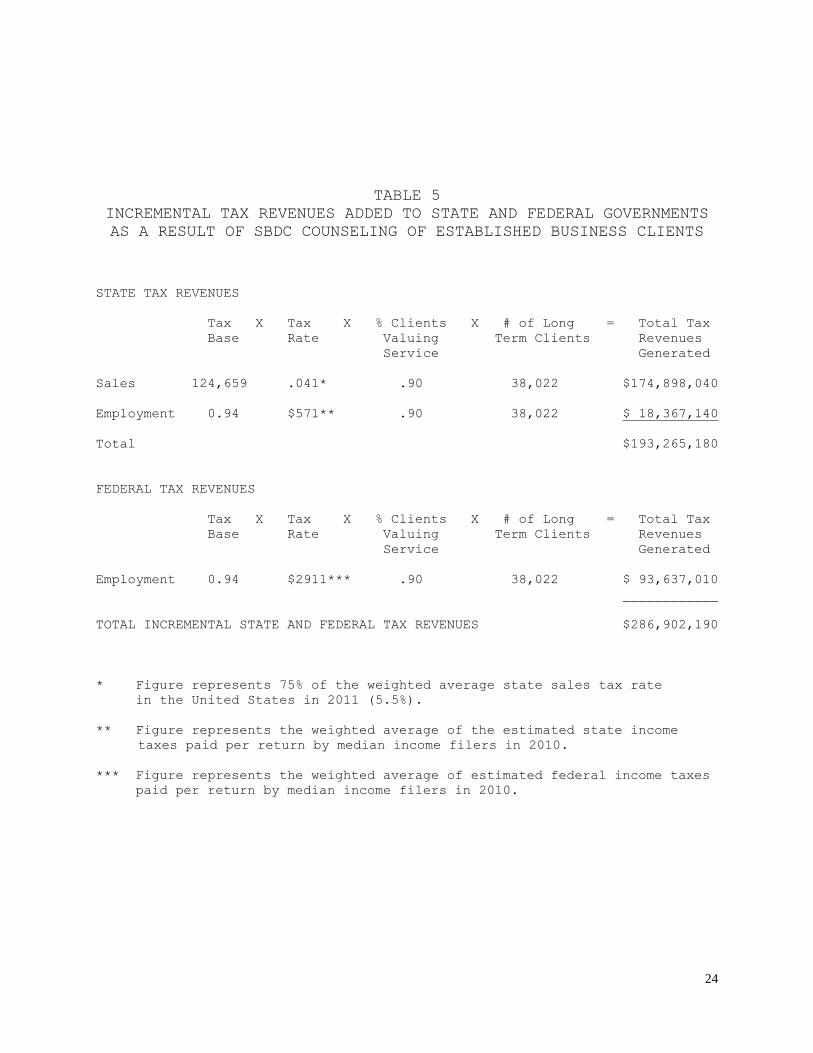
The overall impact estimate for established business clients suggests
that the SBDCs’ services led to a total of approximately $286.9 million in new
tax contributions: approximately $193.3 million went to state governments and
$93.6 million went to the federal government (Table 5). As shown in Table 6,
these additional tax revenues were 19% greater than the operating budget of
the entire SBDC program and 21% greater than the operating budget of the
centers that participated in the study. Furthermore, established clients
generated tax revenues that were 2.09 times greater than the total counseling
budget of the participating SBDCs; these revenues also represented a return of
$4.07 for every dollar those SBDCs spent on established business clients who
received long-term assistance.
Revenue and Job Retention. To supplement the impact estimates we also
asked established clients if the SBDC helped them save jobs and retain
existing revenues. On average, clients estimated that the SBDC program was
responsible for saving $192,832 in revenues and 2.19 full-time equivalent
jobs. In total, this amounted to $7.3 billion in revenues retained and 83,268
jobs saved.15
Financing Obtained. According to the respondents, 20% of established
business clients (1,471 of 7,354) were assisted in preparing to seek
financing. Those clients obtained an average of $334,437 in capital, of which
$144,438 came from SBA loans, $138,460 came from other forms of debt
financing, and $51,539 came from equity financing. Extrapolations indicate
that clients raised $1.10 billion in SBA loans, $1.05 billion in other debt
financing, and $391.92 million in equity financing (approximately $2.5 billion
in total) with the help of the SBDC. This suggests that the total expenditure
of tax dollars on the SBDC was leveraged by public and private financing at a
ratio of 10.73 to 1.00 for long-term established business clients alone.
15 It should be noted again that revenues retained and jobs saved were not figured into the benefit to cost estimates.

16
Our estimates also suggest that of the 38,022 established business
clients served, 3,184 received SBA guaranteed loans as a consequence of SBDC
assistance. Furthermore, 3,423 obtained other loans and 1,313 obtained equity
financing.
PRE-VENTURE CLIENTS
Perceptions of the Quality of Counseling. Of the 2,895 pre-venture
clients who provided an evaluation of the SBDC's services, 90% felt the
counseling was beneficial. In addition, clients gave a rating of 4.42 out of
a possible 5.00 on their counselors' knowledge and expertise and a rating of
4.41 on their working relationship with the counselors (See Table 7).
Finally, of the 2,883 clients who answered the question on whether they would
recommend the SBDC's services to other entrepreneurs, 93% responded in the
affirmative.
Comparison with Private Consultants. A total of 73% of the responding
clients (n = 1,690) believed that it would not have been possible for them to
obtain private consulting services of a similar quality at a price they could
afford.
Economic Impact Estimates. After adjusting for unsuccessful clients, we
calculated that an average of $112,786 in sales and 1.95 new jobs were created
per pre-venture client.16 As Table 8 indicates, these new employees generated
tax payments of approximately $251.7 million to the state and federal
governments ($126.5 million to the state and $125.2 million to the federal).
When compared to the cost of operating all of the SBDCs in the United
States, the tax revenues generated by pre-venture clients returned $1.04 for
every dollar expended. Compared to the operating budget of the SBDCs that
participated in the study, the benefit to cost ratio was 1.06 to 1.00.
Furthermore, the tax revenues generated exceeded the cost of all counseling
16 Since only 59.2% of all responding clients started businesses within one year, the
estimate of sales and employment for start-ups is $195,517 and 3.29, respectively.

17
activities by a ratio of 1.84 to 1.00. Finally, the tax revenues from pre-
venture clients were 9.28 times the amount spent on long-term pre-venture
counseling (See Table 9).
Financing Obtained. According to the responses, 17% of all pre-venture
clients (482 of 2,838) received assistance from the SBDC in preparing to
obtain financing. The average raised was $79,182 in SBA loans, $75,538 in
other sources of debt financing, and $34,042 in equity financing for a total
of $188,762. Extrapolating to the population suggests that a total of $329.81
million in financing from SBA loans, $314.63 million from other sources of
debt, and $141.79 million in financing from equity investors were raised. The
grand total of approximately $786.2 million suggests that each tax dollar
expended on the SBDC was leveraged by $3.32 in public and private financing
for new ventures.
Finally, our estimates suggest that of the 24,501 pre-venture clients
served, 1,776 received SBA guaranteed loans as a consequence of SBDC
assistance. Furthermore, 1,648 obtained other loans and 879 obtained equity
financing.
SUMMARY AND CONCLUSIONS
Results suggest that the SBDC Program makes an important contribution to
the economic development of the United States. Our analysis indicated that
the SBDCs’ long-term clients added $6.8 billion in incremental sales and
75,166 new jobs to the nation. The latter number suggests that the cost of
generating a new job through investment in the SBDC was $3,153 per job. In
addition, our estimates suggest that 83,268 jobs were saved and $7.3 billion
in sales revenues were maintained as a result of the counseling. Finally,
59.2% of all pre-venture clients started businesses within one year of
receiving counseling.
Estimates suggest that the one-year tax benefits accruing as a
consequence of the performance improvements of SBDC-counseled long-term

18
clients returned $2.27 for every dollar spent on the 60 (of 63) SBDCs that
participated in the study.17 Furthermore, our estimates indicate that $5.51
was returned for each dollar expended on counseling long-term clients.
Finally, our estimates indicate that approximately $3.3 billion in
capital was raised by clients as a direct result of the assistance received
from the SBDC. This suggests that each dollar expended on the SBDC Program
was later leveraged by approximately $14.05 in debt and equity capital.
The numbers presented in this report are only estimates based on
responses to a questionnaire. It is possible that the respondents were not
representative of the population of clients, factors such as social
desirability bias may have inflated the estimates, or that “self-selected”
SBDC clients tend to exceed the sales and employment growth rates of “average”
businesses in the United States for reasons unrelated to the counseling
provided. It is also possible that some of the gains of the clients were not
net gains to the economy.
Impact methodologies are always susceptible to potential problems of
obtaining adequate control groups, the possibilities of response bias or self-
selection bias, and displacement effects. Nevertheless, the tests conducted
for bias and reliability, as well as the use of weighted statewide comparison
groups, suggests that the results are accurate enough to conclude that the
SBDC program in the United States makes a positive contribution to the
economy. Furthermore, although the numbers presented in this report are only
estimates, their magnitude suggests that even if we greatly overestimated the
economic impact of the SBDC our overall conclusions would remain the same.
Again, as noted in the Executive Summary, if we consider only the 10,943 clients
17 As noted in the Executive Summary, we estimate that the tax revenues maintained as a
consequence of the jobs and sales saved by clients due to SBDC counseling amounted to
$590.5 million. This amount was 2.49 times larger than the budget for the 60
participating SBDCs. Furthermore, counting total jobs saved and created, the cost per
job was $1,496.

19
who participated in the study, the tax revenues these clients generated ($538.6
million X .175 = $94.3 million) were 97% of the counseling budget for all of the
62,523 long-term clients served. Furthermore, the combined impact of the jobs and
revenues created and saved by those clients ($1.13 billion X .175 = $197.6 million)
was 83% of the total budget of the 60 participating SBDCs, 44% greater than the total
counseling budget, and 2.02 times greater than the portion of the budget spent on
long-term counseling.
In addition, the estimates reported herein do not consider (1) the other
programs the SBDC offers (e.g., workshops, seminars), (2) the value added to
the operations of short-term clients, (3) the continuing tax revenues
generated by long-term clients after the year of analysis, (4) the many
failures SBDC assistance helps stave off and the individuals with unviable
business ideas it discourages, (5) the other tax revenue sources such as
corporate taxes, property taxes, unemployment taxes, social security payments,
or (6) any multiplier effects of a healthier small business sector. Taking
all these factors into account, we believe that the results presented in this
study tend to be conservative.
From a public policy standpoint, the implication of this research is
that the SBDC makes an important contribution to the economy of the United
States. By assisting established small businesses, SBDCs across the United
States help create new job opportunities in growing firms and contribute to
the retention of jobs in small companies trying to turn around or reorient
their businesses. The SBDC work with pre-venture clients helps individuals
identify and initiate viable new business ventures that invigorate the
economy.
In conclusion, the evidence presented in this report indicates that
SBDC-assisted clients (1) generate sales and employment opportunities that
return more tax revenues to state and federal governments than the cost of
operating the Program, (2) believe that the SBDC contributed substantially to

20
the performance improvements of their businesses, (3) are able to save jobs
and sales revenues that might have otherwise been lost, and (4) are better
able to raise capital to support the start-up and growth of their businesses.
It is believed that this provides justification for the continuation and
proliferation of the SBDC Program.

21
TABLE 2
QUALITATIVE EVALUATIONS OF THE COUNSELING PROVIDED TO
ESTABLISHED BUSINESS CLIENTS BY THE SBDC PROGRAM
Knowledge and Expertise of Counselors
Number Percentage
5. Excellent 4,737 63.6%
4. Above Average 1,766 23.7%
3. Average 673 9.0%
2. Below Average 115 1.5%
1. Poor 153 2.1%
______ __________
Totals 7,444 100.0%
Average = 4.45
______________________________________________________________________________
Clients' Working Relationship with Counselors
Number Percentage
5. Excellent 4,947 66.5%
4. Above Average 1,428 19.2%
3. Average 729 9.8%
2. Below Average 155 2.1%
1. Poor 179 2.4%
______ __________
Totals 7,438 100.0%
Average = 4.45

22
TABLE 3
2010-2011 AVERAGE SALES AND EMPLOYMENT OF ESTABLISHED CLIENTS
WHO INDICATED THAT SBDC ASSISTANCE WAS VALUABLE
2010 2011 Average Change
__________ __________ ______________
Sales * $853,831 $1,014,994 + $161,163
18.9%
Employment ** 7.56 jobs 8.59 jobs + 1.03 jobs
13.6%
* Based on analysis of the 5,594 clients that provided usable sales data
for both 2010 and 2011 and indicated SBDC services were beneficial.
** Based on analysis of the 6,216 clients that provided usable employment
data for both 2010 and 2011 and indicated SBDC services were beneficial.

23
TABLE 4
CHANGES IN SALES AND EMPLOYMENT BETWEEN 2010-2011:
SBDC ESTABLISHED BUSINESS CLIENTS VERSUS AVERAGE U.S. BUSINESS
Average % change Average incremental
in small business Average % change change in small
sample all U.S. firms business sample
_________________ _________________
percent aggregate
_______ ___________
Sales +18.9% + 4.3% +14.6% + $124,659
Employment +13.6% + 1.2% +12.4% + 0.94 jobs
24
TABLE 5
INCREMENTAL TAX REVENUES ADDED TO STATE AND FEDERAL GOVERNMENTS
AS A RESULT OF SBDC COUNSELING OF ESTABLISHED BUSINESS CLIENTS
STATE TAX REVENUES
Tax X Tax X % Clients X # of Long = Total Tax
Base Rate Valuing Term Clients Revenues
Service Generated
Sales 124,659 .041* .90 38,022 $174,898,040
Employment 0.94 $571** .90 38,022 $ 18,367,140
Total $193,265,180
FEDERAL TAX REVENUES
Tax X Tax X % Clients X # of Long = Total Tax
Base Rate Valuing Term Clients Revenues
Service Generated
Employment 0.94 $2911*** .90 38,022 $ 93,637,010
____________
TOTAL INCREMENTAL STATE AND FEDERAL TAX REVENUES $286,902,190
* Figure represents 75% of the weighted average state sales tax rate
in the United States in 2011 (5.5%).
** Figure represents the weighted average of the estimated state income
taxes paid per return by median income filers in 2010.
*** Figure represents the weighted average of estimated federal income taxes
paid per return by median income filers in 2010.

25
TABLE 6
THE COSTS AND BENEFITS OF SBDC COUNSELING IN THE UNITED STATES:
ESTABLISHED BUSINESSES
Total incremental State and Federal tax revenues $286,902,190
added by long-term established business clients
Cost of operating all SBDC programs $241,115,354
Benefit to cost ratio 1.19 to 1.00
Cost of operating participating SBDCs $236,996,128
Benefit to cost ratio 1.21 to 1.00
Cost of all counseling* $136,983,760
Benefit to cost ratio 2.09 to 1.00
Cost of counseling long-term established $ 70,546,640
business clients**
Benefit to cost ratio 4.07 to 1.00
* The weighted average cost of counseling was estimated to be 57.8% of
the SBDCs' total operating budgets in 2010.
** Long-term counseling provided to established businesses was approximately
51.5% of the SBDCs' total counseling budgets in 2010.

26
TABLE 7
QUALITATIVE EVALUATIONS OF THE COUNSELING PROVIDED TO
PRE-VENTURE CLIENTS BY THE SBDC PROGRAM
Knowledge and Expertise of Counselors
Number Percentage
5. Excellent 1,837 63.3%
4. Above Average 650 22.4%
3. Average 286 9.9%
2. Below Average 54 1.9%
1. Poor 75 2.6%
______ __________
Totals 2902 100.0%
Average = 4.42
______________________________________________________________________________
Clients' Working Relationship with Counselors
Number Percentage
5. Excellent 1,896 65.5%
4. Above Average 526 18.2%
3. Average 330 11.4%
2. Below Average 59 2.0%
1. Poor 85 2.9%
______ __________
Totals 2896 100.0%
Average = 4.41

27
TABLE 8
INCREMENTAL TAX REVENUES ADDED TO STATE AND FEDERAL GOVERNMENTS
AS A RESULT OF SBDC COUNSELING OF PRE-VENTURE CLIENTS
STATE TAX REVENUES
Tax X Tax X % Clients X # of Long = Total Tax
Base Rate Valuing Term Clients Revenues
Service Generated
Sales 112,786* .041† .90 24,501 $101,968,040
Employment 1.95 ** $571†† .90 24,501 $ 24,552,570
Total $126,520,910
FEDERAL TAX REVENUES
Tax X Tax X % Clients X # of Long = Total Tax
Base Rate Valuing Term Clients Revenues
Service Generated
Employment 1.95 $2911††† .90 24,501 $125,170,830
TOTAL INCREMENTAL STATE AND FEDERAL TAX REVENUES $251,691,740
* Based on analysis of the 2,221 clients that provided usable sales data
for 2011 and indicated SBDC services were beneficial.
** Based on analysis of the 2,385 clients that provided usable employment
2010 and indicated SBDC services were beneficial.
† Figure represents 75% of the weighted average state sales tax rate
in the United States in 2011 (5.5%).
†† Figure represents the weighted average of the estimated state income tax
paid per return by median income filers in 2010.
††† Figure represents the weighted average of estimated federal income taxes
paid per return by median income filers in 2010.

28
TABLE 9
THE COSTS AND BENEFITS OF SBDC COUNSELING IN THE UNITED STATES:
PRE-VENTURES
Total incremental State and Federal tax revenues $251,691,740
Added by long-term pre-venture clients
Cost of operating all SBDC programs $241,115,354
Benefit to cost ratio 1.04 to 1.00
Cost of operating participating SBDCs $236,996,128
Benefit to cost ratio 1.06 to 1.00
Cost of all counseling* $136,983,760
Benefit to cost ratio 1.84 to 1.00
Cost of counseling to long-term pre-venture $ 27,122,780
clients**
Benefit to cost ratio 9.28 to 1.00
* The weighted average cost of counseling was estimated to be 57.8% of
the SBDCs' total operating budgets in 2010.
** Long-term counseling provided to pre-ventures was approximately 19.8%
of the SBDCs' total counseling budgets in 2010.

29
APPENDIX 1
SMALL BUSINESS DEVELOPMENT CENTER IMPACT STUDY QUESTIONNAIRE
ALL INFORMATION WILL BE KEPT CONFIDENTIAL
1. Please indicate the year your business was either started or acquired (if never please indicate).
Year Started ______ or Year Acquired ______
Never Started
2. What was the major activity of your business or proposed business in 2010? Please check one.
Retailing
Services (personal OR professional)
Wholesale (distributor, etc.)
Manufacturing
Construction (all general, and other contractors)
Other (please specify) ___________________
3. Counting yourself, how many full-time employees (35 hours or more per
week) and part-time employees (less than 35 hours per week) did you have
at the end of each of the following years that you were in business? If
you were not in business just write N/A in the appropriate blank(s).
2010 ______________ full-time employees
2011 ______________ full-time employees
2010 ______________ part-time employees
2011 ______________ part-time employees
4. Please estimate the number of jobs saved as a result of the assistance
received from the SBDC.
Existing Full-time jobs saved ______________
Existing Part-time jobs saved ______________
5. What were your gross sales revenues (i.e. before expenses) for the
following (calendar years)? If you were not in business during either
years write N/A (not applicable) in the appropriate blank(s).
2010 $________________
2011 $________________
6. Please estimate the amount of sales revenues maintained as a result of the
SBDC’s assistance.
Existing revenues maintained $_____________
7. Did the SBDC assist you in obtaining financing?
Yes No

30
8. Please estimate the total amount of debt and equity financing your
business raised in 2010-2011.
SBA Loans $____________
Other Loans $____________
Equity Raised from Investors $____________
9. Was the overall service you received from the Small Business Development Center beneficial?
Yes No
10. How would you rate the knowledge and expertise of your SBDC counselor?
Excellent Below Average
Above Average Poor
Average
11. How would you describe your overall working relationship with the SBDC
counselor who provided counseling to you?
Excellent Below Average
Above Average Poor
Average
12. Would you recommend that other businesspersons contact the Small Business
Development Center?
Yes No
13. Was comparable assistance available from a private consultant at a price
you could afford?
Yes No

31
APPENDIX 2
DEMOGRAPHIC DATA COLLECTED FROM CLIENTS
DEMOGRAPHIC DATA FORM #1
THE FOLLOWING INFORMATION SHOULD BE PROVIDED FOR ALL CLIENTS WHO RECEIVED
FIVE HOURS OR MORE OF COUNSELING ASSISTANCE FROM YOUR STATE SBDC IN 2010
REGARDLESS OF WHETHER THEY RESPONDED TO THE SURVEY OR NOT.
1. Total number of clients served (5 hours or more) in 2010.
Pre-venture __________
Existing businesses __________
2. Type of Business (number)
PRE-VENTURES EXISTING
Retail ____________ ___________
Service ____________ ___________
Wholesale ____________ ___________
Manufacturing ____________ ___________
Construction ____________ ___________
Other ____________ ___________
3. Gender of clients (number)
PRE-VENTURE EXISTING
Male ___________ ___________
Female ___________ ___________
Male/Female ___________ ___________
4. Ethnic background (number)
PRE-VENTURE EXISTING
White ___________ ___________
Other ___________ ___________
CENTER: ____________________________________________________
CONTACT PERSON: ____________________________________________________
PHONE, FAX, EMAIL: ____________________________________________________

32
DEMOGRAPHIC DATA FORM #2
INFORMATION ON POINTS 1-4 SHOULD BE PROVIDED ONLY FOR CLIENTS SERVED IN 2010
(FIVE HOURS OR MORE OF COUNSELING ASSISTANCE) WHO RESPONDED TO THE SBDC
IMPACT STUDY SURVEY. PLEASE ALSO INDICATE THE NUMBER OF UNDELIVERABLE
QUESTIONNAIRES AT THE BOTTOM (POINT 5).
1. Total number of responding clients (5 hours or more) in 2010
Pre-venture __________
Established businesses __________
2. Type of Business (number)
PRE-VENTURES EXISTING
Retail ____________ ___________
Service ____________ ___________
Wholesale ____________ ___________
Manufacturing ____________ ___________
Construction ____________ ___________
Other ____________ ___________
3. Gender of clients (number)
PRE-VENTURE EXISTING
Male ___________ ___________
Female ___________ ___________
Male/Female ___________ ___________
4. Ethnic background (number)
PRE-VENTURE EXISTING
White ___________ ___________
Other ___________ ___________
5. UNDELIVERABLE QUESTIONNAIRES ___________
CENTER: ____________________________________________________
CONTACT PERSON: ____________________________________________________
PHONE, FAX, EMAIL: ____________________________________________________

33
DEMOGRAPHIC DATA FORM #3
THE FOLLOWING INFORMATION SHOULD BE PROVIDED AS IT PERTAINS TO YOUR SBDC.
1. Counseling hours*
a. Total number of counseling hours provided to all clients
(regardless of hours) in 2010 ____ hours
b. Total number of counseling hours LONG-TERM PRE-VENTURES ____ hours
provided to clients in 2010 who
received five (5) or more hours LONG-TERM EXISTING CLIENTS ____ hours
of assistance
2. Proportion of total budget allocated to counseling ___________%
[counseling hours (from 1a above) + travel hours/
total hours worked by all counselors] in 2010
3. State sales tax rate in 2011 ___________%
4. Average state personal income tax
paid per return in 2011** $___________
____________________
* Counseling Hours: For the purpose of the national impact studies conducted
under the auspices of the ASBDC, counseling hours shall include all time
spent by counselors in the following activities: (1) direct one-on-one
contact with clients in person or by telephone, (2) preparation for client
meetings, (3) research activities on behalf of clients, (4) correspondence
with clients by mail, fax, or email.
** If data for this time period in not available please provide data for the
most recent year and indicate that time period.
CENTER: ____________________________________________________
CONTACT PERSON: ____________________________________________________
PHONE, FAX, EMAIL: ____________________________________________________
Related Documents