Economic History of the US Revolution to Civil War, 1776-1860 Lecture #4 Peter Allen Econ 120

Welcome message from author
This document is posted to help you gain knowledge. Please leave a comment to let me know what you think about it! Share it to your friends and learn new things together.
Transcript

Economic History of the US
Revolution to Civil War, 1776-1860Lecture #4
Peter AllenEcon 120

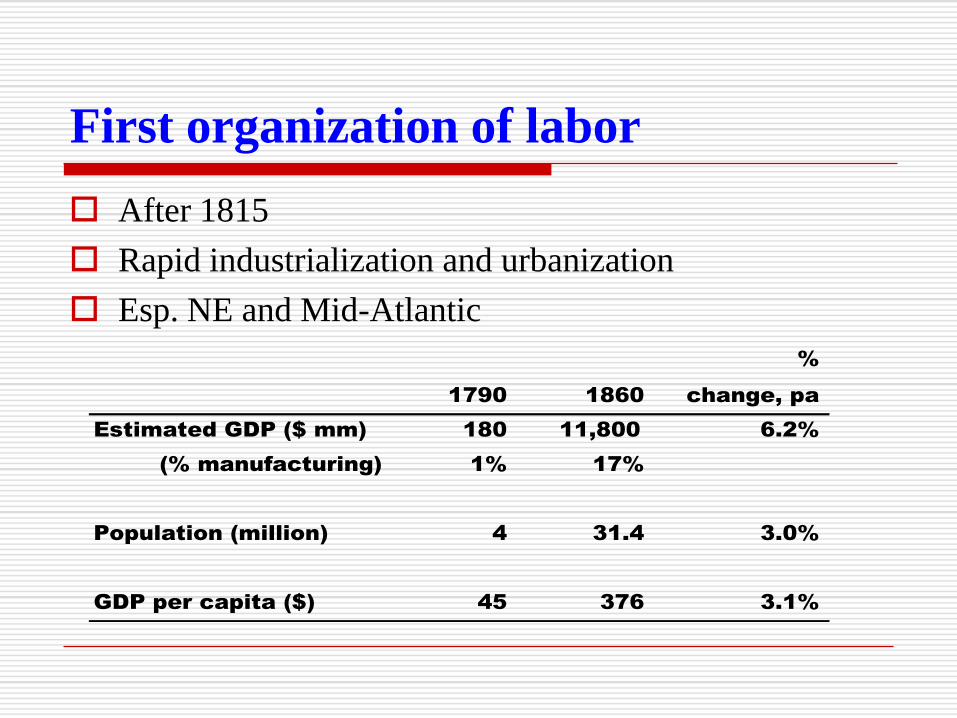
First organization of labor
After 1815
Rapid industrialization and urbanization
Esp. NE and Mid-Atlantic
%
1790 1860 change, pa
Estimated GDP ($ mm) 180 11,800 6.2%
(% manufacturing) 1% 17%
Population (million) 4 31.4 3.0%
GDP per capita ($) 45 376 3.1%
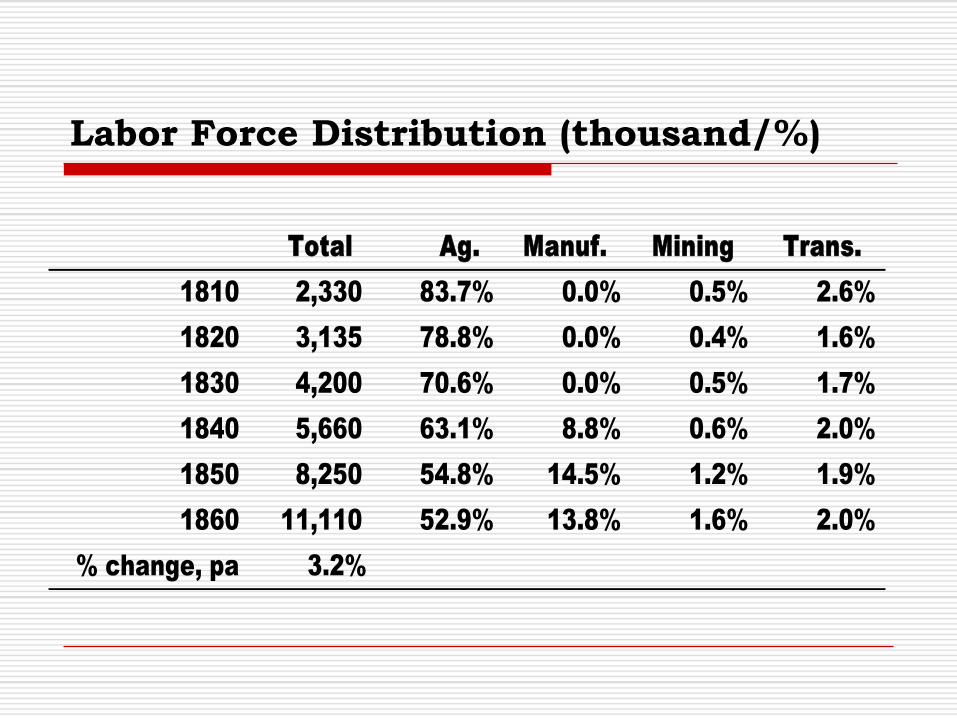
Labor Force Distribution (thousand/%)
Total Ag. Manuf. Mining Trans.
1810 2,330 83.7% 0.0% 0.5% 2.6%
1820 3,135 78.8% 0.0% 0.4% 1.6%
1830 4,200 70.6% 0.0% 0.5% 1.7%
1840 5,660 63.1% 8.8% 0.6% 2.0%
1850 8,250 54.8% 14.5% 1.2% 1.9%
1860 11,110 52.9% 13.8% 1.6% 2.0%
% change, pa 3.2%

Figure 11.1 Labor Force Additions from Migration, 1800–1860

Yearly Immigration (thousand)
Total England Ireland Germany Other
1845-50 233 34 107 66 26
1851-55 350 47 139 129 35
1856-60 160 38 44 61 27

Growth of Factories and Factory Employees
NE, 1820-50 (average per annum)
Firm # Workers per Firm
Shoes 5.4% 1.9%
Cotton textiles 14.8% 3.5%
Flour mills 14.4% -1.0%
Glass 7.8% 0.4%
Hats and caps 11.4% 2.4%
Iron mills 10.8% 0.7%
Liquor 4.6% 2.1%
Paper -3.3% 1.5%
Tanning 11.4% 0.3%
Wool textiles 8.6% 2.8%

Early Industrial Relations
Industrial organization
Larger and larger production
units
Rudimentary mechanization
Division of labor
Specialization, repetition of
tasks…
High proportion of women
and children
Productivity in textiles, 4.5%
pa, 1835-60
12-hour day
½ hour for meals
6-day, 72-hour work week
Sunday off
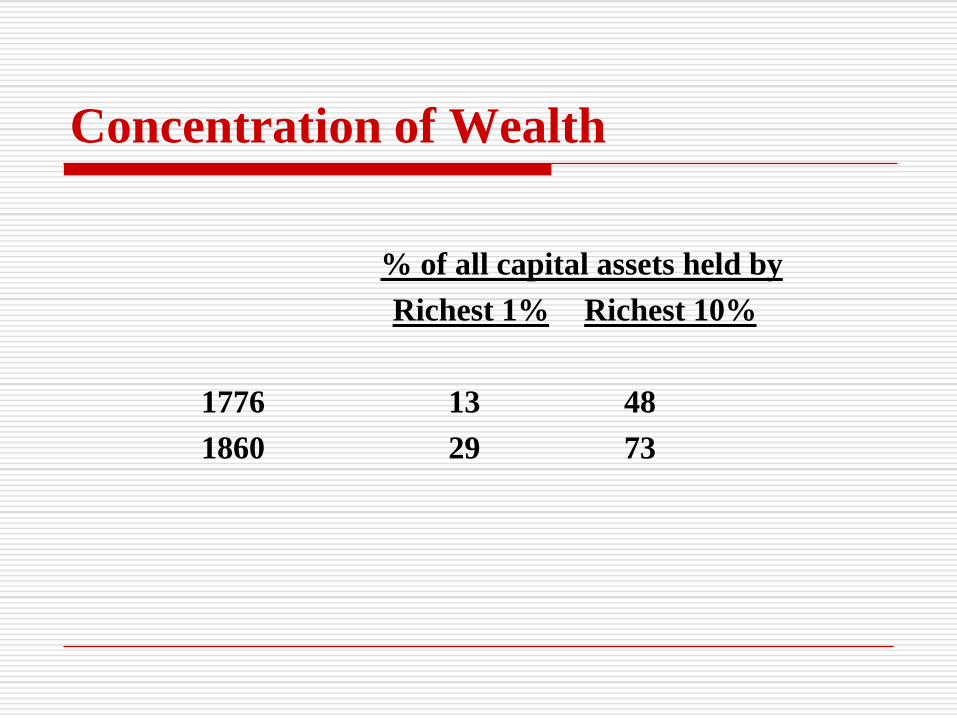
Concentration of Wealth
% of all capital assets held by
Richest 1% Richest 10%
1776 13 48
1860 29 73

Early Union Movement
Growing # of urban workers in close
proximity
Efforts to organize began immediately
New phenomenon…economic
fluctuation
Employment uncertainty and insecurity
Labor scarcity, relatively high wages…
…vs. crude labor standards

Early Union Movement
Before 1860, union members never
exceeded 1% of the labor force
Contrast with England
Craft unions, most successful
Largely excluded factory workers, farm
workers, domestic servants
English Common Law: unions viewed as a
“criminal conspiracy” until 1840

Real Wages, Adult Males
in Manufacturing
Avg. Growth
1820 1832 1850 1860 per annum
New England 101 131-154 149-188 164-197 1.3-1.7
Mid Atlantic 100 122-143 159-202 157-188 1.2-1.6
Total 101 128-150 155-197 159-191 1.2-1.6
Avg. Wage (pa) $267 $292 $341 $360
PV (2008) 4,061 6,220 8,720 8,530
Productivity growth in textile mills averaged 4.5% p.a., 1836-60
Deflation, 1820-mid-1830s and again in early 1840s
Little to no real wage increase in 1850s (1854/1857 recessions)
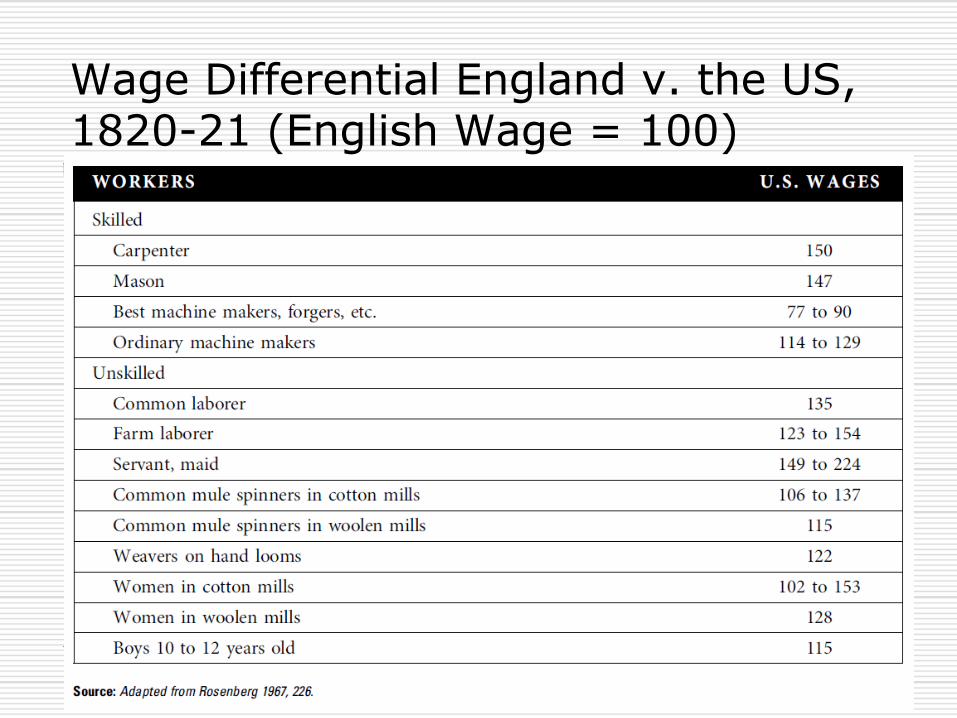
Wage Differential England v. the US, 1820-21 (English Wage = 100)

Figure 11.2 Market for Manufacturing Workers

Figure 11.3 Market for Manufacturing Workers by Skill
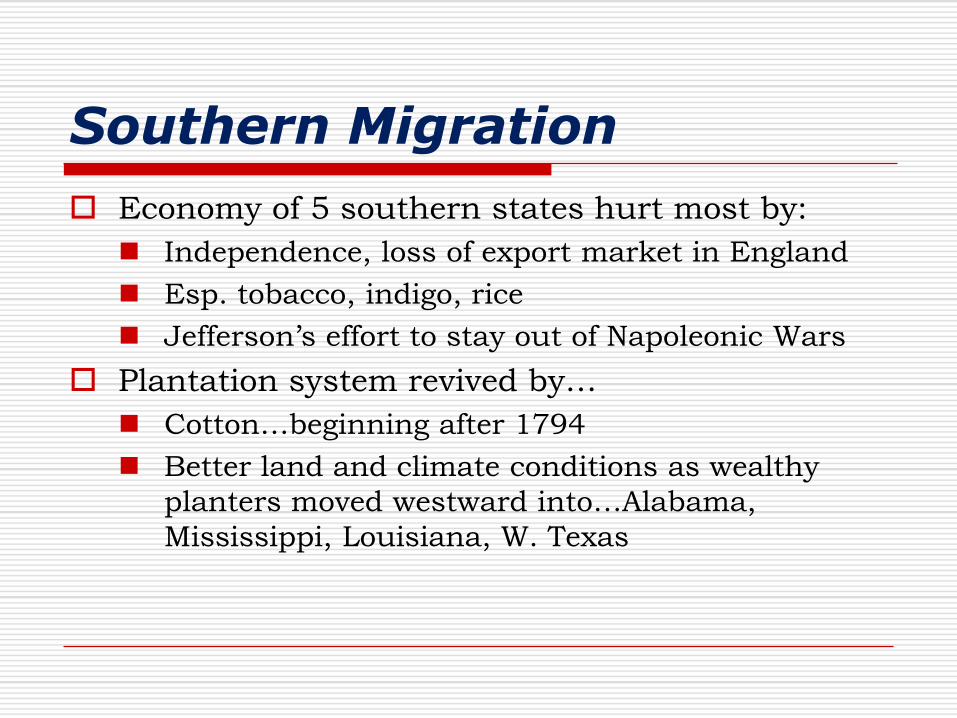
Southern Migration
Economy of 5 southern states hurt most by:
Independence, loss of export market in England
Esp. tobacco, indigo, rice
Jefferson’s effort to stay out of Napoleonic Wars
Plantation system revived by…
Cotton…beginning after 1794
Better land and climate conditions as wealthy
planters moved westward into…Alabama,
Mississippi, Louisiana, W. Texas

Cotton gin, patented March 1794
Eli Whitney
Huge increase in productivity…
One worker…
55 lbs./day
Instead of
1 lb.
5,400%

Southern Migration
Western plantations – Cotton…
…became central to southern agriculture…
Exported to Europe, also NE textile manufacturing
By 1860… Cotton was ½ of all US merchandise exports
10X larger than second largest export, wheat
cotton goods/fabric was #1 manufactured export

Map 8.4 Shifts in Cotton Cultivation

Entrenchment of Slavery
Cotton revived southern states’ economic model
Very large-scale plantations…
…with free labor
“economies of scale”
Huge profits and wealth build-up, but…
…prevented industrialization, modernization, development, change
Little immigration from Europe

Table 13.4 Economies of Scale in Southern Agriculture (Index of Free Southern Farms)

Table 13.8 Per Capita Income pre-Civil War (1860 Prices)
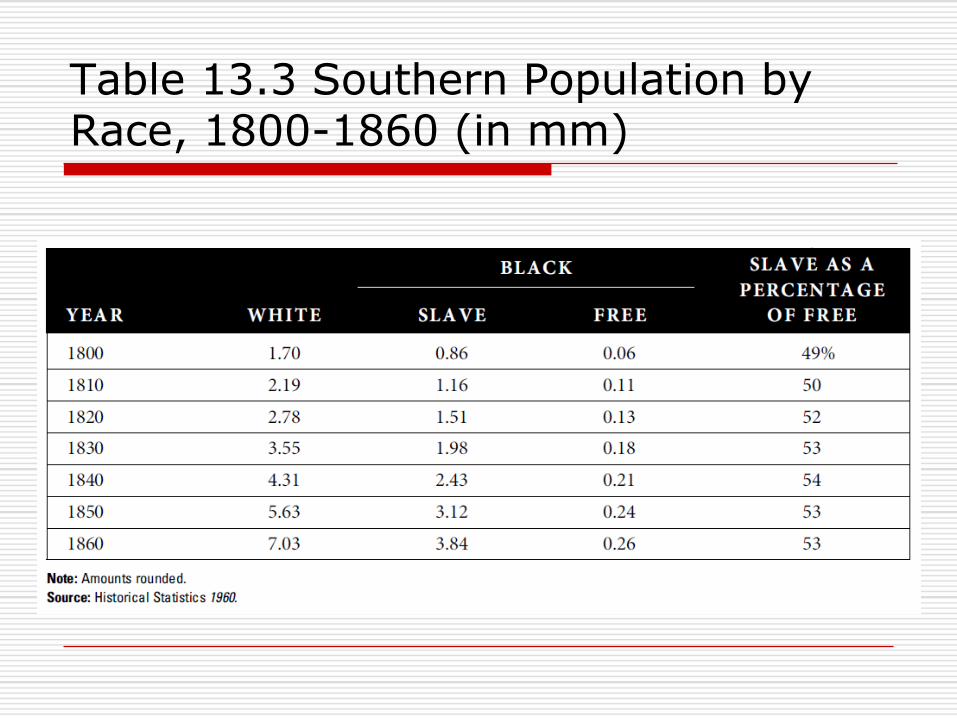
Table 13.3 Southern Population by Race, 1800-1860 (in mm)
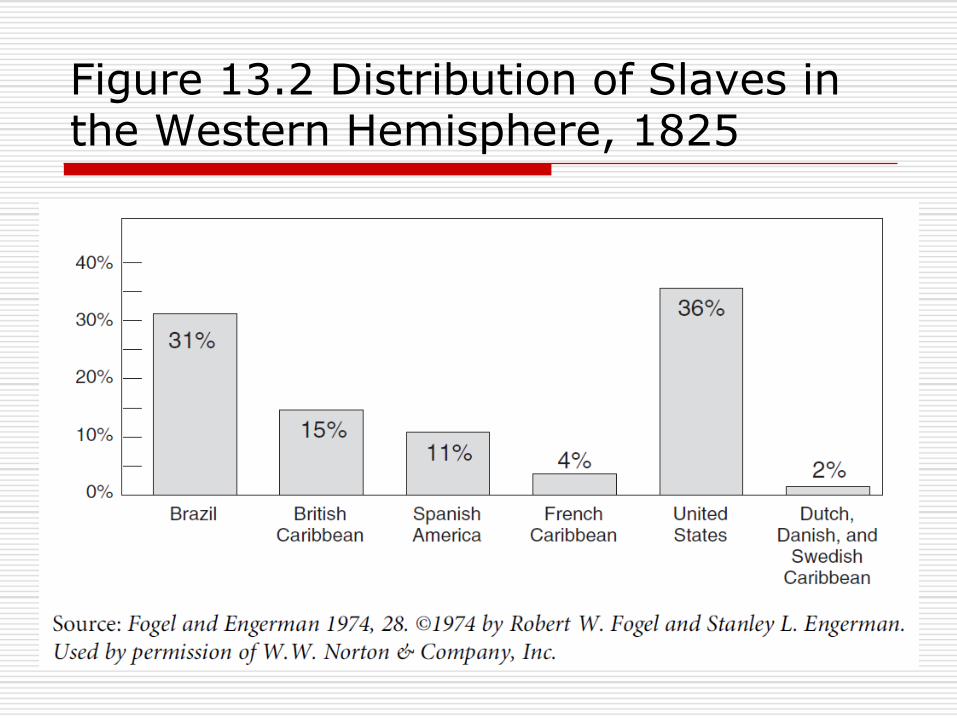
Figure 13.2 Distribution of Slaves in the Western Hemisphere, 1825
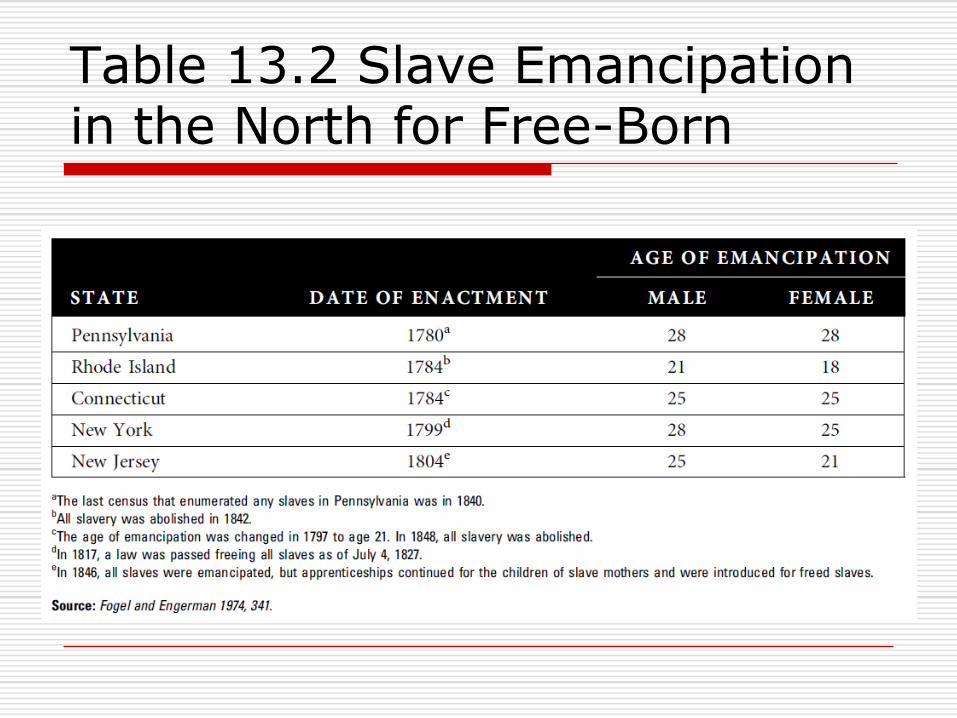
Table 13.2 Slave Emancipation in the North for Free-Born
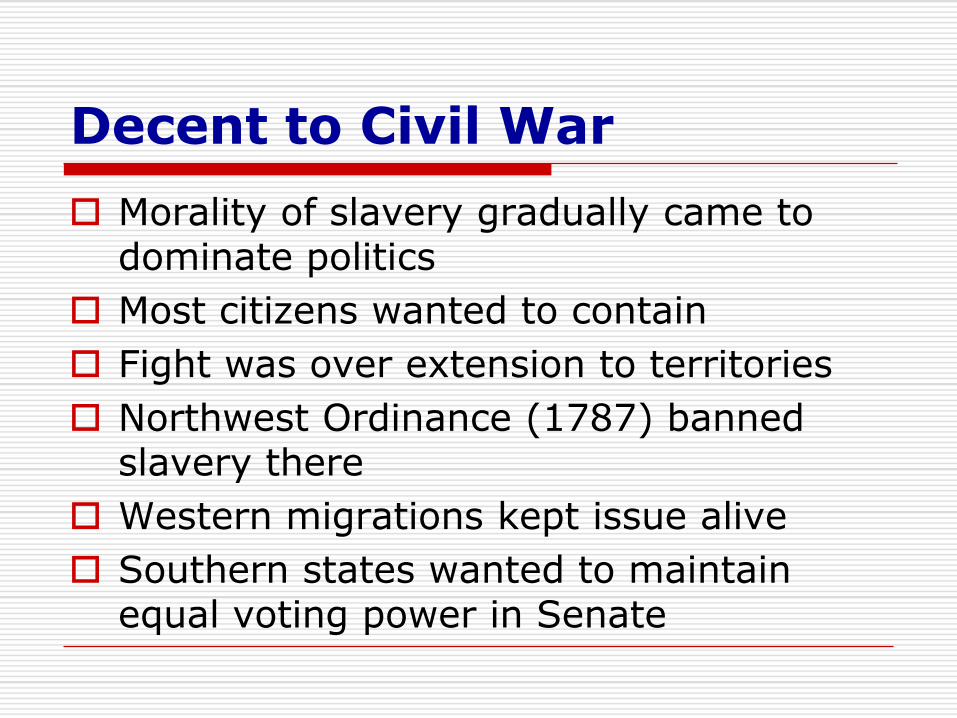
Decent to Civil War
Morality of slavery gradually came to dominate politics
Most citizens wanted to contain
Fight was over extension to territories
Northwest Ordinance (1787) banned slavery there
Western migrations kept issue alive
Southern states wanted to maintain equal voting power in Senate

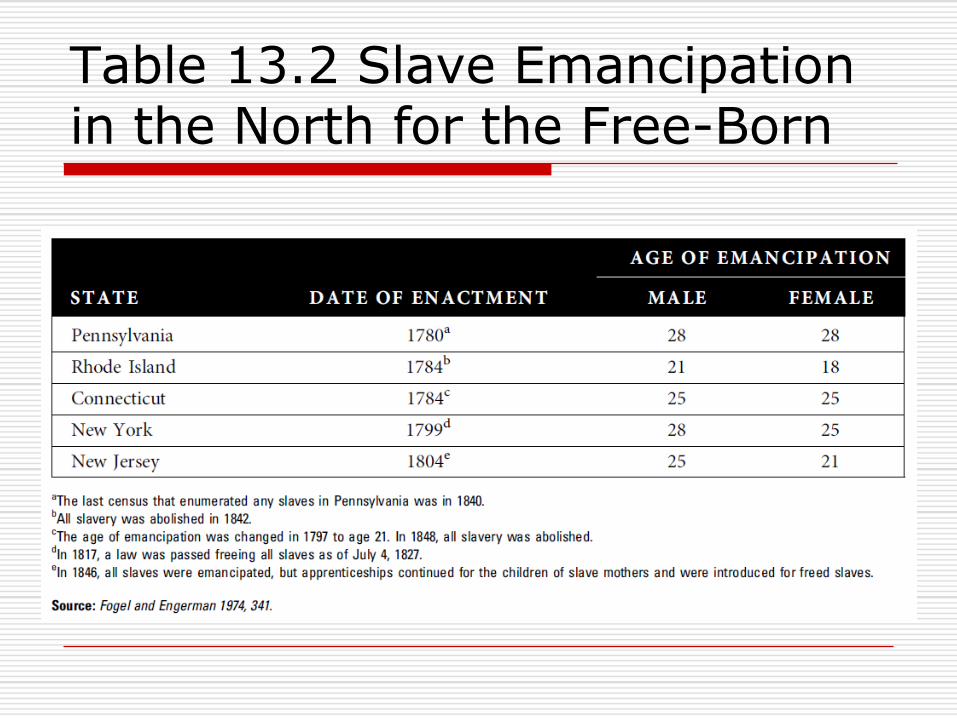
Table 13.2 Slave Emancipation in the North for the Free-Born
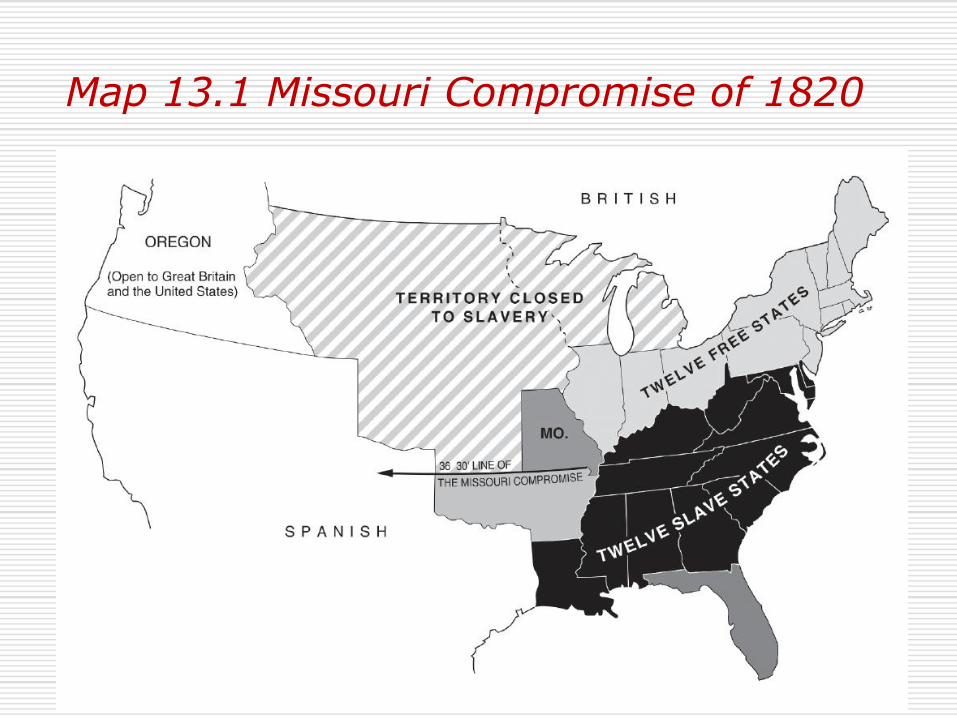
Map 13.1 Missouri Compromise of 1820

Missouri Compromise, 1820
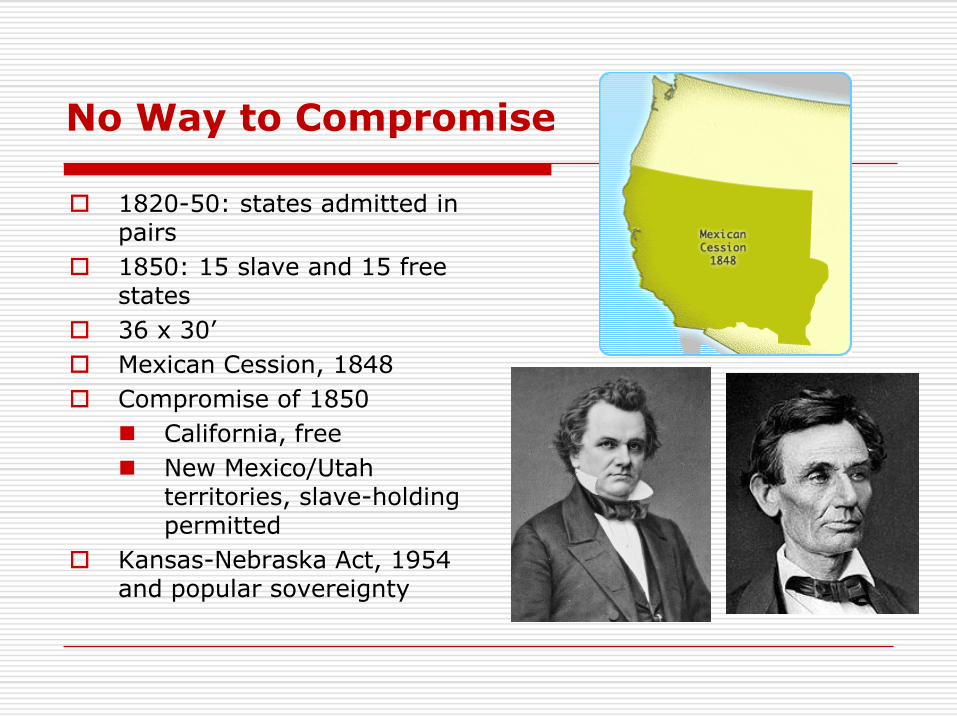
No Way to Compromise
1820-50: states admitted in pairs
1850: 15 slave and 15 free states
36 x 30’
Mexican Cession, 1848
Compromise of 1850
California, free
New Mexico/Utah territories, slave-holding permitted
Kansas-Nebraska Act, 1954 and popular sovereignty

Map 13.2 New Settlements
Related Documents


