India: Growth and prospects Ila Patnaik National Institute of Public Finance and Policy Ila Patnaik (NIPFP) India: Growth and prospects 1 / 36

“Economic Growth in India: Trends and Cycle” by Dr Ila Patnaik
Jan 21, 2018
Welcome message from author
This document is posted to help you gain knowledge. Please leave a comment to let me know what you think about it! Share it to your friends and learn new things together.
Transcript

India: Growth and prospects
Ila Patnaik
National Institute of Public Finance and Policy
Ila Patnaik (NIPFP) India: Growth and prospects 1 / 36

GDP outlookTwo components of GDP growth
Long term growthRecent slowdown
Ila Patnaik (NIPFP) India: Growth and prospects 2 / 36

Cycle around trend
Ila Patnaik (NIPFP) India: Growth and prospects 3 / 36

Part I
Long term growth
Ila Patnaik (NIPFP) India: Growth and prospects 4 / 36

Drivers of long term trend GDP growth
Labour : A young demographic, with growing human capital.Capital : Capital stock has grown steadily.Productivity : Numerous micro-economic drivers of productivity.
Ila Patnaik (NIPFP) India: Growth and prospects 5 / 36

Part II
Labour
Ila Patnaik (NIPFP) India: Growth and prospects 6 / 36

Quality and supply of labour
QualityYear Literacy rate Years of schooling1980 41 1.91990 48 3.02000 61 3.62010 69 4.42014 72.1 (estimated) 5.4
1 Source: Years of schooling UNDP, Human Development Report2 Source: Literacy rate: World Development Indicators: Defined as percentage of population age 15 and above
who can, with understanding, read and write a short, simple statement on their everyday life.
Supply: The working age (15-64) population has been rising and iscurrently at 65% of the population.
Ila Patnaik (NIPFP) India: Growth and prospects 7 / 36

Labour quality will improve
Rapid improvement in literacy70 percent of the work force is literate.10 percent workers are graduates.In the next decade
1 Everyone entering the labour force will be literate.2 20 percent of entrants to the work force will be graduates.
Ila Patnaik (NIPFP) India: Growth and prospects 8 / 36

Literacy will improve
1990 2000 2010 2020
5060
7080
9010
0
Lite
racy
rat
e (%
)
AllFemale
Ila Patnaik (NIPFP) India: Growth and prospects 9 / 36

More literate workers can follow written instructions
Ila Patnaik (NIPFP) India: Growth and prospects 10 / 36
High School educated will increase
1990 2000 2010 2020
510
1520
25
Hig
hsch
ool r
ate
(%)
AllFemale
Ila Patnaik (NIPFP) India: Growth and prospects 11 / 36

High end scientific and technical labour force
Ila Patnaik (NIPFP) India: Growth and prospects 12 / 36

Better health improves labour productivity
Health status of population has been improving.Infant Mortality Rate (IMR) in India declined from 88 per 1000 livebirths in 1990 to 39 in the year 2015.Maternal Mortality Rate (MMR) has declined from 600 per 100,000live births in 1990 to 174 in the year 2015.
Ila Patnaik (NIPFP) India: Growth and prospects 13 / 36

Part III
Capital
Ila Patnaik (NIPFP) India: Growth and prospects 14 / 36
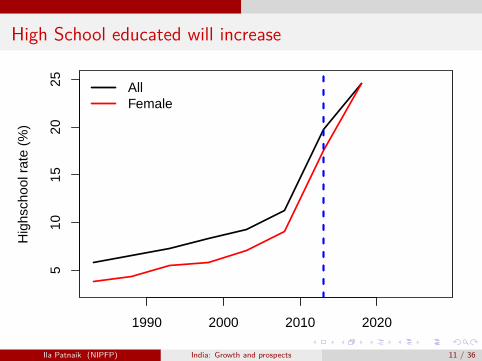
Comparing India’s growth in capital stockIndexed to 100 in 1991, India outperforms its peers
1995 2000 2005 2010
5020
010
0050
00
Inde
x
Growth in capital stockIndiaBrazilGreat BritainJapanMexico
Source: World Development Indicators 2012Ila Patnaik (NIPFP) India: Growth and prospects 15 / 36

All projects under implementationValue of projects under implementation has been rising
20
40
60
80
100
Rs.
Tril
lion
1999 2001 2003 2005 2007 2009 2011 2013 2015 2017
Apr−Jun 2017; 97.68
Ila Patnaik (NIPFP) India: Growth and prospects 16 / 36

Addition to capital stock: Gross fixed assets of all largefirms
100
200
500
1000
Bill
ion
dolla
rs
Mar 1991 Mar 1997 Mar 2003 Mar 2009 Mar 2015
Mar 2016; 1063.83
Ila Patnaik (NIPFP) India: Growth and prospects 17 / 36

Part IV
Productivity
Ila Patnaik (NIPFP) India: Growth and prospects 18 / 36
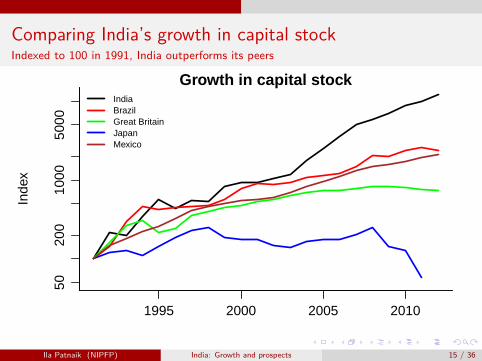
Infrastructure growth
Ila Patnaik (NIPFP) India: Growth and prospects 19 / 36
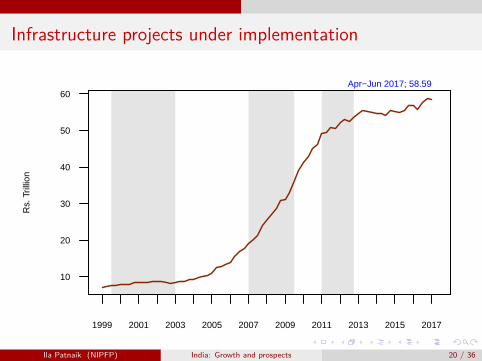
Infrastructure projects under implementation
10
20
30
40
50
60
Rs.
Tril
lion
1999 2001 2003 2005 2007 2009 2011 2013 2015 2017
Apr−Jun 2017; 58.59
Ila Patnaik (NIPFP) India: Growth and prospects 20 / 36
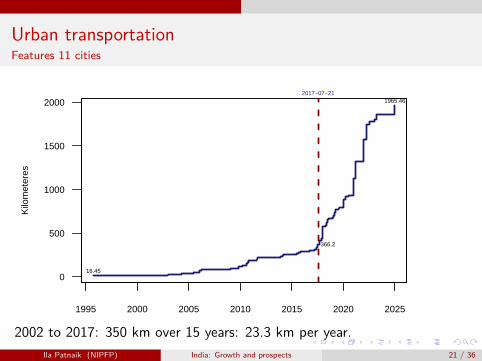
Urban transportationFeatures 11 cities
1995 2000 2005 2010 2015 2020 2025
0
500
1000
1500
2000
Kilo
met
eres
16.45
366.2
1965.462017−07−21
2002 to 2017: 350 km over 15 years: 23.3 km per year.Ila Patnaik (NIPFP) India: Growth and prospects 21 / 36
A sense of the future
The outlook on capital, labour, productivity is positive.Long term growth prospects are good.
Ila Patnaik (NIPFP) India: Growth and prospects 22 / 36

Can we be complacent?
Ila Patnaik (NIPFP) India: Growth and prospects 23 / 36

Part V
Current state of the economy
Ila Patnaik (NIPFP) India: Growth and prospects 24 / 36
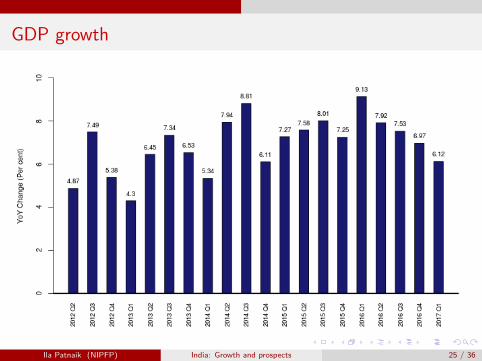
GDP growth
Ila Patnaik (NIPFP) India: Growth and prospects 25 / 36
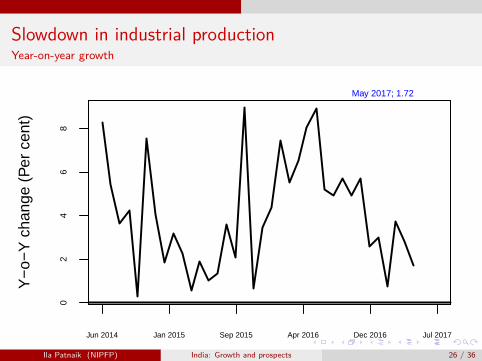
Slowdown in industrial productionYear-on-year growth
02
46
8
Y−
o−Y
cha
nge
(Per
cen
t)
Jun 2014 Jan 2015 Sep 2015 Apr 2016 Dec 2016 Jul 2017
May 2017; 1.72
Ila Patnaik (NIPFP) India: Growth and prospects 26 / 36

Slight uptick in net sales of firms, but still subduedYear-on-year growth
0
5
10
15
20
25
Y−
o−Y
Gro
wth
(P
er c
ent)
1999 2001 2003 2005 2007 2009 2011 2013 2015 2017
Jan−Mar 2017; 5.93
Ila Patnaik (NIPFP) India: Growth and prospects 27 / 36

Slide in bank credit to commercial sectorYear-on-year growth
5
10
15
20
25
30
35
Y−
o−Y
Cha
nge
(Per
cen
t)
1999 2001 2003 2005 2007 2009 2011 2013 2015 2017
Jun 2017; 6.71
Ila Patnaik (NIPFP) India: Growth and prospects 28 / 36

Slump in under-implementation projectsQuarter-on-quarter growth
0
5
10
Per
cen
t
1999 2001 2003 2005 2007 2009 2011 2013 2015 2017
Apr−Jun 2017; −0.77
Ila Patnaik (NIPFP) India: Growth and prospects 29 / 36

Part VI
Will the investment cycle downturn affecttrend growth?
Ila Patnaik (NIPFP) India: Growth and prospects 30 / 36
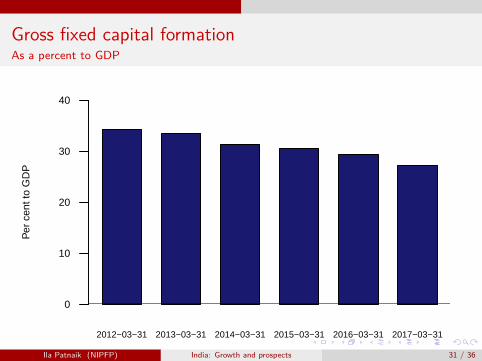
Gross fixed capital formationAs a percent to GDP
2012−03−31 2013−03−31 2014−03−31 2015−03−31 2016−03−31 2017−03−31
Per
cen
t to
GD
P
0
10
20
30
40
Ila Patnaik (NIPFP) India: Growth and prospects 31 / 36

Gross fixed capital formationYear-on-year growth
2013−03−31 2014−03−31 2015−03−31 2016−03−31 2017−03−31
Per
cen
t
0
2
4
6
8
10
Ila Patnaik (NIPFP) India: Growth and prospects 32 / 36

Projects announced by private sector (Levels)
10
20
30
40
Rs.
Tril
lion
1999 2001 2003 2005 2007 2009 2011 2013 2015 2017
Apr−Jun 2017; 24.57
Ila Patnaik (NIPFP) India: Growth and prospects 33 / 36

Concerns
Tax rates and tax administrationPermissions, licenses, red tapeLaw and order, courts, enforcement, corruptionPolicy uncertainty
Ila Patnaik (NIPFP) India: Growth and prospects 34 / 36

Conclusion
India has good long term growth prospects.There a currently a cyclical downturn in investment.If the investment downturn persists, it can impact long term capitalstock and growth.The policy framework for supporting investment needs to beimproved.
Ila Patnaik (NIPFP) India: Growth and prospects 35 / 36

Thank you
Ila Patnaik (NIPFP) India: Growth and prospects 36 / 36
Related Documents