Munich Personal RePEc Archive Economic growth dynamics across countries. Lechman Ewa Faculty of Management and Economics, Gdansk University of Technology September 2011 Online at http://mpra.ub.uni-muenchen.de/37768/ MPRA Paper No. 37768, posted 31. March 2012 14:24 UTC

Welcome message from author
This document is posted to help you gain knowledge. Please leave a comment to let me know what you think about it! Share it to your friends and learn new things together.
Transcript
MPRAMunich Personal RePEc Archive
Economic growth dynamics acrosscountries.
Lechman Ewa
Faculty of Management and Economics, Gdansk University ofTechnology
September 2011
Online at http://mpra.ub.uni-muenchen.de/37768/MPRA Paper No. 37768, posted 31. March 2012 14:24 UTC
1
Economic growth dynamics across countries
Ewa Lechman1
Published in monograph: Macro and microeconomic problems in theory and practice, Szczeciń 2011
Abstract
Economic growth is one of the most important issues discussed worldwide. Its dynamics over time seem to be crucial from the perspective of the ability of poor countries to catch up with highly developed economies. As can
be easily noticed in world statistics, both GDP per capita and GDP growth levels vary substantially across countries.
The main purpose of the paper is to analyze GDP PPP per capita growth rates across countries in the period 1980 – 2008, as well as to identify top and bottom country performers. In addition, the author verifies the
statistical relationship between GDP PPP per capita and some arbitrary selected social indicators like: school life expectancy, infant mortality rate, life expectancy and Human Development Index.
All data applied in the study are drawn from International Monetary Fund and United Nation databases.
Key words: economic growth, economic development, HDI JEL codes: 011, 047
Introduction
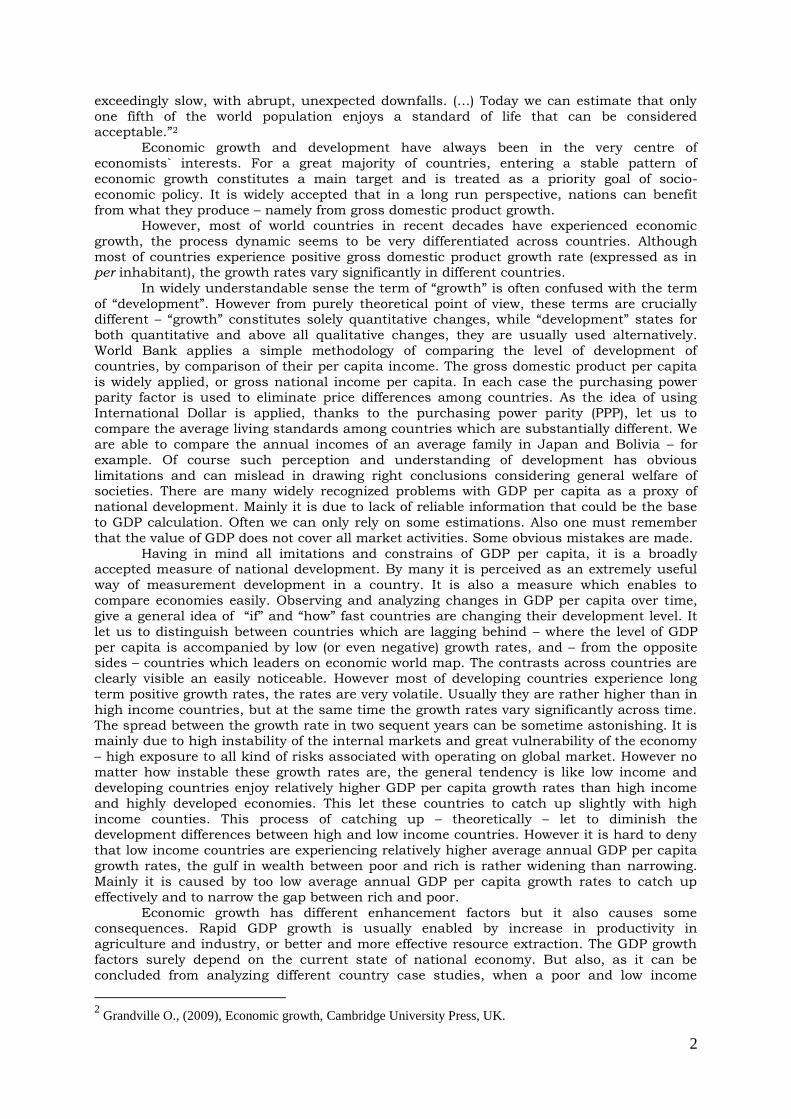
Gross domestic product growth – shortly defined as an economic growth – lies in the very centre of the economists’ interests. It is often perceived as a prerequisite for a country
to develop on social, political, technological ground, but at the same time the permanent
lack of GDP growth constitutes a main obstacle for a country to enter a path of socio -
economic development. The changes in GDP – usually in GDP per capita (per inhabitant),
are analyzed as the indicator is thought to be more reliable than just overall GDP growth.
Surely each indicator is always expressed in international dollars (GDP expresses in US dollars and corrected by purchasing power parity factor), in order to make possible
international comparisons in time and space. In most common sense the average level of GDP per capita is treated as an indicator
explaining the overall wealth of nation and inhabitants. However, the main advantage of
such approach is its simplicity and comparability among countries, but it has some obvious
limitations. As it is widely agreed, the GDP per capita values does not capture some essential aspects of social life, which usually constitute a major part of peoples` general
well-being.
However “economic growth” lies in the centre of the author`s interest, it is not an aim
to discuss the problem of economic growth from purely technical and mathematical point of
view. Economic growth theories will not discussed, although the author does not deny their importance. The main target of the paper is to analyze GDP dynamics in time and space for
as many economies as possible. The correlation between growth rates and initial GDP level
are analyzed. Additionally trends in human development level – defined according to
Amartya Sen`s concept – are studied. In the final part the author runs a statistical analysis
of relationships between GDP levels and level of proxies of social and technological
development, as well as between GDP growth rates and level of proxies of social and technological development.
Economic growth and development. Theoretical background and measurement.
“In the history of mankind, attempts to improve living conditions have only very recently superseded the struggle for survival. In all civilizations, progress has been
1 Ph.D., [email protected]
Gdansk University of Technology, Faculty of Management and Economics
2
exceedingly slow, with abrupt, unexpected downfalls. (…) Today we can estimate that only
one fifth of the world population enjoys a standard of life that can be considered acceptable.”2
Economic growth and development have always been in the very centre of
economists` interests. For a great majority of countries, entering a stable pattern of
economic growth constitutes a main target and is treated as a priority goal of socio-
economic policy. It is widely accepted that in a long run perspective, nations can benefit
from what they produce – namely from gross domestic product growth. However, most of world countries in recent decades have experienced economic
growth, the process dynamic seems to be very differentiated across countries. Although
most of countries experience positive gross domestic product growth rate (expressed as in per inhabitant), the growth rates vary significantly in different countries.
In widely understandable sense the term of “growth” is often confused with the term
of “development”. However from purely theoretical point of view, these terms are crucially different – “growth” constitutes solely quantitative changes, while “development” states for
both quantitative and above all qualitative changes, they are usually used alternatively.
World Bank applies a simple methodology of comparing the level of development of
countries, by comparison of their per capita income. The gross domestic product per capita
is widely applied, or gross national income per capita. In each case the purchasing power parity factor is used to eliminate price differences among countries. As the idea of using
International Dollar is applied, thanks to the purchasing power parity (PPP), let us to
compare the average living standards among countries which are substantially different. We
are able to compare the annual incomes of an average family in Japan and Bolivia – for
example. Of course such perception and understanding of development has obvious
limitations and can mislead in drawing right conclusions considering general welfare of societies. There are many widely recognized problems with GDP per capita as a proxy of
national development. Mainly it is due to lack of reliable information that could be the base
to GDP calculation. Often we can only rely on some estimations. Also one must remember
that the value of GDP does not cover all market activities. Some obvious mistakes are made.
Having in mind all imitations and constrains of GDP per capita, it is a broadly accepted measure of national development. By many it is perceived as an extremely useful
way of measurement development in a country. It is also a measure which enables to
compare economies easily. Observing and analyzing changes in GDP per capita over time,
give a general idea of “if” and “how” fast countries are changing their development level. It
let us to distinguish between countries which are lagging behind – where the level of GDP
per capita is accompanied by low (or even negative) growth rates, and – from the opposite sides – countries which leaders on economic world map. The contrasts across countries are
clearly visible an easily noticeable. However most of developing countries experience long
term positive growth rates, the rates are very volatile. Usually they are rather higher than in
high income countries, but at the same time the growth rates vary significantly across time.
The spread between the growth rate in two sequent years can be sometime astonishing. It is mainly due to high instability of the internal markets and great vulnerability of the economy
– high exposure to all kind of risks associated with operating on global market. However no
matter how instable these growth rates are, the general tendency is like low income and
developing countries enjoy relatively higher GDP per capita growth rates than high income
and highly developed economies. This let these countries to catch up slightly with high
income counties. This process of catching up – theoretically – let to diminish the development differences between high and low income countries. However it is hard to deny
that low income countries are experiencing relatively higher average annual GDP per capita
growth rates, the gulf in wealth between poor and rich is rather widening than narrowing.
Mainly it is caused by too low average annual GDP per capita growth rates to catch up
effectively and to narrow the gap between rich and poor.
Economic growth has different enhancement factors but it also causes some consequences. Rapid GDP growth is usually enabled by increase in productivity in
agriculture and industry, or better and more effective resource extraction. The GDP growth
factors surely depend on the current state of national economy. But also, as it can be
concluded from analyzing different country case studies, when a poor and low income
2 Grandville O., (2009), Economic growth, Cambridge University Press, UK.
3
country reaches the middle – income level of GDP per capita, it also means that a certain
level of industrialization has been achieved. GDP growth generally causes some structural changes in an economy, the structure of consumption is changing and the overall welfare of
a society is to increase. However it is thought that GDP growth is “good for all” – especially
for low income countries, there are much evidence from developing world that increase in
value of national output does necessarily mean that all parts of society benefit equally from
it. Although GDP growth usually stands for better and more effective use of resources of all
kinds, it does not cause a direct poverty reduction. The extend poverty is very likely to stay at the same level even when a country is experiencing high GDP growth rate, when the
distribution of earning is highly unequal. It is very possible that the GDP is growing at high
pace but only a small part of a society has effectively benefit from it. It means that GDP
growth does not always has to mean reduction in absolute poverty rates. In order to find out
how many of the poor benefit from the growth we should analyze the pre and post growth distribution of income. However it is not the purpose of the analysis presented in the paper.
As it was already stated, pure GDP does not reflect entirely a general welfare of
societies. Actually it not a perfect gauge for the measurement of societies well-being. A huge
number of corrections should be implemented if somebody wanted to treat is a welfare
measure. It is mainly because the GDP does not capture numerous elements which can
increase or decrease welfare significantly. They are mainly of qualitative kind, which cannot be easily put into numbers.
In time many different and alternative concepts of measuring overall welfare have
been developed. One of the most popular are these calculated by United Nation Development
Programme3, Human Development Index (HDI). The measurement is mainly based on the
assumption that human development goes far beyond simple increase in income and value of final goods. “It is about creating an environment in which people can develop their full
potential and lead productive, creative lives in accord with their needs and interests. People
are the real wealth of nations. Development is thus about expanding the choices people
have to lead lives that they value. And it is thus about much more than economic growth,
which is only a means —if a very important one —of enlarging people’s choices4”. The
concept of human development is much broader and is not limited to incomes. The Human Development Index was firstly introduced in 1990 by Muhamad al Haq and Amartya Sen.
Originally the index calculation was based on 4 different components, covering three
aspects of life: a decent living standards, knowledge and a long and healthy life5.
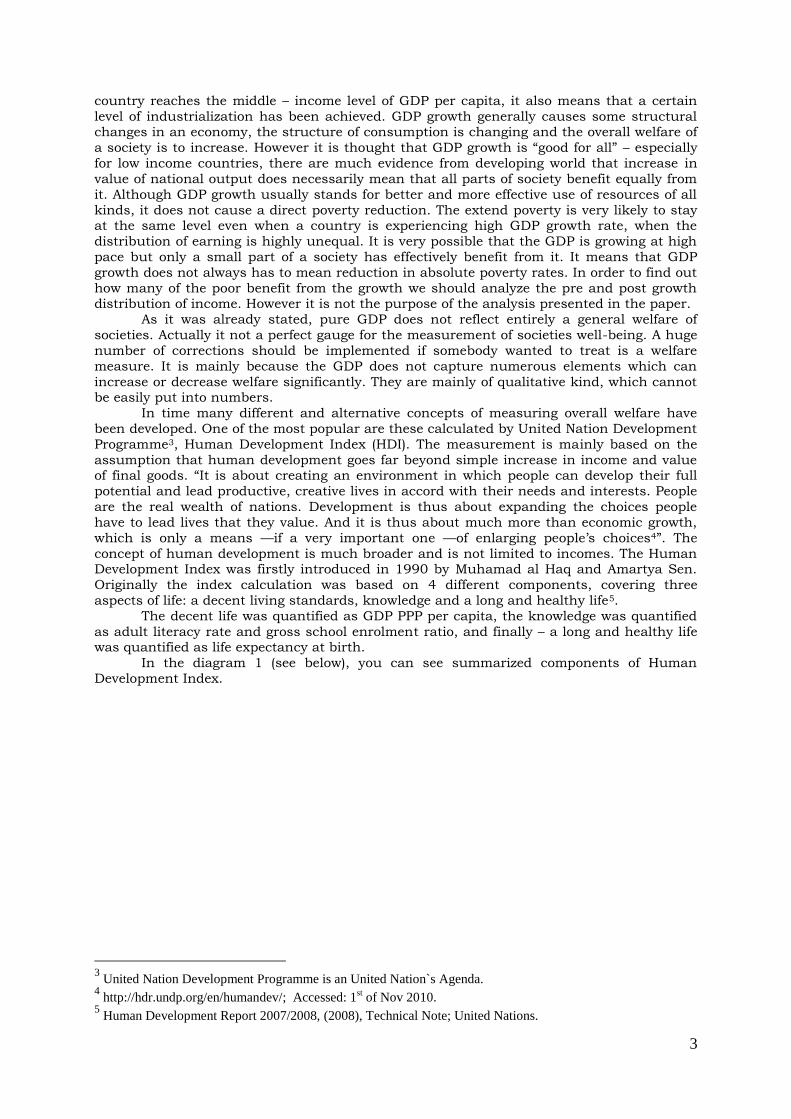
The decent life was quantified as GDP PPP per capita, the knowledge was quantified
as adult literacy rate and gross school enrolment ratio, and finally – a long and healthy life was quantified as life expectancy at birth.
In the diagram 1 (see below), you can see summarized components of Human
Development Index.
3 United Nation Development Programme is an United Nation`s Agenda.
4 http://hdr.undp.org/en/humandev/; Accessed: 1
st of Nov 2010.
5 Human Development Report 2007/2008, (2008), Technical Note; United Nations.
4
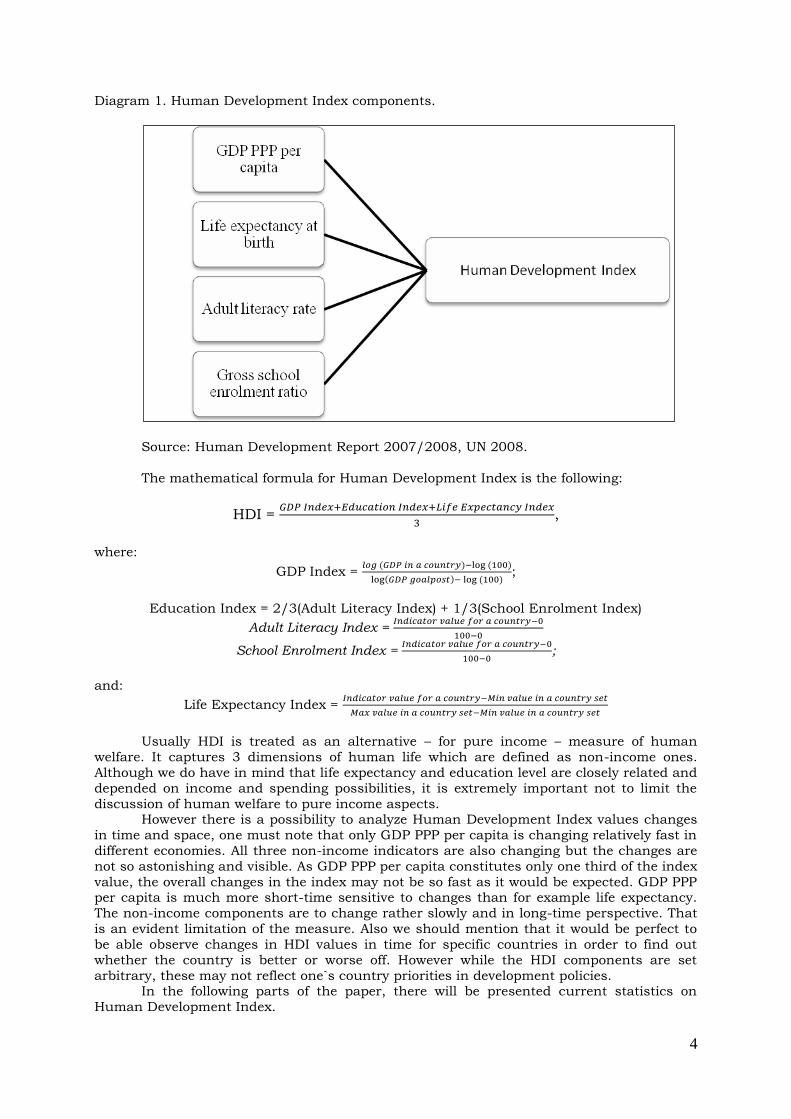
Diagram 1. Human Development Index components.
Source: Human Development Report 2007/2008, UN 2008.
The mathematical formula for Human Development Index is the following:
HDI =
,
where:
GDP Index =
;
Education Index = 2/3(Adult Literacy Index) + 1/3(School Enrolment Index)
Adult Literacy Index =
School Enrolment Index =
;
and:
Life Expectancy Index =
Usually HDI is treated as an alternative – for pure income – measure of human
welfare. It captures 3 dimensions of human life which are defined as non-income ones.
Although we do have in mind that life expectancy and education level are closely related and
depended on income and spending possibilities, it is extremely important not to limit the
discussion of human welfare to pure income aspects. However there is a possibility to analyze Human Development Index values changes
in time and space, one must note that only GDP PPP per capita is changing relatively fast in
different economies. All three non-income indicators are also changing but the changes are
not so astonishing and visible. As GDP PPP per capita constitutes only one third of the index
value, the overall changes in the index may not be so fast as it would be expected. GDP PPP per capita is much more short-time sensitive to changes than for example life expectancy.
The non-income components are to change rather slowly and in long-time perspective. That
is an evident limitation of the measure. Also we should mention that it would be perfect to
be able observe changes in HDI values in time for specific countries in order to find out
whether the country is better or worse off. However while the HDI components are set
arbitrary, these may not reflect one`s country priorities in development policies. In the following parts of the paper, there will be presented current statistics on
Human Development Index.
5
Also in the third section of the paper there also will be analyzed relationships
between GDP PPP per capita and 3 different indicators of social kind which can be considered as proxies of general welfare. These will be:
School life expectancy (in years) – data drawn from World Bank database,
Infant mortality rate – data drawn from World Bank database,
Adult literacy rate (for persons of minimum age of 15 years) - data drawn from World Bank database.
Apart from the discussion considering HDI changes over time, the author analyzes
the existing relationships between GDP PPP and each one of the 4 indicators mentioned
above. The general purpose of the analysis is to learn about whether there is statistically
significant relationship between GDP PPP per capita and level of indicators reflecting general welfare and well-being.
Statistical analysis of GDP changes – cross country study.
The main aim of the second part of the paper is to analyze changes in GDP values
across nation in time. The period applied for the analysis covers 28 sequent years (1980 – 2008). All data concerning GDP levels were drawn from International Monetary Fund
database (IMF Economic Outlook Database, 2010). The sample includes 140 worldwide
economies – both low and high developed countries. The starting year for the analysis is
1980 and the final – 2008.
In the first part of the second paragraph, the author calculates and compares average annual GDP per capita growth rates. All values are expressed as Gross Domestic
Product in Purchasing Power Parity, so the price differences among countries have been
eliminated. The average annual growth rates have been calculated according to the following
mathematical formula:
aaGDPPPPpcgrate = %100*]1)0
[( n
Y
Yn,
where:
n – number of years
Yn – GDP PPP per capita values in the end period year,
Y0 – GDP PPP per capita in the initial year.
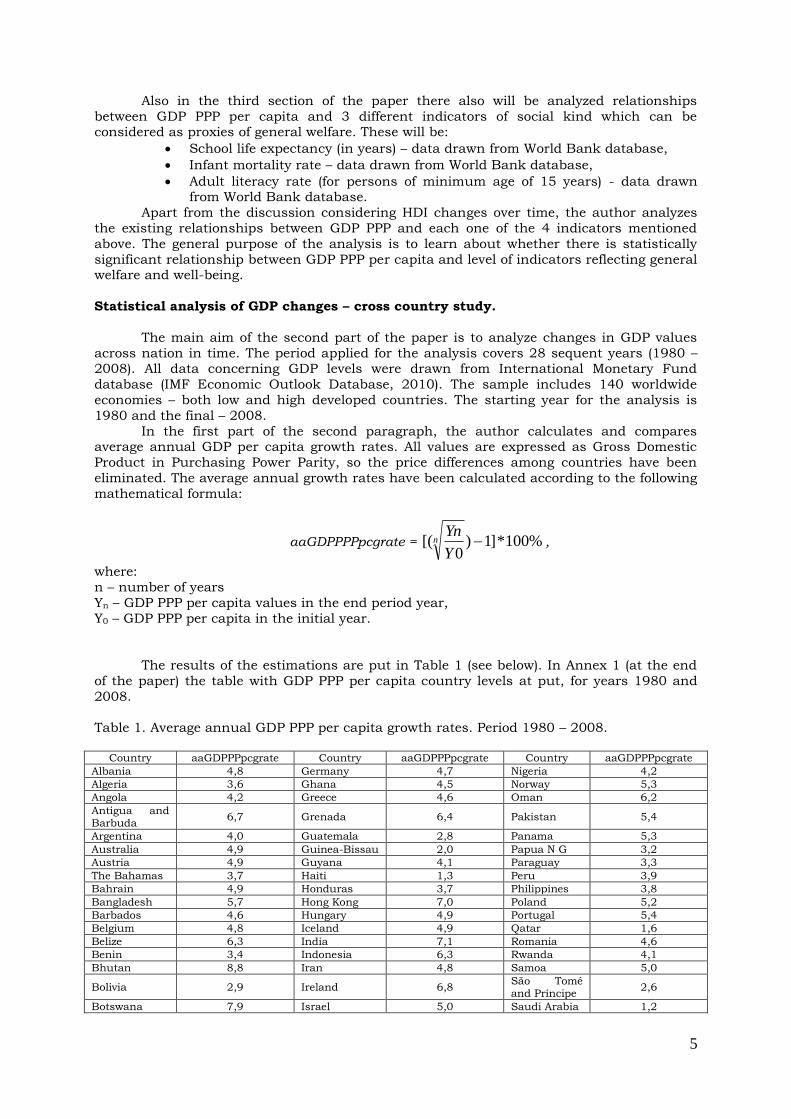
The results of the estimations are put in Table 1 (see below). In Annex 1 (at the end
of the paper) the table with GDP PPP per capita country levels at put, for years 1980 and
2008.
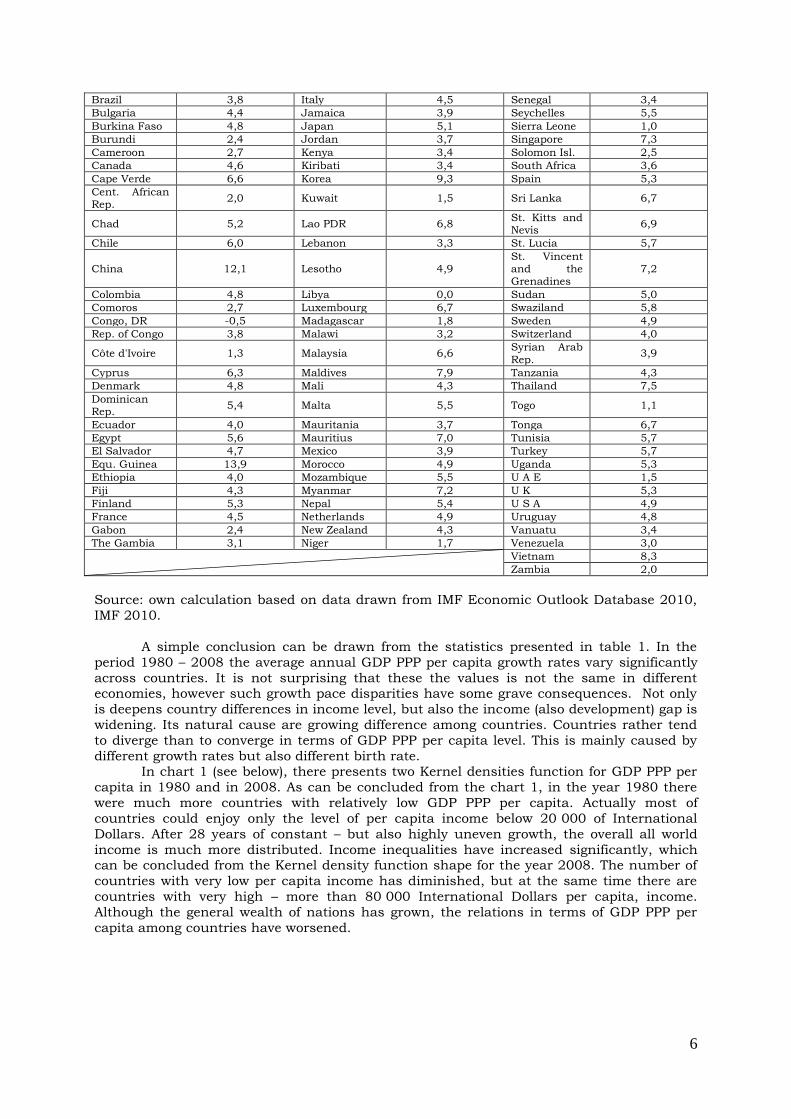
Table 1. Average annual GDP PPP per capita growth rates. Period 1980 – 2008.
Country aaGDPPPpcgrate Country aaGDPPPpcgrate Country aaGDPPPpcgrate
Albania 4,8 Germany 4,7 Nigeria 4,2
Algeria 3,6 Ghana 4,5 Norway 5,3
Angola 4,2 Greece 4,6 Oman 6,2
Antigua and Barbuda
6,7 Grenada 6,4 Pakistan 5,4
Argentina 4,0 Guatemala 2,8 Panama 5,3
Australia 4,9 Guinea-Bissau 2,0 Papua N G 3,2
Austria 4,9 Guyana 4,1 Paraguay 3,3
The Bahamas 3,7 Haiti 1,3 Peru 3,9
Bahrain 4,9 Honduras 3,7 Philippines 3,8
Bangladesh 5,7 Hong Kong 7,0 Poland 5,2
Barbados 4,6 Hungary 4,9 Portugal 5,4
Belgium 4,8 Iceland 4,9 Qatar 1,6
Belize 6,3 India 7,1 Romania 4,6
Benin 3,4 Indonesia 6,3 Rwanda 4,1
Bhutan 8,8 Iran 4,8 Samoa 5,0
Bolivia 2,9 Ireland 6,8 Săo Tomé and Príncipe
2,6
Botswana 7,9 Israel 5,0 Saudi Arabia 1,2
6
Brazil 3,8 Italy 4,5 Senegal 3,4
Bulgaria 4,4 Jamaica 3,9 Seychelles 5,5
Burkina Faso 4,8 Japan 5,1 Sierra Leone 1,0
Burundi 2,4 Jordan 3,7 Singapore 7,3
Cameroon 2,7 Kenya 3,4 Solomon Isl. 2,5
Canada 4,6 Kiribati 3,4 South Africa 3,6
Cape Verde 6,6 Korea 9,3 Spain 5,3
Cent. African Rep.
2,0 Kuwait 1,5 Sri Lanka 6,7
Chad 5,2 Lao PDR 6,8 St. Kitts and Nevis
6,9
Chile 6,0 Lebanon 3,3 St. Lucia 5,7
China 12,1 Lesotho 4,9 St. Vincent and the Grenadines
7,2
Colombia 4,8 Libya 0,0 Sudan 5,0
Comoros 2,7 Luxembourg 6,7 Swaziland 5,8
Congo, DR -0,5 Madagascar 1,8 Sweden 4,9
Rep. of Congo 3,8 Malawi 3,2 Switzerland 4,0
Côte d'Ivoire 1,3 Malaysia 6,6 Syrian Arab
Rep. 3,9
Cyprus 6,3 Maldives 7,9 Tanzania 4,3
Denmark 4,8 Mali 4,3 Thailand 7,5
Dominican Rep.
5,4 Malta 5,5 Togo 1,1
Ecuador 4,0 Mauritania 3,7 Tonga 6,7
Egypt 5,6 Mauritius 7,0 Tunisia 5,7
El Salvador 4,7 Mexico 3,9 Turkey 5,7
Equ. Guinea 13,9 Morocco 4,9 Uganda 5,3
Ethiopia 4,0 Mozambique 5,5 U A E 1,5
Fiji 4,3 Myanmar 7,2 U K 5,3
Finland 5,3 Nepal 5,4 U S A 4,9
France 4,5 Netherlands 4,9 Uruguay 4,8
Gabon 2,4 New Zealand 4,3 Vanuatu 3,4
The Gambia 3,1 Niger 1,7 Venezuela 3,0
Vietnam 8,3
Zambia 2,0
Source: own calculation based on data drawn from IMF Economic Outlook Database 2010,
IMF 2010.
A simple conclusion can be drawn from the statistics presented in table 1. In the
period 1980 – 2008 the average annual GDP PPP per capita growth rates vary significantly
across countries. It is not surprising that these the values is not the same in different economies, however such growth pace disparities have some grave consequences. Not only
is deepens country differences in income level, but also the income (also development) gap is
widening. Its natural cause are growing difference among countries. Countries rather tend
to diverge than to converge in terms of GDP PPP per capita level. This is mainly caused by
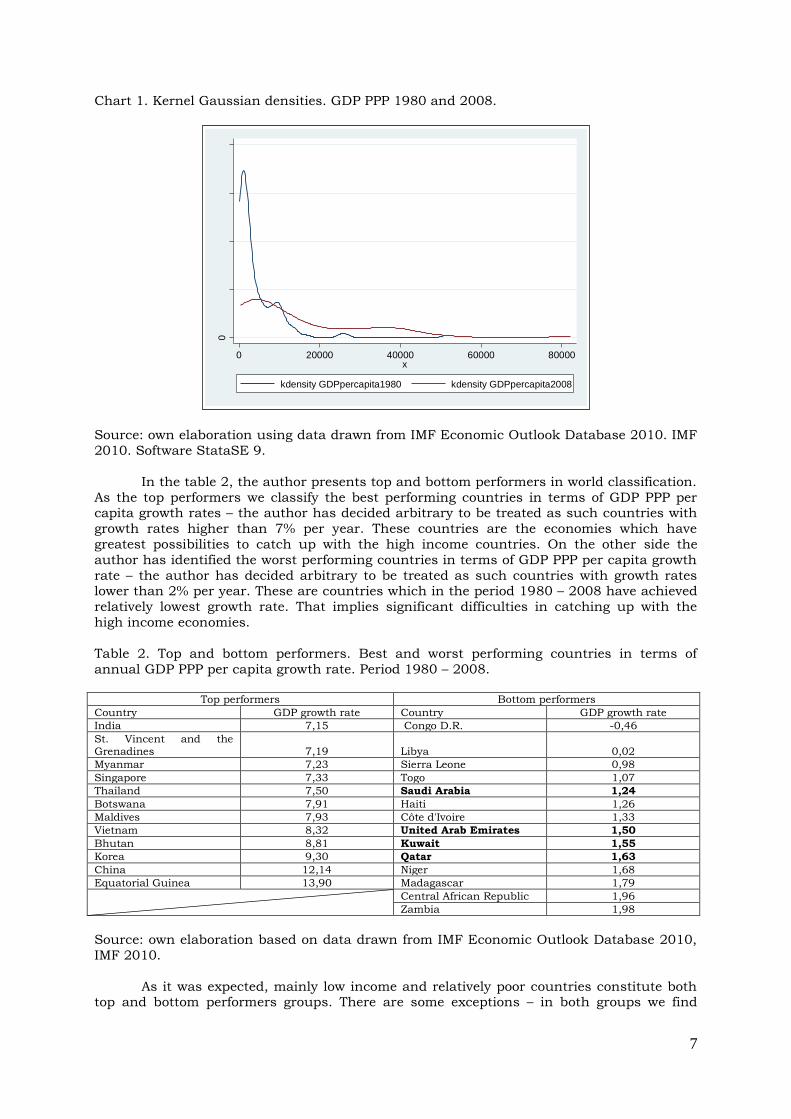
different growth rates but also different birth rate. In chart 1 (see below), there presents two Kernel densities function for GDP PPP per
capita in 1980 and in 2008. As can be concluded from the chart 1, in the year 1980 there
were much more countries with relatively low GDP PPP per capita. Actually most of
countries could enjoy only the level of per capita income below 20 000 of International
Dollars. After 28 years of constant – but also highly uneven growth, the overall all world
income is much more distributed. Income inequalities have increased significantly, which can be concluded from the Kernel density function shape for the year 2008. The number of
countries with very low per capita income has diminished, but at the same time there are
countries with very high – more than 80 000 International Dollars per capita, income.
Although the general wealth of nations has grown, the relations in terms of GDP PPP per
capita among countries have worsened.
7
Chart 1. Kernel Gaussian densities. GDP PPP 1980 and 2008.
Source: own elaboration using data drawn from IMF Economic Outlook Database 2010. IMF
2010. Software StataSE 9.
In the table 2, the author presents top and bottom performers in world classification.
As the top performers we classify the best performing countries in terms of GDP PPP per capita growth rates – the author has decided arbitrary to be treated as such countries with
growth rates higher than 7% per year. These countries are the economies which have
greatest possibilities to catch up with the high income countries. On the other side the
author has identified the worst performing countries in terms of GDP PPP per capita growth
rate – the author has decided arbitrary to be treated as such countries with growth rates lower than 2% per year. These are countries which in the period 1980 – 2008 have achieved
relatively lowest growth rate. That implies significant difficulties in catching up with the
high income economies.
Table 2. Top and bottom performers. Best and worst performing countries in terms of
annual GDP PPP per capita growth rate. Period 1980 – 2008.
Top performers Bottom performers
Country GDP growth rate Country GDP growth rate
India 7,15 Congo D.R. -0,46
St. Vincent and the Grenadines 7,19 Libya 0,02
Myanmar 7,23 Sierra Leone 0,98
Singapore 7,33 Togo 1,07
Thailand 7,50 Saudi Arabia 1,24
Botswana 7,91 Haiti 1,26
Maldives 7,93 Côte d'Ivoire 1,33
Vietnam 8,32 United Arab Emirates 1,50
Bhutan 8,81 Kuwait 1,55
Korea 9,30 Qatar 1,63
China 12,14 Niger 1,68
Equatorial Guinea 13,90 Madagascar 1,79
Central African Republic 1,96
Zambia 1,98
Source: own elaboration based on data drawn from IMF Economic Outlook Database 2010,
IMF 2010.
As it was expected, mainly low income and relatively poor countries constitute both top and bottom performers groups. There are some exceptions – in both groups we find
0
.00
00
5.0
001
.00
01
5.0
002
0 20000 40000 60000 80000x
kdensity GDPpercapita1980 kdensity GDPpercapita2008
8
some high income. These are: Saudi Arabia, United Arab Emirates, Kuwait and Qatar.
The lowest average annual GDP PPP per capita growth rate was noted in Democratic Republic of Congo – (-0,46). In fact the growth rate was negative, which means that in year
1980 (it was 372 International Dollars) the GDP PPP per capita was higher than in 2008 (it
was 327 International Dollars). As the growth rate is close to zero in the period of 28 years,
the Democratic Republic of Congo can be classified as stagnant economy. In Libya the
average annual GDP PPP per capita growth rate was also close to zero – (0,02) in the period
1980 – 2008. In 1980 the GDP PPP per capita in Libya was 13970 International Dollars and in after 28 years – in 2008 it was 14068 International Dollars. Based on such results we can
treat both countries as stagnant economies. Three of the best performing countries are:
Korea, China and Equatorial Guinea. The growth rates are astonishingly high. We must note
that all countries with such high GDP growth rates, in the year 1980 were underdeveloped
economies with relatively very low income level. Such high growth rates enable to catch up with high income countries. According to the catching up hypothesis it is not rather
surprising. In counties with very low initial income per capita level, growth rates shall be far
higher than in countries with relatively high per capita income level.
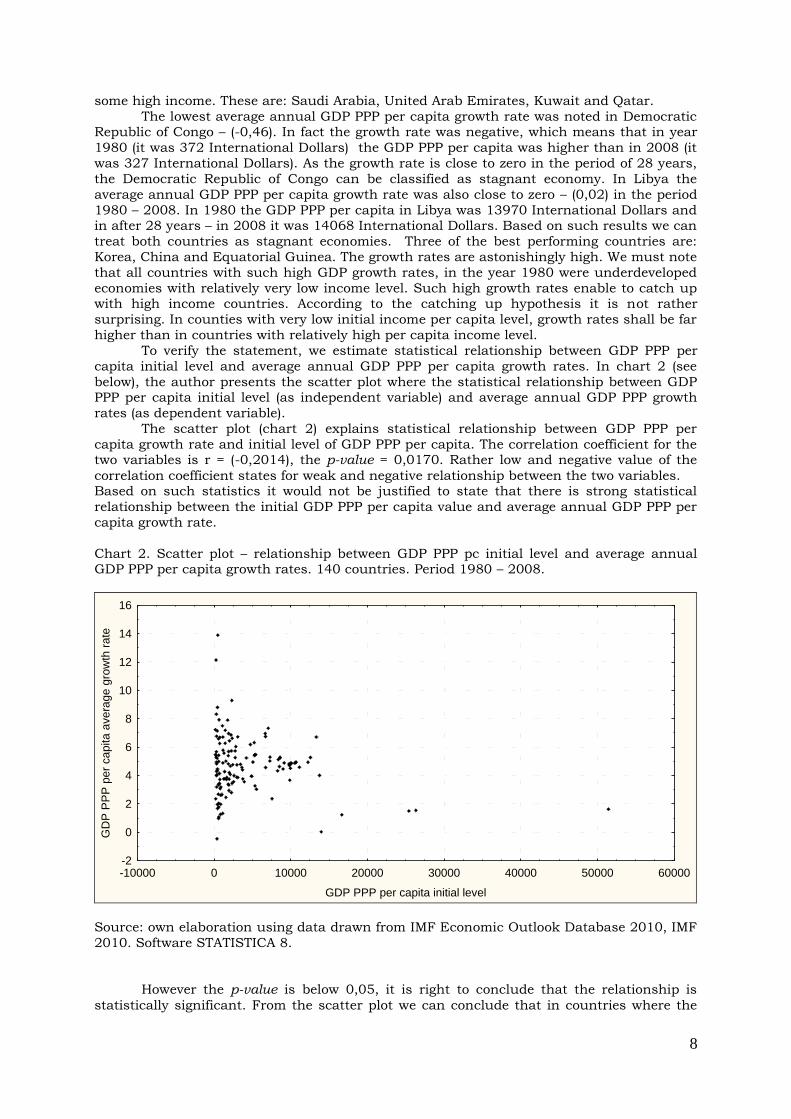
To verify the statement, we estimate statistical relationship between GDP PPP per
capita initial level and average annual GDP PPP per capita growth rates. In chart 2 (see
below), the author presents the scatter plot where the statistical relationship between GDP PPP per capita initial level (as independent variable) and average annual GDP PPP growth
rates (as dependent variable).
The scatter plot (chart 2) explains statistical relationship between GDP PPP per
capita growth rate and initial level of GDP PPP per capita. The correlation coefficient for the two variables is r = (-0,2014), the p-value = 0,0170. Rather low and negative value of the
correlation coefficient states for weak and negative relationship between the two variables. Based on such statistics it would not be justified to state that there is strong statistical
relationship between the initial GDP PPP per capita value and average annual GDP PPP per
capita growth rate.
Chart 2. Scatter plot – relationship between GDP PPP pc initial level and average annual GDP PPP per capita growth rates. 140 countries. Period 1980 – 2008.
-10000 0 10000 20000 30000 40000 50000 60000
GDP PPP per capita initial level
-2
0
2
4
6
8
10
12
14
16
GD
P P
PP
per
capita a
vera
ge g
row
th r
ate
Source: own elaboration using data drawn from IMF Economic Outlook Database 2010, IMF
2010. Software STATISTICA 8.
However the p-value is below 0,05, it is right to conclude that the relationship is
statistically significant. From the scatter plot we can conclude that in countries where the
9
GDP PPP per capita level in the year 1980 was not higher than 10 000 International Dollar,
the growth rates vary significantly. Also the higher density is observed in the countries with relatively lowest initial per capita income levels. Consequently, in countries with relatively
higher initial per capita income the growth rates are also slightly lower and not so
diversified.
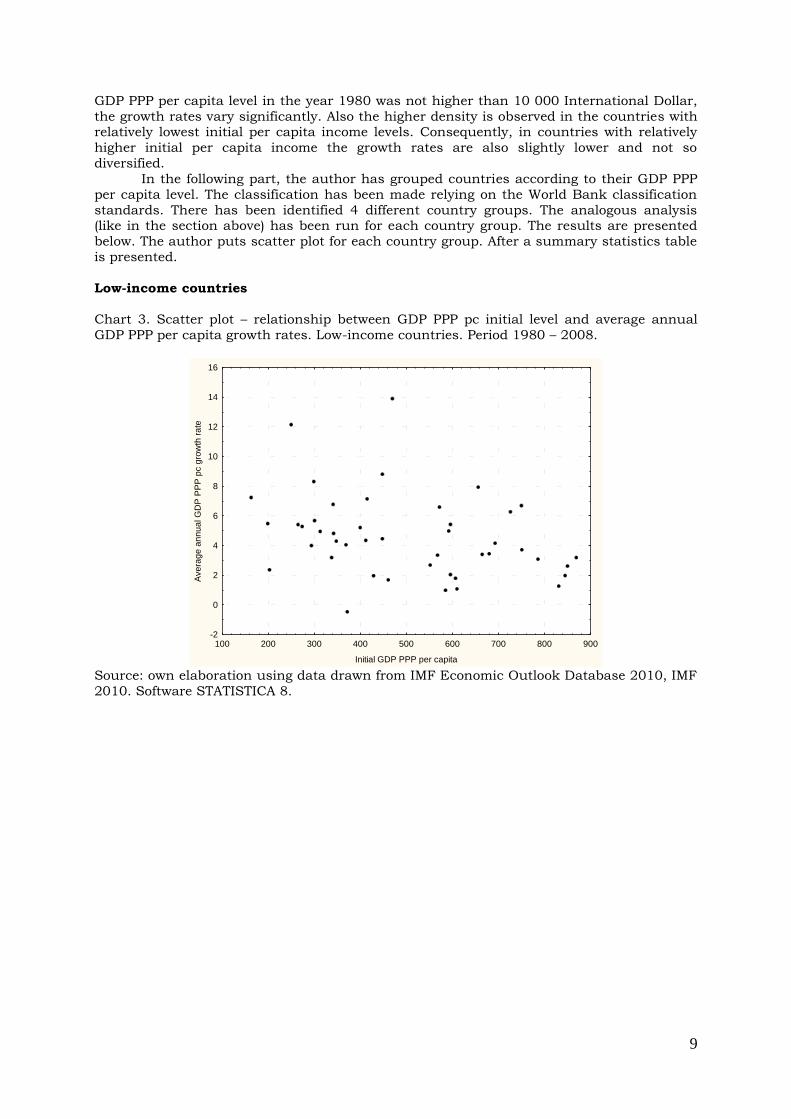
In the following part, the author has grouped countries according to their GDP PPP
per capita level. The classification has been made relying on the World Bank classification
standards. There has been identified 4 different country groups. The analogous analysis (like in the section above) has been run for each country group. The results are presented
below. The author puts scatter plot for each country group. After a summary statistics table
is presented.
Low-income countries
Chart 3. Scatter plot – relationship between GDP PPP pc initial level and average annual
GDP PPP per capita growth rates. Low-income countries. Period 1980 – 2008.
100 200 300 400 500 600 700 800 900
Initial GDP PPP per capita
-2
0
2
4
6
8
10
12
14
16
Ave
rag
e a
nn
ua
l G
DP
PP
P p
c g
row
th r
ate
Source: own elaboration using data drawn from IMF Economic Outlook Database 2010, IMF
2010. Software STATISTICA 8.
10
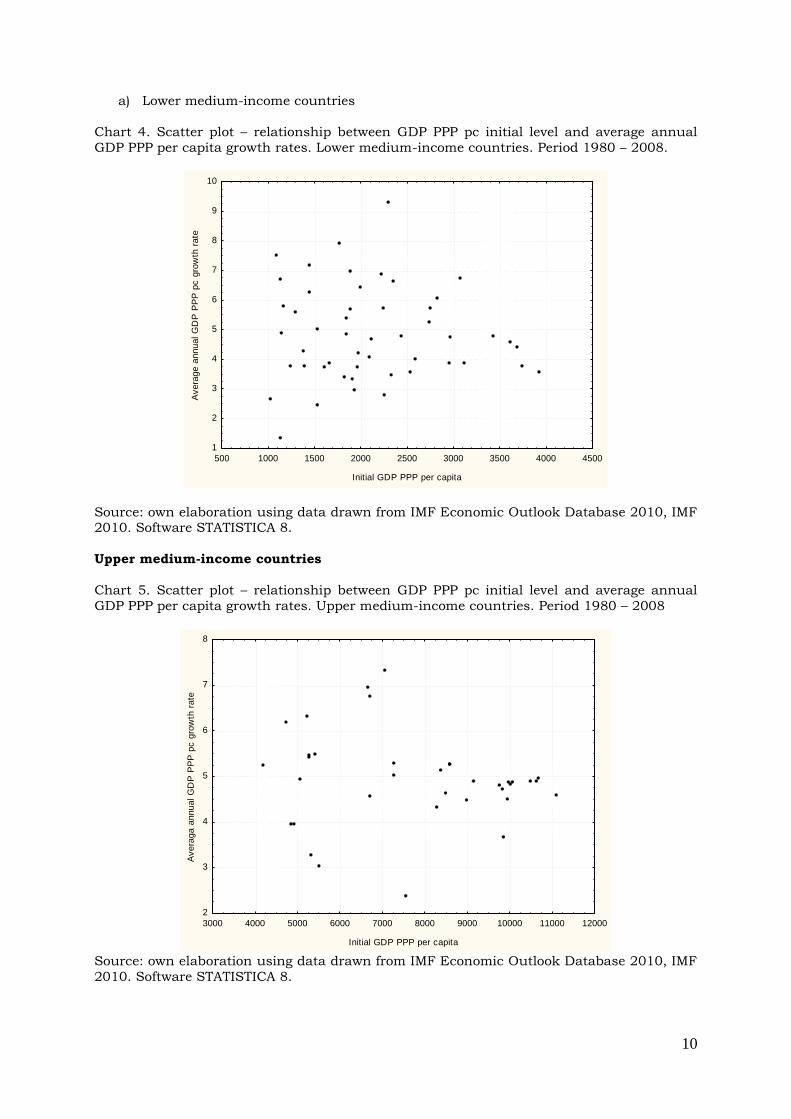
a) Lower medium-income countries
Chart 4. Scatter plot – relationship between GDP PPP pc initial level and average annual
GDP PPP per capita growth rates. Lower medium-income countries. Period 1980 – 2008.
500 1000 1500 2000 2500 3000 3500 4000 4500
Initial GDP PPP per capita
1
2
3
4
5
6
7
8
9
10
Avera
ge a
nnual G
DP
PP
P p
c g
row
th r
ate
Source: own elaboration using data drawn from IMF Economic Outlook Database 2010, IMF 2010. Software STATISTICA 8.
Upper medium-income countries
Chart 5. Scatter plot – relationship between GDP PPP pc initial level and average annual
GDP PPP per capita growth rates. Upper medium-income countries. Period 1980 – 2008
3000 4000 5000 6000 7000 8000 9000 10000 11000 12000
Initial GDP PPP per capita
2
3
4
5
6
7
8
Avera
ga a
nnual G
DP
PP
P p
c g
row
th r
ate
Source: own elaboration using data drawn from IMF Economic Outlook Database 2010, IMF
2010. Software STATISTICA 8.
11
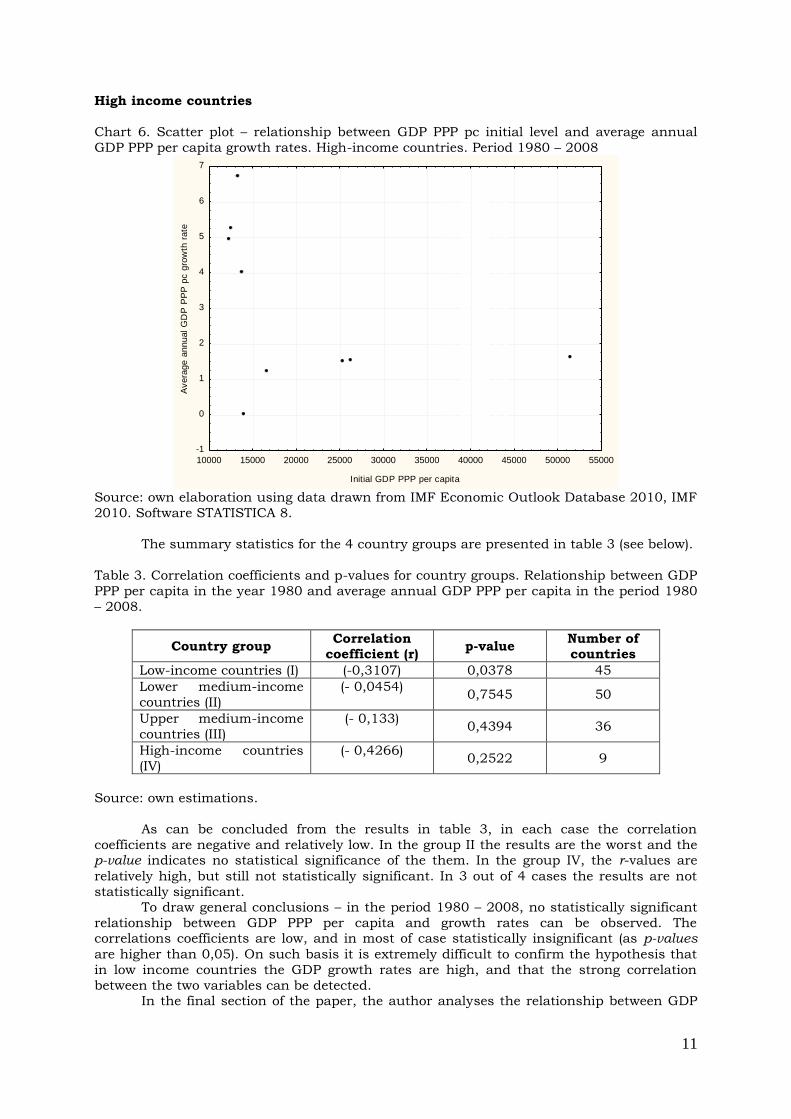
High income countries
Chart 6. Scatter plot – relationship between GDP PPP pc initial level and average annual
GDP PPP per capita growth rates. High-income countries. Period 1980 – 2008
10000 15000 20000 25000 30000 35000 40000 45000 50000 55000
Initial GDP PPP per capita
-1
0
1
2
3
4
5
6
7
Avera
ge a
nnual G
DP
PP
P p
c g
row
th r
ate
Source: own elaboration using data drawn from IMF Economic Outlook Database 2010, IMF
2010. Software STATISTICA 8.
The summary statistics for the 4 country groups are presented in table 3 (see below).
Table 3. Correlation coefficients and p-values for country groups. Relationship between GDP
PPP per capita in the year 1980 and average annual GDP PPP per capita in the period 1980
– 2008.
Country group Correlation
coefficient (r) p-value
Number of countries
Low-income countries (I) (-0,3107) 0,0378 45
Lower medium-income
countries (II)
(- 0,0454)
0,7545 50
Upper medium-income
countries (III)
(- 0,133)
0,4394 36
High-income countries
(IV)
(- 0,4266)
0,2522 9
Source: own estimations.
As can be concluded from the results in table 3, in each case the correlation
coefficients are negative and relatively low. In the group II the results are the worst and the p-value indicates no statistical significance of the them. In the group IV, the r-values are
relatively high, but still not statistically significant. In 3 out of 4 cases the results are not
statistically significant. To draw general conclusions – in the period 1980 – 2008, no statistically significant
relationship between GDP PPP per capita and growth rates can be observed. The correlations coefficients are low, and in most of case statistically insignificant (as p-values
are higher than 0,05). On such basis it is extremely difficult to confirm the hypothesis that
in low income countries the GDP growth rates are high, and that the strong correlation
between the two variables can be detected. In the final section of the paper, the author analyses the relationship between GDP
12
PPP per capita and some social indicators, as well as the Human Development Index.
GDP growth and social progress – statistical analysis
In the final section, there are presented results of statistical analysis concerning both
purely income and social progress aspects. The author verifies whether there is any
relationship between GDP PPP value (and alternatively GDP growth rates) and social
indicators, as well as Human Development Index. The author has arbitrary chosen: school life expectancy (in years), infant mortality rate, adult literacy rate (for persons of minimum
age of 15 years).
In 3 sequent charts (chart 7,8,9), there are presented results of the statistical
analysis between the three social indicators. In the table 4, the summary statistics are put.
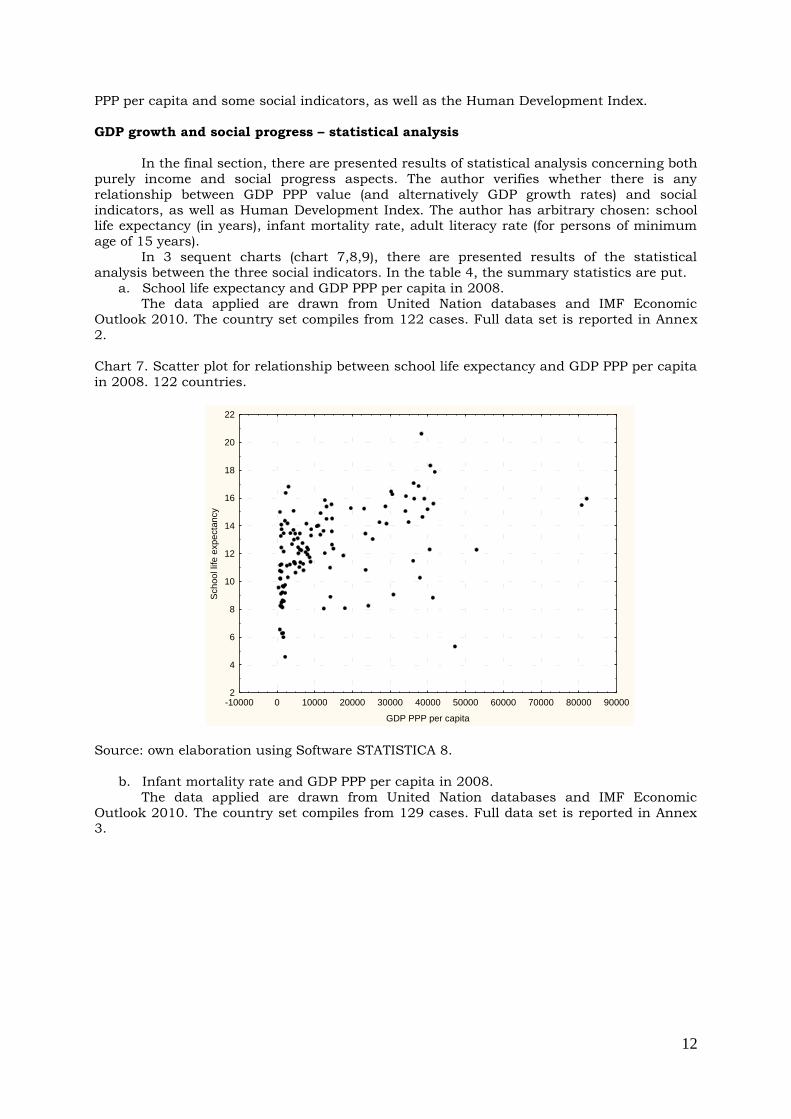
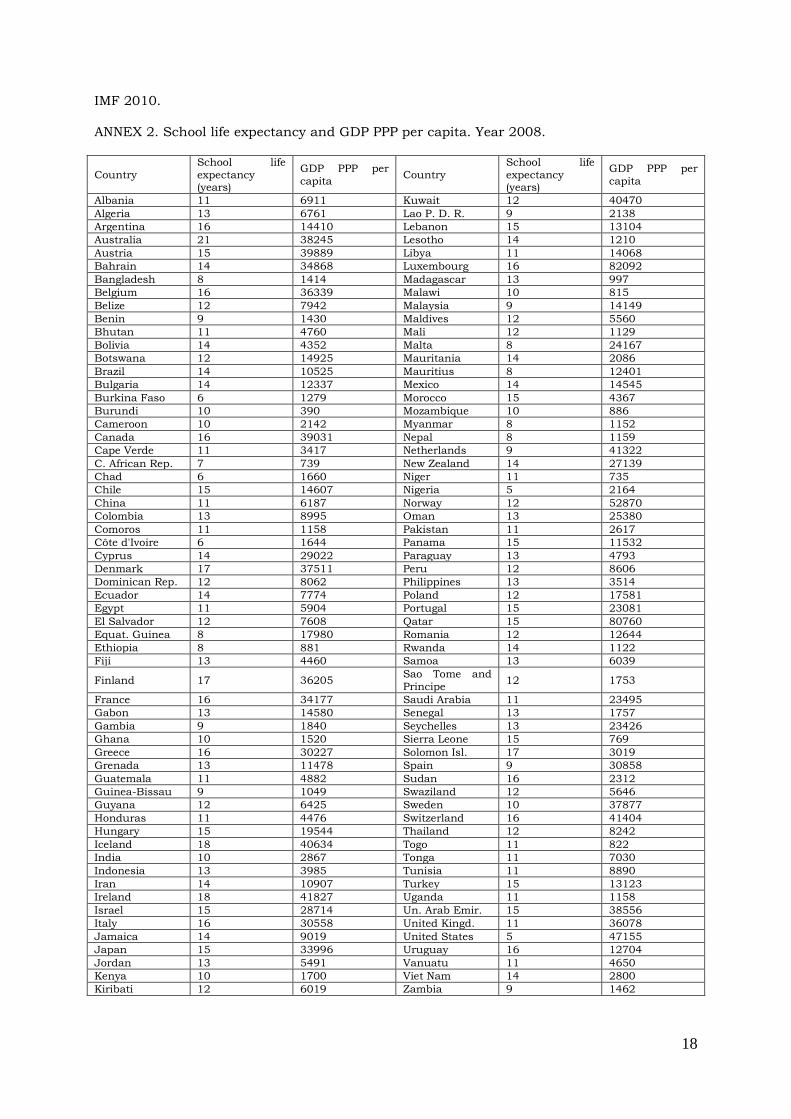
a. School life expectancy and GDP PPP per capita in 2008. The data applied are drawn from United Nation databases and IMF Economic
Outlook 2010. The country set compiles from 122 cases. Full data set is reported in Annex
2.
Chart 7. Scatter plot for relationship between school life expectancy and GDP PPP per capita
in 2008. 122 countries.
-10000 0 10000 20000 30000 40000 50000 60000 70000 80000 90000
GDP PPP per capita
2
4
6
8
10
12
14
16
18
20
22
Sch
oo
l lif
e e
xp
ecta
ncy
Source: own elaboration using Software STATISTICA 8.
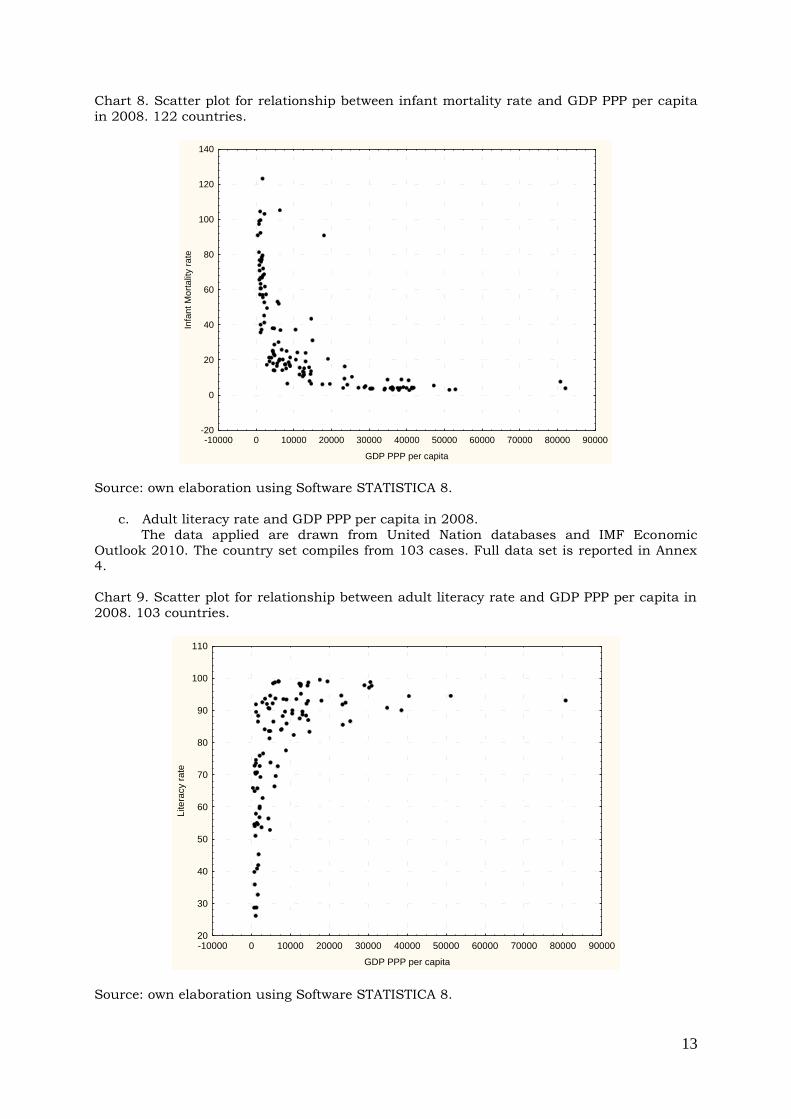
b. Infant mortality rate and GDP PPP per capita in 2008.
The data applied are drawn from United Nation databases and IMF Economic
Outlook 2010. The country set compiles from 129 cases. Full data set is reported in Annex 3.
13
Chart 8. Scatter plot for relationship between infant mortality rate and GDP PPP per capita
in 2008. 122 countries.
-10000 0 10000 20000 30000 40000 50000 60000 70000 80000 90000
GDP PPP per capita
-20
0
20
40
60
80
100
120
140
Infa
nt
Mo
rta
lity r
ate
Source: own elaboration using Software STATISTICA 8.
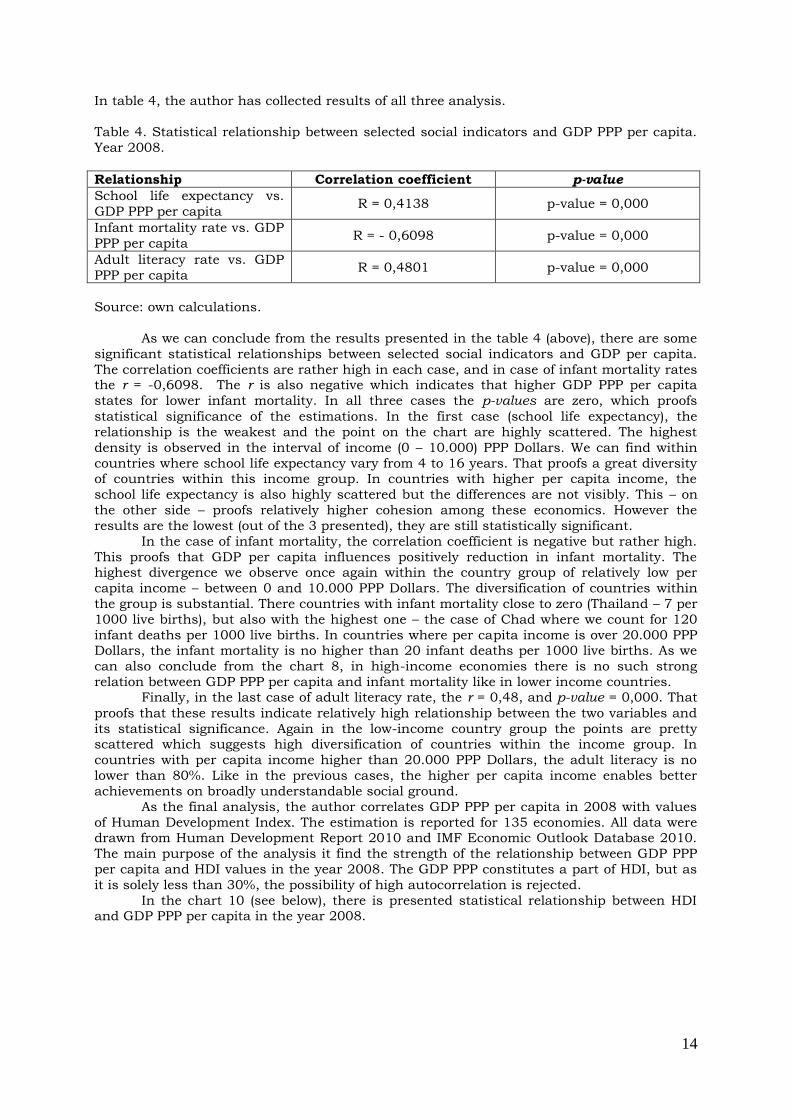
c. Adult literacy rate and GDP PPP per capita in 2008.
The data applied are drawn from United Nation databases and IMF Economic
Outlook 2010. The country set compiles from 103 cases. Full data set is reported in Annex 4.
Chart 9. Scatter plot for relationship between adult literacy rate and GDP PPP per capita in
2008. 103 countries.
-10000 0 10000 20000 30000 40000 50000 60000 70000 80000 90000
GDP PPP per capita
20
30
40
50
60
70
80
90
100
110
Lite
racy r
ate
Source: own elaboration using Software STATISTICA 8.
14
In table 4, the author has collected results of all three analysis.
Table 4. Statistical relationship between selected social indicators and GDP PPP per capita.
Year 2008.
Relationship Correlation coefficient p-value
School life expectancy vs.
GDP PPP per capita R = 0,4138 p-value = 0,000
Infant mortality rate vs. GDP
PPP per capita R = - 0,6098 p-value = 0,000
Adult literacy rate vs. GDP
PPP per capita R = 0,4801 p-value = 0,000
Source: own calculations.
As we can conclude from the results presented in the table 4 (above), there are some
significant statistical relationships between selected social indicators and GDP per capita.
The correlation coefficients are rather high in each case, and in case of infant mortality rates the r = -0,6098. The r is also negative which indicates that higher GDP PPP per capita
states for lower infant mortality. In all three cases the p-values are zero, which proofs
statistical significance of the estimations. In the first case (school life expectancy), the
relationship is the weakest and the point on the chart are highly scattered. The highest
density is observed in the interval of income (0 – 10.000) PPP Dollars. We can find within
countries where school life expectancy vary from 4 to 16 years. That proofs a great diversity of countries within this income group. In countries with higher per capita income, the
school life expectancy is also highly scattered but the differences are not visibly. This – on
the other side – proofs relatively higher cohesion among these economics. However the
results are the lowest (out of the 3 presented), they are still statistically significant.
In the case of infant mortality, the correlation coefficient is negative but rather high.
This proofs that GDP per capita influences positively reduction in infant mortality. The highest divergence we observe once again within the country group of relatively low per
capita income – between 0 and 10.000 PPP Dollars. The diversification of countries within
the group is substantial. There countries with infant mortality close to zero (Thailand – 7 per
1000 live births), but also with the highest one – the case of Chad where we count for 120
infant deaths per 1000 live births. In countries where per capita income is over 20.000 PPP Dollars, the infant mortality is no higher than 20 infant deaths per 1000 live births. As we
can also conclude from the chart 8, in high-income economies there is no such strong
relation between GDP PPP per capita and infant mortality like in lower income countries. Finally, in the last case of adult literacy rate, the r = 0,48, and p-value = 0,000. That
proofs that these results indicate relatively high relationship between the two variables and
its statistical significance. Again in the low-income country group the points are pretty scattered which suggests high diversification of countries within the income group. In
countries with per capita income higher than 20.000 PPP Dollars, the adult literacy is no
lower than 80%. Like in the previous cases, the higher per capita income enables better
achievements on broadly understandable social ground.
As the final analysis, the author correlates GDP PPP per capita in 2008 with values
of Human Development Index. The estimation is reported for 135 economies. All data were drawn from Human Development Report 2010 and IMF Economic Outlook Database 2010.
The main purpose of the analysis it find the strength of the relationship between GDP PPP
per capita and HDI values in the year 2008. The GDP PPP constitutes a part of HDI, but as
it is solely less than 30%, the possibility of high autocorrelation is rejected.
In the chart 10 (see below), there is presented statistical relationship between HDI and GDP PPP per capita in the year 2008.
15
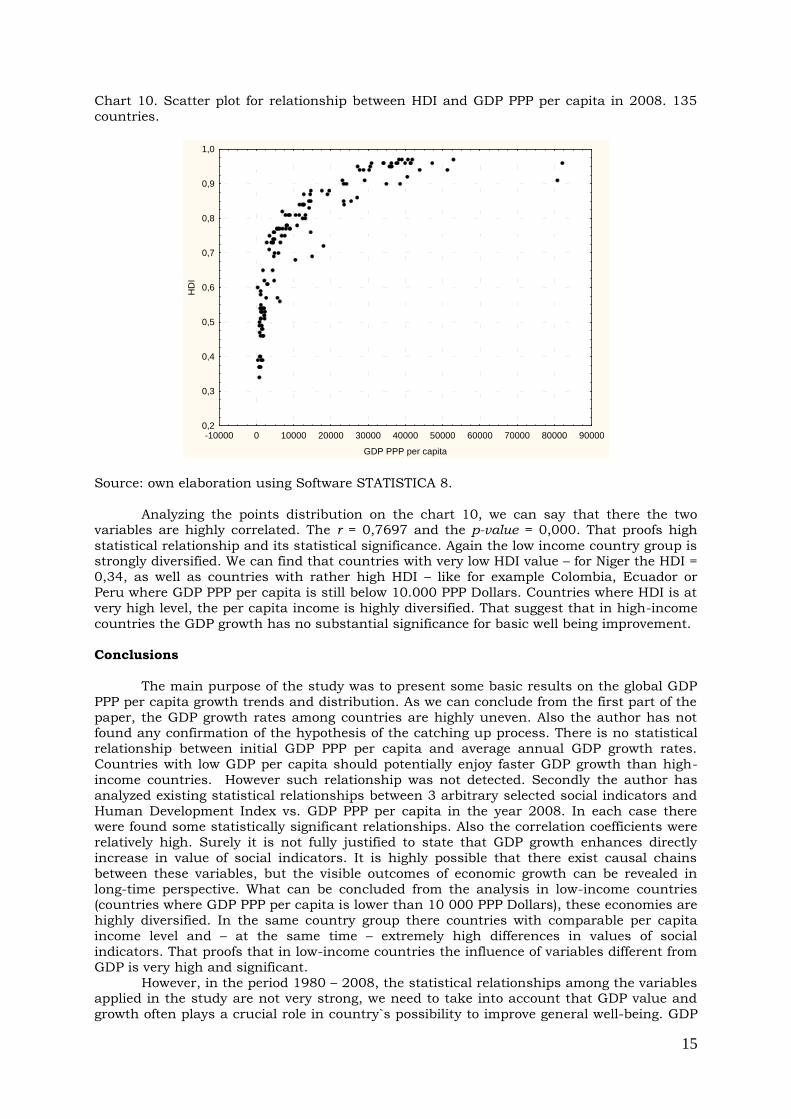
Chart 10. Scatter plot for relationship between HDI and GDP PPP per capita in 2008. 135
countries.
-10000 0 10000 20000 30000 40000 50000 60000 70000 80000 90000
GDP PPP per capita
0,2
0,3
0,4
0,5
0,6
0,7
0,8
0,9
1,0
HD
I
Source: own elaboration using Software STATISTICA 8.
Analyzing the points distribution on the chart 10, we can say that there the two variables are highly correlated. The r = 0,7697 and the p-value = 0,000. That proofs high
statistical relationship and its statistical significance. Again the low income country group is strongly diversified. We can find that countries with very low HDI value – for Niger the HDI =
0,34, as well as countries with rather high HDI – like for example Colombia, Ecuador or
Peru where GDP PPP per capita is still below 10.000 PPP Dollars. Countries where HDI is at
very high level, the per capita income is highly diversified. That suggest that in high-income
countries the GDP growth has no substantial significance for basic well being improvement.
Conclusions
The main purpose of the study was to present some basic results on the global GDP
PPP per capita growth trends and distribution. As we can conclude from the first part of the
paper, the GDP growth rates among countries are highly uneven. Also the author has not found any confirmation of the hypothesis of the catching up process. There is no statistical
relationship between initial GDP PPP per capita and average annual GDP growth rates.
Countries with low GDP per capita should potentially enjoy faster GDP growth than high-
income countries. However such relationship was not detected. Secondly the author has
analyzed existing statistical relationships between 3 arbitrary selected social indicators and
Human Development Index vs. GDP PPP per capita in the year 2008. In each case there were found some statistically significant relationships. Also the correlation coefficients were
relatively high. Surely it is not fully justified to state that GDP growth enhances directly
increase in value of social indicators. It is highly possible that there exist causal chains
between these variables, but the visible outcomes of economic growth can be revealed in
long-time perspective. What can be concluded from the analysis in low-income countries (countries where GDP PPP per capita is lower than 10 000 PPP Dollars), these economies are
highly diversified. In the same country group there countries with comparable per capita
income level and – at the same time – extremely high differences in values of social
indicators. That proofs that in low-income countries the influence of variables different from
GDP is very high and significant.
However, in the period 1980 – 2008, the statistical relationships among the variables applied in the study are not very strong, we need to take into account that GDP value and
growth often plays a crucial role in country`s possibility to improve general well-being. GDP
16
growth is perceived as a prerequisite to increase overall society`s welfare.
Comprechension Check
1) Explain how we can compare national welfare across countries.
2) Explain the role GDP growth in generating human welfare.
3) Chose two different countries – one low income and another one high income. Try to
compare their GDP growth and overall level of society`s welfare. Chose adequate variables and try to explain the differences in their level.
4) Using statistics of Penn World Tables, prepare a complete study on GDP growth over
time in as many countries as possible.
5) Learn more about the catching up hypothesis. Find and explain some statistics
according to the concept.
Recommended Readings
1) Fei C.H. John, Ranis G., (1999), Growth and development from an evolutionary
perspective, Blackwell Publishing, UK.
2) Grandville de la, Oliver, 92009), Economic growth. A unified approach. Cambrigde University Press, UK.
3) Haslam P.A., Schafer J., Beaudet P., (2009), Introduction to International
Development. Approaches, Actors and Issues, Oxford University Press, UK.
4) Mookherjee D., Ray D., (2002), Readings in the Theory of Economic Development,
Blackwell Publishing, UK. 5) Wolff N.E., (2009), Poverty and Income Distribution, Wiley-Blackwell, UK.
REFERENCES:
1. Kowalski J., (2005), Zasobowa teoria firmy, Problemy Rynku Pracy, no 2, pp. 15-25. 2. Comin D.A., Easterly W., Gong E., (2008), Was the wealth of nations determined in 1000
B.C.? Harvard Business School.
3. Fei C.H. John, Ranis G., (1999), Growth and development from an evolutionary
perspective, Blackwell Publishing, UK.
4. Grandville de la, O., (2009), Economic growth. A unified approach. Cambrigde University Press, UK.
5. Haslam P.A., Schafer J., Beaudet P., (2009), Introduction to International Development.
Approaches, Actors and Issues, Oxford University Press, UK.
6. Molina G.G., Purser M., (2010), Human Development Trends since 1970: A Social
Convergence Story, UNDP.
7. Mookherjee D., Ray D., (2002), Readings in the Theory of Economic Development, Blackwell Publishing, UK.
8. OECD (2000), A New Economy? The changing role of innovation and information
technology in growth.
9. Owen D.L., Videras J., (2008), Do all countries follow the same growth process? MPRA
Paper No. 11589.
10. Spolare E., Wacziarg R., (2008), The diffusion of development, NBER, CESInfo, CEPR. 11. Wolff N.E., (2009), Poverty and Income Distribution, Wiley-Blackwell, UK.
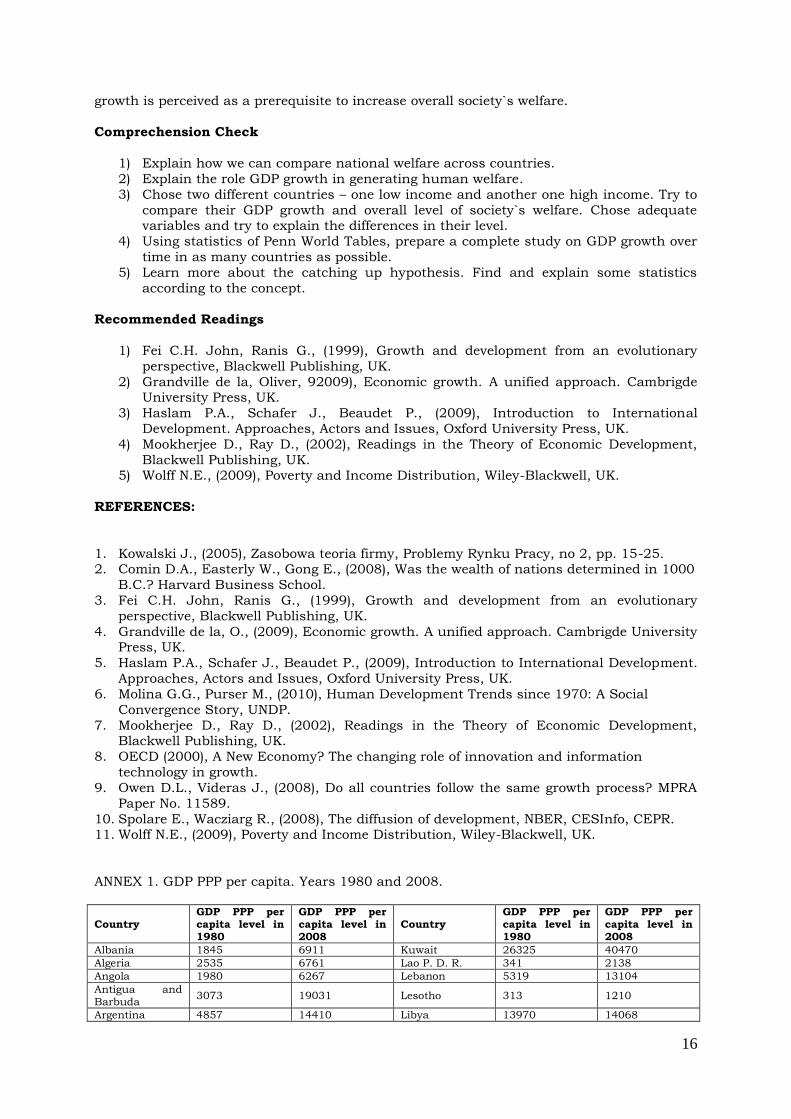
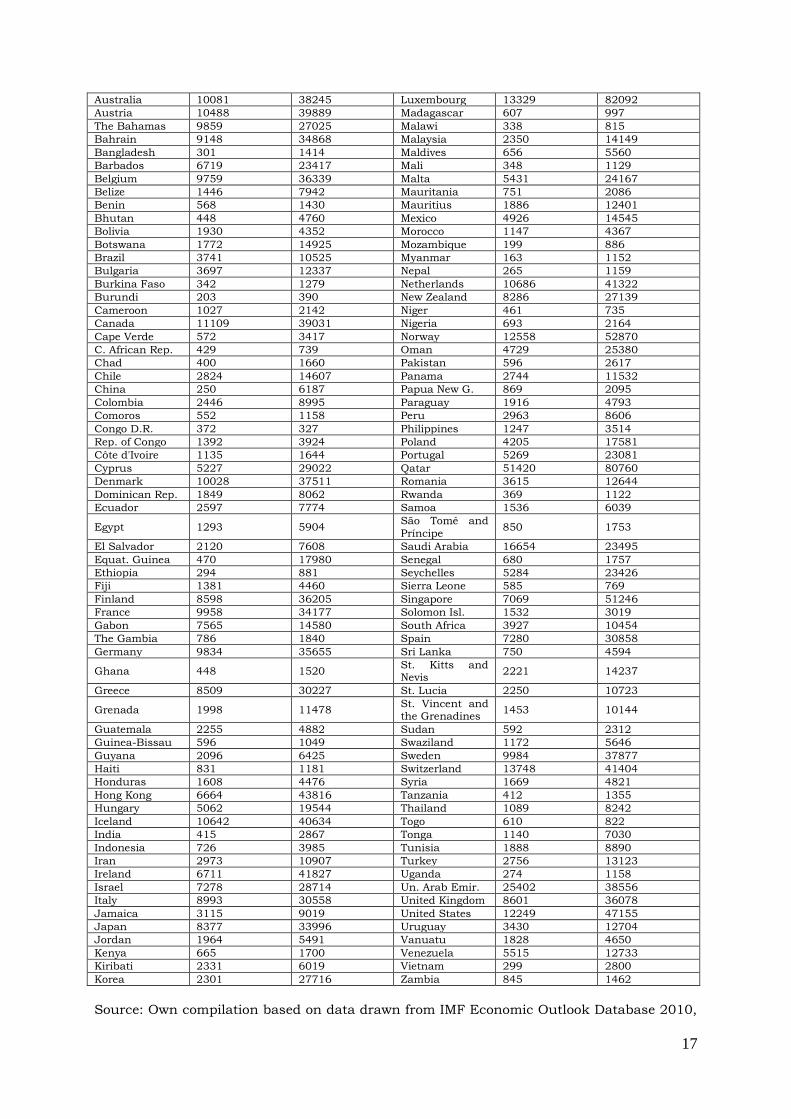
ANNEX 1. GDP PPP per capita. Years 1980 and 2008.
Country GDP PPP per capita level in 1980
GDP PPP per capita level in 2008
Country GDP PPP per capita level in 1980
GDP PPP per capita level in 2008
Albania 1845 6911 Kuwait 26325 40470
Algeria 2535 6761 Lao P. D. R. 341 2138
Angola 1980 6267 Lebanon 5319 13104
Antigua and Barbuda
3073 19031 Lesotho 313 1210
Argentina 4857 14410 Libya 13970 14068
17
Australia 10081 38245 Luxembourg 13329 82092
Austria 10488 39889 Madagascar 607 997
The Bahamas 9859 27025 Malawi 338 815
Bahrain 9148 34868 Malaysia 2350 14149
Bangladesh 301 1414 Maldives 656 5560
Barbados 6719 23417 Mali 348 1129
Belgium 9759 36339 Malta 5431 24167
Belize 1446 7942 Mauritania 751 2086
Benin 568 1430 Mauritius 1886 12401
Bhutan 448 4760 Mexico 4926 14545
Bolivia 1930 4352 Morocco 1147 4367
Botswana 1772 14925 Mozambique 199 886
Brazil 3741 10525 Myanmar 163 1152
Bulgaria 3697 12337 Nepal 265 1159
Burkina Faso 342 1279 Netherlands 10686 41322
Burundi 203 390 New Zealand 8286 27139
Cameroon 1027 2142 Niger 461 735
Canada 11109 39031 Nigeria 693 2164
Cape Verde 572 3417 Norway 12558 52870
C. African Rep. 429 739 Oman 4729 25380
Chad 400 1660 Pakistan 596 2617
Chile 2824 14607 Panama 2744 11532
China 250 6187 Papua New G. 869 2095
Colombia 2446 8995 Paraguay 1916 4793
Comoros 552 1158 Peru 2963 8606
Congo D.R. 372 327 Philippines 1247 3514
Rep. of Congo 1392 3924 Poland 4205 17581
Côte d'Ivoire 1135 1644 Portugal 5269 23081
Cyprus 5227 29022 Qatar 51420 80760
Denmark 10028 37511 Romania 3615 12644
Dominican Rep. 1849 8062 Rwanda 369 1122
Ecuador 2597 7774 Samoa 1536 6039
Egypt 1293 5904 Săo Tomé and
Príncipe 850 1753
El Salvador 2120 7608 Saudi Arabia 16654 23495
Equat. Guinea 470 17980 Senegal 680 1757
Ethiopia 294 881 Seychelles 5284 23426
Fiji 1381 4460 Sierra Leone 585 769
Finland 8598 36205 Singapore 7069 51246
France 9958 34177 Solomon Isl. 1532 3019
Gabon 7565 14580 South Africa 3927 10454
The Gambia 786 1840 Spain 7280 30858
Germany 9834 35655 Sri Lanka 750 4594
Ghana 448 1520 St. Kitts and Nevis
2221 14237
Greece 8509 30227 St. Lucia 2250 10723
Grenada 1998 11478 St. Vincent and the Grenadines
1453 10144
Guatemala 2255 4882 Sudan 592 2312
Guinea-Bissau 596 1049 Swaziland 1172 5646
Guyana 2096 6425 Sweden 9984 37877
Haiti 831 1181 Switzerland 13748 41404
Honduras 1608 4476 Syria 1669 4821
Hong Kong 6664 43816 Tanzania 412 1355
Hungary 5062 19544 Thailand 1089 8242
Iceland 10642 40634 Togo 610 822
India 415 2867 Tonga 1140 7030
Indonesia 726 3985 Tunisia 1888 8890
Iran 2973 10907 Turkey 2756 13123
Ireland 6711 41827 Uganda 274 1158
Israel 7278 28714 Un. Arab Emir. 25402 38556
Italy 8993 30558 United Kingdom 8601 36078
Jamaica 3115 9019 United States 12249 47155
Japan 8377 33996 Uruguay 3430 12704
Jordan 1964 5491 Vanuatu 1828 4650
Kenya 665 1700 Venezuela 5515 12733
Kiribati 2331 6019 Vietnam 299 2800
Korea 2301 27716 Zambia 845 1462
Source: Own compilation based on data drawn from IMF Economic Outlook Database 2010,
18
IMF 2010.
ANNEX 2. School life expectancy and GDP PPP per capita. Year 2008.
Country
School life
expectancy (years)
GDP PPP per
capita Country
School life
expectancy (years)
GDP PPP per
capita
Albania 11 6911 Kuwait 12 40470
Algeria 13 6761 Lao P. D. R. 9 2138
Argentina 16 14410 Lebanon 15 13104
Australia 21 38245 Lesotho 14 1210
Austria 15 39889 Libya 11 14068
Bahrain 14 34868 Luxembourg 16 82092
Bangladesh 8 1414 Madagascar 13 997
Belgium 16 36339 Malawi 10 815
Belize 12 7942 Malaysia 9 14149
Benin 9 1430 Maldives 12 5560
Bhutan 11 4760 Mali 12 1129
Bolivia 14 4352 Malta 8 24167
Botswana 12 14925 Mauritania 14 2086
Brazil 14 10525 Mauritius 8 12401
Bulgaria 14 12337 Mexico 14 14545
Burkina Faso 6 1279 Morocco 15 4367
Burundi 10 390 Mozambique 10 886
Cameroon 10 2142 Myanmar 8 1152
Canada 16 39031 Nepal 8 1159
Cape Verde 11 3417 Netherlands 9 41322
C. African Rep. 7 739 New Zealand 14 27139
Chad 6 1660 Niger 11 735
Chile 15 14607 Nigeria 5 2164
China 11 6187 Norway 12 52870
Colombia 13 8995 Oman 13 25380
Comoros 11 1158 Pakistan 11 2617
Côte d'Ivoire 6 1644 Panama 15 11532
Cyprus 14 29022 Paraguay 13 4793
Denmark 17 37511 Peru 12 8606
Dominican Rep. 12 8062 Philippines 13 3514
Ecuador 14 7774 Poland 12 17581
Egypt 11 5904 Portugal 15 23081
El Salvador 12 7608 Qatar 15 80760
Equat. Guinea 8 17980 Romania 12 12644
Ethiopia 8 881 Rwanda 14 1122
Fiji 13 4460 Samoa 13 6039
Finland 17 36205 Sao Tome and
Principe 12 1753
France 16 34177 Saudi Arabia 11 23495
Gabon 13 14580 Senegal 13 1757
Gambia 9 1840 Seychelles 13 23426
Ghana 10 1520 Sierra Leone 15 769
Greece 16 30227 Solomon Isl. 17 3019
Grenada 13 11478 Spain 9 30858
Guatemala 11 4882 Sudan 16 2312
Guinea-Bissau 9 1049 Swaziland 12 5646
Guyana 12 6425 Sweden 10 37877
Honduras 11 4476 Switzerland 16 41404
Hungary 15 19544 Thailand 12 8242
Iceland 18 40634 Togo 11 822
India 10 2867 Tonga 11 7030
Indonesia 13 3985 Tunisia 11 8890
Iran 14 10907 Turkey 15 13123
Ireland 18 41827 Uganda 11 1158
Israel 15 28714 Un. Arab Emir. 15 38556
Italy 16 30558 United Kingd. 11 36078
Jamaica 14 9019 United States 5 47155
Japan 15 33996 Uruguay 16 12704
Jordan 13 5491 Vanuatu 11 4650
Kenya 10 1700 Viet Nam 14 2800
Kiribati 12 6019 Zambia 9 1462
19
Source: Own compilation based on data drawn from IMF Economic Outlook Database 2010,
and United Nation database.
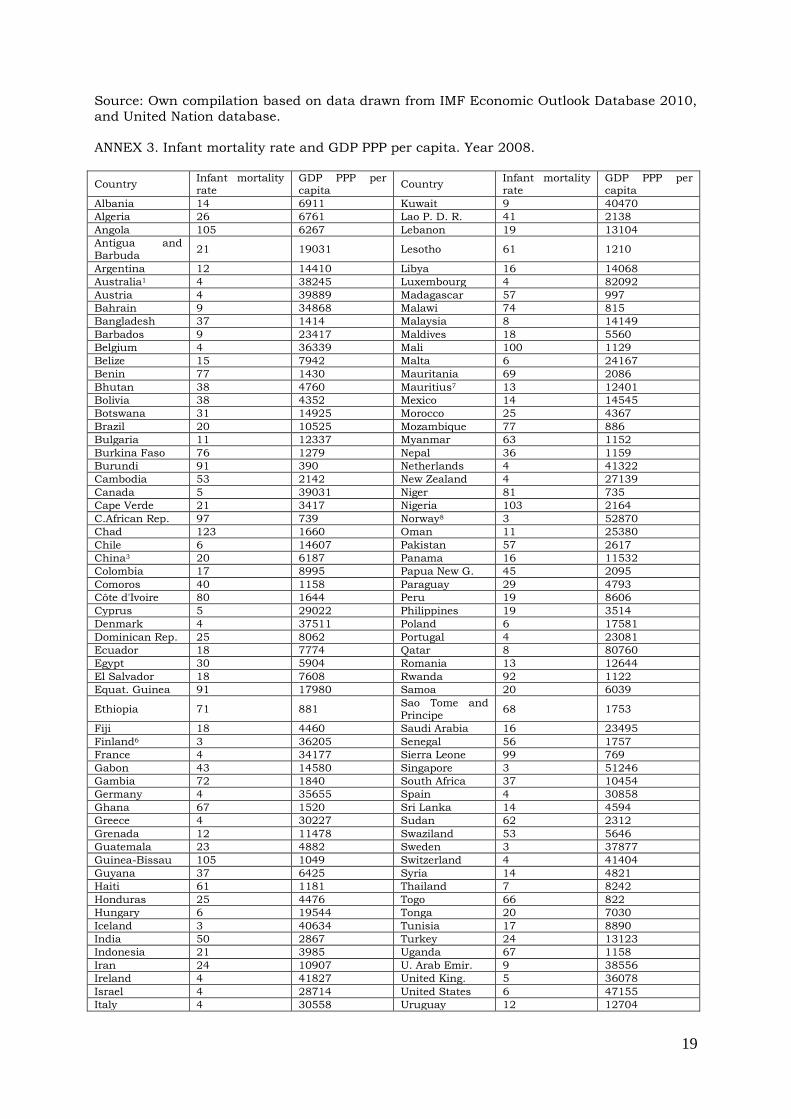
ANNEX 3. Infant mortality rate and GDP PPP per capita. Year 2008.
Country Infant mortality rate
GDP PPP per capita
Country Infant mortality rate
GDP PPP per capita
Albania 14 6911 Kuwait 9 40470
Algeria 26 6761 Lao P. D. R. 41 2138
Angola 105 6267 Lebanon 19 13104
Antigua and Barbuda
21 19031 Lesotho 61 1210
Argentina 12 14410 Libya 16 14068
Australia1 4 38245 Luxembourg 4 82092
Austria 4 39889 Madagascar 57 997
Bahrain 9 34868 Malawi 74 815
Bangladesh 37 1414 Malaysia 8 14149
Barbados 9 23417 Maldives 18 5560
Belgium 4 36339 Mali 100 1129
Belize 15 7942 Malta 6 24167
Benin 77 1430 Mauritania 69 2086
Bhutan 38 4760 Mauritius7 13 12401
Bolivia 38 4352 Mexico 14 14545
Botswana 31 14925 Morocco 25 4367
Brazil 20 10525 Mozambique 77 886
Bulgaria 11 12337 Myanmar 63 1152
Burkina Faso 76 1279 Nepal 36 1159
Burundi 91 390 Netherlands 4 41322
Cambodia 53 2142 New Zealand 4 27139
Canada 5 39031 Niger 81 735
Cape Verde 21 3417 Nigeria 103 2164
C.African Rep. 97 739 Norway8 3 52870
Chad 123 1660 Oman 11 25380
Chile 6 14607 Pakistan 57 2617
China3 20 6187 Panama 16 11532
Colombia 17 8995 Papua New G. 45 2095
Comoros 40 1158 Paraguay 29 4793
Côte d'Ivoire 80 1644 Peru 19 8606
Cyprus 5 29022 Philippines 19 3514
Denmark 4 37511 Poland 6 17581
Dominican Rep. 25 8062 Portugal 4 23081
Ecuador 18 7774 Qatar 8 80760
Egypt 30 5904 Romania 13 12644
El Salvador 18 7608 Rwanda 92 1122
Equat. Guinea 91 17980 Samoa 20 6039
Ethiopia 71 881 Sao Tome and Principe
68 1753
Fiji 18 4460 Saudi Arabia 16 23495
Finland6 3 36205 Senegal 56 1757
France 4 34177 Sierra Leone 99 769
Gabon 43 14580 Singapore 3 51246
Gambia 72 1840 South Africa 37 10454
Germany 4 35655 Spain 4 30858
Ghana 67 1520 Sri Lanka 14 4594
Greece 4 30227 Sudan 62 2312
Grenada 12 11478 Swaziland 53 5646
Guatemala 23 4882 Sweden 3 37877
Guinea-Bissau 105 1049 Switzerland 4 41404
Guyana 37 6425 Syria 14 4821
Haiti 61 1181 Thailand 7 8242
Honduras 25 4476 Togo 66 822
Hungary 6 19544 Tonga 20 7030
Iceland 3 40634 Tunisia 17 8890
India 50 2867 Turkey 24 13123
Indonesia 21 3985 Uganda 67 1158
Iran 24 10907 U. Arab Emir. 9 38556
Ireland 4 41827 United King. 5 36078
Israel 4 28714 United States 6 47155
Italy 4 30558 Uruguay 12 12704
20
Jamaica 21 9019 Vanuatu 23 4650
Japan 3 33996 Venezuela 15 12733
Jordan 17 5491 Viet Nam 17 2800
Kenya 57 1700 Zambia 78 1462
Kiribati 52 6019
Source: Own compilation based on data drawn from IMF Economic Outlook Database 2010,
and United Nation database.
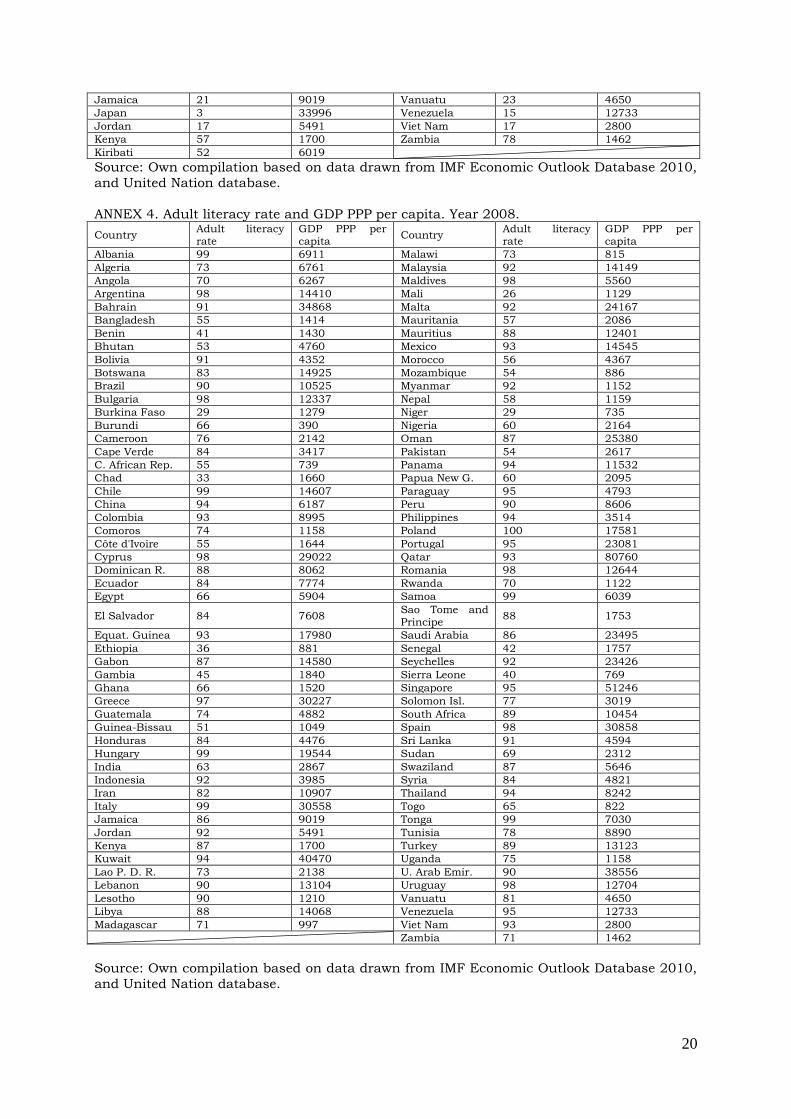
ANNEX 4. Adult literacy rate and GDP PPP per capita. Year 2008.
Country Adult literacy rate
GDP PPP per capita
Country Adult literacy rate
GDP PPP per capita
Albania 99 6911 Malawi 73 815
Algeria 73 6761 Malaysia 92 14149
Angola 70 6267 Maldives 98 5560
Argentina 98 14410 Mali 26 1129
Bahrain 91 34868 Malta 92 24167
Bangladesh 55 1414 Mauritania 57 2086
Benin 41 1430 Mauritius 88 12401
Bhutan 53 4760 Mexico 93 14545
Bolivia 91 4352 Morocco 56 4367
Botswana 83 14925 Mozambique 54 886
Brazil 90 10525 Myanmar 92 1152
Bulgaria 98 12337 Nepal 58 1159
Burkina Faso 29 1279 Niger 29 735
Burundi 66 390 Nigeria 60 2164
Cameroon 76 2142 Oman 87 25380
Cape Verde 84 3417 Pakistan 54 2617
C. African Rep. 55 739 Panama 94 11532
Chad 33 1660 Papua New G. 60 2095
Chile 99 14607 Paraguay 95 4793
China 94 6187 Peru 90 8606
Colombia 93 8995 Philippines 94 3514
Comoros 74 1158 Poland 100 17581
Côte d'Ivoire 55 1644 Portugal 95 23081
Cyprus 98 29022 Qatar 93 80760
Dominican R. 88 8062 Romania 98 12644
Ecuador 84 7774 Rwanda 70 1122
Egypt 66 5904 Samoa 99 6039
El Salvador 84 7608 Sao Tome and Principe
88 1753
Equat. Guinea 93 17980 Saudi Arabia 86 23495
Ethiopia 36 881 Senegal 42 1757
Gabon 87 14580 Seychelles 92 23426
Gambia 45 1840 Sierra Leone 40 769
Ghana 66 1520 Singapore 95 51246
Greece 97 30227 Solomon Isl. 77 3019
Guatemala 74 4882 South Africa 89 10454
Guinea-Bissau 51 1049 Spain 98 30858
Honduras 84 4476 Sri Lanka 91 4594
Hungary 99 19544 Sudan 69 2312
India 63 2867 Swaziland 87 5646
Indonesia 92 3985 Syria 84 4821
Iran 82 10907 Thailand 94 8242
Italy 99 30558 Togo 65 822
Jamaica 86 9019 Tonga 99 7030
Jordan 92 5491 Tunisia 78 8890
Kenya 87 1700 Turkey 89 13123
Kuwait 94 40470 Uganda 75 1158
Lao P. D. R. 73 2138 U. Arab Emir. 90 38556
Lebanon 90 13104 Uruguay 98 12704
Lesotho 90 1210 Vanuatu 81 4650
Libya 88 14068 Venezuela 95 12733
Madagascar 71 997 Viet Nam 93 2800
Zambia 71 1462
Source: Own compilation based on data drawn from IMF Economic Outlook Database 2010,
and United Nation database.
21
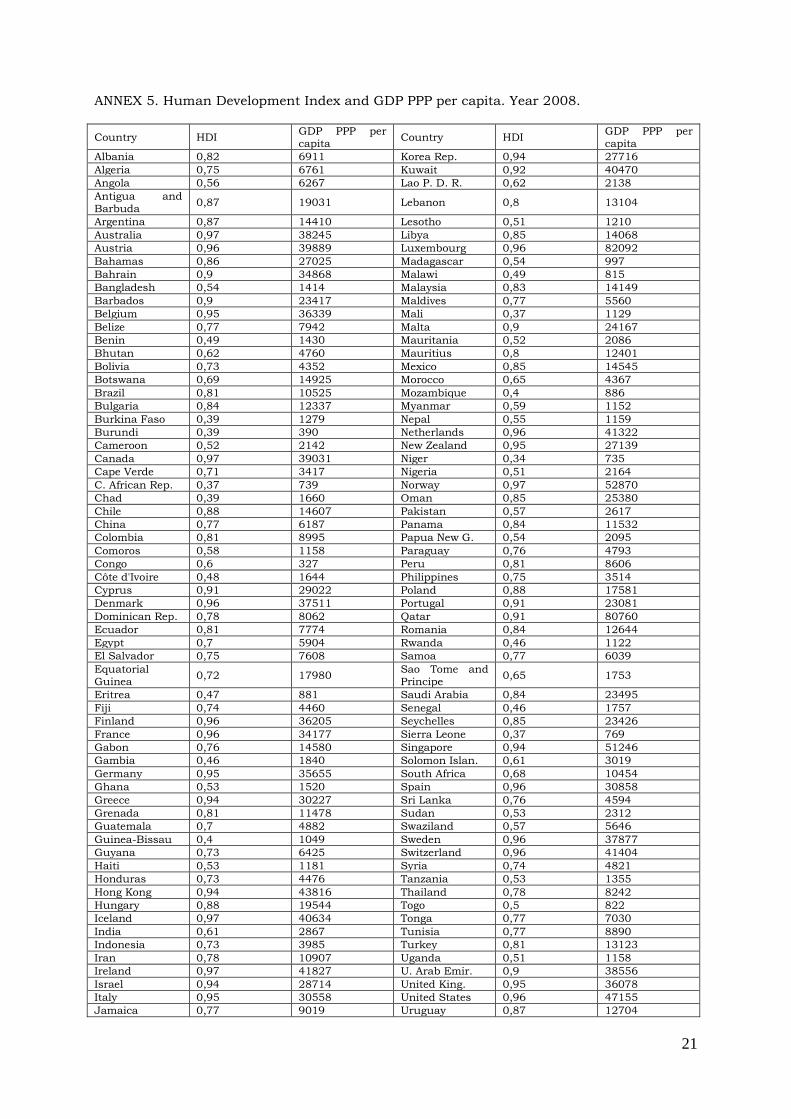
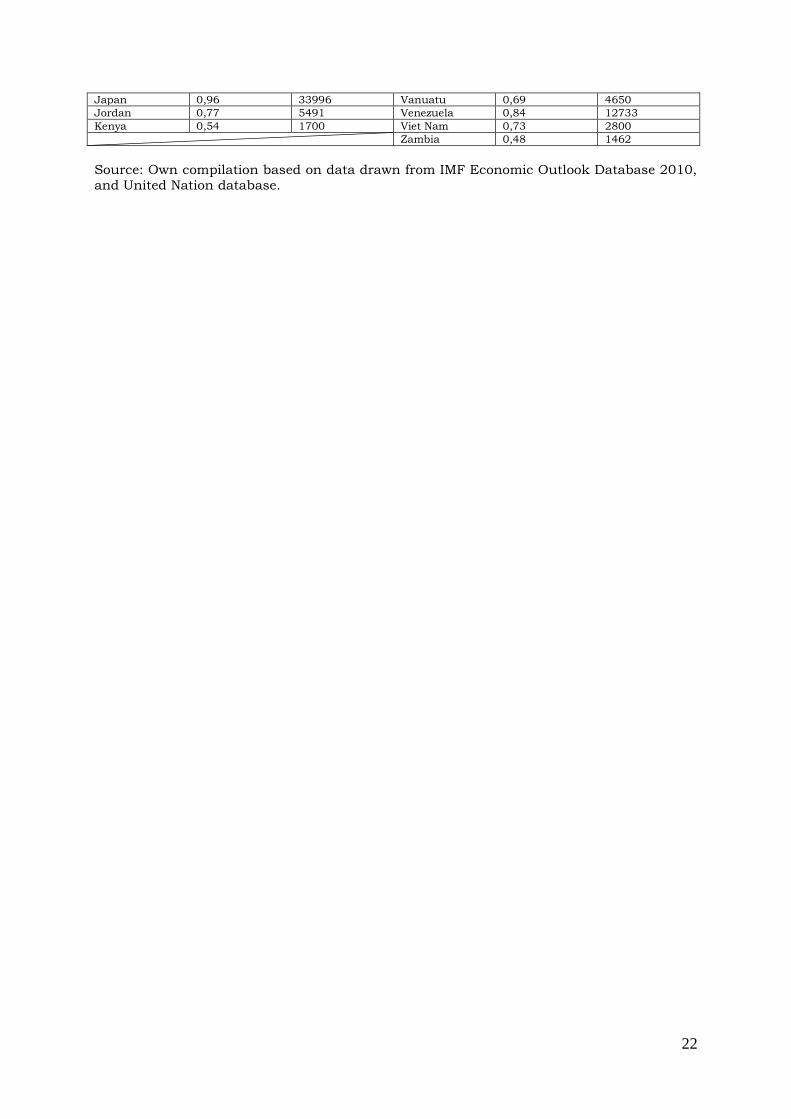
ANNEX 5. Human Development Index and GDP PPP per capita. Year 2008.
Country HDI GDP PPP per capita
Country HDI GDP PPP per capita
Albania 0,82 6911 Korea Rep. 0,94 27716
Algeria 0,75 6761 Kuwait 0,92 40470
Angola 0,56 6267 Lao P. D. R. 0,62 2138
Antigua and Barbuda
0,87 19031 Lebanon 0,8 13104
Argentina 0,87 14410 Lesotho 0,51 1210
Australia 0,97 38245 Libya 0,85 14068
Austria 0,96 39889 Luxembourg 0,96 82092
Bahamas 0,86 27025 Madagascar 0,54 997
Bahrain 0,9 34868 Malawi 0,49 815
Bangladesh 0,54 1414 Malaysia 0,83 14149
Barbados 0,9 23417 Maldives 0,77 5560
Belgium 0,95 36339 Mali 0,37 1129
Belize 0,77 7942 Malta 0,9 24167
Benin 0,49 1430 Mauritania 0,52 2086
Bhutan 0,62 4760 Mauritius 0,8 12401
Bolivia 0,73 4352 Mexico 0,85 14545
Botswana 0,69 14925 Morocco 0,65 4367
Brazil 0,81 10525 Mozambique 0,4 886
Bulgaria 0,84 12337 Myanmar 0,59 1152
Burkina Faso 0,39 1279 Nepal 0,55 1159
Burundi 0,39 390 Netherlands 0,96 41322
Cameroon 0,52 2142 New Zealand 0,95 27139
Canada 0,97 39031 Niger 0,34 735
Cape Verde 0,71 3417 Nigeria 0,51 2164
C. African Rep. 0,37 739 Norway 0,97 52870
Chad 0,39 1660 Oman 0,85 25380
Chile 0,88 14607 Pakistan 0,57 2617
China 0,77 6187 Panama 0,84 11532
Colombia 0,81 8995 Papua New G. 0,54 2095
Comoros 0,58 1158 Paraguay 0,76 4793
Congo 0,6 327 Peru 0,81 8606
Côte d'Ivoire 0,48 1644 Philippines 0,75 3514
Cyprus 0,91 29022 Poland 0,88 17581
Denmark 0,96 37511 Portugal 0,91 23081
Dominican Rep. 0,78 8062 Qatar 0,91 80760
Ecuador 0,81 7774 Romania 0,84 12644
Egypt 0,7 5904 Rwanda 0,46 1122
El Salvador 0,75 7608 Samoa 0,77 6039
Equatorial Guinea
0,72 17980 Sao Tome and Principe
0,65 1753
Eritrea 0,47 881 Saudi Arabia 0,84 23495
Fiji 0,74 4460 Senegal 0,46 1757
Finland 0,96 36205 Seychelles 0,85 23426
France 0,96 34177 Sierra Leone 0,37 769
Gabon 0,76 14580 Singapore 0,94 51246
Gambia 0,46 1840 Solomon Islan. 0,61 3019
Germany 0,95 35655 South Africa 0,68 10454
Ghana 0,53 1520 Spain 0,96 30858
Greece 0,94 30227 Sri Lanka 0,76 4594
Grenada 0,81 11478 Sudan 0,53 2312
Guatemala 0,7 4882 Swaziland 0,57 5646
Guinea-Bissau 0,4 1049 Sweden 0,96 37877
Guyana 0,73 6425 Switzerland 0,96 41404
Haiti 0,53 1181 Syria 0,74 4821
Honduras 0,73 4476 Tanzania 0,53 1355
Hong Kong 0,94 43816 Thailand 0,78 8242
Hungary 0,88 19544 Togo 0,5 822
Iceland 0,97 40634 Tonga 0,77 7030
India 0,61 2867 Tunisia 0,77 8890
Indonesia 0,73 3985 Turkey 0,81 13123
Iran 0,78 10907 Uganda 0,51 1158
Ireland 0,97 41827 U. Arab Emir. 0,9 38556
Israel 0,94 28714 United King. 0,95 36078
Italy 0,95 30558 United States 0,96 47155
Jamaica 0,77 9019 Uruguay 0,87 12704
22
Japan 0,96 33996 Vanuatu 0,69 4650
Jordan 0,77 5491 Venezuela 0,84 12733
Kenya 0,54 1700 Viet Nam 0,73 2800
Zambia 0,48 1462
Source: Own compilation based on data drawn from IMF Economic Outlook Database 2010, and United Nation database.
Related Documents