Agricultural Economics Report No. 172 Economic Effects of Added Growing Season Rainfall on North Dakota Agriculture LeRoy W. Schaffner Jerome E. Johnson Harvey G. Vruegdenhil John W. Enz Department of Agricultural Economics Agricultural Experiment Station North Dakota State University Fargo, North Dakota 58105-5636 July 1983

Welcome message from author
This document is posted to help you gain knowledge. Please leave a comment to let me know what you think about it! Share it to your friends and learn new things together.
Transcript

Agricultural Economics Report No. 172
Economic Effects ofAdded Growing Season Rainfallon North Dakota Agriculture
LeRoy W. SchaffnerJerome E. JohnsonHarvey G. VruegdenhilJohn W. Enz
Department of Agricultural EconomicsAgricultural Experiment StationNorth Dakota State University
Fargo, North Dakota 58105-5636
July 1983

Acknowledgements
Weather modification continues to be of strong interest to North Dakota farmers andranchers. This second report presents a current analysis of expected economic effects ofadded growing season on North Dakota agriculture and the state economy. Hail patternsand economic effects are still being studied.
This project is partially funded by the North Daktoa Weather Modification Board and bythe North Dakota University Agricultural Experiment Station.
The authors appreciate the editing and reviewer comments of William S. Ball, ExtensionAgronomist; Department of Agricultural Economics staff members Roger Johnson andWilliam Nelson. Randall Coon, Agricultural Economics Research Assistant, did the In-put/Output computer analysis.
Possible negative effects of added growing season rainfall were not analyzed in thisstudy. The previous report (Inter-disciplinary "ARE" Research Team, 1974) reviewedstudies to date; few negative effects have been identified or evaluated in detail.
Table of Contents
Page
Section 1. The Setting for the Economic Analysis . . . . . . . . . . .
Section 2. Added Direct Returns to Agriculture for the Four Farming Areas 6
Western Farming Area . . . . . . . . . . . .. . . . .West Central Area . . . . . . . . . . . . . . . . . . .East Central Area . . . . . . . . . . . . . . . . . . .Red River Valley Area . . . . . . . . . . . . . . . . .
Section 3. Total Impact of Added Growing Season RainfallDakota Economy . . . . . . . . . . . . . . . . . . . .
Total Economic Impact on Western Farming Area . . . . .Total Economic Impact on West Central Farming Area . .Total Economic Impact on East Central Farming Area . .Total Economic Impact on Red River Valley Farming AreaTotal Impact on State Economy . . . . . . . . . . . . .
on the North. . . . . . . .0
References . . . . . . . . . . . . . . . . . . . . . . . . . . . . .0
Appendix . . . . . . . . . . . . . . . . . . . . . . . . . . . . . . .
Western Area . . . . . . . . . . . . . . . . . . . .West Central Area . . . . . . . . . . . . . . . . . . .East Central Area . . . . . . . . . . . . . . . . . .Red River Valley . . . . . . . . . . . . . . . . . .
2
6789
10
1212121313
15
16
17181818
. . . . . . . .
40
0
.*
.*
.*
.*
.*
.*
.*
.*
.*
.
.*
.*

ECONOMIC EFFECTS OF ADDED GROWING SEASONRAINFALL ON NORTH DAKOTA AGRICULTURE
LeRoy W. Schaffner, Jerome E. Johnson,Harvey G. Vreugdenhil , and John Enz*
Farmers in North Dakota have been interested in weather modification toincrease precipitation since the drought of the 1930s and going as far back asthe 1800s. Knowledge has been accumulated on the operational procedures formodifying weather but little has been done on results and effects on society.This second economic study used rainfall increase models developed in otherstudies to analyze the current economic effects on four farming areas and thestate as a whole.
The report is divided into three sections. The first reviews theamount of added growing season rainfall that a total well managed cloudseeding program might produce, presents expected changes in crop/forageyields, and summarizes the land resources of each of the four farming areas.
The second section presents the resources and organization ofagriculture in each farming area under "normal" and added growing seasonrainfall and develops an estimate of added direct returns to agriculture withmore growing season rainfall.
The final section completes the economic analysis by examining thetotal impact of the added direct returns to agriculture on the state'seconomy. Input/output analysis is used to measure the impacts of added directreturns on the various sectors of the economy and the total impacts of addedgrowing season rainfall. The appendix presents an alternative way of studyingthe economic effects within the four farming areas by creating a represen-tative farm in each area.
The study has five goals:
1. To measure the dollar values of direct benefits to farmers andranchers of added growing season rainfall;
2. To determine needed enterprise adjustments by farmers and ranchersbecause of increased rainfall;
3. To measure total added direct benefits to the four farming areasand to the state;
4. To examine enterprise shifts within farming areas due to addedgrowing season rainfall;
5. To measure the total impact of added growing season rainfall onthe state economy.
*Schaffner and Johnson are Professors, Vreugdenhil isResearch Associate, Department of Agricultural Economics; and Enz is AssociateProfessor, Department of Soil Science.

-2
Section 1. The Setting for the Economic Analysis
The analysis is based on four farming areas as shown in Figure 1. Theanalysis treats a farming area as one large farm. Data on a typical farm foreach farming area are shown in the Appendix.
The rainfall increases were based on the Illinois State Water SurveyRainfall Increase Model B (1947), calculated for a 50-year period for 40climatic stations in North Dakota for June, July, and August. Severalrainfall models were evaluated to simulate the probable change in rainfallamounts and distribution due to cloud seeding. The models take into accountthat (a) the amount of rainfall increase by cloud seeding depends principallyupon the nature and physics of the clouds being seeded, (b) the presence ofcloud types in the past may be represented by the recorded 24-hour amounts ofrainfall that fell, and (c) proportionately more rain may be produced fromseeding smaller cloud systems than from more intensive storms. Thesehypotheses are based on results of various cloud seeding experiments andoriginally were suggested by Changnon and Huff of the Illinois State WaterSurvey (1971).
It was assumed that all storms would be seeded and the results forstations in each farming area were averaged and are given in Figure 1.
Figure 1. Average Added Growing Season Rainfall in Inches by Farming AreasUsing Illinois State Water Survey Rainfall Increase Model B

- 3-
Increased rainfall for short-term growing crops, such as small grains, wouldrange from 0.83 inch in the Western farming area to 0.80 inch in the Red RiverValley farming area. The longer-term increase, June through August, wouldrange from 1.17 inches in the West Central farming area to 1.13 inches in theRed River Valley farming area.
Expected yield increases resulting from the added growing seasonrainfall are given in Table 1. The yield increases were based on the NorthDakota State University Added Rainfall Effects Study (1974). Sunflower yieldsfor Western and West Central farming areas have been added since this cashcrop has become important in both areas.
TABLE 1. EXPECTED YIELD INCREASES DUE TO ADDED GROWING SEASON RAINFALLIN FOUR FARMING AREAS IN NORTH DAKOTA, PER HARVESTED ACRE
West East Red RiverCrop Unit Western Central Central Valley
Wheata bu. 2.25 2.2 1.7 1.4Barleya bu. 2.08 2.3 2.4 2.0Oatsa bu. 2.91 4.1 3.2 2.4Flaxa bu. 0.50 1.6 1.3 1.0
Corn Grainb bu. 3.17 4.1 3.5 2.8Corn Silageb ton 0.58 0.8 0.6 0.45SunflowerD Ibs. 156 158 139 136Alfalfa Ha b,c Ibs. 317 350 319 339Native Haybc lbs. 69 82 93 dNative Pastureb,c Ibs. 115 140 151 dTame Pastureb,c Ibs. 230 233 232 226Deferred Native
Pastureb,c 1bs. 115 140 151 dSoybeansb bu. d d d 1.7Sugarbeetsb ton d d d 1.1Potatoesb cwt. d d d 15.8
ajune-July added rainfall was used in calculating yield increase.bJune-August added rainfall was used in calculating yield increase.cDry matter basis.dNot applicable.
Land resources of the four farming areas are presented in Table 2. Thesedata were used to create the land resources for the farm for each of the fourfarming areas. The maximum number of acres of each crop that could be grownare shown in Table 2. These maximums were derived by using the five-yearaverage (1977-1981) of actual acreages grown. Acreage limitations were put inthe models to prevent one crop from being produced to the extent that itsproduction could be large enough to affect the marketing and pricing of thatcrop.

TABLE 2. AGRICULTURAL LAND RESOURCES BY FOUR FARMING AREAS OF NORTH DAKOTA, 1977-1981
West East Red River NorthItem Western Central Central Valley Dakota
--------------------------------- acres--------------------
Total Land in Farmsa
CroplandaNative PastureaNative HayaFarmstead and Wastea
Number of Farmsa
Average Farm Sizea
Average 1977-81 Acres of:b
15,232,276
7,696,4566,678,335
191,795665,690
11,298
1,348
10,570,682
7,008,5682,525,781
419,653616,680
10,889
971
11,229,118
8,834,2051,438,959216,446739,508
12,057
931
4,993,287
4,410,032249,06640,246293,943
42,025,363
27,949,26110,892,141
868,1402,315,821
6,925
721
41,169
1,021
WheatBarleyOatsFlaxCornSunflowerSoybeansPotatoesSugarbeetsDry Edible BeansAlfalfa HaySummer Fallow
2,834,000168,700438,00025,0809,300
136,580
680,1202,548,200
2,836,380359,100447,780217,98014,420
329,380
522,7601,766,800
3,410,960966,120317,540175,980127,640
1,237,54015,440
87,880374,640
1,536,000
1,562,400704,080100,68038,960184,000654,500184,380119,200141,120163,62587,880
365,000
10,643,7402,198,0001,304,000458,000335,360
2,358,000199,820119,200141,120222,450
1,665,4006,216,000
aUnited States Department of Commerce, Bureau of the Census, 1978 Census of Agriculture, North Dakota,Vol . 1, Part 34, Washington, D.C., July 1981.
bNorth Dakota Crop and Livestock Statistics, Annual Summaries for 1978 through 1982.

- 5-
The data for each farming area in Table 2 show two outstandingdifferences: (1) the proportion of cropland to total farmland and (2) theproportion of cropland in summer fallow. The ratio of cropland to totalacreage increases from 50 percent in the Western area to 88 percent in the RedRiver Valley area. The amount of land in summer fallow decreases from west toeast in the state. About 33 percent of the cropland in the Western area was insummer fallow compared to only 8 percent in the Red River Valley area.
Linear programming was the tool used to select the most profitable farmenterprise plan using "normal" rainfall, and then with added growing seasonrainfall. Linear programming is an empirical tool by which the one optimumfarm plan can be selected from among many alternative plans. It is amathematical procedure which can quickly select the most profitable plan.
Prices used for the crops and livestock products of each farming areawere the 1977 to 1981 averages of prices received by farmers (North Dakota Cropand Livestock Statistics, 1978 to 1982) and are listed in Table 3. Theseprices may be different from the prices prevailing today, but this does notinvalidate the results. The relationship of prices to one another and toproduction costs are more important than a given level. The 1977 to 1981period also was used for the costs of inputs. The five-year average was longenough to smooth out variations in prices received and paid by farmers.
TABLE 3. PRODUCT PRICES USED IN THE ECONOMIC ANALYSIS OF ADDED GROWING SEASONRAINFALL BY FOUR FARMING AREAS
Red RiverProduct Unit Western West Central East Central Valley
Wheat bu. 3.18 3.23 3.31 3.31Malting Barley bu. 2.16 2.18Feed Barley bu. 1.89 1.98Oats bu. 1.38 1.31 1.32 1.31Flax bu. 5.88 6.03 6.03 6.00Sunflower cwt. 10.10 10.35 10.40 10.40Corn Grain bu. 2.26 2.24 2.26 2.25Soybeans bu. 6.20Dry Edible Beans cwt. 19.35Potatoes cwt. 4.00Sugarbeets ton 28.50Beef Cow cwt. 38.00 38.00 38.00 38.00Calves cwt. 70.00 70.00 70.00 70.00600 Ib. Yearling cwt. 63.90 63.90 63.90 63.90800 Ilb. Yearling cwt. 58.60 58.60 58.60 58.60700 Ilb. Yearling
Off Pasture cwt. 62.00 62.00 62.00 62.00
The yields used were county averages per planted acre reported by theNorth Dakota Crop and Livestock Reporting Service. These yields also wereaveraged for the years 1977 to 1981.

- 6 -
Crop and livestock enterprises most common to each farming area werethe alternatives the linear programming model could select from. However,dairy, sheep, hogs, and beef finishing were not included. Sugarbeets,soybeans, potatoes, and dry edible beans were only included in the Red RiverValley area. In general there were 17 crop and 31 livestock enterprisesincluded in the linear programming model . There were 11 basic livestockenterprises with several alternative types of rations that could be used. Thebasic livestock enterprises included beef cows-selling calves, beefcows-backgroundingl calves to 600 and 800 pounds, beef cows-selling yearlingsoff pasture, and buy yearlings in the spring and pasturing over the summermonths and selling in the fall.
Labor was restricted primarily to the operators and their families.However, a labor hiring activity was included in which labor could be hired at$3.75 per hour.
The economic analysis assumed no change in cultural practics for cropsgrown as rainfall was increased. A five-year study reported by Conlon et al.(1974) indicated that no change in tillage on summer fallow was requireTForthe addition of 1 to 2 inches of rainfall over the growing season. Costs offertilizer and harvesting were adjusted to compensate for increased yields.
Section 2. Added Direct Returns to Agriculturefor the Four Farming Areas
This section reports the results of the linear programming models foreach farming area. These results present the most profitable combination ofresources used in each area as well as the returns over direct costs. Theresults will be discussed for each farming area.
The initial economic analysis determined the most profitable combinationof crops and acreages for each farming area and the level of returns overdirect or variable costs under "normal" rainfall . Then the increases in cropand forage yields due to added rainfall were entered into the analysis. Theoptimal resource combinations and levels of returns were recalculated for theadded growing season rainfall situations. The cost of cloud seeding, at $0.10per acre, was deducted from returns in each case.
Western Farming Area
Under "normal" rainfall the optimum use of the land resources would bewheat after fallow, wheat after crop, flax, sunflower, corn grain, corn silage,and alfalfa hay (Table 4). There were 3,353 hours of labor hired. Thelivestock enterprises consisted of beef cows-backgrounding calves to 600 poundsand beef cows-backgrounding calves to 800 pounds. Returns over variable costsfor the Western area under "normal" rainfall were $270 million or an average of$18.56 per acre.
1Backgrounding is a short-term or "warm-up" feeding period prior toentry into the finishing feedlot. In general, calves fed from weaning, orabout 400 pounds, to 550 to 800 pound weights are referred to as backgroundedfeeders.

-7
TABLE 4. CROP AND LIVESTOCK ENTERPRISE PLANS FOR THE WESTERN AND WEST CENTRALFARMING AREAS UNDER "NORMAL" AND ADDED RAINFALL SITUATIONS, NORTH DAKOTA
Western Area West Central AreaNormal Added Normal Added
Item Unit Rainfall Rainfall Rainfall Rainfall
Wheat After Fallow acres 2,450,000 2,450,000 1,766,800 1,766,800Wheat After Crop acres 181,285 176,123Barley After Crop acres 560,518 547,006Flax After Crop acres 384,823 384,823 350,430 350,430Sunflower After Crop acres 1,285,308 1,285,308 1,168,095 1,168,095Corn Grain acres 59,278 60,400 1,079,440 1,069,923Corn Silage acres 341,913 333,847Corn Feed Grain acres 152,954 159,898 88,655 98,172Alfalfa Hay acres 390,895 396,057 227,830 241,342Native Hay acres 191,795 191,795 245,721 290,916Native Pasture acres 6,678,335 6,678,335 2,525,781 2,525,781Beef Cow-Backgrounding
Calf 6004 number 288,129 362,605Beef Cow-Backgrounding
Calf 8004 number 142,731 142,731 190,481 225,516Spring Labor Hired hours 3,353 527,506
Return OverVariable Cost dollars 270,350,591 324,759,285 333,808,143 383,120,524
Gaina dollars 52,952,035 48,316,981
aCloud seeding cost of $0.10 per acre was deducted.
The results of linear programming of the farm resources with increasedgrowing season rainfall also are shown in Table 4. The same combination offarm enterprises was selected but some crop acreages changed. Wheat after cropacreage was reduced 5,162 acres, which went to increase the alfalfa hay acreage.Corn silage was reduced 8,066 acres, which shifted to producing more corn grain.The beef cow-backgrounding calves to 600 pounds was increased by 74,476 head.Returns over variable costs averaged $22.19 per acre, which was an increase of$3.63 per acre over "normal" rainfall. Total gain for added rainfall was $53.0million after allowing for the cost of cloud seeding. Most of the gain in incomeis due to the increase in crop and forage yields from increased growing seasonrainfall.
West Central Area
The West Central area under "normal" rainfall would produce wheat afterfallow, barley after crop, flax, sunflower, corn grain, and alfalfa hay (Table 4).The major livestock enterprise was beef cows-backgrounding calves to 800 pounds.Returns over variable cost were $334 million or about $33.54 per acre.

-8
The kinds of enterprises selected did not change with added growingseason rainfall , only the number of acres devoted to each crop. Barley acreagewas reduced 13,512 acres, which shifted to produce more alfalfa hay. Corn grainfor sale was reduced 9,517 acres and was used to produce corn grain for feed.Native hay use was increased by 45,195 acres, which was taken from unused nativehay acres. The beef cow-backgrounding calves to 800 pounds was increased by35,035 head. Summer fallow acreage did not change under added growing seasonrainfall because there was a minimum acreage required and the acreage was nevermore than the minimum. Returns over variable cost with added rainfall were$382.1 million or about $38.39 per acre. Returns over variable costs went up$48.3 million compared with "normal" rainfall or about $4.85 per acre.
East Central Area
Farm adjustments for the East Central area are given in Table 5. Thecrop enterprises under "normal" rainfall consisted of wheat grown on summerfallow land, barley after crop, flax, sunflower, corn grain, and alfalfa hay.Soybeans can be grown in the East Central area, with 16,700 acres planted in1981. Because of the lack of a good yield history on soybeans in the East
TABLE 5. CROP AND LIVESTOCK ENTERPRISE PLANS FOR THE EAST CENTRAL AND RED RIVERVALLEY FARMING AREAS UNDER "NORMAL" AND ADDED RAINFALL SITUATIONS, NORTH DAKOTA
East Central Area Red River Valley AreaNormal Added Normal Added
Item Unit Rainfall Rainfall Rainfall Rainfall
Wheat After Fallow acres 1,536,000 1,536,000 365,000 365,000Wheat After Crop acres 1,197,400Barley After Crop acres 4,103,066 4,091,861 2,231,827 1,019,487Flax After Crop acres 175,980 175,980Sunflower After Crop acres 1,237,540 1,237,540 654,500 654,500Corn Grain acres 82,265 76,092 184,000 175,881Corn Feed Grain acres 45,375 51,548 8,119Soybeans acres 183,380 183,380Potatoes acres 121,580 121,580Sugarbeets acres 141,120 141,120Dry Edible Beans acres 163,625 163,625Alfalfa Hay acres 117,979 129,184 14,940Native Hay acres 123,717 141,656 24,085Native Pasture acres 1,438,959 1,438,959 249,066Beef Cow Selling
Calf at 800# number 116,045 138,361 21,471
Return Over
Variable Cost dollars 444,808,844 492,985,773 373,240,173 402,898,083
Gaina dollars 47,127,968 29,187,976
aCloud seeding cost of $0.10 per acre was deducted.
- 9
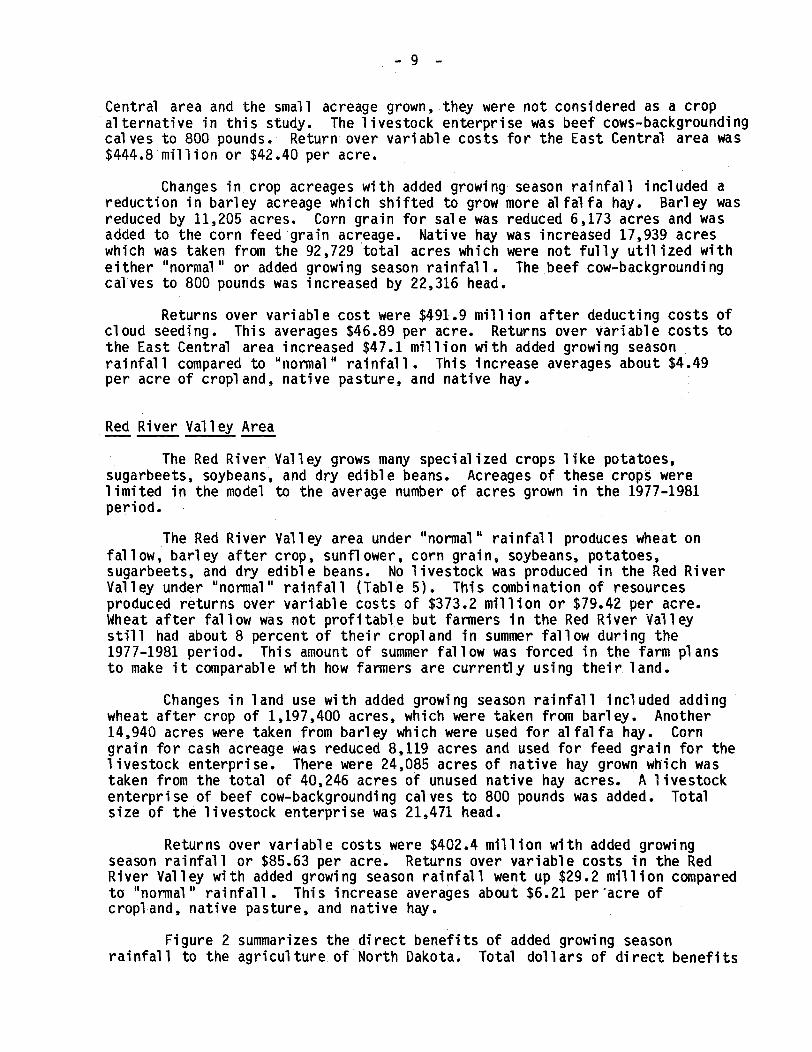
Central area and the small acreage grown, they were not considered as a cropalternative in this study. The livestock enterprise was beef cows-backgroundingcalves to 800 pounds. Return over variable costs for the East Central area was$444.8 million or $42.40 per acre.
Changes in crop acreages with added growing season rainfall included areduction in barley acreage which shifted to grow more alfalfa hay. Barley wasreduced by 11,205 acres. Corn grain for sale was reduced 6,173 acres and wasadded to the corn feed grain acreage. Native hay was increased 17,939 acreswhich was taken from the 92,729 total acres which were not fully utilized witheither "normal" or added growing season rainfall. The beef cow-backgroundingcalves to 800 pounds was increased by 22,316 head.
Returns over variable cost were $491.9 million after deducting costs ofcloud seeding. This averages $46.89 per acre. Returns over variable costs tothe East Central area increased $47.1 million with added growing seasonrainfall compared to "normal" rainfall. This increase averages about $4.49per acre of cropland, native pasture, and native hay.
Red River Valley Area
The Red River Valley grows many specialized crops like potatoes,sugarbeets, soybeans, and dry edible beans. Acreages of these crops werelimited in the model to the average number of acres grown in the 1977-1981period.
The Red River Valley area under "normal" rainfall produces wheat onfallow, barley after crop, sunflower, corn grain, soybeans, potatoes,sugarbeets, and dry edible beans. No livestock was produced in the Red RiverValley under "normal" rainfall (Table 5). This combination of resourcesproduced returns over variable costs of $373.2 million or $79.42 per acre.Wheat after fallow was not profitable but farmers in the Red River Valleystill had about 8 percent of their cropland in summer fallow during the1977-1981 period. This amount of summer fallow was forced in the farm plansto make it comparable with how farmers are currently using their land.
Changes in land use with added growing season rainfall included addingwheat after crop of 1,197,400 acres, which were taken from barley. Another14,940 acres were taken from barley which were used for alfalfa hay. Corngrain for cash acreage was reduced 8,119 acres and used for feed grain for thelivestock enterprise. There were 24,085 acres of native hay grown which wastaken from the total of 40,246 acres of unused native hay acres. A livestockenterprise of beef cow-backgrounding calves to 800 pounds was added. Totalsize of the livestock enterprise was 21,471 head.
Returns over variable costs were $402.4 million with added growingseason rainfall or $85.63 per acre. Returns over variable costs in the RedRiver Valley with added growing season rainfall went up $29.2 million comparedto "normal" rainfall. This increase averages about $6.21 per'acre ofcropland, native pasture, and native hay.
Figure 2 summarizes the direct benefits of added growing seasonrainfall to the agriculture of North Dakota. Total dollars of direct benefits

- 10 -
ion
acre
Figure 2. Estimated Direct Benefits of Added Growing Season Rainfall toFarmers, Totals Per Farming Area and Per Acre in Dollars in North Dakota
to agriculture are given for each farming area and per acre of cropland,native pasture, and native hay. The increased returns over variable costsresulted from the increase in yields of crops and forages. Changes in acreageof crops grown was to provide winter feed for the increased number oflivestock.
Section 3. Total Impact of Added Growing SeasonRainfall on the North Dakota Economy
The analysis of the total economic impacts of increased agriculturalproduction due to added growing season rainfall uses the results of the fourfarming areas in a Leontief input/output model to estimate the interdependencerelationships among the various sectors of businesses in the North Dakotaeconomy. Each sector of an economy is dependent on other sectors for inputs;other sectors also will be affected by changes in agricultural incomes andexpenditures. Increases in farm income and expenditures will result in anincrease in business volume in the North Dakota economy. The North Dakotainput/output model is based on actual expenditure data of North Dakotabusinesses (Sand, Bartch, Senechal, Hertsgaard).
Input/output analysis is a technique for tabulating and describing thelinkages or interdependencies between various industrial or business groupswithin an economy. Interdependence coefficients, or multipliers, show thenumber of times a dollar injected into an economy is turned over, or spent andrespent.

- 11 -
The increased agricultural incomes and expenditures from added growingseason rainfall were distributed among 13 economic sectors. The 13 economicsectors to which increased gross business volume accrued were:
Sector No.
123456789
10111213
Description
Agriculture livestock productionAgriculture crop productionSand and gravel (mining)ConstructionTransportationCommunication and utilitiesWholesale and agricultural processingRetailFinance, insurance, and real estateBusiness and personal servicesProfessional and social servicesHouseholdsGovernment
An economic sector is a group of firms engaged in similar economicactivity. Only eight sectors received the initial payments of the increasedincome and expenditures from added growing season rainfall. These weresectors 1, 5, 7, 8, 9, 10, 11, and 12.
Returns over variable costs described in the four area analyses wereallocated to facilitate the input/output analysis (Table 6). Figure 2 showedthe direct benefits to farmers while Table 6 presents those direct benefits plusthe added spending and respending that occurs within the farming area.
TABLE 6. ALLOCATION OF INCREASED FARM INCOME AND EXPENDITURES BY SECTORS FORADDED GROWING SEASON RAINFALL BY FARMING AREAS
Increased Farm Income and ExpenditureEconomic Sector West East Red RiverReceiving Payment Western Central Central Valley
------------- thousand dollars----------
Agricultural Livestock Production 448.6 229.8 146.4 140.8Construction 168.1 74.6 47.5 45.7Transportation 391.4 184.6 117.6 113.2Wholesale and Agricultural Processing 2,120.8 29.4 969.3 186.5Retail 5,491.2 5,670.0 7,637.5 8,099.4Finance, Insurance, and Real Estate 1,912.6 1,107.8 882.0 1,056.9Business and Personal Services 1,477.6 3,652.1 589.6 1,782.9Professional and Social Services 1,955.7 1,294.2 1,239.3 653.1Households 53,382.3 47,363.9 46,932.3 28,451.2
Total Added Income and Expenditure 67,348.3 59,606.4 58,561.5 40,529.7

- 12 -
Interest on operating costs and investment and depreciation werededucted from returns over variable costs. An annual depreciation cost wasassumed to be used to replace machinery and equipment and spent in the retailsector. Building depreciation was assumed spent in the construction sector.Interest on operating capital and livestock and machinery investment wasallocated 32 percent to the finance sector and 68 percent to the householdsector. Interest from 10 percent of the real estate investment was allocatedto the finance sector and the remainder to the household sector. Estimatedreal estate taxes were deducted from return over variable costs but were notused in the input/output model since the amount spent on taxes did not changewithin the models analyzed. Cost of cloud seeding was assumed to be $0.10 peracre and was assigned to the professional and social services sector. Allother purchased inputs were assigned to the sector where the payment likely wasmade.
Total Economic Impact on Western Farming Area
The estimated direct effect of increased growing season rainfall wouldbe to increase farm income, part of which is farm expenditures and part isreturns over variable costs, by $67.3 million for the Western farming area(Table 6). Most of the increased farm income consists of earnings ofhouseholds (the farm operator's returns to the land he owns, capital , labor,and management, as well as payments for hired farm labor). About 19 percent ofthe increased farm income goes for production costs for items purchased for theretail , construction, and other sectors of the economy.
The multiplier process, measuring the spending and respending of addedincome, continues until the money leaves the community as payment for productspurchased outside the community. By the time the $67.3 million is spent andrespent in the community, it is estimated to generate another $139.1 million ofbusiness volume for a total of $206.6 million (Table 7). The estimated totalincome generated through the multiplier process from added growing seasonrainfall was $206.6 million in the Western farming area.
Total Economic Impact on West Central Farming Area
The estimated total increased farm income and expenditures for addedgrowing season rainfall in the West Central farming area was $59.6 million(Table 6). Spending and respending of these amounts generated an estimatedtotal business volume of $178 million for added growing season rainfall (Table7). Three sectors which received about 77 percent of the added business volumewere the household; retail; and finance, insurance, and real estate sectors.
Total Economic Impact on East Central Farming Area
The estimated increased farm income and expenditures resulting fromadded growing season rainfall in the East Central farming area was $58.6million (Table 6). Another $116.3 million was estimated to be generatedthrough the process of spending and respending for an estimated total of $174.9million (Table 7). The sectors receiving the majority of the business volume

- 13 -
TABLE 7. ESTIMATED INCREASED ADDED BUSINESS VOLUME RESULTING FROM INCREASEDFARM INCOME AND EXPENDITURES FROM ADDED GROWING SEASON RAINFALL BY FARMINGAREAS
Added Business VolumeEconomic Sector West East Red RiverReceiving Added Business Western Central Central Valley
~--------- mil i on dol 1 ars-----------
Added Farm Income and Expenditures 67.3 59.6 58.6 40.5
Economic Sector to Which BusinessVolume Accrued:
Agricultural Livestock Production 5.3 4.3 4.4 3.0Agricultural Crop Production 3.3 1.7 2.2 1.3Sand and GravelConstruction 5.7 5.0 4.8 3.1Transportation 1.1 0.8 0.7 0.5Communication and Utilities 6.8 6.0 5.8 3.9Wholesale and Agricultural Processing 6.7 2.6 4.2 2.1Retail 51.9 46.1 47.1 33.8Finance, Insurance, and Real Estate 12.3 10.2 9.7 6.8Business and Personal Services 5.3 7.0 3.8 3.9Professional and Social Services 8.0 6.5 6.4 3.9Households 93.0 81.6 79.8 51.1Government 6.8 5.9 5.7 3.8
Total Added Business Volume 206.2 178.0 174.9 117.4
were the same for all four farming areaholds; retail; and finance, insurance,
is. The major sectors include house-and real estate.
Total Economic Impact on Red River Valley Farming Area
The estimated increased farm income and expenditures of added growingseason rainfall was $40.5 million in the Red River Valley farming area. Thisgenerated another $76.9 million of estimated business activity. Estimatedtotal business volume increased to $117.4 million for added growing seasonrainfall. The allocations to the various sectors receiving payment andaccruing additional business volume are presented in Tables 6 and 7.
Total Impact on State Economy
Direct purchases by farmers from the local economy resulting fromincreased farm income and expenditures because of added growing seasonrainfall was estimated to total $226.0 million (Table 6). This total wasderived by adding the totals for the four farming area models. The spendingand respending of this increased income and expenditures generated another

- 14 -
$450.9 million of estimated gross business volume from added growing seasonrainfall. The total benefit to the state economy derived from the fourfarming area models was estimated at $676.9 million. Added rainfall increasedgross business volume by about $3.00 for each dollar the farmer received andspent above what he would have under "normal" rainfall conditions.
Added growing season rainfall increased gross business volume by anestimated $10.72 per acre. The Western farming area had an estimated increasein gross business volume for added growing season rainfall of $9.14 per acre,West Central farming area $11.20, East Central farming area $10.36, and theRed River Valley farming area $15.40. Some of the difference in the abovefigures was due to higher product prices in the east than west because offreight rate differences. The yields under "normal" rainfall also increasedfrom west to east. More types of crops can be grown in the East Central andRed River Valley farming areas, many of which have a higher return per acrethan wheat and barley, the principal crops in the two western areas. TheEastern farming area also had a smaller proportion of land in summer fallowand native pasture so a greater proportion of the farmland was devoted to cropproduction.

- 15 -
REFERENCES
Bartch, Bruce L., Analysis of Intersectional and Intercommunity Structure inSouthwestern North Da-5ota, Unpublished M.. Thesis, North Dakota StateUniversity, Fargo, 196
Changnon, S. A. Jr., and F. A. Huff, Evaluation of Potential Benefits ofWeather Modification on Agriculture in IlTTnois, Report to U.S.Department of the Interfior, Bureau o eclamation, Office ofAtmospheric Water Resource, Denver, Colorado, 1971.
Conlon, Thomas J., Armand Bauer, and Timothy C. Faller, "Fallow Management CanContribute to Fuel Conservation," North Dakota Farm Research, Vol. 31,No. 4, North Dakota State University AgriculturaETxperiment Station,Fargo, March-April 1974, pp. 21-23.
Enz, John W., Harvey G. Vreugdenhil , Jerome E. Johnson, and LeRoy W.Schaffner, Cloud Seeding for Rainfall Increase--What Can We Expect inNorth Dakota? Soil Science Report No. 2, North tDakOtTsateUniversity, Fargo, December 1982.
Hertsgaard, Thor A., Randy C. Coon, F. L. Leistritz, and Norman L. Dalsted,Developing Economic Impact Projection Models for the Fort Union CoalRegion, EPA-90/4-77-~ , Environmental ProtectiTon gency, Denver,Colorado, June 1977.
Illinois State Water Survey, Evaluation of Potential Benefits of WeatherModification on Agriculture, PartT to Final Report, Conracti4-06-D-6843 with U.S. Department of Interior, Bureau of Reclamation,Office of Atmospheric Water Resources, University of Illinois, Urbana,October 31, 1947, pp. 7-8.
Interdisciplinary "ARE" Research Team, The Effects of Added Rainfall Duringthe Growing Season in North Dakota, North Da-i-ta Research Report No.357 North Dakota State University Agricultural Experiment Station,Fargo, August 1974.
Sand, Larry D., Analysis of Effects of Income Changes in Intersectional andIntercommunity Economic Structure, Unpublished iM.S. Thesis, NorthDakota State University, Fargo, 1968.
Senechal , D. M., Analysis of Validity of North Dakota Input-Output Models,Unpublished M.S. Thesis, North Dakota State University, Fargo, 1971.
United States Department of Agriculture, Statistical Reporting Service, NorthDakota Agricultural Statistics, 1977-1982, in cooperation with theDepartment of Agricultural Economics, North Dakota State University,Fargo.
United States Department of Commerce, Bureau of the Census, 1978 Census ofAgriculture, North Dakota, Vol. 1, Part 34, Washington, D.C., July"
'1'981.

- 16 -
APPENDIX
An Alternative Way to Analyze Added Direct Returns toAgriculture Using a "Typical" Farm in Each Farming Area
The main part of this manuscript treated each of the four farming areasas one farm. This appendix offers an alternative analysis, where a typicalfarm within each farming area was estimated. This analysis provides similarresults to those presented above in Section 2. Appendix Table 1 shows thetypical farm size was 1,760 acres in the Western farming area, 1,280 acres inthe West Central, 1,120 acres in the East Central , and 920 acres in the RedRiver Valley.
The acreage restraints for various crops are given in Appendix Table 1.These restraints were used in linear programming to prevent any one crop,which would be the most profitable for the resources available, from taking
APPENDIX TABLE 1. CHARACTERISTICS OF MODEL FARMS BEFORE ADDED RAINFALLANALYSIS FOR FOUR FARMING AREAS AND RESTRAINTS USED FOR EACH FARM
Item Western West Central East Central Red River Valley
----------------------- acres---------------------------
Total Farm Size 1,760 1,280 1,120 920Cropland 898 845 885 810Native Pasture 774 307 146 46Native Hay 18 51 22 9Waste 10 77 67 55
Other RestraintsWheat 330 342 342 287Flax 45 42 18 7Sunflower 150 140 124 121Corn 65 140 30 34Soybeans - -- -- 34Summer Fallow 296 213 154 67Labor (Hours)
Spring 780 780 780 780Summer 780 780 780 780Fall 910 910 910 910Winter 1,040 1,040 1,040 1,040
over the total farm acreage. The acreagesof these crops grown in the 1977-1981 perifor farm work also is shown. If the cropmore labor it could be hired at $3.75 per
; were based on the average acreagesod. Hours of family labor availableor livestock enterprises requiredhour.
The typical farm for each farming area was linear programmed to selectthe most profitable farm enterprise plan using "normal" rainfall and with

- 17 -
added rainfall. The linear programming model included the same farmenterprises and same acreage and labor restrictions adjusted to an individualfarm basis as for the area farm. The individual farm results for each of thefour farming areas will be summarized.
Western Area
Under "normal" rainfall the typical farm enterprise plan for theWestern farming area would grow 296 acres of wheat on fallow and 3 acres ofwheat, 45 acres of flax, 150 acres of sunflower, and 5 acres of corn grain onland following a crop (Appendix Table 2). A farmer generally will not plantsmall acreages of crops but would plant that acreage to a crop with a largeracreage. Feed for the livestock operation included 43 acres of alfalfa hay,18 acres of native hay, 17 acres of corn grain, and 43 acres of corn silage.The livestock enterprise included 50 beef cows-backgrounding calves.
APPENDIX TABLE 2. CHANGES IN RETURNS AND FARM ENTERPRISE PLANS FOR THE"TYPICAL" FARM IN EACH OF THE FOUR FARMING AREAS UNDER "NORMAL" AND ADDEDGROWING SEASON RAINFALL
Western Area West Central AreaNormal Added Normal Added
Item Unit Rainfall Rainfall Rainfall Rainfall
Wheat After Fallow acres 296 296 213 213Wheat After Crop acres 3 2Barley After Crop acres 69 68Flax After Crop acres 45 45 42 42Sunflower After
Crop acres 150 150 140 140Corn Grain acres 5 6 129 128Corn Feed Grain acres 17 17 11 12Corn Silage acres 43 42Alfalfa Hay acres 43 44 28 29Native Hay acres 18 18 30 35Native Pasture acres 774 774 307 307Beef Cow-
Backgrounding Calf600# number 35 45
Beef Cow-Backgrounding Cal f800# number 15 14 23 27
Spring LaborHired hours 55
Return OverVariable Costs dollars 31,150 37,530 40,203 46,142
Gaina dollars 6,211 5,819
aCloud seeding cost of $0.10 per acre was deducted.

- 18 -
Added rainfall did not change the enterprises selected, only theacreages planted of crops and forages. The livestock numbers were increasedby nine beef cows. Returns over variable costs increased by $6,211 due toincreased yields of crops and forages. Cost of cloud seeding, at $0.10 peracre, was deducted from the returns over variable costs. Increased returnover variable cost was $3.68 per acre compared with "normal" rainfall for thetypical farm situation.
West Central Area
The typical farm in the West Central farming area under "normal"rainfall conditions would grow 213 acres of wheat on fallow and 69 acres ofbarley, 42 acres of flax, 140 acres of sunflower, and 129 acres of corn onland that was cropped the previous year (Appendix Table 2). Feed forlivestock included 28 acres of alfalfa hay, 30 acres of native hay, 11 acresof corn, and 307 acres of native pasture. Twenty-three head of beefcows-backgrounding calves to 800 pounds made up the livestock enterprise.
Added growing season rainfall did not change the crop enterprise plan.The same acreage supported four additional beef cows. Increased returns overvariable costs with added rainfall was $5,819 for the farm or $4.84 per acre.
East Central Area
The typical farm under "normal" rainfall conditions in the East Centralfarming area would grow 154 acres of wheat on fallow and 393 acres barley, 124acres sunflower, and 30 acres of corn grain on land following a crop (AppendixTable 3). The livestock enterprise was 12 head of beef cows-backgrounding thecalves to 800 pounds. Winter feed was grown on 12 acres of native hay, 12 acresof alfalfa hay, and 5 acres of corn. There was a total of 22 acres of nativehay available but only 12 acres were utilized.
There were no changes in the farm enterprise plan with added rainfall.Native pasture yields increased with added rainfall to accommodate two morebeef cows. Increase in returns over variable costs was $4,742 or $4.50 peracre compared with "normal" rainfal l.
Red River Valley
The typical farm in the Red River Valley with "normal" rainfall grew 67acres of wheat after fallow and 487 acres of barley, 121 acres of sunflower, 34acres of corn grain, and 34 acres of soybeans on land that was cropped theprevious year (Appendix Table 3). Wheat after fallow was not the mostprofitable enterprise but farmers in this area had about 8 percent of theircropland in summer fallow during the 1977-1981 period. This amount of summerfallow was forced into the farm plan and wheat was the most profitable way toutilize the fallow ground. The farm plan under "normal" rainfall conditionshas no livestock.
The crop enterprise plan with added rainfall was shifted by reducingbarley by 223 acres. This acreage was used for 220 acres of wheat after cropand 3 acres of alfalfa hay. The typical farmer would not have livestock even

- 19 -
APPENDIX TABLE 3. CROP AND LIVESTOCK ENTERPRISE PLANS FORUNDER "NORMAL" AND ADDED RAINFALL SITUATIONS IN THE EASTVALLEY FARMING AREAS, NORTH DAKOTA
THE TYPICAL FARMCENTRAL AND RED RIVER
East Central Area Red River Valley AreaNormal Added Normal Added
Item Unit Rainfall Rainfall Rainfall Rainfall
Wheat After Fallow acres 154 154 67 67Wheat After Crop acres 220Barley After Crop acres 393 392 487 264Flax After Crop acres 18 18Sunflower After Crop acres 124 124 121 121Corn Grain acres 25 25 34 32Corn Feed Grain acres 5 5 2Soybeans acres 34 34Alfalfa Hay acres 12 13 3Native Hay acres 12 14 4Native Pasture acres 144 144 46Beef Cow-Backgrounding
Cal f at 800# number 12 14 4
Return OverVariable Cost dollars 45,341 50,188 52,734 57,135
Gaina dollars 4,742 4,315
aCloud seeding cost of $0.10 per acre was deducted.
though the profitable farm plan with added rainfall specified four beefcows-backgrounding calves to 800 pounds. The returns over variable costs wereincreased $4,315 or $4.99 per acre compared with "normal" rainfall.
The benefits of added growing season rainfall came from increased yieldsof crops and forages. The increase in yields resulted in increasing thereturns over variable costs by an average of $4.38 per acre compared with"normal" rainfall. This varied from $3.68 in the Western area to $4.99 peracre in the Red River Valley.
Related Documents


