Economic Diversity in Appalachia Statistics, Strategies, and Guides for Action February 2014 Prepared for the Appalachian Regional Commission

Welcome message from author
This document is posted to help you gain knowledge. Please leave a comment to let me know what you think about it! Share it to your friends and learn new things together.
Transcript

Economic Diversity in Appalachia
Statistics, Strategies, and Guides for Action
February 2014
Prepared for the Appalachian Regional Commission
ECONOMIC DIVERSITY IN APPALACHIA
CONTENTS
List of Tables ...................................................................................................................... iii
List of Figures ..................................................................................................................... iii
About this Report .............................................................................................................. iv
Executive Summary ............................................................................................................ v
Introduction ........................................................................................................................ 1
Research on Diversity and Regional Development ............................................................. 3
Economic Diversity and Regional Stability ..................................................................... 3
Economic Diversity and Regional Growth ...................................................................... 4
Industrial Specializations and Regional Growth and Stability ........................................ 4
Summary ........................................................................................................................ 5
Appalachian diversity: A Statistical portrait ....................................................................... 6
Diversity is What, How, and Why ................................................................................... 6
Diversity is also Where ................................................................................................... 6
Measuring Diversity ....................................................................................................... 7
Applying the Measures................................................................................................... 8
Economic Diversity Across the U.S. and Appalachia ...................................................... 9
Urbanization and Specialization ................................................................................... 13
Diversity and Economic Outcomes............................................................................... 17
Diversity and Geography .............................................................................................. 19
Illustrative Examples of Diversity in Context ................................................................ 22
Diversity and Development Strategy in Appalachia ......................................................... 24
Case Study Selection .................................................................................................... 24
Case Study Findings ...................................................................................................... 25
Common Themes and Trends ...................................................................................... 37
Mutliple avenues for achieving diversification ............................................................ 46
Lessons for Development practice ................................................................................... 48
Growth Occurs through Specialization ......................................................................... 48
Diversification Strategy as Risk Assessment and Opportunity Capture ....................... 49
Regionalism Supports Diversification ........................................................................... 49
Diversification is Supporting the Fundamentals .......................................................... 50
Diversification Needs Information ............................................................................... 51
References ........................................................................................................................ 52
Appendix: Data and methods ........................................................................................... 54
ii
ECONOMIC DIVERSITY IN APPALACHIA
Base Data and Methods for Calculating Economic Diversity ........................................ 54
Measuring Industry-based Economic Diversity ............................................................ 55
Measuring Function-based Economic diversity ............................................................ 55
Measuring Occupation-based Economic Diversity ....................................................... 58
Measuring Knowledge-based Economic Diversity ....................................................... 58
Geographic aggregations .............................................................................................. 60
Presentation of Metrics ................................................................................................ 61
LIST OF TABLES
Table 1: Economic Diversity by Region, 2012 ..................................................................... 9
Table 2: Economic Diversity by County Character, 2012 .................................................. 13
Table 3: Economic Diversity by Region, 2012 ................................................................... 15
Table 4: Economic Diversity by County Character, 2012 .................................................. 15
Table 5: Percent of Appalachian Counties with Particular Functional Specializations, 2012 .................................................................................................................................. 17
Table 6: Diversity by County Economic Status, Appalachia, 2012 .................................... 18
Table 7: Industrial Diversity and Employment Growth ..................................................... 19
Table 8: Ratio of County to Commuting Shed Economic Diversity by Region, 2012 ........ 20
Table 9: Illustrative Examples—Appalachian Economic Diversity and Outcomes, 2012 .. 22
Table A1: Functional Categories with Selected Industry Examples .................................. 57
Table A2: Illustrative Descriptions of Knowledge Clusters ............................................... 59
LIST OF FIGURES
Figure 1: U.S. Industrial Diversity, 2012 ............................................................................ 10
Figure 2: Appalachian Sub-regions ................................................................................... 11
Figure 3: Distribution of Diversity, by Appalachian Region .............................................. 12
Figure 4: Distribution of Diversity, by Appalachian County Character ............................. 14
Figure 5: Rural-Urban County Types in Appalachia .......................................................... 15
Figure 6: Distribution of diversity, by Appalachian region (Index benchmarked to county character) .......................................................................................................................... 16
Figure 7: Distribution of diversity, by Appalachian County Character (Index benchmarked to county character) ......................................................................................................... 16
Figure 8: Functional Specializations in Appalachian Commuter Sheds ............................ 21
iii

ECONOMIC DIVERSITY IN APPALACHIA
ABOUT THIS REPORT
This report is one of four documents prepared as part of an extensive analysis of economic diversity for the Appalachian Regional Commission by the University of Illinois at Urbana-Champaign’s Regional Economics Applications Laboratory and the Center for Regional Economic Competitiveness, with assistance from the RUPRI Center for Rural Entrepreneurship and EntreWorks Consulting. Project leaders were Edward Feser, Ken Poole, Mark White, and Geoffrey Hewings, with Troy Mix serving as Project Manager.
Authors of this report were Edward Feser, Troy Mix, Mark White, and Ken Poole. Deb Markley and Erik Pages contributed to the case studies. William Cook and Erol Yildirim were primarily responsible for building the web tool.
In addition to this report, the documents include a guide to the web tool (A Practitioner's Guide for Planning and Analysis with the Appalachian Economic Diversity Web Tool), a detailed synopsis of case studies (Case Studies in Economic Diversification in Appalachia), and a technical report detailing methods, data, and additional findings (A Statistical Portrait of Economic Diversity in Appalachia). All reports associated with the project can be found here: http://economicdiversityinappalachia.creconline.org/Report/.
iv
ECONOMIC DIVERSITY IN APPALACHIA
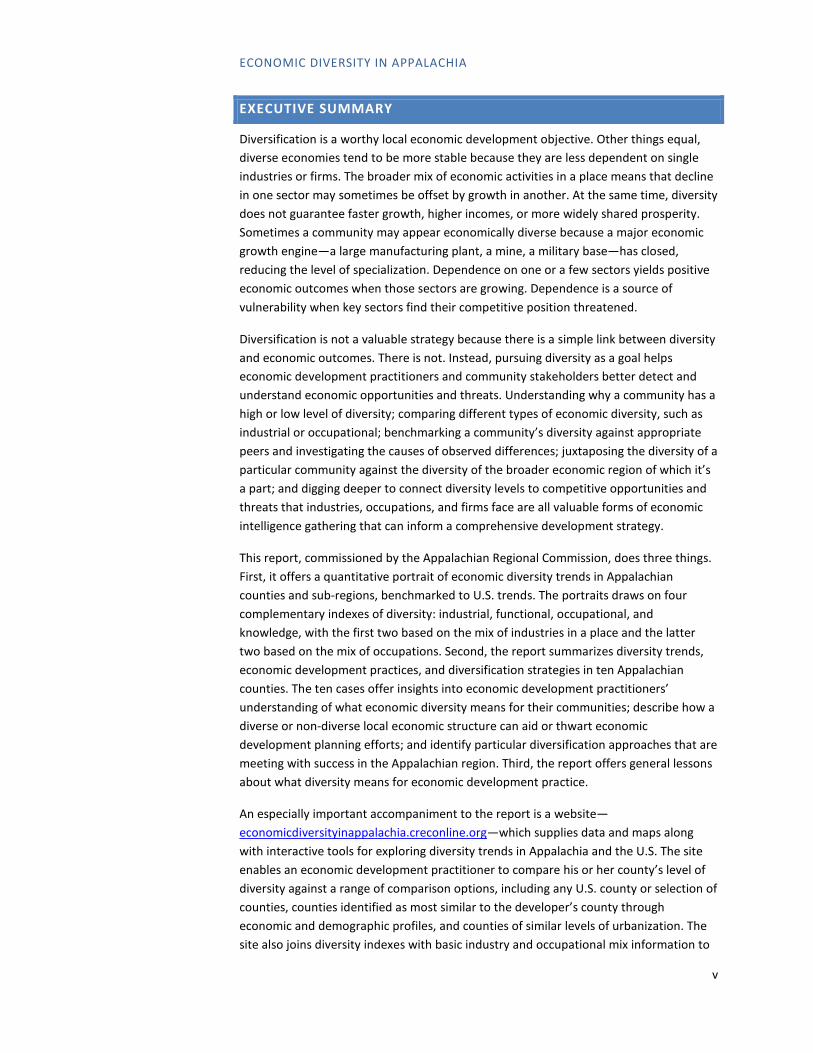
EXECUTIVE SUMMARY
Diversification is a worthy local economic development objective. Other things equal, diverse economies tend to be more stable because they are less dependent on single industries or firms. The broader mix of economic activities in a place means that decline in one sector may sometimes be offset by growth in another. At the same time, diversity does not guarantee faster growth, higher incomes, or more widely shared prosperity. Sometimes a community may appear economically diverse because a major economic growth engine—a large manufacturing plant, a mine, a military base—has closed, reducing the level of specialization. Dependence on one or a few sectors yields positive economic outcomes when those sectors are growing. Dependence is a source of vulnerability when key sectors find their competitive position threatened.
Diversification is not a valuable strategy because there is a simple link between diversity and economic outcomes. There is not. Instead, pursuing diversity as a goal helps economic development practitioners and community stakeholders better detect and understand economic opportunities and threats. Understanding why a community has a high or low level of diversity; comparing different types of economic diversity, such as industrial or occupational; benchmarking a community’s diversity against appropriate peers and investigating the causes of observed differences; juxtaposing the diversity of a particular community against the diversity of the broader economic region of which it’s a part; and digging deeper to connect diversity levels to competitive opportunities and threats that industries, occupations, and firms face are all valuable forms of economic intelligence gathering that can inform a comprehensive development strategy.
This report, commissioned by the Appalachian Regional Commission, does three things. First, it offers a quantitative portrait of economic diversity trends in Appalachian counties and sub-regions, benchmarked to U.S. trends. The portraits draws on four complementary indexes of diversity: industrial, functional, occupational, and knowledge, with the first two based on the mix of industries in a place and the latter two based on the mix of occupations. Second, the report summarizes diversity trends, economic development practices, and diversification strategies in ten Appalachian counties. The ten cases offer insights into economic development practitioners’ understanding of what economic diversity means for their communities; describe how a diverse or non-diverse local economic structure can aid or thwart economic development planning efforts; and identify particular diversification approaches that are meeting with success in the Appalachian region. Third, the report offers general lessons about what diversity means for economic development practice.
An especially important accompaniment to the report is a website— economicdiversityinappalachia.creconline.org—which supplies data and maps along with interactive tools for exploring diversity trends in Appalachia and the U.S. The site enables an economic development practitioner to compare his or her county’s level of diversity against a range of comparison options, including any U.S. county or selection of counties, counties identified as most similar to the developer’s county through economic and demographic profiles, and counties of similar levels of urbanization. The site also joins diversity indexes with basic industry and occupational mix information to
v

ECONOMIC DIVERSITY IN APPALACHIA
support analyses that “look behind” the level of diversity to understand its origins in the specific characteristics of industries and labor force. Tips for using the information and tools—A Practitioner's Guide for Planning and Analysis with the Appalachian Economic Diversity Web Tool—is available on the website.
Also accompanying the report are two additional documents. The first—A Statistical Portrait of Economic Diversity in Appalachia—provides additional details and analysis of the diversity metrics. The second—Case Studies in Economic Diversification in Appalachia—provides extensive narratives of the research conducted in the ten case study counties.
The analysis contained in this report offers several lessons for local economic development practice. First, a competitive regional economy, and one that is also diverse in comparison to other regional economies of similar levels of development and scale, is likely to be comprised of multiple competitive specializations. A diversification goal should not be simply to somehow encourage the emergence and expansion of a generically diverse mix of economic activity, but rather to support the competitiveness and growth of a number of specializations or clusters that can serve as the multi-legged foundation for the local economy. Put differently, a good diversification strategy is a matter of implementing many successful specialization strategies simultaneously.
Second, the local economic developer should seek to fully assess and understand the “risk” associated with the existing economic base of his or her locality. A highly specialized economy may face comparatively little risk of significant decline over a foreseeable future if robust demand for its goods and services is certain. Alternatively, a diverse economic base can be under threat if multiple industries face significant disruption. An important role for the local economic developer is to fully understand the competitive factors underpinning the economic base and use this knowledge to anticipate possible disruptions that might be countered through development strategies.
Third, the developer should scan for economic opportunities—whether through business expansion, entrepreneurship, or attraction strategies, or other economic development initiatives—that might be nurtured through appropriate public sector actions. Regional economic diversification is not akin to financial portfolio diversification; a region cannot choose to actively divest itself of a particular segment of its economy (although it can allow a segment to founder or languish). Instead, it can shift its economic mix primarily by encouraging new industries and activities. In this sense, diversification strategies build on fundamental principles of economic development more broadly.
Fourth, the pursuit of an appropriate level of regionalism in economic development is a good strategy because local and regional diversity are rarely independent of one another. The understanding of a community’s particular economic role within its larger labor market area and region can help to clarify the necessity and potential content of regional arrangements. In order to compensate for local gaps in factors such as workforce skills or infrastructure, individual communities might seek to highlight their
vi

ECONOMIC DIVERSITY IN APPALACHIA
ties to nearby communities; business recruitment or cluster strategies may be more successful if they highlight the region’s resources, not just those of individual communities; local economic development goals may be advanced more rapidly by partnering on major infrastructure projects; and so on. The larger region may offer significant avenues for diversification that are well beyond the reach of a smaller locality.
Fifth, overall, the best diversification strategy is a sound, well-balanced economic development strategy. Communities that successfully implement diversification strategies share several common traits. They develop their strategies on a solid foundation of analysis and research. They think and operate regionally so as to maximize the resources and assets available to them. Their development professionals work across silos to create broader networks and coalitions and to leverage networks and expertise. They put the right leaders and staff in place to ensure effective implementation. And they have a process in place for developing and implementing their strategies and for incorporating new leaders. Economic diversity is a legitimate economic aspiration and goal, but like all economic development goals, it is only accomplished if area leaders and stakeholders thoughtfully and effectively implement their economic development strategies.
vii

ECONOMIC DIVERSITY IN APPALACHIA
INTRODUCTION
Many rural Appalachian areas have long depended on a few dominant industries, such as manufacturing, mining, and forestry. Considerable research suggests that this dependence is closely tied to negative economic outcomes (Bradshaw, 1992; Freudenburg and Wilson, 2002; Stedman, Patriquin, and Parkins, 2011). Likewise, Appalachia’s urban regions also rely on a few industries. For example, large, vertically-integrated steel producers propelled the economies of Youngstown, Ohio and Pittsburgh, Pennsylvania for many decades. As U.S. steel manufacturing declined, the regions faced many difficulties in adapting to an increasingly service-oriented economy due to the steel industry’s institutionalized labor practices and corporate structures (Hoerr, 1988; Safford, 2009).
Prompted in part by Appalachia’s legacy of low economic diversity and the lack of practical guidance available for pursuing diversification strategies, the Appalachian Regional Commission (ARC) sponsored research aimed at better understanding economic diversity in Appalachia and identifying common diversification strategies. Begun in November 2012, this research consisted of three major components: 1) the assembly of a quantitative portrait of economic diversity in Appalachia and the United States; 2) the compilation and assessment—through focused case studies—of views of economic diversity and common regional development strategies related to diversification in the Appalachian region; and 3) the development of guides for local economic development practitioners in the use of the data and strategy findings.
This report summarizes those research findings, with a focus on extracting lessons that offer the most potential for informing local and regional economic development efforts across Appalachia.1 Accompanying the report is a website— economicdiversityinappalachia.creconline.org—which provides interactive data, maps and other analytical tools for exploring diversity trends in Appalachia and the U.S.2
Following a synopsis of previous research on diversity and regional development, the report outlines and applies several approaches to defining economic diversity. Each diversity definition yields an index that provides a different and complementary lens for viewing and understanding the economic challenges and opportunities facing local communities in Appalachia. The definitions recognize different features of local economies, including their industrial make-up, the major roles or “economic functions” they play in their larger regional contexts, and the characteristics of their workforces. Applying the definitions to varying geographic scales—county versus multi-county
1 Detailed findings and methods from the data analysis and case study components of this project can be found in two additional technical reports: A Statistical Portrait of Economic Diversity in Appalachia and Case Studies in Economic Diversification in Appalachia. Both reports are available at http://economicdiversityinappalachia.creconline.org/Report/. 2 A manual for development professionals—A Practitioner's Guide for Planning and Analysis with the Appalachian Economic Diversity Web Tool—is also available on the website.
1
ECONOMIC DIVERSITY IN APPALACHIA
commuting shed—lends additional insight into a locality’s level of diversity and implications for growth and development.
The empirical analysis is followed by summaries of diversity trends, economic development practices, and diversification strategies (if underway) in ten Appalachian counties. The ten counties selected for case study analysis are either highly concentrated in a particularly specialty (i.e., not diverse) or have pursued tangible strategies to increase their level of economic diversity. The aim of the case study work was to generate insights into economic development practitioners’ own understanding of what economic diversity means for their communities; to better understand how a diverse or non-diverse local economic structure can aid or thwart economic development planning efforts; and to discover what diversification approaches are meeting with success in the region.
The report concludes with a discussion of several general lessons for economic development practice. Diversity is certainly a complicated phenomenon; it is not unambiguously associated with strong economic performance. Indeed, in many regions, an increasing level of diversity may be associated with the decline of previously successful industrial specializations or clusters. A place may become more diverse because its longstanding economic engine is sputtering. The pattern of diversity and growth in regions unfolds in complex ways over long periods of time and through a continuous process of economic structural transition and evolution, the net effect of ongoing new business locations, new business formations, firm expansions and contractions, and firm re-locations and closures. In this context, targeting economic diversity as a narrow economic development goal is less useful than using it as one of a suite of metrics informing regular economic development strategizing and planning.
Systematic investigation into why a community either lacks economic diversity or has become diverse over time can uncover useful insights, such as: the level of cyclical or structural risk the community faces given its existing economic mix; the importance of the community’s economic linkages to larger regional, national, and global economies; opportunities for growth in emerging industries or industries that align with local workforce strengths; and possible investments, policies, or initiatives that can assist a structural transition from a vulnerable set of industries. Recognizing that diversity is not simply a matter of how many industries are present in place, but also the characteristics of those industries, their linkages to the wider economy, and the skills and knowledge characteristics of the workers they employ, offers a much richer picture of economic strengths and vulnerabilities. Likewise, understanding that a locality’s diversity depends not only on its own economic mix but the mix of its larger region, can reveal previously unknown opportunities for grown and development through the leveraging of regional assets and creation of innovative inter-jurisdictional partnerships.
2

ECONOMIC DIVERSITY IN APPALACHIA
RESEARCH ON DIVERSITY AND REGIONAL DEVELOPMENT
Regional development practitioners often cite economic diversification as a desirable goal for the purported benefits it can provide in reducing exposure to economic downturns and opening up potential avenues for economic growth. Considerable scholarship has accompanied this practical focus, with much of the attention on devising and evaluating methods for measuring regional economic diversity and testing the relationships among economic diversity and regional growth and stability (Attaran, 1986; Conroy, 1975; Dissart, 2003; Frenken, Van Oort, and Verburg, 2007; Jackson, 1984; Mack, Grubesic, and Kessler, 2007; McLaughlin, 1930). Existing research is organized around investigating three major claims: 1) that economic diversity enhances the stability of regional employment levels; 2) that increased economic diversity results in increased employment growth rates; and 3) that regions’ particular industry specializations play a significant role in determining regional employment stability.
ECONOMIC DIVERSITY AND REGIONAL STABILITY
Scholars and practitioners have long advanced the common sense notion that economic diversity can reduce the impact of economic shocks on a region’s employment. Dissart (2003) referred to economic diversity as an “averaging process: the greater the variety of industries in a region, and the more dispersed the regional employment among these industries, the less likely a region is to suffer severe…economic decline” (p. 424). Put differently, diverse regions are expected to be more stable since “their fortunes are not tied to the fortunes of a few industries” (Chinitz, 1961, p. 281).
There is considerable, though not unequivocal, empirical evidence of a positive relationship between regional economic diversity and stability. In a review of the economic diversity literature since 1930, Dissart (2003) reported that a majority of some 40 studies have found a positive relationship between the diversity and stability of regional economies, and that larger economies tend to be both more diverse and more stable than smaller economies. Malizia and Ke (1993) found a relationship between increased U.S. metropolitan area diversity and both less unemployment and more employment stability. Conroy (1975) also reported a significant, positive relationship between metropolitan area diversity and economic stability. In a recent study of employment in regions of the Netherlands, Frenken et al. (2007) found a negative relationship between the diversity of regional employment across major industry sectors and the growth of unemployment in those regions.
In one example of a contrary study, Attaran (1986) found no relationship between economic diversity and employment stability across U.S. states. While Hammond and Thompson (2004) reported a negative relationship between economic diversity and employment volatility, they present other findings that question the wisdom of pursuing simplistic diversification policies in order to seek stability. In particular, they found that increased local spending on education and increased educational attainment had a significant, positive impact on employment volatility, likely due in part to the increased mobility that tends to accompany a more educated workforce (Hammond and Thompson, 2004, pp. 537-539). That finding highlights a potential tradeoff between
3
ECONOMIC DIVERSITY IN APPALACHIA
policies that seek economic stability and policies that seek to improve long-term growth rates in ways that can exacerbate regional employment volatility, such as investments to improve education.
ECONOMIC DIVERSITY AND REGIONAL GROWTH
Presumably, three connections could exist between economic diversity and growth. First, the presence of more industries in a region could create opportunity for growth by providing for support services (e.g., accounting and legal services) that increase the incentive for firms to locate and expand in a region. Second, a greater variety of sub-industries within a larger industry may offer growth opportunities by multiplying the number of possible productive linkages among existing and prospective new firms. For example, a community dominated by the production of an agricultural commodity may enjoy immediate employment growth as the economy diversifies through the addition of industries aimed at processing those commodities. Later, the increased regional income associated with the addition of that processing activity might result in increased employment in local-serving industries such as retail trade and personal services (Watkins, 1963). Third, a diversity of industries in a region may increase growth through innovation by improving “opportunities to interact, copy, modify, and recombine ideas, practices and technologies across industries” (Frenken et al., 2007, p. 687).
The empirical evidence evaluating the relationship between diversity and growth is more mixed than it is for the relationship between diversity and stability. In the words of (Dissart (2003)), “the evidence regarding the relationship between economic diversity and employment growth is less conclusive [and]…research on the relationship between economic diversity and income levels and growth yields contradictory results” (p. 434). For example, Wagner and Deller (1998) found a positive relationship between economic diversity and growth in per capita incomes, while Attaran (1986) found a negative relationship between those variables. Refining the notion of the type of diversity that is important for economic growth, Frenken et al. (2007) reported a significant positive relationship between the diversity of employment by industry within major economic sectors and the rate of employment growth.
INDUSTRIAL SPECIALIZATIONS AND REGIONAL GROWTH AND STABILITY
While economic diversity is often measured in an industry-blind manner, many scholars stress the differential impacts of certain specializations. Employment in durable goods manufacturing—an industry thought to suffer from similar cyclical downturns—has been studied for its relationship to economic stability and considerable attention has been paid to the negative economic impacts of specialization in some extraction-based industries.
For example, Malizia and Ke (1993) and Hammond and Thompson (2004) found that employment in mining reduces economic stability. Freudenburg and Wilson (2002) reviewed approximately 300 studies on this topic, finding that about half reported negative economic impacts from mining employment, with the remainder finding mostly mixed or neutral impacts. Where positive impacts were found, they tended to
4
ECONOMIC DIVERSITY IN APPALACHIA
relate mining employment to income growth, not regional employment growth. In related work, Auty (2000) reported that, since the 1960s, developing resource-abundant countries have experienced slower growth than have relatively resource-poor countries. Papyrakis and Gerlagh (2007) tested this relationship in a developed country context and found that resource-abundant states in the United States experienced slower growth than less endowed states.
Scholarship on the development of staple-based economies has sought to explain the stunted growth that often accompanies resource-based industries (Watkins, 1977). This literature advances the “staple trap” model for explaining the vicious economic cycle that keeps resource-dependent regions from diversifying. One iteration of this model specifies that, in regions with significant natural resources, industrialization is delayed since significant profits can be enjoyed through resource extraction; less urbanization occurs; a less skilled workforce results; and government intervention is called upon to create jobs and protect industries—reducing the competitiveness of extractive industries in the process (Auty, 2000, 2001).
SUMMARY
Academic research is mixed on the precise nature of the relationships between economic diversity, stability, and growth in employment and incomes in localities and regions. In general, more diverse places tend to be more stable; however, they are not always fast growing. On the one hand, the variation in findings across studies is due to differences in time periods and locations under study, as well as differences in research designs and methods. On the other hand, the lack of consensus in the research literature is more fundamental: the growth and development implications of the level of economic diversity at any given point in a region’s economic trajectory are influenced by many factors, including the specific industry mix, trade and other linkages to other regions, the characteristics of the labor force, the broader regional context, and the legacies that existing industries bring to local civic culture and leadership.
5
ECONOMIC DIVERSITY IN APPALACHIA
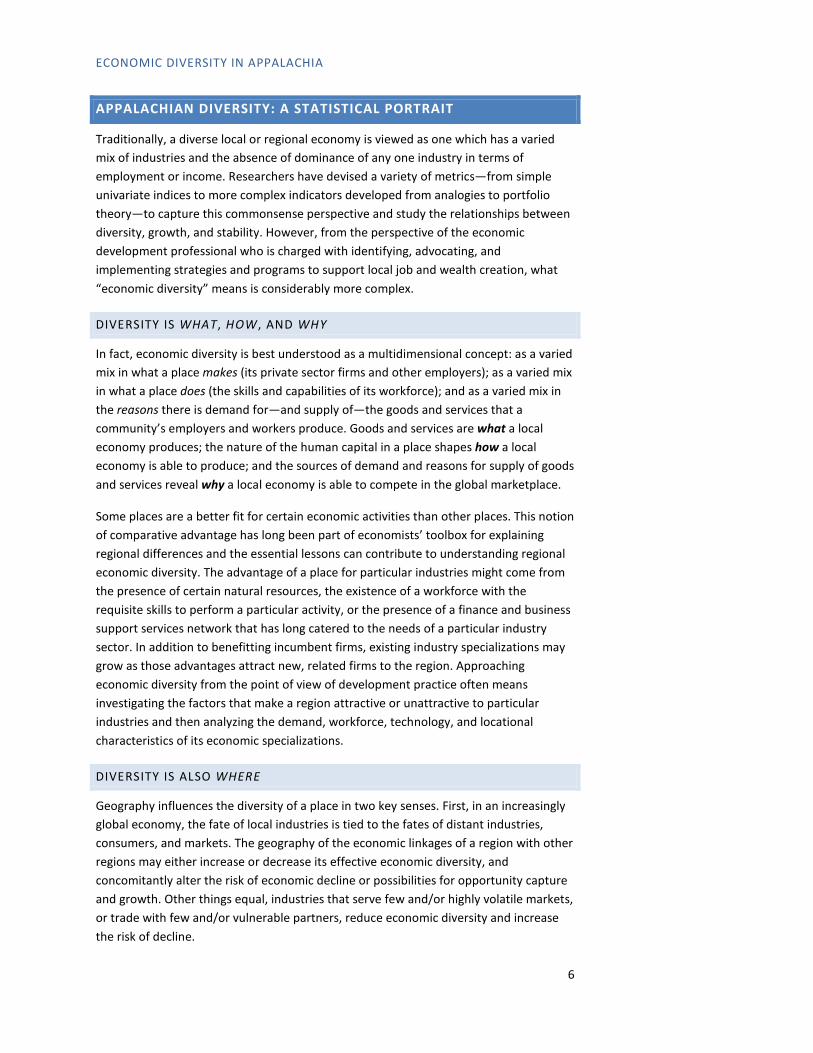
APPALACHIAN DIVERSITY: A STATISTICAL PORTRAIT
Traditionally, a diverse local or regional economy is viewed as one which has a varied mix of industries and the absence of dominance of any one industry in terms of employment or income. Researchers have devised a variety of metrics—from simple univariate indices to more complex indicators developed from analogies to portfolio theory—to capture this commonsense perspective and study the relationships between diversity, growth, and stability. However, from the perspective of the economic development professional who is charged with identifying, advocating, and implementing strategies and programs to support local job and wealth creation, what “economic diversity” means is considerably more complex.
DIVERSITY IS WHAT, HOW , AND WHY
In fact, economic diversity is best understood as a multidimensional concept: as a varied mix in what a place makes (its private sector firms and other employers); as a varied mix in what a place does (the skills and capabilities of its workforce); and as a varied mix in the reasons there is demand for—and supply of—the goods and services that a community’s employers and workers produce. Goods and services are what a local economy produces; the nature of the human capital in a place shapes how a local economy is able to produce; and the sources of demand and reasons for supply of goods and services reveal why a local economy is able to compete in the global marketplace.
Some places are a better fit for certain economic activities than other places. This notion of comparative advantage has long been part of economists’ toolbox for explaining regional differences and the essential lessons can contribute to understanding regional economic diversity. The advantage of a place for particular industries might come from the presence of certain natural resources, the existence of a workforce with the requisite skills to perform a particular activity, or the presence of a finance and business support services network that has long catered to the needs of a particular industry sector. In addition to benefitting incumbent firms, existing industry specializations may grow as those advantages attract new, related firms to the region. Approaching economic diversity from the point of view of development practice often means investigating the factors that make a region attractive or unattractive to particular industries and then analyzing the demand, workforce, technology, and locational characteristics of its economic specializations.
DIVERSITY IS ALSO WHERE
Geography influences the diversity of a place in two key senses. First, in an increasingly global economy, the fate of local industries is tied to the fates of distant industries, consumers, and markets. The geography of the economic linkages of a region with other regions may either increase or decrease its effective economic diversity, and concomitantly alter the risk of economic decline or possibilities for opportunity capture and growth. Other things equal, industries that serve few and/or highly volatile markets, or trade with few and/or vulnerable partners, reduce economic diversity and increase the risk of decline.
6

ECONOMIC DIVERSITY IN APPALACHIA
Second, a specific locality’s diversity is contingent on both the economic base of its immediate jurisdiction and the economic base of the larger functional economic area of which it is a part. A given jurisdiction can be nominally non-diverse in its own industry base but be tightly linked to a region with a highly diverse industry base. Likewise, a jurisdiction with a diverse local economic mix may still face considerable risk if it is tied to a broader region that depends on one or a few industries, markets, suppliers, skill sets, or technologies.
MEASURING DIVERSITY
Ideally, a measure of local diversity will take into account the number and distribution of different kinds of economic activities present because more economically diverse places have a larger variety of activities, other things equal. At the same time, the measure will be flexible enough to be applied to a range of variables that capture the different kinds of diversity described above.
One such indicator takes the shares of each type of activity in the local economy, multiplies them by the logarithms of their inverses, and sums up the values.3 The mathematical details are less important than the result: the measure yields a higher value for places with a broader and more even mix of economic activities, and it registers as zero in the hypothetical case of a location with only a single type of economic activity. The value will be quite low for a community with just a few industries that account for most economic activity. Conversely, the value will be high for a community with more balanced employment across many industries.
Altering the ways economic activity is defined creates a suite of indexes reflecting the multiple dimensions of economic diversity described above. The following are four key ways to define economic activity:
1) As employment in different individual industries in the North American Industrial Classification System (NAICS). This produces a measure of industry-based economic diversity (which the report refers to as industrial diversity).
2) As employment in eleven broad groups of industries, with the groups reflecting different functions (or roles) local economies play in their larger regions or the national economy. Examples of such roles are when a place serves as a center for health services delivery (e.g., the location of a regional hospital), as a higher education center (e.g., a college town), as a center for technology-intensive manufacturing (e.g., Silicon Valley), or as a government center (e.g., a state capital city). The result is a measure of function-based economic diversity (or functional diversity).
3 This is called an entropy measure of diversity. A more detailed description of the methods and findings summarized in this section is provided in the companion technical report Statistical Portrait of Economic Diversity in Appalachia.
7

ECONOMIC DIVERSITY IN APPALACHIA
3) As employment by occupation. This produces a measure of occupation-based economic diversity (or occupational diversity).
4) As employment in twelve broad groups of occupations, with the groups reflecting the different types and levels of knowledge required for success in various professions. This produces a measure of knowledge-based economic diversity (or knowledge diversity).
Calculating the four basic metrics for counties as well as the multi-county regional economies in which they sit offers a rich picture of local diversity that can inform economic development practice, particularly when benchmarked against appropriate comparison counties and regions and supplemented with additional data on the specific industries and occupations present (and absent) in the place. The notion of appropriate comparison is important. Very large places—urban counties and metropolitan areas—clearly will be more diverse than very small places, simply because the former can support a much larger variety of economic activities. Accordingly, the analysis below describes Appalachian diversity for urban versus rural places.
APPLYING THE MEASURES
Measures of industrial, functional, occupational, and knowledge diversity were calculated for U.S. counties and a variety of other geographies using detailed employment data for 1999, 2009, and 2012.4 Industrial diversity is measured for the 1,000+ six-digit NAICS industries. Occupational diversity is measured for 96 occupational groups defined in the 2000 Standard Occupational Classification (SOC) system.5 Functional and knowledge diversity are calculated by first grouping industries and occupations into relevant clusters and then recalculating the measures. In the case of functional diversity, the 1,000+ NAICS industries were grouped into the eleven clusters reported in Table A1, with each cluster representing a distinct and broad type of economic activity that tends to concentrate in particular locations and which represents a major economic function or role (manufacturing center, government center, etc.). In the case of knowledge diversity, the 96 occupations were grouped into the twelve clusters reported in Table A2, with each cluster constituting occupations that require the same types of knowledge of the workers that hold them.
Counties are the basic units of analysis, with county diversity indexes reported as standardized scores or qualitative rankings based on the relationship of individual measures to average diversity levels. To standardize the diversity measures, each county’s raw diversity score was divided by the average score across all U.S. counties, resulting in a standardized scale where 1.0 represents the average and values greater
4 Sources of the employment data are county-level estimates prepared by Economic Modeling Specialists International (EMSI) for 2009 and 2012, and County Business Patterns data for 1999 that were suppression-adjusted following the methodology in Isserman and Westervelt (2006). 5 Estimates of employment by occupation in each county were developed by assuming that national average industry staffing patterns (as revealed in the Bureau of Labor Statistics’ National Staffing Patterns Matrix) hold in each county.
8
ECONOMIC DIVERSITY IN APPALACHIA
than 1.0 represent above average diversity. Diversity scores were then classified into one of six categories ranging from “Very Low” to “Very High,” according to nearness to the mean diversity score and the overall distribution of diversity values. For example, a diversity score located more than two standard deviations above the mean value is a “Very High” level of diversity while a score less than one standard deviation below the mean is a “Below Average” score.
Diversity indexes were generated for all U.S. counties; for the Appalachian region as a whole; for five sub-regions designated by the Appalachian Regional Commission (see Figure 2; and for U.S. Census Regions. Diversity levels are compared for counties of four types—Urban, Mixed Urban, Mixed Rural, or Rural—defined by Isserman (2005). The Isserman urban/rural typology (see Figure 5) takes into account the population density of a county and the relative size of urban and rural areas within it. Each county’s unique region was identified using 2006-2010 commuting data from the American Community Survey; for a given county, nearby counties are defined as part of its labor market area if they are either senders or receivers of at least five percent of the core county’s workforce.
ECONOMIC DIVERSITY ACROSS THE U.S. AND APPALACHIA
In 2012, industrial diversity in U.S. counties ranged from a minimum in Chattahoochee County, GA—where the measure was only 23 percent of the average level—to a maximum in Orange County, CA—where the measure was nearly 25 percent over the average value. Between those extremes, more than half of all U.S. counties have a level of industrial diversity no more than ten percent above or below the national average. Although counties with above average industrial diversity are more common than those with below average diversity, there are some extremely low diversity counties in the country.
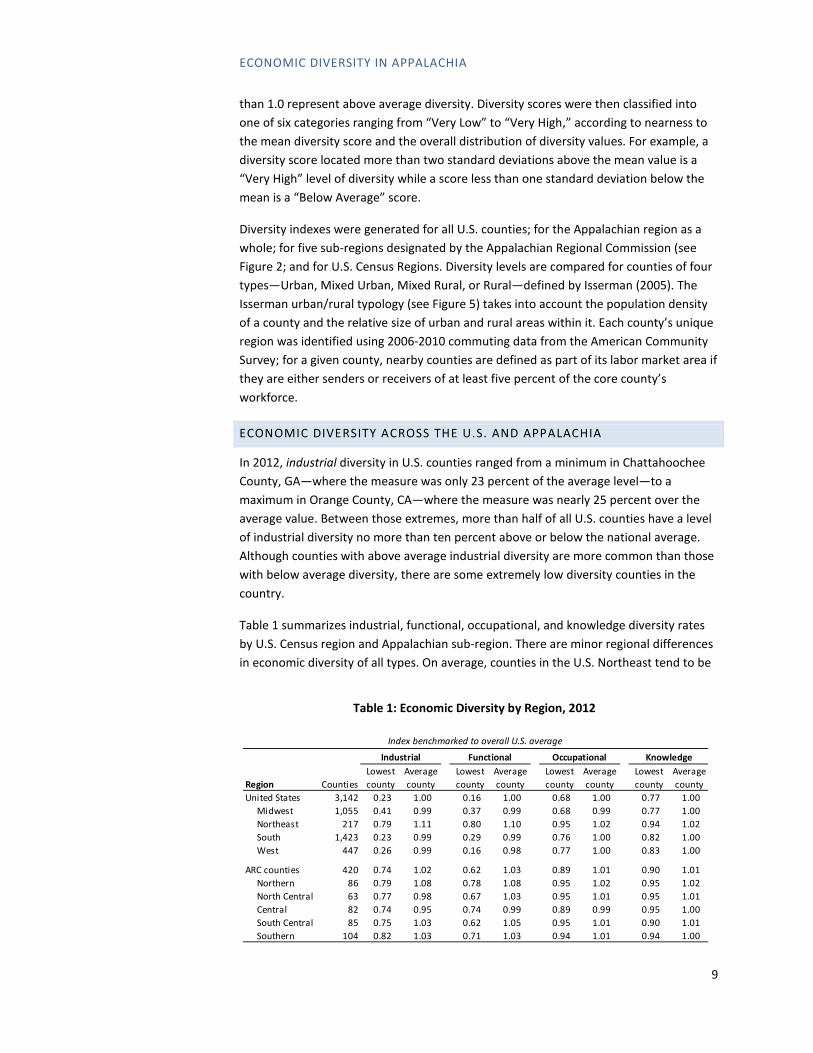
Table 1 summarizes industrial, functional, occupational, and knowledge diversity rates by U.S. Census region and Appalachian sub-region. There are minor regional differences in economic diversity of all types. On average, counties in the U.S. Northeast tend to be
Table 1: Economic Diversity by Region, 2012
Region CountiesLowest county
Average county
Lowest county
Average county
Lowest county
Average county
Lowest county
Average county
United States 3,142 0.23 1.00 0.16 1.00 0.68 1.00 0.77 1.00 Midwest 1,055 0.41 0.99 0.37 0.99 0.68 0.99 0.77 1.00 Northeast 217 0.79 1.11 0.80 1.10 0.95 1.02 0.94 1.02 South 1,423 0.23 0.99 0.29 0.99 0.76 1.00 0.82 1.00 West 447 0.26 0.99 0.16 0.98 0.77 1.00 0.83 1.00
ARC counties 420 0.74 1.02 0.62 1.03 0.89 1.01 0.90 1.01 Northern 86 0.79 1.08 0.78 1.08 0.95 1.02 0.95 1.02 North Central 63 0.77 0.98 0.67 1.03 0.95 1.01 0.95 1.01 Central 82 0.74 0.95 0.74 0.99 0.89 0.99 0.95 1.00 South Central 85 0.75 1.03 0.62 1.05 0.95 1.01 0.90 1.01 Southern 104 0.82 1.03 0.71 1.03 0.94 1.01 0.94 1.00
Index benchmarked to overall U.S. average
Knowledge
Industrial Functional Occupational
9

ECONOMIC DIVERSITY IN APPALACHIA
more diverse, reflecting the higher overall urban density of that region of the country. The least diverse counties in the U.S. tend to be found in the nation’s highly agricultural and rural mid-section, the Great Plains, central Appalachia, and selected mountain and southwestern states (see Figure 1).
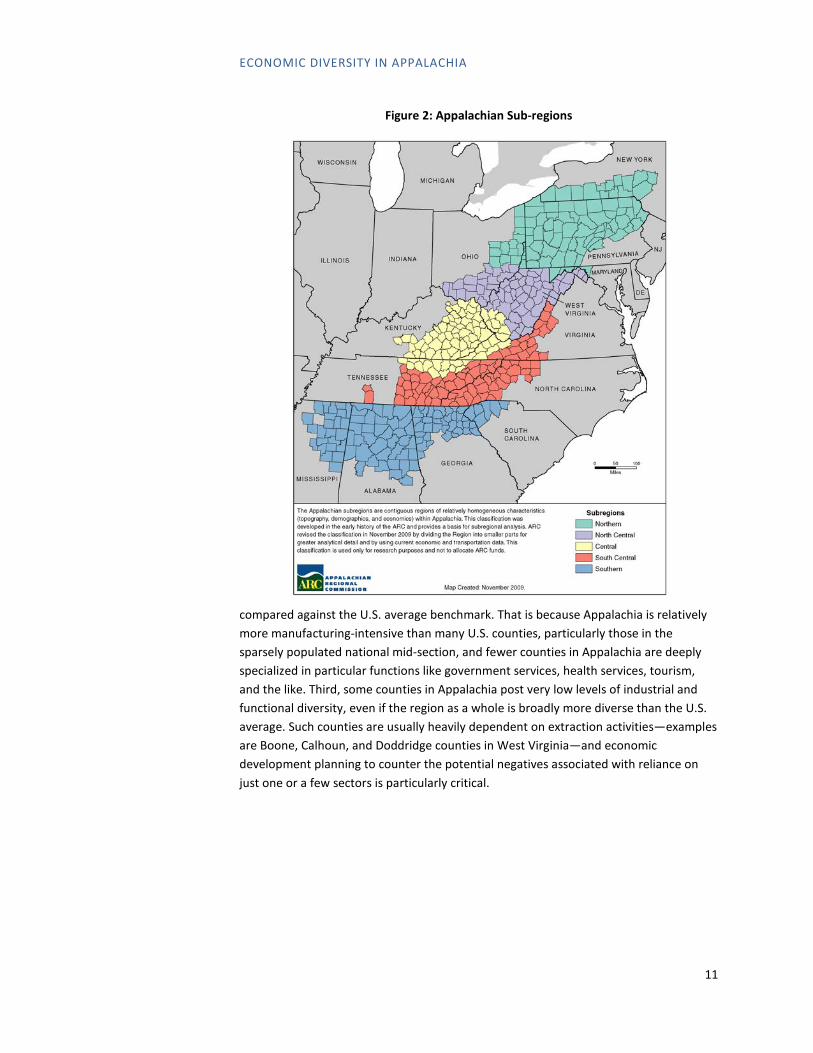
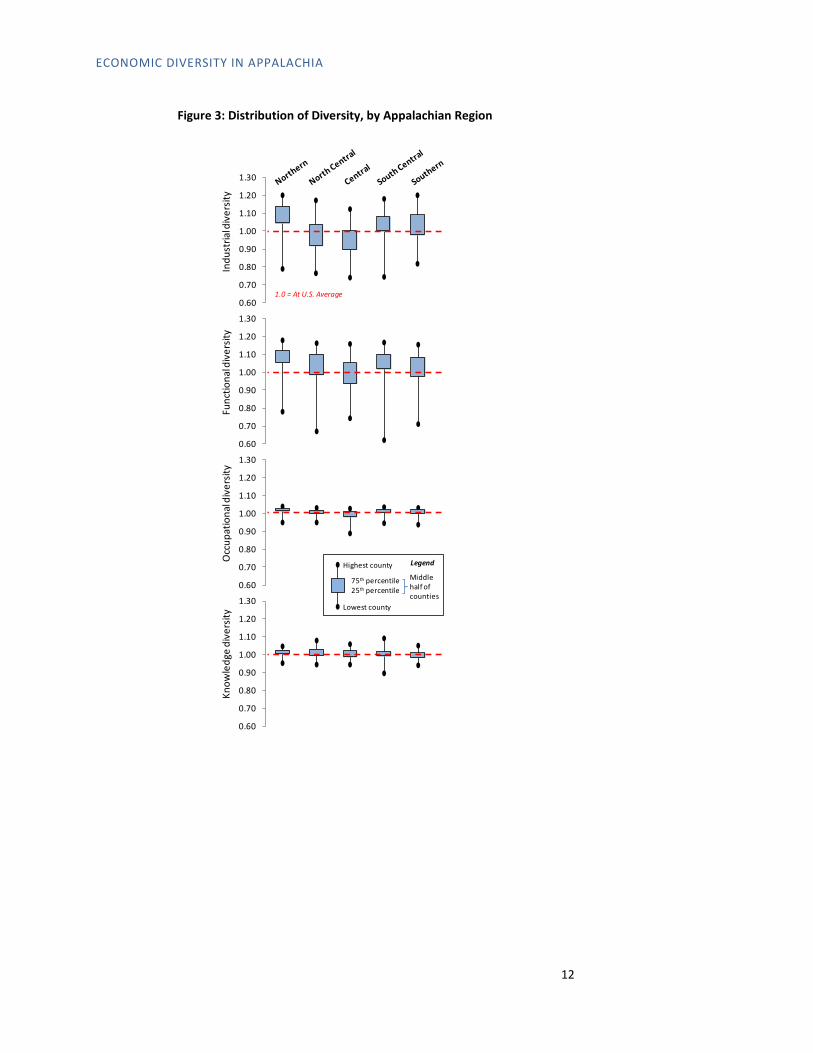
The 420 counties in Appalachia as defined by the Appalachian Regional Commission are, on average, slightly more diverse than the U.S. average. However, there are important sub-regional differences. Figure 2 maps the sub-regions and Figure 3 plots the distribution of each type of diversity by sub-region, showing maximum and minimum values and the range of values in the middle 50 percent of the distribution. The wider the box for a given sub-region in Figure 3, the greater is the range of diversity across those counties that are 25 percent above and below the national average (the middle half of counties). Looking at the top panel in the figure, most counties in the Northern and Southern Appalachian sub-regions have above average levels of industrial diversity, while most counties in the Central sub-region have below average levels of industrial diversity.
Several findings are evident from a scan of the four panels in Figure 3. First, diversity levels vary much more for industrial and functional diversity than for occupational and knowledge diversity. In Appalachia, occupational and knowledge diversity tend to be very similar and are generally near the national average. At the same time, there is some variation, with the Central sub-region posting the lowest levels of occupational and knowledge diversity, consistent with its below average industrial and functional diversity. Second, Appalachia generally fares well in its level of functional diversity when
Figure 1: U.S. Industrial Diversity, 2012
10
ECONOMIC DIVERSITY IN APPALACHIA
compared against the U.S. average benchmark. That is because Appalachia is relatively more manufacturing-intensive than many U.S. counties, particularly those in the sparsely populated national mid-section, and fewer counties in Appalachia are deeply specialized in particular functions like government services, health services, tourism, and the like. Third, some counties in Appalachia post very low levels of industrial and functional diversity, even if the region as a whole is broadly more diverse than the U.S. average. Such counties are usually heavily dependent on extraction activities—examples are Boone, Calhoun, and Doddridge counties in West Virginia—and economic development planning to counter the potential negatives associated with reliance on just one or a few sectors is particularly critical.
Figure 2: Appalachian Sub-regions
11
ECONOMIC DIVERSITY IN APPALACHIA
Figure 3: Distribution of Diversity, by Appalachian Region
0.60
0.70
0.80
0.90
1.00
1.10
1.20
1.30
0.60
0.70
0.80
0.90
1.00
1.10
1.20
1.30
0.60
0.70
0.80
0.90
1.00
1.10
1.20
1.30
0.60
0.70
0.80
0.90
1.00
1.10
1.20
1.30
Indu
stria
l div
ersit
yFu
nctio
nal d
iver
sity
Occ
upat
iona
l div
ersit
yKn
owle
dge
dive
rsity
Highest county
Lowest county
75th percentile25th percentile
Middle half of counties
Legend
1.0 = At U.S. Average
12

ECONOMIC DIVERSITY IN APPALACHIA
URBANIZATION AND SPECIALIZATION
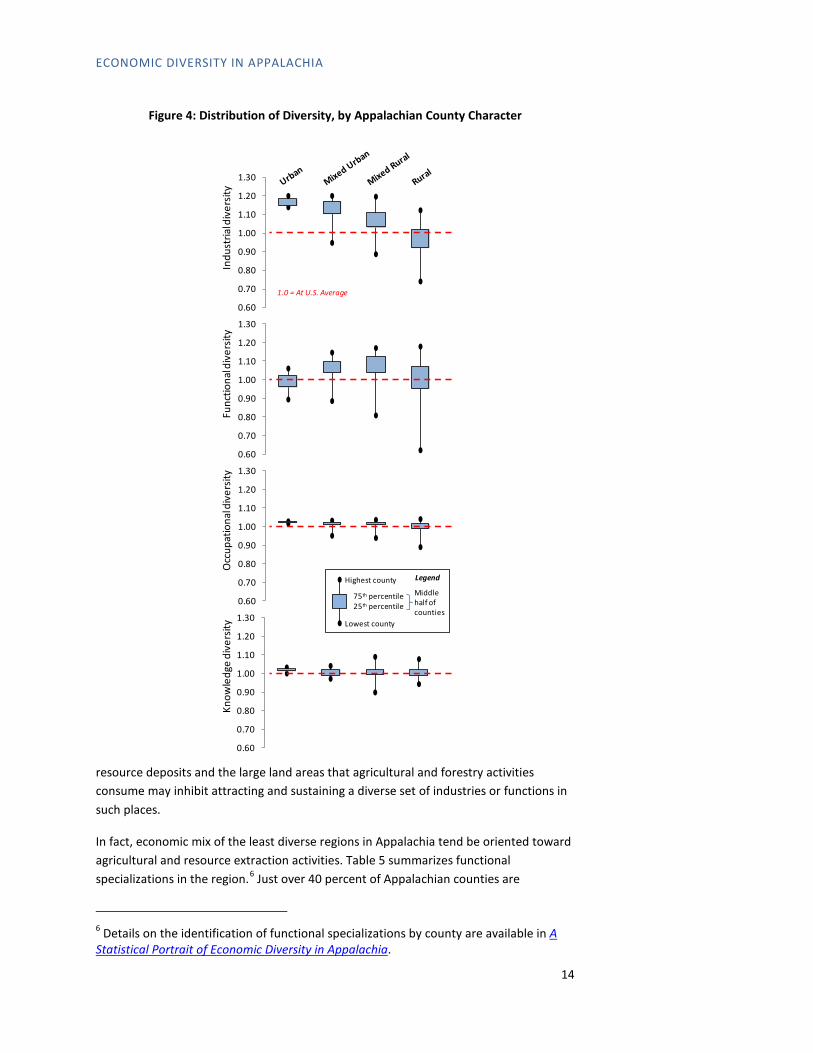
Very broadly, the more urban the county, the more economically diverse it tends to be. Table 2 and Figure 4 summarize diversity levels for counties of four types in Appalachia: urban, mixed urban, mixed rural, and rural. Figure 5 maps county types in the region. Industrial and occupational diversity decline the more rural the county. Functional diversity tends to be higher in mixed urban and mixed rural counties. Mixed urban/rural counties are usually either the suburban counties of metropolitan regions or they are home to the modestly urbanized centers of sparsely populated areas. Hence, they are neither highly specialized in a few urban functions—such as advanced business services—as can be common in the core counties of metropolitan areas, nor do they tend to be dependent on agricultural or extractive industries, as is typical of many highly rural counties.
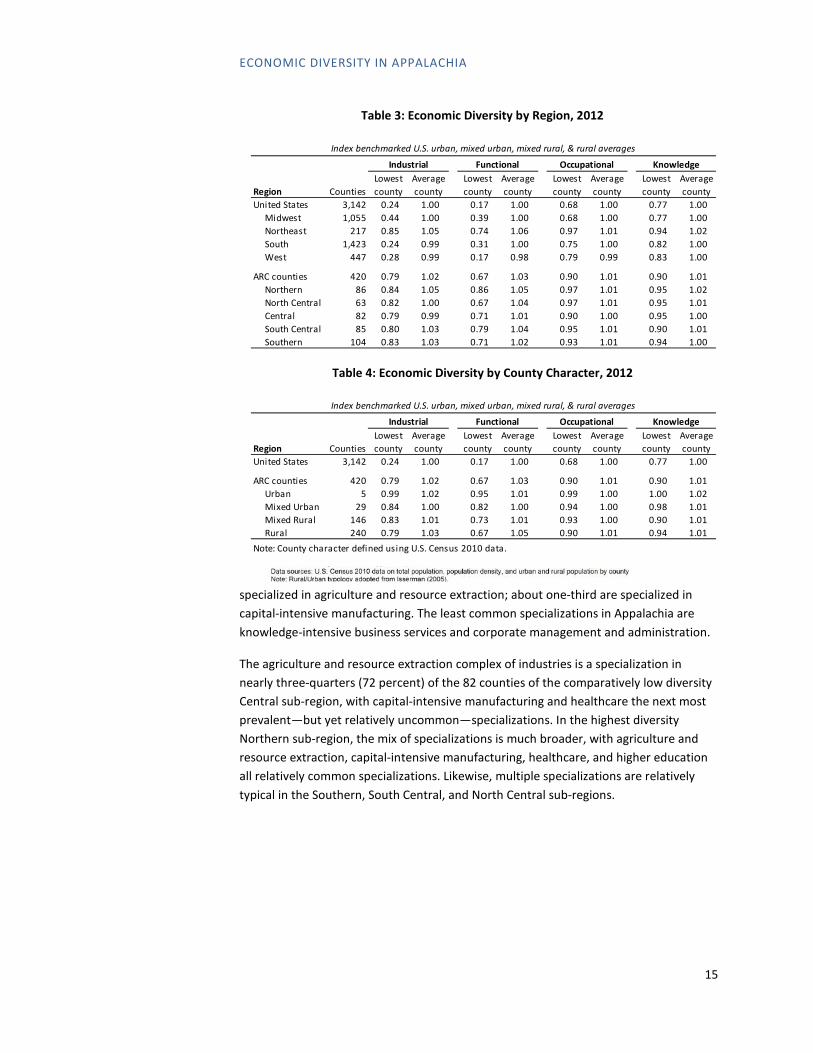
These patterns suggest that a more appropriate benchmark for indexing diversity is the national average for counties of similar levels of urbanization or “character” (urban counties base-lined to the U.S. urban average, mixed urban counties base-lined to the U.S. to mixed urban average, and so on). Tables 3 and 4 and Figures 6 and 7 summarize diversity rates and distributions with the indexes for each county benchmarked in this manner. The general picture is one of variation across Appalachia, with higher diversity in the more industrialized Northern and South Central sub-regions and lower diversity in the Central and North Central sub-regions. Overall, once one controls for the large number of rural and mixed rural counties in Appalachia, most of Appalachia is more diverse than the national average, regardless of diversity type (industrial, functional, occupational, knowledge) or sub-region. This is clearest in Figure 6, at least with respect to industrial and functional diversity. For example, roughly three-quarters of rural counties in Appalachia are more industrially and functionally diverse than their rural counterparts nationwide.
Certainly regional comparative economic advantages make certain locations more suitable for activities linked to particular economic functions. For example, the presence of significant mineral resources and forest stands make some regions more suitable as a location for natural resources-based processing industries. While significant employment in natural resources industries is not synonymous with a lack of functional or industrial diversity, related factors such as the topography associated with mineral
Table 2: Economic Diversity by County Character, 2012
Region CountiesLowest county
Average county
Lowest county
Average county
Lowest county
Average county
Lowest county
Average county
United States 3,142 0.23 1.00 0.16 1.00 0.68 1.00 0.77 1.00
ARC counties 420 0.74 1.02 0.62 1.03 0.89 1.01 0.90 1.01 Urban 5 1.14 1.17 0.90 0.99 1.02 1.03 1.00 1.02 Mixed Urban 29 0.95 1.13 0.89 1.06 0.95 1.02 0.98 1.01 Mixed Rural 146 0.89 1.07 0.81 1.08 0.94 1.02 0.90 1.01 Rural 240 0.74 0.97 0.62 1.01 0.89 1.00 0.94 1.01 Note: County character defined using U.S. Census 2010 data.
Industrial Functional Occupational Knowledge
Index benchmarked to overall U.S. average
13
ECONOMIC DIVERSITY IN APPALACHIA
resource deposits and the large land areas that agricultural and forestry activities consume may inhibit attracting and sustaining a diverse set of industries or functions in such places.
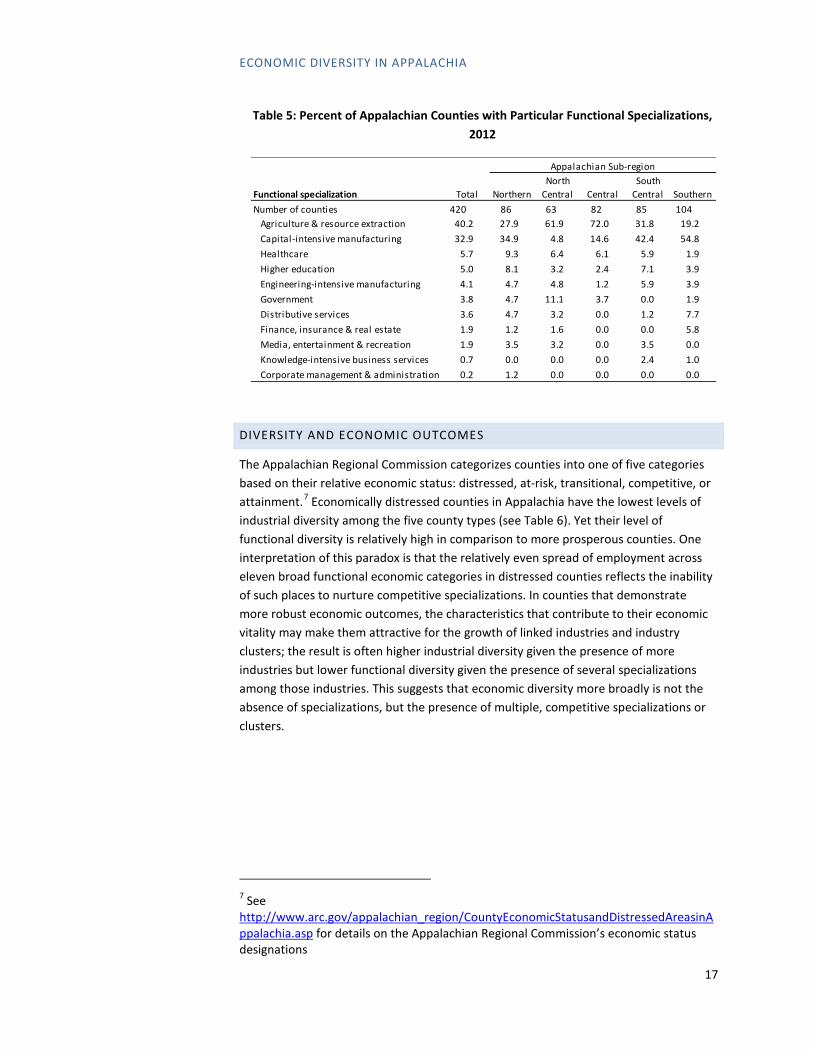
In fact, economic mix of the least diverse regions in Appalachia tend be oriented toward agricultural and resource extraction activities. Table 5 summarizes functional specializations in the region.6 Just over 40 percent of Appalachian counties are
6 Details on the identification of functional specializations by county are available in A Statistical Portrait of Economic Diversity in Appalachia.
Figure 4: Distribution of Diversity, by Appalachian County Character
0.60
0.70
0.80
0.90
1.00
1.10
1.20
1.30
0.60
0.70
0.80
0.90
1.00
1.10
1.20
1.30
0.60
0.70
0.80
0.90
1.00
1.10
1.20
1.30
0.60
0.70
0.80
0.90
1.00
1.10
1.20
1.30
Indu
stria
l div
ersit
yFu
nctio
nal d
iver
sity
Occ
upat
iona
l div
ersit
yKn
owle
dge
dive
rsity
Highest county
Lowest county
75th percentile25th percentile
Middle half of counties
Legend
1.0 = At U.S. Average
14
ECONOMIC DIVERSITY IN APPALACHIA
specialized in agriculture and resource extraction; about one-third are specialized in capital-intensive manufacturing. The least common specializations in Appalachia are knowledge-intensive business services and corporate management and administration.
The agriculture and resource extraction complex of industries is a specialization in nearly three-quarters (72 percent) of the 82 counties of the comparatively low diversity Central sub-region, with capital-intensive manufacturing and healthcare the next most prevalent—but yet relatively uncommon—specializations. In the highest diversity Northern sub-region, the mix of specializations is much broader, with agriculture and resource extraction, capital-intensive manufacturing, healthcare, and higher education all relatively common specializations. Likewise, multiple specializations are relatively typical in the Southern, South Central, and North Central sub-regions.
Figure 5: Rural-Urban County Types in Appalachia
Table 3: Economic Diversity by Region, 2012
Table 4: Economic Diversity by County Character, 2012
Region CountiesLowest county
Average county
Lowest county
Average county
Lowest county
Average county
Lowest county
Average county
United States 3,142 0.24 1.00 0.17 1.00 0.68 1.00 0.77 1.00 Midwest 1,055 0.44 1.00 0.39 1.00 0.68 1.00 0.77 1.00 Northeast 217 0.85 1.05 0.74 1.06 0.97 1.01 0.94 1.02 South 1,423 0.24 0.99 0.31 1.00 0.75 1.00 0.82 1.00 West 447 0.28 0.99 0.17 0.98 0.79 0.99 0.83 1.00
ARC counties 420 0.79 1.02 0.67 1.03 0.90 1.01 0.90 1.01 Northern 86 0.84 1.05 0.86 1.05 0.97 1.01 0.95 1.02 North Central 63 0.82 1.00 0.67 1.04 0.97 1.01 0.95 1.01 Central 82 0.79 0.99 0.71 1.01 0.90 1.00 0.95 1.00 South Central 85 0.80 1.03 0.79 1.04 0.95 1.01 0.90 1.01 Southern 104 0.83 1.03 0.71 1.02 0.93 1.01 0.94 1.00
Knowledge
Industrial Functional Occupational
Index benchmarked U.S. urban, mixed urban, mixed rural, & rural averages
Region CountiesLowest county
Average county
Lowest county
Average county
Lowest county
Average county
Lowest county
Average county
United States 3,142 0.24 1.00 0.17 1.00 0.68 1.00 0.77 1.00
ARC counties 420 0.79 1.02 0.67 1.03 0.90 1.01 0.90 1.01 Urban 5 0.99 1.02 0.95 1.01 0.99 1.00 1.00 1.02 Mixed Urban 29 0.84 1.00 0.82 1.00 0.94 1.00 0.98 1.01 Mixed Rural 146 0.83 1.01 0.73 1.01 0.93 1.00 0.90 1.01 Rural 240 0.79 1.03 0.67 1.05 0.90 1.01 0.94 1.01 Note: County character defined using U.S. Census 2010 data.
Industrial Functional Occupational Knowledge
Index benchmarked U.S. urban, mixed urban, mixed rural, & rural averages
15

ECONOMIC DIVERSITY IN APPALACHIA
Figure 6: Distribution of diversity, by Appalachian region (Index benchmarked to county character)
Figure 7: Distribution of diversity, by Appalachian County Character (Index benchmarked to county character)
0.60
0.70
0.80
0.90
1.00
1.10
1.20
1.30
0.60
0.70
0.80
0.90
1.00
1.10
1.20
1.30
Indu
stria
l div
ersit
yFu
nctio
nal d
iver
sity
Highest county
Lowest county
75th percentile25th percentile
Middle half of counties
Legend
0.60
0.70
0.80
0.90
1.00
1.10
1.20
1.30
0.60
0.70
0.80
0.90
1.00
1.10
1.20
1.30
Indu
stria
l div
ersit
yFu
nctio
nal d
iver
sity
Highest county
Lowest county
75th percentile25th percentile
Middle half of counties
Legend
16
ECONOMIC DIVERSITY IN APPALACHIA
DIVERSITY AND ECONOMIC OUTCOMES
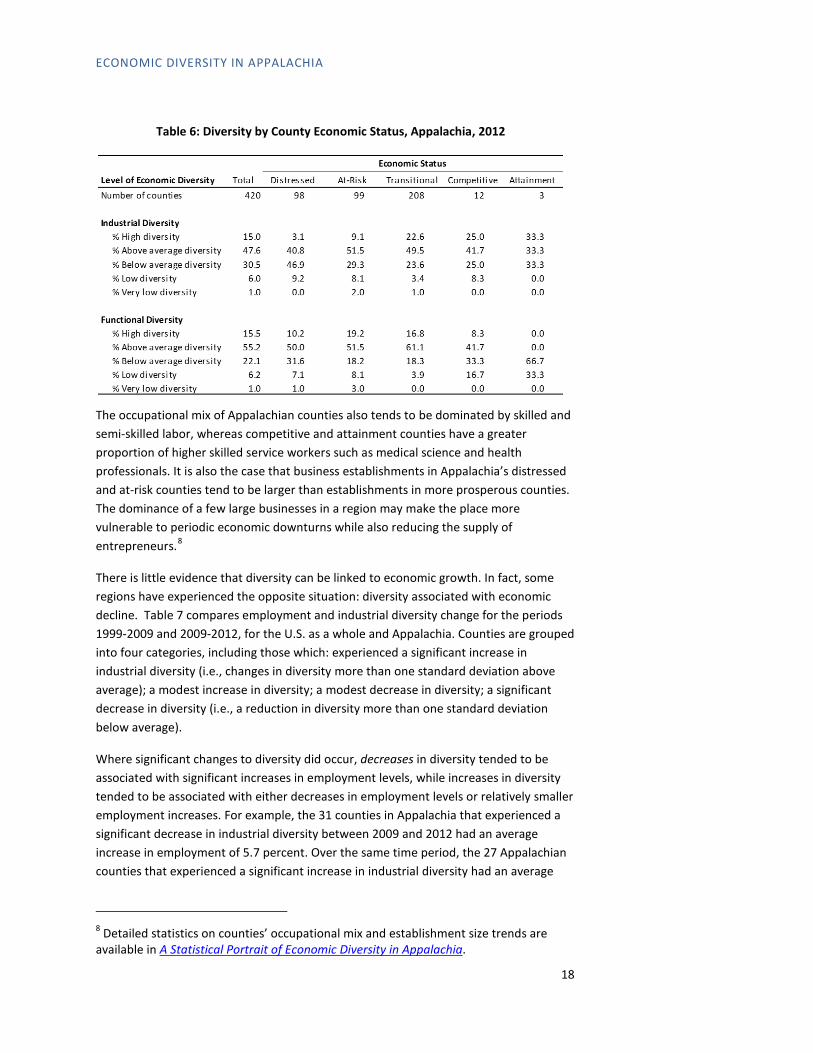
The Appalachian Regional Commission categorizes counties into one of five categories based on their relative economic status: distressed, at-risk, transitional, competitive, or attainment.7 Economically distressed counties in Appalachia have the lowest levels of industrial diversity among the five county types (see Table 6). Yet their level of functional diversity is relatively high in comparison to more prosperous counties. One interpretation of this paradox is that the relatively even spread of employment across eleven broad functional economic categories in distressed counties reflects the inability of such places to nurture competitive specializations. In counties that demonstrate more robust economic outcomes, the characteristics that contribute to their economic vitality may make them attractive for the growth of linked industries and industry clusters; the result is often higher industrial diversity given the presence of more industries but lower functional diversity given the presence of several specializations among those industries. This suggests that economic diversity more broadly is not the absence of specializations, but the presence of multiple, competitive specializations or clusters.
7 See http://www.arc.gov/appalachian_region/CountyEconomicStatusandDistressedAreasinAppalachia.asp for details on the Appalachian Regional Commission’s economic status designations
Table 5: Percent of Appalachian Counties with Particular Functional Specializations, 2012
Functional specialization Total NorthernNorth
Central CentralSouth
Central SouthernNumber of counties 420 86 63 82 85 104
Agriculture & resource extraction 40.2 27.9 61.9 72.0 31.8 19.2Capital-intensive manufacturing 32.9 34.9 4.8 14.6 42.4 54.8Healthcare 5.7 9.3 6.4 6.1 5.9 1.9Higher education 5.0 8.1 3.2 2.4 7.1 3.9Engineering-intensive manufacturing 4.1 4.7 4.8 1.2 5.9 3.9Government 3.8 4.7 11.1 3.7 0.0 1.9Distributive services 3.6 4.7 3.2 0.0 1.2 7.7Finance, insurance & real estate 1.9 1.2 1.6 0.0 0.0 5.8Media, entertainment & recreation 1.9 3.5 3.2 0.0 3.5 0.0Knowledge-intensive business services 0.7 0.0 0.0 0.0 2.4 1.0Corporate management & administration 0.2 1.2 0.0 0.0 0.0 0.0
Appalachian Sub-region
17
ECONOMIC DIVERSITY IN APPALACHIA
The occupational mix of Appalachian counties also tends to be dominated by skilled and semi-skilled labor, whereas competitive and attainment counties have a greater proportion of higher skilled service workers such as medical science and health professionals. It is also the case that business establishments in Appalachia’s distressed and at-risk counties tend to be larger than establishments in more prosperous counties. The dominance of a few large businesses in a region may make the place more vulnerable to periodic economic downturns while also reducing the supply of entrepreneurs.8
There is little evidence that diversity can be linked to economic growth. In fact, some regions have experienced the opposite situation: diversity associated with economic decline. Table 7 compares employment and industrial diversity change for the periods 1999-2009 and 2009-2012, for the U.S. as a whole and Appalachia. Counties are grouped into four categories, including those which: experienced a significant increase in industrial diversity (i.e., changes in diversity more than one standard deviation above average); a modest increase in diversity; a modest decrease in diversity; a significant decrease in diversity (i.e., a reduction in diversity more than one standard deviation below average).
Where significant changes to diversity did occur, decreases in diversity tended to be associated with significant increases in employment levels, while increases in diversity tended to be associated with either decreases in employment levels or relatively smaller employment increases. For example, the 31 counties in Appalachia that experienced a significant decrease in industrial diversity between 2009 and 2012 had an average increase in employment of 5.7 percent. Over the same time period, the 27 Appalachian counties that experienced a significant increase in industrial diversity had an average
8 Detailed statistics on counties’ occupational mix and establishment size trends are available in A Statistical Portrait of Economic Diversity in Appalachia.
Table 6: Diversity by County Economic Status, Appalachia, 2012
18

ECONOMIC DIVERSITY IN APPALACHIA
decrease in employment of 3 percent. In the case of changes between 1999 and 2009, counties that experienced increases in diversity averaged significantly smaller rates of employment increase than did counties that experienced decreases in diversity.9
DIVERSITY AND GEOGRAPHY
For most counties, their economic base depends on the economic activity that takes place in nearby jurisdictions. Workers commute to job centers in adjacent counties, households shop and purchase services outside the county, and firms draw workers from neighboring communities. The average Appalachian county loses more workers via out-commuting than it gains through in-commuting. Comparing own-county industry-based diversity against commuting shed diversity indicates that more diverse counties attract workers from surrounding counties. In all regions of Appalachia, the average ratios of county industrial and functional diversity to regional (commuting shed) industrial and functional diversity are below 1.0 (see Table 8). Regions, by virtue of their larger scale, are generally more diverse. Any particular county’s diversity must be viewed in the context of its labor market area.
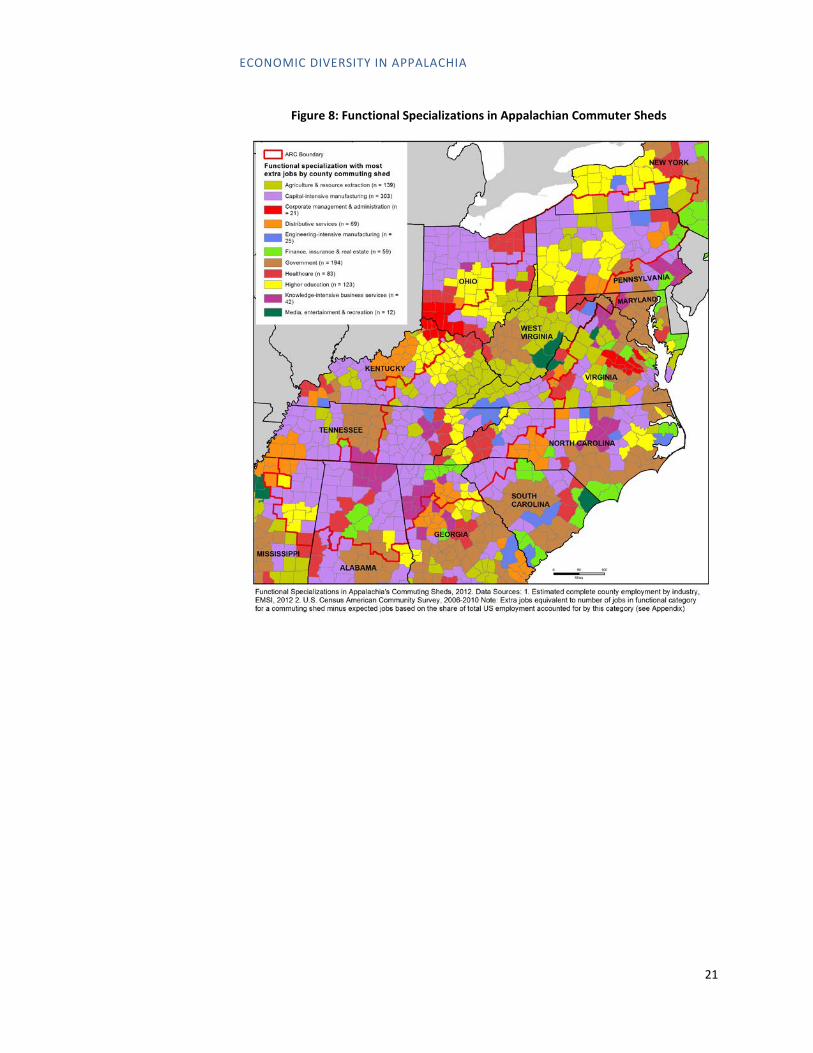
Figure 8 maps the functional specializations of county commuting sheds across the Appalachian states. While an individual county’s functional specialization only accounts for employment within that county, the functional specialization of a county’s
9 One of the more notable recent examples of diversification and decline occurred in Clinton County, Ohio, where DHL closed a major distribution hub that employed 7,000 people. The loss contributed to one of the largest county-level increases in industrial diversity recorded between 2009 and 2012. Within Appalachia, a large increase in diversity occurred in Whitfield County, Georgia where the carpet manufacturing industry continued to shed jobs, reducing the specialization and leaving local serving industries with no replacement for the region’s most significant exporting industry.
Table 7: Industrial Diversity and Employment Growth
Change in industrial diversity
Number of counties
Percent change in
employment
Percent change in diversity
Number of counties
Percent change in
employment
Percent change in diversity
Significant increase (diversification)U.S. counties 162 43.0 108.0 219 -0.8 3.0
ARC counties 21 16.4 96.3 27 -3.0 2.7
Modest increase (diversification)U.S. counties 1,460 33.7 13.7 944 1.5 0.5
ARC counties 174 19.4 12.5 131 1.6 0.5
Modest decrease (specialization)U.S. counties 1,432 46.0 -10.8 1,725 2.8 -0.7
ARC counties 225 25.4 -9.8 239 2.3 -0.8
Significant decrease (specialization)U.S. counties 80 315.5 -43.7 254 8.7 -3.5
ARC counties 8 88.2 -36.7 31 5.7 -3.2
1999 - 2009 2009 - 2012
19

ECONOMIC DIVERSITY IN APPALACHIA
commuting shed accounts for employment in all those counties identified as that county’s major commuting partners. Neighboring counties are much more likely to share the same commuting shed functional specialization than they are to share the same functional specialization for employment within their own boundaries. For example, Pennsylvania State University and other colleges and universities in central Pennsylvania create an identifiable hub of higher education activity at the commuting shed level that tends to be obscured when functional specializations are investigated on a county-by-county basis. Similarly, the prevalence of finance, insurance and real estate and knowledge-intensive business services specializations demonstrate the often far-flung impacts of cities—such as Atlanta, Birmingham, New York City, and Philadelphia—on their surrounding regions. Similarly, the significant number of corporate management and administration specializations in southwestern Ohio and northern Kentucky demonstrate the impact of Cincinnati’s industry mix on the region. The commuting shed perspective on functional specializations also suggests that many counties in Appalachia rely on economic activities that occur outside ARC’s official regional boundary. For example, New York City is part of the commuting shed for Monroe County in northeast Pennsylvania. The knowledge-intensive business services specializations emerging from Atlanta in northwestern Georgia seem to demonstrate a similar phenomenon of significant activity crossing the ARC boundary.
Table 8: Ratio of County to Commuting Shed Economic Diversity by Region, 2012
Region CountiesLowest county
Average county
Lowest county
Average county
United States 3,142 0.21 0.90 0.19 0.91 Midwest 1,055 0.39 0.90 0.33 0.91 Northeast 217 0.68 0.95 0.68 0.97 South 1,423 0.21 0.89 0.25 0.90 West 447 0.26 0.92 0.19 0.93
ARC counties 428 0.68 0.90 0.58 0.92 Northern 86 0.68 0.93 0.71 0.94 North Central 63 0.76 0.89 0.58 0.91 Central 83 0.68 0.87 0.63 0.87 South Central 92 0.74 0.90 0.67 0.92 Southern 104 0.72 0.91 0.65 0.93
Industrial Functional
20
ECONOMIC DIVERSITY IN APPALACHIA
Figure 8: Functional Specializations in Appalachian Commuter Sheds
21

ECONOMIC DIVERSITY IN APPALACHIA
ILLUSTRATIVE EXAMPLES OF DIVERSITY IN CONTEXT
Brief explanations of the examples listed in Table 9 shed further light on the nature of economic diversity across a sample of Appalachian counties.10 Located in metropolitan Atlanta, Cherokee County, Georgia has a high level of industrial diversity and smaller than average establishment sizes. Reflecting a common pattern in many rural and exurban counties, the local school system represents the county’s largest employer with many small establishments in retail trade and finance, insurance and real estate sectors. Cherokee depends heavily on the surrounding region for economic opportunities, with more than 40,000 resident workers commuting outside the county for work. Garrett County, Maryland—another county with a high level of industrial diversity—has above average levels of employment in agriculture and resource extraction, capital-intensive manufacturing, and recreation-related industries tied to the nearby Pittsburgh and Washington metropolitan areas. As with Cherokee, Garrett has a diverse set of smaller-than-average sized establishments that contribute to its industrial diversity.
Montour County, Pennsylvania is a competitive county with below average industrial diversity. There is a large concentration of employment connected to the corporate headquarters of a large, regional medical center, and a large proportion of residents’ earnings are attributable to relatively high wage corporate and healthcare sector jobs. In
10 Extra jobs represent the difference between actual employment in a functional category and expected employment in a functional category if this category accounted for the same percentage of county employment as it did for U.S. employment. See the Appendix for more details on extra jobs and the assignment of functional specializations.
Table 9: Illustrative Examples—Appalachian Economic Diversity and Outcomes, 2012
22

ECONOMIC DIVERSITY IN APPALACHIA
Martin County, Kentucky—a distressed county—jobs associated with coal mining and a federal penitentiary accounts for approximately one quarter of total employment.
Both Centre County, Pennsylvania and McDowell County, West Virginia have low levels of industrial diversity, larger than average establishment sizes, and an identifiable, dominant industry. Centre is home to the main campus of Pennsylvania State University, which accounts for more than 24,000 employees and is a significant regional employment draw. McDowell contains significant employment in the mining industry that pays higher wages than many other jobs in the county. This concentration of earnings in McDowell likely contributes to the county’s distressed status, with those not employed in mining earning relatively low wages. In Centre, on the other hand, earnings are distributed relatively more evenly and the county enjoys transitional status.
23

ECONOMIC DIVERSITY IN APPALACHIA
DIVERSITY AND DEVELOPMENT STRATEGY IN APPALACHIA
Mines and mills dominated the economies of many Appalachian communities for years. The dependence that many communities had on these dominant industries and employers left many communities highly vulnerable to economic shocks. When those industries declined, communities had few options for charting a new economic trajectory. In light of this, many communities now identify a more diversified economy as a key economic development goal. In doing so, they hope to better position themselves to either mitigate economic risk or leverage new economic growth opportunities. Much like investors seeking a diversified portfolio, communities feel more secure when they can rely on a variety of employment and wealth generators.
However, demonstrating a clear connection between increased diversity and specific diversity strategies can prove difficult. To understand this issue in a more in-depth manner, the project team sought to identify the key features of strategies in diverse communities, or communities that have experienced increases in diversity and economic growth. This research included site visits and telephone interviews with key stakeholders in an effort to develop case studies about ten counties located in different areas of the Appalachian region. This section summarizes the findings from the case study research.11 First, the report provides a brief review of the process used to select the ten case studies. Then, the report summarizes the findings from that research as well as the common themes and trends that emerged from the case studies.
CASE STUDY SELECTION
The project team began by using measures of diversity, growth, and economic distress, as defined earlier in this report, to identify a short list of potential case study counties. As part of the effort to narrow the candidates, researchers examined the economies of these counties and conducted preliminary research about the economic development policies that different counties employed. This provided insights about whether the county or its broader region had identified economic diversity as an issue, or if the county or region were involved in initiatives to strengthen and diversify the county or region’s economic base. The subsequent selection criteria considered the following factors:
• Whether the county or its surrounding region had a current economic development strategy;
• Whether the county leaders were engaged in some kind of meaningful economic development efforts;
• Whether the county was participating in current multi-county, regional initiatives.
11 A more detailed description of the case studies, and the methods used to select the cases, can be found in the companion technical report Case Studies in Economic Diversification.
24

ECONOMIC DIVERSITY IN APPALACHIA
Based on this preliminary research and consultation with ARC staff, the research team selected ten counties for case studies. It is important to note that these case studies are not necessarily examples of best practices; some case studies feature counties with very high levels of economic diversity while others have very low diversity. The ultimate goal was to select a set of case studies that spoke to a wide range of diversity-related issues. The project team conducted the case study research through a series of site visits and phone interviews conducted in April and May of 2013. During the course of these case studies, the project team spoke with numerous stakeholders including local economic development and planning organizations, educational institutions, community groups, county and local government, and representatives from the business community. These stakeholders provided information about their community’s economic development activities, and the role that economic diversity goals played in motivating those activities.
CASE STUDY FINDINGS
The ten case study counties evidence a number of diversity-related issues. As noted above, the research team sought counties that had diverse economies, were lacking diverse economies, or had a recent change in diversity. The team also sought to include cases from both urban and rural counties throughout the ARC region. Additionally, the case studies represented a mix of functional specializations, so the selected counties had economies driven by different industries, including manufacturing, education, or extractive industries, as well as some places with no explicit dominant specialization. Listed below are the selected case study counties:
• Tioga County, NY • Lycoming County, PA • Garrett County, MD • Upshur County, WV • Knott County, KY • Washington County, VA • Rutherford County, NC • Pickens County, SC • Lauderdale County, AL • Oktibbeha County, MS
The case analyses focus primarily upon how each community approaches the issue of diversity in economic development strategy and policy, as well as the actions taken to achieve greater economic diversification. The cases also highlight many key issues or lessons learned from each county’s individual experience.
TIOGA COUNTY, NEW YORK
Tioga County, NY is a rural county in New York State’s Southern Tier. Its largest community is Owego, NY, but given that it is situated between Binghamton, Ithaca, and Elmira, it largely serves as a bedroom community to those relatively larger metro areas. The county has a long history of relying heavily on single, large employers beginning
25

ECONOMIC DIVERSITY IN APPALACHIA
with Endicott Johnson, then IBM, and now Lockheed Martin. This dependence has created both great opportunity and great risk. Lockheed Martin recently employed as many as 4,000 employees in relatively high-paying jobs, but lost nearly 1,600 jobs due to the loss of the Marine One Presidential Helicopter contract. These job losses highlighted the extent to which the county relies upon this one employer, and in a sense shows the county’s crisis of diversity.
The future of Lockheed Martin’s facility lies with decisions being made by Congress and Lockheed Martin’s corporate leadership. Shrinking defense budgets have forced Lockheed Martin to make a number of strategic corporate site location decisions in recent years. Local leaders have very limited influence on these external factors. In essence, the locus of control over activities that could significantly alter the region’s economic trajectory is found outside of the county and outside of the region.
In spite of these forces, local policymakers and practitioners have identified local strategies to advance Tioga County’s diversification and economic development goals. Many of these efforts rely on practitioners operating in a collaborative manner. Tioga is a small county and lacks the resources to pursue extensive business recruitment and attraction—activities that might not necessarily be appropriate for a small, rural county anyway. Instead, county economic development stakeholders focus on strengthening relationships both locally and regionally. Continuous efforts are made to build cohesion among local service providers (e.g., Tioga County Department of Economic Development and Planning, the Tioga County Industrial Development Agency, the local Chambers of Commerce, or the Small Business Development Center at nearby Binghamton University in Broome County) so that businesses receive seamless delivery of services. Building these connections has also helped to support entrepreneurial efforts. For instance, potential entrepreneurs can receive mentoring from SCORE (Service Corps of Retired Executives) representatives.
Local leaders have also made efforts to leverage broader regional connections. These opportunities have come through regional information sharing with stakeholders in Broome County (Binghamton) to the east and Chemung County (Elmira) to the west. As a result, local officials feel that they have avoided wasteful beggar-thy-neighbor activities by not providing incentives to companies that are staying in the region, but just changing their address. Tioga County has further applied a regional lens by looking at opportunities available in neighboring Pennsylvania. While New York State currently bans the fractured drilling (“fracking”) for natural gas, Tioga County is home to about a dozen support companies that are involved in Marcellus Shale drilling in Pennsylvania counties immediately to the south. Tioga has also embraced its role as a bedroom community and has invested in making itself an appealing place for workers in neighboring counties.
The challenge with many of these more locally-based diversification efforts is that they tend to represent approaches that are far more incremental in nature than the problems they are meant to address. Ten or twenty new entrepreneurs per year, for instance, cannot outweigh the loss of 1,600 good paying manufacturing jobs at Lockheed Martin. This conundrum is a real issue facing many places like Tioga County
26
ECONOMIC DIVERSITY IN APPALACHIA
that rely heavily on one large employer or industry, as those economic pillars cannot be easily replaced.
LYCOMING COUNTY, PENNSYLVANIA
Lycoming County is home to 117,000 residents, with Williamsport being its largest community. Its economic base has traditionally focused around activities such as lumber production and manufacturing. More recently Lycoming County and Williamsport, PA have become a major activity center for the natural gas industry. Direct jobs in natural gas have grown from 140 in 2009 to over 1,800 in 2012.12 This growth has been evident not only in industries that directly support natural gas, such as trucking, but also more indirectly in industries such as retail and accommodations. Consequently, the creation of a new regional economic specialization (natural gas) has helped to diversify the existing economic base.
Lycoming County took advantage of the Marcellus Shale boom not only because of its proximity to this natural resource, but also because it made investments in several ready-to-use industrial sites that positioned the county for opportunities as they arose. Recognizing the transformative potential of the natural gas industry, area stakeholders wanted to ensure that they were adequately prepared. Once it became clear that these activities were going to significantly accelerate the regional economy, this planning began in earnest. As part of this preparation, approximately 10 area stakeholders went to Fort Worth, TX to see how that community had been affected by rapid natural gas development. They sought to understand not only how the gas boom would affect economic development, but also the area’s schools, public services, health care providers, and infrastructure among other areas. In short, they wanted to learn from the Fort Worth experience to minimize the development’s unintended consequences.
The natural gas boom helped Lycoming County grow, even during the recession. Yet as noted above, county leaders continue to emphasize the importance of promoting economic diversity and not becoming over-reliant on natural gas.13 There is a clearly stated desire to ensure that Williamsport remains more than just a gas town. The Williamsport/Lycoming Chamber of Commerce has emphasized business retention and expansion efforts as a foundation for maintaining and improving the county’s economic diversity. As a result, the Chamber invests significant time into meeting with non-gas companies to ensure that their needs are being met, and investments in those firms are not crowded out by the current interest in natural gas. Even though natural gas has been vitally important to growth, other industries are critical for the region’s overall stability.
The natural gas boom is fostering a stronger interest in broadening the industrial base, and other efforts are also underway to ensure that the region leverages that growth
12 Data provided by Economic Modeling Specialists International (www.economicmodeling.com) 13 http://www.williamsport.org/pdf/PlanofAction.pdf (Page 3)
27
ECONOMIC DIVERSITY IN APPALACHIA
while limiting its over-reliance on natural gas as an economic engine. Local leaders also have made efforts to diversify the area workforce’s skill base. Pennsylvania College of Technology (Penn College) has made great efforts to prepare the area workforce for the gas boom, but the College has also done this with diversity in mind. Since 2009, Penn College has trained approximately 10,000 people for natural gas-related activities. The College has used customized, non-degree programs extensively to provide much of this training. When Penn College sought to invest in new degree programs, they intentionally avoided creating programs that were specifically dedicated to natural gas. Based on a regional workforce needs analysis, they instead sought to develop programs that were not only relevant to the natural gas industry, but also had broader applicability to the workforce needs of other industries. As a result, they put resources into developing new programs in mechatronics (which also supports area manufacturers) and emergency management (which also supports public services and utilities).
GARRETT COUNTY, MARYLAND
Garrett County is the State of Maryland’s western most county and is known for being home to Deep Creek Lake, a prominent Mid-Atlantic resort area. The Garrett County experience represents a strong example of how a community can respond to a diversity crisis. In 1996, Bausch and Lomb closed its glasses factory in Oakland (the county’s largest community) and relocated 600 jobs to San Antonio, TX. The closure’s economic shock to this relatively rural county served as the impetus for leaders to initiate a strategic planning process that successfully focused efforts on creating a stronger, more diverse economy.
The loss of Bausch and Lomb created a crisis atmosphere that spurred community action. The community responded with an honest assessment of the county’s existing strengths, weaknesses, opportunities and threats (SWOT), and that discussion led to the development of a short, concise strategic plan focused on leveraging investments in the county’s existing assets and infrastructure for the purpose of growing and diversifying the Garrett County economy. Since its adoption, the plan has been routinely updated with significant input and consensus from five key Garrett County organizations, including the Garrett County Economic Development Department, Garrett County Development Corporation, Garrett County Chamber of Commerce, Garrett County Community Action Committee, and Garrett College.
Over the past 20 years, the county has grown and diversified by becoming a destination for second-home buyers and tourists. The area has been quite effective at leveraging its proximity to the Washington, DC metro area to attract weekend visitors, vacation-home buyers, and retirees. In addition to connecting to these regional sources of demand, the county—through its economic development planning process—has consistently sought to understand the issues facing companies in multiple sectors such as manufacturing, retail, real estate, tourism, and agriculture and national resources. By regularly speaking with firms in these sectors, county stakeholders have crafted strategies to overcome impediments to business growth. The community has also worked to improve the environment for entrepreneurs by expanding the county’s broadband infrastructure
28
ECONOMIC DIVERSITY IN APPALACHIA
through the efforts of the One Maryland Broadband Network and support from the Appalachian Regional Commission. The County has embarked on several workforce development initiatives led by the President of Garrett College. One of these initiatives has been the Garrett Promise, which provides Garrett County high school graduates and GED completers with scholarships with full tuition payment in their graduation year.
It is important to note that designing strategies to achieve growth and diversification means little if those initiatives are not effectively implemented. Garrett County exemplifies the benefits of an ongoing planning process. Garrett County’s current Economic Development Plan—updated in 201314—is a broad-based and detailed plan that has wide community support. First and foremost, systematically updating the plan through an engagement process designed to build leadership consensus ensures more effective implementation. As part of this effort, leaders identify and agree on ways to measure the strategies’ outcomes as a way to demonstrate progress, and provide accountability. By revisiting their strategy every few years, Garrett County leaders also seek to ensure that the plan continues to meet community needs and responds to changing economic conditions. Ultimately, this proactive “plan and do” process results in an economic development approach that is more proactive and less ad hoc.
UPSHUR COUNTY, WEST VIRGINIA
Upshur County, WV is a small, rural county located in the Alleghany Mountain foothills, with its largest community being Buckhannon, WV. Upshur County’s economy relies heavily on natural resources as the county possesses a wide array of resources ranging from lumber to coal and natural gas deposits. These activities, combined with a long-standing manufacturing base, have been the county’s historical economic drivers. Given this history, the county has consistently maintained diversification as an economic development goal. In those efforts, the county focuses on regionally-oriented economic development efforts in three key sectors— agriculture, hardwood products, and tourism.
The county currently participates in a regional Rural Jobs and Innovation Accelerator grant (sponsored by multiple Federal development agencies) that focuses on promoting local foods and growing its agriculture sector. This grant provides support for creating and strengthening food value chains between area firms and others throughout the state. For instance, one current local effort—led by a local “agripreneur”—helps local organic growers produce for homes and restaurants and creates a community kitchen for food processing. The region is also seeking to grow its forest products industry through a regional Hardwood Alliance Zone established to capture value-added timber product activities. The region has abundant natural hardwood resources as well as the local sawmills and other services needed to grow the region’s value-added production. This regional collaboration focuses on marketing and investing in the infrastructure needed to attract value-added hardwood companies. Regional leaders have also sought
14 http://www.garrettcounty.org/resources/economic-development/pdf/GCED-2013-Strategic-Plan-Refresh-Process.pdf
29
ECONOMIC DIVERSITY IN APPALACHIA
to promote and grow the tourism sector. Three counties—Randolph, Lewis, and Upshur—recognized that each county alone does not provide sufficient activities for tourists, but the counties together can bundle their events and attractions to appeal to overnight visitors. As a result, leaders are creating a tourist corridor and marketing the activities as “33 Things To Do Along Route 33.”
This spirit of collaboration has emerged within Upshur County itself. Significant private sector leadership, particularly in the town of Buckhannon, has advanced “CreateBuckhannon”—a locally driven effort designed to upgrade the county seat’s amenities. Local volunteers with no formal organizational structure are managing the effort. The group conducts a regular weekly lunch meeting open to all to identify projects and manage their implementation. Through this venue, the community secured a USDA grant to build the farmers’ market, a grant to create a downtown park, provided new raised beds at the senior center, restored a Civil War-era home, and built bike and walking trails throughout town. By making the community a more appealing place to live and work, local leaders hope to create an environment more conducive to entrepreneurs and skilled workers. The work of this informal group has brought energy to community residents and created a positive image for those outside the community.
KNOTT COUNTY, KENTUCKY
Located in the eastern Kentucky coalfields, Knott County is a distressed rural county. It is currently home to 16,124 residents and has a long trend of out-migration and population decline. Mining is the county’s single largest employing sector and employment in this sector has declined from almost 1,500 jobs to just under 900 jobs between 2009 and 2012. The mining job losses contribute greatly to an unemployment rate that, at 15.9 percent,15 remains almost twice the state and U.S. rate. This dependence on mining has led to a local economy that lacks diversity. This is an issue identified by the region, and within Knott County efforts to address this issue are based around using the county’s assets to promote activities like tourism.
Several large initiatives form the foundation of the County’s tourism development efforts. One key piece of this effort was the creation of the Kentucky School of Craft which was funded in part by the State of Kentucky’s Community Development Initiative (CDI) and operated as part of Hazard Community and Technical College (HCTC). The idea behind the school was to offer residential opportunities for people to train to become master craftsmen in Appalachian crafts. The strategy also included the establishment of the Kentucky Appalachian Artisan Center and incubator on Hindman’s Main Street as a potential retail outlet for artisanal work. The school was launched with CDI support but, for a number of reasons—including staff turnover, lack of housing opportunities for students, and limited demand for long-term residential programs—it has not yet had the expected economic impact. In spite of this, the CDI process helped local residents witness the power of collaboration and engagement among local citizens.
15 U.S. Bureau of Labor Statistics Local Area Unemployment Statistics, June 2013.
30

ECONOMIC DIVERSITY IN APPALACHIA
One of the outgrowths of the CDI experience was local leadership focused on adventure tourism. Knott County’s relative isolation does not bode well for the recruitment of outside industry, but the county does have entrepreneurial spirit in the region’s “hollows” and the emphasis on tourism is designed to capitalize on that spirit. While the School of Craft combined with the focus on heritage tourism was aided by the state’s CDI, energy for adventure tourism came from county leadership, public and private. In 2006, county leaders made a priority of creating an adventure tourism park. As a legacy of the county’s dependence on natural resource extraction, there are thousands of acres of reclaimed strip mine and forest lands uniquely suited to a range of outdoor recreational activities. In 2007, Mine Made Paradise Park opened – a partnership between a prominent regional coal company, local residents and the county. The park covers over 43,000 acres and has 100 miles of trails for off-road biking and additional horseback riding trails and stables.
The tourism-focused efforts in Knott County offer the potential for diversifying the economy, or at the very least replacing some of the jobs lost in the coal industry. The School of Craft effort has experienced some difficulty because it has not been closely linked to other tourism activities. The grassroots adventure tourism effort has helped to increase in the number of visitors (a key metric for tourism activities). Furthermore, this success has helped to support local efforts to expand facilities and trails at the park. But much like the School of Craft effort, the adventure sports park has much more room to grow. As it currently operates, the park is relatively self-contained with park visitors camping on the grounds rather than staying in lodging off-site. This limits the potential impact the park might otherwise have on the broader county and regional economies. As the county’s tourism efforts continue to grow, they are more likely to create greater diversification, as more visitors will likely create greater opportunities in other activities such as lodging, restaurants and retail. A broader regional effort designed to create an adventure and heritage tourism brand and destination would further increase the economic impacts.
WASHINGTON COUNTY AND BRISTOL CITY, VIRGINIA
Washington County, VA and the independent city of Bristol, VA are located along the Interstate 81 corridor in southwest Virginia. Bristol is on the Virginia-Tennessee Border which runs down the city’s Main Street. Washington County has not been overly dependent on a single industry, although it has historically been a manufacturing dependent area. Development efforts are seeking to capture a number of different opportunities, and several locational factors such as the interstate corridor, several downtown areas, and access to multiple cultural and outdoor amenities have largely shaped these economic development strategies. As a result, the area’s economic development strategies have three relatively distinct focus levels—County, City, and region.
Led by the county commission and the county economic developer, Washington County has focused its economic development activities on commercial and industrial development along the I-81 corridor. The County seeks to attract not only projects related to manufacturing and distribution, but they are also looking for ‘destination’
31

ECONOMIC DIVERSITY IN APPALACHIA
retail like Bass Pro Shop or Cabela’s. To date these efforts have been largely successful; development at one of two major interchanges along I-81 is almost complete and significant new development is planned for the second.
The economic development focus within the area’s two largest cities—Bristol and Abingdon—differs significantly from the county, and instead focuses on downtown revitalization, supporting small business owners and tourism. There is a growing recognition, particularly in Bristol, that entrepreneurial and small business support services are needed to help local businesses actually succeed in their main street locations. Bristol also has an active Main Street program—Believe in Bristol—driven primarily by private sector leadership. Private sector leaders frequently play a catalytic role in advancing Bristol’s tourism development and main street projects. This has been most evident through the construction of the Birthplace of Country Music museum where support for the construction of this museum came from the private sector and not local government.
Complementing these local efforts, multi-county tourism efforts have helped to achieve important successes including the completion of the Birthplace of Country Music museum. Furthermore, Washington County has benefited from the Crooked Road, a southwest Virginia music heritage trail that bisects the county. Other multi-county efforts benefiting Washington County include ‘Round the Mountain’—southwest Virginia’s artisan network. These types of regional efforts allow communities to connect the economic value generated from existing assets with potential external demand. To further support these efforts, Heartwood opened in 2010 as an artisan center located along I-81. Heartwood, funded with ARC and state tobacco trust funds, serves as the region’s gateway to heritage and cultural tourism.
The three elements of the area’s economic development— commercial and industrial development, main street development (in both Bristol and Abingdon) and tourism—serve as the basis for developing a more diverse regional economy. However, the efforts have resulted from independent action that may require much greater participation and a more cohesive shared vision to be successful in the future. Despite the inherent difficulties in getting very different sets of actors to collaborate in the region, aligning the industrial development, Main Street, and tourism strategies through a regionally cohesive vision could help ensure more impactful economic outcomes.
RUTHERFORD COUNTY, NORTH CAROLINA
Located in North Carolina on its South Carolina border, Rutherford County lies in the midst of the area between Asheville, Charlotte, and Greenville-Spartanburg. A distressed county, Rutherford has lost employment over the previous decade and has an unemployment rate of 12.7 percent that remains well above average compared to both the U.S. and North Carolina.16 Rutherford County traditionally relied on manufacturing to provide local jobs. This area included a number of textile mill towns like
16 U.S. Bureau of Labor Statistics Local Area Unemployment Statistics, June 2013.
32

ECONOMIC DIVERSITY IN APPALACHIA
Rutherfordton, Forest City and Spindale, but the jobs they offered disappeared to China during the first decade of the 2000s, well before the Great Recession of 2008-2009.
Even so, manufacturing remains an important part of the county’s economy. Yet, the county’s leaders understand that they must find alternative sources for local employment. For instance, the county has attracted several data centers—most notably Facebook. The county also has a growing in-migrating retiree population, particularly around Lake Lure and Chimney Rock in the western part of the county.
Given the once dominance of textiles in the mill towns of Rutherford County, it is no surprise that county leaders consider economic diversification as an important goal in the region’s Comprehensive Economic Development Strategy (CEDS). The Isothermal Planning and Development Commission, in particular, provides leadership for Rutherford and its neighboring counties17 in designing and implementing strategies that encourage new industry development. As a result of the CEDS process, regional leaders are now implementing several key initiatives to transform the regional economy from its traditional reliance on textile manufacturing to prepare for other industries. For instance, the county is working to upgrade several older, obsolete industrial buildings. The Region C Workforce Development Board (representing Rutherford, McDowell, Cleveland, and Polk counties) is partnering with two neighboring workforce boards on a regional literacy initiative and is promoting greater usage of worker certifications (e.g., ACT WorkKeys) among employers and workers, sponsoring job shadowing programs, and facilitating efforts to communicate employer skills requirements to students and other potential workers. As part of this effort, the Rutherford County EDC is also seeking to better connect area firms to available services such as those offered by the SBTDC, Industrial Extension Service, Community College, or local utilities.
Rutherford County also seeks to diversity its sources of wealth as well as its employment base. For example, the county has support retirement attraction efforts that leverage several natural assets (e.g., the Blue Ridge Mountains, Lake Lure). These new retiree residents bring new money into the community through the spending of their retirement savings, Medicare payments and/or Social Security income. This spending supports other economic activities such as construction, local retail, and recreational facilities like golf courses or equestrian facilities. Further efforts are being made to grow Rutherford County’s attractiveness as a retirement destination by improving health care services, broadband access and housing options.
PICKENS COUNTY, SOUTH CAROLINA
Pickens County is located in Upstate South Carolina and is part of the Greenville-Spartanburg MSA. Local economic developers often refer to three different parts of Pickens County: 1) a western section focused on the city of Clemson and Clemson University—South Carolina’s land grant university, 2) a central section that remains very rural and focused on agriculture, and 3) an eastern section that serves as a bedroom
17 The service area of the Isothermal Planning and Development Commission includes Rutherford County, as well as Cleveland, McDowell and Polk counties.
33
ECONOMIC DIVERSITY IN APPALACHIA
community to Greenville, SC. Historically, the Pickens County economy relied on cotton and textile manufacturing to drive the county’s economy. More recently, Clemson University and urban sprawl form Greenville-Spartanburg have become much more important economic drivers.
Competitiveness issues, more so than diversification, motivates Pickens County economic development efforts. The county’s economic development efforts focus on growing industry clusters such as automotive, plastics and metal working, and medical devices and pharmaceuticals. To support this cluster development, Pickens County—under the auspices of the county government and Alliance Pickens (the county’s public/private economic development arm)—pursues an economic development strategy focused largely on attracting new firms, primarily manufacturers. Pickens County’s primary selling points have been its lower labor and business costs, but it has also sought to leverage its proximity to the automotive manufacturing cluster located around Greenville/Spartanburg. Like many other communities in the southern Appalachians, Pickens County also tries to capitalize on its natural beauty to attract tourists and retirees. Complementing the county’s business attraction efforts, local economic developers describe the high-end residential and resort communities as assets that appeal to visiting corporate executives.
Pickens County also clearly benefits from the presence of Clemson University and its economic ripple effects. For instance, not only is Clemson University a major employer in the county, but also faculty, staff and student spending represents significant drivers for the county’s retail activity and real estate market. However, the collaboration between the county and Clemson University currently appears relatively limited, providing many opportunities to more fully leverage economic spin-offs from the university.
Similarly, Pickens County benefits from its proximity to the nearby Greenville job center and the region’s automotive manufacturing cluster. The spillover effects of being located in Upstate South Carolina near the BMW automotive cluster has helped spur growth in a broad array of related industries (e.g., construction, retail, etc.). This has widened the county’s economic base so that it is not completely reliant on the university or the region’s legacy textile mills for jobs and economic activity. However, greater, and more formal, interaction with regional business leaders and the university are essential foundations for enhancing the region’s economic diversity.
LAUDERDALE COUNTY, ALABAMA
Located in northwest Alabama, Lauderdale County is home to over 92,000 residents. More than 40 percent of these residents live in the city of Florence, which along with Muscle Shoals in Colbert County form the core of the two-county Florence-Muscle Shoals MSA. Also located in Lauderdale County, the University of North Alabama plays an important role in supporting the county’s workforce and entrepreneurial development efforts. The broader Shoals region has a long historical connection with the Tennessee Valley Authority (TVA). The Shoals region, Lauderdale County In particular, have long served as one of Alabama’s leading manufacturing centers. For
34
ECONOMIC DIVERSITY IN APPALACHIA
many years, Tennessee River shipping access and low-cost TVA-provided power have provided the region with the competitive advantage required to attract and retain several major manufacturing facilities. However, like many parts of the traditional “Rust Belt,” the local economy suffered major setbacks when Northwest Alabama manufacturers were so hard hit in the 1980s. This experience laid the foundation for an economic development strategy focused on broadening and diversifying the region’s base.
Concerns about economic diversity do not explicitly drive local economic development strategies, but those efforts tend to be framed and implemented within a broader regional context. For instance, the Regional leaders established the Shoals Economic Development Authority (SEDA) in 1986 to serve as the region’s primary business recruitment arm. SEDA became Alabama’s first multi-county industrial recruitment entity. While many of the resulting investments are made outside of Lauderdale County, these successful new business locations create much needed employment opportunities for county residents. Since 2007 the region has also operated an independent Shoals Industrial Development Committee. The Shoals Industrial Development Committee is composed of public and private sector leaders and oversees a large “deal-closing” fund for prospective economic development projects. The Northwest Alabama Council of Local Governments (NACOLG)—the area’s Local Development District—is another regional development organization that represents the public sector in this broader region. NACOLG manages a number of federal and state-backed business loan programs. The collaboration between and within these regional organizations facilitates more effective economic development practice throughout the region, as it facilitates scale and coordination of economic development activities.
While manufacturing remains an important part of the regional economy, efforts are underway to leverage many of Lauderdale County’s broader regional assets in order to develop other industry sectors. For instance, Florence has emerged as a major regional retail center, attracting numerous shoppers from Northern Alabama, Mississippi and Tennessee. Florence is also a regional medical hub and is home to ECM Hospital system, one of the region’s largest employers with more than 1,200 employees. Tourism is another area of emphasis. Spurred by organizations like the Lauderdale County Tourism and Downtown Florence United, Lauderdale County leverages many of its broader regional assets to support its tourism industry. For instance, the region’s place on the Robert Trent Jones Golf Trail makes the region a golfing destination more so than any single golf course would. Similarly, there are efforts underway to capitalize on the Muscle Shoals region’s musical heritage. While the area hosts many local events and festivals (e.g., the W.C. Handy Music Festival), there are also efforts to develop these assets in a broader regional strategy. The Americana Music Triangle is a proposal to link five states (AL, AR, LA, MS, and TN) along a tourist trail that introduces visitors to key spots in the development of American roots music. Along with Nashville and New Orleans, the Shoals would be a key stop within the Triangle. Once again, marketing these tourism assets in a unified and strategic manner is more likely to draw tourists than promoting multiple attractions individually. Moreover, by leveraging these broader
35

ECONOMIC DIVERSITY IN APPALACHIA
regional assets Lauderdale County is better positioned to capture some of the opportunities that these assets create.
OKTIBBEHA COUNTY, MISSISSIPPI
Located in East Central Mississippi, Oktibbeha County is home to nearly 48,000 residents many of who live in the City of Starkville. It is also home to Mississippi State University (MSU)—Mississippi’s land grant university—and its 20,000 students. MSU serves as the county’s largest economic engine, but the dominance of the university also means that Oktibbeha County lacks economic diversity. The county’s leaders have sought to create greater balance by focusing the county’s economic growth on two fronts. The county is leveraging the university to develop complementary economic activity while also successfully implementing more traditional industrial recruitment and retention activities to attract new activity to locate in the county.
Local economic development leaders acknowledge that MSU’s recent growth has driven Oktibbeha County’s economy. While new employment and population growth has strained the on-campus infrastructure and tightened affordable housing options around Starkville, this growth has also expanded markets for local businesses. Local initiatives, such as those sponsored by Main Street Starkville, have smartly sought to capitalize on these new opportunities to diversify the economic base.
However, the town and gown relationship is key for both the university’s long-term growth and the community’s ability to leverage that asset. This relationship often depends on a more proactive engagement by MSU senior leadership, a relationship has not always been a high priority for the university. Under current leadership, MSU and Starkville are enjoying a renaissance in their partnership. For instance, community leaders are pro-actively seeking to link the community to many of the MSU-related activities like football games. In branding Starkville as “Mississippi’s College Town”, Local leaders hope to turn Starkville into a destination for football fans or parents of MSU students. Success in these efforts should create more opportunities to grow other activities such as tourism and retail.
Continued efforts to attract visitors to Starkville are also a top priority. Starkville and MSU are currently collaborating to develop a hotel and convention center that should help attract more visitors to the community. Besides making Starkville a destination, the community’s leadership also hopes to better connect the community with the campus. Consequently, the Starkville Main Street program promotes local shops and community districts—like the popular Cotton District—to the campus community (faculty, staff and students) so that they are more likely to see these areas as attractive destinations for shopping and nightlife.
The other major plank of Oktibbeha County’s economic development strategies focuses around more traditional business attraction and retention efforts. However, these economic development activities are being undertaken in an increasingly regional context. Oktibbeha County is part of a larger region known as Mississippi’s Golden Triangle, which also encompasses Clay and Lowndes Counties. Several economic
36

ECONOMIC DIVERSITY IN APPALACHIA
development organizations serve these three counties, with the newest being the Golden Triangle Development LINK (GTDL). GTDL is the region’s primary business attraction and marketing agency. Key economic development partners are now working to attract new industries—particularly manufacturers—to the broader Golden Triangle region as opposed to focusing on their individual county. These initiatives further link Oktibbeha County to the wider regional economy by connecting the intellectual assets and talent based at MSU to emerging manufacturing centers in both Clay and Lowndes County.
COMMON THEMES AND TRENDS
The 10 case studies profiled in this report offer both lessons and cautionary tales. This section seeks to identify the common themes and findings that emerged from these case studies. The goal is not only to improve practitioners’ understanding of diversity as a motivating factor in economic development, but also to give those same practitioners insights that might help as they develop their own economic diversification strategies.
DIVERSITY IS MORE OFTEN A GOAL THAN AN ARTICULATED STRATEGY
Many communities identify a more diverse economy as a goal or a value, but diversity is less likely to motivate individual economic development strategies. As a consequence, diversity does not tend to drive strategy development in the same way as a concept like competitiveness. Competitiveness-driven strategies are not necessarily mutually exclusive with regional efforts to diversify, but they do lead to different sets of priorities and types of strategies. A focus on competitiveness can often lead places to select specific clusters around which to focus energy and resources. This, in turn, may limit their activities to only those that support those clusters, foregoing potential opportunities in other non-core activities.
Diversification does not necessarily need to be seen as a goal in itself to be an important concept in framing decisions about economic development strategy. Instead, explicit consideration of diversification within a strategic planning process may help reveal different kinds of strategies and also lead to the implementation of programs or policies that ultimately help diversify the community’s economic base. As a result, diversification as a priority might encourage leaders to consider developing a broader array of skills or focusing on finding new sources of wealth rather than just emphasizing job creation. Thinking carefully about diversity can be helpful for many places, even as leaders consider other goals.
Where diversity does drive thinking, it is usually the result of crisis (e.g., the loss of a major employer or major industry) or the recognition that a crisis might be imminent because the community is overly reliant on a single industry or employer. The justification for seeking economic diversity often centers on mitigating risk and/or capturing opportunity. For those places that rely on a single plant, industry or government facility, there is a need to protect themselves against the potential consequences of losing a large employer (Lockheed Martin in Tioga County, NY) or experiencing a downturn in a key industry (e.g., coal mining in Knott County, KY;
37

ECONOMIC DIVERSITY IN APPALACHIA
furniture and textiles in Rutherford County, NC). As a result, leaders in these places seek additional economic activities to both replace lost jobs in declining industries and reduce the extent to which the community depends on those firms or industries viewed as “declining” or “at-risk” of eventual loss due to global economic forces.
While economic crises may lead communities to seek greater diversity, those same events may also tie leaders’ hands in terms of how best to achieve diversity goals. A crisis environment may limit the extent to which places can be intentional about how they pursue their economic development objectives. Rather than being strategic about their efforts, the crisis itself may force leaders to adopt a “beggars can’t be choosers” mindset and, as a result, pursue any available opportunity instead of focusing their efforts on quality opportunities.
Capturing greater opportunities is another motivating factor behind diversity-driven strategies. Places with dynamic economies that continuously develop new economic activities and are constantly in a state of transformation are more likely to weather economic storms and raise overall regional prosperity. However, in order to do so, places must be able to maximize their assets to capture current and future opportunities. These “opportunistic” strategies might focus on investing in state-of-the-art infrastructure (e.g., Corridor H in Upshur County, WV), building market relationships with nearby growth centers (e.g., Garrett County, MD’s links to Pittsburgh and DC), or effectively connecting firms to local sources of innovation like major research universities (e.g., Clemson University, Mississippi State University) and/or national research laboratories (e.g., Oak Ridge National Laboratory in TN, National Energy Technology Laboratory in WV).
The data show that places that diversify more quickly are those that experience a sudden loss of a major employer or industry. By contrast, the case studies demonstrate that places that achieve more positive economic diversity tend to do so in smaller numbers and over an extended period of time. Therefore, places seeking to implement diversity-driven strategies must show patience and commitment to those efforts. This requires building consensus around diversity as a goal within the area’s long-term economic vision.
DIVERSIFICATION THAT CONTRIBUTES POSITIVELY REQUIRES MANY YEARS
In fact, like making a fine wine, economic diversity requires time to develop local roots and support before its fruit can bear prosperity. Diversity that occurs too rapidly often reflects significant economic weaknesses from a community overly reliant on a single company or industry. These are the stories of crisis and distress that so many regions encounter. While greater diversity may result, its rapid occurrence leads to dislocation among workers and interdependent businesses alike.
The most successful places can expect their efforts to bear positive economic fruit after many years of sustained effort. Several of the case profiles included in this analysis developed their initial plans in the 1990s and pursued that plan’s implementation (with appropriate modifications along the way) for 15 years before realizing success. In these
38

ECONOMIC DIVERSITY IN APPALACHIA
cases, the community’s citizens (not just its leaders) were committed to a long-term investment strategy. For some, that community commitment may have occurred only after a significant event—a major company downsizing or relocation, meaning that the road back to prosperity was probably much longer and more challenging.
However, this long-term commitment often resulted from a common realization that the community’s future had to be built on leveraging one or more unique local assets (a university, a major new highway, or a unique natural geography such as a body of water or mountain) as well as a bit of luck. These assets provided the lynchpin, but the singular focus on a common plan provided the course for the community’s new economic trajectory. Identifying those lynchpins and then building local consensus around the plan to leverage those assets are the most challenging tasks—and ultimately the key to success.
DIVERSIFICATION CAN BE ACHIEVED THROUGH A VARIETY OF ECONOMIC DEVELOPMENT STRATEGIES
Economic diversity results from a variety of strategy choices. Communities with varying economic experiences and situations will pursue those strategies that the community supports and that local partners have the capacity to implement. When asked about how they are working to diversify their economy, practitioners identified a wide range of activities including traditional business recruitment, retention and expansion, workforce development, entrepreneurial development, promoting tourism, leveraging university capabilities, investing in infrastructure, and many others. As noted earlier, all these strategies are typically designed to achieve one of five goals:
• Create collaborative regional planning and implementation systems, • Build an ecosystem capable of supporting a diverse array of economic
activities, • Connect local and regional assets to external markets, • Develop skills and talent needed in a wide range of industries, and • Encourage local reinvestment of wealth.
However, at the most basic level practitioners often seek an “anything that works” approach to diversification. Clearly, there are multiple ways to achieve diversity, and several practitioners pointed out that just as the community should not rely on one employer or one industry, nor should the community rely on any single economic development strategy. Much like diversity itself, undertaking multiple strategies allows practitioners to protect themselves against failed or ineffective initiatives while at the same time increasing the likelihood that one of those strategies will succeed. Moreover, many strategies create jobs in relatively small numbers; undertaking multiple strategies can also increase the overall impact of the broader community efforts.
Another influence over selecting preferred economic diversification strategies is the extent to which strategy outcomes can be controlled locally. Practitioners most commonly identified workforce development and entrepreneurial support efforts as actions they could impact locally. In both instances, these strategies involve building the
39
ECONOMIC DIVERSITY IN APPALACHIA
capacity of people who are already located and/or tied to the local community. In other instances, local efforts to foster diversity focused on giving people already living in the community a reason to stay, either through local educational or career opportunities. Traditional business retention and expansion activities also seek to capture and retain investment in the region, but for many businesses, their fate is determined externally as part of far-flung corporate headquarters’ decisions or by global market forces.
Ultimately, the most significant challenge to overcome is that most diversification strategies result in creating jobs in the fives or tens over a sustained period of time, whereas an economic event can result in the loss of a major employer or industry and hundreds of jobs at a single moment in time. As demonstrated in the case studies, many Appalachian communities are looking toward tourism development strategies to help diversify their economies and replace past economic drivers. These tourism strategies, however, are often more about replacing lost jobs than diversifying the local economy. While the tourism industry provides jobs for relatively low-skilled workers, the new jobs do not pay those same workers as much as industries like coal or manufacturing once did. Consequently, tourism alone will not lead to greater diversity, but instead must be viewed as but one element of broader economic development strategies.
In this context, the appeal of significant business attraction efforts becomes clear. The attraction of a 200-employee manufacturing plant can make a greater impact on the community than helping a small business grow from 5 employees to 10 employees. While business attraction efforts have a place in many comprehensive economic development strategies, these kinds of investments are made sporadically and a focus on these types of projects can be risky. Most notably, there are few relatively large projects seeking new locations, and it is probably unrealistic for communities lacking significant assets to expect to win these types of large projects. Many growth companies are also looking to locate in fast-growing, diverse metropolitan areas, closer to their customer base. The projects that are looking for more rural locations often tend to need a low-cost and relatively low-skilled workforce. These kinds of projects are intrinsically mobile and their employment levels are not always sustainable over a long period of time. As a result, this is an area where local forces are least likely to exert real influence over outcomes.
EFFECTIVE DIVERSIFICATION REQUIRES MORE THAN JUST DIVERSIFYING THE EMPLOYMENT BASE
The case studies demonstrated that approaching diversity issues requires communities and practitioners to take a broader perspective and approach. This broad thinking is required in two ways—in how community leaders and economic developers define diversity as well as in how they go about pursuing strategies to promote greater economic diversity. Most practitioners conceptualize a diverse economy as one with a wide array of industries, but this is a relatively narrow way to define diversity. Since wages paid by area employers are not the area’s only form of wealth generation, diversity should take into account more than just local employment. Therefore, broader definitions of diversity can lead to outcomes beyond just a diverse employment base.
40
ECONOMIC DIVERSITY IN APPALACHIA
For instance, communities might consider thinking about developing a more diverse set of wealth generators. As shown in places like Rutherford County, NC, retiree attraction efforts can diversify an area’s wealth generation capacity. These retirees bring money from outside the region in the form of their retirement accounts as sources of wealth. This wealth can then be re-circulated in the region to support activities like construction and retail. Similarly, Medicare payments (which also originate external to the community) can also generate demand for activities such as those related to health care.
Diversity in the ownership of locally-based companies is another consideration, and specifically whether owners are based inside or outside of the community. Locally-based and headquartered companies are more apt to remain and invest in the area than are firms where the locus of decision making is external to the region. As the Tioga County case study demonstrates, when decisions about a local firm’s future are made external to the region, there can be great uncertainty about the region’s economic future. In order to mitigate this risk, many places pursue entrepreneurship strategies that promote greater local ownership and control. The case study counties provide numerous examples of entrepreneurial strategies including promoting entrepreneurship to students, recruiting entrepreneurs to the region, connecting entrepreneurs to existing support services, and/or investing in key infrastructure like broadband capacity and business incubators. By growing the number of locally-based firms, communities are more able to exert control over their economic trajectory.
Skills diversity is another area of consideration. Workforce development represents another area that local practitioners identified as a real challenge, but also one where they felt as though local action could make a real impact. Many former mill towns possess a talent pool that has a relatively narrow range of skills that may not translate well to emerging new industries. This relative lack of skills slows these communities’ ability to take on new and different activities and thereby diminishes their capacity to diversify their economies. While there may be a desire to focus training efforts around the region’s dominant industry, this can prove risky if that industry experiences significant decline. By contrast, a broad and flexible base of skills is required to support a diverse economy and respond to rapidly changing demand for skills. The Lycoming County case study provides an excellent example of a diversity-driven workforce initiative. In this instance, Penn College intentionally sought to invest in training programs that met the needs of the natural gas industry, but also provided workers with skills that are of use to firms in other industries such as construction, utilities and advanced manufacturing. Therefore, diversifying the skill base can allow communities to better take advantage of opportunities as they present themselves.
These distinctions are important as they force consideration of issues such as the diversity of wealth and ownership, as well as the workforce’s ability to respond to changing economic conditions. Consideration of these different forms of diversity also influences strategy design and how outcomes are measured. These different definitions of diversity are not contradictory or mutually exclusive. Broadly defining diversity can lead to the need for a diverse portfolio of development strategies, which in turn can
41
ECONOMIC DIVERSITY IN APPALACHIA
allow communities to not only achieve multiple objectives, but also increase the chances of strategies proving successful.
ECONOMIC DIVERSITY INFLUENCED BY REGIONAL CONTEXT
Communities must also approach diversity with broader geographic considerations. The case studies showed that diversity is a scale-dependent issue. Workers often think regionally when looking for employment, and so too should communities when seeking future opportunities for wealth creation. Understanding the broader regional context can help communities better understand the range of available opportunities and potential risks. For instance, a community like Tioga County, NY will never be a major jobs center but by making themselves an attractive place to live they are able to attract people with good paying jobs in nearby job centers like Ithaca or Binghamton. By contrast, downturns in the Washington, DC or Pittsburgh economies might have negative consequences for a place like Garrett County, MD. Understanding the regional context can therefore help to shape the parameters for strategy development as it helps communities more fully understand the threats and opportunities they face.
Specialized counties that contribute to a broader, more diverse region are more likely to diversify over time. Building stronger regional connections can enable communities to leverage a greater number of assets, and thereby open up greater economic opportunities. For instance, proximity to large universities can prove beneficial not only for the immediate area, but also surrounding communities. If leveraged properly, large universities, such as MSU in Oktibbeha County or Clemson in Pickens County, can be a source of innovative research and talented workers for area companies, as well as a source of demand for local food producers or retailers. While this is important for all counties, it is especially important for more rural communities that lack depth of assets. However, these regional connections do not always occur naturally and both the university and the community must be willing to work together in order to maximize these opportunities.
Regional thinking can also help create assets. For communities seeking to develop tourism, the whole is greater than the sum of the parts, and they are best served by linking these attractions together in the minds of potential tourists and promoting the entire region as a single destination. By thinking regionally, Lauderdale County, for example, has not only made itself a regional retail center but also a destination for golfers through its place in the Robert Trent Jones Golf Trail. These kinds of economic opportunities would not be available had Lauderdale County acted independently to promote its golf courses or its tourist attractions. Similarly, the tourism and infrastructure initiatives underway in Upshur County and its surrounding region would not have succeeded had those counties operated independently of one another. By contrast, Knott County’s efforts to establish itself as a center for adventure sports has yet to fully materialize in part because the initial efforts have been independent of one another and not yet connected to a broader regional effort.
42

ECONOMIC DIVERSITY IN APPALACHIA
BROAD ENGAGEMENT ACROSS SILOS INCREASES POTENTIAL FOR SUCCESSFUL DIVERSIFICATION STRATEGIES
Similarly, broad engagement with a wide array of stakeholders can also help move diversification efforts forward. Effective strategies engage practitioners from economic development, workforce development, higher education, planning, tourism development, as well as the private sector. Practitioners in each of these arenas bring unique, but sometimes overlapping, networks. These networks offer access to knowledge, resources and expertise. For instance, workforce developers may have access to training funds or training programs that would benefit companies in industries that economic developers seek to promote. Similarly economic developers meet regularly with area companies, and can in turn convey information from these conversations to educators who can then use that information to develop curriculum.
As noted above, regional approaches and regional collaboration is often ideal, but local collaboration is the minimum required for implementing effective strategies. Top down initiatives are not always effective as they often end up being neither regional nor collaborative. Instead, some of the more effective collaborative initiatives emerge from grass roots efforts where local organizations come together to form a partnership to address an issue where there is a consensus need. Economic developers often lead these efforts, but the most effective ones are those that see their primary role as one of a connector. By connecting different regional actors and networks, they are able to gather support and resources to advance regional initiatives. This kind of local collaboration often emerges in places where there are open networks, and grassroots initiatives are able to surface from a wide array of actors.
Opportunities are fewer in places where the practitioners remain within the walls of their silos. The case studies suggest that the communities with the most coherent diversification strategies have overall economic development strategies that are not driven by local economic developers alone. As in the case of Garrett County, MD, these successful strategies involve multiple stakeholders and enjoy broad-based community support. In these instances, area economic developers see that they have a role beyond just industrial recruitment and retention and are willing to embrace their role as a regional connector or facilitator are more apt to be successful in furthering broad based regional initiatives that seek to promote economic diversity.
RESEARCH CAN GUIDE EFFECTIVE STRATEGY DEVELOPMENT AND IMPLEMENTATION
Strategies are more likely to be successful if they are based on a foundation of data-driven research. However, this is an area where many economic development practitioners often lack capacity. These research skills are needed for economic development practitioners to track regional growth and progress, undertake effective market analysis, understand how to harness creativity and entrepreneurship, and keep up with trends about how technology is re-shaping economic advantage. Many places lack this research capacity, but creative and enterprising practitioners can access these
43

ECONOMIC DIVERSITY IN APPALACHIA
capabilities by looking beyond their silos and partnering with other regional organizations that are capable of performing this research.
At the most basic level, communities should have a basic understanding of the economic trends that are shaping their economy. This baseline analysis is an important component in undertaking an honest appraisal of the community’s strengths and weaknesses and is often captured in regional Comprehensive Economic Development Strategies. Understanding these economic trends allows communities and regions to better identify and prioritize key issues as well as determine which strategies are realistic, which are not, and which are likely to yield the greatest impact. For instance, local leaders may seek to turn their community into a tourist destination, but if the community has no hotels or restaurants and lacks highway access or appealing tourist attractions, then this effort will likely experience difficulty gaining traction. Undertaking this kind of honest appraisal allows places to remove less optimal options from consideration and instead focus on diversification strategies that are more appropriate for their circumstances.
In addition to considering their internal strengths and weaknesses, successful places also consider external risks and opportunities. This can be done by better understanding how local firms and industries are connected to external markets, and how growth or decline in other places may affect the local economy. If communities are able to identify comparable places then they might be able to learn from their situation. Similarly, community leaders might also seek to learn from other places that have experienced significant shocks or been presented with similar opportunities. For instance, the Lycoming County case study showed how that community was able to learn from another community—Fort Worth, TX—that had been affected by the natural gas boom, and was better able to prepare for the multitude of impacts arising from these developments.
Research and analytical capacity can also play an important role in monitoring and evaluating strategy progress. By tracking outcomes, places can better identify those strategies that are not performing as hoped and either eliminate them or develop new, more effective tactics for the future. Moreover, tracking outcomes and performance allows stakeholders to demonstrate their progress and impact which is important for enlisting additional support or securing funding.
LEADERSHIP MATTERS
As noted above, there is no single economic development strategy that alone can lead to greater economic diversity. Many different kinds of strategic actions must be undertaken to achieve this goal. However, none of this matters if the strategies are not effectively executed. Successful implementation often comes down to the people involved. For a community to effectively diversify its economy, it must first and foremost have people who see economic diversification as a priority. If diversification proves to be a community priority, then it must also have community leaders and stakeholders who are open to working regionally, collaborating across silos, thinking opportunistically about resources, and willing to take risks in order to make the
44
ECONOMIC DIVERSITY IN APPALACHIA
investments necessary to see diversification strategies through to completion. Moreover, communities need different people in different roles to implement these strategies. At the most basic level, there are two roles that need to be filled—a leadership role and a staff role.
Leadership is crucial for any economic development effort. Local leaders are needed to articulate, and build consensus for, a community vision. They are also needed to serve as champions for strategies and enlist support from the community to help implement those strategies. In several of the cases studies, the research team saw that the private sector could play an important catalyzing role for many strategies. This was especially true for Washington County, VA, where private sector leadership drove the completion of the Birthplace of Country Music Museum. In Oktibbeha County, MS, engaged and committed leadership from both the community and the Mississippi State University administration make it possible for the community to increase the economic impact of the campus community on the local economy. However, for many smaller and more rural Appalachian communities, this kind of strong private sector leadership is not always available, and as a result they often lack the capacity to coalesce local business leadership for true public-private efforts in economic development. In these places, government can be a critical actor in rural local economic development in Appalachia (and elsewhere).
But no matter where this local leadership may come from, there is also a need for multiple leaders. Many of the diversification strategies laid out in the case studies will require long-term commitment before they begin to yield significant and sustainable benefits for the community. Many of the initiatives underway in Lauderdale County began in the mid-1980s and they continue to yield benefits because there has been a long-term commitment to see them continued. Sustaining long-term economic development and diversification efforts therefore requires a depth of leadership. The Knott County, KY case study showed that when there has been significant leadership turnover, it is difficult to maintain the momentum behind these efforts. The loss of a strong, persuasive and visionary leader can derail efforts unless there is a deep leadership bench and broad buy-in to a common vision. As demonstrated by the Garrett County, MD case study, the county’s economic development planning process—which has been ongoing for over 15 years—has been an effective means for on-boarding new leaders into the process and ensuring consensus for the economic development vision.
Leadership alone cannot guarantee successful implementation of economic development and diversification strategies. Strong leaders often succeed when they are supported with great staff. For many leaders, particularly private sector leaders, these kinds of initiatives are well outside of their core professional responsibilities. Therefore, economic development practitioners are needed to do much of the work involved with seeing these strategies through to completion. This may involve work such as organizing meetings and doing the research. Practitioners also play a hugely important role in organizing stakeholders and preparing applications needed to secure state and federal funds that help kick start many of these initiatives. This is not to say that economic development practitioners themselves are not key leaders in their
45
ECONOMIC DIVERSITY IN APPALACHIA
communities. In most instances, they are quite active in many of the core leadership responsibilities (e.g., building a consensus vision, recruiting support) in which private sector leaders should also be engaged. However, rarely can a community truly transform its economy without significant support from business leaders and elected officials and without important support from their economic development practitioners.
It should also be noted that working both collaboratively and regionally requires a great deal of trust among stakeholders. Repeated interaction often leads to greater trust and comfort, so continuously seeking regional and collaborative projects is one way to build these loose coalitions (even if the efforts are not always successful in attracting external funding). The importance of having these coalitions in place cannot be understated. For instance, the existence of ongoing partnerships can allow regions to respond quickly and effectively to funding opportunities as they arise. Just like diversity itself, these coalitions allow places to capture more opportunities and mitigate the risk involved in undertaking new initiatives.
MUTLIPLE AVENUES FOR ACHIEVING DIVERSIFICATION
The case studies demonstrate that diversity represents an oft-articulated goal for pursuing economic development strategies, but it is seldom the only goal (or even the most important goal) of these plans. In fact, places often identify diversity as a goal only if they have experienced some kind of crisis (like the loss of a major employer loss), fear an imminent crisis, or are frustrated by a long-term lack of growth in their industrial base. In essence, leaders are motivated to diversify for two primary reasons:
1) To mitigate the risk associated with being too dependent on a given employer or industry or
2) To capture greater opportunity by being involved in a wider array of economic activities.
When asked about their diversification efforts, local economic development leaders and practitioners typically point to a wide array of strategies employed. For instance, several practitioners cite their business attraction and retention efforts as a key plank of the diversification plan. Perhaps most commonly, practitioners look to activities—like agriculture and tourism—that leverage available assets that they currently control – their land, their people, or their proximity to natural or man-made amenities. These toolbox of development activities are similar to any other economic development goal, but the efforts often focus more on replacing what exists rather creating new growth opportunities. But, replacement efforts rarely serve to actually transform the regional economy. Often, they simply seek to find activities to employ those dislocated in the short term, and many communities have learned that this is a futile effort.
For those communities that are seeking to avoid a crisis (or have accepted the crisis and moved beyond it), the focus tends to be different—emphasizing the possibilities tied to attracting or creating new economic activities rather than retaining the old. For these communities, the economic development toolbox is also the same, but the emphasis may differ. Leaders in these communities are more likely to focus their attention and energy on initiatives designed to encourage new economic activity that will likely have
46

ECONOMIC DIVERSITY IN APPALACHIA
the potential for longer term pay-off in terms of jobs and wealth creation. This long-term view is likely to be more successful in the long run and is also likely to rely on identifying new competitive advantages the community or region should seek.
Some places understand and describe economic diversity in terms that look beyond simply having firms and workers in multiple industries. These communities emphasize the need for also diversifying their talent base and growing locally-owned firms (that can control their own destiny) through entrepreneurial support efforts. In other instances, local efforts stress initiatives designed to diversify sources of wealth generation by attracting people (e.g., retirees) or developing new assets. Moreover, diversified communities also find effective ways to leverage a broader set of assets beyond those within their own borders in order to further their economic development efforts. In short, no one method for diversifying a local economy and successful diversification efforts involve multiple strategies.
47
ECONOMIC DIVERSITY IN APPALACHIA
LESSONS FOR DEVELOPMENT PRACTICE
The results of the empirical and case study analyses suggest several lessons about the nature, characteristics, and implications of economic diversity for local and regional economic development in Appalachia and elsewhere in the U.S. These lessons may be viewed as guides for development practice, whether or not the aim is to pursue a concerted diversification strategy.
GROWTH OCCURS THROUGH SPECIALIZATION
Other things equal, a local and regional economic base that is diverse in its mix of economic activity is likely to be more stable over time; as given industries, markets and technologies change, other economic activities have already taken root and are in place to absorb labor and capital released through restructuring. However, significant regional growth is rarely, if ever, driven by the balanced expansion of a broad mix of industries. Rather, growth tends to coalesce around—and be driven by—particular industries, which often drives growth in related industries through firm in-migration, business start-ups, and existing firm expansions. This “unbalanced” growth phenomenon leads to the formation of industry clusters, a focus of local economic development practice and strategy since the early 1990s. Rapidly growing places, particularly those of small or medium size, are likely to appear non-diverse even as their expansion yields abundant job and wealth-creation opportunities.
It follows that a competitive regional economy, and one that is also diverse in comparison to other regional economies of similar levels of development and scale, is likely to be comprised of multiple competitive specializations. The goal should not be simply to somehow encourage the emergence and expansion of a diverse mix of economic activity, but rather to support the competitiveness and growth of a number of specializations or clusters that can serve as the multi-legged foundation for the local economy. Put differently, a diversification strategy is a matter of implementing many successful specialization strategies simultaneously. Those strategies will typically be focused around industries that have already gained a toehold in the place; by doing so, they have created a kind of “revealed competitive advantage.” If the location of truly new activities in a region is rare, then the rapid, large-scale location of truly new activities in a region is even more rare.
The complex relationships between diversity, specialization, and growth, and their evolution over time in the context of a specific region’s development path, produces “snapshots” of relative diversity that can appear counterintuitive on their face. An example is the finding that a common phenomenon in Appalachia is the nominally diverse county that is growing more slowly or declining faster than less diverse peer counties. What is often happening in such places, particularly those that are small, is that a non-competitive specialization—one that long dominated the mix of employment opportunities—is in decline. What is left is an apparently diverse set of unrelated sectors, some of which constitute stand-alone export-oriented industries and others of which provide business support services to the declining specialization or local services
48
ECONOMIC DIVERSITY IN APPALACHIA
to the remaining population base. In this case, then, a diverse economic structure may well be the reflection of “what’s left,” or, in essence, an absence of competitive clusters.
DIVERSIFICATION STRATEGY AS RISK ASSESSMENT AND OPPORTUNITY CAPTURE
The diversity-specialization-growth dynamic suggests two key roles for the local economic developer who wishes to pursue a general goal of building a diversified economic base. The first is to fully assess and understand the “risk” associated with the existing economic base of his or her locality. A highly specialized economy may face comparatively little risk of significant decline over a foreseeable future if robust demand for its goods and services is certain. Alternatively, a diverse economic base can be under threat if multiple industries face significant disruption. An important role for the local economic developer is to fully understand the competitive factors underpinning the economic base and use this knowledge to anticipate possible disruptions that might be countered through development strategies.
The second key role is to scan for economic opportunities—whether through business expansion, entrepreneurship, or attraction strategies, or other economic development initiatives—that might be nurtured through appropriate public sector actions. Regional economic diversification is not akin to financial portfolio diversification; a region cannot choose to actively divest itself of a particular segment of its economy (although it can allow a segment to founder or languish). Instead, it can shift its economic mix primarily by encouraging new industries and activities. In this sense, diversification strategies build on fundamental principles of economic development more broadly.
REGIONALISM SUPPORTS DIVERSIFICATION
The fact that local and regional diversity are rarely independent of one another is one among many cases for regionalism in economic development policy and strategy. For most communities there is at least some value in regional partnerships for economic development. The examination of functional county roles within a larger labor market area and region can help to clarify the necessity and potential content of these arrangements. In order to compensate for local gaps in factors such as workforce skills or infrastructure, individual communities might seek to highlight their ties to other communities in their region that play different functional roles. In the same vein, business recruitment or cluster strategies may be more successful if they highlight the region’s resources, not just those of individual communities—an approach that could potentially highlight a variety of workforce and infrastructure resources of interest to a wider variety of businesses. Communities might also benefit from partnering on major infrastructure projects.
For example, a bedroom community with close economic ties to a regional work center may find it in its interest to cooperate with the work center and other surrounding counties in funding transit improvements. As part of regional branding efforts, individual communities and the region as a whole may benefit by highlighting the functional distinctions among the jurisdictions. For example, a campaign that highlights the vibrant
49

ECONOMIC DIVERSITY IN APPALACHIA
urban centers, peaceful bedroom communities, and outdoor recreation opportunities in a region might be attractive to a diverse workforce and, thus, attractive to employers seeking to provide employees with a high quality of life.
DIVERSIFICATION IS SUPPORTING THE FUNDAMENTALS
Overall, the best diversification strategy is a sound, well-balanced economic development strategy. The case analyses showed that communities that successfully implement diversification strategies often share several common traits. First, they develop their strategies on a solid foundation of analysis and research. Second, they think and operate regionally so as to maximize the resources and assets available to them. Third, practitioners work across silos to create broader networks and coalitions and to leverage networks and expertise. Fourth, successful places put the right leaders and staff in place to ensure effective implementation. As a result, leaders and stakeholders commit to a common vision and goals, display patience, and take selected, calculated risks. Finally, successful places have a process in place not only for developing and implementing their strategies, but also for incorporating new leaders. Economic diversity is a legitimate economic aspiration and goal, but like all economic development goals, it is only accomplished if area leaders and stakeholders thoughtfully and effectively implement their economic development strategies.
Conversely, good diversification strategy is not a single-shot game or narrow focus on business attraction. True industrial recruitment coups are rare. Most growth in employment, whether by existing businesses or new establishments, tends to complement the incumbent economic base in a region while drawing upon regional assets. The 1992 location of a BMW assembly plant in Greenville-Spartanburg provides an illustrative example of growth building on existing assets. While $130 million in state and local government incentives served as the popular explanation for BMW’s decision, this focus belied the importance of other factors.
Since the late 1950s, Greenville-Spartanburg had consciously sought to compensate for its declining, domestic textiles industry by attracting foreign investment—focusing first on manufacturers of equipment for the textiles industry and later on a broad assortment of industries ranging from chemicals to automotive supplies. By the time of BMW’s site selection decision, the region had become one of the nation’s per-capita leaders in attracting foreign investment, with German companies including Michelin, Bosch, and Bertelesmann AG calling the region home (New York Times, 1992; Saporito and Solo, 1992). In addition to creating a friendly business environment for foreign investment, state and regional leaders had made significant investments in infrastructure, particularly a regional airport, and technical education and workforce training programs that proved attractive to BMW (Eichel, 1992; Kanter, 2003). The well-known and much heralded Research Triangle Park in North Carolina serves as an additional example of an economic development success that resulted from at least fifty years of sustained public policy effort, much to the consternation of economic developers seeking to easily replicate the success enjoyed in that region (Feldman and Desrochers, 2003).
50
ECONOMIC DIVERSITY IN APPALACHIA
DIVERSIFICATION NEEDS INFORMATION
Good information fuels good economic development strategy and, by extension, effective diversification strategy. The local economic developer provides an important economic intelligence function—gathering and interpreting data on economic trends, diagnosing the vulnerability of the local economy based on the market and technological trends buffeting local industries, and working effectively with local businesses to identify bottlenecks and constraints to growth and competitiveness that could be resolved with appropriate policy actions or public sector investments. Diversity metrics like those outlined in this report can be valuable tools if they are used to ask useful questions about the nature of the local economic base. Useful questions are most often revealed by benchmarking local conditions against other places of similar type or character, or which represent “aspirational” targets for local economic development. The web tool that accompanies this study is intended to facilitate this kind of exploratory analysis and benchmarking.
Diversity metrics have to be interpreted carefully, however. If the aim is to have a high diversity score, then diversity metrics are certainly biased in favor of larger, more urban communities. The chief technical underpinning of this tendency is the positive relationship that exists between the number of industry sectors in a region and that region’s diversity level. In smaller places, the maximum diversity is limited by the natural tendency for there to be fewer sectors present. Practitioners should consider the natural bias of diversity for larger places and benchmark regional diversity to regions similar in size and urban population characteristics. This approach will allow for the identification of real differences in economic diversity that are not primarily due to size differences. Benchmarking against counties of similar size and character will allow practitioners to identify realistic goals for economic progress, though it may still be beneficial for comparisons to be made with larger places in order to track progress on more ambitious, transformative economic development goals.
Just as it makes sense to benchmark a county’s diversity to regions with similar urban or rural characteristics, benchmarking to the right places in terms of similar functional specialization can help to make realistic comparisons that at least partially account for differences in diversity due to the structure of counties’ economic specializations. Comparing several counties with similar specializations but very different characteristics related to factors such as economic outcomes and the tenure of economic specializations can also help to assess the trajectory of a region’s development, and might provide opportunities for gaining policy insights from the experiences of peer counties.
51

ECONOMIC DIVERSITY IN APPALACHIA
REFERENCES
Attaran, M. (1986). Industrial diversity and economic performance in US areas. The Annals of Regional Science, 20(2), 44-54.
Auty, R. M. (2000). How Natural Resources Affect Economic Development. Development
Policy Review, 18(4), 347-364. Auty, R. M. (2001). The political economy of resource-driven growth. European
Economic Review, 45(4-6), 839-846. Bradshaw, M. J. (1992). The Appalachian Regional Commission : twenty-five years of
government policy. Lexington, Ky.: University Press of Kentucky. Chinitz, B. (1961). Contrasts in agglomeration: New York and Pittsburgh. American
Economic Review, 51(2), 279. Conroy, M. E. (1975). The concept and measurement of regional industrial
diversification. Southern Economic Journal, 492-505. Dissart, J. C. (2003). Regional Economic Diversity and Regional Economic Stability:
Research Results and Agenda. International Regional Science Review, 26(4), 423-446.
Feser, E. J. (2003). What Regions Do Rather than Make: A Proposed Set of Knowledge-
based Occupation Clusters. Urban Studies, 40(10), 1937-1958. Frenken, K., Van Oort, F., and Verburg, T. (2007). Related variety, unrelated variety and
regional economic growth. Regional Studies, 41(5), 685-697. Freudenburg, W. R., and Wilson, L. J. (2002). Mining the Data: Analyzing the Economic
Implications of Mining for Nonmetropolitan Regions. Sociological Inquiry, 72(4), 549-575.
Hammond, G. W., and Thompson, E. (2004). Employment risk in US metropolitan and
nonmetropolitan regions: The influence of industrial specialization and population characteristics. Journal of Regional Science, 44(3), 517-542.
Hoerr, J. P. (1988). And the wolf finally came : the decline of the American steel industry.
Pittsburgh, PA: University of Pittsburgh Press. Isserman, A. M. (2005). In the National Interest: Defining Rural and Urban Correctly in
Research and Public Policy. International Regional Science Review, 28(4), 465-499.
Isserman, A. M., and Westervelt, J. (2006). 1.5 Million Missing Numbers: Overcoming
Employment Suppression in County Business Patterns Data. International Regional Science Review, 29(3), 311-335.
Jackson, R. W. (1984). An Evaluation of Alternative Measures of Regional Industrial
Diversification. Regional Studies, 18(2), 103-112. Lawrence, R. Z. (1984). Can America compete? Washington, D.C.: Brookings Institution.
52
ECONOMIC DIVERSITY IN APPALACHIA
Mack, E., Grubesic, T. H., and Kessler, E. (2007). Indices of Industrial Diversity and
Regional Economic Composition. Growth and Change, 38(3), 474-509. Malizia, E. E., and Ke, S. (1993). The influence of economic diversity on unemployment
and stability. Journal of Regional Science, 33(2), 221-235. McLaughlin, G. E. (1930). Industrial diversification in American cities. The Quarterly
Journal of Economics, 45(1), 131-149. Noyelle, T. J. (1983). The Rise of Advanced Services: Some Implications for Economic
Development in U.S. Cities. Journal of the American Planning Association, 49(3), 280-290.
Papyrakis, E., and Gerlagh, R. (2007). Resource abundance and economic growth in the
United States. European Economic Review, 51(4), 1011-1039. Safford, S. (2009). Why the garden club couldn't save Youngstown: The transformation
of the Rust Belt. Cambridge, MA: Harvard University Press. Stedman, R. C., Patriquin, M. N., and Parkins, J. R. (2011). Dependence, diversity, and
the well-being of rural community: building on the Freudenburg legacy. Journal of Environmental Studies and Sciences, 1-11.
Thompson, W. R., and Thompson, P. R. (1987). National Industries and Local
Occupational Strengths: The Cross-Hairs of Targeting. Urban Studies, 24(6), 547-560.
Wagner, J. E., and Deller, S. C. (1998). Measuring the effects of economic diversity on
growth and stability. Land Economics, 541-556. Watkins, M. H. (1963). A staple theory of economic growth. The Canadian Journal of
Economics and Political Science / Revue canadienne d'Economique et de Science politique, 29(2), 141-158.
Watkins, M. H. (1977). The staple theory revisited. Journal of Canadian Studies, 12(5),
83-95.
53
ECONOMIC DIVERSITY IN APPALACHIA
APPENDIX: DATA AND METHODS
This appendix provides additional detail on the measurement of economic diversity based on industries, functions, occupations, and knowledge clusters; the geographies used to calculate and aggregate measures of diversity; and the linkages among counties based on commuting ties.
BASE DATA AND METHODS FOR CALCULATING ECONOMIC DIVERSITY
Most of the diversity calculations conducted for this report rely upon county employment estimates acquired from Economic Modeling Specialists International (EMSI). The particular datasets used were “complete” employment estimates for 2009 and the third quarter of 2012, along with “covered” employment estimates for 2009 and 2012.18 Each dataset provides an individual row of data for each six-digit North American Industrial Classification System (NAICS) industry within a county, with these rows detailing the estimated employment and earnings in the industry and county in question. Based on the Bureau of Labor Statistic’s Quarterly Census of Employment and Wages, the covered employment dataset contains estimates for jobs covered by federal or state unemployment insurance systems. In addition to earnings and employment estimates by industry, the covered employment dataset provides estimates of the number of establishments by industry and county, although the 2012 dataset includes establishment estimates from 2011. For this report, the covered employment dataset was only used to conduct analyses that relied upon establishment estimates.
The complete employment dataset includes all employment in the covered dataset along with wage-and-salary employment exempt from unemployment insurance coverage—such as military and railroad employment and employment as a real estate or insurance agent—and self-employment that accounts for all or a portion of an individual’s income. For both datasets, EMSI relies upon a variety of data sources from the Bureau of Economic Analysis, U.S. Census Bureau, and Bureau of Labor Statistics and proprietary algorithms to produce estimates of employment that do not suppress employment and earnings numbers for any county or industry. With a considerable number of employment statistics suppressed to prevent the release of confidential firm information, these datasets allow for a more complete analysis of county employment than allowed for by standard federal data releases (Isserman and Westervelt, 2006).
ENTROPY MEASURE OF ECONOMIC DIVERSITY
The entropy measure of diversity was used to calculate industry-, function-, occupation-, and knowledge--based measures of economic diversity across U.S. counties and a variety of other geographies (Malizia & Ke, 1993). These metrics were calculated according to Formula 1:
18 See http://www.economicmodeling.com/data/ for more information on these datasets
54
ECONOMIC DIVERSITY IN APPALACHIA
(1) 𝐸𝑁𝑇𝑅 = �(𝑝𝑖) ln �1𝑝𝑖�
𝑘
𝑖=1
where there are i=1 to k industries and p
i is the share of economic activity (i.e.,
employment) in the ith industry. The products of industry shares of economic activity and the natural log of the inverse industry shares of economic activity are summed to arrive at the final entropy index measurement. The index has a minimum value of 0 when all economic activity is within one industry, and the value increases as the number of industries increases and the distribution of economic activity across these industries becomes more equal.
Where entropy measures were calculated for non-county geographies (e.g., the United States as a whole or individual states), the employment data was summed by industry and the geography in question before the entropy calculation was performed. Unless otherwise noted, economic diversity statistics cited in this report were calculated based on the entropy values of individual counties located within a geography or aggregation of interest—they do not represent the calculation of entropy based on all economic activity within a given geography. For example, the average entropy by ARC subregion represents the mean value of all county entropy values within each subregion, not the calculation of entropy across all economic activity in the subregions.
MEASURING INDUSTRY-BASED ECONOMIC DIVERSITY
Industry-based economic diversity calculations depend upon EMSI’s complete employment dataset. This section details the procedures used to calculate measures describing industry-based economic diversity.
BASE DIVERSITY OF EARNINGS AND EMPLOYMENT
The entropy measure serves as the base metric of industry-based economic diversity. Measures were calculated for employment, with employment by six-digit NAICS industry serving as the share of total economic activity (p
i) specified in Formula 1.
ANALYZING CHANGES IN DIVERSITY
This analysis relies upon 2009 and 2012 complete employment estimates from EMSI and 1999 suppression-adjusted employment data prepared by Isserman and Westervelt (2006) to calculate changes in industrial diversity. Diversity changes were examined for the periods 2009-2012 and 1999-2009. For the 1999-2009 analysis, the industries included with the 1999 dataset were used as the baseline for comparison when accounting for differences between the Isserman and Westervelt (2006) and EMSI datasets.
MEASURING FUNCTION-BASED ECONOMIC DIVERSITY
A region’s economic function or functions represent the collection of broad economic activities that the region’s workforce and firms engage in. Practically, functions can be
55
ECONOMIC DIVERSITY IN APPALACHIA
identified by grouping industries together into categories that are broadly similar on factors such as inputs, outputs, and/or the technological or skill requirements necessary to perform the work customary to these industries. Grouping industries according to function, rather than simply accepting the NAICS industry categories, can help to broadly characterize the economic roles a county plays in its region; provide insight into the economic relationships and similarities counties have with other regions; identify factors that make regions comparatively better fits for certain economic activities; and speak to the broader economic and demographic forces that are likely to impact a county’s economic prospects.
This section describes the methods used to classify industries into functional groupings, categorize counties according to their functional specialization, and calculate county-level, function-based economic diversity.
CREATING FUNCTIONAL INDUSTRY CLASSIFICATIONS
One purpose of a functional industry classification is to broadly define the types of work that are prevalent in a region. For example, Thompson and Thompson (1987) suggest grouping industries and occupations into functional classes to identify regional specializations in “routine work, precision operations, central management, research and development, and entrepreneurship” (p. 558). In an examination of the rise of services as a proportion of employment, Noyelle (1983) advanced a functional classification system for services “based on the type of outputs (intermediate or final outputs) and the institutional setting under which services are provided (private, public, or nonprofit sectors)” (p. 282). Lawrence (1984) classified manufacturing industries on the basis of the primary end use of the product (e.g., intermediate goods; consumer durables; producer durables; consumer nondurables) and the necessary inputs to the industry (e.g., research and development expenditures; scientists and engineers; capital-, labor-, and resource-intensive).
This analysis draws primarily from the work of Lawrence (1984) and Noyelle (1983) to categorize industries according to functional types. In an effort to focus on the economic base of counties, industries that often serve local populations, such as retail trade, personal services, doctor’s offices, local government, and construction, were excluded from the analysis of functions. Eleven functional categories were delineated and Table A1 lists the category titles and selected examples of industries within each class.
56
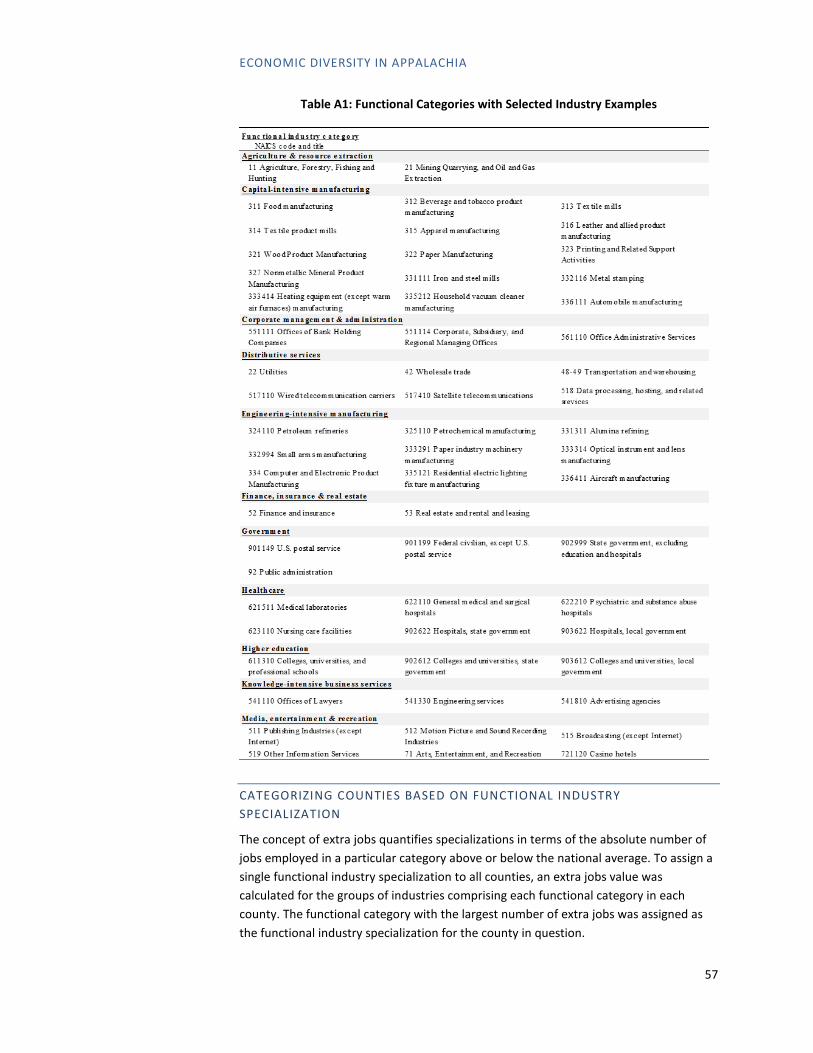
ECONOMIC DIVERSITY IN APPALACHIA
Table A1: Functional Categories with Selected Industry Examples
CATEGORIZING COUNTIES BASED ON FUNCTIONAL INDUSTRY SPECIALIZATION
The concept of extra jobs quantifies specializations in terms of the absolute number of jobs employed in a particular category above or below the national average. To assign a single functional industry specialization to all counties, an extra jobs value was calculated for the groups of industries comprising each functional category in each county. The functional category with the largest number of extra jobs was assigned as the functional industry specialization for the county in question.
57
ECONOMIC DIVERSITY IN APPALACHIA
For each county, extra jobs were calculated for each functional category as shown in Formula 2:
(2) 𝐸𝑥𝑡𝑟𝑎𝑖 = �𝐸𝑖𝑐𝐸𝑐− 𝐸𝑖𝑛
𝐸𝑛� 𝐸𝑐
where Eic is employment in the functional category of interest (i) for a county (c), Ec is total employment in the county of interest, Ein is the nation’s employment in the functional category of interest, and En is total national employment.
CALCULATING FUNCTION-BASED ECONOMIC DIVERSITY
The entropy measure was used to calculate function-based economic diversity. The metric was calculated for each county with employment by functional category serving as the share of total economic activity (pi) specified in Formula 1.
MEASURING OCCUPATION-BASED ECONOMIC DIVERSITY
Understanding what a region “does”—in addition to what a region “makes”—can help an analyst to better gauge the adaptability and suitability of a region to shocks and opportunities (Feser, 2003; Thompson and Thompson, 1987). In part, knowing what a region “does” requires data on the occupations of workers employed in the region’s industries and the skills required to perform those occupations. This section reviews the methods used to estimate county-level employment by occupations. These occupational employment estimates are then used as the basis for the calculation of an occupation-based measure of economic diversity.
DEFINING OCCUPATION GROUPS AND CALCULATING OCCUPATION-BASED ECONOMIC DIVERSITY
Occupation-based economic diversity uses the 96 minor occupational groups defined in the Bureau of Labor Statistics’ 2000 Standard Occupational Classification19 as the units of analysis in the calculation of entropy, with employment by minor occupational group serving as the share of total economic activity (pi) specified in Formula 1. According to the Bureau of Labor Statistics, occupations are grouped based on similarity of “work performed, skills, education, training, and credentials.” Example occupational groups including agricultural workers, life scientists, secretaries and administrative assistants, and top executives. To estimate employment by minor occupational grouping, data from the Bureau of Labor Statistics’ national Staffing Pattern Matrix were used to translate county employment by industry data to county-level employment by occupation.
MEASURING KNOWLEDGE-BASED ECONOMIC DIVERSITY
To estimate the diversity of workforce knowledge at the county level, occupation-based knowledge clusters were derived and employment across these clusters provided the
19 See http://www.bls.gov/soc/2000/socguide.htm
58
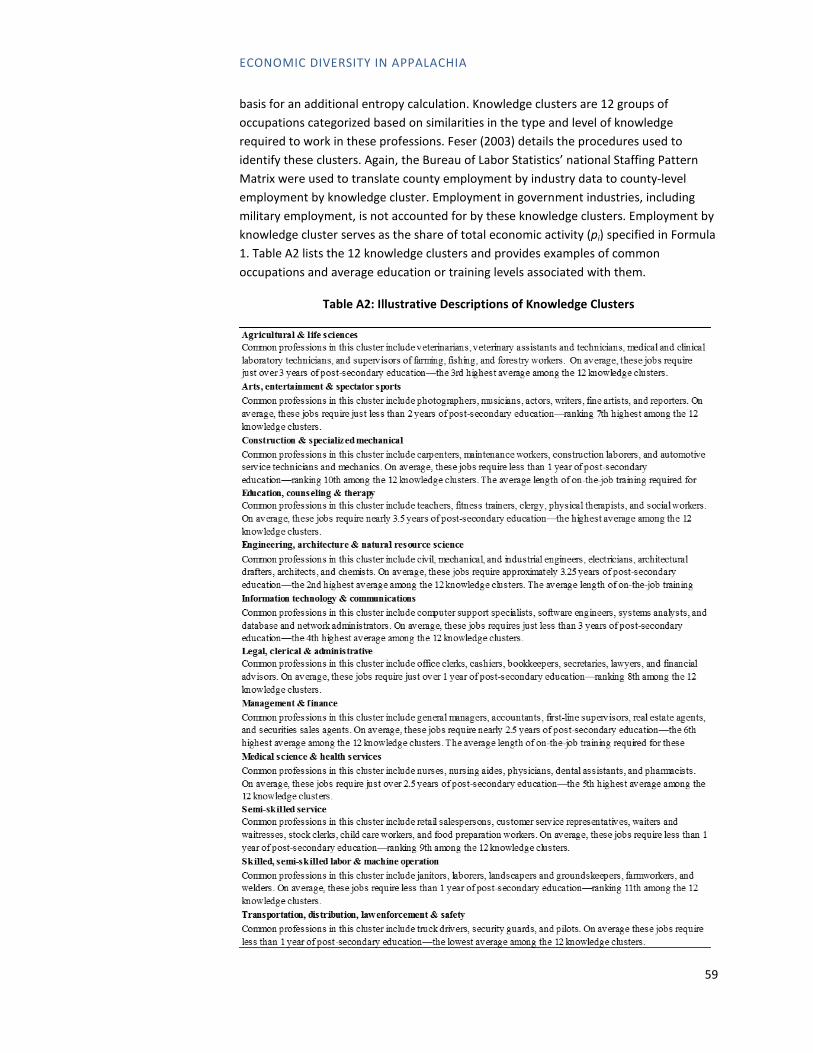
ECONOMIC DIVERSITY IN APPALACHIA
basis for an additional entropy calculation. Knowledge clusters are 12 groups of occupations categorized based on similarities in the type and level of knowledge required to work in these professions. Feser (2003) details the procedures used to identify these clusters. Again, the Bureau of Labor Statistics’ national Staffing Pattern Matrix were used to translate county employment by industry data to county-level employment by knowledge cluster. Employment in government industries, including military employment, is not accounted for by these knowledge clusters. Employment by knowledge cluster serves as the share of total economic activity (pi) specified in Formula 1. Table A2 lists the 12 knowledge clusters and provides examples of common occupations and average education or training levels associated with them.
Table A2: Illustrative Descriptions of Knowledge Clusters
59
ECONOMIC DIVERSITY IN APPALACHIA
CATEGORIZING COUNTIES BASED ON KNOWLEDGE CLUSTER SPECIALIZATION
Modeling the methods used to classify counties by functional specialization, counties were also categorized by knowledge cluster specialization. For this application, the 12 knowledge clusters substitute for the category of interest (i) in formula 2, above. A knowledge cluster specialization is assigned to a county based on the one cluster that accounts for the most extra jobs relative to the other eleven clusters.
GEOGRAPHIC AGGREGATIONS
To examine the differences in economic diversity across urban and rural counties, we adopted the urban-rural typology method suggested in Isserman (2005). This method required the classification of counties as one of four county characters—Urban, Mixed Urban, Mixed Rural, or Rural—based on the population density of the counties and the relative size of urban and rural areas within the counties. To complete the classification, we used U.S. Census 2010 data on total population, rural population, urbanized area and urban cluster population, and total urban population by county. Census information on land area by county was used to calculate population density. Finally, the Census 2010 Urban Area to County Relationship File Layout was used to determine the population of portions of urban areas located completely within individual counties.20 This file splits all urban areas based on county boundaries and reports the population associated with each portion.
We classified counties according to the following criteria:
Rural county: (1) The county’s population density is less than 500 people per square mile, and (2) 90 percent of the county population is in rural areas or the county has no urban area with a population of 10,000 or more.
Urban county: (1) The county’s population density is at least 500 people per square mile, (2) 90 percent of the county population lives in urban areas, and (3) the county’s population in urbanized areas is at least 50,000 or 90 percent of the county population.
Mixed rural county: (1) The county meets neither the urban nor the rural county criteria, and (2) its population density is less than 320 people per square mile.
Mixed urban county: (1) The county meets neither the urban nor the rural county criteria, and (2) its population density is at least 320 people per square mile. (Isserman, 2005, p. 475)
20 See http://www.census.gov/geo/maps-data/data/ua_rel_layout.html for a description of the Census 2010 Urban Area to County Relationship File Layout contents.
60

ECONOMIC DIVERSITY IN APPALACHIA
DETERMINING COMMUTING LINKAGES
In most U.S. counties, workers, firms, and consumers depend upon employment, shopping, and service opportunities that lie both within and outside their home county. While there are many potential regions that could be defined to approximate the multiple economic relationships among places (e.g., firm-to-firm; worker-to-employer; consumer-to-store), the analysis of commuting patterns provides one method for defining inter-county economic relationships.
Using 2006-2010 county-to-county commuting flow data prepared by the U.S. Census Bureau, we defined commuting sheds for each U.S. county.21 A county’s commuting shed includes all those counties that account for a significant share of the journey-to-work commuting flow headed toward or away from that county. Journey-to-work data from the U.S. Census Bureau’s 2006-2010 American Community Survey were used to determine membership in a commuting shed. Specifically, counties are included in a commuting shed if they account for at least five percent of the worker flow toward or away from the county in question. Commuting sheds range in size from one to nine counties in size, including the county of interest. In order to calculate measures of commuting shed diversity, employment by industry data for all counties in a commuting shed were combined.
PRESENTATION OF METRICS
The diversity metrics calculated for this analysis cannot be easily interpreted unless counties are compared relative to one another or the overall distribution of county diversity values. To accomplish these comparisons and allow for interpretation, diversity measures were standardized and classified according to the procedures described in this section.
DATA STANDARDIZATION
For each diversity measure calculated on a county-by-county basis, data standardization required three steps. First, the diversity measure was calculated, resulting in a raw diversity score for each county. Second, the mean, raw diversity value was calculated for each measure by summing the raw diversity values across all counties and dividing by the number of counties. Third, each county’s raw diversity value was divided by the mean, raw diversity value, resulting in a standardized value for each county. Standardized values can be interpreted as follows:
• A standard value (X) less than 1.0 is (1 – X) * 100 percent less diverse than the mean county diversity value (e.g., a standard value of 0.67 is 33 percent less diverse than the mean diversity value);
• A standard value of 1.0 is equivalent to the mean county diversity value;
21 See http://www.fhwa.dot.gov/planning/census_issues/ctpp/ for information on Census Transportation Planning Products
61
ECONOMIC DIVERSITY IN APPALACHIA
• A standard value (X) greater than 1.0 is (X - 1) * 100 percent more diverse than the mean county diversity value (e.g., a standard value of 1.25 is 25 percent more diverse than the mean diversity value).
Z-SCORES CLASSIFICATION
While standardized diversity scores serve as a simple indicator of the relationship of a county’s diversity to the average diversity, z-scores provide information on the relationship of a value to the mean and the value’s placement relative to the distribution of diversity (or another measure, such as average establishment size) across all counties. Z-scores for each value and diversity measure were calculated as follows:
• Calculate the mean (�̅�) and standard deviation (s) for a particular diversity measure;
• For each diversity value (xi), calculate the difference (di) between the value and the mean value (di = xi - �̅�);
• Calculate the z-score for each county’s diversity value (zi) to equal the quotient of the difference between the county’s value and the mean value and the standard deviation (zi = di/s)
While the distributions of the diversity values vary by measure, and none of the measures have a perfect normal distribution, z-scores can be used to provide a shorthand classification of individual values into groups with high, low, or about average values. Z-scores were classified into groups as follows:
• Very high (zi >= 2)
• High (1 <= zi < 2)
• Above average (0 < zi < 1)
• Below average (0 > zi > -1)
• Low (-1 >= zi > -2)
• Very low (zi <= -2)
To control for county character, z-scores were also calculated according to the distribution of diversity scores across each of the four county character categories. Each county was then classified on the very low-very high scale according to its z-score based on the distribution of values in the same county character grouping. Where county character-based z-scores were used to classify counties, tables or maps are identified by language indicating the displayed values control for county character.
62
Related Documents