Manufacturing Competitiveness Investment Trends and What That Means for You 4 December 2015 Sarah Raehl Deloitte Consulting LLP

Welcome message from author
This document is posted to help you gain knowledge. Please leave a comment to let me know what you think about it! Share it to your friends and learn new things together.
Transcript

Manufacturing Competitiveness Investment Trends and What That Means for You 4 December 2015 Sarah Raehl Deloitte Consulting LLP

#ED411 Copyright © 2015 Deloitte Development LLC. All rights reserved.
The US continues to be a recipient of significant Foreign Direct Investment (FDI) • Annual FDI in the US has averaged $200B / year for
the last 8 years
• The continued expansion of the global market is creating a more competitive investment climate
World inflows of FDI
United States 2007 $221B, 11% 2013 $193B, 14%
Europe 2007 $856B, 44% 2013 $239B, 17%
China 2007 $156B, 8% 2013 $258B, 19%
Attractiveness to expanding businesses – both foreign and domestic – is key to economic growth within the global market
Source: OECD international direct investment database
Note: Percentages indicate each country/region’s percentage of total global FDI
Asia European Union
Rest of World
United States

#ED411 Copyright © 2015 Deloitte Development LLC. All rights reserved.
• Total US FDI has risen steadily over time, increasing 38.7% between 2007 and 2013 to $2.8 Trillion
• During that time manufacturing rose over 44% to $936B, accounting for over a third of total US FDI
Manufacturing continues to be the largest FDI sector
0
100
200
300
400
500
600
700
800
900
1000 2013 MFG by Segment $ billion
US total FDI by sector (historical cost basis)
Source: US Bureau of Economic Analysis
Electrical equipment Computers & Electronics
Metals
Food
Machinery
Transportation Equipment
Chemicals
Other Manufacturing

What is driving these trends?

#ED411 Copyright © 2015 Deloitte Development LLC. All rights reserved.
A new generation of digital design and collaboration tools is enabling manufacturers to save time and money in product development and manufacturing, potentially freeing up funds for such things as innovation
Advanced materials with superior performance characteristics, such as carbon fiber composites, ceramics, and nanomaterials are increasingly finding uses in large consumer-oriented industries, which may impact supply chains to streamline access
New processes such as additive manufacturing (e.g. 3D printing) are influencing everything from product design to material selection, to supply chain configuration
Increased push for product customization in less time, while balancing cost and risk demands
Focus is shifting from manufacturing as a cost to be minimized to a strategic lever to drive long term success through product differentiation
New technologies are shaping the future of manufacturing and offering companies new ways to compete, innovate, and grow
New Uses of IT
New Materials
New Production Processes
Shifting Demand Patterns

Where is next?

#ED411 Copyright © 2015 Deloitte Development LLC. All rights reserved.
• 50+ companies responded to the survey • Fabricated Metal Products and Machinery Manufacturing were the top segments represented in the survey • Average revenue of participant organizations was $500M to $10B while the employee count was 1,000 to 10,000
Deloitte, in partnership with MAPI, conducted a survey of US manufacturers regarding the evolution of their global footprint through 2020
25%
23%
18%
8%
8%
4% 4%
10% • Fabricated Metal Products • Machinery • Miscellaneous • Transportation Equipment • Electrical Equipment, Appliance
and Component Manufacturing • Chemicals • Plastics and Rubber Products • Other
9%
26%
14%
46%
0% 6%
$10M to $100M
$100M to $500M
$500M to $1B
$1B to $10B
$10B to $30B
> $30B
Primary Industry of Survey Respondents Annual Revenues of Survey Respondents

#ED411 Copyright © 2015 Deloitte Development LLC. All rights reserved.
Market opportunities, the search for talent, and concerns with business disruption risk have historically been primary location decision drivers
Regulatory Climate Favorable government support
Talent Availability Search for engineers and skilled production workers, particularly welders and machinists
Business Disruption Risk Minimize exposure to natural, political, economic, and infrastructure risks that can disrupt production
Infrastructure Quality Robust and reliable infrastructure to minimize production disruptions
Proximity to Existing Customers Reduce time and cost to get products to end market
New Market Opportunity Growing purchasing power and sheer size of markets such as China and Brazil
#ED411 Copyright © 2015 Deloitte Development LLC. All rights reserved.
The location drivers are expected to shift by 2020 to account for advances in technology and investment in skills
Key Location Drivers Today Key Location Drivers in 2020
New Market Opportunity
Proximity to Existing
Customers
Talent Availability
Business Disruption
Risk
Infrastructure Quality
Regulatory Climate
New Market Opportunity
Proximity to Existing
Customers
Talent Availability
Business Disruption
Risk
Technology Advances
Educational Infrastructure
#ED411 Copyright © 2015 Deloitte Development LLC. All rights reserved.
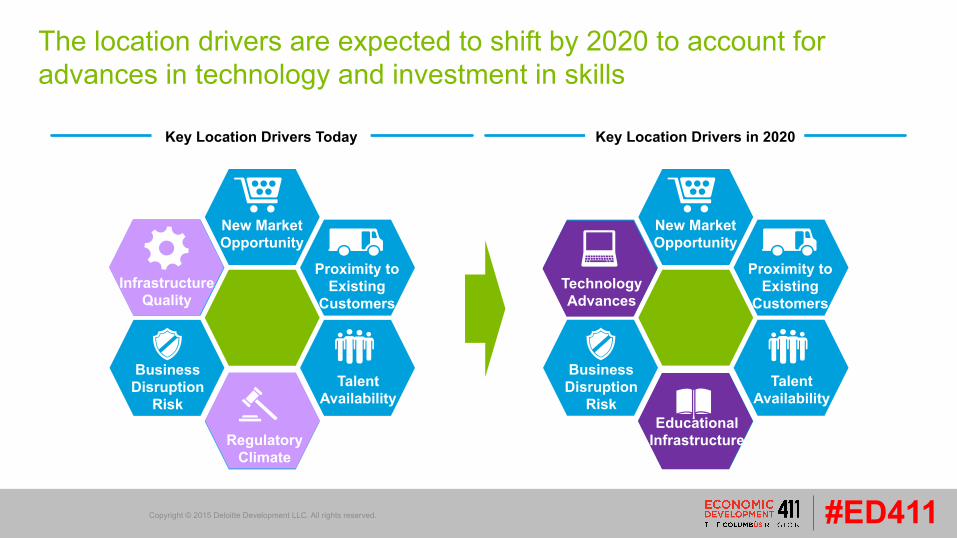
Shifting priorities and the evolving global landscape have resulted in two complementary trends - expansion and new growth
• 98% of respondents plan to add operations where they have an existing footprint
• Within the existing footprint, the highest number of investments by 2020 is expected in China and the United States
1. Data shown for top 10 countries
3 4 4 3 4 7 8 14
24 24
3 3 5 5 5
5 9
16 23
30
2
2 4 3
7 9
17 20
21
2 2
5 6
3 8
2 22
16
0 10 20 30 40 50 60 70 80 90 100
Czech Republic Italy
Poland United Kingdom
Germany Brazil India
Mexico United States
China
Primary Production
Secondary Production
Number of Investments
Number of Investments by 2020 in Countries Where Companies Have Existing Manufacturing Presence
Survey Question: In the countries where your company currently has a manufacturing presence, what additional investments within the manufacturing footprint do you envision making by 2020?1

#ED411 Copyright © 2015 Deloitte Development LLC. All rights reserved.
• While Brazil, China and India continue to be leading candidates for new manufacturing investments, countries such as South Africa, Turkey and Vietnam are also being considered
54% of respondents plan to invest outside of their existing footprint, with a focus in Asia and South America
2 2
3 4 4 4
6 7 7 7
0 2 4 6 8
Saudi Arabia Russia Poland
Vietnam Turkey Mexico
South Africa India
China Brazil
1. Data shown for top 10 countries
Number of Companies
Survey Question: What countries do you anticipate your company will enter (or are considering for entry) by 2020? 1
Number of Companies Looking to Enter New Markets
Country Talent Access
Serve New
Markets
Cost Reduction
Opportunity
Proximity to Resources /
Suppliers Incentives
Favorable Logistics /
Supply Chain
Brazil
China
India
Mexico
Poland
Russia
Saudi Arabia
South Africa
Turkey
Vietnam
High Importance Moderate Importance Limited Importance
Reasons for Expanding Footprint

How can you compete?

#ED411 Copyright © 2015 Deloitte Development LLC. All rights reserved.
Demonstrating a deep talent pool, robust ecosystem, and supportive business environment will be key to competing for manufacturing investment Talent Availability
• Existing talent availability • Pipeline of talent • Relevant industry concentration
Timing to Market • Development ready real estate options
• Site readiness – prepped and ready to go • Utilities – in place, reliable, scalable, and sustainable • Road access – in place • Permitting & environmental studies – complete or able to be expedited
Attractive Cost Structure • One-Time (land/building, construction, site prep, capital, permits) • Ongoing (labor, logistics, taxes, utilities, facility) • Incentives (Upfront, Ongoing)
Fit • United front for attracting business (regional level) • Brand image and company culture • Desirable place to live (expats & Americans)
Enabling Manufacturing
Talent Availability
Timing to Market Cost
Fit

#ED411 Copyright © 2015 Deloitte Development LLC. All rights reserved.
Proactively identifying and addressing challenges within your target ecosystems can be a key differentiator in the long-term
Manufacturers
Universities/ tech colleges
Growth fundin
g
Growth
funding
Investment return
3D printing service
providers
• Software developers • Material providers
Industry trade groups
Startups
Financers
Support
services
Talent
Training
Talent
Research
Research funding
Mentorship
Leadership
Shared research
Development Partnerships/ Research
Training input
Shared research
Jobs / internships
Mfg input / partnerships
Jobs
Training
Training
3D Printing
Representative 3D Printing Ecosystem

Locations that excel at demonstrating favorable talent pools, ecosystems, and supportive business
environments are likely to be the big winners in the race to attract manufacturing investments in the future

Copyright © 2015 Deloitte Development LLC. All rights reserved. Member of Deloitte Touche Tohmatsu Limited
Related Documents