electronics Article Economic Design of Hybrid Pico-Hydraulic/Photovoltaic Generation System: A Case Study in Egypt Fathalla F. Selim 1, * , Almoataz Abdelaziz 2 and Ibrahim B. M. Taha 3 Citation: Selim, F.F.; Abdelaziz, A.; Taha, I.B.M. Economic Design of Hybrid Pico-Hydraulic/Photovoltaic Generation System: A Case Study in Egypt. Electronics 2021, 10, 2947. https://doi.org/10.3390/ electronics10232947 Academic Editor: Albert Smalcerz Received: 23 October 2021 Accepted: 21 November 2021 Published: 26 November 2021 Publisher’s Note: MDPI stays neutral with regard to jurisdictional claims in published maps and institutional affil- iations. Copyright: © 2021 by the authors. Licensee MDPI, Basel, Switzerland. This article is an open access article distributed under the terms and conditions of the Creative Commons Attribution (CC BY) license (https:// creativecommons.org/licenses/by/ 4.0/). 1 Department of Electrical Engineering, Faculty of Engineering, Kafrelshiekh University, Kafrelshiekh P.O. Box 33516, Egypt 2 Faculty of Engineering and Technology, Future University in Egypt, Cairo P.O. Box 11835, Egypt; [email protected] 3 Department of Electrical Engineering, College of Engineering, Taif University, P.O. Box 11099, Taif 21944, Saudi Arabia; [email protected] * Correspondence: [email protected] Abstract: Clean and renewable energy sources are the preferable power system generations for the overall world. This research aims to present a very highly integrated, economic, professional, and simple construction, clean and natural resources usage of the renewable hybrid generation system. This research performs analysis, systematic representation, evaluation, and design of the hybrid proposed system—pico-hydraulic from home usage water and photovoltaic (PV)—to generate an optimal renewable generation system using a new professional control system. Applying this proposed technique in Egypt shows that the hybrid system successfully overcame Egypt’s energy crisis. Renewable energy will rise to 8.782% by increasing 7.323% (14,408.83 GWh/Y). Besides, this system increases the power supply reliability; it gives an additional emergency supply and reduces the exhausts from other generation stations (e.g., CO 2 ). The saving from this hybrid system is very effective for; the residential sector (subscribes), which will be ranged from 9599.298 million E£/10Ys up to 86,393.68 million E£/10Ys that equals 5399.6 million $, government to use this extra generation energy to reduce the maximum loads from various stations. A practical model has been presented with results to verify the high efficiency of the proposed system that illustrates the effective performance of the used hybrid system. Keywords: renewable energy; hybrid proposed generation system; exhausts; residential; eco- nomic strip 1. Introduction One of the main incentives for economic development is enhancing the electric energy sector, as it plays a significant role in present-day civilization [1]. Due to population growth, human comfort level boosting, and industrialization development, electricity demand is increasing rapidly globally with an annual growth rate of 4% [2]. Therefore, most researchers are interested in how to save or generate electrical power. 1.1. Saved Power Literature Overview The saving in power for all consumed sectors, especially the buildings considered one of the largest energy sectors, about 30–32%, from the total energy productions. For example, the retail sector may reach up to 80% of the energy used [3,4]. These saved methodologies studies apply to traditional homes and smart homes. Generally, smart home technologies have reached a good state of maturity, but these are not found in all countries [5]. Paper [6] refers to some of the smart home projects: the Computer-aided design software for smart home devices (based on cloud computing service project) helps the designer to select the smart home device and build a smart living space (visual stimulation). In addition, in Refs. [6,7], another project called energy saving Electronics 2021, 10, 2947. https://doi.org/10.3390/electronics10232947 https://www.mdpi.com/journal/electronics

Welcome message from author
This document is posted to help you gain knowledge. Please leave a comment to let me know what you think about it! Share it to your friends and learn new things together.
Transcript
electronics
Article
Economic Design of Hybrid Pico-Hydraulic/PhotovoltaicGeneration System: A Case Study in Egypt
Fathalla F. Selim 1,* , Almoataz Abdelaziz 2 and Ibrahim B. M. Taha 3
�����������������
Citation: Selim, F.F.; Abdelaziz, A.;
Taha, I.B.M. Economic Design of
Hybrid Pico-Hydraulic/Photovoltaic
Generation System: A Case Study in
Egypt. Electronics 2021, 10, 2947.
https://doi.org/10.3390/
electronics10232947
Academic Editor: Albert Smalcerz
Received: 23 October 2021
Accepted: 21 November 2021
Published: 26 November 2021
Publisher’s Note: MDPI stays neutral
with regard to jurisdictional claims in
published maps and institutional affil-
iations.
Copyright: © 2021 by the authors.
Licensee MDPI, Basel, Switzerland.
This article is an open access article
distributed under the terms and
conditions of the Creative Commons
Attribution (CC BY) license (https://
creativecommons.org/licenses/by/
4.0/).
1 Department of Electrical Engineering, Faculty of Engineering, Kafrelshiekh University,Kafrelshiekh P.O. Box 33516, Egypt
2 Faculty of Engineering and Technology, Future University in Egypt,Cairo P.O. Box 11835, Egypt; [email protected]
3 Department of Electrical Engineering, College of Engineering, Taif University,P.O. Box 11099, Taif 21944, Saudi Arabia; [email protected]
* Correspondence: [email protected]
Abstract: Clean and renewable energy sources are the preferable power system generations forthe overall world. This research aims to present a very highly integrated, economic, professional,and simple construction, clean and natural resources usage of the renewable hybrid generationsystem. This research performs analysis, systematic representation, evaluation, and design of thehybrid proposed system—pico-hydraulic from home usage water and photovoltaic (PV)—to generatean optimal renewable generation system using a new professional control system. Applying thisproposed technique in Egypt shows that the hybrid system successfully overcame Egypt’s energycrisis. Renewable energy will rise to 8.782% by increasing 7.323% (14,408.83 GWh/Y). Besides, thissystem increases the power supply reliability; it gives an additional emergency supply and reducesthe exhausts from other generation stations (e.g., CO2). The saving from this hybrid system isvery effective for; the residential sector (subscribes), which will be ranged from 9599.298 millionE£/10Ys up to 86,393.68 million E£/10Ys that equals 5399.6 million $, government to use this extrageneration energy to reduce the maximum loads from various stations. A practical model has beenpresented with results to verify the high efficiency of the proposed system that illustrates the effectiveperformance of the used hybrid system.
Keywords: renewable energy; hybrid proposed generation system; exhausts; residential; eco-nomic strip
1. Introduction
One of the main incentives for economic development is enhancing the electric energysector, as it plays a significant role in present-day civilization [1]. Due to populationgrowth, human comfort level boosting, and industrialization development, electricitydemand is increasing rapidly globally with an annual growth rate of 4% [2]. Therefore,most researchers are interested in how to save or generate electrical power.
1.1. Saved Power Literature Overview
The saving in power for all consumed sectors, especially the buildings consideredone of the largest energy sectors, about 30–32%, from the total energy productions. Forexample, the retail sector may reach up to 80% of the energy used [3,4].
These saved methodologies studies apply to traditional homes and smart homes.Generally, smart home technologies have reached a good state of maturity, but these arenot found in all countries [5]. Paper [6] refers to some of the smart home projects: theComputer-aided design software for smart home devices (based on cloud computingservice project) helps the designer to select the smart home device and build a smart livingspace (visual stimulation). In addition, in Refs. [6,7], another project called energy saving
Electronics 2021, 10, 2947. https://doi.org/10.3390/electronics10232947 https://www.mdpi.com/journal/electronics
Electronics 2021, 10, 2947 2 of 25
depends on using sensors to minimize domestic energy waste according to human habits.One of the earliest projects is Mozer’s adaptive control of the US’s home environment(ACHE) system. ACHE can use adaptive sensors to control: temperature, heating, andlighting. Authors in [8] introduce energy usage scheduling and management under electricutility to solve the energy management problem and reduce bill cost, peak-to-averageratio, and carbon emission. The model presented in [9] interests saving lighting powerby applying an appropriate lighting design system. The saving system introduced in [10]reviews more than 23 power saved researches with different methods/strategies. Othersaving researches [11–14] present the various controlled lighting system to give the requiredilluminance according to the human occupancy/reference to the place activity or by thevehicles traffic density in the street as in [12], illumination sensors as in [13,14] uses sensor-triggered control strategies. Due to the importance of commercial buildings, paper [15]gives a hybrid system to save consumed power at high levels.
1.2. Related Works Overview
Most of the world’s energy is derived from fossil fuels which cannot supply all therequired load demand–depleted and limited– and contributes to high exhausts (traditionalgeneration systems give nearly 75% of total CO2 emission in the world) [16].
There are many works of the literature on RE generation systems which can concludegeneration types (PV, Wind . . . etc.), enhancement production methodologies, etc.
In recent years, many research studies have tried to reach the optimal generation/operation from the very important type (RE)(samples):
• The RE can reduce the exhausts to provide a clean environment through studies [17].• The optimal production with PV generation requires various methodologies and
techniques [18,19].• Other researchers execute the various combined methods (Hybrid) to reach the optimal
production, such as [16,20–22], which are very effective in reaching optimal productionwith the economy.
From the above sections;
• There is a need to produce additional electrical power from RE to satisfy the unsup-plied loads throughout the world,
• The generation of Hybrid RE is a very effective electrical production system w.r.ttraditional and single method,
• Most research scope about the advanced methodologies that may be cannot be appliedin practical especially the developing countries and with popular human houses.
Therefore, the key contribution of this paper is the development of a comprehensiveand actual optimal for generating power from Hybrid Pico-hydraulic/Photovoltaic byeffective/simple methodology. This study gives an applied model in the popular homeusing RE of solar energy and water by the lowest cost and high saving money method asexplained in the case study section.
An applicable model is verified in Egypt -as a case study-to show how this proposedtechnique can effectively increase the RE generation for the government and save moneyfor the consumers.
2. Egypt Renewable Energy Scenario
In Egypt, about 95% of the population is served by the electricity grid. The currentavailable capacity is larger than the peak load by only 3% “lower than the internationallyadvisable margin of 15%”. Thermal plants supply most of the energy, and the remainingdemands are supplied by large hydro plants with very low percentages by independentpower producers (e.g., wind) [23]. According to [24], 91.43% of total power productionis from thermal plants (95.91% from natural gases and 4.09% from heavy oil), hydroplants give 7.27%, wind and solar give 1.91%. According to the duration of the sun’sbrightness, PV systems be economical or not for smart houses (proposed technique). Some
Electronics 2021, 10, 2947 3 of 25
information about Egypt’s renewable energy with solar energy will be introduced in thefollowing paragraphs:
The duration of the sun’s brightness is high throughout Egypt, starting from a low levelof 3300 h/Y along the northern part of places such as Alexandria to reach the highest levelof more than 4000 h/Y in most parts of the country [25,26]. The average daily brightness ofthe sun ranges between 9.3–10.8 h/D [27]. In the north, it ranges from 6–8 h/D, while it isbetween 8–10 h/D in the south. The number of hours of sunshine increases in summer to amaximum of 12 h/D in June and July [28,29].
Although Egypt is vast and has abundant solar energy resources, the numbers ofmeteorological stations are few. Therefore, many methodologies are done to solve thisproblem [30,31].
There are updated Egyptian studies that focus on how great benefits of PV systemin Egypt are to give the maximum output green generation [32], and discuss the qualityeffects of PV generation outputs (I, V) on the low voltage grid of Electronics ResearchInstitute Egypt [33]. The hybrid systems for various generation and applications types areapplied to give the most economic and efficient solution, such as the application of hybridwind/P.V. energy system for a remote area in Egypt [34] and supply the required loadswithout any defaults of the grid “DGs” while keeping the distribution network withinminimum pollution [35].
3. Methodology
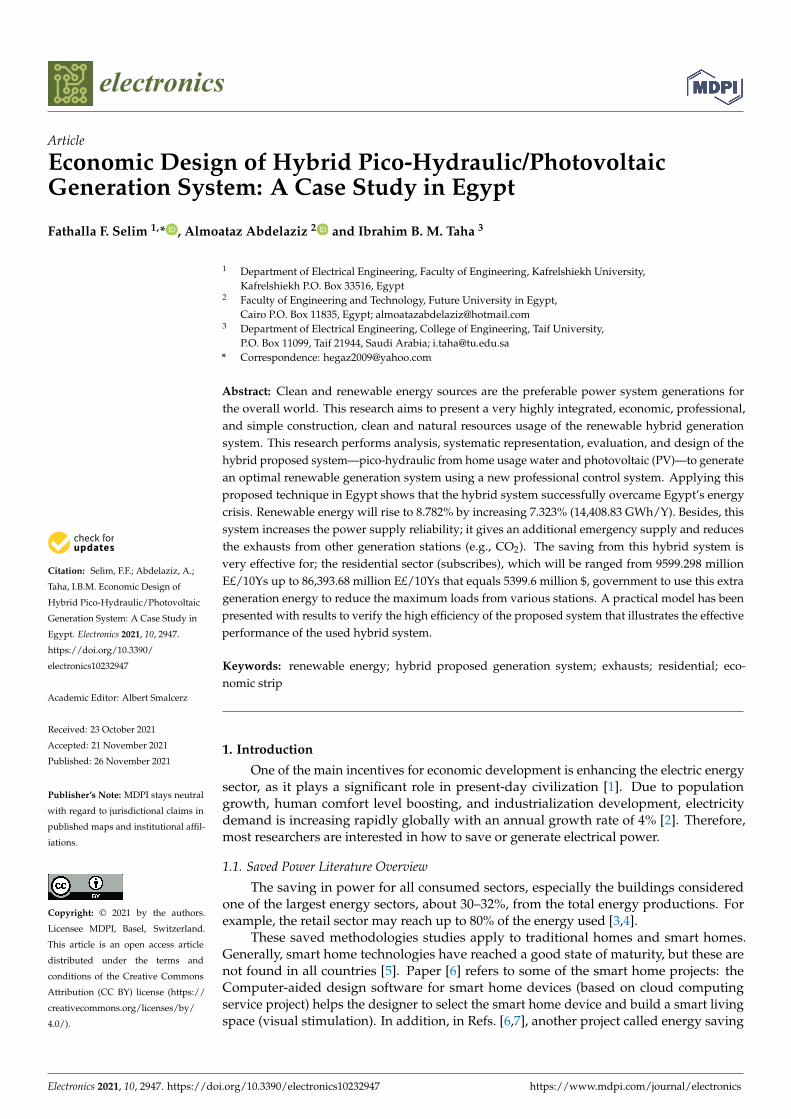
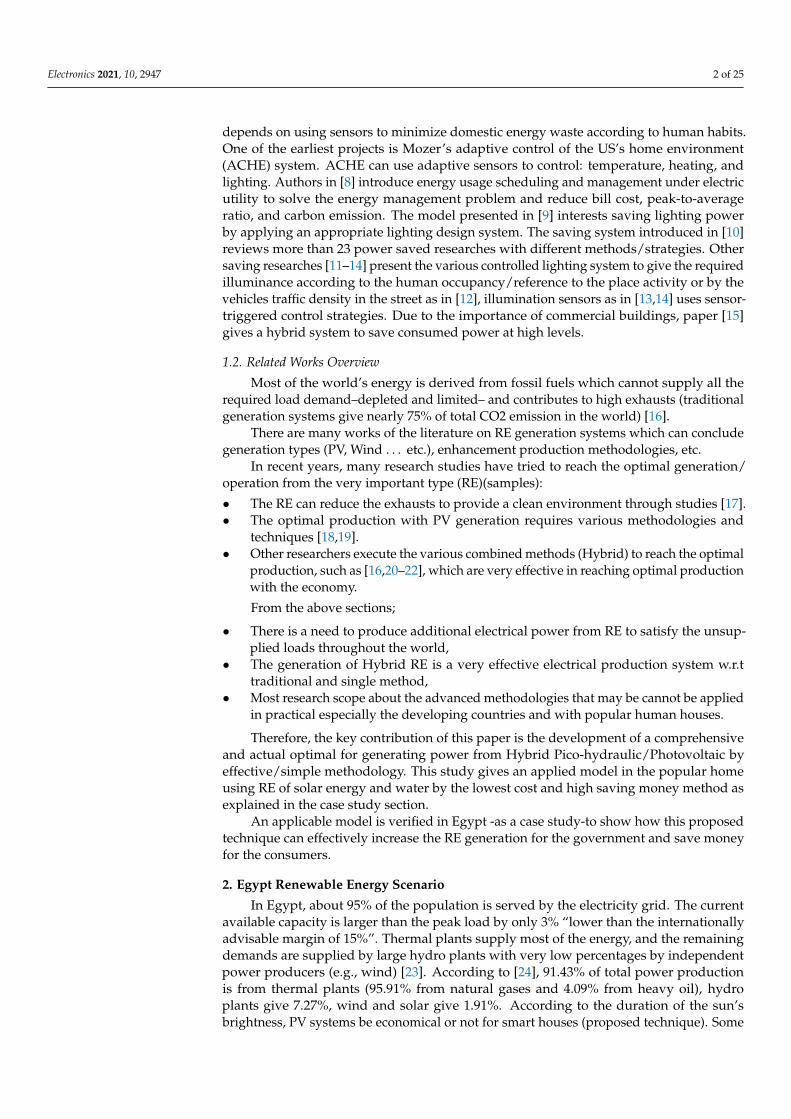
The methodology has been selected and developed based on the aim of this casestudy. The methodology has been based on; designing hydraulic and PV systems, themathematical calculations of the required power to satisfy decided power, and limitingthe home consumer bill to the economic range. It is based on estimating the requiredpower needed from the RE hybrid system to maintain the monthly residential home onthe economic strip. This economic strip will be decided from the tariff of the ministryof Egypt electricity. The comparison shall explain that the hybrid system can give therequired power by an easy and simple method with minimal cost w.r.t the traditional powersupplied by the government. The proposed, tested model will verify the methodology, andthis model builds on Figures 1–3. These Figures investigate how can generate the requiredpower from a hybrid system; Figure 1 explains the integrated generation system flowchart(verify the supply power/voltage maintained at a certain level under any circumstances),Figure 2 display the structure of hybrid system components and the perfect places of them,and Figure 3 indicates the logic circuit to fix the power/voltage at the required level.
Electronics 2021, 10, 2947 4 of 25Electronics 2021, x, x FOR PEER REVIEW 4 of 26
Figure 1. Integrated generation system flowchart.
Figure 2. House generation systems places.
Figure 1. Integrated generation system flowchart.
Electronics 2021, x, x FOR PEER REVIEW 4 of 26
Figure 1. Integrated generation system flowchart.
Figure 2. House generation systems places.
Figure 2. House generation systems places.
Electronics 2021, 10, 2947 5 of 25Electronics 2021, x, x FOR PEER REVIEW 5 of 26
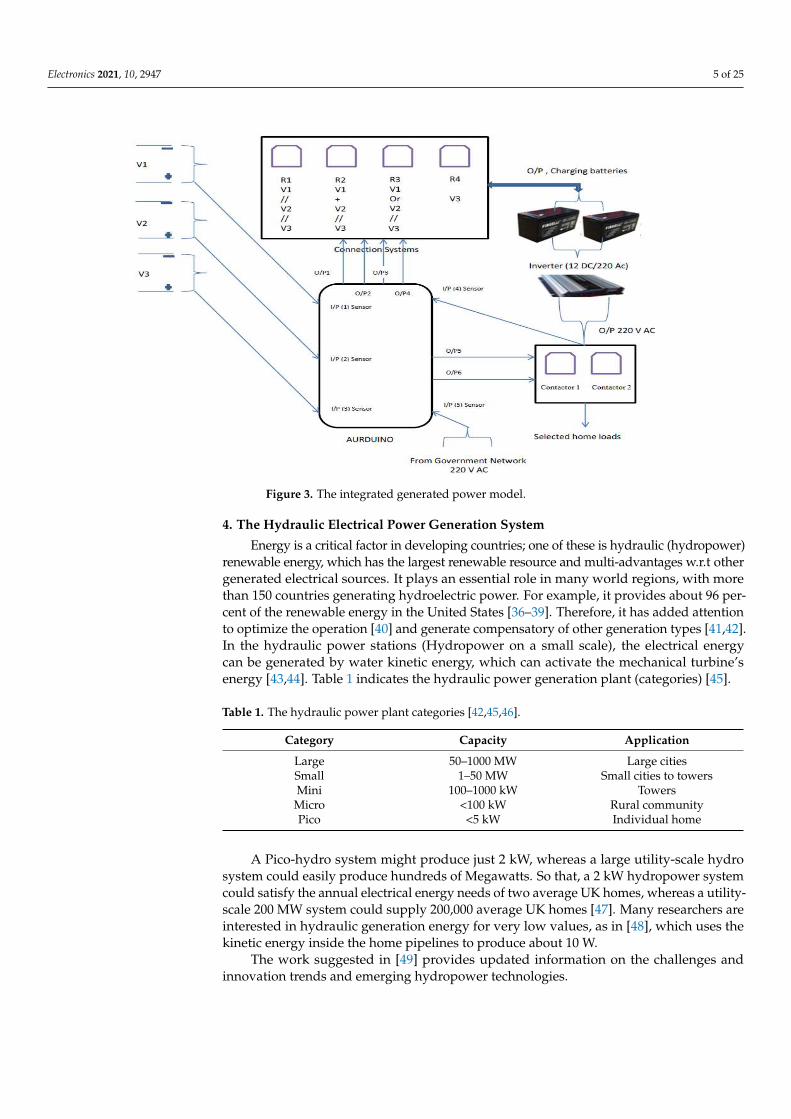
Figure 3. The integrated generated power model.
4. The Hydraulic Electrical Power Generation System Energy is a critical factor in developing countries; one of these is hydraulic
(hydropower) renewable energy, which has the largest renewable resource and multi-advantages w.r.t other generated electrical sources. It plays an essential role in many world regions, with more than 150 countries generating hydroelectric power. For example, it provides about 96 percent of the renewable energy in the United States [36–39]. Therefore, it has added attention to optimize the operation [40] and generate compensatory of other generation types [41,42]. In the hydraulic power stations (Hydropower on a small scale), the electrical energy can be generated by water kinetic energy, which can activate the mechanical turbine’s energy [43,44]. Table 1 indicates the hydraulic power generation plant (categories) [45].
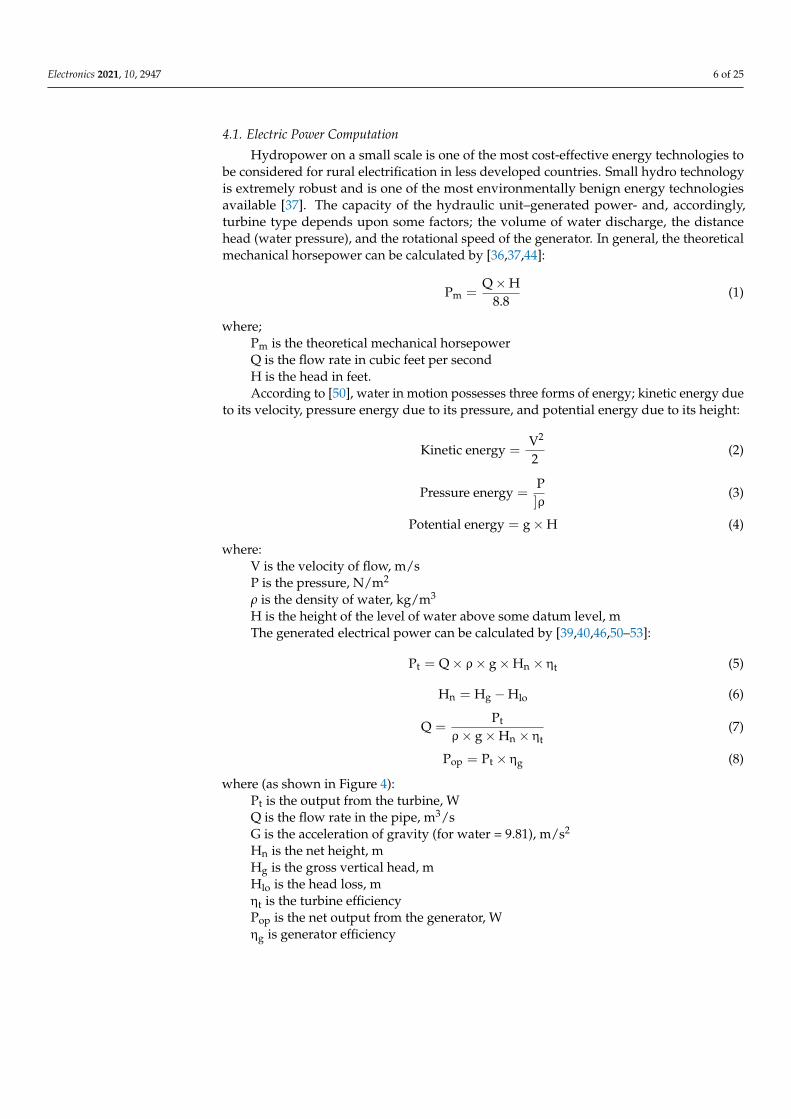
Table 1. The hydraulic power plant categories [42,45,46].
Category Capacity Application Large 50–1000 MW Large cities Small 1–50 MW Small cities to towers Mini 100–1000 kW Towers
Micro <100 kW Rural community Pico <5 kW Individual home
A Pico-hydro system might produce just 2 kW, whereas a large utility-scale hydro system could easily produce hundreds of Megawatts. So that, a 2 kW hydropower system could satisfy the annual electrical energy needs of two average UK homes, whereas a utility-scale 200 MW system could supply 200,000 average UK homes [47]. Many researchers are interested in hydraulic generation energy for very low values, as in [48], which uses the kinetic energy inside the home pipelines to produce about 10 W. On the
The work suggested in [49] provides updated information on the challenges and innovation trends and emerging hydropower technologies.
Figure 3. The integrated generated power model.
4. The Hydraulic Electrical Power Generation System
Energy is a critical factor in developing countries; one of these is hydraulic (hydropower)renewable energy, which has the largest renewable resource and multi-advantages w.r.t othergenerated electrical sources. It plays an essential role in many world regions, with morethan 150 countries generating hydroelectric power. For example, it provides about 96 per-cent of the renewable energy in the United States [36–39]. Therefore, it has added attentionto optimize the operation [40] and generate compensatory of other generation types [41,42].In the hydraulic power stations (Hydropower on a small scale), the electrical energycan be generated by water kinetic energy, which can activate the mechanical turbine’senergy [43,44]. Table 1 indicates the hydraulic power generation plant (categories) [45].
Table 1. The hydraulic power plant categories [42,45,46].
Category Capacity Application
Large 50–1000 MW Large citiesSmall 1–50 MW Small cities to towersMini 100–1000 kW TowersMicro <100 kW Rural communityPico <5 kW Individual home
A Pico-hydro system might produce just 2 kW, whereas a large utility-scale hydrosystem could easily produce hundreds of Megawatts. So that, a 2 kW hydropower systemcould satisfy the annual electrical energy needs of two average UK homes, whereas a utility-scale 200 MW system could supply 200,000 average UK homes [47]. Many researchers areinterested in hydraulic generation energy for very low values, as in [48], which uses thekinetic energy inside the home pipelines to produce about 10 W.
The work suggested in [49] provides updated information on the challenges andinnovation trends and emerging hydropower technologies.
Electronics 2021, 10, 2947 6 of 25
4.1. Electric Power Computation
Hydropower on a small scale is one of the most cost-effective energy technologies tobe considered for rural electrification in less developed countries. Small hydro technologyis extremely robust and is one of the most environmentally benign energy technologiesavailable [37]. The capacity of the hydraulic unit–generated power- and, accordingly,turbine type depends upon some factors; the volume of water discharge, the distancehead (water pressure), and the rotational speed of the generator. In general, the theoreticalmechanical horsepower can be calculated by [36,37,44]:
Pm =Q×H
8.8(1)
where;Pm is the theoretical mechanical horsepowerQ is the flow rate in cubic feet per secondH is the head in feet.According to [50], water in motion possesses three forms of energy; kinetic energy due
to its velocity, pressure energy due to its pressure, and potential energy due to its height:
Kinetic energy =V2
2(2)
Pressure energy =P]ρ
(3)
Potential energy = g×H (4)
where:V is the velocity of flow, m/sP is the pressure, N/m2
ρ is the density of water, kg/m3
H is the height of the level of water above some datum level, mThe generated electrical power can be calculated by [39,40,46,50–53]:
Pt = Q× ρ× g×Hn × ηt (5)
Hn = Hg −Hlo (6)
Q =Pt
ρ× g×Hn × ηt(7)
Pop = Pt × ηg (8)
where (as shown in Figure 4):Pt is the output from the turbine, WQ is the flow rate in the pipe, m3/sG is the acceleration of gravity (for water = 9.81), m/s2
Hn is the net height, mHg is the gross vertical head, mHlo is the head loss, mηt is the turbine efficiencyPop is the net output from the generator, Wηg is generator efficiency
Electronics 2021, 10, 2947 7 of 25Electronics 2021, x, x FOR PEER REVIEW 7 of 26
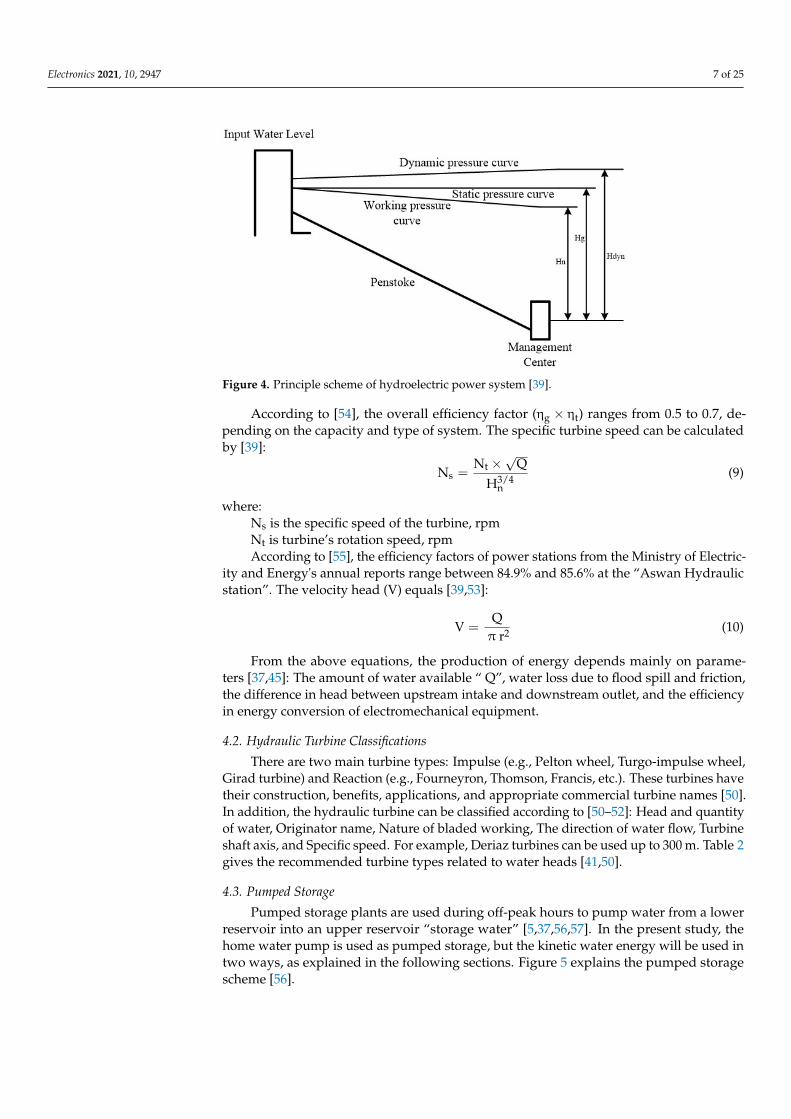
Figure 4. Principle scheme of hydroelectric power system [39].
According to [54], the overall efficiency factor ( η × η ) ranges from 0.5 to 0.7, depending on the capacity and type of system. The specific turbine speed can be calculated by [39]:
N =N × Q
H/
(9)
where: N is the specific speed of the turbine, rpm N is turbine’s rotation speed, rpm
According to [55], the efficiency factors of power stations from the Ministry of Electricity and Energy's annual reports range between 84.9% and 85.6% at the “Aswan Hydraulic station”. The velocity head (V) equals [39,53]:
V =Q
π r (10)
From the above equations, the production of energy depends mainly on parameters [37,45]: The amount of water available “ Q”, water loss due to flood spill and friction, the difference in head between upstream intake and downstream outlet, and the efficiency in energy conversion of electromechanical equipment.
4.2. Hydraulic Turbine Classifications There are two main turbine types: Impulse (e.g., Pelton wheel, Turgo-impulse wheel,
Girad turbine) and Reaction (e.g., Fourneyron, Thomson, Francis, etc.). These turbines have their construction, benefits, applications, and appropriate commercial turbine names [50]. In addition, the hydraulic turbine can be classified according to [50–52]: Head and quantity of water, Originator name, Nature of bladed working, The direction of water flow, Turbine shaft axis, and Specific speed. For example, Deriaz turbines can be used up to 300 m. Table 2 gives the recommended turbine types related to water heads [41,50].
Figure 4. Principle scheme of hydroelectric power system [39].
According to [54], the overall efficiency factor (ηg × ηt) ranges from 0.5 to 0.7, de-pending on the capacity and type of system. The specific turbine speed can be calculatedby [39]:
Ns =Nt ×
√Q
H3/4n
(9)
where:Ns is the specific speed of the turbine, rpmNt is turbine’s rotation speed, rpmAccording to [55], the efficiency factors of power stations from the Ministry of Electric-
ity and Energy's annual reports range between 84.9% and 85.6% at the “Aswan Hydraulicstation”. The velocity head (V) equals [39,53]:
V =Qπ r2 (10)
From the above equations, the production of energy depends mainly on parame-ters [37,45]: The amount of water available “ Q”, water loss due to flood spill and friction,the difference in head between upstream intake and downstream outlet, and the efficiencyin energy conversion of electromechanical equipment.
4.2. Hydraulic Turbine Classifications
There are two main turbine types: Impulse (e.g., Pelton wheel, Turgo-impulse wheel,Girad turbine) and Reaction (e.g., Fourneyron, Thomson, Francis, etc.). These turbines havetheir construction, benefits, applications, and appropriate commercial turbine names [50].In addition, the hydraulic turbine can be classified according to [50–52]: Head and quantityof water, Originator name, Nature of bladed working, The direction of water flow, Turbineshaft axis, and Specific speed. For example, Deriaz turbines can be used up to 300 m. Table 2gives the recommended turbine types related to water heads [41,50].
4.3. Pumped Storage
Pumped storage plants are used during off-peak hours to pump water from a lowerreservoir into an upper reservoir “storage water” [5,37,56,57]. In the present study, thehome water pump is used as pumped storage, but the kinetic water energy will be used intwo ways, as explained in the following sections. Figure 5 explains the pumped storagescheme [56].
Electronics 2021, 10, 2947 8 of 25
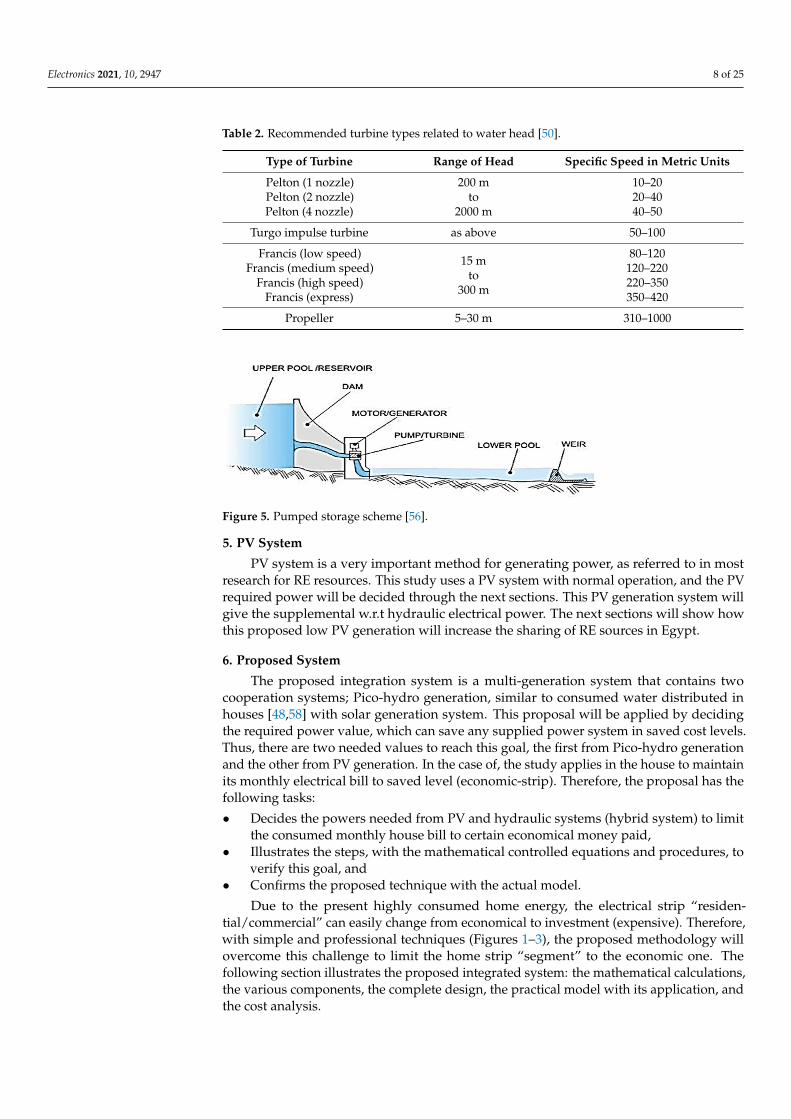
Table 2. Recommended turbine types related to water head [50].
Type of Turbine Range of Head Specific Speed in Metric Units
Pelton (1 nozzle)Pelton (2 nozzle)Pelton (4 nozzle)
200 mto
2000 m
10–2020–4040–50
Turgo impulse turbine as above 50–100
Francis (low speed)Francis (medium speed)
Francis (high speed)Francis (express)
15 mto
300 m
80–120120–220220–350350–420
Propeller 5–30 m 310–1000
Electronics 2021, x, x FOR PEER REVIEW 8 of 26
Table 2. Recommended turbine types related to water head [50].
Type of Turbine Range of Head Specific Speed in Metric Units
Pelton (1 nozzle) Pelton (2 nozzle) Pelton (4 nozzle)
200 m to
2000 m
10–20 20–40 40–50
Turgo impulse turbine as above 50–100 Francis (low speed)
Francis (medium speed) Francis (high speed)
Francis (express)
15 m to
300 m
80–120 120–220 220–350 350–420
Propeller 5–30 m 310–1000
4.3. Pumped Storage Pumped storage plants are used during off-peak hours to pump water from a lower
reservoir into an upper reservoir “storage water” [5,37,56,57]. In the present study, the home water pump is used as pumped storage, but the kinetic water energy will be used in two ways, as explained in the following sections. Figure 5 explains the pumped storage scheme [56].
Figure 5. Pumped storage scheme [56].
5. PV System PV system is a very important method for generating power, as referred to in most
research for RE resources. This study uses a PV system with normal operation, and the PV required power will be decided through the next sections. This PV generation system will give the supplemental w.r.t hydraulic electrical power. The next sections will show how this proposed low PV generation will increase the sharing of RE sources in Egypt.
6. Proposed System The proposed integration system is a multi-generation system that contains two
cooperation systems; Pico-hydro generation, similar to consumed water distributed in houses [48,58] with solar generation system. This proposal will be applied by deciding the required power value, which can save any supplied power system in saved cost levels. Thus, there are two needed values to reach this goal, the first from Pico-hydro generation and the other from PV generation. In the case of, the study applies in the house to maintain its monthly electrical bill to saved level (economic-strip). Therefore, the proposal has the following tasks: Decides the powers needed from PV and hydraulic systems (hybrid system) to limit
the consumed monthly house bill to certain economical money paid, Illustrates the steps, with the mathematical controlled equations and procedures, to
verify this goal, and Confirms the proposed technique with the actual model.
Figure 5. Pumped storage scheme [56].
5. PV System
PV system is a very important method for generating power, as referred to in mostresearch for RE resources. This study uses a PV system with normal operation, and the PVrequired power will be decided through the next sections. This PV generation system willgive the supplemental w.r.t hydraulic electrical power. The next sections will show howthis proposed low PV generation will increase the sharing of RE sources in Egypt.
6. Proposed System
The proposed integration system is a multi-generation system that contains twocooperation systems; Pico-hydro generation, similar to consumed water distributed inhouses [48,58] with solar generation system. This proposal will be applied by decidingthe required power value, which can save any supplied power system in saved cost levels.Thus, there are two needed values to reach this goal, the first from Pico-hydro generationand the other from PV generation. In the case of, the study applies in the house to maintainits monthly electrical bill to saved level (economic-strip). Therefore, the proposal has thefollowing tasks:
• Decides the powers needed from PV and hydraulic systems (hybrid system) to limitthe consumed monthly house bill to certain economical money paid,
• Illustrates the steps, with the mathematical controlled equations and procedures, toverify this goal, and
• Confirms the proposed technique with the actual model.
Due to the present highly consumed home energy, the electrical strip “residen-tial/commercial” can easily change from economical to investment (expensive). Therefore,with simple and professional techniques (Figures 1–3), the proposed methodology willovercome this challenge to limit the home strip “segment” to the economic one. Thefollowing section illustrates the proposed integrated system: the mathematical calculations,the various components, the complete design, the practical model with its application, andthe cost analysis.
Electronics 2021, 10, 2947 9 of 25
6.1. Pico-Hydro Generation System
The study determines the feasibility and achievability of the proposed Pico-hydrosystem through the following:
6.1.1. Power Determination
In this study, there are some assumptions:
• The daily consumed power for each family home person is denoted by (Pp, W/day),
• The number of family persons is (n),• The actual total family persons daily consumed power is (PT = n ∗ Pp, W/day),
• The consumed water/person is denoted by (Qp, L/day),
• The total consumed water for all family persons is (QT = n ∗Qp, L/day), and
• The total consumed power for all family persons must be limited to economic valuedenoted by (Pec, W/day).
From the above assumptions and the hybrid system data: the required generationvalue for the bill to be economical is:
Preq = PT − Pec (11)
Suppose that; Q “= QT”, ρ, g and Preq are known, and others will be decided. Thereare two-generation units in the proposed systems: One of them is fixed in the outlet of thepumped pipe motor “inside the water home tank”, which depends on the motor pumpwater pressure without any friction or loss (P1), and the other is fixed in the way pipesupply water from the tank to daily home consumed waters “laundry, cook and bathe”, ithas kinetic energy that depends on the head of fall water (Hn).
From [58], the relation between the head (Hn), m” and the pressure (Pw, psi) is:
Hn = 0.704× Pw (12)
Therefore, the power generation from the first unit “P1” can be calculated by:
P1 = 0.704× Pw ×QT × g× ρ× ηt × ηg (13)
However, the second “water return way” has generation value “P2”, it can be calcu-lated by:
P2 = QT ×Hn × g× ρ× ηt × ηg (14)
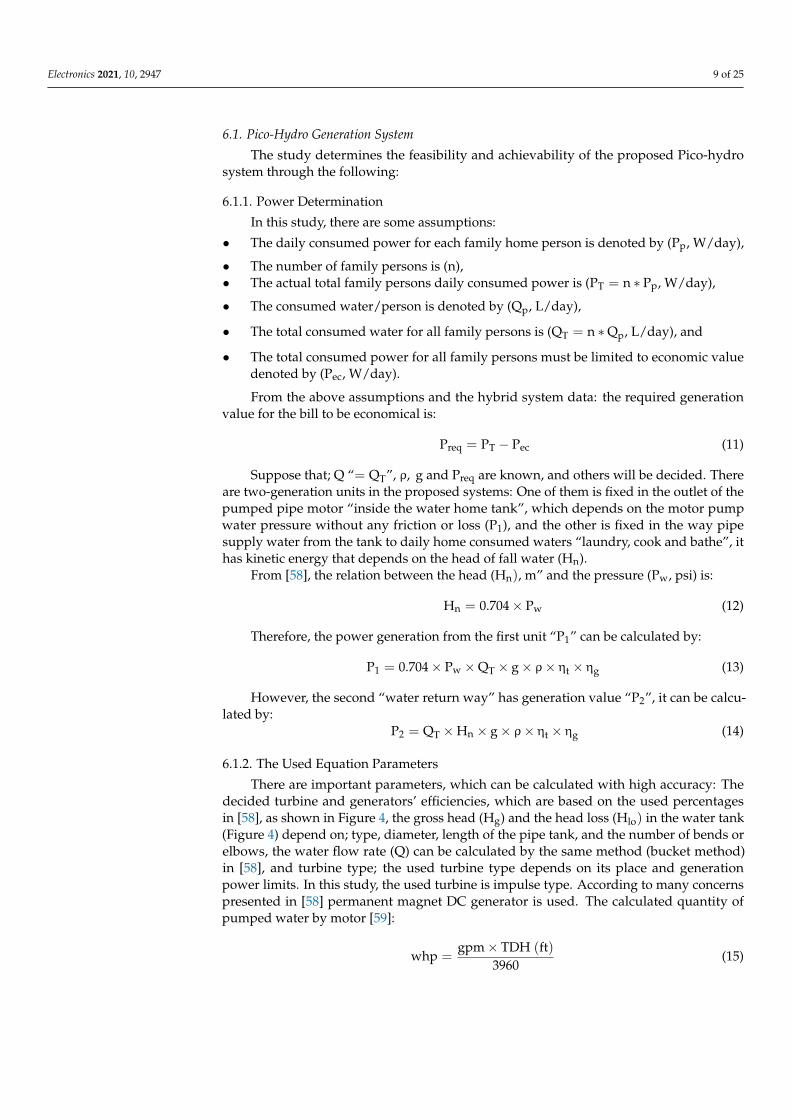
6.1.2. The Used Equation Parameters
There are important parameters, which can be calculated with high accuracy: Thedecided turbine and generators’ efficiencies, which are based on the used percentagesin [58], as shown in Figure 4, the gross head (Hg) and the head loss (Hlo) in the water tank(Figure 4) depend on; type, diameter, length of the pipe tank, and the number of bends orelbows, the water flow rate (Q) can be calculated by the same method (bucket method)in [58], and turbine type; the used turbine type depends on its place and generationpower limits. In this study, the used turbine is impulse type. According to many concernspresented in [58] permanent magnet DC generator is used. The calculated quantity ofpumped water by motor [59]:
whp =gpm× TDH (ft)
3960(15)
Electronics 2021, 10, 2947 10 of 25
Due to the pumped water (motor) does not give the full efficiency [45], equation (15)will be divided by 0.8 [59] for small electric motors”, Equation (15) will be:
whp =gpm× TDH (ft)
3960× 0.8(16)
where:TDH is the total dynamic head in feetGpm is the pumping rate in gallons per minute, andWhp is the water horsepower.
6.2. Solar Energy System
Due to the decrease in traditional energy resources, the world energy generatedsystems are interested in renewable energy resources to ensure energy security andstrengthen/maintain the environment without polluting “green energy” [60,61]. Some ofthe most interesting recent researches and studies are solar energy (photovoltaic “PV”),which is an environmentally friendly power generation source [62–64]. Many researchershave paid attention to getting the maximum generation energy from PV/PVT/PV-PVT-CR/CPV with other supplementary systems [65–70] to give the required residential loadsdepending on the net-metered load data and system install data [71]. The generation withthis PV system be denoted by (Ps).
This proposed hybrid system has standard generation powers in the market andpurchasing power (P2) according to the following equation:
Preq = P1 + P2 + Ps (17)
Therefore, if the Pic-hydro generation power (P1 +P2) is sufficient to limit the segmentto its economic value; there is no need to add solar generation power “(Ps).
6.3. The Proposed Integrated System
The proposed system can be explained through:
• The flowchart in Figure 1 shows the proposed technique integrated procedures(programming), which indicates the maintained supply outputs voltages and powerto charge the battery/selected loads under various circumstances,
• The proposed pico-hydraulic and PV model is displayed in Figure 2; the compoundsystem contains two pico-hydraulic and one PV generation unit to supply the requiredpower (Preq), and
• The integrated system shown in Figure 3 contains three-generation outputs units (P1,P2, and P3/Ps), the Arduino program circuits, different relays operations (R1, R2,R3, and R4), charging circuit to storage energy battery/s, inverter to convert DC/ACvoltage and selected loads contractors, this system is responsible for maintaining thesupply voltage/power to batteries/loads under different cases.
This study investigates a very effective, simple, economic, and handled model. There-fore, the main contributions of this study are:
• Explaining the benefits by using the daily natural resources for generatingelectrical energy;
• Maintaining the supply voltage/power from the proposed circuit by a new sim-ple and professional control system for certain values (a proposed technique inFigures 1 and 3);
• Applying the proposed integrated circuit (Figure 2 and Figure 13);• Limiting the consumed electrical energy bill to a certain acceptable economic strip
level by hybrid generation system;• Executing high savings in energy and money and helping the environment to get rid
of toxic exhausts such as CO2; and
Electronics 2021, 10, 2947 11 of 25
• Verifying the proposed system by actual case study in Egypt.
7. Design the Proposed System with Actual Case Study
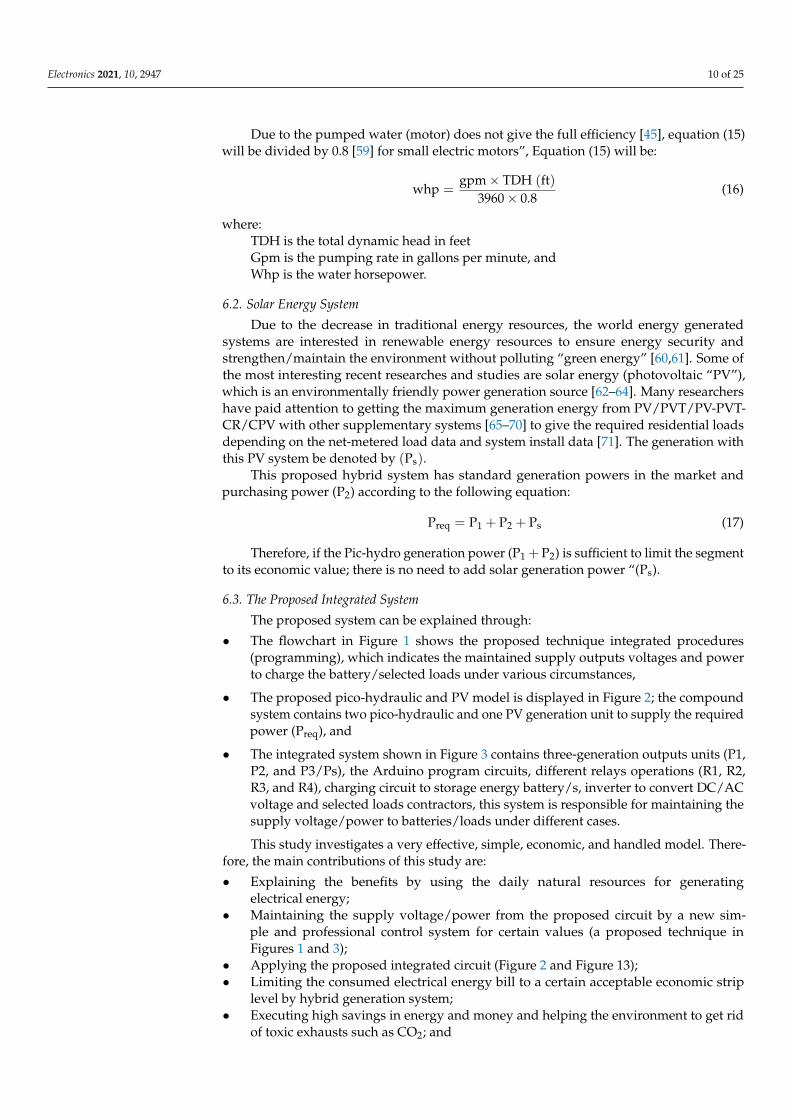
In this paper, the proposed methodology will be implemented by an actual case studyin Egypt. According to Figure 6 ([72], last report 2017–2018),
Electronics 2021, x, x FOR PEER REVIEW 11 of 26
Executing high savings in energy and money and helping the environment to get rid of toxic exhausts such as CO2; and
Verifying the proposed system by actual case study in Egypt.
7. Design the Proposed System with Actual Case Study In this paper, the proposed methodology will be implemented by an actual case
study in Egypt. According to Figure 6 ([72], last report 2017–2018), The annual consumed energy for each Egyptian person is 2016 kWh/Y “the average
person daily consumed energy is 5.5232 kWh, Figure 6”. The economic strip up to 650 kWh/M–0.9 E£/kWh(EGP)- but investment one from
651 kWh/M with 1.35 E£/kWh- which can be described in Figure 7 [73]. Based on the report in [74], the average person daily consumed water is 300 Liters.
Figure 6. The average person consumed energy/year, kWh [72].
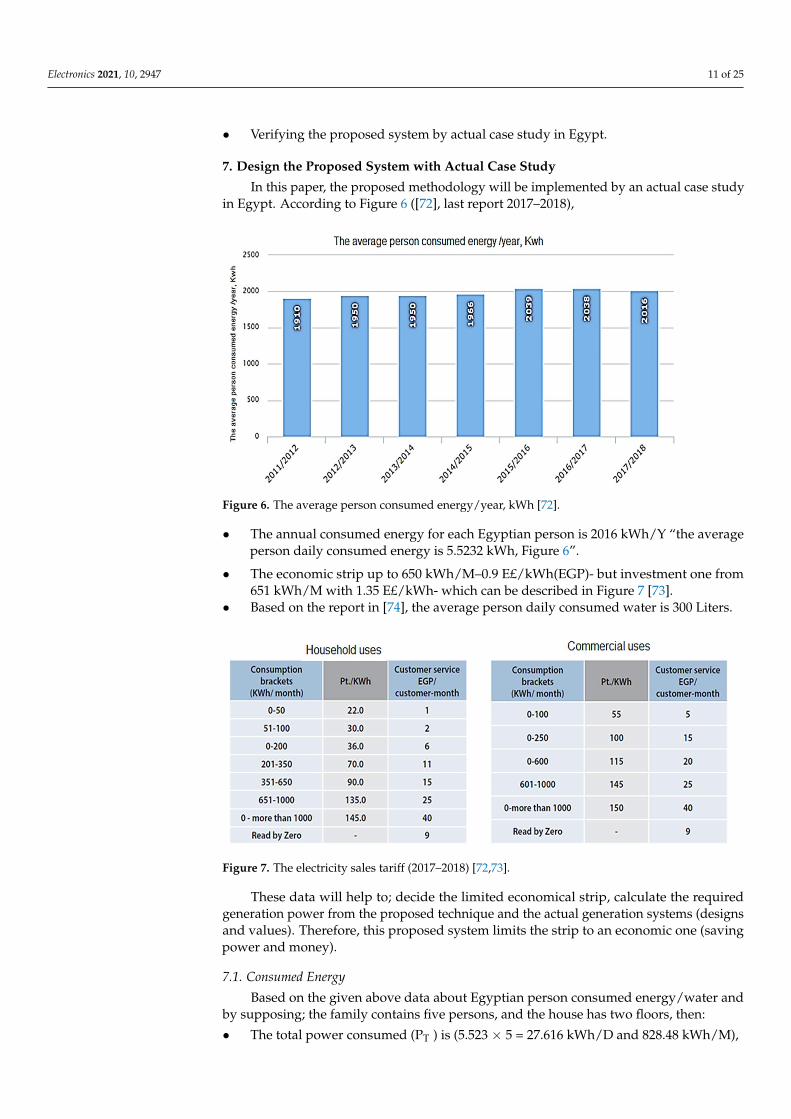
Figure 7. The electricity sales tariff (2017–2018) [72,73].
These data will help to; decide the limited economical strip, calculate the required generation power from the proposed technique and the actual generation systems (designs and values). Therefore, this proposed system limits the strip to an economic one (saving power and money).
Figure 6. The average person consumed energy/year, kWh [72].
• The annual consumed energy for each Egyptian person is 2016 kWh/Y “the averageperson daily consumed energy is 5.5232 kWh, Figure 6”.
• The economic strip up to 650 kWh/M–0.9 E£/kWh(EGP)- but investment one from651 kWh/M with 1.35 E£/kWh- which can be described in Figure 7 [73].
• Based on the report in [74], the average person daily consumed water is 300 Liters.
Electronics 2021, x, x FOR PEER REVIEW 11 of 26
Executing high savings in energy and money and helping the environment to get rid of toxic exhausts such as CO2; and
Verifying the proposed system by actual case study in Egypt.
7. Design the Proposed System with Actual Case Study In this paper, the proposed methodology will be implemented by an actual case
study in Egypt. According to Figure 6 ([72], last report 2017–2018), The annual consumed energy for each Egyptian person is 2016 kWh/Y “the average
person daily consumed energy is 5.5232 kWh, Figure 6”. The economic strip up to 650 kWh/M–0.9 E£/kWh(EGP)- but investment one from
651 kWh/M with 1.35 E£/kWh- which can be described in Figure 7 [73]. Based on the report in [74], the average person daily consumed water is 300 Liters.
Figure 6. The average person consumed energy/year, kWh [72].
Figure 7. The electricity sales tariff (2017–2018) [72,73].
These data will help to; decide the limited economical strip, calculate the required generation power from the proposed technique and the actual generation systems (designs and values). Therefore, this proposed system limits the strip to an economic one (saving power and money).
Figure 7. The electricity sales tariff (2017–2018) [72,73].
These data will help to; decide the limited economical strip, calculate the requiredgeneration power from the proposed technique and the actual generation systems (designsand values). Therefore, this proposed system limits the strip to an economic one (savingpower and money).
7.1. Consumed Energy
Based on the given above data about Egyptian person consumed energy/water andby supposing; the family contains five persons, and the house has two floors, then:
• The total power consumed (PT ) is (5.523 × 5 = 27.616 kWh/D and 828.48 kWh/M),
Electronics 2021, 10, 2947 12 of 25
• The total consumed water/day is (300 × 5 = 1500 L “1.5 m3”),
• The economic strip is up to 650 kWh/M, which means the monthly needed generationpower from the proposed system will be 828.68 − 650 = 178.68 kWh/M,
• The proposed technique should generate the remainder value (27.616 − 21.66 =5.956 kWh/D).
7.2. The Required Generation
The required generation power (Preq) is 5.956 kWh/D (178.68 kWh/M) to limit thestrip to the economic level. Therefore, the two proposed generation turbines must give thisrequired power (Preq) with or without PV system according to the following descriptionsand submissions:
• The supply pipe diameter is 34 inch with electrical motor power equals 0.75 hp, and
the motor pump pressure is 5 bar (5 × 14.50378 = 72.5189 Psi) [75,76];• The net head of the water tank to the second pump is 7 m (G2 in Figure 2);• The total turbine-generator efficiency is 0.8 and Q will have 0.018, 0.026 and 0.045 m3/min
(average (0.018 + 0.026 + 0.0450)/3 = 0.0296/60 = 0.000493 m3/s) [77].
The generated power from these turbines are:
7.2.1. The First Generation Turbine (P1)
• The total high is 7 m (1 m = 3.38 ft)• According to [78], one gallon per minute = 5.45099 m3/day (0.227124 m3/h
= 3.7854 × 10⁻³ m3/min):
According to the above data and Equation (16):
0.75 =Q× 7× 3.38
3960× 0.8
Q = 100.422 g.p.m = 22.80 m3/h = 0.38 m3/min = 0.00633 m3/sNote; this motor (0.75 hp) will fill the family tank (1.5 m3) through 0.06578 h (1.5/22.8).According to the above data and Equations (13) and (14), P1 has two values:
• P1 = 0.000493 × 9.81 × 1000 × 0.8 × 0.704 × 72.5189 = 197.528 W, or
• P1 = 0.00633 × 9.81 × 1000 × 0.8 × 0.704 × 72.5189 × 0.06578 = 166.92 W.
7.2.2. The Second Generation Turbine (P2)
By the same data and equations, P2 has two values:
• P2 = 0.000493 ∗ 9.81 ∗ 1000 ∗ 0.8 ∗ 7= 27.083 W, or
• P2 = 0.00633 ∗ 9.81 ∗ 1000 ∗ 0.8 ∗ 7 ∗ 0.06578 = 22.89 W.
Note that: this hydraulic generation system (P1 and P2) does not affect the water flowrate (quantity and pressure).
7.2.3. The Third Generation Turbine (Ps)
The generations with two pico-hydraulic cannot supply the required power(Preq
);
therefore PV system should supply power (Preq − (P1 + P2) ).From the above calculations and given data:
• The home water motor will fill the tank by 3.157 min,• The first generation unit (P1) will give from 167 to 198 W during motor (3.94 min)
operations (average = 182.5 W),
• The second-generation unit ( P2) will give from 23 to 27 W during serviced waterhomework times (average = 25 w), and
• The total average generation by pico-hydraulic units are 207.5 W/D, and the PVsystem should supply the remaining required power (5956 − 207.5 = 5.7485 kW/D).
Electronics 2021, 10, 2947 13 of 25
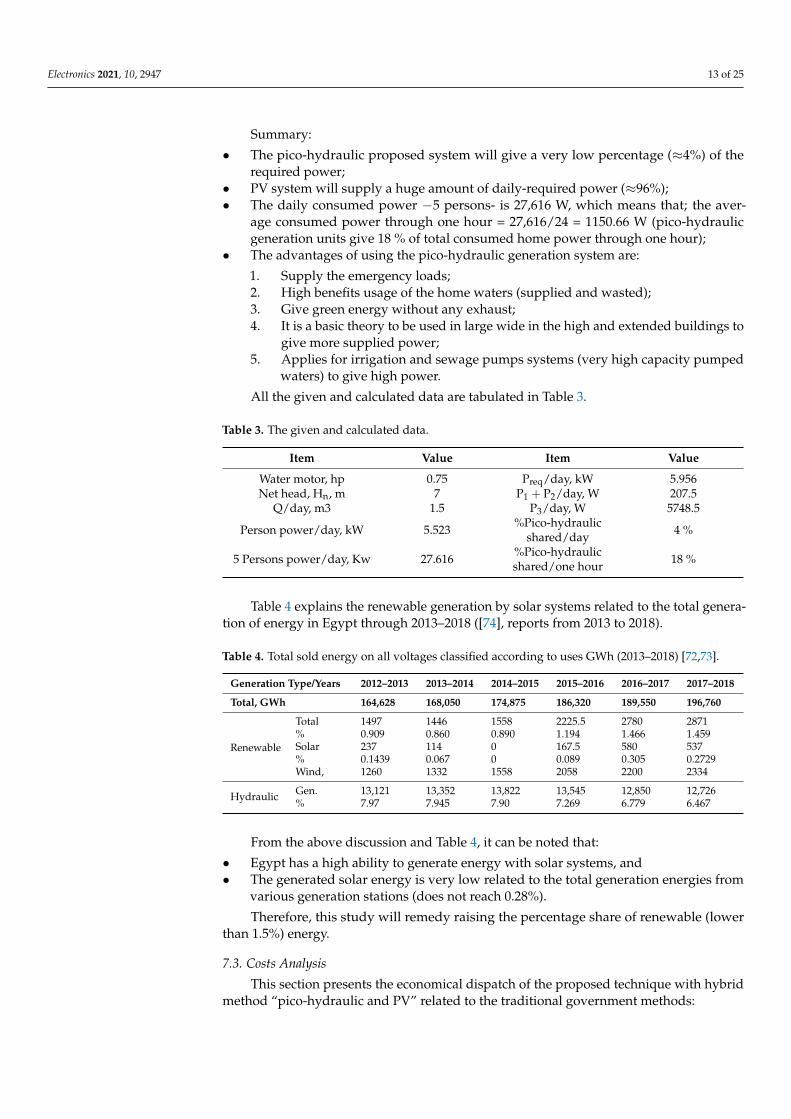
Summary:
• The pico-hydraulic proposed system will give a very low percentage (≈4%) of therequired power;
• PV system will supply a huge amount of daily-required power (≈96%);• The daily consumed power −5 persons- is 27,616 W, which means that; the aver-
age consumed power through one hour = 27,616/24 = 1150.66 W (pico-hydraulicgeneration units give 18 % of total consumed home power through one hour);
• The advantages of using the pico-hydraulic generation system are:
1. Supply the emergency loads;2. High benefits usage of the home waters (supplied and wasted);3. Give green energy without any exhaust;4. It is a basic theory to be used in large wide in the high and extended buildings to
give more supplied power;5. Applies for irrigation and sewage pumps systems (very high capacity pumped
waters) to give high power.
All the given and calculated data are tabulated in Table 3.
Table 3. The given and calculated data.
Item Value Item Value
Water motor, hp 0.75 Preq/day, kW 5.956Net head, Hn, m 7 P1 + P2/day, W 207.5
Q/day, m3 1.5 P3/day, W 5748.5
Person power/day, kW 5.523 %Pico-hydraulicshared/day 4 %
5 Persons power/day, Kw 27.616 %Pico-hydraulicshared/one hour 18 %
Table 4 explains the renewable generation by solar systems related to the total genera-tion of energy in Egypt through 2013–2018 ([74], reports from 2013 to 2018).
Table 4. Total sold energy on all voltages classified according to uses GWh (2013–2018) [72,73].
Generation Type/Years 2012–2013 2013–2014 2014–2015 2015–2016 2016–2017 2017–2018
Total, GWh 164,628 168,050 174,875 186,320 189,550 196,760
Renewable
Total 1497 1446 1558 2225.5 2780 2871% 0.909 0.860 0.890 1.194 1.466 1.459Solar 237 114 0 167.5 580 537% 0.1439 0.067 0 0.089 0.305 0.2729Wind, 1260 1332 1558 2058 2200 2334
Hydraulic Gen. 13,121 13,352 13,822 13,545 12,850 12,726% 7.97 7.945 7.90 7.269 6.779 6.467
From the above discussion and Table 4, it can be noted that:
• Egypt has a high ability to generate energy with solar systems, and• The generated solar energy is very low related to the total generation energies from
various generation stations (does not reach 0.28%).
Therefore, this study will remedy raising the percentage share of renewable (lowerthan 1.5%) energy.
7.3. Costs Analysis
This section presents the economical dispatch of the proposed technique with hybridmethod “pico-hydraulic and PV” related to the traditional government methods:
Electronics 2021, 10, 2947 14 of 25
7.3.1. PV System
The solar energy system (PV) is now one of the most renewable energy sources, allthe information about; how the system is used, the components and their prices, etc., canget easily.
According to the above section/subsections and their references:
• The needed power from PV is 5.7485 kW/D, and• The minimum times of daily brightness of the sun range 6–8 h/day (average 7 h).
Therefore, the required installed PV rating is one kW/h with its othercooperating components.
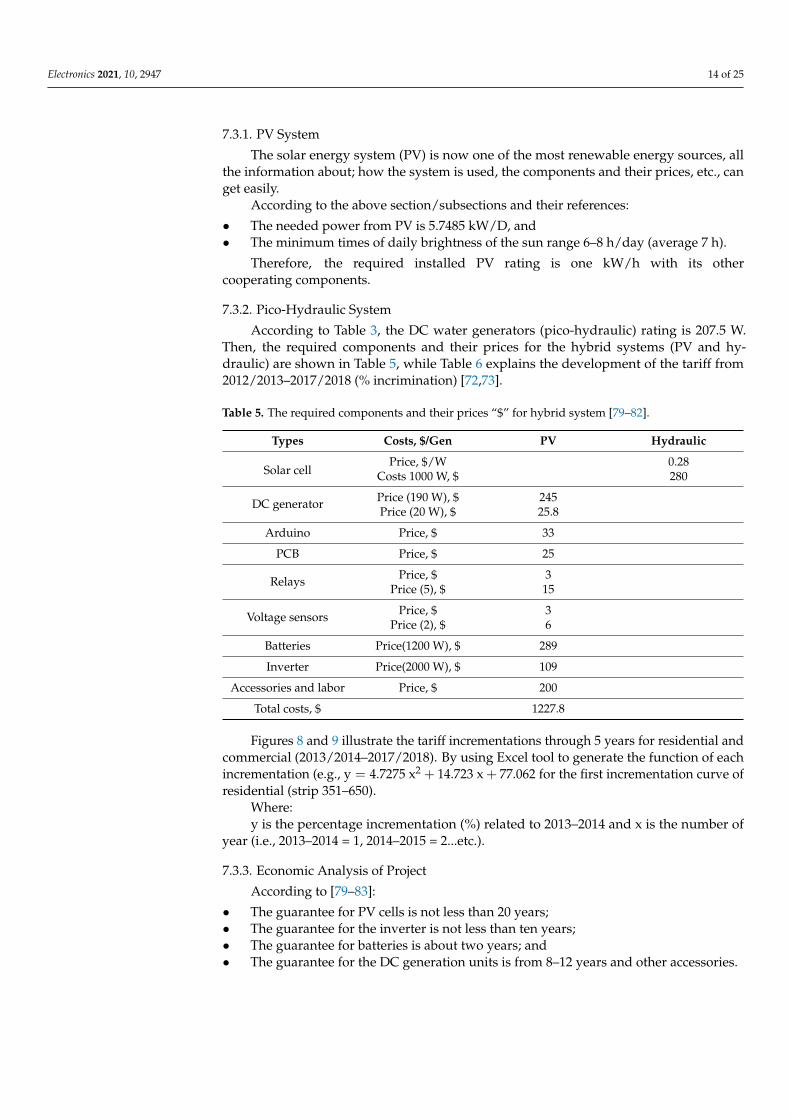
7.3.2. Pico-Hydraulic System
According to Table 3, the DC water generators (pico-hydraulic) rating is 207.5 W.Then, the required components and their prices for the hybrid systems (PV and hy-draulic) are shown in Table 5, while Table 6 explains the development of the tariff from2012/2013–2017/2018 (% incrimination) [72,73].
Table 5. The required components and their prices “$” for hybrid system [79–82].
Types Costs, $/Gen PV Hydraulic
Solar cellPrice, $/W 0.28
Costs 1000 W, $ 280
DC generator Price (190 W), $ 245Price (20 W), $ 25.8
Arduino Price, $ 33
PCB Price, $ 25
Relays Price, $ 3Price (5), $ 15
Voltage sensors Price, $ 3Price (2), $ 6
Batteries Price(1200 W), $ 289
Inverter Price(2000 W), $ 109
Accessories and labor Price, $ 200
Total costs, $ 1227.8
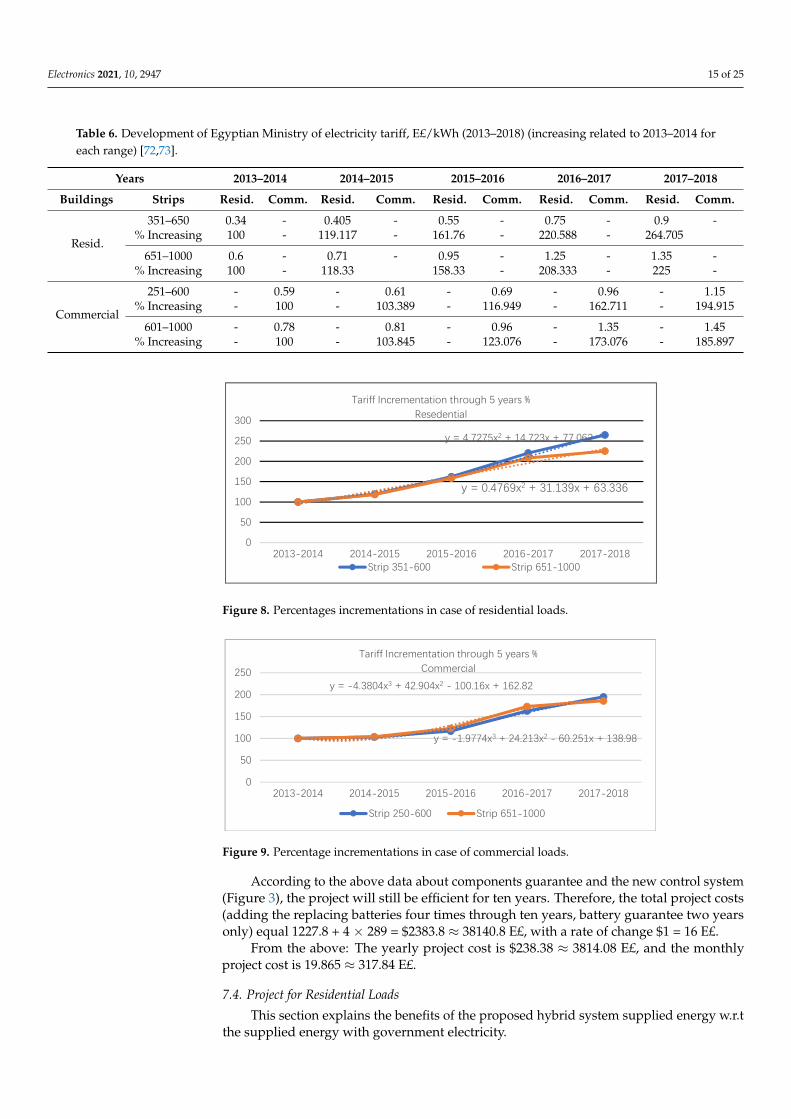
Figures 8 and 9 illustrate the tariff incrementations through 5 years for residential andcommercial (2013/2014–2017/2018). By using Excel tool to generate the function of eachincrementation (e.g., y = 4.7275 x2 + 14.723 x + 77.062 for the first incrementation curve ofresidential (strip 351–650).
Where:y is the percentage incrementation (%) related to 2013–2014 and x is the number of
year (i.e., 2013–2014 = 1, 2014–2015 = 2...etc.).
7.3.3. Economic Analysis of Project
According to [79–83]:
• The guarantee for PV cells is not less than 20 years;• The guarantee for the inverter is not less than ten years;• The guarantee for batteries is about two years; and• The guarantee for the DC generation units is from 8–12 years and other accessories.
Electronics 2021, 10, 2947 15 of 25
Table 6. Development of Egyptian Ministry of electricity tariff, E£/kWh (2013–2018) (increasing related to 2013–2014 foreach range) [72,73].
Years 2013–2014 2014–2015 2015–2016 2016–2017 2017–2018
Buildings Strips Resid. Comm. Resid. Comm. Resid. Comm. Resid. Comm. Resid. Comm.
Resid.
351–650 0.34 - 0.405 - 0.55 - 0.75 - 0.9 -% Increasing 100 - 119.117 - 161.76 - 220.588 - 264.705
651–1000 0.6 - 0.71 - 0.95 - 1.25 - 1.35 -% Increasing 100 - 118.33 158.33 - 208.333 - 225 -
Commercial
251–600 - 0.59 - 0.61 - 0.69 - 0.96 - 1.15% Increasing - 100 - 103.389 - 116.949 - 162.711 - 194.915
601–1000 - 0.78 - 0.81 - 0.96 - 1.35 - 1.45% Increasing - 100 - 103.845 - 123.076 - 173.076 - 185.897
Electronics 2021, x, x FOR PEER REVIEW 15 of 26
Figures 8 and 9 illustrate the tariff incrementations through 5 years for residential and commercial (2013/2014–2017/2018). By using Excel tool to generate the function of each incrementation (e.g., y = 4.7275 x + 14.723 x + 77.062 for the first incrementation curve of residential (strip 351–650).
Where: y is the percentage incrementation (%) related to 2013–2014 and x is the number of
year (i.e., 2013–2014 = 1, 2014–2015 = 2...etc.).
Figure 8. Percentages incrementations in case of residential loads.
Figure 9. Percentage incrementations in case of commercial loads.
7.3.3. Economic Analysis of Project According to [79–83]:
The guarantee for PV cells is not less than 20 years; The guarantee for the inverter is not less than ten years; The guarantee for batteries is about two years; and The guarantee for the DC generation units is from 8–12 years and other accessories.
According to the above data about components guarantee and the new control system (Figure 3), the project will still be efficient for ten years. Therefore, the total project costs (adding the replacing batteries four times through ten years, battery guarantee two years only) equal 1227.8 + 4 × 289 = $2383.8 ≈ 38140.8 E£, with a rate of change $1 = 16 E£.
From the above: The yearly project cost is $238.38 ≈ 3814.08 E£, and the monthly project cost is 19.865 ≈ 317.84 E£.
7.4. Project for Residential Loads This section explains the benefits of the proposed hybrid system supplied energy
w.r.t the supplied energy with government electricity.
y = 4.7275x2 + 14.723x + 77.062
y = 0.4769x2 + 31.139x + 63.336
0
50
100
150
200
250
300
2013-2014 2014-2015 2015-2016 2016-2017 2017-2018
Tariff Incrementation through 5 years %
Resedential
Strip 351-600 Strip 651-1000
y = -1.9774x3 + 24.213x2 - 60.251x + 138.98
y = -4.3804x3 + 42.904x2 - 100.16x + 162.82
0
50
100
150
200
250
2013-2014 2014-2015 2015-2016 2016-2017 2017-2018
Tariff Incrementation through 5 years %
Commercial
Strip 250-600 Strip 651-1000
Figure 8. Percentages incrementations in case of residential loads.
Electronics 2021, x, x FOR PEER REVIEW 15 of 26
Figures 8 and 9 illustrate the tariff incrementations through 5 years for residential and commercial (2013/2014–2017/2018). By using Excel tool to generate the function of each incrementation (e.g., y = 4.7275 x + 14.723 x + 77.062 for the first incrementation curve of residential (strip 351–650).
Where: y is the percentage incrementation (%) related to 2013–2014 and x is the number of
year (i.e., 2013–2014 = 1, 2014–2015 = 2...etc.).
Figure 8. Percentages incrementations in case of residential loads.
Figure 9. Percentage incrementations in case of commercial loads.
7.3.3. Economic Analysis of Project According to [79–83]:
The guarantee for PV cells is not less than 20 years; The guarantee for the inverter is not less than ten years; The guarantee for batteries is about two years; and The guarantee for the DC generation units is from 8–12 years and other accessories.
According to the above data about components guarantee and the new control system (Figure 3), the project will still be efficient for ten years. Therefore, the total project costs (adding the replacing batteries four times through ten years, battery guarantee two years only) equal 1227.8 + 4 × 289 = $2383.8 ≈ 38140.8 E£, with a rate of change $1 = 16 E£.
From the above: The yearly project cost is $238.38 ≈ 3814.08 E£, and the monthly project cost is 19.865 ≈ 317.84 E£.
7.4. Project for Residential Loads This section explains the benefits of the proposed hybrid system supplied energy
w.r.t the supplied energy with government electricity.
y = 4.7275x2 + 14.723x + 77.062
y = 0.4769x2 + 31.139x + 63.336
0
50
100
150
200
250
300
2013-2014 2014-2015 2015-2016 2016-2017 2017-2018
Tariff Incrementation through 5 years %
Resedential
Strip 351-600 Strip 651-1000
y = -1.9774x3 + 24.213x2 - 60.251x + 138.98
y = -4.3804x3 + 42.904x2 - 100.16x + 162.82
0
50
100
150
200
250
2013-2014 2014-2015 2015-2016 2016-2017 2017-2018
Tariff Incrementation through 5 years %
Commercial
Strip 250-600 Strip 651-1000
Figure 9. Percentage incrementations in case of commercial loads.
According to the above data about components guarantee and the new control system(Figure 3), the project will still be efficient for ten years. Therefore, the total project costs(adding the replacing batteries four times through ten years, battery guarantee two yearsonly) equal 1227.8 + 4 × 289 = $2383.8 ≈ 38140.8 E£, with a rate of change $1 = 16 E£.
From the above: The yearly project cost is $238.38 ≈ 3814.08 E£, and the monthlyproject cost is 19.865 ≈ 317.84 E£.
7.4. Project for Residential Loads
This section explains the benefits of the proposed hybrid system supplied energy w.r.tthe supplied energy with government electricity.
Electronics 2021, 10, 2947 16 of 25
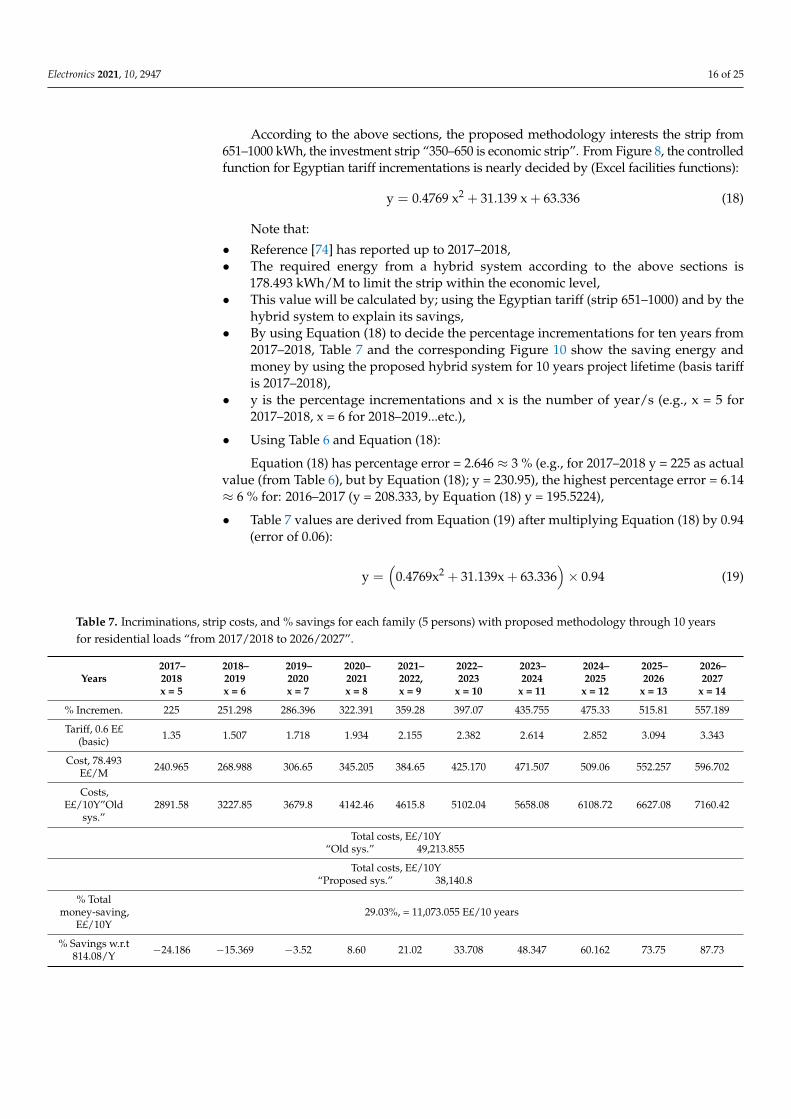
According to the above sections, the proposed methodology interests the strip from651–1000 kWh, the investment strip “350–650 is economic strip”. From Figure 8, the controlledfunction for Egyptian tariff incrementations is nearly decided by (Excel facilities functions):
y = 0.4769 x2 + 31.139 x + 63.336 (18)
Note that:
• Reference [74] has reported up to 2017–2018,• The required energy from a hybrid system according to the above sections is
178.493 kWh/M to limit the strip within the economic level,• This value will be calculated by; using the Egyptian tariff (strip 651–1000) and by the
hybrid system to explain its savings,• By using Equation (18) to decide the percentage incrementations for ten years from
2017–2018, Table 7 and the corresponding Figure 10 show the saving energy andmoney by using the proposed hybrid system for 10 years project lifetime (basis tariffis 2017–2018),
• y is the percentage incrementations and x is the number of year/s (e.g., x = 5 for2017–2018, x = 6 for 2018–2019...etc.),
• Using Table 6 and Equation (18):
Equation (18) has percentage error = 2.646 ≈ 3 % (e.g., for 2017–2018 y = 225 as actualvalue (from Table 6), but by Equation (18); y = 230.95), the highest percentage error = 6.14≈ 6 % for: 2016–2017 (y = 208.333, by Equation (18) y = 195.5224),
• Table 7 values are derived from Equation (19) after multiplying Equation (18) by 0.94(error of 0.06):
y =(
0.4769x2 + 31.139x + 63.336)× 0.94 (19)
Table 7. Incriminations, strip costs, and % savings for each family (5 persons) with proposed methodology through 10 yearsfor residential loads “from 2017/2018 to 2026/2027”.
Years2017–2018x = 5
2018–2019x = 6
2019–2020x = 7
2020–2021x = 8
2021–2022,x = 9
2022–2023
x = 10
2023–2024
x = 11
2024–2025
x = 12
2025–2026
x = 13
2026–2027
x = 14
% Incremen. 225 251.298 286.396 322.391 359.28 397.07 435.755 475.33 515.81 557.189
Tariff, 0.6 E£(basic) 1.35 1.507 1.718 1.934 2.155 2.382 2.614 2.852 3.094 3.343
Cost, 78.493E£/M 240.965 268.988 306.65 345.205 384.65 425.170 471.507 509.06 552.257 596.702
Costs,E£/10Y”Old
sys.”2891.58 3227.85 3679.8 4142.46 4615.8 5102.04 5658.08 6108.72 6627.08 7160.42
Total costs, E£/10Y“Old sys.” 49,213.855
Total costs, E£/10Y“Proposed sys.” 38,140.8
% Totalmoney-saving,
E£/10Y29.03%, = 11,073.055 E£/10 years
% Savings w.r.t814.08/Y −24.186 −15.369 −3.52 8.60 21.02 33.708 48.347 60.162 73.75 87.73
Electronics 2021, 10, 2947 17 of 25
Electronics 2021, x, x FOR PEER REVIEW 17 of 26
% Savings w.r.t
814.08/Y −24.186 −15.369 −3.52 8.60 21.02 33.708 48.347 60.162 73.75 87.73
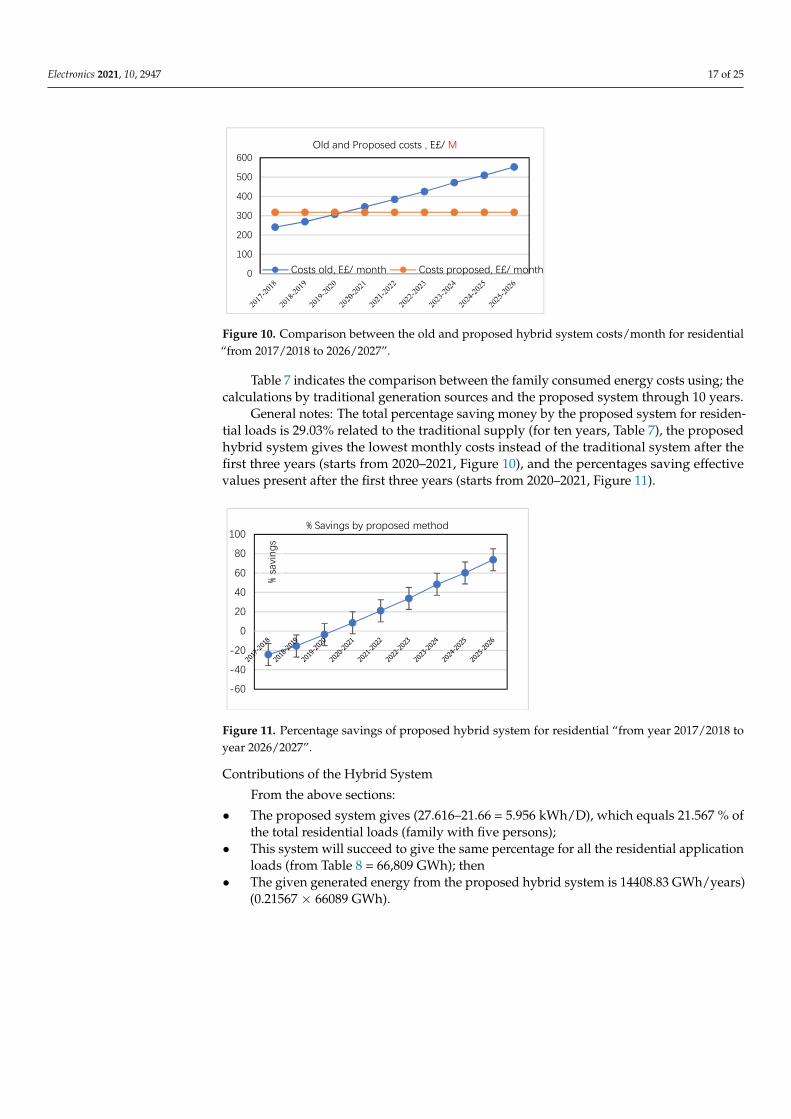
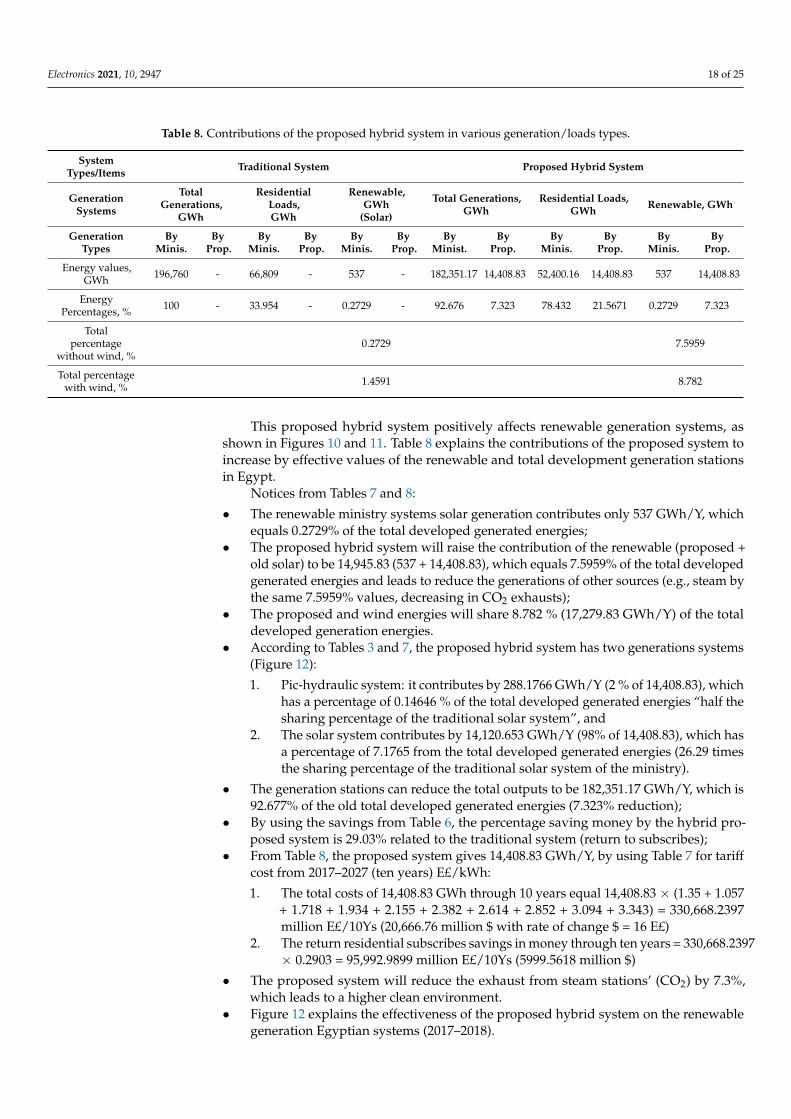
General notes: The total percentage saving money by the proposed system for residential loads is 29.03% related to the traditional supply (for ten years, Table 7), the proposed hybrid system gives the lowest monthly costs instead of the traditional system after the first three years (starts from 2020–2021, Figure 10), and the percentages saving effective values present after the first three years (starts from 2020–2021, Figure 11).
Figure 10. Comparison between the old and proposed hybrid system costs/month for residential “from 2017/2018 to 2026/2027”.
Figure 11. Percentage savings of proposed hybrid system for residential “from year 2017/2018 to year 2026/2027”.
Contributions of the Hybrid System From the above sections:
The proposed system gives (27.616–21.66 = 5.956 kWh/D), which equals 21.567 % of the total residential loads (family with five persons);
This system will succeed to give the same percentage for all the residential application loads (from Table 8 = 66,809 GWh); then
The given generated energy from the proposed hybrid system is 14408.83 GWh/years (0.21567 × 66089 GWh). This proposed hybrid system positively affects renewable generation systems, as
shown in Figures 10 and 11. Table 8 explains the contributions of the proposed system to increase by effective values of the renewable and total development generation stations in Egypt.
0
100
200
300
400
500
600Old and Proposed costs , E£/ M
Costs old, E£/ month Costs proposed, E£/ month
-60
-40
-20
0
20
40
60
80
100
%sa
vin
gs
% Savings by proposed method
Figure 10. Comparison between the old and proposed hybrid system costs/month for residential“from 2017/2018 to 2026/2027”.
Table 7 indicates the comparison between the family consumed energy costs using; thecalculations by traditional generation sources and the proposed system through 10 years.
General notes: The total percentage saving money by the proposed system for residen-tial loads is 29.03% related to the traditional supply (for ten years, Table 7), the proposedhybrid system gives the lowest monthly costs instead of the traditional system after thefirst three years (starts from 2020–2021, Figure 10), and the percentages saving effectivevalues present after the first three years (starts from 2020–2021, Figure 11).
Electronics 2021, x, x FOR PEER REVIEW 17 of 26
% Savings w.r.t
814.08/Y −24.186 −15.369 −3.52 8.60 21.02 33.708 48.347 60.162 73.75 87.73
General notes: The total percentage saving money by the proposed system for residential loads is 29.03% related to the traditional supply (for ten years, Table 7), the proposed hybrid system gives the lowest monthly costs instead of the traditional system after the first three years (starts from 2020–2021, Figure 10), and the percentages saving effective values present after the first three years (starts from 2020–2021, Figure 11).
Figure 10. Comparison between the old and proposed hybrid system costs/month for residential “from 2017/2018 to 2026/2027”.
Figure 11. Percentage savings of proposed hybrid system for residential “from year 2017/2018 to year 2026/2027”.
Contributions of the Hybrid System From the above sections:
The proposed system gives (27.616–21.66 = 5.956 kWh/D), which equals 21.567 % of the total residential loads (family with five persons);
This system will succeed to give the same percentage for all the residential application loads (from Table 8 = 66,809 GWh); then
The given generated energy from the proposed hybrid system is 14408.83 GWh/years (0.21567 × 66089 GWh). This proposed hybrid system positively affects renewable generation systems, as
shown in Figures 10 and 11. Table 8 explains the contributions of the proposed system to increase by effective values of the renewable and total development generation stations in Egypt.
0
100
200
300
400
500
600Old and Proposed costs , E£/ M
Costs old, E£/ month Costs proposed, E£/ month
-60
-40
-20
0
20
40
60
80
100
%sa
vin
gs
% Savings by proposed method
Figure 11. Percentage savings of proposed hybrid system for residential “from year 2017/2018 toyear 2026/2027”.
Contributions of the Hybrid System
From the above sections:
• The proposed system gives (27.616–21.66 = 5.956 kWh/D), which equals 21.567 % ofthe total residential loads (family with five persons);
• This system will succeed to give the same percentage for all the residential applicationloads (from Table 8 = 66,809 GWh); then
• The given generated energy from the proposed hybrid system is 14408.83 GWh/years)(0.21567 × 66089 GWh).
Electronics 2021, 10, 2947 18 of 25
Table 8. Contributions of the proposed hybrid system in various generation/loads types.
SystemTypes/Items Traditional System Proposed Hybrid System
GenerationSystems
TotalGenerations,
GWh
ResidentialLoads,GWh
Renewable,GWh
(Solar)
Total Generations,GWh
Residential Loads,GWh Renewable, GWh
GenerationTypes
ByMinis.
ByProp.
ByMinis.
ByProp.
ByMinis.
ByProp.
ByMinist.
ByProp.
ByMinis.
ByProp.
ByMinis.
ByProp.
Energy values,GWh 196,760 - 66,809 - 537 - 182,351.17 14,408.83 52,400.16 14,408.83 537 14,408.83
EnergyPercentages, % 100 - 33.954 - 0.2729 - 92.676 7.323 78.432 21.5671 0.2729 7.323
Totalpercentage
without wind, %0.2729 7.5959
Total percentagewith wind, % 1.4591 8.782
This proposed hybrid system positively affects renewable generation systems, asshown in Figures 10 and 11. Table 8 explains the contributions of the proposed system toincrease by effective values of the renewable and total development generation stationsin Egypt.
Notices from Tables 7 and 8:
• The renewable ministry systems solar generation contributes only 537 GWh/Y, whichequals 0.2729% of the total developed generated energies;
• The proposed hybrid system will raise the contribution of the renewable (proposed +old solar) to be 14,945.83 (537 + 14,408.83), which equals 7.5959% of the total developedgenerated energies and leads to reduce the generations of other sources (e.g., steam bythe same 7.5959% values, decreasing in CO2 exhausts);
• The proposed and wind energies will share 8.782 % (17,279.83 GWh/Y) of the totaldeveloped generation energies.
• According to Tables 3 and 7, the proposed hybrid system has two generations systems(Figure 12):
1. Pic-hydraulic system: it contributes by 288.1766 GWh/Y (2 % of 14,408.83), whichhas a percentage of 0.14646 % of the total developed generated energies “half thesharing percentage of the traditional solar system”, and
2. The solar system contributes by 14,120.653 GWh/Y (98% of 14,408.83), which hasa percentage of 7.1765 from the total developed generated energies (26.29 timesthe sharing percentage of the traditional solar system of the ministry).
• The generation stations can reduce the total outputs to be 182,351.17 GWh/Y, which is92.677% of the old total developed generated energies (7.323% reduction);
• By using the savings from Table 6, the percentage saving money by the hybrid pro-posed system is 29.03% related to the traditional system (return to subscribes);
• From Table 8, the proposed system gives 14,408.83 GWh/Y, by using Table 7 for tariffcost from 2017–2027 (ten years) E£/kWh:
1. The total costs of 14,408.83 GWh through 10 years equal 14,408.83 × (1.35 + 1.057+ 1.718 + 1.934 + 2.155 + 2.382 + 2.614 + 2.852 + 3.094 + 3.343) = 330,668.2397million E£/10Ys (20,666.76 million $ with rate of change $ = 16 E£)
2. The return residential subscribes savings in money through ten years = 330,668.2397× 0.2903 = 95,992.9899 million E£/10Ys (5999.5618 million $)
• The proposed system will reduce the exhaust from steam stations’ (CO2) by 7.3%,which leads to a higher clean environment.
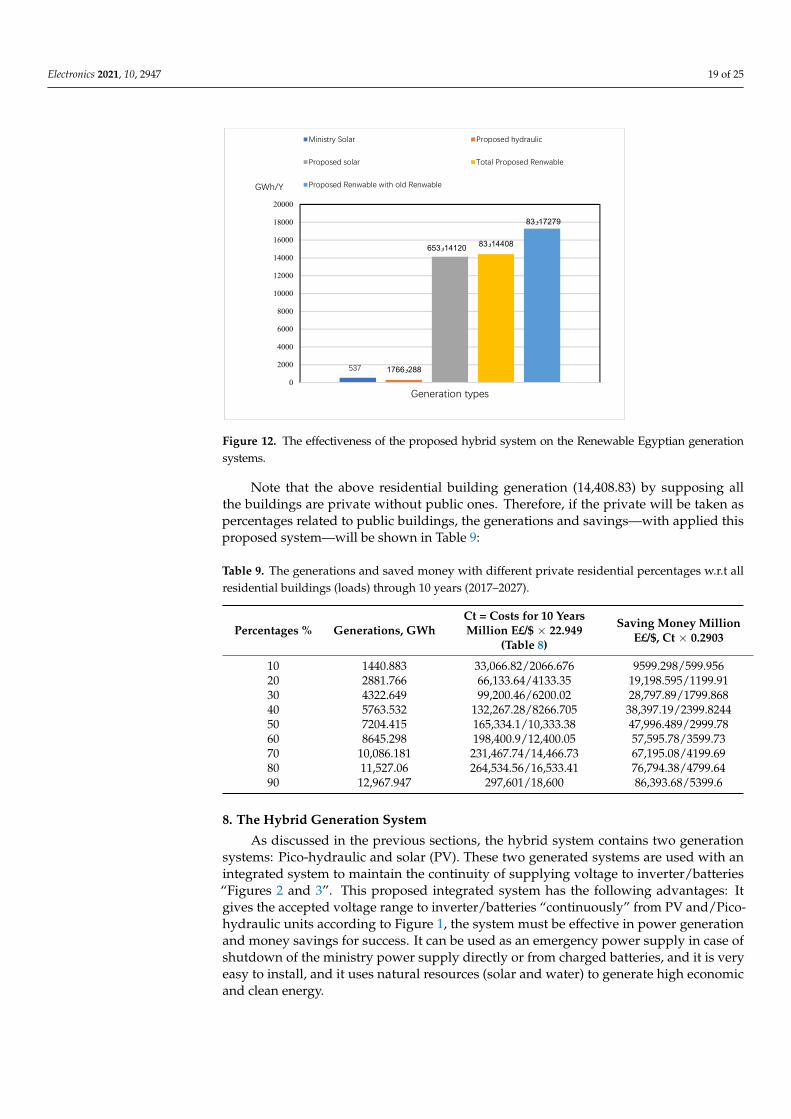
• Figure 12 explains the effectiveness of the proposed hybrid system on the renewablegeneration Egyptian systems (2017–2018).
Electronics 2021, 10, 2947 19 of 25Electronics 2021, x, x FOR PEER REVIEW 19 of 26
Figure 12. The effectiveness of the proposed hybrid system on the Renewable Egyptian generation systems.
Note that the above residential building generation (14,408.83) by supposing all the buildings are private without public ones. Therefore, if the private will be taken as percentages related to public buildings, the generations and savings—with applied this proposed system—will be shown in Table 9:
Table 9. The generations and saved money with different private residential percentages w.r.t all residential buildings (loads) through 10 years (2017–2027).
Percentages % Generations, GWh Ct = Costs for 10 Years Million E£/$ × 22.949
(Table 8)
Saving Money Million E£/$, Ct ×
0.2903 10 1440.883 33,066.82/2066.676 9599.298/599.956 20 2881.766 66,133.64/4133.35 19,198.595/1199.91 30 4322.649 99,200.46/6200.02 28,797.89/1799.868 40 5763.532 132,267.28/8266.705 38,397.19/2399.8244 50 7204.415 165,334.1/10,333.38 47,996.489/2999.78 60 8645.298 198,400.9/12,400.05 57,595.78/3599.73 70 10,086.181 231,467.74/14,466.73 67,195.08/4199.69 80 11,527.06 264,534.56/16,533.41 76,794.38/4799.64 90 12,967.947 297,601/18,600 86,393.68/5399.6
8. The Hybrid Generation System As discussed in the previous sections, the hybrid system contains two generation
systems: Pico-hydraulic and solar (PV). These two generated systems are used with an integrated system to maintain the continuity of supplying voltage to inverter/batteries “Figures 2 and 3”. This proposed integrated system has the following advantages: It gives the accepted voltage range to inverter/batteries “continuously” from PV and/Pico-hydraulic units according to Figure 1, the system must be effective in power generation and money savings for success. It can be used as an emergency power supply in case of shutdown of the ministry power supply directly or from charged batteries, and it is very easy to install, and it uses natural resources (solar and water) to generate high economic and clean energy.
537 1766و288
653و14120 83و14408
83و17279
0
2000
4000
6000
8000
10000
12000
14000
16000
18000
20000
Generation types
GWh/Y
Ministry Solar Proposed hydraulic
Proposed solar Total Proposed Renwable
Proposed Renwable with old Renwable
Figure 12. The effectiveness of the proposed hybrid system on the Renewable Egyptian generationsystems.
Note that the above residential building generation (14,408.83) by supposing allthe buildings are private without public ones. Therefore, if the private will be taken aspercentages related to public buildings, the generations and savings—with applied thisproposed system—will be shown in Table 9:
Table 9. The generations and saved money with different private residential percentages w.r.t allresidential buildings (loads) through 10 years (2017–2027).
Percentages % Generations, GWhCt = Costs for 10 YearsMillion E£/$ × 22.949
(Table 8)
Saving Money MillionE£/$, Ct × 0.2903
10 1440.883 33,066.82/2066.676 9599.298/599.95620 2881.766 66,133.64/4133.35 19,198.595/1199.9130 4322.649 99,200.46/6200.02 28,797.89/1799.86840 5763.532 132,267.28/8266.705 38,397.19/2399.824450 7204.415 165,334.1/10,333.38 47,996.489/2999.7860 8645.298 198,400.9/12,400.05 57,595.78/3599.7370 10,086.181 231,467.74/14,466.73 67,195.08/4199.6980 11,527.06 264,534.56/16,533.41 76,794.38/4799.6490 12,967.947 297,601/18,600 86,393.68/5399.6
8. The Hybrid Generation System
As discussed in the previous sections, the hybrid system contains two generationsystems: Pico-hydraulic and solar (PV). These two generated systems are used with anintegrated system to maintain the continuity of supplying voltage to inverter/batteries“Figures 2 and 3”. This proposed integrated system has the following advantages: Itgives the accepted voltage range to inverter/batteries “continuously” from PV and/Pico-hydraulic units according to Figure 1, the system must be effective in power generationand money savings for success. It can be used as an emergency power supply in case ofshutdown of the ministry power supply directly or from charged batteries, and it is veryeasy to install, and it uses natural resources (solar and water) to generate high economicand clean energy.
Electronics 2021, 10, 2947 20 of 25
Applicable Model
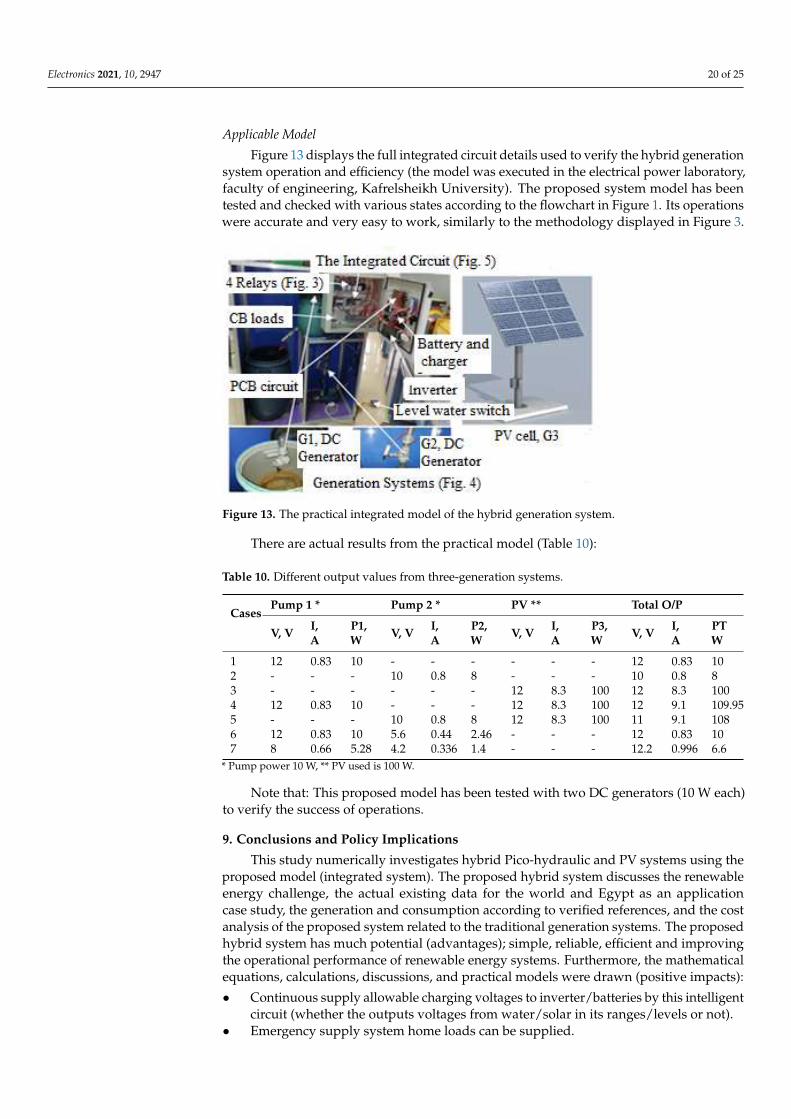
Figure 13 displays the full integrated circuit details used to verify the hybrid generationsystem operation and efficiency (the model was executed in the electrical power laboratory,faculty of engineering, Kafrelsheikh University). The proposed system model has beentested and checked with various states according to the flowchart in Figure 1. Its operationswere accurate and very easy to work, similarly to the methodology displayed in Figure 3.
Electronics 2021, x, x FOR PEER REVIEW 20 of 26
Applicable Model Figure 13 displays the full integrated circuit details used to verify the hybrid
generation system operation and efficiency (the model was executed in the electrical power laboratory, faculty of engineering, Kafrelsheikh University). The proposed system model has been tested and checked with various states according to the flowchart in Figure 1. Its operations were accurate and very easy to work, similarly to the methodology displayed in Figure 3.
Figure 13. The practical integrated model of the hybrid generation system.
There are actual results from the practical model (Table 10):
Table 10. Different output values from three-generation systems.
Cases Pump 1 * Pump 2 * PV ** Total O/P
V, V I, A
P1, W V, V I, A
P2, W V, V I, A
P3, W V, V I, A
PT W
1 12 0.83 10 - - - - - - 12 0.83 10 2 - - - 10 0.8 8 - - - 10 0.8 8 3 - - - - - - 12 8.3 100 12 8.3 100 4 12 0.83 10 - - - 12 8.3 100 12 9.1 109.95 5 - - - 10 0.8 8 12 8.3 100 11 9.1 108 6 12 0.83 10 5.6 0.44 2.46 - - - 12 0.83 10 7 8 0.66 5.28 4.2 0.336 1.4 - - - 12.2 0.996 6.6 * Pump power 10 W,** PV used is 100 W.
Note that: This proposed model has been tested with two DC generators (10 W each) to verify the success of operations.
9. Conclusions and Policy Implications This study numerically investigates hybrid Pico-hydraulic and PV systems using the
proposed model (integrated system). The proposed hybrid system discusses the renewable energy challenge, the actual existing data for the world and Egypt as an application case study, the generation and consumption according to verified references, and the cost analysis of the proposed system related to the traditional generation systems. The proposed hybrid system has much potential (advantages); simple, reliable, efficient and improving the operational performance of renewable energy systems. Furthermore,
Figure 13. The practical integrated model of the hybrid generation system.
There are actual results from the practical model (Table 10):
Table 10. Different output values from three-generation systems.
CasesPump 1 * Pump 2 * PV ** Total O/P
V, V I,A
P1,W V, V I,
AP2,W V, V I,
AP3,W V, V I,
APTW
1 12 0.83 10 - - - - - - 12 0.83 102 - - - 10 0.8 8 - - - 10 0.8 83 - - - - - - 12 8.3 100 12 8.3 1004 12 0.83 10 - - - 12 8.3 100 12 9.1 109.955 - - - 10 0.8 8 12 8.3 100 11 9.1 1086 12 0.83 10 5.6 0.44 2.46 - - - 12 0.83 107 8 0.66 5.28 4.2 0.336 1.4 - - - 12.2 0.996 6.6
* Pump power 10 W, ** PV used is 100 W.
Note that: This proposed model has been tested with two DC generators (10 W each)to verify the success of operations.
9. Conclusions and Policy Implications
This study numerically investigates hybrid Pico-hydraulic and PV systems using theproposed model (integrated system). The proposed hybrid system discusses the renewableenergy challenge, the actual existing data for the world and Egypt as an applicationcase study, the generation and consumption according to verified references, and the costanalysis of the proposed system related to the traditional generation systems. The proposedhybrid system has much potential (advantages); simple, reliable, efficient and improvingthe operational performance of renewable energy systems. Furthermore, the mathematicalequations, calculations, discussions, and practical models were drawn (positive impacts):
• Continuous supply allowable charging voltages to inverter/batteries by this intelligentcircuit (whether the outputs voltages from water/solar in its ranges/levels or not).
• Emergency supply system home loads can be supplied.
Electronics 2021, 10, 2947 21 of 25
• Increase the contribution of renewable energy by the solar system from 0.273% to7.595% of the total different installed generation stations in Egypt.
• Saves a lot of money for residential users (subscribers); each family can save11,073 E£/10 Y ($296.06) through service lifetimes of application of this proposedsystem related to supplying the same loads by the government system.
• On a large scale, according to Table 9, the savings in money in the residential sub-scriptions sector (through ten years) ranged from 9599.298 million E£/10Ys (lowestpercentage, 10%) up to 86,393.68 million E£/10Ys = 5399.6 million $ (percentage 90%).
• Uses the daily human usage water in the home to give 288.1766 GWh/Y (2% of14,408.83), which has a percentage of 0.14646% of the total developed generatedenergies (half the sharing percentage of the total updated traditional solar system inEgypt through 2017–2018).
• Uses solar energy (nature resource) to give 14,120.653 GWh/Y (98% of 14,408.83), whichhas a percentage of 7.1765% of the total developed generated energies (26.29 times thesharing percentage of the traditional solar system in Egypt through 2017–2018).
• Help the Egyptian electrical ministry to reduce the energy outputs from its generationstations to be 182,351.17 GWh/Y. This reduction is 7.323% of the total developedsupplied energy, which increases the service lifetime of ministry generation stations(decreasing their maximum loads) and gives the government a chance to install newprojects to use this extra generation energy.
• Increase the system power quality.• For environmental impact, it reduces the exhaust from steam stations’ (CO2 (by
7.3%), which equals the added by the proposed system), which leads to a higherclean environment.
• Some of the houses are individuals (e.g., Villa), which has its green land around it. Thisgreen land takes about half the quantity of water house; this means the generation of pico-hydraulic may share with another percentage value added to the previous percentage.
• It can be applied to all residential and commercial buildings to save users and thegovernment more.
But, there are limitations on the application of this proposed system: needs the sourceof hydraulic system (water tank) and solar sources to give all the above benefits. The outputvoltages and energy are still in low ranges, with interest on the cost and maintenance fee forthe pico-hydro power generator and the decline of photovoltaic cell performance. There isa reduction in the saved by this study may be limited to a very percentage (maybe less than0.05% from 7.3%). In addition, there is no support by governments to apply this model.
In future research, authors will try to overcome these drawbacks by:
• This proposed study must be supported by governments by giving bonuses on thebill, and reducing the cost by not applying tax and customs on the products used inthe application to consumers in a residential and commercial building, and
• Try to apply this model for large scales (e.g., irrigation projects).
Author Contributions: Conceptualization, F.F.S.; methodology, F.F.S.; software, F.F.S.; Validation,F.F.S., A.A. and I.B.M.T.; formal analysis, F.F.S.; investigation, I.B.M.T.; resources, F.F.S.; data curation,F.F.S.; writing—original draft preparation, F.F.S.; writing—review and editing, A.A.; visualization,F.F.S.; supervision, F.F.S.; project administration, A.A. All authors have read and agreed to thepublished version of the manuscript.
Funding: Ibrahim B. M. Taha is the author who received the financial grant from Taif UniversityResearchers Supporting Project (Number TURSP-2020/61), Taif University, Taif, Saudi Arabia.
Acknowledgments: The authors acknowledge the financial support received from Taif UniversityResearchers Supporting Project (Number TURSP-2020/61), Taif University, Taif, Saudi Arabia.
Conflicts of Interest: The authors declare no conflict of interest.
Electronics 2021, 10, 2947 22 of 25
Nomenclature
AbbreviationsACHE Adaptive control of the home environmentPV. Photo-voltaicPVT Photovoltaic thermalPVT-CR Photothermic–radiative coolingCPV Concentrator PhotovoltaicRE Renewable EnergySymbolsPm Theoretical mechanical horsepowerQ The flow rate in cubic feet per secondV The velocity of flow, m/sP Pressure, N/m2
P The density of water, kg/m3
Pt The output from the turbine, WQ The flow rate in the pipe (m3/s)G Acceleration of gravity (for water = 9.81 m/s2)Hn The net height, mHg Gross vertical head, mHlo Head loss, mηt Turbine efficiencyPop The net output from the generator, Wηg Generator efficiencyNs The specific speed of the turbine, rpmNt Turbine’s rotation speed (rpm)Pp Daily consumed power for each family home person is denoted by, KWhN Number of family personsPT The actual total family persons daily consumed power, KWhQp Consumed water/family person, m3
QT Total consumed water for all family persons, m3
Pec Total consumed power for all family persons must be Limited to economicvalue, and it is denoted by, KWh
Pw The pressure, psiTDH Total dynamic head, feetGpm Pumping rate in gallons per minuteWhp GpmPs Additional solar generation power, KW hE£ Egyptian pound
References1. Mehta, V.K.; Mehta, R. Principles of Power Systems; Chand: New Delhi, India, 2005; p. 15.2. Fang, Y.; Wei, W.; Mei, S.; Chen, L.; Zhang, X.; Huang, S. Promoting electric vehicle charging infrastructure considering policy
incentives and user preferences: An evolutionary game model in a small-world network. J. Clean. Prod. 2020, 258, 120753.[CrossRef]
3. Pérez-Lombard, L.; Ortiz, J.; Pout, C. A review on buildings energy consumption information. Energy Build. 2008, 40, 394–398.[CrossRef]
4. Zazzini, P.; Romano, A.; Di Lorenzo, A.; Portaluri, V.; Di Crescenzo, A. Experimental Analysis of the Performance of Light Shelvesin Different Geometrical Configurations Through the Scale Model Approach. J. Daylighting 2020, 7, 37–56. [CrossRef]
5. Ricquebourg, V.; Menga, D.; Durand, D.; Marhic, B.; Delahoche, L.; Loge, C. The Smart Home Concept: Our immediate future. InProceedings of the 2006 1ST IEEE International Conference on E-Learning in Industrial Electronics, Hammamet, Tunisia, 18–20December 2006; pp. 23–28.
6. Sripan, M.; Lin, X.; Petchlorlean, P.; Ketcham, M. Research and thinking of smart home technology. In Proceedings of theInternational Conference on Systems and Electronic Engineering (ICSEE’2012), Phuket, Thailand, 18–19 November 2012; pp.61–64.
7. Alam, M.R.; Reaz, M.B.I.; Ali, M.A.M. A Review of Smart Homes—Past, Present, and Future. IEEE Trans. Syst. Man Cybern. PartC 2012, 42, 1190–1203. [CrossRef]

Electronics 2021, 10, 2947 23 of 25
8. Rehman, A.U.; Wadud, Z.; Elavarasan, R.M.; Hafeez, G.; Khan, I.; Shafiq, Z.; Alhelou, H.H. An Optimal Power Usage Schedulingin Smart Grid Integrated With Renewable Energy Sources for Energy Management. IEEE Access 2021, 9, 84619–84638. [CrossRef]
9. The Lighting Handbook; Zumtobel Lighting GmbH: Dornbirn, Austria, 2016. Available online: https://www.zumtobel.com/PDB/teaser/SV/Lichthandbuch.pdf (accessed on 10 September 2021).
10. Selim, F.; Abdelwanis, M.I. Advance low-cost smart power savings system for public buildings. In Proceedings of the 11thICEENG Conference, Cairo, Egypt, 3–5 April 2018. [CrossRef]
11. Li, Z.; Li, J.; Li, X.; Yang, Y.; Xiao, J.; Xu, B. Design of Office Intelligent Lighting System Based on Arduino. Procedia Comput. Sci.2020, 166, 134–138. [CrossRef]
12. Ergüzel, A.T. A study on the implementation of dimmable street lighting according to vehicle traffic density. Optik 2019, 184,142–152. [CrossRef]
13. Li, D.H.W.; Li, S.; Chen, W. Estimating the switching frequency and energy saving for daylight-linked lighting on-off controls.Energy Procedia 2019, 158, 2878–2883. [CrossRef]
14. Chraibi, S.; Creemers, P.; Rosenkötter, C.; Van Loenen, E.; Aries, M.; Rosemann, A. Dimming strategies for open office lighting:User experience and acceptance. Light. Res. Technol. 2019, 51, 513–529. [CrossRef]
15. Wagiman, K.R.; Abdullah, M.N.; Hassan, M.Y.; Radzi, N.H.M.; Abu Bakar, A.H.; Kwang, T.C. Lighting system control techniquesin commercial buildings: Current trends and future directions. J. Build. Eng. 2020, 31, 101342. [CrossRef]
16. Elavarasan, R.M.; Shafiullah, G.; Padmanaban, S.; Kumar, N.M.; Annam, A.; Vetrichelvan, A.M.; Mihet-Popa, L.; Holm-Nielsen,J.B. A Comprehensive Review on Renewable Energy Development, Challenges, and Policies of Leading Indian States With anInternational Perspective. IEEE Access 2020, 8, 74432–74457. [CrossRef]
17. Elavarasan, R.; Shafiullah, G.; Kumar, N.M.; Padmanaban, S. A State-of-the-Art Review on the Drive of Renewables in Gujarat,State of India: Present Situation, Barriers and Future Initiatives. Energies 2019, 13, 40. [CrossRef]
18. Hassan, T.-U.; Abbassi, R.; Jerbi, H.; Mehmood, K.; Tahir, M.; Cheema, K.; Elavarasan, R.; Ali, F.; Khan, I. A Novel Algorithm forMPPT of an Isolated PV System Using Push Pull Converter with Fuzzy Logic Controller. Energies 2020, 13, 4007. [CrossRef]
19. Kiani, A.T.; Nadeem, M.F.; Ahmed, A.; Khan, I.; Elavarasan, R.M.; Das, N. Optimal PV Parameter Estimation via DoubleExponential Function-Based Dynamic Inertia Weight Particle Swarm Optimization. Energies 2020, 13, 4037. [CrossRef]
20. Kumar, S.; Sarita, K.; Vardhan, A.; Elavarasan, R.; Saket, R.; Das, N. Reliability Assessment of Wind-Solar Pv IntegratedDistribution System Using Electrical Loss Minimization Technique. Energies 2020, 13, 5631. [CrossRef]
21. Elavarasan, R.M.; Leoponraj, S.; Dheeraj, A.; Irfan, M.; Sundar, G.G.; Mahesh, G. PV-Diesel-Hydrogen fuel cell based gridconnected configurations for an institutional building using BWM framework and cost optimization algorithm. Sustain. EnergyTechnol. Assess. 2021, 43, 100934. [CrossRef]
22. Shafiullah, G.; Masola, T.; Samu, R.; Elavarasan, R.M.; Begum, S.; Subramaniam, U.; Romlie, M.F.; Chowdhury, M.; Arif,M.T. Prospects of Hybrid Renewable Energy-Based Power System: A Case Study, Post Analysis of Chipendeke Micro-Hydro,Zimbabwe. IEEE Access 2021, 9, 73433–73452. [CrossRef]
23. Al-Sakaf, O.H. Application possibilities of solar thermal power plants in Arab countries. Renew. Energy 1998, 14, 1–9. [CrossRef]24. Egypt Consumer Protection Agency. Available online: http://www.egyptera.org/ (accessed on 10 September 2021).25. Soliman, K.H. Rainfall over Egypt. Q. J. R. Meteorol. Soc. 1953, 79, 389–397. [CrossRef]26. WMO. The Climatological Norm for the Period 1961–1990 WMO/OMM. No. 847. Available online: https://library.wmo.int/in
dex.php?lvl=categ_see&id=10986 (accessed on 10 September 2021).27. Shaltout, M.A. Egyptian solar radiation atlas. In New and Renewable Authority; Ministry of Electricity and Energy: Cairo, Egypt,
1991. Available online: http://www.worldcat.org/title/egyptian-solar-radiation-atlas/oclc/25011751 (accessed on 10 September2021).
28. Tadros, M. Uses of sunshine duration to estimate the global solar radiation over eight meteorological stations in Egypt. Renew.Energy 2000, 21, 231–246. [CrossRef]
29. Robaa, S. Evaluation of sunshine duration from cloud data in Egypt. Energy 2008, 33, 785–795. [CrossRef]30. Angstrom, A. Solar and terrestrial radiation. Report to the international commission for solar research on actinometric investiga-
tions of solar and atmospheric radiation. Q. J. R. Meteorol. Soc. 1924, 50, 121–126. [CrossRef]31. Liu, B.Y.; Jordan, R.C. The interrelationship and characteristic distribution of direct, diffuse and total solar radiation. Sol. Energy
1960, 4, 1–19. [CrossRef]32. Kabeel, A.; Abdelgaied, M.; Sathyamurthy, R. A comprehensive investigation of the optimization cooling technique for improving
the performance of PV module with reflectors under Egyptian conditions. Sol. Energy 2019, 186, 257–263. [CrossRef]33. Elkholy, A. Harmonics assessment and mathematical modeling of power quality parameters for low voltage grid connected
photovoltaic systems. Sol. Energy 2019, 183, 315–326. [CrossRef]34. Hemeida, A.; El-Ahmar, M.; El-Sayed, A.; Hasanien, H.M.; Alkhalaf, S.; Esmail, M.; Senjyu, T. Optimum design of hybrid
wind/PV energy system for remote area. Ain Shams Eng. J. 2020, 11, 11–23. [CrossRef]35. Swief, R.; El-Amary, N.H. Optimal probabilistic reliable hybrid allocation for system reconfiguration applying WT/PV and
reclosures. Ain Shams Eng. J. 2020, 11, 109–118. [CrossRef]36. Bureau of Reclamation. Hydroelectric Power; US Department of Interior. Available online: https://www.usbr.gov/power/
(accessed on 10 September 2021).
Electronics 2021, 10, 2947 24 of 25
37. Al-juboori, S.S. Hydroelectric Power. Energy Science & Technology: Opportunities and Challenges. Available online: https://www.researchgate.net/publication/315493188 (accessed on 10 September 2021).
38. Singh, V.K.; Chauhan, N.S.; Kushwaha, D. An overview of hydroelectric power plant. ISST J. Mech. Eng. 2015, 6, 59–62.39. Lajqi, S.; Lajqi, N.; Hamidi, B. Design and construction of mini hydropower plant with propeller turbine. Int. J. Contemp. Energy
2016, 2, 1–13. [CrossRef]40. Li, J.; Saw, M.M.M.; Chen, S.; Yu, H. Short-Term Optimal Operation of Baluchaung II Hydropower Plant in Myanmar. Water 2020,
12, 504. [CrossRef]41. Uddin, W.; Ayesha, Z.K.; Haider, A.; Khan, B.; Islam, S.U.; Ishfaq, M.; Khan, I.; Adil, M.; Kim, H.J. Current and future prospects of
small hydro power in Pakistan: A survey. Energy Strat. Rev. 2019, 24, 166–177. [CrossRef]42. Hatata, A.; El-Saadawi, M.; Saad, S. A feasibility study of small hydro power for selected locations in Egypt. Energy Strat. Rev.
2019, 24, 300–313. [CrossRef]43. Ribeiro, A.C.A. Mathematical Problems of Hydroelectric Power Stations Management. Ph.D Thesis, University of Porto, Porto,
Portugal, 2014.44. Moniruzzaman, E. Hydroelectric Power Generation System. Master Thesis, Dhaka University of Engineering & Technology,
Gazipur City, Bangladesh, 2019. Available online: https://www.researchgate.net/publication/332170877 (accessed on 8 Septem-ber 2021).
45. Hydro Electric Power (Hydel Power). Available online: https://www.studentenergy.org/topics/hydro-power (accessed on 8September 2021).
46. Anaza, S.O.; Abdulazeez, M.S.; Yisah, Y.A.; Yusuf, Y.O.; Salawu, B.U.; Momoh, S.U. Micro hydroelectric energy generation- anoverview. Am. J. Eng. Res. 2017, 6, 5–12.
47. How Much Hydropower Power Could I Generate from a Hydro Turbine? Renewable: The Hydro and Wind Co. Availableonline: https://www.renewablesfirst.co.uk/hydropower/hydropower-learning-centre/how-much-power-could-i-generate-from-a-hydro-turbine/ (accessed on 1 September 2021).
48. Aqel, M.O.A.; Issa, A.; Qasem, E.; El-Khatib, W. Hydroelectric Generation from Water Pipelines of Buildings. In Proceedings ofthe 2018 International Conference on Promising Electronic Technologies (ICPET), Deir El-Balah, Palestine, 3–4 October 2018; pp.63–68.
49. Kougias, I.; Aggidis, G.; Avellan, F.; Deniz, S.; Lundin, U.; Moro, A.; Muntean, S.; Novara, D.; Pérez-Díaz, J.I.; Quaranta, E.; et al.Analysis of emerging technologies in the hydropower sector. Renew. Sustain. Energy Rev. 2019, 113, 109257. [CrossRef]
50. Raja, A.K.; Srivastava, A.P.; Dwivedi, M. Power Plant Engineering; New Age International Ltd.: Delhi, India, 2006.51. Abdulkareem, M.A. Hydro-water power plant. Power Plant Lecture Notes; Al-Mustansiriya University. Chapter 7, 2017. Available
online: https://www.researchgate.net/publication/304396387 (accessed on 1 September 2021).52. Brekke, H. Hydraulic Turbines Design, Erection and Operation; Norwegian University of Science and Technology: Trondheim,
Norway, 2001.53. Gabriel, C.D.; Odhiambo, P.; Odhach, J. Designing a Small Hydro Power Plant Capable of Producing 10 MW of Electricity at
Webuye Along River Nzoia. First Year Project, Nairobi University. 2015. Available online: https://pdfcoffee.com/design-of-a-small-hydro-power-plantpdf-pdf-free.html (accessed on 1 August 2021).
54. Zaman, A.; Khan, T. Design of a water wheel for a low head micro hydro power system. J. Basic Sci. Technol. 2012, 1, 1–6.55. Abdel-Aziz, T.M.; Salam, N.M.A. Characteristic Equations for Hydropower Stations of Main Barrages in Egypt. In Proceedings
of the Eleventh International Water Technology Conference IWTC11, Sharm El-Sheikh, Egypt, 1 January 2007. Availableonline: https://www.researchgate.net/publication/270750891_CHARACTERISTIC_EQUATIONS_FOR_HYDROPOWER_STATIONS_OF_MAIN_BARRAGES_IN_EGYPT (accessed on 1 August 2021).
56. Module 5 Hydropower Engineering. Version 2 CE IIT, Kharagpur. Available online: https://www.yumpu.com/en/document/view/15174084/module-5-nptel (accessed on 1 August 2021).
57. Pali, B.S.; Vadhera, S. An Innovative Continuous Power Generation System Comprising of Wind Energy Along With Pumped-Hydro Storage and Open Well. IEEE Trans. Sustain. Energy 2020, 11, 145–153. [CrossRef]
58. Zainuddin, H.; Yahaya, M.S.; Lazi, J.M.; Basar, M.M.F.; Ibrahim, Z. Design and development of pico-hydro generation system forenergy storage using consuming water distributed to houses. Int. J. Electr. Comput. Energetic Electron. Commun. Eng. 2009, 3,1928–1932. Available online: https://www.researchgate.net/publication/280688181 (accessed on 1 August 2021).
59. Fipps, G. Calculating Horsepower Requirements and Sizing Irrigation Supply Pipelines; Texas Agricultural Extension Service, TexasA&M University System: College Station, TX, USA, 2019. Available online: https://cdn-ext.agnet.tamu.edu/wp-content/uploads/2019/03/EB-6011-calculating-horsepower-requirements-and-sizing-supply-pipelines-for-irrigation.pdf (accessed on 11 June2021).
60. Li, P.; Zhou, K.; Lu, X.; Yang, S. A hybrid deep learning model for short-term PV power forecasting. Appl. Energy 2020, 259,114216. [CrossRef]
61. Shen, L.; Li, Z.; Ma, T. Analysis of the power loss and quantification of the energy distribution in PV module. Appl. Energy 2020,260, 114333. [CrossRef]
62. Jordehi, A.R. Enhanced leader particle swarm optimisation (ELPSO): An efficient algorithm for parameter estimation of photo-voltaic (PV) cells and modules. Sol. Energy 2018, 159, 78–87. [CrossRef]
Electronics 2021, 10, 2947 25 of 25
63. Chen, Y.; Sun, Y.; Meng, Z. An improved explicit double-diode model of solar cells: Fitness verification and parameter extraction.Energy Convers. Manag. 2018, 169, 345–358. [CrossRef]
64. Rezk, H.; Fathy, A. A novel optimal parameters identification of triple-junction solar cell based on a recently meta-heuristic watercycle algorithm. Sol. Energy 2017, 157, 778–791. [CrossRef]
65. Mostafa, M.R.; Saad, N.H.; El-Sattar, A.A. Tracking the maximum power point of PV array by sliding mode control method. AinShams Eng. J. 2020, 11, 119–131. [CrossRef]
66. Rahmanian, S.; Hamzavi, A. Effects of pump power on performance analysis of photovoltaic thermal system using CNT nanofluid.Sol. Energy 2020, 201, 787–797. [CrossRef]
67. Esfe, M.H.; Kamyab, M.H.; Valadkhani, M. Application of nanofluids and fluids in photovoltaic thermal system: An updatedreview. Sol. Energy 2020, 199, 796–818. [CrossRef]
68. Müller, J.; Trutnevyte, E. Spatial projections of solar PV installations at subnational level: Accuracy testing of regression models.Appl. Energy 2020, 265, 114747. [CrossRef]
69. Hu, M.; Zhao, B.; Ao, X.; Ren, X.; Cao, J.; Wang, Q.; Su, Y.; Pei, G. Performance assessment of a trifunctional system integratingsolar PV, solar thermal, and radiative sky cooling. Appl. Energy 2020, 260, 114167. [CrossRef]
70. Awad, M.; Radwan, A.; Abdelrehim, O.; Emam, M.; Shmroukh, A.N.; Ahmed, M. Performance evaluation of concentratorphotovoltaic systems integrated with a new jet impingement-microchannel heat sink and heat spreader. Sol. Energy 2020, 199,852–863. [CrossRef]
71. Stainsby, W.; Zimmerle, D.; Duggan, G.P. A method to estimate residential PV generation from net-metered load data and systeminstall date. Appl. Energy 2020, 267, 114895. [CrossRef]
72. The Annual Report for Consumed Energy in Egypt. Available online: http://www.moee.gov.eg/test_new/ST_consumption.aspx(accessed on 1 August 2021).
73. Egypt Electric Power Tariff. Available online: https://www.eehc.gov.eg/eehcportal/eng/YearlyReport/finalEnglish.pdf orhttp://egyptera.org/ar/Tarrif2017.aspx# (accessed on 1 August 2021).
74. The Consumed Water in Egypt. Available online: https://www.shorouknews.com/news/view.aspx?cdate=23092018&id=7637589e-6c70-4060-acf8-ad420dd7a838 (accessed on 1 August 2021).
75. The Relation between Psi and Bar. Available online: https://www.differencebetween.com/difference-between-psi-and-bar(accessed on 13 June 2021).
76. Psi to Bar Conversion. Available online: https://www.asknumbers.com/psi-to-bar.aspx (accessed on 13 June 2021).77. The Turbine-Generator Efficiency. Available online: http://www.orient-hose.com/project/pvc-garden-hose/?gclid=CjwKCAi
A66_xBRBhEiwAhrMuLa3rkrJIiXuE8zZMG-fQ09yMuIWopQ0VXZ29HjyD_HzGzvafcKd1YBoCAAgQAvD_BwE (accessed on13 June 2021).
78. The Conversion between Gallon to Cubic Metre. Available online: https://www.convertunits.com/from/gallons+per+minute/to/cubic+meters+per+day (accessed on 15 June 2021).
79. The Prices of Inverters. Available online: https://www.made-in-china.com/products-search/hot-china-products/DC_To_AC_Inverter.html (accessed on 18 June 2021).
80. The Prices of PV. Available online: https://www.google.com/search?q=solar+ell+price+lis+dollar&tbm=isch&ved=2ahUKEwjXoYzdt9voAhUTO-wKHTjeBjEQ2-cCegQIABAA&oq=solar+ell+price+lis+dollar&gs_lcp=CgNpbWcQAzoECCMQJzoCCAA6BAgAEEM6BAgAEB46BAgAEBM6CAgAEAgQHhATUIWCAlidzwJgxtICaABwAHgAgAHOAogBrC2SAQgwLjcuMTcuMpgBAKABAaoBC2d3cy13aXotaW1n&sclient=img&ei=JyGPXpfyFpP2sAe4vJuIAw&bih=708&biw=1440&rlz=1C1SQJL_enSA867SA868&safe=strict#imgrc=n6wyL-JxQHwOjM (accessed on 19 June 2021).
81. PV Products and Prices. Available online: https://www.amazon.com/SAVEMORE4U18/b/ref=bl_dp_s_web_17348805011?ie=UTF8&node=17348805011&field-lbr_brands_browse-bin=SAVEMORE4U18 (accessed on 19 June 2021).
82. DC Generators Types and Prices. Available online: https://www.alibaba.com/product-detail/Germany-Free-Ship-Lithium-ion-20Ah_62003155567.html?spm=a2700.pcdrm.normalList.10.2e53rTdbrTdbeu&s=p&fullFirstScreen=truehttps://www.qoo10.sg/g/544768068?source=ig102cc4da3c06559e5d1c405d9cf0283pte7p3f-000M00h0&jaehuid=2026298010 (accessedon 19 June 2021).
83. Walubita, L.F.; Djebou, D.C.S.; Faruk, A.N.M.; Lee, S.I.; Dessouky, S.; Hu, X. Prospective of Societal and Environmental Benefits ofPiezoelectric Technology in Road Energy Harvesting. Sustainability 2018, 10, 383. [CrossRef]
Related Documents


![· Steam Turbine C] Fuel Cell Solar/ Photovoltaic C] Biomass Solar/ Photovoltaic Biomass Fuel Type: A. Existing: C] Wind Turbine Hydraulic Turbine Diesel Engine Gas Turbine B. New:](https://static.cupdf.com/doc/110x72/5eb494634700370587679ab6/steam-turbine-c-fuel-cell-solar-photovoltaic-c-biomass-solar-photovoltaic-biomass.jpg)


