Economic costs of the Israeli Occupaton of Palestine
Mar 23, 2016
Â
Welcome message from author
This document is posted to help you gain knowledge. Please leave a comment to let me know what you think about it! Share it to your friends and learn new things together.
Transcript


The economic costs of the Israeli occupation for the occupied Palestinian territory
A bulletin published by the Palestinian Ministry of National Economy in cooperation with the Applied Research Institute-‐ Jerusalem (ARIJ)
September 2011
The Ministry of National Economy wishes to acknowledge UNDP for the financial support.

The economic costs of the Israeli occupation for the occupied Palestinian terr itory
I
Contents Executive Summary ................................................................................................................................. II 1. Introduction .................................................................................................................................... 1 2. Costs of the blockade on Gaza ........................................................................................................ 3 3. Import and export restrictions ........................................................................................................ 5 4. Restrictions on the use of water resources .................................................................................. 11 5. Potential revenues from Israeli controlled natural resources in the West Bank and Gaza .......... 18 6. Electricity restrictions ................................................................................................................... 22 7. Obstacles to domestic movement of goods and labour ............................................................... 25 8. Dead Sea Tourism ......................................................................................................................... 29 9. Uprooted trees .............................................................................................................................. 31 10. Fiscal implications: sustainable fiscal balance .............................................................................. 32 Appendix 1 ............................................................................................................................................ 35 Appendix 2 ............................................................................................................................................ 39 Appendix 3 ............................................................................................................................................ 44 References ............................................................................................................................................ 45

II
Executive Summary The Israeli military occupation of the Palestinian territory imposes a huge price tag on the Palestinian economy. Israeli restrictions prevent Palestinians from accessing much of their land and from exploiting most of their natural resources; they isolate the Palestinians from global markets, and
international economic organisations, including the World Bank, UNCTAD and the IMF, these restrictions are the main impediment to any prospects of a sustainable Palestinian economy. Acknowledging this, and in spite of data scarcity and challenges in carrying out such an immense task the Palestinian Ministry of National Economy teamed up with the Applied Research Institute-‐ Jerusalem (ARIJ), an independent think-‐tank, to provide the first systematic quantification of the annual costs imposed by the occupation on the Palestinian economy. The main results of such analysis are presented in this bulletin, which aims to be a regular publication monitoring and quantifying the costs of Israeli restrictions on the Palestinian economy. Many of these restrictions have been in place since the start of the occupation in 1967, reflecting an unchanged colonial attitude of Israel, which aims to exploit Palestinian natural resources (including land, water and mining resources) for its own economic benefits. coupled by the desire of Israel to prevent any Palestinian competition with Israeli economic interests. This attitude is summed up by defense minister in 1986:
(UNCTAD 1986). This has been (and still is) reflected in a series of Israeli obstacles related to customs, transportation and infrastructure which have prevented the development of a competitive Palestinian tradable sector and of Palestinian trade with non-‐Israeli partners. Today these restrictions have deepened further and according to our estimations in 2010 they are almost equal to the value of the entire Palestinian economy. The total costs imposed by the Israeli occupation on the Palestinian economy which we have been able to measure was USD 6.897 billion in 2010, a staggering 84.9% of the total estimated Palestinian GDP. In other words, had the Palestinians not been subject to the Israeli occupation, their economy would have been almost double in size than it is today. Table E1 below summarises these costs split by the main types of restriction. In line with the colonial paradigm of the Israeli occupation, the majority of these costs do not have any relationship with security concerns but rather come from the heavy restrictions imposed on the Palestinians in the access to their own natural resources, many of which are exploited by Israel itself, including water, minerals, salts, stones and land. Over USD 4.5 billion per year, a full 56% of GDP, is the cost (in terms of both foregone revenues and higher costs of raw materials) for the Palestinians for not being able to access their own resources. What determines the size of these figures? The huge costs of the Gaza blockade are determined by a myriad of Israeli restrictions, including the almost complete closure to international trade, the disruption caused to the electricity production, the limited access to the sea resources and the continued shelling of infrastructure. These restrictions have led to the collapse of the economy, whose growth path has diverged from that of the West Bank since 2006. The restrictions on access to water (in the West Bank) and on access to natural resources deprive the Palestinians of enormous sources of revenues associated with the economic activities based on these natural resources. These include the expansion of irrigated

The economic costs of the Israeli occupation for the occupied Palestinian terr itory
III
agriculture, the extraction of salts and minerals from the Dead Sea (which is off limits to the
and stone available in the West Bank, most of which is exploited by Israel, and the development of the Gaza offshore gas field. Similarly the lack of access to the Dead Sea has made the development of a high potential Palestinian tourism industry along its shores impossible. Other losses imposed by the occupation include the extra costs of electricity and water provision faced by the Palestinians, who are dependent on Israeli supplies for such provision due to the restrictions imposed on the electricity generation and on the access to water; the costs imposed by the restrictions on exports and imports, which translate into unavailability of inputs and higher production costs; the costs associated with the barriers to the movement of goods and people within the West Bank, and the destruction of productive assets, particularly the uprooting of trees. Despite the magnitude of the estimated losses, these are likely to be a severe under-‐estimation of the real costs imposed by the occupation on the Palestinian economy, as we have not been able to measure all the different costs of the occupation due to a lack of data. For example the prohibition to import goods such as lathe machines, which are essential inputs in the machinery production, has most probably stifled the development of the whole Palestinian manufacturing sector. However in the absence of an estimation of the potential size of the sector in the absence of such restrictions, it is not possible to quantify their costs. Not only does the occupation maintains the Palestinian economy small but it also hinders Palestinian fiscal balance by reducing its fiscal revenues in two ways: directly, by preventing an efficient collection of taxes mainly due to the prohibition of the PA to operate at the international borders; and indirectly, by artificially reducing the size of the Palestinian economy and therefore its tax
the direct fiscal costs of the occupation amount to USD 406 million per year while the indirect fiscal costs total USD 1.389 billion per year. This implies that without the occupation, the Palestinian Authority would run a healthy fiscal surplus without thaid, and would be able to substantially expand fiscal expenditures to spur further social and economic development.

IV
Table E1: E conomic costs of the Israeli occupation for the Palestinian ter ritory, USD
Cost ('000 USD) %GDP Gaza blockade 1,908,751 23.5% Indirect costs of water restrictions 1,903,082 23.4%
Value Added from irrigation 1,219,667 15.0% Jordan Valley agriculture 663,415 8.2% Health costs from water 20,000 0.2%
Natural resources 1,837,738 22.6% Dead Sea salts and minerals 1,102,869 13.6% Value added from quarries 574,869 7.1% Gas marine reserve 160,000 2.0%
Direct utility costs 492,788 6.1% Direct electricity costs 440,876 5.4% Direct water costs 51,912 0.6%
Intl. Trade restrictions 288,364 3.5% Dual use (excl agriculture) 120,000 1.5% Dual use agriculture 141,972 1.7% Cost of trading 26,392 0.3%
Movement restrictions 184,517 2.3% Dead Sea tourism 143,578 1.8% Uprooted trees 138,030 1.7% Direct costs 3,012,451 37.1% Indirect costs 3,884,398 47.8% TOTAL 6,896,849 84.9% Fiscal costs 1,795,685 Memo item Nominal Palestinian GDP (2010) 8,124,000

The economic costs of the Israeli occupation for the occupied Palestinian terr itory
1
1. Introduction The Israeli occupation imposes a myriad of restrictions on the Palestinian economy. It prevents Palestinians from accessing much of their land and from exploiting most of their natural resources; it isolates the Palestinians from global markets, and fragments their territory into small, badly
. As recently highlighted by international economic organisations, (including the World Bank, 2010b and 2011, UNCTAD, 2011 and the IMF, 2011), it is the conditions of occupation that are impeding any prospects of sustainable economic growth in the occupied Palestinian territory (oPt). Although the importance of the Israeli restrictions to stifle the Palestinian economic development is undisputed, a systematic quantification of the costs that such restrictions impose on the economy is still lacking. This bulletin represents the first effort to provide such systematic quantification in terms of annual costs. It is compiled by the Palestinian Ministry of National Economy working with the independent think-‐tank Applied Research Institute -‐Jerusalem (ARIJ). It aims to be a regular publication that closely monitors and quantifies the costs of Israeli restrictions on the Palestinian economy. Many of these restrictions have been in place since the start of the occupation in 1967, reflecting an unchanged colonial attitude of Israel, which aims to exploit Palestinian natural resources (including land, water and mining resources) for its own economic benefits. coupled by the desire of Israel to prevent any Palestinian competition with Israeli economic interests. This attitude is summed up by minister in 1986: and no permits
(UNCTAD 1986). This has been (and still is) reflected in a series of Israeli obstacles related to customs, transportation and infrastructure which as this report will show have prevented the development of a competitive Palestinian tradable sector and especially Palestinian trade with non-‐Israeli partners. Despite not being able to quantify all the costs, the numbers are huge: we estimate that the total measurable cost of the Israeli occupation on the Palestinian economy in 2010 was USD 6.897 billion; a staggering 84.9% of the total Palestinian GDP in 2010. As the costs are measured in current prices, we use GDP in 2010 measured in current prices as well. For that we use the estimate of USD 8.124 billion provided by the IMF and the Palestinian Ministry of Finance. The costs are split into direct and indirect costs. The former are extra costs, which are directly borne by the Palestinian economy due to Israeli restrictions; these include higher costs of electricity, water, and the movements of goods and people. The latter form the major part of the costs of the Israeli occupation and concern the foregone revenues from production that have yet to be realized, due to the restrictions imposed by the occupation. These revenues would have materialised had Palestine been a free and sovereign country. Examples of these indirect costs include the value added from the extraction of minerals and salts in the Dead Sea, and the royalties from the development of the offshore marine gas field of Gaza. We limit the estimation of indirect costs to sectors such as natural resource exploitation, so that we can confidently quantify the opportunity cost of not developing any economic activities. As such, we are not including the probable missed revenues from not developing certain industries due to the import restrictions imposed by Israel in our estimation. This quantification is likely to be an under-‐estimation of the true costs of the occupation, as we have made the choice to quantify only those costs for which reliable and relatively precise estimations

2
could be provided. We have not been able to quantify the many different costs of the occupation because, in many cases, a lack of data prevents us from finding a reliable quantification of the costs. In particular the major costs which were not included are the following:
1. Costs associated with obstacles to the international movement of people;1 2. Loss of investments due to building restrictions; 3. Indirect losses from import restrictions in industry and ITC ; 4. Indirect losses from restrictions on telecommunications; 5. Losses from the construction of the wall, especially in terms of severing economic links
between the Palestinians in Israel and the West Bank; 6. Losses from restrictions to the East Jerusalem market; especially for pharmaceuticals and
telecommunications. In the remainder of the report we provide the details of the various costs which we were able to quantify, along with the methodology and data sources used for the estimating them.
1 potential value of each investor. However it is has not been possible to estimate the value of the latter.

The economic costs of the Israeli occupation for the occupied Palestinian terr itory
3
2. Costs of the blockade on Gaza The costs of the blockade imposed by Israel on Gaza are difficult to estimate pervasive effects on all aspects of its economy. For example, the heavy restrictions on trade make the economy function in a state of quasi autarky: the Gaza population faces severe limitations on what it can export (against over USD 150 million pre-‐blockade) and import. This alone increases the costs of inputs significantly, especially because the economy in Gaza is small and highly dependent on imports for production and consumption. The closures have had a major impact on water supply as well. As reported by the World Bank (2009), in November 2008, most water wells had stopped because of lack of spares and others were working at half-‐ capacity. Electricity production has also been greatly affected. The power plant in Gaza is now working at half capacity due to the damages it suffered from the shelling at the end of 2008 and because it cannot run on gas due to Israeli restrictions. This has generated a huge shortage in the electricity supply, estimated at approximately 90 MW in 2010 (GEDCO, 2010). Power cuts and lack of diesel for generators have undermined water distribution and pumping to household reservoirs. The utility often runs out of chlorine, an indispensable chemical to ensure water disinfection. There is also lack of related chemicals such as anti-‐scalants and spares. Small
price. As a result, at the end of 2008, the World Bank (2009) reported that more than 50% of households did not have access to network water and some households had not had water for more than 10 days. The shelling of Gaza by the Israeli forces only heightened the hugely disruptive effect of occupation
economy by destroying both its physical assets and infrastructure (UNDP, 2010). Rather than focussing on the micro-‐level costs for the different sectors and economic activities, we believe a macro approach is more suitable in this case as it allows us to measure the cost of the blockade in a more comprehensive way. We start from the fact that the economies of the West Bank and Gaza were following an almost identical pattern of long-‐term growth in the period before the blockade (2002-‐05), as illustrated in the top panel of Figure 2.1 (data from the Palestinian Central Bureau of Statistics, PCBS). Without shocks we would have expected the two economies to have continued to follow a similar pattern. This has not been the case due to the massive shock of the blockade (along with the bombing at the end of 2008 to beginning of 2009) imposed on Gaza. We estimate that without such shocks the economy would have continued to grow at the same pace as the West Bank economy, which has not experienced any major further shocks since 2006 (except during 2007 when the Hamas-‐elected government was forced from office by the Israeli intervention). In fact, the West Bank economy continued on a similar pattern of growth as it had before 2005, while the Gaza economy collapsed. By applying the same rate of growth to the Gaza economy, we find the counterfactual path of GDP for Gaza in the absence of the blockade between 2006 and 2010 (bottom panel of Figure 1b).

4
Figure 2.1: The costs of the blockade on Gaza a) Pre-‐blockade GDP, West Bank and Gaza (GDP in const USD mln)
b) Blockade effect, Gaza (GDP in USD million constant)
The difference between the predicted and the actual GDP in 2010 is 1.480 billion in constant 2004 US dollars (i.e. USD 2.826 bn USD 1.346 bn), which we interpret as the cost of the blockade in Gaza in 2010. This is equal to . We transform this figure in current prices, by multiplying it by the ratio between the consumer price index in 2010 and in 2004 (1.29). Thus the total cost of the blockade in 2010 for the Gaza economy is estimated to be USD 1.908 billion at current 2010 prices; or, over one quarter of total Palestinian GDP.
West Bank
Gaza
0
500
1,000
1,500
2,000
2,500
3,000
3,500
2002 2003 2004 2005
Actual
Predicted
0
500
1,000
1,500
2,000
2,500
3,000
2002 2003 2004 2005 2006 2007 2008 2009 2010e

The economic costs of the Israeli occupation for the occupied Palestinian terr itory
5
3. Import and export restrictions
Israel imposes a variety of restrictions on the trade to and from the West Bank and Gaza (WB&G), including with Israel. These restrictions lead to different types of costs, which we divide into two categories:
a.
item list. b. Costs of the restrictions in handling, processing and transporting imports and
exports.
Unfortunately we are not able to quantify the costs of a third category, i.e. export restrictions to the East Jerusalem market due to lack of adequate data.
3a. -‐ exclusively for West Bank) Dual-‐use items are goods, raw materials and equipments and spare parts that have both civilian use as well as potentially other harmful use to which they could be diverted after import into the WB&G. Israeli restrictions on dual-‐use chemicals and fertilizers have been in place for decades, but in 2002, the Israeli military began limiting access to chemicals and fertilizers further by lowering the maximum concentration levels allowed. Since 2002, the Government of Israel (GoI) has progressively added materials, machinery, and equipment (including telecommunications equipment) to the list of
-‐ In 2008, as part of the new Defence Export Control Law, a new list was approved by MoD that includes 56 items.2 The latter includes; fertilizers, chemicals and raw materials for industry, steel pipes, lathe and milling machines, optical equipment, and navigation aids, amongst others. To control imports by Palestinian businesses, the GoI has established a system of bureaucratic controls that require the GoI to authorize their transfer to the West Bank. The system requires the importers to obtain a license in order to import the dual use items; however, most companies fail to get the license. These restrictions limit Palestinian access to dual use goods as they need GoI authorization for the transfer. The authorization is obtained through an application process for permits and licenses, but the authorization for many goods is so rarely obtained that, in effect, the goods are banned. Recent work carried out by the Trade Facilitation Project (TFP) identifies key problems that severely restrict the authorisation process3: 1. The list and scope of restricted dual use goods has been increasing despite an environment of improved security; 2. Lack of specificity regarding the items causes uncertainty and confusion; 3. No easy access to information on dual use goods (e.g. even toothpaste which contains a small percentage of nitric acid would not be allowed, but an exception is made because it is a humanitarian item); 4. Military orders do not explain the application process or establish timelines for processing applications, taking decisions and resolving disputes; 5. The Exceptions Committee meets infrequently and with unclear timelines and there is limited staff at the Israeli civil administration in Bet El to process applications (only one clerk to process requests for the whole of the West Bank which results in further delays).
2 The complete list is presented in Appendix 1. 3 The results from the work were presented at the Ministry of National Economy in September 2010 and are available from Ministry of National Economy (2010).

6
Under this system, the process of handing out permissions must be repeated for every truckload of dual-‐use item, even for the same type of goods. In addition, there are some imports which are strictly prohibited from entering the West Bank and Gaza, such as glycerine and lathe machines (PALTRADE, 2010). These restrictions raise the costs of inputs, and/or force companies to use an inefficient input mix of production and/or prevent companies from producing altogether if the prohibited import is a necessary input to production. Box 1 illustrates some examples of how these restrictions affect specific companies. Three major macro-‐ elated restrictions ate the agricultural industrial and ICT sectors. For the latter two we base the estimation of costs on TFP work. We compute our own estimates for agricultural costs, since these are more clearly identifiable and we can compute some of the indirect costs from the restrictions. On the other hand, the work from TFP only captures the direct costs of the restrictions, i.e. the extra costs faced by the firms in their production due to the import restrictions. This is a clear under-‐estimation of the true costs from such restrictions, which are likely to involve mainly the foregone revenues for the lack of production due to the restrictions. This can be the case when existing companies cannot expand production due to their lack of competitiveness (stifled by restrictions) or even when potential companies cannot come about altogether as the costs of production is too high vis-‐à-‐vis the market due to the restrictions. Box 1: Firm-‐level experience on the costs from dual use restrictions The profile. The company exports an estimated 10 truckloads of aluminum to Israel on a monthly basis. Due to the restrictions imposed on the entry of industrial inputs essential for aluminum anodizing (oxidizations) and
costs per shipment of 400 kg are estimated at NIS 25,800, for aluminum anodizing, and NIS 6,464 for nitration.. These extra costs represent transportation and processing costs in Israel. Pal Karm Company for Cosmetics, located in Nablus, is a leading industrial cosmetics company. The company sells products in the local market and also exports to Israel. Around 50% -‐ 60% of the company's sales are going to the Israeli market. The company has a wide experience in manufacturing cosmetics and skincare products: i.e. moisturizer and lipstick. Glycerin is an essential raw material for the company which is used in cosmetics to hold moisture against the skin and prevent dryness. Israel banned the entry of Glycerin into the Palestinian Territory since mid 2007. Ever since, the company has not able to sell skincare products in the Israeli market because the Israeli Health Authorities require Glycerin to be part of such products. The company estimates their losses at 30% of their sales in the Israeli market for this specific product. Al-‐Juneidi Dairy and Food Stuff Company was founded in 1982 in Hebron. Al-‐Juneidi is a leading industrial producer of dairy products and food stuff, which contains numerous products of food, dairy, salads, and snacks. Al-‐Juneidi uses packing material known as (Tetra-‐Pack) for packing their products. Further, it is internationally recommended to use hydrogen peroxide H 2O2 with a concentration of 35%. Since 2007, Israel only allows the entry of hydrogen peroxide of H2O2 with 17% concentration into the Palestinian Territory. This limitation severely impacts the productivity of the factory because the packing machine automatically stops when the sterilizing materials concentration reaches low levels (12%). Therefore, the company has to install more sterilizing materials in order to resume production. Further, it is necessary to re-‐sterilize the whole production line again. Consequently, this process requires several hours, causing disruption in production. The estimated time for re-‐sterilizing and re-‐operation is 4 days per month, where the operating cost per day is estimated at NIS 5,000, which is around NIS 20,000 per month. Source: PalTrade, 2010
The economic costs of the Israeli occupation for the occupied Palestinian terr itory
7
According to TFP work, dual use items affect the following industrial sub-‐sectors: food, beverages, metal, pharmaceuticals, textiles, leather, paints, detergents and cosmetics. Items of relevance to these sub-‐sectors include: hydrogen peroxide, nitric acid, sulphuric acid, glycerine, metal pipes, etc. For example, UHT milk requires hydrogen peroxide for sterilization. As the required 35% concentration cannot be procured, the companies use an inferior concentration (17%) which decreases the shelf life of the milk from 1 year to less than 6 months and leads to a higher percentage of spoiled goods.4 In another example, companies that need to use nitric acid to clean pipes from grease have to use different chemicals which are less effective and require that the pipes be replaced much more frequently. ICT companies are also affected by dual use restrictions due to the extra costs related to the restrictions to import certain telecommunications devices (such as switches, which had to be placed in London, and more recently in Jordan) and technology (such as 3G technology), which increase their overall operating costs. The TFP work estimates annual direct losses from such restrictions at about USD 60 million for industry and USD 60 million for ICT.
In the agriculture sector, GoI imposes a number of restrictions on the type of fertilizers which can be imported by Palestinian farmers. There are a number of fertilizers that Palestinians cannot import (see complete list in Appendix 1), but we analyze only the extra costs of the banning of three main ones which should capture a significant share of the overall costs of dual use item restrictions in agriculture:
Compound solid 20:20:20 fertilizer (20% of nitrogen, 20% phosphate and 20% potash) Urea (CH4N2O); Potassium nitrate (KNO3).
We compare the costs for Palestinian farmers from using the appropriate fertilizers which are banned vis-‐à-‐vis the costs of using the alternative permitted (but inefficient) fertilizers. This comparison yields two types of costs: a direct cost arising from the fact that the use of alternative fertilizers is usually more costly than the more efficient banned fertilizer and, indirect costs from the
s, relative to the banned ones. In particular the main alternatives for solid 20:20:20 fertilizer are the fertilizer 13:13:13 or the liquid fertilizer; these types being used for irrigated vegetable crops (both protected and open) as well as for fruit trees (which are mainly rain-‐fed in Palestine). The only company in the world that produced fertilizers with the 13:13:13 concentration is a plant in Haifa, which explains also the higher price
for the 13:13:13 vis-‐à-‐vis the 20:20:20. We identify the recommended quantity of fertilizer use in terms of kg/dunum/year in order for each type of crops to receive the correct dose of the various nutrient elements (Table 3.1). As the 20:20:20 fertilizer has a higher concentration of nitrogen, phosphate and potash per kilo than the 13:13:13 fertilizer, one would need to apply more of the latter than the former to have the same quantity per dunum. This results in extra costs for the farmers as shown in the upper part of Table 2.1. The same is also true when comparing 20:20:20 fertilizer to the other alternatives, i.e. liquid fertilizer, as well as when comparing Urea (which is banned) vis-‐à-‐vis Ammonium Nitrate (NH4NO3) fertilizers, although in these cases the fertilizers are only applied to the irrigated vegetables production. On the other hand, potassium nitrate and potassium sulphate (K2SO4) contain similar amounts of the necessary chemicals (thus the recommended quantity per dunum is the same) but potassium nitrate (banned) is cheaper than potassium sulphate; this again creates an extra cost for Palestinian farmers (bottom part of Table 3.1). 4 Based on interviews with companies as well as sectoral experts.

8
As we do not have infwe assume that the various fertilizers considered are used in equal amounts on irrigated vegetable crops. Therefore, we take the average extra direct costs across fertilizers for irrigated vegetable
then add the extra cost from using the 13:13:13 fertilizer instead of the 20:20:20 fertilizer for rain-‐fed fruit trees and obtain the estimated total direct costs from the banning of fertilizers by Israel. The total costs computed in this way amounts to close to NIS 100 million, equivalent to USD 28.6 million, which is the estimated direct extra cost from not being able to import the right type of fertilizers.5 Table 3.1: Cost comparisons between banned vs. permitted fertilizers
Cultivated
Area Fertilizer use (kg/dunum)
Fertilizer use (kg/dunum) Cost Difference
20-‐20-‐20 solid (banned) vs. 13:13:13 solid fertilizers
Type of crops (dunum) 20:20:20 (6.8 NIS/kg)
13:13:13 (4.8 NIS/kg) (NIS)
Protected Irrigated Vegetables 45,303 250 400 9,966,660 Open field Irrigated Vegetables 105,972 100 200 29,672,160 Rain-‐Fed Fruit Trees 1,096,742 20 30 8,773,936 Total 48,412,786 20-‐20-‐20 solid (banned) vs. liquid fertilizers
Type of crops (dunum) 20:20:20 (6.8 NIS/kg)
Liquid compound fertilizers (4.0 NIS/L)
(NIS)
Prot. Irr. Veg. 45,303 250 750 58,893,900 Open Irr. Veg. 105,972 100 600 182,271,840 Total 241,165,750 Urea (CH4N2O) (banned) vs. ammonium nitrate (NH4NO3) fertilizers
Type of crops (dunum) CH4N2O (3.2 NIS/kg)
NH4NO3 (2.3 NIS/kg) (NIS)
Prot. Irr. Veg. 45,303 163 325 10,233,948 Open Irr. Veg. 105,972 125 250 18,545,100 Total 28,779,048 Potassium nitrate (KNO3) (banned) vs. K2SO4 fertilizers
Type of crops (dunum) KNO3 (2.4 NIS/kg)
K2SO4 (5.6 NIS/L) (NIS)
Prot. Irr. Veg. 45,303 130 130 18,846,048 Open Irr. Veg. 105,972 100 100 33,911,040 Total 52,757,088
Direct costs from fertilizer banning (avg. + 13:13:13 for rain-‐fed trees) NIS 99,359,113
Source: ARIJ Agriculture Department
5 We apply here and in the rest of the document the average USD/NIS exchange rate for the months of July-‐August 2011, i.e. 1 USD= 3.472 NIS.

The economic costs of the Israeli occupation for the occupied Palestinian terr itory
9
Besides creating this fertilizers also has a negative indirect impact on agricultural production by reducing the productivity of the land. For example, the 13:13:13 fertilizer is only composed of 39% of nutrient materials (nitrogen, phosphate and potash) and 61% of inert material, mainly salt, as opposed to the 20:20:20 fertilizer which has only 40% of inert materials. In addition as explained above farmers need to use the 13:13:13 fertilizer more intensely per dunum of cultivated land due to its lower concentration of nutrient elements. These factors result in a much higher injection of inert materials into the soil than it would be the case with the use of the 20:20:20 fertilizer, thus increasing substantially soil salinity, which generates the deterioration of the soil and reduce its productivity. Similarly, the plants require potassium nutrients for their growth especially during the fruiting stage, as this improves the quality of the fruits and ensures longer life-‐shelf. This is usually compensated by the addition of potassium fertilizers to the soil. As potassium nitrate is banned by the GoI (only for Palestinians but not for the settlers cultivating fields in the Jordan Valley), the alternative for Palestinian farmers is to use potassium sulphate, whose price per kilogram is higher. The plants require also nitrogen nutrient for their growth especially during the early stages of their life. This is usually provided by adding nitrogen fertilizers to the soil. As urea (which contains 46% of nitrogen) is banned by the GoI (again only for Palestinians but not for the settlers), the Palestinian farmers have to use ammoniac fertilizers which has a lower concentration of nitrogen (21%). Therefore farmers have to use higher quantities of fertilizers to get the required nitrogen nutrient than in the case of urea. In addition to being more expensive, using ammoniac fertilizers also adds more inert material to the soil than using urea; this having negative effects on land productivity. Estimates of the loss in popposed to the recommended ones which are banned, suggest a range of values between 20% and one third. This range comes from the experience of ARIJ working with farmers in the Jordan Valley and from a USAID project quoted by the TFP work on dual use items (MoNE, 2010). The former have seen the per dunum production of their land lowering by 20-‐25% in the last seven years, a period in which the only change to their production inputs was the use of the 13:13:13 fertilizer instead of the 20:20:20, which was banned by GoI seven years ago. This may well represent a lower bound estimate compared to the results of a USAID project through which exceptions were made on the import of fertilizers. Farmers involved in the project (mainly located in the Jordan Valley as well) were allowed to use the suitable fertilizers, as opposed to the other farmers, and saw their yield grow by up to one third relative to the previous season. Keeping to our line of providing conservative estimates, we then use the lower bound estimate (20%) to measure the reduction in productivity of the land in the oPt due to the use of the inappropriate types of fertilizers, which are the only ones allowed by Israel. This loss of 20% is calculated on the value added by agricultural production from vegetable crops and fruit trees (thus excluding field crops, for which fertilizers are not used intensively). This amounted to USD 566.8 million in 2008, the latest year for which such data is available (PCBS, 2009b), therefore the indirect loss from dual use item restrictions in agriculture is USD 113.4 million. Adding the direct costs computed above (i.e. USD 28.6 million) agriculture of USD 142 million.
3b. Costs of exports and imports As described above, Israel also imposes particularly burdensome procedures on Palestinian imports and exports mostly in the name of security. These procedures directly raise the costs of trading for

10
Palestinian businesses. The World Bank (2010a) estimates the various costs and times of trading faced by Israeli and Palestinian businesses to import and export in 2010 (Table 3.2). The costs are calculated for a dry cargo, 20-‐foot, full container load. For exporting goods, procedures range from packing the goods at the warehouse to their departure from the port of exit. For importing goods,
warehouse. The difference measured by the World Bank (2010a) is considerable with Palestinian imports and exports being subject to twice the costs of Israeli imports and exports. The time difference is even more significant, with importing procedures taking on average as much as four times longer for Palestinians than for Israelis (40 days vs. 10 days). Djankov et al. (2010) show how in the case of
We will use their estimations to capture some of the indirect costs for businesses from these trading restrictions. As both Israeli and Palestinian businesses use the same port facilities in Israel, the difference in cost should be entirely attributable to the extra restrictions imposed only on Palestinian goods, with the
hich is
The cost and time difference for this item is likely too high to be justified only on the basis of the different distance.6 However, in order to provide conservative estimates in line with the rest of the study, we exclude this item in the total computation of the cost difference. Table 3.2: Trading costs for Israel vs. West Bank and Gaza
Exports Imports
Israel West Bank and
Gaza Israel West Bank and
Gaza
Duration (days)
US$ Cost
Duration (days)
US$ Cost
Duration (days)
US$ Cost
Duration (days)
US$ Cost
Documents preparation 4 110 10 310 4 120 17 350 Customs clearance and technical control 1 110
6 300 1 60
12 50
Ports and terminal handling 3 250 3 250 3 250 7 400
Inland transportation and handling 3 200
4 450 2 175
4 425
Total 11 670 23 1310 10 605 40 1225 Source: World Bank (2010a)
6 in fact there are Israeli imposed restrictions (such as the back-‐to-‐back transportation system imposed to goods transiting between WB&G and Israel) which probably accounts for such a difference.
The economic costs of the Israeli occupation for the occupied Palestinian terr itory
11
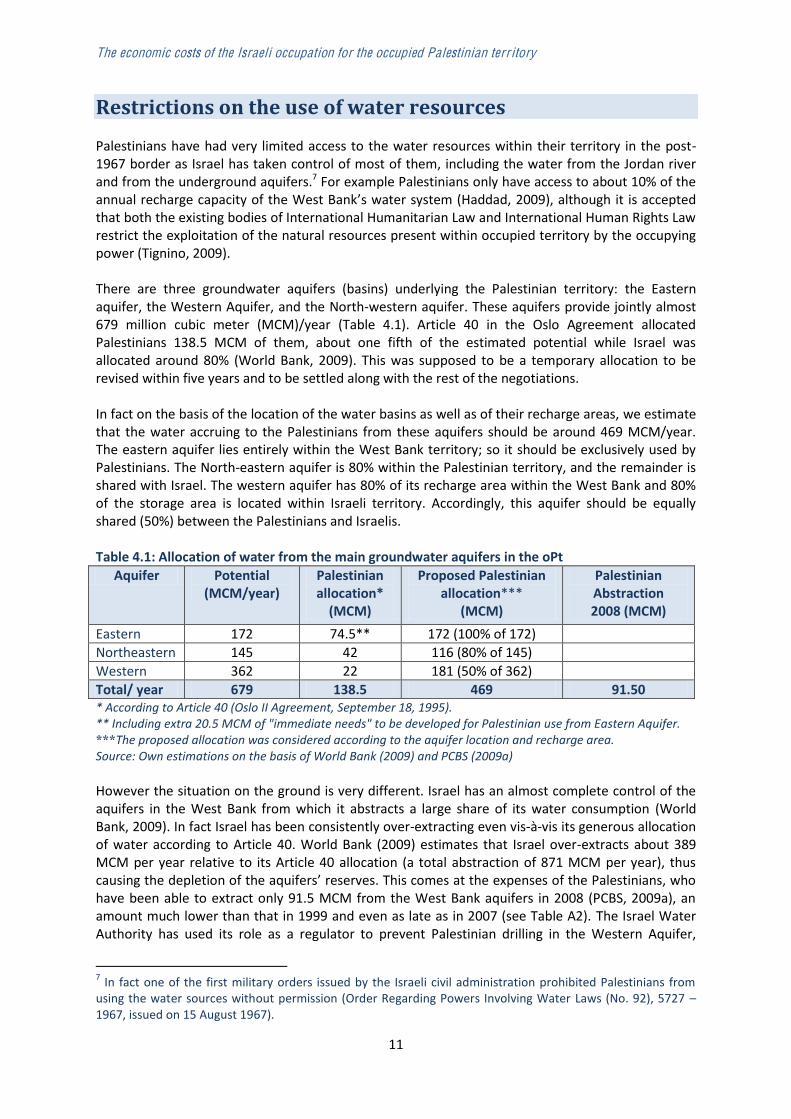
Restrictions on the use of water resources Palestinians have had very limited access to the water resources within their territory in the post-‐1967 border as Israel has taken control of most of them, including the water from the Jordan river and from the underground aquifers.7 For example Palestinians only have access to about 10% of the annual recharge capacity of the West Bank water system (Haddad, 2009), although it is accepted that both the existing bodies of International Humanitarian Law and International Human Rights Law restrict the exploitation of the natural resources present within occupied territory by the occupying power (Tignino, 2009). There are three groundwater aquifers (basins) underlying the Palestinian territory: the Eastern aquifer, the Western Aquifer, and the North-‐western aquifer. These aquifers provide jointly almost 679 million cubic meter (MCM)/year (Table 4.1). Article 40 in the Oslo Agreement allocated Palestinians 138.5 MCM of them, about one fifth of the estimated potential while Israel was allocated around 80% (World Bank, 2009). This was supposed to be a temporary allocation to be revised within five years and to be settled along with the rest of the negotiations. In fact on the basis of the location of the water basins as well as of their recharge areas, we estimate that the water accruing to the Palestinians from these aquifers should be around 469 MCM/year. The eastern aquifer lies entirely within the West Bank territory; so it should be exclusively used by Palestinians. The North-‐eastern aquifer is 80% within the Palestinian territory, and the remainder is shared with Israel. The western aquifer has 80% of its recharge area within the West Bank and 80% of the storage area is located within Israeli territory. Accordingly, this aquifer should be equally shared (50%) between the Palestinians and Israelis. Table 4.1: Allocation of water from the main groundwater aquifers in the oPt
Aquifer Potential (MCM/year)
Palestinian allocation* (MCM)
Proposed Palestinian allocation***
(MCM)
Palestinian Abstraction 2008 (MCM)
Eastern 172 74.5** 172 (100% of 172) Northeastern 145 42 116 (80% of 145) Western 362 22 181 (50% of 362) Total/ year 679 138.5 469 91.50 * According to Article 40 (Oslo II Agreement, September 18, 1995). ** Including extra 20.5 MCM of "immediate needs" to be developed for Palestinian use from Eastern Aquifer.
The proposed allocation was considered according to the aquifer location and recharge area. Source: Own estimations on the basis of World Bank (2009) and PCBS (2009a) However the situation on the ground is very different. Israel has an almost complete control of the aquifers in the West Bank from which it abstracts a large share of its water consumption (World Bank, 2009). In fact Israel has been consistently over-‐extracting even vis-‐à-‐vis its generous allocation of water according to Article 40. World Bank (2009) estimates that Israel over-‐extracts about 389 MCM per year relative to its Article 40 allocation (a total abstraction of 871 MCM per year), thus causing the depletiohave been able to extract only 91.5 MCM from the West Bank aquifers in 2008 (PCBS, 2009a), an amount much lower than that in 1999 and even as late as in 2007 (see Table A2). The Israel Water Authority has used its role as a regulator to prevent Palestinian drilling in the Western Aquifer,
7 In fact one of the first military orders issued by the Israeli civil administration prohibited Palestinians from using the water sources without permission (Order Regarding Powers Involving Water Laws (No. 92), 5727 1967, issued on 15 August 1967).

12
despite growing demand from Palestinian towns. Although recharge is almost all in the West Bank, Israel exploits the highly productive Western Aquifer from within Israel, and has denied PA requests to allow more wells to meet growing urban demand or potential irrigation and industrial demands in the West Bank (World Bank, 2009) the water that it has tapped from the Western Aquifer. Since the beginning of the occupation, Israel has developed wells in the West Bank (largely in the Jordan Valley) and a network serving settlements that is linked into the Israeli national network. The settlements are consuming about 44 MCM of water extracted from wells within the West Bank (World Bank, 2009). Half of Palestinian wells have dried up over the last twenty years and effects are particularly severe for the generally more vulnerable population groups living in Area C. PCBS (2009a) reported that in 2008, 325 Palestinian wells were operational in the West Bank, compared to 774 wells in 1967. Area C is the area where Palestinians should have access to most water sources in the West Bank. However any Palestinian attempt to access new water sources or to connect new areas is inevitably curbed by the restrictions imposed by Israel in Area C. Current project approval rules require a second approval by the Civil Administration if projects touch on Area C, which is the case for almost all wells, water conveyance and wastewater treatment and reuse infrastructure (World Bank, 2009). A number of projects have been approved by the Joint Water Committee, for which detailed planning permission has then not been granted by the Israeli Civil Administration. As a consequence of these policies by 2007 the Palestinian population had access to only about one quarter of the ration of their Israeli counterparts: West Bank Palestinians had about 123 litre per capita per day (lpcd) a number which has since further declined -‐ and Israelis about 544 lpcd (World Bank, 2009). The Jordan River is an example of an even more inequitable allocation of water resources. Presently, Israel uses approximately 58.7% of the waters of the Jordan River; Jordan uses 23.4%; Syria 11% and Lebanon 0.3% (McHugh, 2009). Palestinians, in contrast, are allocated none. In a situation without occupation, clearly Palestine would have access to part of the water from the river as one of the countries through which the river flows. As argued by Glover and Hunter (2010) the most equitable means of reallocating Jordan water would be on a per capita basis, so that each riparian would receive a share of water proportionate to its population size. This view is also supported by Phillips et al (2005) who argue that there is a legal precedent for this option. According to the current estimated allocation, Israel is using approximately 769.56 MCM of Jordan water annually. Taking the 2008 population levels of Israel, the West Bank and Gaza, Glover and Hunter (2010) estimate that an equitable per capita distribution cation of Jordan water would be 268 MCM for the Palestinians, and 501 MCM for Israelis. The 268 MCM figure for Palestinians is also very close to the allocation according to the Johnston plan, which the literature estimates to be around 257
Table 4.2: Water supply in West Bank and Gaza (2008) Water supply for agriculture (MCM) Wells Springs Total West Bank 30.1 12.8 43.0 Gaza 75.3 0.0 75.3 Total 105.4 12.8 118.2 Water supply for municipal sector (MCM) Wells Spring Mekorot Total West Bank 36.1 12.4 48.0 96.5 Gaza 84.2 4.8 89.0 Total 120.3 12.4 52.8 185.5
Source: PCBS (2009a)

The economic costs of the Israeli occupation for the occupied Palestinian terr itory
13
Israeli restrictions on access to water limit the amount of water that Palestinians can use; especially in the West Bank. Aside from the 91.5 MCM abstracted from the Aquifers, Palestinians in West Bank areas are forced to buy around half of the domestic water consumed 48 MCM -‐ from the Israeli Water Company Mekorot (Table 4.2). Considering that in Gaza the renewable safe yield of the Aquifer has been estimated to be 124 MCM/yr (Vengosh et al., 2004)8, the total allocation of water for Palestine in a situation without occupation should be around 861 MCM. These are still conservative estimates relative to others. For example according to Haddad (2009) if the Palestinian population had the right to exploit all the water resources of the Palestinian Territories, water availability would be approximately 275 CM/Capita/yr, or between 1,000 and 1,100 MCM of water available per year. Even considering the lower bound estimate of 861 MCM of water potentially available for the Palestinians, the following section will show the huge economic costs imposed by the occupation through restricted access to water. The restricted access to water resources generates two types of losses for the Palestinian economy: direct and indirect losses, in terms of higher costs for the water consumed and foregone agricultural production along with health problems due to poor water quality, respectively. 4a. Direct costs of water losses The direct costs of water access restrictions are measured by the difference between the cost currently paid by Palestinians for their water consumption and the cost that they would face if they were able to freely access their water resources. This difference should be zero for the 91.5 MCM currently extracted by Palestinians from West Bank aquifers (i.e. Palestinians would still be extracting that amount at the same cost). But the extra costs are likely to be positive in the case of the water purchased from Mekorot. This water is sold to the Palestinian households at around 0.71 USD/m3 (PCBS,2009c), which is likely to be higher than the cost at which the Palestinians are currently able to extract and distribute the same amount of water in a situation without Israeli restrictions. However it is difficult to estimate what the exact costs of abstraction would be without restrictions, as the cost of abstraction varies greatly across Palestine. This is especially so in the West Bank, due to the different depth of the wells. In areas like Tulkarem where the wells are only 60-‐70 meters deep, abstraction costs NIS 0.5 (USD 0.15) per m3.9 In other areas in central West Bank, where wells are much deeper, the cost could reach up to NIS 2 (USD 0.60) per m3.10 In 2009 the water purchased from Mekorot amounted to 53.5 MCM for a total cost paid by Palestinians of almost USD 38 million (PCBS,2009c). This is likely to be a more expensive solution than if Palestinians had free access to their water resources but the computation of the cost differential would require information on the depth of the wells across the West Bank which is not available to us. 4b. Indirect agricultural costs due to water restrictions In as much as the direct costs of access to water for the Palestinians are likely to be non-‐ negligible the largest costs from water restrictions in the oPt are due to the value of production foregone due to the occupation induced water shortages. The restrictions to water (also land) access as well as the physical interventions on the land in Area C, have constrained the development of irrigated agriculture in oPt. Only a small part (14%) of the
8 However note that Gaza over-‐extracts from the Aquifer with a total extraction of around 160 MCM per year (PCBS, 2009b). 9 Based on personal communications from the Palestinian Water Authority. 10 Based on personal communications from the Palestinian Water Authority.

14
cultivated land is irrigated in oPt, and this restriction is particularly severe in the West Bank, where only 9% of the agricultural land or 148,153 dunum -‐ is irrigated (PCBS, 2009b). Quoting data from UN OCHA oPt roadblocks that impeded vehicular access for limited numbers of farmers to agricultural land in Area C, no improvement was observed regarding access to much larger agricultural areas World Bank, 2010, p. 14). This problem is compounded by the restrictions imposed on the development of mechanised irrigation systems or greenhouses for Palestinians in area C agricultural lands. The small share of irrigated agriculture is a major constraint on the performance of the agricultural sector and its impact on economic development in the oPt. According to land surveys and data from the Ministry of Agriculture in 2007, if sufficient water was made available, the total potentially irrigable area in the Palestinian territories would be 745,000 dunum (Glover and Hunter, 2010). This amounts to approximately 920,796 dunum of cropping area, if using the average conversion factor for the oPt.11 Relative to the current irrigated cropping area of 263,566 dunum (PCBS, 2009b), this would represent an additional 657,230 dunum of cropping land area that could be put under irrigation if enough water were available and the other Israeli restrictions were lifted. Glover and Hunter (2010) estimate the expansion in water use in agriculture needed to irrigate all the irrigable land in the Palestinian territories. In particular they compute the weighted average water requirement for an irrigated dunum of land on the basis of the current cropping pattern.12 These calculations show that the average irrigated water requirement per dunum, per year, is 579 CM. (see Appendix 2 for further details on the methodology). As Glover and Hunter (2010) note, this figure should be viewed as an upper limit of the water that could be reasonably expected to be needed. On the basis of this figure, we can compute the total water needed to put all irrigable land in West Bank and Gaza under irrigation; this, totalling 490 MCM per year (i.e. an additional 381 MCM relative to the current water supply). This water requirement along with those estimated for domestic and industrial usage generates a total water need of around 712 MCM per year (see Table 4.3). As explained above this quantity should be available to Palestinians if they had free access to their water resources and equitable access to those in common with Israel. This means that without occupation Palestinians would have been able to irrigate all of the irrigable land within their territory. How much additional value would that generate? In order to estimate the potential value of production on the additional land irrigated we compute the average productivity per dunum of irrigated and rain-‐fed land in oPt. We weigh each crop by its importance in terms of production value (based on PCBS, 2009b) so as to reflect current cropping patterns. Appendix 2 provides the production values and cropping areas for the different crops cultivated in WB&G on irrigated and rain-‐fed land. These are split into the three major categories of crops, fruit trees, field crops and vegetables (which have the highest productivity per dunum also as most of their cultivation is on irrigated land). By dividing the value of production by the cropping area for irrigated land we obtain the productivity per dunum of irrigated land and then we added these values across all the varieties on the basis of the contribution of each variety to the total value of production on irrigated land. We then apply the same procedure for the rain-‐fed cultivations. Our estimation indicates that the
11 The cropping area is equal to the actual cultivated area times the number of harvests in the year in that cultivated area. For instance if a specific crop is harvested twice a year, then the cropping area for that crop would be double the actual cultivated land. Given the current cropping pattern, cropping area in Palestine is estimated to be 1.24 times the actual cultivated area (Ministry of Agriculture). 12 This approach is similar to that used in Jayyousi and Srouji (2009), but provides a more accurate assessment of the average water requirement for irrigated land in Palestine. Rather than averaging the water need for all irrigated crops farmed in Palestine, this study weights their contribution to overall agricultural production therefore providing a fair reflection of water use under current cropping patterns.

The economic costs of the Israeli occupation for the occupied Palestinian terr itory
15
average value of production on irrigated land is USD 2,344, with USD 1,829 of gross value added; against USD 157 on rain-‐fed land with USD 123 of gross value added, i.e. irrigated land is almost 15 times more productive than rain-‐fed land. This difference already suggests the potential for agricultural expansion from an increase in the share of irrigated area. Table 4.3: Estimated water needs for West Bank and Gaza (with irrigation of all irrigable land) Sector Water need (MCM) Municipal 184.1 Industrial 29.5 Agriculture 498.9 Total 712.5
On the basis of these figures, the production resulting from the additional irrigated areas (net of the rain-‐fed production lost to the irrigated production) is USD 1.44 billion, with a gross value added of USD 1.12 billion.13 As explained in section 2, the land in the oPt has become at least 20% less productive due to the use of inappropriate fertilizers by Palestinian farmers following the Israeli banning of certain fertilizers in the oPt. We add this 20% to the figures above (again except for field crops for which fertilizers are much less used) in order to get a complete estimate of the losses from the foregone agricultural expansion due to the occupation. This yields a total value of foregone agricultural production of USD 1.67 billion; with a gross value added of USD 1.30 billion. Other than this irrigation led agricultural expansion, a situation without occupation would allow the development of a specific additional high value-‐added cultivation on 50,000 dunum in the Jordan Valley (Gal et al., 2010). This possibility is feasible considering the value productivity of flower and vegetable land areas in Gaza prior to the disengagement and the huge demand for quality vegetables and flowers especially in the Gulf Cooperation Council (GCC) markets. Gal et al. (2010) estimate that it would be possible to develop an export-‐oriented high-‐value vegetable, flower, and herb industry valued at around US$1 billion per year on around 50,000 dunum in the Jordan Valley (see Box 1 for the explanation of the assumptions behind this estimation). Considering that such production is likely to be more intermediate input intensive (e.g. material for the green-‐houses) than the average agricultural production, we conservatively estimate that the gross value added from it would be 15% lower than in the case of normal agriculture, i.e. around USD 663 million; or 9% of Palestinian GDP. Of course the pre-‐conditions for such a development would be to have access to water and unrestricted access to the Jordan Valley, both of which are currently unfulfilled due to the Israeli restrictions. If 50,000 dunum of cultivation in the Jordan Valley were devoted to high value added agriculture, this would mean a reduction of 50,000 dunum of irrigated land, which would slightly reduce the additional production and value added from the irrigation expansion. In particular, additional production in oPt from irrigation expansion (excluding the Jordan Valley development) would be USD 1.55 billion with gross value added of USD 1.22 billion, or 15% of Palestinian GDP.
13 Of this production expansion almost everything, i.e. around USD 1.39 billion, is going to occur in the West Bank, and according to our estimates over three quarter of this West Bank additional production would occur in area C. This is for two reasons. First it reflects the fact that 62.9% of all agricultural land in Palestine is in area C (Isaac and Hrimat, 2007). Second, it is likely that the current irrigation pattern has been neglecting Area C due to the restrictions imposed by Israel.

16
Box 1: A USD 1 billion agro-‐industry on 50,000 dunum in the Jordan Valley Gal et al. (2010) estimate a potential USD 1 billion-‐worth agricultural production in the Jordan Valley through an examination of a series of evidence. Firstly, they note that the cumulative plant exports of Israeli Gaza-‐Strip settlements alone, prior to the 2005 disengagement, was estimated at around USD 100 million (produced on around 10,000 dunum of greenhouses), and the export revenue of Gazan flower growers, produced on around 1,000 dunum, was around USD 10 million. Secondly, they estimate that the huge demand for quality vegetables and flowers in the GCC markets, and in
-‐value vegetable and flower exports at least ten-‐times higher than was produced in pre 2005 Gaza, i.e. some USD one-‐billion inthey argue, the GCC countries are key markets in this respect given the free access of Palestine (as a member to GAFTA) to them, and their huge size boosted by their role as international marketplace for flowers and other agricultural products as well. In addition the quality-‐edge gained by the close access to Israeli growing technologies, would endow Palestinian growers important comparative advantage in these markets. Third, based on growing technologies that were used in Gaza, this supply of high value added agricultural products would require a total growing area of around 100,000 dunum, most of it in the Jordan valley.14 However, new highly-‐intensive soil-‐less growing technologies, which have been developed in Israel (and in some other places) in recent years, enable growers to enhance productivity up to five to ten times (per dunum of greenhouses), compared to the productivity of pre-‐2005 Gaza. Therefore an appropriate mix of such new technologies, with "old" greenhouse growing technologies and some open-‐field crops, would enable to develop a USD one-‐billion per year export-‐oriented high-‐value vegetable, flower, and herb industry, on around 50,000 dunum in the Jordan Valley. Source: Gal et al. (2010) To summarise, if enough water were available to the Palestinians, as according to an equitable distribution of the water resources based on principles of geographic location and fairness, and if the restrictions in Area C were lifted, the Palestinian agricultural sector could drastically expand its production. This would occur mainly by irrigating all the suitable agricultural land and by developing high value-‐added agricultural products in the Jordan Valley. The potential additional value of production derived from such expansion would be considerable. In value added terms, this would translate into a total USD 1.88 billion, or almost a quarter of Palestinian GDP. This confirms the huge potential of the agricultural sector in Palestine, which in the context of a sovereign state, would be the cornerstone of Palestinian agricultural development. Although these numbers are important relative to the size of the Palestinian economy, they appear to be conservative estimates vis-‐à-‐vis what other authors have suggested (Glover & Hunter, 2010). It has been estimated that the economic potential of the sector could reach USD 4.59 billion; and projections suggest that if export demand was unlimited and no restrictions or tariffs were placed upon export volumes, net profits could rise as high as USD 5.93 billion (Nasser, 2003). 4c. Indirect cost due to water restrictions: health costs The quality of the water is poor in various parts of oPt, especially in smaller communities unconnected to the network, and for people living in Area C. In these areas the health impacts of poor water quality are particularly harsh with a high incidence of water related diseases (World Bank, 2009). Water-‐borne disease is a major problem for Palestinians, creating substantial costs and losses. 14 The Jordan Valley has a similar potential inherent agricultural productivity as the Gaza area.

The economic costs of the Israeli occupation for the occupied Palestinian terr itory
17
The poor quality of water in these communities is caused by their lack of connection to the network and their reliance on water tanker due to Israeli imposed restrictions. As reported by WaSH (2004) in November 2002, the community of Jurish in Nablus district were using about 30 lpcd of poor quality tanker water. The cost was high at 15 NIS/m3, a cost driven up by the impact of checkpoints and curfew during the trip of about 3 km from the well. In the community of 1,500, there were 300 cases of amoeba infection at the time, due to the poor quality source and sewage flow and cess pits near to their cisterns. As noted by the World Bank (2009) the health impacts can be gauged by the high incidence of diarrhoea amongst infants. The 2006 PAPFAM survey found that 12% of children under 5 had suffered from diarrhoea in the two weeks preceding the survey. Diarrheal conditions are strongly associated with water quality, hygiene and sanitation. Some 54% of these cases had necessitated a medical consultation. Extrapolating from the nature and cost of the medical treatments involved and without accounting for the losses of adult productivity, it has been estimated that the annual cost of the health impacts of poor water and sanitation on children 5-‐year old or less, is USD 20 million (World Bank, 2009 on the basis of Glover and Hunter, 2010).
18
4. Potential revenues from Israeli controlled natural resources in the oPt GOI directly controls and\or impedes the exploitation of a huge amount of resources in the West Bank, typically located in Area C; over which Palestinians do not have any security or civilian control. This section estimates the foregone revenues from the exploitation of the main such resources for Palestinians, due to Israeli restrictions. In particular the estimation of this section concerns the following Palestinian foregone revenues:
a. The extraction of Salts and minerals in the Dead Sea b. The exploitation of the mining and quarries controlled by Israel c. The development of the Gaza offshore gas field
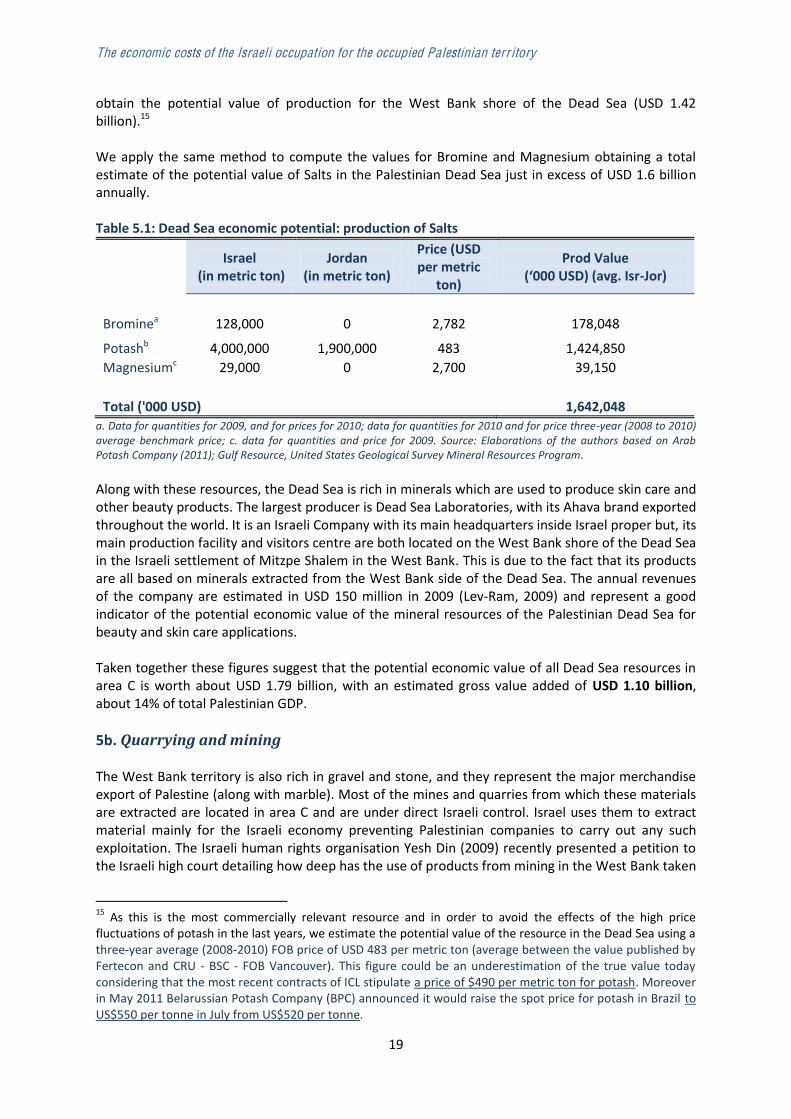
5a. Dead Sea Salts and minerals The Dead Sea is extremely rich in Salts and minerals, but only some of them have a particularly high commercial value and have been extracted in large quantities by both Israeli and Jordanian companies for many decades. The Dead Sea lies between the West Bank, Jordan and Israel but the West Bank side is entirely lying within area C. Access to the Dead Sea is completely sealed off for Palestinians as far as economic activities are concerned. For the Palestinian economy this represents a loss proportional to the potential economic value from the exploitation of these resources. In particular, three types of Salts make up most of the Dead Sea economic resources: Potash (which is mainly used to produce agricultural fertilizer), Bromine (flame retardant, pesticide and some other minor applications such as gasoline additive, medical and veterinary) and Magnesium (industrial applications, such as de-‐icing roads and used in textile and cosmetics industries). The Dead Sea is a vast (practically inexhaustible) and highly concentrated source of reserves of Potash, Bromine, Magnesium and Salt. Israeli Chemicals Ltd (ICL), a chemical Israeli multinational, is the largest company extracting these resources in the Dead Sea (in the southern basin). According to the company (ICL, 2011), the cost of production of Potash and Bromine from the Dead Sea is relatively lower than the cost faced by other producers in the world. A significant part of ICL operational advantages in the international markets derive from the characteristics of the Dead Sea, particularly its high concentration of minerals and the relatively low cost of their production compared -‐ for example -‐ with mining Potash from underground deposits or extracting Bromine from less concentrated sources. Moreover the hot and dry climate of the Dead Sea allows the storage of large quantities of Potash in open areas at particularly low cost. These appealing characteristics would make the development of a chemical industry in the Palestinian Dead Sea potentially viable if Israeli restrictions were lifted. In order to estimate the potential economic value of these resources, we took the recent annual production of the three main Salts -‐ Potash, Bromine and Magnesium -‐ by Israel and Jordan and evaluated it at international prices. The extraction of these Salts in Israel and Jordan is almost entirely concentrated in the Dead Sea. Potash is by far the most valuable Salt in the Dead Sea and both Israel (through ICL) and Jordan (through Arab Potash Company) are large producers by international standards. In 2010 Israel extracted around 4 million metric tons of Potash from the Dead Sea for an approximate value of almost USD 1.5 billion, while Jordan extracted almost half of that amount (Table 5.1). Applying an average between the two Israeli and the Jordanian figure we
The economic costs of the Israeli occupation for the occupied Palestinian terr itory
19
obtain the potential value of production for the West Bank shore of the Dead Sea (USD 1.42 billion).15 We apply the same method to compute the values for Bromine and Magnesium obtaining a total estimate of the potential value of Salts in the Palestinian Dead Sea just in excess of USD 1.6 billion annually. Table 5.1: Dead Sea economic potential: production of Salts
Israel (in metric ton)
Jordan (in metric ton)
Price (USD per metric
ton)
Prod Value -‐Jor)
Brominea 128,000 0 2,782 178,048
Potashb 4,000,000 1,900,000 483 1,424,850 Magnesiumc 29,000 0 2,700 39,150 Total ('000 USD) 1,642,048
a. Data for quantities for 2009, and for prices for 2010; data for quantities for 2010 and for price three-‐year (2008 to 2010) average benchmark price; c. data for quantities and price for 2009. Source: Elaborations of the authors based on Arab Potash Company (2011); Gulf Resource, United States Geological Survey Mineral Resources Program. Along with these resources, the Dead Sea is rich in minerals which are used to produce skin care and other beauty products. The largest producer is Dead Sea Laboratories, with its Ahava brand exported throughout the world. It is an Israeli Company with its main headquarters inside Israel proper but, its main production facility and visitors centre are both located on the West Bank shore of the Dead Sea in the Israeli settlement of Mitzpe Shalem in the West Bank. This is due to the fact that its products are all based on minerals extracted from the West Bank side of the Dead Sea. The annual revenues of the company are estimated in USD 150 million in 2009 (Lev-‐Ram, 2009) and represent a good indicator of the potential economic value of the mineral resources of the Palestinian Dead Sea for beauty and skin care applications. Taken together these figures suggest that the potential economic value of all Dead Sea resources in area C is worth about USD 1.79 billion, with an estimated gross value added of USD 1.10 billion, about 14% of total Palestinian GDP. 5b. Quarrying and mining The West Bank territory is also rich in gravel and stone, and they represent the major merchandise export of Palestine (along with marble). Most of the mines and quarries from which these materials are extracted are located in area C and are under direct Israeli control. Israel uses them to extract material mainly for the Israeli economy preventing Palestinian companies to carry out any such exploitation. The Israeli human rights organisation Yesh Din (2009) recently presented a petition to the Israeli high court detailing how deep has the use of products from mining in the West Bank taken
15 As this is the most commercially relevant resource and in order to avoid the effects of the high price fluctuations of potash in the last years, we estimate the potential value of the resource in the Dead Sea using a three-‐year average (2008-‐2010) FOB price of USD 483 per metric ton (average between the value published by Fertecon and CRU -‐ BSC -‐ FOB Vancouver). This figure could be an underestimation of the true value today considering that the most recent contracts of ICL stipulate a price of $490 per metric ton for potash. Moreover in May 2011 Belarussian Potash Company (BPC) announced it would raise the spot price for potash in Brazil to US$550 per tonne in July from US$520 per tonne.

20
root in the Israeli economy. It uses a document by the Israeli Ministry of Interior's Planning Administration (GOI, 2008) which recently analysed the future reserves of mines in the West Bank from which raw materials for roads and construction can be produced. According to the document the quarries in Area C produce the largest amount of mining and quarrying material for Israel, mainly gravel. Most of the mines and quarries are owned by Israeli companies and operate under the permits and supervision of the legal authorities in the Civil Administration in Judea and Samaria. They mainly market the product in Israel (some 74% of the yield). GOI (2008) also notes quite explicitly th this trend will continue in the future as well. The Israeli Civil Administration's staff officer for trade, industry and mining estimates that the annual gravel yield in the West Bank amount to some 12 million tons a year. According to interviews carried out by ARIJ with experts in the field, an estimated one third of production is used for construction stones, whilst the rest is used for producing gravel and other construction materials. Using these ratios it is possible to transform these amounts into quantities of construction stones, gravel and other construction material and estimate their annual economic value at ex factory market prices. For construction stones the estimated produced quantity in m3 is 12 million ton/2.75 m3/ton= 4363636.36 m3. 1 m3 produces about 15 m2 of construction material and the ex factory price of 1 m2 in the local market is around USD 35 (data collected from interviews with local suppliers), therefore 4,363,636.36 m3 x 1/3 = 1,440,000 m3 and Value of production is = 1,440,000 x 15 m2 x $35/m2 = USD 756,000,000. Assuming that the cost of one ton of building materials produced in these quarries is around USD 18; the potential value of production of building material is: Value of building material = 2/3 x 12million x USD 18= USD 144,000,000. Therefore the total potential value of production from mining and quarrying in the West Bank under Israeli control is around USD 900 million per year. Again, in order to make it comparable to the Palestinian GDP, this figure is converted into value added by using the gross output-‐value added conversion rate for the mining and quarrying industry in the West Bank, i.e. 64% (PCBS, 2010). The estimated foregone gross value added for the Palestinian economy from mining and quarrying is USD 575 million, or 7.1% of total Palestinian GDP. 5c. Restrictions on the development of the Gaza offshore gas field
The development of natural resources in Gaza is also constrained by Israel. In 1999 a consortium comprising British Gas Group, the Consolidated Contractors Company (CCC), and the Palestine Investment Fund (PIF) was granted exclusive oil and gas exploration rights off the Gaza coast in an agreement signed with the PA (PIF, 2011). In 2000, the consortium discovered over 30 billion cubic meters of natural gas in two Palestinian offshore gas field. These are the Gaza Marine, which is the larger field and is located entirely in Palestinian territorial waters, containing an estimated 28 billion cubic meters of gas; and the Border Field, which is an extension of the Israeli Noa Field, partially located in Israeli territorial waters. The volume of gas in Border Field is estimated at around 3.5 billion cubic meters (PIF, 2011). At 2010 prices, the value of the natural gas discovered in both fields is estimated at over USD 6.5 billion (PIF, 2011). To date, the consortium has invested around $100 million in the venture but the total volume of investment in the project is expected to reach $800 million (PIF, 2011). However,

The economic costs of the Israeli occupation for the occupied Palestinian terr itory
21
Israeli restrictions have so far impeded the development of the project including the extraction, sale and use of the gas. attempts to export Palestinian natural gas to international markets. Israel has refused to implement measures required to extend a pipeline to Al-‐Areesh in Egypt (PIF, 2011); a prerequisite to liquefying the gas and exporting it to international markets. Israel has also refused to provide the necessary clearances required by developers (PIF, 2011). In addition, negotiations to export gas to Israel have been unsuccessful to date, as the PA and developers are unwilling to sell gas at lower than fair market prices. The Palestinian Authority and developers continue to demand clear guarantees (so far unsuccessfully), backed by commercial contracts, that the Gaza power station will be supplied with natural gas on an uninterrupted basis in the event that Palestinian natural gas is exported to Israel. Guarantees are also being sought that gas revenues be transferred to the PA without hindrance. All these obstacles have prevented the Palestinian economy from realising the potential benefits of a project that could provide significant revenues to the PA and at the same time could help made Palestine self-‐sufficient in energy terms. Palestinian proceeds from the natural gas project will
net profits. The PA will receive royalties, tax revenues and PIF profit, which the consortium estimates to be around USD 2.4 billion throughout the 15-‐year lifespan of the project. This means an annual income of USD 160 million for the PA, which is currently foregone due to Israeli restrictions.
the diesel currently used at the Gaza Power Station with Palestinian natural gas, which will significantly reduce the cost of electricity production and restrict the volume of diesel imported from Israel, thereby increasing its economic independence from Israel. These gains in terms of energy production savings are estimated in the section below and would come about only once Israel lifted the restrictions to the development of the marine gas fields and the use of the gas to feed the power plant.

22
5. Electricity restrictions
The main constraints facing the development of the Palestinian energy sector are restrictions imposed by Israeli policies and actions. These constraints arise from: (i) Israeli control over parts of the West Bank (Area C) which can impose a serious challenge to constructing the power network in these areas in the event that Israeli cooperation and coordination is not forthcoming; (ii) Israeli control of Palestinian territorial borders, particularly in the West Bank, which can effectively deny or limit trade across international borders, including importation of electricity and petroleum products through physical interconnections; (iii) Israeli destruction of Palestinian power system facilities by military action, such as the June 2006 attack on the Gaza Power Plant that created a serious short-‐term crisis for power users in Gaza; (iv) Israeli related impediments to the Gaza marine gas field exploitation. As argued above, a situation free of Israeli restrictions would allow the West Bank and Gaza to produce all electricity needed by developing gas-‐fed power plants. The occupation has restricted the potential for electricity generation due to restrictions on the importation of spare parts, and technicians, as well as by not guaranteeing the import of gas needed to run the power plant. Without this guarantee there cannot be any viable investments in such plants. That is why, if Palestine had been a sovereign country, we assume that it would have been able to develop a gas-‐fed plant to generate the needed electricity. In addition, Palestinian power plants in both the West Bank and Gaza Strip could run with the natural gas from the Marine offshore in Gaza, which at present has not been developed mostly as a result of Israeli restrictions. Generating electricity in Palestinian power plants with Palestinian natural Gas would be much cheaper than importing diesel from Israel. In fact, PIF plans to expand the existing power plant in Palestine and establish new ones to create the economic scale needed to make the new strategy work (PIF, 2011). PIF and a number of Palestinian investors recently announced plans to establish a new power plant in the West Bank. A third power plant is also being considered in order to bring the total local electrical generation capacity to 1250 MW. This is expected to make Palestinian energy self-‐sufficient, thus saving the treasury hundreds of millions of dollars annually by eliminating the need to import electricity from Israel (PIF, 2011). We estimate below the direct costs of electricity that the Palestinian economy has to face due to Israeli occupation vis-‐à-‐vis the cost of unconstrained electricity production using resources from the Gaza marine Gas field. West Bank The West Bank needs almost 600 MW (World Bank, 2007) of electricity each year. It purchases almost all this electricity (580 MW) from the Israeli company while the rest (20 MW) comes from Jordan for the Jericho areas. For the purpose of the calculations, since we do not know the price of these 20 MW, and as this is a relatively insignificant amount, we will assume that the West Bank gets all of the 600 MW from Israel.16 According to the World Bank (2007), the cost of producing and transferring a kilowatt of medium voltage for Palestinians through a natural gas-‐fed power plant would be NIS 0.126. But Palestine buys it from Israel for 0.33 NIS per KW. Based on these figures we can calculate the extra cost that the Israeli occupation imposes on the Palestinian economy through higher energy prices:
16 We assume that all of the 600 MW medium voltage electricity, although a very minor quantity of it comes through the more expensive low voltage.

The economic costs of the Israeli occupation for the occupied Palestinian terr itory
23
Cost of buying electricity from Israel: 600MW x 1000 x 8,760 hr x 0.33 NIS/KW= 1,734,480,000 NIS
If Palestinians were able to produce electricity for the West Bank from their own power plants using its own natural gas Natural Gas, the cost would be:
600 MW x 1000 x 8,760 hr x 0.126 per kilowatt= 662,256,000 NIS The difference between those two numbers represents the extra cost that the economy of the West Bank is paying due to occupation measures:
1,734,480,000 -‐ 662,256,000 =1,072,224,000 NIS
Gaza Strip There are three major entities that provide electricity in the Gaza Strip: the Palestine Electric Company (PEC) which owns the power station there, the Israel Electric Corporation (IEC), and the Gaza Electricity Distribution Company, which also buys electricity from Egypt. The power plant has a capacity of 140 MW. It used to run on full capacity between 2004 and June 2006 before Israel bombed Not long after, the Gaza Blockade started. Since the 2006 bombing, the plant has never come close to reaching full capacity. Given that Israel refuses to allow natural gas into Gaza, the plant has faced serious challenges in sustaining its operations, so much so, that the plant now runs on fuel that is more expensive and less efficient. On its most efficiently running days,, the plant utilizes3 of 6 turbines, and produces between 50 MW-‐70 MW. In addition to those 50-‐70MW, Gaza receives 120 MW from the IEC at the same price that the West Bank gets electricity i.e. 0.33 NIS per kilowatt. Also, since September 2007 the Rafah Governorate gets 17 MW directly from Egypt at a price for which we have no information. This makes the total amount of electricity available to Gaza 197 MW. This results into two types of costs for the Gaza Economy: the difference between the cost of buying this electricity from Israel and Egypt and the cost of producing the electricity through the Gaza power plant fed by fuel (whose import is also controlled by Israel) on the one hand, and the difference between the cost of generating electricity through the Gaza power plant fed by fuel and the cost of generating electricity through the Gaza power plant fed by natural gas on the other hand. This cost can be calculated as follows:
Cost of producing electricity through the power plant and run it using Palestinian natural gas= 180 x 1,000 x 8760 x 0.126= 198,676,800 NIS17
Total cost of electricity for Gaza at present:
a. electricity produced in Gaza= 70 x 1,000 x 8,760 x 0.506 = 310,279,200 NIS b. electricity purchased from Israel= 120 x 1,000 x 8,760 x 0.33 = 346,896,000 NIS
a+b = NIS 657,175,200
17 180 MW is the total amount of electricity available in Gaza in 2010 excluding the 17MW Gaza gets from Egypt, for which we do not know the price.

24
Total extra costs of electricity for Gaza: 657,175,200 -‐ 198,676,800 = 458,498,400 NIS
Extra cost because of the occupation (difference between the present costs and the costs of producing the same amount of energy in a situation free of occupation) =
1,072,224,000 + 458,498,400 = 1,530,722,400 NIS
This total amount is equivalent to USD 441 million per year.

The economic costs of the Israeli occupation for the occupied Palestinian terr itory
25
6. Obstacles to domestic movement of goods and labour The movement of goods and people within the West Bank has been heavily restricted by Israel for over a decade through a system of check-‐points, road-‐blocks and other barriers. The restrictions slow down vehicle traffic and often force traffic to take the least direct route to a particular location, such as in the case of the Bethlehem-‐Ramallah route, which cannot go through East Jerusalem. These barriers have been officially established by Israelis for security reasons. This system, however is maintained by Israel regardless of the level of violence in the oPt, has sadly become a permanent landmark of the Israeli occupation. In fact, this system is largely in place, even now (2011) when there has been no reported attack on Israelis by Palestinians in the West Bank for some time (UN OCHA, 2011). These Israeli restrictions are among the most critical constraints on competitiveness, international investment, and economic development in the West Bank. They result in huge transfer delays and higher transaction costs that affect the productivity of the public and private sector alike. In order to estimate these costs we have identified four major routes where restrictions imposed by the Israelis are likely to affect major traffic flows in the West Bank. These routes are:
Bethlehem-‐ Ramallah: the most direct route to Ramallah is through Jerusalem passing through Qalandia checkpoint, but this route is not permitted to West Bank residents; we compare this direct route with the alternative route through Wadi Elnar which is effectively used by West Banker between Ramallah and Bethlehem. We consider Efrata Junction as the starting and the Jaba checkpoint as the ending point with the three different sub-‐routes allowed:
o Old Qader o Sawahirya West o Sawahirya East
Jericho-‐ 90: the normal route from different northern West Bank cities to Jericho is through Hammra and Tayasir check points, as follows:
o Jenin-‐ Al Jiftilik direct via Tayasir checkpoint o Tulkarem and Qalqeilia-‐ Al Jiftilik direct via Hamra checkpoint o Nablus-‐ Al Jiftilik direct via Hamra checkpoint o Tubas -‐ Al Jiftilik direct via Tayasir checkpoint
However, with the exception of around 56,000 people who are registered as residents of the Jordan Valley (including Jericho), the Palestinians are prohibited from crossing these checkpoints with their private vehicles, unless they have obtained a special permit.18 Therefore, we compare these routes with the alternative going through north of Ramallah (route 1).
Ramallah Jerusalem: the most direct route is through Qalandia, but this not permitted for West Bank residents; we compare this most direct route as if there were no check-‐point (as it would be the case in a unified Palestinian state) with the alternative routes:
o Through Betunia check-‐point for commercial vehicles o Through Hizma check-‐point, o Through Qalandia with the checkpoint
18 Moreover those who obtain these permits are required to have the vehicles licensed in their names before being able to drive them through the checkpoints.
26
Ramallah-‐Nablus: the most direct route to Nablus is through historic segments of Route 60 which is however closed by road blocks. Therefore, the alternative route via Beir-‐Zeit is considered.
For each alternative, we first compute the extra time and extra kilometres to be driven vis-‐à-‐vis the most direct route. We rely on ARIJ mapping of the West Bank routes on the Geographical Information System, as well as on information from the Palestinian Ministry of Economy in order to estimate the timing and the length of each alternative. Table 7.2 presents the length of each route and its alternatives as well as the time taken to travel these routes under normal traffic conditions. The differences are substantial with the alternative route often taking double the time than the direct route. The differences are particularly significant for the Jordan Valley route which is de facto isolated from the north of West Bank. We then estimate the costs per vehicle due to the extra time and mileage caused by the restrictions. We calculate these additional costs per extra kilometre travelled and per extra minute for six categories of vehicles: private vehicle, taxis, mini-‐bus, full bus, small, medium and large commercial vehicles (divided in turn into large commercial and full trailer). For each category we estimate the various costs per kilometre, taking into account fuel consumption, maintenance and fixed costs.19 Table 7.1 presents the estimates for a private vehicle. We perform a similar exercise for the cost per minute travelled. First we estimate the average occupancy for the various types of vehicles. Then we compute the opportunity cost of time for each
West Bank in 2010 (estimate in current prices based on PCBS data on GDP per capita in constant 2004 US dollars).20 For the drivers of taxis, buses and commercial vehicles, we base their opportunity cost on the average monthly wage for such occupation (NIS 3,000). The last which we take from the Ministry of Public Works and Housing. This is measured in different working days of the week for each route and then averaged out, valuing the weekend days as half working day each.21
for instance, if 46% of the traffic on the Bethlehem-‐Ramallah road via the Old Qedar is taken by private cars, we will weigh the cost of the private car by 46% in the computation of the average cost per vehicle on that alternative. The estimations of the extra costs for the various routes (both in terms of weighted average costs per vehicle and in terms of total overall annual costs) are presented in Table 7.2. Most of the costs arise from the barriers obstructing the Bethlehem-‐Ramallah connection (diverting traffic through the over-‐crowded Wadi Nar) due to the heavy volume of traffic and from access to the Jordan Valley
19 Fuel consumption is based on figures from the Institute of Transport Studies at the University of Leeds cross referenced with enquiries with car mechanics in the West Bank; maintenance costs and annual travel are averages calculated from enquiries with car mechanics in the West Bank. Fuel and fixed costs are based on data provided by the Palestinian Ministry of Transportation. 20 We divide the GDP per capita (NIS 8,620) by (200 working days x 8 hours x 60 minutes) in order to get the average per minute valuation of time, i.e. NIS 0.09. 21 Sometimes traffic data does not distinguish between commercial vehicles and between mini-‐ and full buses. In those cases we just distribute the traffic for the macro-‐category (e.g. commercial vehicle) equally across the sub-‐categories (small, medium and large commercial). Also, for the Jericho-‐90 road we only have data for the vehicle traffic without the indication of the specific origins from the various cities in the West Bank. We
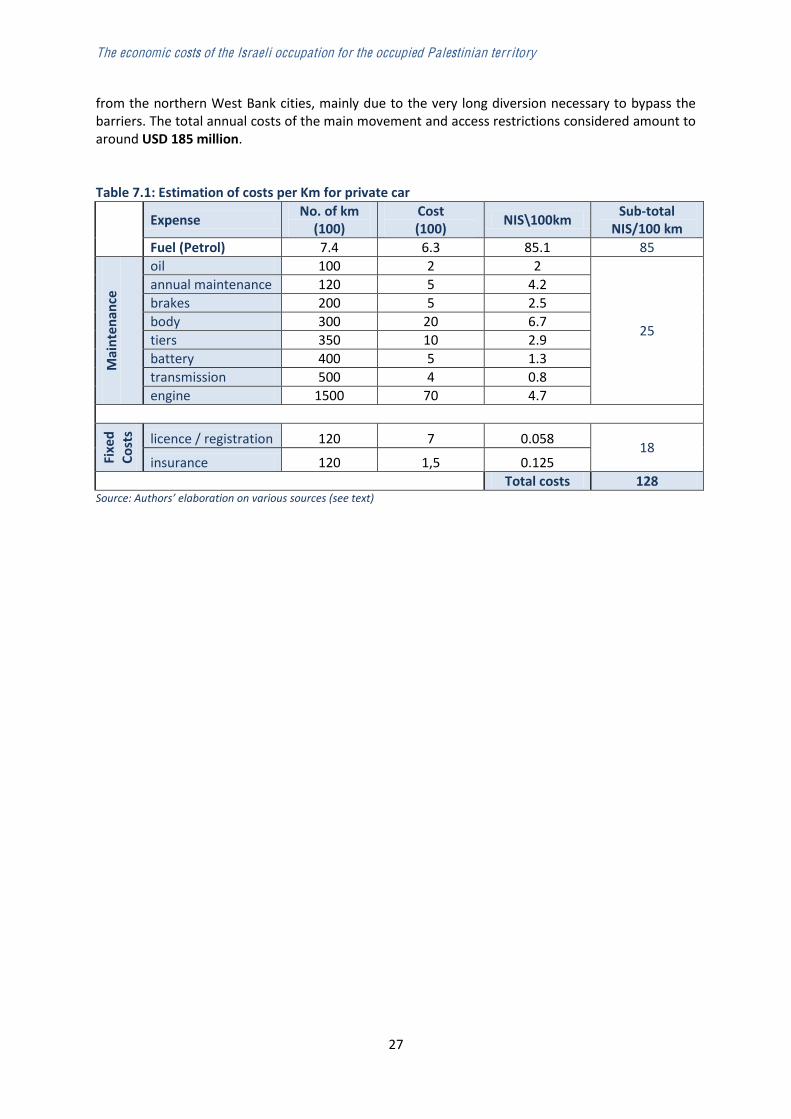
The economic costs of the Israeli occupation for the occupied Palestinian terr itory
27
from the northern West Bank cities, mainly due to the very long diversion necessary to bypass the barriers. The total annual costs of the main movement and access restrictions considered amount to around USD 185 million.
Table 7.1: Estimation of costs per Km for private car
Expense No. of km (100)
Cost (100) NIS\100km Sub-‐total
NIS/100 km Fuel (Petrol) 7.4 6.3 85.1 85
Mainten
ance
oil 100 2 2
25
annual maintenance 120 5 4.2 brakes 200 5 2.5 body 300 20 6.7 tiers 350 10 2.9 battery 400 5 1.3 transmission 500 4 0.8 engine 1500 70 4.7
Fixed
Costs licence / registration 120 7 0.058 18
insurance 120 1,5 0.125 Total costs 128

28
Table 7.2: Differences between using normal routes and their alternatives (with obstacles) for the main routes in the oPt
Route
Length (km) Time (min) Annual No. Vehicles ('000)
Tot cost diff ('000 USD)
Direct Alternative Difference Cost diff vehicle (NIS)
Direct Alternative Difference Cost diff vehicle (NIS)
Bethlehem Ramallah via Old Qedar 31.8 50.3 18.5 32.8 39.5 75.5 36.0 9.3 1,888.1 22,895 via Sawahirya West 31.8 49.5 17.8 29.5 39.5 87.0 47.5 12.9 929.0 11,356 via Sawahirya East 31.8 49.2 17.4 32.2 39.5 89.0 49.5 15.4 1,497.3 20,519
Jericho-‐90 Jenin Al Jiftlik 57.7 172.9 115.2 210.7 72.5 126.5 54.0 19.21 455.8 30,186 Tubas Al Jiftlik 39.4 137.5 98.1 179.5 50.5 101 50.5 17.97 86.6 4,926 Tulkarm Al Jiftlik 57.9 162.2 104.3 190.7 82 119 37.0 13.17 281.0 16,497 Qalqiliya Al Jiftlik 53.5 159.2 105.7 193.3 67 117 50.0 17.79 178.9 10,881 Nablus Al Jiftlik 32.7 135.9 103.2 188.7 49.5 113 63.5 22.59 597.4 36,350
Ramallah Jerusalem via Betunia (comm.) 14.8 21.1 6.3 25.5 25.5 58.0 32.5 10.2 22.7 233 via Hizma 14.8 27.4 12.6 18.7 25.5 43.0 17.5 3.7 2,349.5 15,167 via Qalandia (w/o CP) 14.8 14.8 0.0 0.0 25.5 55.0 29.5 8.1 2,417.7 5,621
Ramallah-‐ Nablus 51.0 55.0 4.0 1.9 59.0 64.5 5.5 4.2 5,639.9 9,888 Total 184,517

The economic costs of the Israeli occupation for the occupied Palestinian terr itory
29
7. Dead Sea Tourism Tourism is another economic activity that has been conspicuously restrained by the Israeli restrictions as well as by the unrest in the Palestinian territories. Given the natural, religious and historic amenities in the West Bank and in the Jordan Valley-‐Dead Sea areas in particular, tourism development holds some important potential in the Palestinian territories; particularly in Area C. As noted by the World Bank (2010b), tourism development in area C could include the Dead Sea, the Jordan River, and the Jordan Valley slopes, as they offer a unique combination of health, leisure, sport/adventure, ecological, agro, and religious tourism destinations in a single area. In fact tourism development has been stifled in the whole of West Bank and Gaza, especially in the last decade, due to movement and access restrictions imposed by the Israelis on the transit from and to Israel, as well as by political instability and violence. But given the severe current building and access restrictions,
tourism development in Area C, despite its potential.22 The only exception has been some Israeli development in those areas controlled directly by Israel, most notably, the West Bank side of the Dead Sea. To understand the potential value of tourism in Area C, we estimate what could be the revenues generated by arguably the most valuable touristic resource there, the Dead Sea. Of course this is again an under-‐estimation of the tourism potential of Palestine as we are not including many other valuable touristic and religious sites in West Bank and Gaza, which could benefit from the lifting of the restrictions of the Israeli occupation. Given its unique features, its worldwide fame, and its location, the Dead Sea would represent the key to the development of tourism in the West Bank. It is close to the baptism site on the Jordan River, to the Jordan Valley and to the Jericho desert, and is well connected to both Jordan and Israel, including Jerusalem. Therefore the tourism potential of the Palestinian Dead Sea is a good indication of the foregone revenues for Palestine from tourism development in Area C, which are currently prohibited by Israeli rule over it. However, by estimating only the potential tourism value of the Dead Sea we again provide a lower bound estimate of the true foregone revenues from tourism development in the whole of West Bank and Gaza due to the occupation. The commercially successful experience of the Jordanian Dead Sea, right across the West Bank side, confirms the potential for a possible rapid development of tourism on the Palestinian side. We take the tourism revenues of the Jordanian Dead Sea as the benchmark to estimate the potential value of the tourism sector on the Palestinian side. This is for two reasons: first, the upper Jordanian, where almost all of the tourism in the Jordanian Dead Sea happens, and the West Bank sides of the Dead Sea are very similar from a topographic and landscape angles.. Second, unlike the Israeli side of the Dead Sea, most tourism on the Jordanian side is international, which is a more likely scenario for the development of the Palestinian Dead Sea. The Dead Sea tourism development in Jordan occurred largely in recent years mainly through a series of foreign investments by multinational hotel companies (such as Kempinsky and Movenpick), and has quickly became one of the largest contributors to the rapid growth of Jordanian tourism. There are an estimated 1,500 rooms in high quality hotels, which usually charge well in excess of USD 150 per night. This has facilitated the development of a fairly wealthy tourism, which has long average stays and relatively high expenditure per capita. 22 The extent to which any development in area C is hindered can be grasped by considering that at the beginning of 2011 the Israeli army destroyed the signposts placed two weeks earlier by the villagers in Sebastia, a town north of Nablus, which aimed to explain the most important ruins in the Roman archaeological site.

30
Unfortunately there is no publicly available data on the tourism revenues generated by the Dead Sea in Jordan, therefore we need to estimate it on the basis of the Dead Sea shares in total package tourist-‐nights in Jordan (see Table 2) and of the total tourism receipts for the country as a whole in 2010 (the fuller methodology is explained in the Appendix). On the basis of this we estimate the tourism revenues from the Dead Sea to be around USD 360 million in 2010. This can be seen as the actual value of the demand for tourism services for the upper part of the Dead Sea. Table 2: Package tourists, by location (2009) Tourist Tourist-‐night Avg. length % tour-‐night Amman 363,848 985,061 2.71 43.2% Petra 299,782 577,888 1.93 25.3% Aqaba 134,074 353,591 2.64 15.5% Dead Sea 88,519 244,886 2.77 10.7% Wadi Rum 59,902 76,807 1.28 3.4% Madaba 11,980 18,621 1.55 0.8% Karak 2,710 3,496 1.29 0.2% Tafeleh 3,200 4,689 1.47 0.2% Ma'an Spa 1,447 4,045 2.80 0.2% Jarash 781 1,018 1.30 0.0% Others 5,843 10,677 2.01 0.4% Total 972,086 2,280,779 100.0%
Source: Jordanian Ministry of Tourism and Antiquities If the West Bank Dead Sea passed under full Palestinian control this could spur the development of the necessary touristic infrastructures (mainly hotels and restaurants), thus allowing the Palestinian tourism industry to tap into this buoyant demand. As one of the main drivers of tourism demand is supply of tourist services, the increase in the latter expected from the development on the Palestinian side is likely to attract additional tourism demand to the Dead Sea; which we conservatively estimate in 20% of the current demand. This would yield a total estimated potential of USD 434 million in revenues to be divided between Jordan and Palestine, which would yield potential revenues for the Palestinian Dead Sea of around USD 217 million per year. Using the conversion rate for the hotels and restaurant sector in the West Bank (PCBS, 2010), this represents an expected value added of around USD 144 million, foregone due to the Israeli occupation.

The economic costs of the Israeli occupation for the occupied Palestinian terr itory
31
8. Uprooted trees
The Urbanization Monitoring department at the Applied Research Institute of Jerusalem estimates that about 2.5 million trees have been uprooted since 1967. The Israeli policy of uprooting trees has been executed for a number of reasons, including the construction of Israeli settlements, the construction of the separation wall, and settlements infrastructure; all of which exclusively benefits the settler population.
of tree uprooting also creates a grave economic damage for the Palestinian people. The vast majority of the uprooted trees have been fruit bearing trees in their highly productive period of life; thus the uprooting has deprived Palestinians of a valuable source of income. The annual loss for the Palestinian economy is given by the foregone production. ARIJ estimates that around one third of the 2.5 million uprooted trees were olive trees and the remaining consist of other types of fruit trees, including around 34,000 palm trees.23 The average annual productivity of one olive tree is about 70 kg (Agriculture department of ARIJ), with olive production being valued at ex farm price of USD 1.103 per kilo, which is an estimate on the basis of data from PCBS (2009b). Therefore:
The cost of uprooted olive trees/year = 2.5 million x 0.33 x 70 kg /tree x $1.103/kg = USD 55,133,602
The other fruit trees are estimated to have an average annual production of around USD 50, with the exception of palm trees which yield an average production value of USD 70 (data from the Palestinian Ministry of Agriculture). Therefore the total production value of these trees is USD 85,713,333 million. Considering that there is very little intermediate consumption in the production of rain-‐fed fruit trees, we estimate that the gross value added is around 98% of the production value, so the total forgone value added as a result of uprooted trees by the Israelis is equivalent to USD 138 million per year.
23 Estimates by ARIJ in conjunction with the Palestinian Ministry of Agriculture.

32
9. Fiscal implications: sustainable fiscal balance Despite being lower bound estimates, the economic losses from the Israeli occupation which we have been able to measure appear to be an unbearable burden for the Palestinian economy, a burden almost as large as the entire economy itself. This type of burden would make it impossible for any economy to be viable on its own, let alone to thrive. One implication of these costs is that Palestine today is heavily dependent on foreign aid in order to breach the large fiscal deficit that it is running due to the low level of fiscal revenues. There are two ways in which the occupation is stifling the amount of Palestinian fiscal revenues: directly, by preventing an efficient collection of taxes mainly due to the prohibition of the PA to operate at the international border; indirectly, by artificially reducing the size of the Palestinian economy (as we ha We estimate that the direct fiscal costs of the occupation amount to USD 406 million per year while our estimation shows that the indirect fiscal costs total USD 1.563 billion per year24. We acknowledge that this is a very rough estimate to get a sense of the scale of potential losses. Direct fiscal costs of the occupation As an occupied country, Palestine does not enjoy any control over international borders. In addition Israel does not allow any presence of PA officials at these borders. This generates a situation whereby Israel has complete control over the tax and customs clearance revenues accruing to Palestine, which it collects on behalf of the PA.25 However this system of collection is ridden with problems, which create significant fiscal leakage and damage the fiscal viability of the PA. First, taxes on Palestinian imports from outside Israel are based on a declaration of value from the importer which is often an under-‐estimation of the true value of the goods. Except for the second-‐hand car imports Israeli restrictions make it impossible for Palestinian customs to double-‐check the real value of the goods, which leads to a lower collection of tax revenues from imports than in the case of a sovereign Palestinian state. Preliminary estimates from the Ministry of Finance suggest that the revenues lost through this channel are about 10% of the total customs taxes.26 As in 2010 these taxes totalled NIS 3.73 billion, therefore it is expected that around NIS 370 million, or USD 106.6 million, in import taxes is lost annually due to the occupation. Second, the PA has no control over the borders between Israel and the Area C of the West Bank. The collection of VAT on the goods imported from Israel into through Area C is based on self-‐declaration by the importer, which again leads to an incomplete collection of VAT. The Ministry of Finance estimates that this loss of VAT due to the PA lack of control over the Israel-‐West Bank cost around 15% of the VAT revenues from imports from Israel, equivalent to NIS 296 million, or USD 85.4 million per year.27
24 Ministry of finance revenue departments and Macro-‐fiscal Unit estimates. 25 Israel has often used this position to threaten the PA by withholding of clearance revenue, creating huge uncertainty for the PA fiscal space. 26 whose value cannot be under-‐ e remaining 18% of total revenues is paid for by large companies, which do not tend to declare deflated import values. The remaining 10% of total custom revenues are estimated to be half of what should have been really paid in terms of taxes by importers. 27 This value is estimated on the basis of the predicted VAT on the basis of the intra-‐trade volume with Israel compared to the actual VAT revenues collected on the imports from Israel.

The economic costs of the Israeli occupation for the occupied Palestinian terr itory
33
In addition not all of the goo portion of these imports are produced in a third country and then re-‐exported to the oPt as if they had been produced in Israel. This is the case as the cost of importing to Israel (and then to Palestine) is usually lower than trying to import directly to Palestine, as imports to Palestine face much longer checks and higher costs than imports to Israel, as shown in section 2. A recent study by the Bank of Israel (2010) quoted in UNCTAD (2011) indicat Israeli trade sector, accounted for at least 58% of the trade that was reported as Palestinian imports from Israel in 2008. As explained by UNCTAD (2011) customs revenues are collected by the Israeli authorities but not transferred to the PA, as they are not labelled as being destined to oPt and are imported in bulk by Israeli importers and resold to Palestinian consumers. On the basis of the information that represent 58% of total imports and that they would be taxed at the average 10% import tariff, we estimate that the costs to the Palestinian treasury of not receiving
Israel are in the range of USD 200 million per year.28 The last direct way in which the occupation reduces fiscal revenues of the PA is via allowing domestic VAT tax evasion in Area C. As this area is not controlled by the PA, a lot of smuggling and black market selling occur in there which is effectively not subject to any taxation. The Ministry of Finance estimates that such loss is around 80% of the actual local VAT collection, i.e. about NIS 50 million, or USD 14.4 million per year. This gives a total direct fiscal cost of the occupation equal to USD 406.4 million per year, essentially due to the hurdles in the Palestinian tax collection imposed by the Israeli restrictions. Indirect fiscal costs of the occupation As highlighted above the occupation affects the fiscal sustainability of the PNA by artificially reducing the size of the Palestinian economy and in turn its tax revenues base as well. A bigger economy yields more taxes as consumption and incomes are higher. This represents the indirect fiscal cost imposed by the occupation on the Palestinian economy. In order to estimate it we, first compute the elasticity of fiscal revenues growth with respect to GDP growth in West Bank and Gaza. We can compute this elasticity only on the basis of the last three years (2008-‐2010) as the earlier data on clearance and tax revenues are not compatible with the more recent data. The average elasticity of fiscal revenues to GDP computed in this way is 0.879, i.e. fiscal revenues increase by 87.9% for every 100% increase in GDP. We apply this elasticity to the estimated increase in GDP in West Bank and Gaza in the absence of occupation. As we discussed according to our calculations the economy would be 84.9% larger without the occupation, thus it would generate USD 1.389 billion additional fiscal revenues. Adding this figure to the direct fiscal costs yields total fiscal costs from the occupation of USD 1.796 billion. Given the total fiscal deficit in West Bank and Gaza of USD 1.358 billion in 2010 (IMF, 2011), the Palestinian economy would be able to run a healthy fiscal balance with a surplus of USD 438 million without the direct and indirect fiscal costs imposed by the occupation.29 It would not have to rely on
28 Note that this estimate is lower than the USD 480 million per year estimated by UNCTAD (2011). This is because UNCTAD
29 This would be the case provided an unchanged expenditure pattern.

34
expenditure to spur needed social and economic development.

The economic costs of the Israeli occupation for the occupied Palestinian terr itory
35
Appendix 1
ISRAELI LISTS OF FORBIDEN & RESTRICTED GOODS
TO THE WEST BANK & THE GAZA STRIP
I. ARMS & MUNITIONS: Forbidden transfer under all circumstances across Israel's frontiers without specific permits -‐ as defined in the Control of Exports Security Order (Arms and Munitions) 2008, and in the Control of Exports Security Order (Missile Equipment) 2008. II. LIST OF RESTRICTED DUAL-‐USE GOODS TO THE WB: The list of restricted dual-‐use goods below is excerpted from the Defense Export Control (Controlled Dual-‐Use Equipment Transferred to Areas under the Palestinian Authority Jurisdiction) Order 2008 last updated on 2 August, 2009 and translated from Hebrew. A. Chemicals
1. Chlorate Salts a. Potassium chlorate KClO3 b. Sodium chlorate NaClO3
2. Perchlorate Salts a. Potassium perchlorate KCLO4 b. Sodium perchlorate NaClO4
3. Hydrogen peroxide H2O2 4. Nitric acid HNO3 5. Musk xylene C12H15N3O6 6. Mercury Hg 7. Hexamine C6H12N4 8. Potassium permanganate 9. Sulfuric acid H2SO4 10. Potassium cyanide KCN 11. Sodium cyanide NaCN 12. Sulfur S 13. Phosphorus P 14. Aluminum powder Al 15. Magnesium powder Mg 16. Naphthalene C10H8 17. Fertilizers
a. Ammonium nitrate NH4NO3 b. Potassium nitrate KNO3 c. Urea CH4N2O d. Urea nitrate CH4N2ONO3 e. Fertilizer 27-‐10-‐17 f. Fertilizer 20-‐20-‐20 g. Any fertilizer containing any of the chemicals in items a c
18. Nitrous Salts of other metals: a. Sodium nitrate NaNO3

36
b. Calcium nitrate Ca(NO3)2 19. Pesticides
a. Lannate b. Endosulfan
20. Nitrite Salt 21. Methyl bromide CH3Br 22. Potassium chloride KCL 23. Formalin CH2O 24. Ethylene glycol C2H6O2 25. Glycerin C3H8O3
B. Other Materials and Equipment
26. Platen, titanium, or graphite plates not more than 10 cm thick 27. Communication equipment, communication support equipment, or any equipment that has
a communication function 28. Equipment whose operation can cause interference in communication networks 29. Communication network infrastructure equipment 30. Lathe machines for removing metals (including center lathe machines) 31. Lathe machine spare parts, lathe machine equipment, and lathe machines accessories 32. Machine tools that can be used for one or more of the following functions: erosion,
screwing, purifying, and rolling 33. Casting ovens of more than 600 degrees Celsius 34. Aluminum rods with a radius between 50 to 150 mm 35. Metal pipes of 50 to 200 mm radius 36. Metal balls with a radius of 6 mm and bearings containing metal balls with a 6 mm radius 37. Optical binoculars 38. Telescopes including aimers (and markers) 39. Laser distance measuring equipment 40. Laser pointers 41. Night vision equipment 42. Underwater cameras and sealed lenses 43. Compasses and designated navigation equipment including GPS 44. Diving equipment, including diving compressors and underwater compasses 45. Jet skis 46. External marine engines of more than 25 Hp and designated parts for such engines 47. Parachutes, surf-‐gilders, and flying models 48. Balloons, dirigible airships, hanging gliders, flying models, and other aircraft that do not
operate with engine power 49. Devices and instruments for measuring gamma and x-‐rays 50. Devices and instruments for physical and chemical analysis 51. Telemetric measuring equipment 52. All-‐terrain vehicles 53. Firearms and ammunition for civilian use (e.g., for hunting, diving, fishing, and sports 54. Daggers, swords, and folding knifes of more than 10 cm 55. An object or a system of objects that can emit fire or detonators including fireworks 56. Uniforms, symbols and badges. 57. All items listed in the Defense Export Control Order (Controlled Dual-‐use Equipment), 2008 -‐
Items listed under the Wassenaar Arrangement: As specified in the updated (2008) "Wassenaar Arrangement on Export Controls for Arms and Dual Use Goods and Technologies -‐ List of Dual Use Goods and Technologies and Munitions List."

The economic costs of the Israeli occupation for the occupied Palestinian terr itory
37
III. LIST OF RESTRICTED GOODS TO THE GAZA STRIP According to the decision taken on June 20, 2010, by the Israeli Security Cabinet, the Government of Israel formed two categories of listed items whose entry into Gaza would be subject to Israeli control. The lists as published by COGAT:30 A. Items listed in Lists I & II above in addition to:
1. Fertilizers or any mixture containing chloric potassium with concentrations greater than 5%.
2. Fibers or textiles containing carbon (carbon fibers or graphite fibers), including:
a. Chopped carbon fibers. b. Carbon roving. c. Carbon strand. d. Carbon fabric tape.
3. Glass fiber-‐based raw materials, including: a. Chopped glass fibers. b. Glass roving c. Glass strand. d. Glass fabric tape. e. S-‐glass. f. E-‐glass.
4. Vessels. 5. Fibers or fabrics featuring polyethylene, also known as Dyneema. 6. Retro detection devices. 7. Gas tanks. 8. Drilling equipment. 9. Equipment for the production of water from drillings. 10. Vinyl esther resins. 11. Epoxy resins. 12. Hardeners for epoxy resins featuring chemical groups of durable or reliable types,
including: a. DETA diethylenetriamine. b. TETA thiethylenetramine. c. AEP aminoethylpiperazine. d. E-‐100-‐ethyleneamine. e. Jeffamine T-‐403. f. Catalyst 4,5,6,22,23,105, 140, 145,150,179,190,240. g. D.E.H 20,24,25,26,29,52,58,80,81,82,83,84,85,87. h. XZ 92740.00
13. Vinyl esther accelerants, including: a. DMA-‐dimethylaniline. b. Cobalt octoate. c. MEKP methylethyl keyone peroxide. d. AAP acetyl acetone peroxide.
30 http://www.mfa.gov.il/NR/rdonlyres/F1E4CCD4-‐AC96-‐4BA9-‐803A-‐816E51300594/0/COGATCivilianPolicyGazaStrip.pdf

38
e. CuHP cumene hydroperoxide. 14. M or H type HTPB, hydroxyl-‐terminated polybutadiene. 15. Water disinfection materials solutions with a concentration of over 11%.
B. Construction Items and Materials to be allowed Entry into Gaza only for PA-‐authorized Projects Implemented by the International Community:
1. Portland cement, quicklime (bulk or bags or drums). 2. Natural aggregates, quarry aggregates and all foundation materials. 3. Prepared concrete. 4. Concrete elements and/or precast and/or tensed concrete. 5. Steel elements and/construction products. 6. Concrete for foundations and pillars of any diameter (including welded steel mesh). 7. Steel cables of any thickness. 8. Forms for construction elements of plastic or galvanized steel. 9. Industrial forms for concrete pouring. 10. Beams from composite materials or plastic with a panel thickness of 4mm and thicker. 11. Thermal insulation materials and/or products. 12. Concrete blocks, silicate, Ytong or equivalent, plaster (of any thickness). 13. Building sealing materials or products. 14. Asphalt and its components (bitumen, emulsion) in bulk or in packages of any sort. 15. Steel elements and/or steel working products for construction. 16. Elements and/or products for channeling and drainage from precast concrete with diameters of over 1mm. 17. Trailers and/or shipping containers. 18. Natural wood beams and platforms over 2cm thick except for those in finished products. 19. Vehicles except for personal vehicles (not including 4X4 vehicles), including construction vehicles.
Notes: 1. Any item not contained in the list of controlled items will be allowed to enter the Gaza Strip. 2. The list of controlled items will be updated from time to time. 3. Requests for authorization to transfer items included in this list to the Gaza Strip may be
referred to the Gaza CLA.

The economic costs of the Israeli occupation for the occupied Palestinian terr itory
39
Appendix 2 Table A2: Palestinian abstraction from the three shared aquifers in 1999 and 2007 (MCM)
Aquifer Article 40 allocation
Palestinian abstraction 1999
Palestinian abstraction 2007
Palestinian abstraction 2008
Eastern 74.5 71.9 58.8 NA Northeastern 42 36.9 26.8 NA Western 22 29.4 27.9 NA Total 138.5 138.2 113.5 91.50
Source: World Bank (2009) and PCBS (2009a) for 2008 data
Table A3: Cost of purchased water from Mekorot Year Purchased water
(MCM) Cost ($million) ($0.71/m3)
2003 43.1 30.60 2004 42.6 30.246 2005 42.2 29.962 2006 43.9 31.169 2007 49.4 35.074 2008 52.8 37.488 2009 53.5 37.985 Total 2003-‐09 327.5 232.525 Source: PWA, 2009, PCBS
Computing water needs per dunum of irrigable area Glover and Hunter (2010) take all crops that have at least 1,000 dunum cultivated under irrigation. Table A3 shows the water requirements for irrigated crops in oPt, with their share of area currently farmed under irrigation. The authors then combine these figures to calculate the average irrigation requirement for any irrigable dunum of Palestinian land. As the authors note this procedure assumes that future expansion will simply scale up current
urban expansion that will be required to accommodate the expanding population; nor does it account for any improvements in technology that may reduce the water requirements of future irrigated land. It is quite likely that with the introduction of a systematic and enforceable agricultural water pricing system, cropping patterns will tend towards crops that are less water intensive for efficiency reasons. As a result of these factors, the projections offered here are likely to overestimate, rather than underestimate, the water needed to put all irrigable land in Palestine under irrigation. Yet, this approach is more realistic than that offered by both Jayyousi and Srouji (2009) and GTZ (1995). Both studies assume very high water consumption per irrigated dunum, of 850 CM and 741 CM respectively. By not taking into account actual cropping patterns of irrigated land, these figures provide vastly inflated overestimations of what future water demand is likely to be.

40
Table A3: Water Requirements for Irrigated Crops in Palestine
Proportion of current total Irrigated Area
Irrigated water Requirements per
dunum in M3
Weighted Water Contribution in
M3\YR\D Olive 14.0% 400 56.00 Potato 11.7% 395 46.22 Squash 10.9% 428 46.65 Tomato 6.6% 797 52.60 Cucumber 6.4% 620 39.68 Aubergine 6.3% 800 50.40 Valencia Orange 5.7% 688 39.22 Maize 5.2% 650 33.80 Cauliflower 4.6% 420 19.32 White cabbage 3.7% 360 13.32 Dry Onion 3.3% 525 17.33 Lemon 2.9% 600 17.40 Grape 2.6% 600 15.60 Date 2.3% 1200 27.60 Jew's Mallow 2.0% 483 9.66 wheat 1.9% 550 10.45 Green Kidney Bean 1.8% 476 8.57 Broad Bean Green 1.7% 400 6.80 Shammoty Orange 1.5% 688 10.32 Clementine Orange 1.4% 950 13.30 Navel Orange 1.1% 688 7.57 Watermelon 0.9% 1200 10.80 Green Onion 0.8% 525 4.20 Banana 0.7% 3000 21.00 Total 100% 726.79 (average) 579.11
Source: Glover and Hunter (2010)

The economic costs of the Israeli occupation for the occupied Palestinian terr itory
41
Tables for estimating productivity per dunum of irrigated vs. non irrigated land Table A4: Value of production and cultivated area, irrigated vs. rain-‐fed, Fruit Trees
Irrigated Rainfed
Area
(dunum) Value (USD) Area
(dunum) Value (USD) Olive 23,945 4,039,733 893,721 90,664,267 Grape 4,441 6,768,474 63,708 37,360,526 Valencia 9,684 23,236,000 0 Lemon 4,874 22,908,389 405 554,611 Plum 246 140,591 21,155 7,500,409 Clement 2,368 3,043,000 0 Fig 153 139,597 13,039 7,788,403 Shammoty 2,613 6,815,000 0 Banana 1,280 3,915,000 0 Guava 2,476 3,790,000 0 Navel Oragne 1,795 3,603,000 0 Aloe 0 4,894 3,418,000 Date 3,953 3,812,965 20 23,035 Almond (hard) 14 7,790 28,165 3,845,210 Almond (soft) 70 155,320 11,110 18,104,680 Poppy 951 1,520,000 0 0 Grapefruit -‐ 0 529 478,000 Peach 535 437,685 2,053 629,315 Apricot 230 251,281 4,174 1,556,719 Apple 232 272,518 1,520 761,482 Cherry 30 25,365 1,708 1,998,635 Pomegranate 118 53,560 934 472,440 Mandarin -‐ 0 296 317,000 Akadenia 146 397,901 350 242,099 Mango -‐ 0 215 433,000 Avocado -‐ 0 84 316,000 Francawy -‐ 0 143 130,000 Walnut -‐ 0 293 506,000 Pears 44 25,528 411 186,472 Other Citrus -‐ 0 71 118,000 Quince 28 29,086 251 167,914 Others 78 154,000 0 0 Others Stone Fruit 140 118,000 0 0 Custard -‐ 0 30 211,000 Bomaly -‐ 0 40 37,000 Sumak -‐ 0 424 319,000 Balady Orange -‐ 0 20 36,000 Nectarine 10 6,643 44 18,357 Pican 24 66,922 26 71,078 Total 60,478 85,733,347 1,049,833 178,264,653
elaboration on PCBS (2009b)

42
Table A5: Value of production and cultivated area, irrigated vs. rain-‐fed, Field Crops Irrigated Rainfed Area (dunum) Value (USD) Area (dunum) Value (USD) Wheat 3,200 709,544 226,241 22,741,456 Barley 990 97,566 106,558 3,115,434 Sern 109 3,627 27,379 7,447,373 Clover 1,227 407,856 21,374 3,715,144 Potato 20,061 27,009,756 1,116 877,244 Dry Onion 5,653 9,489,381 11,673 8,536,619 Vetch 16,190 534,000 Chick-‐peas 14,575 1,613,000 Lentil 11,395 499,000 Tobacco 4,372 2,673,000 Broad bean 3,994 284,000 Sesame 3,781 668,000 Thyme 1,601 4,107,778 610 178,222 Anise 2,137 779,000 Sweet Potato 1,780 4,019,000 Dry Garlic 430 1,776,604 1,143 1,124,396 Others Clover, Sern 1,386 102,000 Broom Corn 1,034 8,000 Black cumin 948 128,000 Onion Tuber 735 805,805 187 84,195 Local Tobacco 787 960,000 Sorghum 5 5,245 775 9,755 Fenugreek 2 181 396 55,819 Safflower 323 44,000 Cumin 210 83,000 Dry Cowpea 60 79,808 147 6,192 Meramieh 95 391,632 77 123,368 Other Dry Leumes 30 18,750 104 16,250 Ment 114 192,622 10 15,378 Others 122 22,000 Chamomile 83 71,000 Sun Flower 71 5,000 Tomak 50 11,000 Fiber 30 41,000 Total 36,205 49,227,154 459,165 56,459,846

The economic costs of the Israeli occupation for the occupied Palestinian terr itory
43
Table A5: Value of production and cultivated area, irrigated vs. rain-‐fed, Vegetables Irrigated Rainfed Area (dunum) Value (USD) Area (dunum) Value (USD) Cucumber 32,348 138,757,000 0 Squash 22,263 33,118,740 5,922 2,608,260 Tomato 20,143 136,314,481 4,778 1,651,519 Eggplant 11,712 36,393,634 1 366 Maize 9,462 4,782,000 0 Cauliflower 7,784 17,289,786 904 729,214 White Cabbages 6,352 12,857,540 4 460 Snake Cucumber 631 625,797 5,540 1,513,203 Okra 1,474 1,116,363 4,196 2,134,637 Jew's Mallow 5,396 6,245,000 0 Broad Bean (Green) 2,869 2,562,136 2,199 1,281,864 Hot Pepper 4,527 13,589,000 0 Kidney bean (green) 4,260 7,899,226 59 16,774 Peas 1,288 562,198 2,943 1,175,802 Chick Peas (Green) 50 15,330 3,859 1,987,670 Water Melon 3,080 2,340,482 460 48,518 Paprika 2,796 871,000 0 Spinach 1,885 3,151,241 509 526,759 Onion 1,355 2,216,613 845 580,387 Pumpkin 905 792,683 589 239,317 Parsley 1,378 2,116,671 34 11,329 Carrot 1,373 1,477,000 0 Cowpea 579 812,633 766 205,367 Strawberry 1,260 4,351,000 0 Muskmelon 903 996,430 300 136,570 Radish 1,052 1,422,219 84 16,781 Turnip 864 2,264,572 54 13,428 Lettuce 882 980,884 36 3,116 Fennen 701 2,835,000 0 Gourd 245 356,250 372 121,750 Kidney Bean (Yellow) 448 784,000 0 Chard 429 769,000 0 Cut Flower 406 3,345,000 0 Others 337 2,723,000 0 Red Cabbages 182 255,000 0 Warak Lesan 77 119,000 0 Garlic (Green) 8 30,222 5 3,778 Taro 12 35,000 0 Total 151,716 447,173,131 34,459 15,006,869

44
Appendix 3 Estimation of the tourism revenues in the Jordanian Dead Sea In the absence of publicly available data on the tourism revenues from the Jordanian Dead Sea, we estimate those as follows. We first take the share of the Dead Sea in the total tourist-‐nights in Jordan (including domestic) in the period January-‐September 2008 (which is the last for which such data is publicly available). This is 7.7% as shown in Table A1. As we have more recent and complete data for tourist-‐night only for package tourists, we take the share of tourist-‐nights in the Dead Sea in total package tourists for 2009, which is 10.7% (see Table A2). In order to compute the Dead Sea share of tourist-‐nights in total in 2009, we adjust the 2009 figure for package tourists (10.7%) by a factor equal to the Dead Sea share in total package tourist-‐nights in the period January-‐August 2008 (9.3%) divided by the Dead Sea share in total nights for the roughly the same period, i.e. January-‐September 2008 (7.7% in Table A1). Dividing the 10.7% package tourists share by this adjustment factor of 1.208 yields an estimated Dead Sea share of 8.9% in total tourist-‐nights in Jordan. If the tourism expenditure pattern were the same across locations, we would just apply this share to total tourism revenues in Jordan to estimate the Dead Sea tourism revenues. However, as highlighted by Khammash and Alkhas (2009), the concentration of luxury hotels in the Dead Sea is much higher than that in the rest of the country (save Aqaba), and so are the room prices. Moreover unlike other locations in Jordan, occupancy rates are high (as high as 70% for the rooms) indicating that the demand is high relatively to the supply, thus there may not be downward pressure on prices as in other locations. These factors suggest that the expenditures per capita of tourists in the Dead Sea are likely to be considerably higher than for those in other locations. We therefore adjust the 8.9% share by a conservative factor of 1.2 (which is for example lower than the room rate differential between the Dead Sea and the other tourist locations in Jordan) and then multiply this new share (10.7%) by total tourism receipts in Jordan for 2010, i.e. JOD 2.42 billion (source: Ministry of Tourism and Antiquities), equivalent to USD 3.39 billion. This yields the estimated tourism revenues in the Jordanian Dead Sea of USD 361 million. Table A1: Nights spent by location (all visitors to Jordan) Jan-‐Sep 07 Jan-‐Sep 08 % in total 08 Amman 2,750,423 2,798,050 69.2% Aqaba 454,469 466,104 11.5% Petra 312,463 385,076 9.5% Dead Sea 238,350 311,150 7.7% Madaba 19,934 23,886 0.6% Irbid 13,779 16,649 0.4% Jarash 6,170 5,011 0.1% Others 37,791 36,816 0.9%
Source: Jordanian Ministry of Tourism and Antiquities

The economic costs of the Israeli occupation for the occupied Palestinian terr itory
45
References
the future, mimeo.
Bank of Israel (2010). Recent economic developments, Tel Aviv, May August: 128.
Djankov, S.,Freund, C. and Pham, C.S. (2010), Trading on time, Review of Economics and Statistics, Vol. 92, No. 1: 166 173.
Economic Dimensions of a Two-‐State Agreement Between Israel and Palestine, Volume II Supplementary Papers, Aix Group.
Gaza Electricity Distribution Company GEDCO (2010), Online Statistics and Reports,
Technical Statistics, available at http://www.gedco.ps/e/under.php
Glover, S. and Hunter, A. (2010). Meeting future Palestinian water demand needs, MAS.
GOI (2008). National Blueprint (NBP) 14b -‐ NBP of Mining and Quarrying Sites for the Construction and Road Building Business, Israeli Ministry of Interior.
GTZ (1996) Middle East Regional Study on Water Supply and Demand Development (GTZ).
Haddad, M. (2009). Palestinian Water Rights: Past, Present and Future, in Water: Rights and
Values (Palestine Academy Press, Ramallah).
IMF (2011). Macroeconomic and fiscal framework for the West Bank and Gaza: Seventh review of progress, Staff report for the meeting of the ad hoc liaison committee, Brussels.
Isaac, J. and N. Hrimat (2007). A Review of the Palestinian Agricultural Sector, Applied
Research Institute of Jerusalem.
Lev-‐Ram, M. (2009). Turning Dead Sea mud into money, CNN Money, available at http://money.cnn.com/2009/12/09/smallbusiness/ahava_dead_sea.fsb/index.htm
Jayyousi, A. & Srouji, F. (2009). Future Water Needs in Palestine (MAS, Ramallah).
Khammash, T. and Alkhas, Z. (2009). Tourism Sector Report, ABC Investments, Amman,
Jordan.
McHugh, R. (2009). Seawater Desalination in Palestine: Feasibility and Options, in Water: Rights and Values (Palestine Academy Press, Ramallah).
Ministry of Finance (2o11). Ministry of finance revenue departments and Macro-‐fiscal Unit estimates.
Nasser ,Y. (2003)
Water: Rights and Values (Palestine Academy Press, Ramallah).

46
Palestine Investment Fund (2011). Annual Report, 2010, Ramallah, Palestine.
Palestinian Ministry of National Economy (2010), Minutes of meeting of the Private sector
development and trade sector working group, Ramallah, September.
PALTRADE (2010), West Bank Crossing Bi-‐monthly Monitoring Report, June-‐July 2010. Avialable at http://siteresources.worldbank.org/INTWESTBANKGAZA/Resources/Jun-‐Jul2010.pdf
PCBS (2009a), Water Statistics in the Palestinian Territory Annual Report, 2008, Ramallah,
Palestine.
PCBS (2009b), Agricultural Statistics 2007/08, Ramallah, Palestine.
PCBS (2009c), Price of Water Purchased from Israeli Water Companay (Mekorot) in the Palestinian Territory by Region and Type of Use, 2009, Ramallah, Palestine.
PCBS (2010), National Accounts at Current and Constant Prices (2008, 2009), Ramallah,
Palestine.
Phillips, D, J, H. Attili, S. McCaffrey, S. & Murray, J, S, (2007). The Jordan River Basi: 2. Potential Future Water Allocations to the Coriparians, Water International 32(1) pp. 39-‐62.
Tignino, M. (2009) Rethinking the Protection of Water Rights for the Palestinian People: the
Need for a Comprehensive Approach, in Water: Rights and Values (Palestine Academy Press, Ramallah).
UN OCHA (2011), West Bank Movement and Access Update, Jerusalem.
UNCTAD (1986). Recent economic developments in the occupied Palestinian territories,
UNCTAD/TD/B/1102.
UNCTAD (2011) Report on UNCTAD assistance to the Palestinian people: Developments in the economy of the occupied Palestinian territory, UNCTAD: Geneva.
UNDP (2010). One year after Report. Gaza Early Recovery and Reconstruction Needs
Assessments, Jerusalem.
Vengosh, A. et al. (2004). Sources of Salinity and Boron in the Gaza Strip: Natural Contaminant Flow in the Southern Mediterranean Coastal Aquifer, Water Resources Research 41.
WaSH MP (2004) Water for Life: "Israeli Assault on Palestinian Water, Sanitation and
Hygiene during the Intifada.
WaSH MP (2005). Water for Life: Continued Israeli Assault on Palestinian Water, Sanitation and Hygiene during the Intifada.
World Bank (2007). West Bank and Gaza Energy Sector Review, Washington DC: The World
Bank.

The economic costs of the Israeli occupation for the occupied Palestinian terr itory
47
World Bank (2009). Assessment of Restrictions on Palestinian Water Sector Development, Sector Note.
World Bank (2010a). Doing Business Indicators, Trading Across Borders, online data,
available at http://www.doingbusiness.org/data/exploretopics/trading-‐across-‐borders
World Bank (2010b). The Underpinnings of the Future Palestinian State: Sustainable Growth and Institutions, Economic Monitoring Report to the Ad Hoc Liaison Committeee.
World Bank (2011). Building the Palestinian State: Sustaining Growth, Institutions, and
Service Delivery, Economic Monitoring Report to the Ad Hoc Liaison Committeee.
Yesh Din (2009), Petition for an Order Nisi and an Interim Injunction, The Supreme Court of Israel, Jerusalem.
Related Documents