Economic Contributions of Women and Men in APEC Economies December 2004

Welcome message from author
This document is posted to help you gain knowledge. Please leave a comment to let me know what you think about it! Share it to your friends and learn new things together.
Transcript
Economic Contributions of Women and Men in APEC Economies
December 2004
Note: Some of the terms used here do not conform to the APEC Style Manual and Nomenclature. Please visit http://www.apec.org/apec/ about_apec/policies_and_procedures.html for the APEC style guide. SOM 01/2003 Reproduced electronically in October 2007 © 2007 APEC Secretariat Produced for APEC Secretariat 35 Heng Mui Keng Terrace Singapore 119616 Tel: (65) 67756012 Fax: (65) 67756013 Email: [email protected] Website: www.apec.org APEC#207-SO-01.1
Economic Contributions of Women and Men in APEC Economies
Manisha Sengupta, Ph.D. Victoria A. Velkoff, Ph.D.
International Programs Center
U.S. Census Bureau December 2004
This report is released to inform parties of ongoing research and to encourage discussion.
Table of Contents
Acknowledgements Executive Summary Glossary Introduction Section 1. Labor Force Participation ……………………………………………10
Trends in labor Force Participation – Is the labor force participation gap closing?
Section 2. Employment and Unemployment …………………………………….12 Employment-to-Population Ratios Unemployment
Trends in Employment and Unemployment – Do women who look for work find work?
Section 3. Employment Sectors, Occupation, and Gender Gap in Earnings ….29
Employment by Sector – Are different sectors of the economy favorable for women and men?
Occupational Segregation Earnings Gaps – Is there wage equity between women and men? Section 4. Status in Employment, Informal Work, and Entrepreneurship ……28 Status in Employment Informal Employment Women and Men in Business
Section 5. Conclusions and Recommendations …………………………………..36 References Tables Figures
2
Acknowledgements We acknowledge the financial support provided through a series of reimbursable agreements between APEC and the U.S. Census Bureau dating back to calendar year 2000. Many people have contributed to this report and have made this work possible. Theresa B. Andrews, Kathleen M. Caban, and Kimberly A. DeBarros of the International Programs Center at the U.S. Census Bureau helped create and update the data tables. Sonya Rastogi, Yer Ting Hu, and Michelle Cheuk, Summer Interns at the U.S. Census Bureau provided research support. Kimberly DeBarros and Michelle Cheuk also read earlier drafts and provided constructive comments. We would also like to thank Heather Gibb, The North-South Institute, Canada, Dr. Diah Widarti, Thanh-Dam Truong, and Lisa Fancott for allowing us to preview their papers. We gratefully acknowledge all the help and support we received. However, all errors and omissions are the responsibility of the authors.
3
Executive Summary
This report is part of a project entitled “The Economic Contributions of Women
and Men in APEC Economies.” The three purposes of this project are to identify gaps in
sex-disaggregated economic data, to document women’s and men’s participation in
economic activities from the available data, and to make recommendations for
improvements in data collection and analysis. Systematic documentation of economic
activities that women perform in these economies will facilitate effective policy
development that will help level the playing field for women.
This project conducted a systematic inventory of the sex-disaggregated economic
data currently collected and disseminated by APEC economies, identified gaps in
relevant data sets, and addressed the need for reporting comparable sex-disaggregated
data across APEC economies in the future.
The report provides an overview of the economic contributions of women and
men in APEC economies. An inventory of the available data indicates gaps in the data
for many APEC member economies.1 The data used in the analyses come from various
sources including national and international organizations. The lack of sex-disaggregated
data is particularly significant in Brunei Darussalam, Malaysia, Papua New Guinea,
Chinese Taipei , and Vietnam. These deficiencies in the data are further
aggravated by a lack of common standard for reporting data by the member economies.
1 The figures and table in this report incorporates data from selected economies based primarily on data availability. In some cases, data only from a few economies are presented as examples. However, the appendix tables relate to all economies for which data are available.
4
Additionally, for some economies, the absence of historical data makes it difficult to
assess changes in women’s and men’s participation in economic activities. It is also
evident that there is a pronounced gap in the availability of data for employment for the
informal sectors of the economy. This lack of data from the informal sector particularly
limits the ability to assess women’s contributions to the economy, many of whom are
engaged in informal activities.
Key findings indicate that an increasing proportion of women are entering the
labor force in APEC economies. Yet, there are sectoral and occupational differences
between women and men. Also, women’s multiple roles including motherhood and
homemaking often create pre-conditions that may lead women to withdraw from the
formal labor market and force them to be part of the informal economy. However, in the
absence of comparable sex-disaggregated statistics on employment in the informal sector,
it is difficult to create a clear picture of women’s and men’s contribution to this sector.
This report offers suggestions for improvements in data collection that will
reinforce the gender mainstreaming goals of APEC, and emphasizes the need for:
• Sex-disaggregated employment data, preferably by age.
• A comparable system of data reporting and dissemination so that
data are comparable between economies
• Data about the informal economy
5
Glossary APEC Asia-Pacific Economic Cooperation GFPN Gender Focal Point Network ILO International Labor Organization KILM Key Indicators of the Labor Market SME Small and Medium Enterprise HDR Human Development Report HDI Human Development Indicators UNDP United Nations Development Programme UNIFEM United Nations Fund for Women
6
Introduction
The Asia-Pacific Economic Cooperation (APEC) was established in 1989 and has
since developed as the premier forum for facilitating economic growth, cooperation,
trade, and investment in the Asia-Pacific region. APEC consists of 21 member
economies: Australia, Brunei Darussalam, Canada, Chile, People's Republic of China,
Hong Kong, Indonesia, Japan, Republic of Korea, Malaysia, Mexico, New Zealand,
Papua New Guinea, Peru, The Republic of the Philippines, The Russian Federation,
Singapore, Chinese Taipei, Thailand, the United States of America, and
Vietnam. These economies together account for more than 2.5 billion people, a GDP of
19 trillion US dollars and 47 percent of world trade. It is also one of the most
economically dynamic regions in the world, generating nearly 70 percent of global
economic growth during the period 1989 to 1999. Women account for half of the
population in the APEC economies, yet little is known about the economic contributions
that women make in these economies. Among the reasons for this lack of knowledge
about women’s contributions are a general lack of sex-disaggregated data and an
underutilization of the sex-disaggregated data that are available.
In addition to its general goals of economic growth and cooperation in the region,
the APEC leadership has expressed a strong interest in advancing the economic interests
of women in the member economies. In 1998, the APEC leadership endorsed the
recommendations of the First Ministerial Meeting on Women. This meeting was held in
Makati, Philippines, and recommended the development of a ‘Framework for the
7
Integration of Women in APEC,’ which was subsequently developed and endorsed in
1999.2 The guidelines presented in this and later meetings recommended sharing
information and support between member economies and the secretariat in order to
advance gender issues and the economic interests of women, as well as recognize
women’s contributions to member economies. Some of the important issues
recommended by the APEC leadership include understanding the barriers to women
accessing finance, information, and technology for their full participation in business, the
workforce, education, and leadership. They also recognized the importance of improved
collection, monitoring, and use of sex-disaggregated data that would help identify the
possible differences in the impact of policies on women and men, as well as on different
groups and cultures within our societies.
This report summarizes findings from an analysis of women’s and men’s
economic participation in the 21 member economies. The report discusses the current
status of women and men in the labor market in general, historical trends, and sectoral
differences. It emphasizes the differences between women and men with respect to
employment, unemployment, and youth employment. The report attempts to incorporate
the latest available information for each of the member economies. This report also
highlights that some economies do not have enough detailed sex-disaggregated data to
enable gender analysis, and there is much heterogeneity between individual economy
reporting systems. It draws attention to the challenges of assessing gender differences in
economic participation based on current data availability, and presents an overview of the
state of women’s and men’s economic participation and the challenges in their paths.
2 The theme of the meeting was “Women in Economic Development and Cooperation in APEC,” with sub themes: “Women and Small and Medium Enterprises,” Women and Industrial Science and Technology”, and “Women and Human Resources Development.”
8
Some of the important questions discussed in this report include:
1. Is the female-male labor force participation gap closing?
2. What are the characteristics of female and male work?
3. Are women and men segregated into different sectors of the economy?
4. Is there wage equity between women and men?
5. Do women and men experience similar pre-conditions that help to enhance
employment?
Organization of the Report
The study is divided into five sections. Section 1 sets the context with a brief
description of the differences in labor force participation among women and men.
Section 2 includes a discussion about the employment and unemployment
situation in the APEC economies. Section 3 examines the various sectors of the
economy, occupational segregation, and gender differences in earnings. Section 4
is concerned with women’s and men’s status in employment, their engagement in
informal work, and entrepreneurship. Section 5 presents a summary of findings,
major observations, and a set of recommendations on how to promote and
strengthen women’s and men’s participation in the economy, and the need for
sex-disaggregated data.
9
I. Labor Force Participation
The economically active population is a measure of the workforce of a economy.
It comprises both employed and unemployed people who engage in or attempt to engage
in economic activities to produce goods and services. The labor force participation rates
for men and for women indicate how many of working age are participating or willing to
participate in the labor market. These rates estimate the relative size of the labor supply
available to the economy.
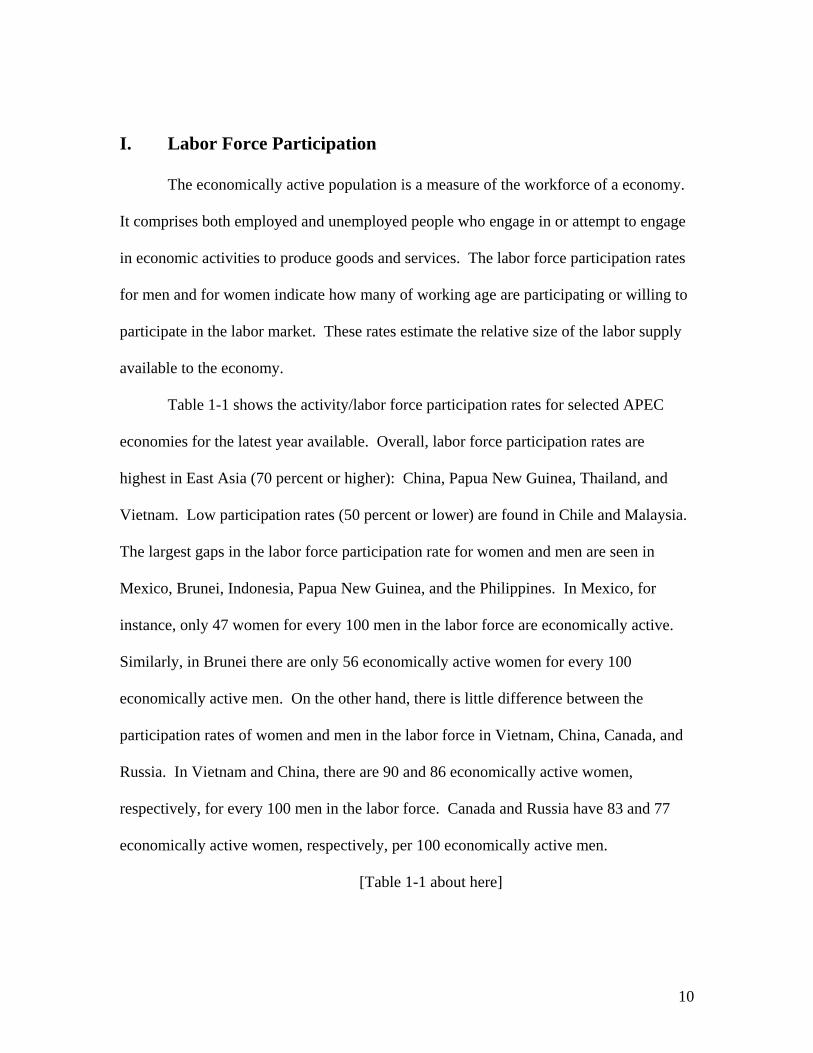
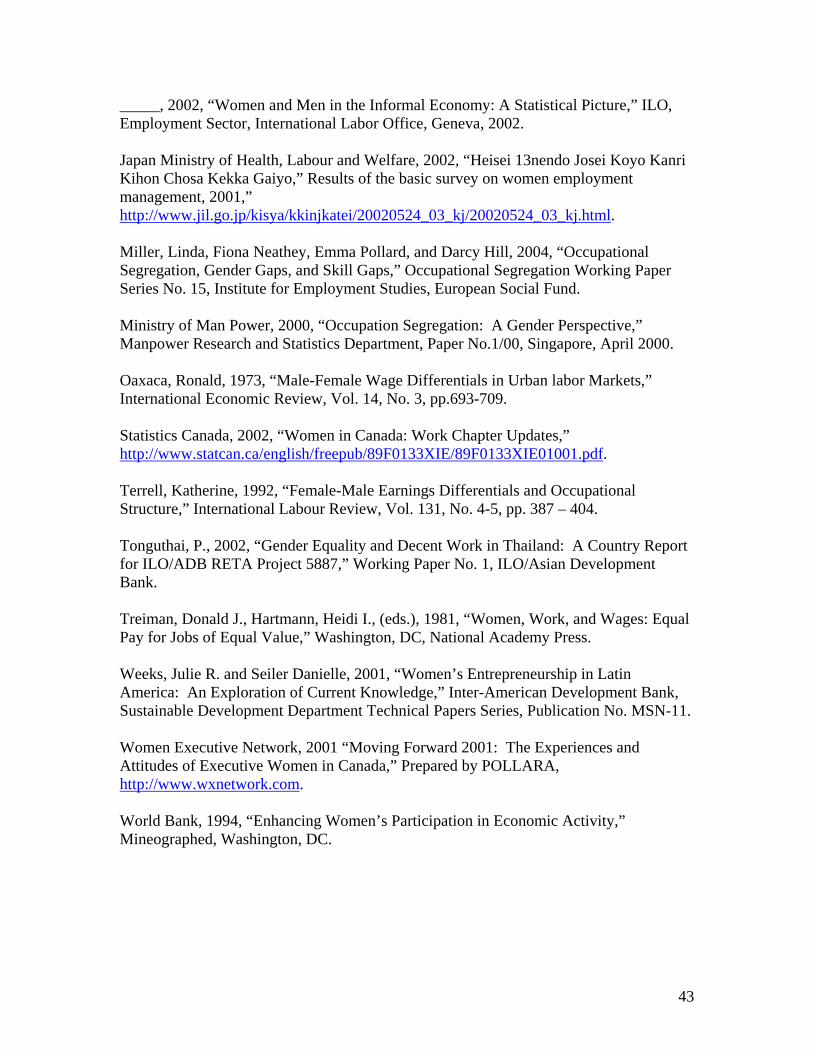
Table 1-1 shows the activity/labor force participation rates for selected APEC
economies for the latest year available. Overall, labor force participation rates are
highest in East Asia (70 percent or higher): China, Papua New Guinea, Thailand, and
Vietnam. Low participation rates (50 percent or lower) are found in Chile and Malaysia.
The largest gaps in the labor force participation rate for women and men are seen in
Mexico, Brunei, Indonesia, Papua New Guinea, and the Philippines. In Mexico, for
instance, only 47 women for every 100 men in the labor force are economically active.
Similarly, in Brunei there are only 56 economically active women for every 100
economically active men. On the other hand, there is little difference between the
participation rates of women and men in the labor force in Vietnam, China, Canada, and
Russia. In Vietnam and China, there are 90 and 86 economically active women,
respectively, for every 100 men in the labor force. Canada and Russia have 83 and 77
economically active women, respectively, per 100 economically active men.
[Table 1-1 about here]
10
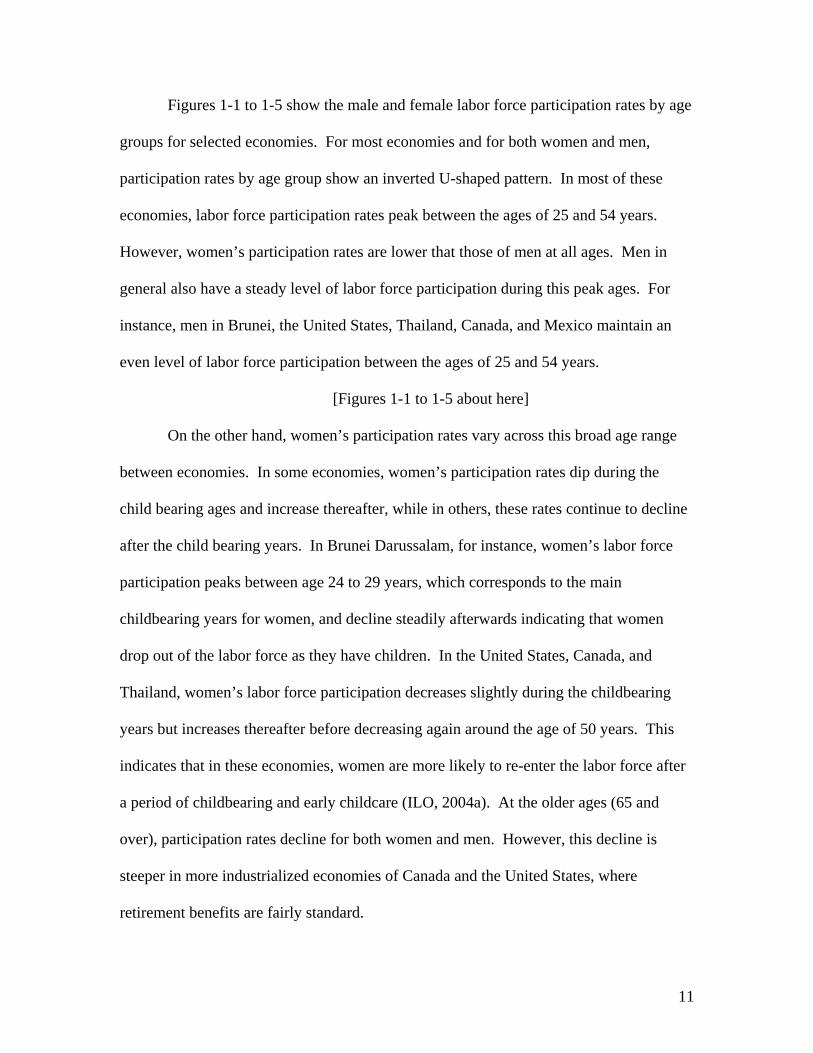
Figures 1-1 to 1-5 show the male and female labor force participation rates by age
groups for selected economies. For most economies and for both women and men,
participation rates by age group show an inverted U-shaped pattern. In most of these
economies, labor force participation rates peak between the ages of 25 and 54 years.
However, women’s participation rates are lower that those of men at all ages. Men in
general also have a steady level of labor force participation during this peak ages. For
instance, men in Brunei, the United States, Thailand, Canada, and Mexico maintain an
even level of labor force participation between the ages of 25 and 54 years.
[Figures 1-1 to 1-5 about here]
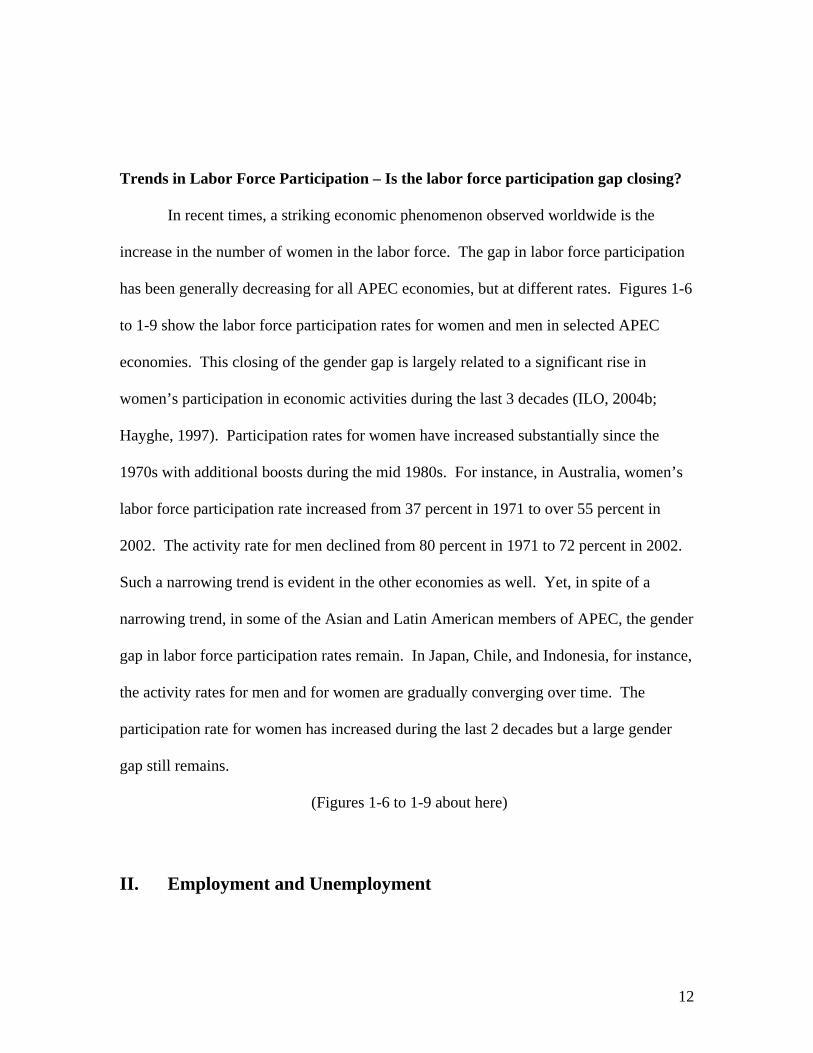
On the other hand, women’s participation rates vary across this broad age range
between economies. In some economies, women’s participation rates dip during the
child bearing ages and increase thereafter, while in others, these rates continue to decline
after the child bearing years. In Brunei Darussalam, for instance, women’s labor force
participation peaks between age 24 to 29 years, which corresponds to the main
childbearing years for women, and decline steadily afterwards indicating that women
drop out of the labor force as they have children. In the United States, Canada, and
Thailand, women’s labor force participation decreases slightly during the childbearing
years but increases thereafter before decreasing again around the age of 50 years. This
indicates that in these economies, women are more likely to re-enter the labor force after
a period of childbearing and early childcare (ILO, 2004a). At the older ages (65 and
over), participation rates decline for both women and men. However, this decline is
steeper in more industrialized economies of Canada and the United States, where
retirement benefits are fairly standard.
11
Trends in Labor Force Participation – Is the labor force participation gap closing?
In recent times, a striking economic phenomenon observed worldwide is the
increase in the number of women in the labor force. The gap in labor force participation
has been generally decreasing for all APEC economies, but at different rates. Figures 1-6
to 1-9 show the labor force participation rates for women and men in selected APEC
economies. This closing of the gender gap is largely related to a significant rise in
women’s participation in economic activities during the last 3 decades (ILO, 2004b;
Hayghe, 1997). Participation rates for women have increased substantially since the
1970s with additional boosts during the mid 1980s. For instance, in Australia, women’s
labor force participation rate increased from 37 percent in 1971 to over 55 percent in
2002. The activity rate for men declined from 80 percent in 1971 to 72 percent in 2002.
Such a narrowing trend is evident in the other economies as well. Yet, in spite of a
narrowing trend, in some of the Asian and Latin American members of APEC, the gender
gap in labor force participation rates remain. In Japan, Chile, and Indonesia, for instance,
the activity rates for men and for women are gradually converging over time. The
participation rate for women has increased during the last 2 decades but a large gender
gap still remains.
(Figures 1-6 to 1-9 about here)
II. Employment and Unemployment
12
Employment and unemployment are among the most closely watched measures of
economic activity and utilization of labor. Recent and long-term trends in employment
and unemployment provide a comprehensive picture of an economy. With sex-
disaggregated data, this information can be used for gender-sensitive planning and policy
implementation.
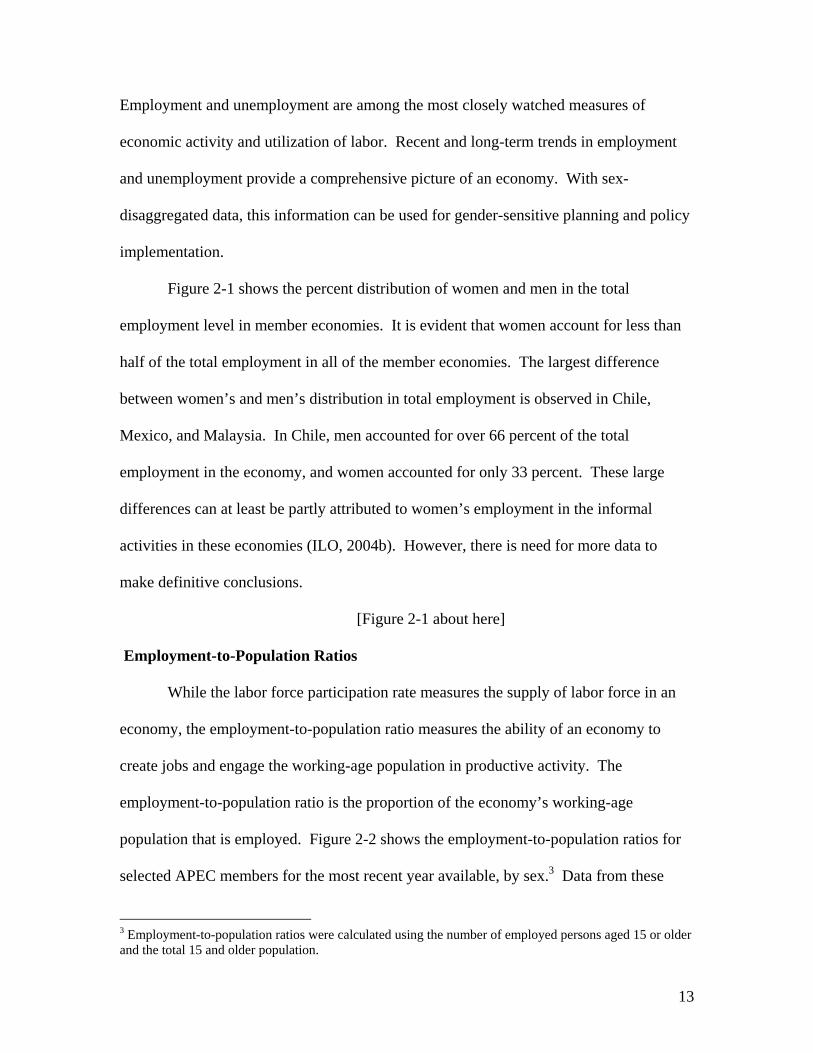
Figure 2-1 shows the percent distribution of women and men in the total
employment level in member economies. It is evident that women account for less than
half of the total employment in all of the member economies. The largest difference
between women’s and men’s distribution in total employment is observed in Chile,
Mexico, and Malaysia. In Chile, men accounted for over 66 percent of the total
employment in the economy, and women accounted for only 33 percent. These large
differences can at least be partly attributed to women’s employment in the informal
activities in these economies (ILO, 2004b). However, there is need for more data to
make definitive conclusions.
[Figure 2-1 about here]
Employment-to-Population Ratios
While the labor force participation rate measures the supply of labor force in an
economy, the employment-to-population ratio measures the ability of an economy to
create jobs and engage the working-age population in productive activity. The
employment-to-population ratio is the proportion of the economy’s working-age
population that is employed. Figure 2-2 shows the employment-to-population ratios for
selected APEC members for the most recent year available, by sex.3 Data from these
3 Employment-to-population ratios were calculated using the number of employed persons aged 15 or older and the total 15 and older population.
13
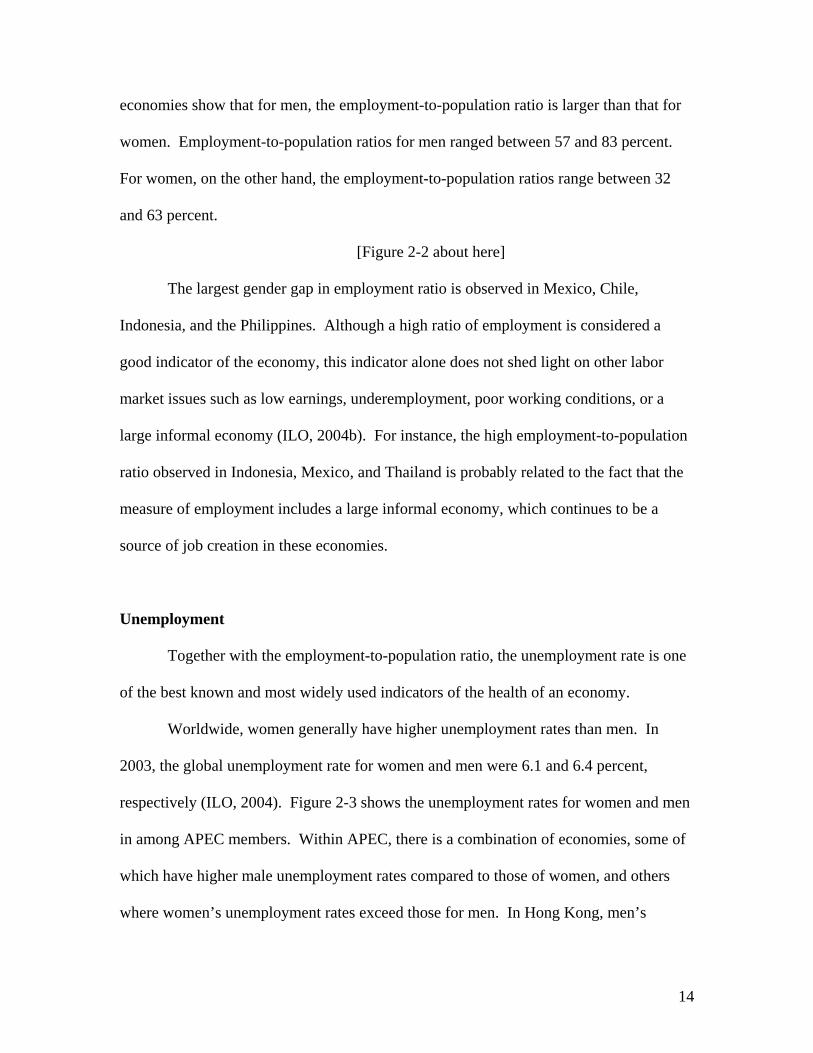
economies show that for men, the employment-to-population ratio is larger than that for
women. Employment-to-population ratios for men ranged between 57 and 83 percent.
For women, on the other hand, the employment-to-population ratios range between 32
and 63 percent.
[Figure 2-2 about here]
The largest gender gap in employment ratio is observed in Mexico, Chile,
Indonesia, and the Philippines. Although a high ratio of employment is considered a
good indicator of the economy, this indicator alone does not shed light on other labor
market issues such as low earnings, underemployment, poor working conditions, or a
large informal economy (ILO, 2004b). For instance, the high employment-to-population
ratio observed in Indonesia, Mexico, and Thailand is probably related to the fact that the
measure of employment includes a large informal economy, which continues to be a
source of job creation in these economies.
Unemployment
Together with the employment-to-population ratio, the unemployment rate is one
of the best known and most widely used indicators of the health of an economy.
Worldwide, women generally have higher unemployment rates than men. In
2003, the global unemployment rate for women and men were 6.1 and 6.4 percent,
respectively (ILO, 2004). Figure 2-3 shows the unemployment rates for women and men
in among APEC members. Within APEC, there is a combination of economies, some of
which have higher male unemployment rates compared to those of women, and others
where women’s unemployment rates exceed those for men. In Hong Kong, men’s
14
unemployment rate is 2.4 percentage points higher than that of women, while in most
Latin American APEC members unemployment rates have been historically higher for
women than men (ILO, 2004c).
[Figure 2-3 about here]
Youth unemployment
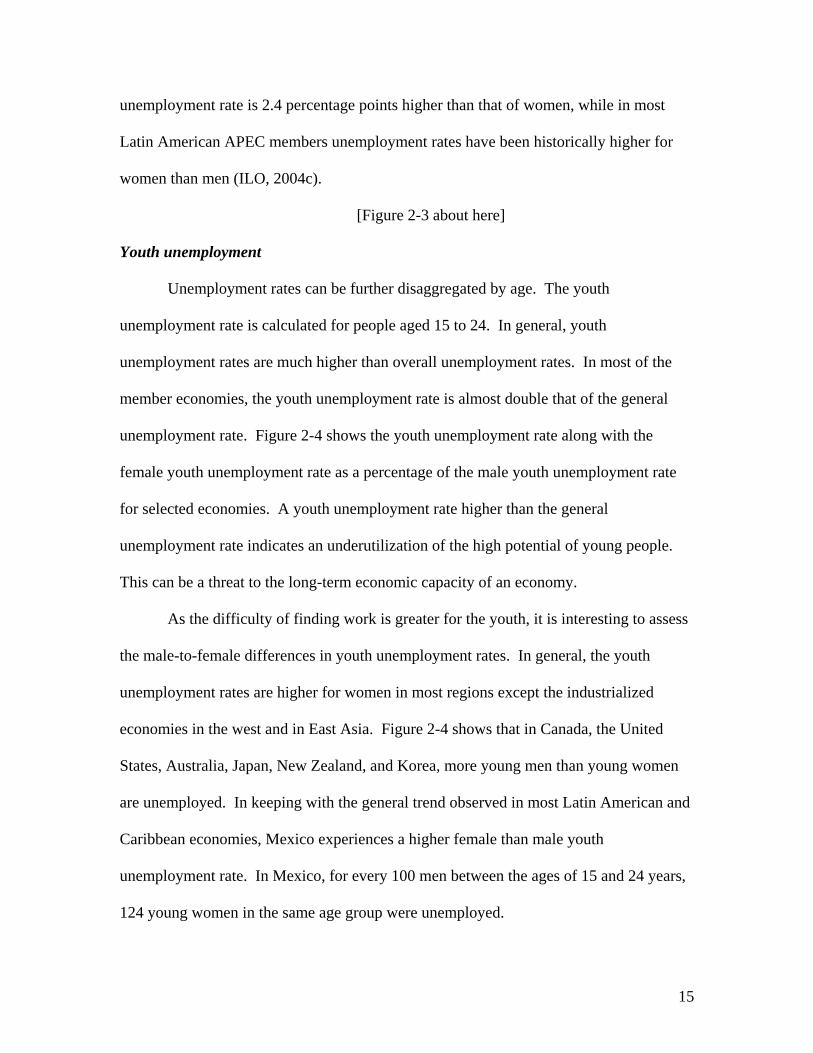
Unemployment rates can be further disaggregated by age. The youth
unemployment rate is calculated for people aged 15 to 24. In general, youth
unemployment rates are much higher than overall unemployment rates. In most of the
member economies, the youth unemployment rate is almost double that of the general
unemployment rate. Figure 2-4 shows the youth unemployment rate along with the
female youth unemployment rate as a percentage of the male youth unemployment rate
for selected economies. A youth unemployment rate higher than the general
unemployment rate indicates an underutilization of the high potential of young people.
This can be a threat to the long-term economic capacity of an economy.
As the difficulty of finding work is greater for the youth, it is interesting to assess
the male-to-female differences in youth unemployment rates. In general, the youth
unemployment rates are higher for women in most regions except the industrialized
economies in the west and in East Asia. Figure 2-4 shows that in Canada, the United
States, Australia, Japan, New Zealand, and Korea, more young men than young women
are unemployed. In keeping with the general trend observed in most Latin American and
Caribbean economies, Mexico experiences a higher female than male youth
unemployment rate. In Mexico, for every 100 men between the ages of 15 and 24 years,
124 young women in the same age group were unemployed.
15

[Figure 2-4 about here]
Long-term unemployment
The long-term unemployment rate shows the duration or length of time that an
unemployed person has been looking for work. While short periods of joblessness can
cause negative consequences, it is of lesser concern than the long-term rate, especially
when unemployed individuals are covered by insurance for short time job loss, and when
people use this time to seek optimal employment, or when employers allow this time to
weather temporary shortfalls in business (ILO, 2004a). On the other hand, long-term
unemployment can not only cause loss of income but also diminish the employability of
the job seeker. Figure 2-5 shows the long-term unemployment rates as a percentage of
total unemployment for selected economies in 2002. Korea and Mexico exhibit some of
the lowest long-term unemployment rates while Japan has the highest. Men in general
experience a higher rate of long-term employment. The gender gap, however, varies
between economies, with Japan experiencing the largest male disadvantage almost 14
percentage points higher than that of women.
[Figure 2-5 about here]
Although unemployment rate is one of the most used labor market measures,
differences in definitions between economies limit its ability to provide a clear picture of
the shortcomings of the labor market. For instance, in some economies, definitions of
unemployment exclude those individuals who want to work but are not actively looking
for work, mainly because they feel that no work would be available or because they have
restricted labor mobility and face discrimination related to cultural, social, or structural
barriers. Interestingly, in most economies, this group of ‘discouraged workers’ is often
16
largely made up of women (ILO, 2004b). It is, therefore, extremely important to exercise
caution in interpreting unemployment rates and trends. For instance, a reduction in
unemployment rates for women could simply indicate a situation where women are
totally opting out of the labor market, reducing work time, or working part-time due to
deteriorating economic conditions. Part-time work indicates fewer numbers of hours of
work in general. However, as there is no agreed international definition of how many
hours constitute part-time work, the rate of part-time employment is measured either on a
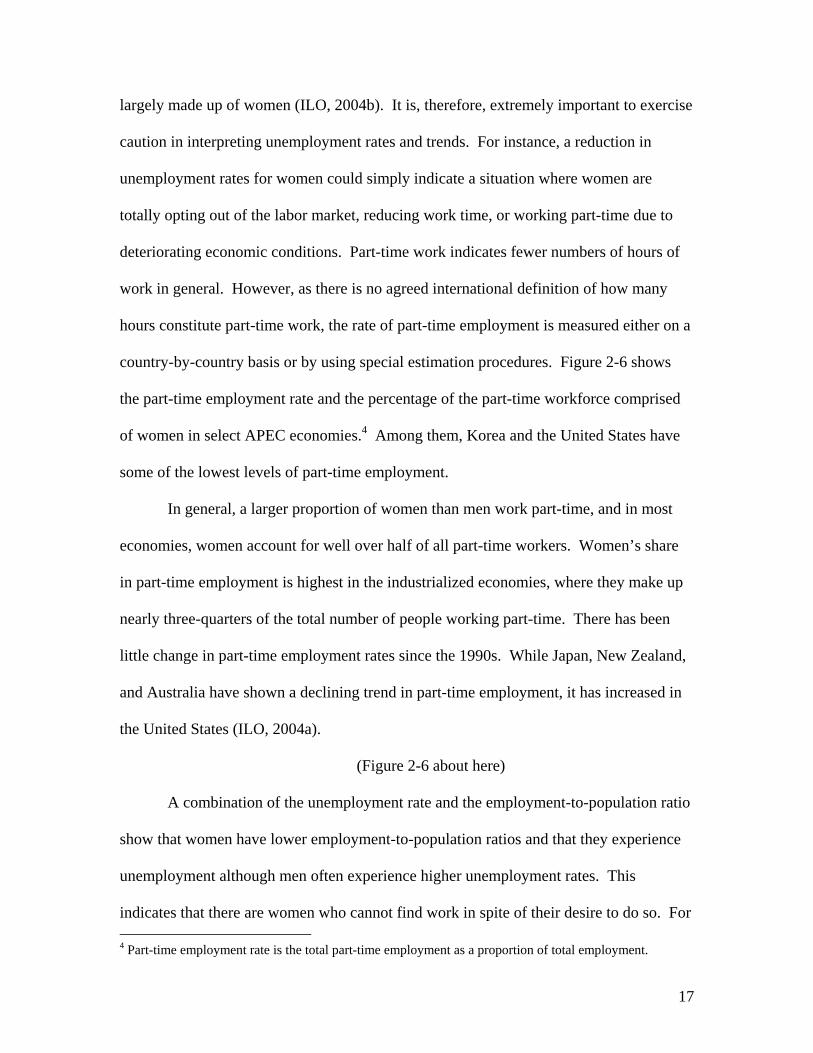
country-by-country basis or by using special estimation procedures. Figure 2-6 shows
the part-time employment rate and the percentage of the part-time workforce comprised
of women in select APEC economies.4 Among them, Korea and the United States have
some of the lowest levels of part-time employment.
In general, a larger proportion of women than men work part-time, and in most
economies, women account for well over half of all part-time workers. Women’s share
in part-time employment is highest in the industrialized economies, where they make up
nearly three-quarters of the total number of people working part-time. There has been
little change in part-time employment rates since the 1990s. While Japan, New Zealand,
and Australia have shown a declining trend in part-time employment, it has increased in
the United States (ILO, 2004a).
(Figure 2-6 about here)
A combination of the unemployment rate and the employment-to-population ratio
show that women have lower employment-to-population ratios and that they experience
unemployment although men often experience higher unemployment rates. This
indicates that there are women who cannot find work in spite of their desire to do so. For 4 Part-time employment rate is the total part-time employment as a proportion of total employment.
17
member economies, where the unemployment rate is higher among women than men, it
is clear that more employment opportunities need to be created for them. While in
industrialized economies, some women can afford and choose to remain out of the work
force, it is likely that in many economies, women would work if there were opportunities
available. A first step is to create a more balanced playing field for women and men is to
provide women and men equal access to education and opportunities in acquiring skills
useful in the labor market.
Trends in Employment and Unemployment – Do women who look for work find
work?
Women are gradually closing the gap in their share of the employed labor force
(ILO, 2004b). In the United States, the percent of women in the employed work force
increased from 37 percent in 1969 to 51 percent in 2002. In some member economies in
Southeast Asia, like Indonesia and Malaysia, there has been a slight decline in women’s
share since the early 1990s. In others like Chile and Mexico, in spite of an increase in
women’s share of the employed work force, the gap between women and men is still
prominent.
[Figures 2-7 to 2-8 about here]
There was remarkable variation among economies in the employment-population
ratios during previous decades. Among APEC economies, the industrialized economies
of Australia, Canada, New Zealand, and the United States have shared a high capacity to
create jobs. In the East and South East Asian economies, the trends reflect regional
economic gains, losses, and employment instabilities (ILO, 2004c).
18
In order to assess the unemployment situation by sex, Figures 2-9 to 2-10 show
trends in the unemployment rate for women and men in Canada and the United States.
Trends in unemployment vary between member economies and reflect regional and
national economic conditions. The United States and Canada have experienced moderate
declines in unemployment for women and men during the last 2 decades although since
2000, these rates have increased. Like most other Latin American economies, Chile
shows a decline in unemployment rates, particularly for men. Labor markets in most
Latin American economies are recovering from recession and local economic crises of
recent years.
[Figures 2-9 to 2-10 about here]
Unemployment is a relatively new phenomenon in East Asia and is still at a low
level in the East Asian APEC economies. Southeast Asia has a diverse set of economies
with different unemployment outlooks. As a group, economies in this region have
experienced an increase in unemployment for both women and men, but particularly
women, although the rates are still relatively low. The current unemployment rate is
relatively higher than the rate before the Asian financial crises.
III. Employment Sectors, Occupation, and the Gender Gap in
Earnings
An analysis of the distribution of women and men in various sectors of the
economy and in varied occupations provides another view of the gender component of an
economy. This section of the report focuses on the sectors of employment, occupational
segregation, and differences in earnings between women and men.
19
Employment by Sector - Are different sectors of the economy favorable for women
and men?
Sectoral data on employment divides the economy into three broad categories:
agriculture, manufacturing, and services. Figures 3-1 to 3-3 show the percent share of
employment in these categories by sex. Barring a few South East Asian economies,
where agriculture continues to be a major source of employment, most of the APEC
member economies have the largest share of employment in the services sector, followed
by manufacturing, and a smaller proportion in agriculture. Indonesia and Thailand, with
larger agricultural sectors have 40 percent of their women and men employed in
agriculture. These economies exhibit a smaller gender gap in employment in agriculture
compared to those where agriculture employs only a small share of the labor force.
The share of employment in manufacturing varies remarkably between women
and men in most economies. There are higher proportions of men than women in
agriculture and manufacturing, whereas a higher proportion of women than men work in
the services sector in most economies. The female share of employment in service
industries exceeds that of men by 15 percentage points or more in 10 of the economies,
with Chile having the largest difference of over 30 percentage points.
[Figure 3-1, Figure 3-2 and Figure 3-3 about here]
Within the services sector, women are more likely to be in those jobs that are
traditionally associated with care-giving gender roles such as in social, personal, and
educational services (ILO, 2004b). Figure 3-4 shows the number of women and men
employed in educational, financial, and community services for these economies.
20
[Figure 3-4 about here]
Generally, time trends in employment by sector show a decline in employment in
agriculture and manufacturing for both women and men (ILO, 2004c). Segregation of
job sectors by sex is gradually declining, but at a very slow rate, and continue to
experience discrimination as stereotypes continue to associate women with care-giving,
and more docile and often home-based activities.
Occupational Segregation
Sex-segregation in different occupations is one of the most interesting and often
troubling aspects of segregation in an economy. Apart from the issues of equality of
opportunity, occupational segregation by sex is a major contributing factor to the gender
gap in earnings (Forth, 2002; Miller et al., 2004). Occupational segregation by sex,
which is often extensive in some regions of the world, is one of the most enduring
phenomena of labor markets (Anker, 1997). Figure 3-5 shows the percentage of female
and male legislators, senior officials, and managers in select economies. The statistics
show that over 50 percent of those engaged in these professions are men in most
economies (with the exception of new Zealand and the Philippines). Furthermore, in
some parts of East Asia, including Japan and Korea, over 90 percent of legislators, senior
officials, and managers are men.
[Figures 3-5 and 3-6 about here]
Figure 3-6 shows the sex distribution of professional and technical workers for
selected APEC members. Among the 15 economies shown in the Figure, women’s share
in professional jobs is highest in the Philippines, followed by Russia, and Thailand.
21
The main factors that lead to such occupational segregation are cultural and social
norms and attitudes that define “male” and “female” jobs and an even deeper male-
female disparity in education. Occupational segregation of this order can be of two
types; the first level of segregation relates to the type of work and is called “horizontal
occupational segregation” (Anker, 1997; ILO, 2004). For instance, traditionally, more
men are employed in the engineering, judicial, and financial professions, while women
dominate the ‘softer’ professions like teaching. In Canada, for example, in 2001, 79
percent of women employees were in teaching, nursing, clerical/administrative, and
sales/service jobs. Similarly in Singapore, Korea, and Mexico women are
underrepresented in the administrative and managerial occupations as well as
professional and technical occupations (Ministry of Manpower, Government of
Singapore, 2001; Kong, 1997; UNIFEM, 2000).
The second form of segregation, also termed as “vertical occupational
segregation” relates to differences in position and remuneration within the professions.
For instance, even within the medical profession, more men are likely to be doctors and
administrators, while women dominate the nursing jobs.
Sex-segregation into professions such as teaching, nursing and clerical
occupations can partly be attributed to the greater flexibility in terms of the part-time and
temporary work available in these occupations (ILO, 2004d). These advantages appeal to
the women who generally have household and other responsibilities. Often women have
to make a choice not only between paid work and family but also between occupations in
order to prioritize between their family life and professional life.
22
A 2001 study surveying about 1200 female and male executives in different
regions of the world found that 32 percent more women than men delayed marriage or
having a family in order to establish their careers (Families and Work Institute, 2003).
Results from the same survey showed that 34 percent of women and 24 percent of men
had reduced their career aspirations for their personal or family lives. A survey in
Canada in 2001 found that among women executives, 47 percent had even considered
leaving their jobs to find a better balance between work and family (Women Executive
Network, 2001).
An informal survey conducted in a few Latin American economies showed that
when women started a family, they more often negotiated vacation time and flexible
work hours in place of promotions and wage increases, and some even left the workforce
(although the survey also showed that in most Latin American economies, where the
focus is on the family, the availability of family support for childcare make it easier for
some women to continue with their careers) (Braine, 2002).
In most economies, women are underrepresented in managerial positions,
particularly at the higher levels. According to the U.S. General Accounting Office, in
2002, women represented 47 percent of the work force but only 12 percent of all
managerial jobs and were largely underrepresented in the higher positions. Over 60
percent of women managers in the United Stated are in the medical services, hospitals,
and education. Similarly in Canada, women held 35 percent of managerial jobs and 23
percent were at the senior management level in 2001 (Statistics Canada, 2002).
In Japan, where women are seriously underrepresented in managerial jobs, a
survey of 6,700 companies in 2002 showed that 12 percent of women managers were
23
working as sub-section chiefs, 6 percent were section chiefs, and 3 percent were
department heads (Japan Ministry of Health, Labor, and Welfare, 2002). Furthermore,
the survey indicated that male employees were promoted more rapidly than female
employees who had the same educational qualifications. In Thailand’s private sector,
women’s share of directors was 29 percent compared to over 40 percent as officers,
supervisors, and department managers (Tonguthai, 2002)
Estimates of women’s share of executive heads of organizations are limited and
differently defined in different economies, making it even more difficult to make cross-
national comparisons. A survey of 200 top companies in Australia showed that in 2002,
8.2 percent of board positions were held by women and only 1 percent (2) were CEOs
(ILO, 2004d). Out of these companies, over half had no women executive managers, 30
percent had had just one woman executive manager, and nearly 20 percent had multiple
women executive managers. Most of the executive managerial jobs held by women
were in software, banking, telecom, insurance, and retailing, and some in real estate,
hotels and restaurants and leisure and energy.
In Canada, women held 14 percent of the corporate officer positions in FP500
companies in 2002.5 Another survey done in the United States showed that women held
14 percent of board positions in Fortune 500 companies in 2003.
Progress toward a balanced distribution of professional jobs between women and
men reflect an evolving situation of gender equality in an economy. Among the APEC
members in general, there has been a gradual increase in women’s share of professional
jobs. Overall, women’s share has increased and women have also made in-roads into
male dominated professional jobs (ILO, 2004d). However, in spite of these 5 Canada's top 500 private & public companies
24
improvements, women continue to have a smaller share of professional jobs in many of
these selected economies. For instance, in Mexico, where women have increased their
share in professional jobs by 10 percentage points between 1991 and 2000, women’s
share of these jobs still remained at 24 percent in 2000.
Women tend to be over-represented in the clerical occupations in most
economies. Women are also generally underrepresented in craft and production related
occupations, skilled agriculture, and plant and machinery-related occupations, where the
nature of work in more strenuous. Figures 3-7 to 3-9 show the detailed occupations held
by women and men in Mexico, Australia, and Peru.
[Figures 3-7, 3-8, and 3-9 about here]
Earnings Gaps - Is there wage equity between women and men?
In general, women earn less than men. Apart from women’s concentration in
low-paying non-professional jobs, gender differences in education and job training,
society’s attitude toward women’s ability to work leading to differences in pay within the
same occupation are some of the main factors that lead to a gap between women’s and
men’s earnings. In addition to these factors, there are other disadvantages created by
social, cultural, and institutional barriers (Anker, 1997; Gunderson, 1994). Empirical
studies that have analyzed the gender gap in wages divide these factors into two major
groups: differences related due to differences in productivity, and differences in returns
from their endowments (Oaxaca, 1973). One such study estimated that about a third of
the male-female differential in wages is due to occupational segregation by sex (Terrell,
1992; Gonzalez, 1991; Treiman and Hartmann, 1981; World Bank, 1994)
25
Due to the lack of sex-disaggregated data on income and wages, direct measures
of income are often unavailable and have to be estimated or derived. Also, when
differences in wages are measured by occupations, the rates are greatly affected by the
level of aggregation of the occupational data. Gender differences in wages based on
occupations are more evident when occupational data are more disaggregated (Anker,
1997). Figure 3-10 shows the percent of estimated female to male earned income derived
from estimates of male and female earned income.6 The percentage of female to male
earned income varies between economies, ranging from 27 percent in Peru to 71 percent
in Australia. Canada, China, New Zealand, Russia, Thailand, United States and Vietnam
are some of the other members where women earn over 60 percent of men’s earned
income. Among economies that have some of the largest female disadvantage in
earnings are Peru, Chile, and Mexico.
[Figure 3-10 about here]
In addition to socio-cultural and education barriers, women often experience a
shorter and more disrupted career span than men, which also leads to less pay and fewer
promotions. For instance, women are more likely to take time off from work during the
childbearing years, and also have time, travel, and relocation restrictions (ILO, 2004d).
Such limitations along with the other barriers may not only lead to a gender gap in wages
but also a gap in the ‘perks’, bonuses, commissions, profit sharing, and retirement
benefits between women and men. In fact studies in several industrialized economies
suggest that mothers tend to earn less than other women and that while one child could
6 The data used to estimate these measures include the ratio of female non-agricultural wage to the total non-agricultural wage, male and female shares of the economically active population, the total female and male population, and the GDP per capita (for more detail, see Human Development Report, 2004).
26
lead to an earnings loss of 6 to 7 percent for the mother, the penalty could be 13 percent
for 2 children (Harkness and Waldfogel, 2004).
Various surveys in different economies have also shown that women earn less
than men even when they have the same educational qualifications. In a survey
conducted in Japan in 2001, it was found that women earned about 65 percent of men’s
earnings, and that women graduates between the ages of 35 and 50 earned 81 percent and
60 percent respectively of what men in the same age groups and with same degrees
earned. In the financial and insurance sectors, women graduates earned only about half
of men’s earnings (53 percent). When asked about the reason for these disparities in
earnings, Japanese respondents attributed wage differentials to the concentration of
women in lower paid jobs, less time spent with a single employer, and men receiving
allowances as the head of the family.
Similarly in 2000 in Korea, women who were university graduates earned nearly
three- fourths of men’s earnings with the same qualifications. Singapore had a similar
situation with women earning about 75 percent of what men earned. According to
respondents in Singapore, the wage gap has narrowed in professional jobs and most of
the differential was related to women’s lower qualification and lesser experience, rather
than discrimination. In 2000, women directors in Thailand earned an average monthly
income that was 80 percent that of men. Public sector salaries in New Zealand were 17
percent less than that of men in 2002 and managers earned 16 percent less if they were
women.
Women managers and professionals in the United States earned 71 percent of
men’s earnings. In the “executive, administrative, and managerial” and the
27
‘professional” groups, women earned 67 and 73 percent respectively of what men in
these same groups earned. In the financial sector, which has some of the most well-paid
jobs, women managers earn only 65 percent of men’s salaries. Among lawyers, who are
the best paid among professionals; women earn nearly 70 percent of men’s wages. The
wage differentials are smaller in management jobs related to personnel, training, and
labor relations.
With globalization and increasing trade liberalization, some recent research has
focused on the impact of trade agreements on women’s employment and living standard.
These studies largely agree that such liberalization increases women’s paid employment.
However, this increase often shields caveats that include a continuing gender gap in
earnings, job insecurity, sectoral relocation, and an increase in women’s overall work
burden and working hours (Cagatay, 2001; Cardero, 2000).
IV. Status in Employment, Informal work, and Entrepreneurship
Gender equality, status in employment, and entrepreneurship go hand in hand. With
women’s increased participation in the economy, policymakers and planners need to be
aware of the economic significance of women's productive activities and the nature of
their contribution to income generation. Therefore, some of the fundamental issues that
need to be explored include women’s and men’s status in employment, informal work,
and their role as entrepreneurs.
28
Status in Employment
Using the status in employment indicator, the employed population can be divided
into 3 broad categories, namely employees who are wage and salary workers; self-
employed workers who are either employers (self-employed workers with employees) or
own-account workers (self-employed workers without employees), and contributing
family workers who are unpaid family workers.
Figures 4-1 and 4-2 show the employment status of women and men in selected
APEC economies for the latest year available. There are differences in the status of
employment between economies and between the sexes, although wage and salary
workers form the dominant group irrespective of economy and sex. In general, more men
were self-employed than women and among those self-employed, both women and men
were predominantly own-account workers without employees. However, among those
self-employed, more men were employers than women. In East and Southeast Asia,
including Thailand, Korea, and Japan, and some Latin American and Caribbean
economies like Peru and Mexico, the share of female- contributing family workers in
total employment is higher than that of men, and women are also less likely to be salaried
workers.
[Figure 4-1 and Figure 4-2 about here]
There is some evidence that even among women who are salaried workers, more
women are likely to be in non-regular or atypical employment (ILO, 2004b). While men
are more likely to be hired in regular or core better–paid positions, women are
increasingly being hired in peripheral, insecure, less-valued jobs including home-based,
29
casual, or temporary work. These jobs are often characterized by very low pay, irregular
income, little or no job security, and a lack of social protection.
When the APEC economies are viewed over time, a variety of patterns evolve in
women’s and men’s employment status. While New Zealand, Korea, and Australia show
an increase in employees and a decrease in contributing family workers, Japan shows a
decrease in the self-employed (both own-account workers and employers).
[Figures 4-3, 4-4, 4-5]
Informal Employment
Informal work is a part of the economy in developing as well as developed
economies. Definitions of informal work have changed and evolved since the informal
sector was discovered and includes a variety of visible workers like street vendors,
luggage cart pullers, bicycle peddlers, as well as less visible workers including repair
workshops in small kiosks or stalls, small merchandise shops on street corners, home-
based sellers and producers of embroidered goods, shoemakers, food processors, casual
workers in restaurants, sub-contracted janitors and security guards, and temporary office
staff. Although the conditions of work and the level of earnings vary markedly
depending on the type and sector of informal work, most of these workers lack social
protection.
With changes in definitions and inclusion and expansion of the concept, informal
employment is now understood to include all remunerative work including self-
employment and wage employment, which are not recognized, regulated, or protected
within a legal and regulatory framework of an income-producing framework (ILO, 2002).
Informal enterprises can be classified by type of unit or employment status. They include
30
micro-enterprises with an employer and employees, family businesses with an owner-
operator and often other unpaid family workers, and own-account operations with an
individual owner-operator. The employees may either consist of those employed in
informal enterprises or domestic workers who do not have regular contracts; casual
workers with a fixed employer; industrial outworkers for formal firms, informal firms
and their intermediaries; and unregistered or undeclared workers.7
Few economies have information on their informal sectors and even fewer have
collected survey data on informal employees outside of the informal sector. In the
absence of such direct measures, most of our information about informal workers comes
from indirect estimates. These estimates show that the informal sector contributed
significantly to the non-agricultural GDP in some of the member economies. For
instance, in Mexico the informal sector contributes about 13 percent of the non-
agricultural GDP in 1998, while it contributed over 30 percent of the non-agricultural
GDP in Indonesia and the Philippines.
Sex-disaggregated data about the contribution of the informal sector to the total
non-agricultural GDP is available for only a few economies. Figure 4-6 shows informal
employment as a percentage of non-agricultural employment by sex for selected
economies. Indonesia and the Philippines had some of the highest levels of informal
employment in the non-agricultural sector. Informal employment is generally a larger
source of employment for women than men. Indonesia is an exception. Caution needs to
be used in interpreting the data in Figure 4-6 since it excludes agricultural activities,
which are a major source of employment, particularly for women, thereby
7 For a more detailed discussion of the informal economy and its components, see “Women and Men in the Informal Economy: A Statistical Picture,” ILO, 2002.
31
underestimating the size of informal employment. Among the few that have included
informal agriculture as a distinct type of informal employment, estimates from Mexico
show that when informal agriculture is included, the significance of informal employment
increases. In Mexico, about 58 percent of women and 64 percent of men are in informal
employment.
[Figure 4-6 about here]
As Figure 4-7 and Figure 4-8 show, self-employment has a larger share of non-
agricultural informal employment than wage-employment in most economies. Among
the economies reported, more women than men in Indonesia, the Philippines, and
Thailand are informal workers, who are self-employed. In contrast, over 60 percent of
women in Chile are informal wageworkers.
[Figures 4-7 and 4-8 about here]
Measuring employment in the informal sector in industrialized economies
involves an analysis of non-standard employment arrangements, where there is no access
to basic labor rights and employment-based social protection. Such arrangements include
part-time and temporary employment in formal firms, self-employment (own-account
workers without employees), inter-firm subcontracted work, and industrial outwork
including homework, sweatshop work, and day labor.
Women comprise the majority of part-time workers. This share ranges from 55
percent in Korea to nearly 75 percent in New Zealand.8 The main occupations of part-
time workers are services and sales, clerical, and low-skilled labor (ILO, 2002). Women
are mostly concentrated in service and sales. For most economies, hourly earnings of
part-time workers represent 55 to 90 percent that of full-time workers. However, the 8 See Figure 3-10 for distribution of male and female part-time workers in selected economies.
32
wage differential between male and female part-time workers is less than that between
comparable full-time workers. This is mainly attributed to the fact that women’s full-
time jobs are not significantly different from women’s part-time jobs and that male part-
time jobs are associated with only a few select occupations (ILO, 2002).
Another form of informal employment in these economies is temporary
employment. In the United States in 1999, temporary workers were about 4.1 percent of
those employed. In Japan in 1997, the majority of the 12 percent of temporary workers
were women (Houseman et al., 1999). Self-employed is the third category of non-
standard work and represented less than 10 percent of non-agricultural employment in the
United States, Japan, and New Zealand (ILO, 2002).
Women and Men in Business
Entrepreneurship is an effective measure of women’s and men’s contribution to
an economy. In fact, business ownership in general is not only an indicator of economic
growth, but women’s entrepreneurship has a stronger correlation with GDP growth than
work force participation or occupation (Weeks and Seller, 2001). But more importantly
and in addition to increasing economic growth and providing job opportunities for job
seekers, women’s entrepreneurship improves the socio-economic and health status of
women and their families. Yet, little quantitative and comparable data across economies
is available to analyze women’s and men’s contribution to their economies through their
entrepreneurial activities.
The most comparable and frequently used data across economies is on the status
of employment that differentiates between employees, own-account workers, and
33
employers. Although the information about employers does not distinguish between
small and medium-sized enterprises and micro-enterprises, it provides a snapshot of
entrepreneurship across economies. More men than women are employers.9 However,
women’s and men’s share in business ownership varies between economies: United
States, Canada, New Zealand, Australia, where women own at least a third of the
businesses versus Japan and Mexico, where women’s share is less than 20 percent. In the
United States for instance, women alone own 26 percent of firms in addition to 17
percent that are owned jointly by women and men (Chun, 1999). In Korea and Mexico,
women own over 30 percent of the businesses (Figures 4-9, 4-10, 4-11). Furthermore, in
some economies in Latin America, women’s share in self-employment (own-account
workers and employers) more than doubled between 1970 and 1990 (Weeks and Seller,
2001).
(Figures 4-9, 4-10, 4-11 about here)
Yet, data on sales revenues and receipts for male and female–owned business,
when available, show that businesses owned by women are smaller in sales revenue than
men-owned firms. For instance, in the United States, women-owned firms earn only
about 4 percent of sales revenue compared to 36 percent by men-owned firms (Figure 4-
12). In Canada, over 40 percent of women-owned firms had sales revenue of under
$250,000, over 80 percent had revenue under $500,000, and 90 percent less than $1
million (Figure 4-13). Similarly, another survey in the Philippines found that a majority
of those surveyed had annual sales less than US$ 40000 (Figure 4-14).
(Figures 4-12, 4-13, 4-14 about here)
9 See section on ‘Status in Employment’ for details.
34
An analysis of survey data from various APEC members shows that much of this
discrepancy between women’s and men’s share in business ownership and their share in
sales revenue is related to different characteristics of their enterprises.10 These data show
that women-owned businesses are smaller in size than businesses owned by men. Among
the self-employed, women are less likely than men to be employers and more likely to be
self-employed without employees or work as unpaid family workers. In the United States
for instance, only 7 percent of firms with paid employees are owned by women compared
to 8 percent that are jointly-owned, and 42 percent that are owned by men (Figure 4-15).
Among those women and men who own businesses that have employees, women-owned
businesses have fewer employees than their male counterparts. Figure 4-16 and Figure 4-
17 show women’s share in business by size of business. Although the size groupings
vary across economies, in all the selected economies, women have a larger share in
smaller businesses than men. The size of a firm has important implications for growth
and development since earlier studies have shown that smaller firms are less likely to be
aware of and use financial support, internet facilities, and training programs, which are
important for a business to be successful (Weeks and Seiler, 2001).
(Figure 4-15, 4-16, 4-17 about here)
Women-owned firms are also younger than men-owned firms, and due to the
fewer years that these firms have been in business, they are less likely to be aware of
available business resources and use them to their benefit. Women owned firms, unlike
men-owned firms, are largely concentrated in the service sector, particularly in the hotel
and personal services industries (Figure 4-18 and 4-19).
10 Data are from “Women Entrepreneurs in SMEs in the APEC Region,” Asia-Pacific Economic Cooperation, Policy Level Group on Small and Medium Enterprises, Small and Medium Business Administration.
35
(Figure 4-18 and 4-19 about here)
Interestingly, male and female owners of business are generally equally educated
in most of the APEC economies for which data are available. They are generally
concerned with the same business issues that include access to capital, access to
technology and training, and government business policies.
V. CONCLUSIONS AND RECOMMENDATIONS
Women’s participation in the labor market and contribution to the economy is
important in promoting growth and development. As women are increasingly becoming
integral participants in the economy, there is growing interest in their contribution to the
economy. This report discusses gender differences in economic participation, wages,
employment status, and entrepreneurship in the APEC economies. Using multiple
measures of economic participation and labor market indicators, this report addresses not
only the difference in participation rates between women and men, but also explores the
underlying conditions and factors that are likely responsible for this difference.
One of the most important conclusions is that more women in APEC economies
work today than ever before. Data from various economies within the APEC region
demonstrate a surge in women’s participation in the labor force. However, the rate of
increase varies across economies as well as within economies. The gap between
women’s and men’s participation rates has been declining. Yet, there are some
economies where women’s participation continues to be substantially lower than that of
men. Women in the Latin American APEC members also have higher levels of youth
unemployment compared to men.
36
The data in this report suggest that there are differences in the sectors of
employment in which women and men work. Employment in agriculture and
manufacturing is predominantly male while women are more likely to be found in the
service sector. Even within the service industry, men predominantly hold the high-
paying jobs in finance, wholesale, and retail, while there are more women in care giving,
educational, and personal services, which have traditionally been dominated by women.
Apart from sectoral concentration, there continues to be striking gender
segregation in occupational status. Men continue to hold higher positions in the
occupational hierarchy with about 60 percent of the professional jobs in most member
economies, and about 90 percent of the administrative, managerial, and legislative jobs in
some. However, there are some economies like Russia and the Philippines, where a more
balanced distribution of professional jobs is observed. Perhaps even more striking is the
fact that, even when women are employed as salaried workers, they are often engaged in
atypical and non-regular work. Also, women’s wages continue to be lower than that of
men.
Employment in informal activities and in the informal sector has become a major
source of employment, particularly for women in the APEC economies, as elsewhere in
the world. With a general lack of data about employment in these activities, it is,
however, difficult to provide a detailed account about women’s and men’s contributions
through economic engagement. Data from some economies at least suggest that among
those who are self-employed, more women than men were self-account workers while
more men were employers.
37
Women’s share in entrepreneurship has increased in recent years and from the
little data that are available for a few economies, it is evident that in some, women own
over 30 percent of firms. Yet, women’s share in sales revenue is substantially lower than
firms owned by men.
Overall, this report suggests that women have made important strides toward
increased participation in the APEC economies. As half or more of the adult population,
women consistently contribute to the growth and development of the economy through
their involvement not only in the formal employment sector but also through other
activities. However, the fact that women and men have systematically different access to
and control of resources, including that of time, has significant implications for economic
growth and development. Women’s contributions to the economy in the household and
community are often overlooked. Figure 5-1 shows that women in most of the selected
economies spend more time working than men. However, during this time, women are
more likely to be engaged in non-market activities while men are more likely to be
involved in market activities (Figure 5-2 and Figure 5-3). Consequently, if these
activities are not recognized, women’s need for economic incentives and productive
resources are often ignored or not understood. For instance, women’s labor force
participation generally dips during the child-bearing and child-rearing years in most
economies. Also, women’s multiple roles that include family care giving and household
chores often impose restrictions on their ability to work inflexible hours.
In addition to social and cultural expectations that often restrict women to more
traditional and care-giving roles, unequal power relations within the family and the
38
workplace stifle professional women’s upward mobility to high paying and powerful
positions in the occupational hierarchy.
(Figures 5-1, 5-2, and 5-3 about here)
Unless more is done to balance the resources that help to create equal
opportunities for women and men, women are unlikely to achieve the fruits of
development. With better access to the productive resources and a reduction of the
traditional norms in the sexual division of labor, women are more likely to move into
better-paid and more stable sectors of the economy. With policies that address gender
equality in education, family chores, and childcare facilities, the APEC economies can
bring about a marked improvement in income-earning and entrepreneurial capacities.
To achieve this goal, there needs to be more research on women’s and men’s roles
in the economy. The APEC is a diverse group of economies that are characterized by
different cultural and societal norms and beliefs. To be able to analyze women’s
contributions to these diverse societies, there is an urgent need for sex-disaggregated
comparable statistics across economies. At present, there is only limited quantitative data
on a few indicators of women’s and men’s labor market participation. For some
economies, there is a dearth of even the most basic data. Furthermore, even when there is
data, they are neither comparable across economies nor through time. With ever-
changing definitions and categories, the available data are often ill-suited for comparative
research and trend research.
Secondly, most of the data that are available is for formal activities. There is
limited information on the informal sector or informal activities. Even if some
economies have information on some of the indicators, most of these data are not sex-
39
disaggregated. This is particularly disadvantageous for women since in most of the
APEC economies, more women than men are engaged in informal activities and in the
absence of sex-disaggregated data their contribution is left unmeasured. The same is true
with regard to sex-disaggregated data on entrepreneurship.
Thirdly, many APEC members are undergoing a rapid ageing of the population.
With increased life expectancy, and healthier aging, some older women and men may
continue to work beyond the retirement years. Given that women comprise the majority
of older population and also that women and men may differ in their experience in the
labor market, it is relevant to explore women’s and men’s participation in the labor force
beyond the generally accepted working age.
Based on these gaps in data, this report recommends:
1. The use of a common template of sex-disaggregated data collection for the
basic indicators of the labor market. The Appendix tables in this report
provide examples of templates that could be used for data dissemination.
2. Sex-disaggregated data by age that will provide a picture of women’s and
men’s economic participation at different age groups.
3. Maintenance of at least some basic definitions for indicators so that they are
comparable across economies and over time.
4. Additional small surveys to obtain sex-disaggregated data for the informal
sector. These surveys could at least provide an overview of women’s and
men’s contribution to the informal economy.
40
5. A basic data registry of business enterprises through local or county statistical
agencies. This will not only provide sex-disaggregated data on business
ownership, but also help identify entrepreneurs who need training and other
assistance. With the rising significance of SMEs and microenterprises in
economic development, particularly for women, it is pertinent that more data
be available on participation in these activities.
41
References
Anker, Richard, 1997, “Theories of Occupational Segregation by Sex: An Overview,” International Labour Review, Vol. 136, Number 3. Asia-Pacific Economic Cooperation, 1999, “Women Entrepreneurs in SMEs in the APEC region,” APEC Project SME 02/98. Braine, T., 2002, “Women Executives in Latin America,” Search, Vol., 19, No. 2 http://www.aesc.org/newsletter/summer 2002/newsSummer02-1.html. Cagatay, Nilüfer, 2001, “Gender, Poverty and Trade,” UNDP Background Paper, New York, October 2001. Cardero, Maria Elena, 2000 “The Impact of NAFTA on Female Employment in Mexico,” in Women's Empowerment and Economic Justice, New York, UNIFEM, 2000. Chun, Bang Jee, 1999, “Women Entrepreneurs in SMEs in the APEC Region,” Asia-Pacific Economic Cooperation, Policy Level Group on Small and Medium Enterprises, Hoseo University, and Small and Medium Business Administration. Families and Work Institute, Catalyst, and The Center for Work and Family at Boston College, Carroll School of Management, 2003, “Leaders in Global Economy: A Study of Executive Women and Men,” http://catalystwomen.org/publications/executive-summaries/globalleaders.pdf. Forth, J., 2002, “The Gender Pay Gap,” paper presented to the Gender Research Forum, DTI, London, November, 2002. Harkness, S. and J. Waldfogel, “The Family Gap in Pay: Evidence From Seven Industrialized Economies: Case Paper 30,” Center for Analysis of Social Exclusion, London School of Economics, forthcoming in Research in Labor Economics. Hayghe, H.V., 1997, “Developments in Women’s Labor Force Participation,” Monthly Labor Review, Vol. 120, No. 9, pp. 41 – 46. International Labour Organization, 2004a, “Key Indicators of the Labour Market (KILM),” http://www.ilo.org. _____, 2004b, “Global Employment Trends for Women,” ILO Labour Office. _____, 2004c, “Global Employment Trends,” ILO Labor Office. _____, 2004d, “Breaking Through the Glass Ceiling: Women in Management, Update 2004,” ILO, International Labor Office, Geneva, 2004.
42
_____, 2002, “Women and Men in the Informal Economy: A Statistical Picture,” ILO, Employment Sector, International Labor Office, Geneva, 2002. Japan Ministry of Health, Labour and Welfare, 2002, “Heisei 13nendo Josei Koyo Kanri Kihon Chosa Kekka Gaiyo,” Results of the basic survey on women employment management, 2001,” http://www.jil.go.jp/kisya/kkinjkatei/20020524_03_kj/20020524_03_kj.html. Miller, Linda, Fiona Neathey, Emma Pollard, and Darcy Hill, 2004, “Occupational Segregation, Gender Gaps, and Skill Gaps,” Occupational Segregation Working Paper Series No. 15, Institute for Employment Studies, European Social Fund. Ministry of Man Power, 2000, “Occupation Segregation: A Gender Perspective,” Manpower Research and Statistics Department, Paper No.1/00, Singapore, April 2000. Oaxaca, Ronald, 1973, “Male-Female Wage Differentials in Urban labor Markets,” International Economic Review, Vol. 14, No. 3, pp.693-709. Statistics Canada, 2002, “Women in Canada: Work Chapter Updates,” http://www.statcan.ca/english/freepub/89F0133XIE/89F0133XIE01001.pdf. Terrell, Katherine, 1992, “Female-Male Earnings Differentials and Occupational Structure,” International Labour Review, Vol. 131, No. 4-5, pp. 387 – 404. Tonguthai, P., 2002, “Gender Equality and Decent Work in Thailand: A Country Report for ILO/ADB RETA Project 5887,” Working Paper No. 1, ILO/Asian Development Bank. Treiman, Donald J., Hartmann, Heidi I., (eds.), 1981, “Women, Work, and Wages: Equal Pay for Jobs of Equal Value,” Washington, DC, National Academy Press. Weeks, Julie R. and Seiler Danielle, 2001, “Women’s Entrepreneurship in Latin America: An Exploration of Current Knowledge,” Inter-American Development Bank, Sustainable Development Department Technical Papers Series, Publication No. MSN-11. Women Executive Network, 2001 “Moving Forward 2001: The Experiences and Attitudes of Executive Women in Canada,” Prepared by POLLARA, http://www.wxnetwork.com. World Bank, 1994, “Enhancing Women’s Participation in Economic Activity,” Mineographed, Washington, DC.
43
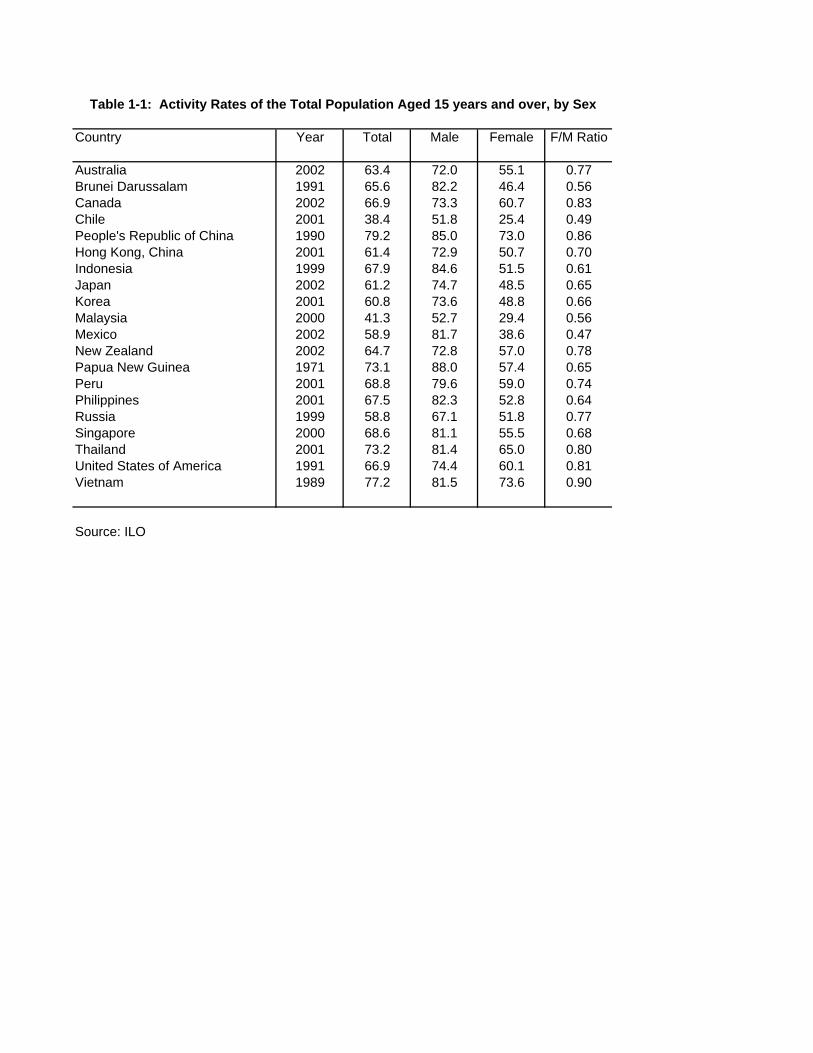
Table 1-1: Activity Rates of the Total Population Aged 15 years and over, by Sex
Country Year Total Male Female F/M Ratio
Australia 2002 63.4 72.0 55.1 0.77Brunei Darussalam 1991 65.6 82.2 46.4 0.56Canada 2002 66.9 73.3 60.7 0.83Chile 2001 38.4 51.8 25.4 0.49People's Republic of China 1990 79.2 85.0 73.0 0.86Hong Kong, China 2001 61.4 72.9 50.7 0.70Indonesia 1999 67.9 84.6 51.5 0.61Japan 2002 61.2 74.7 48.5 0.65Korea 2001 60.8 73.6 48.8 0.66Malaysia 2000 41.3 52.7 29.4 0.56Mexico 2002 58.9 81.7 38.6 0.47New Zealand 2002 64.7 72.8 57.0 0.78Papua New Guinea 1971 73.1 88.0 57.4 0.65Peru 2001 68.8 79.6 59.0 0.74Philippines 2001 67.5 82.3 52.8 0.64Russia 1999 58.8 67.1 51.8 0.77Singapore 2000 68.6 81.1 55.5 0.68Thailand 2001 73.2 81.4 65.0 0.80United States of America 1991 66.9 74.4 60.1 0.81Vietnam 1989 77.2 81.5 73.6 0.90
Source: ILO
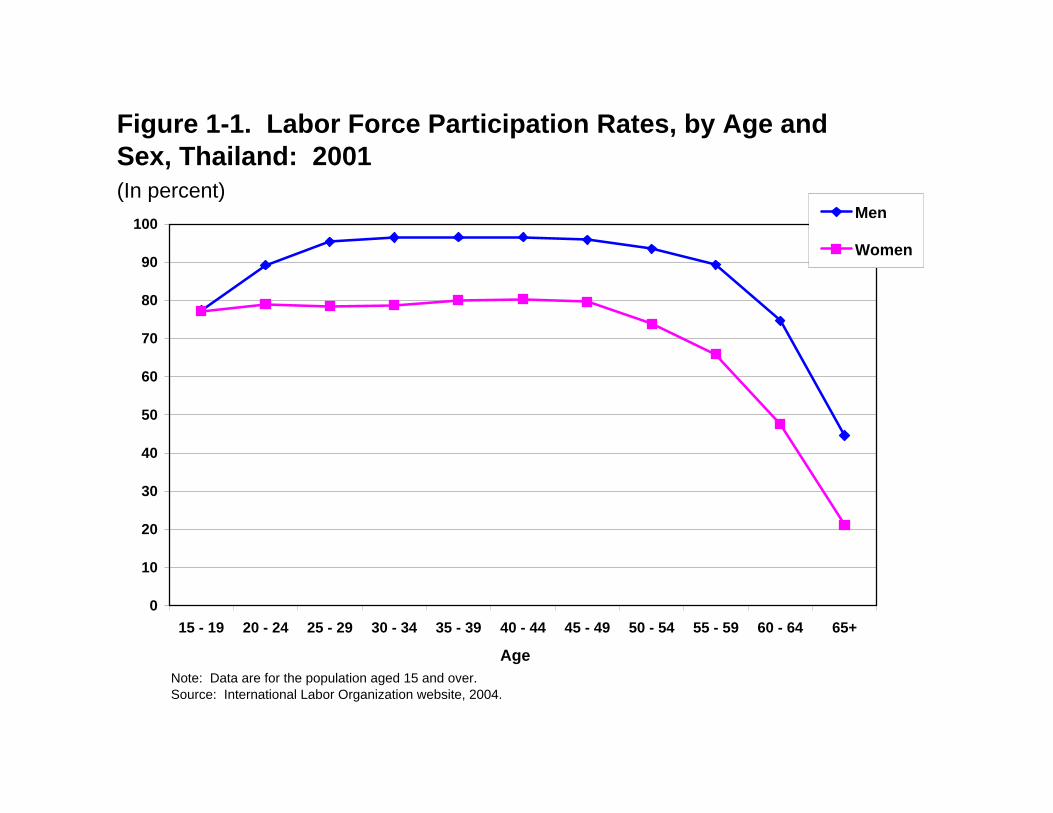
Figure 1-1. Labor Force Participation Rates, by Age and Sex, Thailand: 2001(In percent)
0
10
20
30
40
50
60
70
80
90
100
15 - 19 20 - 24 25 - 29 30 - 34 35 - 39 40 - 44 45 - 49 50 - 54 55 - 59 60 - 64 65+
Men
Women
Note: Data are for the population aged 15 and over.Source: International Labor Organization website, 2004.
Age
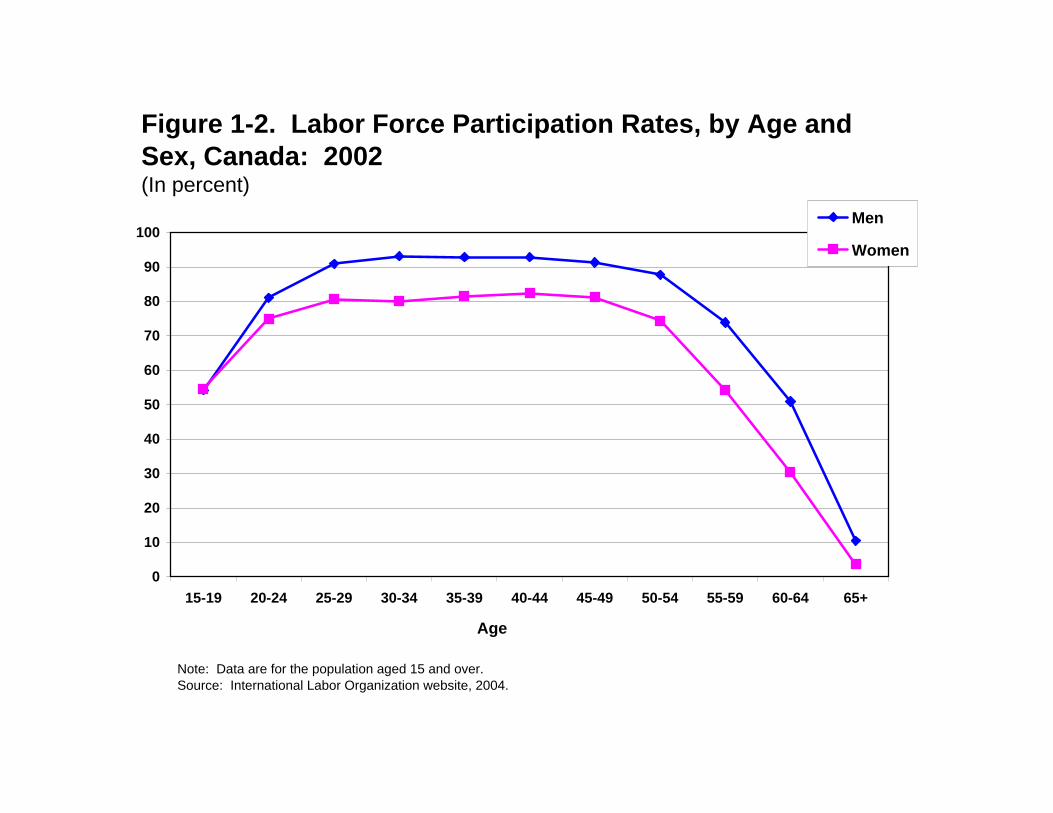
Figure 1-2. Labor Force Participation Rates, by Age and Sex, Canada: 2002(In percent)
0
10
20
30
40
50
60
70
80
90
100
15-19 20-24 25-29 30-34 35-39 40-44 45-49 50-54 55-59 60-64 65+
Men
Women
Note: Data are for the population aged 15 and over.Source: International Labor Organization website, 2004.
Age
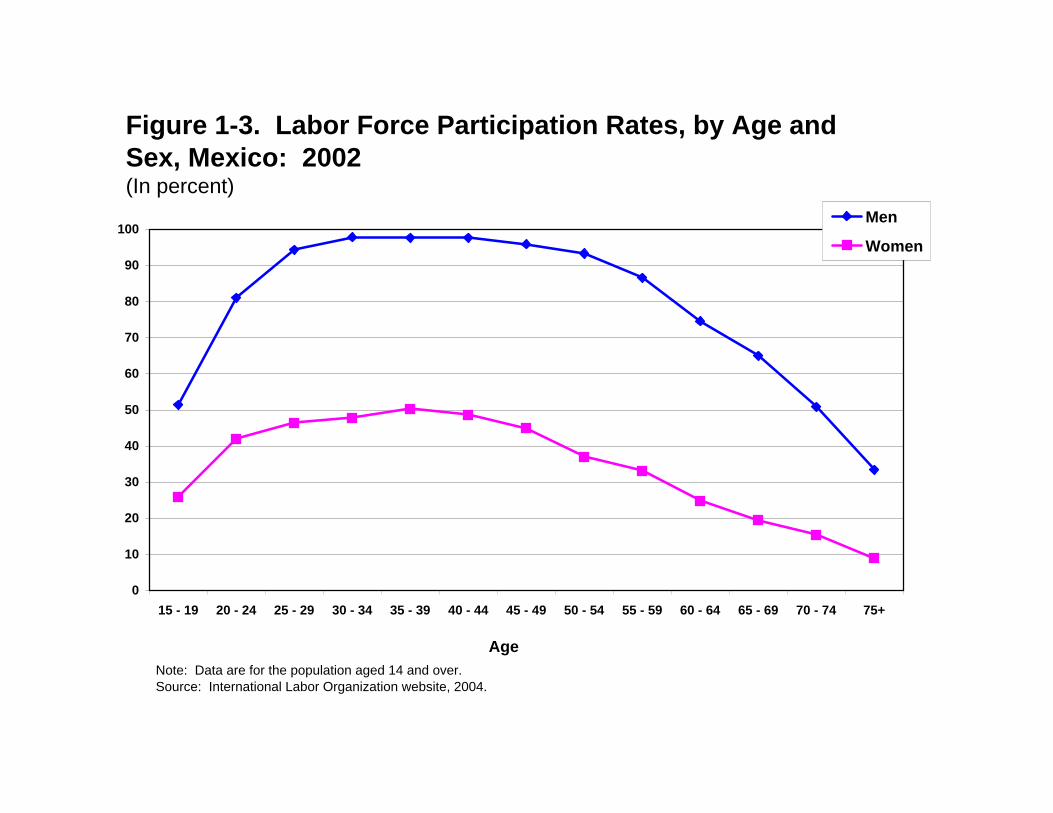
Figure 1-3. Labor Force Participation Rates, by Age and Sex, Mexico: 2002(In percent)
0
10
20
30
40
50
60
70
80
90
100
15 - 19 20 - 24 25 - 29 30 - 34 35 - 39 40 - 44 45 - 49 50 - 54 55 - 59 60 - 64 65 - 69 70 - 74 75+
Men
Women
Note: Data are for the population aged 14 and over.Source: International Labor Organization website, 2004.
Age
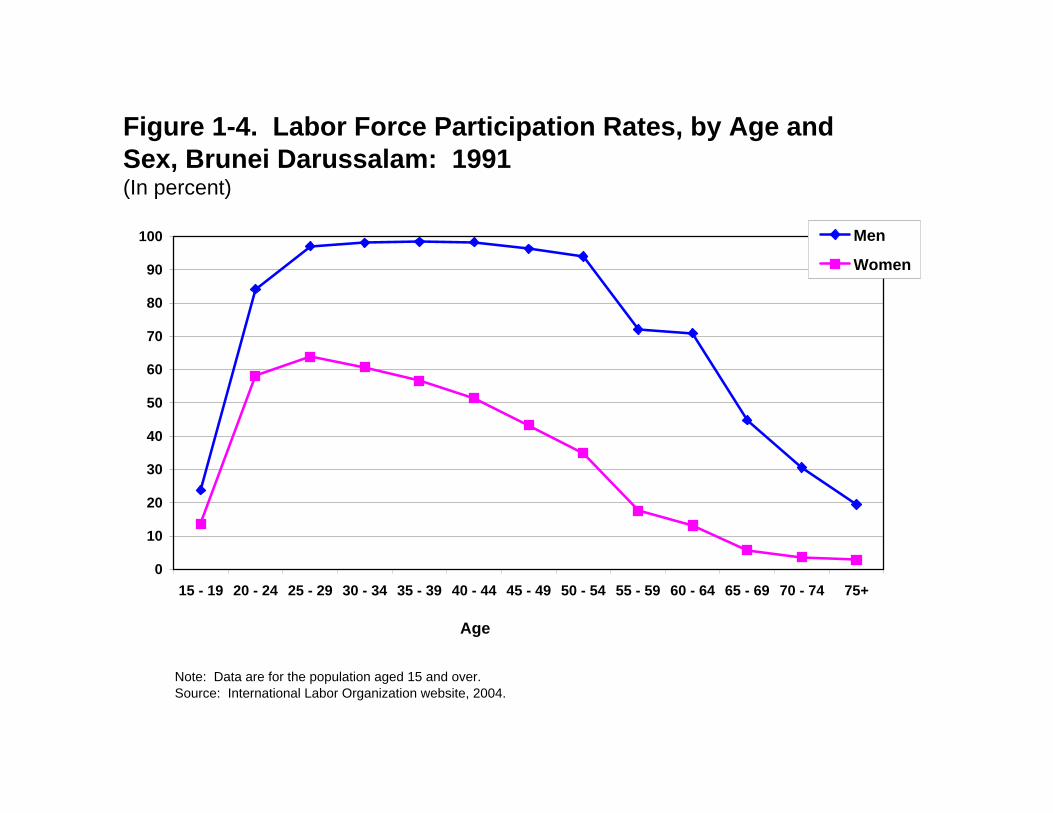
Figure 1-4. Labor Force Participation Rates, by Age and Sex, Brunei Darussalam: 1991(In percent)
0
10
20
30
40
50
60
70
80
90
100
15 - 19 20 - 24 25 - 29 30 - 34 35 - 39 40 - 44 45 - 49 50 - 54 55 - 59 60 - 64 65 - 69 70 - 74 75+
Men
Women
Note: Data are for the population aged 15 and over.Source: International Labor Organization website, 2004.
Age
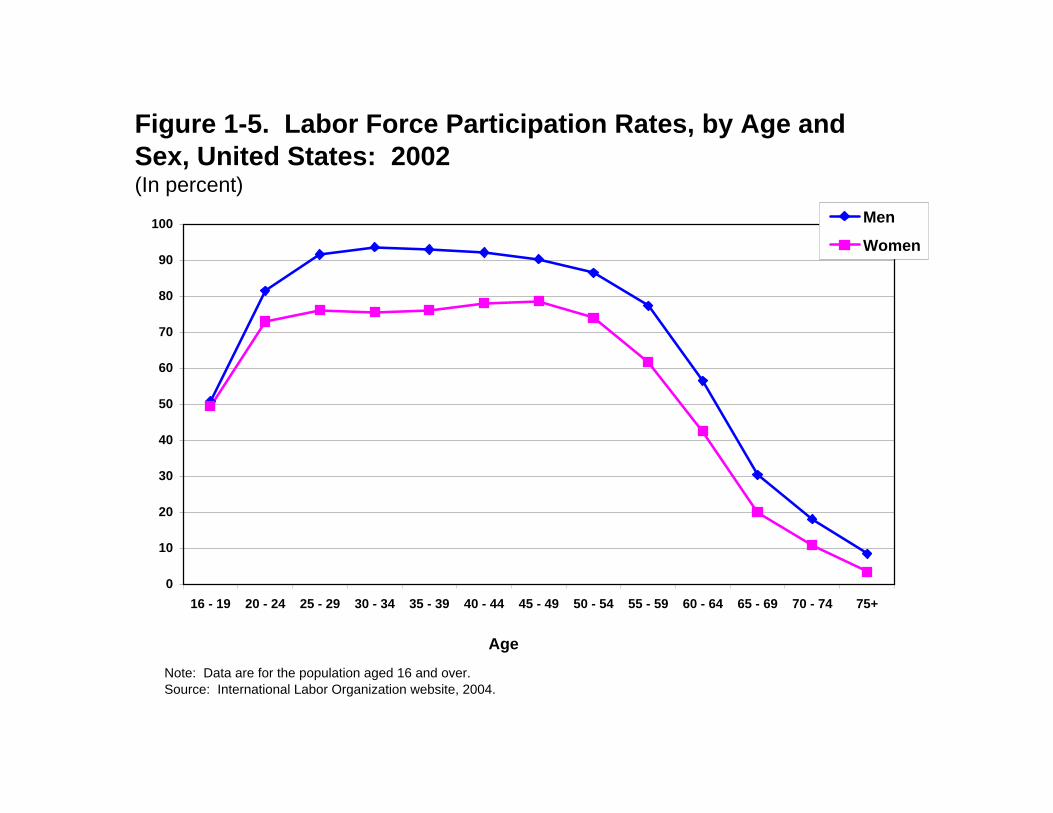
Figure 1-5. Labor Force Participation Rates, by Age and Sex, United States: 2002(In percent)
0
10
20
30
40
50
60
70
80
90
100
16 - 19 20 - 24 25 - 29 30 - 34 35 - 39 40 - 44 45 - 49 50 - 54 55 - 59 60 - 64 65 - 69 70 - 74 75+
Men
Women
Note: Data are for the population aged 16 and over.Source: International Labor Organization website, 2004.
Age
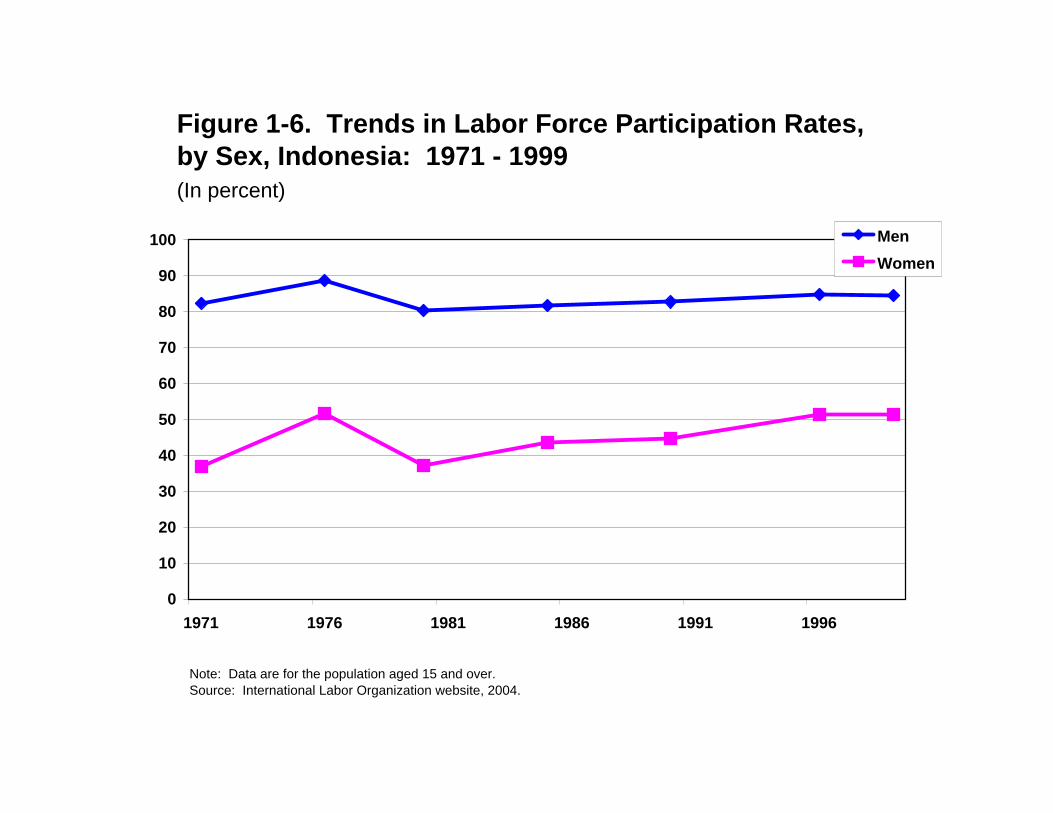
Figure 1-6. Trends in Labor Force Participation Rates, by Sex, Indonesia: 1971 - 1999(In percent)
0
10
20
30
40
50
60
70
80
90
100
1971 1976 1981 1986 1991 1996
MenWomen
Note: Data are for the population aged 15 and over.Source: International Labor Organization website, 2004.
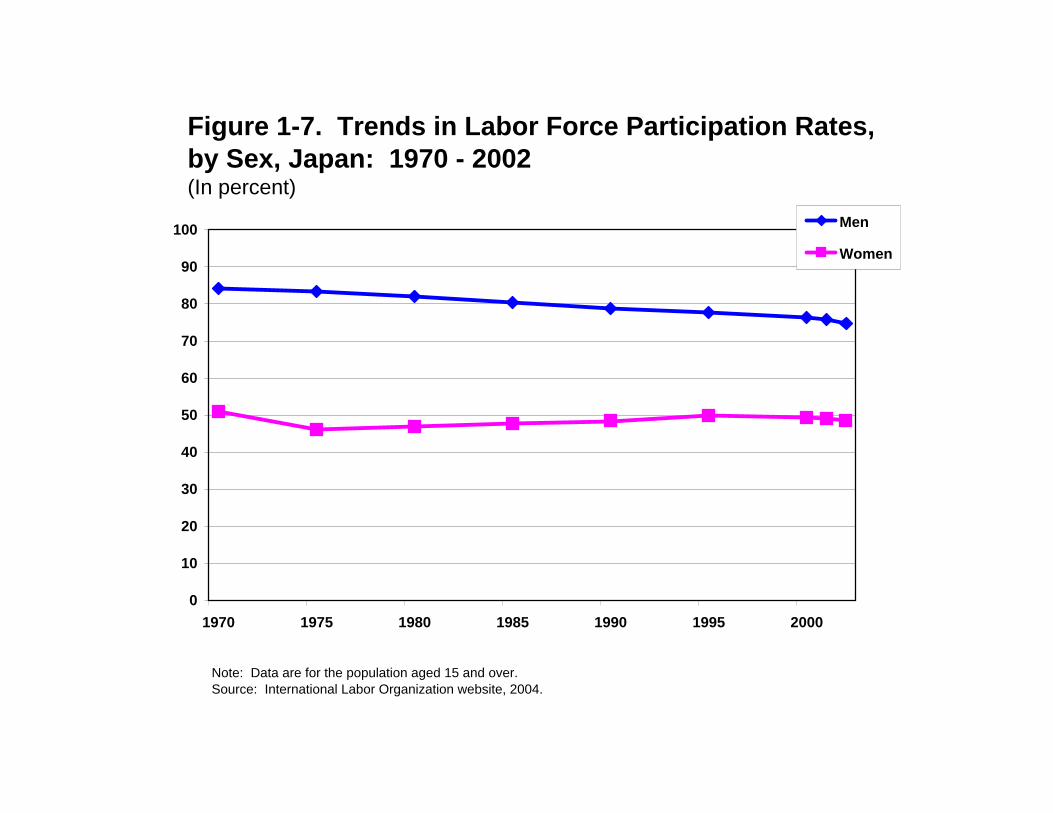
Figure 1-7. Trends in Labor Force Participation Rates, by Sex, Japan: 1970 - 2002(In percent)
0
10
20
30
40
50
60
70
80
90
100
1970 1975 1980 1985 1990 1995 2000
Men
Women
Note: Data are for the population aged 15 and over.Source: International Labor Organization website, 2004.
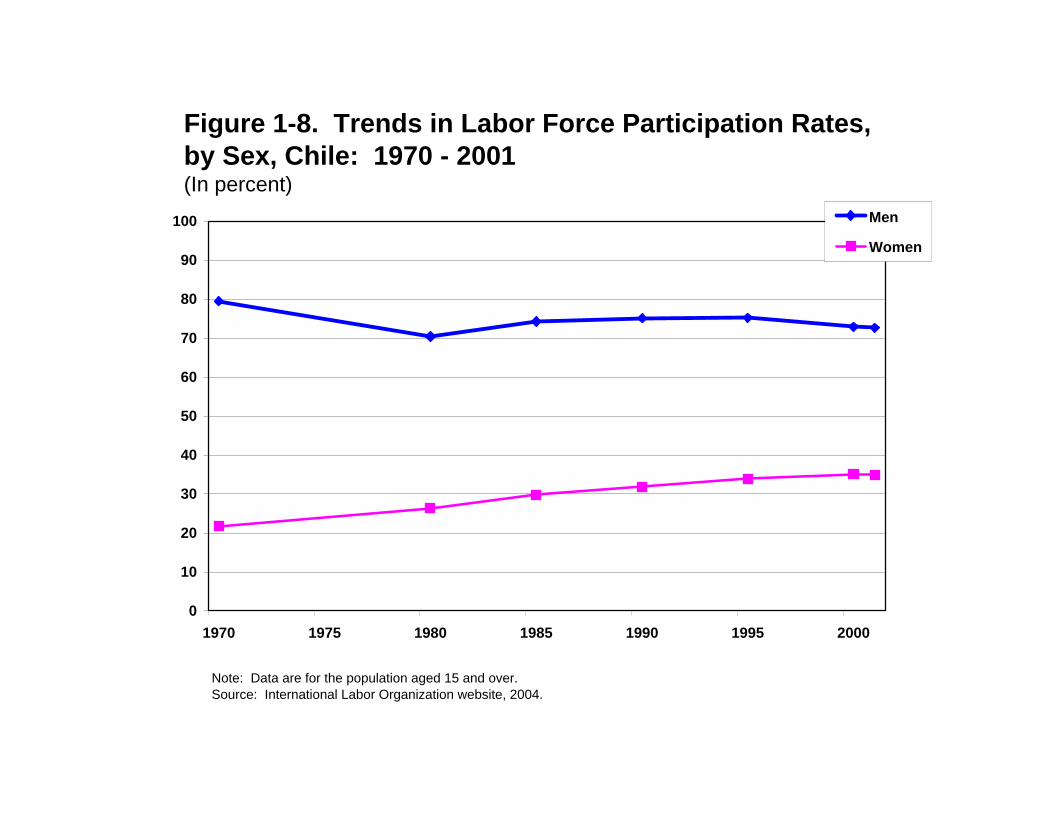
Figure 1-8. Trends in Labor Force Participation Rates, by Sex, Chile: 1970 - 2001(In percent)
0
10
20
30
40
50
60
70
80
90
100
1970 1975 1980 1985 1990 1995 2000
Men
Women
Note: Data are for the population aged 15 and over.Source: International Labor Organization website, 2004.
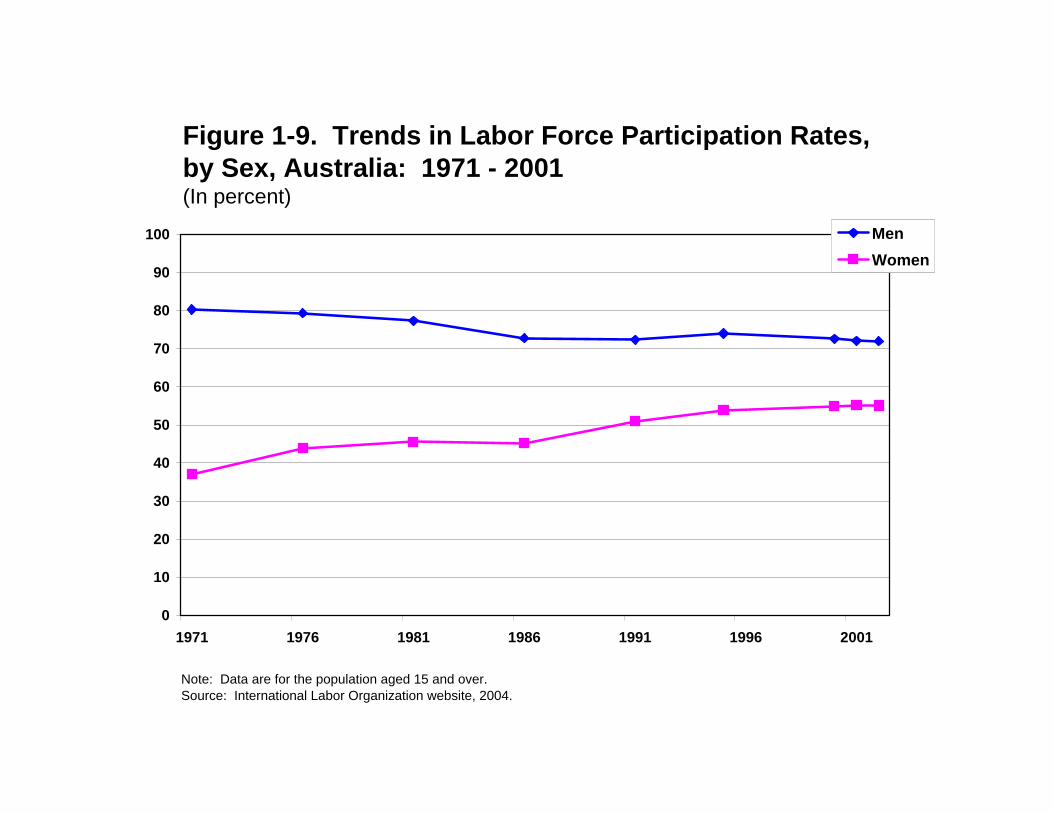
Figure 1-9. Trends in Labor Force Participation Rates, by Sex, Australia: 1971 - 2001(In percent)
0
10
20
30
40
50
60
70
80
90
100
1971 1976 1981 1986 1991 1996 2001
MenWomen
Note: Data are for the population aged 15 and over.Source: International Labor Organization website, 2004.
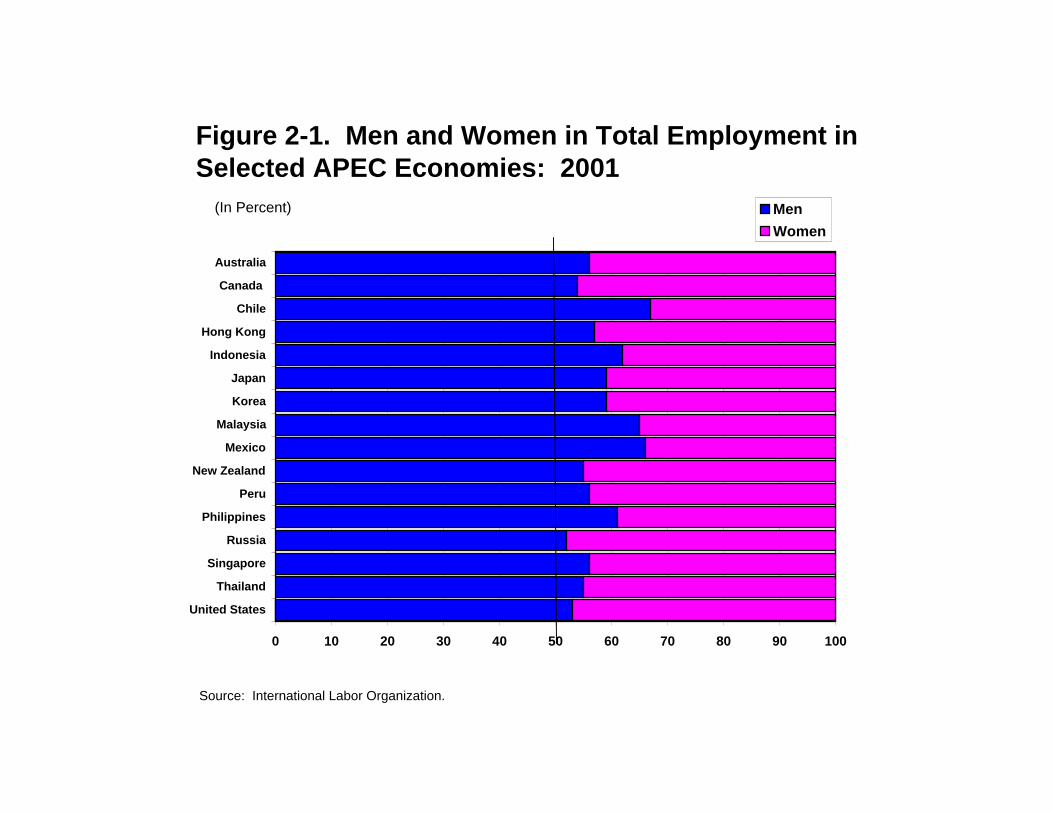
Figure 2-1. Men and Women in Total Employment in Selected APEC Economies: 2001
0 10 20 30 40 50 60 70 80 90 100
United States
Thailand
Singapore
Russia
Philippines
Peru
New Zealand
Mexico
Malaysia
Korea
Japan
Indonesia
Hong Kong
Chile
Canada
Australia
MenWomen
Source: International Labor Organization.
(In Percent)
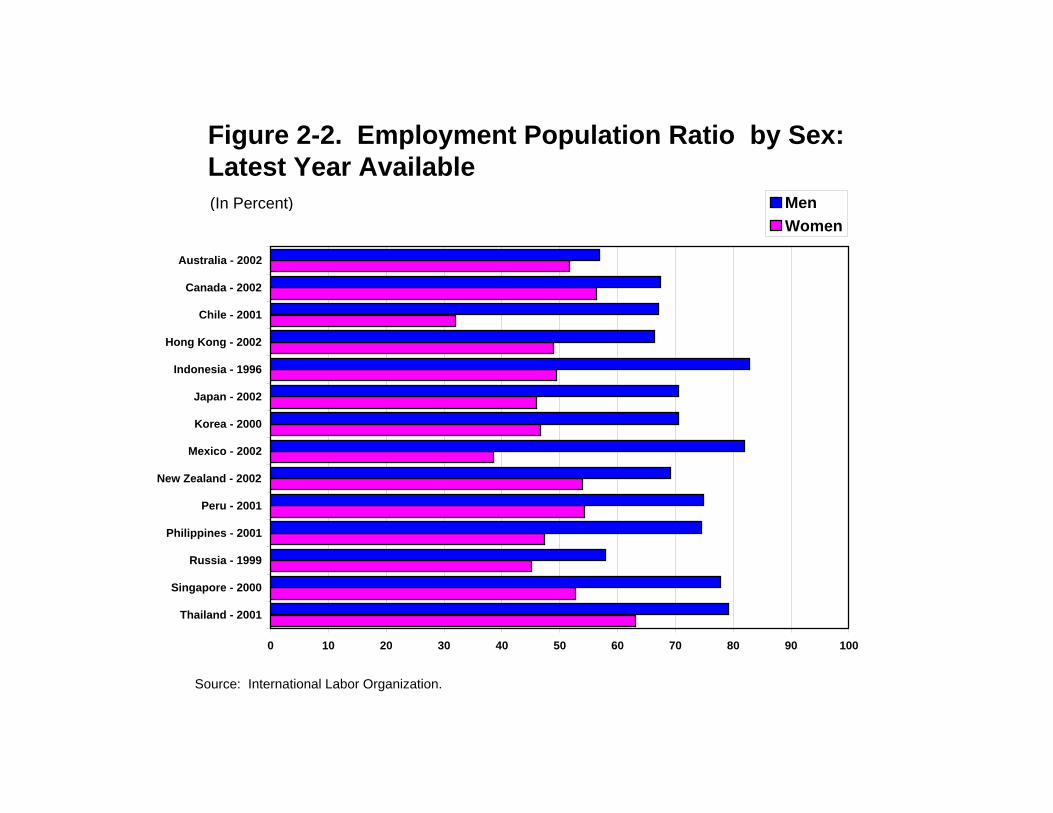
Figure 2-2. Employment Population Ratio by Sex: Latest Year Available
0 10 20 30 40 50 60 70 80 90 100
Thailand - 2001
Singapore - 2000
Russia - 1999
Philippines - 2001
Peru - 2001
New Zealand - 2002
Mexico - 2002
Korea - 2000
Japan - 2002
Indonesia - 1996
Hong Kong - 2002
Chile - 2001
Canada - 2002
Australia - 2002
MenWomen
Source: International Labor Organization.
(In Percent)
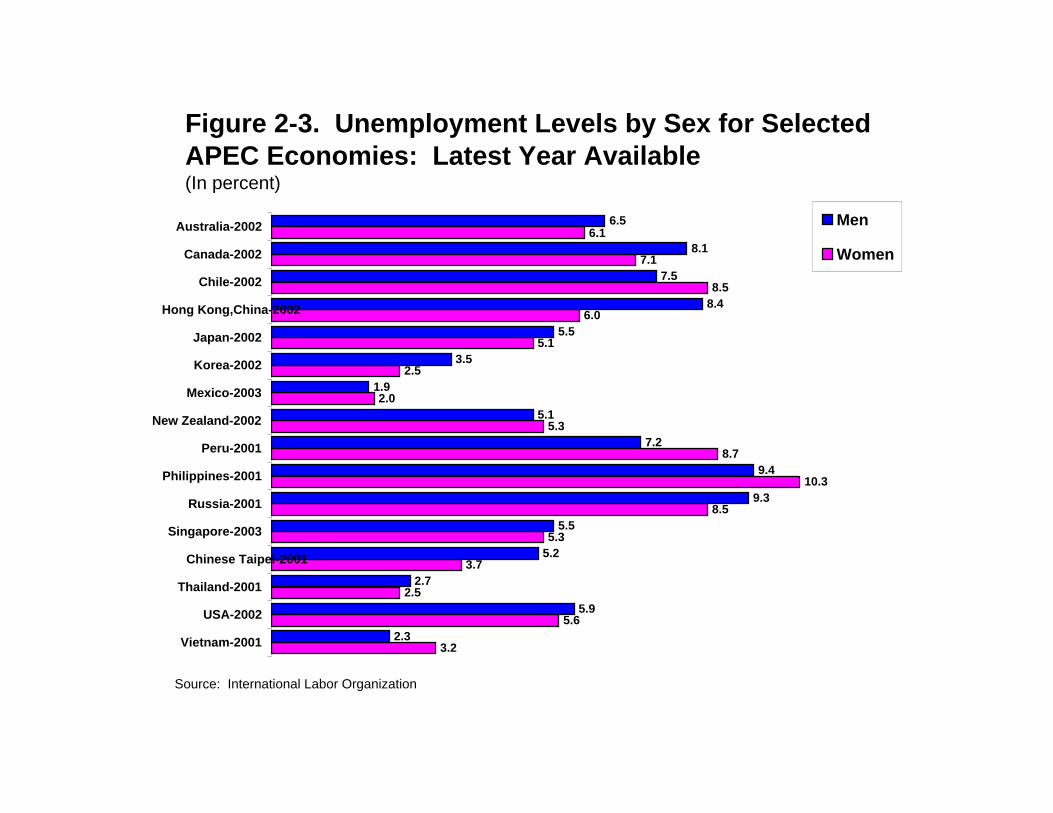
Figure 2-3. Unemployment Levels by Sex for Selected APEC Economies: Latest Year Available(In percent)
3.2
5.6
2.5
3.7
5.3
8.5
10.3
8.7
5.3
2.0
2.5
5.1
6.0
8.5
7.1
2.3
5.9
2.7
5.2
5.5
9.3
9.4
7.2
5.1
1.9
3.5
5.5
8.4
7.5
8.1
6.56.1
Vietnam-2001
USA-2002
Thailand-2001
Chinese Taipei-2001
Singapore-2003
Russia-2001
Philippines-2001
Peru-2001
New Zealand-2002
Mexico-2003
Korea-2002
Japan-2002
Hong Kong,China-2002
Chile-2002
Canada-2002
Australia-2002 Men
Women
Source: International Labor Organization
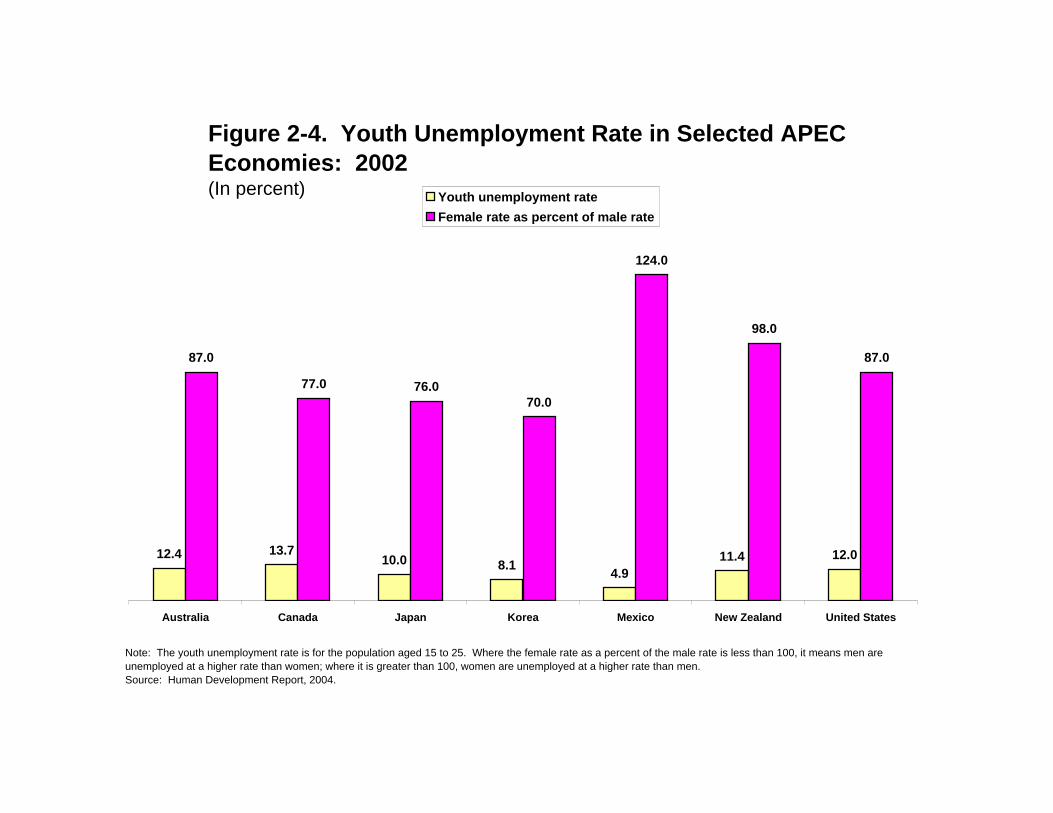
Figure 2-4. Youth Unemployment Rate in Selected APEC Economies: 2002(In percent)
12.4 13.710.0 8.1 4.9
11.4 12.0
87.0
77.0 76.070.0
124.0
98.0
87.0
Australia Canada Japan Korea Mexico New Zealand United States
Youth unemployment rateFemale rate as percent of male rate
Note: The youth unemployment rate is for the population aged 15 to 25. Where the female rate as a percent of the male rate is less than 100, it means men are unemployed at a higher rate than women; where it is greater than 100, women are unemployed at a higher rate than men.Source: Human Development Report, 2004.
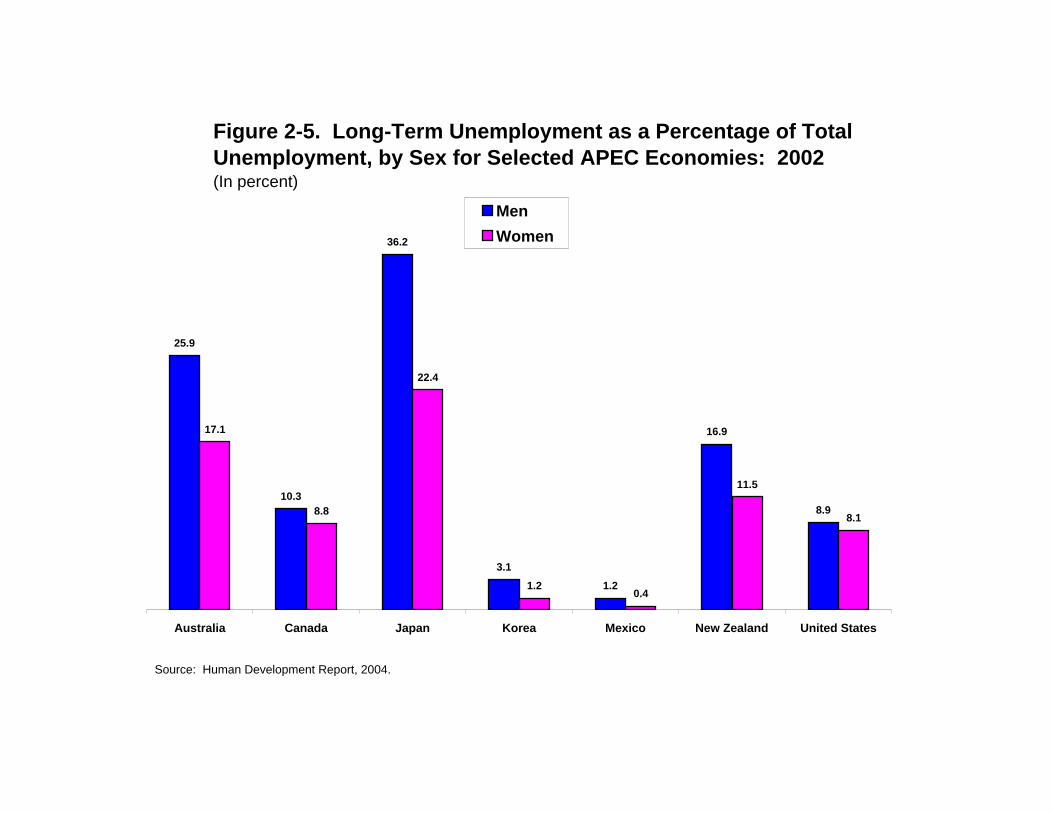
Figure 2-5. Long-Term Unemployment as a Percentage of Total Unemployment, by Sex for Selected APEC Economies: 2002(In percent)
25.9
10.3
36.2
3.1
1.2
16.9
8.9
17.1
8.8
22.4
1.20.4
11.5
8.1
Australia Canada Japan Korea Mexico New Zealand United States
MenWomen
Source: Human Development Report, 2004.
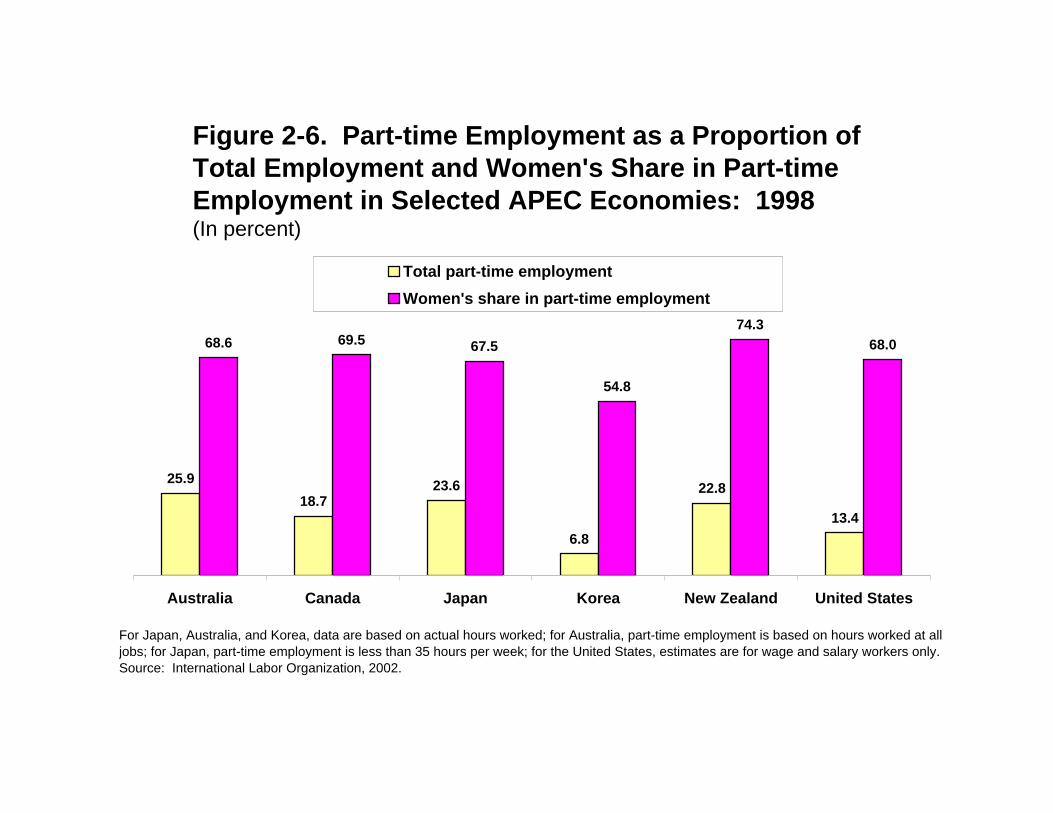
Figure 2-6. Part-time Employment as a Proportion of Total Employment and Women's Share in Part-time Employment in Selected APEC Economies: 1998(In percent)
25.918.7
23.6
6.8
22.8
13.4
68.6 69.5 67.5
54.8
74.368.0
Australia Canada Japan Korea New Zealand United States
Total part-time employmentWomen's share in part-time employment
For Japan, Australia, and Korea, data are based on actual hours worked; for Australia, part-time employment is based on hours worked at all jobs; for Japan, part-time employment is less than 35 hours per week; for the United States, estimates are for wage and salary workers only.Source: International Labor Organization, 2002.
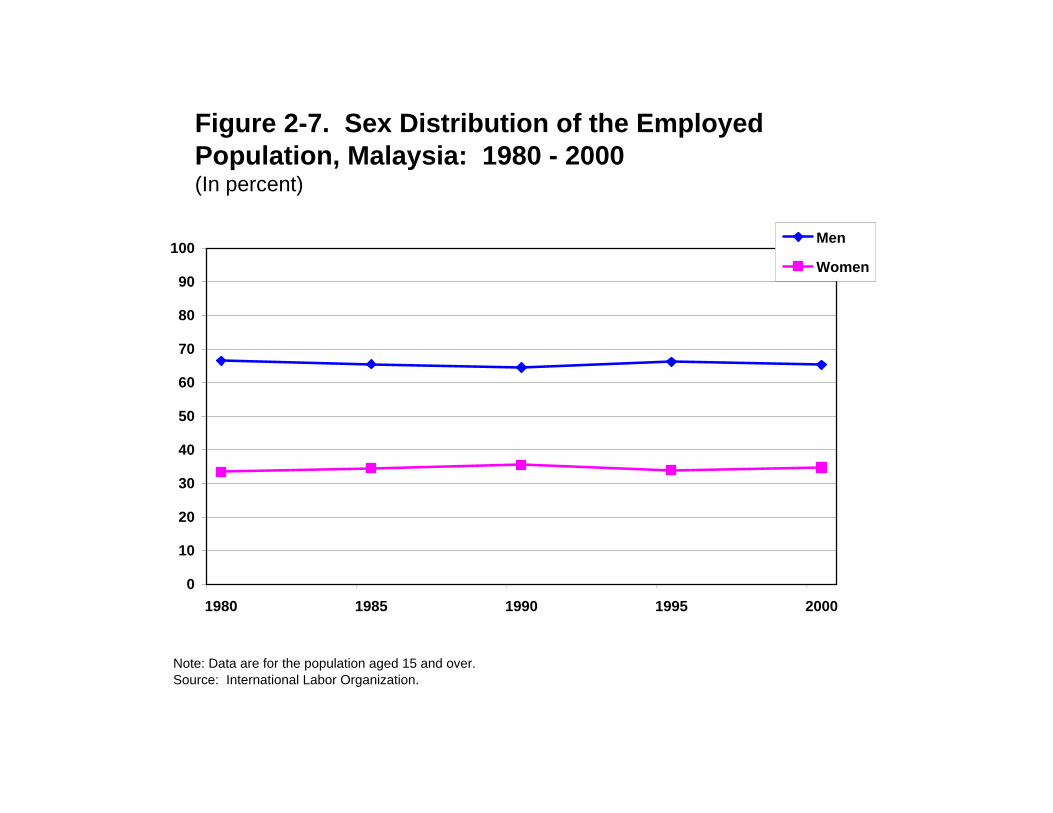
Figure 2-7. Sex Distribution of the Employed Population, Malaysia: 1980 - 2000(In percent)
0
10
20
30
40
50
60
70
80
90
100
1980 1985 1990 1995 2000
Men
Women
Note: Data are for the population aged 15 and over.Source: International Labor Organization.
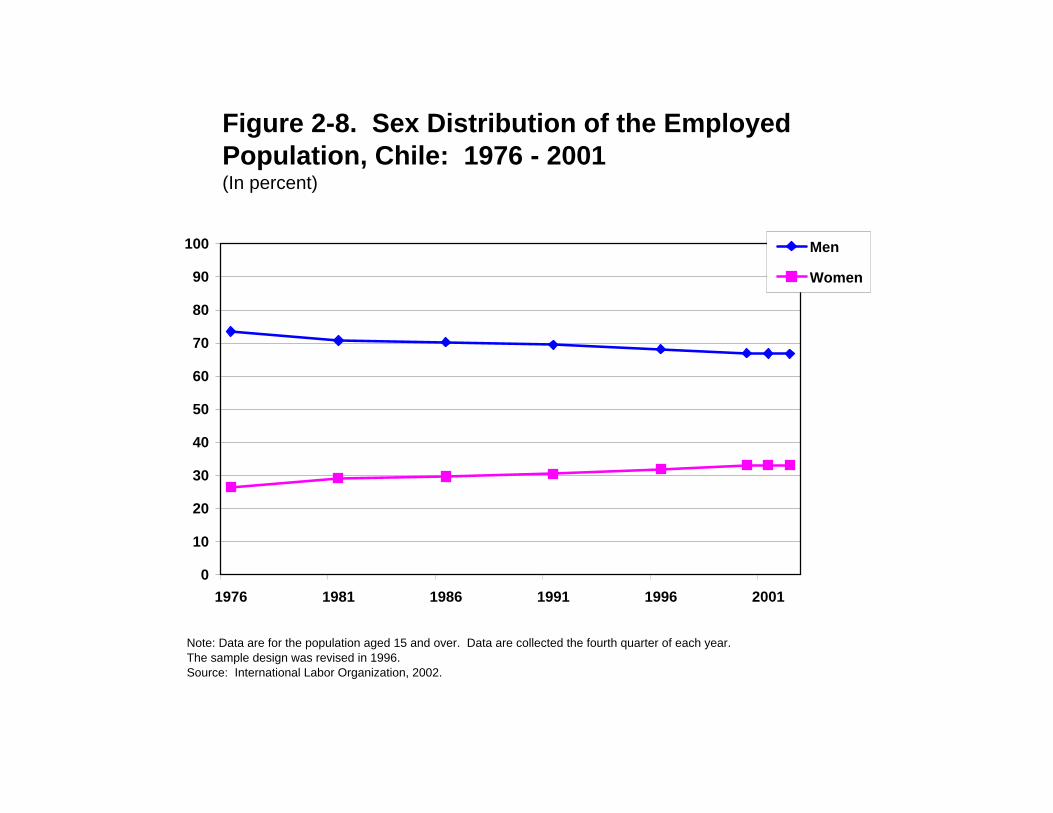
Figure 2-8. Sex Distribution of the Employed Population, Chile: 1976 - 2001(In percent)
0
10
20
30
40
50
60
70
80
90
100
1976 1981 1986 1991 1996 2001
Men
Women
Note: Data are for the population aged 15 and over. Data are collected the fourth quarter of each year.The sample design was revised in 1996.Source: International Labor Organization, 2002.
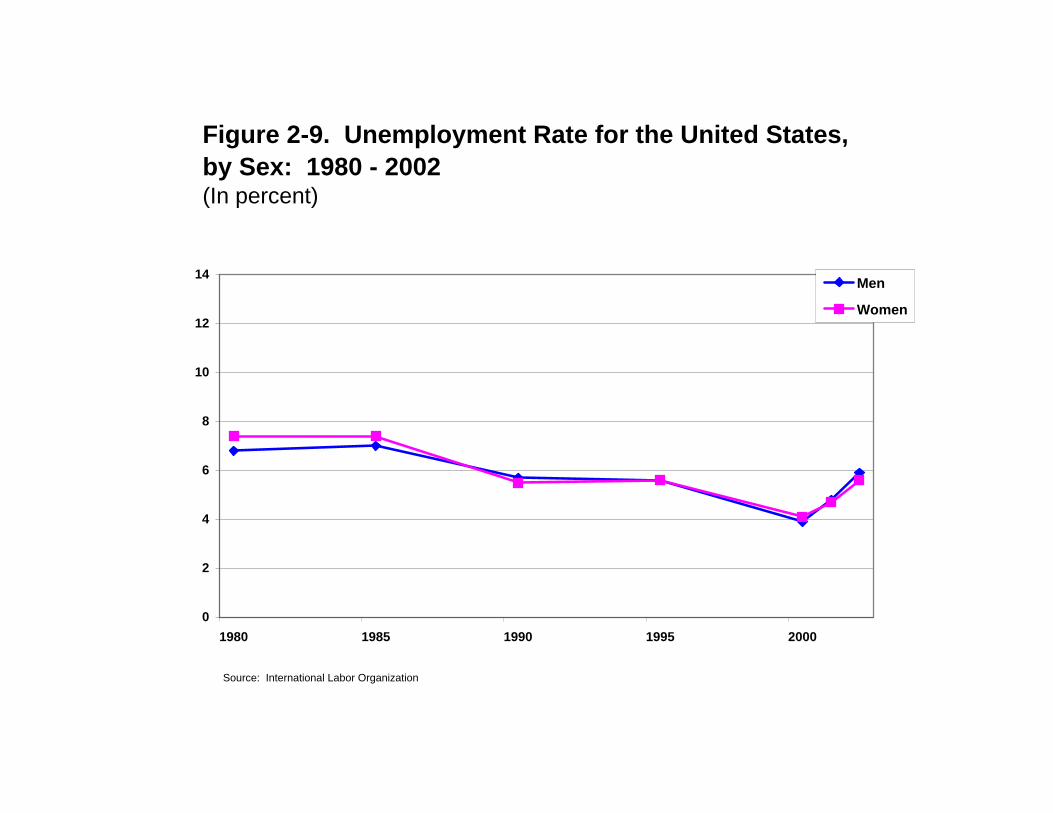
Figure 2-9. Unemployment Rate for the United States,by Sex: 1980 - 2002(In percent)
0
2
4
6
8
10
12
14
1980 1985 1990 1995 2000
Men
Women
Source: International Labor Organization
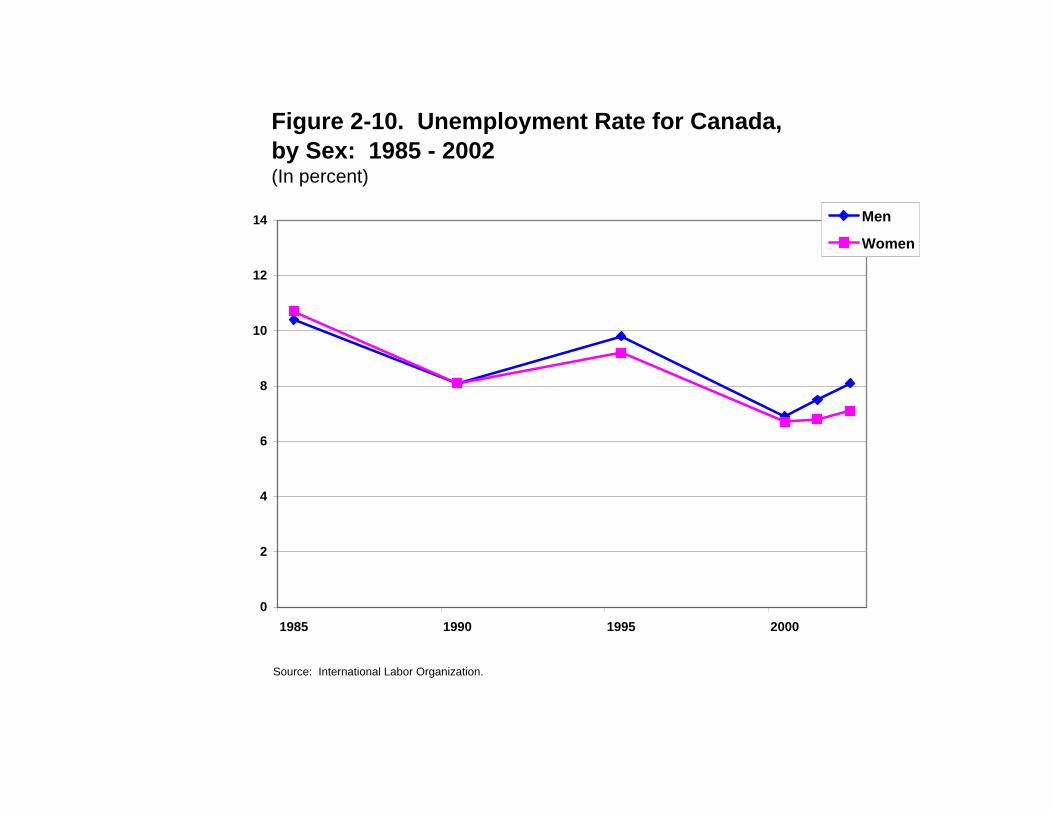
Figure 2-10. Unemployment Rate for Canada,by Sex: 1985 - 2002(In percent)
0
2
4
6
8
10
12
14
1985 1990 1995 2000
Men
Women
Source: International Labor Organization.
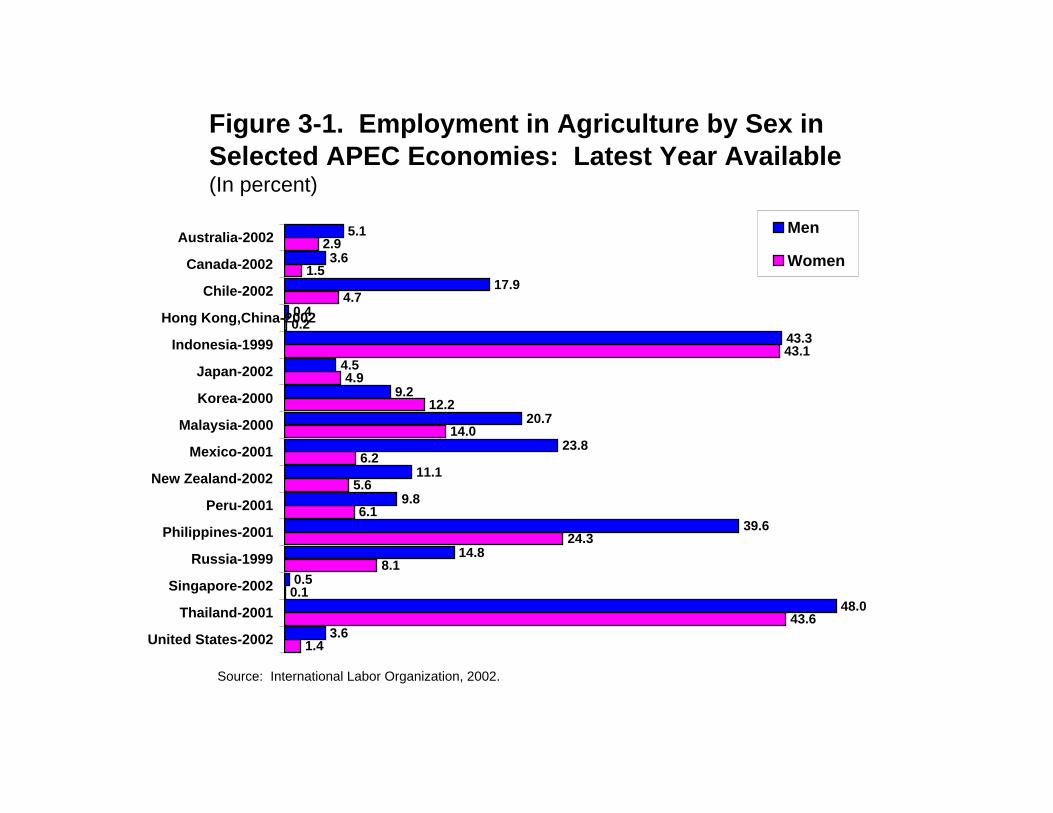
Figure 3-1. Employment in Agriculture by Sex in Selected APEC Economies: Latest Year Available(In percent)
1.4
43.6
0.1
8.1
24.3
6.1
5.6
6.2
14.0
12.2
4.9
43.1
0.2
4.7
1.5
2.9
3.6
48.0
0.5
14.8
39.6
9.8
11.1
23.8
20.7
9.2
4.5
43.3
0.4
17.9
3.6
5.1
United States-2002
Thailand-2001
Singapore-2002
Russia-1999
Philippines-2001
Peru-2001
New Zealand-2002
Mexico-2001
Malaysia-2000
Korea-2000
Japan-2002
Indonesia-1999
Hong Kong,China-2002
Chile-2002
Canada-2002
Australia-2002 Men
Women
Source: International Labor Organization, 2002.
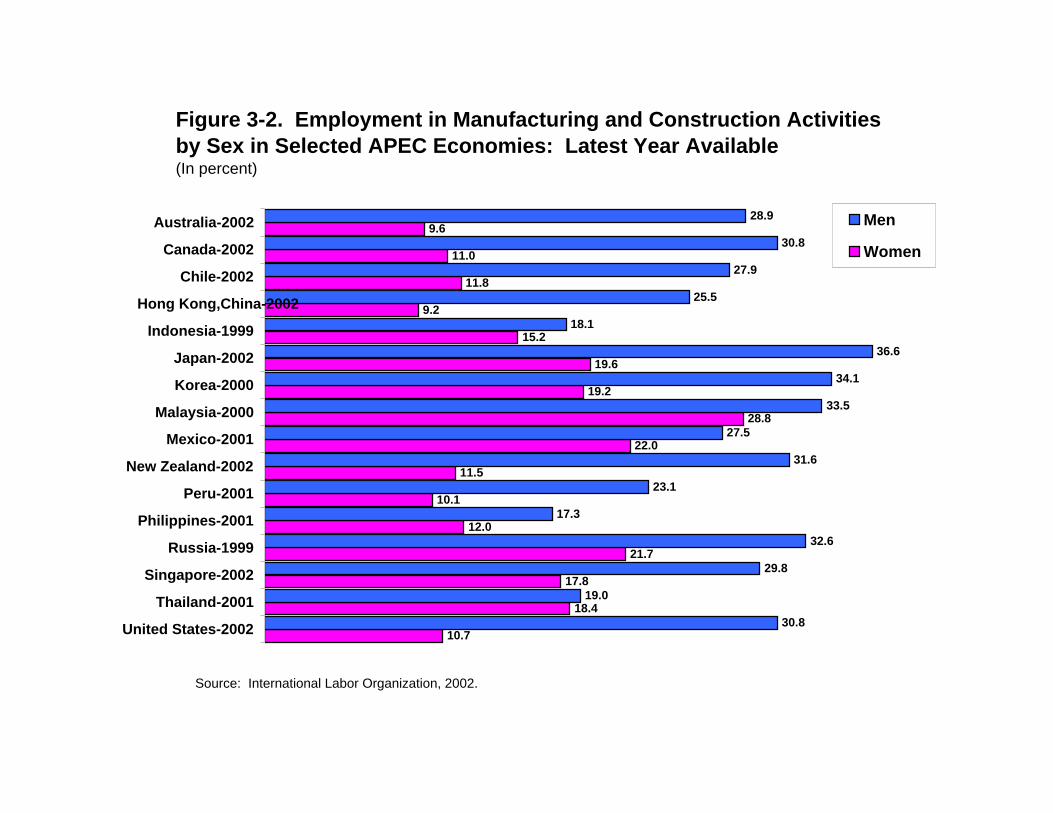
Figure 3-2. Employment in Manufacturing and Construction Activities by Sex in Selected APEC Economies: Latest Year Available(In percent)
10.7
18.4
17.8
21.7
12.0
10.1
11.5
22.0
28.8
19.2
19.6
15.2
9.2
11.8
11.0
9.6
30.8
19.0
29.8
32.6
17.3
23.1
31.6
27.5
33.5
34.1
36.6
18.1
25.5
27.9
30.8
28.9
United States-2002
Thailand-2001
Singapore-2002
Russia-1999
Philippines-2001
Peru-2001
New Zealand-2002
Mexico-2001
Malaysia-2000
Korea-2000
Japan-2002
Indonesia-1999
Hong Kong,China-2002
Chile-2002
Canada-2002
Australia-2002 Men
Women
Source: International Labor Organization, 2002.
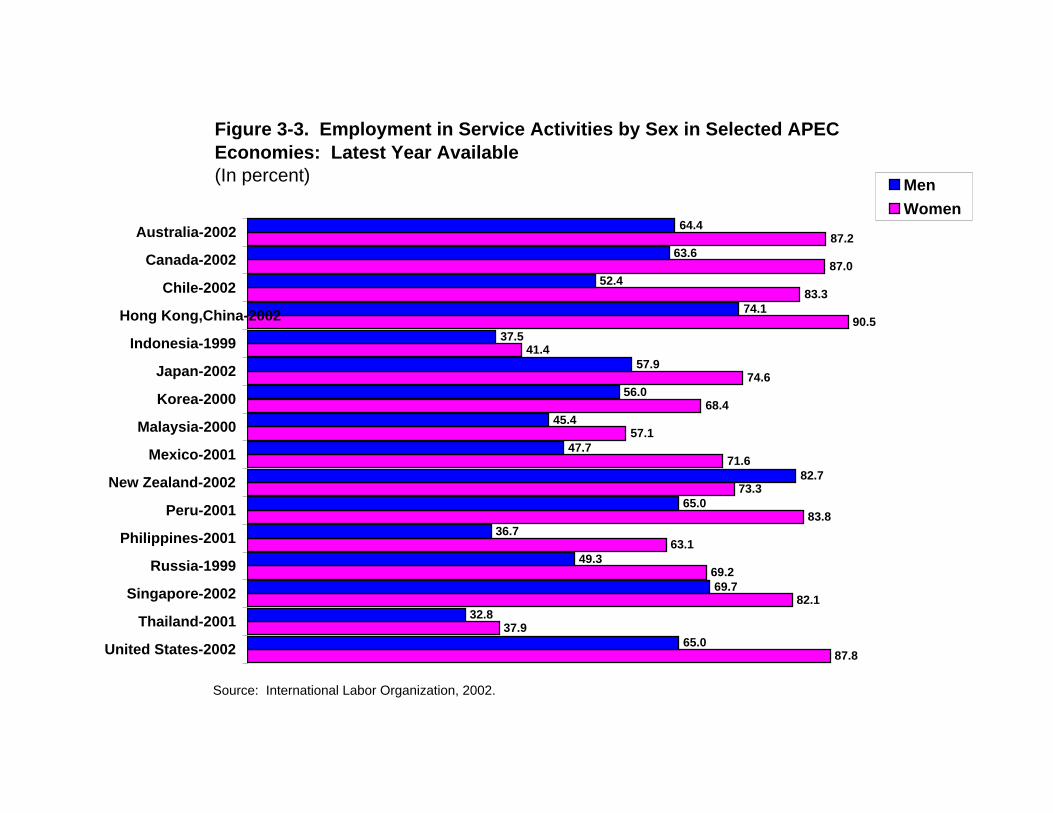
Figure 3-3. Employment in Service Activities by Sex in Selected APEC Economies: Latest Year Available(In percent)
87.8
37.9
82.1
69.2
63.1
83.8
73.3
71.6
57.1
68.4
74.6
41.4
90.5
83.3
87.0
87.2
65.0
32.8
69.7
49.3
36.7
65.0
82.7
47.7
45.4
56.0
57.9
37.5
74.1
52.4
63.6
64.4
United States-2002
Thailand-2001
Singapore-2002
Russia-1999
Philippines-2001
Peru-2001
New Zealand-2002
Mexico-2001
Malaysia-2000
Korea-2000
Japan-2002
Indonesia-1999
Hong Kong,China-2002
Chile-2002
Canada-2002
Australia-2002
MenWomen
Source: International Labor Organization, 2002.
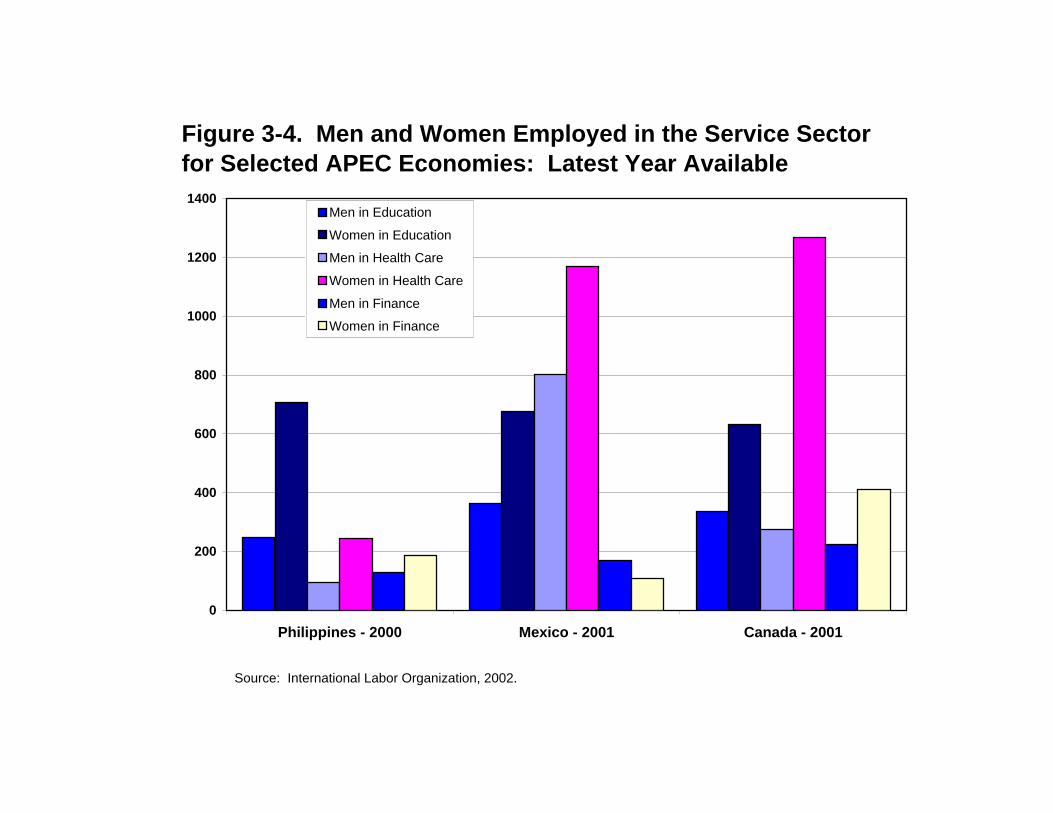
Figure 3-4. Men and Women Employed in the Service Sector for Selected APEC Economies: Latest Year Available
0
200
400
600
800
1000
1200
1400
Philippines - 2000 Mexico - 2001 Canada - 2001
Men in Education
Women in Education
Men in Health Care
Women in Health Care
Men in Finance
Women in Finance
Source: International Labor Organization, 2002.
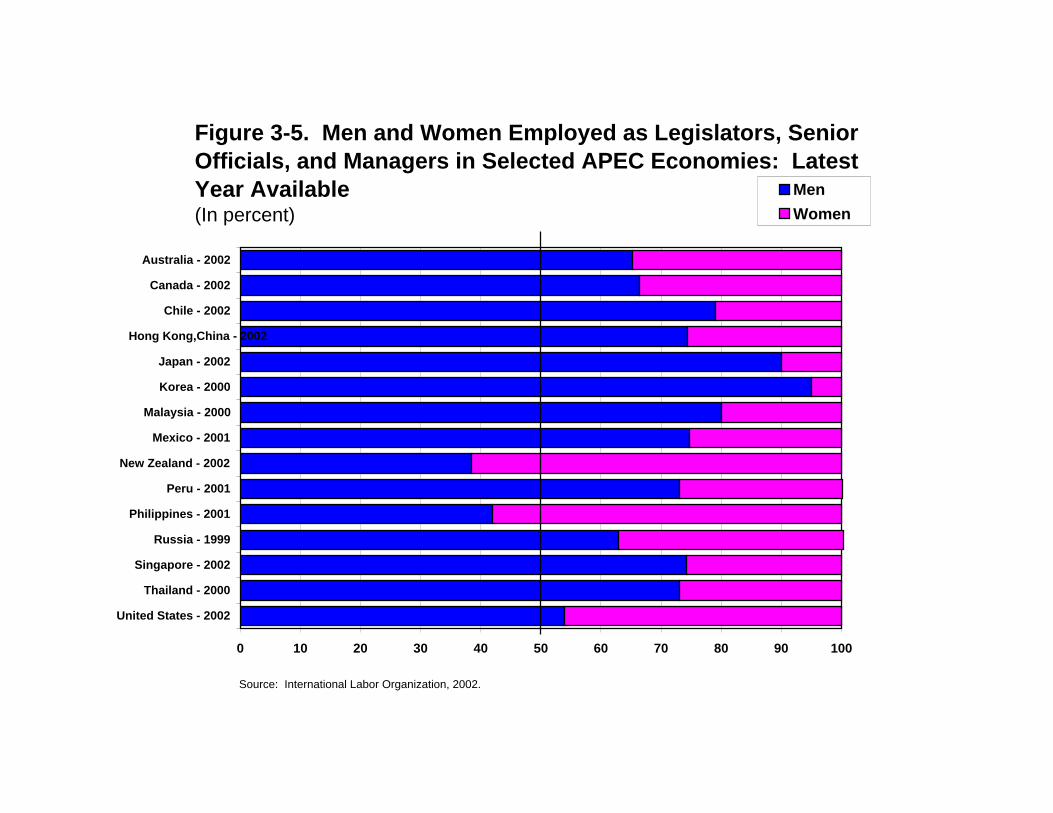
Figure 3-5. Men and Women Employed as Legislators, Senior Officials, and Managers in Selected APEC Economies: Latest Year Available (In percent)
0 10 20 30 40 50 60 70 80 90 100
United States - 2002
Thailand - 2000
Singapore - 2002
Russia - 1999
Philippines - 2001
Peru - 2001
New Zealand - 2002
Mexico - 2001
Malaysia - 2000
Korea - 2000
Japan - 2002
Hong Kong,China - 2002
Chile - 2002
Canada - 2002
Australia - 2002
MenWomen
Source: International Labor Organization, 2002.
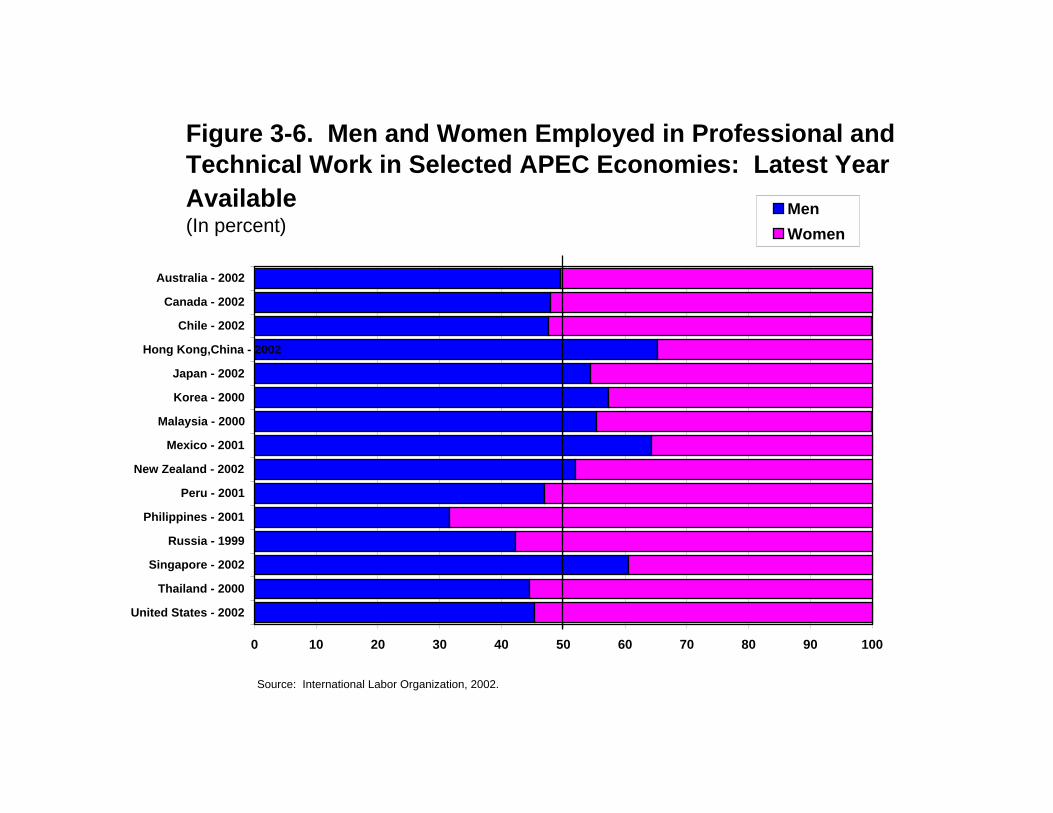
Figure 3-6. Men and Women Employed in Professional and Technical Work in Selected APEC Economies: Latest Year Available(In percent)
0 10 20 30 40 50 60 70 80 90 100
United States - 2002
Thailand - 2000
Singapore - 2002
Russia - 1999
Philippines - 2001
Peru - 2001
New Zealand - 2002
Mexico - 2001
Malaysia - 2000
Korea - 2000
Japan - 2002
Hong Kong,China - 2002
Chile - 2002
Canada - 2002
Australia - 2002
MenWomen
Source: International Labor Organization, 2002.
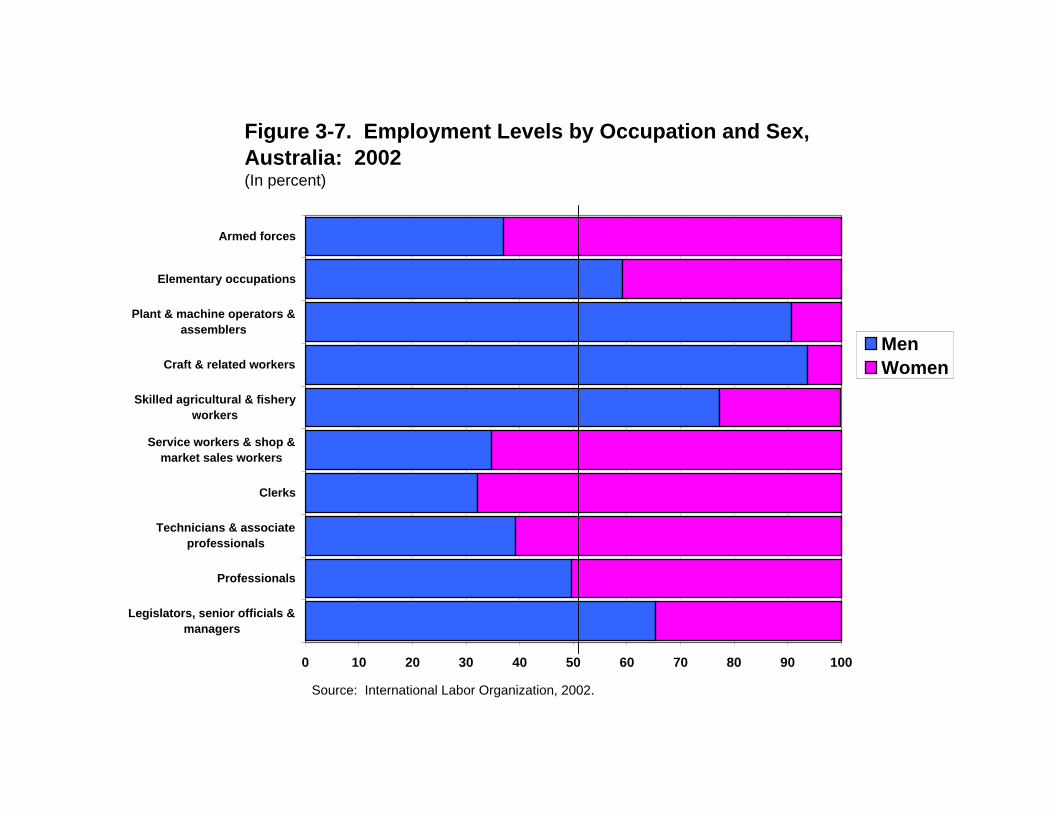
Figure 3-7. Employment Levels by Occupation and Sex, Australia: 2002(In percent)
0 10 20 30 40 50 60 70 80 90 100
Legislators, senior officials &managers
Professionals
Technicians & associateprofessionals
Clerks
Service workers & shop &market sales workers
Skilled agricultural & fisheryworkers
Craft & related workers
Plant & machine operators &assemblers
Elementary occupations
Armed forces
MenWomen
Source: International Labor Organization, 2002.
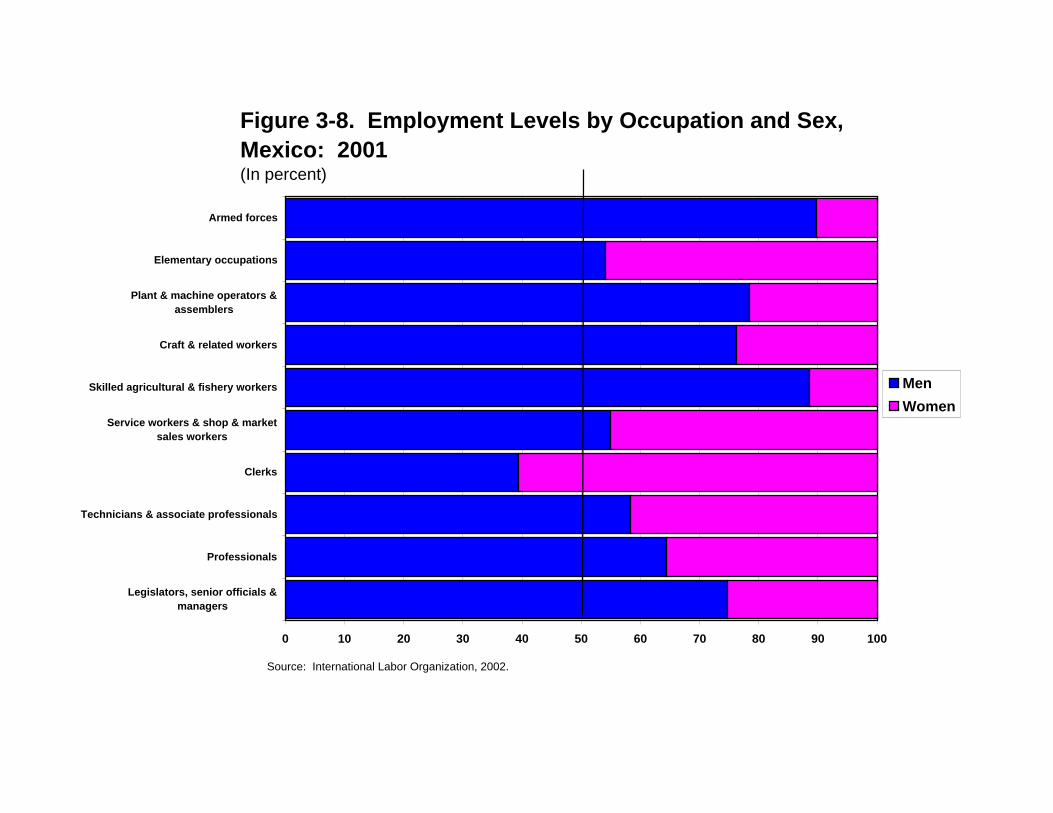
Figure 3-8. Employment Levels by Occupation and Sex,Mexico: 2001(In percent)
0 10 20 30 40 50 60 70 80 90 100
Legislators, senior officials &managers
Professionals
Technicians & associate professionals
Clerks
Service workers & shop & marketsales workers
Skilled agricultural & fishery workers
Craft & related workers
Plant & machine operators &assemblers
Elementary occupations
Armed forces
MenWomen
Source: International Labor Organization, 2002.
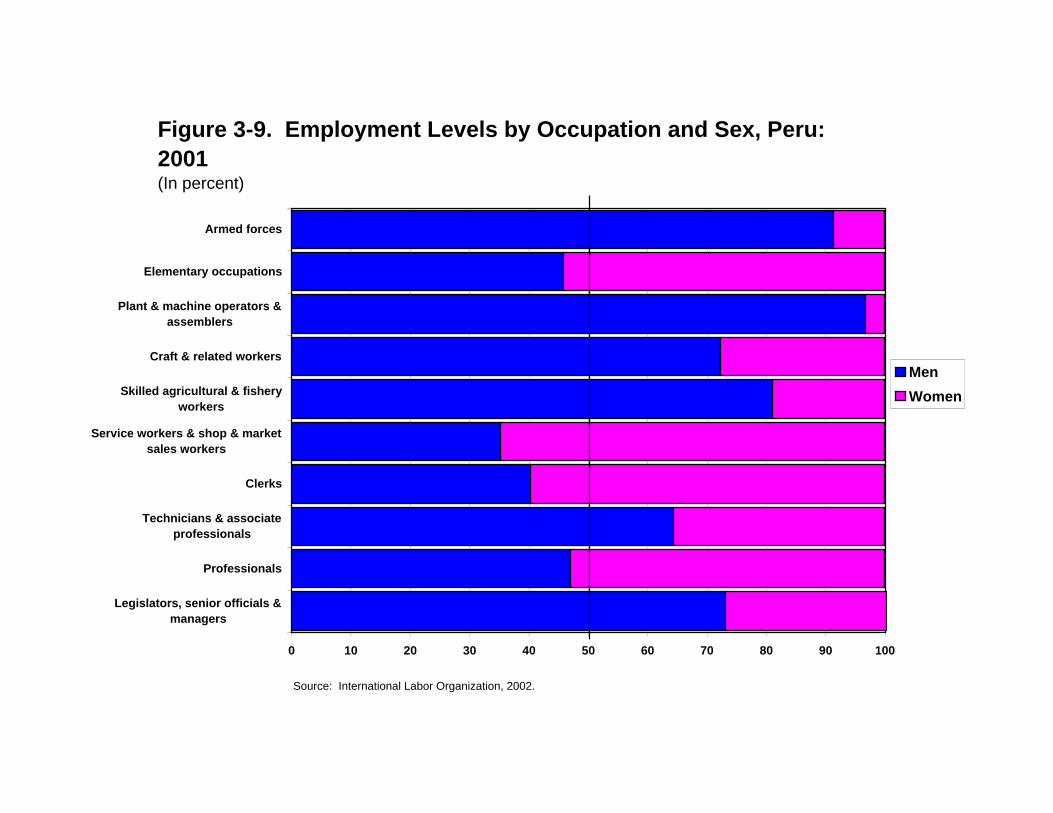
Figure 3-9. Employment Levels by Occupation and Sex, Peru: 2001(In percent)
0 10 20 30 40 50 60 70 80 90 100
Legislators, senior officials &managers
Professionals
Technicians & associateprofessionals
Clerks
Service workers & shop & marketsales workers
Skilled agricultural & fisheryworkers
Craft & related workers
Plant & machine operators &assemblers
Elementary occupations
Armed forces
MenWomen
Source: International Labor Organization, 2002.
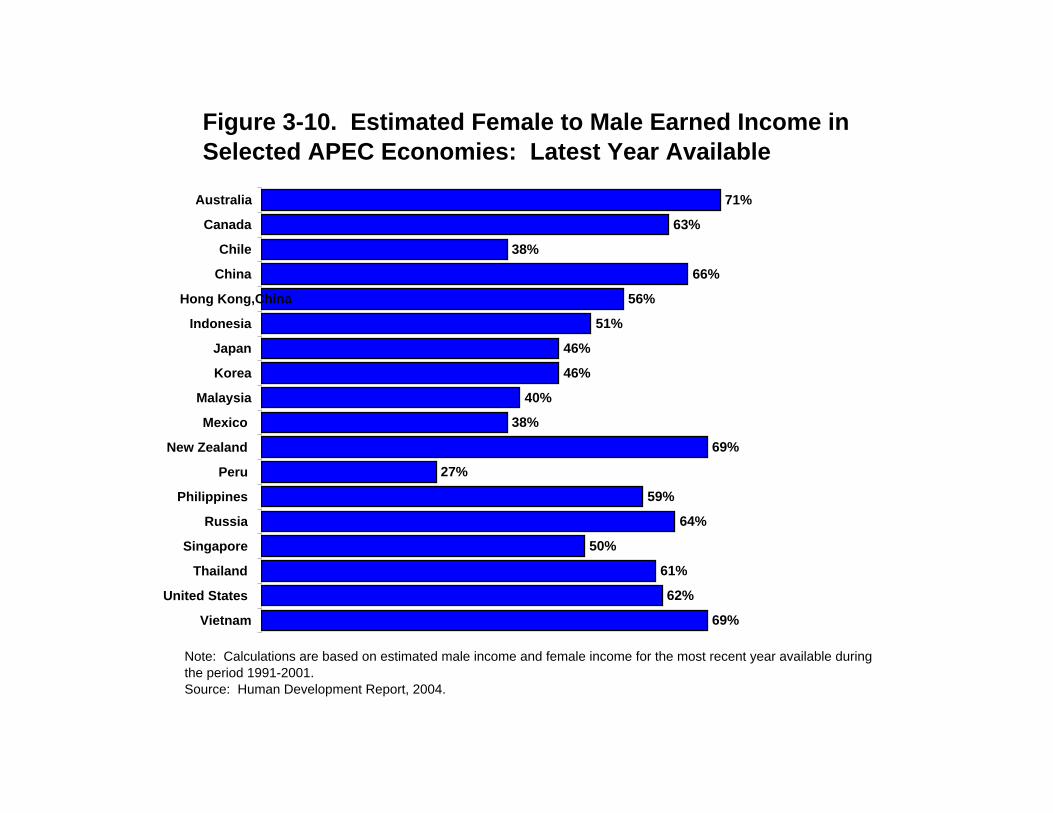
Figure 3-10. Estimated Female to Male Earned Income in Selected APEC Economies: Latest Year Available
69%
62%
61%
50%
64%
59%
27%
69%
38%
40%
46%
46%
51%
56%
66%
38%
63%
71%
Vietnam
United States
Thailand
Singapore
Russia
Philippines
Peru
New Zealand
Mexico
Malaysia
Korea
Japan
Indonesia
Hong Kong,China
China
Chile
Canada
Australia
Note: Calculations are based on estimated male income and female income for the most recent year available duringthe period 1991-2001.Source: Human Development Report, 2004.
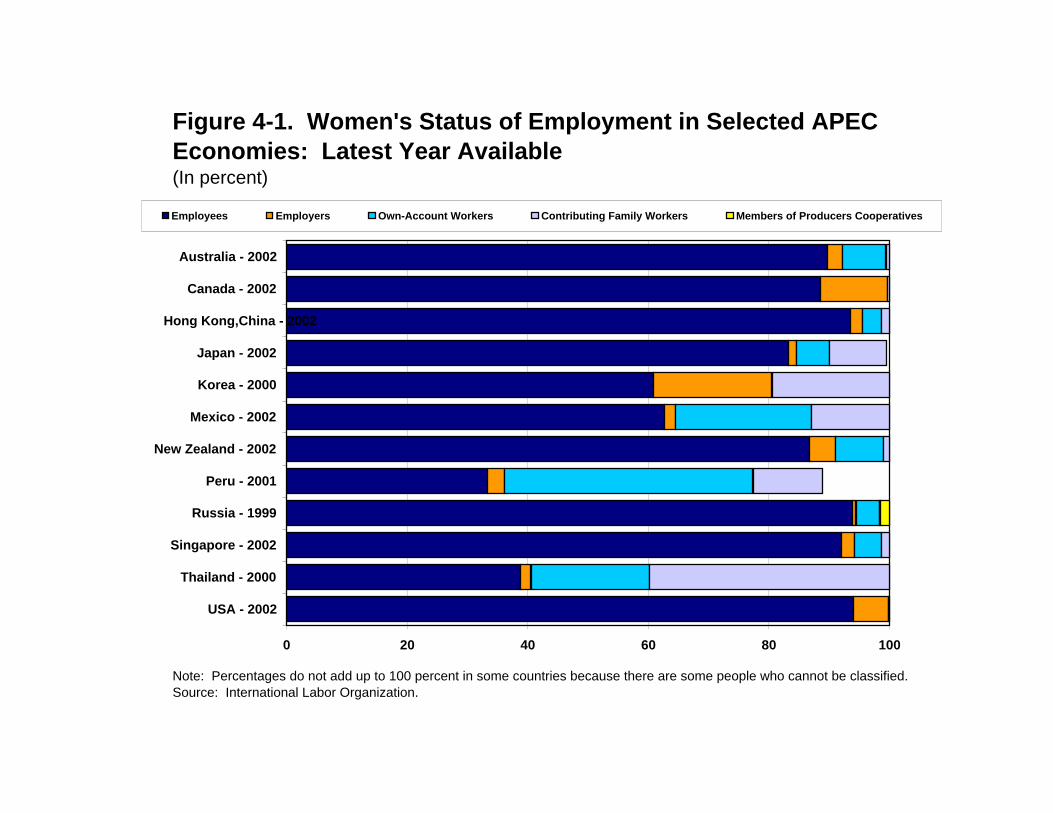
Figure 4-1. Women's Status of Employment in Selected APEC Economies: Latest Year Available(In percent)
0 20 40 60 80 100
USA - 2002
Thailand - 2000
Singapore - 2002
Russia - 1999
Peru - 2001
New Zealand - 2002
Mexico - 2002
Korea - 2000
Japan - 2002
Hong Kong,China - 2002
Canada - 2002
Australia - 2002
Employees Employers Own-Account Workers Contributing Family Workers Members of Producers Cooperatives
Note: Percentages do not add up to 100 percent in some countries because there are some people who cannot be classified.Source: International Labor Organization.
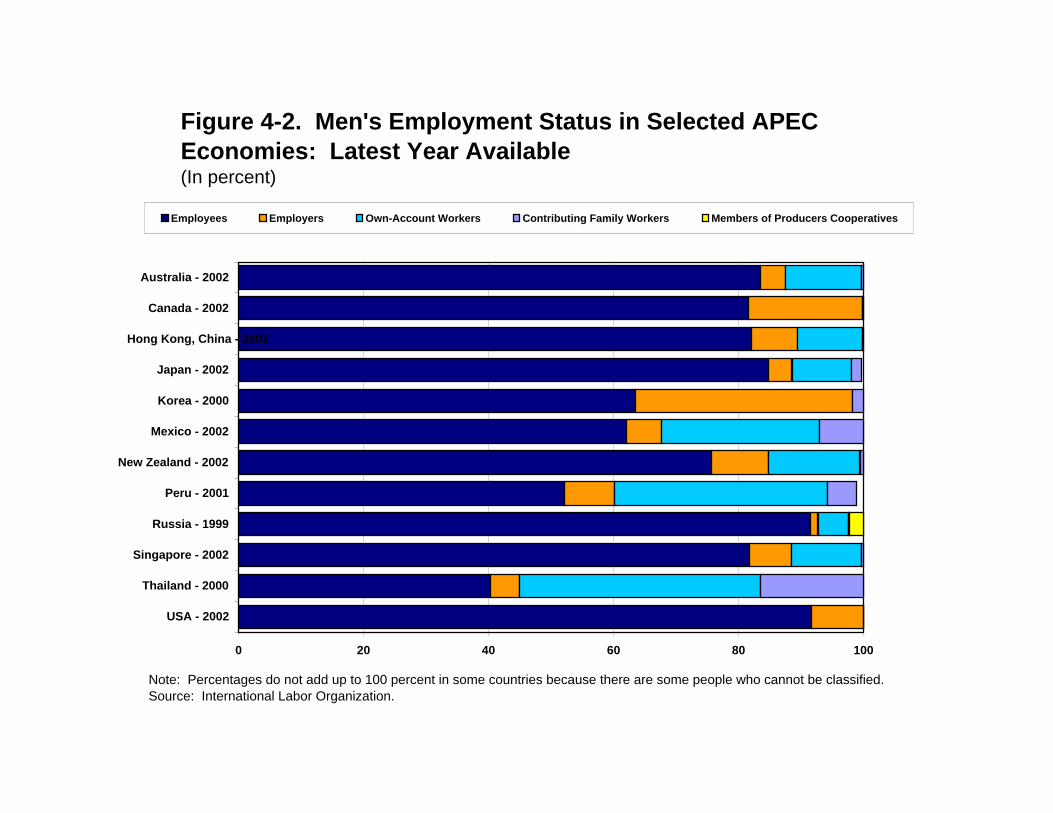
Figure 4-2. Men's Employment Status in Selected APEC Economies: Latest Year Available(In percent)
0 20 40 60 80 100
USA - 2002
Thailand - 2000
Singapore - 2002
Russia - 1999
Peru - 2001
New Zealand - 2002
Mexico - 2002
Korea - 2000
Japan - 2002
Hong Kong, China - 2002
Canada - 2002
Australia - 2002
Employees Employers Own-Account Workers Contributing Family Workers Members of Producers Cooperatives
Note: Percentages do not add up to 100 percent in some countries because there are some people who cannot be classified.Source: International Labor Organization.
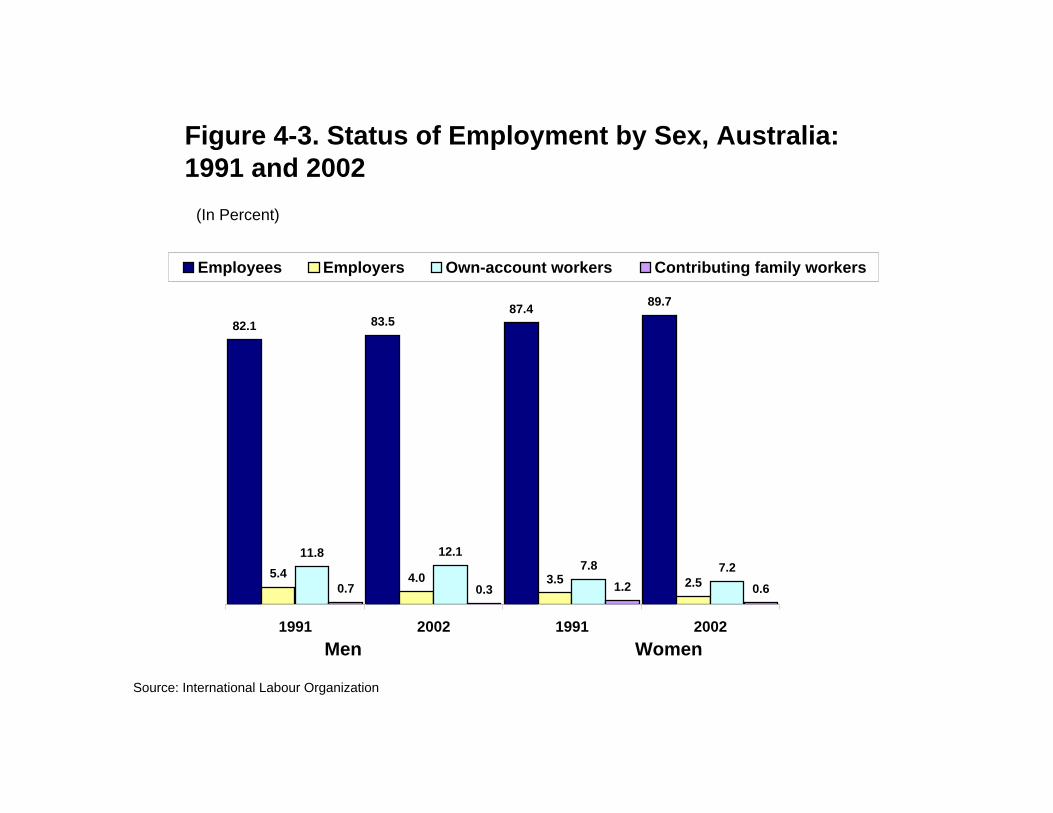
Figure 4-3. Status of Employment by Sex, Australia: 1991 and 2002
82.1 83.587.4 89.7
5.4 4.0 3.5 2.5
11.8 12.17.8 7.2
0.7 0.3 1.2 0.6
1991 2002 1991 2002
Employees Employers Own-account workers Contributing family workers
Men Women
Source: International Labour Organization
(In Percent)
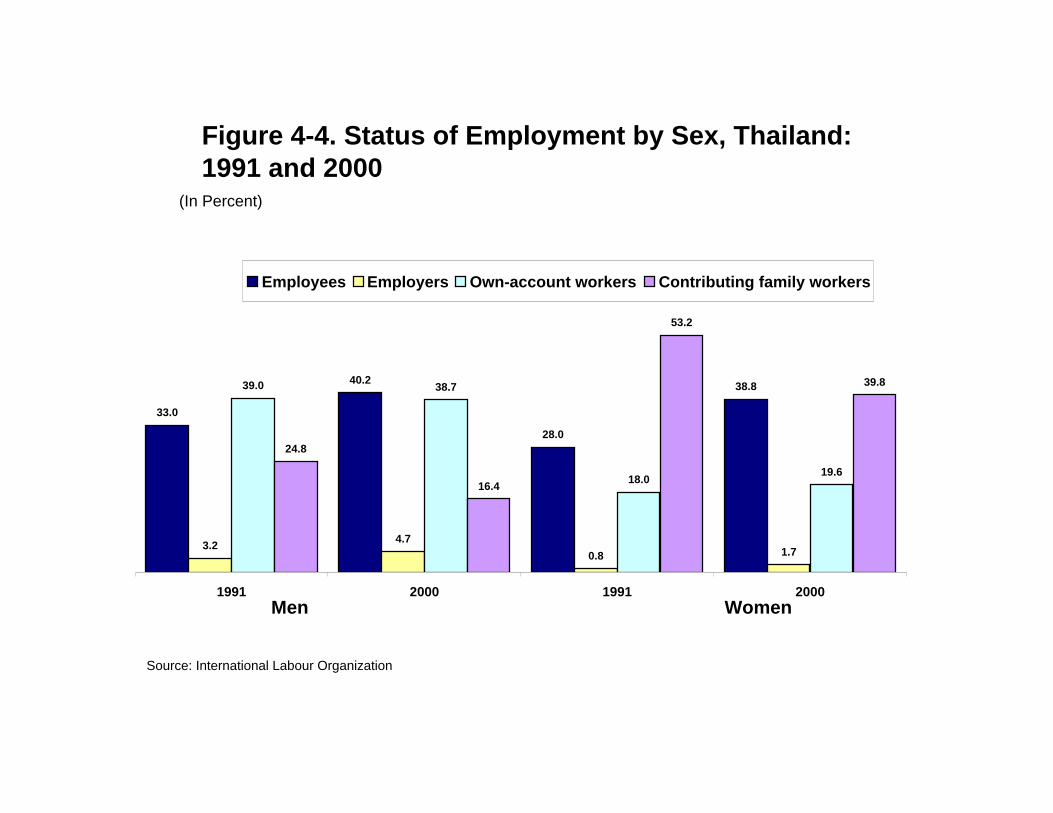
Figure 4-4. Status of Employment by Sex, Thailand: 1991 and 2000
40.2
28.0
38.8
3.2 4.70.8 1.7
39.0 38.7
18.0 19.6
24.8
16.4
53.2
39.8
33.0
1991 2000 1991 2000
Employees Employers Own-account workers Contributing family workers
Men Women
Source: International Labour Organization
(In Percent)
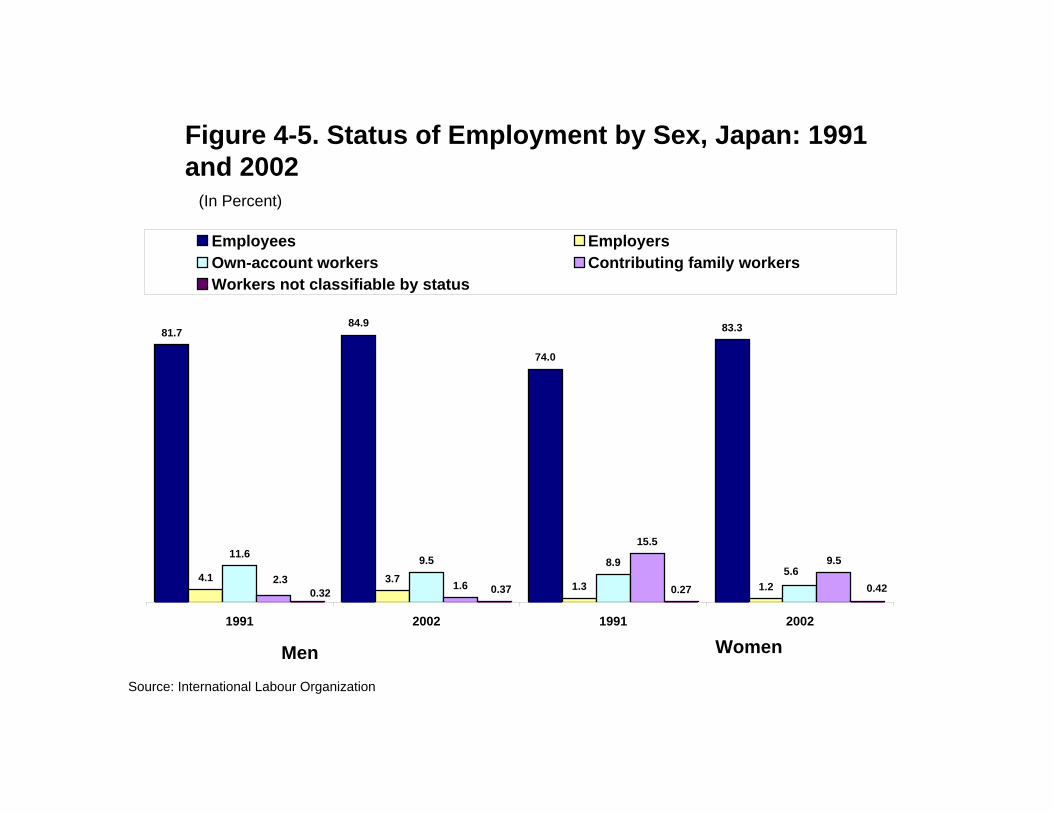
Figure 4-5. Status of Employment by Sex, Japan: 1991 and 2002
81.784.9
74.0
83.3
4.1 3.71.3 1.2
11.6 9.5 8.9
1.6
15.5
9.5
0.275.6
2.30.420.370.32
1991 2002 1991 2002
Employees EmployersOwn-account workers Contributing family workersWorkers not classifiable by status
Source: International Labour Organization
Men Women
(In Percent)
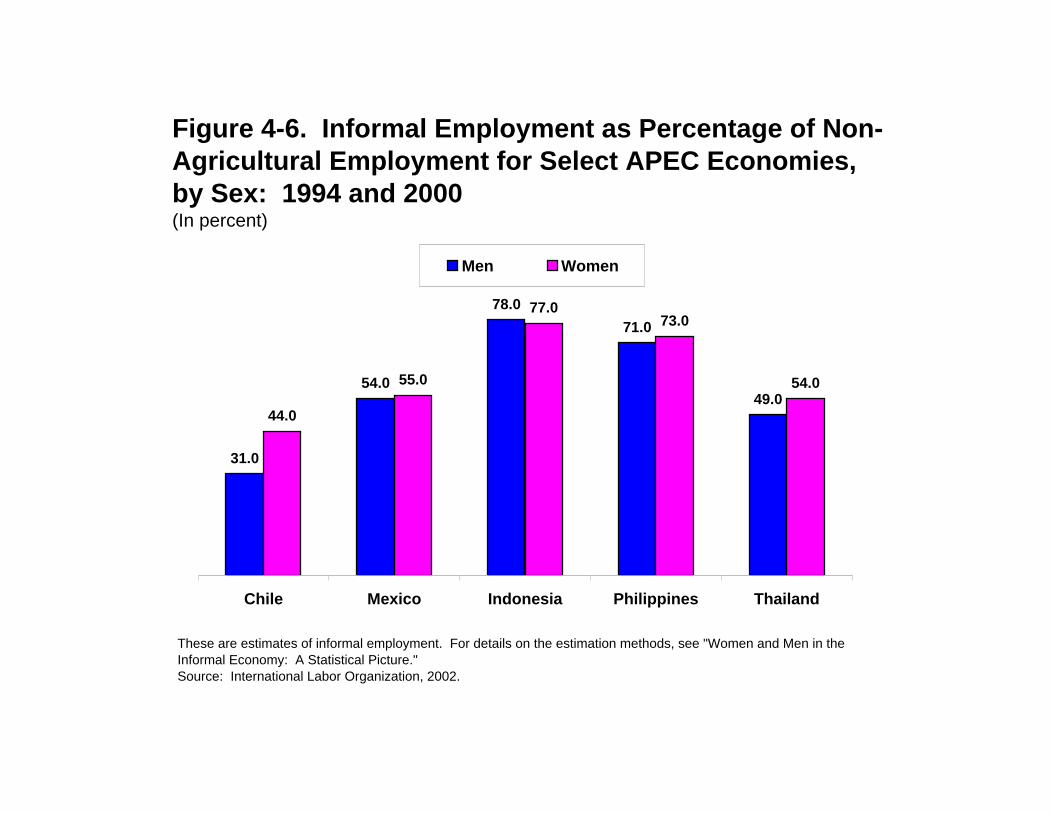
Figure 4-6. Informal Employment as Percentage of Non-Agricultural Employment for Select APEC Economies, by Sex: 1994 and 2000(In percent)
31.0
54.0
78.071.0
49.044.0
55.0
77.073.0
54.0
Chile Mexico Indonesia Philippines Thailand
Men Women
These are estimates of informal employment. For details on the estimation methods, see "Women and Men in theInformal Economy: A Statistical Picture."Source: International Labor Organization, 2002.
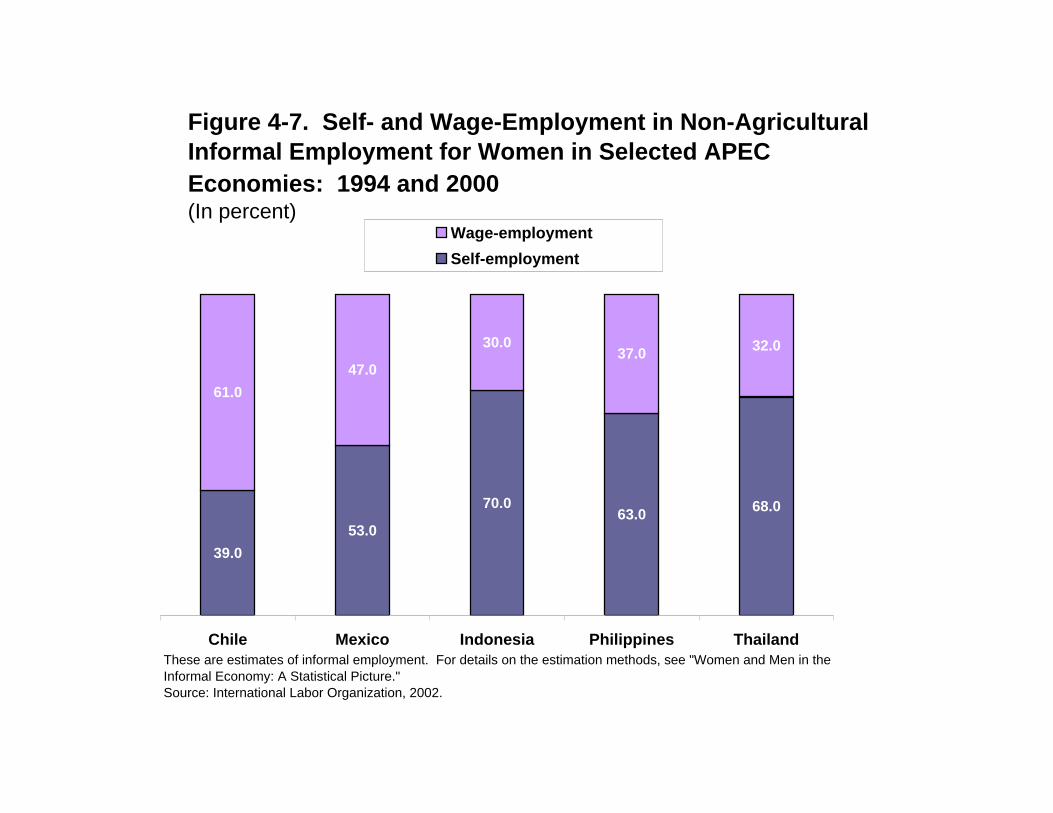
Figure 4-7. Self- and Wage-Employment in Non-Agricultural Informal Employment for Women in Selected APEC Economies: 1994 and 2000(In percent)
39.053.0
70.063.0 68.0
61.047.0
30.037.0 32.0
Chile Mexico Indonesia Philippines Thailand
Wage-employmentSelf-employment
These are estimates of informal employment. For details on the estimation methods, see "Women and Men in theInformal Economy: A Statistical Picture."Source: International Labor Organization, 2002.
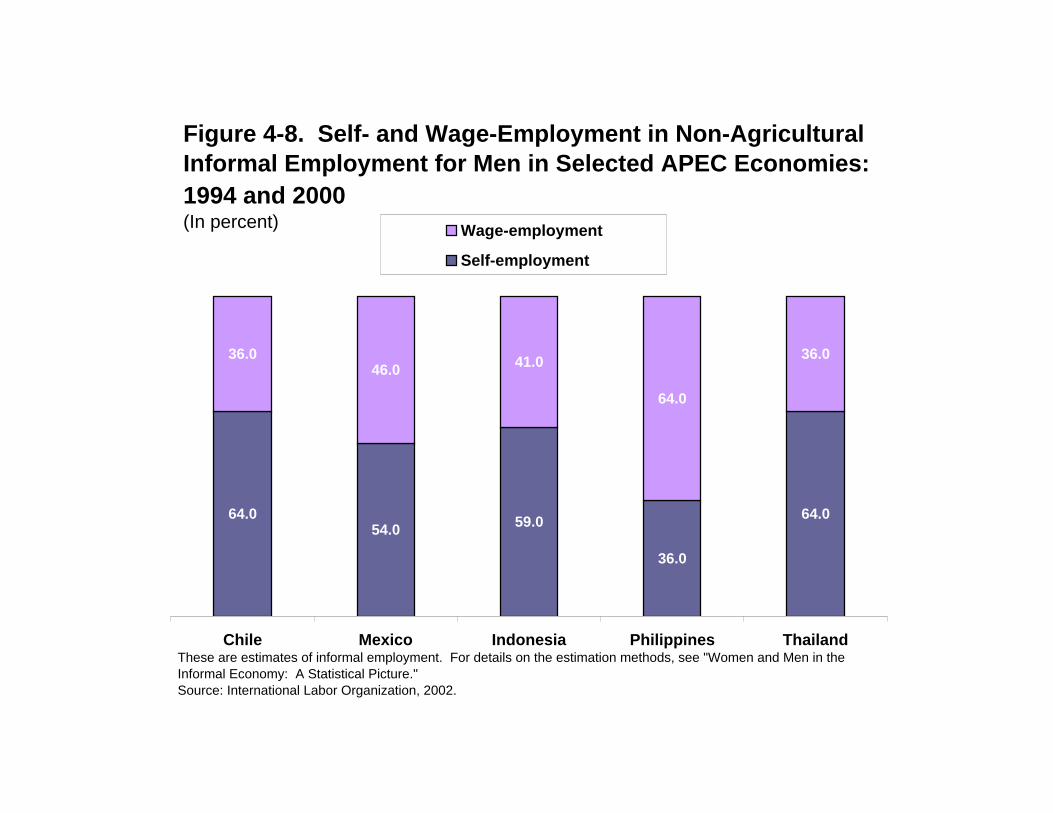
Figure 4-8. Self- and Wage-Employment in Non-Agricultural Informal Employment for Men in Selected APEC Economies: 1994 and 2000(In percent)
64.054.0 59.0
36.0
64.0
36.046.0
64.0
36.041.0
Chile Mexico Indonesia Philippines Thailand
Wage-employment
Self-employment
These are estimates of informal employment. For details on the estimation methods, see "Women and Men in theInformal Economy: A Statistical Picture."Source: International Labor Organization, 2002.
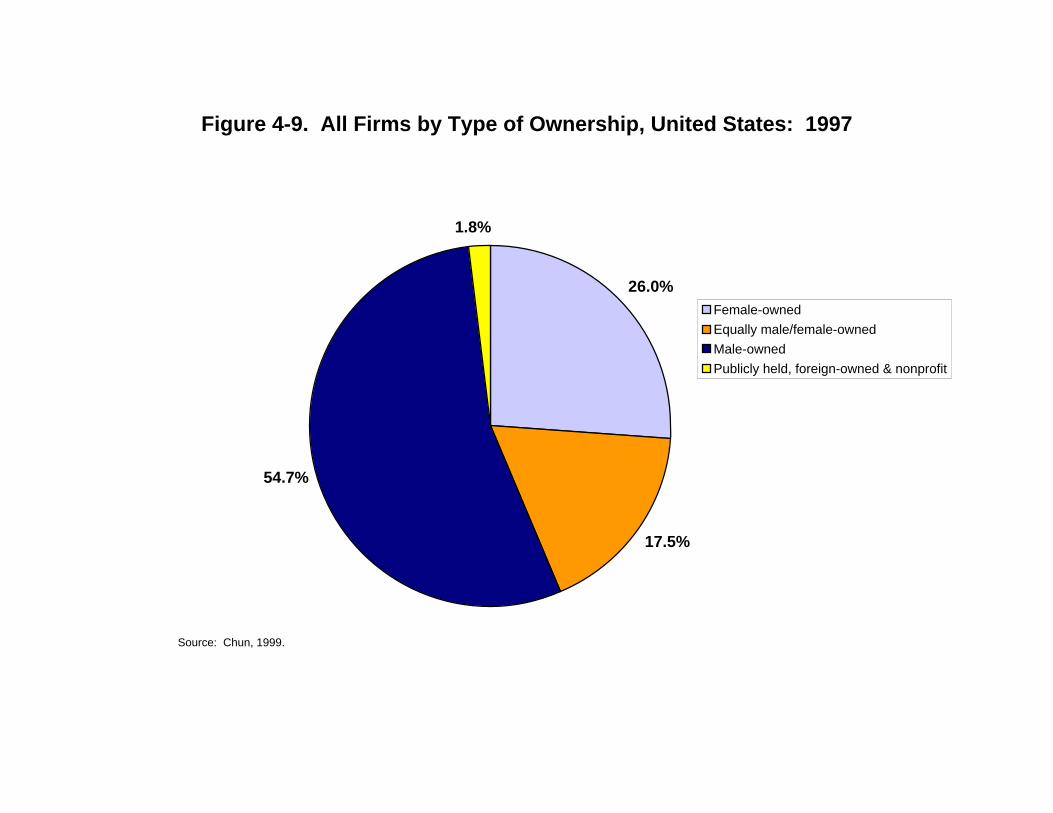
Figure 4-9. All Firms by Type of Ownership, United States: 1997
26.0%
17.5%
54.7%
1.8%
Female-ownedEqually male/female-ownedMale-ownedPublicly held, foreign-owned & nonprofit
Source: Chun, 1999.
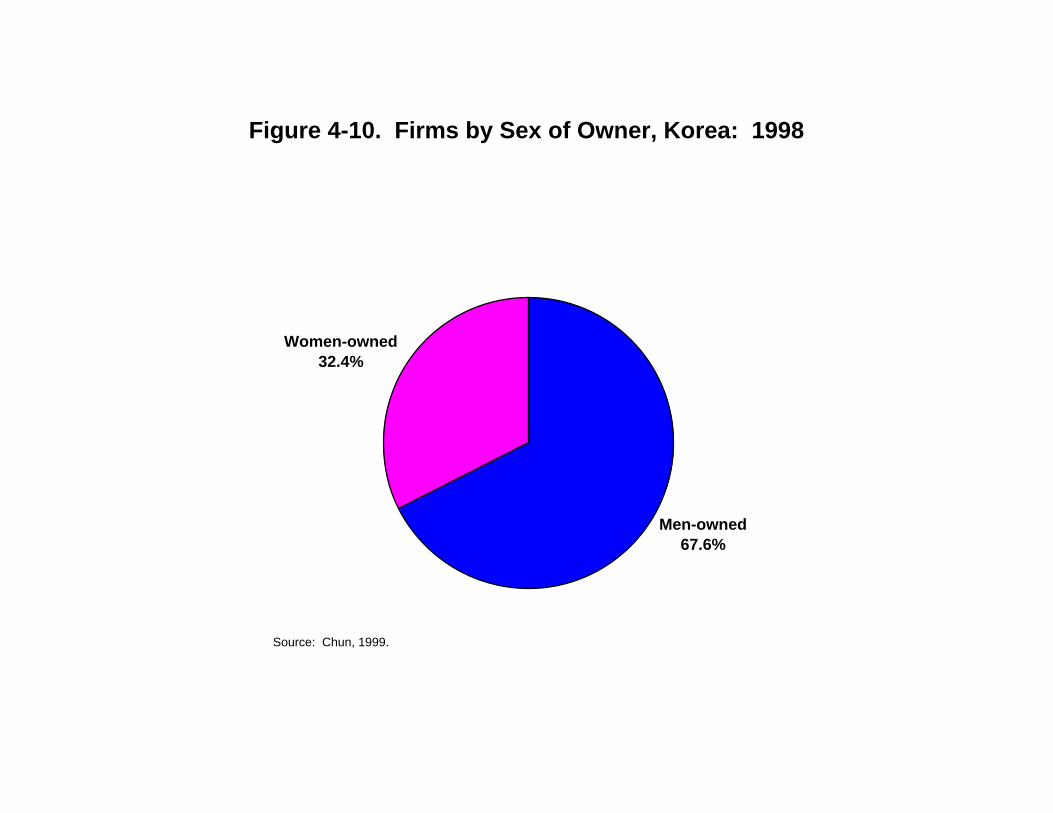
Figure 4-10. Firms by Sex of Owner, Korea: 1998
Men-owned67.6%
Women-owned32.4%
Source: Chun, 1999.
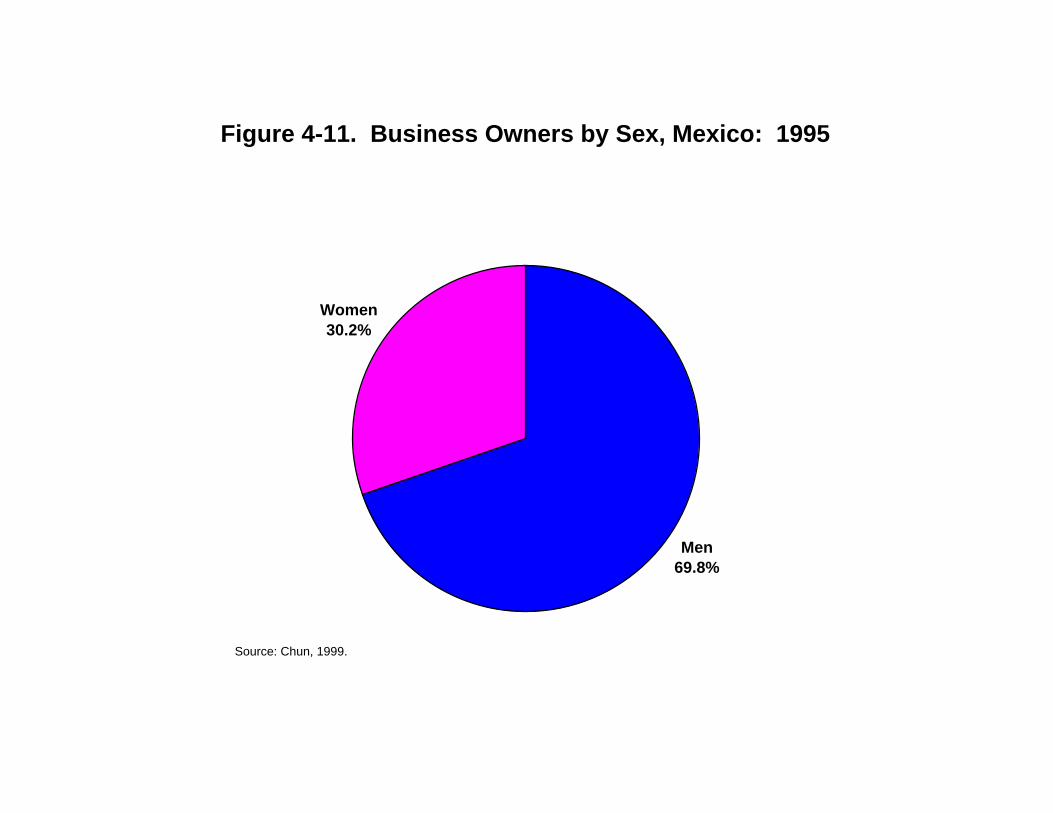
Figure 4-11. Business Owners by Sex, Mexico: 1995
Women30.2%
Men69.8%
Source: Chun, 1999.
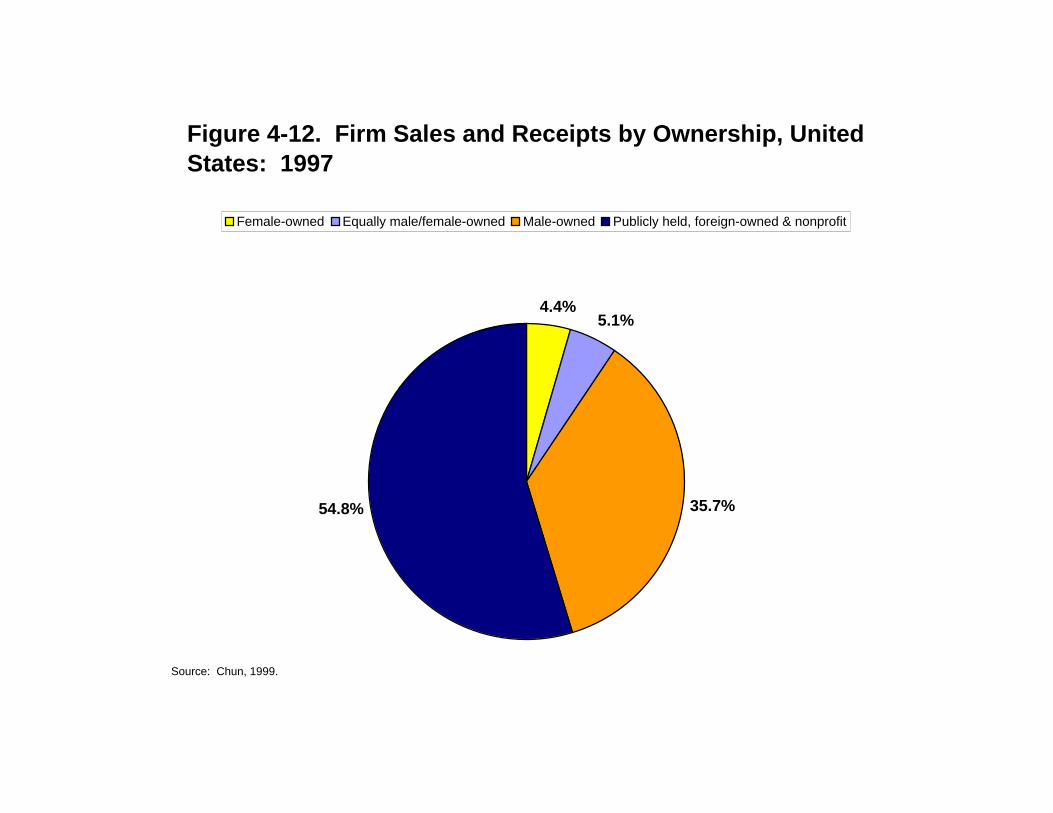
Figure 4-12. Firm Sales and Receipts by Ownership, United States: 1997
4.4%5.1%
35.7%54.8%
Female-owned Equally male/female-owned Male-owned Publicly held, foreign-owned & nonprofit
Source: Chun, 1999.
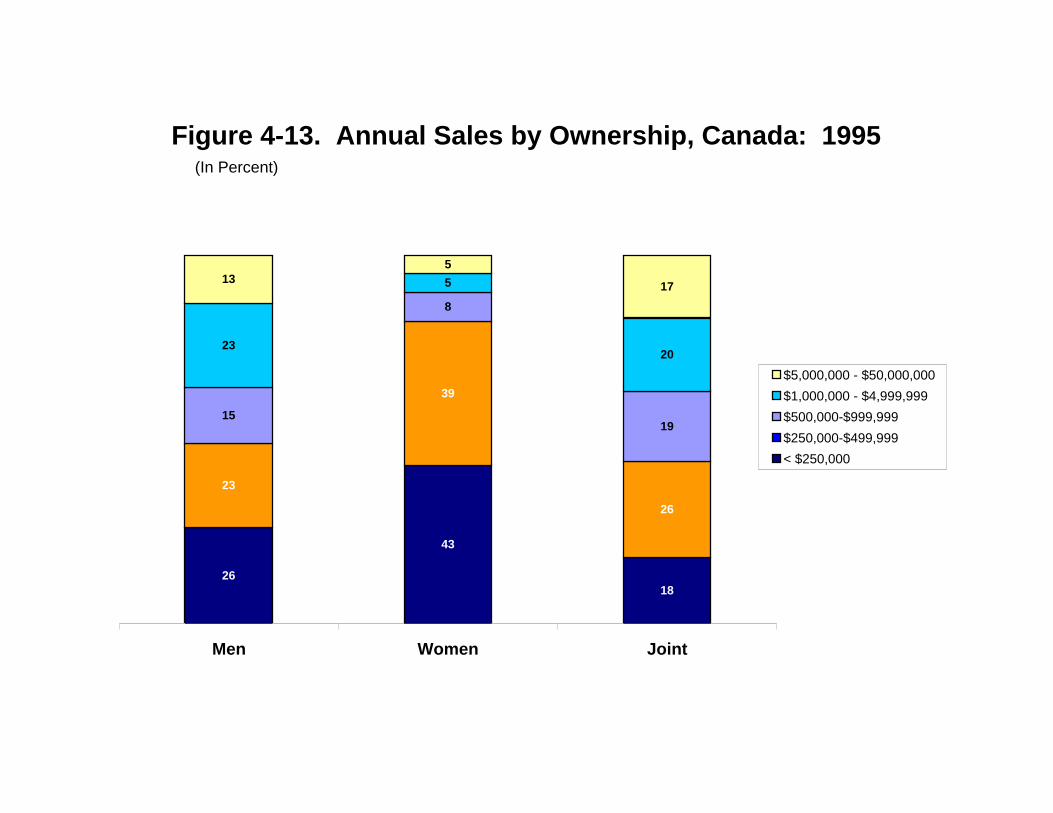
Figure 4-13. Annual Sales by Ownership, Canada: 1995
26
43
18
23
39
26
15
8
19
23
5
20
135
17
Men Women Joint
$5,000,000 - $50,000,000$1,000,000 - $4,999,999 $500,000-$999,999$250,000-$499,999< $250,000
(In Percent)
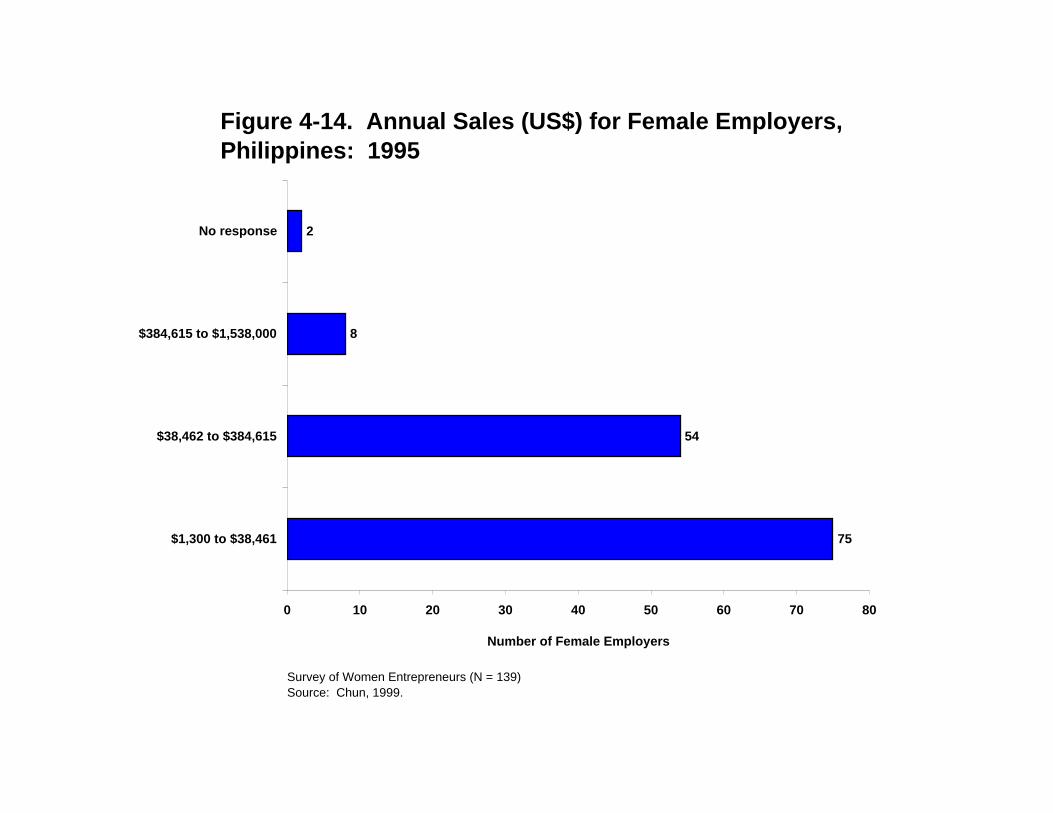
Figure 4-14. Annual Sales (US$) for Female Employers, Philippines: 1995
75
54
8
2
0 10 20 30 40 50 60 70 80
$1,300 to $38,461
$38,462 to $384,615
$384,615 to $1,538,000
No response
Number of Female Employers
Survey of Women Entrepreneurs (N = 139)Source: Chun, 1999.
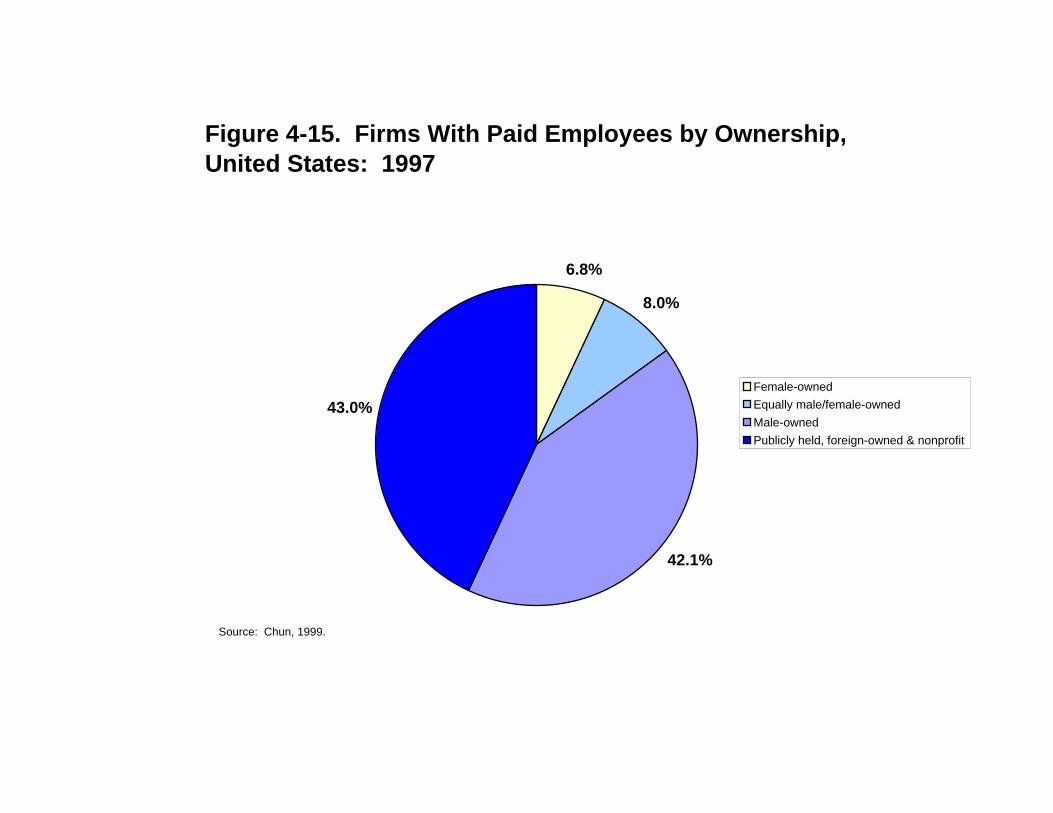
Figure 4-15. Firms With Paid Employees by Ownership, United States: 1997
6.8%
8.0%
42.1%
43.0%Female-ownedEqually male/female-ownedMale-ownedPublicly held, foreign-owned & nonprofit
Source: Chun, 1999.
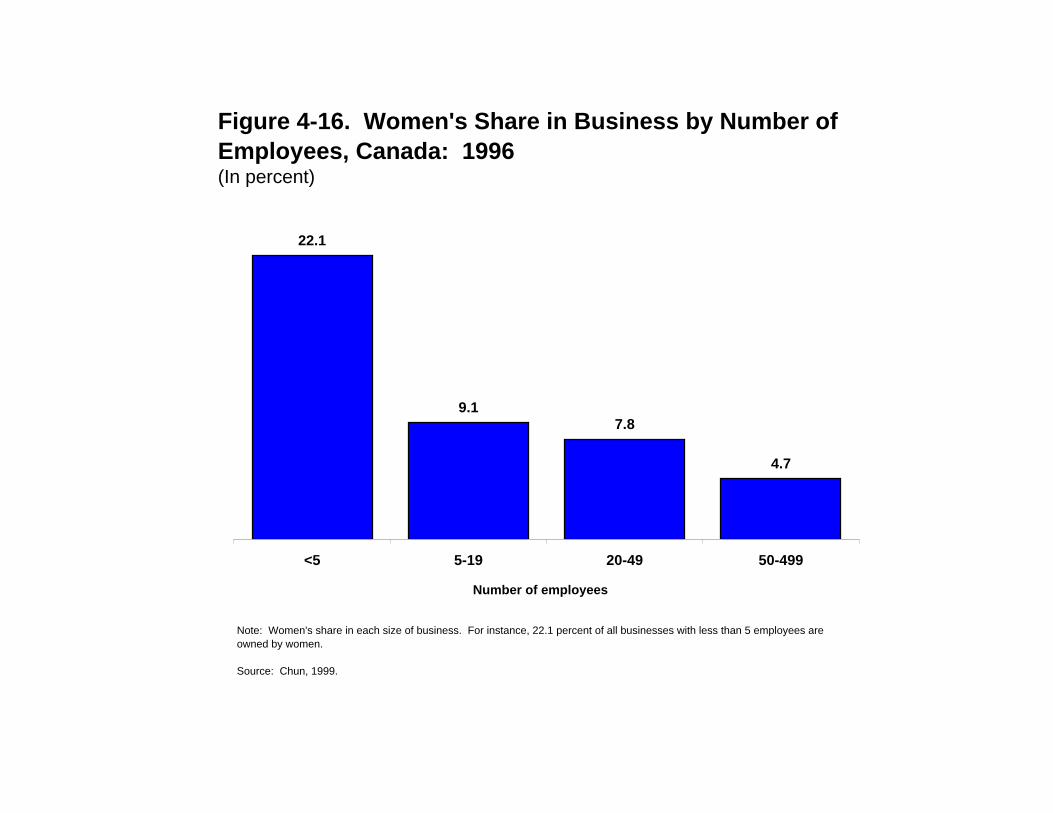
Figure 4-16. Women's Share in Business by Number of Employees, Canada: 1996(In percent)
22.1
9.17.8
4.7
<5 5-19 20-49 50-499
Number of employees
Note: Women's share in each size of business. For instance, 22.1 percent of all businesses with less than 5 employees are owned by women.
Source: Chun, 1999.
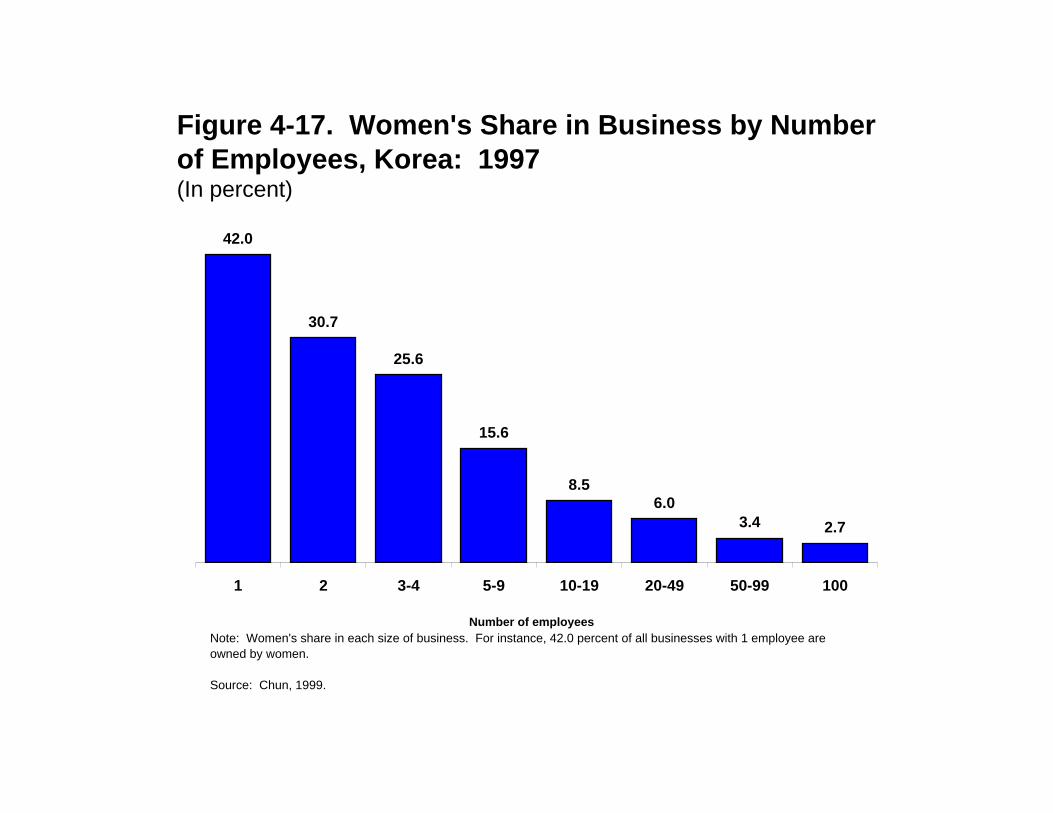
Figure 4-17. Women's Share in Business by Number of Employees, Korea: 1997(In percent)
42.0
30.7
25.6
15.6
8.56.0
3.4 2.7
1 2 3-4 5-9 10-19 20-49 50-99 100
Note: Women's share in each size of business. For instance, 42.0 percent of all businesses with 1 employee are owned by women.
Source: Chun, 1999.
Number of employees
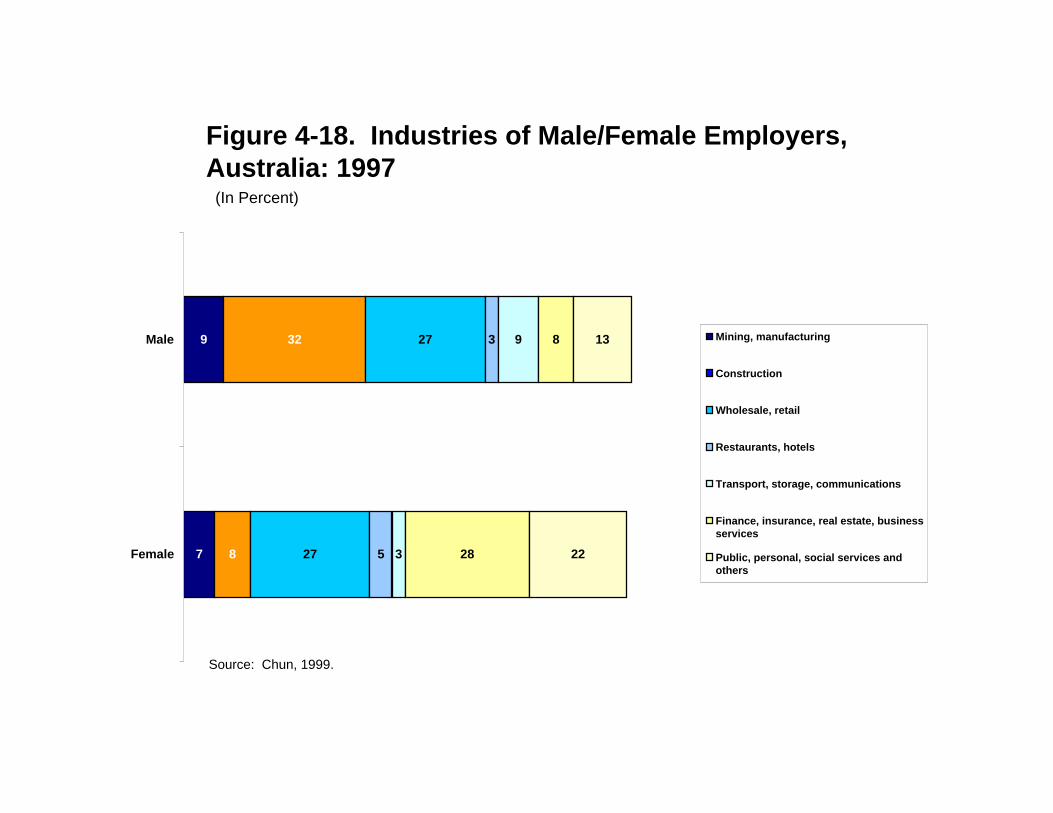
Figure 4-18. Industries of Male/Female Employers, Australia: 1997
7
9
8
32
27
27
5
3
3
9
28
8
22
13
Female
Male Mining, manufacturing
Construction
Wholesale, retail
Restaurants, hotels
Transport, storage, communications
Finance, insurance, real estate, businessservices
Public, personal, social services andothers
Source: Chun, 1999.
(In Percent)
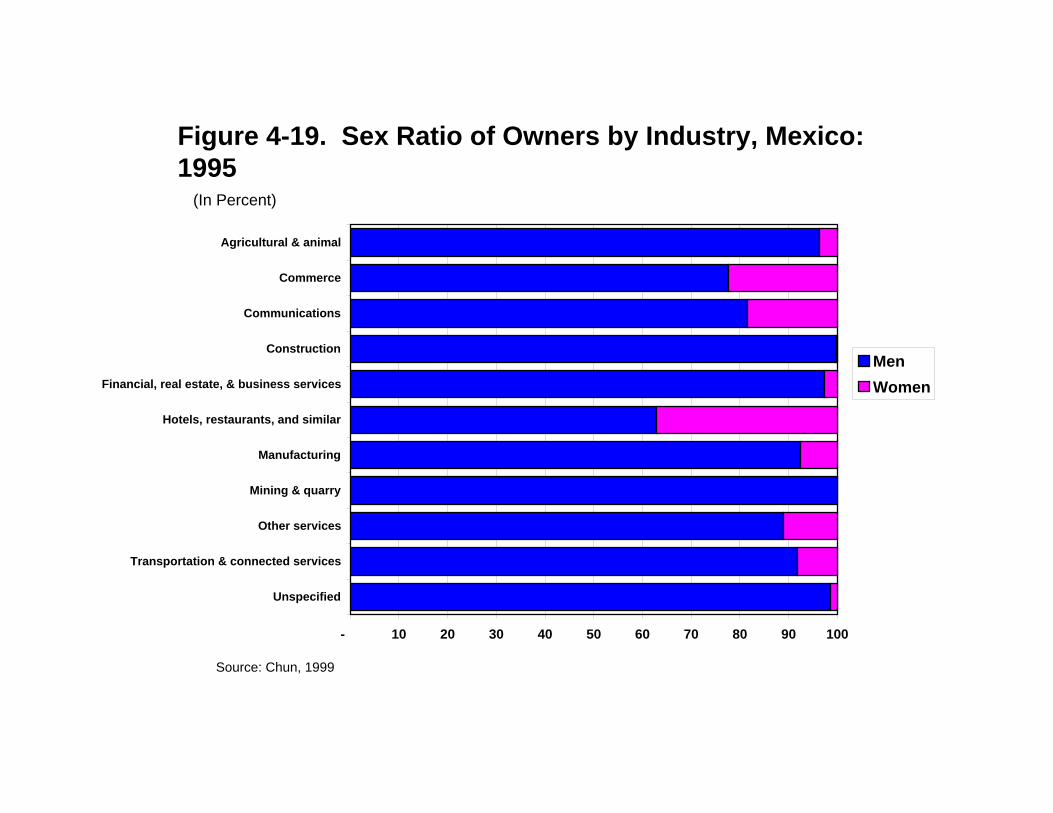
Figure 4-19. Sex Ratio of Owners by Industry, Mexico: 1995
- 10 20 30 40 50 60 70 80 90 100
Unspecified
Transportation & connected services
Other services
Mining & quarry
Manufacturing
Hotels, restaurants, and similar
Financial, real estate, & business services
Construction
Communications
Commerce
Agricultural & animal
MenWomen
Source: Chun, 1999
(In Percent)
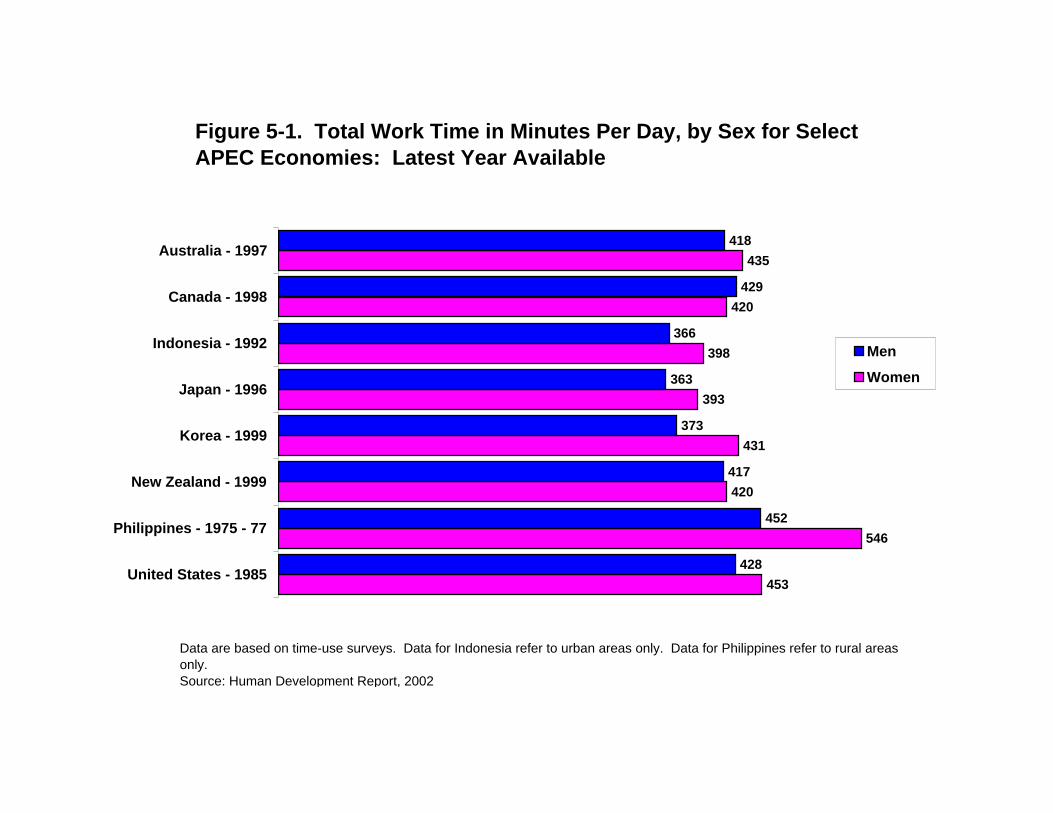
Figure 5-1. Total Work Time in Minutes Per Day, by Sex for Select APEC Economies: Latest Year Available
453
546
420
431
393
398
420
435
428
452
417
373
363
366
429
418
United States - 1985
Philippines - 1975 - 77
New Zealand - 1999
Korea - 1999
Japan - 1996
Indonesia - 1992
Canada - 1998
Australia - 1997
Men
Women
Data are based on time-use surveys. Data for Indonesia refer to urban areas only. Data for Philippines refer to rural areas only.Source: Human Development Report, 2002
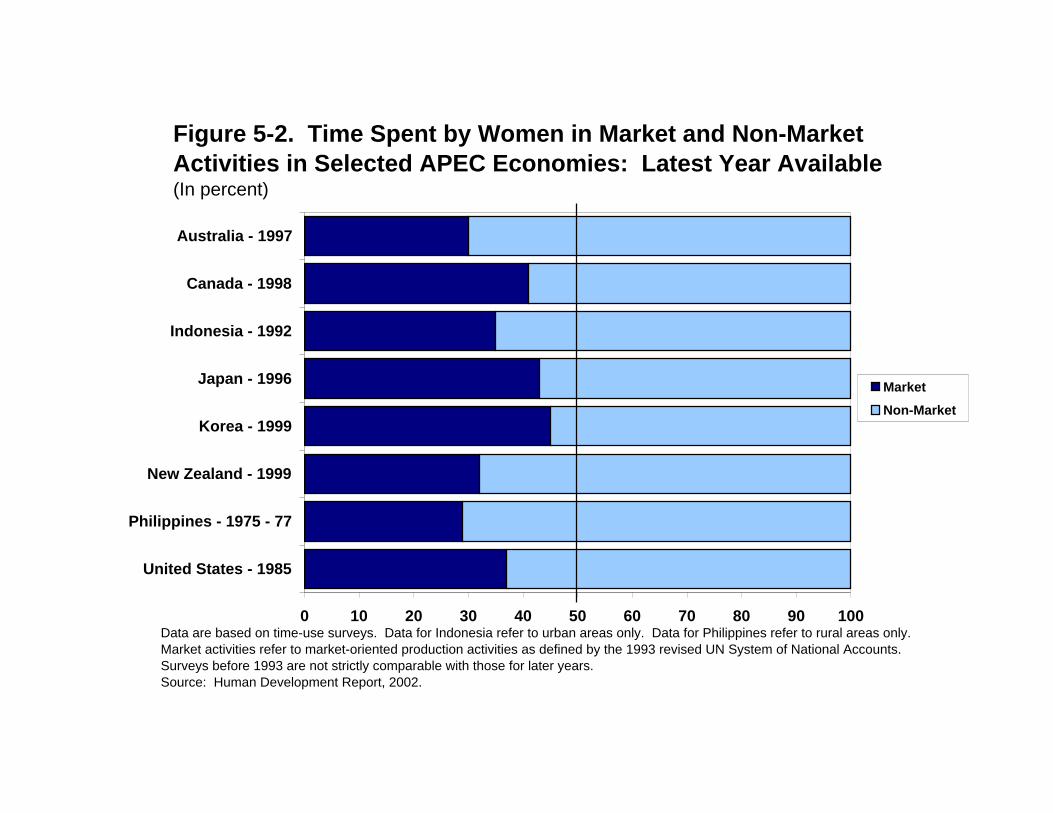
Figure 5-2. Time Spent by Women in Market and Non-Market Activities in Selected APEC Economies: Latest Year Available(In percent)
0 10 20 30 40 50 60 70 80 90 100
United States - 1985
Philippines - 1975 - 77
New Zealand - 1999
Korea - 1999
Japan - 1996
Indonesia - 1992
Canada - 1998
Australia - 1997
Market
Non-Market
Data are based on time-use surveys. Data for Indonesia refer to urban areas only. Data for Philippines refer to rural areas only.Market activities refer to market-oriented production activities as defined by the 1993 revised UN System of National Accounts.Surveys before 1993 are not strictly comparable with those for later years.Source: Human Development Report, 2002.
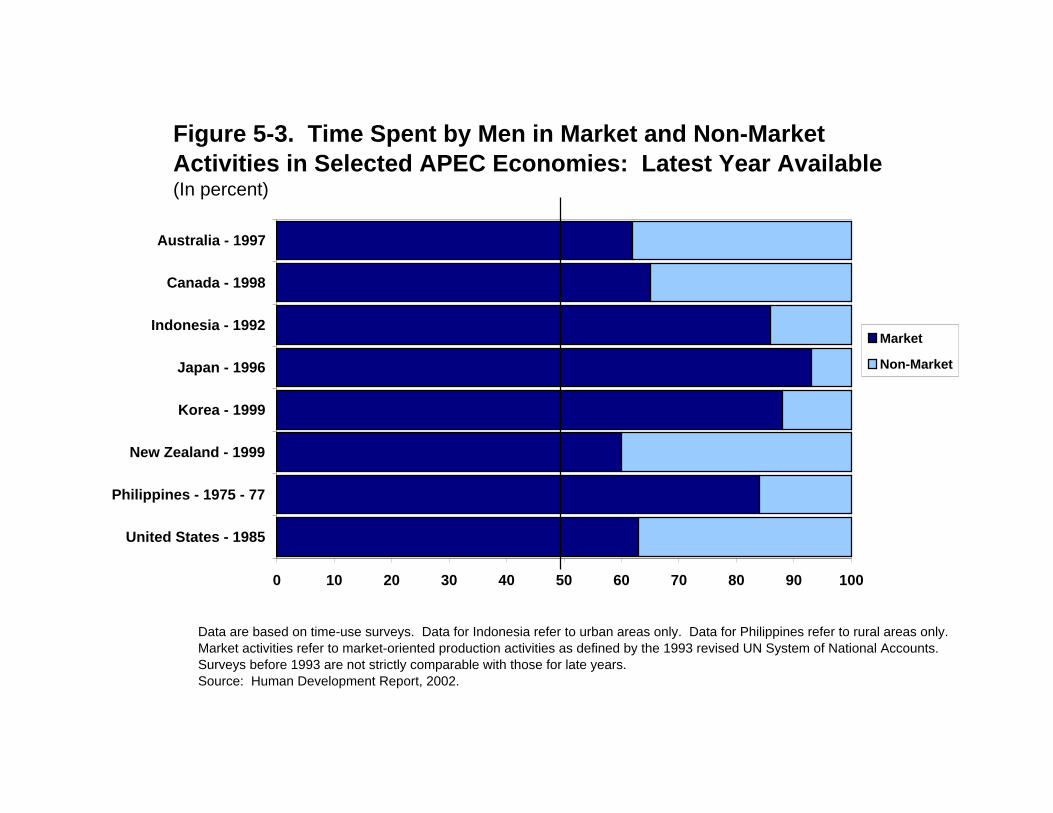
Figure 5-3. Time Spent by Men in Market and Non-Market Activities in Selected APEC Economies: Latest Year Available(In percent)
0 10 20 30 40 50 60 70 80 90 100
United States - 1985
Philippines - 1975 - 77
New Zealand - 1999
Korea - 1999
Japan - 1996
Indonesia - 1992
Canada - 1998
Australia - 1997
Market
Non-Market
Data are based on time-use surveys. Data for Indonesia refer to urban areas only. Data for Philippines refer to rural areas only.Market activities refer to market-oriented production activities as defined by the 1993 revised UN System of National Accounts. Surveys before 1993 are not strictly comparable with those for late years.Source: Human Development Report, 2002.
Related Documents