Economic Contribution of the UK’s Film, High-End TV, Video Game, and Animation Programming Sectors Report presented to the BFI, Pinewood Shepperton plc, Ukie, the British Film Commission and Pact by Olsberg•SPI with Nordicity February 2015

Welcome message from author
This document is posted to help you gain knowledge. Please leave a comment to let me know what you think about it! Share it to your friends and learn new things together.
Transcript

Economic Contribution of the UK’s Film, High-End TV, Video Game, and Animation Programming Sectors
Report presented to the BFI, Pinewood Shepperton plc, Ukie, the British Film Commission and Pact by Olsberg•SPI with Nordicity
February 2015

Contents
Economic Contribution of the UK’s Screen Sectors
© Olsberg•SPI and Nordicity 2015 iiFebruary 2015
Foreword from George Osborne, Chancellor of the Exchequer ...................... v
1. Key Points ......................................................................................................................................................1
1.1. Film .........................................................................................................................................................1 1.2. High-End TV ........................................................................................................................................2 1.3. Video Games .......................................................................................................................................2 1.4. Animation Programmes .................................................................................................................3
2. Executive Summary ...............................................................................................................................4
2.1. Film .........................................................................................................................................................4 2.2. High-End TV ........................................................................................................................................6 2.3. Video Games .......................................................................................................................................7 2.4. Animation Programmes .................................................................................................................8 How the Screen Sectors Benefit the UK Economy ............................................................. 10
3. Introduction ............................................................................................................................................. 11
3.1. Background ...................................................................................................................................... 11 3.2. Aims of this Report ........................................................................................................................ 11 3.3. Study Scope and Objectives ...................................................................................................... 11 3.4. Definitions of the Core UK Industries ..................................................................................... 12 3.5. UK Tax Reliefs, and the Definition of Qualifying Projects ................................................ 14 3.6. The Channels of Economic Impact .......................................................................................... 14
4. The Film Sector – Economic Impact ......................................................................................... 17
4.1. Overview of the Value Chain...................................................................................................... 17 4.2. Direct Impact ................................................................................................................................... 18 4.3. Multiplier Effects and Total Value Chain Impact ................................................................. 32 4.4. Impact of Tax Relief ....................................................................................................................... 34 4.5. Spillover Effects .............................................................................................................................. 36 4.6. Overall Economic Contribution ................................................................................................ 39
5. The High-End TV Sector – Economic Impact ..................................................................... 41
5.1. Introduction ..................................................................................................................................... 41 5.2. Direct Impact ................................................................................................................................... 42 5.3. Multiplier Effects and Total Value Chain Impact ................................................................. 47 5.4. Impact of Tax Relief ....................................................................................................................... 48 5.5. Spillover Effects .............................................................................................................................. 50 5.6. Overall Economic Contribution ................................................................................................ 51
6. The Video Games Sector – Economic Impact .................................................................... 52
6.1. Introduction and Overview of the Value Chain .................................................................. 52 6.2. Direct Impact – Employment and GVA .................................................................................. 54 6.3. Multiplier Effects and Total Economic Impact ..................................................................... 59 6.4. Spillover Effects – Merchandise Sales ..................................................................................... 60 6.5. Overall Economic Contribution ................................................................................................ 61

Economic Contribution of the UK’s Screen Sectors
7. The Animation Programme Sector – Economic Impact ........................................... 62 7.1. Introduction ..................................................................................................................................... 62 7.2. Direct Impact – Employment and GVA .................................................................................. 63 7.3. Multiplier Effects and Total Value Chain Impact ................................................................. 67 7.4. Impact of Tax Relief ....................................................................................................................... 68 7.5. Spillover Effects .............................................................................................................................. 70 7.6. Overall Economic Contribution ................................................................................................ 71
8. Conclusions ............................................................................................................................................... 72 8.1. Value Chain Impact (Direct Impact and Multiplier Effects) ............................................. 72 8.2. Sectoral Evolution .......................................................................................................................... 73 8.3. Spillover Effects .............................................................................................................................. 73 8.4. Overall Economic Contribution ................................................................................................ 74
9. Bibliography ................................................................................................................................................. I 10. Appendix 1 – Economic Contribution Analysis Methodology ........................ III 10.1. Film ........................................................................................................................................................ III 10.2. High-End TV ...................................................................................................................................... VI 10.3. Video Games .................................................................................................................................... VII 10.4. Animation ........................................................................................................................................ XIII 10.5. Tourism Methodology ..................................................................................................................XV 10.6. Aggregate Statistics .....................................................................................................................XVI
11. Appendix 2 – Lists of Tables and Figures ...........................................................................XVII 11.1. List of Tables ...................................................................................................................................XVII 11.2. List of Figures............................................................................................................................... XVIII
12. Appendix 3 – Glossary ......................................................................................................................XX
© Olsberg•SPI and Nordicity 2015 iiiFebruary 2015

The BFI is the lead organisation for film in the UK. Founded in 1933, it is a registered charity governed by Royal Charter. In 2011 it was given additional responsibilities, becoming a Government arm’s-length body and distributor of Lottery funds for film, widening its strategic focus.The BFI now combines a cultural, creative and industrial role. The role brings together activities including the BFI National Archive and distribution, its cultural programmes, publishing and festivals with Lottery investment for film production, distribution, education, audience development and market intelligence and research.
The Pinewood Studios Group is a leading provider of studio and related services to the global film and television industry. Synonymous with world class British and international productions, the impressive heritage of its UK-based Pinewood and Shepperton Studios date back to the early 20th Century and are home to some of the most successful feature films and TV shows ever made.The facilities comprise the best quality sound stages, a globally unique underwater filming stage, a wealth of specialist production resources, state of the art TV studios, post production and digital content services.The studios also offer easy access to the world’s most experienced crews as well as the expertise of hundreds of complementary media companies based at its Pinewood and Shepperton Media Hubs.
The British Film Commission (BFC) is the national body responsible for maximising and supporting the production of international feature film and high-end television in the UK. With offices in the UK and the US, the BFC provides free professional advice from the earliest stages of development through to completion.The BFC has industry sponsors, who form the membership of the agency’s innovative public/private partnership: Disney, Harbottle & Lewis, Pinewood Studios Group, Saffery Champness, Warner Bros. UK, BBC Worldwide, Coutts, Double Negative, Elstree Studios, Framestore, MPC and Working Title Films.The British Film Commission is managed by Film London through a public/private partnership made up of its commercial sponsors, with funding from the Department for Culture, Media and Sport, BFI and UK Trade and Investment.
The Association for United Kingdom Interactive Entertainment or Ukie is the trade body that aims to support, grow and promote the whole of the UK’s games and interactive entertainment industry. Ukie’s membership includes all the major UK and global games publishers and the best of UK development talent. Ukie works with government to champion a range of issues including age ratings, education and skills, access to finance and protecting intellectual property rights. It also works with the media to ensure true and accurate representation of the sector by raising awareness of the industry’s positive economic contribution and the societal benefits of gaming to policy makers, regulators and consumers.
Pact is the UK trade association which represents the commercial interests of 500 independent television, feature film and digital media companies.Pact supports its members with legal and business affairs advice and support, as well as a wide range of services and campaign work.Pact helps to shape the best possible regulatory and legislative environment for the independent production sector to grow domestically and internationally – the association has a strong record of success in campaigning for producers’ rights.
Commissioning Partners
Economic Contribution of the UK’s Screen Sectors
© Olsberg•SPI and Nordicity 2015 ivFebruary 2015

Economic Contribution of the UK’s Screen Sectors
Foreword for the BFI’s Economic Impact Report
© Olsberg•SPI and Nordicity 2015 vFebruary 2015
I am delighted to welcome the publication of the BFI’s Economic Impact Report. As the report makes clear, the UK can be rightly proud of its screen-based creative industries. The sector is dynamic, innovative, internationally respected – and growing.The creative industries are one of the UK’s great strengths. British films, video games, animation and television are enjoyed by audiences around the world. This enhances our reputation and attracts tourism from abroad.
In addition to its cultural value, the creative sector is delivering real benefits to our economy. It adds billions to UK GDP each year and supports jobs across the country. The growth of the creative sector also benefits other parts of the economy, as it empowers our workforce to develop new skills and provides the infrastructure for innovation.
Indeed, UK-based facilities are expanding their operations at rapid pace. The BFI estimate that independent British films had a 16% share of the UK box office in 2014. Films like Gravity, The Theory of Everything, The Imitation Game and Mr Turner have won accolades around the world. British television is booming as well – programmes like Game of Thrones and Downton Abbey are being watched by global audiences.
As this report shows, government support has played an important role in helping the screen-based creative industries to thrive. Film tax relief has been claimed by over 1,600 films since 2007. The total production expenditure by films claiming tax relief stands at £7.8 billion, of which 72% was incurred in the UK.
Backing the strengths of the UK economy is a key part of our long term economic plan. That’s why this government has introduced tax relief for high-end television, animation, video games and theatre productions to maximise the cultural and economic benefits enabled by this kind of support. These will soon be joined by tax relief for orchestras and children’s television. Our creative sector tax reliefs have a proven record of success – in 2014, £615 million was spent on producing high-end television in the UK.
This is a golden age for the creative sector in the UK. In the coming years, I am confident our creative industries will continue to make the people of Britain proud, helping us to lead the world in the fields of innovation, creativity and art.
George OsborneChancellor of the Exchequer

Economic Contribution of the UK’s Screen Sectors
1. Key Points1.1 Film
l In 2013 the core UK film sector1
o supported 39,800 Full-Time Equivalents (FTEs) of direct employment and
o contributed £1.4 billion in direct Gross Value Added (GVA).
l The UK film sector generated nearly £1.4 billion in exports in 2013, yielding a trade surplus of £916 million.
l The UK film sector displayed the highest export intensity of any UK service sector in 2013, with exports being equivalent to 65% of sectoral GVA. This was nearly double the export intensity of 35% observed across the overall UK economy.
l The UK film sector has made private sector capital investments in the UK of more than £425 million since 2007. This goes beyond the South East – where Pinewood Shepperton plc, Warner Bros. Studios Leavesden, and Industrial Light & Magic have all invested – to include Belfast, Bristol, and Cardiff Bay.
l Of the £21 billion of tourism spend by overseas visitors to the UK in 2013, an estimated £840 million can be attributed to film-induced tourism and
o supported 8,400 FTEs of employment o generated £400 million in GVA and
o contributed £92 million to the Exchequer.
l UK-made films also led to an estimated £226 million in merchandise sales in the UK in 2013 and the placement of the UK on screens around the globe led to an additional £717 million in turnover for UK companies in 2013.
l Taking account of the total economic contribution (including multiplier and spillover effects) the core UK film sector in 2013
o supported 97,300 FTEs of employment o generated £3.7 billion in GVA and
o contributed £1.1 billion to the Exchequer.
l For each pound of Film Tax Relief (FTR) granted across the period 2006-07 to 2013-14, £12.49 in additional GVA was created through direct and multiplier effects. This equates to a taxation return for the Exchequer of £3.74 in additional tax revenues for each pound of relief granted.
1 Throughout this report, we refer to the existence of a ‘core’ sector; for all industries, this refers to the economic contribution of UK-qualifying content across the supply chain, including distribution and exhibition. While this has little impact on the discussion of production, for the distribution and exhibition sub-sectors, the impact of non-UK content can be significant, but is not relevant to this study as it does not have any connection to the Film, High-End TV, Video Games and Animation Programme Tax Reliefs (collectively, the Creative Sector Tax Reliefs)
© Olsberg•SPI and Nordicity 2015 1February 2015

Economic Contribution of the UK’s Screen Sectors
1.2 High-End TVl In 2013 the High-End Television (HETV) sector2
o supported 8,300 FTEs of direct employment and
o generated £382 million in direct GVA.
l As distributors and producers achieve additional downstream revenues through the secondary sales of programming, it is expected that this first-year GVA will grow in the future as downstream benefits accrue to UK rights holders.
l Taking account of the total economic contribution (including multiplier and spillover effects) the UK HETV sector in 2013
o supported 16,800 FTEs of employment o generated £852 million in GVA and
o contributed £249 million to the Exchequer.
l Again, this impact is expected to increase in the future, as distributors and producers accrue downstream revenues.
l For each pound of High-End Television Tax Relief (HETR) granted during the first year of operation, £8.31 in additional GVA was created through direct and multiplier effects. This equates to a taxation return for the Exchequer of £2.48 in additional tax revenues for each pound of relief granted.
1.3 Video Games3
l In 2013, the year prior to the introduction of tax relief, the core UK video games sector4
o supported 12,100 FTEs of direct employment and
o contributed £755 million in direct GVA.
l Taking account of the total economic contribution (including multiplier and spillover effects) the core UK video games sector (i.e. UK-made video games) in 2013
o supported 23,900 FTEs of employment
o generated £1.4 billion in GVA and
o contributed £429 million to the Exchequer.
l The video games development sector in the UK has a strong degree of regional spread. Games developers are located across London and the South East, with other strong hubs in the East of England, the West Midlands, and Scotland, and emerging hubs in the North West and Wales.
l Video games publishing is, similarly, spread across the UK, though it is slightly more linked to London and the South East than development.
2 For the purposes of High-End Television Tax Relief, HETV is defined as productions costing more than £1 million per broadcast hour3 NB: Video Games Tax Relief only became available in 2014, as such there were not enough data to study the impact of this on the sector for this report
4 i.e. video games wholly or partially made in the UK
© Olsberg•SPI and Nordicity 2015 2February 2015

Economic Contribution of the UK’s Screen Sectors
1.4 Animation Programmesl In 2013 the animation programme sector
o supported 1,300 FTEs of direct employment and
o contributed £54 million in direct GVA.
l Taking account of the total economic contribution (including multiplier and spillover effects) the animation programme sector in in 2013
o supported 4,700 FTEs of employment o generated £171 million in GVA and
o contributed £52 million to the Exchequer.
l For each pound of Animation Tax Relief (ATR) granted during the first year of operation, £1 in additional GVA was created through direct and multiplier effects. This equates to a taxation return for the Exchequer of £0.3 in additional tax revenues for each pound of tax relief granted.
l In comparison with other television genres, animation producers draw a much larger share of their revenue and economic returns from downstream programme sales and licensing activities. Because of this unique business model, the Return on Investment (ROI) results for animation programming in 2013 are conservative, and likely to increase in the future as UK animation producers realise these ancillary revenues.
© Olsberg•SPI and Nordicity 2015 3February 2015

Economic Contribution of the UK’s Screen Sectors
2. Executive Summary2.1 Film
The UK film industry has seen significant growth in recent years, with the 2007 introduction of the FTR underpinning the development of the UK’s production sector, assisting both UK independent and inward investment films. During the same period, the distribution and exhibition sectors have undergone a period of major change, but remain important contributors to the sector’s overall employment and GVA. The industry has cemented the gains seen since the introduction of the FTR in January 2007, with production remaining above £1 billion per annum on a three-year moving average basis. In 2013, the industry once again saw the release of a number of major UK studio-backed projects – including Gravity and Captain Phillips – as well as UK independent productions such as Rush, Sunshine on Leith, Philomena, and Quartet.
Though it is not a focus of this report, 2014 saw significant further growth in production activity, with the British Film Institute’s (BFI’s) February statistical release showing 222 films starting production, at a total UK spend of £1,471 million.5 This represented a large increase on the previous peak production spend for the UK, at £1,325 million, which was seen in 2011.
As a result of such production activity, the core UK film sector is a substantial employer, directly generating 39,800 FTEs of cast and crew employment, and contributing over £1.4 billion to the UK’s Gross Domestic Product (GDP) in 2013. Direct employment in the sector has grown 22% since 2009, with a growing percentage of employees being directly employed rather than working on a self-employed basis.
The sector generates a significant trade surplus for the UK, which has seen major growth since the introduction of FTR. For 2012, the most recent year for which figures are available, this surplus was £916 million. The film sector also displayed the highest export intensity of any UK service sector between 2009 and 2013, with exports being equivalent to 65% of sectoral GVA; this compares to a UK-wide service sector average of 35%.
When the entire spending effects created by the core UK film sector are considered, including secondary spending from those directly and indirectly employed in the sector, and the industry’s broader spillover contributions, the total economic contribution for the core UK film sector in 2013 amounted to £3.7 billion in GVA. This economic activity supported 97,300 FTEs, and contributed £1.1 billion in tax revenues to the Exchequer.
5 Film, high-end television, animation programmes, and video games production in the UK: full-year 2014, BFI Research and Statistics Unit (3rd February, 2015)
© Olsberg•SPI and Nordicity 2015 4February 2015

Economic Contribution of the UK’s Screen Sectors
Figure 1Total Economic Contribution of the Core UK Film Sector
The economic contribution generates a strong ROI to the Treasury from a fiscal perspective, before the major cultural benefits are taken into account. As demonstrated in previous reports, the FTR continues to generate a return of more than £12.49 in direct and multiplier-effects GVA per pound of tax relief granted. For the Treasury, the return is £3.74 in additional tax revenue for each pound of FTR granted, after deducting the counterfactual level of UK film production – i.e. the level of production that is estimated would have occurred in the absence of the FTR.
The UK film sector also continues to be a strong source of capital investment for the UK, with more than £425 million invested by companies in their infrastructure since 2007 across the UK. The pace of this investment has increased in recent years, with Pinewood Shepperton plc, Warner Bros. Studios Leavesden, and Industrial Light & Magic among those making significant investments. Expenditure on infrastructure has also been UK-wide – Belfast, Bristol, and Cardiff Bay have all seen studio investments, while a new facility is also expected for Scotland. Many of these facilities will also be used for HETV, responding to increased demand spurred by the introduction of the HETR in 2013.
The spillover benefits of the FTR to the UK economy are also significant, in particular for tourism and the general positioning of ‘UK plc.’ Of the £21 billion of tourism spending by overseas visitors to the UK in 2013, an estimated £840 million can be attributed to film-induced tourism, generating £400 million in GVA, and supporting 8,400 FTEs. Furthermore, UK-made films also led to an estimated £226 million in merchandise sales in the UK in 2013 and the placement of the UK on screens around the globe led to an additional £717 million in turnover for UK companies in 2013.
The FTR is a key element of the competitiveness of the UK’s film sector within the global economy, underlined by the extremely high occupancy rates of production stages at major UK studios. The stability and reliability of the incentive is vital to long-term investment and decision-making, particularly by international studios, building on the competitiveness of the actual rate of the relief. Recent changes to the incentive – the lowering of the percentage of the budget required to be spent in the UK, and the simplifying of the relief mechanism at the £20 million spend line to allow all productions access to the 25% relief level – further enhance the attractiveness of the FTR to inward investment and co-productions.
© Olsberg•SPI and Nordicity 2015 5February 2015
Overall economic contribution of core UK film sector(including spillover effects)
97,300 FTEs£3.7b GVA
£1.1b tax revenue
Tourism:8,400 FTEs£400m GVA£92m tax revenue
Merchandise:4,100 FTEs
£148m GVA£69m tax revenue
Direct impact39,800 FTEs£1.4b GVA
£431m tax revenue
Total value chain impact(including multiplier effects)
80,300 FTEs£2.9b GVA
£875m tax revenue
UK brand promotion:4,500 FTEs£203m GVA£63m tax revenue

Economic Contribution of the UK’s Screen Sectors
Figure 2Total Economic Contribution of the Core UK HETV Sector
The film sector continues to contribute substantially to the UK’s cultural life, with its rich diversity of stories and talent working as key cultural signposts to the UK both domestically and overseas. This cultural role is to be explored further in a separate report, to be published in due course.
2.2 High-End TVDespite being in its first year, the HETV sector in the UK has shown rapid growth since the introduction of the HETR.6 HETV production in the UK stood at £394.7 million in the 2013-14 financial year – the first fiscal year of HETR.7 This production activity has come from both domestic and international productions, with inward investment projects being attracted by the strength of the UK sector and the opportunities unlocked by the tax relief. The introduction of the HETR also enabled UK-based producers to make higher quality TV drama, leveraging additional spend to attract leading talent and enhance the creative elements of the work. Such programming has higher export value given the UK television sector has the other core elements – creative production companies, crew and facilities – in place.
The result of the additional spend stimulated by the HETR was a significant first-year GVA contribution from the core sector of £381.5 million, with 8,300 FTEs supported. Given the return profile for TV productions, where distributors and producers are able to gain additional downstream revenues through the secondary sales of programming, it is expected that this first-year GVA will grow in future as downstream benefits accrue to UK rights holders.
Taking into account the multiplier and spillover effects created by the core HETV sector, its total economic contribution in 2013 was £851.7 million in GVA. Overall, the sector supports 16,800 FTEs, providing £248.5 million in tax revenue to the Exchequer in the first year. As with the direct impacts, these figures will be expected to increase as UK producers and distributors further leverage the content which the HETR has helped to create.
© Olsberg•SPI and Nordicity 2015 6February 2015
6 For the purposes of HETR, High-End Television is defined as productions with a spend of more than £1 million per broadcast hour
7 As HETR started in April 2013, the studied period covers a financial year rather than a calendar year
Overall economic contribution of HETV sector(including spillover effects)
16,800 FTEs£852 GVA
£249m tax revenue
Tourism:2,100 FTEs£100m GVA£23m tax revenue
Direct impact8,300 FTEs
£382m GVA£114m tax revenue
Total value chain impact(including multiplier effects)
14,700 FTEs£752m GVA
£226m tax revenue

Economic Contribution of the UK’s Screen Sectors
As with the film sector, this economic impact has generated a strong fiscal ROI for the UK and the Exchequer. For each pound of relief paid during the first year of operation, just over £8.31 in additional GVA was created through direct and indirect impacts. This equates to a taxation return for the Exchequer of £2.48 in additional tax revenues for each pound of HETR.
As with the FTR, the HETR is already proving to be a significant driver of the UK’s competitiveness within the global television market. In its first year, the incentive has attracted a number of US productions to the UK, including the new series of 24 – 24: Live Another Day and UK-based episodes of Elementary. HETV productions have also generated economic benefits across the UK, with Outlander shooting in Scotland, Galavant being produced in Bristol, Da Vinci’s Demons in Swansea, and Game of Thrones continuing to be made in Belfast. The latter two shows existed prior to the HETR’s introduction, with the relief acting to secure the significant investment and employment they bring to the UK.
Much of this production builds on the natural synergies which HETV has with film production: many of the cast and crew work across both sectors, while the technical aspects of productions match film more closely than traditional TV. As a result, many of the infrastructure investments made for film will equally benefit HETV production, and the introduction of the HETR is expected to underpin further investments, as has already been experienced in locations such as Roath Lock, Cardiff Bay, which hosts many BBC productions.8 Like film, the HETV sector also supports a significant skills base in the UK.
Though still in its relative infancy as a sector, HETV can already be seen as a major component of the UK’s cultural life, both domestically and abroad. Productions such as Downton Abbey and Sherlock have had significant international success, and together with longer-running shows like Doctor Who have moved into the HETV budget band as the incentive has become available, being able to increase their production values as a result.
2.3 Video GamesVideo Games Tax Relief (VGTR) was introduced for games development from April 2014. Therefore, this study covers the underlying impact of the UK core video games sector, as a first full year of the VGTR, and the spend resulting from this, has not yet been completed.
The current figures, however, underline that the UK games sector is in a very strong position for future growth, which the VGTR is expected to support. A recent survey conducted for the Game Developers Conference underlines this: it showed that Sweden is currently the leading European games development centre, but with the UK anticipated to be in first position within five years.9 This does, however, only reflect survey sentiment in a fast-changing market.
In the year before the introduction of the VGTR, the core UK video games sector produced a direct GVA of £755.4 million, with 12,100 of direct FTEs employed by the sector across development, publishing, and retail.10 Including the multiplier and spillover effects generated by the sector, the total GVA contribution of the core UK video games sector to the UK economy in 2013 was over £1.4 billion; 23,900 FTEs were supported by this economic contribution, with £429.0 million accruing to the Exchequer in tax revenues.11
© Olsberg•SPI and Nordicity 2015 7February 2015
8 Roath Lock began operating before the introduction of HETR9 PR Newswire (2014), “GDC Europe 2014 European State of the Industry Survey Shows Developer Migration to PC and New Consoles”, accessed at http://www.prnewswire.com/news-releases/gdc-europe-2014-european-state-of-the- industry-survey-shows-developer-migration-to-pc-and-new-consoles-266159981.html10 In the context of this report, the ‘Core UK Video Games Sector’ is defined as the entirety of the value chain supported by UK-made content, therefore including 30% of the publishing and consumption segments; for further details on this, please see chapter 6.111 These figures differ from recently-published data from Nesta as we have, similar to film, used a value chain approach focusing on the core UK video games sector; the differences between this model and the Nesta study are detailed below in Section 6.2

Economic Contribution of the UK’s Screen Sectors
© Olsberg•SPI and Nordicity 2015 8February 2015
Figure 3Total Economic Contribution of the UK-made Video Game Sector
Contributing to this revenue is 2013’s biggest hit, Grand Theft Auto V, which was developed in the UK and which, by mid-2014, had sold more than 33 million copies worldwide, generating more than US$2 billion in sales. The UK is also home to many leading independent businesses such as King and Mind Candy, together with regional headquarters for the international console manufacturers – Sony, Microsoft, and Nintendo – which also publish video games and operate their own development studios.
The UK video games development sector also displays a fair degree of regional diversity.. Games developers are spread across London and the South East, with other strong hubs in the East of England, the West Midlands, and Scotland, as well emerging hubs in the North West and Wales. Video games publishing is, similarly, spread across the UK as an industry, though it is slightly more linked to London and the South East than development.
The video games sector is a major provider of employment in the UK, particularly in the development subsector, where a recent report from Games Investor Consulting (GIC) concludes that there are 9,900 creative staff currently working in the UK. At an average GVA per employee of almost £68,000 – the highest of all the sectors studied – there is an opportunity for significant growth in the value of the sector to the UK economy when the sector is supported by this and other incentives.
2.4 Animation ProgrammesCompared to the other sectors studied for this report, the UK animation programme sector was experiencing major difficulties to the introduction of the ATR. It is also worth noting that this form of animation production only covers a small part of the entire UK animation sector, which also includes film animation, supported through the FTR. In recent years, a combination of high costs, competition from strong overseas incentives, and falling licence fees from broadcasters had led to a hollowing out of the sector, with few UK buyers for original UK animation programming.
With the long lead-in period for animation production – which can take two or more years to come to fruition – it is too soon for the sector to see immediacy of impact which has occurred as a result of the ATR. Nonetheless, there are green shoots emerging as a result of the ATR’s introduction.
Overall economic contribution of UK-made video game sector(including spillover effects)
23,900 FTEs£1.4b GVA
£429m tax revenue
Direct impact12,100 FTEs£755m GVA
£227m tax revenue
Total value chain impact(including multiplier effects)
23,600 FTEs£1.4b GVA
£227m tax revenue
Merchandise:300 FTEs£9m GVA
£3m tax revenue

Economic Contribution of the UK’s Screen Sectors
© Olsberg•SPI and Nordicity 2015 9February 2015
Figure 4Total Economic Contribution of the UK Animation Programme Sector
At present, the size of the UK animation programme production sector remains relatively small – in 2013-14, production expenditure was £51.7 million, generating £41.4 million in direct GVA, and supporting 1,100 direct FTEs. Across the animation programme value chain, there were 1,300 FTEs in 2013, generating a total of £54.1 million in GVA. Note that at present this does not include the distribution sector, as the length of animation production, and the broadcaster-supported model of production, means that the distribution impacts of ATR-supported production will materialise over time.
Including the multiplier and spillover effects, the animation programme sector in the UK generated £171.1 million in GVA in 2013, supported 4,700 FTEs, and provided £52.0 million in tax revenue to the UK Exchequer.
In the first year of the relief, the ROI as a result of ATR supported production was £1 for each pound of tax relief, with £0.3 of additional tax revenue generated per pound of ATR. These figures are smaller than those for the FTR and HETR, but are extremely conservative because the business model for animation programme requires a particularly long production process, while recoupment can also be similarly long-running. As a result, we expect that ATR-supported productions will produce a greater ROI as the incentive continues, and productions from the period studied gain downstream revenues from secondary markets, other distribution channels, and merchandising.
Without doubt, the initial impact on the sector has been a significant increase in the competitiveness of the UK’s animation programme sector, with 22 animation programmes produced in 2014, and greater broadcaster interest noted. Though not available for animated films – which can access the FTR – the ATR has actually also led to an increase in international interest in producing these in the UK, which will further benefit the broader UK animation sector.
One of the hallmarks of animation programming is that it ‘travels well’, with the ability to be redubbed or re-versioned to meet the needs of new markets and broadcasters. Together with other, secondary revenue sources, this leads us to be expect that the ROI from this year’s productions will increase in future.
Overall economic contribution of animation programme sector(including spillover effects)
4,700 FTEs£171m GVA
£52m tax revenue
Direct impact1,300 FTEs£54m GVA
£16m tax revenue
Total value chain impact(including multiplier effects)
2,200 FTEs£99m GVA
£30m tax revenue
Merchandise:2,500 FTEs£72m GVA
£22m tax revenue

Economic Contribution of the UK’s Screen Sectors
© Olsberg•SPI and Nordicity 2015 10February 2015
Economic Contribution of the UK’s Screen Sectors
© Olsberg•SPI and Nordicity 2015 February, 2015 11
3. Introduction 3.1 Background
The UK has a long history of international success in the screen sectors. In film, the UK has produced numerous award-winning and culturally important films for many decades, with a mix of productions ranging from Lawrence of Arabia, Gandhi, and Chariots of Fire to the Ealing Comedies, all of which have been highly successful. The sector has continued to build on this legacy in recent years, with studio-backed productions such as the Bond and Harry Potter franchises gaining widespread acclaim, together with independent productions such as The King’s Speech.
HETV is a newer market segment, but is nonetheless one where the UK builds on a strong, long-term television production heritage.12 Even in this new market area, productions such as Downton Abbey and Sherlock have garnered worldwide interest. The BBC’s 50th anniversary special of Doctor Who, The Day of the Doctor, meanwhile became the world’s largest simulcast of a TV drama in 2013.13 The animation programme sector also has a strong history, ranging from Animal Farm in 1954 to Wallace and Gromit and Peppa Pig in more recent years.
The UK’s video games sector has a similar track record in the production of games, being the producer of the world’s largest-selling franchise, Grand Theft Auto. The broader UK technology industry is also responsible for the development of a significant range of technologies used in the games sector, from the ZX Spectrum and BBC Micro to Raspberry Pi; ARM CPUs, which drive the majority of mobile phones worldwide, are also a British-owned product.
3.2 Aims of this Report As with many of the creative industries, the screen sectors generate significant economic and cultural benefits for the UK. In particular, the screen sectors are sources of employment for thousands of workers in the UK, while at the same time giving Britons the opportunity to experience and share the stories and values that underpin British culture. These economic and benefits provide the policy impetus for the tax reliefs. In order to better understand the scale and nature of these economic and cultural benefits the British Film Institute (BFI), Pinewood Shepperton plc, Ukie, the British Film Commission (BFC) and Pact, commissioned this study of the economic and cultural contribution of the screen sectors.
The aim of this study is to demonstrate the economic contribution of the screen sectors. The study expands upon the prior economic contribution analyses by including coverage of HETV, animation programmes and video games, thus spanning all of the screen sectors now subject to tax relief. In this regards, the study provides policymakers and the general public with a comprehensive analysis of the economic contribution generated by HM Treasury’s ongoing support for the production of culturally relevant screen-based content.
3.3 Study Scope and Objectives In 2012 the BFI, Pinewood Shepperton plc, the BFC and Creative England commissioned Oxford Economics to conduct a study of the economic contribution of
12 High-End TV (HETV) refers to productions of more than £1 million per broadcast hour 13 Matt Guengault (2013), “Guinness World Record for the Day of the Doctor”, accessed at http://www.doctorwho.tv/whats-new/article/guinness-world-record-for-the-day-of-the-doctor
Economic Contribution of the UK’s Screen Sectors
© Olsberg•SPI and Nordicity 2015 February, 2015 12
the UK film sector (the “2012 study”). That study – which was an update to a study first prepared by Oxford Economics for the UK Film Council (UKFC) and Pinewood Shepperton plc in 2005 – provided estimates of the total employment, GVA and Exchequer revenue generated by the UK-made films. These included the direct, indirect and induced economic impacts of the core sector. The study also quantified the contribution that UK-made films made to trade and investment and investigated many of the spillover impacts, including:
• skills development,
• film tourism,
• culture,
• merchandise sales, and
• promotion of the UK brand and international trade.
This 2012 study complemented the BFI’s own annual Statistical Yearbook and provided an analysis of the ROI associated with FTR.
In developing the study’s methodology, we have built upon the methodology used for the 2012 study, The Economic Impact of the UK Film Industry, expanding it to include HETV, animation programmes and video games sectors.
As with the 2012 study, this study provides an evaluation of the core UK film sector. The definition of the core UK sector is discussed in more detail in Section 3.4 below. However, the general rule is that it reflects the economic contribution of films that are UK-qualifying films, rather than all films exhibited or viewed in the UK. In focusing on the core UK film sector, this study isolates the economic contribution that can be linked back to the FTR, and thereby provides an appropriate basis for an ROI calculation and cost-benefit analysis of the incentives.
In the case of film and the other screen sectors, the study adopts a value chain approach. Rather than just measuring the contribution of only the development and production of screen content, it tracks how this screen content stimulates downstream economic activity across the value chain, from the traditional exhibition sub-sector, through to physical media, Video on Demand (VoD) and Subscription Video on Demand (SVoD).
3.4 Definitions of the Core UK Industries Most statistics published by the Office for National Statistics (ONS), BFI, Department for Culture, Media and Sport (DCMS), Nesta, Ofcom or industry trade associations quantify the overall economic contribution of the screen sectors, regardless of the national origin of the screen content within that sector. For example, ONS publishes turnover, employment and GVA statistics for the entire cinema-exhibition industry in UK, regardless of whether this economic activity is generated by UK-made films or films originating from other countries.14 By adopting the concept of the core UK industry, however, we are focussing on the economic contribution generated by UK-qualifying content – that is, screen content that qualifies for the various tax reliefs.
3.4.1 Film sector At the production end of the value chain, there is very little, if any, difference between the overall industry and the core UK industry.15 However, as one moves down the
14 SIC 59.14 Motion picture projection activities 15 i.e., there are few if any films produced in the UK which do not contribute to the sector

Economic Contribution of the UK’s Screen Sectors
© Olsberg•SPI and Nordicity 2015 February, 2015 13
value chain, non-UK content plays an increasing economic role. As a result, we have applied certain estimation methods in order to isolate the economic activity within the distribution and exhibition segments of the value chain that can be linked to UK-made films. Specifically, we have used the market share of UK-made films in the cinema exhibition and video-platforms sub-sectors to approximate the economic contribution attributable to the core-UK film sector.
3.4.2 HETV We have taken a similar approach for HETV. However, because our focus is on a particular type of television programming, published industry-wide statistics play even less of a role.
HETV production is only a subset of total television programme production in the UK – namely, that with a production cost greater than £1 million per broadcast hour (pro rated, with a minimum length of 30 minutes.) As a result we have used the annual statistics on HETV expenditures in the UK published by the BFI as the basis for estimating the economic contribution of the sector. To isolate the economic contribution of HETV in other segments of the value chain, including the television broadcasting sector and other video platforms, we developed estimates of employment and GVA that were linked to the contribution that HETV programming makes to UK broadcasters’ revenue. As a result, our methodology was comparable to the approach applied to the film sector.
3.4.3 Animation Programmes As with HETV, for the animation programmes sector, our analysis focused on programming that qualified for tax relief. Our estimates of the economic contribution from the production of animation programming was based on the expenditure data published by the BFI. To isolate the economic contribution of animation programmes in other segments of the value chain, including the television broadcasting industry and other video platforms, we developed estimates of employment and GVA linked to the audience share of animation programming on Public Service Broadcasters (PSBs) in the UK.16
3.4.4 Video Games To parallel the analyses conducted for film, HETV and animation programmes, an analysis of the core video games sector should isolate the economic contribution of video games that qualify for tax relief – i.e. video games certified as culturally British. However, given that the tax relief for video games was introduced on 1st April 2014, there is not yet sufficient data upon which to derive estimates of the core UK video games sector in a manner identical to the other sectors.
In lieu of estimates for qualifying video games, we have developed estimates of the economic contribution of all UK-made video games. This analysis of the economic contribution of video games covers the entire value chain – from development through sales to consumers. For the development stage of the value chain, we include the contribution from all video games produced in the UK. To estimate the economic contribution of UK-made video games through distribution and retail – including physical and digital sales – we have estimated the UK market share of UK-developed games by the number of titles in the top-100 physical sales list which would have qualified for the tax relief. This approach is comparable to that applied for film, whereby UK-made films’ share of the UK box office was used to estimate their
16 Audience share was used as proxy for market since, since an analysis of revenue contribution (as was done in the case of HETV) was not feasible.

Economic Contribution of the UK’s Screen Sectors
© Olsberg•SPI and Nordicity 2015 February, 2015 14
share of economic activity in the exhibition and distribution segments of the value chain.
3.5 UK Tax Reliefs, and the Definition of Qualifying Projects Qualification for the UK’s tax reliefs is based on the certification of a project through either a sector-specific cultural test, or as an official co-production covered by bilateral co-production treaty or the European Convention on Cinematographic Co-Production. Passing the cultural test requires reaching a threshold value for available points – for film, this is now 18 out of 35 points, and for the other sectors 16 out of 31.17
The qualification tests for the new tax reliefs are based on those for film, and are structured into four key sections:
• Cultural content – with the project being set in the UK/EEA, having UK/EEA lead characters, being based on UK/EEA subject matter, and recorded in English or another UK indigenous language;
• Cultural contribution – the project reflects British creativity, heritage, or diversity;
• Cultural hubs – at least 50% of production or post-production takes place in the UK; and,
• Cultural practitioners – leading creative talents for the project are British or EEA residents.
For all of the cultural tests, receiving 100% of the points in the cultural content section is enough to achieve certification. Producers can apply during the production process itself – receiving interim certification to be able to claim relief during production – but must also submit final certification after the completion of the project.
Where an official co-production treaty exists, and the project in question is eligible through this, then certification as a co-production is sufficient for access to the reliefs. Unofficial co-productions, however, still require a cultural test.
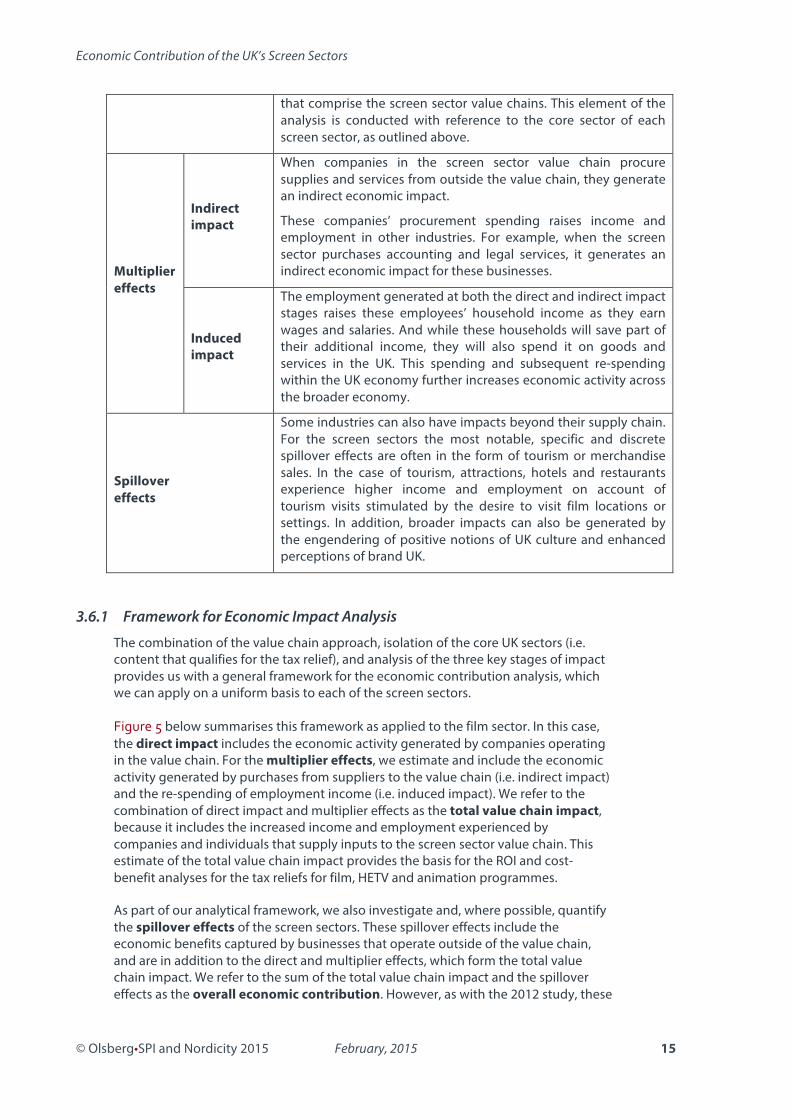
3.6 The Channels of Economic Impact There are several channels through which the creation of screen content has an impact on the UK economy. In accordance with the consensus of views in economic contribution studies, there are four key channels, which are summarised in Table 1 as applied to the screen sectors subject to this study.
Table 1 Summary of channels of economic impact
Direct impact
This refers to the economic activity (i.e. employment and GVA) generated directly within the particular screen based sector.
In the context of this study, it refers to economic activity generated directly in the value chain. For example, it includes employment and wages earned at companies in the sub-sectors
17 Historically, the film test also required 16 out of 31 points, but has recently been modernised with the addition of further possible points, and to allow European content in line with the newer tax reliefs
Economic Contribution of the UK’s Screen Sectors
© Olsberg•SPI and Nordicity 2015 February, 2015 15
that comprise the screen sector value chains. This element of the analysis is conducted with reference to the core sector of each screen sector, as outlined above.
Multiplier effects
Indirect impact
When companies in the screen sector value chain procure supplies and services from outside the value chain, they generate an indirect economic impact.
These companies’ procurement spending raises income and employment in other industries. For example, when the screen sector purchases accounting and legal services, it generates an indirect economic impact for these businesses.
Induced impact
The employment generated at both the direct and indirect impact stages raises these employees’ household income as they earn wages and salaries. And while these households will save part of their additional income, they will also spend it on goods and services in the UK. This spending and subsequent re-spending within the UK economy further increases economic activity across the broader economy.
Spillover effects
Some industries can also have impacts beyond their supply chain. For the screen sectors the most notable, specific and discrete spillover effects are often in the form of tourism or merchandise sales. In the case of tourism, attractions, hotels and restaurants experience higher income and employment on account of tourism visits stimulated by the desire to visit film locations or settings. In addition, broader impacts can also be generated by the engendering of positive notions of UK culture and enhanced perceptions of brand UK.
3.6.1 Framework for Economic Impact Analysis The combination of the value chain approach, isolation of the core UK sectors (i.e. content that qualifies for the tax relief), and analysis of the three key stages of impact provides us with a general framework for the economic contribution analysis, which we can apply on a uniform basis to each of the screen sectors.
Figure 5 below summarises this framework as applied to the film sector. In this case, the direct impact includes the economic activity generated by companies operating in the value chain. For the multiplier effects, we estimate and include the economic activity generated by purchases from suppliers to the value chain (i.e. indirect impact) and the re-spending of employment income (i.e. induced impact). We refer to the combination of direct impact and multiplier effects as the total value chain impact, because it includes the increased income and employment experienced by companies and individuals that supply inputs to the screen sector value chain. This estimate of the total value chain impact provides the basis for the ROI and cost-benefit analyses for the tax reliefs for film, HETV and animation programmes.
As part of our analytical framework, we also investigate and, where possible, quantify the spillover effects of the screen sectors. These spillover effects include the economic benefits captured by businesses that operate outside of the value chain, and are in addition to the direct and multiplier effects, which form the total value chain impact. We refer to the sum of the total value chain impact and the spillover effects as the overall economic contribution. However, as with the 2012 study, these

Economic Contribution of the UK’s Screen Sectors
© Olsberg•SPI and Nordicity 2015 February, 2015 16
spillover effects are not taken into account when conducting the ROI and cost-benefit analysis.18
Figure 5 Framework for economic impact analysis (film sector example)
18 The exclusion is made for two reasons. First, in some cases, the data sources used to estimate the spillover effects are less reliable than those used to estimate the direct impacts and multiplier effects. Second, in many cases, the attribution of spillover effects is much less known than for the direct impacts and multiplier effects - tourism decisions, for example, often have multiple stimuli.

Economic Contribution of the UK’s Screen Sectors
© Olsberg•SPI and Nordicity 2015 February, 2015 17
4. The Film Sector – Economic Impact 4.1 Overview of the Value Chain
The film sector value chain is a complex, multi-faceted entity which is presently undergoing a period of change with the emergence of new technologies, such as VoD, which are beginning to change the established business model. While offering new revenue streams for content owners, such innovations are also altering the nature of value within the sector and the financing of new productions, particularly for the independent sector. In order to simplify this, we present here a traditional model of production, distribution and exhibition. Though not all films approach the market in this manner now, the majority continue to reach consumers in this way, and as such it remains the most rational basis for our analysis; films qualifying for the FTR also must have a cinematic release to gain final certification.
The film sector can be viewed in terms of three key value chain segments: production, distribution and exhibition. The value chain begins with production (including pre-production, filming, and visual effects (VFX) production and post-production), the stage at which producers – from major global studios to small independent production companies – manage the conversion of the creative ideas of the screenwriter and director into a finished film.19
The production stage is followed by international sales of a film. Distribution companies acquire the economic rights to a film, and proceed to plan the release of the film in the UK and abroad, including its marketing and promotion. In the process, the distributor takes on a large element of the financial risk for the film. Distributors mitigate this financial risk by maintaining a portfolio of rights to different films for exploitation.
Figure 6 Film sector value chain
Most films are first released by distributors into the exhibition segment through cinemas. As a result, the cinema exhibition sub-sector is often considered the primary release window. In recent decades, however, distributors have experimented with alternative release models: including straight-to-broadcast or straight-to-video. Indeed, in recent years, distributors have also started to adopt day and date release models whereby a film is released simultaneously on several different platforms, these may include cinema, television broadcast and VoD.
19 Nordicity (2013), The Economic Contribution of the Film and Television Sector in Canada, p. 8.

Economic Contribution of the UK’s Screen Sectors
© Olsberg•SPI and Nordicity 2015 February, 2015 18
Under a standard release model, after a distributor has released a film in the cinema window, it will then move to secondary release windows, including DVD/Blu-ray sales and rentals, VoD and television broadcast. Collectively, these secondary windows are referred to as video platforms. However, as noted above, for certain productions they can, nowadays, be the primary release window for a film.
Regardless of sequence of release, much of the economic activity generated in these downstream segments of the value chain is inextricably linked to the production of film content. The implication is that only a value chain approach that includes these downstream segments can fully capture the economic contribution of the film sector.
4.2 Direct Impact The next section of this report looks at the direct impact of the core UK film sector across the value chain – from production through to exhibition.
4.2.1 Production The production sub-sector is the largest source of economic contribution in the film sector value chain. In the following sub-section we present our analysis of production expenditures, employment and GVA generated in the production sub-sector of the core UK film sector.
Expenditures
In 2013, expenditures on the film production in the UK totalled £1.1 billion, including £860 million in inward investment production. Indeed, during the last five years, film production expenditures in the UK have been at or near the £1 billion level on an annual basis.
Figure 7 Expenditures on film production in the UK
Source: BFI
When viewing annual time-series data on film production expenditures, it is important to keep in mind that they are highly susceptible to the concentration of spending for accounting purposes, which can distort year-on-year trends. The production of a film takes place over several months; however, conventional
Economic Contribution of the UK’s Screen Sectors
© Olsberg•SPI and Nordicity 2015 February, 2015 19
production accounting practices mean that the entire projected expenditure for a film is recognised on its first day of principal photography. This can sometimes result in significant year-to-year fluctuations in production expenditures.20
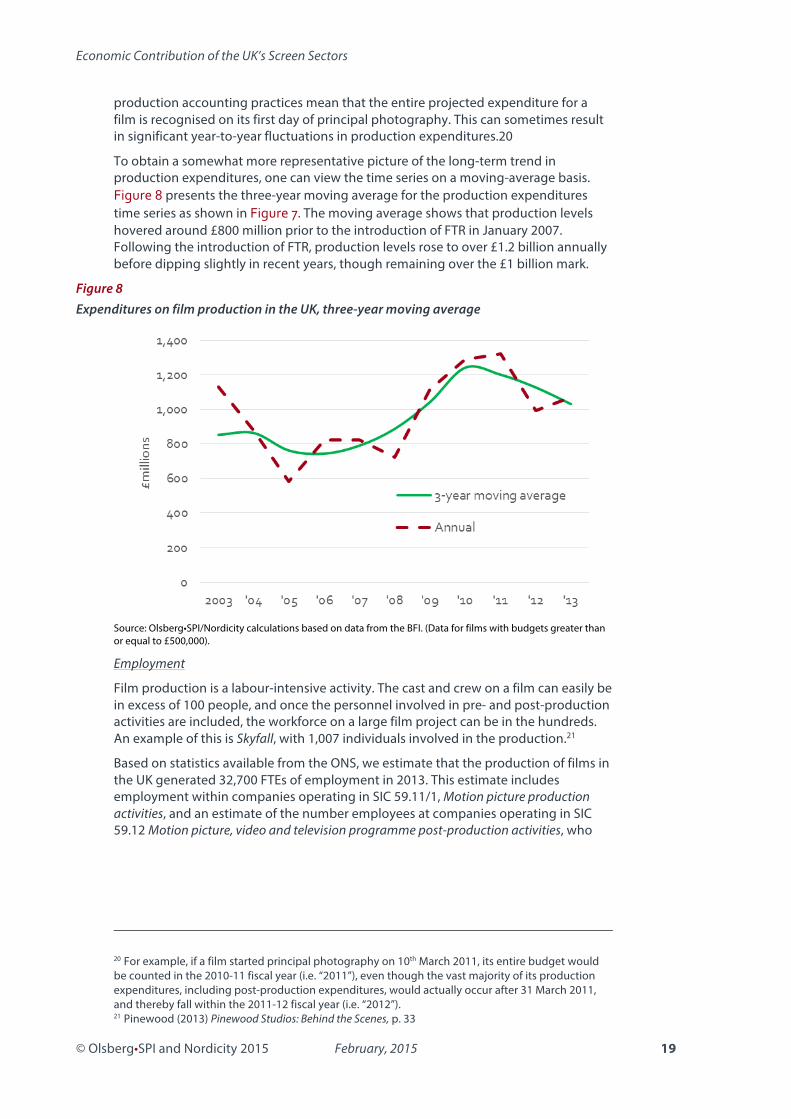
To obtain a somewhat more representative picture of the long-term trend in production expenditures, one can view the time series on a moving-average basis. Figure 8 presents the three-year moving average for the production expenditures time series as shown in Figure 7. The moving average shows that production levels hovered around £800 million prior to the introduction of FTR in January 2007. Following the introduction of FTR, production levels rose to over £1.2 billion annually before dipping slightly in recent years, though remaining over the £1 billion mark.
Figure 8 Expenditures on film production in the UK, three-year moving average
Source: Olsberg•SPI/Nordicity calculations based on data from the BFI. (Data for films with budgets greater than or equal to £500,000).
Employment
Film production is a labour-intensive activity. The cast and crew on a film can easily be in excess of 100 people, and once the personnel involved in pre- and post-production activities are included, the workforce on a large film project can be in the hundreds. An example of this is Skyfall, with 1,007 individuals involved in the production.21
Based on statistics available from the ONS, we estimate that the production of films in the UK generated 32,700 FTEs of employment in 2013. This estimate includes employment within companies operating in SIC 59.11/1, Motion picture production activities, and an estimate of the number employees at companies operating in SIC 59.12 Motion picture, video and television programme post-production activities, who
20 For example, if a film started principal photography on 10th March 2011, its entire budget would be counted in the 2010-11 fiscal year (i.e. “2011”), even though the vast majority of its production expenditures, including post-production expenditures, would actually occur after 31 March 2011, and thereby fall within the 2011-12 fiscal year (i.e. “2012”). 21 Pinewood (2013) Pinewood Studios: Behind the Scenes, p. 33

Economic Contribution of the UK’s Screen Sectors
© Olsberg•SPI and Nordicity 2015 February, 2015 20
worked on film projects.22 In 2013, this company employment was the equivalent of 18,100 FTEs (Figure 9).
Company employment only captures a portion of the total direct employment in the film sector, as film production is also characterised by a large freelance workforce. Data from the Annual Population Survey (APS) and Labour Force Survey (LFS) was used to construct a time-series of the number of self-employed workers in the film sector. These data indicate that an additional 14,600 FTEs of employment were generated on a self-employed basis in the film and video sector in 2013 (Figure 9).23
With the inclusion of self-employed workers, the total size of the direct workforce employed in the production sub-sector increases to 32,700 FTEs in 2013 (Figure 9). The time series in Figure 9 indicates that total employment in the film sector climbed quickly between 2009 and 2011, increasing by 54%, before declining in 2012 and 2013.
This rapid increase and subsequent decline since 2011 was due in large part to a significant spike in the number of self-employed workers in 2011. This spike may have been due to a combination of fundamental as well as statistical factors. First, we note that 2011 also represented the ten-year peak in production activity, with blockbuster films such Skyfall and Harry Potter and the Deathly Hallows: Part 2 being filmed, and contributing to a strong employment position. The spike in employment could also be due to the fact that, in contrast to the employee data, the data for self-employment in 2011 were derived from the LFS, which is a quarterly survey that is subject to sampling variability, and at the industry level could be subject to a relatively wide sampling variance.24
It is also worth noting that many of the freelancers working in the film sector increasingly work across HETV as well, given the complementarity in skillsets and approaches. With the significant growth in that sector, as a result of the introduction of the HETR, it is to be expected that freelancers split their time across both, which likely impacts the numbers counted for film production.
Statistics from the Inter-Departmental Business Register (IDBR) for 31st March 2014 indicate that employment in film production increased from 18,100 FTEs in 2013 to an estimated 22,800 FTEs in 2014. Assuming no change in the number of self-employed workers in 2014 would imply that total employment in film production increased to 37,400 FTEs – a year-on-year increase of 14.4%.
22 Based on survey research conducted by Olsberg-SPI in 2008, we estimate that 34% of the revenue in the post-production industry in 2013 was for work on films. The remaining 66% was split between work on television programmes and video (e.g. advertising) 23 Statistics on the number of self-employed workers available from the APS and LFS are only available for film and video production 24 This spike in the estimated number of self-employed workers may also be due to the fact that the LFS and APS report a respondent’s main and second job

Economic Contribution of the UK’s Screen Sectors
© Olsberg•SPI and Nordicity 2015 February, 2015 21
Figure 9 Employment in film production
Source: Estimates based on data from Labour Force Survey, Annual Population Survey, Oxford Economics and Optima / Cambridge Econometrics and Inter-Departmental Business Register.
Our estimates of the regional breakdown of employment in the UK film production sub-sector in Figure 10 are based employment data from the ONS’ Business Register and Employment Survey (BRES). These estimates indicate that employment in film production is distributed across all regions of the UK, with most of it is concentrated in London and South East, which account for 69% of total employment in the film production sub-sector.
Figure 10 Regional distribution of employment in film production (FTEs), 2013
Source: Estimates based on data from Annual Population Survey, BRES and Inter-Departmental Business Register.

Economic Contribution of the UK’s Screen Sectors
© Olsberg•SPI and Nordicity 2015 February, 2015 22
GVA
In addition to the direct employment impact, the film production sector also generates significant levels of GVA for the UK economy. According to statistics from the Annual Business Survey (ABS), the film production sub-sector generated over £1 billion in GVA in 2013, although this was down slightly from £1.2 billion in 2012 (Figure 11). The production sub-sector’s GVA has been trending upwards since 2008.25 Between 2008 and 2013, GVA in the film production sub-sector increased by 53%.
Figure 11 Direct GVA generated in film production
Source: Estimates based on data from Annual Business Survey, Optima/Cambridge Econometrics and Oxford Economics.
4.2.2 Distribution The distribution of films can also generate significant economic activity, as UK-based distribution companies earn licensing revenue from cinema exhibition and other platforms in excess of the advances they provide to producers. According to the ABS, film distribution companies earned over £1.2 billion in turnover in 2013.
Since the revenue earned in the UK distribution sub-sector is derived from UK-made and non-UK films, we sought to isolate the portion of turnover and economic activity associated with the former by using data for UK films’ share of the UK box office. According to the data published by the BFI, UK films’ box office share ranged from 15% to 36% between 2003 and 2013 (Figure 12). To account for the fact that distribution companies earn revenue from films of different production years, and not just the current production year, we used the three-year moving average of box office market share and multiplied it by total employment and GVA to isolate the economic activity associated with the core UK film sector. For 2013, this moving-average approach indicated that UK films accounted for 30% of economic activity in the distribution sub-sector.
25 Beginning in 2008, ONS began reporting ABS statistics on the basis of SIC 2007; the previous statistics were based on SIC 2003. As a result, the GVA statistics for 2003-2007 may not be directly comparable to the statistics for 2008-2013

Economic Contribution of the UK’s Screen Sectors
© Olsberg•SPI and Nordicity 2015 February, 2015 23
Figure 12 Share of UK box office held by UK-made films
Source: Olsberg•SPI/Nordicity calculations based on data from CAA and Rentrak.
To estimate the direct employment impact in the distribution sub-sector resulting from these productions, we multiplied the total industry employment (expressed in FTEs) reported by the ONS for SIC 59.13/1 Motion picture distribution activities (3,200) by UK films’ share of the cinema box office for the previous three years (30%). This approach indicated that the core UK film sector generated 900 FTEs (30% × 3,200 ≈ 900) of employment in the distribution sub-sector in 2013 (Figure 13). A similar approach was used to estimate the GVA impact of £107 million in 2013 (Figure 13).
The time-series data for the distribution sub-sector suggests that there was a significant decrease in employment and GVA in 2012. However, according to the ONS, a large part of this decrease was due to the restructuring of some businesses which resulted in the reclassification of their turnover and economic activity to other SIC codes within SIC 59.13, Motion picture, video and television programme distribution activities.

Economic Contribution of the UK’s Screen Sectors
© Olsberg•SPI and Nordicity 2015 February, 2015 24
Figure 13 Direct employment and GVA generated by distribution of UK-made films
Source: Estimates based on Annual Business Inquiry, Annual Business Survey and BFI. Note: Due to the business restructuring of certain respondent companies, GVA statistics for 2012 and 2013 may not be directly comparable to those prior to 2012.
4.2.3 Cinema Exhibition Most films are released on a commercial basis through the cinema exhibition ‘window’. (Many – though not all – productions will have a festival premiere before release).
Whilst the cinema release window accounts for much less of a film’s overall revenue than it did prior to the emergence of new platforms, it still generates significant economic activity in the form of turnover, employment and GVA – all of which is inextricably linked to the film content.
Nowadays, cinema exhibition includes a variety of additional elements driven by film content, which tend to be described as ‘Event Cinema’. New exhibition models of this type include the type of events held by Secret Cinema, and will be discussed in greater detail in the Cultural and Audience Contribution study, to be published later this year.
As of 2013, there were 3,867 cinema screens at 756 sites across the UK.26 These cinemas sold a total of 165.5 million tickets for admission in 2013, generating just under £1.1 billion in gross box office receipts.27
26 BFI (2014), Statistical Yearbook 2014, p. 105 27 The statistics for cinema admissions include admissions to films as well as alternative content (e.g. live theatre, sports events) screened at cinemas. The statistics for gross box office receipts include only films

Economic Contribution of the UK’s Screen Sectors
© Olsberg•SPI and Nordicity 2015 February, 2015 25
Figure 14 Cinema box office and admissions in the UK
Source: BFI, CAA and Rentrak.
As with the distribution sub-sector, UK films’ share of the UK box office (three-year moving average) was used to isolate the portion of employment and GVA within SIC 59.14, Motion picture projection activities, that could be attributed to the core UK film sector. Based on this approach, UK films generated an estimated 3,900 FTEs of employment and £169 million in GVA in the cinema exhibition sub-sector in 2013 (Figure 15); as with distribution, this represents 30% of the total employment and GVA for the sub-sector.
Figure 15 Core UK employment and GVA in the exhibition sub-sector
Source: Estimates based on data from IDBR, BRES, ABS, ABI, BFI, CAA, Rentrak and Oxford Economics.
It is also important to note that, in comparison to other film sub-sectors, the cinema exhibition sub-sector is characterised by a high proportion of part-time employment. Employment data from BRES indicates that 70% of total employees in the cinema

Economic Contribution of the UK’s Screen Sectors
© Olsberg•SPI and Nordicity 2015 February, 2015 26
exhibition sub-sector in 2013 were part-time. The implication is that, in the case of cinema exhibition, the number of individuals with employment would be about 50% higher than the number of FTEs. So, whereas the core UK film sector generated 3,900 FTEs of employment in the cinema exhibition sub-sector in 2013, this likely entailed jobs for approximately 5,900 individuals.
4.2.4 Video Platforms Films continue to generate economic activity as they are released onto video platforms. Broadcast television has always been an important secondary release window – and sometimes a primary release window – for the viewing of films. For several decades, the video-release platform – VHS and Betamax, followed by DVD and then Blu-ray – was also a crucial release point from a revenue perspective. In recent years, however, the physical video platforms have diminished in consumer popularity, as various VoD platforms, including download-to-own (DTO) and SVoD have grown rapidly. Despite this, DVD/Blu-ray sales and rentals remain second only to the broadcast platform in terms of their share of video platform revenue, and are still over three times the size of the VoD platform in terms of revenue.
Between 2003 and 2013, revenue from the sale or rental of DVD/Blu-ray films fell by 60% (Figure 16). Part of the falling DVD/Blu-ray revenue was offset by the increasing value of films broadcast on UK television (excluding television VoD). The growth in the VoD revenue from film in recent years has also helped to partially offset the falling revenue from physical media; however, it has by no means fully offset the declines experienced in the DVD/Blu-ray segments.
Figure 16 Revenue associated with films viewed on video platforms in the UK
Source: Estimates based on data from BFI, BVA, IHS and Attentional. * Estimate of broadcaster revenue (advertising, subscription or licence fee) attributable to film. Data not published by BFI/UKFC prior to 2006.
The viewing of UK films on video platforms including broadcast television also has an economic impact in generating revenue for broadcasters and other platform operators. Once again, we used data published by BFI for the audience share of UK films on video platforms to isolate the economic activity associated with the core UK film sector. Based on this approach, the viewing of UK-made films on other consumer

Economic Contribution of the UK’s Screen Sectors
© Olsberg•SPI and Nordicity 2015 February, 2015 27
platforms is estimated to have generated 2,100 FTEs of employment and £134 million in GVA in 2013 (Figure 17).
The employment generated by films viewed on video platforms has fallen in recent years, even as GVA has increased. This apparent dichotomy is, in large part, due to the fact that audience-use and revenue have been falling in the relatively labour intensive DVD/Blu-ray media channels, whereas the revenue associated with film has been increasing in the television broadcast channel, which has a higher rate of GVA contribution per pound of revenue.
Figure 17 Direct employment and GVA generated by viewing of UK-made films on other consumer platforms
Source: Estimates based on data from BFI, BVA, IHS, Attentional and ONS.
4.2.5 Summary of Employment and GVA Impact The above sub-sectors – production, distribution, exhibition, and video platforms – are brought together to allow us to estimate the total direct economic impact of the core UK film sector. In total, the core UK film sector generated 39,800 FTEs of direct employment in 2013 (Figure 18). Direct employment was down slightly from 2012 and lower than the ten-year peak of 47,000 FTEs reached in 2011. However, in 2013 it was 22% higher than in 2009, and 11% higher than 2007, the first year of FTR.

Economic Contribution of the UK’s Screen Sectors
© Olsberg•SPI and Nordicity 2015 February, 2015 28
Figure 18 Direct employment impact of core UK film sector
Source: 2003-2008: estimates based on data from Labour Force Survey, Annual Population Survey, Oxford Economics and Optima / Cambridge Econometrics; 2009-2012: estimates based on data from Inter-Departmental Business Register. * Includes DVD/Blu-ray sales and rentals (incl. by post), VoD (incl. TV and online) and value of films aired on UK TV.
As noted in Figure 19, a large part of the spike in direct employment in 2011 was due to a sharp rise in the number of self-employed workers in the film sector. It is important to keep in mind that the ONS surveys used to generate estimates of the number of self-employed workers are subject to much less precision than the data used to estimate the number of employees at companies operating in the film sector. This lower precision could have contributed to the spike in 2011. However, as noted above, 2011 also represented the peak in film production expenditures (Figure 7).
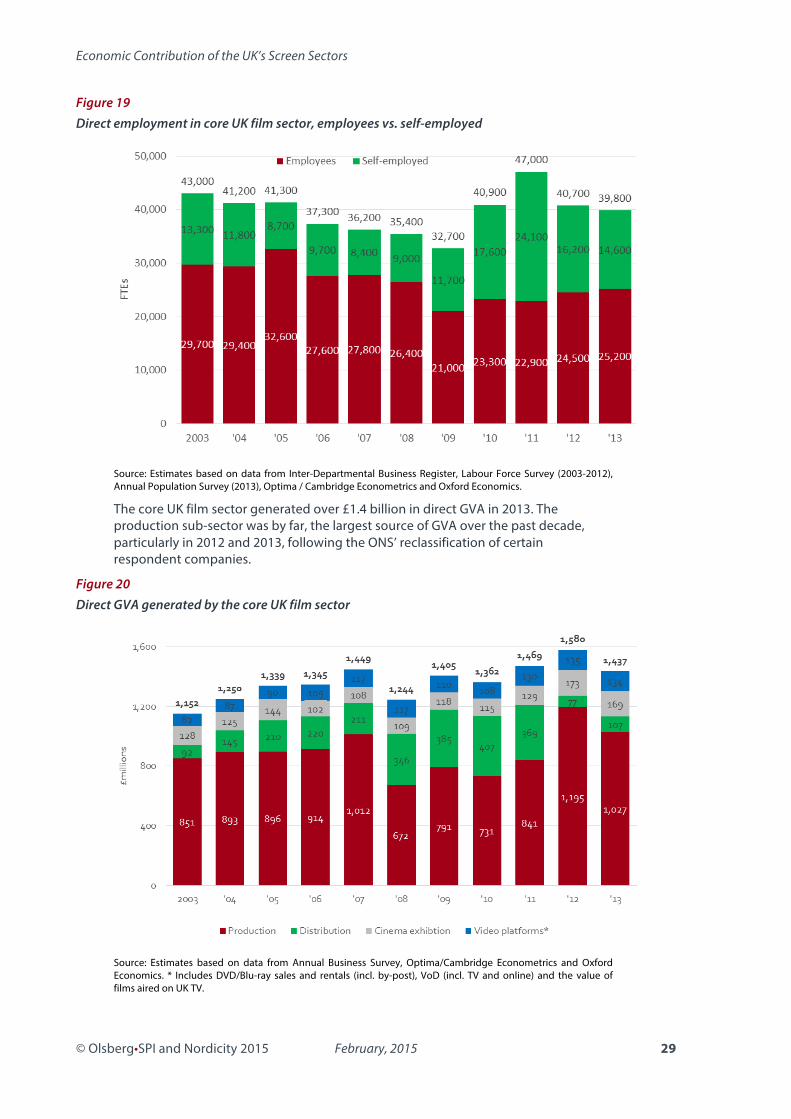
Economic Contribution of the UK’s Screen Sectors
© Olsberg•SPI and Nordicity 2015 February, 2015 29
Figure 19 Direct employment in core UK film sector, employees vs. self-employed
Source: Estimates based on data from Inter-Departmental Business Register, Labour Force Survey (2003-2012), Annual Population Survey (2013), Optima / Cambridge Econometrics and Oxford Economics.
The core UK film sector generated over £1.4 billion in direct GVA in 2013. The production sub-sector was by far, the largest source of GVA over the past decade, particularly in 2012 and 2013, following the ONS’ reclassification of certain respondent companies.
Figure 20 Direct GVA generated by the core UK film sector
Source: Estimates based on data from Annual Business Survey, Optima/Cambridge Econometrics and Oxford Economics. * Includes DVD/Blu-ray sales and rentals (incl. by-post), VoD (incl. TV and online) and the value of films aired on UK TV.

Economic Contribution of the UK’s Screen Sectors
© Olsberg•SPI and Nordicity 2015 February, 2015 30
As indicated in Figure 19, employment in the core UK film sector in 2013 was 21.6% higher than in 2009 – the year marking the beginning of the recovery in the UK economy – although it was lower than the 2011 peak. With this rate of employment growth between 2009 and 2013, the core UK film sector has outpaced economy-wide employment (in Great Britain) between 2009 and 2013 (3.0%) as well as outpacing almost all other sectors of the economy (Figure 21). Only the television sector displayed a faster rate of employment growth (89.5%) between 2009 and 2013.
Figure 21 Employment growth, 2009-2013
Source: Estimates based on data from Business Register and Employment Survey, Labour Force Survey, Annual Population Survey, Optima / Cambridge Econometrics and Oxford Economics.
4.2.6 International trade The film sector is a significant source of export earnings for the UK economy. Indeed, a major part of the direct economic impact of the core UK film sector is directly linked to the receipt of royalty revenue from the licensing of UK films to distributors and broadcasters outside the UK as well as the sale of production services to studios outside the UK and other foreign rights holders.28
In 2013 (the latest year of published statistics), the UK film sector generated nearly £1.4 billion in exports for the UK economy. Following the introduction of FTR in 2007, the film sector’s export earnings have significantly exceeded the UK economy’s imports of film services, thus yielding significant annual trade surpluses for the UK economy. In 2013, this trade surplus was £916 million; in 2010, it was over £1.5 billion.
28 The sale of production services to studios outside the UK is often also referred to as “inward investment” because it brings investment to the UK which is spent in the creation of a UK company – a production special purpose vehicle (SPV) – that employs UK workers, much in the same way as an offshore company opening an office in the UK would do
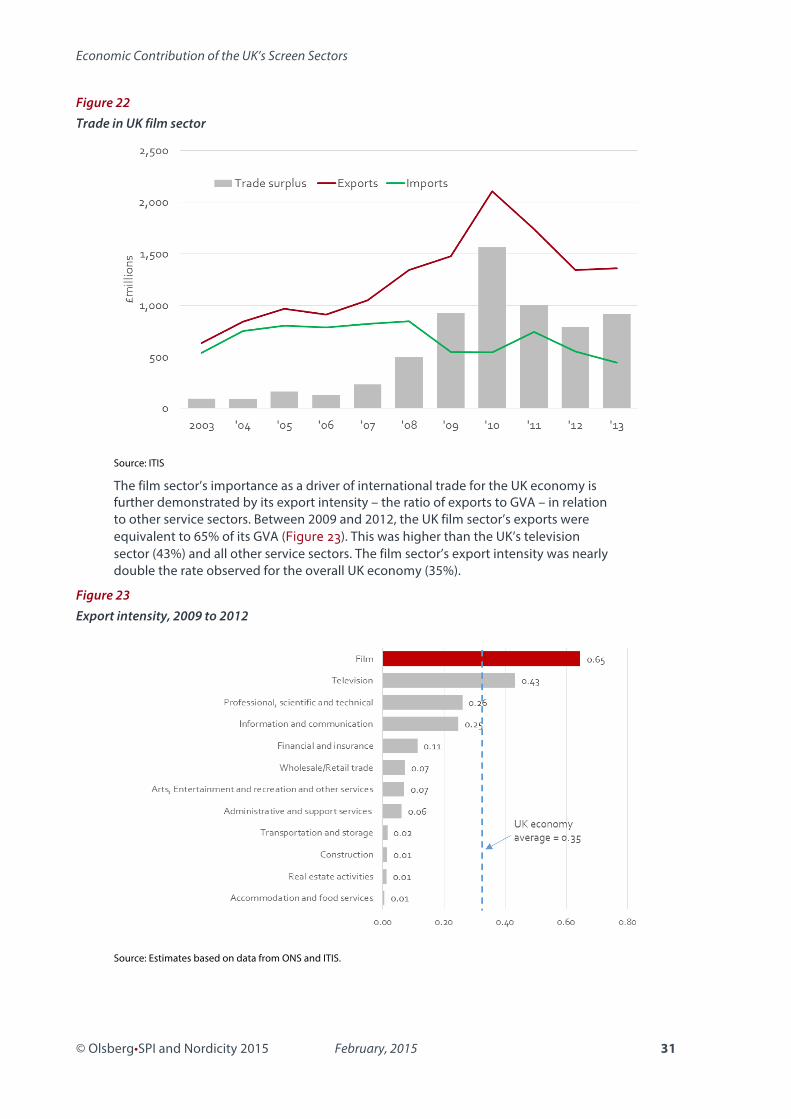
Economic Contribution of the UK’s Screen Sectors
© Olsberg•SPI and Nordicity 2015 February, 2015 31
Figure 22 Trade in UK film sector
Source: ITIS
The film sector’s importance as a driver of international trade for the UK economy is further demonstrated by its export intensity – the ratio of exports to GVA – in relation to other service sectors. Between 2009 and 2012, the UK film sector’s exports were equivalent to 65% of its GVA (Figure 23). This was higher than the UK’s television sector (43%) and all other service sectors. The film sector’s export intensity was nearly double the rate observed for the overall UK economy (35%).
Figure 23 Export intensity, 2009 to 2012
Source: Estimates based on data from ONS and ITIS.

Economic Contribution of the UK’s Screen Sectors
© Olsberg•SPI and Nordicity 2015 February, 2015 32
4.2.7 Capital Investment A major outcome of the long-term stability of the FTR has been the confidence which private parties have in placing film-related capital investments in the UK; such facilities can also be used for TV and HETV, the growth of which has been spurred by the introduction of the HETR. Since the launch of FTR in 2007, at least £400 million of investment has been made or announced for film production infrastructure in the UK. The focus of this investment has been the Pinewood and Leavesden facilities in Greater London – other facilities, such as MediaCity UK in Salford and Pinewood Studio Wales, have also seen significant investment, but are largely TV- or HETV-driven.
Table 2 Selected capital investments in film studio facilities in the UK since 2007
Facility Investment (£m) Pinewood Studios Development Framework 200.0 Pinewood – other since 2007 126.5 Leavesden (total investments including Harry Potter Studio Tour)
130.0
Total1 c. 425 Olsberg•SPI/Nordicity analysis of planning documents and press releases from Pinewood Shepperton plc and Warner Brothers. Notes: 1. In creating this total, we have deducted £20 million from Leavesden’s overall £13o million spend as an estimate for the cost of the Harry Potter Studio Tour
Within the last year, the pace of investment across the production and post-production sector has significantly increased, though many projects do not publicly disclose the value of their investment. An example of this is the announcement by Industrial Light & Magic of a major London investment, supporting the UK-based production of Disney’s new Star Wars films. Other studio investments – including Titanic Studios in Belfast and Bottle Yard Studios in Bristol – have been supported by public bodies. The total of these suggests that the verifiable figure of £400 million underestimates the overall value of investment, though even this underlines the success the FTR has had in underpinning confidence in the UK film sector.
We note that in recent years there have been limits on the number of inward investment productions, as studios have been full – ongoing investments in this sector such as at Pinewood will therefore provide the space for future growth.
4.3 Multiplier Effects and Total Value Chain Impact As with many industries, the core UK film sector also generates significant multiplier effects through both its indirect and induced impacts. Film production involves the purchase of supplies and services from a variety of other sectors, ranging from construction to catering to legal advice; this is referred to as the indirect impact. Similarly, the other segments of the film sector value chain – distribution, exhibition and other video platforms – also purchase supplies and services from other sectors and thereby increase income and employment in the wider economy.
Film sector cast and crew, along with workers employed in the other value chain sub-sectors, and at supplier companies in other industries, also re-spend their income within the UK economy, thereby generating further economic activity. This is referred to as the induced impact. Together, indirect and induced impacts comprise the multiplier effects.

Economic Contribution of the UK’s Screen Sectors
© Olsberg•SPI and Nordicity 2015 February, 2015 33
To estimate the multiplier effects for the production sub-sector, we applied the Type II multiplier of 2.00, which was applied in the 2012 Study, having been established in an earlier study conducted by Optima/Cambridge Econometrics.29
To estimate the multiplier effects for the other sub-sectors, we developed Type II multipliers, based on the Type I multipliers available from ONS’s input-output tables and the induced impact multiplier reported in the 2012 study.30 As exact multipliers per sub-sector are not available, the closest analogues were chosen; for the distribution sub-sector, we used the Type I multiplier for the wholesale distribution industry.
For the film cinema exhibition sub-sector, we used the Type I multiplier for the retail distribution industry. For the video platforms sub-sector, we used an average of the retail distribution industry (from the ONS input-output tables) and the Type II national multiplier for the television broadcast industry implied by the research conducted by Optima/Cambridge Econometrics in 2005 (see Section 5.2.3 for detailed discussion of the Type II multiplier for the television broadcast industry).31 Table 3 summarises the derivation of the Type II multipliers for the distribution, cinema exhibition and video platforms sub-sectors.
Table 3 Derivation of multipliers for film sector value chain segments
Value chain segment
Industry category1
Type I output
multiplier
Induced impact
multiplier
Type II output
multiplier2 Distribution Wholesale
distribution 1.84 1.25 2.30 Cinema Exhibition
Retail distribution 1.64 1.25 2.05
Video platforms Retail distribution 1.64 1.25 2.05 Broadcast -‐-‐ -‐-‐ 1.97 Average -‐-‐ -‐-‐ 2.01
Source: Olsberg•SPI/Nordicity, ONS and Optima / Cambridge Econometrics. Notes: 1. The industry category refers to most similar industry for which multipliers were available from either ONS or Optima / Cambridge Econometrics. 2. Equals: Type I output multiplier × Induced impact multiplier
Based on the multipliers outlined in Table 3, the core UK film sector is estimated to have generated 40,500 indirect and induced FTEs in 2013, bringing the total value chain impact to 80,300 FTEs. The core UK film sector also generated an estimated £1.48 billion in multiplier-effects GVA, resulting in a total GVA impact across the value chain of £2.92 billion in 2013.
To estimate the impact on tax revenues, we applied the ratio of tax revenue-to-GVA (0.30) implied by the results of the 2012 study. Based on this approach the economic activity generated by the core UK film sector generated £874.6 million in tax revenue for the Exchequer in 2013, including £431.1 million in revenue from the direct impacts and an additional £443.1 million in revenue associated with the multiplier effects (Table 4).
29 Optima / Cambridge Econometrics (2005), Economic Impact of the UK Screen Industries. A Type II multiplier includes both the indirect and induced economic impacts, whereas a Type I multiplier only includes the indirect economic impact
30 Oxford Economics (2012), The Economic Impact of the UK Film Industry, p. 38. 31 Optima / Cambridge Econometrics (2005), Economic Impact of the UK Screen Industries.

Economic Contribution of the UK’s Screen Sectors
© Olsberg•SPI and Nordicity 2015 February, 2015 34
Table 4
Summary of multiplier effects and total value chain impact, core UK film sector, 2013
Employment (FTEs)
GVA (£m) Exchequer revenue (£m)
Direct impact 39,800 1,437.0 431.1 Multiplier effects* 40,500 1,478.2 443.5 Total value chain impact 80,300 2,915.3 874.6 Source: Estimates based on data from Annual Business Survey, Business Register and Employment Survey, Labour Force Survey, Annual Population Survey, Optima / Cambridge Econometrics and Oxford Economics. * Includes indirect and induced impacts.
4.4 Impact of Tax Relief To assess the impact of the FTR, we modelled how the total economic contribution of the core UK film sector would change in the absence of FTR. As of 31st March 2014, the FTR had supported £5.6 billion in production expenditures in the UK, or an annualised average of £775 million in expenditure (Figure 24).32 On an annual average basis, these production expenditures generated £1,421 million in direct GVA and £2,884 million in total GVA (including multiplier effects).
The 2012 study established an additionality rate of 71% based, in part, on research conducted by Olsberg-SPI. In our view, this additionality rate still applies; indeed, we believe, it is now quite conservative because the global market for inward production has become much more competitive since the last study. More jurisdictions, including California, have introduced tax incentives to attract inward production and/or prevent runaway production.
By applying an additionality rate of 71%, we find that in the absence of the FTR production expenditures would be £550 million lower, on an average annual basis. As a result, direct GVA would be £1,009 million lower, and the total GVA impact of the core UK film sector would be £2,048 million lower.
We find that, on an average annual basis, £164 million in FTR generated an estimated £2,048 million in total additional GVA across the value chain for the core UK film sector.33 In other words each £1 of FTR generated £12.49 in GVA for the UK economy.
32 HM Revenue & Customs (2014), “Film Tax Relief Summary – August 2014”, accessed at http://www.hmrc.gov.uk/films/ftr-monitoring-summary.pdf. Since FTR has been in place from 1st January 2007, the annualised amount is calculated by dividing the cumulative total value of payments by 87 months and then multiplying 12 (£5.6 billion ÷ 87 × 12 = £775 million) 33 As of 31st March 2014, HM Revenue & Customs had made FTR payments of £1,190 million since the inception of FTR in January 2007. This is equivalent to an annual average of £164 million in payments (£1,190 million ÷ 87 months × 12 = £164 million)

Economic Contribution of the UK’s Screen Sectors
© Olsberg•SPI and Nordicity 2015 February, 2015 35
Figure 24 Analysis of tax relief ROI, GVA return, 2006-07 to 2013-14
Source: Estimates based on Oxford Economics, Olsberg•SPI and British Film Commission. Notes: 1. Includes direct and multiplier effects. 2. Refers to the additional production and economic activity stimulated by FTR. 3. Refers to the level of production and economic activity that would have occurred in the absence of FTR.
The UK Government supports film production through the FTR on behalf of all UK residents and businesses, and therefore a comparison of FTR outlays to the additional GVA provides an indicative measure of its ROI. However, fiscal programmes such as the FTR can also be viewed through a narrower lens in terms of their fiscal ROI – for example, the return they deliver in terms of additional tax revenue. As noted in sub-section 3.3, the total economic activity generated by the core UK film sector yielded 30p of tax revenue for every £1 of GVA. Based on this average tax-to-GVA ratio, the core UK film sector generated an estimated £865 million in tax revenue on an average annual basis between 2006-07 and 2013-14 (Figure 25).
Once again, applying an additionality rate of 71% implies that additional tax revenue generated by the core UK film sector was £614 million on an average annual basis (Figure 25). When this estimate of additional tax revenue is compared to average annual FTR claims of £164 million, we conclude that each £1 of FTR yielded £3.74 in additional tax revenue between 2006-07 and 2013-14.

Economic Contribution of the UK’s Screen Sectors
© Olsberg•SPI and Nordicity 2015 February, 2015 36
Figure 25 Analysis of tax relief ROI, return to Exchequer, 2006-07 to 2013-14
Source: Estimates based on Oxford Economics, Olsberg•SPI and British Film Commission. Notes: 1. Includes direct and multiplier effects 2. Exchequer revenue for the 2006-07 to 2013-14 has been estimated by applying the tax-to-GVA ratio of 0.31 used to estimate Exchequer revenue for 2013. 3. Refers to the additional production and economic activity stimulated by FTR. 4. Refers to the level of production and economic activity that would have occurred in the absence of FTR.
4.5 Spillover Effects Thus far, our analysis has quantified the economic benefits that arise as a result of economic activity within the film sector value chain, including its supplier industries. The film sector, however, also generates positive externalities for other industries. These positive externalities are often referred to as spillover effects, since they “spill-out” from their source sector to other industries. In this section, we investigate three of the most notable spillover effects associated with the film sector: tourism, merchandise sales and UK brand promotion.
4.5.1 Tourism Films are increasingly viewed as a major stimulus for broader economic benefits and transactions. Film fans will often travel to countries or cities that have either been filming locations or have been the settings for films.
The UK has a very vibrant film tourism economy. A long list of popular films, including Harry Potter, Notting Hill, Pride and Prejudice, Bridget Jones’s Diary and Love Actually are noteworthy for drawing tourists from around the world.
A further example is the publication of Paddington’s Guide to London, which was recently reprinted following the release of the film Paddington.
Figure 26 Summary of economic impact of film-induced tourism in UK, 2013
Source: Olsberg•/Nordicity analysis based on data from VisitBritain Deloitte and Oxford Economics.

Economic Contribution of the UK’s Screen Sectors
© Olsberg•SPI and Nordicity 2015 February, 2015 37
To estimate the economic impact of film tourism we reviewed the most recently available data published by VisitBritain on the profile of overseas visitors’ tourist activities in the UK. We combined this data with recent survey research conducted by Olsberg•SPI at various screen-tourism locations in the UK.
According to VisitBritain, 3% of overseas tourists visited cultural attractions associated with film or literature between 2006 and 2011.34 While VisitBritain does not provide a breakdown of film locations vs. literature locations, we assume that film accounts for two-thirds of total visits. Therefore, we conclude that 2% of overseas visitors visited a film location in the UK between 2006 and 2001.
Given that the methodology in the 2012 study was based on the number of visitors influenced by film rather than those who actually visited locations, we sought to obtain an analogous percentage. Recent survey research conducted by Olsberg•SPI indicates that for every tourist that visits a screen location two others are partially influenced. We discount these partial influenced tourists by 50% and thereby conclude that other for every tourist that visits a location, one other tourist is influenced by film. This implies that if 2% of overseas tourists visited a film location, then approximately 4% were influenced by film in 2013.
According to the ONS, tourists coming to Britain spent an estimated £21.0 billion on accommodation, travel, food, attractions and shopping in the UK in 2013. We multiplied this rate of total spending by 4% and concluded that £840 million of this spending could be attributed to film.
To convert this estimate of total film-induced tourism spending into an estimate of the economic impact, we obtained economic ratios and multipliers for the UK tourism sector from a recent study prepared by Deloitte and Oxford Economics for VisitBritain.35 The economic modelling adopted in that study suggests that £840 million in spending by overseas tourists would have generated £400 million in GVA, 8,400 FTEs and £92 million in tax revenue (including multiplier effects) in 2013.
4.5.2 Merchandise Sales Films also play an important role in stimulating merchandise sales in the UK, and thereby generate an economic contribution to the UK’s retail sector. Film soundtracks have historically been important in promoting music sales, and many films are released in conjunction with a book version of their script. In both cases, it is the film version of the content – which combines moving image and music – which drives the consumption of the other media, both music and books.
Films directed at children’s audiences are particularly instrumental in stimulating toy sales. Disney, for example, has developed a business model around the use of mass-audience children’s films to promote toy sales. These toy sales generate licensing revenue back to Disney and other rights-holders, but also generate significant retail economic activity.
34 VisitBritain (2013), Inbound tourism to Britain’s nations and regions: Profile of activities of international holiday visitors, p. 8 35 Deloitte and Oxford Economics (2013), Tourism: jobs and growth, The economic contribution of the tourism economy in the UK, accessed at http://www.visitbritain.org/Images/Final%20proof%2015%20Nov_tcm29-39296.pdf

Economic Contribution of the UK’s Screen Sectors
© Olsberg•SPI and Nordicity 2015 February, 2015 38
Films have also been known to help shape fashion trends and thereby promote clothing sales. These types of merchandise sales do not necessarily yield licensing revenue for film rights holders, but can generate significant economic activity in the UK’s retail and fashion industries.
To quantify the value of merchandise sales associated with UK-made films we updated the estimates in the 2012 study. This study found that the combined sales of soundtracks, computer and video games, and other merchandise (e.g. books, toys, clothing) was an estimated £180 million, or equivalent to 70% of the £255 million in box office receipts earned by UK-made films (including UK independent films and studio-backed UK-made films) in the previous three years (2009-2011).36
To estimate the total value of merchandise sales in 2013, we applied this 70% ratio to the average annual box office of £321 million earned by UK-made films between 2011 and 2013. This approach implies that merchandise sales were an estimated £226 million in 2013. The economic ratios implied by the 2012 study were used to convert this total merchandise-sales amount into estimates of economic impact. On this basis, £226 million in merchandise sales induced by UK-made films generated 4,100 FTEs, £148 million in GVA and £69 million in tax revenue in 2013.
4.5.3 UK Brand Promotion Films can not only directly drive sales of merchandise in the UK directly based on their intellectual property (IP), they can also play a role in indirectly promoting the UK brand overseas. In general, film can help a country or region build an image as a destination for tourism or even as place to do business. More specifically, films have been a platform for product placement. In the previous section, we quantified how films’ IP generates economic activity in the UK retail sector. In this section we consider how the placement of UK products in UK films helps ‘UK plc’ – including designers, manufacturers and services industries – generate sales of their products and services outside of the UK.
To quantify the economic impact of this product placement, we have updated the model used in the 2012 study. This model looked at the value of product placement as a share of the box office for UK films and estimated the implied increase from this in global sales, by assuming that brands would not be irrational, and thereby pay more than their incremental increase in profit generated as a result of this product placement. The 2012 study found that product placement was worth an estimated 3.4% of the global box office receipts in 2006.37 Recent data published by PQ Media
36 The 2012 study also included sales of DVD/Blu-ray media in its estimate of merchandise sales. For the current study, DVD/Blu-ray sales have been included in the value chain impact, since it represents a release window for screen content 37 Oxford Economics (2012), p. 48
Source: Olsberg•/Nordicity analysis based on data from Oxford Economics.
Figure 27 Summary of economic impact of film-induced merchandise sales in UK, 2013
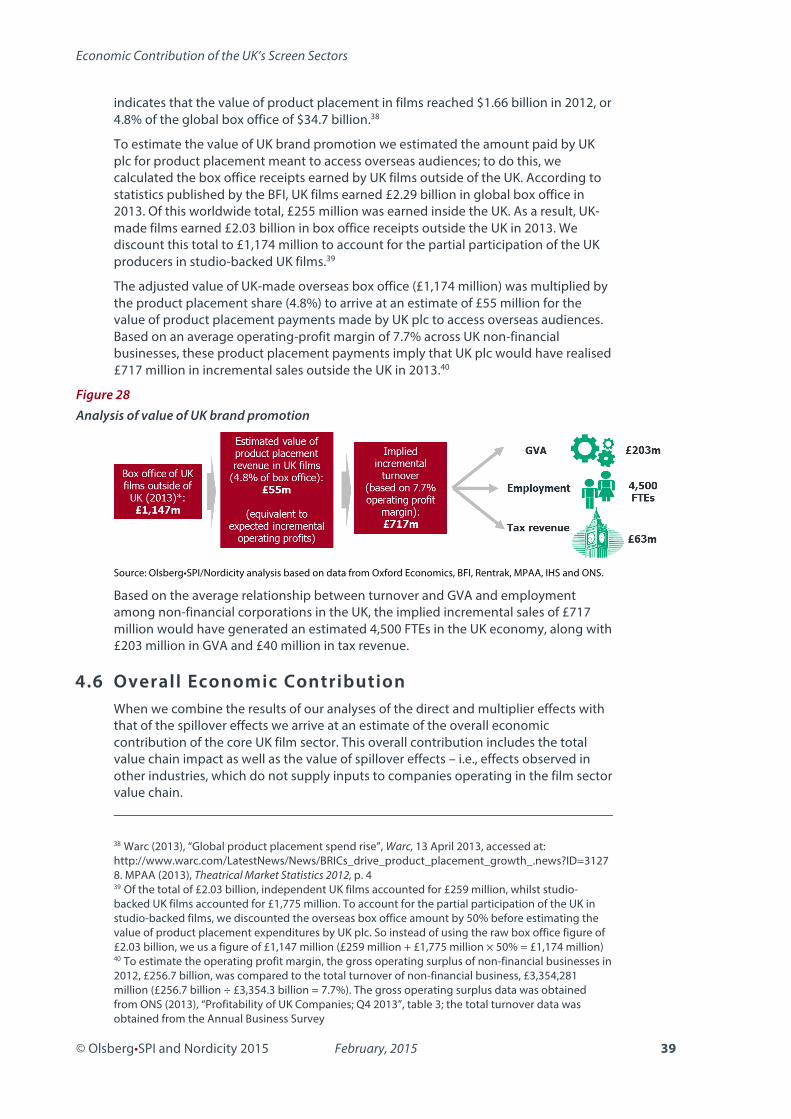
Economic Contribution of the UK’s Screen Sectors
© Olsberg•SPI and Nordicity 2015 February, 2015 39
indicates that the value of product placement in films reached $1.66 billion in 2012, or 4.8% of the global box office of $34.7 billion.38
To estimate the value of UK brand promotion we estimated the amount paid by UK plc for product placement meant to access overseas audiences; to do this, we calculated the box office receipts earned by UK films outside of the UK. According to statistics published by the BFI, UK films earned £2.29 billion in global box office in 2013. Of this worldwide total, £255 million was earned inside the UK. As a result, UK-made films earned £2.03 billion in box office receipts outside the UK in 2013. We discount this total to £1,174 million to account for the partial participation of the UK producers in studio-backed UK films.39
The adjusted value of UK-made overseas box office (£1,174 million) was multiplied by the product placement share (4.8%) to arrive at an estimate of £55 million for the value of product placement payments made by UK plc to access overseas audiences. Based on an average operating-profit margin of 7.7% across UK non-financial businesses, these product placement payments imply that UK plc would have realised £717 million in incremental sales outside the UK in 2013.40
Figure 28 Analysis of value of UK brand promotion
Source: Olsberg•SPI/Nordicity analysis based on data from Oxford Economics, BFI, Rentrak, MPAA, IHS and ONS.
Based on the average relationship between turnover and GVA and employment among non-financial corporations in the UK, the implied incremental sales of £717 million would have generated an estimated 4,500 FTEs in the UK economy, along with £203 million in GVA and £40 million in tax revenue.
4.6 Overall Economic Contribution When we combine the results of our analyses of the direct and multiplier effects with that of the spillover effects we arrive at an estimate of the overall economic contribution of the core UK film sector. This overall contribution includes the total value chain impact as well as the value of spillover effects – i.e., effects observed in other industries, which do not supply inputs to companies operating in the film sector value chain.
38 Warc (2013), “Global product placement spend rise”, Warc, 13 April 2013, accessed at: http://www.warc.com/LatestNews/News/BRICs_drive_product_placement_growth_.news?ID=31278. MPAA (2013), Theatrical Market Statistics 2012, p. 4 39 Of the total of £2.03 billion, independent UK films accounted for £259 million, whilst studio-backed UK films accounted for £1,775 million. To account for the partial participation of the UK in studio-backed films, we discounted the overseas box office amount by 50% before estimating the value of product placement expenditures by UK plc. So instead of using the raw box office figure of £2.03 billion, we us a figure of £1,147 million (£259 million + £1,775 million × 50% = £1,174 million) 40 To estimate the operating profit margin, the gross operating surplus of non-financial businesses in 2012, £256.7 billion, was compared to the total turnover of non-financial business, £3,354,281 million (£256.7 billion ÷ £3,354.3 billion = 7.7%). The gross operating surplus data was obtained from ONS (2013), “Profitability of UK Companies; Q4 2013”, table 3; the total turnover data was obtained from the Annual Business Survey

Economic Contribution of the UK’s Screen Sectors
© Olsberg•SPI and Nordicity 2015 February, 2015 40
On an overall basis, the core UK film sector generated 97,300 FTEs of employment in 2013, as well as £3.7 billion in GVA and £1.1 billion in tax revenue (Table 5).
Table 5 Summary of overall economic contribution of core UK film sector, 2013
Employment (FTEs)
GVA (£m)
Tax revenue (£m)
Direct impact 39,800 1,437.0 431.1 Multiplier effects 40,500 1,478.2 443.5 Total value chain impact 80,300 2,915.3 874.6 Spillover effects: Tourism Merchandise sales Promotion of UK brand
8,400 4,100 4,500
400.0 148.0 203.0
92.0 69.0 63.0
Overall economic contribution 97,300 3,666.3 1,098.6 Source: Olsberg•SPI/Nordicity, Oxford Economics and ONS.
Economic Contribution of the UK’s Screen Sectors
© Olsberg•SPI and Nordicity 2015 February, 2015 41
5. The High-End TV Sector – Economic Impact
5.1 Introduction In the following section, we analyse the economic impact of HETV – that is, television programming for which the production budget is more than £1 million per television hour. In 2013-14, several popular UK and global television programmes, including Outlander, Galavant, and 24: Live Another Day all qualified as HETV.41
As with the film sector, we only assess the economic contribution of production that qualifies for tax relief and not the UK television sector in its entirety. Also, in correspondence with the film sector analysis, we also adhere to a value chain approach, assessing the contribution that HETV content makes to the UK economy across the production, broadcast, and consumption stages.
The value chain model for HETV is very similar to that of the film sector. At the production stage, producers conceive, develop and make the content. Unlike the film sector, however, HETV content can go directly to broadcast on television without intermediation by a distribution company. However, this broadcast commissioning model does not mean that a distribution stage does not exist for HETV. Distribution companies or the distribution arms of production companies that hold economic rights to HETV content can also market these rights to other broadcasters or platforms outside of the primary transmission window in order to earn additional licensing revenue.
The broadcast stage of the value chain, the television broadcast window, has historically been the primary window for the release of television content. However, in recent years, video platforms have taken a larger role in the television value chain, particularly for HETV programming. Consumers now consider VoD and DVD/Blu-ray as platforms for catch-up viewing of HETV content that has already been released on broadcast television or even for the initial viewing of HETV programming. As a result, the viewing of HETV in the video platform sub-sector can either follow or precede viewing through the television broadcast sub-sector.
41 BFI (2014), p. 191.

Economic Contribution of the UK’s Screen Sectors
© Olsberg•SPI and Nordicity 2015 February, 2015 42
Figure 29 HETV value chain
5.2 Direct Impact In the following section we present estimates of the direct economic impact of HETV across the television sector value chain.
5.2.1 Production Statistics compiled by the BFI indicate that during the 2013-14 fiscal year (1st April to 31st March), £394.7 million was spent in in the UK on the production of UK-qualifying HETV. These total expenditures included £170.0 million in domestic UK production and UK co-production, and £224.7 million in inward investment production.
To estimate the direct economic impact of HETV production in 2013-14, the total expenditure of £394.7 million was broken down into estimates of direct wages, for cast and crew, and operating surplus.42 The wage share (58%) was based on a review of ABS statistics for SIC 59.11/3 Television programme production activities. The ABS statistics indicated that the ratio of wages to output between 2008 and 2012 was 0.58.43
The operating surplus share (10%) was derived from consultation with Pact. According to Pact, independent production companies in the UK typically earn a production fee equivalent to 10% of the total production budget. Production companies use these fees to remunerate their company principals and shareholders, invest in project development and pay taxes. The balance of production expenditures (32%) was assumed to have been spent on the purchase of supplies and services, including rent, computer equipment, and travel.
The direct wages or £228.9 million and operating surplus of £39.5 million were added up to arrive at a direct GVA estimate of £268.4 million. An average full-time salary of
42 Operating surplus refers to the income earned by a business’s owner-operator and shareholders and is often similar to operating profits. Operating surplus is the residual income leftover after the value of employment costs and other purchases of supplies and services are deducted from the value of output 43 This wage ratio is consistent with previous research conducted by Olsberg-SPI/Nordicity, which involved reviews of production budgets for television projects

Economic Contribution of the UK’s Screen Sectors
© Olsberg•SPI and Nordicity 2015 February, 2015 43
£31,772 was used to convert direct wages into an employment impact estimate of 7,200 FTEs.44
Figure 30 Derivation of direct GVA generated by HETV production
Source: Olsberg•SPI/Nordicity analysis based on data from BFI, ONS, Pact and Animation UK.
5.2.2 Distribution HETV programmes are typically commissioned by one or more broadcasters. These broadcasters pay a license fee that gives them the rights to the first airing of the programme in their broadcast territories. However, this does not usually cover the entire cost of programme production. Therefore distribution companies and production companies with distribution arms can also earn revenue from the sale of HETV programmes to other territories – i.e. locations other than those served by the commissioning broadcasters – as well as other consumer platforms and subsequent broadcast windows within the original broadcast territories (i.e. secondary release windows or syndication). This revenue often provides an important means of funding the deficit in the costs of programme production left after the payment of the license fee.
The fact that HETV programming often attracts committed audiences suggests that it should also perform well in the distribution market. If the distribution rights for a HETV programme are held by UK companies, those rights will generate GVA and employment for the UK economy, in much the same as the distribution of UK films does in the film sector. This analysis excludes an estimate of the economic contribution generated by the distribution of HETV. In this regard, the estimate of the overall economic contribution is understated, although the degree of this understatement is probably minor for several reasons.
Firstly, inward production accounted for 57% of HETV production expenditures in 2013-14. The distribution rights for these programmes are typically held by companies based outside of the UK and therefore the distribution revenue and economic benefits bypass the UK. The balance of HETV production, which is comprised of UK domestic or co-production, would yield distribution revenue for UK-based companies. However, the majority of this revenue is likely to be generated in future years, as HETV programmes are sold into other territories and platforms. For these reasons, and given the lack of reliable data on the distribution sales generated by HETV programming produced in 2013-14, we have not produced an estimate of the economic contribution within the distribution sub-sector.
44 In 2013, the median average full-time weekly salary (excluding overtime) in SIC 59.11 Motion picture, video and television programme production activities was £611, or £31,772 on an annual (52-week) basis

Economic Contribution of the UK’s Screen Sectors
© Olsberg•SPI and Nordicity 2015 February, 2015 44
5.2.3 Television Broadcast The economic contribution from HETV is not confined to the production and distribution stages. When HETV programming is broadcast on television it generates economic value for UK broadcasters. To estimate the contribution that HETV makes to the television broadcast sub-sector, we sought to approximate the value that HETV supplies to broadcasters’ turnover, employment and GVA by virtue of the audiences that HETV programming attracts and the net advertising sales that these audiences generate for commercial broadcasters.
To estimate this contribution, Attentional/Ubiquity analysed a list of HETV titles that aired on UK television in 2013 (see Appendix, Section 10.2, for a description of the methodology). This analysis established an audience level for each HETV programme that aired on commercial television in the UK, which was then converted into an estimate of the net advertising revenue (i.e. advertising revenue less commissions) generated by the particular HETV programme based on commercial impacts. Television revenue estimates were also assigned to HETV programming that aired on BBC, even though this programming did not generate any advertising revenue. To derive these advertising equivalent estimates, each HETV programme that aired on BBC in 2013 was matched to a similar HETV programme that aired on a commercial broadcaster.45
Based on this analysis of commercial impacts and net advertising revenue, HETV programming generated the equivalent of £181.7 million in revenue for UK broadcasters in 2013 (Table 6). This attributed revenue represented 2.6% of the total broadcast industry turnover of £7,033 million in 2013.
Table 6 Calculation of share of broadcast TV revenue attributable to HETV, 2013
Amount Television revenue attributed to HETV programming (£m) 181.7 Broadcast industry revenue (£m) Net advertising revenue BBC TV income Other TV revenue Total
3,697.0 2,600.0 737.0
7,033.0 HETV revenue share 2.6% Source: Olsberg•SPI/Nordicity analysis based on data from BFI, Attentional/Ubiquity and Ofcom (2014), Communications Market Review 2014, p. 160.
The HETV revenue share was then multiplied by our estimate of total GVA and employment in SIC 60.2 Television programming and broadcasting activities, which includes the economic activity generated by BBC and commercial broadcasters, as well as subscription-based platform operators such as BSkyB, Virgin Media, BT Vision and TalkTalk TV.
Based on this approach, we estimate that HETV programming accounted for £105.0 million of the £4,039 million in GVA in the broadcast industry in 2013 (Figure 31). The
45 Programmes were matched on the basis of the ratio of commercial impacts to audience. A single commercial impact is defined as one viewer watching a single advertisement once. As an example of programme matching, Downtown Abbey (which aired on ITV) was used as a model for Call the Midwife (which aired on BBC1)

Economic Contribution of the UK’s Screen Sectors
© Olsberg•SPI and Nordicity 2015 February, 2015 45
airing of HETV programming also accounted for 900 of the estimated 36,100 FTEs in the broadcast industry in 2013.46
Figure 31 Estimates of GVA and employment generated by HETV programming in the UK broadcast industry, 2013
Olsberg•SPI/Nordicity analysis based on data from BFI, ABS, ASHE and Attentional/Ubiquity.
5.2.4 Video Platforms Over the past decade video platforms, including DVD/Blu-ray sales and rentals, and VoD have become increasingly important to the overall viewing of television programming. This is particularly the case with the type of high-end drama which is supported by the tax relief. In this section we derive estimates of the share of revenue accounted for by HETV in the video platform sub-sector. As part of these estimates, we include the revenue and economic activity associated with DVD/Blu-ray rental by post as well as online VoD services.
DVD/Blu-ray sales and rentals
Data compiled by the British Video Association (BVA) and IHS for the BFI indicate that sales of television programming on DVD/Blu-ray were an estimated £498 million in 2013. These data also indicate that the revenue earned from rental of television programming on DVD/Blu-ray media – including online postal services – was an estimated £31 million in 2013.
We conclude (Section 5.2.3) that HETV programming accounted for 2.6% of economic activity in the broadcast sub-sector. Using data for the audience shares of various genres of screen content in the DVD/Blu-ray markets, we conclude that HETV accounted for a 5.5% share of economic activity in the DVD/Blu-ray sales segment and a 5.9% share in the DVD/Blu-ray rental segment (see Appendix, Section 10.2, for a description of methodology). These higher economic shares in the DVD/Blu-ray markets is reasonable given that many genres prominent on broadcast television (i.e. news and current affairs, factual) are not prominent in the DVD/Blu-ray market.
We multiplied the economic share in each segment of the DVD/Blu-ray market by our estimates of the total revenue attributed to television programming to arrive at
46 The number of FTEs in the broadcast industry was estimated by dividing the total 2013 employment cost (£1,355 million) by the average annual FTE salary of £37,544. The latter is based on the median weekly salary (excluding overtime) of £722

Economic Contribution of the UK’s Screen Sectors
© Olsberg•SPI and Nordicity 2015 February, 2015 46
estimates of the revenue attributed to HETV in segment. Overall, we estimate that HETV accounted for £27.5 million in DVD/Blu-ray sales in 2013 and £1.8 million in DVD/Blu-ray rentals in 2013 (Table 7).
Table 7 Estimated revenue attributable to HETV, DVD/Blu-ray sales and rentals market, 2013
Total revenue attributed
to television programming (£m)
Economic share
Revenue attributed to HETV (£m)
DVD/Blu-ray sales 498.0 5.5% 27.5 DVD/Blu-ray rentals 31.0 5.9% 1.8 Total 529.0 -- 29.3 Source: Olsberg•SPI/Nordicity, BFI, BVA and Ofcom.
A similar approach was adopted to estimate HETV’s share of revenue and economic activity in the VoD market. According to Ofcom, online VoD services generated £363.6 million in revenue in 2013. Deducting the value of films on online VoD, as reported by the BFI (£192.6 million), we arrive at an estimate of the online VoD market for television programming of £170.7 million. We used the ratio of TV-to-online VoD revenue in the film market to estimate the value of the TV-based VoD market. Based on this approach, we estimate that the overall market for television VoD was £285.7 million in 2013.
Applying the economic share for HETV in the DVD/Blu-ray rental market (5.9%), we can estimate the portion of the total market that could be attributed to HETV, and find that HETV generated an estimated £16.9 million in revenue for VoD services in the UK in 2013 (Table 8).
Table 8 Estimated VoD revenue attributable to HETV, 2013
Total revenue attributed
to television programming (£m)
Economic share
Revenue attributed to HETV
(£m)
Television VoD 115.0 5.9% 6.8 Online VoD1 170.7 5.9% 10.0 Total 285.7 -- 16.9 Source: Olsberg•SPI/Nordicity, BFI, BVA and Ofcom. Notes: Some totals may not sum due to rounding. 1. Includes free-to-view (e.g. 4oD), subscription VoD (e.g. Netflix), pay-per-view (e.g. Apple iTunes rentals) and download-to-own (e.g. Apple iTunes download).
To estimate the economic impact of HETV on video platforms, we derived the net margin earned by each platform on the total revenue and then used data from the ONS input-output tables and ABS to convert this net margin into employment and GVA estimates. We conclude that the viewing of HETV on video platforms generated 200 FTEs of employment and £8.1 million in GVA in 2013 (Table 9).

Economic Contribution of the UK’s Screen Sectors
© Olsberg•SPI and Nordicity 2015 February, 2015 47
Table 9 Estimated attributable revenue, net margin and direct economic impact of HETV on other consumer platforms, 2013
Attributable turnover (£m)
Net margin (£m)
Employment (FTEs)
GVA (£m)
DVD/Blu-ray sales and rentals 29.3 9.6 180 4.6 VoD 16.9 5.6 30 3.5 Total 46.2 15.2 200 8.1 Source: Olsberg•SPI/Nordicity, BFI, BVA, Ofcom and ONS. Note: Some total may not sum due to rounding.
5.2.5 Summary Combining the estimates of economic activity in each of the value chain sub-sectors, we conclude that HETV generated 8,300 FTEs of direct employment and £381.5 million in direct GVA in 2013 (Table 10).
Table 10 Summary of direct economic impact of HETV sector, 2013
Employment (FTEs)
GVA (£m)
Production 7,200 268.4 Television broadcast 900 105.0 Video platforms 200 8.1 Total 8,300 381.5 Source: Olsberg•SPI/Nordicity, BFI, BVA, Attentional/Ubiquity, ONS and Ofcom.
5.3 Multiplier Effects and Total Value Chain Impact As with the other screen sectors, the production and broadcast of HETV generate multiplier effects through the purchases of supplies and services, and the re-spending of wages earned by workers employed in the direct and indirect impact phases.
To estimate these multiplier effects, thereby deriving the total value chain impact, multipliers were developed for each of the value chain sub-sectors. For the production sub-sector, a Type II multiplier of 1.97 was applied (Table 11).47 This national multiplier was based on the regional multipliers developed for the UK’s television sector by Optima / Cambridge Econometrics in its 2005 study of the UK’s screen sector.48 The Type II multiplier of 1.97 for the television sector was also applied to the direct economic impact in the television broadcast sub-sector. For the video platforms sub-sector, a multiplier of 2.01 was used, being the average of the television broadcast sub-sector multiplier of 1.97 and the multiplier of 2.05 derived for the retail distribution industry.
47 A Type II multiplier includes both the indirect and induced economic impacts, whereas a Type I multiplier only includes the indirect economic impact 48 Optima and Cambridge Econometrics (2005), The Economic Impact of the UK Screen Industries, pp. 47 and 68. The regional multipliers were weighted by the television production sales data in the report to arrive at a national multiplier of 1.97. Just as the analysis of the film sector in the Optima / Cambridge Econometrics analysis provided the basis for the film sector multiplier used in this study, the analysis of the television sector in the Optima / Cambridge Econometrics analysis provided the basis for the multiplier applied to HETV
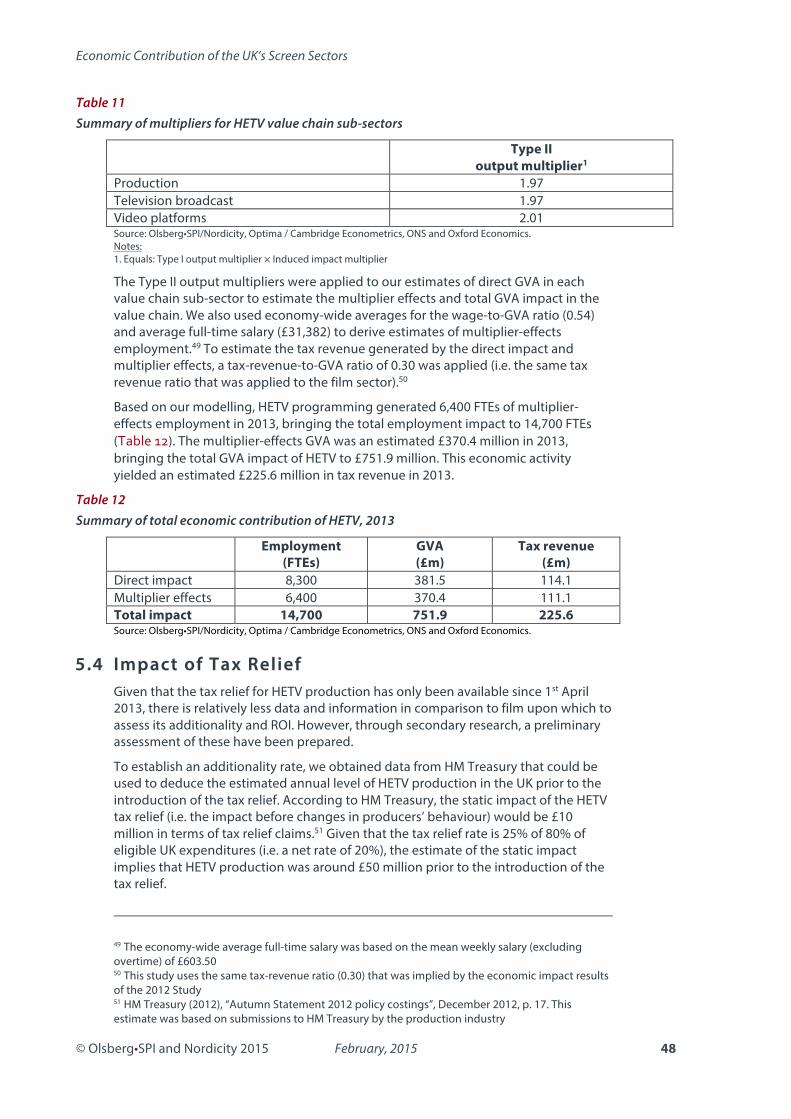
Economic Contribution of the UK’s Screen Sectors
© Olsberg•SPI and Nordicity 2015 February, 2015 48
Table 11 Summary of multipliers for HETV value chain sub-sectors
Type II output multiplier1
Production 1.97 Television broadcast 1.97 Video platforms 2.01 Source: Olsberg•SPI/Nordicity, Optima / Cambridge Econometrics, ONS and Oxford Economics. Notes: 1. Equals: Type I output multiplier × Induced impact multiplier
The Type II output multipliers were applied to our estimates of direct GVA in each value chain sub-sector to estimate the multiplier effects and total GVA impact in the value chain. We also used economy-wide averages for the wage-to-GVA ratio (0.54) and average full-time salary (£31,382) to derive estimates of multiplier-effects employment.49 To estimate the tax revenue generated by the direct impact and multiplier effects, a tax-revenue-to-GVA ratio of 0.30 was applied (i.e. the same tax revenue ratio that was applied to the film sector).50
Based on our modelling, HETV programming generated 6,400 FTEs of multiplier-effects employment in 2013, bringing the total employment impact to 14,700 FTEs (Table 12). The multiplier-effects GVA was an estimated £370.4 million in 2013, bringing the total GVA impact of HETV to £751.9 million. This economic activity yielded an estimated £225.6 million in tax revenue in 2013.
Table 12 Summary of total economic contribution of HETV, 2013
Employment (FTEs)
GVA (£m)
Tax revenue (£m)
Direct impact 8,300 381.5 114.1 Multiplier effects 6,400 370.4 111.1 Total impact 14,700 751.9 225.6 Source: Olsberg•SPI/Nordicity, Optima / Cambridge Econometrics, ONS and Oxford Economics.
5.4 Impact of Tax Relief Given that the tax relief for HETV production has only been available since 1st April 2013, there is relatively less data and information in comparison to film upon which to assess its additionality and ROI. However, through secondary research, a preliminary assessment of these have been prepared.
To establish an additionality rate, we obtained data from HM Treasury that could be used to deduce the estimated annual level of HETV production in the UK prior to the introduction of the tax relief. According to HM Treasury, the static impact of the HETV tax relief (i.e. the impact before changes in producers’ behaviour) would be £10 million in terms of tax relief claims.51 Given that the tax relief rate is 25% of 80% of eligible UK expenditures (i.e. a net rate of 20%), the estimate of the static impact implies that HETV production was around £50 million prior to the introduction of the tax relief.
49 The economy-wide average full-time salary was based on the mean weekly salary (excluding overtime) of £603.50 50 This study uses the same tax-revenue ratio (0.30) that was implied by the economic impact results of the 2012 Study 51 HM Treasury (2012), “Autumn Statement 2012 policy costings”, December 2012, p. 17. This estimate was based on submissions to HM Treasury by the production industry

Economic Contribution of the UK’s Screen Sectors
© Olsberg•SPI and Nordicity 2015 February, 2015 49
The fact that HETV production expenditures increased to £394.7 million indicates an additionality rate of 87% for HETV production (Figure 32A). This additionality rate of 87% implies that HETV tax relief generated £656.7 million in incremental GVA in 2013-14 (including direct and multiplier effects). Therefore, £1 of tax relief resulted in £8.31 of GVA for the UK economy (Figure 32B), using the same model applied to FTR.
Figure 32 Impact of HETV tax relief
A. Additionality B. Return on investment
Source: Olsberg•SPI/Nordicity analysis based on data from BFI, BVA, Attentional/Ubiquity, Ofcom and ONS. * Includes multiplier effects.
When considering that the economic activity generated by HETV production resulted in an estimated £225.6 million in tax revenue in 2013, then one can also conclude that the estimated £79 million in tax relief generated £196.3 million in additional tax revenue (87% × £225.6 million) (Figure 33). In other words, £1 of HETR claimed returned £2.48 to the Exchequer.
We note that the estimates of both the return to the UK economy in terms of GVA and the return to the Exchequer in terms of tax revenue are likely to increase in the future. As noted in Section 5.2.2, this analysis excludes the economic benefits from the distribution of HETV programming. In so far as these distribution revenues are captured in the future, they will likely increase both ROIs. Furthermore, as UK distribution companies build libraries of HETV content over time, the aggregate value of distribution licensing should grow, and thereby, likely lead to further increases in this ROI.

Economic Contribution of the UK’s Screen Sectors
© Olsberg•SPI and Nordicity 2015 February, 2015 50
Figure 33 Analysis of HETV tax relief ROI, return to Exchequer
Source: Olsberg•SPI/Nordicity analysis based on data from BFI, BVA, Attentional/Ubiquity, Ofcom and ONS. Notes: 1. Includes direct and multiplier effects 2. Tax revenue for has been estimated by applying the tax-to-GVA ratio of 0.3. 3. Refers to the additional production and economic activity stimulated by HETV Tax Relief. 4. Refers to the level of production and economic activity that would have occurred in the absence of HETV Tax Relief.
5.5 Spillover Effects Like film, television programing generates spillover effects. In the case of live-action HETV programming, the most notable form of spillover effect is in the form of tourism. In this section, we present our assessment of the economic impact of television tourism associated with HETV programming.
5.5.1 Tourism As with film, fans of high-end fiction programming often travel to visit filming locations or the settings for the television programme. Downton Abbey, for example, has increased the popularity of visits to Highclere Castle in Berkshire. With several British high-end dramas generating significant audience levels outside of the UK, there is even greater scope for this television-induced tourism to help attract inward tourist visits.
To quantify the economic impact of television-induced tourism associated with HETV, we researched the audience performance of the leading British dramas airing in North America. We compared the aggregate average audience level for the television programmes (55 million viewers) to an estimate of the total admissions in North America to UK films (220 million), and concluded that the tourism impact for television is likely to be equal to approximately 25% of the impact for film.
We applied this 25% rate to the £840 million in inward tourism spending in the film sector to arrive at an estimate of £201 million in inward tourism spending associated with HETV in 2013. This 25% rate was also applied to the economic
Figure 34 Summary of economic impact of screen tourism associated with HETV, UK, 2013
Source: Olsberg•SPI /Nordicity analysis based on data from VisitBritain and MPAA.

Economic Contribution of the UK’s Screen Sectors
© Olsberg•SPI and Nordicity 2015 February, 2015 51
impact results for the film sector, leading us to conclude that the television-induced tourism associated with HETV generated an estimated 2,100 FTEs of employment, £99.9 million in GVA and £23 million in tax revenue for 2013.
5.6 Overall Economic Contribution In this sub-section, the results of our analyses of the direct, multiplier and spillover effects are combined to arrive at an estimate of the total economic contribution of HETV to the UK economy in 2013. In total, the HETV sector generated 16,800 FTEs of employment, £851.7 million in GVA and £248.5 million in tax revenue for the UK economy in 2013 (Table 13).
Table 13 Summary of overall economic contribution of HETV in UK, 2013
Employment (FTEs)
GVA (£m)
Tax revenue (£m)
Direct impact 8,300 381.5 114.4 Multiplier effects 6,400 370.4 111.1 Total value chain impact 14,700 751.9 225.6 Spillover effects: Tourism 2,100 99.9 23.0 Overall economic contribution 16,800 851.7 248.5 Source: Olsberg•SPI/Nordicity, Oxford Economics and ONS. Some totals may not sum due to rounding.
Economic Contribution of the UK’s Screen Sectors
© Olsberg•SPI and Nordicity 2015 February, 2015 52
6. The Video Games Sector – Economic Impact
6.1 Introduction and Overview of the Value Chain The UK has a long tradition of producing innovative and successful video games. Indeed, the highest grossing video game series of all time, Grand Theft Auto, was developed in the UK. The latest edition of this global hit, Grand Theft Auto V, has sold more than 33 million copies worldwide, generating $2 billion (£1.3 billion) in sales.52 Nonetheless, in recent years there has been increasing competition by governments seeking to attract video game development studios to their jurisdictions. Responding to this, the UK Government introduced the VGTR effective from 1st April 2014. This followed a broader acceptance by the European Commission that there was market failure in the development of culturally-relevant video games in the European Union.
In January 2014, the DCMS published estimates of economic activity in the video games sector, as part of its ongoing publication of economic estimates for the creative economy. For its economic estimates, the DCMS defined the video games sector as comprising the following two SIC codes:
• 58.21/0 Publishing of computer games (“publishing”); and
• 62.01/1 Ready-made interactive leisure and entertainment software development (“development”).
The protean nature of the video games sector, however, has meant that these two SIC codes may fail to fully capture the growing base of economic activity within the video games sector. Many companies operating in the video games sector may report their financial and economic data under adjacent SIC codes, such as 6201/2, Business and domestic software development, or 58.29/0, Other software publishing. Furthermore, many video games development companies may be too small, in terms of annual turnover to meet ONS’s reporting thresholds.
While the exclusion of these so-called micro-businesses is not unique to the video games sector or to the UK, the pervasive start-up culture in this sector means that it could be disproportionately affected by such exclusions. Indeed, some of the most successful micro-sized video games companies can generate significant revenue.53
To address the issue of under-coverage in the SIC data, this analysis used company information collected from Companies House, Dun&Bradstreet, Ukie and Creative Skillset to identify UK companies operating in the video games sector – both development and publishing – regardless of the SIC under which they report their economic and financial data to ONS. This list was then used to derive estimates of turnover, employment and GVA for the combined video games development and publishing sector. More details on this “SIC-plus” approach can be found in the Appendix (Section 10.3) alongside further detail on other aspects of the detail of the
52 Dave Their (2014), “Grand Theft Auto 5 Has Sold Nearly $2 Billion”, Forbes.com, 13 May 2014, accessed at http://www.forbes.com/sites/davidthier/2014/05/13/grand-theft-auto-5-has-sold-nearly-2-billion-at-retail/ 53 Daniel Nye Griffiths (2014), “With 1m Sales for ‘Thomas Was Alone’, Mike Bithell Launches ‘Volume’ Trailer Ahead of E3”, Forbes.com, 6th August, 2014, accessed at http://www.forbes.com/sites/danielnyegriffiths/2014/06/08/with-1m-sales-for-thomas-was-alone-bithell-launches-volume-trailer-ahead-of-e3/
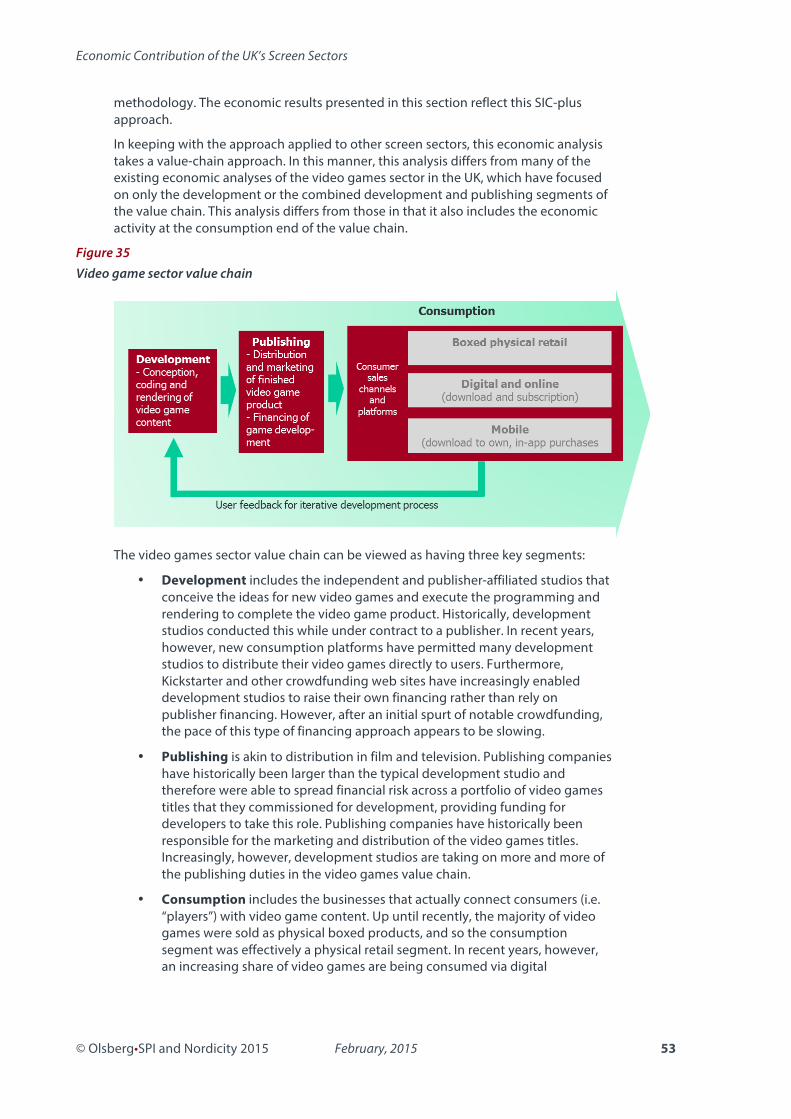
Economic Contribution of the UK’s Screen Sectors
© Olsberg•SPI and Nordicity 2015 February, 2015 53
methodology. The economic results presented in this section reflect this SIC-plus approach.
In keeping with the approach applied to other screen sectors, this economic analysis takes a value-chain approach. In this manner, this analysis differs from many of the existing economic analyses of the video games sector in the UK, which have focused on only the development or the combined development and publishing segments of the value chain. This analysis differs from those in that it also includes the economic activity at the consumption end of the value chain.
Figure 35 Video game sector value chain
The video games sector value chain can be viewed as having three key segments:
• Development includes the independent and publisher-affiliated studios that conceive the ideas for new video games and execute the programming and rendering to complete the video game product. Historically, development studios conducted this while under contract to a publisher. In recent years, however, new consumption platforms have permitted many development studios to distribute their video games directly to users. Furthermore, Kickstarter and other crowdfunding web sites have increasingly enabled development studios to raise their own financing rather than rely on publisher financing. However, after an initial spurt of notable crowdfunding, the pace of this type of financing approach appears to be slowing.
• Publishing is akin to distribution in film and television. Publishing companies have historically been larger than the typical development studio and therefore were able to spread financial risk across a portfolio of video games titles that they commissioned for development, providing funding for developers to take this role. Publishing companies have historically been responsible for the marketing and distribution of the video games titles. Increasingly, however, development studios are taking on more and more of the publishing duties in the video games value chain.
• Consumption includes the businesses that actually connect consumers (i.e. “players”) with video game content. Up until recently, the majority of video games were sold as physical boxed products, and so the consumption segment was effectively a physical retail segment. In recent years, however, an increasing share of video games are being consumed via digital

Economic Contribution of the UK’s Screen Sectors
© Olsberg•SPI and Nordicity 2015 February, 2015 54
distribution platforms.54 These consumption platforms include digital distribution directly to video games consoles or PCs, using online platforms such as Steam, or, as has become increasingly popular, via mobile platforms, such as Apple’s iOS or Google’s Android operating system.55
By including consumption as part of the value chain along with development and publishing, this analysis is consistent with the analyses of the other screen sectors, where economic activity in the exhibition and broadcast windows has also been included and are analogous to video games consumption.
6.2 Direct Impact – Employment and GVA The following section presents the estimates of the direct economic impact of the video games value chain.
6.2.1 Development According to Games Investor Consulting (GIC), video games studios in the UK invested £458 million in the development of video games in 2013 – this was 7.3% higher than the level of expenditures in 2012.56 GIC’s research also indicates that approximately 9,900 workers were employed in creative roles (i.e. “creative staff”) at video game studios.57 Employment data from BRES indicates that approximately 10% of employees in the video games development sector were employed on a part-time basis in 2013; these shares imply that 9,900 workers in video games development would be equivalent to 9,400 FTEs.
Our analysis indicates that the GVA per FTE in the video games sector in 2013 was £67,992 (see Table A -‐ 9 and Table A -‐ 10 in the Appendix). On that basis, we conclude that the 9,400 FTEs in the video games development sector generated £639.1 million in direct GVA in 2013 (Table 14).58 In effect, our estimate of employment in the development sub-sector is based on the research conducted by GIC, while the GVA estimate is based on our own industry research that itself entailed the derivation of GVA estimates on a company-by-company basis.
54 Paul Tassi (2014), “Steam Reaches Record 8 Million Concurrent Users At The End Of Its Summer Sale”, Forbes.com, 30 June 2014, accessed at: http://www.forbes.com/sites/insertcoin/2014/06/30/steam-reaches-record-8-million-concurrent-users-at-the-end-of-its-summer-sale/ 55 John Gaudiosi (2014), “Valve Software shoots for the living room with Steam Machines”, Fortune.com, 12 February 2014, accessed at http://fortune.com/2014/02/12/valve-software-shoots-for-the-living-room-with-steam-machines/ 56 TIGA (2014), “The UK video game development sector is back on track”, 10 June 2014, accessed at http://www.tiga.org/news/the-uk-video-game-development-sector-is-back-on-track. 57 ibid 58 In September 2014, Nesta and Ukie published A Map of the UK Games Industry (“Games Mapping Study”). The Games Mapping Study concluded that there 1,902 games companies operating in the UK. It also provided a “back-of-envelope” estimate suggesting that the GVA of the UK games industry could be as high as £1.7 billion. The disparities between this estimate and ours are due to differences in definitions, as well as our use of the latest ABS data from the ONS, which were not available when Nesta and Ukie published their report
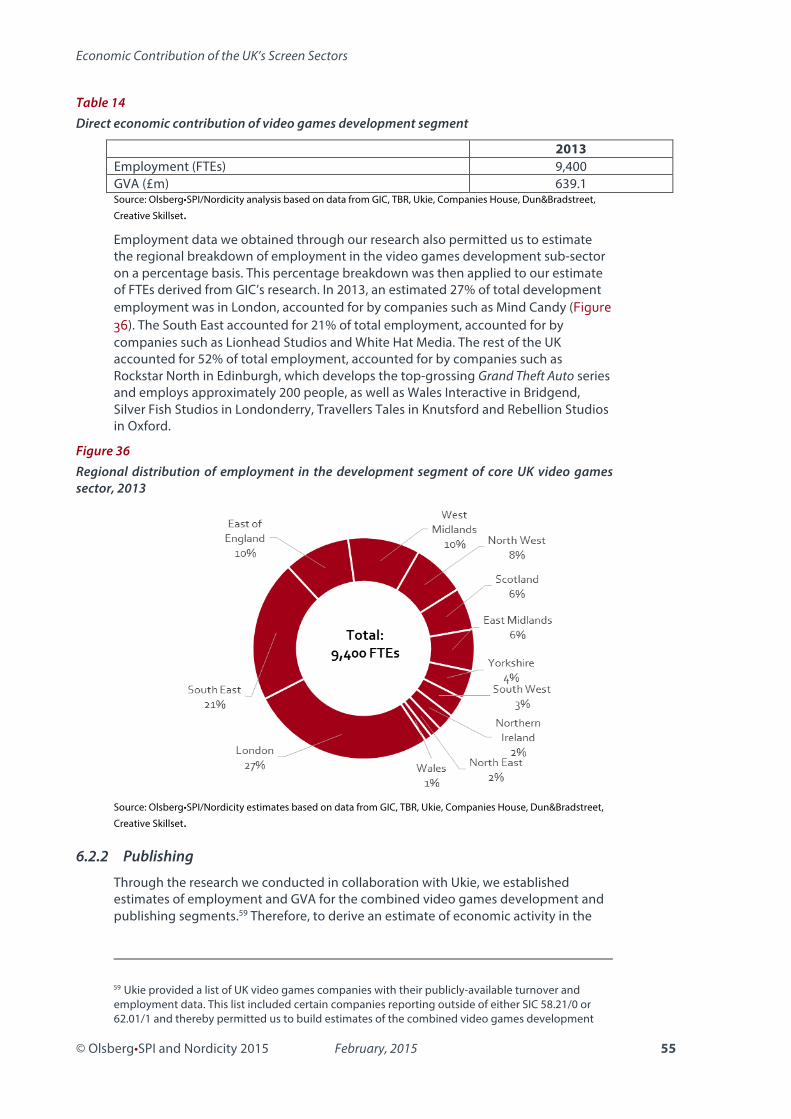
Economic Contribution of the UK’s Screen Sectors
© Olsberg•SPI and Nordicity 2015 February, 2015 55
Table 14 Direct economic contribution of video games development segment
2013 Employment (FTEs) 9,400 GVA (£m) 639.1 Source: Olsberg•SPI/Nordicity analysis based on data from GIC, TBR, Ukie, Companies House, Dun&Bradstreet, Creative Skillset.
Employment data we obtained through our research also permitted us to estimate the regional breakdown of employment in the video games development sub-sector on a percentage basis. This percentage breakdown was then applied to our estimate of FTEs derived from GIC’s research. In 2013, an estimated 27% of total development employment was in London, accounted for by companies such as Mind Candy (Figure 36). The South East accounted for 21% of total employment, accounted for by companies such as Lionhead Studios and White Hat Media. The rest of the UK accounted for 52% of total employment, accounted for by companies such as Rockstar North in Edinburgh, which develops the top-grossing Grand Theft Auto series and employs approximately 200 people, as well as Wales Interactive in Bridgend, Silver Fish Studios in Londonderry, Travellers Tales in Knutsford and Rebellion Studios in Oxford.
Figure 36 Regional distribution of employment in the development segment of core UK video games sector, 2013
Source: Olsberg•SPI/Nordicity estimates based on data from GIC, TBR, Ukie, Companies House, Dun&Bradstreet, Creative Skillset.
6.2.2 Publishing Through the research we conducted in collaboration with Ukie, we established estimates of employment and GVA for the combined video games development and publishing segments.59 Therefore, to derive an estimate of economic activity in the
59 Ukie provided a list of UK video games companies with their publicly-available turnover and employment data. This list included certain companies reporting outside of either SIC 58.21/0 or 62.01/1 and thereby permitted us to build estimates of the combined video games development

Economic Contribution of the UK’s Screen Sectors
© Olsberg•SPI and Nordicity 2015 February, 2015 56
publishing segment, we used a residual approach, whereby the estimates of economic activity in the development segment were subtracted from the combined development and publishing segments. Based on this approach, we estimate that video games publishing activities in the UK employed 3,100 individuals in 2013 and generated £210.9 million in GVA (Table 15). Unlike video games development, however, some portion of this economic activity was associated with the distribution and marketing of video games developed outside of the UK, and as such, does not form part of the core UK video games sector.
To isolate the core UK video games sector, we researched the national origin of the top 100 video game titles sold in the UK in the physical boxed product sales channel. This research indicated that approximately 30% of the top 100 sales were of UK titles. We used this 30% market share as a proxy to isolate the core video game sector.60 On the basis of this 30% market share, the core UK video game sector generated 900 jobs and £63.3 million in GVA (Table 15).
Table 15 Direct economic contribution of video game publishing segment, 2013
Total sector Core UK1
Employment (FTEs) 3,100 900 GVA (£m) 210.9 63.3 Source: Olsberg•SPI/Nordicity analysis based on data from GIC, TBR, Ukie, Companies House, Dun&Bradstreet, Creative Skillset. Notes: 1. Equal to 30% of the total sector.
Whereas London accounted for the largest single share of employment in the development segment, the South East actually had the largest share in the publishing segment, with 32% of total employment. This was accounted for by companies such as Microsoft and Electronic Arts (Figure 37). London held a 31% share of total publishing segment employment, accounted for by companies such as Warner Bros. The rest of the UK accounted for the remaining 37% of employment, with companies such as Core Design in Aberdeen, E-Web Studio in Pontypridd, Pandco in Banbridge and Connect2 in Manchester. Approximately one-half of the rest of the UK employment is within the East of England, accounted for by companies such as Jagex, Frontier Developments and Gamebridge.
and publishing sector in the UK that was not confined by these two SICs. We refer to this as the “SIC-plus” list or “SIC-plus” approach 60 This 30% market share does only reflect the top-selling titles in the physical product market and excludes the digital and online and mobile platforms. However, as noted in Section 5.2.3, the physical retail market still accounted for 43% of consumer spending in 2013, and therefore, provides a significant sample to represent the entire market. That being said, we understand that UK-made video games’ share of the physical retail may be higher than its overall share of the market. Later versions of this research will have access to certification data, the use of which will supersede this estimate

Economic Contribution of the UK’s Screen Sectors
© Olsberg•SPI and Nordicity 2015 February, 2015 57
Figure 37 Regional distribution of employment in the publishing segment of core UK video games sector, 2013
Source: Olsberg•SPI/Nordicity estimates based on data from GIC, TBR, Ukie, Companies House, Dun&Bradstreet, Creative Skillset.
6.2.3 Consumption According to statistics published by Ukie and MCV in the 2013 industry valuation, UK consumers spent just under £2.5 billion on the purchase of original and second-hand video game content in 2013.61. This total spending included:
• £998 million in sales of boxed software (“physical retail”)
• £819 million in spending on online downloads and subscriptions (“digital and online”)
• £430 million in spending on download-to-own apps and in-app purchases (“mobile”),
• £148 million in spending on the purchase of points cards, and62
• £78 million on second-hand software.
61 Ukie and MCV (2014), “The games industry in numbers”, accessed at http://ukie.org.uk/content/games-industry-numbers. In keeping with the value-chain approach adopted for the other screen sectors, we have excluded expenditures on equipment that enables the consumption of screen content 62 Points cards permit consumers to activate video games of downloadable content using points rather than credits cards. In this regard, the purchase of points cards are equivalent to spending on the purchase of video games. According to Ukie and GfK, in 2013, UK consumers spent £137 million on points cards for unspecified titles and £11 million for specified titles at UK retail outlets

Economic Contribution of the UK’s Screen Sectors
© Olsberg•SPI and Nordicity 2015 February, 2015 58
Figure 38 Consumer spending on video games in the UK, by sales channel, 2013
Source: Ukie and MCV (2014)
To avoid double-counting with the revenue of upstream companies (i.e. publishers and developers) and in accordance with standard practices of economic impact analysis, we sought to isolate the retail margin generated by the sales in each of the three major sales channels: physical (boxed software, points cards and second-hand), digital and online, and mobile. We obtained data on average retail margins (from public financial reports for Game Retail Ltd. and Apple) as well as data on average salaries, GVA and wage ratios (from ONS) for the retail distribution, computer services, and software publishing industries to convert consumer spending into retail margins and subsequently into estimates of employment and GVA (See Appendix for detailed calculations). However, because the leading digital, online, and mobile distribution platforms are based outside of the UK, we have zero-rated the economic contribution of these platforms.63 Based on this approach, the £2.5 billion in consumer spending on video games in the UK in 2013 translated into an estimated £782.9 million in retail margin, 6,000 FTEs of employment and £176.8 million in GVA.64
To isolate the economic contribution of the core UK video games sector, we multiplied these estimates by 30% to reflect the approximate market share of UK-made games. As noted in Section 6.2.2, this 30% market share was based on a review of the sales of the top 100 boxed software titles in the UK in 2013. On the basis of a 30% market share, consumption in the core UK video games sector generated an estimated 1,800 FTEs of employment and £53.0 million in GVA in 2013.
63 This zero-rating is warranted because whilst these platforms do collect revenues from UK consumers, the companies that operate these platforms do not need to locate their technical and managerial personnel in the UK and thereby the vast majority of the economic benefits in terms of employment and GVA are likely to occur outside the UK. For example, the largest online platforms, Apple iOS and Valve (Steam) are American companies with registered European offices in Luxembourg, and under EU single market legislation pay taxes there 64 We note that whilst it may be possible that the revenue from the sales of points card could be counted twice – both by the retailer and by the digital/online platform because our analysis zero-rates the economic contribution of digital and online platforms, there is no double counting in the GVA and employment impacts

Economic Contribution of the UK’s Screen Sectors
© Olsberg•SPI and Nordicity 2015 February, 2015 59
Table 16 Economic contribution of consumption of video games in the UK, 2013
Retail margin
(£m)
Total sector Core UK sector1
Employment (FTEs)
GVA (£m)
Employment (FTEs)
GVA (£m)
Physical retail (original and second-hand)
367.2 6,000 176.8 1,800 53.0
Digital and online 286.7 --2 --2 --2 --2 Mobile 129.0 --2 --2 --2 --2 Total 782.9 6,000 176.8 1,800 53.0 Source: Olsberg•SPI/Nordicity, Ukie, MCV, Game Digital plc. Notes: 1. Equal to 30% of the total sector 2. The economic contribution has been zero rated since the vast majority of the economic activity associated with these platforms is generated outside the UK.
6.2.4 Summary Combining the estimates of economic activity in each of the value chain segments, we conclude that the core UK video games sector generated 12,100 FTEs of employment and £755.4 million in GVA in 2013 (Table 17).
Table 17 Summary of direct economic impact of core UK video game sector value chain, 2013
Employment (FTEs)
GVA (£m)
Development 9,400 639.1 Publishing 900 63.3 Retail (all platforms) 1,800 53.0 Total 12,100 755.4 Source: Olsberg•SPI/Nordicity, ONS, Ukie, MCV and Gfk. Note: totals may not sum due to rounding
6.3 Multiplier Effects and Total Economic Impact To estimate the multiplier effects in each value chain segment, we first obtained Type I output multipliers from the latest input-output tables published by ONS.65 To convert these Type I multipliers to Type II multipliers – which incorporate induced impacts – we applied the induced impact multiplier of 1.25 used by Oxford Economics in the 2012 study.66 The resulting Type II output multiplier provided us with a multiplier that we could use to estimate the multiplier effects.
65 ONS (2005), United Kingdom Input-Output Analytical Tables, 2005. Type I multipliers can be used to calculate the indirect impact of an increase in output in a particular industry, but do not include the induced impacts 66 From our own previous research, we agree that a multiplier of 1.25 can effectively capture induced impacts on a national basis.

Economic Contribution of the UK’s Screen Sectors
© Olsberg•SPI and Nordicity 2015 February, 2015 60
Table 18 Derivation of multipliers for video game sector value chain segments
Value chain segment ONS industry category
Type I output
multiplier
Induced impact
multiplier
Type II output
multiplier1 Development Computer
services 1.48 1.25 1.85 Publishing and administration
Advertising 1.62 1.25 2.02
Retail (all platforms)
Retail distribution 1.64 1.25 2.05
Source: Olsberg•SPI/Nordicity, ONS and Oxford Economics. Notes: 1. Equals: Type I output multiplier × Induced impact multiplier
We applied the Type II output multipliers to our estimates of direct GVA in each value chain segment to estimate the multiplier effects and total GVA impacts. We also used economy-wide averages for the wage-to-GVA ratio (0.54) and average full-time salary (£31,382) to derive estimates of multiplier-effects employment. To estimate the tax revenue generated by the direct and multiplier effects, we applied the tax-revenue-to-GVA ratio of 0.30 used elsewhere in this report.
The results indicate that the core UK video games sector contributed 11,500 FTEs of multiplier-effects employment in 2013, bringing the total employment impact to 23,600 FTEs (Table 19). Multiplier-effects GVA was an estimated £665.8 million in 2013, bringing the sector’s total GVA impact to just over £1.4 billion. This economic activity yielded an estimated £426.4 million in tax revenue in 2013.
Table 19 Summary of total value chain impact of the core UK video games sector, 2013
Employment (FTEs)
GVA (£m)
Tax revenue (£m)
Direct impact 12,100 755.4 226.6 Multiplier effects 11,500 665.8 199.7 Total value chain impact
23,600 1,421.2 426.4
Source: Olsberg•SPI/Nordicity, Ukie, MCV, GIC, Oxford Economics and ONS. Note: totals may not sum due to rounding.
6.4 Spillover Effects – Merchandise Sales Similar to other screen-based content, video games generate spillover effects outside of the value chain. In the case of video games, the most notable spillover effect is associated with the sales of IP-based merchandise. Indeed, some video games, such as Activision Blizzard’s Skylanders Trap Team, are incorporating licensed merchandise directly into the gaming experience.67 According to MCV/Ukie, video games generated £196.9 million in merchandise sales in the UK 2013.68 This total included the following:
• Interactive toys (e.g. Skylanders and Disney Infinity): £97.0 million
67 Trefis Team (2014), “Activision Confident With Skylanders Franchise Despite Tough Competition”, Forbes.com, 3 July 2014, accessed at http://www.forbes.com/sites/greatspeculations/2014/07/03/activision-confident-with-skylanders-franchise-despite-tough-competition/. 68 Ukie and MCV (2014).
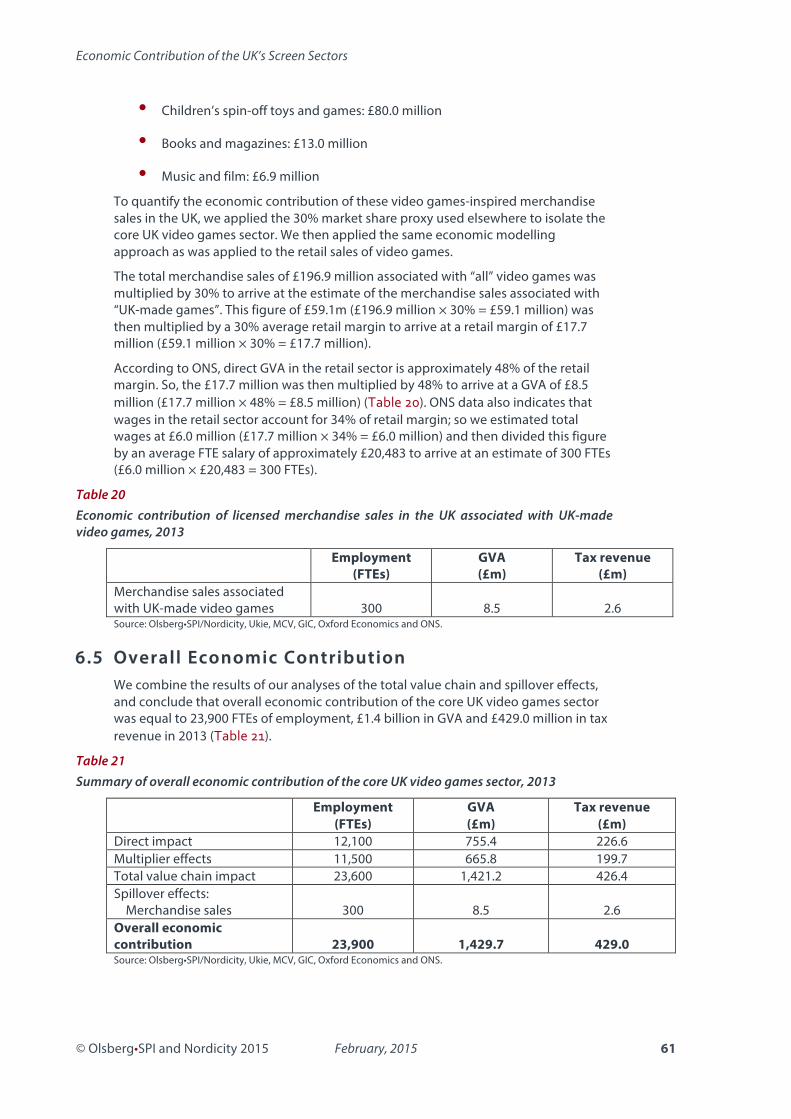
Economic Contribution of the UK’s Screen Sectors
© Olsberg•SPI and Nordicity 2015 February, 2015 61
• Children’s spin-off toys and games: £80.0 million
• Books and magazines: £13.0 million
• Music and film: £6.9 million
To quantify the economic contribution of these video games-inspired merchandise sales in the UK, we applied the 30% market share proxy used elsewhere to isolate the core UK video games sector. We then applied the same economic modelling approach as was applied to the retail sales of video games.
The total merchandise sales of £196.9 million associated with “all” video games was multiplied by 30% to arrive at the estimate of the merchandise sales associated with “UK-made games”. This figure of £59.1m (£196.9 million × 30% = £59.1 million) was then multiplied by a 30% average retail margin to arrive at a retail margin of £17.7 million (£59.1 million × 30% = £17.7 million).
According to ONS, direct GVA in the retail sector is approximately 48% of the retail margin. So, the £17.7 million was then multiplied by 48% to arrive at a GVA of £8.5 million (£17.7 million × 48% = £8.5 million) (Table 20). ONS data also indicates that wages in the retail sector account for 34% of retail margin; so we estimated total wages at £6.0 million (£17.7 million × 34% = £6.0 million) and then divided this figure by an average FTE salary of approximately £20,483 to arrive at an estimate of 300 FTEs (£6.0 million × £20,483 = 300 FTEs).
Table 20 Economic contribution of licensed merchandise sales in the UK associated with UK-made video games, 2013
Employment (FTEs)
GVA (£m)
Tax revenue (£m)
Merchandise sales associated with UK-made video games 300 8.5 2.6 Source: Olsberg•SPI/Nordicity, Ukie, MCV, GIC, Oxford Economics and ONS.
6.5 Overall Economic Contribution We combine the results of our analyses of the total value chain and spillover effects, and conclude that overall economic contribution of the core UK video games sector was equal to 23,900 FTEs of employment, £1.4 billion in GVA and £429.0 million in tax revenue in 2013 (Table 21).
Table 21 Summary of overall economic contribution of the core UK video games sector, 2013
Employment (FTEs)
GVA (£m)
Tax revenue (£m)
Direct impact 12,100 755.4 226.6 Multiplier effects 11,500 665.8 199.7 Total value chain impact 23,600 1,421.2 426.4 Spillover effects: Merchandise sales 300 8.5 2.6 Overall economic contribution 23,900 1,429.7 429.0 Source: Olsberg•SPI/Nordicity, Ukie, MCV, GIC, Oxford Economics and ONS.

Economic Contribution of the UK’s Screen Sectors
© Olsberg•SPI and Nordicity 2015 February, 2015 62
7. The Animation Programme Sector – Economic Impact
7.1 Introduction The UK has a long tradition of creating successful animation programmes. Titles such as Wallace and Gromit, Bob the Builder, Thomas and Friends and Peppa Pig have become global franchises airing in hundreds of countries and generating millions of pounds of ancillary revenues. Like film and HETV, animation programming draws upon the UK’s creative community’s track record in character development and storytelling. Like film and video games, animation programme production also leverages the UK’s global leadership in the artistic and technical aspects of the visual product.
Animation programmes, as defined for the purpose of the ATR, form only part of a broader UK animation sector.69 This broader sector includes film animation, which is supported through FTR and as a result not relevant for this element of the analysis, and programmes containing smaller animation elements as a percentage of total cost than the ATR supports. It follows that the entire UK animation sector is broader than described below, though this is not something which the present report aims to analyse.
As with the other screen sectors, the economic impact analysis in this section takes a value chain approach to quantify the economic contribution generated by animation programmes produced with the support of the ATR. The value chain for animation programming resembles that of HETV. At the production stage, producers conceive and develop the content. A team of animators and graphic artists then renders this content into a finished animation programme.
In comparison with live action production, such as HETV, animation programme production often undergoes a much longer production cycle. The production of a single animation series can extend over two years, whereas a live action programme of equivalent running length can be produced over a matter of months. Animation programme production also differs from live action production in that it often involves the production of several short episodes (e.g. 3 to 10 minutes in length), whereas the episodes for a live action project are likely to be 30 minutes (or approximately 20-25 minutes after allowance for commercial breaks).
As with HETV, there is often no intermediation by a distributor between the production and primary release of the content in the television broadcast sub-sector. However, distribution companies or the distribution arms of production companies do play a role in the marketing of animation programmes to other broadcasters or video platforms. They may also play a role in managing the licensing of IP for use in merchandise.
69 Productions accessing ATR must be intended for broadcast, including using online channels, with at least 51% of the total core expenditure being on animation

Economic Contribution of the UK’s Screen Sectors
© Olsberg•SPI and Nordicity 2015 February, 2015 63
Figure 39 Animation programme value chain
As with other forms of television content video platforms are taking a larger role in the broadcast stage of the animation programme value chain. Consumers use VoD and DVD/Blu-ray as platforms for catch-up viewing of animation programming that has already been released on broadcast television or even for the initial viewing of animation programming. As a result, the viewing of animation programmes in the video platforms sub-sector can either follow or precede viewing via the broadcast sub-sector.
The analysis in this section also investigates the significant spillover effects that animation programming IP generates in the UK’s retail sector through sales of licensed merchandise and in the tourism sector through inward visits to theme parks inspired by animation programmes. We note, however, that the analysis of the value chain – and to a lesser extent the spillover effects – should be viewed as conservative because it is too early to fully assess the revenue and economic value generated by animation programme content produced in 2013-14.
In a couple of respects, the business model for animation programmes differs notably from film and HETV, in that animation is readily adapted to other languages by dubbing. Furthermore, animation programme producers draw a much larger share of their revenue and economic returns from sales and licensing activities that in many cases occur several years after production and first airing or release. As a result, further downstream revenues from this years’ animation programming content are to be expected.
Consequently, unlike many of the other screen sectors, animation programming displays a very long revenue cycle – an animation programme can generate a revenue stream that lasts several years into the future. The full economic contribution from the 2013-14 vintage of animation programming production will therefore not be fully known until several years from now.
7.2 Direct Impact – Employment and GVA In the following section we present estimates of the direct economic impact of animation programmes made with support of the ATR.
7.2.1 Production Statistics compiled by the BFI indicate that during the 2013-14 fiscal year, producers spent £51.7 million on the production of UK-qualifying animation programmes. These

Economic Contribution of the UK’s Screen Sectors
© Olsberg•SPI and Nordicity 2015 February, 2015 64
total expenditures included £43.9 million in domestic UK production and UK co-production, and £7.8 million in inward investment production. As noted in Section 7.1, in comparison to live action production, animation programmes typically involve the production of numerous short episodes of over a longer production cycle, which can be as long as two years in many cases.
To estimate the direct economic impact of animation programme production in 2013-14, the total expenditure of £51.7 million was broken down into estimates of direct wages (i.e. cast and crew wages) and operating surplus. The wage share (70%) was based on discussions with Animation UK.
The operating surplus share (10%) was derived from consultations with Animation UK and Pact. Both organisations confirmed that independent animation production companies in the UK typically earn a production fee equivalent to 10% of the total production budget. The balance of production expenditures (20%) was assumed to have been spent in the purchase of supplies and services (e.g. rent, computer equipment, and travel).
The direct wages of £36.2 million and operating surplus of approximately £5.2 million were combined to arrive at a direct GVA estimate of £41.4 million (Figure 40). An average full-time salary of £31,772 was used to convert direct wages into an employment-impact estimate of 1,100 FTEs.
Figure 40 Derivation of direct GVA and employment generated by animation programme production
Source: Olsberg•SPI/Nordicity analysis based on data from BFI, Pact, Animation UK and ONS.
7.2.2 Distribution In addition to production, the distribution of animation programmes can also generate economic activity within the UK from the licensing of programming to broadcasters (other than commissioning broadcasters) and to video platforms, as well as the licensing of IP for use in merchandise. As with HETV, such funding often comes in the form of advances, utilised by the production company to complete the budget for the programme. This is required as the license fee from the original broadcaster generally does not cover the entire cost of making the programme. However, as was the case with HETV, we have not prepared an estimate of the economic contribution of the distribution sub-sector.
Similar to HETV, the economic gains from the distribution of animation programmes produced in 2013-14 are likely to emerge across future years. While these future benefits could, in theory, have been forecast and discounted to the present, the lack of data on distribution sales of animation programme production meant that this would have likely been a wholly speculative exercise. As these revenues are realised in future years, they can be captured, quantified and incorporated into the economic contribution analysis in a rigorous manner. For these reasons, therefore, we have not

Economic Contribution of the UK’s Screen Sectors
© Olsberg•SPI and Nordicity 2015 February, 2015 65
produced an estimate of the economic contribution within the distribution sub-sector and note that this approach would – as was the case with HETV – tend to result in an understatement of the total economic impact of the animation programme sector.
7.2.3 Television Broadcast When animation programming is broadcast it also generates economic value for the UK economy, by raising income and employment at UK broadcasters. To estimate the contribution that animation programming makes to the television broadcast sub-sector, we sought to ascertain the audience share for animation programming. However, in contrast to HETV, the type of audience data available to us did not permit the same level of analysis. As an alternative, we used more general audience data to derive an economic share for animation programming in the UK.
The derivation of the economic share of animation programming is outlined in Table 22. Children’s viewing of children’s programming as a share of total television viewing in the UK by all ages (2.5%) was multiplied by the share of children’s viewing of animation programming (27%).70 Even though UK-originated content in the children’s genre accounted for 20% of output in 2011, it accounted for 45% of viewing. Taken together, these audience and programme output metrics suggest that UK-originated animation programming accounts for 0.31% of the economic value generated by the broadcast sub-sector in the UK.
Table 22 Derivation of economic share of UK animation programming on broadcast television
Share of children’s viewing of children’s programming on UK
TV (2011)1
Share of children’s viewing of children’s programing on UK TV
accounted for by animation (2011)2
Audience share of UK-originated
children’s programming
(2011)3
Economic share
2.5% × 27% × 45% = 0.31%
Sources: 1. See Appendix for details of calculation. 2. Ofcom (2013), Public Service Broadcasting Report 2013: Annex Information pack F: Children’s Report, p. 51. Ofcom (2013), p. 31 and 37.
We multiplied the economic share attributable to animation programming by the total GVA and employment in SIC 60.2, Television programming and broadcast, to estimate the economic impact attributable to the broadcast of animation programming. Based on this approach animation programmes accounted for £12.3 million in GVA and 100 FTEs of employment in the broadcast sub-sector in 2013 (Table 23).
70 Whilst it is true that UK-qualifying animation programming can be made for all ages, rather than just children’s audiences, the only available audience data related to animation programming is for children’s animation programming. As a result, we note that our analysis provides a conservative estimate of the audience share for animation programming since it excludes animation programming made for non-children’s audiences.

Economic Contribution of the UK’s Screen Sectors
© Olsberg•SPI and Nordicity 2015 February, 2015 66
Table 23 Calculation of economic activity in UK broadcast industry attributable to animation programing
Total broadcast industry (SIC 60.2)
Animation programming economic share (0.31%)
Turnover (£m) 9,549.0 29.2 Employment (FTEs) 36,100 100 GVA (£m) 4,039.0 12.3 Source: Olsberg•SPI/Nordicity analysis based on data from Ofcom and ONS.
7.2.4 Video Platforms In a similar manner to HETV, we also estimated the portion of economic activity on video platforms that can be attributed to animation programming. Instead of using an economic share of 0.31% for the DVD/Blu-ray sales and rental market, however, we derived rates of 1.2% for sales and 1.4% for rentals. These rates reflect the economic share model presented above and the genre data for DVD/Blu-ray sales and rentals published by in the BFI’s Statistical Yearbook 2014 (see Appendix, Section 10.4, for calculations of economic share).71
Based on these economic share assumptions, we estimate that animation programmes accounted for approximately £2.3 million in turnover on video platforms in 2013 (Table 24). This turnover generated an estimated 100 FTEs of employment and £400,000 in GVA.
Table 24 Estimated attributable turnover and direct economic impact of animation programmes on video platforms
Attributable turnover (£)
Employment (FTEs)
GVA (£)
DVD/Blu-ray sales 720,000 --1 --1 DVD/Blu-ray rentals 51,000 --1 --1 VoD 1,560,000 --1 --1 Total 2,331,000 100 400,000 Source: Olsberg•SPI/Nordicity, BFI, Ofcom and ONS. Notes: 1. Estimates of employment and GVA were only prepared for total activity in video platforms.
7.2.5 Summary The estimates of economic activity in each of the value chain segments were added together to arrive at an estimate of the total direct impact of the animation programme sector. In 2013, animation programming generated 1,300 FTEs of direct employment and £54.1 million in direct GVA (Table 25).
71 BFI (2014), Statistics Yearbook 2014, pp. 125 and 129.

Economic Contribution of the UK’s Screen Sectors
© Olsberg•SPI and Nordicity 2015 February, 2015 67
Table 25 Summary of direct economic impact of UK animation programme sector, 2013
Employment (FTEs)
GVA (£m)
Production 1,100 41.4 Television broadcast 100 12.3 Video platforms 100 0.4 Total 1,300 54.1 Source: Olsberg•SPI/Nordicity, ONS, Pact, Animation UK and Ofcom.
7.3 Multiplier Effects and Total Value Chain Impact As with the other screen sectors, the production and broadcast of animation programmes generate multiplier effects through the purchases of supplies and services, and the re-spending of wages earned by workers employed in the direct- and indirect-impact phases.
To estimate the multiplier effects, and thereby derive the total value chain impact, multipliers were developed for each of the sub-sectors. For the production sub-sector, the multiplier of 1.97 used in the analysis of HETV was modified to reflect the fact that a higher share of an animation programme’s budget is devoted to direct wages as opposed to the purchase of supplies and services. This type of spending profile would suggest a somewhat lower multiplier would be applicable to animation programming compared to HETV, since a higher share of the economic impact is in the form of direct impact. On this basis, we used a Type II multiplier of 1.79 rather than 1.97.
As in the case of HETV, for the television broadcast sub-sector, the national multiplier of 1.97 – implied by the regional multipliers derived by Optima/Cambridge Econometrics – was used. For the video platforms sub-sector, a multiplier of 2.02 was used, i.e. the average of the broadcast industry multiplier of 2.0 and the multiplier of 2.05 derived for retail distribution.
Table 26 Summary of multipliers for animation programme value chain sub-sectors
Type II output multiplier1
Production 1.79 Television broadcast 1.97 Video platforms 2.02 Source: Olsberg•SPI/Nordicity, ONS and Oxford Economics. Notes: 1. Equals: Type I output multiplier × Induced impact multiplier.
The Type II output multipliers were applied to our estimates of direct GVA in each value chain sub-sector to estimate the multiplier effects in terms and total GVA impact. We also used economy-wide averages for the wage-to-GVA ratio (0.54) and the average economy-wide full-time salary in 2013 (£31,382) to derive estimates of multiplier-effects employment. To estimate the tax revenue generated by the direct and multiplier effects, we used a tax-revenue-to-GVA ratio of 0.30, as was applied for the other screen sectors.
Based on our modelling, animation programmes generated 900 FTEs of multiplier-effects employment in 2013, bringing the total value chain impact to 2,200 FTEs (Table 27). The multiplier effect GVA was an estimated £44.9 million in 2013, bringing the total GVA impact of the animation programme value chain to £99.1 million. This economic activity yielded an estimated £29.7 million in tax revenue in 2013.

Economic Contribution of the UK’s Screen Sectors
© Olsberg•SPI and Nordicity 2015 February, 2015 68
Table 27 Summary of total value chain impact of animation programmes, 2013
Employment (FTEs)
GVA (£m)
Tax revenue (£m)
Direct impact 1,300 54.1 16.2 Multiplier effects 900 44.9 13.5 Total value chain impact 2,200 99.1 29.7 Source: Olsberg•SPI/Nordicity, Oxford Economics and ONS.
7.4 Impact of Tax Relief Given that the tax relief for animation programme production has only been available since 1st April 2013, there is less data in comparison to film upon which to assess its additionality and ROI. However, through primary and secondary research, a preliminary assessment of additionality and ROI have been prepared.
While there is no direct data on the annual levels of animation programme production in the UK prior to the introduction of the ATR, a confidential survey of UK animation companies conducted by Pact indicated that the level of animation programme production in the UK in 2011 was approximately £46 million. The fact that animation programme production expenditures during 2013-14 were £51.7 million suggests that the additionality rate during the first year of the ATR was 11%.
Whilst HMRC has not published precise statistics on the value of ATR claims associated with animation programme production, we estimate that £51.7 million in production expenditures would have triggered £10.3 million in claims. Based on an additionality rate of 11%, the ATR generated £10.9 million in additional GVA in 2013-14. Therefore, £1 of tax relief resulted in £1.06 of GVA for the UK economy.
Figure 41 Impact of the ATR
A. Additionality B. Return on investment
Source: Olsberg•SPI/Nordicity analysis based on data from BFI, Ofcom, Pact, Animation UK and ONS. * Includes direct and multiplier effects.
When considering that the economic activity generated by animation programmes resulted in an estimated £29.7 million in tax revenue, then it can also be concluded that the £10.3 million in estimated ATR generated £3.3 million in tax revenue (11% × £29.7 million). Therefore, £1 of tax relief returned £0.32 to the Exchequer.

Economic Contribution of the UK’s Screen Sectors
© Olsberg•SPI and Nordicity 2015 February, 2015 69
Figure 42 Analysis of the ATR’s ROI, return to Exchequer
Source: Olsberg•SPI/Nordicity analysis based on data from BFI, Ofcom, Pact, Animation UK and ONS. Notes: 1. Includes direct and multiplier effects 2. Tax revenue for has been estimated by applying the tax-to-GVA ratio of 0.3. 3. Refers to the additional production and economic activity stimulated by ATR. 4. Refers to the level of production and economic activity that would have occurred in the absence of ATR.
While the ROI for the ATR is lower than that observed for FTR and HETV tax relief, in our view, it is extremely conservative. This position is based on the fact that animation programme production follows a very different business model than either film or live action television drama programming. In comparison to other genres, animation programme producers draw a much larger share of their revenue and economic returns from sales and licensing activities – both of which have not been taken into account in our economic impact modelling and ROI analysis. Furthermore, the production cycle in animation programme production is often longer than in HETV and film, therefore, it is likely that these figures will increase in future years once the full impact of the ATR can be seen.
One of the hallmarks of animation programmes – particularly children’s animation programmes – is that they “travels well”, i.e. programmes can be readily dubbed or versioned for other languages and markets. As a result, some of the animation programming produced in 2013-14 with the support of the ATR is likely to generate distribution sales as it is sold to broadcasters around the world – both in English-speaking and non-English-speaking countries.
A second hallmark of animation programming – once again, particularly children’s animation – is that some of the titles spawn substantial merchandise sales. These merchandise sales return licensing revenue to the producers of the programming.
Both of these secondary revenue sources are likely to generate additional revenue for animation producers and distributors in the years to come. In many cases, these revenue streams can persist for a long period. A comprehensive ROI analysis should take into account these future revenue streams and discount them back to the present for comparison to the value of ATR outlays. This is not yet possible to do, since the revenue has not yet been realised. The key implication, however, is that in future years, it should be expected that the ROI for animation programmes would increase for any given year of the ATR, as secondary revenue sources are credited back to their parent rights holder.

Economic Contribution of the UK’s Screen Sectors
© Olsberg•SPI and Nordicity 2015 February, 2015 70
7.5 Spillover Effects Animation programming also generates significant spillover effects outside the value chain. In particular, there are significant positive spillovers in terms of merchandise sales as well as tourism linked to an animation programme’s IP.
7.5.1 Merchandise Sales As noted in the ROI analysis, merchandise sales are an inextricable part of the business model for animation programming. For global hits, such as Peppa Pig, Thomas and Friends, Bob the Builder or Teletubbies, the licensing revenue generated by merchandise sales can be significant; moreover, the economic activity generated in the retail industry is not insignificant.
In the context of this analysis, merchandise sales are attributed as a spillover impact – specifically the impact that they have on the retail sector in the UK. The licensing revenue earned by producers and rights-holders from licensed merchandise; however, should not be viewed as a spillover impact, since it has already been counted as income and GVA in the production or distribution stages of the value chain. Merchandise sales also stimulate economic activity in the book publishing and manufacturing sectors. Whilst some of this labour undoubtedly takes place in the UK, the vast majority is likely to occur offshore. The spillover impact in the retail sector is, however, captured within the UK economy through the sales of licensed merchandise in UK stores.
There is limited data available on the value of merchandise sales in UK stores linked with licensed content from UK animation programmes. It is known, however, that the two leading UK animation brands, Peppa Pig and Thomas and Friends, generated a combined £400 million in merchandise sales in 2010. Accounting for other animation brands and market growth, it can reasonably be concluded that the licensed merchandise sales market was worth an estimated £500 million in 2013.
Based on a model of the economic impact of retail sales, which takes into account average retail margins and average salaries in the retail sector, it can be estimated that £500 million in sales would generate £72 million in GVA and 2,500 FTEs of employment for the UK economy.
This economic impact, of course, was generated from an extensive library of content. Peppa Pig has aired for six seasons; Thomas and Friends has aired for 18 seasons and is based on a brand of even longer standing. With that in mind, a more appropriate assessment of the merchandise sales associated with a single year of tax relief might take some fraction of this total. However, this approach could be countered by the fact that it is often the most recent airings of a programme that stimulate contemporaneous merchandise sales. In other words, a single year’s merchandise sales can be linked to the most recently aired season of animation, which maintained or piqued interest in the brand.
7.5.2 Tourism There is little doubt that Disney’s animation films and television series have generated enormous tourism benefits for Florida, California, Japan and France, since Disney theme parks are located in these jurisdictions. The UK tourism sector also benefits from the global success of its animation content. Thomas Land at Drayton Manor Theme Park in Staffordshire attracts visitors from among the global audience for Thomas and Friends, which airs in the US and dozens of other countries. In Hampshire, the Paultons Family Theme Park opened Peppa Pig World in April 2011. Once again, whilst Peppa Pig is popular with UK audiences, it has also grown to be a massive international success, now airing in the US and 180 different countries.

Economic Contribution of the UK’s Screen Sectors
© Olsberg•SPI and Nordicity 2015 February, 2015 71
Whilst the annual number of inward-tourist visits to either Thomas Land or Peppa Pig World are not known, we do know both theme parks have been resounding successes for their owners.72 Furthermore, we know that the developers of Peppa Pig World made a significant investment, £5 million, to create it. 73 Presumably, investors would expect that a successful operation, as Peppa Pig World has become, would recover this investment, generate a financial surplus, as well as economic benefits for local accommodation and restaurants.
7.6 Overall Economic Contribution In this sub-section, the results of our analyses of the direct, multiplier and spillover effects are combined to arrive at an estimate of the overall economic contribution of animation programmes to the UK economy in 2013. In total, the animation programme sector generated 4,700 FTEs of employment, £171.1 million in GVA and £52.0 million in tax revenue for the UK economy in 2013 (Table 28).
Table 28 Summary of overall economic contribution of animation programmes in the UK, 2013
Employment (FTEs)
GVA (£m)
Tax revenue (£m)
Direct impact 1,300 54.1 16.2 Multiplier effects 900 44.9 13.5 Total value chain impact 2,200 99.1 29.7 Spillover effects: Merchandise sales Tourism
2,500
--*
72.0 --*
22.3 --*
Overall economic contribution 4,700 171.1 52.0 Source: Olsberg•SPI/Nordicity, Oxford Economics and ONS. * Data not available
72 Andrew Mellor (2011), “Paultons hits new heights with Peppa Pig World”, InterPark, 30 September 2011, accessed at: http://www.interpark.co.uk/feature/Paultons-hits-new-heights-with-Peppa-Pig-World/129-1-11- 73 ibid

Economic Contribution of the UK’s Screen Sectors
© Olsberg•SPI and Nordicity 2015 February, 2015 72
8. Conclusions 8.1 Value Chain Impact (Direct Impact and Multiplier
Effects) The creative sectors worldwide are undergoing a period of intense change – the emergence of new models of production and consumption are in the process of altering long-held business norms, while continuing high levels of production in the UK and abroad means increasing competition for audiences. Under these circumstances, the stability of the UK’s Creative Sector Tax Reliefs, particularly FTR, are a vital underpinning for the success of the sector. It is hard to imagine that, without these, the sectors would be anywhere near as vibrant as they currently are.
Table 29 Summary of total value chain impact of screen sectors subject to tax relief in 2013-14*
Employment (FTEs)
GVA (£m)
Tax revenue (£m)
Direct impact 49,400 1,872.7 561.8 Multiplier effects 47,800 1,893.5 568.0 Total value chain impact 97,200 3,766.2 1,129.8
Source: Olsberg•SPI/Nordicity estimates * Film, HETV and animation
Since the 2012 study, the broad trends for the film sector are positive, as the infrastructure investments made by groups such as Industrial Light & Magic suggest. The significant investment seen in the UK’s major studios will also open the ground for further expansion of the sector. Given the fact that in both 2013 and 2014 studio productions have been turned away for want of sufficient dedicated shooting space, such additions are sorely needed.
The year studied for this report preceded the most recent changes to the FTR, which – in lowering the minimum UK spend to 10% and removing the step at £20 million – will be expected to have a further positive impact. Both the UK’s independent production sector, through an increase in co-productions, and the visual effects industry are likely to benefit from these changes.
For the HETV sector, the growth since the introduction of the relief has been little short of spectacular. HETV production spend is 87% up on where it was the year before the incentive, with elements of this growth coming from both domestic and international productions. In many cases, productions have reached up into the £1 million pound per hour band, spending a relatively small additional amount to gain the significant benefits of the HETR. Such additional spending has increased the ability of UK HETV to attract major international talent, and will be expected to have a significant impact when downstream revenues are counted over the next few years.
In the animation programme sector the story is less about major expansion than it is about the survival of an industry which, over the last decades, has been in dire straits. As a result, the immediate impact of the ATR has been to stabilise the sector, providing a base for future growth and reviving international interest. With the length of the production process for animation programmes, as well as the opportunities for downstream revenues, it is expected that success in this sector will come in future.

Economic Contribution of the UK’s Screen Sectors
© Olsberg•SPI and Nordicity 2015 February, 2015 73
Table 30 Summary of total value chain impact of video game sector, 2013
Employment (FTEs)
GVA (£m)
Tax revenue (£m)
Direct impact 12,100 755.4 226.6 Multiplier effects 11,500 665.8 199.7 Total value chain impact 23,600 1,421.2 426.4
Source: Olsberg•SPI/Nordicity estimates
Video games had not, during the study period for this report, had access to the tax reliefs, but we note that there is significant interest in the wider industry about the possibilities the incentive offers. The UK games sector is already recognised for its skills and creativity, and as such the incentive offers a strong basis for its future success.
The track record of the UK’s creative sectors has also been noted recently by the Chancellor, George Osborne. His proposal to introduce a tax relief for the production of Children’s TV is likely to be welcomed by the industry, while the proposed lowering of the minimum spend for the HETR has the potential for further positive impacts on the UK’s production sector.
8.2 Sectoral Evolution A key element of the success of the UK’s creative sectors in recent years has been in international trade, where film and television – including HETV and animation – have both achieved significant success. With export intensities of 65% and 43% respectively, these industries outstrip the overall service economy in conducting their business on a worldwide scale. They have also achieved major success in attracting capital investment, and this will be expected to continue as more production spend is achieved.
All of the creative sectors offer significant additional value in advertising the UK to the outside world. The brand promotion values of the creative sectors in this study benefit the UK economy greatly, even if this is an element which is tricky to value. Culturally, film and TV are major components in how the UK presents itself to the outside world, a topic which will be explored in greater detail in the second report.
A further trend of particular interest to this study is the degree to which the sectors covered by the tax reliefs are increasingly growing into one another. This breaking down of silos is particularly pronounced in the film and HETV sectors, where casts, crew, and equipment are in many cases common from one production to another. Such commonality was undoubtedly of significance to the initial success of the HETR in the UK, in allowing the HETV sector to build on the strong foundations of UK film. Animation and games, together with the visual effects industry which supports much UK film and HETV, are also expected to see convergence over the coming years.
In aggregate, such further convergence and growth would be expected to support an improving employment position for the UK’s creative sector. Already, the industries covered in this study support a large number of workers – 61,500 FTEs directly, and 120,800 in total, including multiplier effects.
8.3 Spillover Effects Aside from brand promotion, as previously outlines, the UK’s creative tax relief sectors also offer significant benefits to the broader economy through the attraction of tourists and merchandising sales. Both of these elements are, by their nature, harder to grasp than the direct and indirect contributions of the sector but there are,

Economic Contribution of the UK’s Screen Sectors
© Olsberg•SPI and Nordicity 2015 February, 2015 74
nonetheless, of great significance to the UK’s economy. Altogether, these spillover effects generated an estimated 21,900 FTEs of employment in 2013, bringing the total employment impact of the screen sectors to 142,700 FTEs.
Table 31 Summary of spillover effects from the UK Screen Sector, 2013
Employment (FTEs)
GVA (£m)
Tax revenue (£m)
UK brand promotion 4,500 203.0 63.0 Merchandise sales 6,900 228.5 93.9 Tourism 10,500 499.9 115.0 Total 21,900 931.4 271.9
Source: Olsberg•SPI/Nordicity estimates
8.4 Overall Economic Contribution Bringing together all of the impacts noted, we can develop a single picture of the economic contribution of the sectors supported by Creative Sector Tax Reliefs:
Table 32 Summary of overall economic contribution of screen sectors in UK, 2013
Employment (FTEs)
GVA (£m)
Tax revenue (£m)
Film 39,800 1,437.0 431.1 HETV 8,300 381.5 114.4 Video Games 12,100 755.4 226.6 Animation 1,300 54.1 16.2 Total Direct Impact 61,500 2,628.1 788.4 Film 40,500 1,478.2 443.5 HETV 6,400 370.4 111.1 Video Games 11,500 665.8 199.7 Animation 900 44.9 13.5 Total multiplier effects 59,300 2,559.3 767.8 Total value chain impact 120,800 5,187.3 1,556.2 Spillover effects: Film (Brand) 4,500 203.0 63.0 UK brand promotion 4,500 203.0 63.0 Film (Merch) 4,100 148.0 69.0 Video Games (Merch) 300 8.5 2.6 Animation (Merch) 2,500 72.0 22.3 Merchandise sales 6,900 228.5 93.9 Film (Tourism) 8,400 400.0 92.0 HETV (Tourism) 2,100 99.9 23.0 Animation (Tourism) --* --* --* Tourism 10,500 499.9 115.0 Overall impact 142,700 6,118.7 1,828.1
Source: Olsberg•SPI/Nordicity estimates * Data not available

Economic Contribution of the UK’s Screen Sectors
© Olsberg•SPI and Nordicity 2015 February, 2015 I
9. Bibliography BFI (2013), ‘Statistical Yearbook 2013’: http://www.bfi.org.uk/sites/bfi.org.uk/files/downloads/bfi-statistical-yearbook-2013.pdf
BFI (2014), ‘Statistical Yearbook 2014’: http://www.bfi.org.uk/sites/bfi.org.uk/files/downloads/bfi-statistical-yearbook-2014.pdf
Deloitte and Oxford Economics (2013), ‘Tourism: jobs and growth, The economic contribution of the tourism economy in the UK’: http://www.visitbritain.org/Images/Final%20proof%2015%20Nov_tcm29-39296.pdf
Gaudiosi, John (12 February 2014), ‘Valve Software shoots for the living room with Steam Machines’: http://fortune.com/2014/02/12/valve-software-shoots-for-the-living-room-with-steam-machines/
Hamburger, Ellis (5 February 2014), ‘Indie smash hit 'Flappy Bird' racks up $50K per day in ad revenue’: http://www.theverge.com/2014/2/5/5383708/flappy-bird-revenue-50-k-per-day-dong-nguyen-interview
HM Revenue & Customs (15 July 2006), ‘Regulatory Impact Assessment for Reform of Film Tax Incentives’: http://webarchive.nationalarchives.gov.uk/20060715165822/http://www.hmrc.gov.uk/ria/ria-film-reform.pdf
HM Treasury (December 2012), ‘Autumn Statement 2012 policy costings’: https://www.gov.uk/government/uploads/system/uploads/attachment_data/file/221551/as2012_policy_costings.pdf
HM Revenue & Customs (August 2014), ‘Film Tax Relief Summary – August 2014’: http://www.hmrc.gov.uk/films/ftr-monitoring-summary.pdf
Mateos-Garcia, J., Bakhshi, H. and Lenel, M. (2014), A Map of the UK Games Industry, London: Nesta and Ukie. http://www.nesta.org.uk/sites/default/files/map_uk_games_industry_wv.pdf.
Mellor, Andrew (30 September 2011), ‘Paultons hits new heights with Peppa Pig World’: http://www.interpark.co.uk/feature/Paultons-hits-new-heights-with-Peppa-Pig-World/129-1-11-
MPAA (2013), ‘Theatrical Market Statistics 2012’: http://www.mpaa.org/wp-content/uploads/2014/03/2012-Theatrical-Market-Statistics-Report.pdf
Nordicity (July 2013), ‘The Economic Contribution of the Film and Television Sector in Canada’: www.nordicity.com/media/2013724dgfjbufnd.pdf
Ofcom (8 August 2013), ‘Public Service Broadcasting Annual Report 2013: C. PSB viewing’: http://stakeholders.ofcom.org.uk/binaries/broadcast/reviews-investigations/psb-review/psb2013/viewing.pdf
Economic Contribution of the UK’s Screen Sectors
© Olsberg•SPI and Nordicity 2015 February, 2015 II
ONS (2 August 2011), ‘Input-Output Analytical Tables, 2005 Edition’: http://www.ons.gov.uk/ons/rel/input-output/input-output-analytical-tables/2005/index.html
Optima / Cambridge Econometrics (May 2005), ‘Economic Impact of the UK Screen Industries’: http://www.bfi.org.uk/sites/bfi.org.uk/files/downloads/economic-impact-of-the-uk-screen-industries-2005-05-13.pdf
Oxford Economics (September 2012), ‘The Economic Impact of the UK Film Industry’: http://www.bfi.org.uk/sites/bfi.org.uk/files/downloads/bfi-economic-impact-of-the-uk-film-industry-2012-09-17.pdf
Tassi, Paul (30 June 2014), ‘Steam Reaches Record 8 Million Concurrent Users At The End Of Its Summer Sale’: http://www.forbes.com/sites/insertcoin/2014/06/30/steam-reaches-record-8-million-concurrent-users-at-the-end-of-its-summer-sale/
Their, Dave (13 May 2014), ‘Grand Theft Auto 5 Has Sold Nearly $2 Billion’: http://www.forbes.com/sites/davidthier/2014/05/13/grand-theft-auto-5-has-sold-nearly-2-billion-at-retail/
TIGA (10 June 2014), ‘The UK video game development sector is back on track’: http://www.tiga.org/news/the-uk-video-game-development-sector-is-back-on-track
Trefis Team (3 July 2014), ‘Activision Confident With Skylanders Franchise Despite Tough Competition’: http://www.forbes.com/sites/greatspeculations/2014/07/03/activision-confident-with-skylanders-franchise-despite-tough-competition/
Ukie and MCV (2014), ‘The games industry in numbers’: http://ukie.org.uk/content/games-industry-numbers
VisitBritain (September 2013), ‘Inbound tourism to Britain’s nations and regions: Profile of activities of international holiday visitors’: http://www.visitbritain.org/bounce.aspx?PG=/Images/Regional%20Activities%20report%20FINAL%20COMPRESSED_tcm29-38415.pdf
Warc (13 April 2013), ‘Global product placement spend rise’: http://www.warc.com/LatestNews/News/BRICs_drive_product_placement_growth_.news?ID=31278

Economic Contribution of the UK’s Screen Sectors
© Olsberg•SPI and Nordicity 2015 February, 2015 III
10. Appendix 1 – Economic Contribution Analysis Methodology
10.1 Film Employment and GVA in film post-production
In 2004, Olsberg•SPI conducted a survey of companies operating in the UK’s screen facilities sector. The results of this survey indicated that film sector clients accounted for 40% of VFX turnover, 10% of video post-production turnover and 25% of audio post-production turnover in the UK in 2008. When weighted by turnover in each screen facilities sub-segment, the implication is that film sector clients accounted for 26% of total turnover earned by VFX and post-production companies.
Table A - 1 Distribution of turnover in selected screen facilities sub-segments, 2008
Distribution of turnover
Estimated turnover (£000s)
Film TV Other* Total Film TV Other* Total Visual effects and graphics 40% 7% 53% 100% 150,544 26,345 199,471 376,360 Picture post-production 10% 66% 24% 100% 33,365 220,209 80,076 333,650 Audio post-production 25% 58% 17% 100% 39,498 91,634 26,858 157,990 Total -- -- -- -- 223,407 338,188 306,405 868,000 Share of revenue -- -- -- -- 26% 39% 35% 100% Source: Olsberg•SPI and TBR (2008), p. 79. * Includes production of commercials, corporate videos, games and video promos.
Given the strong growth in the UK’s film-VFX industry in recent years, we assumed that 50% of the growth in turnover in SIC 59.12 Motion picture, video and television programme post-production activities was due to film projects. This approach implies that film clients accounted for £535.1 million in turnover in 2012 out of total turnover of £1,587 million, or 34%.
Table A - 2 Estimate of share of post-production sector turnover earned from film clients
Turnover in SIC 59.12 (£m)
Growth in turnover, 2008-
2012 (£m)
Turnover earned from
film clients (£m)
Share of total turnover in
SIC59.12 2008 1,065 -- 274.1 26% 2012 1,587 522 535.1* 34% Source: Olsberg•SPI/Nordicity calculations based on data from Olsberg•SPI (2008) and Annual Business Survey. * Equals £274.1 + 50% × £522 million.
On the basis of this approach, the film sector accounted for 26% of total turnover, employment and GVA in SIC 59.12 Motion picture, video and television programme post-production activities in 2008 (and prior years). This share was assumed to increase by two percentage each year (2009-2012) until reaching a 34% share in 2012. This 34% share was also applied to 2013.

Economic Contribution of the UK’s Screen Sectors
© Olsberg•SPI and Nordicity 2015 February, 2015 IV
Table A - 3 Summary of share of turnover, employment and GVA in SIC 59.12 attributed to the film sector.
Year Film sector’s share of turnover, employment and GVA in SIC 59.12
2008 (and prior years) 26% 2009 28% 2010 30% 2011 32% 2012 34% 2013 34% Source: Olsberg•SPI/Nordicity calculations based on data from Olsberg•SPI (2008) and Annual Business Survey.
Export intensity
To calculate export intensity, annual export statistics were obtained from the International Trade in Services (ITIS) survey for the film, television and other services sectors; and from the ONS National Accounts for the UK economy.
Table A - 4 Exports by sector (£m)
2009 2010 2011 2012 2013 5-year total
Film 1,476 2,106 1,739 1,342 1,361 8,024 Television 1,480 1,705 1,508 1,721 1,463 7,877 Construction 746 840 983 1,205 1,575 5,349 Wholesale/Retail Trade 6,842 8,609 14,176 10,869 13,772 54,268 Transportation & Storage 1,051 791 915 1,010 1,147 4,914 Accommodation & Food Services 96 97 71 79
592 934
Information & Communication 19,448 21,204 21,799 24,220
25,312 111,983
Financial & Insurance Activities 10,992 11,670 13,238 14,664
17,926 68,490
Real Estate Activities 430 183 378 492 311 1,794 Professional, Scientific & Technical Activities 27,677 27,876 28,772 32,724 32,091 149,139 Administrative & Support Service Activities 3,409 4,147 3,717 5,928 7,670 24,872 Arts, Entertainment & Recreation & Other Service Activities 1,456 2,099 2,225 2,344 2,841 10,965
UK economy 402,17
1 447,26
9 492,884 495,284 506,470
2,344,078 Source: ITIS and ONS National Accounts (Output, Income and Expenditure).
GVA data for each film, television and each service sector was obtained from ABS. Total GDP for the UK economy was obtained from the ONS National Accounts.
Table A - 5 GVA by sector (£m)
2009 2010 2011 2012 2013 5-year total
Film sector 2,774 2,920 2,788 2,008 1,946 12,436 Television 1,636 3,496 5,121 4,179 3,767 18,199

Economic Contribution of the UK’s Screen Sectors
© Olsberg•SPI and Nordicity 2015 February, 2015 V
Construction 68,885 67,359 70,150 72,207 79,900 358,501 Wholesale/Retail Trade 149,315 153,019 151,202 144,077 153,384 750,997 Transportation & Storage 56,708 60,953 61,522 64,912 70,728 314,823 Accommodation & Food Services 29,375 31,435 34,826 37,778 38,096 171,510 Information & Communication 83,494 85,309 90,579 93,366 99,656 452,404 Financial & Insurance Activities 137,395 126,695 116,363 109,512 109,944 599,909 Real Estate Activities 25,720 28,242 28,935 32,289 36,789 151,975 Professional, Scientific & Technical Activities 105,093 104,765 113,416 119,127 129,404 571,805 Administrative & Support Service Activities 66,314 73,872 80,243 87,073 95,356 402,858 Arts, Entertainment & Recreation & Other Service Activities 30,284 27,978 29,373 30,763 37,955 156,353 UK economy (GDP)
1,280,261 1,327,923 1,360,925 1,376,731
1,422,089 6,767,929
Source: Annual Business Survey and ONS National Accounts (Output, Income and Expenditure).
The four-year sum of exports (2009-2013) was then expressed as a percentage of the four-year sum of GVA (at current prices) for the same period to derive estimates of the export intensity of each sector and the overall UK economy. For the film sector, the GVA for the entire film sector was used rather than just the GVA for the core UK film sector.
Table A - 6 Export intensity, 2009-2012
Exports (2009-2013)
GVA (2009-2013)
Export intensity**
Film sector* 8,024 12,436 0.65 Television 7,877 18,199 0.43 Construction 5,349 358,501 0.01 Wholesale/Retail Trade 54,268 750,997 0.07 Transportation & Storage 4,914 314,823 0.02 Accommodation & Food Services 934 171,510 0.01 Information & Communication 111,983 452,404 0.25 Financial & Insurance Activities 68,490 599,909 0.11 Real Estate Activities 1,794 151,975 0.01 Professional, Scientific & Technical Activities 149,139 571,805 0.25 Administrative & Support Service Activities 24,872 402,858 0.06

Economic Contribution of the UK’s Screen Sectors
© Olsberg•SPI and Nordicity 2015 February, 2015 VI
Arts, Entertainment & Recreation & Other Service Activities 10,965 156,353 0.07 UK economy 2,344,078 6,767,929 0.35 Source: Olsberg•SPI/Nordicity calculations based on data from Annual Business Survey, ITIS and ONS National Accounts (Output, Income and Expenditure). * Includes GVA for entire film sector as opposed to only core film sector ** Equals: exports ÷ GVA
10.2 High-End TV Summary of Attentional/Ubiquity Methodology
The BFI supplied Attentional/Ubiquity with a list of HETV programmes that received tax relief during the 2013-14 fiscal year. One title, Game of Thrones, was removed from the list, since it aired in 2014.
The revenues for commercial broadcasters were derived on the basis of all commercial impacts in the going in, centre and end breaks of programmes that aired in the UK in 2013. A single commercial impact is defined as one viewer watching a single advertisement once. All audience data was against ABC1 Adults, which would be the most appropriate for HETV drama programming from a trading perspective. (Note that audiences for commercial advertisements are always lower than the average programme audience because of viewing on record and fast-forwarding through the ad breaks. Advertises played at anything other than normal pace are not counted by BARB and the ratio is very different by programme.)
These commercial impacts were then multiplied by the relevant monthly/station prices to generate estimates of advertising revenue. In some cases premium prices were applied, as this is a common practice for the highly popular programmes such as Downton Abbey.
To gain equivalent figures for BBC channels, values have been assigned based on the ratio of commercial impacts to audience of equivalent programmes on commercial broadcasters. For example, Downton Abbey (airing on ITV) was used as a model for Call the Midwife airing on BBC1). All advertising revenue estimates are net advertising (i.e. exclude sales commissions) and are to be used as a guide to actual advertising revenue earned by commercial broadcasters; they should not be taken as actual revenue figures per title.
Economic share of HETV on video platforms
Statistics published by the BFI indicate that fiction genres accounted for 79% of sales on the film side of DVD/Blu-ray market, and 84% of rentals. We took these genre shares to represent HETV’s share of the total market for television programming on DVD/Blu-ray media. This is a reasonable assumption, given that high-end drama content has been one of the primary drivers of viewers’ use of DVD/Blu-ray to consume television programming. In contrast, television genres such as factual/documentary, which account for significant shares of viewing on broadcast television, account for a much lower proportion of viewing in the DVD/Blu-ray market. For example, although factual programming (i.e. documentaries) accounted for 22% of all peak-time viewing on PSBs in 2012, the documentary genre only accounted for only 0.7% of DVD/Blu-ray sales in 2012.74
To account for UK programming’s share of revenue in the DVD/Blu-ray markets, we compared HETV’s revenue share (2.6%) to the combined viewing share to the drama and soaps, and entertainment and comedy (36%). This suggests that HETV
74 Ofcom (2013), Public Service Broadcasting Annual Report 2013: PSB Viewing p. 49; BFI (2013), Statistical Yearbook 2013, p. 136

Economic Contribution of the UK’s Screen Sectors
© Olsberg•SPI and Nordicity 2015 February, 2015 VII
programming would account for approximately 7% of total sales and rentals in the DVD/Blu-ray sales and rentals market. From this, we derived an estimate that HETV accounts for 5.5% of revenue in the DVD/Blu-ray sales market and 5.9% in the DVD/Blu-ray rental market.
Table A - 7 Derivation of economic share of HETV for DVD/Blu-ray sales and rentals
HETV genre’s share of total sales/rentals
HETV share of viewing in HETV genres
Economic share
DVD/Blu-ray sales
79% × 7% = 5.5%
DVD/Blu-ray rentals
84% × 7% = 5.9%
Sources: Olsberg•SPI/Nordicity estimates based on data from BF, BVA and Ofcom.
10.3 Video Games We obtained company-level financial and operating data from Companies House, Dun&Bradstreet and Creative Skillset for companies operating in the video games sector SIC codes identified by DCMS:
• 58.21/0 Publishing of computer games (“publishing”); and
• 62.01/1 Ready-made interactive leisure and entertainment software development (“development”).
In collaboration with Ukie, we identified large companies operating in the video games sector that had not reported within these SICs.
Using this combined data set, we tabulated the number firms, turnover and employment, and prepared estimates of GVA.
Table A - 8 Combined dataset for video games sector SICs
Number of firms
Turnover (£m)
Employment GVA (£m)
58.21/0 Publishing 143 667.7 2,240 147.7 62.01/1 Development 1,441 3,114.4 14,350 1,058.6 Total 1,584 3,782.1 16,600 1,206.3 Source: Olsberg•SPI/Nordicity, TBR, Ukie, Companies House, Dun&Bradstreet.
Several of the largest video games console and publishing companies in the UK (i.e. Sony Computer Entertainment, Microsoft, Warner Brothers and Disney also have significant operations outside of the video games industry. Because Companies House and other data sources do not typically provide data at a line-of-business level, our combined dataset included the turnover, employment and GVA for these companies’ entire operations.
In collaboration with Ukie, we surveyed these four large companies to ascertain the portions of their respective workforces employed in the video games sector roles. We removed their non-video-games employees (i.e. 3,333 employees) from the dataset and then used each company’s average turnover per employee and GVA per

Economic Contribution of the UK’s Screen Sectors
© Olsberg•SPI and Nordicity 2015 February, 2015 VIII
employee to scale down our estimates of each company’s turnover and GVA. The result of this adjustment process is summarised in Table A -‐ 9.75
Table A - 9 Adjusted dataset for video games sector SICs
Number of firms
Turnover (£m)
Employment GVA (£m)
5821/0 Publishing 143 437.6 1,780 99.9 6201/1 Development 1,441 2,335.3 11,487 750.0 Total 1,584 2,772.8 13,267 849.9 Source: Olsberg•SPI/Nordicity, TBR, Ukie, Companies House, Dun&Bradstreet.
Given the lack certainty related to classification of the companies between the two video games SIC codes, and given that many companies operate in both segments of the value chain sought to incorporate the results of the annual survey conducted by GIC of the UK’s video games development sector. We took the results of the GIC survey (i.e. 9,900 workers) to represent the best estimates of employment in video games development (i.e. creative employment). We took the residual amount of employment as the best estimate of the employment in publishing and other non-creative roles in the UK video games sector (i.e. non-creative employment).
Employment data from BRES indicates that approximately 10% of employees in the video games development sector were employed on a part-time basis in 2013; in the video games publishing sector, the share was 18%. These shares imply that 9,900 workers in video games development would be equivalent to 9,400 FTEs, and that 3,400 workers in publishing would be equivalent to 3,100 FTEs.
Table A - 10 Calculation of employment in video games, development and publishing/administration
Number of workers
FTEs
Development (i.e. creative employment) 9,900 9,400 Publishing and administration (non-creative employment) 3,400 3,100 Total 13,300* 12,500 Source: Olsberg•SPI/Nordicity, GIC, TBR, Ukie, Companies House, Dun&Bradstreet. * The total number of workers of 13,267 has been rounded up to 13,300, in order to be consistent with the reporting of employment data in the rest of the study.
We used the average GVA per FTE for the overall video games sector (£67,992 per FTE) to re-estimate the direct GVA in the development segment.76 This resulted in an estimate of direct GVA of £639.1 million in the UK video games development segment in 2013. The residual GVA of £210.9 million was applied to the publishing and administration segment.
75 Note that in our combined dataset, three of the four large companies had been classified to SIC 6201/1 Development, whilst only one company had been classified to SIC 5821/0 Publishing. As a result, this adjustment process led to scaled-down estimates in both SICs. 76 £849.9 million ÷ 12,500 FTEs = £67,992

Economic Contribution of the UK’s Screen Sectors
© Olsberg•SPI and Nordicity 2015 February, 2015 IX
Table A - 11 Re-estimate of GVA in development and publishing/administration segments of the video games sector
Employment (FTEs)
Average GVA per worker
(£)
GVA (£m)
Development 9,400 67,992 639.1 Publishing and administration 3,100 -- 210.9 Total 12,500 -- 849.9 Source: Olsberg•SPI/Nordicity, TBR, Ukie, Companies House, Dun&Bradstreet. Note: totals may not sum due to rounding.
In accordance with our value chain approach, we also sought to estimate the employment and GVA generated by the consumption of video games content – through both physical sales and digital distribution platforms.
We obtained data published by Ukie on the total value of video games retail market in the UK. To avoid double-counting with the revenue of upstream companies (i.e. publishers and developers) and in accordance with standard practices of economic impact analysis, we sought to isolate the retail margin generated by the sales in each of the three major sales channels: physical, digital and online, and mobile.
Our review of the annual report for Game pointed to a retail margin of 30%. We applied this retail margin to physical retail and second-hand sales, as well as points cards sales. Fmor the digital/online platform, we also used a retail margin of 35%, which is the midpoint of 30% to 40% margin that digital platforms are believed to earn.77 In the mobile channel, we have used a 30% margin, which corresponds with Apple iOS standard practices. Based on these assumptions, we conclude that £2.5 billion in consumer spending on video games in 2013 generated a total retail margin of £782.9 million.
Table A - 12 Calculation of retail margin in video game sales in the UK, 2013
Consumer spending
(£m)
Retail margin
% £m Physical retail (original, second-hand, points cards) 1,224.0 30% 367.2 Digital and online 819.0 35% 286.7 Mobile 430.0 30% 129.0 Total 2,473.0 -- 782.9 Source: Olsberg•SPI/Nordicity, Ukie, MCV, Game Digital plc.
With these estimates of the retail margin for each platform, we were able to prepare a breakdown of the revenue flow in the video games value chain.
77 Ben Parfitt (2010), “OPINION: Retail vs Steam,” MCV, 26 November 2010, accessed at http://www.mcvuk.com/news/read/opinion-retail-vs-steam

Economic Contribution of the UK’s Screen Sectors
© Olsberg•SPI and Nordicity 2015 February, 2015 X
Table A - 13 Breakdown of consumer revenue in UK video games market (£m)
Physical (boxed
software)1
Digital and online
Mobile Total
Sales / Consumer spending 1,224.0 819.0 430.0 2,473.0 Retail/Platform margin 367.2 286.7 129.0 782.9 Publisher/Developer revenue base 856.8 532.4 301.0 1,690.2 Source: Olsberg•SPI/Nordicity, Ukie, MCV and Gfk. Notes: 1. Includes sales of original and second-hand software.
We used the wage ratio and average full-time salary published by ONS for the retail industry to estimate the number of FTEs generated by the retail margin in the physical sales segment. We used the GVA ratio published by ONS to estimate the GVA. A similar approach was used to estimate FTEs and GVA in the digital and online, and mobile segments; however, the wage and GVA ratios were drawn from the computer services industry line in the ONS input-output tables. The average full-time salary was obtained from SIC 58.2 Software publishing.
Table A - 14 Estimate of employment generated by the retail sales of video games (all platforms)
Retail margin
(£m)
Wage ratio Total wage bill
(£m)
Average full-time
salary (£)1
FTEs
Physical 367.2 0.342 123.7 20,4834 6,000 Digital and online 286.7 0.433 123.3 42,6105 2,900 Mobile 129.0 0.433 55.5 42,6105 1,300 Total 782.9 -- 302.5 -- 10,200 Source: Olsberg•SPI/Nordicity, ONS, Ukie, MCV and Gfk. Notes: 1. Salary data are from 2012 and have been adjusted by CPI to apply to 2013. 2. Retail industry 3. Computer services industry 4. SIC 47.83 Retail sale of music and video recordings in specialised stores 5. SIC 58.2 Software publishing
Table A - 15 Estimate of GVA generated by the retail sales of video games (all platforms)
Retail margin (£m)
GVA ratio Total GVA (£m)
Physical 367.2 0.4801 176.8 Digital and online 286.7 0.6152 176.3 Mobile 129.0 0.6152 79.3 Total 782.9 -- 432.4 Source: Olsberg•SPI/Nordicity, ONS, Ukie, MCV and Gfk. Notes: 1. Retail industry 2. Computer services industry
With the estimates for the retail segment, we were able to estimate the total direct economic contribution of the video games sector value chain – from development through publishing and administration to retail (Table A -‐ 16).
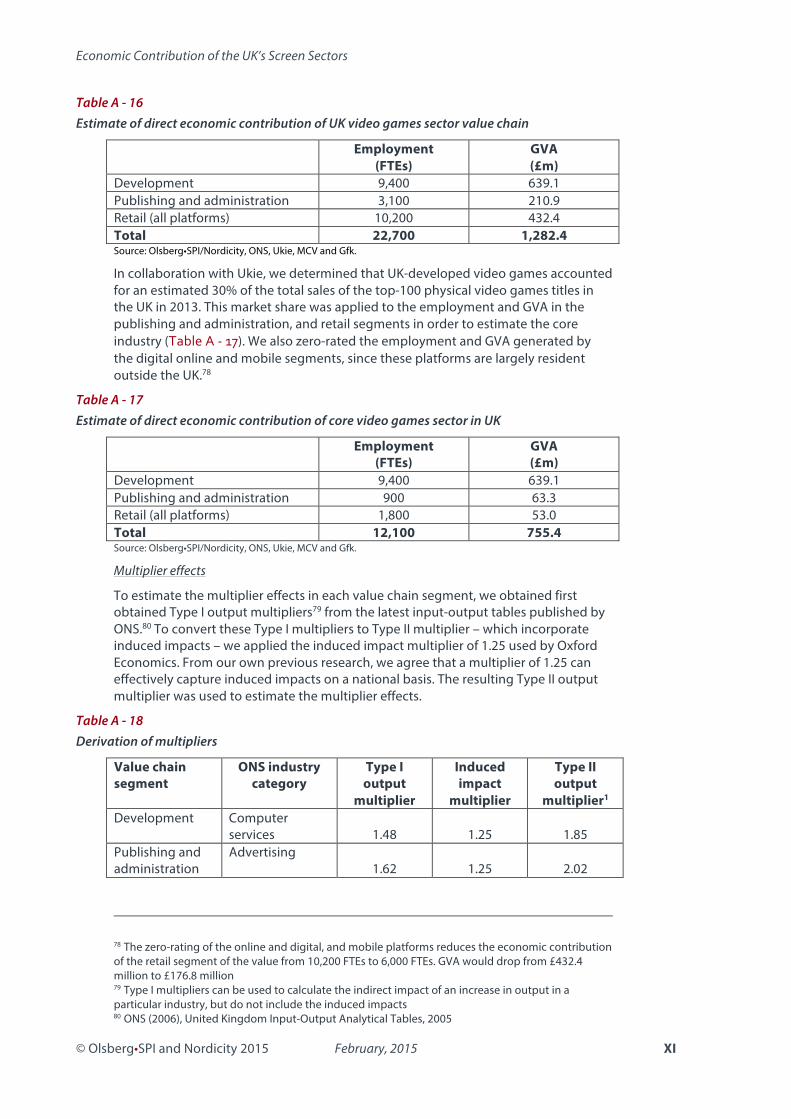
Economic Contribution of the UK’s Screen Sectors
© Olsberg•SPI and Nordicity 2015 February, 2015 XI
Table A - 16 Estimate of direct economic contribution of UK video games sector value chain
Employment (FTEs)
GVA (£m)
Development 9,400 639.1 Publishing and administration 3,100 210.9 Retail (all platforms) 10,200 432.4 Total 22,700 1,282.4 Source: Olsberg•SPI/Nordicity, ONS, Ukie, MCV and Gfk.
In collaboration with Ukie, we determined that UK-developed video games accounted for an estimated 30% of the total sales of the top-100 physical video games titles in the UK in 2013. This market share was applied to the employment and GVA in the publishing and administration, and retail segments in order to estimate the core industry (Table A -‐ 17). We also zero-rated the employment and GVA generated by the digital online and mobile segments, since these platforms are largely resident outside the UK.78
Table A - 17 Estimate of direct economic contribution of core video games sector in UK
Employment (FTEs)
GVA (£m)
Development 9,400 639.1 Publishing and administration 900 63.3 Retail (all platforms) 1,800 53.0 Total 12,100 755.4 Source: Olsberg•SPI/Nordicity, ONS, Ukie, MCV and Gfk.
Multiplier effects
To estimate the multiplier effects in each value chain segment, we obtained first obtained Type I output multipliers79 from the latest input-output tables published by ONS.80 To convert these Type I multipliers to Type II multiplier – which incorporate induced impacts – we applied the induced impact multiplier of 1.25 used by Oxford Economics. From our own previous research, we agree that a multiplier of 1.25 can effectively capture induced impacts on a national basis. The resulting Type II output multiplier was used to estimate the multiplier effects.
Table A - 18 Derivation of multipliers
Value chain segment
ONS industry category
Type I output
multiplier
Induced impact
multiplier
Type II output
multiplier1 Development Computer
services 1.48 1.25 1.85 Publishing and administration
Advertising 1.62 1.25 2.02
78 The zero-rating of the online and digital, and mobile platforms reduces the economic contribution of the retail segment of the value from 10,200 FTEs to 6,000 FTEs. GVA would drop from £432.4 million to £176.8 million 79 Type I multipliers can be used to calculate the indirect impact of an increase in output in a particular industry, but do not include the induced impacts 80 ONS (2006), United Kingdom Input-Output Analytical Tables, 2005

Economic Contribution of the UK’s Screen Sectors
© Olsberg•SPI and Nordicity 2015 February, 2015 XII
Retail (all platforms)
Retail distribution 1.64 1.25 2.05
Source: Olsberg•SPI/Nordicity and ONS. Notes: 1. Equals: Type I output multiplier × Induced impact multiplier
We applied the Type II output multipliers to our estimates of direct GVA in each value chain segment to estimate the multiplier-effects and total GVA impacts.
Table A - 19 Estimate of total and multiplier effects GVA
Direct GVA (£m)
Type II output
multiplier
Multiplier-effects
GVA (£m)1
Total GVA impact (£m)2
Development 639.1 1.85 545.5 1,184.6 Publishing and administration 63.3 2.02 64.8 128.1 Retail (all platforms) 53.0 2.05 55.5 108.5 Total 755.4 -- 665.8 1,421.2 Source: Olsberg•SPI/Nordicity and ONS. Notes: 1. Equals: Total GVA − direct GVA 2. Equals: Direct GVA × Type II output multiplier We applied the overall wage-to-GVA ratio of 0.54 for the overall economy to estimate the multiplier-effects wages, and then used an economy-wide average full-time salary of £31,382 to estimate the number of multiplier-effects FTEs.
Table A - 20 Estimate of total and multiplier effects employment
Multiplier-effects
GVA (£m)
Wage-to-GVA
ratio
Multiplier-effects wages (£m)1
Average full-time salary (£)
Multiplier-effects
employment (FTEs)2
Development 545.5 0.54 294.5 31,382 9,400 Publishing and administration 64.8 0.54 35.0 31,382 1,100 Retail (all platforms) 55.5 0.54 30.0 31,382 1,000 Total 665.8 -- 359.5 -- 11,500 Source: Olsberg•SPI/Nordicity and ONS. Notes: 1. Equals: Multiplier effects GVA × Wage-to-GVA ratio 2. Equals: Multiplier effects wages ÷ Average full-time salary
We sum the estimates of the direct and multiplier effects to arrive at estimates of the total economic contribution in each value chain segment and the overall core video games sector (Table A -‐ 21).
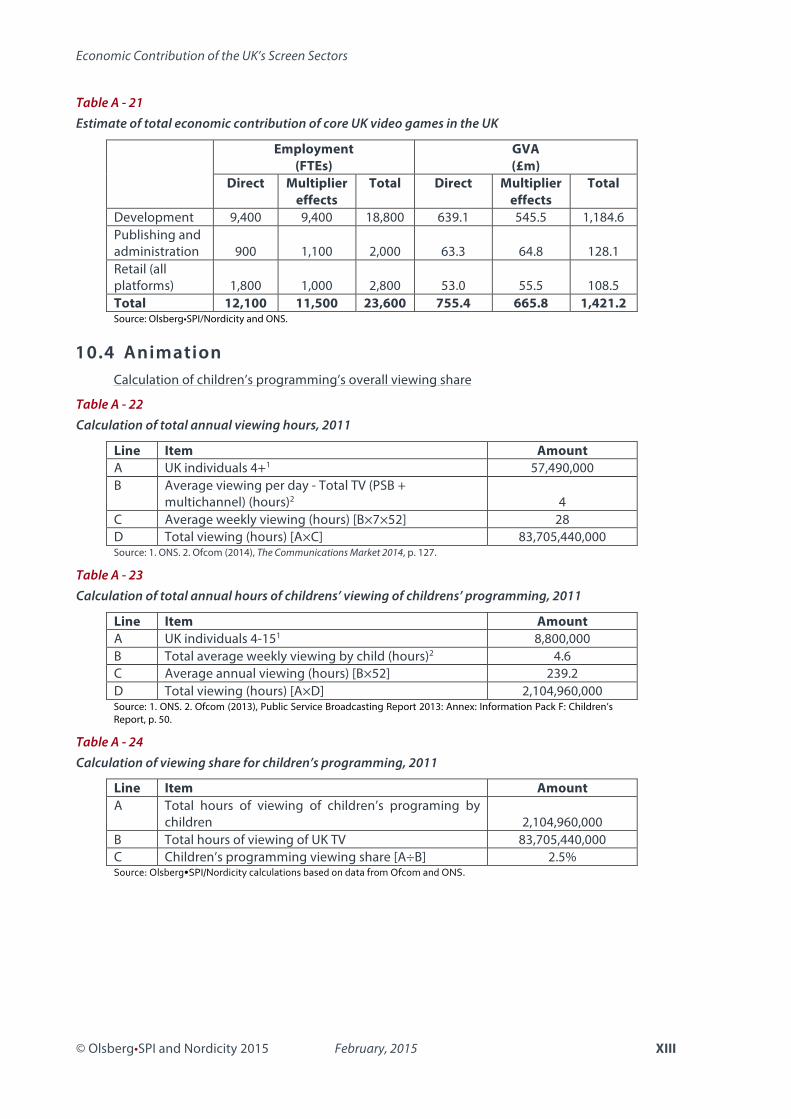
Economic Contribution of the UK’s Screen Sectors
© Olsberg•SPI and Nordicity 2015 February, 2015 XIII
Table A - 21 Estimate of total economic contribution of core UK video games in the UK
Employment (FTEs)
GVA (£m)
Direct Multiplier effects
Total Direct Multiplier effects
Total
Development 9,400 9,400 18,800 639.1 545.5 1,184.6 Publishing and administration 900 1,100 2,000 63.3 64.8 128.1 Retail (all platforms) 1,800 1,000 2,800 53.0 55.5 108.5 Total 12,100 11,500 23,600 755.4 665.8 1,421.2 Source: Olsberg•SPI/Nordicity and ONS.
10.4 Animation Calculation of children’s programming’s overall viewing share
Table A - 22 Calculation of total annual viewing hours, 2011
Line Item Amount A UK individuals 4+1 57,490,000 B Average viewing per day - Total TV (PSB +
multichannel) (hours)2 4 C Average weekly viewing (hours) [B×7×52] 28 D Total viewing (hours) [A×C] 83,705,440,000 Source: 1. ONS. 2. Ofcom (2014), The Communications Market 2014, p. 127.
Table A - 23 Calculation of total annual hours of childrens’ viewing of childrens’ programming, 2011
Line Item Amount A UK individuals 4-151 8,800,000 B Total average weekly viewing by child (hours)2 4.6 C Average annual viewing (hours) [B×52] 239.2 D Total viewing (hours) [A×D] 2,104,960,000 Source: 1. ONS. 2. Ofcom (2013), Public Service Broadcasting Report 2013: Annex: Information Pack F: Children’s Report, p. 50.
Table A - 24 Calculation of viewing share for children’s programming, 2011
Line Item Amount A Total hours of viewing of children’s programing by
children 2,104,960,000 B Total hours of viewing of UK TV 83,705,440,000 C Children’s programming viewing share [A÷B] 2.5% Source: Olsberg•SPI/Nordicity calculations based on data from Ofcom and ONS.

Economic Contribution of the UK’s Screen Sectors
© Olsberg•SPI and Nordicity 2015 February, 2015 XIV
Derivation of economic share of UK animation programming for video platforms
Table A - 25 Derivation of economic share of UK animation programming for video platforms
Share of children’s viewing to children’s
programming1
Share of children’s viewing accounted for
by UK animation2
Economic
share
DVD/Blu-ray sales
9.8% × 12.2% = 1.2%
DVD/Blu-ray rentals
11.2% × 12.2% = 1.4%
VoD 10% × 12.2% = 1.2%
Sources: BFI (2014), pp. 125 and 129, and Olsberg•SPI/Nordicity estimates
Table A - 26 Derivation of output multiplier for animation production
Row Item Television Animation Programmes
A Raw Type II multiplier 2.00 2.00 B Induced impact multiplier 1.25 1.25 C Implied Type I multiplier1 1.60 1.60 D Direct wages’ share of production
expenditures 0.58 0.70 E Supplies and services’ share of production
expenditures 0.42 0.30 F Adjustment factor2 -- 0.71 G Adjusted Type I multiplier3 -- 1.43 H Adjusted Type II multiplier4 -- 1.79 Source: Olsberg•SPI/Nordicity, ONS and Oxford Economics. Notes: 1. Equals: A ÷ B 2. Equals: Supplies and services’ share (Animation) ÷ Supplies and services’ share (Television) 3. Equals: ((C-1) × F) + 1 4. Equals: G × B
Table A - 27 Multiplier effects and total value chain impact of animation programming, by value chain segment, 2013
Employment (FTEs) GVA (£m) Direct Multiplier
effects Total Direct Multiplier
effects Total
Production 1,100 600 1,700 41.4 32.5 73.9 Broadcast 100 200 300 12.3 11.9 24.2 Other consumer platforms 100 100 200 0.4 0.4 0.9 Total 1,300 900 2,200 54.1 44.9 99.1 Source: Olsberg•SPI/Nordicity, ONS and Oxford Economics.

Economic Contribution of the UK’s Screen Sectors
© Olsberg•SPI and Nordicity 2015 February, 2015 XV
10.5 Tourism Methodology The 2012 study concluded that film-induced tourism generated £2.1 billion in additional tourism spending for the UK in 2011, or 12% of total spending by overseas visitors (i.e. inward tourism spending) of £17.9 billion.81 This estimate and its associated share of total inward tourism spending was ultimately based on research conducted for the economic contribution studies in 2005, 2007 and 2010.
Amongst this research was a survey by VisitBritain in 2004, which found that 20% of visitors to the UK came as a result of seeing a film or television programme.82 The 2005 study also made reference to case-study research of the tourism stimulated by Braveheart and Rob Roy, which suggested that inward tourism spending could be expected to be eight times the UK box office for a film.83 On that basis of that ratio, the 2005 study concluded that film-induced inward tourism spending was £1.6 billion in 2004, or 12% of total inward tourism spending of £13 billion in that year.84
As noted in Section 4.5.1, more recent survey research conducted by VisitBritain in 2013 indicates that 3% of overseas tourists visited locations associated with film or literature between 2006 and 2011.85 While VisitBritain does not provide a breakdown of film locations vs. literature locations, this new survey research does place an upper limit of 3% on the attributable share inward tourism spending – significantly lower than the 12% share implied by VisitBritain’s 2004 study and the case studies of Braveheart and Rob Roy.
The methodology for estimating film-induced tourism spending in this study is based on VisitBritain’s new survey research. In particular, the new methodology assumes that film accounts for two-thirds of total inward tourists’ visits to locations, or 2% of total inward visitors’ visits between 2006 and 2011. As noted in Section 4.5.1, this 2% rate has been adjusted upward to 4% to account for the fact that recent survey research conducted by Olsberg•SPI indicates that for every tourist that visits a screen location two others are partially influenced by film to visit the UK.
81 Oxford Economics (2012), pp. 71-72 82 Oxford Economic Forecasting (2005), The Economic Contribution of the UK Film Industry, pp. 35-36 83 ibid 84 ibid 85 VisitBritain (2013), Inbound tourism to Britain’s nations and regions: Profile of activities of international holiday visitors, p. 8.

© Olsberg•SPI and Nordicity 2015 February, 2015 XVI
10.6 Aggregate Statistics Table A - 1 Aggregate economic contribution statistics
Impacts Film HETV Film +
HETV
Animation Film + HETV
+ Animation
Video Games
All screen sectors
GVA (£m)
Direct 1,437.0 381.5 1,818.5 54.1 1,872.7 755.4 2,628.1 Multiplier 1,478.2 370.4 1,848.6 44.9 1,893.5 665.8 2,559.3
Value Chain 2,915.3 751.9 3,667.1 99.1 3,766.2 1,421.2 5,187.3 Spillover 751.0 99.9 850.9 72.0 922.9 8.5 931.4
Total 3,666.3 851.7 4,518.0 171.1 4,689.0 1,429.7 6,118.7
Employment (FTEs)
Direct 39,800 8,300 48,100 1,300 49,400 12,100 61,500 Multiplier 40,500 6,400 46,900 900 47,800 11,500 59,300
Value Chain 80,300 14,700 95,000 2,200 97,200 23,600 120,800 Spillover 17,000 2,100 19,100 2,500 21,600 300 21,900
Total 97,300 16,800 114,100 4,700 118,800 23,900 142,700
Tax Revenue
(£m)
Direct 431.1 114.4 545.6 16.2 561.8 226.6 788.4 Multiplier 443.5 111.1 554.6 13.5 568.0 199.7 767.8
Value Chain 874.6 225.6 1,100.1 29.7 1,129.8 426.4 1,556.2 Spillover 224.0 23.0 247.0 22.3 269.3 2.6 271.9
Total 1,098.6 248.5 1,347.1 52.0 1,399.1 429.0 1,828.1
Return on investment
£GVA per £ tax relief 12.49 8.31 11.13 1.06 10.72 --* --* £ tax revenue per £ tax relief 3.74 2.48 3.33 0.32 3.21 --* --*
Source: Olsberg•SPI/Nordicity estimates. * Calculations of return on investment are not available since tax relief data was not available for the video games sector at the time of writing. Note: Some totals may not sum due to rounding.

© Olsberg•SPI and Nordicity 2015 February, 2015 XVII
11. Appendix 2 – Lists of Tables and Figures 11.1 List of Tables Table 1 Summary of channels of economic impact ................................................................................. 14 Table 2 Selected capital investments in film studio facilities in the UK since 2007 ...................... 32 Table 3 Derivation of multipliers for film sector value chain segments ............................................ 33 Table 4 Summary of multiplier effects and total value chain impact, core UK film sector, 2013 .................................................................................................................................... 34 Table 5 Summary of overall economic contribution of core UK film sector, 2013 ........................ 40 Table 6 Calculation of share of broadcast TV revenue attributable to HETV, 2013 ...................... 44 Table 7 Estimated revenue attributable to HETV, DVD/Blu-ray sales and rentals market, 2013 ........................................................................................................................................................... 46 Table 8 Estimated VoD revenue attributable to HETV, 2013 ................................................................. 46 Table 9 Estimated attributable revenue, net margin and direct economic impact of HETV on other consumer platforms, 2013 .............................................................................................. 47 Table 10 Summary of direct economic impact of HETV sector, 2013 ................................................ 47 Table 11 Summary of multipliers for HETV value chain sub-sectors ................................................... 48 Table 12 Summary of total economic contribution of HETV, 2013 ..................................................... 48 Table 13 Summary of overall economic contribution of HETV in UK, 2013 ..................................... 51 Table 14 Direct economic contribution of video games development segment ......................... 55 Table 15 Direct economic contribution of video game publishing segment, 2013 ..................... 56 Table 16 Economic contribution of consumption of video games in the UK, 2013 ..................... 59 Table 17 Summary of direct economic impact of core UK video game sector value chain, 2013 .................................................................................................................................................. 59 Table 18 Derivation of multipliers for video game sector value chain segments ......................... 60 Table 19 Summary of total value chain impact of the core UK video games sector, 2013 ........ 60 Table 20 Economic contribution of licensed merchandise sales in the UK associated with UK-made video games, 2013 ............................................................................................................................ 61 Table 21 Summary of overall economic contribution of the core UK video games sector, 2013 ............................................................................................................................................................. 61 Table 22 Derivation of economic share of UK animation programming on broadcast television .................................................................................................................................................................. 65 Table 23 Calculation of economic activity in UK broadcast industry attributable to animation programing ........................................................................................................................................ 66 Table 24 Estimated attributable turnover and direct economic impact of animation programmes on video platforms .................................................................................................................... 66 Table 25 Summary of direct economic impact of UK animation programme sector, 2013 ............................................................................................................................................................. 67 Table 26 Summary of multipliers for animation programme value chain sub-sectors ............... 67 Table 27 Summary of total value chain impact of animation programmes, 2013 ........................ 68 Table 28 Summary of overall economic contribution of animation programmes in the UK, 2013 ....................................................................................................................................................... 71 Table 29 Summary of total value chain impact of screen sectors subject to tax relief in 2013-14* ................................................................................................................................................................... 72 Table 30 Summary of total value chain impact of video game sector, 2013 ................................... 73 Table 31 - Summary of spillover effects from the UK Screen Sector, 2013 ....................................... 74 Table 32 Summary of overall economic contribution of screen sectors in UK, 2013 ................... 74

© Olsberg•SPI and Nordicity 2015 February, 2015 XVIII
Table A -‐ 1 Distribution of turnover in selected screen facilities sub-segments, 2008 ................. III Table A -‐ 2 Estimate of share of post-production sector turnover earned from film clients ...... III Table A -‐ 3 Summary of share of turnover, employment and GVA in SIC 59.12 attributed to the film sector. ................................................................................................................................................... IV Table A -‐ 4 Exports by sector (£m) ................................................................................................................... IV Table A -‐ 5 GVA by sector (£m) .......................................................................................................................... IV Table A -‐ 6 Export intensity, 2009-2012 .......................................................................................................... V Table A -‐ 7 Derivation of economic share of HETV for DVD/Blu-ray sales and rentals ................. VII Table A -‐ 8 Combined dataset for video games sector SICs .................................................................. VII Table A -‐ 9 Adjusted dataset for video games sector SICs ................................................................... VIII Table A -‐ 10 Calculation of employment in video games, development and publishing/administration ............................................................................................................................... VIII Table A -‐ 11 Re-estimate of GVA in development and publishing/administration segments of the video games sector .............................................................................................................. IX Table A -‐ 12 Calculation of retail margin in video game sales in the UK, 2013 ................................ IX Table A -‐ 13 Breakdown of consumer revenue in UK video games market (£m) ............................. X Table A -‐ 14 Estimate of employment generated by the retail sales of video games (all platforms) ........................................................................................................................................................... X Table A -‐ 15 Estimate of GVA generated by the retail sales of video games (all platforms) ........ X Table A -‐ 16 Estimate of direct economic contribution of UK video games sector value chain ............................................................................................................................................................... XI Table A -‐ 17 Estimate of direct economic contribution of core video games sector in UK ......... XI Table A -‐ 18 Derivation of multipliers ............................................................................................................. XI Table A -‐ 19 Estimate of total and multiplier effects GVA ..................................................................... XII Table A -‐ 20 Estimate of total and multiplier effects employment .................................................... XII Table A -‐ 21 Estimate of total economic contribution of core UK video games in the UK ....... XIII Table A -‐ 22 Calculation of total annual viewing hours, 2011 ............................................................ XIII Table A -‐ 23 Calculation of total annual hours of childrens’ viewing of childrens’ programming, 2011 ........................................................................................................................................... XIII Table A -‐ 24 Calculation of viewing share for children’s programming, 2011 .............................. XIII Table A -‐ 25 Derivation of economic share of UK animation programming for video platforms ................................................................................................................................................................ XIV Table A -‐ 26 Derivation of output multiplier for animation production ......................................... XIV Table A -‐ 27 Multiplier effects and total value chain impact of animation programming, by value chain segment, 2013 ........................................................................................................................ XIV Table A -‐ 28 Aggregate economic contribution statistics .................................................................... XVI
11.2 List of Figures Figure 1 Total Economic Contribution of the Core UK Film Sector ....................................................... 5 Figure 2 Total Economic Contribution of the Core UK HETV Sector ..................................................... 6 Figure 3 Total Economic Contribution of the UK-made Video Game Sector ..................................... 8 Figure 4 Total Economic Contribution of the UK Animation Programme Sector ............................ 9 Figure 5 Framework for economic impact analysis (film sector example) ....................................... 16 Figure 6 Film sector value chain ...................................................................................................................... 17 Figure 7 Expenditures on film production in the UK ................................................................................ 18 Figure 8 Expenditures on film production in the UK, three-year moving average ....................... 19 Figure 9 Employment in film production ..................................................................................................... 21 Figure 10 Regional distribution of employment in film production (FTEs), 2013 .......................... 21 Figure 11 Direct GVA generated in film production ................................................................................. 22

© Olsberg•SPI and Nordicity 2015 February, 2015 XIX
Figure 12 Share of UK box office held by UK-made films ....................................................................... 23 Figure 13 Direct employment and GVA generated by distribution of UK-made films ................. 24 Figure 14 Cinema box office and admissions in the UK .......................................................................... 25 Figure 15 Core UK employment and GVA in the exhibition sub-sector ............................................ 25 Figure 16 Revenue associated with films viewed on video platforms in the UK ........................... 26 Figure 17 Direct employment and GVA generated by viewing of UK-made films on other consumer platforms .......................................................................................................................... 27 Figure 18 Direct employment impact of core UK film sector ................................................................ 28 Figure 19 Direct employment in core UK film sector, employees vs. self-employed ................... 29 Figure 20 Direct GVA generated by the core UK film sector ................................................................. 29 Figure 21 Employment growth, 2009-2013 ................................................................................................. 30 Figure 22 Trade in UK film sector ..................................................................................................................... 31 Figure 23 Export intensity, 2009 to 2012 ...................................................................................................... 31 Figure 24 Analysis of tax relief ROI, GVA return, 2006-07 to 2013-14 ................................................ 35 Figure 25 Analysis of tax relief ROI, return to Exchequer, 2006-07 to 2013-14 ............................... 36 Figure 26 Summary of economic impact of film-induced tourism in UK, 2013 ............................. 36 Figure 27 Summary of economic impact of film-induced merchandise sales in UK, 2013 ......... 38 Figure 28 Analysis of value of UK brand promotion ................................................................................. 39 Figure 29 HETV value chain ............................................................................................................................... 42 Figure 30 Derivation of direct GVA generated by HETV production .................................................. 43 Figure 31 Estimates of GVA and employment generated by HETV programming in the UK broadcast industry, 2013 ............................................................................................................................. 45 Figure 32 Impact of HETV tax relief ................................................................................................................. 49 Figure 33 Analysis of HETV tax relief ROI, return to Exchequer ............................................................. 50 Figure 34 Summary of economic impact of screen tourism associated with HETV, UK, 2013 .. 50 Figure 35 Video game sector value chain ..................................................................................................... 53 Figure 36 Regional distribution of employment in the development segment of core UK video games sector, 2013 ............................................................................................................................ 55 Figure 37 Regional distribution of employment in the publishing segment of core UK video games sector, 2013 ............................................................................................................. 57 Figure 38 Consumer spending on video games in the UK, by sales channel, 2013 ...................... 58 Figure 39 animation programme value chain ............................................................................................ 63 Figure 40 Derivation of direct GVA and employment generated by animation programme production ............................................................................................................................................................... 64 Figure 41 Impact of the ATR .............................................................................................................................. 68 Figure 42 Analysis of the ATR’s ROI, return to Exchequer ...................................................................... 69
© Olsberg•SPI and Nordicity 2015 February, 2015 XX
©
12. Appendix 3 – Glossary Abbreviation/Term Description ABI Annual Business Inquiry IHS IHS is a global information company, providing data to
industries including the audiovisual sector ASHE Annual Survey of Hours and Earnings ABS Annual Business Survey APS Annual Population Survey ATR Animation Tax Relief BFC British Film Commission BFI British Film Institute BRES Business Register and Employment Survey BVA British Video Association CAA Cinema Advertising Association DCMS Department for Culture, Media and Sport Direct Impact The economic impact directly attributable to economic activity
in the production, distribution, and consumption segments of the industries covered by this report
DTO Download to own DVD Digital video disc FTE Full-time equivalent FTR Film Tax Relief GDP Gross domestic product GIC Games Investor Consulting GVA Gross value added HETV High-end television IDBR Inter-Departmental Business Register LFS Labour Force Survey MCV MCV is a print and online periodical published by NewBay
Media which covers the video games industry. Ofcom Independent regulator and competition authority for the UK
communications industries ONS Office for National Statistics Pact Producers Alliance for Cinema and Television Primary window A platform or venue in which a film or television program is first
released commercially to the public. Operating surplus Operating surplus refers to the income earned by a business’s
owner-operator and shareholders and is often similar to operating profits. Operating surplus is the residual income leftover after the value of employment costs and other purchases of supplies and services are deducted from the value of output.
PSB Public Service Broadcaster Qualifying spend The elements of production spend which are eligible for the
Creative Sector Tax Reliefs ROI Return on investment

© Olsberg•SPI and Nordicity 2015 February, 2015 XXI
Abbreviation/Term Description Secondary Window A platform or venue in which a film or television program is
released commercially to the public, following release on the primary window.
SIC Standard Industrial Classification SIC Plus An approach adopted by Olsberg•SPI and Nordicity to ensure
that the impact of various companies in the Video Games sector which do not report in the official SIC codes are considered
SVoD Subscription video on demand TIGA The Independent Games Developers Association UKFC UK Film Council Ukie UK Interactive Entertainment VGTR Video Games Tax Relief VoD Video on demand

Olsberg•SPI provides a range of expert consultancy and strategic services to public and private sector clients, specialising in the worlds of filim, television and digital media.
Nordicity specialise in strategy, policy and economic analysis for the global digital, creative and communications industries.
For further information contact:Andrew BarnesOlsberg•SPI19, Bolsover StreetLondon W1W 5NA
© Olsberg•SPI and Nordicity 2015
Related Documents


![Pinewood Derby Display Case - FINAL[1] - Cub Scoutscubscouts.org/.../uploads/2017/08/Pinewood-Derby-Display-Case.pdf · Pinewood Derby Display Case ... found it difficult to find](https://static.cupdf.com/doc/110x72/5a9f82af7f8b9a62178cd2b9/pinewood-derby-display-case-final1-cub-derby-display-case-found-it-difficult.jpg)