ISO MET HOD OLO GY 2.0 ISO MET HOD OLO GY 2.0 ISO MET HOD OLO GY EBS, ISO, MET, HOD, OLO, GY, 2.0, EBS, ISO MET, HOD, OLO, GY, 2.0, EBS, ISO, MET, HOD OLO, GY, 2.0, EBS, ISO, MET, HOD, OLO, 2.0, EBS, ISO, MET, HOD, OLO, GY, 2.0, E ISO, MET, HOD, OLO, GY, 2.0, EBS, ISO, MET HOD, OLO, GY, 2.0, EBS, ISO, MET, HOD, OLO GY, 2.0, EBS, ISO, MET, HOD, OLO, GY, 2.0 EBS, ISO, MET, HOD, OLO, GY, 2.0, EBS, ISO MET, HOD, OLO, GY, 2.0, EBS, ISO, MET, HOD OLO, GY, 2.0, EBS, ISO, MET, HOD, OLO, GY 2.0, EBS, ISO, MET, HOD, OLO, GY, 2.0, EBS ISO, MET, HOD, OLO, GY, 2.0, EBS, ISO, MET HOD, OLO, GY, 2.0, EBS, ISO, MET, HOD, OLO, Y, 2.0, EBS, ISO, MET, HOD, OLO, GY, 2.0, EBS SO, MET, HOD, OLO, GY, 2.0, EBS, ISO, ME HOD, OLO, GY, 2.0, EBS, ISO, MET, HOD, OLO Y, 2.0, EBS, ISO, MET, HOD, OLO, GY, 2.0, EB O, MET, HOD, OLO, GY, 2.0, EBS, ISO, MET HOD, OLO, GY, 2.0, EBS, ISO, MET, HOD, OL Y, S, , O, International Organization for Standardization Economic benefits of standards ISO Methodology 2.0

Welcome message from author
This document is posted to help you gain knowledge. Please leave a comment to let me know what you think about it! Share it to your friends and learn new things together.
Transcript

ISOMETHODOLOGY 2.0ISOMETHODOLOGY 2.0ISOMETHODOLOGY
EBS, ISO, MET, HOD, OLO, GY, 2.0, EBS, ISO, MET, HOD, OLO, GY, 2.0, EBS, ISO, MET, HOD,
OLO, GY, 2.0, EBS, ISO, MET, HOD, OLO, GY, 2.0, EBS, ISO, MET, HOD, OLO, GY, 2.0, EBS,
ISO, MET, HOD, OLO, GY, 2.0, EBS, ISO, MET, HOD, OLO, GY, 2.0, EBS, ISO, MET, HOD, OLO,
GY, 2.0, EBS, ISO, MET, HOD, OLO, GY, 2.0, EBS, ISO, MET, HOD, OLO, GY, 2.0, EBS, ISO,
MET, HOD, OLO, GY, 2.0, EBS, ISO, MET, HOD, OLO, GY, 2.0, EBS, ISO, MET, HOD, OLO, GY, 2.0, EBS, ISO, MET, HOD, OLO, GY, 2.0, EBS, ISO, MET, HOD, OLO, GY, 2.0, EBS, ISO, MET,
HOD, OLO, GY, 2.0, EBS, ISO, MET, HOD, OLO, GY, 2.0, EBS, ISO, MET, HOD, OLO, GY, 2.0, EBS, ISO, MET, HOD, OLO, GY, 2.0, EBS, ISO, MET, HOD, OLO, GY, 2.0, EBS, ISO, MET, HOD, OLO, GY, 2.0, EBS, ISO, MET, HOD, OLO, GY, 2.0, EBS, ISO, MET, HOD, OLO, GY, 2.0, EBS, ISO, MET, HOD, OLO, GY, 2.0, EBS, ISO, MET, HOD, OLO,
OLO, GY, 2.0, EBS, ISO, MET, HOD, OLO, GY, 2.0, EBS, ISO, MET, HOD, OLO, GY, 2.0, EBS, GY, 2.0, EBS, ISO, MET, HOD, OLO, GY, 2.0, EBS, HOD, OLO, GY, 2.0, EBS, ISO, MET, HOD, OLO,
International Organization for Standardization
Economic benefits of standards
ISO Methodology 2.0
ISO
Met
hodo
logy
2.0
Econ
omic
ben
efits
of s
tand
ards

International Organizationfor Standardization
ISO Central Secretariat
1, chemin de la Voie-Creuse
Case postale 56
CH - 1211 Genève 20
Switzerland
www.iso.org
ISBN 978-92-67-10606-9
© ISO, 2013All rights reserved

ISO in brief
ISO is the International Organization for Standardization. ISO has a
membership of 162* national standards bodies from countries large
and small, industrialized, developing and in transition, in all regions of
the world. ISO’s portfolio of over 19 600* standards provides business,
government and society with practical tools for all three dimensions
of sustainable development: economic, environmental and social.
ISO standards make a positive contribution to the world we live in.
They facilitate trade, spread knowledge, disseminate innovative ad-
vances in technology, and share good management and conformity
assessment practices.
ISO standards provide solutions and achieve benefits for almost all
sectors of activity, including agriculture, construction, mechanical
engineering, manufacturing, distribution, transport, healthcare, infor-
mation and communication technologies, the environment, energy,
safety and security, quality management, and services.
ISO only develops standards for which there is a clear market re-
quirement. The work is carried out by experts in the subject drawn
directly from the industrial, technical and business sectors that have
identified the need for the standard, and which subsequently put the
standard to use. These experts may be joined by others with relevant
knowledge, such as representatives of government agencies, testing
laboratories, consumer associations and academia, and by international
governmental and nongovernmental organizations.
An ISO International Standard represents a global consensus on the
state of the art in the subject of that standard.
*in March 2013

2 Economic benefits of standardsISO Methodology 2.0 Table of contents
Introduction .................................................................................................................................................................................07
Part 1 : The ISO Methodology in brief
1.1 Key questions .............................................................................................................................................................12
1.2 What "standards" mean in the ISO Methodology ...................................................................12
1.3 Basic approach ..........................................................................................................................................................13
1.4 The value chain .........................................................................................................................................................141.4.1 Company value chain1.4.2 Industry value chain
1.5 Key steps in the assessment of an organization ....................................................................... 19Step 1 : Understand the value chain of the industry and the companyStep 2 : Identify the impacts of standardsStep 3 : Analyze the value drivers and determine operational indicatorsStep 4 : Assess and calculate results
1.6 Basic approach to measuring the impacts of standards ................................................... 311.6.1 Before-after comparison1.6.2 Comparing concurrent conditions–projects1.6.3 What-if comparison
1.7 Collecting the data and limitations in their availability .................................................... 33
1.8 ISO Methodology toolbox ..............................................................................................................................34
Part 2: Insights from case studies
2.1 Value chains ................................................................................................................................................................362.1.1 Identification of an industry value chain for a company assessment2.1.2 Company value chain
2.2 Identify the impacts of standards ..........................................................................................................45
2.3 Scoping the assessment ..................................................................................................................................49
2.4 Determine value drivers ..................................................................................................................................50
2.5 Identify operational indicators and principles of calculation ....................................... 52
Table of contents

3Economic benefits of standards ISO Methodology 2.0 Table of contents
2.6 Calculate the impacts of standards .......................................................................................................592.6.1 Time frames for the assessment of impacts2.6.2 Approaches to calculation2.6.2.1 Separation of impacts of standards from other factors2.6.2.2 Indicators expressing direct versus indirect financial contributions2.6.2.3 Absolute figures vs. percentages
2.7 Dealing with limitations in the availability of data ...............................................................702.7.1 Estimations based on experience2.7.2 Extrapolations2.7.3 Aggregation
Part 3 : Summary of findings
3.1 Findings from company case studies ..................................................................................................723.1.1 Overview3.1.2 Selection of companies3.1.3 Key benefits of standards resulting from the case study findings
3.2 Findings from industry sector case studies ...................................................................................78
Part 4 : Practical organization of case studies
4.1 Company case studies .......................................................................................................................................80
Annexes
Annex A Assessment of economic benefits of standards to industry sectors ......88
Annex B Assessment of non-economic benefits of standards ....................................107
Annex C ISO Methodology toolbox ........................................................................................................118
Annex D Terms and definitions .................................................................................................................122
Bibliography ...........................................................................................................................................................................125

The ISO MethodologyCalculating the benefi tsISO has developed a simple, step-by-step methodology and a robust set of tools to measure the economic benefi ts of standards. The methodology can be applied to all companies and industry sectors in order to identify the contribution that standards make to their performance.
Step 2 : �dentify the impact �f tandard
Step 1 : naly e the value chain
Locate the company’s position in the value chain, and the core competences and key activities involved in the
creation of value.
Determine the impact of standards on each of the company’s main business functions and associated activities. A handy tool is the standards impact map which compiles over 90
examples of such impact by business function.
Step 3 : �etermine value driver
and defi ne key �perati�nal indicat�r
Step 4 :C�� ect inf�rmati�n and mea ure impact
Value drivers are key organizational capabilities that give a company a competitive advantage. The most desirable impact should be concentrated here.
Operational indicators are used to measure actual impact (e.g. requiredmanpower or customer satisfaction).
The earnings before interest and tax (EBIT) indicator is used as a measure of value created. EBIT accounts for
the gross profi t of a company (revenue minus costs) at a given point in time.


ISOMETHODOLOGY 2.0ISOMETHODOLOGY 2.0ISOMETHODOLOGY
EBS, ISO, MET, HOD, OLO, GY, 2.0, EBS, ISO, MET, HOD, OLO, GY, 2.0, EBS, ISO, MET, HOD,
OLO, GY, 2.0, EBS, ISO, MET, HOD, OLO, GY, 2.0, EBS, ISO, MET, HOD, OLO, GY, 2.0, EBS,
ISO, MET, HOD, OLO, GY, 2.0, EBS, ISO, MET, HOD, OLO, GY, 2.0, EBS, ISO, MET, HOD, OLO,
GY, 2.0, EBS, ISO, MET, HOD, OLO, GY, 2.0, EBS, ISO, MET, HOD, OLO, GY, 2.0, EBS, ISO,
MET, HOD, OLO, GY, 2.0, EBS, ISO, MET, HOD, OLO, GY, 2.0, EBS, ISO, MET, HOD, OLO, GY, 2.0, EBS, ISO, MET, HOD, OLO, GY, 2.0, EBS, ISO, MET, HOD, OLO, GY, 2.0, EBS, ISO, MET,
HOD, OLO, GY, 2.0, EBS, ISO, MET, HOD, OLO, GY, 2.0, EBS, ISO, MET, HOD, OLO, GY, 2.0, EBS, ISO, MET, HOD, OLO, GY, 2.0, EBS, ISO, MET, HOD, OLO, GY, 2.0, EBS, ISO, MET, HOD, OLO, GY, 2.0, EBS, ISO, MET, HOD, OLO, GY, 2.0, EBS, ISO, MET, HOD, OLO, GY, 2.0, EBS, ISO, MET, HOD, OLO, GY, 2.0, EBS, ISO, MET, HOD, OLO,
0
Introduction

8 Economic benefits of standardsISO Methodology 2.0 Introduction
Background
Since 2000, a significant number of studies have been conducted on
the benefits of standardization and the use of standards. However,
comparing these studies and reaching overall conclusions is difficult
because they were carried out by different organizations, with different
objectives and using different methodologies. Most of them, and par-
ticularly those with the highest influence 1), followed a macroeconomic
perspective, trying to evaluate the contribution of standardization to
the economic performance of countries, considering indicators such
as GDP growth and productivity increase.
Those studies made substantial progress in understanding the eco-
nomic impacts of standards. However, they have not, or only margin-
ally, addressed the microeconomic perspective and have not tried
to assess the benefit that standards bring to individual companies.
The ISO Methodology 2) was designed to fill this gap. It provides a
systematic approach for assessing the economic benefits of standards
for individual organizations. It supports companies’ internal analyses,
the development of case studies and the comparison of results from
different studies.
The primary scope of the ISO Methodology is assessing the economic
benefits of standards (i.e. the contribution of standards to the crea-
tion of economic value) for a company. The methodology can be
applied to the economic impact of standards on an industry sector
at national or international level, although this requires particular
attention and increased efforts.
The ISO Methodology can also be adapted to describe and quantify
the non-economic benefits of standards – i.e. the contribution that
1) See the bibliography at the end this document which contains a number of these studies.
2) Developed with the support of Roland Berger Strategies Consultants and further refined
during its application in over 20 company case studies worldwide.

9Economic benefits of standards ISO Methodology 2.0 Introduction
standards give to the achievement of social and environmental ben-
efits – from the perspective of an individual organization (irrespective
of whether the organization is for-profit, not-for-profit, in the public
or private sector).
The methodology is focused on the measurement of benefits resulting
from the use of standards. The benefits associated with participating
in standards development are only addressed at a qualitative level.
This document gives an overview of the ISO Methodology and its
objectives. It describes the key stages of the assessment process and
provides references to some of the tools which should be applied
at certain stages of the assessment. It presents the key elements
and concepts of the methodology, including practical advice on the
organization of projects, on steps in the assessment process, and on
methods to calculate the benefits of standards. Examples from the
library of case studies developed so far (December 2012) are given
to illustrate the concepts.
The main part of this document is focused on the primary target
of the analysis, i.e. economic benefits of standards for companies
(for-profit organizations). The assessment of economic benefits of
standards for an industry sector is covered in Annex A. The extension
of the methodology to assess non-economic benefits of standards is
covered in Annex B.

10 Economic benefits of standardsISO Methodology 2.0 Introduction
Potential users
Many organizations and individuals are potentially interested in ap-
plying the ISO Methodology, including ISO itself, national standards
bodies (NSBs), other standards development organizations (SDOs),
companies, other types of organizations that use standards, and
academic institutions.
ISO, NSBs and other SDOs, can benefit because the application of
the ISO Methodology helps them to address systematically the issue
of benefits of standards, with a view to :
• Enabling stakeholders in private as well as public sectors to ap-
preciate better the economic and social impact of voluntary
consensus standards,
• Raising the awareness of policy makers and business leaders to
the importance of standardization.
Companies and other organizations that are users of external standards
can benefit because the application of the ISO Methodology can help
them to understand better the impacts of standards on their activities
and processes. This may help to improve further their performance
and maximize the benefits derived from standards. Companies can
use the same approach and tools provided by the ISO Methodology
to investigate the impact of internal company standards.
Academic institutions can benefit because the application of the
ISO Methodology will help them to develop original case studies
and to capture information, for teaching and empirical material for
research related to standards.

ISOMETHODOLOGY 2.0ISOMETHODOLOGY 2.0ISOMETHODOLOGY
EBS, ISO, MET, HOD, OLO, GY, 2.0, EBS, ISO, MET, HOD, OLO, GY, 2.0, EBS, ISO, MET, HOD,
OLO, GY, 2.0, EBS, ISO, MET, HOD, OLO, GY, 2.0, EBS, ISO, MET, HOD, OLO, GY, 2.0, EBS,
ISO, MET, HOD, OLO, GY, 2.0, EBS, ISO, MET, HOD, OLO, GY, 2.0, EBS, ISO, MET, HOD, OLO,
GY, 2.0, EBS, ISO, MET, HOD, OLO, GY, 2.0, EBS, ISO, MET, HOD, OLO, GY, 2.0, EBS, ISO,
MET, HOD, OLO, GY, 2.0, EBS, ISO, MET, HOD, OLO, GY, 2.0, EBS, ISO, MET, HOD, OLO, GY, 2.0, EBS, ISO, MET, HOD, OLO, GY, 2.0, EBS, ISO, MET, HOD, OLO, GY, 2.0, EBS, ISO, MET,
HOD, OLO, GY, 2.0, EBS, ISO, MET, HOD, OLO, GY, 2.0, EBS, ISO, MET, HOD, OLO, GY, 2.0, EBS, ISO, MET, HOD, OLO, GY, 2.0, EBS, ISO, MET, HOD, OLO, GY, 2.0, EBS, ISO, MET, HOD, OLO, GY, 2.0, EBS, ISO, MET, HOD, OLO, GY, 2.0, EBS, ISO, MET, HOD, OLO, GY, 2.0, EBS, ISO, MET, HOD, OLO, GY, 2.0, EBS, ISO, MET, HOD, OLO,
The ISO Methodology in brief
1

12 Economic benefits of standardsISO Methodology 2.0 Part 1
1.1 Key questions
The ISO Methodology addresses the following core question :
• What is the quantitative contribution of standards to the creation
of value by an organization ?
Other questions that can be addressed together with the core ques-
tion are :
• What is the qualitative contribution of standards to company
operations ? This question aims at a clear understanding of other
significant benefits of standards that could not be quantified
• How can companies maximize the value contributed by standards ?
• Which areas of company operations could additionally benefit
from the use of standards ?
1.2 What “ standards ” mean in the ISO Methodology
“ Standards ” in the ISO Methodology are not limited to standards
developed and published by ISO, but comprise all consensus-based
standards issued by any standards-developing organization. Compa-
nies often call these “ external ” standards to distinguish them from
internal company standards.
“ External ” standards include International Standards developed by
ISO and the International Electrotechnical Commission (IEC), regional
and national standards, standards developed by sector-based stand-
ards development organizations, as well as consortia standards if the
consortia are open to participation by interested parties in addition
to consortia members.
Internal company standards are excluded from the assessment except
if they are related to or based on external standards. In such cases,
the interplay between internal and external standards needs to be

13Economic benefits of standards ISO Methodology 2.0 Part 1
carefully analyzed, because the influence and impact of external
standards can be substantial, even if the effect is achieved through
internal standards.
As explained in section 1.3, it is important to underline that the im-
pacts from internal company standards (even if they are not related
to external standards) can also be assessed using the same approach
and the same set of tools provided by the ISO Methodology.
Finally, a special note is required for Technical regulations, i.e. govern-
mental technical documents that are mandatory and legally binding
in certain jurisdictions – in particular, those of countries that are target
markets of the company.
The approach and the tools provided by the ISO Methodology can
be applied to both voluntary standards and technical regulations.
In principle, if the primary interest is to evaluate the impact of vol-
untary standards, technical regulations should be excluded from
the assessment. However, in reality it is often difficult to distinguish
between the two from the company perspective, especially in small
and medium-sized companies : in most cases, both voluntary standards
and technical regulations are part of the same portfolio of technical
documents that companies use in their business practices.
1.3 Basic approach
The fundamental point in the ISO Methodology is to consider the
company perspective : its environment, objectives, business processes
and activities.
To describe and analyze the activities of a company in a structured and
consistent way, the value chain model is applied (see section 1.4). The
impact of standards is then determined as described in section 1.5.

14 Economic benefits of standardsISO Methodology 2.0 Part 1
Standards used by the company (all standards – as defined in section
1.2) are considered in relation to the company business processes and
specific activities. We need first to identify where, for which activities,
standards are used and how these activities, supported by the use
of standards, contribute to the creation of value for the company.
Operational indicators associated with the activities impacted by
standards then need to be identified to allow quantification. Activi-
ties and indicators most closely associated to the company “ value
drivers ” need to be privileged, because they are usually associated
with higher added-value.
The impact of standards is determined by quantifying the variation
caused by the use of standards of the relevant performance indicators
over the period of time considered by the assessment (the main ap-
proaches used for such quantification are described in section 1.6).
Finally, the impact is converted into monetary terms, by translat-
ing changes in the operational indicators into contributions to the
company’s gross profit.
Extensions to the ISO Methodology towards an industry sector
analysis and towards assessing non-economic benefits are covered
in Annexes A and B.
1.4 The value chain
The ISO Methodology is based on the value chain approach.
A value chain comprises a sequence of activities to generate a certain
output, a product or a service. The output of the work passes through
all the activities of the chain in a given order adding value at each
stage. The links that form a value chain may be organized inside a
single company, or they may be spread over different companies that

15Economic benefits of standards ISO Methodology 2.0 Part 1
cooperate with each other in supply chain networks and that may
be located in different countries (see figure 1).
Stage 1 Stage 2 Stage 3 Stage 4
input outputoutput / input output / input output / input
Figure 1 – A simple value chain
1.4.1 Company value chain
A company value chain represents the chain of activities conducted
inside a company. The operations of the company are subdivided into
a number of key business functions (see figure 2 with the nine busi-
ness functions A to I). Each of these functions is associated with a set
of specific value chain activities. For example, the activities concerning
the production of components and the assembly of final products are
undertaken within the “ production/operations ” business function.
A - Management & Administration
B - Research & Development
C - Engineering
D - Procurement
E - Inbound Logistics
F - Production / Operations
G - Outbound Logistics
H - Marketing & Sales
I - After-sales Service
Figure 2 – The value chain of a manufacturing company
The business functions designated as E to I in figure 2 are named
primary functions 1), whilst functions A to D are called support func-
1) " Primary functions " are those dealing with the " core " activities of the company (e.g. for a
manufacturing company, all those associated with the transformation of materials into prod-
ucts and their delivery to customers). In a business, they usually represent the " direct costs ".

16 Economic benefits of standardsISO Methodology 2.0 Part 1
tions 2). In principle, all products of a manufacturing company are
processed through the primary business functions. Some of these
functions may be quite complex and composed of stages, whereas
others may be relatively simple. The support functions influence the
primary functions and assist in their execution. For a definition of
the individual business functions, see Annex D Terms and definitions.
The company value chain in figure 2 is generic, but based on the
model of manufacturing companies that, since the late 1980s, have
been extensively analyzed in management literature using this ap-
proach. The value chain model can also be applied to other types of
organizations (e.g. service companies or social institutions), but may
require an adaptation to reflect the specific characteristics of the
operations of these organizations.
In these cases, the modification concerns mainly the structure of the
primary functions, which need to reflect the “ core ” activities of the
organizations. Examples from the case studies are shown in section 2.
Further examples for an adaptation of the value chain can be found
at Annex B where the value chain model is applied to the descrip-
tion of a hospital.
Figures 3 and 4 summarize the ISO Methodology and identify its
focus in the context of the wider supply chain of a company.
2) " Support functions " are all the others (e.g. for a manufacturing company, activities that are
not directly related to each unit of product). Their costs are usually considered as " overheads ".

17Economic benefits of standards ISO Methodology 2.0 Part 1
Benefits of standards can be identified along the entire company value chain and its external interfaces. They can be quantified in terms of impact on specific operational indicators and converted into financial terms
Easier cooperation with other companies on common basis
Facilitated inter-action with public stakeholders, regarding compliance (e.g., safety, health, environment)
Inbound logistics
Operations Outbound logistics
Marketing and sales
Service
Management & Administration
Research & Development
Engineering
Procurement
Process improvement : increased productivity, reduced waste, consumption of resources, etc.
Improved procurement and relations with suppliers
Broader markets, increased sales
> Lower transaction cost
> Consistent quality > Transparency > Economies of scale
> Customer confidence > Access to new
markets > Lower pressure
on price > Lower transaction
costs
Figure 3
Figure 3 – The ISO Methodology at a glance
Supplier’s value chain
Channel value chain
Customer’s value chain
Organization’s value chain
Firm’s infrastructure
Human resource management
Technological development
Procurement
Inbound logistics Operations Outbound
logisticsMarketing
& salesAfter-sales service
Ma
rg
in
Organization’s value chain
Figure 4 – A company and its value chain embedded in the wider supply chain

18 Economic benefits of standardsISO Methodology 2.0 Part 1
1.4.2 Industry value chain
A company value chain, as applied in this methodology and shown in
figure 2, is limited to the scope of an individual company. However,
the value chain model can be extended to a whole industry sector,
in which case the various stages of production and services and the
network of suppliers and customers are included in the perspective.
This is referred to as the “ industry value chain ” (see figure 5 giving
an example of the oil and gas engineering industry).
Exploration Production Refining/manufacturing Distribution Marketing
Transport to refinery Product development
Trading
Engineering
Component manufacturing
Figure 5 – Oil and gas engineering industry value chain and scope
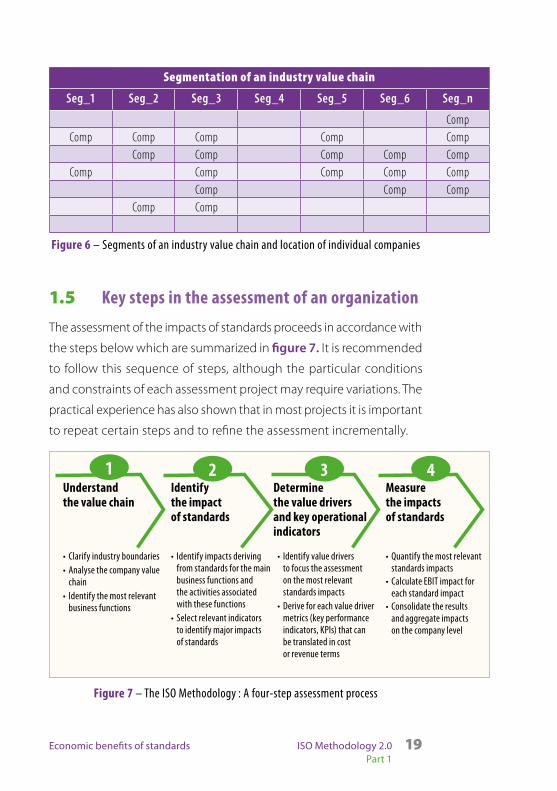
More generally, an industry value chain can be segmented into dif-
ferent streams and sequences of productive operations that come
together and intersect at certain stages. Each of the segments can
be occupied by certain types of companies, which, on the basis of
certain inputs produce certain outputs and thereby can be located
in certain segments of the industry value chain as shown in figure 6.
Placing a company into the context of its industry value chain helps
to understand how it is embedded in a network of interrelated inputs
and outputs.
19Economic benefits of standards ISO Methodology 2.0 Part 1
Segmentation of an industry value chain
Seg_1 Seg_2 Seg_3 Seg_4 Seg_5 Seg_6 Seg_n
CompComp Comp Comp Comp Comp
Comp Comp Comp Comp CompComp Comp Comp Comp Comp
Comp Comp CompComp Comp
Figure 6 – Segments of an industry value chain and location of individual companies
1.5 Key steps in the assessment of an organization
The assessment of the impacts of standards proceeds in accordance with
the steps below which are summarized in figure 7. It is recommended
to follow this sequence of steps, although the particular conditions
and constraints of each assessment project may require variations. The
practical experience has also shown that in most projects it is important
to repeat certain steps and to refine the assessment incrementally.
Understand the value chain
Identify the impact of standards
Determine the value drivers and key operational indicators
Measure the impacts of standards
2 3 41
• Clarify industry boundaries• Analyse the company value
chain• Identify the most relevant
business functions
• Identify impacts deriving from standards for the main business functions and the activities associated with these functions
• Select relevant indicators to identify major impacts of standards
• Identify value drivers to focus the assessment on the most relevant standards impacts
• Derive for each value driver metrics (key performance indicators, KPls) that can be translated in cost or revenue terms
• Quantify the most relevant standards impacts
• Calculate EBIT impact for each standard impact
• Consolidate the results and aggregate impacts on the company level
Figure 7 – The ISO Methodology : A four-step assessment process

20 Economic benefits of standardsISO Methodology 2.0 Part 1
Step 1 : Understand the value chain of the industry and the company
The first step is to determine – at least at a general level – the value
chain of an industry and to locate a company in the context of the
industry value chain. This is important because it helps to understand
the business, to appreciate its boundaries and its relations with sup-
pliers, customers and distribution channels.
Secondly, the internal value chain of the company needs to be un-
derstood. It is crucial to understand the company business processes,
its organization, and its core value adding activities.
A decision of key importance is with regard to the scope of the as-
sessment : should it cover the whole company, or should it be limited
to one or more of its business functions ? It may take a few iterations
in the analysis until the scope can be finally fixed. The decision on the
scope is dependent on factors such as the size and complexity of the
company, the available resources for the assessment, the access to
key information, the experience of the members of the project team
and the willingness of the company to engage in such an assessment.
When a large company is assessed, it is hardly possible to assess the
impacts of standards on the company in its entirety. The scope needs
therefore to be limited to certain key areas of operations. In other
cases, the assessment may include a number of different business
units. In the case of a company with several production sites, only
one of these sites may be assessed.
Step 2 : Identify the impacts of standards
In this second step, the business functions and activities in the
company value chain where standards are expected to perform a
significant role are determined.
21Economic benefits of standards ISO Methodology 2.0 Part 1
Existing company documentation, e.g. the quality manual, process
and organizational charts, other corporate or departmental documen-
tation, should be used to understand processes, business functions
and the main activities performed by the relevant business func-
tions. Depending on the complexity of the company, a global list or
a function-specific list of the standards used by the company should
be used or compiled. Company experts should then indicate which
standards (or groups of standards) are applied for which activities
within the selected business functions.
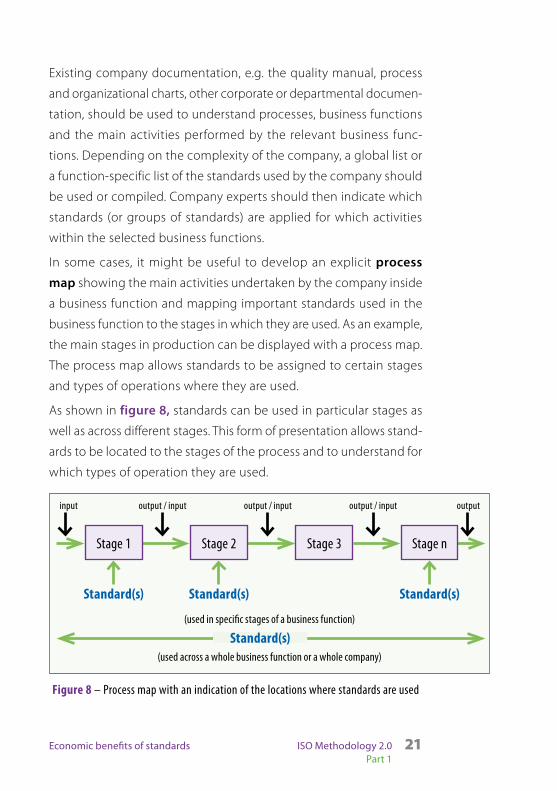
In some cases, it might be useful to develop an explicit process
map showing the main activities undertaken by the company inside
a business function and mapping important standards used in the
business function to the stages in which they are used. As an example,
the main stages in production can be displayed with a process map.
The process map allows standards to be assigned to certain stages
and types of operations where they are used.
As shown in figure 8, standards can be used in particular stages as
well as across different stages. This form of presentation allows stand-
ards to be located to the stages of the process and to understand for
which types of operation they are used.
Stage 1 Stage 2 Stage 3 Stage n
input outputoutput / input output / input output / input
Standard(s) Standard(s) Standard(s)
(used in specific stages of a business function)
(used across a whole business function or a whole company)
Standard(s)
Figure 8 – Process map with an indication of the locations where standards are used

22 Economic benefits of standardsISO Methodology 2.0 Part 1
ISO has developed a tool that can assist in the identification of core
areas of the company value chain where standards may perform a
significant role : the Standards Impact Map (see figure 9 and table 1).
The Standards Impact Map is part of the toolbox that comes with the
ISO Methodology (see tool TB_07).
The Standards Impact Map is a generic check list based on the model
business functions that make up the company value chain and the
typical activities undertaken in these functions, and indicates potential
impacts of standards on these activities.
Listing over 80 types of impacts, the Standards Impact Map can help
to generate ideas or to explore possibilities : However, in most cases,
specific impacts relevant for the company under investigation have to
be determined either by adapting/specializing generic entries of the
map, or as a result of the detailed analysis of the company’s activities.
It is also important to note that only a subset of the impacts listed
in the standards impact map may be relevant for a given project.
Standards Impact Map (Functional Perspective)
Functions Activities Impacts Description Prioritization
[1-high, 3-low] Product Process Compliance
Better internal information transfer Using standardized documents and specifications makes passing on internal information about products and services more efficient. 2 x x x I.1
Better training of personnel Inbound Logistics staff can be trained better because relevant specifications for both products and services are standardized. 3 x x x I.2
More efficient logistics Inbound Logistics can be conducted more efficiently due to the reduced number of types of supplies. 1 x I.3In-house logistics More efficient receiving of supplies Standardized documentation, packaging, labels or tags of supplies makes receiving more efficient. 1 x x I.4Warehousing Reduced warehousing needs Due to the high availability of standardized products, fewer supplies need to be stored in the warehouse. 1 x I.5
Better internal information transfer Using standardized documents and specifications makes passing on internal information about products and services more efficient. 2 x x x PO.1
Better training of personnel Production/Operations staff can be trained better because relevant specifications are standardized, for both products and services. 3 x x x PO.2
More efficient processing Due to the reduced number of types of non-standardized products, Production/ Operations can become more efficient. 1 x PO.3More efficient assembly Assembly processes are more efficient due to the modular product architecture. 1 x PO.4Better quality of equipment and supplies Higher quality of equipment and supplies based on standards reduces the failure rate and related correction costs. 1 x x PO.5
Quality assurance Better quality management Quality management based on standards can be implemented more effectively. 1 x PO.6
Reduced disadvantages from regulations Influence in standard-setting process helps to reduce disadvantages from regulations 3 x x PO.7Better health/safety/environmental compliance HSE management based on standards can be implemented more effectively. 1 x x PO.8
Better internal information transfer Using standardized documents and specifications makes passing on internal information about products and services more efficient. 2 x x x O.1
Better training of personnel Outbound logistics staff can be trained better because relevant specifications for both products and services are standardized. 3 x x x O.2
More efficient logistics Reducing the number of product types means that Outbound Logistics can be conducted more efficiently. 1 x O.3Packing/shipping More efficient packing and shipping Standardized documentation, packaging and labels make packing and shipping goods more efficient. 1 x x O.4
Better internal information transfer Using standardized documents and specifications makes passing on internal information about products and services more efficient. 2 x x x M.1
Better training of personnel Marketing & Sales staff can be trained better because relevant specifications for both products and services are standardized. 3 x x x M.2
More efficient marketing activities Marketing & Sales activities can be conducted more efficiently if there are fewer product types. 1 x M.3Market analysis, research Better competitor information Since competitor's products have standardized specifications, market research can be conducted more efficiently. 3 x x x M.4Marketing activities, client development Better customer information Communicating product and service specifications and requirements to potential customers is more effective when refering to standards 1 x x x M.5Contracting More efficient contractual agreements Defined specifications of the company's products and customer requirements makes concluding contractual agreements easier. 1 x x x M.6
Higher sales Sales are higher due to customer confidence in standardized products and services. 1 x x x M.7Increased competition The market share is lower due to more competitors on a market for standardized products and services. 1 x x x M.8Reduced time-to-market For products and services based on standardized components, the time-to-market and market share are higher due to earlier access to technical information. 2 x x x M.9Benefits from participating in standard-setting process A larger market share can be achieved through the promotion of the own technology to become standard and the acquisition of customers 3 x x x x M.10
Better internal information transfer Using standardized documents and specifications makes passing on internal information about products and services more efficient. 2 x x x S.1
Better customer communication You can communicate information about products and services to customers more effectively by using standardized specifications. 1 x x x S.2
Better training of personnel You can train Service staff better if you have standardized specifications of products and services. 3 x x x S.3
More efficient customer care Fewer types of non-standardized products make Service activities more efficient. 1 x S.4Reduced consultation needs Improved quality of standardized products means less consultation required. 1 x x S.5
More efficient transfer of internal information Using standardized documents and specifications makes passing on internal information about products and services more efficient. 2 x x x MA.1
More efficient training of personnel You can train staff better if you have standardized specifications of products and services. 3 x x x MA.2
More efficient management Management & Administration can be conducted more efficiently due to the reduced number of types of products and services. 2 x MA.3
Benefits from potential strategic partnerships as a result from relationship build-up during standardization processBenefits from potential strategic partnerships arise as a result from relationship build-up during standard-setting process 3 x x x x MA.4
Comparison with best-practices of competitors The awareness of activities of competitors who use the same standardized technologies can induce internal improvements. 3 x x x MA.5Legal Reduced liability costs Liability costs can be reduced if compliance with standards is demonstrated. 2 x x x MA.6
More efficient transfer of internal information Using standardized documents and specifications makes passing on internal information about products and services more efficient. 2 x x x MA.7
More efficient training of personnel You can train Facility Management staff better if you have standardized specifications of products and services. 3 x x x MA.8
More efficient management of facilities Facility Management activities can be conducted more efficiently if there are fewer types of products and services. 1 x MA.9
Better identification of future trends and influence on standards The access to information and the influence in the standard-setting process helps to prevent negative developments 3 x x x x MA.10More secure future sales and supplies Operational risk is reduced if products and services are based on standards, because standardized products can be sold longer time and supplies are available for longer.2 x x MA.11
More efficient transfer of internal, operational information Using standardized documents and specifications makes passing on internal information about products and services more efficient. 2 x x x MA.12
More efficient training of personnel You can train IT staff better if you have standardized specifications of products and services. 3 x x x MA.13
More efficient IT activities Fewer types of non-standardized products make IT activities more efficient. 1 x MA.14
More efficient training of personnel You can train staff better if you have standardized specifications of products and services. 3 x x x MA.15More available trained personnel There is more potential personnel available on a market for standardized technology 3 x x MA.16Reduced HR requirements HR requirements are reduced with a reduced number of types of products and services, production complexity and types of employees in production 3 x x MA.17
Better internal information transfer Using standardized documents and specifications makes passing on internal information about products and services more efficient. 2 x x x E.1
Clearer product specifications Standardized specifications of the suppliers' products and customer requirements make it easier to collect relevant information. 1 x x E.2
Better training of personnel You can train R&D staff better if you have standardized specifications of products and services. 3 x x x E.3
More efficient Engineering Fewer types of non-standardized products make R&D activities more efficient. 1 x E.4
Additional personnel costs Additional personnel cost arise from participating in the standard-setting process 3 x x x x E.5Knowledge management More efficient internal standardization It is cheaper to implement standards within a company by using open consensus-based standards instead of developing internal standards. 1 x x x E.6
Reduced project development cost Project development costs are reduced because standards provide technical information free of charge. 1 x x E.7
Availability of replacement components Critical replacement components are more readily available on the market for standardized products (which reduces costs). 1 x x E.8
Additional costs from adopting standards There are additional cost due to the product and process requirements specified in standards 1 x x x E.9More efficient assembly Assembly processes are more efficient due to the modular product architecture. 1 x E.10Better quality of equipment and supplies Higher quality of equipment and supplies based on standards reduces the failure rate and related correction costs. 1 x x E.11Better quality management Quality management based on standards can be implemented more effectively. 1 x E.12Better health/safety/environmental compliance HSE management based on standards can be implemented more effectively. 1 x x E.13
Better internal information transfer Using standardized documents and specifications makes passing on internal information about products and services more efficient. 2 x x x R.1
Clearer product specifications Standardized specifications of the suppliers' products and customer requirements make it easier to collect relevant information. 1 x x R.2
Better training of personnel You can train R&D staff better if you have standardized specifications of products and services. 3 x x x R.3
More efficient R&D Fewer types of non-standardized products make R&D activities more efficient. 1 x R.4
Additional personnel costs Additional personnel cost arise from participating in the standard-setting process 3 x x x x R.5Knowledge management More efficient internal standardization It is cheaper to implement standards within a company by using open consensus-based standards instead of developing internal standards. 1 x x x R.6
Reduced research needs Research needs are reduced because standards provide technical information free of charge. 2 x R.7
Reduced research needs from participating in standard-setting process Research needs are reduced because additional information is obtained during standard-setting process. 3 x x R.8
Reduced product development cost Product development costs are reduced because standard technical information is available for free. 1 x R.9
Reduced product development cost from participating in standard-setting process Product development cost are reduced because additional information is obtained during standard-setting process. 2 x x R.10
Availability of replacement components Critical replacement components are more readily available on the market for standardized products (which reduces costs). 1 x x R.11Additional costs from adopting standards There are additional cost due to the product and process requirements specified in standards 1 x x x R.12
Better internal information transfer Using standardized documents and specifications makes passing on internal information about products and services more efficient. 2 x x x P.1
Better training of personnel You can train Procurement staff better if you have standardized specifications of products and services. 3 x x x P.2
More efficient procurement activities Fewer types of non-standardized products make Procurement activities more efficient. 1 x P.3Screening and selection of suppliers More efficient screening of specifications of standardized products Due to the standardized specifications of the suppliers' products and the internal requirements, it is easier to collect relevant information. 1 x x x P.4
More efficient contractual agreements Defined specifications of suppliers' products makes concluding agreements easier. 1 x x x P.5
More competition More competition in the market drives down the costs of supplies. 1 x P.6
Larger quantities Costs of supplies are lower because larger quantities of the same type can be purchased for standardized components. 1 x x P.7
Research
Product development
Procure-ment
All activities
Negotiating and contracting
R&D
All activities
Engin-eering / Construc-tion
All activities
Design
Inbound logistics
All activities
Production / Operations
Service
Manage-ment & Adminis-tration
All activities
All activities
Standard categories
IT
HR
Outbound logistics
All activities
Marketing and Sales
Impact number
Construction
Processing
HSE (health, safety and environment)
Facility management
Risk
General management, financing, accounting, controlling
Sales
Customer care and technical support
Impact from participation
Figure 9 – Standard Impact Map : business functions, activities and potential impacts of standards

23Economic benefits of standards ISO Methodology 2.0 Part 1
Function Activities Impacts Description
Production/ Operations
All activities Better internal information transfer This section of the impact map contains more detailed description of each of the possible impacts
Better training of personnelMore efficient processing
Processing More efficient assemblyBetter quality of equipment and supplies
Quality assurance Better quality managementHSE (health, safety and environment)
Reduced disadvantages from regulationsBetter health/safety/environmental compliance
Table 1 – Extract from the Standards Impact Map – Production function – Structure of the map
Step 3 : Analyze the value drivers and determine operational indicators
This step is divided into the following two sub-steps : a) the analysis
of the company value drivers and b) the determination of operational
indicators relevant to the selected business functions.
a) Value drivers
Value drivers are crucial organizational capabilities that give a company
a competitive advantage. The analysis of value drivers is important
because :
• It helps to better understand the company strategy and the activi-
ties, within the various business functions, that add value
• If impacts of standards can be assessed in activities closely as-
sociated with value drivers, their impact on value creation may
be significantly higher than for other activities
The analysis of value drivers can be done at two levels :
Firstly, at the company level, an analysis of the value drivers helps to
understand the overall company strategy. Depending on the organi-
zation of the project and the involvement of senior management,

24 Economic benefits of standardsISO Methodology 2.0 Part 1
the analysis can be performed initially in the framework of the value
chain analysis (step 1) and may then be refined in the current step.
Secondly, at the level of the individual business functions, activities
can be identified that are more closely connected with the company
value drivers and related operational indicators. Table 2 shows for
several business functions examples of the relationship between
these aspects :
Business functions Value drivers Key activities (using standards)
Research & Development Excellence in new product design
Collection and company-wide dissemination of information on design technologies
Production High-performing, flexible production line
Streamlined and well-monitored production process
Marketing & Sales High market and customer intelligence
Information about market access information and customer preferences readily available
Table 2 – Business functions, value drivers and activities using standards
Business functions and activities
using standards
Areas of operations where value drivers
exist
Figure 10 – Intersection : standards contribute and sustain value divers and key activities
Whenever possible, the assessment of the impacts of standards should
focus on activities most closely related to value drivers (see figure 10).
This is because standards will most likely generate the largest benefits
for a company when they support value drivers.

25Economic benefits of standards ISO Methodology 2.0 Part 1
However, if such an intersection cannot be found or if it is relatively
limited, all other activities which are impacted by standards should
be considered as a secondary choice.
b) Operational indicators
To assess the impacts resulting from the use of standards, one or
more operational indicators need to be identified.
Operational indicators are measurable variables of company activities
that show improvement or degradation of performance. The opera-
tional indicators chosen in the assessment need to be relevant, i.e.
they need to capture essential aspects of the activities under analysis,
and need to reflect the impacts of standards. Whenever possible, they
should be associated with the company value drivers.
In general terms, it is possible to distinguish between two broad
categories of operational indicators :
• Indicators related to the efficiency of operations
• Indicators related to market development.
Some examples are given in tables 3 and 4 (for more details, see
section 2).
Examples of operational indicators related to the efficiency of operations :
Business functions Operational indicators Impacts of standards
Management & Administration
Legal compliance Due to the use of standards, awareness has been built into management systems so that legal requirements can be easier traced
Research & Development
Manpower Due to the use of standards, the amount of work needed to develop a new product has decreased. This means that the cost for design engineers (hours × average cost) was reduced

26 Economic benefits of standardsISO Methodology 2.0 Part 1
Business functions Operational indicators Impacts of standards
Inbound logistics Non-conformant supplies Due to the use of standards, specifications for supplies can be met by more suppliers leading to more competition and better quality. This results in lower costs in handling a) rejections and b) product failures. The value is calculated as a reduction of a certain cost over time
Production Conformant products Reduced failures result in higher quality output, less re-work and less warranty claims
All business functions Accidents Reduced number of accidents and consequent injuries, deaths
Table 3 – Examples of efficiency indicators
Examples of operational indicators related to market development :
Business function Operational indicators Impacts of standards
Marketing & Sales Sales Due to the use of standards for new or modified products or improvements in production, the company increased sales revenues and profits
Access to existing markets that are new to the company
By meeting certain requirements stated in standards (regulatory or market expectations), the company can access markets that were previously closed to it
Creation of new markets Using certain standards, the company developed markets for a new type of product for which it occupies a monopoly position for a certain time
Table 4 – Examples of market development indicators
The selected indicators may not cover all the impacts of standards
on the selected business functions. Nevertheless, if chosen care-
fully, the impacts that can be determined and quantified for these
indicators may be significant enough to prove the degree to which
standards influence the operations of the company and contribute
to its value creation.

27Economic benefits of standards ISO Methodology 2.0 Part 1
Table 5 relates business function and operational indicators to measure
the impacts of the standards used :
Business functions Operational indicators (examples) Relevant standards
Management & Administration
Internal company information transfer and access to key information
Internal company processes are clearly defined and information is communicated to staff e.g. ISO 9001
Research & Development
Management system standards and information capture specifications ensure up-to-date information is available e.g. ISO 8000, ISO 9001, and specific technology standards
Engineering Flexibility in customized set-up of production equipment
Specific technology standards
Procurement Transparency in supplier relationships and contracting
Technical requirements for supplies are defined by reference to standards wherever possible
Inbound logistics High degree of fault detection Standards are used in sample checking of supplies, and in sampling and testing
Production/Operations
Efficient, flexible processes resulting in high-quality products and services
Standards are used to organize and monitor production processes
Outbound logistics Fast packaging process and reliable packaging of final products
Standards are used to operate packing and storage processes
Marketing & Sales Reputation for high quality and diversified product line
Reference to standards assures customers of quality and reliability of company
After-sales service Effective customer support and responsive complaints handling
Standards are used to establish customer service criteria and processes
Table 5 – Examples of operational indicators and relevant standards for main business functions
The key point to keep in mind is to collect information on operational
activities at a level which is as close as possible to where standards
are actually used. Examples of leading questions in this process are :
• Has the use of standards had an impact on the inputs needed to
perform a given task (e.g. the testing of materials) ?
• If yes, by how much has the amount of inputs used in this task
changed due to the use of standards ?

28 Economic benefits of standardsISO Methodology 2.0 Part 1
Step 4 : Assess and calculate results
The purpose of the whole assessment process is :
1. To quantify the impact from the use of standards through the
operational indicators and to aggregate these impacts for each
of the selected business functions ;
2. To convert the resulting quantities in financial figures, i.e. gross
profit, generated by the use of standards for each of the selected
business functions ;
3. To sum up the figures for all the selected business functions,
determining the total contribution of standards. Earnings Before
Interest and Tax (EBIT) or gross profit, is used as the key indicator
(see figure 11).
Economic benefits : EBIT key measure to assess the creation of economic value
EBIT = Earnings Before Interest and Tax
It is the key indicator applied for the assessment and is taken as a measure of the company’s value creation. EBIT expresses the gross profit of a company, i.e. revenue minus cost, at a given point in time.
Figure 11 – EBIT – the key measure to assess the creation of economic value
It is expected that the use of standards leads to a change in the value
of the operational indicators for the selected business functions. This
impact, converted into financial terms, shows that the value created
by the company is increased a) by reducing costs, b) by contributing
to higher revenues or c) a combination of both.
For example, “ cost savings ” for the procurement of materials and
components is an operational indicator which is measured directly in
financial terms. The reduction of “ manpower needed to complete the
design of products ”, however, is an operational indicator that needs

29Economic benefits of standards ISO Methodology 2.0 Part 1
to be converted into estimated cost savings on the basis of average
company data for the sector, such as the average cost of personnel
with the required qualification, the number of projects, etc.
Likewise, “ increased sales ” due to the contribution of standards to
access certain markets, is another operational indicator measured di-
rectly in financial terms. However, it should be noted that to calculate
the gross profit generated, direct costs (e.g. for production associated
with these extra sales) need to be subtracted from the sales revenue.
EBIT
Aggregate
Revenue
Costs
Convert
Increased domestic sales
Increased export sales
...
Increased productivity
Reduced waste
...
Understand
Calculate• Sum-up individual
contributions to determine total contribution to the company EBIT • Transform the variations of operational
indicators in financial terms
• How much : quantify the impact of standards on the operational indicators selected for the relevant business functions (i.e. variation in a given timeframe)
• What : identify the most relevant standards that support activities of the business functions in scope
Impacts of standards measured with operational indicators (examples)
Figure 12 – Measurement of the impacts of standards using operational indicators and converting measured impacts into EBIT contribution
As outlined in figure 12, all the data collected for the operational
indicators are converted into financial values. The financial values are
aggregated to determine the overall impact of the use of standards
for the company or the business function(s) being assessed. This
final value is the total contribution of standards to the EBIT of the
selected company.

30 Economic benefits of standardsISO Methodology 2.0 Part 1
Figure 13 highlights the relationship between value drivers, op-
erational indicators applied for the quantification of the impact of
standards that contribute either to revenues or costs and how they
are then summed up in the overall contribution to the company EBIT.
R & D effectiveness
Sales effectiveness
Control over after-market
Focused value chain coverage
Quality of production processes
VALUE DRIVERS
EBIT
Revenue
Costs
Marketing & sales costs
Service revenues/ total revenues
Product design time
Depreciation Production capacity
Time to market
Production costs Defect rate
Sales volume/ sales employee
Demand
SELECTED OPERATIONAL INDICATORS
}
Figure 13 – Analyze value drivers, select operational indicators, measure impacts and calculate EBIT contribution

31Economic benefits of standards ISO Methodology 2.0 Part 1
1.6 Basic approach to measuring the impacts of standards
In general, the approach to assessing the impact of standards consists
in comparing a situation 1 (standards not used) with a situation 2
(standards used) (see figure 14).
Operational indicators• Efficiency
- Cost- Time- Waste- Conformity rates- others
• Market development- Sales- Take-up of new products- Price- others
No use of certain standards
Use of certain standards
Situation 1 Situation 2
Figure 14 – Basic approach in the assessment : Comparison between situation 1 and 2
1.6.1 Before-after comparison
The simplest case is a before-after comparison : An organization
may have migrated from a situation 1 when it did not use standards
towards a situation 2 when it uses certain standards. In such a case,
there may be data available for company operations before and after
the introduction of certain standards which allows to make a compari-
son and to quantify the impact of the implementation of standards.
32 Economic benefits of standardsISO Methodology 2.0 Part 1
The same approach of “ before-after ” can be applied if a company
migrates from using one set of standards (situation 1) to another
set of standards (situation 2), e.g. by migrating to a new edition of
a standard or a set of standards.
In some cases, situation 1 and 2 can represent snapshots of the
conditions at subsequent instances in time (time1 and time
2). In other
cases, when data is not available for comparable instances in time,
data for a situation 1 or 2 may have to be calculated as an average
over a longer period of time (in extreme cases even over several years).
In other cases, it can be justified to consider projections. As an ex-
ample, certain standards may not be widely used yet, but, under
the assumption that they would, projections could be made for the
benefits that would result if the standards would be applied (situ-
ation 1 being the current situation and situation 2 the conditions
assumed in the projection). An example are standards for supply parts
which are used by a single company : Assuming that these standards
were used throughout the industry with consequent lower prices for
these types of supplies would give an impression what the impacts
of these standards could be, in case of a wide use of the standards.
1.6.2 Comparing concurrent conditions – Projects
Another type of comparison is the following : standards may be used
in certain projects, e.g. due to customer requirements or for sales in
certain markets, whereas they may not be used for other similar pro-
jects. In such a case there exists a concurrent relationship between
situation 1 and 2.
Irrespective of whether the before-after or the concurrent relation-
ship is applied in a case study, the assessment attempts to identify
the difference between the two situations and, through applying the
same indicators in the comparison, to determine and quantify the

33Economic benefits of standards ISO Methodology 2.0 Part 1
contribution of the standards. The same approach is applied if an or-
ganization has migrated from using one set of standards (situation 1)
to using another set of standards (situation 2).
1.6.3 What-if comparison
Another approach is the comparison resulting from a “ What-if ”-as-
sumption, which is based on estimating how certain activities/processes
would be performed without standards (situation 1) and comparing
such a condition with the existing situation, in which standards are
applied (situation 2). Such a comparison can be made by applying
the insights of company experts or by substituting the missing data
for the company being analyzed with data for the same or compa-
rable functions from similar companies from the same industry with
a similar size etc.
1.7 Collecting the data and limitations in their availability
The data needed for the assessment is obtained through desk research
and the use of available statistical and other industry data (see step 1
in section 1.5) as well as through interviews and workshops with
company representatives (mainly in steps 2 and 3). Preference should
be given to interviewing heads of business functions or managers
at similar operational levels, trying to combine as best as possible
technical knowledge regarding the company operations (and the
way standards are used to support them) with understanding of the
company business fundamentals.
If possible, and if data is available, information obtained through
interviews with company experts should be compared and related
to information about the whole industry and similar companies.

34 Economic benefits of standardsISO Methodology 2.0 Part 1
The collected information is finally aggregated to calculate the overall
value created by the use of standards in the particular company (in
step 4).
Some of the data needed to assess the impacts of standards, such
as nonconformity rates of product, time needed to operate certain
processes, volume of production, manpower costs etc., may be readily
available. Other data may be lacking.
If there is not sufficient data available or the data is not considered to
be reliable enough for a calculation, data obtained from assessments
of the same or similar functions in other comparable companies or
data estimated by company experts can be used to fill in the gaps.
1.8 ISO Methodology toolbox
The ISO Methodology contains a toolbox that can be used to sup-
port the assessment process, as well as the recording of information
and the calculation of the impacts of standards. These tools have a
support function, but are not a condition for a successful application
of the methodology.
An overview of the individual tools is given at Annex C.

ISOMETHODOLOGY 2.0ISOMETHODOLOGY 2.0ISOMETHODOLOGY
EBS, ISO, MET, HOD, OLO, GY, 2.0, EBS, ISO, MET, HOD, OLO, GY, 2.0, EBS, ISO, MET, HOD,
OLO, GY, 2.0, EBS, ISO, MET, HOD, OLO, GY, 2.0, EBS, ISO, MET, HOD, OLO, GY, 2.0, EBS,
ISO, MET, HOD, OLO, GY, 2.0, EBS, ISO, MET, HOD, OLO, GY, 2.0, EBS, ISO, MET, HOD, OLO,
GY, 2.0, EBS, ISO, MET, HOD, OLO, GY, 2.0, EBS, ISO, MET, HOD, OLO, GY, 2.0, EBS, ISO,
MET, HOD, OLO, GY, 2.0, EBS, ISO, MET, HOD, OLO, GY, 2.0, EBS, ISO, MET, HOD, OLO, GY, 2.0, EBS, ISO, MET, HOD, OLO, GY, 2.0, EBS, ISO, MET, HOD, OLO, GY, 2.0, EBS, ISO, MET,
HOD, OLO, GY, 2.0, EBS, ISO, MET, HOD, OLO, GY, 2.0, EBS, ISO, MET, HOD, OLO, GY, 2.0, EBS, ISO, MET, HOD, OLO, GY, 2.0, EBS, ISO, MET, HOD, OLO, GY, 2.0, EBS, ISO, MET, HOD, OLO, GY, 2.0, EBS, ISO, MET, HOD, OLO, GY, 2.0, EBS, ISO, MET, HOD, OLO, GY, 2.0, EBS, ISO, MET, HOD, OLO, GY, 2.0, EBS, ISO, MET, HOD, OLO,
Insights from case studies
2

36 Economic benefits of standardsISO Methodology 2.0 Part 2
This part provides examples from case studies to clarify key aspects
of the ISO Methodology 1). In some cases, reference is made to the
full text of individual case studies.
2.1 Value chains
2.1.1 Identification of an industry value chain for a company assessment
If the impacts of standards are assessed for a particular company, the
identification of the industry value chain serves mainly to understand
the interfaces of the company with its main suppliers and custom-
ers. Such an insight can contribute to a better understanding of the
operations of the company and its dependence on its upstream and
downstream markets. Information about the industry value chain can be
collected through desk research and interviews with industry experts.
In case it is difficult to obtain such information, the following practi-
cal approach is suggested. As shown in figure 15, place the chosen
company in the center of a value chain. Then determine the key sup-
pliers that provide inputs directly to the company (in the form of raw
materials, parts, equipment, fuels, consultancies etc.). These suppliers
are referred to as “ direct ” suppliers of the company.
Then determine the main suppliers of the direct suppliers, who are
referred to as “ indirect ” suppliers as seen from the perspective of
the company. Do the same for the customers and identify first the
main direct customers to whom the company delivers its goods or
finished parts. Then determine the main customers which are served
by the outputs produced by the direct customers of the company
(the “ indirect ” customers).
1) The collection of case studies available in February 2013 consists of 21 company case studies.

37Economic benefits of standards ISO Methodology 2.0 Part 2
Indirect suppliers
Direct suppliers Company Direct
customersIndirect
customers
Figure 15 – Approach to the development of an industry value chain
Typically, such a description is sufficient for the purpose of under-
standing the main external interfaces of the company and locating
it in the industry value chain.
Depending on the industry and on the specific characteristics of the
company, other factors can also be of key importance, such as the
structure and characteristics of the competition and the regulatory
environment.

38 Economic benefits of standardsISO Methodology 2.0 Part 2
Examples of industry value chains from case studies
Figure 16 gives an overview of the industry value chain of the au-
tomation industry which was developed in the project with Festo,
Brasil (Brazil). In the model industry value chain the operations of the
company are placed in the middle between suppliers and customers.
It should be noted that the necessary level of detail of value chains
depends always on the needs of each specific assessment.
CustomersSuppliers
Pneumatic and electric automation technologies
Machines
Integrated systems
Metal Oil and gas
Plastics Food and beverages
Mechanical components Automotive
PackagingElectric and electronic components
Other industries
Installation and after-sales services
Figure 16 – Automation industry value chain (Festo, Brazil)

39Economic benefits of standards ISO Methodology 2.0 Part 2
Figure 17 provides an overview of the industry value chain of the
chocolate manufacturing industry developed in the project with
Chococam, Cameroon. In a similar form, the operations of the com-
pany are shown in the center of the industry value chain between
suppliers and customers.
Raw materials (national suppliers) Cocoa, Peanuts, Sugar
Raw materials (imported) Milk, Oils, Glucose, ...
Technical equipment
Spread and manufacture of chocolate powder
Chocolate forming
Confectionery
Wholesalers national market
Distributors export market
Supermarkets
Dealers
Small retailers
Export market (CEMAC, Nigeria)
National market (4 regions)
...
...
...
Suppliers Consumers
Figure 17 – Chocolate manufacturing industry value chain (Chococam, Cameroon)

40 Economic benefits of standardsISO Methodology 2.0 Part 2
The example in figure 18 is from a case study of the Dalian Shipbuild-
ing Industry Corporation, China, which applies a segmentation of the
industry in up-, mid- and downstream activities.
Upstream Midstream Downstream
Raw material
Support equipment manufacture
Components and parts
Ship design
Ship manufacture
Ship-owner (client) Shipping Ship
repairingShip
breaking
Offshore engineering equipment
Derived value chain of ocean engineering
Oil well construction Oil exploration
Oil exploitation
Petroleum refining and sale Oil consumer
End client
Supplier
Supplier
Supplier
Supplier
Figure 18 – Shipbuilding industry value chain (Dalian Shipbuilding Industry Corporation, China)
41Economic benefits of standards ISO Methodology 2.0 Part 2
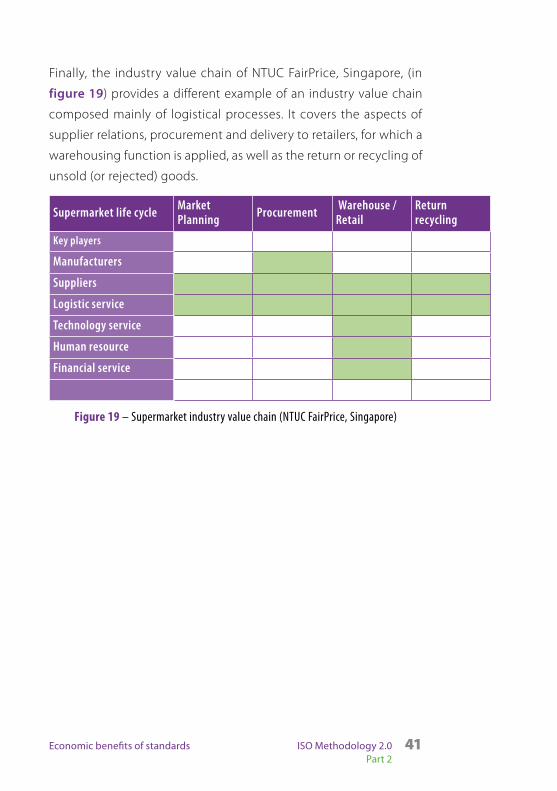
Finally, the industry value chain of NTUC FairPrice, Singapore, (in
figure 19) provides a different example of an industry value chain
composed mainly of logistical processes. It covers the aspects of
supplier relations, procurement and delivery to retailers, for which a
warehousing function is applied, as well as the return or recycling of
unsold (or rejected) goods.
Supermarket life cycle Market Planning Procurement Warehouse /
RetailReturn recycling
Key players
Manufacturers
Suppliers
Logistic service
Technology service
Human resource
Financial service
Figure 19 – Supermarket industry value chain (NTUC FairPrice, Singapore)

42 Economic benefits of standardsISO Methodology 2.0 Part 2
2.1.2 Company value chain
It is recommended to start a company analysis by collecting informa-
tion about the company from various sources, such as annual reports,
company publications, catalogues and others, as well as interviews
with company staff. A quality manual of the company (with related
documentation) is particularly useful, because it often provides a
well-thought out, structured view of the company business processes
and organizational structure.
It is then recommended to try to map this information to the com-
pany value chain model developed by Michael Porter (see figure 2
in 1.4.1). In some instances, there may be a good fit between the
model and the company operations, in particular if the company is
a manufacturing company. In other cases, it may be necessary to
adapt this model to the core processes of the chosen company (see
e.g. the value chain of NTUC FairPrice).
It is important that the value chain model is adapted in the analysis
to the realities of a specific company so that the model reflects the
core process stages of the company (as the primary activities) as well
as the main functions that support the core process (as the support-
ing functions).
Examples of company value chains from case studies
Figure 20 is from a case study of the company Xinxing Ductile Iron
Pipes (China) and shows the main activities in the business functions
of its value chain (which matches the original model developed by
Porter).

43Economic benefits of standards ISO Methodology 2.0 Part 2
Management & administration
Research & development
Engineering
Procurement : including procurement of raw materials, fuels, and charges
Inbound logisticsProduction/operation : iron making, steel
Outbound logistics
Marketing & sales
After-sales service
Train and truck transport
Making steel, steel rolling, and pipe casting
Train and automobile transport
Sales of cast and steel pipe and steel grating plate products
Figure 20 – Company value chain (Xinxing Ductile Iron Pipes, China)
Figure 21 is from a case study of Gerfor, a PVC pipe company in Co-
lombia, showing the grouping of key activities into business functions.
A Direction and management
B R&D /
Engineering
C Procurement
Direction, Planing and improvement, Internal Quality Audit - IQA, Client service
Development of finished product, Development of raw materials
National purchases, International purchases, Dealers
Raw materials conformity
Mixes Extrusion Injection
Recovered Welding
Conformity of finished product,
Store Management,
Delivery of finished product
Marketing Sales
Technical assistance
Support activities
Pipeli
ne pr
oduc
tion fl
ow
D Logistics (input)
F Logistics (output)
E Operations
G Marketing and
sales
H Services
Figure 21 – PVC pipe manufacturing company value chain (Gerfor, Colombia)

44 Economic benefits of standardsISO Methodology 2.0 Part 2
The next example in figure 22 is from a case study of a food company
in Egypt, Juhayna Food Industries, and their fruit juice manufacturing
operations.
Management & Administration
Projects
Supply chain
Research & Development (R&D) and Quality management
Marketing Manufacturing Sales & Distribution Customer RelationshipManagement
(CRM)
Figure 22 – Company value chain (Juhayna Food Industries, Egypt)

45Economic benefits of standards ISO Methodology 2.0 Part 2
2.2 Identify the impacts of standards
In some cases, tables of the key activities performed by the various
business functions have been developed with an associated listing
of the standards used in these activities. Some examples are shown
in tables 6 and 7 below.
Holcim Lebanon
Business function
Activities External standards(currently used)
Year when standards were first introduced(possibly an earlier edition than that currently used)
Management and administration
ISO 9001:2008ISO14001:2004
20032004
Procurement ISO 9001:2008ISO14001:2004
20082004
Production
Quarry and preparation of raw material
EN 197-1:2004NL 53:1999ISO 9001:2008ISO 14001:2004
2004199920032004
Clinker production NL 53:1999ISO 9001:2008ISO 14001:2004ASTM D 388:1999ASTM C 465:1999
19992003200420112011
Grinding ISO 14001:2004ISO 9001:2008
20042003
Table 6 – Activities and standards used (Holcim Lebanon, Lebanon)

46 Economic benefits of standardsISO Methodology 2.0 Part 2
Business function Activities Standards Description
Manufacturing
Raw material reception
ISO 22000:2005ISO 17025:2005
• Food safety management systems• General requirements for the competence
of testing and calibration laboratoriesMaterials preparation : sugar syrup and other production ingredients
GMP standardsISO 22000:2005
• General requirements for the competence of testing and calibration laboratories
• Good manufacturing practice• Food safety management systems
Mixing process GMP standardsISO 22000:2005
• General requirements for the competence of testing and calibration laboratories
• Good manufacturing practice• Food safety management systems
UHT treatment (pasteurization)
GMP standardsISO 22000:2005
• General requirements for the competence of testing and calibration laboratories
• Good manufacturing practice• Food safety management systems
Filling and packing GMP standardsISO 22000:2005
• Good manufacturing practice• Food safety management systems
Palletizing GMP standardsISO 22000:2005
• Good manufacturing practice• Food safety management systems
Storing until dispatch to distribution centre
ISO 22000:2005 • Food safety management systems
Table 7 – Activities in the production function and standards used (Juhayna, Egypt)
In other cases, a more detailed analysis has been conducted, result-
ing in process maps showing the main activities undertaken by the
company inside a business function. In some cases important stand-
ards used have been mapped to the stages where the standards are
used. Examples of process maps are given in figures 23, 24 and 25.

47Economic benefits of standards ISO Methodology 2.0 Part 2
Receiving & checking materials
Materials preparation Mixing
Palletizing PasteurizationFilling & Packing
Start
Storing final products Release
Figure 23 – Production process map (Juhayna, Egypt)
Preparation of mould
Spinning/vibrating
Detensioning
Reinforcing
Tensioning of PC wire
Demoulding Steam curing
Stacking & water curing
Concrete pouring
Mould closing
Figure 24 – Production of concrete piles process map (PT. Wijaya Karya, Beton, Indonesia)

48 Economic benefits of standardsISO Methodology 2.0 Part 2
UPVC pipes manufacturing
Dry blend preparation
Approved suppliers list for purchase of raw materials
Mixing of UPVC powder with required additives as per product application
Testing of dry blend
Mixed and tested material released for production
Material on hold incoming inspection effected
Incoming raw material accompanied with certificate of quality and technical data sheet
Coq’s indicates compliance to following :• K value DIN 53726• Apparent bulk density ISO 60• Volatile matter ISO 1269• Sieving test ASTM-D-1921• Residual VCM ASTM-D-3749
In-house test :• Bulk density ISO 60• Sieving ISO 2591-1• Flow ability ISO 6186-1
In process test :• Bulk density ISO 60• Sieving ISO 2591-1• Flow ability ISO 6186-1• Thermal stability ISO 182-2
Figure 25 – Pipe manufacturing and standards used (PPP PSL, Mauritius)

49Economic benefits of standards ISO Methodology 2.0 Part 2
2.3 Scoping the assessment
It is important to scope the assessment in a realistic way in order to
achieve results in the given time frame and within the limits of avail-
able resources. It is particularly important to minimize the use of the
time spent by company experts, involving them in key, well-prepared
steps (more details about timing and resources are given in section 4.)
Depending on the company’s size and on the project’s objectives,
the scope of an assessment can be :
Limited to one or a few business functions, covering :
• An individual site of a company
• One or more business units or product lines (which may comprise
several companies belonging to the same holding firm)
• The whole company (this is normally feasible only for small or
medium-sized companies).
The scope of the assessment can also be restricted to a given set of
standards, or even to just one standard, applied in one or more busi-
ness functions. However, the basic approach of the ISO Methodology
privileges the assessment of the overall standards’ contribution to a
relevant part of a company business (or the whole business). Nearly
all the case studies developed by NSBs and ISO so far have considered
a multiple set of standards used by at least one business function.
In the vast majority of the case studies undertaken (14 out of 21),
three to five business functions have been investigated. One or two
business functions have been considered in five cases and six or more
in the remaining two (see figure 26).
The focus of a study and the selection of business functions should
always be determined by considering which business functions play
a major role in a company and where standards have a visible role for
the operations or the business success of a company.

50 Economic benefits of standardsISO Methodology 2.0 Part 2
8 BFs
6 BFs
5 BFs
4 BFs
3 BFs
2 BFs
1 BF1
1
4
55
3
2
Figure 26 – Case studies and number of business functions (BFs) assessed in each of them
2.4 Determine value drivers
Value drivers are key capabilities of a company through which it
creates competitive advantages and builds the basis for its business
success. In some cases, a value driver can be associated with activi-
ties of a particular business function. In other cases it may extend
to activities performed by several business functions or even certain
operations of the whole company.
Examples of value drivers from the case studies
Below a list of value drivers identified in a number of case studies is
shown :
VINAKIP, Vietnam – Electrical appliances
• Safety and quality of products
• Continual improvement

51Economic benefits of standards ISO Methodology 2.0 Part 2
• Competitive pricing
• Customer focus
NTUC FairPrice, Singapore – Supermarket, food logistics
• Partnership with suppliers
• Quality of products and processes
• Safety compliance
• Efficiency of processes
• Sales effectiveness and customer retention
Gerfor, Colombia – Plastic pipes / Construction materials
• Distribution channels
• Customer service
• Product quality
• Production capacity
• Process efficiency
Xinxing Ductile Iron Pipes, China – Construction materials
• Innovation and new product development
• Efficient and lean procurement function
• Efficient production of higher-value added products
• Aggressive marketing and new market development
Water Senegal, Senegal – Water services
• Ability to deliver water in the required quality and quantity
• Network maintenance
• Efficient billing system, recovery and customer relationship system
• Capability to expand the water delivery network
Mapei, Italy – Ceramic tiles / Construction materials
• Product innovation
• Product quality and reliability
• Customer service

52 Economic benefits of standardsISO Methodology 2.0 Part 2
• Health, safety and environmental protection
Please note that the toolbox of the ISO Methodology contains a
value driver map (see tool TB_08) with a listing of some key value
drivers which can be used as a check-list to identify value drivers in
a particular project.
2.5 Identify operational indicators and principles of calculation
Operational indicators are used to measure the impacts of standards
on the activities performed by the selected business functions and to
quantify their contribution to the company’s value creation (expressed
as contribution to the company EBIT).
The selection of the right operational indicators is one of the most
critical tasks of the assessment process.
To be effective, operational indicators need to be highly representa-
tive of the activities of the business functions under investigation, in
order to determine performance in a reliable manner. Additionally,
there needs to be a relationship between the operational indicators
and the use of standards, in order to determine the standards’ impacts.
Good insight from the company experts is essential – although it
may not be easy or immediate to obtain. In-depth discussions may
be needed, along with re-consideration of issues and the comparison
of different opinions.
Operational indicators are usually selected in the following two steps :
1. Firstly, performance indicators already associated with the activi-
ties under investigation are considered, along with other possible
ones that could be relevant to the scope of the analysis. Com-
panies that have implemented successfully the ISO 9001 quality
management standard tend to have in place a structured set of

53Economic benefits of standards ISO Methodology 2.0 Part 2
key performance indicators for the various business processes
and business functions. Indicators that are regularly monitored
represent a useful basis.
2. The preliminary list of indicators needs to be critically reviewed,
to determine which ones are impacted by the use of standards
and if information is available (either through company data or
experts’ estimates) to quantify the impact of the standards.
In a final step a set of operational indicators is selected from the list
of indicators for the quantification.
Even if the assessment will be performed with only a few operational
indicators, the results of such an analysis will be beneficial in terms
of process insight, giving the opportunity to refine and improve the
evaluation of the role and impact of standards in the future.
Examples of operational indicators for different business functions
Tables 8, 9, 10, 11, 12 and 13 give for the various business functions
operational indicators from the case studies that have so far been
concluded. In some instances, there may be an overlap between
different indicators.
Business function : Research and development (R&D) / Engineering
Activities Operational indicators Definition
Product development research Savings in time due to the application of standards in research resulting in increased reliability
Average failure rate of products (before & after the introduction of standards)

54 Economic benefits of standardsISO Methodology 2.0 Part 2
Activities Operational indicators Definition
Dissemination of research results and transfer of information (through the quality management system)
Time for dissemination Saving of time through the dissemination of information due to the provision of standards indicators (e.g. for material specifications, process specification and standardization of aspects of the product, which are transformed into work instructions, operational procedures, brochures etc.)
Developing product specifications
Savings due to not having to write specifications internally
Using existing standards for materials, products, processes etc., the company has savings (money, time, human resources) otherwise needed to write internal specifications
i. New products marketedii. Production process
improvementiii. Product development
1) Number of new products accepted by customers over the number of products of the company
2) Number of complaints related to new products
3) Number of projects initiated per month
4) % of projects completed on time5) Number of new processes
deployed divided by the number of new processes developed
The first two indicators seek to assess the effectiveness of new product development ;indicators 3 and 4 concern the efficiency of R&D work ;the fifth indicator assesses the effectiveness of R&D’s process improvement activities
Product development Clearer product specifications : Standardized specifications of the suppliers’ products make it easier to collect relevant information
Personnel costs : costs per year for developers
Research/Product development Better internal information transfer : Using standardized documents and specifications improves dissemination of product and service information within R&D
Personnel costs : costs per year for developers

55Economic benefits of standards ISO Methodology 2.0 Part 2
Activities Operational indicators Definition
Equipment set-up for manufacturing of different products
Time needed to prepare facilities, equipment for the production of other products
Time needed before and after the use of standards
Table 8 – Examples of operational indicators for Research and Development / Engineering
Business function : Procurement
Activities Operational indicators Definitions
Supplier selection Order availability on time Avoidance of misunderstandings about required specifications for supplied raw materials and other goods
Information exchange with suppliers
Time spent on communication with supplier
Time spent on communicating product requirements, regulatory requirements, standard compliance, package size, quality, etc. while placing orders and general matters
Contracting Contracting activities with suppliers
Long term contracts are concluded with selected suppliers on the basis of their quality and standards in factory reducing the number of suppliers
Complaints handling Number of customer return cases
Customer return cases from retail store due to spoilt product after purchase
Screening of suppliers ; selection of suppliers ; negotiating and contracting ; monitoring
Reduction in costs for supplier management
By applying standards for materials, the company can cooperate with more reliable suppliers and can reduce the cost for supplier management in terms of time and human resources
Supplier communication Work savings Hourly cost of concerned personnel (HH/year) / Time reduction for processing orders ( %) / Time-to-market (days)
Table 9 – Examples of operational indicators for Procurement

56 Economic benefits of standardsISO Methodology 2.0 Part 2
Business function : Inbound logistics
Activities Operational indicators Definitions
Testing of incoming raw materials
Through the communication of requirements for supplies and the reference to standards, the resources needed for testing of raw materials has been reduced and fewer tests are performed
a) Time, number of people and other resources needed for the testing of supplied goodsb) Percentage of nonconforming material supplied
Internal checks Number of nonconformities Cases of supplied product not meeting quality or other requirements of standards
Table 10 – Examples of operational indicators for Inbound logistics
Business function : Production / operations
Activities Operational indicators Definitions
Waste handling Amount of production of waste (products that have to be disposed of and cannot be re-used or repaired)
Rate of waste generated before and after the use of standards
Product testing Reduction in costs for testing final products
Development of the costs for final product testing before and after the use of standards
Continuous improvement Saving of costs in production by continual improvements
By implementing a quality management system according to ISO 9001 and applying continual improvement processes to promote initiatives, the company can save a significant amount of costs in production in terms of time, human resources, materials and can achieve product improvements
Materials handling Savings of materials in production Measurement of the development of savings due to improved handling of materials before and after the introduction of standards
Quality of production Reduction of cost in handling rejections, reworking and repairing of defects
Reduction of cost compared to the previous cost in handling rejections, reworking and repairing of defects

57Economic benefits of standards ISO Methodology 2.0 Part 2
Activities Operational indicators Definitions
Project management Time taken from mobilization to handing over of a particular project (project cycle time)
Time compared to the previous project cycle time
Minimizing defective work at hand over
Reduction of rework/repair during project completion
Reduction of cost arising due to less additional material and time
Reliability and stability of the production process
Through the use of standards to monitor systematically the production process,the control over the process has increased
Conformity rate of the goods produced
Continuous production The breakdown hours/production stops
Reduction in the breakdown hours
Production output Increase in production volume Increase in production volume before and after the use of certain standards
Energy consumption per unit of product
Energy consumption (fuels, electricity etc.) in relation to the total production output
Costs for energy per unit volume of production
Reduction of waste Reduction of waste Cost savings due to the reduced generation of waste
Saving in use of raw materials
Through a new design of wall pipes (with a three-layered structure) raw materials could be saved while retaining the performance characteristics of the product
Reduction of use of raw materials and savings thereby ; improvement of environmental record by using less materials (and also reducing waste and emissions)
Table 11 – Examples of operational indicators for Production/operations

58 Economic benefits of standardsISO Methodology 2.0 Part 2
Business function : Marketing and sales
Activities Operational indicators Definitions
Marketing and sales Increase of sales Due to new or modified products or due to improvements in production, the company can increase sales revenues and profits
Access to existing markets that are new to the company
By meeting certain requirements (regulatory or market expectations), the company can access markets that were previously closed to it
Creation of new markets By developing a new type of product, the company creates a new market and has for a certain period of time a monopoly position in this market
Bill generation Reduction in time taken to calculate and prepare the interim bills on monthly basis for the construction
Time consumed to prepare the monthly bills
Table 12 – Examples of operational indicators for Marketing and sales
Business function : After-sales service
Activities Operational indicators Definitions
Customer service/complaints handling
Response to enquiries by customers Due to clearly defined processes customer enquiries about the functionality of products as well as complaints can be handled quickly and satisfactorily
Warranty compensation Replacement costs for non-functional products (warranty)
Measurement of the development of costs for compensation payments due to warranty claims
Table 13 – Examples of operational indicators for After-sales service

59Economic benefits of standards ISO Methodology 2.0 Part 2
2.6 Calculate the impacts of standards
To calculate the impacts of standards, a number of aspects need to
be considered.
2.6.1 Time frames for the assessment of impacts
It is assumed that during a certain period after the introduction of
the standards, impacts can be measured, through the variation of the
values of the selected operational indicators.
Over time, the impacts diminish or are no longer visible as the stand-
ards become part of the day-to-day operations of the company. It is
therefore suggested that assessments do not extend beyond a period
of five years 2) after the introduction of the standards.
2.6.2 Approaches to calculation
The approaches to quantify the impact of standards on the selected
indicators have been described in section 1.6 (“ before-after ”, “ com-
paring concurrent conditions – projects ”, “ what-if ”). Experience has
shown that the “ before-after ” comparison is usually the most ef-
fective. It is therefore recommended, as the first choice, to make the
best effort to apply it, even if the input from company experts may
at first indicate that data are not available. It is worth trying to dig
into the matter in some detail, asking different questions to stimulate
the understanding and ideas from the experts (e.g. by refining the
selected indicators, or trying to identify new ones, always focusing
on variables that can be quantified).
Please note that the assessment of standards impacts is a non-con-
ventional type of analysis which is rarely part of established company
2) There may be a few exceptions, justified by the context – e.g. see the case studies of NTUC
FairPrice or Mapei.
60 Economic benefits of standardsISO Methodology 2.0 Part 2
practices. For most people and organizations, this is something new
and it requires looking at things from a different perspective.
2.6.2.1 Separation of impacts from standards from other factors
The way to calculate the contribution of standards to the company
EBIT varies in relation to the specific situations.
In what follows, we provide an outline of the most frequently used
types of indicators, of how the standards impact is expressed in
terms of variation of the indicators’ value and of how that variation
is translated in financial contribution to the company EBIT.
Please recall that to perform these calculations correctly, it is important
to isolate the specific impact deriving from the use of standards from
other factors, e.g. organizational changes and new technologies, to
determine the variation of the value of operational indicators.
For example, a productivity increase is achieved for certain activities
after the introduction of standards. This improvement is determined
by changes in the work practices that have been driven by the new
standards – but also by organizational changes and the use of newly
introduced technology. In such a case, company experts need to
evaluate as objectively as possible what is the relative contribution
of the different factors that influence the result.
An approach that has proven to be effective consists of putting the
same questions separately to different company experts with good
knowledge of the context. Possible diverging estimates can then be
reconciled through in-depth discussions, which usually result in an
improved understanding of the context and in more reliable, shared
assumptions.
In practical terms, a percentage of the total operational indicator
variation is finally attributed to the impact of standards.

61Economic benefits of standards ISO Methodology 2.0 Part 2
2.6.2.2 Indicators expressing a direct versus an indirect financial contribution
“ Direct financial contribution ” means that the indicator already
expresses a financial impact, either as an absolute figure or as a
percentage.
For example, the variation of the “ cost of procurement ” for a given
category of goods or services indicates “ cost savings ” (or “ cost in-
creases ”) : an item which represents in itself a contribution to the
company EBIT. As an example, annual cost savings of USD 500 000
(an absolute figure), mean a contribution of USD 500 000 to the
company gross profit. If the variation is expressed in percentage, see
section 2.6.2.3.
In case of increased sales, one needs to keep in mind that increased
sales deriving from facilitated access to certain markets represent a
“ direct ” financial impact. However, the actual contribution to the
company EBIT is determined by the amount of increased sales less,
as a minimum, the direct costs 3) associated with them. For example,
an annual increase in export sales of USD 2 million would generate
a contribution to the company gross profit of USD 2 million less the
cost for the manufacturing of these goods, sales and transport. As-
suming a 50 % cost of goods, the resulting EBIT contribution would
be USD 2 million – 1 million = USD 1 million.
“ Indirect financial contribution ” means that an indicator expressed
as a non-financial impact needs to be converted into a financial im-
pact. Consider for example the indicator “ professional time ” needed
to design a product. In this case, if we determine that, due to the
use of certain standards, the team of engineers in charge of product
3) Only " direct costs " are deducted under the assumption that only additional marginal costs
are required to achieve these extra sales. If that is not the case, a full cost deduction could
be more appropriate, including direct costs plus overheads.

62 Economic benefits of standardsISO Methodology 2.0 Part 2
development (e.g. five people) saves 60 hours per month, in order
to determine the cost savings we need to know the average cost for
company engineers. Assuming an average cost of USD 100 per hour,
the annual cost savings for the company would be USD 60 × 100 × 12
= 72 000 and this would be the contribution of standards to the
company EBIT.
2.6.2.3 Absolute figures versus percentages
If the variations of the indicators’ values are expressed in absolute
figures, they can be converted into contributions to the company
EBIT either directly, if they are “ direct financial contributions ”, or by
converting them into financial figures using appropriate company
data, as in the previous example regarding professional time.
Most often, however, quantifications are given in percentages. The
examples below describe the steps to convert such valuations into
absolute financial figures.
Example 1 :
The total cost for the design of machine parts in a company after
standards have been introduced are USD 1 000 000. It is estimated
by company personnel that the use of standards has reduced the
total costs by 10 %. This means that the current total design costs
of USD 1 million already take account of the impacts of standards.
Calculation :
Total actual costs (after standards were introduced – in USD) : 1 000 000Cost reduction due to standards 10 %Total costs (without or before the use of standards) 1 111 111
Estimated cost reduction due to standards 111 111

63Economic benefits of standards ISO Methodology 2.0 Part 2
Explanation :
If the total actual cost, which includes the reduction due to standards, is
1 million USD and the use of standards has contributed to the reduction
by 10 %, the costs without or before the use of standards is calculated
as follows :
Total cost = Total actual cost /(1-10 %) : 1 million / 0,9 = 1 111 111
The cost reduction of costs due to standards is therefore 10 % of
USD 1 111 111 = 111 111.
For simplicity, it is often useful to make an approximation and apply
the standards impact assuming as a baseline the current actual costs.
In example 1, this would mean 100 000 versus 111 111.
Example 2 :
In the costs of project development, it is estimated that professional
time saved through the use of standards is 20 %. Labour represents
80 % of the project development costs. The impact of standards on
project development costs can be determined as 20 % of 80 %, i.e.16 %
of project development costs.
The calculation is then made as in the previous case.
Calculation :
Total actual costs for project development (after standards were introduced – in USD) :
10 000 000
Cost reduction due to standards (in USD) 16 %Total costs (without or before the use of standards) 11 904 761
Estimated cost reduction due to standards 1 904 761

64 Economic benefits of standardsISO Methodology 2.0 Part 2
Example 3 :
The failure rate in manufacturing/production was reduced by 30 % due
to standards. Since 10 % of the overall engineering costs are related
to production failures, the impact from standards can be estimated
to be around 3 %.
The current total cost for manufacturing/production is USD 1 million
and it already includes the contribution from the use of standards. As
shown below, the cost base has therefore to be adjusted to reflect
this impact :
USD 143 000 = 100 000/(1 – 0.3).
From this basis, the impact of standards is then calculated as
(= 0.3 x 143 000).
Better quality of equipment and supplies – Standards help implement quality management more effectively
Has this impact had a significant effect on your function due to standards introduced or modified in the past five years ?
Yes
Overall engineering costs (USD m) 1Percentage of overall engineering costs related to failures 10 %Reduction of the failure rate due to new quality management standards 30 %Total financial impact on adjusted cost base (USD) 42 900
Example 4 : NTUC FairPrice, Singapore
This study focused on three business functions, which are procure-
ment (comprising sourcing and supplier management), warehous-
ing/distribution (in two main central warehousing and distribution
centers of NTUC) and retail (comprising the provision of goods to
the retail outlets, including final quality check, processing of returns
etc.). Based on an identification of key standards applied by NTUC
FairPrice, the following areas and impacts of standards were selected
for the assessment :

65Economic benefits of standards ISO Methodology 2.0 Part 2
• Cold chains to support refrigeration and therefore delivery over
larger distances of perishable products and related standards
• Bar codes that are used in package identification, warehouse
management and distribution
• Pallet standards used in package storage and delivery
The impacts of the use of the standards were estimated by NTUC man-
agers on the basis of a total set of 21 operational indicators, such as :
• Time to undertake a process
• Quantity of packages being processed
• Productivity of staff
• Volume of sales
• Operational cost
• others
The calculations of cost savings were undertaken on the basis of cost
averages for staff and operations and related to the increased sales
revenues. It turned out that the standards had significant impacts in
terms of efficiency gains and increase in output (see details of the
calculation in table 14).
Finally, it was assumed that the standards had an average impact of
five years, so the average annual contribution in an area of operations
of NTUC was spread over five years, which then resulted in a valuation
of the total impacts of the identified standards.
However, it needs to be noted that, because the standards were
introduced at different times, their impacts and EBIT contributions
became also visible at different times.

66 Economic benefits of standardsISO Methodology 2.0 Part 2
Average annual impacts of standards across different business
functions at NTUC FairPrice (in Singapore Dollars – SGD)
Period : 1999 – 2009
Standards (by subject area) Procurement
Distribution Centre Retail Total In SGD
GLS FFDC
Cold Chain Milk and Dairy
7,613 - 31,613 102,451 141,677
Cold Chain Chilled Pork
18,935 - - 622,704 641,639
Standard Pallet - 713,600 - - 713,600
Carton Barcode - 3,064,551 - - 3,064,551
TOTAL 26,548 3,778,151 31,613 725,156 4,516,467
Table 14 – Example for a calculation of the impacts of standards – NTUC FairPrice, Singapore
Example 5 : Festo Brasil, Brazil
In the case study of Festo, Brasil, the key impacts of standards were
identified in the business functions procurement, engineering and
production/operations.
The EBIT impacts of standards were calculated as follows :
Procurement
Procurement costs for metals make up 30 % of the total procure-
ment cost. Procurement costs for plastics and other items : 20 % of the
total cost. The impact of standards on the procurement function has
been identified as (i) work savings, and (ii) purchase savings. As far as
work savings are concerned, the amount of work needed to complete
Festo Brasil’s purchasing process for non-standards based metals is
estimated to be five times higher than for standards-based metals.

67Economic benefits of standards ISO Methodology 2.0 Part 2
Orders for standards-based metals represent about 7.5 % of total
orders. Personnel cost for the purchasing department is 40 % of BRL
13 million, that is, BRL 5.22 million.
Savings due to the use of standards in processing orders can therefore
be estimated as 80 % of 7.5 % of BRL 5.22 million, or about BRL 312 912
per year.
In purchase savings – the second standards impact – standards-based
goods cost on average 30 % less than non-standard-based ones. Or-
ders for standards-based metals represent about 7.5 % of total orders.
Savings due to the use of standards-based metals can therefore be
estimated as 30 % of 7.5 % of BRL 143 million, or about BRL 3 219 750
per year, or 2.25 % of procurement costs.
Engineering
Two types of impacts have been identified in the engineering func-
tion : (i) work savings (design time) and (ii) savings due to reduction
in project time.
Savings in design time due to implementing certain key standards
used in product design impacted about 33 % of engineering man-
power. In addition :
• Estimated design time savings were about 10 %
• Personnel cost for the engineering department is 50 % of BRL 7.16
million, i.e. BRL 3.58 million per year
• Savings from using the respective standards can therefore be
estimated as 10 % of 33 % of BRL 3.58 million or BRL 118 058 per
year, or 1.6 % of the cost of the engineering function.
For savings from reduction in project time :
The total amount of engineering hours per month required from
product design to production set-up was estimated at 2 670 hours
Estimated total time reduction was 5 %

68 Economic benefits of standardsISO Methodology 2.0 Part 2
Hourly cost of personnel was BRL 127
Total cost of personnel was BRL 338 670 per month, or BRL 4.07 mil-
lion per year
Savings from using standards for geometrical and positional tolerances
can therefore be estimated as 5 % of 4.07 million which amounts to
around BRL 203 202 per year.
Production/operations
The major impact of standards on the production/operations function
has been in production efficiency gains. Here, the mix of measures
introduced through the standards-driven continual improvement
process has enabled the company to achieve BRL 1.59 million sav-
ings in production costs (about 13 % of total 2010 production). The
implementation of standards was estimated to have contributed
about one third of this improvement, or about BRL 524 700.
The total EBIT contribution of standards to the operations of Festo,
Brasil, is given in table 15 :
Business function Operational indicators Financial impact (in Brazilian Real – BRL)
Procurement Work savings 312 912Purchase savings 3 219 750
Engineering Work savings (design time) 118 058Savings due to reduction in project time 203 202
Production/operations Gain in production efficiency 524 700
Total EBIT impact of standards 4 378 622
Table 15 – Calculation of the total EBIT impact of standards in Festo, Brasil (Brazil)
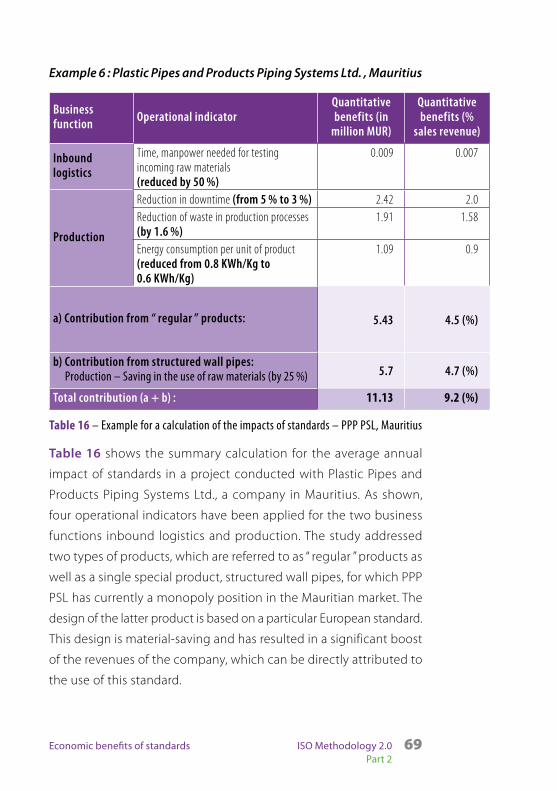
69Economic benefits of standards ISO Methodology 2.0 Part 2
Example 6 : Plastic Pipes and Products Piping Systems Ltd. , Mauritius
Business function Operational indicator
Quantitative benefits (in
million MUR)
Quantitative benefits (%
sales revenue)
Inbound logistics
Time, manpower needed for testing incoming raw materials (reduced by 50 %)
0.009 0.007
Production
Reduction in downtime (from 5 % to 3 %) 2.42 2.0Reduction of waste in production processes (by 1.6 %)
1.91 1.58
Energy consumption per unit of product (reduced from 0.8 KWh/Kg to 0.6 KWh/Kg)
1.09 0.9
a) Contribution from “ regular ” products: 5.43 4.5 (%)
b) Contribution from structured wall pipes: Production – Saving in the use of raw materials (by 25 %) 5.7 4.7 (%)
Total contribution (a + b) : 11.13 9.2 (%)
Table 16 – Example for a calculation of the impacts of standards – PPP PSL, Mauritius
Table 16 shows the summary calculation for the average annual
impact of standards in a project conducted with Plastic Pipes and
Products Piping Systems Ltd., a company in Mauritius. As shown,
four operational indicators have been applied for the two business
functions inbound logistics and production. The study addressed
two types of products, which are referred to as “ regular ” products as
well as a single special product, structured wall pipes, for which PPP
PSL has currently a monopoly position in the Mauritian market. The
design of the latter product is based on a particular European standard.
This design is material-saving and has resulted in a significant boost
of the revenues of the company, which can be directly attributed to
the use of this standard.

70 Economic benefits of standardsISO Methodology 2.0 Part 2
2.7 Dealing with limitations in the availability of data
2.7.1 Estimations based on experience
In some instances, data are not sufficient to allow a comparison. In this
case, missing data needs to be replaced by estimations by company
staff with the necessary experience.
2.7.2 Extrapolations
In some instances, no data are available for a certain indicator for a
particular company. In this case, data (or the percentage impact) can
be considered that has been calculated for another company of the
same or a similar industry for the operational indicator. However, care
needs to be taken when considering such an approach.
2.7.3 Aggregation
Finally, the calculated data for the impact of standards for the selected
business functions are aggregated and calculated as a percentage of
the EBIT of the company. This leads to the final result of the impact
of standards on the chosen business function(s) or the company as
a whole (depending on the scope applied in the assessment).

ISOMETHODOLOGY 2.0ISOMETHODOLOGY 2.0ISOMETHODOLOGY
EBS, ISO, MET, HOD, OLO, GY, 2.0, EBS, ISO, MET, HOD, OLO, GY, 2.0, EBS, ISO, MET, HOD,
OLO, GY, 2.0, EBS, ISO, MET, HOD, OLO, GY, 2.0, EBS, ISO, MET, HOD, OLO, GY, 2.0, EBS,
ISO, MET, HOD, OLO, GY, 2.0, EBS, ISO, MET, HOD, OLO, GY, 2.0, EBS, ISO, MET, HOD, OLO,
GY, 2.0, EBS, ISO, MET, HOD, OLO, GY, 2.0, EBS, ISO, MET, HOD, OLO, GY, 2.0, EBS, ISO,
MET, HOD, OLO, GY, 2.0, EBS, ISO, MET, HOD, OLO, GY, 2.0, EBS, ISO, MET, HOD, OLO, GY, 2.0, EBS, ISO, MET, HOD, OLO, GY, 2.0, EBS, ISO, MET, HOD, OLO, GY, 2.0, EBS, ISO, MET,
HOD, OLO, GY, 2.0, EBS, ISO, MET, HOD, OLO, GY, 2.0, EBS, ISO, MET, HOD, OLO, GY, 2.0, EBS, ISO, MET, HOD, OLO, GY, 2.0, EBS, ISO, MET, HOD, OLO, GY, 2.0, EBS, ISO, MET, HOD, OLO, GY, 2.0, EBS, ISO, MET, HOD, OLO, GY, 2.0, EBS, ISO, MET, HOD, OLO, GY, 2.0, EBS, ISO, MET, HOD, OLO, GY, 2.0, EBS, ISO, MET, HOD, OLO,
Summary of findings
3

72 Economic benefits of standardsISO Methodology 2.0 Part 3
3.1 Findings from company case studies
3.1.1 Overview
ISO has worked with over 20 of its members, national standards bodies
in different countries, to develop case studies to assess and quantify
the benefits companies can obtain from the use of standards. These
projects were undertaken in close cooperation by the ISO member
body, a company in its country, staff of the ISO Central Secretariat
acting as advisors to the project team and, in many cases, an academic
institution. The studies were conducted between October 2010 and
May 2012 and are published in two volumes of the book, Economic
benefits of standards, International case studies, the first published in
August 2011 and the second in August 2012. All case studies are
publicly available at : www.iso.org/benefits_of_standards.
3.1.2 Selection of companies
The selection of the companies for the projects was made by the ISO
members in the various countries. The only requirements were that
the company had been a user of standards at least for a number of
years and that the member body had a good relationship with the
company, to make sure that key staff in the company would be avail-
able for interviews and discussions with the project team. Table 17
shows the spread over different industries of the companies assessed
in the 21 case included in the two volumes of this book.
Manufacturing companies constitute the large majority of the se-
lected companies which is not a surprise, considering the historical
relevance of technical standards for manufacturing.

73Economic benefits of standards ISO Methodology 2.0 Part 3
Industries Countries Volume 1 or 2
Agri-food businessCameroonPeruEgypt
212
Chemical industry Thailand 1
Construction & construction materials
BotswanaIndonesiaItalyLebanonSouth AfricaSri Lanka
112212
Electrical appliances Vietnam 1
Electrical power transmission Germany 1
Food retail/food logistics Singapore 1
Heating, ventilation, air conditioning Jordan 2
Industrial automation equipment Brazil 1
Information & telecommunication Germany 1
Pipes and piping systemsChinaColombiaMauritius
212
Shipbuilding China 2
Water supply Senegal 2
Table 17 – Industries and countries covered by the case studies
An overview of the business functions where standards had the most
impact in the companies and which therefore have been the subject
of assessment is given in table 18. It shows that production is the
business function most frequently assessed, followed by marketing
and sales, procurement and R&D/Engineering.
The size of the companies varied from small companies with 25
employees and annual sales revenue of around USD 4.5 million to

74 Economic benefits of standardsISO Methodology 2.0 Part 3
companies with several thousand employees and annual revenue
of over USD 2 billion.
3.1.3 Key benefits of standards resulting from the case study findings
The results demonstrate consistently that companies achieve benefits
from using standards. From the company case studies it is possible to
identify three main forms of benefits from the use of standards :
Key benefit 1 : Streamlining internal operations
Standards can be used to streamline the internal processes of com-
panies : e.g. by reducing time needed to perform specific activities
within the various business functions, decreasing waste, reducing
procurement costs and increasing productivity in production and
engineering. Gains in efficiency also occur through the reduction
of transaction costs with suppliers and customers : Most of the case
studies provide evidence of this type of impact and the benefits of
using standards are valued, in terms of contribution to the companies’
EBIT or gross profit, between 0,15 % and 5 % of the annual sales
revenues of the companies.
Key benefit 2 : Innovating and extending the scale of company
operations
Some case studies provide examples that standards are used as the
basis for innovating business processes, such as cold chains used
in the transport of perishable goods, allowing the extension of the
geographical market for food supply. In other cases, standards helped
to reduce the risk to companies of introducing new types of prod-
ucts to national markets. Standards can also be used as a basis for
the international expansion of companies by providing a common
management framework.

75Economic benefits of standards ISO Methodology 2.0 Part 3
Key benefit 3 : Creating or entering new markets
Other case studies show that standards have been used as a basis for
the development of new products, for entering new markets (both
domestic and export), for supporting market take-up of new products,
or creating markets. (The term “ new product ” refers either to products
that are completely new or which may have existed already, but are
new to a particular national market). In special cases the impact of
standards could exceed the figure mentionned before by far, reach-
ing a contribution to the companies’ gross profit of up to 33 % of
annual revenue, helping a company to achieve a leading position
in its market, at least for a certain period of time.
By applying key standards, a company may be able to shape or to
access new markets. In such cases, standards can play a central role in
creating confidence for potential customers in a new technology or in
building trust that a company which enters a new market will be able
to consistently deliver products and services with the required quality.
The case studies did not attempt to quantify the benefits derived
from participating in standards development. However, the analysis
indicates that when standards play an important role for entering
new markets or promoting new products, companies tend to be
significantly engaged in standards development and, in some cases,
they have a leadership position (at national or international level).
Consistent with the above, case studies also provide evidence that a
focus on standards can be the core of an upgrading strategy through
which companies aim at entering higher value-added segments of
the value chain in their respective industries.

76 Economic benefits of standardsISO Methodology 2.0 Part 3
Busin
ess F
unct
ions
(BFs
) sub
ject
to ca
se st
udy
asse
ssm
ent
Prim
ary
BFs
Supp
ort B
FsAd
ditio
nal B
Fs
Com
pani
es/C
ount
ries
Inbo
und
Log
Prod
uctio
nOu
tbou
nd
Log
M&S
Afte
r Sa
les
M&A
R&D
Engi
neer
ing
Proc
urem
ent
S&L
Reta
il
PT. W
ijaya
Kar
ya
(Indo
nesia
)×
××
×
NTUC
Fairp
rice
(Sin
gapo
re)
××
×
PTT
Chem
ical
(Tha
iland
)×
×
VINA
KIP
(Vie
tnam
)×
××
××
Fest
o Br
asil
(Bra
zil)
××
×
Gerf
or (C
olom
bia)
××
DanP
er Tr
ujill
o (P
eru)
××
××
Loba
tse
Clay
Wor
ks
(Bot
swan
a)×
PPC
Cem
ent
(Sou
th A
fric
a)×
××
×
Siem
ens A
G (G
erm
any)
××
Nano
tron
(Ger
man
y)×
××
PPP
PSL (
Mau
ritiu
s)×
××
Juha
yna
Food
Indu
strie
s (E
gypt
)×
××
×

77Economic benefits of standards ISO Methodology 2.0 Part 3
Busin
ess F
unct
ions
(BFs
) sub
ject
to ca
se st
udy
asse
ssm
ent
Prim
ary
BFs
Supp
ort B
FsAd
ditio
nal B
Fs
Com
pani
es/C
ount
ries
Inbo
und
Log
Prod
uctio
nOu
tbou
nd
Log
M&S
Afte
r Sa
les
M&A
R&D
Engi
neer
ing
Proc
urem
ent
S&L
Reta
il
Petr
a En
gine
erin
g (J
orda
n)×
××
××
Holc
im Le
bano
n (L
eban
on)
××
××
Mag
a En
gine
erin
g
(Sri
Lank
a)×
××
Dalia
n Sh
ipbu
ildin
g (C
hina
)×
Xinx
ing
Iron
Pipe
s (C
hina
)×
××
××
××
×
SDE
(Sen
egal
)×
××
××
Choc
ocam
(Cam
eroo
n)×
××
××
Map
ei (I
taly
)×
××
××
×
TOTA
L :6
182
133
89
311
31
M&
S =
Mar
ketin
g &
Sal
es /
/ M
&A
= M
anag
emen
t &
Adm
inis
trat
ion
// R
&D
= R
esea
rch
& D
evel
opm
ent
// S
&L
= S
tora
ge &
Log
istic
s
Tabl
e 18
– B
usin
ess F
unct
ions
(BFs
) sub
ject t
o ass
essm
ent i
n th
e cas
e stu
dies

78 Economic benefits of standardsISO Methodology 2.0 Part 3
3.2 Findings from industry sector case studies
A summary of the analysis and of the findings of the global automo-
tive industry case study is given in Annex A.

ISOMETHODOLOGY 2.0ISOMETHODOLOGY 2.0ISOMETHODOLOGY
EBS, ISO, MET, HOD, OLO, GY, 2.0, EBS, ISO, MET, HOD, OLO, GY, 2.0, EBS, ISO, MET, HOD,
OLO, GY, 2.0, EBS, ISO, MET, HOD, OLO, GY, 2.0, EBS, ISO, MET, HOD, OLO, GY, 2.0, EBS,
ISO, MET, HOD, OLO, GY, 2.0, EBS, ISO, MET, HOD, OLO, GY, 2.0, EBS, ISO, MET, HOD, OLO,
GY, 2.0, EBS, ISO, MET, HOD, OLO, GY, 2.0, EBS, ISO, MET, HOD, OLO, GY, 2.0, EBS, ISO,
MET, HOD, OLO, GY, 2.0, EBS, ISO, MET, HOD, OLO, GY, 2.0, EBS, ISO, MET, HOD, OLO, GY, 2.0, EBS, ISO, MET, HOD, OLO, GY, 2.0, EBS, ISO, MET, HOD, OLO, GY, 2.0, EBS, ISO, MET,
HOD, OLO, GY, 2.0, EBS, ISO, MET, HOD, OLO, GY, 2.0, EBS, ISO, MET, HOD, OLO, GY, 2.0, EBS, ISO, MET, HOD, OLO, GY, 2.0, EBS, ISO, MET, HOD, OLO, GY, 2.0, EBS, ISO, MET, HOD, OLO, GY, 2.0, EBS, ISO, MET, HOD, OLO, GY, 2.0, EBS, ISO, MET, HOD, OLO, GY, 2.0, EBS, ISO, MET, HOD, OLO, GY, 2.0, EBS, ISO, MET, HOD, OLO,
Practical organization of case studies
4

80 Economic benefits of standardsISO Methodology 2.0 Part 4
4.1 Company case studies
For a listing of the key activities typically undertaken in cases studies
and their organization, please refer to the project planning tool in
the tool box (see tool TB_10).
There are three pre-requisites for the selection of a company :
• It must be a significant user of standards since several years (at
least 3 years)
• There should be good relations with senior company management
(to ensure access to company data and experts)
• It should be interested in an assessment and in the outcome of
the study
To undertake an assessment of the impacts of standards on a com-
pany, make sure before you start that you have the staff, the time and
the budget to conduct the project 1). Have a preliminary idea of the
scope of the study at an early stage – Is it likely to assess a single or a
selected number of business functions within a company, a business
unit or the company as a whole ? Besides deriving your choice from
an initial company analysis, you should also consider the following
time and resource issues :
• Capacity : As the project requires intensive work, it is recom-
mended that the person conducting the assessment (or the person
responsible for conducting interviews and drafting the report, if a
project team is established) works on it full-time. As a minimum,
around 50 % of his/her time should be dedicated to the project.
1) Please consider that the first project will most probably require more effort than subse-
quent projects.

81Economic benefits of standards ISO Methodology 2.0 Part 4
• Time : Based on the experiences gained in the case studies, a total
duration of 3-4 months 2) should be assumed for the assessment
of an organization. This may be longer or shorter, depending on
specific factors.
• Budget : The budget required depends mainly on a) the location
of the company and whether costs for travel occur, b) whether
external consultants need to be hired and c) whether study reports
need to be purchased (such as industry studies), d) whether al-
lowances for internships of students are to be paid. If none is the
case, the only cost factor is the working hours of staff involved
in the study.
Establish a key contact in the company who is your main contact
for all issues related to the project. This person may even formally
become a member of the project team. Ideally, this person should
have a position with some decision making power in the company,
such as a director, deputy director or head of function, and should be
well connected in the company. For many of the projects undertaken
by ISO and NSBs between 2010 and 2012, the primary company con-
tact was the head of the quality control or quality assurance business
function. In most cases, this has proven to be an excellent choice.
Experience has shown that often there is some hesitation in compa-
nies with regard to disclosing certain company-internal information.
Depending on the specific conditions, some information may not be
needed in a project. It is recommended in any case to sign a “ Dec-
laration of confidentiality “ in which the project team declares to
abstain from this closing confidential information outside the project
team and to submit a final project report to the company for approval
2) Please consider that the actual interaction with company experts may usually take much
less time – typically around one week. However, significant time intervals tend to pass
in subsequent iterations (e.g. for collecting new/missing data, feedback from company
experts, approval of findings). This is the main reason for the longer time needed.

82 Economic benefits of standardsISO Methodology 2.0 Part 4
before publication. A template for such a declaration is part of the
tool box (see tool TB_11).
Identify interview participants
To achieve the best results, it is recommended to interview 2-3 persons
per business function, including the heads of each function or their
deputies. Those interviewed must be well aware of which standards
are applied in their function and how, and able to estimate the impacts
of standards. If you analyze a business unit or a company, assess all
functions separately.
Arrange a date and time for any meetings well in advance to give
both sides the time to prepare adequately.
Interview schedulingStart setting up the interviews well in advance, as heads of functions usually have busy schedules.
International interviewsIf people from different countries are involved in the interviews, take into account the following :• Differences in culture/hierarchies• Holidays/vacation• Language issues

83Economic benefits of standards ISO Methodology 2.0 Part 4
Decide what type of interview is appropriate for your purpose. Table 19
provides an overview of different types of interviews :
Selection of interview type
Type of interview Advantages Disadvantages Recommendation :
Appropriate if…
Phone interview
• Time-efficient• Cost-efficient• Medium degree of
interaction
• May produce less representative results than in a face-to-face interview due to lack of trust
• For international calls, the sound quality might be an issue
…time and money are an issue…the interviewee and interviewer already know each other
Face-to-face interview
• Knowledge-efficient (highly efficient interviews in term of the outcome)
• High degree of interaction
• Cost- and time-intensive …interviewee and interviewer are geographically close to each other…quality of the outcome has high priority
Workshop
• Knowledge-efficient (highly efficient in terms of the outcome)
• Highest degree of interaction
• Cost- and time-intensive …two or more people can participate in the workshop and the quality of the outcome has high priority…participants wish to benefit from the meeting
Online questionnaire
• Time-efficient• Cost-efficient
• No interaction …time and cost are limited…the survey is conducted in different companies all over the world…in addition to the other types of interviews
Table 19 – Different types and formats of interviews
Set dates according to the availability of the participants. Depend-
ing on the business function your interview partner belongs to, you
may adapt your questionnaire. If you had already initial contact with
interview partners before, you may consider sending a questionnaire

84 Economic benefits of standardsISO Methodology 2.0 Part 4
to the interviewees beforehand (e.g. one week), to allow them time to
prepare. However, it is suggested to have a face-to-face contact first
before sending a questionnaire to avoid possible misunderstandings.
Please note that the tool box contains two basic questionnaires for
interviews (see tool TB_13).
Workshops
In some cases it may be useful to have a workshop bringing together
various participants from the same or different business functions.
Different options to organize workshops are shown in table 20 :
Possible workshop methods
1. Brainstorming Collect all ideas about a topic as they come up, write them down and organize them at the end (e.g. for collecting all standards in a company)
2. Discussion rounds - Ask each workshop attendee to comment on an open-ended question. After this first round, encourage the attendees to challenge the statements - This method is very useful if attendees from different functions participate. It allows them to first get an insight into the opinions of the members of other functions, and also gives them space to discuss them
3. Voting If there is a choice to be made between different options (e.g. prioritizing value drivers), you can conduct a vote between the participants
Table 20 – Different methods for organizing workshops
Take notes
Always take notes during interviews and workshops.
Iterative process
It may be necessary to repeat or extend interviews in the light of
additional data or inconsistencies of information obtained from dif-
ferent participants.

85Economic benefits of standards ISO Methodology 2.0 Part 4
Obtain data
Keep in mind that the aim of the interviews and workshops is to
quantify key impacts of standards on the business functions that are
being analyzed. Questions and answers should ultimately lead to
quantification in terms of EBIT impacts.
The quantification of the impacts of standards is the most critical (and
often most difficult) step of the assessment process.
In many cases, the main difficulty concerns the availability of data.
Most companies do not have specific data on standards impacts
and, in the majority of cases, quantifications need to be made by the
experts during the interviews. The attitudes of the company experts
vary and some are more comfortable than others in providing esti-
mates based on their knowledge and experience. The interviewers
should help and encourage the company experts during the analysis,
clarifying that approximate figures based on their best judgment are
fully acceptable for this type of assessment.
Quantification and calculating impacts
The methodology contains a calculation tool, which allows registering
data of the impacts of standards in financial terms and aggregating
the impacts over all selected business functions to a total EBIT con-
tribution of the standards (see tool TB_09).
Preparation of the final case study report
Summarize your findings in a final report. A reporting tool for case
studies is contained in the tool box (see tool TB_12). Please follow
this tool, but do not hesitate to adapt it wherever necessary.


ISOMETHODOLOGY 2.0ISOMETHODOLOGY 2.0ISOMETHODOLOGY
EBS, ISO, MET, HOD, OLO, GY, 2.0, EBS, ISO, MET, HOD, OLO, GY, 2.0, EBS, ISO, MET, HOD,
OLO, GY, 2.0, EBS, ISO, MET, HOD, OLO, GY, 2.0, EBS, ISO, MET, HOD, OLO, GY, 2.0, EBS,
ISO, MET, HOD, OLO, GY, 2.0, EBS, ISO, MET, HOD, OLO, GY, 2.0, EBS, ISO, MET, HOD, OLO,
GY, 2.0, EBS, ISO, MET, HOD, OLO, GY, 2.0, EBS, ISO, MET, HOD, OLO, GY, 2.0, EBS, ISO,
MET, HOD, OLO, GY, 2.0, EBS, ISO, MET, HOD, OLO, GY, 2.0, EBS, ISO, MET, HOD, OLO, GY, 2.0, EBS, ISO, MET, HOD, OLO, GY, 2.0, EBS, ISO, MET, HOD, OLO, GY, 2.0, EBS, ISO, MET,
HOD, OLO, GY, 2.0, EBS, ISO, MET, HOD, OLO, GY, 2.0, EBS, ISO, MET, HOD, OLO, GY, 2.0, EBS, ISO, MET, HOD, OLO, GY, 2.0, EBS, ISO, MET, HOD, OLO, GY, 2.0, EBS, ISO, MET, HOD, OLO, GY, 2.0, EBS, ISO, MET, HOD, OLO, GY, 2.0, EBS, ISO, MET, HOD, OLO, GY, 2.0, EBS, ISO, MET, HOD, OLO, GY, 2.0, EBS, ISO, MET, HOD, OLO,
Annexes

88 Economic benefits of standardsISO Methodology 2.0 Annexes
Annex A Assessment of economic benefits of standards to industry sectors
The ISO Methodology can be used to assess the impact of standards
on industry-sectors and this section describes the approach and steps
to be taken to that end.
The industry sector analysis is undertaken with the same approach as a
company assessment. Results of the assessment of sample companies
are aggregated to arrive at an evaluation of the impacts of standards
on an industry sector.
Firstly, it is important to understand the industry value chain and to
undertake an appropriate segmentation of the stages in the industry
value chain.
Secondly, select a sample of companies that can represent the core
segments of the industry value chain. For each of these companies
undertake a company assessment which includes face-to-face inter-
views with company staff as described for the company assessment.
After such assessments have been concluded or have reached an
advanced stage, extend the assessment further by investigating
additional companies of the relevant industry segments using less
time-consuming approaches such as sending out survey question-
naires and conducting telephone interviews.
Before you engage in a sector assessment, ensure that you have the
staff, time and budget to conduct such a project.
• Capacity : As the project requires intensive work, it is recommended
that the person conducting the assessment (or the project leader
if a project team is established) works on it full-time.
• Staffing : Depending on the amount of experience and knowledge
of the project team, it may be advisable to involve additionally

89Economic benefits of standards ISO Methodology 2.0 Annexes
industry consultants who can provide knowledge and details
about the industry and its use of standards.
• Time : To quantify the impact of standards in a whole industry
you will need realistically between four months and one year
depending on the size of the industry, the geographical scope
and the desired depth of the study.
• Budget : Calculate a budget for one and half full-time equivalent
persons (possibly with assistance) for the time of the project, and
a travel budget dependent on the size and geographical coverage
of the selected company sample.
It is important to underline that at the time of publication of this docu-
ment, the methodology had been applied to a single industry study,
covering the global automotive sector (published in January 2010).
This means that the experience gained to date is not yet comparable
to that acquired for company case studies. We expect the proposed
approach to be refined over time, on the basis of experience gained
from new studies.
Key steps in an industry sector assessment
The assessment of the impact of standards on an industry sector is
divided in three main steps : Preparation, assessment/aggregation of
company data and evaluation of results (see figure 27).

90 Economic benefits of standardsISO Methodology 2.0 Annexes
Preparation Assessment Evaluation1 2 3
• Define sector boundaries according to the industry value chain and in relation to supporting sectors
• Define geographical scope• Select organizations by
ensuring a heterogeneous sample (company type, size and location)
• Conduct the basic assessments for each company included in the sample (as described in section 1)
• Consolidate quantitative data on the industry level
• Benchmark individual company (and sub-sector) performance and attitudes
• Identify common patterns and deviations
Quantifying the impact of standards on an industry sector
Figure 27 – Three steps in the quantification of the impact of standards in an industry sector
Step 1 : Preparation
Define scope
The first requirement is a good understanding of the industry. This is
achieved by analyzing the industry value chain.
Compared to a company case study, an industry sector study requires
a deeper analysis of the industry structure and of its segments.
Initially, the industry is considered as a whole and it is particularly im-
portant to understand its boundaries. Typical questions to be answered
are : What is the core of the value chain for the industry ? How many
upstream and downstream value-added steps are to be considered ?
For example, raw materials are used by most manufacturing companies
within a large variety of sectors. However, they are often considered
just as input – in most cases all the activities related to finding, ex-
tracting and processing such materials are not part of the core value
chain of the manufacturing sectors using them.

91Economic benefits of standards ISO Methodology 2.0 Annexes
Consider the pharmaceutical manufacturing industry as an example
(see figure 28). The pharmaceutical industry develops, produces, and
markets drugs or pharmaceuticals licensed for use as medications. This
industry is actually a part of the broader chemical industry, which can
be subdivided into upstream basic and fine chemical industry. The
upstream basic chemical industry produces large volumes of basic
chemical products. The fine chemical industry produces complex,
single, pure chemical substances in limited volumes and at relatively
high prices. Fine chemicals are used as starting materials for specialty
chemicals, particularly pharmaceuticals, biopharmaceuticals and
agrochemicals.
The pharmaceutical industry can be further subdivided in sub-sectors.
Looking from another perspective, it can also be considered as part
of the health care industry.
Upstream chemical industry
Basic chemicals
Complex, single, pure chemical substances
Pharmaceutical industry
Agrochemical industry
...
Fine chemical industry
• pharmaceuticals• biopharmaceuticals• etc
• pesticides• fertilizers• etc
• ...• ...• ...
Figure 28 – The chemical and related industries and their outputs

92 Economic benefits of standardsISO Methodology 2.0 Annexes
Which industry and which core segments of an industry should be
considered ? This depends on the objectives and constraints of each
project. The analysis will help to identify the various components of
the industry and possible overlaps between segments and companies,
with a view to define clearly distinct sectors.
For this purpose, it is recommended to consult industry experts, in-
dustry associations, industry classifications, such as the International
Standard Industry Classification of All Economic Activities (ISIC) of the
United Nations Statistics Division, as well as key reference materials
published by national, regional and international agencies.
An overview of key industry classifications is given here :
http://en.wikipedia.org/wiki/Industry_classification
When developing an industry value chain, it is possible to test it
applying the approach described for the company value chain and
try to identify key types of suppliers and customers for each of the
segments in the industry value chain.
Another critical aspect concerns the definition of the geographical
scope of the study, which can be national, regional or international,
depending on the objectives and resources of the project.
Once the industry boundaries and geographical scope have been
defined, the analysis will explore in more detail the value chain of
the specific industry, considering its internal structure (sub-sectors,
inter-sector relations and interfaces).
The main company types need to be identified (i.e. companies fo-
cused on one or more segments of the value chain), along with other
relevant company characteristics (e.g. size, geographical coverage).
Key players (and their relations) in the main industry segments need
also to be mapped.

93Economic benefits of standards ISO Methodology 2.0 Annexes
The scope of the analysis is then finalized by selecting the segments of
the industry value chain considered most important or most promis-
ing in terms of contribution to the industry value creation, from the
perspective of the potential impact of standards.
Example from the global automotive sector study
Given the complexity of the industry and the available time and
resources, it was not possible to differentiate by type of vehicle. The
scope of the study was therefore restricted to the car segment of the
industry.
For the purposes of the study, the scope of the sector was further
restricted to its core segments, characterized by specific company
types (parts suppliers, car manufacturers, dealers, engineering ser-
vice providers and manufacturing service providers) covering, with
a different level of detail, the core elements of the sector value chain
which are highlighted in figure 29.
Vehicle life cycle
Design & development
Parts production
Vehicle production Distribution After-sales
serviceUsed car
salesReturn/
recycling
Key players
Manufacturers
Suppliers
Dealers
Manufacturing service providers
Engineering service providers
Financial service providers
Core activities Supporting activities In scope of study
Figure 29 – Automotive value chain and scope of study

94 Economic benefits of standardsISO Methodology 2.0 Annexes
The study had a global scope. Therefore, the most important geo-
graphical regions for the sector – in terms of volumes of production
and number of customers – were included in the study, which are
North America, Europe and Asia.
Select companies for the assessment
The assessment was conducted using a sample of companies that
represent the industry sector. An effective sample 1) can be set-up by :
• Selecting a heterogeneous set of companies, covering all the
company types matching the industry sub-sectors in scope
• Ensuring a balanced representation of companies, in terms of
market share, geography and size
Example from the global automotive sector study
A representative sample was selected considering the distribution
of value creation in the industry, the geographical coverage and the
size of companies. The result is highlighted in figure 30 (the sample
included more than 50 companies : the length of the bars represents
the number of different types of companies or organizations from
the indicated regions).
1) For the purpose of this analysis, an " effective sample " is considered a sample of companies
where the main different company types and geographical regions are represented in a
balanced way. This normally allows a good qualitative understanding of the sector, and to
perform useful quantitative estimates. If the objective of the study is to operate precise
sector-level quantifications, higher levels of representativeness of the sample need to be
considered : e.g. the sample should account for a certain percentage of the total industry
sales or market share, or include a statistically relevant number of companies for the main
company types.

95Economic benefits of standards ISO Methodology 2.0 Annexes
Americas Europe Asia
Manufacturer
Supplier
Dealer
Service provider
Association
Figure 30 – Field study sample – Companies/organizations and regions
Step 2 : Conduct assessment of the sample companies
The assessment of most of the individual companies in the sample
is carried out as described under section 1.5.
Two main differences, however, need to be considered :
• The learning curve effect : The understanding of the sector and
of the impact of standards on the companies belonging to it will
grow with the number of companies interviewed. Therefore, after
having identified some critical aspects through the first interviews,
these findings can be applied in the following interviews to
speed-up and refine the undertaking and to validate some of the
previous findings. Value drivers, types of standards impacts,
operational indicators, examples of calculations are the most
important aspects benefitting from this effect.
• The organization of field studies : A relatively limited number of
face-to-face interviews can be planned, which will then be com-
plemented by phone interviews and online surveys. The latter can
be organized in the second phase of an assessment project, using
questionnaires focused on a limited number of key questions,
which were developed on the basis of the knowledge and experi-
ence acquired through the first cycle of face-to-face interviews.

96 Economic benefits of standardsISO Methodology 2.0 Annexes
Example from the global automotive sector study
Value drivers
Value drivers are considered in order to set the right focus in assessing
the impact of standards. If a direct impact of standards on a value
driver is identified, it is given high priority in the assessment.
Through desk research, input from consultants and discussion with
company experts the main value drivers for companies in the auto-
motive industry were identified as innovation, efficiency and mar-
keting. Their importance varies for different company types in the
industry value chain (as shown in figure 31) : for manufacturers, the
production process and marketing activities are the key value drivers.
For the suppliers, technological innovation and the flexibility to adapt
to the manufacturers are essential. Dealers are very much depend-
ent on the marketing activities of the manufacturer but also need to
attract customers themselves, and so on.
Value driver Manufacturer Supplier DealerManufacturing
service provider
Engineering service
provider
Technology innovation
Lean manufacturing
Quality of production processes
Logistics capability
Product strategy
Flexibility to adapt to customer
Brand awareness
Economies of scale
Source : Roland BergerFigure 31 – Industry value drivers

97Economic benefits of standards ISO Methodology 2.0 Annexes
This general picture was used to guide the interviews with the com-
panies in the sample.
Impact of standards
The way and extent to which companies are affected by standards
vary by company type and function, as illustrated in figure 32.
Service
Marketing & sales
Logistics
Production
Procurement
R&D
Management & administration
Car manufacturer Suppliers
Engineering service
providersDealers
After-sales service
provider
1)
• Main impact for most companies in R&D with standards as basis for product development
• Procurement impact is most relevant mainly due to economies of scale
• Process standards in Production have high impact on quality
Comments
Low impact Medium impact High impact Focus of assessment 1) Spare-part distributors
Figure 32 – Intensity of impact from standards by company type and function
The analysis was focused on the following company types and busi-
ness functions for which it had become apparent that standards have
the highest impact :
• Company types : car manufacturers and parts suppliers
• Business functions : research and development, procurement and
production.

98 Economic benefits of standardsISO Methodology 2.0 Annexes
Step 3 : Evaluation : aggregate company data and evaluate results
After conducting the assessments of the individual companies in-
cluded in the sample, the contribution of standards to the company
EBIT will be determined for each company, supplemented by other
qualitative information on the impact of standards.
The individual company data need then to be used to obtain industry
sector outcomes. Two levels of analysis can be pursued :
• Estimation of a cumulative value of the impact of standards on
the sector (contribution to the total gross profit of the sector) by
aggregating individual company data
• Evaluation of the relative performances in the use of standards for
the various types of industry players (benchmarking)
Estimate the contribution of standards to the industry EBIT
The aggregation of impacts at the industry level is determined as
follows (see figure 33) :
1. Define reasonable categories for the aggregation. “ Company
type ”, i.e. belonging to a given industry segment, represents the
first choice. This means that data will be first combined for the
companies belonging to a given industry segment, and then at
the whole industry level.
2. Calculate the average of the total impact of standards on the
different company types, weighted by the total EBIT. To do this,
consider company type 1. Take the EBIT impact of each company
of type 1, and divide it by the company’s current EBIT. Sum up
these values for all the companies of type 1, and then divide the
total by the number of companies of type 1 assessed. Repeat this
for all the company types assessed.

99Economic benefits of standards ISO Methodology 2.0 Annexes
3. Finally, multiply the value obtained in step 2 for each company
type, with the total EBIT of the corresponding company type. Then
add up those final EBIT impacts per company type to get the total
industry EBIT impact.
EBIT impact on companyCompany EBIT
Investigated suppliers
EBIT impact on companyCompany EBIT
Investigated manufacturers
EBIT impact on companyCompany EBIT
...
Number of investigated suppliers
Number of investigated manufacturers
Number of investigated ...
Total EBIT of all suppliers in the market
Total EBIT of all manufacturers in the market
Total EBIT of all ... in the market
∑ :
:
:
×
×
×
∑
∑
∑ =Total industry EBIT impact
Figure 33 – Calculation of EBIT impact at industry level
Other parameters might be used as weighting factors to support
the aggregation of data – e.g. market capitalization. The choice of
parameter may depend on external factors such as industry trends,
the current economic situation, etc.

100 Economic benefits of standardsISO Methodology 2.0 Annexes
Example from the global automotive sector study
Standards impact on the core business functions.
Impacts from standards on the core business functions (R&D, procure-
ment, manufacturing – complemented, in some cases, by marketing
and sales) were calculated for the companies in the sample belong-
ing to the two most important company types (car manufacturers
and parts suppliers). Figure 34 visualizes the results for some of the
companies assessed.
Impact: Reduced product development costs
EBIT impact: USD 13 m
Management & Administration
Procurement Inbound Logis- tics
Produc-tion/ Oper-ations
Outbound Logistics
Marke-ting & Sales
Service
R&D
Company: Supplier
Country: Germany
Impact: Improved quality management
EBIT impact: USD 22 m
Company: Supplier Country: Canada
Impact: Improved customer confidence
EBIT impact1): USD 592 k
Company: Service provider
Country: Germany
Impact: Efficient reception of goods
EBIT impact: USD 140 k
Company: Dealer
Country: Czech Republic
Impact: Improved internal information transfer
EBIT impact: USD 43 m
Company: Car manufacturer Country: India
1) Assuming 5% EBIT margin Source: Roland Berger
Figure 34 – Model cases of the impact of standards
For each company, the impact of standards on the three core business
functions was divided by the total revenues of the companies. The
weighted average of these ratios was than taken for each company
type and core function. Since the estimates were derived from a
relatively small sample size, the results were given as a range with
the lower bound being 70 % of the estimated values.
The total impact on the three core functions was then expressed as
a percentage of revenues for the two most relevant company types :
original equipment manufactures (OEM) and suppliers. This allows

101Economic benefits of standards ISO Methodology 2.0 Annexes
the estimation of the combined effect for the two company types 2)
and then, considering the relative weight of their market segments,
the total impact at the industry level.
Benchmarking
Various levels of analysis can be conducted on the basis of the quan-
titative and qualitative data collected.
A first level, based on the quantifications, concerns the industry seg-
ment (“ company types ”). It is possible to rate the relative impact of
standards for the various industry segments and to look for qualita-
tive information to understand if and why standards have different
impacts on the various industry segments. This type of analysis can
also be conducted considering different company groupings (e.g.
companies of a given size or geographical region).
A second level, also based on the quantifications, is focused on the
business functions. It is interesting to evaluate the relative impact of
standards on the main business functions analyzed, and to investigate
possible differences among industry sectors.
A third level is focused on individual companies, comparing companies
within industry segment and within the whole industry. Individual
company impacts can be mapped, identifying various performance
levels. This information can be combined with other information – in
particular, the position of the company in the value chain, its power
within the industry, its attitude towards standards and its capability
in using them.
This analysis can be used to position companies in the industry, to
understand how industry and company specifics can influence the
ability of a company to take value from standards and to identify
2) Some of the impacts e.g. for the procurement function need to be subtracted to avoid
double-counting in the aggregation (details can be found in the full report).

102 Economic benefits of standardsISO Methodology 2.0 Annexes
industry leaders in the use of standards versus followers and those
who are unaware of the benefits of standards (see figure 35).
Position in value chain
Power within industry
Theme relevance
Market novelty
DESCRIPTION Indicators
• Car manufacturer X has power and can impose specific standards on its supplier
• Car manufacturer X is a moderator/influencer due to its relatively high power in the industry
• Standards are an established theme in the automotive industry and of middle importance
• Car manufacturer X is an experienced player in the automotive industry and also experienced in the use of standards
How do industry and company specifics impact the corporate value creation due to standards ?
How can the company maximize the value contribution from standards ?
• Through car manufacturer X’s innovation attempts new standards arise regularly
• Car manufacturer X promotes its own standards
Seeker Leader
Ignorant Follower
B
D
A
C
Pro-active
Re-active
Low High
Stan
dard
at
titud
eStandard capabilities
A C
B D
Strategic significance of standards is recognized and reflected throughout the organization
Good internal systems and processes with dedicated resources for implementation of standards
Specific standards are demanded or adopted due to their strategic value
Standards are not considered management decisions
Adopter Moderator Influencer
Pow
erEx
perie
nce
Incumbent Market entry
Theme maturity
Indu
stry
re
leva
nce
Figure 35 – Analysis of the attitude of a company with regard to standards

103Economic benefits of standards ISO Methodology 2.0 Annexes
Findings from the global automotive industry case study
The field study sample was designed to cover a variety of company
types, sizes and geographical locations as shown in figure 36.
Americas Europe• 1 car manufacturer• 4 suppliers• 2 associations
• 4 car manufacturers• 8 suppliers• 3 dealers• 3 service providers• 3 associations
Asia• 5 car manufacturers• 5 suppliers• 2 associations
Figure 36 – Geographical distribution of the companies involved in the case study of the automotive industry
The study revealed that standards affect procurement functions
as follows :
• They help car manufacturers and suppliers reduce the variety
of supply categories, with a positive impact on costs (making it
possible to purchase in larger quantities)
• They help to make the procurement process more efficient (de-
creasing the time needed to manage the process), and simplify
contractual agreements
• Standardized components, even if they only account for a limited
portion of the car, are offered at lower prices.

104 Economic benefits of standardsISO Methodology 2.0 Annexes
Standards’ impact on the research and development and engineer-
ing functions include :
• Lower research costs from defined material and test standards
• Reduction of product development costs varying, depending on
the level of adherence to external standards by car manufactur-
ers. The closer company standards are to external standards, the
higher the costs savings
• Supply costs are reduced, since specifications are more easily met
by potential suppliers
• Process standards positively impact product development costs.
For example, when combined with a range of defined testing
standards, quality management systems lower costs and achieve
comparability on the market for suppliers.
For the production function, the main impact comes from quality
management standards, both for car manufacturers and suppliers (as
well as for some service providers) :
• Measurable improvements result from quality management
standards such as ISO/TS 16949, Particular requirements for the
application of ISO 9001:2000 for automotive production and relevant
service part organizations
Car manufacturers can also better integrate suppliers into their sup-
ply chains. Using data gathered through interviews, various types of
data aggregation and estimates have been performed, including :
• Aggregation of impacts from standards on core business functions
(R&D/engineering, procurement, production) for a single company
• Aggregation of total impacts from standards for a company
• Estimate of the total impact from standards on one of the core
business functions for the entire industry
• Estimate of the total impact from standards for the entire industry.
A variety of company cases were considered in the study. The

105Economic benefits of standards ISO Methodology 2.0 Annexes
results show an incidence of the impact from standards rang-
ing from 0.15 % to about 3 % of turnover – depending on the
company and the business function analyzed.
The estimate of the total impact from standards on the three core
business functions for the entire industry has been given in percent
of revenues for the two most relevant company types, manufacturers
(OEMs) and suppliers (see figure 37). Since the estimates have been
computed from a relatively small sample size, the results are given
as a range with the lower bound being 70 % of the estimated values.
OEMs
SUPPLIERS
RANGE OF AVERAGE EFFECT COMBINED EFFECT
1.29 % – 1.84 %
1.19 % – 1.70 %0.56 % – 0.80 %1.81 % – 2.58 %0.017 % – 0.024 %
1.43 % – 2.05 %0.64 % – 0.91 %1.37 % – 1.96 %0.67 % – 0.96 %
R & D Procurement Production
Figure 37 – EBIT contribution of standards in the global automotive industry for different segments of the industry value chain
To give a better appreciation of the scale of the standards impact, the
above estimate has been projected to the total industry revenues for
2008. As a result, the total contributing impact would be between
USD 38 billion and USD 55 billion.
This estimate is based on a limited sample of companies and to achieve
more precise and reliable figures, it should be refined and validated
using a larger sample. However, the analysis provides a clear and valid
indication of the scale of the standards’ contribution to the sector.

106 Economic benefits of standardsISO Methodology 2.0 Annexes

107Economic benefits of standards ISO Methodology 2.0 Annexes
Annex B Assessment of non-economic benefits of standards
In the first version of the ISO Methodology (2010) the assessment of
economic benefits of standards was directly related to companies
from the private sector.
Organizations from the “ public sector ” are also affected by standards
and it was observed that most of the methodology could be applied
in a similar way as in the private sector. However, the methodology
had to be adapted to address the specifics of a public sector institu-
tion, whose primary mission is (in general) devoted to create societal
value rather than economic value.
This approach appears in the meantime as being too narrow. It is more
coherent with current developments in business and society (driven
by the importance of sustainability) to use an analytical framework
that can distinguish between :
• Economic benefits of standards
• Non-economic benefits of standards (i.e. the contribution of stand-
ards to social and environmental benefits)
This is an approach applicable to any type of organization irrespec-
tive of whether it is a private for-profit, private not-for profit, a public
sector, or another form of organization.
Economic and non-economic impacts of standards are seen as different
aspects in which standards contribute to an organization and to the
environment in which it exists, irrespective of the type of organization.

108 Economic benefits of standardsISO Methodology 2.0 Annexes
4.1.1 Overview
The assessment of non-economic benefits of standards faces a higher
level of complexity.
The main reason is that the analysis needs to :
• Identify and quantify the performance of the organization to be
assessed in relation to non-economic results (through key meas-
ures that are, as much as possible, as clear and effective as it is
“ gross-profit ” for measuring economic performance),
and, at the same time, to
• Describe and quantify the contribution of standards to such results.
All organizations have in place management and accounting systems
tracking economic performances (income and cost are defined, or can
be defined for almost all organizations’ activities). However, social or
environmental performance are, in the vast majority of cases, either
not defined and measured at all, or in a limited way.
Basic approach of the assessment
To start, a preliminary, high-level analysis needs to be conducted to
identify the relevant social and environmental aspects of the organiza-
tion’s operations. It is possible that these are part of the organization’s
core business, or that these can be associated in various ways with
the company operations.
In the first case, the core business of the organization is oriented
towards achieving social or environmental goals in a direct way. This
is the case for many public sector organizations, such as civil protec-
tion agencies whose core mission is to provide disaster prevention
or relief, environmental agencies whose core mission is to support or
enforce environmental protection, health care institutions such as a

109Economic benefits of standards ISO Methodology 2.0 Annexes
hospital 1), whose core mission is to save lives and heal patients, and
so on. But it is also the case of not-for-profit organizations providing
health care, social or environmental services, social businesses 2), etc.
In the second case, the organization pursues a conventional, mostly
for-profit business and social and environmental aspects are linked
to the organization’s core business activities.
For the assessment, it would be very helpful if the organization is
already aware of the social and environmental implications of its
activities, or, in an ideal case, has already put in place (or is willing
to develop) a management system supporting measurement and
reporting of performance across the organization’s “ triple bottom
line ” (economic, social, environmental). This could be achieved by
applying some of the most widely used reporting guidelines for such
purposes, such as those of the Global Reporting Initiative (GRI).
In any case, it is essential to define and identify the social and/or envi-
ronmental aspects of an assessment to ensure a clear scope is applied.
To keep the analysis focused and manageable, it is recommended
to define key measures to characterize the social and environmental
performance of the organization in the areas that have been selected
for the assessment. These measures will have a role similar to EBIT in
the assessment of economic benefits.
Depending on the specifics of the organization and of the context
in which it operates, it may be possible to combine some specific
indicators into a general measure, e.g. to define a composite social
value measure for “ labour ” by combining in an appropriate way
1) A hospital can also be a private institution – an organization that can provide health care
services in an efficient way and make a profit on that. However, the primary goal of such an
institution is (or at least should be !) to provide social value.
2) According to the definition of Prof. Muhammad Yunus, " a non-loss, non-dividend company
designed to address a social objective within the highly regulated marketplace of today".

110 Economic benefits of standardsISO Methodology 2.0 Annexes
specific indicators related to this issue. Alternatively, it may be more
appropriate to select one or a few specific indicators that are highly
relevant for that company – e.g. GHG emissions as the key measure
of environmental performance.
The assessment can then be conducted following the same approach
that is applied in the evaluation of economic benefits of standards
(starting with an analysis of the organization’s value chain, business
functions, impacts of standards, value drivers, operational indica-
tors, etc.). A summary and high-level overview of the steps towards
the assessment of non-economic impacts of standards is given in
figures 38 and 39.
Social• Measure 1 : # of accidents• Measure 2 : # of
suppliers screened
Key measure(s) selected
Environmental• Measure : GHG
emissions
• Labor• Human Rights• Communities /
stakeholders
Categories of performance
indicators
• Emissions• Use of natural
resources• Biodiversity
Health and Safety of employees (# accidents, etc.)
Performance indicators (examples)
GHG emissionsEmissions of pollutants
Control of suppliers’ labor practices (child labor, etc.)
Use of energy Use of materialsUse of water
...
...
Examples Examples
Figure 38 – Definition of key measures to assess non-economic (social and environmental) impacts of standards

111Economic benefits of standards ISO Methodology 2.0 Annexes
Social• Key Measure 1• Key Measure 2• …
Environmental• Measure : GHG emissions
Less accidents in most critical operations / sites
Reduction of GHG emissions in manufacturing
More workforce trained + formal agreements…
Reduction of GHG emissions in transport
...
...
Understand
Calculate• How much : quantify
the impact of standards on the operational indicators selected for the relevant business functions (i.e. variation in a given timeframe)
• What : identify the most relevant standards that support activities of the business functions in scope
Impacts of standards on operational indicators
(examples)
• Transform the variations of operational indicators into the selected Key Measures
Convert
Figure 39 – The impacts of standards on operational indicators are converted into impacts on the selected key Measures of environmental and social performance
The following section gives an example of a possible extension of
the ISO Methodology to address organizations whose primary goal
is to create social or environmental value with a focus on hospitals.
The assessment process
Step 1 : Understand the value chain
In hospitals, as in most of the healthcare industry (including pharma-
ceutical companies), the key activities can be organized around the
phases a patient goes through during treatment in a hospital. This
is commonly referred to as the “ patient flow ”. As a result, the value
chain for the hospital industry can be designed on the basis of the

112 Economic benefits of standardsISO Methodology 2.0 Annexes
patient flow which is supported by administrative and infrastructure
functions as shown in figure 40.
Administration
Communication and IT
Marketing/PR
Procurement (of medication)
Admission Diagnosis Treatment Discharge Post- treatment
care
Support functions
Patient flow
Suppliers of :
• Medical equipment
• Consumables• Medication
International and national medical panels
Figure 40 – Hospital value chain
For the sake of simplicity, the scope of the analysis was restricted to
the services provided by hospitals. These services include all eHealth
(electronic health services) aspects covered by hospitals, but exclude
medical equipment supply (pharmaceuticals and medical devices).
Step 2 : Identify the impacts of standards
In this step, we identify the relevant functions and the significant
impacts within the selected business functions of the hospitals.
We suggest an analysis, based on desk studies and interviews with
staff of the hospital. It may be useful to refer to the generic Standards
Impact Map (see section 1.5) – as far as possible and meaningful –
to identify the relevance of functions and the impacts of standards.
This needs to be supplemented with the identifications of impacts
on the business functions that make up the hospital value chain.

113Economic benefits of standards ISO Methodology 2.0 Annexes
In the example case study, the following overview of value drivers
and relevant types of standards was used as a starting point for the
analysis (see figure 41) :
Quality of treatment
Cost
VALUE DRIVERS RELEVANT STANDARD TYPE
Efficacy
Length of stay
Complication rate
Cost efficiency
Safety rate
Quality of information
Medical panel guidelines
Clinic-specific guidelines
• Treatment guidelines of international medical panels based on ICD
• National treatment guidelines (e.g. DRG for Germany) of medical panels
• Clinic-specific treatment, quality management and IT standards
• Hospital-specific quality management certifications (ISO 9000-series, KTQ, ProCumCert)
• IT standards for interfaces and data structure (HL7, Dicom, CEN)
Consensus-based standards
Figure 41 – Value drivers in the hospital value chain and standards used
Treatment, the core function of hospitals, is mostly affected by medi-
cal best practices and guidelines set by international medical panels.
Consensus-based standards are less relevant.
In medication procurement, consensus-based standards are mostly
related to medical devices and pharmaceuticals, which have been
excluded from the scope.
In administration, consensus-based standards can have a relevant
impact, because length of stay is not only a result of the treatment
or medication itself, i.e. a low complication rate, but also of quality
and efficiency of processes, which are directly linked to quality system
management practices.
For example, a shorter admission time can bring significant productivity
gains. In surgical wards, it has been shown through empirical studies
that it is related to a lower complication rate. Another example of a

114 Economic benefits of standardsISO Methodology 2.0 Annexes
meaningful impact is the improved documentation flow during surgical
procedures after the introduction of quality management standards.
In-depth interviews were conducted in two supporting functions,
medication procurement and administration.
Step 3 : Analyze the value drivers and determine operational indicators
a) Value drivers
The key value driver categories identified were quality of treatment
and cost. During the interviews, the value drivers were gradually re-
fined. The value drivers selected after the interviews are highlighted
in figure 42 :
Quality of treatment
Cost
VALUE DRIVERSCATEGORY DESCRIPTION
Efficacy Ability to provide a successful and evidence-based treatment according to the medical gold standard
Length of stay Ability to optimize the length of stay in medical and administrative terms
Complication rate Ability to minimize unwanted side-effects or secondary conditions
Cost efficiency Ability to minimize operational costs of treatment without compromising medical best practices
Safety rate Ability to offer safe treatment according to medical gold standards
Quality of information Ability to provide all involved parties with accessible, meaningful and correct data
Figure 42 – Value drivers and their impact in the hospital value chain
b) Operational indicators
As stated above, the patient flow is at the core of the hospital value
chain. Alongside, there are several administrative support functions,
such as procurement of medication or quality management.
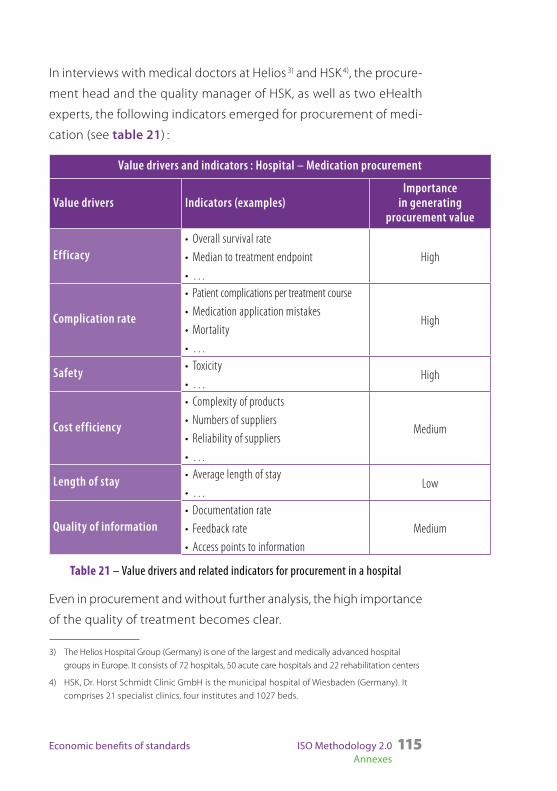
115Economic benefits of standards ISO Methodology 2.0 Annexes
In interviews with medical doctors at Helios 3) and HSK 4), the procure-
ment head and the quality manager of HSK, as well as two eHealth
experts, the following indicators emerged for procurement of medi-
cation (see table 21) :
Value drivers and indicators : Hospital – Medication procurement
Value drivers Indicators (examples) Importance
in generating procurement value
Efficacy• Overall survival rate• Median to treatment endpoint• …
High
Complication rate
• Patient complications per treatment course• Medication application mistakes• Mortality• …
High
Safety • Toxicity• …
High
Cost efficiency
• Complexity of products• Numbers of suppliers• Reliability of suppliers• …
Medium
Length of stay • Average length of stay• …
Low
Quality of information• Documentation rate• Feedback rate• Access points to information
Medium
Table 21 – Value drivers and related indicators for procurement in a hospital
Even in procurement and without further analysis, the high importance
of the quality of treatment becomes clear.
3) The Helios Hospital Group (Germany) is one of the largest and medically advanced hospital
groups in Europe. It consists of 72 hospitals, 50 acute care hospitals and 22 rehabilitation centers
4) HSK, Dr. Horst Schmidt Clinic GmbH is the municipal hospital of Wiesbaden (Germany). It
comprises 21 specialist clinics, four institutes and 1027 beds.

116 Economic benefits of standardsISO Methodology 2.0 Annexes
Step 4 : Assess the impacts and calculate results
The preliminary analysis dedicated to hospitals did not allow to
complete the assessment and to quantify the benefits of standards
for one or more institutes. Nevertheless, a number of interesting facts
and figures were collected, along with qualitative considerations,
which are reported below.
KTQ certification is a consensus-based quality management system
designed to cater to the specific medical and legal environment in
Germany. When it was re-certified in 2006, the Klinikum St. Marien in
Amberg (Germany) used the momentum that re-certification brought
along to revamp its whole surgical documentation procedure, from
admission in surgical wards to post-operative pain and decubitus
management.
It involved more than 750 employees. Within one year, the outdated
paper documentation with poor-quality information was replaced by
a database with one digital record per patient. The surgical processes,
previously virtually undocumented, now have a documentation rate
of 100 %.
It is now possible to evaluate and compare core processes such as
surgical ward admission time in minutes or the quality of post-operative
pain management in terms of average pain scores. The hospital was
granted an award by KTQ for outstanding performance.
The following considerations emerged from discussion with experts
from hospitals :
1. The level of process standardization is still low in hospitals and there are
still large potential gains to be made from consensus -based standards
in the management of hospitals and in the public sector in general.

117Economic benefits of standards ISO Methodology 2.0 Annexes
Compared to institutions in the private sector, the level of professional
management procedures is strikingly varied among hospitals. For in-
stance, electronic health records (EHR) are still highly hospital-specific.
2. The low level of process standardization coupled with increasing cost
pressure highlights emerging issues of standard-setting.
In discussion with procurement and e-health experts, “ clinical path-
ways ” were mentioned as an area in which consensus-based standards
could be helpful in the future. Clinical pathways are predefined best
practices for treating and managing very frequent patient issues. They
involve not only treatment guidelines, but also (quality) management
aspects, for instance admission time. Implementing clinical pathways
is inconceivable without standardized eHealth support, such as elec-
tronic health reports. Standards-setting organizations could have a
significant role and provide tools built on consensus-based standards.

118 Economic benefits of standardsISO Methodology 2.0 Annexes
Annex C ISO Methodology toolbox
The toolbox is composed of presentations, spreadsheets and docu-
ment templates. Each of the tools is identified with an ID and can be
downloaded from : www.iso.org/benefits_of_standards.
A. Presentations
The presentations comprise the following :
TB_01 : Overview of the ISO Methodology
Description : Introductory presentation of the key elements of the ISO
Methodology with a focus on company assessments, the organization
of case studies and main results obtained in these studies about the
impacts of standards.
TB_02 : Practical assessment : Steps and calculation of results
Description : An overview of the main approaches to calculating the
impacts of standards and the frameworks for the determination before
and after standards have been applied.
TB_03 : Process mapping tool
Description : An introduction into process mapping with some exam-
ples which can be copied and applied in the development of process
maps in new studies.
TB_04 : Industry value chains – Examples
Description : These are examples from case studies published by ISO
in 2011 and 2012. The collection of examples aims at providing some

119Economic benefits of standards ISO Methodology 2.0 Annexes
cases that show how value chains have been constructed. These
examples may provide guidance for future studies.
TB_05 : Company value chains – Examples
Description : These are examples from case studies published by ISO
in 2011 and 2012. The collection of examples aims at providing some
cases that show how value chains have been constructed. These
examples may provide guidance for future studies.
TB_06 : Process maps – Examples
Description : These are examples for process maps published by ISO
in 2011 and 2012. The collection of examples aims at providing some
cases that show how process maps have been constructed. These
examples may provide guidance for future studies.
B. Spreadsheets
TB_07 : Standards Impact Map
Description : This map gives an overview of likely impacts of standards
on the basis of the company value chain. The impacts are listed and
defined to allow an easy check with regard to their relevance in a
specific case study. It should be noted that the impact map is not
exhaustive and that it is not possible to capture all possible impacts
in such a list. Additionally, it should also be kept in mind that for a
specific company only a subset of impacts will be relevant.
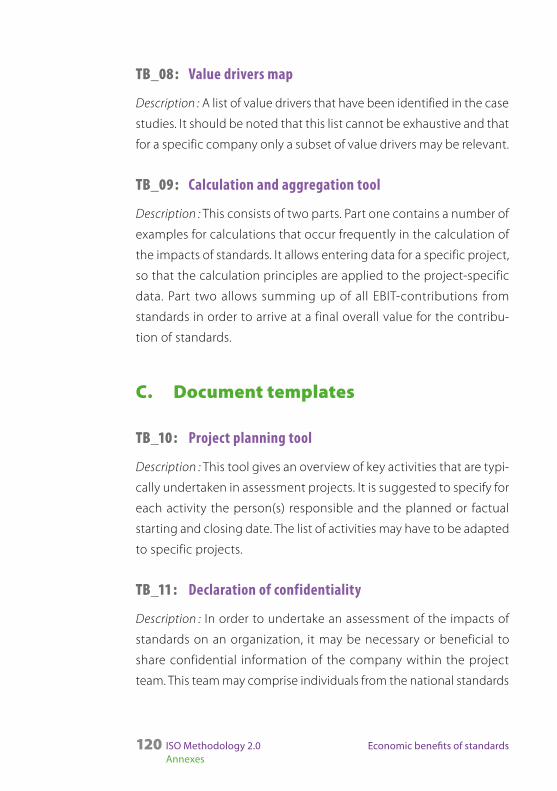
120 Economic benefits of standardsISO Methodology 2.0 Annexes
TB_08 : Value drivers map
Description : A list of value drivers that have been identified in the case
studies. It should be noted that this list cannot be exhaustive and that
for a specific company only a subset of value drivers may be relevant.
TB_09 : Calculation and aggregation tool
Description : This consists of two parts. Part one contains a number of
examples for calculations that occur frequently in the calculation of
the impacts of standards. It allows entering data for a specific project,
so that the calculation principles are applied to the project-specific
data. Part two allows summing up of all EBIT-contributions from
standards in order to arrive at a final overall value for the contribu-
tion of standards.
C. Document templates
TB_10 : Project planning tool
Description : This tool gives an overview of key activities that are typi-
cally undertaken in assessment projects. It is suggested to specify for
each activity the person(s) responsible and the planned or factual
starting and closing date. The list of activities may have to be adapted
to specific projects.
TB_11 : Declaration of confidentiality
Description : In order to undertake an assessment of the impacts of
standards on an organization, it may be necessary or beneficial to
share confidential information of the company within the project
team. This team may comprise individuals from the national standards

121Economic benefits of standards ISO Methodology 2.0 Annexes
body, an academic institution or a consultancy. In order to assure the
company that no confidential information is disclosed outside the
project team and that no such information is included in the final
project report, it is suggested that the project partners sign a declara-
tion of confidentiality at the outset of a project.
TB_12 : Reporting tool for case studies
Description : This tool defines a structure for the final report about the
assessment of the impacts of standards. The tool is intended to make
sure key information is captured in the report. Applying a common
structure also allows to compare findings between different reports.
The reporting tool can be adapted to the special needs of a case study.
TB_13 : Questionnaires to assist in company interviews
Description : There are two questionnaires provided in the toolbox.
Questionnaire 1 is aimed at capturing general data about the com-
pany or organization. Questionnaire 2 addresses the use of standards
by the company and assists in capturing key information from the
company. Both questionnaires are generic which means they can be
used irrespective of the type or size of a company, its industry affili-
ation or the business functions being assessed. Additionally, there is
a set with nine questionnaires each of which is specific to one of the
business function in Porter’s value chain model. These questionnaires
may have to be adapted before they are used in interviews or surveys
in a specific case study.

122 Economic benefits of standardsISO Methodology 2.0 Annexes
Annex D Terms and definitions
Note : Some definitions related to standards and standardization have
been simplified for practical reasons from those included in ISO/IEC
Guide 2, Standardization and related activities – General vocabulary.
TERM DEFINITIONActivity In the value chain each activity in an organization is assigned to one of the
functions in the value chain
After-sales service One of the nine business functions in the model value chain developed by Porter, including maintenance, warranty, possibly training and other services
Approximation A method to estimate the value of indicators in cases of missing or incomplete data for those indicators
Business function An organizational unit of a company dedicated to a specific set of activities, such as research & development
Business unit An organizational unit of a company that comprises the company's entire business for a specific product (or service) group
Company standard Standard that has been developed and is owned by a company and is not shared with other interested parties
Compliance standard
Standard that defines restrictions on products and services or requires specific performance levels to match health, safety and environmental protection (HSE) requirements
Documentary, voluntary, consensus-based standard
Standard that• has been developed in an open process on the basis of consensus
between the participants• is voluntary towards its use• is accessible and open for use by any interested party (irrespective of whether
the party has participated in its development)
EBIT Earnings Before Interest and Tax. A measure for the gross profit of a company. Contribution to EBIT is applied as the key indicator for the measurement of the impacts of standards
Engineering One of the nine business functions in the model value chain developed by Porter related to the set-up and fine-tuning of often sophisticated equipment and processes

123Economic benefits of standards ISO Methodology 2.0 Annexes
TERM DEFINITIONFunction or Business function (in a value chain)
Set of key activities in an organization that can be aggregated and that compose one of the components of an organizational value chain. For each function a number of activities is defined
Grey spot Segment in a value chain under analysis for which required data are only partially available or available without the required quality
Inbound logistics One of the nine business functions in the model value chain developed by Porter with the function of receiving inputs from suppliers, incl. checking these inputs with regard to quantity, quality, timely delivery etc.
Management and administration
One of the nine business functions in the model value chain developed by Porter, including all management functions across the company and administrative functions such as financial, human resources etc. management
Marketing and sales
One of the nine business functions in the model value chain developed by Porter with the function to market and sell products and services, incl. customer analysis, pricing, advertising etc.
Operational indicator
Indicator applied to the operations of an organization that can be observed and whose impact can be measured. Indicators need to be selected that reflect the impact of standards. The results from the measurement of the impacts of selected indicators are then translated and combined to an overall value resulting from the use of standards by an organization
Organization Generic designation for all types of institutions, such as companies, public sector organizations, government agencies etc.
Outbound logistics One of the nine business functions in the model value chain developed by Porter with the function of delivering products to customers, which may include interim storage, packaging, loading to transport facilities etc.
Private sector organization
Organization that is oriented towards generating profits, a business
Process standard Standard that provides specifications for processes in terms of activities and process flows, process performance requirements and indicators, and process management practices
Procurement One of the nine business functions in the model value chain developed by Porter with the function of supplier management, supplier and supplies contracting and ordering
Product standard Standard that provides specifications for products and materials in terms of physical and chemical properties, interfaces and underlying test methods, terminology or categorization

124 Economic benefits of standardsISO Methodology 2.0 Annexes
TERM DEFINITIONProduction / Operations
One of the nine business functions in the model value chain developed by Porter with the function of producing or providing goods and services
Public sector organization
Organization that performs a function for the public and is not primarily oriented towards generating profits
Regulatory (mandatory) standard
Standard that is part of regulation (in a territory, such as a country, a province, a county etc.) and mandatory with regard to its implementation
Research and development
One of the nine business functions in the model value chain developed by Porter with the task to research new products and technologies. mostly for new product or service development
Standards Impact Map
Map that lists many impacts from standards on the basis of a classification by company function and activity. The Map also presents the priority of each impact and relates them to the three types of standards
Value Excess in revenues over the costs to produce a product or service
Value chain Chain of activities in an organization. A conceptual framework to analyze the internal structure of an organization by disaggregating it into core functions and relating key organizational activities to the functions. The functions are divided into primary and support functions. The functions are placed in a sequence which reflects the core operational process in an organization.Although the concept value chain has been developed originally for the analysis of for-profit-organizations, such as companies, its use can, with some adaptations, be applied to other types of organizations.The value chain concept has also been extended to cover whole supply chains and distribution networks (" industry value chain ")
Value driver Crucial capability that gives an organization a competitive advantage
White spot Segment in a value chain under analysis for which required data is unavailable

ISOMETHODOLOGY 2.0ISOMETHODOLOGY 2.0ISOMETHODOLOGY
EBS, ISO, MET, HOD, OLO, GY, 2.0, EBS, ISO, MET, HOD, OLO, GY, 2.0, EBS, ISO, MET, HOD,
OLO, GY, 2.0, EBS, ISO, MET, HOD, OLO, GY, 2.0, EBS, ISO, MET, HOD, OLO, GY, 2.0, EBS,
ISO, MET, HOD, OLO, GY, 2.0, EBS, ISO, MET, HOD, OLO, GY, 2.0, EBS, ISO, MET, HOD, OLO,
GY, 2.0, EBS, ISO, MET, HOD, OLO, GY, 2.0, EBS, ISO, MET, HOD, OLO, GY, 2.0, EBS, ISO,
MET, HOD, OLO, GY, 2.0, EBS, ISO, MET, HOD, OLO, GY, 2.0, EBS, ISO, MET, HOD, OLO, GY, 2.0, EBS, ISO, MET, HOD, OLO, GY, 2.0, EBS, ISO, MET, HOD, OLO, GY, 2.0, EBS, ISO, MET,
HOD, OLO, GY, 2.0, EBS, ISO, MET, HOD, OLO, GY, 2.0, EBS, ISO, MET, HOD, OLO, GY, 2.0, EBS, ISO, MET, HOD, OLO, GY, 2.0, EBS, ISO, MET, HOD, OLO, GY, 2.0, EBS, ISO, MET, HOD, OLO, GY, 2.0, EBS, ISO, MET, HOD, OLO, GY, 2.0, EBS, ISO, MET, HOD, OLO, GY, 2.0, EBS, ISO, MET, HOD, OLO, GY, 2.0, EBS, ISO, MET, HOD, OLO,
Bibliography
126 Economic benefits of standardsISO Methodology 2.0 Bibliography
Bibliography
• Blind, Knut (2004), The economics of standards : Theory, evidence,
policy. Edward Elgar, Cheltenham, Northampton
• –, Andre Jungmittag, Axel Mangelsdorf (2010), The economic benefits
of standardization. An update of the study carried out by DIN in 2000.
Published by DIN German Institute for Standardization, available at :
www.din.de/sixcms_upload/media/2896/DIN_GNN_2011_
engl_akt_neu.pdf
• Gerundino, Daniele, Reinhard Weissinger (2011), Economic benefits
of standards. International case studies. International Organiza-
tion for Standardization, Geneva. Case studies are available at :
www.iso.org/benefits_of_standards
• Gerundino, Daniele, Reinhard Weissinger (2012), Economic benefits
of standards. International case studies. Volume 2. International
Organization for Standardization, Geneva. Case studies are avail-
able at : www.iso.org/benefits_of_standards
• Porter, Michael (1985), Competitive advantage. Creating and
sustaining superior performance. Free Press. New York, London,
Toronto, Sydney
• Swann, Peter G.M. (2000), The economics of standardization.
Final report for standards and technical regulations directo-
rate, Department of trade and industry, London, available at :
www.dti.gov.uk/files/file11312.pdf
• – (2010), The Economics of Standardization : An Update, avail-
able at : www.bis.gov.uk/feeds/~/media/ED32CDA672764D-
7C8AC2F4E323581010.ashx

127Economic benefits of standards ISO Methodology 2.0 Bibliography
• World Trade Organization (2005), World Trade Report 2005. Ex-
ploring the links between trade, standards and the WTO. WTO,
Geneva, available at : www.wto.org/english/res_e/booksp_e/
anrep_e/world_trade_report05_e.pdf
• Yunus, Muhammad, Bertrand Moingeon, Laurence Lehmann-
Ortega (2010), Building social business models : Lessons from
the Grameen experience, in : Long Range Planning, Vol. 43, April
– June 2010, pp. 308-325, available at : www.hec.edu/content/
download/52956/470943/file/Article %20LRP %20Yunus %20
Moingeon %20Lehmann-Ortega %20d %C3 %A9finitif.pdf


GY, 2.0, EBS, ISO, MET, HOD, OLO, GY, 2.0, EBS, ISO, MET, HOD, OLO, GY, 2.0, EBS, ISO, MET, EBS, ISO, MET, HOD, OLO, GY, 2.0, EBS, ISO, MET, HOD, OLO, GY, 2.0, EBS, ISO, MET, HOD,
OLO, GY, 2.0, EBS, ISO, MET, HOD, OLO, GY, 2.0, EBS, ISO, MET, HOD, OLO, GY, 2.0, EBS,
ISO, MET, HOD, OLO, GY, 2.0, EBS, ISO, MET, HOD, OLO, GY, 2.0, EBS, ISO, MET, HOD, OLO,
GY, 2.0, EBS, ISO, MET, HOD, OLO, GY, 2.0, EBS, ISO, MET, HOD, OLO, GY, 2.0, EBS, ISO,
MET, HOD, OLO, GY, 2.0, EBS, ISO, MET, HOD, OLO, GY, 2.0, EBS, ISO, MET, HOD, OLO, GY, 2.0, EBS, ISO, MET, HOD, OLO, GY, 2.0, EBS, ISO, MET, HOD, OLO, GY, 2.0, EBS, ISO, MET,
HOD, OLO, GY, 2.0, EBS, ISO, MET, HOD, OLO, GY, 2.0, EBS, ISO, MET, HOD, OLO, GY, 2.0, EBS, ISO, MET, HOD, OLO, GY, 2.0, EBS, ISO, MET, HOD, OLO, GY, 2.0, EBS, ISO, MET, HOD, OLO, GY, 2.0, EBS, ISO, MET, HOD, OLO, GY, 2.0, EBS, ISO, MET, HOD, OLO, GY, 2.0, EBS, ISO, MET, HOD, OLO, GY, 2.0, EBS, ISO, MET, HOD, OLO,
ISO
Met
hodo
logy
2.0
Econ
omic
ben
efits
of s
tand
ards
International Organizationfor Standardization
ISO Central Secretariat
1, chemin de la Voie-Creuse
Case postale 56
CH - 1211 Genève 20
Switzerland
www.iso.org
ISBN 978-92-67-10606-9
© ISO, 2013All rights reserved
Related Documents