Illinois Wesleyan University Digital Commons @ IWU Digital Commons @ IWU Honors Projects Economics Department Spring 2012 Economic Assimilation of Chinese Immigrants in the United Economic Assimilation of Chinese Immigrants in the United States: Is There Wage Convergence with Natives? States: Is There Wage Convergence with Natives? Yujie Wu [email protected] Follow this and additional works at: https://digitalcommons.iwu.edu/econ_honproj Part of the Economics Commons Recommended Citation Wu, Yujie, "Economic Assimilation of Chinese Immigrants in the United States: Is There Wage Convergence with Natives?" (2012). Honors Projects. 118. https://digitalcommons.iwu.edu/econ_honproj/118 This Article is protected by copyright and/or related rights. It has been brought to you by Digital Commons @ IWU with permission from the rights-holder(s). You are free to use this material in any way that is permitted by the copyright and related rights legislation that applies to your use. For other uses you need to obtain permission from the rights-holder(s) directly, unless additional rights are indicated by a Creative Commons license in the record and/ or on the work itself. This material has been accepted for inclusion by faculty at Illinois Wesleyan University. For more information, please contact [email protected]. ©Copyright is owned by the author of this document.

Welcome message from author
This document is posted to help you gain knowledge. Please leave a comment to let me know what you think about it! Share it to your friends and learn new things together.
Transcript

Illinois Wesleyan University
Digital Commons @ IWU Digital Commons @ IWU
Honors Projects Economics Department
Spring 2012
Economic Assimilation of Chinese Immigrants in the United Economic Assimilation of Chinese Immigrants in the United
States: Is There Wage Convergence with Natives? States: Is There Wage Convergence with Natives?
Yujie Wu [email protected]
Follow this and additional works at: https://digitalcommons.iwu.edu/econ_honproj
Part of the Economics Commons
Recommended Citation Wu, Yujie, "Economic Assimilation of Chinese Immigrants in the United States: Is There Wage Convergence with Natives?" (2012). Honors Projects. 118. https://digitalcommons.iwu.edu/econ_honproj/118
This Article is protected by copyright and/or related rights. It has been brought to you by Digital Commons @ IWU with permission from the rights-holder(s). You are free to use this material in any way that is permitted by the copyright and related rights legislation that applies to your use. For other uses you need to obtain permission from the rights-holder(s) directly, unless additional rights are indicated by a Creative Commons license in the record and/ or on the work itself. This material has been accepted for inclusion by faculty at Illinois Wesleyan University. For more information, please contact [email protected]. ©Copyright is owned by the author of this document.

Economic Assimilation of Chinese Immigrants in the United States:
Is There Wage Convergence with Natives?
Yujie (Eunis) Wu
Illinois Wesleyan University Economics Honor’s Research Project
Spring 2012

Wage Convergence 2
Abstract
Asian Americans are often referred to as the “model minority” due to perceptions of their
high income and educational attainment; yet relatively little is known about their economic
assimilation experience. The purpose of this study is to determine economic assimilation of
Chinese immigrants over time. This research follows a cohort of Chinese immigrants from 1994
to 2011 and compares their earnings performance with natives that have similar educational
attainment. Multiple regression analysis is used to analyze data from the Current Population
Survey. Results show that, although the cohort of Chinese immigrants initially has earnings
substantially lower than the natives, it is only about 10 years before they reach income parity. By
2011, Chinese immigrants’ earnings exceed natives’ earnings by about 4 percent. The study
concludes that despite the language and adjustment challenges, Chinese immigrants do show
rapid economic assimilation in the United States.

Wage Convergence 3
Introduction
Asian Americans have a long history in the United States, and are often referred to as the
“model minority” in America for their high educational attainment and high achievement.
Nonetheless, past research has found that there still seems to be a wage gap between Asian
Americans and natives. For example, one study finds that Asian immigrants’ earnings are about
75% of native-born white Americans’ earnings (Min, 2006). Mass media reports also show that
Asian American men are paid up to 29% less than equally qualified white males (Debusmann,
Jr., 2010). While existing literature suggests that immigrants who can adapt well and are
relatively successful in their new jobs can make a significant contribution to economic growth
(Borjas, 2009), the income level of Chinese immigrants depends on various factors.
Although Asian Americans are perceived as the “model minority” due to their high
education attainment and high income, relatively little is known about Chinese immigrants’
economic assimilation experience. The number of Chinese immigrants in the U.S. has increased
significantly over the years. According to the U.S. Census Bureau, there are 3.8 million Asians
of Chinese descent in the U.S. in 2009, making it the largest Asian group in the country (2009
American Community Survey, 2009). The continuously increasing number of Chinese
immigrants in the U.S. raises a number of important research questions. What determines
Chinese immigrants’ performance in the U.S. labor market? Is there an income gap between
Chinese immigrants and natives? Moreover, is there assimilation and upward mobility for
Chinese immigrants today?
The purpose of this study is to determine economic assimilation of Chinese immigrants over
time. By looking for income disparity between the immigrants and the natives, my research
follows a cohort over time to investigate the impact of assimilation on the level of earnings for

Wage Convergence 4
Chinese immigrants in the United States. This paper uses Census data and multiple regression
techniques to examine income determinants for Chinese immigrants relative to natives by
applying theories of assimilation and human capital. The research focuses on income differences
between a cohort of Chinese immigrants and natives that are followed from 1994 through 2011.
The study aims to re-examine the conclusions reached from past studies and explore the impact
of economic assimilation that affect the living situations of Chinese immigrants who reside in the
U.S.
Theory and Literature Review
Assimilation
Assimilation theory describes the process that immigrants use to adapt and become
acculturated to the host country. It is defined by William Clark as a way of understanding the
social dynamics of American society, a learning process that occurs spontaneously in the course
of interaction between majority and minority groups (Clark, 2003).
Waters and Jeménez state that today’s immigrants are largely assimilating into the American
society along four dimensions: socioeconomic status, spatial concentration, language
assimilation, and intermarriage. After migration takes place, immigrants find themselves in a
foreign and sometimes hostile environment. A learning process about the host country’s cultural,
political and economic characteristics takes place, and the immigrant begins to “assimilate.” In
general, immigrants and their descendants become more similar to natives over time by
improving their language skills and acquiring local human capital. They may also become more
similar to natives in their legal status by obtaining long-term residency and work permits, or by
marrying natives and becoming naturalized citizens (Schaeffer, 2006). In theory, assimilation

Wage Convergence 5
along these four dimensions should help immigrants close the earnings gap with natives as the
number of years in the U.S. increases.
Assimilation occurs spontaneously in the interaction between natives and immigrants and
therefore is an ongoing process that takes time to occur. For example, Beenstock, Chiswick and
Paltiel (2010) suggest that duration in the destination plays an important role in the economic
adjustment of immigrants in the host country. By testing the immigrant assimilation hypothesis
with longitudinal data, they further claim that long-duration immigrants experience a steeper
increase in earnings.
Besides length of stay in the host country, researchers have long emphasized the importance
of education on an immigrant’s income level. Studies of Asian Americans’ income show that
education helps immigrants to become acculturated and subsequently to assimilate (Barringer,
Takeuchi, & Xenos, 1990). For example, research shows that sharp differences exist in time use
between immigrants and natives, and that an increasing amount of time spent on education helps
immigrants to become assimilated to the host country (Vigdor, 2008).
Age earnings profile
Age earnings profiles are often used by researchers to examine earnings progressions of
immigrants and natives and are widely used to describe an individual’s earnings over the course
of one’s work life. Chiswick’s early studies (1978) use cross-section data to sketch out the age-
earnings profiles of immigrants and natives. Figure 1 uses data from the 1970 census and shows
the age-earnings profiles of immigrant and native men in the cross section.

Wage Convergence 6
Figure 1: Age-Earnings Profiles of Immigrant and Native Men in the Cross Section (Bor jas, 2009)
In Figure 1, Chiswick uses cross sectional data and thus displays a snapshot of the
population at a point in time. Observations of the age-earnings profile suggest that immigrants’
earnings are initially lower than the native level, and the immigrant curve is steeper than the
natives’. Gradually, immigrants reach the same level of income as natives while eventually
earning more than natives. Therefore, based on Chiswick’s 1978 study using cross-section data,
the age-earnings profiles of immigrant and native men show that upward mobility is an important
aspect of the immigrant experience (as cited in Borjas, 2009). These studies also show that
immigrant wages converge toward and then exceed native wages.
While Figure 1 may seem plausible, critiques point out that such findings are based solely
on one year’s cross sectional data and thus could be misleading. Because Figure 1 displays a
snapshot of the population at a point in time, it disregards the question of when the immigrant
migrated to the host country. Borjas (2009), for example, suggests that different cohorts, defined
by year of arrival in the United States, may be significantly different from each other because of
productivity differences. Figure 2 illustrates the cohort bias issue that Borjas suggests.

Wage Convergence 7
Figure 2: Illustration of Cohor t Effects and the Age-Earnings Profile (Borjas, 2009)
Based on this reasoning, Borjas (2009) suggests a hypothetical scenario in Figure 2 where
there are three separate waves of immigrants. These waves of immigrants have distinct
productivities but all immigrate to the U.S. at the age of 20. As shown in Figure 2, the typical
age-earnings profile for each wave of immigrants is displayed in the graph. Now assume that we
obtain the 1970 census data and plot the earnings for immigrants as line RQP. Notice that the
1970 census data reports the wage of 1970-wave immigrants when they are 20 years old (point
R); the wage of 1960-wave immigrants when they are 30 years old (point Q); and the wage of
1950-wave immigrants when they are 40 years old (point P) (Borjas, 2009). When points R, Q
and P are connected, we get the 1970 cross section estimate of the age earnings profile of
immigrants. It shows much more rapid earnings growth than actually occurred according to the
three parallel actual age-earnings profiles of the three cohorts. In short, the upward rising line
RQP shows that one year’s cross section is not a good approximation of actual cohort earnings
over time. In fact, without considering such cohort bias, the age-earnings profile based solely on
one year of cross section data can erroneously imply assimilation for immigrants (Borjas, 2009).
1950 Wave Wage ($)
P
1960 Wave
Q 1970 Wave
R
20 30 40 Age

Wage Convergence 8
Since the use of cross section data can create bias in the estimation of actual cohort
performance, Thornton, Rodgers, and Brookshire (1997) suggest that great caution should be
exercised in making interpretations about individuals’ earnings over time based on cross section
data. The importance of actually following specific cohorts over time and not using a single cross
section to estimate a cohort’s earnings profile has also been noted in other studies (Fukuda,
2008).
There are several reasons to expect cohorts who immigrate to the U.S. in different years to
have different earnings performance. As explained above, Borjas argues that differences exist in
cohort qualities such as productivity and skill level. Others suggest additional reasons for cohort
bias such as the inflation rate and productivity growth in the economy (Thornton, Rodgers, &
Brookshire, 1997).
Human Capital
Borjas defines human capital as the unique set of abilities and acquired skills that each of us
brings into the labor market (Borjas, 2005). Human capital theory even more directly asserts the
enhancing impact of education on the living situation of minorities (Barringer, Takeuchi, &
Xenos, 1990). Human capital theory suggests that success in school and high levels of formal
education increase the prospects for better paying, higher status, and more satisfying
employment (Barringer, Takeuchi, & Xenos, 1990).
Based on the assimilation theory and human capital theory, my research attempts to explore
income determinants for Chinese immigrants and answer the question of how much influence
assimilation has on income level after controlling for human capital factors. Specifically, this
research adopts a cohort approach by using repeated cross section data over multiple years. By
following a group of Chinese immigrants over time to eliminate cohort biases that are present in

Wage Convergence 9
cross section data, this paper examines whether assimilation, measured by length of stay in the
host country, helps to close the income gap between Chinese immigrants and natives after
controlling for other known variables to affect income level.
I hypothesize that:
(1) Human capital factors have a significant influence on Chinese immigrant earnings.
(2) The more assimilated Chinese immigrants are, the closer the income parity with
natives, controlling for other factors that are known to affect income. Specifically, the
longer Chinese immigrants stay in the U.S., the closer their income parity with natives,
controlling for other factors that are known to affect income.
Data
All data in this research paper comes from the IPUMS CPS (Current Population Survey)
database. IPUMS-CPS is an integrated set of data covering 50 years (1962-2011) of the March
Current Population Survey (CPS). It is a monthly U.S. household survey conducted jointly by the
U.S. Census Bureau and the Bureau of Labor Statistics (IPUMS-CPS, 2011). Data used in this
research comes from the CPS database administered every March from 1994 to 2011. Due to the
availability of data in the IPUMS CPS, this research follows two cohorts:
1) Chinese born individuals who immigrated to the U.S. prior to 1994, work more than 35
hours per week, and were at least 25 and not over 45 years old during the 1994 survey
year.
2) Native born individuals who work more than 35 hours per week and were at least 25 and
not over 45 years old during the 1994 survey year.

Wage Convergence 10
My research follows the native and Chinese cohorts by studying the behavior of their
earnings during survey years 1994, 1996, 1998, 2000, 2002, 2004, 2006, 2008, 2010 and 2011.
The Chinese and the native earnings are compared at each point in time by analyzing CPS data
from the corresponding survey year.
Table 1 shows the CPS data selected and the corresponding sample size. The native group
has a large sample size in each sample year and therefore is assumed to be representative of the
entire population. The adequate sample size for the Chinese immigrants group allows the study
to make inferences about the entire population. Note that both of the cohorts age with the
passage of time from 25-45 years in 1994 to 42-62 years in 2011.
Table 1: Summary of Sample Sizes for Each Selected Survey Year Survey Year Age Number of Observations
Natives Chinese Immigrants 1994 25-45 30,915 197 1996 27-47 26,481 165 1998 29-49 26,470 195 2000 31-51 26,859 159 2002 33-53 44,248 262 2004 35-55 40,748 258 2006 37-57 38,096 275 2008 39-59 36,225 270 2010 41-61 32,428 214 2011 42-62 30,193 227
Dependent var iable
The variable Wage and Salary Income indicates each respondent’s total pre-tax wage and
salary income—that is, money received as an employee—for the previous calendar year.
RealWage indicates each respondent’s real wage level after being adjusted for inflation, and is
expressed in terms of a 2011 price level. LnRealWage is used to measure level of income after
being adjusted for inflation. The natural log of wage is commonly used as a dependent variable

Wage Convergence 11
in wage equations and has the convenient characteristic that the regression coefficients estimate
the percentage change in income for a one unit of change for a given variable.
To see the CPI data used in real wage adjustments, please refer to Appendix 1.
Independent var iables
Education Attainment is used to measure an individual’s level of education based on the
assimilation and human capital theory. This variable is recoded into a set of dummy
variables:
• HighSchoolDiploma
• SomeCollege
• Bachelors
• Masters
• Professionals
• Doctors
The reference group for the education dummy variables is respondents who have not
earned a high school diploma.
Age gives each person’s age at last birthday. Age approximates life experience and is a
very rough proxy for work experience.
Usual Hours Worked Per Week (last year) is used to measure the individual’s work
experience. It reports the number of hours per week that respondents usually worked if they
worked during the previous calendar year. Individuals either reported hours worked at a job
or business at any time during the previous year or acknowledged doing “any temporary,
part-time, or seasonal work even for a few days” during the previous year (IPUMS-CPS,
2011).
Wage Convergence 12
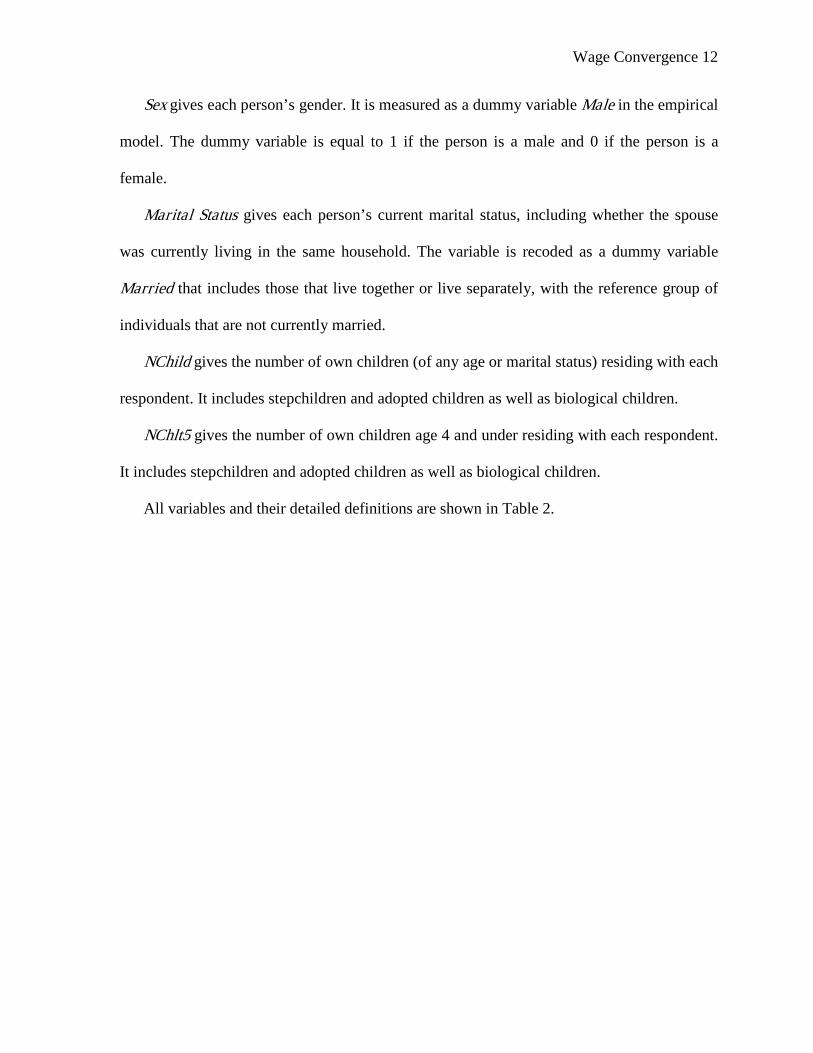
Sex gives each person’s gender. It is measured as a dummy variable Male in the empirical
model. The dummy variable is equal to 1 if the person is a male and 0 if the person is a
female.
Marital Status gives each person’s current marital status, including whether the spouse
was currently living in the same household. The variable is recoded as a dummy variable
Married that includes those that live together or live separately, with the reference group of
individuals that are not currently married.
NChild gives the number of own children (of any age or marital status) residing with each
respondent. It includes stepchildren and adopted children as well as biological children.
NChlt5 gives the number of own children age 4 and under residing with each respondent.
It includes stepchildren and adopted children as well as biological children.
All variables and their detailed definitions are shown in Table 2.

Wage Convergence 13
Table 2: Var iables, Descr iptions and Expected Signs Var iable Descr iption Expected Sign Dependent LnRealWage Natural log of real wage and salary income Independent Education attainment Positive HighSchoolDiploma 0 = High school (no diploma) or under
1 = High school diploma or equivalent
SomeCollege 0 = no college 1 = some college (including associate’s degree)
Bachelors 0 = No Bachelor’s degree 1 = Bachelor’s degree
Masters 0 = No Master’s degree 1 = Master’s degree
Professionals 0 = No Professional School degree 1 = Professional School degree
Doctors 0 = No Doctorate degree 1 = Doctorate degree
Age A person’s age at last birthday Positive Uhrswork Usual hours worked per week (last year) Positive Sex Male 0 = Female
1 = Male Unknown
Marital Status Married 0 = Not married
1 = Married Unknown
NChild Number of own children in household Unknown NChlt5 Number of own children under age 5 in
household Unknown
Empir ical Model
The empirical model of this study contains the following parts:
1. Descriptive statistics;
2. OLS regression analysis;

Wage Convergence 14
3. Simulation of real income level for the cohort of Chinese immigrants and natives and
comparison of results over time
First, descriptive statistics are obtained for each selected survey year to compare variables of
Chinese immigrants to natives.
Second, Ordinary Least Squares (OLS) regressions are run for each selected survey year to
examine whether each income determinant has a significant impact on the level of income for
Chinese immigrants and natives. These regressions are later used to determine the extent that
Chinese immigrant wages and salaries have assimilated to the native levels after controlling for
human capital related determinants of earnings.
The regression model is as follows:
𝐿𝑛𝑅𝑒𝑎𝑙𝑊𝑎𝑔𝑒 = 𝛽0 + 𝛽1(𝐻𝑖𝑔ℎ𝑆𝑐ℎ𝑜𝑜𝑙𝐷𝑖𝑝𝑙𝑜𝑚𝑎) + 𝛽2(𝑆𝑜𝑚𝑒𝐶𝑜𝑙𝑙𝑒𝑔𝑒) + 𝛽3(𝐵𝑎𝑐ℎ𝑒𝑙𝑜𝑟𝑠) +
𝛽4(𝑀𝑎𝑠𝑡𝑒𝑟𝑠) + 𝛽5(𝑃𝑟𝑜𝑓𝑒𝑠𝑠𝑖𝑜𝑛𝑎𝑙𝑠) + 𝛽6(𝐷𝑜𝑐𝑡𝑜𝑟𝑠) + 𝛽7(𝐴𝑔𝑒) + 𝛽8(𝑈ℎ𝑟𝑠𝑤𝑜𝑟𝑘) +
𝛽9(𝑀𝑎𝑙𝑒) + 𝛽10(𝑀𝑎𝑟𝑟𝑖𝑒𝑑) + 𝛽11(𝑁𝐶ℎ𝑖𝑙𝑑) + 𝛽12(𝑁𝐶ℎ𝑖𝑙𝑡5)…………………………………(1)
Next, the simulation analysis examines whether wage convergence takes place between
Chinese immigrants and natives with the following steps:
Step 1: Run the LnRealWage equation regression specified in the above equation (Equation
1) for the native population for 1994.
Step 2: Compute the mean values for each of the Equation 1 variables for the Chinese
respondents in our sample for 1994.
Step 3: Plug the Chinese mean values into the native equation estimated in Step 1 to
estimate what Chinese earnings would have been in 1994 if the Chinese pay was determined by
the native earnings function.

Wage Convergence 15
Step 4: Compare the estimated 1994 wage of Chinese immigrants to the actual 1994 wage of
natives. If the estimated Chinese earnings are equal to or greater than the actual native earnings,
we can conclude that “assimilation” has occurred.
Step 5: Repeat the above steps for each of the remaining nine selected survey years from
1996 to 2011.
The five-step model outlined above is used in the next section to compare actual Chinese
LnRealWage to estimated native LnRealWage. The estimated native LnRealWage shows
natives’ LnRealWage if they had identical Chinese human capital endowments. The changes in
the difference between actual LnRealWage for Chinese immigrants and estimated LnRealWage
for natives suggest whether there is wage convergence and economic assimilation over time. If
the actual Chinese LnRealWage is less than the estimated native LnRealWage, then Chinese
immigrants have not yet reached income parity with natives that have identical measurable
human capital endowments, which implies that economic assimilation has not yet occurred. On
the other hand, if the actual Chinese LnRealWage is equal to or greater than the estimated native
LnRealWage, then Chinese immigrants have reached income parity with natives that have
identical human capital endowments, which implies that economic assimilation has occurred.
Results
Descr iptive statistics
Complete descriptive results of the mean and standard deviation for natives and Chinese
immigrants are shown in Appendix 2 and Appendix 3. Table 3 shows an excerpt of descriptive
results that reflect the real wage and salary income of natives and Chinese immigrants. These
results are adjusted to 2011 dollars.

Wage Convergence 16
Table 3: Descr iptive Results of Wages and Salar ies for Natives and Chinese Immigrants
RealWage LnRealWage Survey Year Natives Chinese Immigrants Natives Chinese Immigrants
1994 40,364.48 47,873.73 10.4101 10.4610 1996 44,720.96 47,276.55 10.4758 10.4883 1998 48,004.94 51,541.12 10.5503 10.5644 2000 49,196.30 50,855.74 10.5967 10.6628 2002 54,993.33 66,422.29 10.6754 10.7953 2004 54,903.88 62,277.27 10.6826 10.7898 2006 55,527.01 68,024.01 10.6871 10.9003 2008 54,835.37 66,846.80 10.6887 10.8595 2010 57,053.33 76,538.25 10.6971 10.9098 2011 54,910.82 66,125.06 10.6894 10.8851
A comparison of the means for wage and salary income suggests that Chinese immigrants
earn more than natives on average. Based on descriptive results, Figure 3 shows real wage and
salary income for natives and Chinese immigrants. Chinese immigrants earn slightly more than
natives before 2000; after 2000, however, the gap between the income level of Chinese
immigrants and that of the natives widens, with Chinese immigrants making $11,214.24 more
than natives in 2011.
20,000.00
30,000.00
40,000.00
50,000.00
60,000.00
70,000.00
80,000.00
1994 1996 1998 2000 2002 2004 2006 2008 2010 2012
Ann
ual R
eal W
age
(201
1 do
llars
)
Year
Figure 3: Compar ison of Real Wage between Natives and Chinese Immigrants
Natives RealWage
Chinese RealWage

Wage Convergence 17
One possible reason that Chinese earnings consistently exceed native earnings in Figure 3 is
that Chinese immigrants could have higher levels of human capital because they have higher
levels of formal education. Appendix 2 and Appendix 3 show that this is indeed the case:
Chinese immigrants are more likely to have college degrees at all levels, from bachelors degrees
through PhD degrees. Because of differences in human capital between the Chinese and native
cohorts, it is necessary to use regression techniques to control for these differences.
OLS regression analysis
Regression results from 1994 to 2011 for natives are shown in Table 4. Regression results
for Chinese immigrants from 1994 to 2011 are included in Appendix 4.

Wage Convergence 18
Table 4: Regression Results for Natives (t-Statistic in Parentheses) Natives 1994 1996 1998 2000 2002 2004 2006 2008 2010 2011 (Constant) 8.329*** 8.534*** 8.573*** 8.702*** 8.886*** 8.953*** 9.093*** 9.125*** 9.122*** 9.154***
(216.398) (204.011) (195.276) (197.358) (251.799) (228.445) (216.392) (208.690) (179.626) (175.635)
HighSchool Diploma .441*** .384*** .372*** .399*** .343*** .360*** .355*** .313*** .364*** .300***
(24.191) (20.219) (18.690) (20.409) (21.998) (20.955) (19.645) (16.752) (16.678) (13.254)
SomeCollege .615*** .544*** .547*** .578*** .541*** .527*** .541*** .507*** .568*** .472***
(33.398) (28.298) (27.185) (29.302) (34.532) (30.550) (29.792) (27.076) (25.926) (20.873)
Bachelor s .961*** .878*** .864*** .902*** .879*** .859*** .868*** .832*** .917*** .816***
(49.758) (43.628) (41.149) (43.838) (54.147) (48.198) (46.442) (43.320) (40.858) (35.375)
Masters 1.089*** 1.051*** 1.017*** 1.056*** 1.022*** 1.021*** 1.060*** .978*** 1.088*** .998***
(44.690) (42.144) (39.486) (43.448) (54.345) (50.576) (50.119) (45.848) (44.177) (39.901)
Professionals 1.314*** 1.316*** 1.296*** 1.337*** 1.440*** 1.441*** 1.467*** 1.335*** 1.504*** 1.385***
(32.787) (33.243) (33.013) (33.946) (49.554) (46.331) (46.738) (41.475) (40.419) (36.781)
Doctors 1.125*** 1.120*** 1.155*** 1.168*** 1.182*** 1.188*** 1.212*** 1.149*** 1.322*** 1.191***
(22.356) (22.352) (23.692) (26.098) (35.845) (33.980) (33.997) (32.484) (35.024) (31.360)
Age .021*** .015*** .013*** .010*** .007*** .005*** .002*** .002** .001 .001
(26.495) (18.079) (15.846) (12.289) (11.332) (7.673) (3.037) (2.393) (1.359) (1.015)
Usual hour s worked per week (last yr ) .010*** .012*** .014*** .013*** .013*** .014*** .013*** .014*** .014*** .015***
(18.496) (20.871) (23.196) (23.529) (30.939) (29.843) (28.202) (29.424) (25.514) (27.372)
Male .320*** .344*** .352*** .358*** .360*** .327*** .356*** .328*** .282*** .288***
(35.735) (36.423) (36.776) (39.090) (51.637) (43.816) (45.895) (42.171) (32.516) (32.982)
Marr ied .149*** .141*** .132*** .119*** .124*** .129*** .105*** .126*** .134*** .124***
(14.289) (13.013) (11.890) (11.264) (14.991) (14.689) (11.619) (14.093) (13.520) (12.492)
Number of own children in household -.024*** -.006 -.005 .006 .014*** .019*** .028*** .025*** .025*** .033***
(-5.344) (-1.448) (-1.241) (1.399) (4.429) (5.565) (7.875) (6.553) (5.984) (7.570)
Number of own children under age 5 in hh .043*** .024** .046*** .033*** .023*** .028*** -.006 .013 -.007 -.023
(4.834) (2.475) (4.479) (3.183) (2.912) (2.928) (-.510) (1.010) (-.425) (-1.235)
Adjusted R Square .223 .225 .225 .242 .263 .244 .250 .242 .231 .306 Sample size 29116 25214 24949 25263 41684 38257 35736 33914 30535 28381 Note: ***Significant at the 1 percent level. **Significant at the 5 percent level. *Significant at the 10 percent level. t-Statistics are reported in parentheses.
In Table 4, almost all the coefficients are statistically significant for natives. In particular, all
the educational variables are significant at the 1 percent level, and many demographic variables
are significant at the 1 percent or 5 percent level. Compared to natives’ regression results, there
are also many coefficients that are statistically significant for Chinese immigrants. The

Wage Convergence 19
regression results consistently show that Chinese immigrants have statistically significant
coefficients for the education variables but not as much with the demographic variables. The
regression results meet the expectation that most of the coefficients have positive signs. The
coefficients also support the human capital theory that education plays an enormous role in
determining income regardless of whether an individual is a native or an immigrant. Moreover,
the higher educational attainment one has, the higher the income level one is able to have.
Simulation of real income level for the cohor t of Chinese immigrants and natives
As explained in the previous sections, the simulation examines wage convergence by tracing
out earnings for Chinese immigrants and natives over time with a five-step model.
Step 1: Natives’ regression results for Equation 1 are presented in Table 4. Based on the
results in Table 4, the empirical model can be re-written for the year 1994 as:
𝐿𝑛𝑅𝑒𝑎𝑙𝑊𝑎𝑔𝑒 = 8.329 + .441(𝐻𝑖𝑔ℎ𝑆𝑐ℎ𝑜𝑜𝑙𝐷𝑖𝑝𝑙𝑜𝑚𝑎) + .615(𝑆𝑜𝑚𝑒𝐶𝑜𝑙𝑙𝑒𝑔𝑒)
+ .961(𝐵𝑎𝑐ℎ𝑒𝑙𝑜𝑟𝑠) + 1.089(𝑀𝑎𝑠𝑡𝑒𝑟𝑠) + 1.314(𝑃𝑟𝑜𝑓𝑒𝑠𝑠𝑖𝑜𝑛𝑎𝑙𝑠)
+ 1.125(𝐷𝑜𝑐𝑡𝑜𝑟𝑠) + .021(𝐴𝑔𝑒) + .010(𝑈ℎ𝑟𝑠𝑤𝑜𝑟𝑘) + .320(𝑀𝑎𝑙𝑒)
+ .149(𝑀𝑎𝑟𝑟𝑖𝑒𝑑) − .024(𝑁𝐶ℎ𝑖𝑙𝑑) + .043(𝑁𝐶ℎ𝑖𝑙𝑡5)
Step 2: Chinese mean values for each of the Equation 1 variables in our sample are presented
in Appendix 3.
Step 3: Chinese mean values are plugged into the native equation estimated in Step 1 to
estimate what native earnings would have been if natives had Chinese human capital
endowments. The results estimated for survey year 1994 are presented in Table 5. Column 2 of
Table 5 shows the coefficients of the 1994 native earnings function. Column 3 shows the
Chinese mean values in 1994. Native coefficients in column 2 are multiplied by the Chinese
mean values in column 3 to get the product in column 4. The sum of these products in column 4

Wage Convergence 20
is the estimated LnRealWage for natives with Chinese human capital endowments. LnRealWage
is than translated into Real Wage in dollar terms.
Table 5: Simulation of Survey Year 1994 Native Model with Chinese Mean Native
Coefficients Chinese Mean
Product
(Constant) 8.329 8.3287 HighSchoolDiploma .441 .2081 0.0918 SomeCollege .615 .1015 0.0625 Bachelors .961 .2589 0.2487 Masters 1.089 .1929 0.2101 Professionals 1.314 .0305 0.0400 Doctors 1.125 .1117 0.1256 Age .021 35.82 0.7659 Usual hours worked per week (last yr) .010 42.90 0.4312 Male .320 .5635 0.1800 Married .149 .8122 0.1209 Number of own children in household -.024 1.06 (0.0256) Number of own children under age 5 in hh .043 .36 0.0153 LnRealWage 10.5952 Real Wage $39,942.27
Step 4: The actual Chinese LnRealWage is compared to the estimated wage of natives given
Chinese human capital endowments. If the actual Chinese earnings are equal to or greater than
the native estimated earnings, we can conclude that assimilation has occurred. From Table 3, we
know that the actual LnRealWage for Chinese is 10.4610, which is 0.13 less than the estimated
result (10.5952) from Table 5. This means that in 1994, the cohort of Chinese immigrants has a
lower income level than estimated for natives with Chinese human capital endowments; thus
economic assimilation has not yet occurred at this point.
Step 5: The steps above are repeated for each of the remaining nine selected survey years
from 1996 to 2011. Results are presented in Table 6, Figure 4, and Figure 5. These results are
presented in dollar terms by taking the antilogs of the estimated LnRealWage results. To see the
results in LnRealWage terms refer to Appendix 5.

Wage Convergence 21
Table 6: Actual Chinese Real Wage vs. Estimated Native Real Wage
Survey Year Actual Chinese Real Wage
Estimated Native Real Wage
Actual minus Estimated
Percentage Difference
1994 34,924.86 39,942.27 -5,017.41 -12.56% 1996 35,891.70 41,830.78 -5,939.08 -14.20% 1998 38,731.62 43,570.65 -4,839.03 -11.11% 2000 42,735.86 45,848.41 -3,112.55 -6.79% 2002 48,790.86 51,577.34 -2,786.48 -5.40% 2004 48,522.29 51,005.46 -2,483.18 -4.87% 2006 54,193.70 49,683.88 4,509.82 9.08% 2008 52,028.47 51,204.82 823.66 1.61% 2010 54,712.05 52,187.65 2,524.40 4.84% 2011 53,373.78 51,480.48 1,893.30 3.68%
Table 6 compares actual Chinese real earnings to estimated native real earnings. As
explained in the previous section, the estimated earnings show Chinese immigrants’ real earnings
when they are rewarded according to natives’ reward structure. The changes in the difference of
actual and estimated earnings reported in the last two columns indicate whether there is wage
convergence and economic assimilation over time.
Results in Table 6 are graphed in Figure 4. Actual Chinese earnings are below the estimated
native earnings level from 1994 to 2004 but are above the native line from 2006 to 2011. This
result implies that income parity is not reached between Chinese immigrants and natives from
1994 to 2004 but is then reached and exceeded from 2006 to 2011. Thus, economic assimilation
of Chinese immigrants to natives occurs sometime between 2004 and 2006. It can also be seen
from the graph that both lines display an upward rising trend and they intersect between 2004
and 2006. Therefore, income level for the cohort of Chinese immigrants and natives rises over
time.

Wage Convergence 22
Figure 5 shows the percentage difference of actual Chinese earnings and estimated native
earnings. It shows that the cohort of Chinese immigrants has an earnings disadvantage relative to
natives of 12.56% in 1994; however, this disadvantage gradually disappears over time and
eventually becomes an earnings advantage after 2004. In 2011, Chinese immigrant earnings
exceed native earnings by 3.68%. The results support the original hypothesis that there is wage
convergence between the cohort of 1994 Chinese immigrants and natives over time, and
economic assimilation eventually takes place. Meanwhile, the gradually narrowing gap between
the Chinese and native earnings supports my hypothesis that assimilation of Chinese immigrants
would occur over time and that they would eventually reach earnings parity with natives.
20,000.00
25,000.00
30,000.00
35,000.00
40,000.00
45,000.00
50,000.00
55,000.00
60,000.00
1994 1996 1998 2000 2002 2004 2006 2008 2010 2012
Ann
ual R
eal W
age
(201
1 do
llars
)
Year
Figure 4: Actual Chinese Real Wage vs. Estimated Native Real Wage
Estimated Native Real Wage
Actual Chinese Real Wage

Wage Convergence 23
Conclusions
This research explores income determinants for 21st century Chinese immigrants and
examines whether there is wage convergence and economic assimilation between Chinese
immigrants and natives over time. By using repeated cross-section data in age-period cohort
analysis, this research follows a cohort of Chinese immigrants who migrated before 1994 and a
cohort of natives from 1994 through 2011. My hypothesis that human capital factors have a
significant influence on a Chinese immigrant’s income level is supported by my results. The
most important finding of this study is that over time there is wage convergence and economic
assimilation of Chinese immigrants towards natives, which is consistent with Chiswick’s
findings in the age-earnings profile.
Also, this study suggests that current immigration policies are attracting high-skilled
Chinese immigrants to the U.S. Policies that encourage immigrants to acquire advanced college
education should continue to be carried out. As they become increasingly assimilated over time,
-20.00%
-15.00%
-10.00%
-5.00%
0.00%
5.00%
10.00%
15.00%
1994 1996 1998 2000 2002 2004 2006 2008 2010 2012
Perc
enta
ge D
iffer
ence
Year
Figure 5: Percentage Difference of Actual Chinese Real Wage vs. Estimated Native Real Wage
Percentage Difference

Wage Convergence 24
long-term residency may also encourage high-skilled immigrants to stay in the United States and
utilize the skills to contribute and stimulate the economy.
Because my research hypotheses are supported by the results, and the findings are consistent
with the assimilation and human capital theories, this study has thus far suggested the existence
of wage convergence and economic assimilation. Future research should be conducted to explore
the extent to which each factor contributes to wage convergence. One possibility would be to
decompose the difference in earnings and explore how much of the difference is due to
differences in the mean values of the independent variables and how much of the difference in
earnings is due to differences in returns as measured by coefficients.

Wage Convergence 25
References
2009 American Community Survey. (2009). American FactFinder. Retrieved December 4,
2011, from U.S. Census Bureau:
http://factfinder.census.gov/home/saff/main.html?_lang=en
Barringer, H. R., Takeuchi, D. T., & Xenos, P. (1990). Education, Occupational Prestige, and
Income of Asian Americans. Sociology of Education , 63 (1), 27-43.
Beenstock, M., Chiswick, B. R., & Paltiel, A. (2010). Testing the immigrant assimilation
hypothesis with longitudinal data. Review of Economics of the Household , 8 (1), 7-27.
Borjas, G. J. (2005). Chapter 7 Human Capital. In G. J. Borjas, Labor Economics, Third Edition
(pp. 235-279). New York, NY: McGraw-Hill/Irwin.
Borjas, G. J. (2009). Chapter 8 Labor Mobility. In G. J. Borjas, Labor Economics, Sixth Edition
(pp. 331-334). New York, NY: McGraw Hill.
Chiswick, B. R. (1978, October). The Effect of Americanization on the Earnings of Foreign-
Born Men. Journal of Political Economy , 86.
Clark, W. (2003). Immigrants and the American Dream: Remaking the Middle Class. New
York: Guilford Press.
Debusmann, Jr., B. (2010, December 7). Asian-Americans in U.S. earn less than white men:
study | Reuters. Retrieved November 29, 2011, from Reuters.com:
http://www.reuters.com/article/2010/12/07/us-work-discrimination-asians-
idUSTRE6B63EZ20101207
Fukuda, K. (2008). A Cohort Analysis of U.S. Age-Earnings Profiles. Bulletin of Economic
Research , 60 (2), 191-207.
IPUMS-CPS. (2011, March). IPUMS-CPS: FAQ. Retrieved October 23, 2011, from IPUMS-

Wage Convergence 26
CPS: http://cps.ipums.org/cps-action/faq#ques0
Min, P. G. (2006). Major Issues Related to Asian American Experiences. In P. G. Min, Asian
Americans: Contemporary Trends and Issues (2 ed., p. 83). London, United Kindom:
Pine Forge Press, Sage Publications Ltd.
Schaeffer, P. V. (2006). Outline of an Economic Theory of Assimilation. The Journal of
Regional Anlaysis & Policy , 153.
Thornton, R. J., Rodgers, J. D., & Brookshire, M. L. (1997). On the Interpretation of Age-
Earnings Profiles. Journal of Labor Research , 18 (2), 351-365.
U.S. Census Bureau. (2008, August 14). Newsroom: Population: An Older and More Diverse
Nation by Midcentury. Retrieved December 4, 2011, from U.S. Census Bureau:
http://www.census.gov/newsroom/releases/archives/population/cb08-123.html
Vigdor, J. L. (2008). Measuring Immigrant Assimilation in the United States. Civic Report
No.53. Manhattan Inst, New York, NY Center for,Civic Innovation. New York, NY:
Manhattan Institute for Policy Research.
Waters, M. C., & Jiménez, T. R. (2005). Assessing Immigrant Assimilation: New Empirical
and Theoretical Challenges. Annual Review of Sociology , 31, 105-125.

Wage Convergence 27
Appendix 1: CPI Data Used For Each Survey Year Survey Year CPI
1994 148.20 1996 156.90 1998 163.00 2000 172.20 2002 179.90 2004 188.90 2006 201.60 2008 215.30 2010 218.06 2011 224.94

Wage Convergence 28
Appendix 2: Descr iptive Results of Natives Natives 1994 1996 1998 2000 2002
Mean Std. Dev Mean Std. Dev Mean Std. Dev Mean Std. Dev Mean Std. Dev Dependent Var iable: Natives Wage and salary income
26593.95 19480.482 31193.88 30774.504 34786.34 35934.249 37661.78 33340.822 43982.15 47471.579
RealWage 40364.48 29567.612 44720.96 44119.733 48004.94 49589.043 49196.30 43551.981 54993.33 59356.362 LnWage 9.9929 .83267 10.1155 .81688 10.2282 .82336 10.3295 .80392 10.4520 .79431 LnRealWage 10.4101 .83267 10.4758 .81688 10.5503 .82336 10.5967 .80392 10.6754 .79431 Independent Var iable:
HighSchoolDiploma .3419 .47434 .3401 .47375 .3372 .47275 .3326 .47116 .3256 .46861 SomeCollege .3053 .46052 .2981 .45745 .3000 .45825 .3009 .45868 .3018 .45905 Bachelors .2010 .40073 .2014 .40102 .2045 .40331 .2034 .40253 .2086 .40631 Masters .0589 .23545 .0640 .24484 .0638 .24442 .0725 .25930 .0770 .26656 Professionals .0166 .12762 .0178 .13231 .0194 .13786 .0178 .13221 .0192 .13718 Doctors .0085 .09202 .0095 .09709 .0113 .10568 .0121 .10950 .0132 .11432 Age 35.07 5.872 37.07 5.865 39.02 5.883 41.02 5.907 42.68 5.726 Usual hours worked per week (last yr)
44.24 8.703 44.34 8.564 44.33 8.419 44.38 8.438 44.18 8.332
Male .5751 .49434 .5719 .49482 .5716 .49486 .5663 .49560 .5683 .49532 Married .6727 .46922 .6882 .46324 .6986 .45889 .6986 .45887 .7363 .44067 Number of own children in household
1.16 1.205 1.21 1.222 1.23 1.214 1.20 1.219 1.34 1.203
Number of own children under age 5 in hh
.29 .584 .25 .546 .22 .517 .18 .481 .18 .469

Wage Convergence 29
Appendix 2: Descr iptive Results of Natives (cont.) Natives 2004 2006 2008 2010 2011
Mean Std. Dev Mean Std. Dev Mean Std. Dev Mean Std. Dev Mean Std. Dev Dependent Var iable:
Natives Wage and salary income
46107.36 48551.519 49765.69 53830.652 52486.32 55065.931 55307.53 59337.582 54910.82 53239.876
RealWage 54903.88 57814.347 55527.01 60062.565 54835.37 57530.436 57053.33 61210.590 54910.82 53239.876 LnWage 10.5080 .80392 10.5775 .80882 10.6449 .79067 10.6660 .83517 10.6894 .81309 LnRealWage 10.6826 .80392 10.6871 .80882 10.6887 .79067 10.6971 .83517 10.6894 .81309 Independent Var iable:
HighSchoolDiploma .3181 .46574 .3135 .46393 .3061 .46086 .3080 .46166 .2970 .45695 SomeCollege .3025 .45933 .3045 .46021 .3008 .45861 .2987 .45771 .2966 .45675 Bachelors .2107 .40782 .2132 .40957 .2174 .41248 .2176 .41261 .2245 .41723 Masters .0840 .27740 .0843 .27778 .0921 .28916 .0955 .29391 .1026 .30345 Professionals .0192 .13720 .0209 .14312 .0204 .14146 .0192 .13716 .0199 .13979 Doctors .0139 .11693 .0140 .11735 .0150 .12151 .0179 .13276 .0181 .13326 Age 44.61 5.725 46.34 5.715 48.20 5.724 50.02 5.702 50.94 5.696 Usual hours worked per week (last yr)
44.08 8.296 44.27 8.435 44.07 8.374 43.82 8.295 43.93 8.308
Male .5646 .49581 .5634 .49597 .5580 .49663 .5601 .49639 .5603 .49636 Married .7373 .44010 .7351 .44128 .7252 .44640 .7238 .44711 .7206 .44871 Number of own children in household
1.27 1.193 1.20 1.181 1.10 1.152 1.02 1.140 .96 1.110
Number of own children under age 5 in hh
.13 .412 .10 .372 .07 .317 .05 .263 .04 .239

Wage Convergence 30
Appendix 3: Descr iptive Results of Chinese Immigrants Chinese 1994 1996 1998 2000 2002
Mean Std. Dev Mean Std. Dev Mean Std. Dev Mean Std. Dev Mean Std. Dev Dependent Var iable:
Chinese Wage and salary income
31541.38 23464.538 32976.45 35476.581 37348.80 39767.397 38932.15 32379.078 53122.71 56845.913
RealWage 47873.73 35614.640 47276.55 50860.846 51541.12 54878.764 50855.74 42295.688 66422.29 71077.614 LnWage 10.0437 1.00143 10.1280 .80236 10.2423 .89738 10.3956 .84983 10.5719 .94110 LnRealWage 10.4610 1.00143 10.4883 .80236 10.5644 .89738 10.6628 .84983 10.7953 .94110
Independent Var iable:
HighSchoolDiploma .2081 .40700 .2121 .41005 .2154 .41215 .2327 .42389 .2061 .40528 SomeCollege .1015 .30279 .1091 .31270 .1282 .33518 .1132 .31785 .1031 .30461 Bachelors .2589 .43914 .2364 .42614 .2308 .42241 .2956 .45775 .2481 .43273 Masters .1929 .39558 .2424 .42985 .2205 .41566 .1824 .38739 .2099 .40803 Professionals .0305 .17228 .0121 .10976 .0359 .18651 .0126 .11180 .0344 .18248 Doctors .1117 .31577 .0909 .28835 .0564 .23131 .0818 .27487 .1183 .32361 Age 35.82 5.619 38.30 5.846 39.65 5.672 41.88 5.595 42.72 5.490 Usual hours worked per week (last yr)
42.90 7.299 43.71 8.145 43.63 8.915 44.25 8.981 43.62 9.100
Male .5635 .49722 .5152 .50129 .5487 .49890 .4906 .50149 .5573 .49766 Married .8122 .39156 .8242 .38177 .7897 .40854 .8868 .31785 .8397 .36759 Number of own children in household
1.06 1.146 1.18 1.020 1.20 1.087 1.28 1.038 1.19 1.008
Number of own children under age 5 in hh
.36 .652 .27 .543 .32 .645 .24 .456 .23 .546

Wage Convergence 31
Appendix 3: Descr iptive statistics results of Chinese Immigrants (cont.) Chinese 2004 2006 2008 2010 2011
Mean Std. Dev Mean Std. Dev Mean Std. Dev Mean Std. Dev Mean Std. Dev Dependent Var iable:
Chinese Wage and salary income
52299.41 47049.805 60966.04 70594.065 63983.20 66886.756 74196.23 79421.828 66125.06 56148.275
RealWage 62277.27 56026.131 68024.01 78766.659 66846.80 69880.309 76538.25 81928.801 66125.06 56148.275 LnWage 10.6152 .82311 10.7908 .80169 10.8158 .83112 10.8788 .92739 10.8851 .79155 LnRealWage 10.7898 .82311 10.9003 .80169 10.8595 .83112 10.9098 .92739 10.8851 .79155
Independent
Var iable:
HighSchoolDiploma .2132 .41035 .1891 .39229 .1741 .37988 .2150 .41175 .2335 .42398
SomeCollege .1434 .35117 .0982 .29810 .0889 .28511 .0841 .27821 .1101 .31375 Bachelors .1899 .39300 .2291 .42101 .2148 .41146 .2523 .43537 .2026 .40286 Masters .1899 .39300 .2145 .41126 .2556 .43698 .2477 .43267 .2159 .41233 Professionals .0543 .22698 .0255 .15779 .0481 .21448 .0187 .13575 .0396 .19556 Doctors .1085 .31165 .1091 .31232 .1148 .31939 .1121 .31629 .1322 .33941 Age 44.81 5.901 47.33 5.704 48.61 5.824 50.30 5.312 51.38 5.615 Usual hours worked per week (last yr)
43.83 8.745 43.44 7.233 42.81 7.587 43.16 8.083 43.31 7.836
Male .5775 .49491 .5673 .49636 .5185 .50058 .5187 .50082 .5330 .50001 Married .8527 .35508 .8400 .36727 .8630 .34453 .8318 .37494 .8282 .37805 Number of own children in household
1.32 .999 1.20 .958 1.17 .968 1.14 1.040 1.19 1.042
Number of own children under age 5 in hh
.24 .493 .12 .343 .07 .326 .07 .327 .04 .217

Wage Convergence 32 Appendix 4: Regression Results for Chinese Immigrants (t-Statistics in Parentheses)
Chinese 1994 1996 1998 2000 2002 2004 2006 2008 2010 2011 (Constant) 8.504*** 9.029*** 8.890*** 10.470*** 8.905*** 9.958*** 8.712*** 10.198*** 10.107*** 10.412***
(13.041) (17.414) (16.669) (14.034) (15.348) (21.447) (18.855) (19.831) (15.259) (16.829)
HighSchoolDiploma 1.232*** .191 .495** .187 .460** .445*** .268** .368** .357 .206
(4.923) (.925) (2.433) (.700) (2.044) (2.850) (2.077) (2.233) (1.511) (1.081)
SomeCollege 1.409*** .384 .460* .412 .834*** .531*** .571*** .796*** .510* .443**
(4.872) (1.620) (1.944) (1.418) (3.184) (3.146) (3.745) (4.144) (1.893) (2.121)
Bachelor s 1.696*** .575*** 1.177*** .807*** .874*** 1.170*** .922*** .918*** .887*** .797***
(7.023) (2.863) (5.740) (3.098) (3.898) (7.356) (7.327) (5.669) (3.905) (4.155)
Masters 1.984*** 1.138*** 1.340*** 1.013*** 1.409*** 1.462*** 1.319*** 1.394*** 1.392*** .917***
(8.033) (5.619) (6.423) (3.569) (6.328) (9.139) (10.209) (8.939) (6.106) (4.872)
Professionals 1.351*** 1.823*** 1.471*** .547 1.812*** 1.801*** 1.979*** 1.505*** 1.790*** 1.272***
(3.358) (3.573) (4.182) (.846) (4.814) (8.471) (7.999) (6.563) (3.942) (4.528)
Doctors 2.125*** 1.044*** 1.520*** .745** 1.371*** 1.340*** 1.698*** 1.166*** 1.651*** 1.336***
(7.570) (4.136) (5.438) (2.278) (5.459) (7.458) (11.616) (6.430) (6.352) (6.608)
Age -.002 .018 .021* -.015 .012 -.005 .006 -.009 -.006 -.020
(-.133) (1.409) (1.925) (-1.004) (1.093) (-.700) (.804) (-1.102) (-.547) (-2.291)
Usual hour s worked per week (last yr ) .006 .007 -.004 .002 .010 .000 .020*** .001 .002 .011*
(.711) (.939) (-.528) (.212) (1.460) (.018) (3.537) (.256) (.255) (1.925)
Male .204 .163 .394*** .429*** .083 .280*** .054 .312*** .071 .107
(1.528) (1.402) (3.415) (3.122) (.746) (3.330) (.719) (3.575) (.621) (1.190)
Marr ied .071 -.401** -.125 -.126 -.035 -.096 .374*** .035 -.016 .303**
(.391) (-2.392) (-.761) (-.567) (-.222) (-.752) (3.525) (.270) (-.097) (2.330)
Number of own children in household .094 .073 -.010 .037 .003 .047 -.088** -.058 .052 .041
(1.243) (.989) (-.152) (.494) (.045) (1.061) (-2.048) (-1.151) (.888) (.869)
Number of own children under age 5 in hh -.099 .151 .089 -.086 .120 .033 -.104 -.105 .153 -.433** (-.755) (1.324) (.859) (-.444) (1.032) (.346) (-.911) (-.735) (.894) (-2.169) Adjusted R Square .303 .306 .321 .172 .238 .427 .534 .365 .317 .385 Sample size 191 159 185 144 243 244 247 252 204 213 Note: ***Significant at the 1 percent level. **Significant at the 5 percent level. *Significant at the 10 percent level. t-Statistics are reported in parentheses.

Wage Convergence 33
Appendix 5: Actual Chinese LnRealWage vs. Estimated Native LnRealWage
Survey Year Actual Chinese LnRealWage
Estimated Native LnRealWage
1994 10.4610 10.5952 1996 10.4883 10.6414 1998 10.5644 10.6821 2000 10.6628 10.7331 2002 10.7953 10.8508 2004 10.7898 10.8397 2006 10.9003 10.8134 2008 10.8595 10.8436 2010 10.9098 10.8626 2011 10.8851 10.8490
Related Documents