Economic appraisal of public transport service enhancements October 2013 I Wallis and A Lawrence, Ian Wallis Associates Ltd, Wellington N Douglas, Douglas Economics, Wellington NZ Transport Agency research report 533 Contracted research organisation – Ian Wallis Associates Ltd

Welcome message from author
This document is posted to help you gain knowledge. Please leave a comment to let me know what you think about it! Share it to your friends and learn new things together.
Transcript
Economic appraisal of public transport service enhancements
October 2013
I Wallis and A Lawrence, Ian Wallis Associates Ltd, Wellington N Douglas, Douglas Economics, Wellington
NZ Transport Agency research report 533 Contracted research organisation – Ian Wallis Associates Ltd
ISBN 978-0-478-40781-5 (electronic)
ISSN 1173-3764 (electronic)
NZ Transport Agency
Private Bag 6995, Wellington 6141, New Zealand
Telephone 64 4 894 5400; facsimile 64 4 894 6100
www.nzta.govt.nz
Wallis, I,1 N Douglas2 and A Lawrence1 (2013) Economic appraisal of public transport service
enhancements. NZ Transport Agency research report 533. 121pp.
1 Ian Wallis Associates Ltd PO Box 11785 Manners Street, Wellington 6142, New Zealand, tel: +64-4 472 2354
2 Douglas Economics PO Box 9926 Marion Square, Wellington 6141, New Zealand, tel: +64-4 472 4645
Ian Wallis Associates Ltd was contracted by the NZ Transport Agency in 2012 to carry out this research.
This publication is copyright © NZ Transport Agency 2013. Material in it may be reproduced for personal
or in-house use without formal permission or charge, provided suitable acknowledgement is made to this
publication and the NZ Transport Agency as the source. Requests and enquiries about the reproduction of
material in this publication for any other purpose should be made to the Research Programme Manager,
Programmes, Funding and Assessment, National Office, NZ Transport Agency, Private Bag 6995,
Wellington 6141.
Keywords: economic appraisal, New Zealand, parameter values, public transport.

An important note for the reader
The NZ Transport Agency is a Crown entity established under the Land Transport Management Act 2003.
The objective of the Agency is to undertake its functions in a way that contributes to an efficient, effective
and safe land transport system in the public interest. Each year, the NZ Transport Agency funds innovative
and relevant research that contributes to this objective.
The views expressed in research reports are the outcomes of the independent research, and should not be
regarded as being the opinion or responsibility of the NZ Transport Agency. The material contained in the
reports should not be construed in any way as policy adopted by the NZ Transport Agency or indeed any
agency of the NZ Government. The reports may, however, be used by NZ Government agencies as a
reference in the development of policy.
While research reports are believed to be correct at the time of their preparation, the NZ Transport Agency
and agents involved in their preparation and publication do not accept any liability for use of the research.
People using the research, whether directly or indirectly, should apply and rely on their own skill and
judgement. They should not rely on the contents of the research reports in isolation from other sources of
advice and information. If necessary, they should seek appropriate legal or other expert advice.

Acknowledgements
The project team would like to thank the members of the Steering group for their time and helpful
comments:
• Doug Weir, NZ Transport Agency (research owner/Chair)
• Sandy Fong, NZ Transport Agency
• Graeme Belliss, NZ Transport Agency
• Nick Hunter, NZ Transport Agency
• Haobo Wang, Ministry of Transport
• Chris Clarke, Taranaki Regional Council
• Nik Vorster, Auckland Transport
• Steve Spence, Wellington City Council
• Philip Manning, Bus & Coach Association
We would also like to thank our peer reviewers:
• Don Wignall, Transport Futures Ltd, Wellington
• Todd Litman, Victoria Transport Policy Institute, Vancouver, Canada.
5
Contents
Executive summary ..................................................................................................................................................................................... 7 Abstract ............................................................................................................................................................................................................ 10 1 Introduction ..................................................................................................................................................................................... 11
1.1 Project objectives and scope ....................................................................................................... 11 1.1.1 Public transport proposals - service enhancements, network reconfigurations
and infrastructure developments ..................................................................................... 12 1.2 Project context ............................................................................................................................. 12
1.2.1 Economic appraisal of public transport proposals in New Zealand ................................ 12 1.2.2 Transport project appraisal and decision making in New Zealand ................................. 13 1.2.3 New Zealand Treasury Better Business Cases framework ............................................... 14
1.3 Report structure ........................................................................................................................... 15 2 Review of approaches to project appraisal ................................................................................................................. 16
2.1 Introduction .................................................................................................................................. 16 2.2 Project appraisal approaches ....................................................................................................... 16
2.2.1 Financial appraisal ............................................................................................................. 17 2.2.2 Cost-effectiveness analysis ............................................................................................... 17 2.2.3 Social cost-benefit analysis ............................................................................................... 18 2.2.4 Economic impact assessment ........................................................................................... 18 2.2.5 Multi-criteria analysis ........................................................................................................ 18
2.3 Assessment of appraisal approaches .......................................................................................... 19 2.3.1 Multi-criteria assessment criteria...................................................................................... 19 2.3.2 Results of multi-criteria assessment ................................................................................ 20
2.4 Recommended approach for economic appraisal ...................................................................... 22 3 Review of economic appraisal procedures .................................................................................................................. 24
3.1 Introduction .................................................................................................................................. 24 3.2 Key methodological considerations ............................................................................................ 24
3.2.1 Social cost-benefit analysis ............................................................................................... 25 3.2.2 Cost-effectiveness analysis ............................................................................................... 27 3.2.3 Comment on financial appraisal ....................................................................................... 28
3.3 Public transport user benefit parameters ................................................................................... 28 3.4 Consideration of ‘simplified procedures’ for economic appraisal ............................................. 29
3.4.1 NGTSM ‘rapid appraisal’ .................................................................................................... 30 3.4.2 EEM ‘simplified procedures’ .............................................................................................. 30 3.4.3 Federal Transit Administration ‘new starts and small starts’ ......................................... 31
4 Considerations for application of economic appraisal procedures in New Zealand ......................... 33 4.1 Introduction .................................................................................................................................. 33 4.2 Consideration of appropriate level of analysis ........................................................................... 33
4.2.1 Type of proposal ............................................................................................................... 34 4.2.2 Cost and risk profile .......................................................................................................... 34 4.2.3 Stage of assessment .......................................................................................................... 36
4.3 Recommended levels of analysis for economic appraisal .......................................................... 37 4.3.1 Detailed appraisal .............................................................................................................. 39 4.3.2 Rapid appraisal .................................................................................................................. 39 4.3.3 Simple appraisal ................................................................................................................ 40

6
4.4 Selecting an appropriate level of analysis for economic appraisal ............................................ 41 5 Review of public transport user benefit parameter values ............................................................................... 43
5.1 Introduction .................................................................................................................................. 43 5.2 Scoping of parameter value investigations ................................................................................. 43 5.3 Overview of user benefit parameter research (New Zealand and Australia) .............................. 47 5.4 Assessment of parameter value evidence: (standard) in-vehicle time ....................................... 48 5.5 Assessment of parameter value evidence: journey time attributes ........................................... 49
5.5.1 Walk time (access/egress) ................................................................................................. 50 5.5.2 Headway (service interval) ................................................................................................. 50 5.5.3 Seat availability/crowding ................................................................................................. 51 5.5.4 Interchange ........................................................................................................................ 52 5.5.5 Reliability of travel time ..................................................................................................... 54
5.6 Assessment of parameter value evidence: quality and mode-specific attributes ...................... 56 5.6.1 Overview ............................................................................................................................. 56 5.6.2 Review of quality attributes ............................................................................................... 56 5.6.3 Mode-specific factors ......................................................................................................... 57
5.7 Recommendations on public transport user benefit parameter values ..................................... 59 6 Application of recommended procedures and parameter values – case study ..................................... 62
6.1 Introduction .................................................................................................................................. 62 6.2 Overview of case study ................................................................................................................. 63
6.2.1 The PTSS proposals and economic appraisal scope ......................................................... 63 6.2.2 The case study scope and approach ................................................................................. 63
6.3 Detailed appraisal – implications of recommended parameter values for the EEM .................. 64 6.3.1 Details of parameter values tested ................................................................................... 64 6.3.2 Application and comments ................................................................................................ 65 6.3.3 Conclusion on effects of applying recommended parameter values .............................. 66
6.4 Rapid appraisal – comparison of EEM simplified procedures (SP10) with detailed appraisal results ........................................................................................................................... 67 6.4.1 Details of scope and methodology ................................................................................... 67 6.4.2 Application of EEM simplified procedures (SP10) ............................................................. 68 6.4.3 Comparisons with EEM detailed procedures .................................................................... 69 6.4.4 Conclusions on effects of applying EEM simplified procedures (SP10) relative to
EEM detailed procedures ................................................................................................... 70 6.5 Simple appraisal – brief consideration ........................................................................................ 71
7 Conclusions and recommendations ................................................................................................................................. 72 8 References ........................................................................................................................................................................................ 75
8.1 Appraisal approaches and procedures ........................................................................................ 75 8.2 Parameter values .......................................................................................................................... 78
Appendix A: Business case decision making ............................................................................................................................ 81 Appendix B: Approaches and methods used in the appraisal of transport projects ....................................... 84 Appendix C: International review of procedures for economic appraisal .............................................................. 88 Appendix D: Key methodological considerations for social cost-benefit analysis ........................................... 91 Appendix E: Evidence on individual parameters .................................................................................................................... 98 Appendix F: Summary of parameter value studies ............................................................................................................ 115 Appendix G: Review of existing ‘simplified procedures’ in NZ Transport Agency Economic
evaluation manual ...................................................................................................................................................... 117 Appendix H: Glossary ........................................................................................................................................................................... 121
7
Executive summary
This research project was tasked with developing recommendations on economic appraisal approaches,
parameters and parameter values appropriate for application in New Zealand to assess the viability of
public transport proposals (in particular service enhancements), and then to assess the effects of applying
these recommendations to a sample New Zealand case study.
Economic appraisal approaches and procedures
The first focus area included an international review of economic and project appraisal approaches and
procedures, with five broad approaches to project appraisal identified and assessed. A multi-criteria
analysis (MCA) framework was found to be most appropriate for overall project appraisal of transport
projects in New Zealand. Within this overall framework, social cost-benefit analysis (SCBA), supported by
cost-effectiveness analysis (CEA), was found to be the most suited approach to economic appraisal, with
CEA being most appropriate for smaller projects focusing on public transport service changes. This is
consistent with existing practice in New Zealand and therefore we recommend no substantial changes to
the current New Zealand approach to economic appraisal.
Six procedures from Australia, the UK, USA and New Zealand, currently used for SCBA and CEA of
transport projects were then reviewed. The review focused on key methodological considerations, public
transport user benefit parameters and the application of ‘simplified procedures’ for economic appraisal.
The procedures were all based on SCBA, except in the US, where procedures were primarily based on CEA
(within a MCA framework).
The public transport appraisal procedures in the New Zealand Economic evaluation manual (EEM) provide
monetary values for travel time in different situations, generally similar to the equivalent Australian and
UK evaluation manuals, although there are notable omissions relating to rail infrastructure factors and
public transport mode-specific preferences. We therefore recommend that parameter values for rail
infrastructure features and for mode-specific preferences be incorporated into New Zealand practice and
included in the current EEM review/update. Our review, and previous reviews, also identified that
practitioners find the EEM difficult to apply; we therefore recommend the EEM be redrafted to improve
ease of use.
Appraisal methodology issues
Seven SCBA methodology issues were addressed, principally in the context of the EEM volume 2, and by
comparing the New Zealand approach with international practices:
1 We recommend that future appraisal procedures incorporate escalation of unit parameter values over
time (to reflect changes in real incomes).
2 Adoption of either equity or behavioural valuations of non-work time was reviewed but no
recommendations made (as this is largely a policy decision).
3 We recommend no changes to existing EEM procedures relating to choice of willingness-to-pay or
social cost basis in SCBA calculations, although the text and presentation could usefully be enhanced.
4 We recommend no changes to existing EEM procedures relating to choice of market price or factor
cost units of account, although the text and presentation could usefully be enhanced.
5 Treatment of key benefit and cost items in deriving SCBA decision criteria (net present value, benefit–
cost ratio ((BCR)) etc). We recommend clarification in EEM of the roles for BCRN and BCR
G for public
transport schemes.

Economic appraisal of public transport service enhancements
8
6 Discount rate, no recommendations as not specific to public transport (needs to be addressed in a
wider context).
7 Analysis period, no recommendations as not specific to public transport (needs to be addressed in a
wider context).
Application of procedures
This area concluded with how economic appraisal procedures might best be applied to public transport
proposals in New Zealand. We looked at the following three levels of appraisal:
1 ‘detailed appraisal’ based on full SCBA
2 ‘rapid appraisal’ based on SCBA with simplified consideration of externalities
3 ‘simple appraisal’ based on CEA and including operating costs, patronage and revenue impacts.
We recommend the appraisal method for public transport proposals be tailored to ensure an appropriate
level of analysis, based on a consideration of the type of proposal, cost and risk profile, and stage of the
assessment within the decision-making process. We recommend further research into the selection of an
appropriate level of analysis, and to determine the extent to which rapid appraisal procedures might differ
for single-stage and multi-stage decision-making processes.
Public transport user benefit parameters
The second focus area considered appropriate public transport user benefit parameter values that might
be applied to economic appraisal of public transport proposals in New Zealand. This involved a
comprehensive review of evidence on public transport parameter values from market research undertaken
since 1990 in Australia (28 studies) and New Zealand (seven studies), covering: values of travel time in a
range of situations (access/egress, waiting, in-vehicle including crowding, interchanging), reliability of
travel time and vehicle and stop/station quality factors. Comparisons were made with current EEM and
National guidelines for transport system management in Australia (NGTSM) values, with the evidence
analysed to identify appropriate ‘default’ parameter values and any gaps in the existing research evidence.
Our recommendations are as follows:
• In-vehicle time, headway (frequency), vehicle quality and stop/station quality features
Recommend that any changes to these parameters in EEM be considered once the public transport
pricing strategies research project is completed (refer section 5.6).
• Access/egress (walk) time, travel time reliability and seat availability/crowding
Recommend no changes in these parameters in EEM (current parameter values more-or-less consistent
with weight of evidence examined).
• Interchange (wait time and transfer ‘penalty’)
Recommend changes to both these sub-parameters in the EEM. Also note need for additional
New Zealand-based market research on this aspect (important in the context of service and modal
integration/coordination policies being considered in Auckland, Wellington and other centres).
• Mode-specific factors
Recommend that 1) these be incorporated into the EEM; 2) in the short term, adopt the NGTSM
formulations; 3) in the medium term, undertake a more comprehensive review of international
evidence and integrate with the findings on quality factors from the public transport pricing strategies
project.

Executive summary
9
Case study
Finally, a case study based on the Wellington public transport spine study short list evaluation was
undertaken to illustrate the potential application of recommended improvements to economic appraisal
procedures and recommended user benefit parameter values. The case study included a ‘rapid appraisal’ and
‘detailed appraisal’, applied using EEM simplified procedures and EEM full procedures respectively. The full
procedures case study included a comparison of results using recommended user benefit parameter values.
Based on our ‘detailed appraisal’ (using EEM full procedures), we conclude that adoption of our preferred
set of public transport user benefit parameter values, in place of the current EEM values, is likely to make
material differences to ‘detailed’ economic appraisal results for public transport proposals, in both
absolute and relative terms. The case study makes a good case for implementing our recommendations on
parameter values.
Based on comparative analysis of our ‘rapid appraisal’ (using EEM SP10 procedures) and detailed appraisal,
we conclude that:
• In this particular case, the public transport user benefit estimates by both methods are reasonably
similar in magnitude, and the options are ranked in the same order as in the detailed appraisal.
• While it is not clear whether such a result would be replicated for other schemes (as it is not
appropriate to generalise results from a single case study), in general terms this is to be expected.
The SP10 public transport user benefit estimates are driven by the number of new passengers, which
in turn are driven by the level of benefits to existing passengers (which account for the great majority
of public transport benefits in the detailed appraisal).
• In this particular case, the road user benefits estimated through SP10 and using detailed (modelling)
procedures are very different; this reflects the particular nature and impacts of the PTSS scheme and
seems unlikely to be a general finding.
We recommend a review of the EEM simplified procedures relating to the economic appraisal of public
transport proposals (ie SP9 and SP10 of the EEM). Such a review should cover:
• the case for retaining simplified procedures, and a clearer specification of the circumstances in which
they are in practice likely to be appropriate (taking account of the combined demand
forecasting/economic appraisal task, and the stage in project development)
• if they are to be retained, then consideration of the need for two sets of procedures (as now) or their
replacement by a single set (or possibly multiple sets)
• the inclusion of additional and practical advice on demand assessment (either within the context of
simplified procedures and/or elsewhere in the manual)
• review and updating of any parameter formulations and values specific to the simplified procedures
(eg as in SP10 table 1).
Economic appraisal of public transport service enhancements
10
Abstract
This research project was undertaken to provide guidance on appropriate methods and benefits
parameters to use in the economic appraisal of public transport proposals (in particular service
enhancements) in New Zealand.
The research involved two focus areas and a case study. The first focus area included an international
review of economic and project appraisal approaches and procedures, followed by a detailed assessment
of selected international appraisal procedures. The second focus area involved a comprehensive review of
existing New Zealand and Australian research evidence on public transport user benefit parameter values.
Finally, a case study based on the Wellington public transport spine study short list evaluation was
undertaken to illustrate the potential application of recommended improvements to economic appraisal
procedures and recommended user benefit parameter values.
The research found that social cost benefit analysis and cost effectiveness analysis were the most
appropriate methods for economic appraisal of public transport proposals in New Zealand, and that an
appropriate level of analysis should be undertaken. Recommended default values for appropriate user
benefit parameters were also identified.
1 Introduction
11
1 Introduction
1.1 Project objectives and scope
The overall objective of this research was to provide guidance on appropriate methods and benefit
parameters for use in the economic appraisal of public transport proposals (in particular service
enhancements) in New Zealand. One potential application of this research project would be as an input
into the NZ Transport Agency (‘the Transport Agency’) review of the Economic evaluation manual (EEM)
(NZ Transport Agency 2010a; NZ Transport Agency 2010b).
The high-level scope of this research project was as follows:
• Describe economic appraisal methods used to assess the viability of investment in public transport
proposals (including service enhancements).
• Describe the associated parameters and parameter values.
• Compare these against current New Zealand methodology.
• Identify a preferred approach, and associated parameters and parameter values that are most relevant
to New Zealand.
• Demonstrate the recommended approach in a sample New Zealand case study.
• Recommend possible resulting enhancements to economic appraisal procedures in New Zealand for
public transport services.
The research focused on the following two areas, plus a case study:
1 Economic appraisal approaches and procedures: The role of economic appraisal within the wider
context of project appraisal was considered, with five broad approaches to project appraisal identified
and evaluated. A more detailed assessment of procedures, focusing on key methodological
considerations and benefit parameters, was then carried out for a range of procedures currently used
in Australia, the UK, USA and New Zealand. Recommendations have been made in this report for
improving the application of economic appraisal procedures and practices to public transport
proposals in New Zealand, including potential improvements to current Transport Agency procedures.
2 Public transport user benefit parameter values: A comprehensive review of existing New Zealand and
Australian research evidence on public transport user benefit parameter values, based on willingness-
to-pay market research, was undertaken. This evidence was analysed to identify appropriate ‘default’
parameter values for use in economic appraisal procedures and to identify any gaps in the existing
research evidence. ‘Default’ parameter values have been recommended and aspects for further
research identified.
3 Case study on application of recommendations: The findings from these two research areas were
applied to a case study to illustrate the potential application of recommended improvements to
economic appraisal procedures in New Zealand; and the impact of adopting research
recommendations for user benefit parameters and parameter values.
The consideration of demand parameters (eg elasticities), public transport supply and unit operating cost
parameters were outside the scope of this research project, but would need to be considered in any ‘real
world’ application of the recommendations in this report.

Economic appraisal of public transport service enhancements
12
The research was undertaken by Ian Wallis Associates Ltd (Ian Wallis and Adam Lawrence) in conjunction
with Douglas Economics (Neil Douglas).
1.1.1 Public transport proposals – service enhancements, network reconfigurations and infrastructure developments
The emphasis of this research project was on service enhancements and ‘network reconfigurations’ which,
in New Zealand tend to be more common than infrastructure-based schemes. However, the public user
benefit parameters and associated values considered in this research project are generally the same for all
public transport proposals, whether service enhancements or infrastructure projects. The term ‘public
transport proposal’ is therefore used throughout this report as a generic term referring to public transport
service enhancements, network reconfigurations and infrastructure developments.
1.2 Project context
1.2.1 Economic appraisal of public transport proposals in New Zealand
In New Zealand, economic appraisal procedures are set out in the two-volume Economic evaluation
manual, first released by the Transport Agency in 2006 (NZ Transport Agency 2010a; NZ Transport
Agency 2010b). The first and more substantial volume (EEM volume 1) is primarily for the appraisal of
roading projects, while the second volume (EEM volume 2) covers other modes, including public transport,
but also depends on sections of volume 1 which focus on road-based appraisal requirements. EEM volume
2 includes simplified procedures in accompanying spreadsheets for appraising changes to new public
transport services (SP9) and existing public transport services (SP10).
There have been a number of reviews/recommendations on improvements that could be made to the EEM
volume 2 and its public transport procedures in particular (Ashford and Van Geldermalsen 2007; John
Bolland Consulting 2006; Wallis 2007; Wignall 2012a). The Transport Agency is currently (June 2013)
reviewing the EEM, and as part of the scoping stage of that review, Wignall (2012a) made the following
recommendations on matters that should be addressed and that are directly relevant to this research
project1:
• Advice on the circumstances (preliminary evaluation, post-implementation review, non-
major projects) where the mixed use of simplified procedures and full procedures is
appropriate.
• Allowance for the comprehensive treatment of PT infrastructure and service
improvements when these represent a 'package' of measures, rather than the (typical)
current approach of undertaking separate evaluations.
• Comprehensively identify the range of potentially allowable benefits and provide advice
on methods to quantify these.
• Updating of benefit and cost parameter values and indices up to July 2012.
1 A number of other recommendations were made; but these were mostly outside the direct scope of this research
project.

1 Introduction
13
• Review the value of time, especially the value of PT travel time for work related travel
which international comparisons reveals is currently low in both relative and absolute
terms (Wignall 2012a)
The work undertaken in this project on economic appraisal approaches and procedures dealt with the first
two points above, with recommendations relating to potential improvements to EEM guidelines and
procedures; particularly on the application of simplified procedures to public transport service
enhancements (which often include a component of infrastructure investment). The work on public transport
user benefit parameter values dealt with the last three points above, with recommendations on the value of
time savings for public transport users in different journey situations, including the user benefit parameters
and values appropriate for the appraisal of public transport proposals and service enhancements.
This report’s recommendations are also of direct application to regional councils (in particular) and other
organisations looking to justify or introduce public transport service enhancements, irrespective of
whether or not they are required to follow EEM guidelines.
The EEM provides detailed guidance on the economic appraisal of projects, but economic appraisal is only
one component of project appraisal and decision making, as now discussed.
1.2.2 Transport project appraisal and decision making in New Zealand
Project appraisal refers to a systematic process of defining the implications of (mutually exclusive) options
for a project, to assist decision makers in deciding whether the project should proceed and which option
should be selected: economic appraisal is one component of his process. A review of the various
approaches to project appraisal is provided in chapter 2; one such approach being multi-criteria analysis
(MCA), which is currently used by the Transport Agency in its funding decisions.
The Transport Agency, as administrator of the National Land Transport Fund, is a key decision-making
body for most transport investment in New Zealand and its requirements drive most other decision-
making processes2. The Transport Agency’s decision-making requirements are set out in the Planning and
investment knowledgebase (NZ Transport Agency 2011). The decision-making framework is essentially a
form of MCA with projects assessed as ranking high, medium or low against the following three criteria:
1 Strategic fit – refers to how an identified problem, issue or opportunity aligns with the Transport
Agency’s strategic investment direction. Strategic fit is assessed against a stated set of strategic
priorities or goals, which are derived from the Government policy statement on land transport funding
2011/2012 – 2021/2022 (GPS) (MoT 2011). The GPS also prescribes the amount of funding available
for each project type (or activity class).
2 Effectiveness – refers to the contribution that the proposed solution makes towards solving the
identified problem. Guidelines on how this criterion should be applied are contained within the
Planning and investment knowledgebase.
3 Economic efficiency – refers to the value (benefits) of the proposed solution relative to the resources
used (with the rating based on benefit-cost ratio appraisal using the EEM3).
2 For example, most local and regional transport projects (including public transport proposals) receive a funding
contribution from the Transport Agency and therefore the Transport Agency’s decision-making requirements must be
followed. 3 The benefit–cost ratio is converted into a low (<2), medium (2–4) or high (>4) rating.
Economic appraisal of public transport service enhancements
14
The resulting three-letter ‘assessment profile’ is used to rank projects from 1 to 11 using a rating table
specified by the Transport Agency4. In practice, the economic efficiency component is the only quantified
factor with the other factors being subjective judgements.
1.2.3 New Zealand Treasury Better Business Cases framework
The New Zealand Treasury Better Business Cases (TBBC) framework has been developed to guide and
assist government agencies seeking funding for new capital expenditure. It adopts a project appraisal
approach based on ‘five cases’ (NZ Treasury 2012) 5:
• Strategic case – is the proposal supported by a robust case for change?
• Economic case – does the proposal maximise value for money?
• Commercial case – is the proposal commercially viable?
• Financial case – is the proposal financially viable?
• Management case – is the proposal achievable?
The TBBC framework provides a structure for project appraisal and decision making, as discussed in
section 4.2.3.1. The framework includes different ‘paths’ for projects and programmes and provides for a
single-stage or two-stage decision-making process (depending on the scale and risk profile of the project).
A key emphasis of the TBBC framework is the ‘case for change’; with the strategic case the first of the five
cases to be developed. The economic case is then developed, based on social cost-benefit analysis as the
preferred method.
The TBBC framework is now being applied in the local government and transport sectors. It was used to
prepare the Additional Waitemata Harbour Crossing preliminary business case (Price Waterhouse Coopers
and NZIER 2011) and is being used as an organising structure for the Wellington public transport spine
study (PTSS) (AECOM 2012). The Transport Agency is currently (June 2013) in the process of incorporating
aspects of the TBBC framework into its own decision-making processes (National Infrastructure Unit 2012),
with new procedures expected to be published prior to the next planning round scheduled for 2015/16 (D
List, Transport Agency – pers comm, March 2013). This is significant for public transport proposals in
New Zealand, as the appraisal and funding approval of these projects is dependent on meeting the
Transport Agency’s requirements. Further discussion on the Transport Agency’s application of the TBBC is
provided in appendix A.
This business case approach, particular the staged decision-making process, is being applied to transport
projects in other jurisdictions. In the UK, WebTAG2 seeks to combine the UK Treasury framework (which
the TBBC is based on) with the current WebTAG guidelines (DfT 2011a). The National guidelines for
transport system management in Australia (NGTSM) (ATC 2006a) adopted a similar staged or tiered
approach to transport appraisal and decision making. Further discussion on both these is provided in
appendix A.
4 Refer www.pikb.co.nz/assessment-framework/prioritisation-of-activities/ 5 The TBBC is based on the UK Treasury framework but takes some elements from the Investment Management
Standard produced by the Department of Treasury and Finance in the State of Victoria, Australia (HM Treasury 2012;
State of Victoria Department of Treasury and Finance 2004).

1 Introduction
15
1.3 Report structure
The remainder of this report is structured around the two main research areas identified above, together
with the case study and application considerations, as follows:
• Economic appraisal approaches and procedures:
- Chapter 2 considers the role of economic appraisal (for public transport proposals) within the
wider context of project appraisal. It provides a summary of various project appraisal approaches
and includes an assessment of these against a number of criteria in order to determine the project
appraisal approaches most appropriate for use in public transport economic appraisal in the
New Zealand context.
- Chapter 3 reviews economic appraisal procedures appropriate for the project appraisal
approaches recommended above. A summary is provided of economic appraisal procedures
currently used in Australia, the UK, USA and New Zealand, focusing on key methodological
considerations, public transport user benefit parameters and consideration of ‘simplified
procedures’ for economic appraisal.
- Chapter 4 considers the application of economic appraisal procedures to public transport
proposals in New Zealand, focusing on considerations for methodology and level of analysis that
is appropriate to the problem being considered, eg considering of simplified procedures for
smaller projects such as those involving simpler public transport service changes. Potential
improvements to the application of economic appraisal procedures and practices in New Zealand
are identified.
• Public transport user benefit parameter values:
- Chapter 5 sets out the user benefit parameters relevant to the economic appraisal of public
transport proposals in New Zealand. For these parameters, it includes a detailed analysis of the
available New Zealand and Australian research evidence on appropriate values, recommends
‘default’ parameter values for use in New Zealand economic appraisal procedures and identifies
any gaps in the existing research evidence.
• Case study and application considerations:
- Chapter 6 uses a case study approach to illustrate the application and implications for
New Zealand public transport economic appraisal practices and results of adopting the project’s
recommendations on appraisal procedures, parameter formulations and parameter values.
• Conclusions and recommendations:
- Chapter 7 sets out the research conclusions and recommendations.
• Appendices – eight appendices, as listed on the contents page, provide additional details on some of
the aspects addressed in the main body of the report, and a glossary.

Economic appraisal of public transport service enhancements
16
2 Review of approaches to project appraisal
2.1 Introduction
This chapter considers the role of economic appraisal (for public transport proposals) within the wider
context of project appraisal. A literature review of international approaches to project appraisal, including
national and sub-national guidelines for project appraisal and relevant academic literature, was undertaken.
The review focused on approaches that could be compared against existing social cost-benefit analysis
(SCBA) procedures in New Zealand and that were suitable for ex-ante appraisal of public transport proposals.
The review also sought out methods for cost-effectiveness analysis (CEA), particularly for consideration as
potential ‘short-cut’ procedures that might be a suitable proxy for a full economic appraisal but are easier
and quicker to apply. Potential ‘short-cut’ procedures were considered as being of particular relevance to
minor public transport changes (eg changes to frequency or hours of operators). These considerations are
covered later in this report (refer chapter 3).
A summary of the identified project appraisal approaches is provided below, followed by an assessment to
determine those approaches most appropriate for use in the economic appraisal of public transport
proposals. The last section of this chapter sets out our recommendations on the most appropriate
approaches to economic appraisal of public transport proposals in New Zealand.
2.2 Project appraisal approaches
The project identified five broad approaches to project appraisal as shown in figure 2.1. These approaches
are not mutually exclusive, for example a financial appraisal may form an input into a CEA or the outputs
of a SCBA may be used as one of the criteria in a MCA. There is also a range of tools and methods
associated with each of these approaches as set out in appendix B.
Figure 2.1 Project appraisal approaches

2 Review of approaches to project appraisal
17
2.2.1 Financial appraisal
Financial appraisal compares revenue and financial costs directly attributable to a project – the normal
‘business’ approach. Key characteristics of financial appraisal include:
• Financial appraisal usually undertaken from the perspective of the transport operator or agency
incurring the financial costs and receiving the revenues, rather than a broader social view.
• Financial appraisal requires a ‘market’ to exist for project inputs and outputs. For public transport
services, fares may be set to capture user benefit. In making quality improvements to services, eg
more comfortable buses, emphasis is placed on assessing the likely demand response and the ability
to capture user benefit through fare rises (or public subsidy).
• Financial appraisal includes funding gap analysis, such as in the EEM (NZ Transport Agency 2010a),
which considers incremental impacts on revenue and costs that are incurred/received by the transport
operator. Also includes public transport ‘farebox’ analysis which may differ from funding gap analysis
(eg treatment of capital charges) or calculation of ‘commerciality ratios’ under the new public
transport operating model in New Zealand (NZ Transport Agency 2013).
Financial appraisal is often a subset of other appraisal approaches, such as SCBA, where the financial
components of the approach can be separately identified and reported.
2.2.2 Cost-effectiveness analysis
Cost-effectiveness analysis compares the costs of alternative projects in contributing towards a particular
objective or outcome, eg cost per life saved or cost per passenger-kilometre. In some quarters, CEA is
confined to looking at costs of different options in achieving the same (equal/constant) objective or
outcome. Cost-effectiveness analysis is:
• Particularly useful when options are similar in nature (ie similar impacts) and where it is not possible
or feasible to value certain major benefits in monetary terms (Griffith et al 2012, p15; NSW Treasury
2007, p10).
• Sometimes considered a proxy for a full SCBA, in that all benefits and costs need to be identified.
Monetary values should be placed on as many benefits as possible so they can be included with the
costs. This inclusion of benefits is a key distinguishing factor between financial appraisal and CEA.
• Currently used mainly in areas such as health and education. It has been less used in the transport
sector (The World Bank 2005a). Cost-effectiveness analysis can be used to evaluate multiple objectives
or outcomes using a form of MCA known as a weighted CEA (The World Bank 2005b, p6).
• Often expressed in terms of a cost-effectiveness ratio which is obtained by dividing the effectiveness
of a measure by its costs but where effectiveness is not necessarily expressed in monetary terms
(Griffith et al 2012, p16). This then becomes a value for money measure that can also be used as part
of an index to compare the degree to which alternative projects achieve a defined outcome relative to
their costs.
• Not appropriate when considering projects that are intended to deliver different objectives or
outcomes because there is no common basis for comparison. Cost-effectiveness analysis does not
provide any information on the ‘worthiness’ of different objectives (weighted CEA, which is a form of
MCA, can be used to differentiate between objectives).
Economic appraisal of public transport service enhancements
18
2.2.3 Social cost-benefit analysis
SCBA measures in monetary terms the value of all benefits and costs of alternative projects in social
economic terms and:
• goes further than CEA by allowing comparison of projects with different objectives or outcomes, eg
comparing increased frequency against increased coverage of public transport services (provided the costs
and benefits can be expressed in monetary terms)
• provides a relative measure of total economic welfare of alternative projects and does not consider
distributional impacts on different groups (although it can be formulated to identify benefits to
specific grounds and weightings subsequently applied)
• requires benefits and costs to be valued based on market prices. When there is no market to test
consumers’ willingness-to-pay, values need to be estimated, usually on a willingness-to-pay basis.
Benefits that cannot be monetised need to be evaluated and reported separately.
• generally focuses on direct impacts (on users, non-users and externalities).
2.2.4 Economic impact assessment
Economic impact assessment traces the direct and indirect impacts of a project throughout the economy and:
• provides useful information on the distributive impact of projects at the local, regional or national level
by tracing impacts through the economy. Choosing the correct level of analysis is important because any
benefits/costs outside the scope will not be considered in the analysis
• starts by assessing the direct impact on employment and expenditure of a project, with the
investment and money spent by workers then being traced through the economic system, generating
further jobs. Initial impacts therefore have multiplier effects, eg an initial dollar spend may generate
$1.30 of final economic activity in the study area
• when narrowly focused, typically excludes impacts on the natural environment unless
- mitigation or prevention costs are included in the project costs, or
- the project has damaging environmental impacts that reduce economic output (eg reduced crop
yield from road dust).
In such cases, it is usual for a separate environmental impact assessment to be undertaken.
• places reliance on monetary multiplier effects (generally market prices), which are most commonly
analysed by way of input–output tables or alternative methods such as computable general
equilibrium models. An input–output table shows the fraction of expenditure by one industry going to
all others in the local area, region or country
• does not consider alternative uses of resources and has a number of forecasting difficulties that make it
impractical for all but the very large-scale transport projects and wide-ranging policies (such as carbon fuel
taxes). It is also significantly more costly to conduct in time and resources than a SCBA, unless relevant
multiplier tables are already available in which case this form of analysis could be very cost effective.
2.2.5 Multi-criteria analysis
Multi-criteria analysis (MCA) compares options against a range of criteria, with results often presented in
terms of a score. Criteria may have different weightings and be rated subjectively or quantitatively, with
cost-effectiveness or SCBA often used as some criteria.
2 Review of approaches to project appraisal
19
MCA:
• is used when there are different impacts (often qualitative) that are not easy to express on a common
basis (eg dollars)
• covers a wide variety of techniques that compare options against one or more objective criteria. At
one level, MCA is similar to CEA in that a data framework is provided for impacts to be quantified
either subjectively (eg points based) or objectively (using appropriate physical or monetary measures)
• enables projects to be assessed against more than one objective. The main departure from other
approaches is that money need not be used to cost inputs, outputs or impacts. MCA can instead use
any set of weights, however derived, to develop a scoring system to rank project alternatives.
• is particularly useful at project selection in that it can offer a quick and cost effective way of short-
listing projects and comparing them against strategic objectives in a structured way.
The main concern about MCA is the development and application of weighting systems. MCA can be
criticised in the over-reliance on largely subjective weighting systems made by the analyst or imposed
implicitly (eg equal weightings) or explicitly by the decision-maker. MCA also risks double (or more)
counting of impacts.
2.3 Assessment of appraisal approaches
The project appraisal approaches identified above have been assessed to determine those most suited for
use in the economic appraisal of public transport proposals in New Zealand. But first we need to
acknowledge the distinction (or lack thereof) between project appraisal and economic appraisal. In much
of the literature these terms are used interchangeably, for example the NSW government guidelines for
economic appraisal state that:
[t]he purpose of an economic appraisal is not to validate a specific proposal, but to help
choose the best means to satisfy a specified objective, and to rank competing proposals when
resources are limited. (NSW Treasury 2007)
This definition, however, can equally apply to project appraisal. Project appraisal essentially refers to a
systematic process of analysing and comparing options in order for present sufficient information for
decision-makers to make informed decisions. Economic appraisal is essentially a subset of project
appraisal and is primarily concerned with weighting up economic costs and benefits to society, which are
usually expressed in monetary or equivalent terms.
This assessment of appraisal approaches could be applied to any transport proposal or project, but in this
instance has been undertaken particularly in the context of public transport proposals.
2.3.1 Multi-criteria assessment criteria
We have used MCA to compare the suitability of the above project appraisal approaches for use in
economic appraisal of public transport proposals in New Zealand. This approach is most useful when
comparing options against a number of different criteria. We note that while the subjective nature of MCA
weighting systems is a key criticism, the approach does provide a useful framework for our purposes.
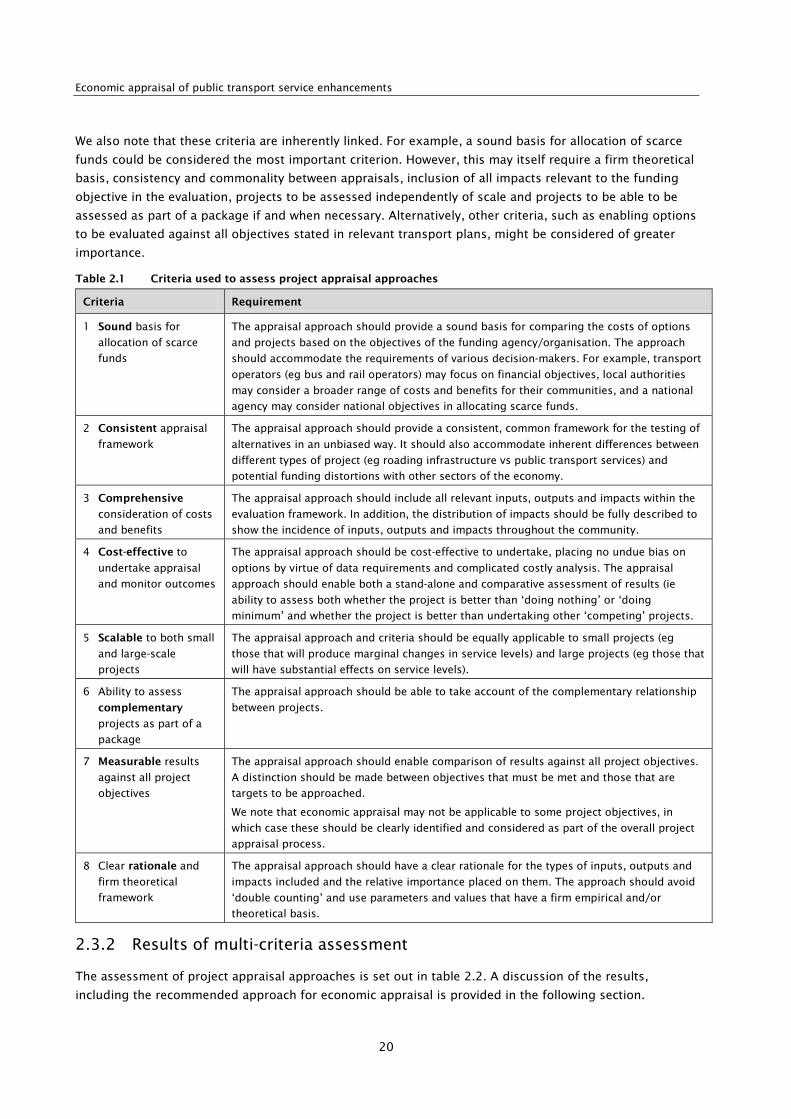
We have identified eight criteria for the MCA, as set out in table 2.1. We have made no attempt to derive a
weighting system for our criteria, reflecting a view that the criteria are equally important and that
decision-makers will have a range of views as to the relative importance of these criteria.
Economic appraisal of public transport service enhancements
20
We also note that these criteria are inherently linked. For example, a sound basis for allocation of scarce
funds could be considered the most important criterion. However, this may itself require a firm theoretical
basis, consistency and commonality between appraisals, inclusion of all impacts relevant to the funding
objective in the evaluation, projects to be assessed independently of scale and projects to be able to be
assessed as part of a package if and when necessary. Alternatively, other criteria, such as enabling options
to be evaluated against all objectives stated in relevant transport plans, might be considered of greater
importance.
Table 2.1 Criteria used to assess project appraisal approaches
Criteria Requirement
1 Sound basis for
allocation of scarce
funds
The appraisal approach should provide a sound basis for comparing the costs of options
and projects based on the objectives of the funding agency/organisation. The approach
should accommodate the requirements of various decision-makers. For example, transport
operators (eg bus and rail operators) may focus on financial objectives, local authorities
may consider a broader range of costs and benefits for their communities, and a national
agency may consider national objectives in allocating scarce funds.
2 Consistent appraisal
framework
The appraisal approach should provide a consistent, common framework for the testing of
alternatives in an unbiased way. It should also accommodate inherent differences between
different types of project (eg roading infrastructure vs public transport services) and
potential funding distortions with other sectors of the economy.
3 Comprehensive
consideration of costs
and benefits
The appraisal approach should include all relevant inputs, outputs and impacts within the
evaluation framework. In addition, the distribution of impacts should be fully described to
show the incidence of inputs, outputs and impacts throughout the community.
4 Cost-effective to
undertake appraisal
and monitor outcomes
The appraisal approach should be cost-effective to undertake, placing no undue bias on
options by virtue of data requirements and complicated costly analysis. The appraisal
approach should enable both a stand-alone and comparative assessment of results (ie
ability to assess both whether the project is better than ‘doing nothing’ or ‘doing
minimum’ and whether the project is better than undertaking other ‘competing’ projects.
5 Scalable to both small
and large-scale
projects
The appraisal approach and criteria should be equally applicable to small projects (eg
those that will produce marginal changes in service levels) and large projects (eg those that
will have substantial effects on service levels).
6 Ability to assess
complementary
projects as part of a
package
The appraisal approach should be able to take account of the complementary relationship
between projects.
7 Measurable results
against all project
objectives
The appraisal approach should enable comparison of results against all project objectives.
A distinction should be made between objectives that must be met and those that are
targets to be approached.
We note that economic appraisal may not be applicable to some project objectives, in
which case these should be clearly identified and considered as part of the overall project
appraisal process.
8 Clear rationale and
firm theoretical
framework
The appraisal approach should have a clear rationale for the types of inputs, outputs and
impacts included and the relative importance placed on them. The approach should avoid
‘double counting’ and use parameters and values that have a firm empirical and/or
theoretical basis.
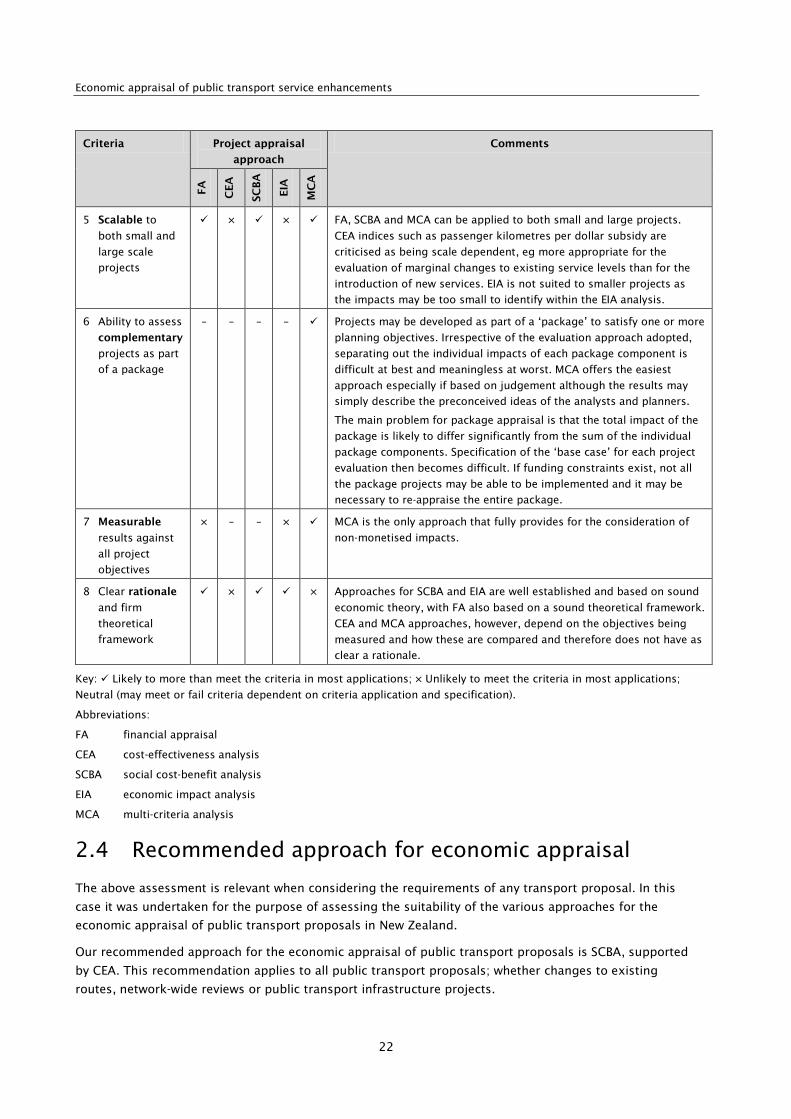
2.3.2 Results of multi-criteria assessment
The assessment of project appraisal approaches is set out in table 2.2. A discussion of the results,
including the recommended approach for economic appraisal is provided in the following section.

2 Review of approaches to project appraisal
21
Table 2.2 Summary of MCA assessment of project appraisal approaches
Criteria Project appraisal
approach
Comments
FA
CEA
SC
BA
EIA
MC
A
1 Sound basis for
allocation of
scarce funds
× × × CEA and SCBA both provide a sound basis for ranking different projects
to allocate funds.
SCBA analysis is considered superior as it can rank projects with quite
different outcomes, for example a roading project against a public
transport service enhancement using a measure such as benefit–cost
ratio. This relies all relevant benefits and costs being identified and
accurate monetary values assigned.
CEA is in effect a restricted SCBA, usually because of its inability to
place reliable values on impacts. CEA indices such as passenger
kilometres per dollar subsidy can be used to allocate funding, but are
best suited for projects with similar objectives.
MCA weightings are not always transferrable between different projects
and therefore can be difficult when comparing different types of
projects competing for funding.
2 Consistent
appraisal
framework
× – – – SCBA is the only approach providing a consistent common appraisal
framework for testing alternative transport projects in an unbiased
way. CEA is not transferable between different types of project, and FA
is narrowly focused on financial consideration and therefore cannot
provide a consistent common approach for all types of project.
3 Comprehensive
consideration of
costs and
benefits
× × SCBA, EIA and MCA are all suitable for showing the inputs, outputs and
impacts through the community. Although all struggle with
environmental and other impacts that are difficult to monetise, EIA is
also restricted by the significant amount of data required.
SCBA and MCA both perform strongly here, with the weighting system the
main area of difference. SCBA’s weighting system is based on monetary
values, with impacts that cannot be valued excluded. The appraisal
procedure may impose values which have been previously researched (eg the
value of life, time savings) or it may require values to be locally estimated.
MCA can use any weighting system but in almost all instances there is some
form of value judgement (even when no weightings are applied).
SCBA is considered to be better at assessing the allocative impacts of a
scheme rather than the distributional impacts. Equity values are
sometimes introduced in SCBA to replace behavioural values. Where
the incidence of impacts is important, the evaluation should adopt a
disaggregated framework. The disaggregated framework should show
the incidence and distribution of impacts and effects including those
not valued in monetary terms on the full range of community groups,
public and private transport operators and users.
4 Cost-effective
to undertake
appraisal and
monitor
outcomes
– – × MCA and CEA are the easiest and most cost-effective appraisal
approaches to implement. SCBA requires further analysis and
consideration of benefits but the information requirements are not as
onerous as for EIA. EIAs are rarely undertaken in transport appraisals
other than for large roading evaluations and airport or ferry terminal
assessments because of their complexity. Input–output models are
required when data is either out of date or unavailable. Even if suitable
input–output models exist, the impacts of transport projects are often
too small to be estimated with any accuracy.
Economic appraisal of public transport service enhancements
22
Criteria Project appraisal
approach
Comments
FA
CEA
SC
BA
EIA
MC
A
5 Scalable to
both small and
large scale
projects
× × FA, SCBA and MCA can be applied to both small and large projects.
CEA indices such as passenger kilometres per dollar subsidy are
criticised as being scale dependent, eg more appropriate for the
evaluation of marginal changes to existing service levels than for the
introduction of new services. EIA is not suited to smaller projects as
the impacts may be too small to identify within the EIA analysis.
6 Ability to assess
complementary
projects as part
of a package
– – – – Projects may be developed as part of a ‘package’ to satisfy one or more
planning objectives. Irrespective of the evaluation approach adopted,
separating out the individual impacts of each package component is
difficult at best and meaningless at worst. MCA offers the easiest
approach especially if based on judgement although the results may
simply describe the preconceived ideas of the analysts and planners.
The main problem for package appraisal is that the total impact of the
package is likely to differ significantly from the sum of the individual
package components. Specification of the ‘base case’ for each project
evaluation then becomes difficult. If funding constraints exist, not all
the package projects may be able to be implemented and it may be
necessary to re-appraise the entire package.
7 Measurable
results against
all project
objectives
× – – × MCA is the only approach that fully provides for the consideration of
non-monetised impacts.
8 Clear rationale
and firm
theoretical
framework
× × Approaches for SCBA and EIA are well established and based on sound
economic theory, with FA also based on a sound theoretical framework.
CEA and MCA approaches, however, depend on the objectives being
measured and how these are compared and therefore does not have as
clear a rationale.
Key: Likely to more than meet the criteria in most applications; × Unlikely to meet the criteria in most applications;
Neutral (may meet or fail criteria dependent on criteria application and specification).
Abbreviations:
FA financial appraisal
CEA cost-effectiveness analysis
SCBA social cost-benefit analysis
EIA economic impact analysis
MCA multi-criteria analysis
2.4 Recommended approach for economic appraisal
The above assessment is relevant when considering the requirements of any transport proposal. In this
case it was undertaken for the purpose of assessing the suitability of the various approaches for the
economic appraisal of public transport proposals in New Zealand.
Our recommended approach for the economic appraisal of public transport proposals is SCBA, supported
by CEA. This recommendation applies to all public transport proposals; whether changes to existing
routes, network-wide reviews or public transport infrastructure projects.
2 Review of approaches to project appraisal
23
SCBA provides a value in money terms of all project benefits and costs, to whomever they may accrue, and
also meets the requirements of most of the above assessment criteria. SCBA is considered the most
suitable approach for economic appraisal generally; it uses a consistent approach that is applicable to all
alternatives in an unbiased way, is equally applicable to both small and large projects and provides for the
widest assessment of economic impacts.
CEA meets only a few of the criteria but is considered the most appropriate appraisal approach for
projects where a full SCBA cannot be justified. CEA identifies the effectiveness of achieving particular
objectives relative to costs involved. CEA benefits are not necessarily expressed in monetary terms but can
be expressed in terms of a particular objective or outcome (eg cost per passenger). CEA is considered to
be of particular relevance in the application of ‘simplified procedures’ for economic appraisal and is
considered especially suited to minor public transport proposals, where there are few externalities and
where changes can be compared against existing operations. CEA is also suited to comparing efficiency
outcomes such as farebox recovery.
FA and EIA are not recommended. EIA is not recommended because it is not suitable for smaller projects
where impacts through the wider economy may be hard to identify and can be costly to develop and
implement. FA is not comprehensive enough to be considered, but will usually be required at some point to
establish the need for and amount of funding. FA often forms part of a wider appraisal, and is often included
as a subset to SCBA where the financial components of analysis can be separately identified and reported.
Economic appraisal is only one part of a wider project appraisal and decision-making process. It is
therefore important that the process and requirements (including data requirements) are consistent with
the wider decision-making processes in the relevant country. We note that our preferred approach for
project appraisal would more generally be a MCA framework supported by SCBA, with SCBA providing the
economic appraisal. This would allow all project impacts, including those for which monetary values could
not be identified, to be compared alongside each other. This approach would be similar to that used in the
UK where the transport appraisal guidelines, WebTAG, require the preparation of an ‘appraisal summary
table’. The Transport Agency’s project appraisal and decision-making procedures summarised in section
1.2 also include a combined MCA/SCBA approach to project appraisal, as does the NGTSM in Australia.
The TBBC provides an alternative approach, where ‘business cases’ are prepared for different components
of the project (ie the five case model).

Economic appraisal of public transport service enhancements
24
3 Review of economic appraisal procedures
3.1 Introduction
This chapter provides an overview of SCBA and CEA procedures currently used in Australia, the UK, USA
and New Zealand for the economic appraisal of public transport proposals. The following six procedures
were reviewed:
• New Zealand – NZ Transport Agency (2010a; 2010b) Economic evaluation manual (EEM)
• Australia – Australian Transport Council (ATC) (2006e) National guidelines for transport system
management in Australia (NGTSM)
• Australia – Transport for New South Wales (Australia) (2012) Principles and guidelines for economic
appraisal of transport investment and initiatives – draft (TfNSW)
• United Kingdom – Department for Transport (2011b) Transport analysis guidance – WebTAG (WebTAG)
• United Kingdom – Transport for London (2008) Business case development manual (TfL)
• United States – Federal Transit Administration (2013) Proposed new starts and small starts policy
guidance (USA new starts).
These procedures were selected to reflect current practice and to cover national guidelines from leading
countries in the field of transport economic appraisal. These procedures also include a selection of sub-
national guidelines relevant to the appraisal of public transport proposals.
We note there are a number of other national and sub-national guidelines that have not been reviewed.
Many of these other guidelines are largely comparable to the procedures summarised here, eg guidelines
from countries such as Ireland (Department of Transport 2009) or states such as Victoria in Australia (DoT
2010). Some guidelines were not included in the review due to their age, such as Canada’s guide to cost-
benefit analysis published in 1994 (Transport Canada 1994).
The review focused on key methodological considerations, public transport user benefit parameters and
consideration of ‘simplified procedures’. It considered all benefit parameters included in the procedures
reviewed (refer appendix C) but the primary emphasis was on public transport user benefits.
3.2 Key methodological considerations
A summary of the decision-making criteria included within the six approaches reviewed is provided in
table 3.1. The procedures across Australia, New Zealand and the UK are all based on SCBA and are
generally comparable, but emphasising different areas6. The US procedures focus on CEA within a MCA
framework, but are not as advanced as the other procedures reviewed in terms of economic appraisal7.
6 All the procedures reviewed also had a multi-criteria analysis element embedded in the decision-making processes,
whether this was implicit or explicit (eg by way of an appraisal summary table). 7 The study team had some difficulty in identifying any relevant federal level guidelines. We note that the Transport
Cooperative Research Program in the USA includes a large number of published reports on advanced economic
appraisal methodologies, but the extent to which any of these documents form part of official procedures was not
clear. They were therefore not included in this review. The complexity of the system in the USA and scope of this
project limited further investigation into this area.
3 Review of economic appraisal procedures
25
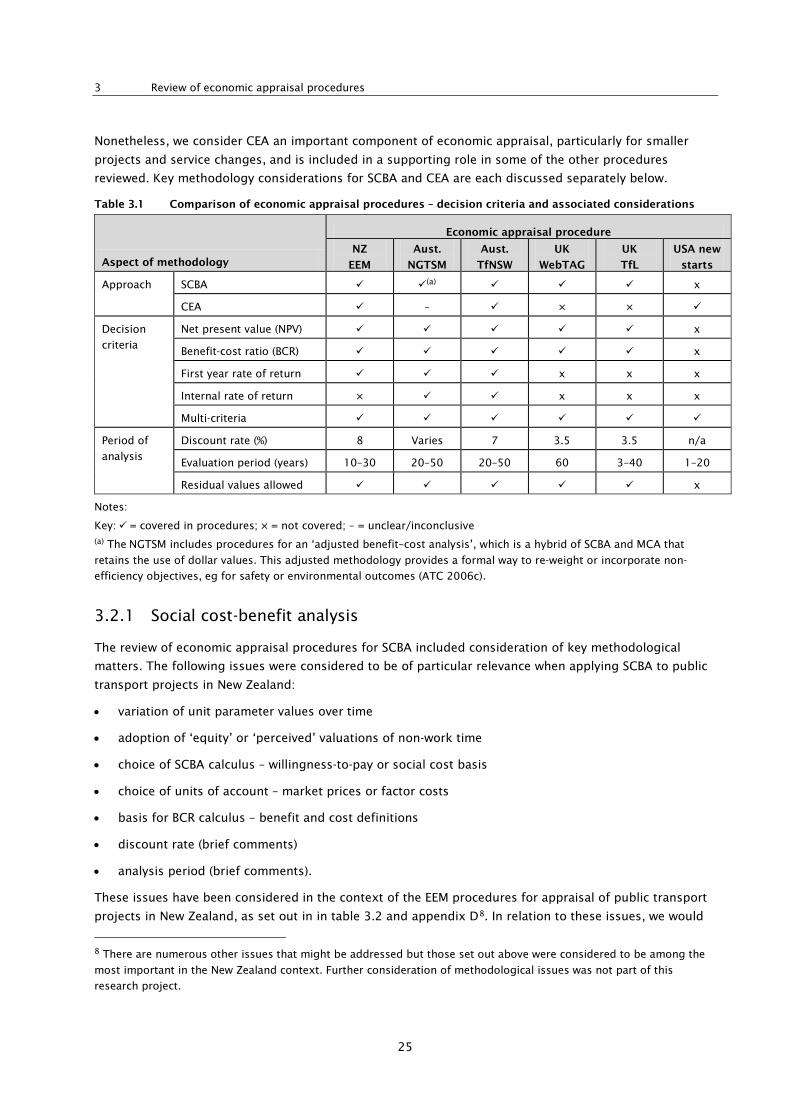
Nonetheless, we consider CEA an important component of economic appraisal, particularly for smaller
projects and service changes, and is included in a supporting role in some of the other procedures
reviewed. Key methodology considerations for SCBA and CEA are each discussed separately below.
Table 3.1 Comparison of economic appraisal procedures – decision criteria and associated considerations
Aspect of methodology
Economic appraisal procedure
NZ
EEM
Aust.
NGTSM
Aust.
TfNSW
UK
WebTAG
UK
TfL
USA new
starts
Approach SCBA (a) x
CEA – × ×
Decision
criteria
Net present value (NPV) x
Benefit-cost ratio (BCR) x
First year rate of return x x x
Internal rate of return × x x x
Multi-criteria
Period of
analysis
Discount rate (%) 8 Varies 7 3.5 3.5 n/a
Evaluation period (years) 10–30 20–50 20–50 60 3–40 1–20
Residual values allowed x
Notes:
Key: = covered in procedures; × = not covered; – = unclear/inconclusive (a) The NGTSM includes procedures for an ‘adjusted benefit–cost analysis’, which is a hybrid of SCBA and MCA that
retains the use of dollar values. This adjusted methodology provides a formal way to re-weight or incorporate non-
efficiency objectives, eg for safety or environmental outcomes (ATC 2006c).
3.2.1 Social cost-benefit analysis
The review of economic appraisal procedures for SCBA included consideration of key methodological
matters. The following issues were considered to be of particular relevance when applying SCBA to public
transport projects in New Zealand:
• variation of unit parameter values over time
• adoption of ‘equity’ or ‘perceived’ valuations of non-work time
• choice of SCBA calculus – willingness-to-pay or social cost basis
• choice of units of account – market prices or factor costs
• basis for BCR calculus – benefit and cost definitions
• discount rate (brief comments)
• analysis period (brief comments).
These issues have been considered in the context of the EEM procedures for appraisal of public transport
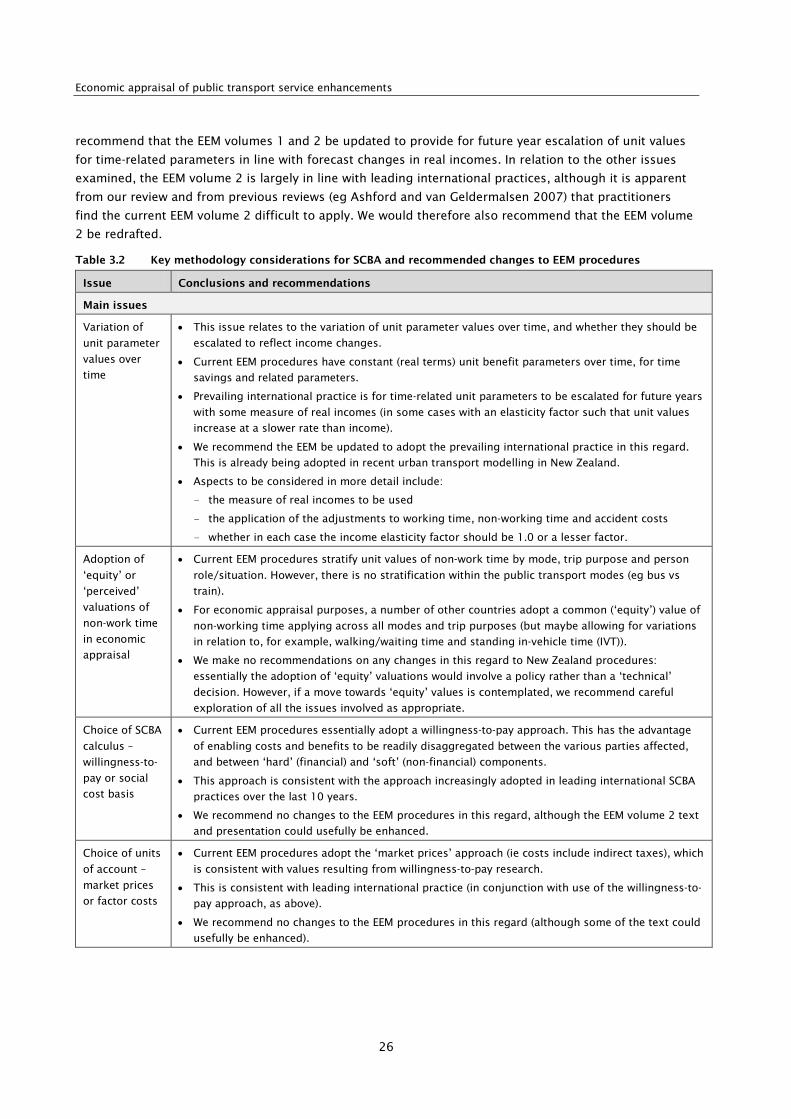
projects in New Zealand, as set out in in table 3.2 and appendix D8. In relation to these issues, we would
8 There are numerous other issues that might be addressed but those set out above were considered to be among the
most important in the New Zealand context. Further consideration of methodological issues was not part of this
research project.
Economic appraisal of public transport service enhancements
26
recommend that the EEM volumes 1 and 2 be updated to provide for future year escalation of unit values
for time-related parameters in line with forecast changes in real incomes. In relation to the other issues
examined, the EEM volume 2 is largely in line with leading international practices, although it is apparent
from our review and from previous reviews (eg Ashford and van Geldermalsen 2007) that practitioners
find the current EEM volume 2 difficult to apply. We would therefore also recommend that the EEM volume
2 be redrafted.
Table 3.2 Key methodology considerations for SCBA and recommended changes to EEM procedures
Issue Conclusions and recommendations
Main issues
Variation of
unit parameter
values over
time
• This issue relates to the variation of unit parameter values over time, and whether they should be
escalated to reflect income changes.
• Current EEM procedures have constant (real terms) unit benefit parameters over time, for time
savings and related parameters.
• Prevailing international practice is for time-related unit parameters to be escalated for future years
with some measure of real incomes (in some cases with an elasticity factor such that unit values
increase at a slower rate than income).
• We recommend the EEM be updated to adopt the prevailing international practice in this regard.
This is already being adopted in recent urban transport modelling in New Zealand.
• Aspects to be considered in more detail include:
- the measure of real incomes to be used
- the application of the adjustments to working time, non-working time and accident costs
- whether in each case the income elasticity factor should be 1.0 or a lesser factor.
Adoption of
‘equity’ or
‘perceived’
valuations of
non-work time
in economic
appraisal
• Current EEM procedures stratify unit values of non-work time by mode, trip purpose and person
role/situation. However, there is no stratification within the public transport modes (eg bus vs
train).
• For economic appraisal purposes, a number of other countries adopt a common (‘equity’) value of
non-working time applying across all modes and trip purposes (but maybe allowing for variations
in relation to, for example, walking/waiting time and standing in-vehicle time (IVT)).
• We make no recommendations on any changes in this regard to New Zealand procedures:
essentially the adoption of ‘equity’ valuations would involve a policy rather than a ‘technical’
decision. However, if a move towards ‘equity’ values is contemplated, we recommend careful
exploration of all the issues involved as appropriate.
Choice of SCBA
calculus –
willingness-to-
pay or social
cost basis
• Current EEM procedures essentially adopt a willingness-to-pay approach. This has the advantage
of enabling costs and benefits to be readily disaggregated between the various parties affected,
and between ‘hard’ (financial) and ‘soft’ (non-financial) components.
• This approach is consistent with the approach increasingly adopted in leading international SCBA
practices over the last 10 years.
• We recommend no changes to the EEM procedures in this regard, although the EEM volume 2 text
and presentation could usefully be enhanced.
Choice of units
of account –
market prices
or factor costs
• Current EEM procedures adopt the ‘market prices’ approach (ie costs include indirect taxes), which
is consistent with values resulting from willingness-to-pay research.
• This is consistent with leading international practice (in conjunction with use of the willingness-to-
pay approach, as above).
• We recommend no changes to the EEM procedures in this regard (although some of the text could
usefully be enhanced).

3 Review of economic appraisal procedures
27
Issue Conclusions and recommendations
Main issues
Basis for BCR
calculus –
benefit and
cost definitions
• The focus has been on appraisal methods from a national perspective, as per usual practice for
SCBA, but comment is made here on methods from a government perspective also, reflecting both
financial and economic factors.
• Current EEM procedures appear technically sound in relation to three sub-issues examined:
- items to be categorised as ‘costs’ in the BCR denominator
- the merits in expressing BCR performance from a national economic perspective (BCRN) or from
a public funding perspective (BCRG)
- the treatment of fare revenues as a component of benefits.
• In updating of EEM volume 2, we recommend attention be given to:
- the need for BCRN appraisals for public transport proposals
- clarification of the text in a number of respects, including the treatment of fare revenues in
benefit assessment.
Other issues (brief consideration)
Discount rate • Current EEM procedures specify a discount rate of 8% pa (real terms) over the project appraisal
period. This rate was reduced from the previous value of 10% in 2008, following a review by the
NZ Treasury.
• The current New Zealand rate is towards the high end of discount rates used in economic
appraisals of transport projects internationally. The current UK rate is 3.5%.
• Parker (2009) undertook a review of the discount rate for the Transport Agency, as part of a
research project. He concluded that: ‘…using a social time preference rate is most appropriate.
This might range from 3%–5% real rather than the current 8% real, with 4% being appropriate’.
(Parker 2009)
• Given that the discount rate issue is not specific to public transport proposals, and given Parker’s
relatively recent in-depth review, we have not undertaken further work on this aspect.
Analysis period • This may be considered in parallel with, and related to, the discount rate aspect above. As noted
by Parker (2009): ‘Given that the analysis period is based upon the discount rate, lowering the
discount rate should increase the analysis period.’
• The maximum analysis period advised in the EEM procedures is 30 years (having been increased
from 25 years in 2008, when the discount rate was reduced). This period is towards the low end of
the range found in both UK and Australia.
• For public transport proposals, the EEM does not appear to be specific on the period to be
adopted. For public transport services, the Transport Agency advises that the normal period to be
adopted is 12–15 years (depending on contract length); but for public transport schemes involving
substantial capital investment, we assume a 30-year period would normally be adopted.
3.2.2 Cost-effectiveness analysis
CEA is in effect a restricted SCBA, restricted in terms of its ability to place reliable values on many impacts,
but is generally easier and cheaper to apply than a full SCBA. CEA is most useful when appraising changes
to existing public transport services, where changes can be compared against existing operations and any
externalities are generally minimal.
The US Federal Transit Administration (2013) ‘new starts and small starts’ guidelines were the only CEA
procedures reviewed and are discussed further in section 3.4.3. A number of other procedures identified
CEA as having a supporting role (eg NZ Transport Agency 2010b; Transport for NSW 2012), the Transport
Agency also uses CEA internally when reviewing funding levels for existing systems as part of the National
Land Transport Programme (refer section 1.2.2).
Economic appraisal of public transport service enhancements
28
We expect that most public transport authorities and major operators use CEA in some form, but this
informal use has not been reviewed by this study as such use is generally not well documented.
3.2.3 Comment on financial appraisal
Financial appraisal (FA) will usually be required at some point to establish the need for and amount of
funding. FA often forms part of a wider appraisal, and is often included as a subset to SCBA or CEA where
the financial components of analysis can be separately identified and reported. FA is also an important
component of the new public transport operating model (known as PTOM) in New Zealand, for example in
the application of new ‘commerciality ratios’ and benchmarking, and will be an important consideration in
any changes to public transport services.
3.3 Public transport user benefit parameters
The review of economic appraisal procedures internationally included consideration of the public transport
user benefit parameters that the procedures covered. These are shown in table 3.3 for New Zealand (EEM)
together with five sets of procedures used in other countries. A wider comparison of benefit parameters,
including externalities, is provided in appendix C. Our conclusions and recommendations on parameters
for inclusion in economic appraisal procedures in New Zealand are discussed in chapter 5.
Most of the procedures reviewed included comprehensive coverage of public transport user benefit
parameters within a SCBA framework, with the USA being a notable exception (based on CEA). Monetary
values are available for most of these parameters, although interestingly WebTAG does not monetise travel
time reliability. In regards to access time, the EEM is unclear as to treatment of walk access, and in all the
procedures car and bus access modes have (at best) only passing mention. Public transport mode-specific
factors appear to be available only in the Australian NGTSM. Transport for London identified pre-
journey/ticketing as a separate parameter, although this appears to risk double counting as it is generally
included as part of other quality factors (we therefore do not recommend further investigation of separate
values for this parameter). Infrastructure and vehicle quality are covered by all the procedures, although it
is unclear whether WebTAG provides any parameters for bus infrastructure/vehicles.
Economic appraisal procedures should include consideration of all relevant benefits (and costs). A
summary of all benefits included in the various procedures reviewed is provided in appendix C. Road
traffic system (decongestion) benefits are covered by most of the procedures. Of interest, Transport for
London does not appear to require consideration of these benefits, except for accident cost savings.
Parking cost savings are included in the EEM and WebTAG but not the other procedures. In regards to
environmental factors, travel demand management (TDM) factors9, wider economic benefits and national
strategic factors there is a range of treatments with some benefits monetised and others not. We note that
any parameters that have not been monetised would need to be reported alongside any SCBA, for
example, as part of the ‘appraisal summary table’ required by the WebTAG guidelines.
9 TDM is defined in chapter 2.1 of the EEM volume 2 as follows: ‘Transport demand management (TDM), includes
various strategies that encourage more efficient and sustainable travel and transport behaviour. TDM has the objective
of encouraging motor vehicle users to use alternative, more sustainable, means of transport when appropriate, while
also reducing total vehicle kilometres travelled. TDM is an increasingly common response to urban traffic congestion
and pollution issues, and to reduce general issues associated with vehicle dependency.’

3 Review of economic appraisal procedures
29
Table 3.3 Comparison of economic appraisal procedures – public transport user benefit parameters
Benefit parameters Economic appraisal procedure
NZ
EEM
Aust.
NGTSM
Aust.
TfNSW
UK
WebTAG
UK
TfL
US ‘new
starts’
Value of IVT IVT (standard values) (M) (M) (M) (M) (M) x
Journey time
attributes
Access time
• walk time (access/egress)
• car access
• public transport access(a)
(M)(e)
×
×
(M)
×
×
(M)
(M)
(M)
(M)
–
–
(M)
–
–
x
x
x
Headway (service interval)(b) (M) (M) (M) (M)(h) (M) x
Seat availability/crowding (M) (M) (M)(g) (M)(h) (M) x
Interchange (transfer penalty
and wait time)
(M) (M) (M) (M) (M) x
Reliability of travel time(c) (M) (M) (M) (N) (M) x
Mode-specific factors(d) × (M) × – – x
Pre-journey/ ticketing x x x x (M) x
Quality
attributes
Vehicle features (M) (M) (M) (M)(i) (M) x
Stop/station features (M)(f) (M) (M) (M)(i) (M) x
Notes:
Key: (M) = monetised parameter; (N) = non-monetised parameter; – = unclear/inconclusive; × = not covered (a) Public transport access time (eg bus/ferry access to rail) is considered a ‘transfer’ and covered under ‘interchange’ in
most procedures. (b) Headway (service interval) is often referred as the expected wait time at a stop or station. (c) Reliability of travel time includes unexpected wait time at stop or station and unexpected IVT (eg delay due to
congestion). (d) Mode-specific factors are also known as alternative specific constants. (e) EEM is unclear as to treatment of walk access (f) EEM provides parameters for bus stop and station features only (ie excludes rail). (g) TfNSW seat availability/crowding parameters provided for rail only. (h) WebTAG headway (service interval) and seat availability/crowding parameters provided for rail only. (i) WebTAG quality attributes are provided for rail, it is unclear if any apply to other modes.
3.4 Consideration of ‘simplified procedures’ for economic appraisal
The review of economic appraisal procedures included consideration as to whether there was provision for
‘simplified procedures’: the results are summarised in table 3.4. The recommended application of
simplified procedures is discussed in chapter 4. The use of EEM simplified procedures, including
conclusions, is also covered in the case study in chapter 6.
The EEM was the only procedure to include specific simplified procedures for public transport project
appraisals, although the NGTSM includes a ‘rapid appraisal’ stage and provision for simplified road user
benefit parameters. The US Federal Transit Administration (2013) ‘new starts and small starts’ procedures
might itself be regarded as a simplified procedure, although not considered suitable for New Zealand.
These three procedures are discussed in turn below.
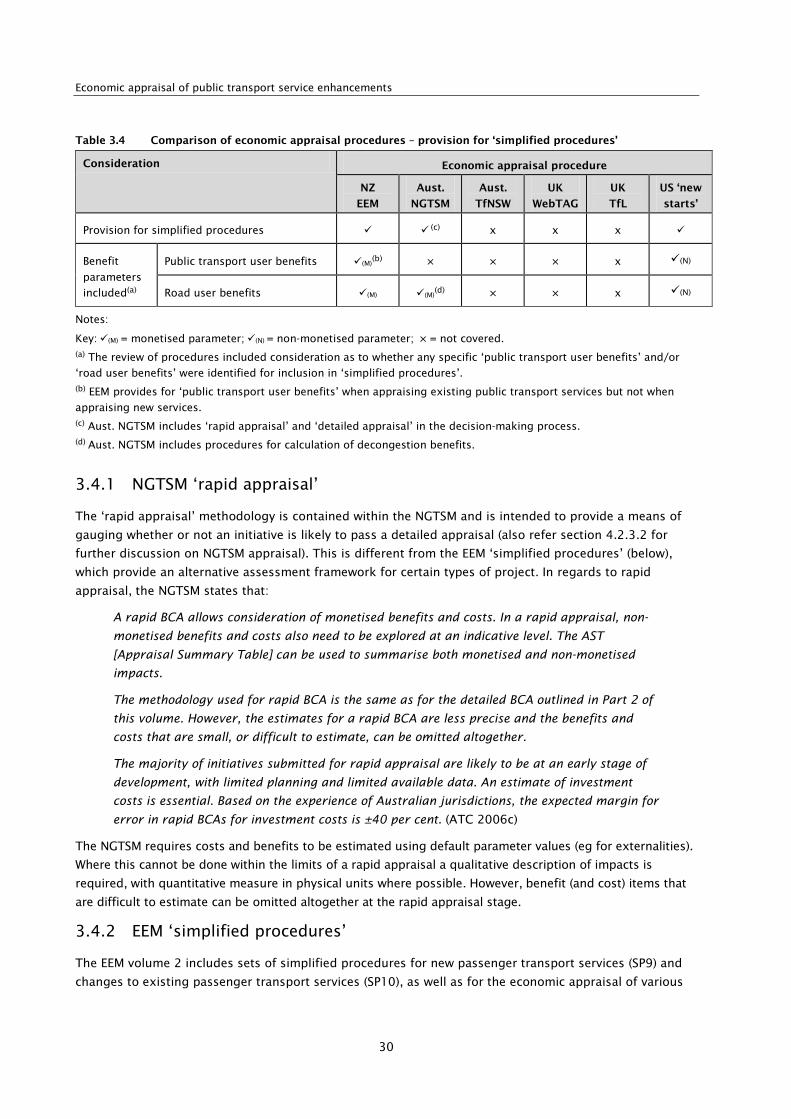
Economic appraisal of public transport service enhancements
30
Table 3.4 Comparison of economic appraisal procedures – provision for ‘simplified procedures’
Consideration Economic appraisal procedure
NZ
EEM
Aust.
NGTSM
Aust.
TfNSW
UK
WebTAG
UK
TfL
US ‘new
starts’
Provision for simplified procedures (c) x x x
Benefit
parameters
included(a)
Public transport user benefits (M)(b) × × × x (N)
Road user benefits (M) (M)(d) × × x (N)
Notes:
Key: (M) = monetised parameter; (N) = non-monetised parameter; × = not covered.
(a) The review of procedures included consideration as to whether any specific ‘public transport user benefits’ and/or
‘road user benefits’ were identified for inclusion in ‘simplified procedures’. (b) EEM provides for ‘public transport user benefits’ when appraising existing public transport services but not when
appraising new services. (c) Aust. NGTSM includes ‘rapid appraisal’ and ‘detailed appraisal’ in the decision-making process. (d) Aust. NGTSM includes procedures for calculation of decongestion benefits.
3.4.1 NGTSM ‘rapid appraisal’
The ‘rapid appraisal’ methodology is contained within the NGTSM and is intended to provide a means of
gauging whether or not an initiative is likely to pass a detailed appraisal (also refer section 4.2.3.2 for
further discussion on NGTSM appraisal). This is different from the EEM ‘simplified procedures’ (below),
which provide an alternative assessment framework for certain types of project. In regards to rapid
appraisal, the NGTSM states that:
A rapid BCA allows consideration of monetised benefits and costs. In a rapid appraisal, non-
monetised benefits and costs also need to be explored at an indicative level. The AST
[Appraisal Summary Table] can be used to summarise both monetised and non-monetised
impacts.
The methodology used for rapid BCA is the same as for the detailed BCA outlined in Part 2 of
this volume. However, the estimates for a rapid BCA are less precise and the benefits and
costs that are small, or difficult to estimate, can be omitted altogether.
The majority of initiatives submitted for rapid appraisal are likely to be at an early stage of
development, with limited planning and limited available data. An estimate of investment
costs is essential. Based on the experience of Australian jurisdictions, the expected margin for
error in rapid BCAs for investment costs is ±40 per cent. (ATC 2006c)
The NGTSM requires costs and benefits to be estimated using default parameter values (eg for externalities).
Where this cannot be done within the limits of a rapid appraisal a qualitative description of impacts is
required, with quantitative measure in physical units where possible. However, benefit (and cost) items that
are difficult to estimate can be omitted altogether at the rapid appraisal stage.
3.4.2 EEM ‘simplified procedures’
The EEM volume 2 includes sets of simplified procedures for new passenger transport services (SP9) and
changes to existing passenger transport services (SP10), as well as for the economic appraisal of various
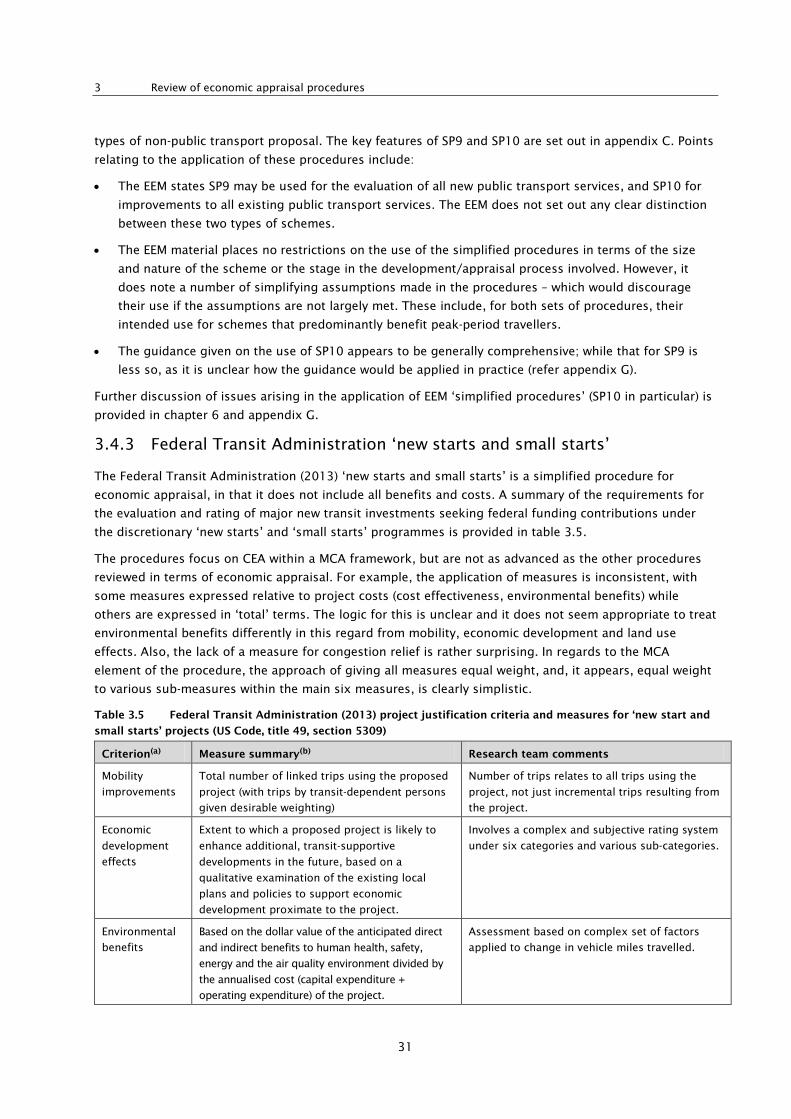
3 Review of economic appraisal procedures
31
types of non-public transport proposal. The key features of SP9 and SP10 are set out in appendix C. Points
relating to the application of these procedures include:
• The EEM states SP9 may be used for the evaluation of all new public transport services, and SP10 for
improvements to all existing public transport services. The EEM does not set out any clear distinction
between these two types of schemes.
• The EEM material places no restrictions on the use of the simplified procedures in terms of the size
and nature of the scheme or the stage in the development/appraisal process involved. However, it
does note a number of simplifying assumptions made in the procedures – which would discourage
their use if the assumptions are not largely met. These include, for both sets of procedures, their
intended use for schemes that predominantly benefit peak-period travellers.
• The guidance given on the use of SP10 appears to be generally comprehensive; while that for SP9 is
less so, as it is unclear how the guidance would be applied in practice (refer appendix G).
Further discussion of issues arising in the application of EEM ‘simplified procedures’ (SP10 in particular) is
provided in chapter 6 and appendix G.
3.4.3 Federal Transit Administration ‘new starts and small starts’
The Federal Transit Administration (2013) ‘new starts and small starts’ is a simplified procedure for
economic appraisal, in that it does not include all benefits and costs. A summary of the requirements for
the evaluation and rating of major new transit investments seeking federal funding contributions under
the discretionary ‘new starts’ and ‘small starts’ programmes is provided in table 3.5.
The procedures focus on CEA within a MCA framework, but are not as advanced as the other procedures
reviewed in terms of economic appraisal. For example, the application of measures is inconsistent, with
some measures expressed relative to project costs (cost effectiveness, environmental benefits) while
others are expressed in ‘total’ terms. The logic for this is unclear and it does not seem appropriate to treat
environmental benefits differently in this regard from mobility, economic development and land use
effects. Also, the lack of a measure for congestion relief is rather surprising. In regards to the MCA
element of the procedure, the approach of giving all measures equal weight, and, it appears, equal weight
to various sub-measures within the main six measures, is clearly simplistic.
Table 3.5 Federal Transit Administration (2013) project justification criteria and measures for ‘new start and
small starts’ projects (US Code, title 49, section 5309)
Criterion(a) Measure summary(b) Research team comments
Mobility
improvements
Total number of linked trips using the proposed
project (with trips by transit-dependent persons
given desirable weighting)
Number of trips relates to all trips using the
project, not just incremental trips resulting from
the project.
Economic
development
effects
Extent to which a proposed project is likely to
enhance additional, transit-supportive
developments in the future, based on a
qualitative examination of the existing local
plans and policies to support economic
development proximate to the project.
Involves a complex and subjective rating system
under six categories and various sub-categories.
Environmental
benefits
Based on the dollar value of the anticipated direct
and indirect benefits to human health, safety,
energy and the air quality environment divided by
the annualised cost (capital expenditure +
operating expenditure) of the project.
Assessment based on complex set of factors
applied to change in vehicle miles travelled.
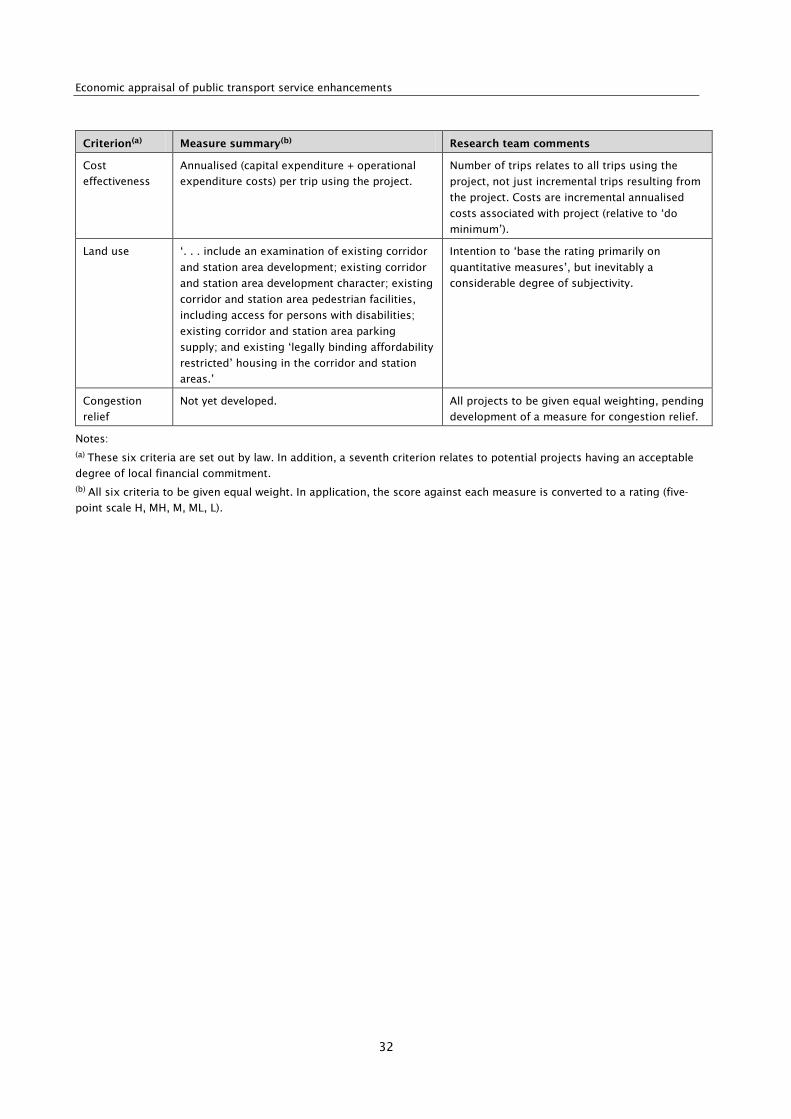
Economic appraisal of public transport service enhancements
32
Criterion(a) Measure summary(b) Research team comments
Cost
effectiveness
Annualised (capital expenditure + operational
expenditure costs) per trip using the project.
Number of trips relates to all trips using the
project, not just incremental trips resulting from
the project. Costs are incremental annualised
costs associated with project (relative to ‘do
minimum’).
Land use ‘. . . include an examination of existing corridor
and station area development; existing corridor
and station area development character; existing
corridor and station area pedestrian facilities,
including access for persons with disabilities;
existing corridor and station area parking
supply; and existing ‘legally binding affordability
restricted’ housing in the corridor and station
areas.’
Intention to ‘base the rating primarily on
quantitative measures’, but inevitably a
considerable degree of subjectivity.
Congestion
relief
Not yet developed. All projects to be given equal weighting, pending
development of a measure for congestion relief.
Notes: (a) These six criteria are set out by law. In addition, a seventh criterion relates to potential projects having an acceptable
degree of local financial commitment. (b) All six criteria to be given equal weight. In application, the score against each measure is converted to a rating (five-
point scale H, MH, M, ML, L).
4 Considerations for application of economic appraisal procedures in New Zealand
33
4 Considerations for application of economic appraisal procedures in New Zealand
4.1 Introduction
This chapter considers the application of economic appraisal procedures to public transport proposals in
New Zealand, focusing on methodology and the appropriate level of analysis for the problem under
consideration, eg simplified procedures for smaller projects such as those involving simpler public
transport service changes. Potential improvements to the application of economic appraisal procedures
and practices in New Zealand are identified.
The economic appraisal of public transport proposals (and other projects) must be considered within a
wider decision-making framework. This research project assessed economic appraisal approaches and
procedures for application to public transport proposals and the circumstances in which theses might be
applied.
We have therefore focused on one application consideration, albeit an important one, which is the
determination of an appropriate level of analysis for public transport proposals in New Zealand.10. This
chapter discussed the appropriate level of analysis, before recommending three levels of analysis for
economic appraisal and the basis for selection.
4.2 Consideration of appropriate level of analysis
The consideration of an appropriate level of analysis is about making sure that the analysis is appropriate
to the relevant decision-making requirements. The NZ Treasury (2005) Cost benefit analysis primer states
that:
The extent or depth of the analysis should be tailored to the relative size, impacts, and risks
of the proposal. Not all proposals will require full cost benefit analysis or involve all the
detailed elements…
Determining an appropriate level of analysis is essentially about making sure the level of analysis applied
to project appraisal is commensurate with the change or problem being considered. Three factors that the
research team considered as being of particular relevance in determining the appropriate level of analysis
were:
• type of proposal
• cost and risk profile
• stage of assessment
These are discussed below. We note that the TBBC approach provides a good framework for the
consideration of many of these matters.
10 We note that this research project was not tasked with developing or recommending full procedures (ie specific
methods for completing an economic appraisal) but some guidance on selecting an appropriate appraisal method has
been provided.

Economic appraisal of public transport service enhancements
34
4.2.1 Type of proposal
The type of proposal is relevant in determining the appropriate level of analysis. This is similar to the cost
and risk consideration below, but focuses more on the different characteristics of various projects. The
consideration of the type of proposal is also different from the cost and risk of the project in that the
‘thresholds’ for acceptable costs and risks will most likely vary depending on the type of proposal.
The need to consider the type of proposal in determining the appropriate level of analysis is already
reflected in the EEM, with the inclusion of ‘simplified procedures’ for the appraisal of new public transport
services (SP9) and changes to existing public transport services (SP10) (NZ Transport Agency 2010b).
These simplified procedures reflect that the nature of changes resulting from public transport service
reviews often involve no significant infrastructure investment. In many cases service changes are focused
on incremental changes to service levels required to meet customer demand, which often involves a trade-
off of benefits between different groups of people (eg moving a service from one area to another)11. It is
difficult to justify a full economic appraisal for these types of projects and in many cases a simplified
appraisal focusing on operating costs and patronage/revenue impacts may be all that is required.
On the other hand, other types of public transport project do require a greater level of appraisal. These
would include major new public transport investments such as the Northern Busway in Auckland (Wignall
2012b) and policy decisions with significant system-wide implications such as significant fare restructuring.
In some cases, a simplified approach where the significant impacts are estimated broadly can be justified,
but this would depend in large part on the cost and risk profile of the proposal, as discussed below.
4.2.2 Cost and risk profile
The cost and risk profile of a proposal is an important factor in determining the appropriate level of
analysis. This section provides two examples of how this is applied, being the TBBC ‘scalability matrix’ for
determining the required level of analysis and decision-making process, and the project type thresholds
applied by the Depart of Transport in Ireland (2009).
The cost and risk profile will have a bearing on the appropriate level of analysis required, although we
note the level of analysis required for a certain level of cost/risk also depends on the type of proposal
(discussed above) and the requirements of the decision-making body. For public transport proposals the
costs involved are predominantly for recurrent operations and for vehicles (which may be readily
redeployed) rather than for infrastructure (generally sunk costs). This different mix of cost types
(compared with road infrastructure projects) should be taken into account when assessing the cost and
risk profile of each proposal (as well as its effective life for economic appraisal purposes).
Specific consideration of the level of cost/risk or ‘thresholds’ to determine an appropriate level of analysis
was outside the scope of this research project.
4.2.2.1 Example ‘scalability matrix’ used for the TBBC in New Zealand
The TBBC framework is a requirement for New Zealand government agencies seeking Cabinet approval for
funding of more than $25 million but is also required for high-risk projects requiring lesser funding.
Figure 4.1 sets out the TBBC ‘scalability matrix’ which is used to determine the level of detail required in
the economic appraisal and whether a single-stage or two–stage business case is required (NZ Treasury
2012).
11 In New Zealand, the focus in recent years has been on funding public transport service improvements through
efficiency gains.
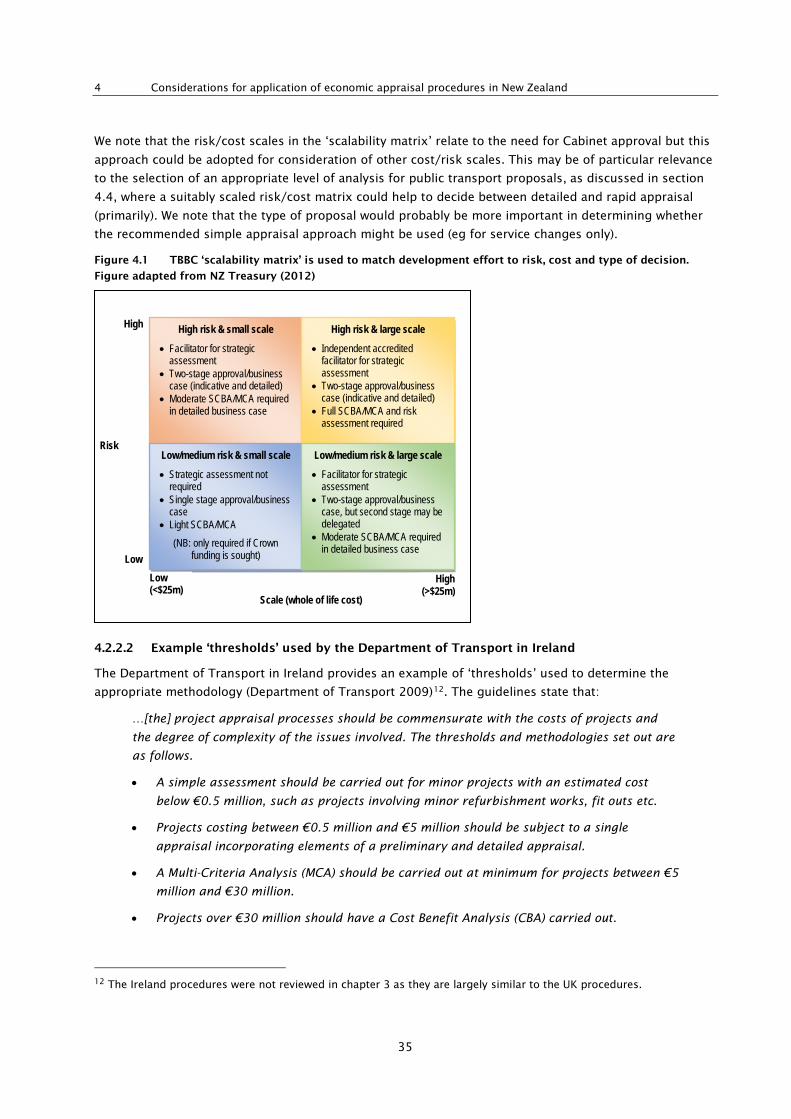
4 Considerations for application of economic appraisal procedures in New Zealand
35
We note that the risk/cost scales in the ‘scalability matrix’ relate to the need for Cabinet approval but this
approach could be adopted for consideration of other cost/risk scales. This may be of particular relevance
to the selection of an appropriate level of analysis for public transport proposals, as discussed in section
4.4, where a suitably scaled risk/cost matrix could help to decide between detailed and rapid appraisal
(primarily). We note that the type of proposal would probably be more important in determining whether
the recommended simple appraisal approach might be used (eg for service changes only).
Figure 4.1 TBBC ‘scalability matrix’ is used to match development effort to risk, cost and type of decision.
Figure adapted from NZ Treasury (2012)
4.2.2.2 Example ‘thresholds’ used by the Department of Transport in Ireland
The Department of Transport in Ireland provides an example of ‘thresholds’ used to determine the
appropriate methodology (Department of Transport 2009)12. The guidelines state that:
…[the] project appraisal processes should be commensurate with the costs of projects and
the degree of complexity of the issues involved. The thresholds and methodologies set out are
as follows.
• A simple assessment should be carried out for minor projects with an estimated cost
below €0.5 million, such as projects involving minor refurbishment works, fit outs etc.
• Projects costing between €0.5 million and €5 million should be subject to a single
appraisal incorporating elements of a preliminary and detailed appraisal.
• A Multi-Criteria Analysis (MCA) should be carried out at minimum for projects between €5
million and €30 million.
• Projects over €30 million should have a Cost Benefit Analysis (CBA) carried out.
12 The Ireland procedures were not reviewed in chapter 3 as they are largely similar to the UK procedures.
High risk & small scale
• Facilitator for strategic assessment
• Two-stage approval/business case (indicative and detailed)
• Moderate SCBA/MCA required in detailed business case
High risk & large scale
• Independent accredited facilitator for strategic assessment
• Two-stage approval/business case (indicative and detailed)
• Full SCBA/MCA and risk assessment required
Low/medium risk & small scale
• Strategic assessment not required
• Single stage approval/business case
• Light SCBA/MCA
(NB: only required if Crown funding is sought)
Low/medium risk & large scale
• Facilitator for strategic assessment
• Two-stage approval/business case, but second stage may be delegated
• Moderate SCBA/MCA required in detailed business case
Risk
High
Low
Scale (whole of life cost)
High (>$25m)
Low (<$25m)
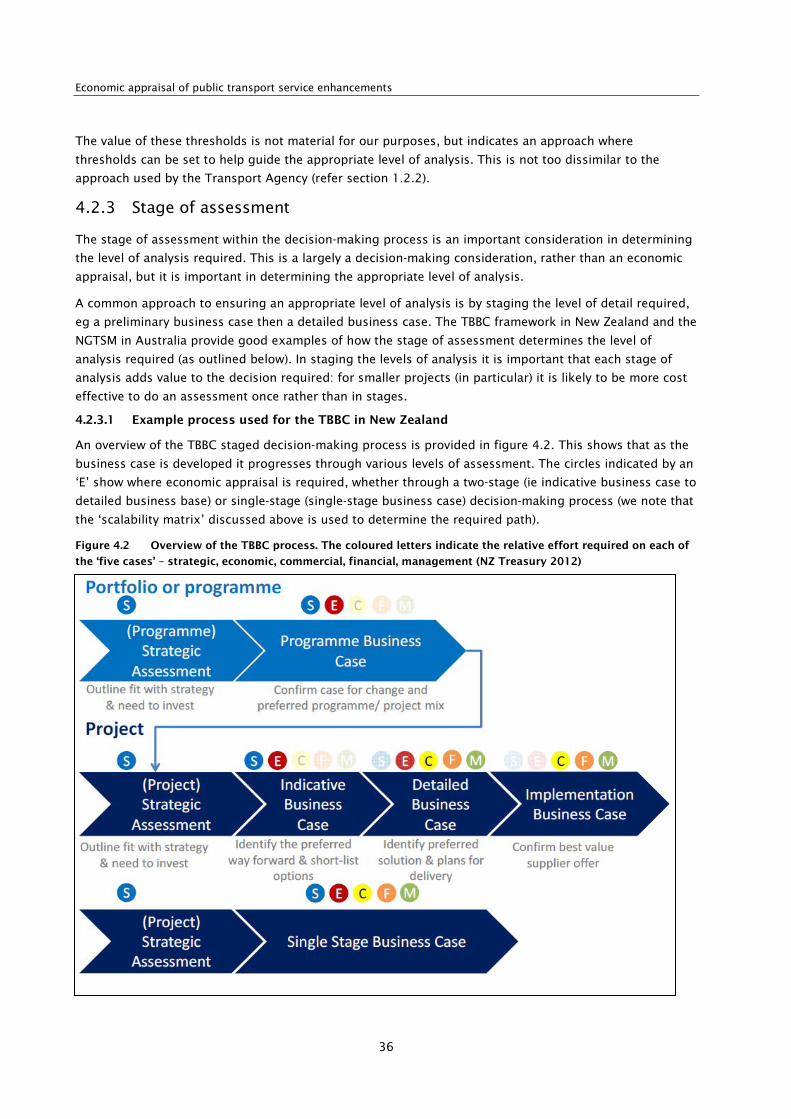
Economic appraisal of public transport service enhancements
36
The value of these thresholds is not material for our purposes, but indicates an approach where
thresholds can be set to help guide the appropriate level of analysis. This is not too dissimilar to the
approach used by the Transport Agency (refer section 1.2.2).
4.2.3 Stage of assessment
The stage of assessment within the decision-making process is an important consideration in determining
the level of analysis required. This is a largely a decision-making consideration, rather than an economic
appraisal, but it is important in determining the appropriate level of analysis.
A common approach to ensuring an appropriate level of analysis is by staging the level of detail required,
eg a preliminary business case then a detailed business case. The TBBC framework in New Zealand and the
NGTSM in Australia provide good examples of how the stage of assessment determines the level of
analysis required (as outlined below). In staging the levels of analysis it is important that each stage of
analysis adds value to the decision required: for smaller projects (in particular) it is likely to be more cost
effective to do an assessment once rather than in stages.
4.2.3.1 Example process used for the TBBC in New Zealand
An overview of the TBBC staged decision-making process is provided in figure 4.2. This shows that as the
business case is developed it progresses through various levels of assessment. The circles indicated by an
‘E’ show where economic appraisal is required, whether through a two-stage (ie indicative business case to
detailed business base) or single-stage (single-stage business case) decision-making process (we note that
the ‘scalability matrix’ discussed above is used to determine the required path).
Figure 4.2 Overview of the TBBC process. The coloured letters indicate the relative effort required on each of
the ‘five cases’ – strategic, economic, commercial, financial, management (NZ Treasury 2012)
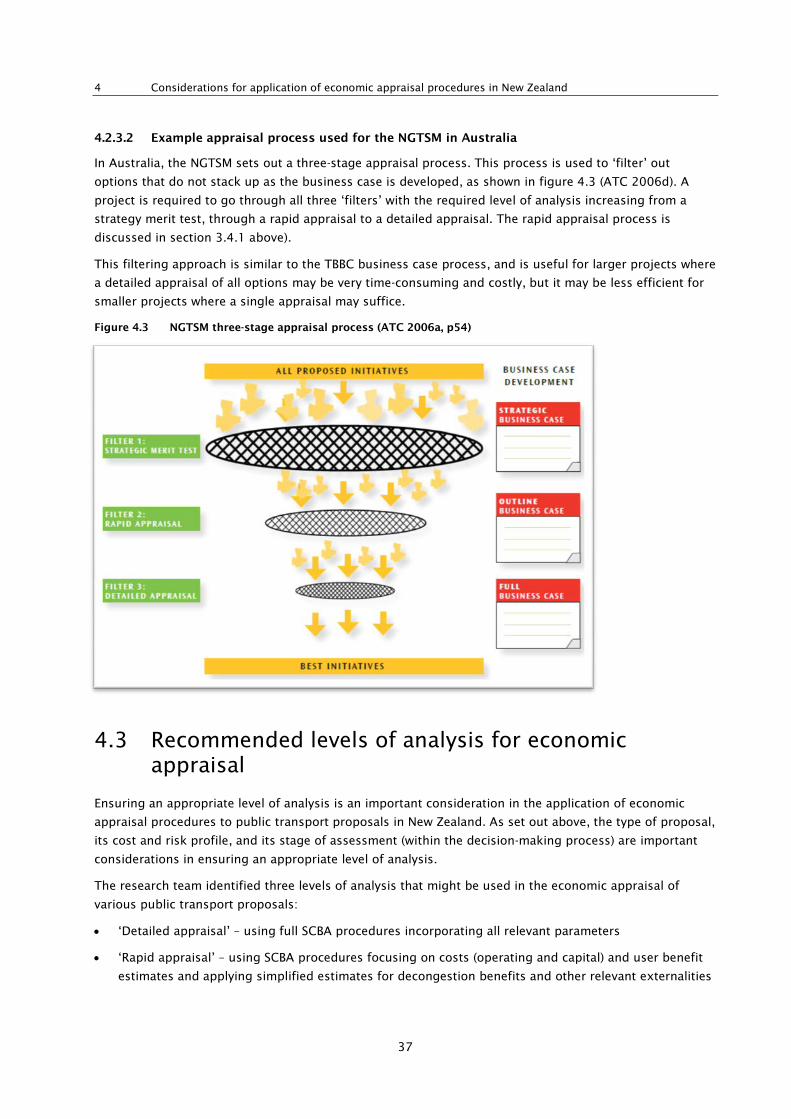
4 Considerations for application of economic appraisal procedures in New Zealand
37
4.2.3.2 Example appraisal process used for the NGTSM in Australia
In Australia, the NGTSM sets out a three-stage appraisal process. This process is used to ‘filter’ out
options that do not stack up as the business case is developed, as shown in figure 4.3 (ATC 2006d). A
project is required to go through all three ‘filters’ with the required level of analysis increasing from a
strategy merit test, through a rapid appraisal to a detailed appraisal. The rapid appraisal process is
discussed in section 3.4.1 above).
This filtering approach is similar to the TBBC business case process, and is useful for larger projects where
a detailed appraisal of all options may be very time-consuming and costly, but it may be less efficient for
smaller projects where a single appraisal may suffice.
Figure 4.3 NGTSM three-stage appraisal process (ATC 2006a, p54)
4.3 Recommended levels of analysis for economic appraisal
Ensuring an appropriate level of analysis is an important consideration in the application of economic
appraisal procedures to public transport proposals in New Zealand. As set out above, the type of proposal,
its cost and risk profile, and its stage of assessment (within the decision-making process) are important
considerations in ensuring an appropriate level of analysis.
The research team identified three levels of analysis that might be used in the economic appraisal of
various public transport proposals:
• ‘Detailed appraisal’ – using full SCBA procedures incorporating all relevant parameters
• ‘Rapid appraisal’ – using SCBA procedures focusing on costs (operating and capital) and user benefit
estimates and applying simplified estimates for decongestion benefits and other relevant externalities

Economic appraisal of public transport service enhancements
38
• ‘Simple appraisal’ – primarily using CEA and focusing on operating costs, demand (patronage) and
fare revenue impacts, with no consideration of decongestion benefits or other externalities. May also
use SCBA procedures, similar to rapid appraisal.
In all these cases, the appraisal should also be supported by a FA to determine the financial impacts of the
various project options, in additional to the overall ‘social’ impacts. A summary of the three levels of
analysis and appraisal approaches is provided in table 4.1. The table includes a description of the likely
project characteristics and examples of projects that might be subject to each level of analysis. Further
discussion on each of these three levels of analysis is provided below.
Table 4.1 Approaches to economic appraisal and characteristics of public transport proposals
Appraisal
approach/
characteristic
Level of analysis(a)
Detailed appraisal Rapid appraisal Simple appraisal
Recommended
appraisal
approach
• Social cost-benefit analysis,
with detailed consideration
of all relevant externalities.
• A supporting FA should also
be undertaken.
• Social cost-benefit analysis,
focusing on operating costs
and user benefits.
• A supporting FA should also
be undertaken. A supporting
CEA may also be used.
• Decongestion impacts and
other externalities may be
estimated using simplified
procedures.
• Cost-effectiveness analysis
and FA, focusing on
operating costs, patronage
and revenue impacts.
• Optionally, rapid appraisal
analysis may be used with
user benefits estimated
using simplified procedures.
• Decongestion impacts and
other externalities not
generally considered.
Type of
proposal
• Proposals with significant
externalities and significant
impacts on public transport
and roading networks.
• Major new public transport
investments.
• Policy decisions and
proposals with significant
system-wide implications.
• Proposals with some
externalities and/or impacts
on public transport and
roading networks.
• New public transport routes
and route extensions into
new areas.
• Public transport corridor and
area-wide reviews.
• Significant changes to public
transport route structure and
service levels.
• Proposals with few
externalities and minimal
impact on public transport
and roading networks.
• Changes within existing
public transport services.
• Relative minor changes that
can be easily benchmarked
against existing services.
• Changes to frequency and
hours of operation of public
transport routes.
Cost and risk
profile
• Proposals likely to be both
high cost and high risk.
• Potential that significant new
capital investment or
significant new operating
expenditure may be
required.
• Proposals likely to have a
moderate cost, but may
include projects with either a
high cost or high risk profile
(if both high then detailed
appraisal may be more
appropriate).
• Some new capital investment
and new operating
expenditure may be
required.
• Proposals likely to be low
cost and low risk.
• Minimal new capital or
operating expenditure
required.
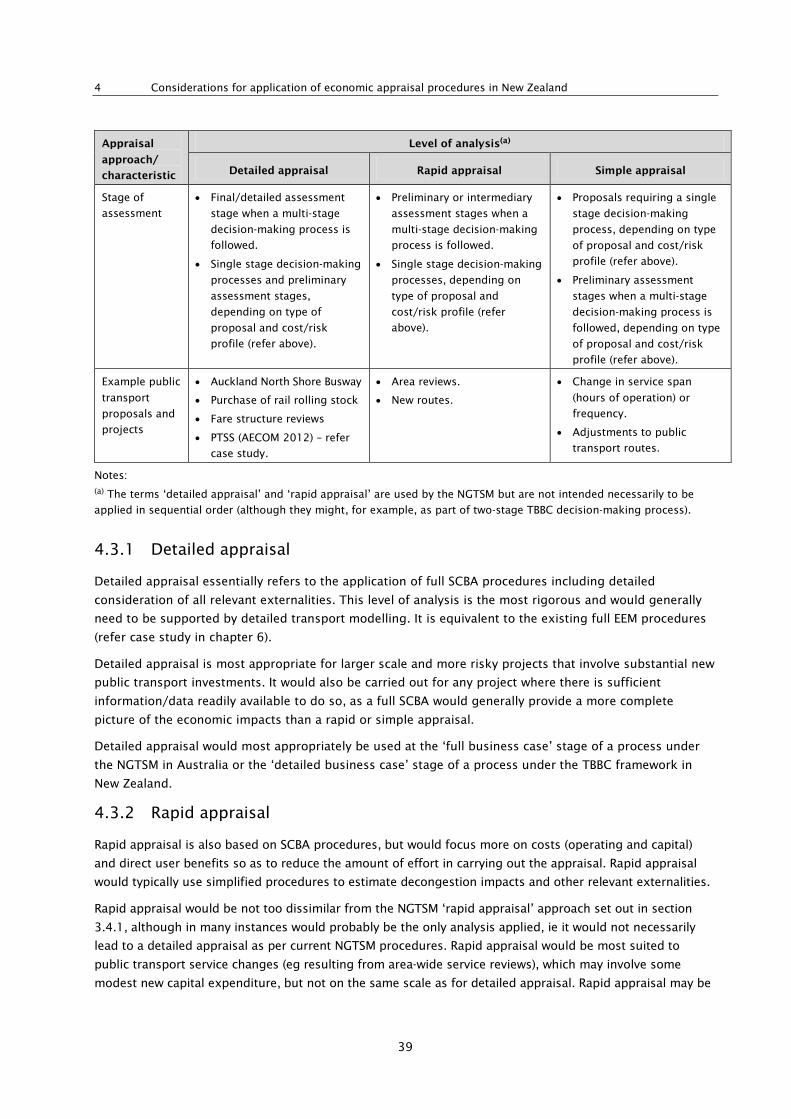
4 Considerations for application of economic appraisal procedures in New Zealand
39
Appraisal
approach/
characteristic
Level of analysis(a)
Detailed appraisal Rapid appraisal Simple appraisal
Stage of
assessment
• Final/detailed assessment
stage when a multi-stage
decision-making process is
followed.
• Single stage decision-making
processes and preliminary
assessment stages,
depending on type of
proposal and cost/risk
profile (refer above).
• Preliminary or intermediary
assessment stages when a
multi-stage decision-making
process is followed.
• Single stage decision-making
processes, depending on
type of proposal and
cost/risk profile (refer
above).
• Proposals requiring a single
stage decision-making
process, depending on type
of proposal and cost/risk
profile (refer above).
• Preliminary assessment
stages when a multi-stage
decision-making process is
followed, depending on type
of proposal and cost/risk
profile (refer above).
Example public
transport
proposals and
projects
• Auckland North Shore Busway
• Purchase of rail rolling stock
• Fare structure reviews
• PTSS (AECOM 2012) – refer
case study.
• Area reviews.
• New routes.
• Change in service span
(hours of operation) or
frequency.
• Adjustments to public
transport routes.
Notes: (a) The terms ‘detailed appraisal’ and ‘rapid appraisal’ are used by the NGTSM but are not intended necessarily to be
applied in sequential order (although they might, for example, as part of two-stage TBBC decision-making process).
4.3.1 Detailed appraisal
Detailed appraisal essentially refers to the application of full SCBA procedures including detailed
consideration of all relevant externalities. This level of analysis is the most rigorous and would generally
need to be supported by detailed transport modelling. It is equivalent to the existing full EEM procedures
(refer case study in chapter 6).
Detailed appraisal is most appropriate for larger scale and more risky projects that involve substantial new
public transport investments. It would also be carried out for any project where there is sufficient
information/data readily available to do so, as a full SCBA would generally provide a more complete
picture of the economic impacts than a rapid or simple appraisal.
Detailed appraisal would most appropriately be used at the ‘full business case’ stage of a process under
the NGTSM in Australia or the ‘detailed business case’ stage of a process under the TBBC framework in
New Zealand.
4.3.2 Rapid appraisal
Rapid appraisal is also based on SCBA procedures, but would focus more on costs (operating and capital)
and direct user benefits so as to reduce the amount of effort in carrying out the appraisal. Rapid appraisal
would typically use simplified procedures to estimate decongestion impacts and other relevant externalities.
Rapid appraisal would be not too dissimilar from the NGTSM ‘rapid appraisal’ approach set out in section
3.4.1, although in many instances would probably be the only analysis applied, ie it would not necessarily
lead to a detailed appraisal as per current NGTSM procedures. Rapid appraisal would be most suited to
public transport service changes (eg resulting from area-wide service reviews), which may involve some
modest new capital expenditure, but not on the same scale as for detailed appraisal. Rapid appraisal may be

Economic appraisal of public transport service enhancements
40
suited to public transport network reconfigurations and public transport fare reviews, but if geographic-
based demand estimation is required a detailed appraisal (involving network modelling) may be appropriate.
As discussed above, the EEM volume 2 includes simplified procedures for certain public transport service
changes and new public transport services. Rapid appraisal would be applicable for these types of projects
and many public transport service changes. However, for projects involving substantial network changes,
detailed network demand modelling would generally be required in order to estimate demand changes (refer
discussion in chapter 6), so in such cases the amount of work required is still commensurate with that
required for a detailed appraisal. Rapid appraisal is intended to be easier to apply than detailed appraisal.
Rapid appraisal would most appropriately be used at the ‘outline business case’ stage of a process under
the NGTSM in Australia or the ‘indicative business case’ stage of a process under the TBBC framework in
New Zealand. Rapid appraisal may also be used for a ‘single stage’ business case under the TBBC or where
a business case is not required, depending on the type of project or proposal. In multi-stage decision-
making processes, rapid appraisal is used to help ‘filter’ options and would lead to further detailed
appraisal, but where used in single-stage decision-making processes it would be the only economic
appraisal undertaken. We recommend that further research be undertaken to determine the extent to
which rapid appraisal procedures might differ for single-stage and multi-stage decision-making processes.
4.3.3 Simple appraisal
Simple appraisal has been introduced to recognise that some changes to public transport services (eg to
operating hours and service frequency) do not require a more detailed analysis, particularly where there
are minimal impacts outside those to users and the operator (plus any public funding). Also it recognises
that such changes typically involve minimal (or zero) capital costs and only modest changes in operating
costs, and are readily reversible (any sunk costs being small). A key distinction from detailed and rapid
appraisal is that simple appraisal does not need to consider decongestion impacts or other externalities.
Simple appraisal would be based on CEA, focusing on operating costs, demand (patronage) and fare
revenue impacts. It would be most suited to relatively minor changes to existing public transport services
such as changes to the frequency and hours of operation of routes, but also minor changes to routes and
in some cases new services (likely to be in areas adjacent to areas already served, for example the
extension of bus services into a new subdivision).
Simple appraisal is not the same as ‘simplified procedures’ already used in Australia and New Zealand
(refer section 3.4) in that those procedures still rely on the consideration of a simplified set of parameters
within a SCBA framework. Simple appraisal relies on a CEA, where the impacts of the proposal are usually
measured in terms of their cost effectiveness (against financial and other specified objectives). It does not
take account of externalities.
As discussed in section 3.2.2, we are aware that most public transport organisations use CEA in some
form but this is generally not well documented. The NGTSM (Urban transport, volume 4) includes a
‘generalised cost’ formulation representing the perceived user costs of public transport travel (refer
section 5.2), how these are affected by changes in services and the resultant patronage and revenue
impacts – this could form the basis for simple appraisal (ATC 2006e).
The application of this ‘generalised cost’ formation can be seen in the New Zealand Bus Policy Model,
which was developed as part of an earlier research project (Wallis and Schneiders 2012). The model
contained within that research provides an example of the type of methodology/tool that is suitable for
the level of analysis envisaged for ‘simple appraisal’.
4 Considerations for application of economic appraisal procedures in New Zealand
41
The Bus Policy Model is designed as a scenario analysis tool, used to assess the impacts on the bus system
and its performance of changes to the bus system itself (eg to services, fares or unit costs) and/or
changes in external factors affecting the demand for bus travel (eg changes in fuel prices, impacts of
population and urban development changes). It starts from a database of current bus operations, costs,
patronage and fare revenues, disaggregated by route/route group, day of week (weekday, Saturday,
Sunday) and time of day (peak, interpeak, evening).
The model incorporates a ‘generalised cost’ formulation, similar to that in the Australian NGTSM, and can
be used to derive a set of CEA performance ratios (eg change in patronage per dollar change in operating
costs) and can similarly provide FA results (eg farebox revenue/cost, change in funding requirements, etc).
The model could also readily be further developed to derive user benefits and hence provide simplified
SBCA outputs (ie user benefits/incremental operating costs). While it currently excludes any road traffic
and environmental externalities, these could readily be derived by applying current EEM simplified
procedures (SP9/SP10).
4.4 Selecting an appropriate level of analysis for economic appraisal
The above levels of analysis for economic appraisal (detailed, rapid, simple) have been identified following
our review of existing appraisal procedures and a consideration of the project type, cost and risk and
stage in determining an appropriate level of analysis. A key consideration in selecting the appropriate level
is to ensure that the amount of effort on economic appraisal is commensurate with the expected impacts.
This research project was not tasked with determining the decision-making process or specifying the level
of analysis that would be applied to specific projects, but we have set out in figure 4.4 a possible process
that could be followed to determine whether a detailed appraisal, rapid appraisal and/or simple appraisal
should be undertaken.
In terms of the wider decision-making process, we note that both the NGTSM in Australia and the TBBC
framework in New Zealand set out a staged decision-making/analysis process. Consideration must be
given to other cases where a two stage approach could be an efficient use of appraisal resources,
particular for smaller projects.
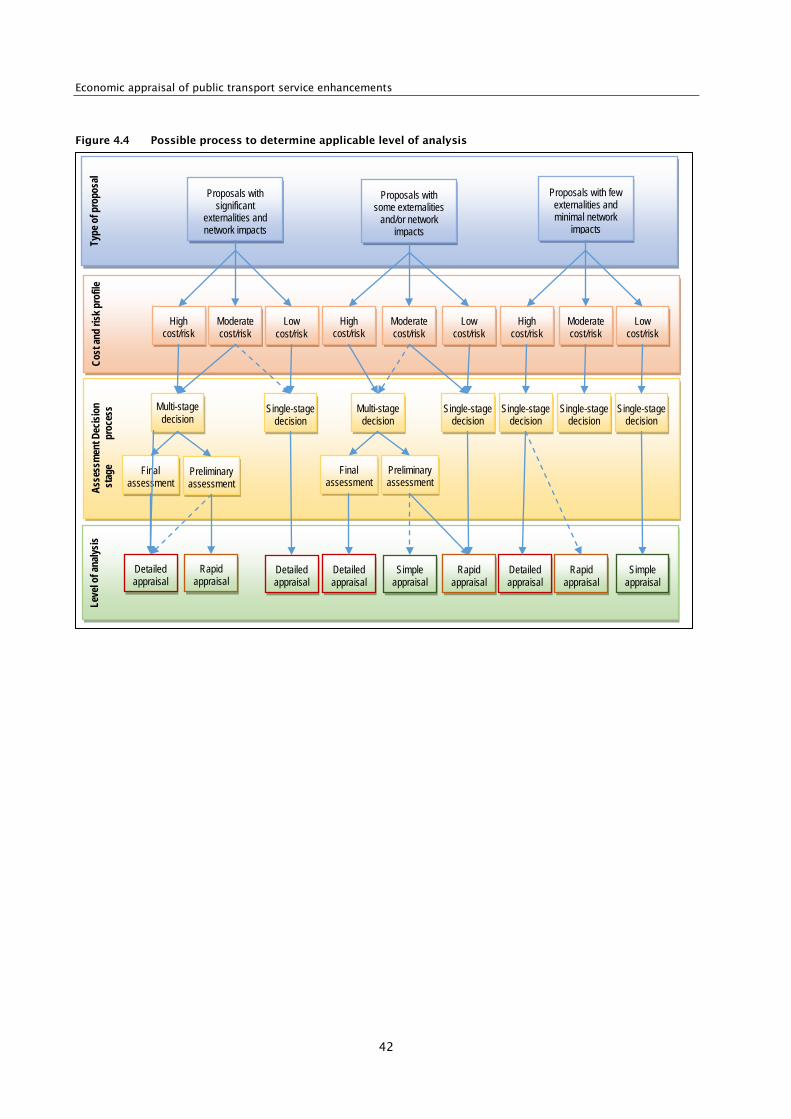
Economic appraisal of public transport service enhancements
42
Figure 4.4 Possible process to determine applicable level of analysis
Asse
ssm
ent D
ecisi
on
stag
e p
roce
ss
Cost
and
risk p
rofil
e Le
vel o
f ana
lysis
Detailed appraisal
Preliminary assessment
Final assessment
Multi-stage decision
Type
of p
ropo
sal
Proposals with few externalities and minimal network
impacts
Proposals with some externalities
and/or network impacts
Proposals with significant
externalities and network impacts
Low cost/risk
High cost/risk
Moderate cost/risk
Low cost/risk
High cost/risk
Moderate cost/risk
Low cost/risk
High cost/risk
Moderate cost/risk
Single-stage decision
Rapid appraisal
Detailed appraisal
Detailed appraisal
Preliminary assessment
Final assessment
Multi-stage decision
Single-stage decision
Rapid appraisal
Simple appraisal
Simple appraisal
Rapid appraisal
Single-stage decision
Detailed appraisal
Single-stage decision
Single-stage decision
5 Review of public transport user benefit parameter values
43
5 Review of public transport user benefit parameter values
5.1 Introduction
This chapter outlines and provides the results of the project’s review of existing research evidence on unit
values for benefit parameters relevant to the economic appraisal of public transport proposals in
New Zealand. The review focused on public transport user benefits and on evidence from New Zealand and
Australia. The primary purpose was, based on the available research evidence, to identify ‘default’
parameter values appropriate for application in the appraisal of New Zealand public transport proposals. A
secondary purpose was to identify any gaps in the existing research evidence for which further research
should be given priority.
In the following sections, we:
• outline the scope of the review work, including the parameters selected for investigation and the
rationale for their selection (section 5.2)
• provide an overview of the nature and extent of the research evidence available (section 5.3)
• set out our analyses of this research evidence and draw conclusions on ‘default’ values for
New Zealand applications for each selected parameter (sections 5.4 to 5.6)
• summarise our conclusions from the review, and our recommendations on parameter values for
New Zealand (section 5.7).
5.2 Scoping of parameter value investigations
The overall objective of this research project was to provide guidance on appropriate methods and
benefits parameters for use in the economic appraisal of public transport proposals in a New Zealand
context.
Our review of appraisal approaches in chapter 2 identified SCBA, supported by CEA (for smaller/simpler
projects), as the preferred approach to economic appraisal. It was therefore appropriate that our research
on parameters and parameter values should be considered within a SCBA methodology. Our international
review of economic appraisal procedures then identified a wide range of benefit parameters potentially
relevant to the economic appraisal of public transport proposals (refer chapter 3).
The benefit parameters of potential relevance to the economic appraisal of public transport proposals can
be considered in the categories shown in table 5.1. For the reasons given in table 5.1, the major focus of
the project’s parameter values research was on public transport user benefits. While experience is that
these usually account for the majority of benefits from most public transport proposals, other benefit
categories, especially road system user benefits, also commonly account for a substantial proportion of
total benefits. In some cases ‘externality’ benefits and what we have termed ‘other economic’ benefits may
also be significant; however, the methods and evidence base relating to the valuation of benefits under
these two categories are much less well developed than those for public transport user benefits.
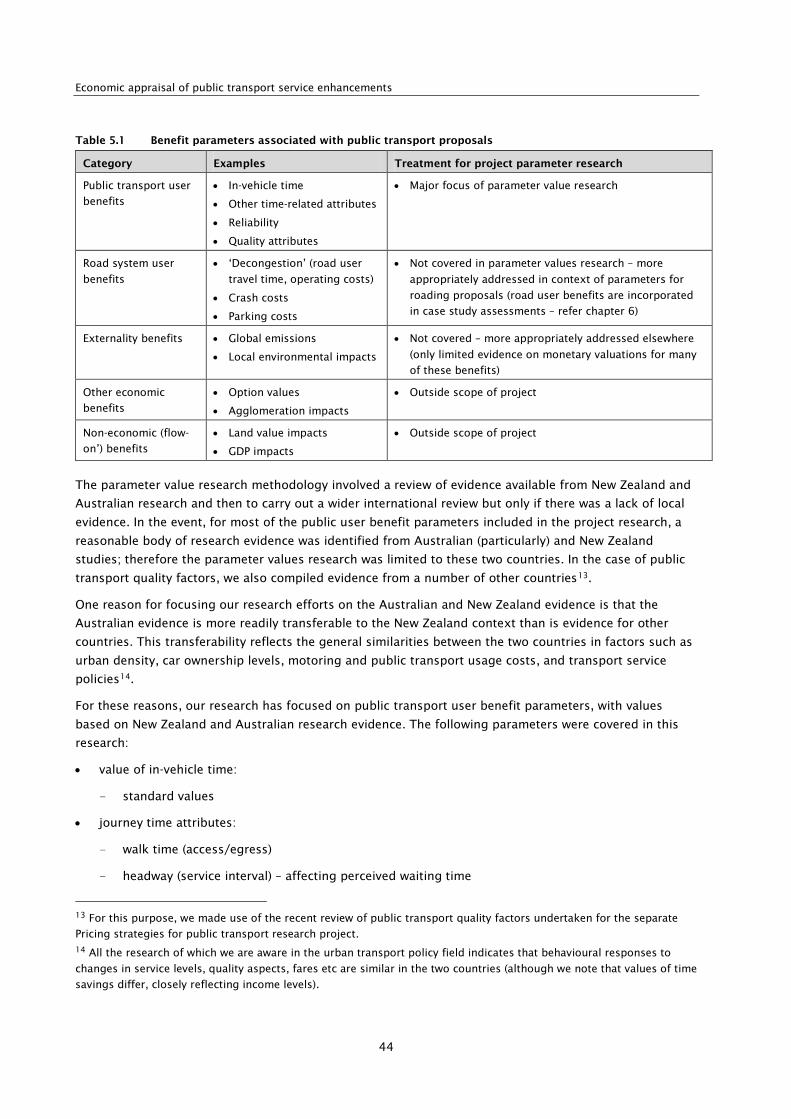
Economic appraisal of public transport service enhancements
44
Table 5.1 Benefit parameters associated with public transport proposals
Category Examples Treatment for project parameter research
Public transport user
benefits
• In-vehicle time
• Other time-related attributes
• Reliability
• Quality attributes
• Major focus of parameter value research
Road system user
benefits
• ‘Decongestion’ (road user
travel time, operating costs)
• Crash costs
• Parking costs
• Not covered in parameter values research – more
appropriately addressed in context of parameters for
roading proposals (road user benefits are incorporated
in case study assessments – refer chapter 6)
Externality benefits • Global emissions
• Local environmental impacts
• Not covered – more appropriately addressed elsewhere
(only limited evidence on monetary valuations for many
of these benefits)
Other economic
benefits
• Option values
• Agglomeration impacts
• Outside scope of project
Non-economic (flow-
on’) benefits
• Land value impacts
• GDP impacts
• Outside scope of project
The parameter value research methodology involved a review of evidence available from New Zealand and
Australian research and then to carry out a wider international review but only if there was a lack of local
evidence. In the event, for most of the public user benefit parameters included in the project research, a
reasonable body of research evidence was identified from Australian (particularly) and New Zealand
studies; therefore the parameter values research was limited to these two countries. In the case of public
transport quality factors, we also compiled evidence from a number of other countries13.
One reason for focusing our research efforts on the Australian and New Zealand evidence is that the
Australian evidence is more readily transferable to the New Zealand context than is evidence for other
countries. This transferability reflects the general similarities between the two countries in factors such as
urban density, car ownership levels, motoring and public transport usage costs, and transport service
policies14.
For these reasons, our research has focused on public transport user benefit parameters, with values
based on New Zealand and Australian research evidence. The following parameters were covered in this
research:
• value of in-vehicle time:
- standard values
• journey time attributes:
- walk time (access/egress)
- headway (service interval) – affecting perceived waiting time
13 For this purpose, we made use of the recent review of public transport quality factors undertaken for the separate
Pricing strategies for public transport research project. 14 All the research of which we are aware in the urban transport policy field indicates that behavioural responses to
changes in service levels, quality aspects, fares etc are similar in the two countries (although we note that values of time
savings differ, closely reflecting income levels).

5 Review of public transport user benefit parameter values
45
- seat availability/crowding – affecting perceived valuation of in-vehicle time
- interchange (transfer penalty and wait time)
- reliability of travel time
• quality attributes, covering:
- stop/station quality features
- vehicle quality features
- mode-specific factors (in general terms).
As shown in figure 5.1, these benefit parameters correspond to the various components of a public
transport journey (from origin to destination). The perceived user ‘generalised cost’ of a public transport
journey is effectively the sum of the time involved in each journey component, weighted according to the
relevant parameter value of time (which is expressed as a factor on standard values of in-vehicle time). In
the context of economic appraisal of public transport schemes, this generalised cost is a key driver of:
1 User benefits, which represent the change in user costs between a scheme option and a ‘base case’
2 Changes in demand (patronage) resulting from the scheme – which may be related to the generalised
cost change through elasticity factors of using another type of demand model.
The public transport user benefit parameters selected for the research are essentially consistent with
those parameters used in the economic appraisal (SCBA) of public transport proposals in key countries
internationally (refer table 3.3). They also largely reflect the public transport user benefits parameters
included in the EEM, although there are some areas of difference15.
15 The EEM does not include mode-specific factors, although it does include valuations for a range of stop/station and
vehicle quality factors.
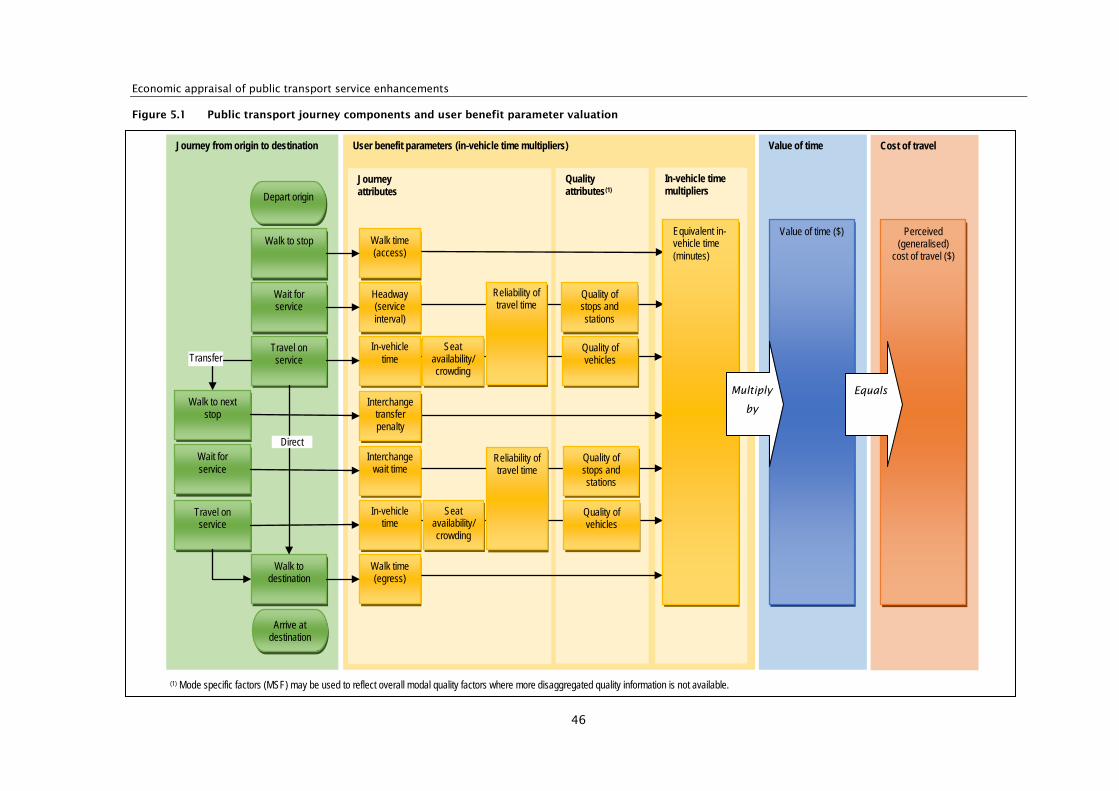
Economic appraisal of public transport service enhancements
46
Figure 5.1 Public transport journey components and user benefit parameter valuation
Cost of travel
Perceived (generalised)
cost of travel ($)
Value of time User benefit parameters (in-vehicle time multipliers)
Quality attributes(1)
Journey attributes
In-vehicle time multipliers
Journey from origin to destination
Walk to stop
Wait for service
Travel on service
Walk to next stop
Wait for service
Travel on service
Walk to destination
Transfer
Direct
Walk time (access)
Headway (service interval)
In-vehicle time
Interchange transfer penalty
Interchange wait time
Seat availability/ crowding
Quality of stops and stations
Quality of vehicles
Quality of stops and stations
Quality of vehicles
Walk time (egress)
Reliability of travel time
In-vehicle time
Seat availability/ crowding
Reliability of travel time
(1) Mode specific factors (MSF) may be used to reflect overall modal quality factors where more disaggregated quality information is not available.
Equivalent in-vehicle time (minutes)
Value of time ($)
Depart origin
Arrive at destination
Multiply
by
Equals

5 Review of public transport user benefit parameter values
47
5.3 Overview of user benefit parameter research (New Zealand and Australia)
A total of 35 studies (28 Australia, seven New Zealand) were reviewed relating to the valuation of in-
vehicle time and the various journey time attributes. The studies cover, bus, rail, light rail, busway
(transitway) and ferry. Some studies only interviewed public transport users but some included car,
walk/cycle and other non-users. The studies covered the period 1990 to 2013, with most of them taking
place between 1995 and 2005.
Most of the Australian studies took place in Sydney with the remainder in Brisbane, Canberra and Melbourne,
and were a part of demand forecasting work. Other studies were undertaken as part of building demand
models, estimating parameters for economic valuations or developing business strategies.
All but two studies were based on stated preference (SP) methods. The remaining two studies were based on
an analysis of travel choices or revealed preference (RP) data to estimate a travel model for Sydney using the
household travel survey data. In all cases, the benefit parameter values estimated reflect user willingness-to-
pay valuations. These values are strongly influenced by the incomes of those surveyed: care is thus needed
in comparing research results from different situations (eg countries, years, survey locations).
The SP surveys usually presented respondents with a series of journey choices which were either between
public transport modes (eg bus vs bus or bus vs rail) or between public transport and car (or in a few
cases public transport vs walk/cycle). Those studies which presented ‘same mode’ choices (eg bus vs bus)
produced more reliable relative valuations than those involving ‘different mode’ choices (eg car vs bus)16.
In drawing conclusions (eg on mean parameter values) from the range of studies relating to such
attributes, decisions were required on whether all the relevant study results should be given equal weight,
or whether some method of relative weighting should be used. It was decided to weight each study on the
basis of the relative spread of its distribution of values, as reflected in its relevant ‘t’ statistic: this t-value
represents the ratio of the mean estimate to the standard error17.
This weighting method gives greater weight to those studies with a narrow spread of results (ie higher t-
values), on the assumption that these results will be of higher quality. In practice, while there is likely to
be a tendency for this to be the case, many other factors can influence the quality of study results;
however, short of an in-depth independent appraisal of each study, there appears to be no better way of
assessing relative study quality18.
16 Respondents in same mode stated preference surveys were more likely to trade off the times and costs, varying their
response across the choice situations, whereas in between mode stated preference surveys, respondents were more
likely to stick to their current mode. 17 Most studies only reported the t-value of the individual parameter estimates rather than the value for the relative
valuation (the ratio of the estimates). Where possible, the t-value for the relative value was calculated (assuming zero
covariance between the estimators). Where it was not possible to calculate, a value of 1.6 was assumed. To produce the
weighting index, the t values were allocated to three categories and given a score of 1 for t-values between 0 and 2, 2
for t-values between 2 and 4 and 3 for t-values exceeding 4, An average weight was then calculated with the individual
study categorised t values compared relative to this. This maintained the number of observations. 18 In practice, such an independent appraisal would not be possible for some of the studies involved, as the detailed
study documentation is no longer available.
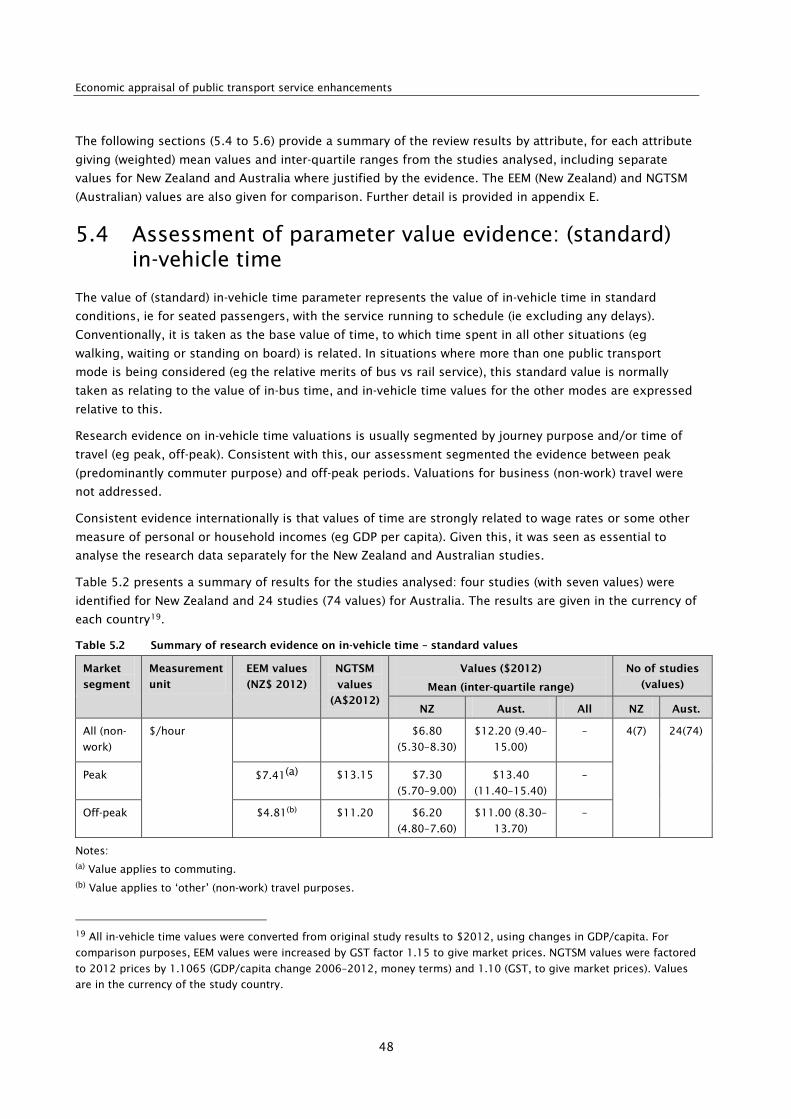
Economic appraisal of public transport service enhancements
48
The following sections (5.4 to 5.6) provide a summary of the review results by attribute, for each attribute
giving (weighted) mean values and inter-quartile ranges from the studies analysed, including separate
values for New Zealand and Australia where justified by the evidence. The EEM (New Zealand) and NGTSM
(Australian) values are also given for comparison. Further detail is provided in appendix E.
5.4 Assessment of parameter value evidence: (standard) in-vehicle time
The value of (standard) in-vehicle time parameter represents the value of in-vehicle time in standard
conditions, ie for seated passengers, with the service running to schedule (ie excluding any delays).
Conventionally, it is taken as the base value of time, to which time spent in all other situations (eg
walking, waiting or standing on board) is related. In situations where more than one public transport
mode is being considered (eg the relative merits of bus vs rail service), this standard value is normally
taken as relating to the value of in-bus time, and in-vehicle time values for the other modes are expressed
relative to this.
Research evidence on in-vehicle time valuations is usually segmented by journey purpose and/or time of
travel (eg peak, off-peak). Consistent with this, our assessment segmented the evidence between peak
(predominantly commuter purpose) and off-peak periods. Valuations for business (non-work) travel were
not addressed.
Consistent evidence internationally is that values of time are strongly related to wage rates or some other
measure of personal or household incomes (eg GDP per capita). Given this, it was seen as essential to
analyse the research data separately for the New Zealand and Australian studies.
Table 5.2 presents a summary of results for the studies analysed: four studies (with seven values) were
identified for New Zealand and 24 studies (74 values) for Australia. The results are given in the currency of
each country19.
Table 5.2 Summary of research evidence on in-vehicle time – standard values
Market
segment
Measurement
unit
EEM values
(NZ$ 2012)
NGTSM
values
(A$2012)
Values ($2012)
Mean (inter-quartile range)
No of studies
(values)
NZ Aust. All NZ Aust.
All (non-
work)
$/hour $6.80
(5.30–8.30)
$12.20 (9.40–
15.00)
– 4(7) 24(74)
Peak $7.41(a) $13.15 $7.30
(5.70–9.00)
$13.40
(11.40–15.40)
–
Off-peak $4.81(b) $11.20 $6.20
(4.80–7.60)
$11.00 (8.30–
13.70)
–
Notes: (a) Value applies to commuting. (b) Value applies to ‘other’ (non-work) travel purposes.
19 All in-vehicle time values were converted from original study results to $2012, using changes in GDP/capita. For
comparison purposes, EEM values were increased by GST factor 1.15 to give market prices. NGTSM values were factored
to 2012 prices by 1.1065 (GDP/capita change 2006–2012, money terms) and 1.10 (GST, to give market prices). Values
are in the currency of the study country.
5 Review of public transport user benefit parameter values
49
Comments on values:
• Values relate to seated bus passengers, at typical levels of crowding.
• All estimates are in market prices (including indirect taxation component).
• All but two studies were SP. Exceptions were two Sydney cross-sectional mode choice estimates that
used Household Travel Survey data with the estimates subject to ‘caveats’ in the reports
• Evidence suggests that values have increased over time, relative to GDP/capita. However most studies
were undertaken between 1995 and 2005 (with noteworthy variation).
• Values of time for Australia (mainly New South Wales) and New Zealand were similar proportions of
the GDP per capita in each country.
• Average value-of-time approximately 42% of GDP/capita per hour for New Zealand and Australia;
higher for peak (45%) and lower for off-peak (38%).
• The New Zealand mean value was similar to EEM for peak, and circa 30% higher for off-peak.
• No statistically significant difference for rail/bus. Some observations included car respondents.
Conclusions and recommendations:
• Peak/commuting. The New Zealand mean value (four studies) is almost identical to the EEM value
(allowing for indirect taxation): no case for change.
• Off-peak/other purposes. The New Zealand mean value (four studies) is much higher (29%) than the
EEM value. Also off-peak: peak ratio in EEM much lower (65%) than corresponding ratios in NGTSM
(85%) and mean values from Australian studies (82%). Indicates good case to increase EEM off-
peak/other value to circa 85% of peak/commute value (circa $6.20 including GST, NZ$ 2012).
• The Transport Agency research project on pricing strategies for public transport project will derive
estimates for this parameter, based on SP-based market research involving relatively large samples of
New Zealand bus and train users. Given that these results will soon be available, we recommend that
the case for any changes to the EEM parameters covered in that project be considered at that time.
This consideration should address the structure of any new values (eg peak vs off-peak or commuter
vs other purpose; rail vs bus).
5.5 Assessment of parameter value evidence: journey time attributes
The following sub-sections present the research evidence relating to the five journey time attributes, as
listed in section 5.2 (‘quality’ and modal attributes are covered subsequently). Values for each of these
attributes are closely related to the standard value of in-vehicle time, and hence our results for these
attributes are presented as factors relative to the standard values (eg people typically value saving one
minute walking at 1.40 times their value for saving one minute sitting on the bus, so the walk time
parameter value is expressed as a factor 1.40).
For these journey time attributes, the international evidence indicates that the various value factors are
largely consistent from one country to another, and particularly between Australia and New Zealand (for
comparable conditions, market segments etc). Given this, and given the generally few New Zealand studies
available, for analysis purposes we have pooled the data from the two countries.
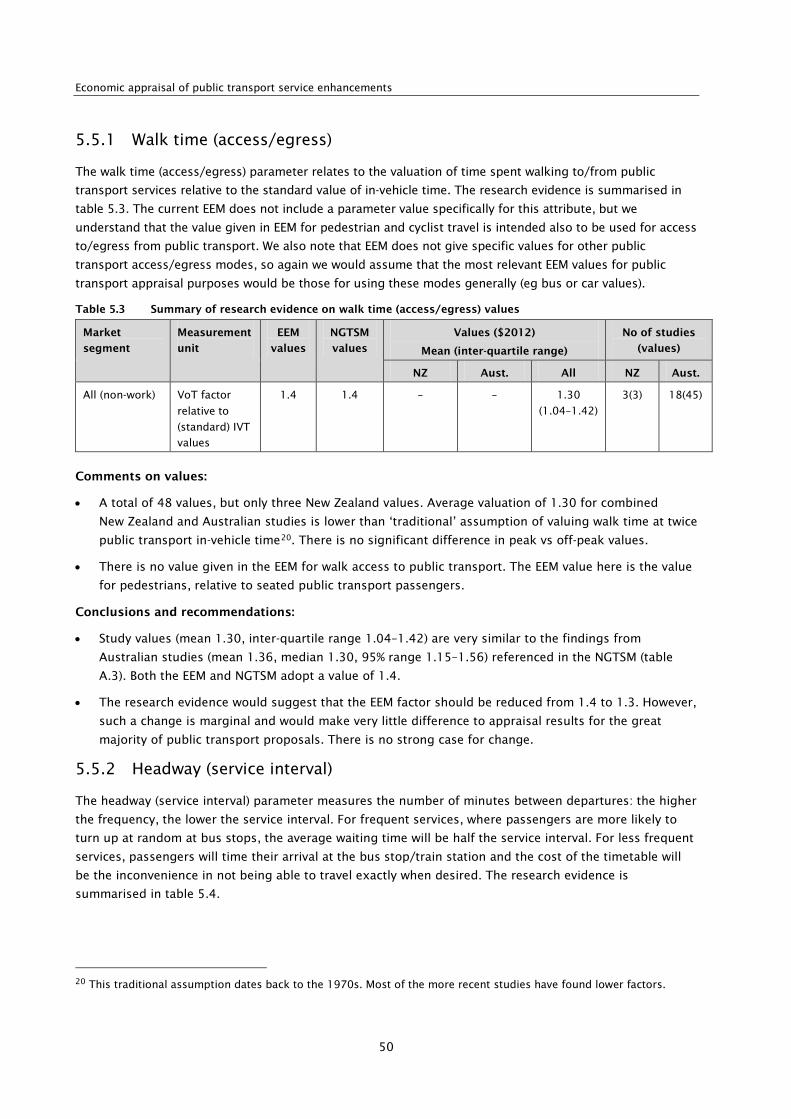
Economic appraisal of public transport service enhancements
50
5.5.1 Walk time (access/egress)
The walk time (access/egress) parameter relates to the valuation of time spent walking to/from public
transport services relative to the standard value of in-vehicle time. The research evidence is summarised in
table 5.3. The current EEM does not include a parameter value specifically for this attribute, but we
understand that the value given in EEM for pedestrian and cyclist travel is intended also to be used for access
to/egress from public transport. We also note that EEM does not give specific values for other public
transport access/egress modes, so again we would assume that the most relevant EEM values for public
transport appraisal purposes would be those for using these modes generally (eg bus or car values).
Table 5.3 Summary of research evidence on walk time (access/egress) values
Market
segment
Measurement
unit
EEM
values
NGTSM
values
Values ($2012)
Mean (inter-quartile range)
No of studies
(values)
NZ Aust. All NZ Aust.
All (non-work) VoT factor
relative to
(standard) IVT
values
1.4 1.4 – – 1.30
(1.04–1.42)
3(3) 18(45)
Comments on values:
• A total of 48 values, but only three New Zealand values. Average valuation of 1.30 for combined
New Zealand and Australian studies is lower than ‘traditional’ assumption of valuing walk time at twice
public transport in-vehicle time20. There is no significant difference in peak vs off-peak values.
• There is no value given in the EEM for walk access to public transport. The EEM value here is the value
for pedestrians, relative to seated public transport passengers.
Conclusions and recommendations:
• Study values (mean 1.30, inter-quartile range 1.04–1.42) are very similar to the findings from
Australian studies (mean 1.36, median 1.30, 95% range 1.15–1.56) referenced in the NGTSM (table
A.3). Both the EEM and NGTSM adopt a value of 1.4.
• The research evidence would suggest that the EEM factor should be reduced from 1.4 to 1.3. However,
such a change is marginal and would make very little difference to appraisal results for the great
majority of public transport proposals. There is no strong case for change.
5.5.2 Headway (service interval)
The headway (service interval) parameter measures the number of minutes between departures: the higher
the frequency, the lower the service interval. For frequent services, where passengers are more likely to
turn up at random at bus stops, the average waiting time will be half the service interval. For less frequent
services, passengers will time their arrival at the bus stop/train station and the cost of the timetable will
be the inconvenience in not being able to travel exactly when desired. The research evidence is
summarised in table 5.4.
20 This traditional assumption dates back to the 1970s. Most of the more recent studies have found lower factors.
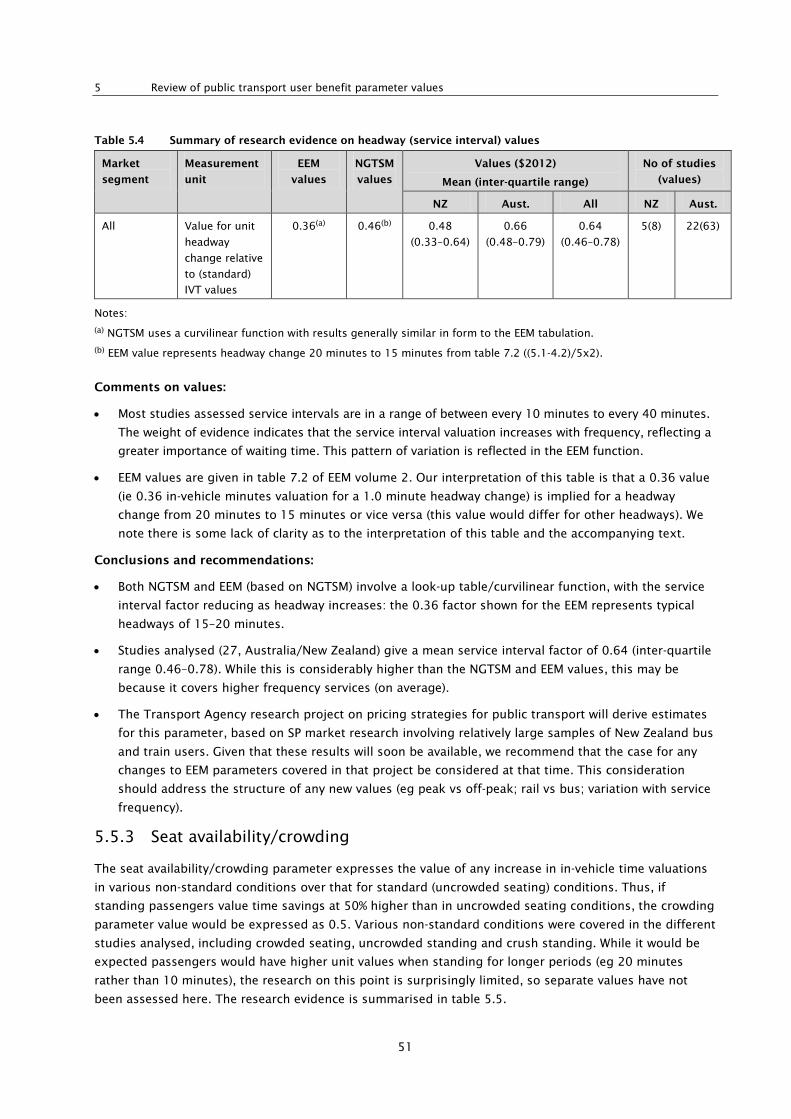
5 Review of public transport user benefit parameter values
51
Table 5.4 Summary of research evidence on headway (service interval) values
Market
segment
Measurement
unit
EEM
values
NGTSM
values
Values ($2012)
Mean (inter-quartile range)
No of studies
(values)
NZ Aust. All NZ Aust.
All Value for unit
headway
change relative
to (standard)
IVT values
0.36(a) 0.46(b) 0.48
(0.33–0.64)
0.66
(0.48–0.79)
0.64
(0.46–0.78)
5(8)
22(63)
Notes:
(a) NGTSM uses a curvilinear function with results generally similar in form to the EEM tabulation.
(b) EEM value represents headway change 20 minutes to 15 minutes from table 7.2 ((5.1-4.2)/5x2).
Comments on values:
• Most studies assessed service intervals are in a range of between every 10 minutes to every 40 minutes.
The weight of evidence indicates that the service interval valuation increases with frequency, reflecting a
greater importance of waiting time. This pattern of variation is reflected in the EEM function.
• EEM values are given in table 7.2 of EEM volume 2. Our interpretation of this table is that a 0.36 value
(ie 0.36 in-vehicle minutes valuation for a 1.0 minute headway change) is implied for a headway
change from 20 minutes to 15 minutes or vice versa (this value would differ for other headways). We
note there is some lack of clarity as to the interpretation of this table and the accompanying text.
Conclusions and recommendations:
• Both NGTSM and EEM (based on NGTSM) involve a look-up table/curvilinear function, with the service
interval factor reducing as headway increases: the 0.36 factor shown for the EEM represents typical
headways of 15–20 minutes.
• Studies analysed (27, Australia/New Zealand) give a mean service interval factor of 0.64 (inter-quartile
range 0.46–0.78). While this is considerably higher than the NGTSM and EEM values, this may be
because it covers higher frequency services (on average).
• The Transport Agency research project on pricing strategies for public transport will derive estimates
for this parameter, based on SP market research involving relatively large samples of New Zealand bus
and train users. Given that these results will soon be available, we recommend that the case for any
changes to EEM parameters covered in that project be considered at that time. This consideration
should address the structure of any new values (eg peak vs off-peak; rail vs bus; variation with service
frequency).
5.5.3 Seat availability/crowding
The seat availability/crowding parameter expresses the value of any increase in in-vehicle time valuations
in various non-standard conditions over that for standard (uncrowded seating) conditions. Thus, if
standing passengers value time savings at 50% higher than in uncrowded seating conditions, the crowding
parameter value would be expressed as 0.5. Various non-standard conditions were covered in the different
studies analysed, including crowded seating, uncrowded standing and crush standing. While it would be
expected passengers would have higher unit values when standing for longer periods (eg 20 minutes
rather than 10 minutes), the research on this point is surprisingly limited, so separate values have not
been assessed here. The research evidence is summarised in table 5.5.

Economic appraisal of public transport service enhancements
52
Table 5.5 Summary of research evidence on seat availability/crowding values
Market
segment
Measurement
unit
EEM
values
NGTSM
values
Values ($2012)
Mean (inter-quartile range)
No. of studies (values)
NZ Aust. All NZ Aust.
Standing
crush
VoT
additional
time factor
relative to
(standard) IVT
values
n/a 1.0 – 1.00
(0.86–1.25)
1.00
(0.86–1.25)
0 3
Standing
0.4 0.4 0.49 0.62 0.58
(0.39–0.78)
4 6
Crowded
seating
n/a 0.1 – 0.23
(0.21–0.28)
0.23
(0.21–0.28)
0 2
Comments on values:
• Additional time factor for passengers in crowded seating, standing and crush standing situations.
Only standing estimates produced for New Zealand. For Australia, evidence indicates that standing
values increase as length of stand increases and level of crowding increases.
• EEM gives a single value on this aspect, for standing bus/rail passengers relative to seated
passengers: the additional factor used is 0.4.
Conclusions and recommendations:
• Very few Australian/New Zealand studies cover seat availability/crowding valuations, and hence
confidence in the resulting mean values is relatively low.
• EEM currently has a single ‘standing’ value (no separate values for ‘crowded seating’ or ‘crush’ conditions).
• We recommend against any change to EEM values on the basis of the studies examined.
• Further research would appear warranted on this aspect, with a view to developing a more graduated
scale of values, varying with the crowding levels (refer NGTSM). We note that market research on this
aspect is currently being undertaken in Sydney.
5.5.4 Interchange
Changing buses and trains typically involves a walk between the two services, and a wait for the second
service (as well as possibly an additional fare). Additional to the time involved, passengers typically
perceive a transfer penalty, reflecting the added journey ‘hassle’ and extra uncertainty and anxiety about
potentially missed connections. Thus the user cost of a transfer may be divided into three components:
the walk time, the wait time for the next service, and the additional transfer penalty. Many studies on
transfers do not clearly distinguish between these three transfer components, so our assessment has tried
to disentangle them where possible, focusing mainly on the wait time and transfer penalty components (it
could be assumed that the walk time valuations are similar to those for walk time as an access/egress
mode covered in section 5.5.1).
Transfer penalties are generally expressed in terms of their perceived cost in equivalent minutes of
standard in-vehicle time, while wait times are expressed as a factor of in-vehicle time. The two
components are discussed separately below.
While we identified 18 studies (with 64 transfer penalty estimates), only one of these was New Zealand-
based, indicating a dearth of New Zealand evidence on this important aspect.
The studies reviewed indicated perceived differences in transfer penalties between:

5 Review of public transport user benefit parameter values
53
• Same mode transfers and different mode transfers, with the latter having higher penalties than the
former. It is not clear whether this effect is intrinsic to the modes, to the quality of the transfer
environment, or to the frequency of the services involved (the latter should be addressed separately).
• Transfers at peak and off-peak periods, with the latter having higher penalties than the former. Again
it is unclear whether these differences are related to the frequency of the services involved (which
should be addressed separately).or the (un)familiarity of passengers with the transfer arrangements.
Evaluation of transfers is an aspect that warrants further research.
5.5.4.1 Transfer penalty
The research evidence on transfer penalties is summarised in table 5.6.
Table 5.6 Summary of research evidence on interchange transfer penalty values
Market
segment
Measurement
unit
EEM
values
NGTSM
values
Values ($2012)
Mean (inter-quartile range)
No. of studies (values)
NZ Aust. All NZ Aust.
Peak same
mode
Value in
(standard) IVT
minutes
5 5–7 – – 4 (0–9) 1(1) 17(63)
Peak other
mode
5 7–10 – – 9 (4–15)
Off peak
same mode
5 5–7 – – 12.5
(10–15)
Off peak
other mode
5 7–10 – – 17 (14–21)
Comments on values:
• Values relate to pure penalty excluding any walk or wait time. Most studies estimated gross penalties
that included a transfer time. A pure penalty was estimated by netting out the weighted wait time. Off-
peak penalty higher than peak, reflecting lower frequency and consequent greater cost of missed
connection (and possibly a component of wait time), lesser familiarity with transfer, and greater
likelihood of luggage and/or reduced mobility.
Conclusions and recommendations:
• There is a dearth of New Zealand studies on transfers (transfer penalty, walk time, wait time), hence
our appraisal relies largely on Australian studies.
• These studies give a considerable range of values for transfer penalties, with the primary distinction
being between peak vs off-peak periods (penalty considerably higher in off-peak) and a secondary
distinction between same mode transfers (eg cross-platform) and other mode transfers (typically involve
significant walking, exposure to weather, etc).
• The same mode vs other mode difference (mean five minutes in-vehicle time) seems very plausible.
(The current EEM assumption of five minutes in all cases seems less plausible.)
• We are less confident regarding the apparent peak vs off-peak differences; we suspect this is partly a
service frequency (headway) effect, which should be covered under transfer wait time.
• In regard to the EEM transfer penalty value, we recommend:
- differentiating between same mode and other mode transfers

Economic appraisal of public transport service enhancements
54
- pending further New Zealand-based market research, adopting values of four in-vehicle minutes
for same mode transfers, eight in-vehicle minutes for other mode transfers
- further New Zealand market research (SP-based) should be undertaken on this topic, including into
valuation differences between same and other mode transfers, and between peak and off-peak
periods
- if appropriate information is available, this should be accompanied by revealed preference-based
market research (eg using transport model calibration and survey data).
5.5.4.2 Wait time (interchange)
The research evidence on transfer wait time valuations is summarised in table 5.7.
Table 5.7 Summary of research evidence on interchange wait time values
Market
segment
Measurement
unit
EEM
values
NGTSM
values
Values ($ 2012)
Mean (inter-quartile range)
No of studies (values)
NZ Aust. All NZ Aust.
All Value of wait
time at transfer
relative to IVT
2.0 1.20 1.25
(1.05–1.44)
1(1) 6(15)
Comments on values:
• Value of time spent waiting at transfer (uncrowded conditions). Lower value than conventionally
assumed for waiting time reflecting nature of studies. One study distinguished between amounts of
time spent on platform versus in access/entrance way, with access/entrance time valued at 1.5x more
than platform time under medium crowding conditions.
Conclusions and recommendations:
• EEM currently adopts factor 2.0 for both walk time and wait time on transfers without specific
guidance on how the wait time is to be calculated. There is little basis for this factor (it was the
‘traditional’ factor adopted some years ago in UK studies for both walking and waiting generally).
• The studies examined indicate a typical wait time factor of around 1.25.
• While the research evidence is not compelling, we recommend that EEM be changed as follows:
- Transfer walk time: adopt factor 1.4, as for walk access/egress time generally.
- Transfer wait time – default: adopt 1.25 * wait time, where wait time = 0.5 * headway.
- Wait time – timed transfers: adopt 1.25 * scheduled transfer time (eg range 3–5 minutes).
5.5.5 Reliability of travel time
Surveys of customer opinion have consistently shown that service reliability (relative to the timetable) is a
critical factor in service quality.
Service reliability covers two components: the reliability of services in arrival/departure time at the bus
stop or train station and the reliability in the travel time spent on the bus or train. Together they account
for the reliability at the destination.
Ten studies were reviewed that estimated values for reliability; four were New Zealand studies and six
were Australian. One New Zealand study by Vincent (2008) was undertaken specifically to value reliability.
The other studies included reliability among a list of attributes.
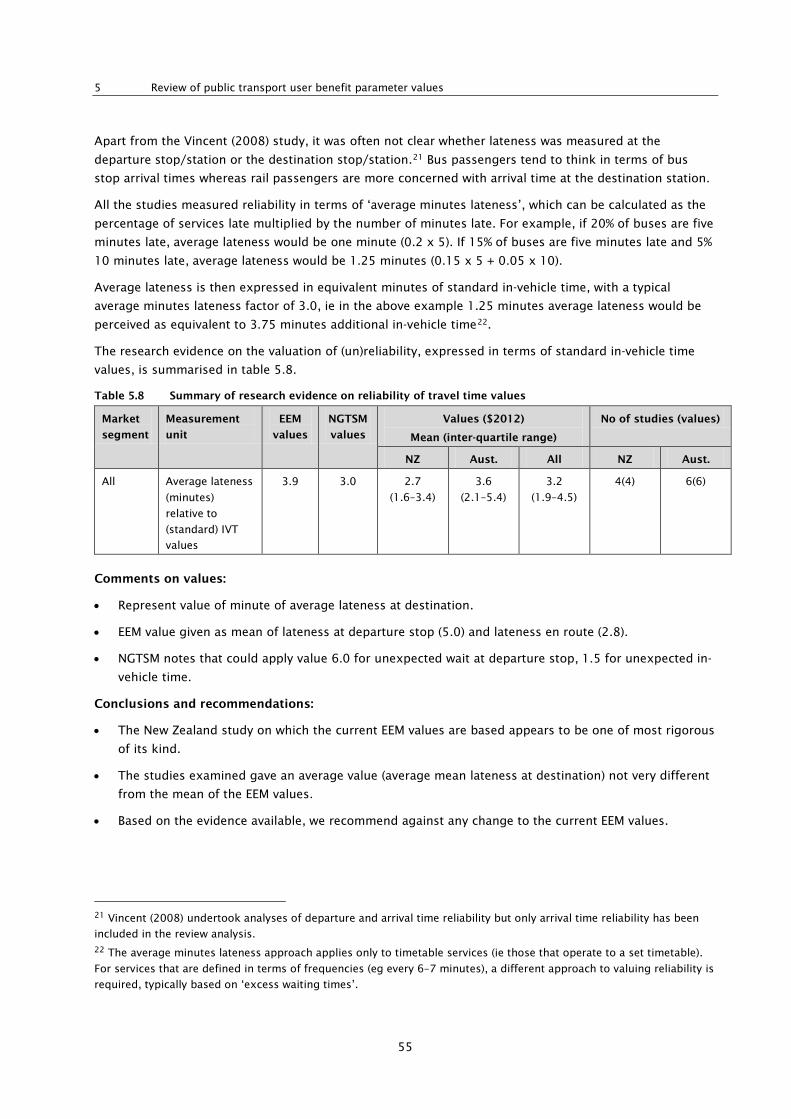
5 Review of public transport user benefit parameter values
55
Apart from the Vincent (2008) study, it was often not clear whether lateness was measured at the
departure stop/station or the destination stop/station.21 Bus passengers tend to think in terms of bus
stop arrival times whereas rail passengers are more concerned with arrival time at the destination station.
All the studies measured reliability in terms of ‘average minutes lateness’, which can be calculated as the
percentage of services late multiplied by the number of minutes late. For example, if 20% of buses are five
minutes late, average lateness would be one minute (0.2 x 5). If 15% of buses are five minutes late and 5%
10 minutes late, average lateness would be 1.25 minutes (0.15 x 5 + 0.05 x 10).
Average lateness is then expressed in equivalent minutes of standard in-vehicle time, with a typical
average minutes lateness factor of 3.0, ie in the above example 1.25 minutes average lateness would be
perceived as equivalent to 3.75 minutes additional in-vehicle time22.
The research evidence on the valuation of (un)reliability, expressed in terms of standard in-vehicle time
values, is summarised in table 5.8.
Table 5.8 Summary of research evidence on reliability of travel time values
Market
segment
Measurement
unit
EEM
values
NGTSM
values
Values ($2012)
Mean (inter-quartile range)
No of studies (values)
NZ Aust. All NZ Aust.
All
Average lateness
(minutes)
relative to
(standard) IVT
values
3.9 3.0 2.7
(1.6–3.4)
3.6
(2.1–5.4)
3.2
(1.9–4.5)
4(4) 6(6)
Comments on values:
• Represent value of minute of average lateness at destination.
• EEM value given as mean of lateness at departure stop (5.0) and lateness en route (2.8).
• NGTSM notes that could apply value 6.0 for unexpected wait at departure stop, 1.5 for unexpected in-
vehicle time.
Conclusions and recommendations:
• The New Zealand study on which the current EEM values are based appears to be one of most rigorous
of its kind.
• The studies examined gave an average value (average mean lateness at destination) not very different
from the mean of the EEM values.
• Based on the evidence available, we recommend against any change to the current EEM values.
21 Vincent (2008) undertook analyses of departure and arrival time reliability but only arrival time reliability has been
included in the review analysis. 22 The average minutes lateness approach applies only to timetable services (ie those that operate to a set timetable).
For services that are defined in terms of frequencies (eg every 6–7 minutes), a different approach to valuing reliability is
required, typically based on ‘excess waiting times’.

Economic appraisal of public transport service enhancements
56
5.6 Assessment of parameter value evidence: quality and mode-specific attributes
5.6.1 Overview
This section addresses perceived values for two groups of public transport journey parameters, which are
often considered separately in demand modelling/economic appraisal studies, but are to a large extent
different perspectives on the same journey aspects:
• Quality attributes – these primarily cover infrastructure (stops/stations etc) quality features and
vehicle quality features, but also include other aspects (such as passenger information) that do not
readily fit into either of these categories.
• Mode-specific attributes – cover perceived attributes which are commonly associated with different
public transport modes, additional to the (time-related) attributes addressed in earlier sections of this
chapter.
These parameter groups together cover all significant (to users) journey attributes that were not covered
earlier. They may be regarded as ‘soft’ attributes, and not readily expressed in numerical or financial terms.
It will be recognised that there is considerable overlap between the two groups of parameters. For
example, ride quality may be considered a quality attribute, independent of the mode involved; or it may
be treated as a modal quality, being generally different for rail services than for bus services (which
usually operate in general traffic, but could operate on a high-quality reserved right-of-way). Another
example would be station/stop facilities, such as shelters, passenger information, toilets; these may be
regarded as attributes of rail services, but there is no reason why such facilities could not be provided for
bus services.
The mode-specific attribute approach is generally taken by demand modellers, who look to generalised
modal factors to explain typical differences in user behaviour between (eg) rail and bus modes. On the
other hand, the quality attributes approach is generally taken by market researchers and others interested
in establishing how the product could be made more attractive to existing and potential users, through
enhancing its specific features.
The following sub-sections review research which has been undertaken using each of the approaches, first
focusing on quality attributes, then on the mode-specific approach. In developing recommendations on
relevant parameter values from the research evidence, the findings from the two approaches would need
to be brought together and integrated, to ensure comprehensive coverage without double-counting.
5.6.2 Review of quality attributes
A separate Transport Agency research project on pricing strategies for public transport is expected to
provide primary research evidence on appropriate parameter values for vehicle and station/stop quality
attributes; it will also derive valuations for in-vehicle time and service intervals (Douglas Economics
2012b). This research project includes market research (using relatively large samples) of public transport
users in Auckland, Wellington and Christchurch and will provide up-to-date and local New Zealand
evidence on appropriate parameter values. A brief summary of the pricing strategies review of
international research evidence on public transport ‘quality’ attributes is provided below. We have not
carried out any further review of evidence on public transport ‘quality’ attributes, nor made any
recommendations in this area.
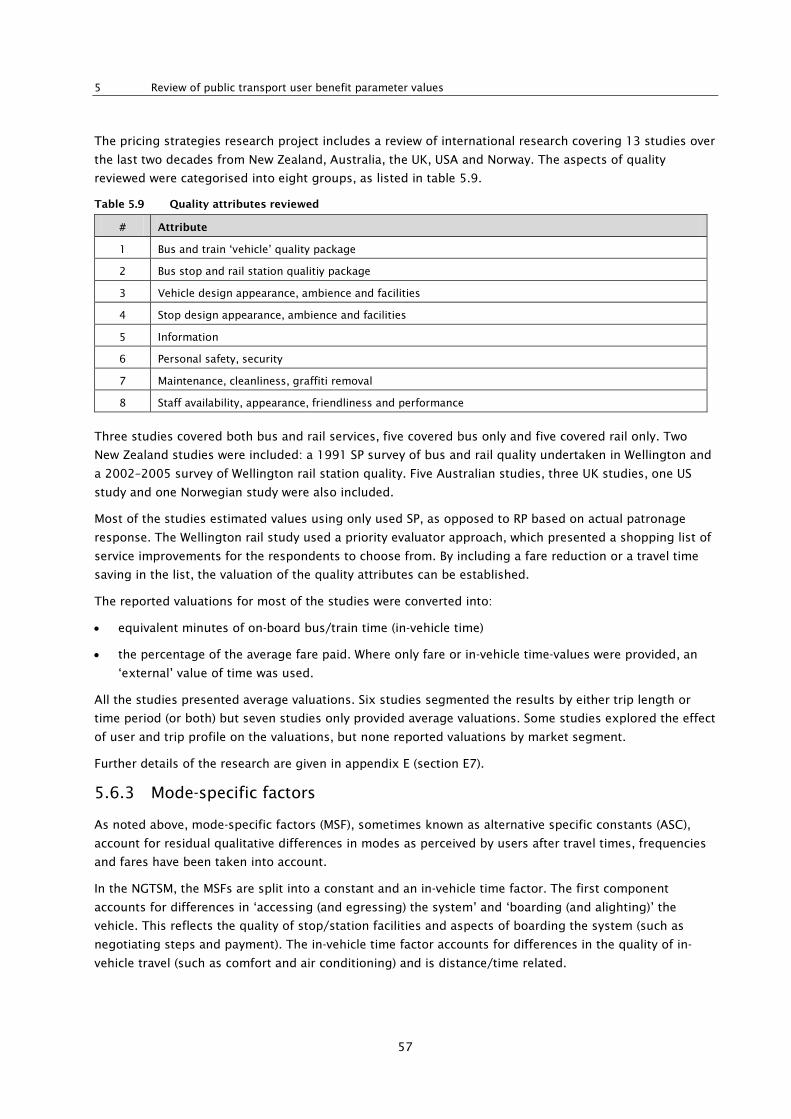
5 Review of public transport user benefit parameter values
57
The pricing strategies research project includes a review of international research covering 13 studies over
the last two decades from New Zealand, Australia, the UK, USA and Norway. The aspects of quality
reviewed were categorised into eight groups, as listed in table 5.9.
Table 5.9 Quality attributes reviewed
# Attribute
1 Bus and train ‘vehicle’ quality package
2 Bus stop and rail station qualitiy package
3 Vehicle design appearance, ambience and facilities
4 Stop design appearance, ambience and facilities
5 Information
6 Personal safety, security
7 Maintenance, cleanliness, graffiti removal
8 Staff availability, appearance, friendliness and performance
Three studies covered both bus and rail services, five covered bus only and five covered rail only. Two
New Zealand studies were included: a 1991 SP survey of bus and rail quality undertaken in Wellington and
a 2002–2005 survey of Wellington rail station quality. Five Australian studies, three UK studies, one US
study and one Norwegian study were also included.
Most of the studies estimated values using only used SP, as opposed to RP based on actual patronage
response. The Wellington rail study used a priority evaluator approach, which presented a shopping list of
service improvements for the respondents to choose from. By including a fare reduction or a travel time
saving in the list, the valuation of the quality attributes can be established.
The reported valuations for most of the studies were converted into:
• equivalent minutes of on-board bus/train time (in-vehicle time)
• the percentage of the average fare paid. Where only fare or in-vehicle time-values were provided, an
‘external’ value of time was used.
All the studies presented average valuations. Six studies segmented the results by either trip length or
time period (or both) but seven studies only provided average valuations. Some studies explored the effect
of user and trip profile on the valuations, but none reported valuations by market segment.
Further details of the research are given in appendix E (section E7).
5.6.3 Mode-specific factors
As noted above, mode-specific factors (MSF), sometimes known as alternative specific constants (ASC),
account for residual qualitative differences in modes as perceived by users after travel times, frequencies
and fares have been taken into account.
In the NGTSM, the MSFs are split into a constant and an in-vehicle time factor. The first component
accounts for differences in ‘accessing (and egressing) the system’ and ‘boarding (and alighting)’ the
vehicle. This reflects the quality of stop/station facilities and aspects of boarding the system (such as
negotiating steps and payment). The in-vehicle time factor accounts for differences in the quality of in-
vehicle travel (such as comfort and air conditioning) and is distance/time related.
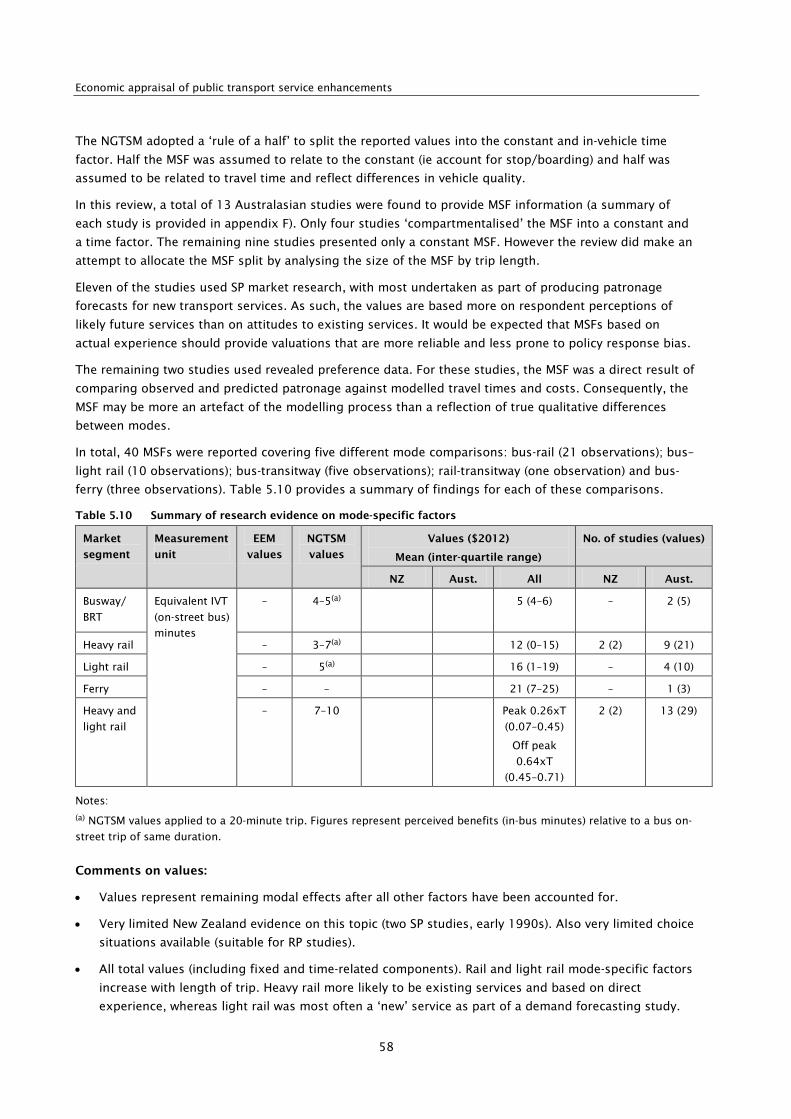
Economic appraisal of public transport service enhancements
58
The NGTSM adopted a ‘rule of a half’ to split the reported values into the constant and in-vehicle time
factor. Half the MSF was assumed to relate to the constant (ie account for stop/boarding) and half was
assumed to be related to travel time and reflect differences in vehicle quality.
In this review, a total of 13 Australasian studies were found to provide MSF information (a summary of
each study is provided in appendix F). Only four studies ‘compartmentalised’ the MSF into a constant and
a time factor. The remaining nine studies presented only a constant MSF. However the review did make an
attempt to allocate the MSF split by analysing the size of the MSF by trip length.
Eleven of the studies used SP market research, with most undertaken as part of producing patronage
forecasts for new transport services. As such, the values are based more on respondent perceptions of
likely future services than on attitudes to existing services. It would be expected that MSFs based on
actual experience should provide valuations that are more reliable and less prone to policy response bias.
The remaining two studies used revealed preference data. For these studies, the MSF was a direct result of
comparing observed and predicted patronage against modelled travel times and costs. Consequently, the
MSF may be more an artefact of the modelling process than a reflection of true qualitative differences
between modes.
In total, 40 MSFs were reported covering five different mode comparisons: bus-rail (21 observations); bus–
light rail (10 observations); bus-transitway (five observations); rail-transitway (one observation) and bus-
ferry (three observations). Table 5.10 provides a summary of findings for each of these comparisons.
Table 5.10 Summary of research evidence on mode-specific factors
Market
segment
Measurement
unit
EEM
values
NGTSM
values
Values ($2012)
Mean (inter-quartile range)
No. of studies (values)
NZ Aust. All NZ Aust.
Busway/
BRT
Equivalent IVT
(on-street bus)
minutes
– 4–5(a) 5 (4–6) – 2 (5)
Heavy rail – 3–7(a) 12 (0–15) 2 (2) 9 (21)
Light rail – 5(a) 16 (1–19) – 4 (10)
Ferry – – 21 (7–25) – 1 (3)
Heavy and
light rail
– 7–10 Peak 0.26xT
(0.07–0.45)
Off peak
0.64xT
(0.45–0.71)
2 (2) 13 (29)
Notes:
(a) NGTSM values applied to a 20-minute trip. Figures represent perceived benefits (in-bus minutes) relative to a bus on-
street trip of same duration.
Comments on values:
• Values represent remaining modal effects after all other factors have been accounted for.
• Very limited New Zealand evidence on this topic (two SP studies, early 1990s). Also very limited choice
situations available (suitable for RP studies).
• All total values (including fixed and time-related components). Rail and light rail mode-specific factors
increase with length of trip. Heavy rail more likely to be existing services and based on direct
experience, whereas light rail was most often a ‘new’ service as part of a demand forecasting study.
5 Review of public transport user benefit parameter values
59
• Caution not to double-count between mode-specific factors values and modal differences in in-vehicle
time and/or quality factors.
• Rail and light rail MSFs were combined and regressed on trip length. For peak, bus mode-specific
factors (relative to heavy and light rail) increased at 0.26xtime; off-peak 0.64xtime. For a 20-minute
trip, bus peak mode-specific factor was worth five minutes and bus off-peak MSF 13 minutes.
Conclusions and recommendations:
• No figures currently included in EEM, although these are an important feature in appraisal of some
major public transport proposals, eg PTSS (AECOM 2012).
• If the EEM is to include values in the short term, we recommend the NGTSM values be used as the
starting point: these values distinguish between a fixed modal component (per boarding) and a
variable component (per in-vehicle minute) based on an assumed 50:50 split.
• Analysis of the surveys being undertaken as part of the Transport Agency’s research project on pricing
strategies for public transport may enable derivation of any modal (bus vs rail) differences in in-vehicle
time. Decisions will be needed as to whether these differences are to be reflected in mode-specific
factor values, or in in-vehicle time values. We note that a market research study being undertaken in
Sydney on bus, (heavy) rail and light rail will establish modal constants and in-vehicle time multipliers:
the results from that research should be reviewed, along with the pricing strategies work, when
considering recommended values.
• If the EEM is to include improved mode-specific factor values, we recommend a more comprehensive
appraisal of evidence, such as:
- a review of international RP and SP evidence
- detailed appraisal of the pricing strategies for public transport research project evidence, to
distinguish modal factors from in-vehicle time and quality differences by mode.
5.7 Recommendations on public transport user benefit parameter values
Based on our assessment of public transport parameter value research evidence (from New Zealand and
Australia) in this chapter, table 5.10 presents our summary of recommendations on values for each user
benefit parameter covered.
The recommendations may be divided into four categories, as follows:
1 In-vehicle time, headway (frequency), vehicle quality and stop/station quality features.
a Recommend that any changes to these parameters in EEM be considered once the public transport
pricing strategies research project is completed
2 Access/egress (walk) time, travel time reliability and seat availability/crowding.
a Recommend no changes in these parameters in EEM (current parameter values more-or-less
consistent with weight of evidence examined).
3 Interchange (wait time and transfer ‘penalty’).
a Recommend changes to both these sub-parameters in the EEM. Also note need for additional
New Zealand-based market research on this aspect (important in the context of service and modal
integration/coordination policies being considered in Auckland, Wellington and other centres).
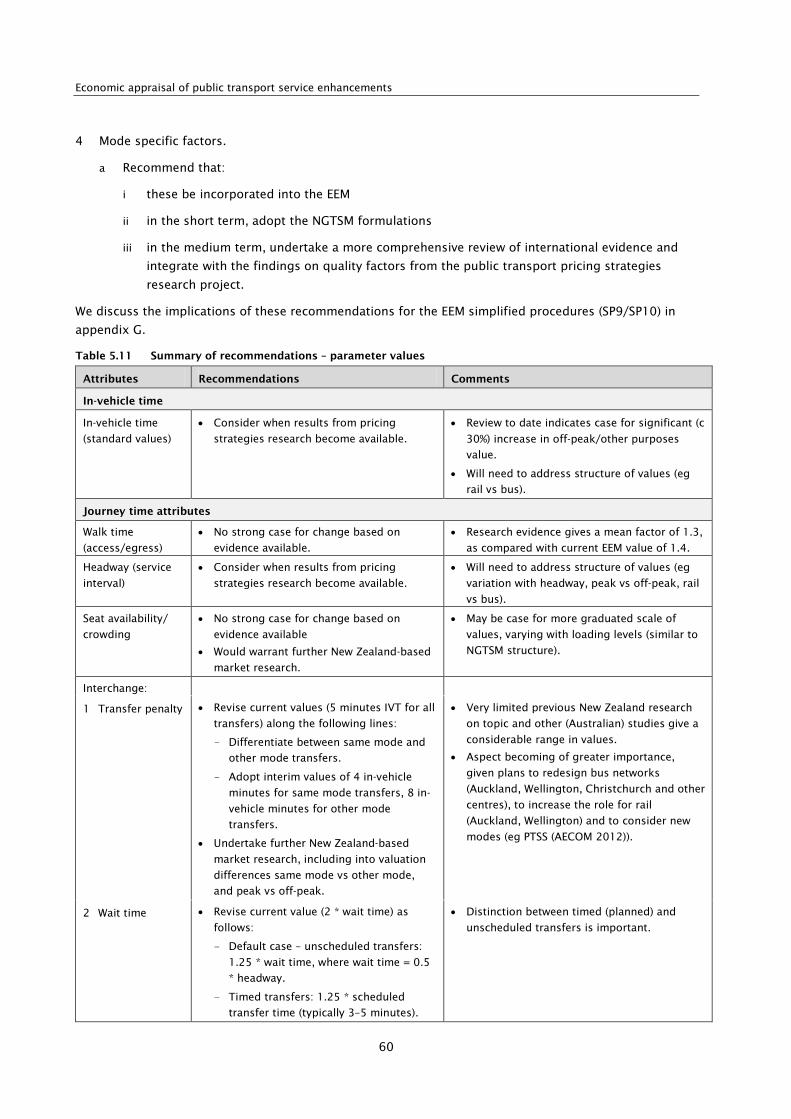
Economic appraisal of public transport service enhancements
60
4 Mode specific factors.
a Recommend that:
i these be incorporated into the EEM
ii in the short term, adopt the NGTSM formulations
iii in the medium term, undertake a more comprehensive review of international evidence and
integrate with the findings on quality factors from the public transport pricing strategies
research project.
We discuss the implications of these recommendations for the EEM simplified procedures (SP9/SP10) in
appendix G.
Table 5.11 Summary of recommendations – parameter values
Attributes Recommendations Comments
In-vehicle time
In-vehicle time
(standard values)
• Consider when results from pricing
strategies research become available.
• Review to date indicates case for significant (c
30%) increase in off-peak/other purposes
value.
• Will need to address structure of values (eg
rail vs bus).
Journey time attributes
Walk time
(access/egress)
• No strong case for change based on
evidence available.
• Research evidence gives a mean factor of 1.3,
as compared with current EEM value of 1.4.
Headway (service
interval)
• Consider when results from pricing
strategies research become available.
• Will need to address structure of values (eg
variation with headway, peak vs off-peak, rail
vs bus).
Seat availability/
crowding
• No strong case for change based on
evidence available
• Would warrant further New Zealand-based
market research.
• May be case for more graduated scale of
values, varying with loading levels (similar to
NGTSM structure).
Interchange:
1 Transfer penalty • Revise current values (5 minutes IVT for all
transfers) along the following lines:
- Differentiate between same mode and
other mode transfers.
- Adopt interim values of 4 in-vehicle
minutes for same mode transfers, 8 in-
vehicle minutes for other mode
transfers.
• Undertake further New Zealand-based
market research, including into valuation
differences same mode vs other mode,
and peak vs off-peak.
• Very limited previous New Zealand research
on topic and other (Australian) studies give a
considerable range in values.
• Aspect becoming of greater importance,
given plans to redesign bus networks
(Auckland, Wellington, Christchurch and other
centres), to increase the role for rail
(Auckland, Wellington) and to consider new
modes (eg PTSS (AECOM 2012)).
2 Wait time • Revise current value (2 * wait time) as
follows:
- Default case – unscheduled transfers:
1.25 * wait time, where wait time = 0.5
* headway.
- Timed transfers: 1.25 * scheduled
transfer time (typically 3–5 minutes).
• Distinction between timed (planned) and
unscheduled transfers is important.
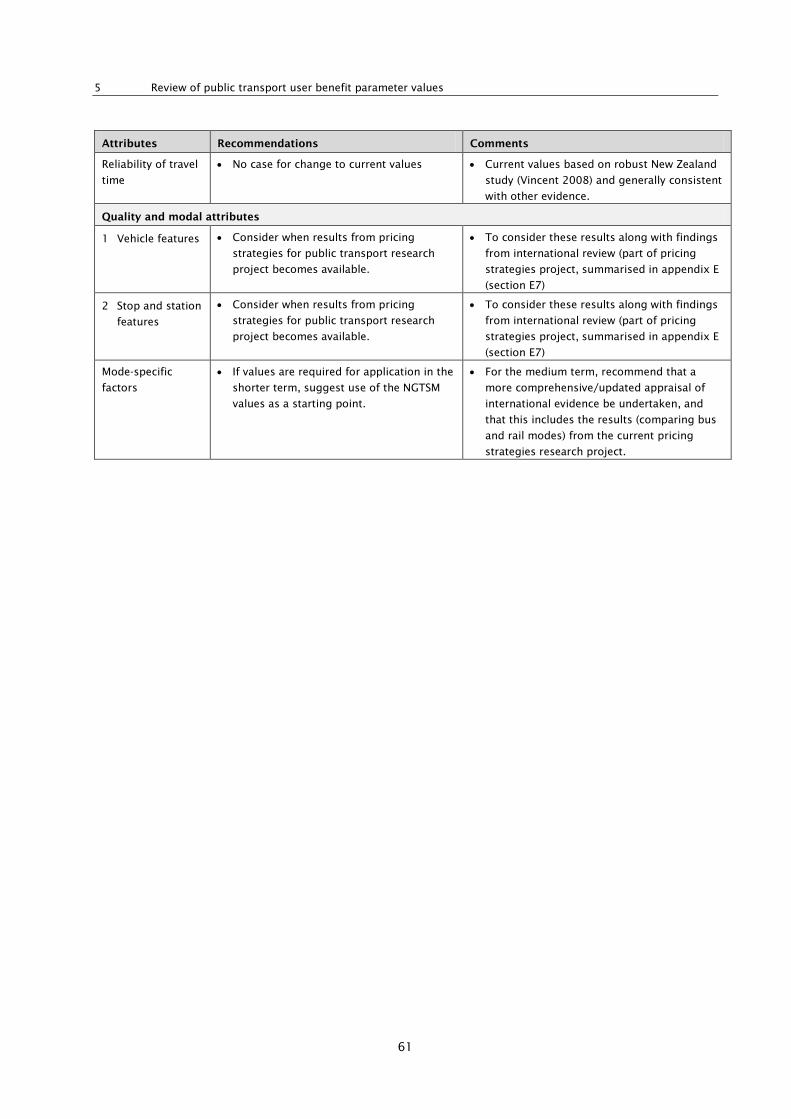
5 Review of public transport user benefit parameter values
61
Attributes Recommendations Comments
Reliability of travel
time
• No case for change to current values • Current values based on robust New Zealand
study (Vincent 2008) and generally consistent
with other evidence.
Quality and modal attributes
1 Vehicle features • Consider when results from pricing
strategies for public transport research
project becomes available.
• To consider these results along with findings
from international review (part of pricing
strategies project, summarised in appendix E
(section E7)
2 Stop and station
features
• Consider when results from pricing
strategies for public transport research
project becomes available.
• To consider these results along with findings
from international review (part of pricing
strategies project, summarised in appendix E
(section E7)
Mode-specific
factors
• If values are required for application in the
shorter term, suggest use of the NGTSM
values as a starting point.
• For the medium term, recommend that a
more comprehensive/updated appraisal of
international evidence be undertaken, and
that this includes the results (comparing bus
and rail modes) from the current pricing
strategies research project.
Economic appraisal of public transport service enhancements
62
6 Application of recommended procedures and parameter values – case study
6.1 Introduction
This research project was tasked with developing recommendations on economic appraisal approaches,
parameters and parameter values appropriate for application in New Zealand to assess the viability of
public transport proposals (in particular service enhancements), and then to assess the effects of applying
these recommendations to a sample New Zealand case study.
It was envisaged that, if a suitable case study could be selected, the case study work could be useful to the
overall project in two main respects. It could be used to illustrate:
• the effects of any recommended changes in relevant parameters and in unit parameter values for a
sample public transport proposal economic appraisal on:
- absolute levels of benefits and hence economic (BCR) performance
- relative levels of benefits/BCR between different options relating to that proposal
− the application of alternative ‘levels of analysis’ (refer chapter 4, table 4.1 in particular) to a single
sample public transport proposal – including shedding light on the relative results obtained, the
relative simplicity/complexity of the alternative methods and particular issues arising in their
application23.
A number of alternative public transport proposals (or proposal types) were considered. The PTSS offered
a number of advantages over other case study candidates, including:
• It is a ‘real world’ proposal rather than an example ‘invented’ for case study purposes.
• It is current and topical, with the economic appraisal work being completed at about the time that the
case study needed to be undertaken.
• The appraisal involves several substantially different options, involving different public transport
modes and network restructuring plans, to address the same problem.
• The appraisal involves detailed transport modelling work, which provided a basis for assessment of
benefits using the full EEM evaluation procedures. It thus provided the opportunity to cover the two main
aspects noted above (ie the impacts of parameter value changes on proposal benefits in both absolute
and relative terms; and comparisons of evaluation methods involving different ‘levels of analysis’).
• The case study findings might also provide additional insights on option performance that could be
useful to the PTSS deliberations.
The remainder of this chapter therefore describes the PTSS case study, demonstrating the potential application
of recommended parameter values (from chapter 5) as well as levels of analysis (from chapter 4). It covers:
• an overview of the PTSS case study (section 6.2)
23 As far as we were able to ascertain, this application of alternative ‘levels of analysis’ to the same public transport
proposal has not previously been undertaken in New Zealand.
6 Application of recommended procedures and parameter values – case study
63
• detailed appraisal of the PTSS options, in terms of the impacts of adopting this project’s
recommended parameter values in place of current EEM values (section 6.3)
• rapid appraisal of the PTSS options, through applying the EEM ‘simplified procedures’ (SP10) in place
of the detailed EEM procedures (section 6.4)
• brief comments on the application of the simple appraisal level of analysis for proposals such as the
PTSS options (section 6.5)
• a summary of conclusions and recommendations from the case study work (section 6.6).
6.2 Overview of case study
6.2.1 The PTSS proposals and economic appraisal scope
The PTSS is essentially a pre-feasibility assessment of options for improving public transport services through
Wellington central business district (CBD): its methodology was to progressively refine and ‘sieve’ options
through a three-stage process, ie long list, medium list and short list. The economic appraisal of the short-list
options involved comparing the following three options against a ‘do minimum’ base (reference) case:
• enhanced bus priority (bus priority option)
• bus rapid transit (BRT option)
• light rail (LRT option).
The PTSS economic appraisal involved detailed modelling of demand and user benefit impacts, using the
Wellington Public Transport Model. Modelling was undertaken separately for AM peak and weekday inter-
peak periods for three representative years (2021, 2031 and 2041). The modelling results were then
applied to assess economic benefits on two bases:
1 Applying ‘behavioural’ benefit parameter values, as used in the model formulation and operation
2 Applying EEM unit benefit values to the model outputs, in terms of ‘generalised’ time savings for each
component of passenger journeys.
For each basis, annual benefits and the present value of benefits (discounted over a 30-year evaluation
period) were derived, broken down between two main benefit components24:
1 Benefits to public transport users (estimated directly as above)
2 Benefits to road system/users (estimated through additional traffic modelling work).
For our case study analyses (described below), we took as our starting point the PTSS estimates of user
benefits (public transport users and road users) for year 2031, based on EEM benefit parameters and their
unit values (adjusted to 2012 prices).
6.2.2 The case study scope and approach
The PTSS level of analysis was considered in terms of the three levels of analysis identified in chapter 4
(detailed, rapid and simple) as follows:
24 In addition, a third component, comprising ‘agglomeration’ benefits, was estimated, in direct proportion to the main
two components. Its consideration was outside the scope of this case study.
Economic appraisal of public transport service enhancements
64
• Type of proposal – the PTSS involved a number of externalities and significant network impacts.
• Cost and risk profile – the PTSS involved consideration of high-cost options and due to its scale and
network impacts could also be considered high risk.
• Stage of assessment – the PTSS followed a multi-stage decision-making process, with the short-list
appraisal being the final assessment stage (leading to the selection of a preferred option, which would
then be subject to further development and appraisal).
The PTSS would therefore most suit a detailed appraisal level of analysis, as per the process set out in
figure 4.4. Earlier stages of assessment might have been suited to rapid appraisal, or if considered to be
only a moderate cost/risk, a single-stage decision-making process might have been followed (still with
detailed appraisal). Should the PTSS have had lesser network impacts and moderate cost/risk, a single-
stage decision-making process with rapid appraisal might have sufficed, and was tested in this case study.
In the light of these considerations, the case study involved two main appraisals, both starting from the
PTSS economic appraisal outlined above:
1 ‘Detailed appraisal’ – using full EEM procedures to assess the effects of replacing current EEM
parameter values with the preferred parameter values from chapter 525
2 ‘Rapid appraisal’ – using EEM simplified procedures (SP10 – existing passenger transport services) as
an alternative to the detailed appraisal procedures (using EEM parameter values in both cases). This
assessed the implications of applying alternative levels of analysis (as noted in section 6.1).
In the following sections, we describe the case study work on detailed appraisal (section 6.3) and rapid
appraisal (section 6.4). We have not attempted to apply the ‘simple appraisal’ level of analysis in the case
study (refer section 6.5), as this level of analysis is not suited to, or appropriate for, such a relatively high-
cost/high-risk project.
6.3 Detailed appraisal – implications of recommended parameter values for the EEM
6.3.1 Details of parameter values tested
This ‘sensitivity test’ assessed the effects on public transport user benefit estimates of replacing the EEM
unit parameter values (as used in the PTSS appraisal) with the recommended/preferred values from this
project’s research (refer chapter 5). Table 6.1 sets out the two sets of parameter values for the parameters
where these differ.26
25 For those parameters for which no recommendations on appropriate values had been made (while awaiting the
impending completion of the pricing public transport strategies research project), we used the ’preferred’ parameter
values that we would have recommended based on this project’s parameter value research. 26 In regard to the base (in-vehicle) value of time, we adopted the EEM average (peak/off-peak) value for public
transport (seated) passengers of $5.31/hour ($2012). However, the PTSS appraisal actually adopted a value of about
$10.50/hour, based on a weighted average of EEM values for car drivers and car passengers, by trip purposes. In our
view, this approach was not appropriate for the PTSS project, based on EEM guidelines, and therefore the lower EEM
(public transport) values were applied in the case study for the EEM methodology.
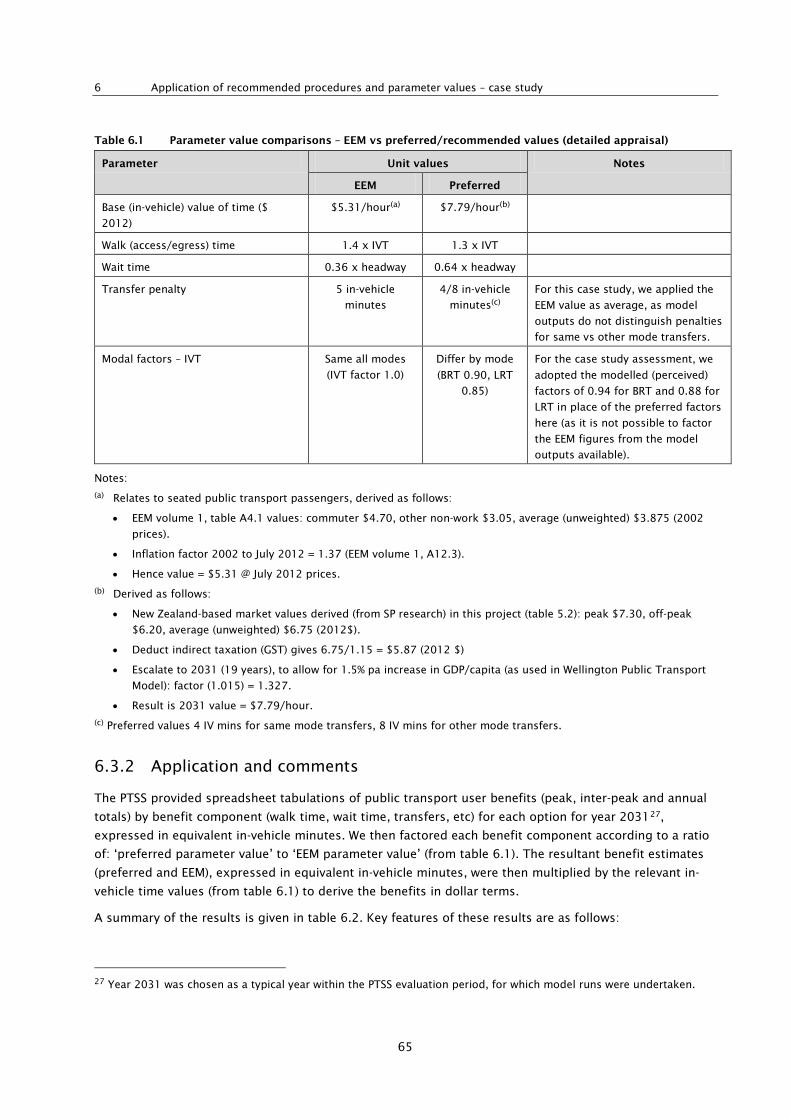
6 Application of recommended procedures and parameter values – case study
65
Table 6.1 Parameter value comparisons – EEM vs preferred/recommended values (detailed appraisal)
Parameter Unit values Notes
EEM Preferred
Base (in-vehicle) value of time ($
2012)
$5.31/hour(a) $7.79/hour(b)
Walk (access/egress) time 1.4 x IVT 1.3 x IVT
Wait time 0.36 x headway 0.64 x headway
Transfer penalty 5 in-vehicle
minutes
4/8 in-vehicle
minutes(c)
For this case study, we applied the
EEM value as average, as model
outputs do not distinguish penalties
for same vs other mode transfers.
Modal factors – IVT Same all modes
(IVT factor 1.0)
Differ by mode
(BRT 0.90, LRT
0.85)
For the case study assessment, we
adopted the modelled (perceived)
factors of 0.94 for BRT and 0.88 for
LRT in place of the preferred factors
here (as it is not possible to factor
the EEM figures from the model
outputs available).
Notes:
(a) Relates to seated public transport passengers, derived as follows:
• EEM volume 1, table A4.1 values: commuter $4.70, other non-work $3.05, average (unweighted) $3.875 (2002
prices).
• Inflation factor 2002 to July 2012 = 1.37 (EEM volume 1, A12.3).
• Hence value = $5.31 @ July 2012 prices.
(b) Derived as follows:
• New Zealand-based market values derived (from SP research) in this project (table 5.2): peak $7.30, off-peak
$6.20, average (unweighted) $6.75 (2012$).
• Deduct indirect taxation (GST) gives 6.75/1.15 = $5.87 (2012 $)
• Escalate to 2031 (19 years), to allow for 1.5% pa increase in GDP/capita (as used in Wellington Public Transport
Model): factor (1.015) = 1.327.
• Result is 2031 value = $7.79/hour.
(c) Preferred values 4 IV mins for same mode transfers, 8 IV mins for other mode transfers.
6.3.2 Application and comments
The PTSS provided spreadsheet tabulations of public transport user benefits (peak, inter-peak and annual
totals) by benefit component (walk time, wait time, transfers, etc) for each option for year 203127,
expressed in equivalent in-vehicle minutes. We then factored each benefit component according to a ratio
of: ‘preferred parameter value’ to ‘EEM parameter value’ (from table 6.1). The resultant benefit estimates
(preferred and EEM), expressed in equivalent in-vehicle minutes, were then multiplied by the relevant in-
vehicle time values (from table 6.1) to derive the benefits in dollar terms.
A summary of the results is given in table 6.2. Key features of these results are as follows:
27 Year 2031 was chosen as a typical year within the PTSS evaluation period, for which model runs were undertaken.

Economic appraisal of public transport service enhancements
66
• In terms of generalised time (equivalent in-vehicle minutes), the combined effects of the above
sensitivity changes varies considerably between the options, depending on their mix of changes in
walking time, waiting time and transfers. The combined effects vary between an increase in
generalised time savings of some 4% (BRT option) and a reduction of around 9% (LRT option).
• In terms of total public transport user benefits (allowing for the different unit values of time), the
combined effects of the recommended parameter changes are to increase the benefits for all three
options – by between 53% (BRT option) and 34% (LRT option). The ranking of the three options, in
terms of total benefits, is unchanged.
• On an incremental basis, the results are more mixed. Relative to the lowest cost (bus priority) option,
the incremental user benefits for the BRT option increase by 54%, while those for the LRT option
increase by only 15%. However, the incremental benefits of the BRT option over the LRT option
increase by 85%.
These case study analyses showed that the effects on benefits, expressed in total generalised time
savings, of adopting our preferred parameter formulations and values in place of EEM values were mixed,
varying between modest increases (BRT +4%) and modest decreases (LRT -9%). When these total
generalised time savings were multiplied by the relevant values of (in-vehicle) time, use of our preferred
parameter values resulted in higher public transport user benefits than with EEM parameter values, for the
three options: the increases ranged from 34% to 53% across the options. When comparing benefits
between options (incremental analysis), the increases in the values ranged more widely, between 15% and
85%. We note that, in this case, the increase in the base value of time in our preferred values set (about
47%) produced greater changes in the benefit results than the net effect of the various adjustments
affecting the benefits in terms of in-vehicle minutes.
Table 6.2 Summary of evaluation results – public transport user benefit parameters (EEM vs preferred)(a)
Option Benefits – GC(b) mins (000pa) Ave values of IVT ($/hr) Benefits – $Mpa
EEM Preferred % incr EEM Preferred % incr EEM Preferred % incr
Priority 22,725 23,412 3,0% 5.31 7.79 46.7% 2.01 3.04 51.1%
LRT 44,333 40,386 -8.9% 5.31 7.79 46.7% 3.92 5.24 33.6%
BRT 70,751 73,721 4.2% 5.31 7.79 46.7% 6.26 9.57 52.9%
LRT – priority 21,608 16,974 -21.4% 1.91 2.20 15.2%
BRT – LRT 26,418 33,335 26.2% 2.34 4.33 85.1%
BRT – priority 48,026 50,309 4.8% 4.25 6.53 53.7%
Note: (a) All figures cover both existing and new users, including fare correction for new users (but not vehicle operating cost
correction). (b) GC = generalised cost
6.3.3 Conclusion on effects of applying recommended parameter values
We would be cautious about generalising from these case study results. However, we would expect that:
• In general, benefits would increase somewhat if our preferred values were adopted: the higher values
of in-vehicle time would be a major contributor to this (particularly over the medium/longer term).
• Schemes that involve increasing service frequencies would be particularly advantaged. Our preferred
headway parameter (applying to service frequencies) is approaching 80% higher than that incorporated
in the EEM.
6 Application of recommended procedures and parameter values – case study
67
• For the PTSS options appraised, the largest component of the increase in benefits (in absolute terms)
relates to the in-vehicle time savings.
We conclude that adoption of our preferred set of public transport user benefit parameter values (from
chapter 5), in place of the EEM values, is likely to make material differences to ‘detailed’ economic
appraisal results for public transport proposals, in both absolute and relative terms, including:
• generally resulting in increased benefits
• benefiting some types of proposals more than others
• potentially, in some cases, affecting the ranking of (mutually exclusive) options, in terms of their
relative benefits, incremental benefits and hence benefit/cost ratios.
6.4 Rapid appraisal – comparison of EEM simplified procedures (SP10) with detailed appraisal results
6.4.1 Details of scope and methodology
This part of the case study task involved comparisons between the PTSS ‘detailed appraisal’ methods and
results (using full EEM procedures) and the methods and results from using ‘rapid appraisal’ procedures
(the EEM simplified procedures SP10), starting from the same base data in each case.
The purposes of these comparisons were to examine (on a case study basis):
• the ‘accuracy’ of the SP10 procedures as a means of assessing economic benefits as compared with
the full EEM procedures
• issues arising in the application of rapid appraisal procedures, such as SP10.
The starting point for this assessment was the PTSS demand modelling and detailed economic appraisal of
the PTSS options and specifically the 2031 estimates for user benefits (used in full procedures) and
patronage changes (used in SP10).
The EEM volume 2 states that SP10 ‘…provides a simplified method for appraising the costs and benefits
of activities to improve an existing passenger transport service through the provision of capital
infrastructure and/or service improvements’. The procedure provides estimates of scheme benefits in four
categories (refer appendix G, section G1 for further details):
1 Road traffic user benefits (RUB)
2 Public transport user benefits (PTUB) – time and costs
3 Public transport user benefits (PTUB) – reliability
4 Public transport user benefits (PTUB) – quality factors.
The PTSS did not assess public transport reliability benefits. In regard to public transport quality factors,
these were included within its time and costs category, although not in a detailed manner. The PTSS
covered quality differences between public transport modes (bus priority vs BRT vs LRT) at a generalised
level, through the values placed on in-vehicle time and boarding time for each mode. Thus our
comparative assessment of SP10 with detailed EEM procedures for the PTSS options essentially covered
public transport user time, cost and quality benefits (PTUB) and road traffic benefits (RUB).
This rapid appraisal test compared the results for:
Economic appraisal of public transport service enhancements
68
• the EEM detailed appraisal (undertaken as part of the PTSS), is used as the baseline in section 6.3/
table 6.2 above
• application of the EEM simplified procedures SP10 to the PTSS outputs (undertaken as part of this project).
In effect, the test compared the effects of applying ‘full’ and simplified EEM procedures to an example
scheme (in both cases using current EEM parameter values rather than the preferred parameter values
from this project)28.
The key inputs required in the application of SP10 are:
• forecast number of new public transport trips resulting from the proposed project, split between bus
and rail modes (reflecting the different average trip lengths on each mode)
• unit benefit rates, expressed per new user, by bus and rail (and split between peak and off-peak
periods). These are specified in table 1 of the SP10 documentation (EEM volume 2).
The outputs are the total economic benefits of the project, split between public transport user benefits
(PTUB) and road user benefits (RUB), the latter relating to the effects of road traffic reduction (eg
congestion relief and associated environmental benefits), resulting from people switching from car to
public transport as a result of the project.
6.4.2 Application of EEM simplified procedures (SP10)
Table 6.3 shows our summary of SP10 benefit estimates for year 2031 covering both peak and off-peak
periods, and separating the PTUB and RUB components. The SP10 procedures (SP10, table 1) give unit
benefit rates for Wellington schemes, according to whether the new users use predominantly bus services,
predominantly rail services, or a mixture of these two modes: this distinction is made primarily to reflect
the different trip lengths typically involved, rather than any intrinsic differences in modal characteristics29.
Given that most new public transport users attracted by the spine options are likely to be making relatively
short distance trips, we consider it most appropriate to use the SP10 bus value, but also show the all
(public transport) modes value for comparison.
The results are perhaps notable in that, for all options, the RUB benefits are similar in magnitude to the
PTUB benefits. In our experience, this is a relatively high proportion of RUB benefits for significant
metropolitan public transport schemes; it would appear to reflect the relatively high proportion of total
scheme benefits that relate to peak period travel, partly offset by the relatively low proportion of new
public transport users.
28 It is not readily possible to determine the effects, if any, on the SP10 unit parameter values of introducing the
parameter value changes recommended in this report.
29 SP10 notes that ‘The…values are based on public transport trips of average length for each urban area or mode.
Where the values…do not accurately represent local conditions, you should provide additional information that shows
what values have been used and whether these have been calibrated to local conditions’.
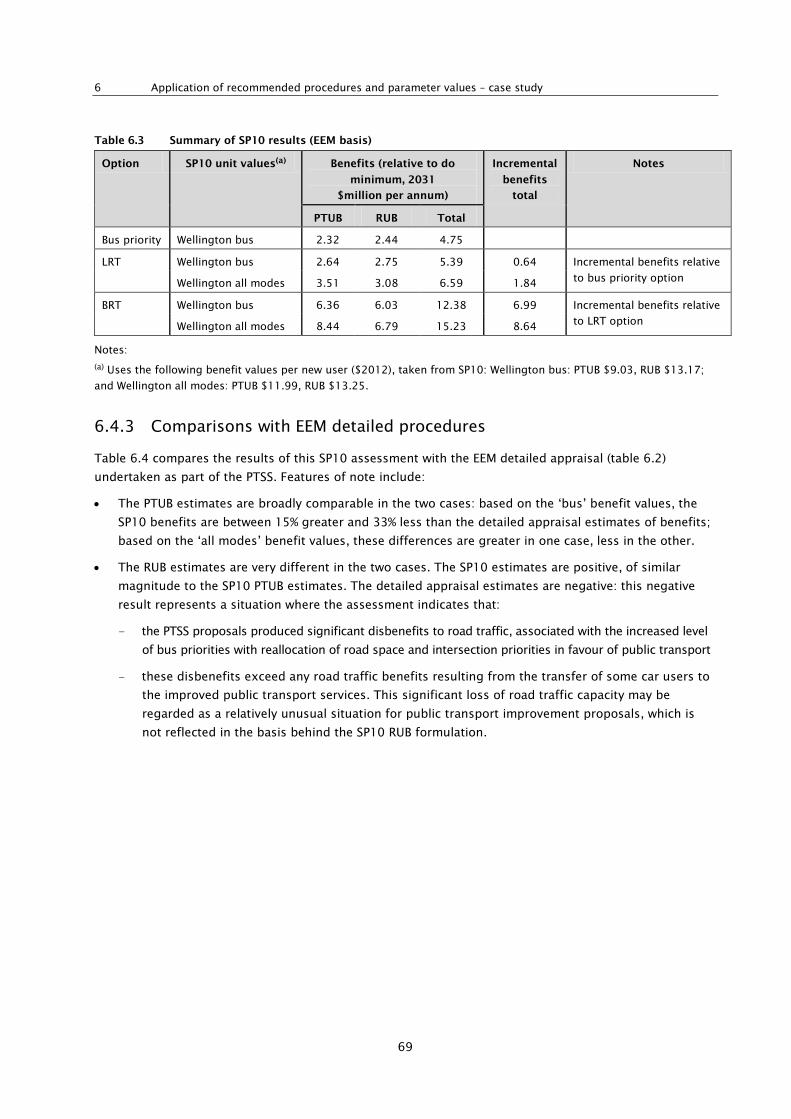
6 Application of recommended procedures and parameter values – case study
69
Table 6.3 Summary of SP10 results (EEM basis)
Option SP10 unit values(a) Benefits (relative to do
minimum, 2031
$million per annum)
Incremental
benefits
total
Notes
PTUB RUB Total
Bus priority Wellington bus 2.32 2.44 4.75
LRT
Wellington bus 2.64 2.75 5.39 0.64 Incremental benefits relative
to bus priority option Wellington all modes 3.51 3.08 6.59 1.84
BRT
Wellington bus 6.36 6.03 12.38 6.99 Incremental benefits relative
to LRT option Wellington all modes 8.44 6.79 15.23 8.64
Notes:
(a) Uses the following benefit values per new user ($2012), taken from SP10: Wellington bus: PTUB $9.03, RUB $13.17;
and Wellington all modes: PTUB $11.99, RUB $13.25.
6.4.3 Comparisons with EEM detailed procedures
Table 6.4 compares the results of this SP10 assessment with the EEM detailed appraisal (table 6.2)
undertaken as part of the PTSS. Features of note include:
• The PTUB estimates are broadly comparable in the two cases: based on the ‘bus’ benefit values, the
SP10 benefits are between 15% greater and 33% less than the detailed appraisal estimates of benefits;
based on the ‘all modes’ benefit values, these differences are greater in one case, less in the other.
• The RUB estimates are very different in the two cases. The SP10 estimates are positive, of similar
magnitude to the SP10 PTUB estimates. The detailed appraisal estimates are negative: this negative
result represents a situation where the assessment indicates that:
- the PTSS proposals produced significant disbenefits to road traffic, associated with the increased level
of bus priorities with reallocation of road space and intersection priorities in favour of public transport
- these disbenefits exceed any road traffic benefits resulting from the transfer of some car users to
the improved public transport services. This significant loss of road traffic capacity may be
regarded as a relatively unusual situation for public transport improvement proposals, which is
not reflected in the basis behind the SP10 RUB formulation.
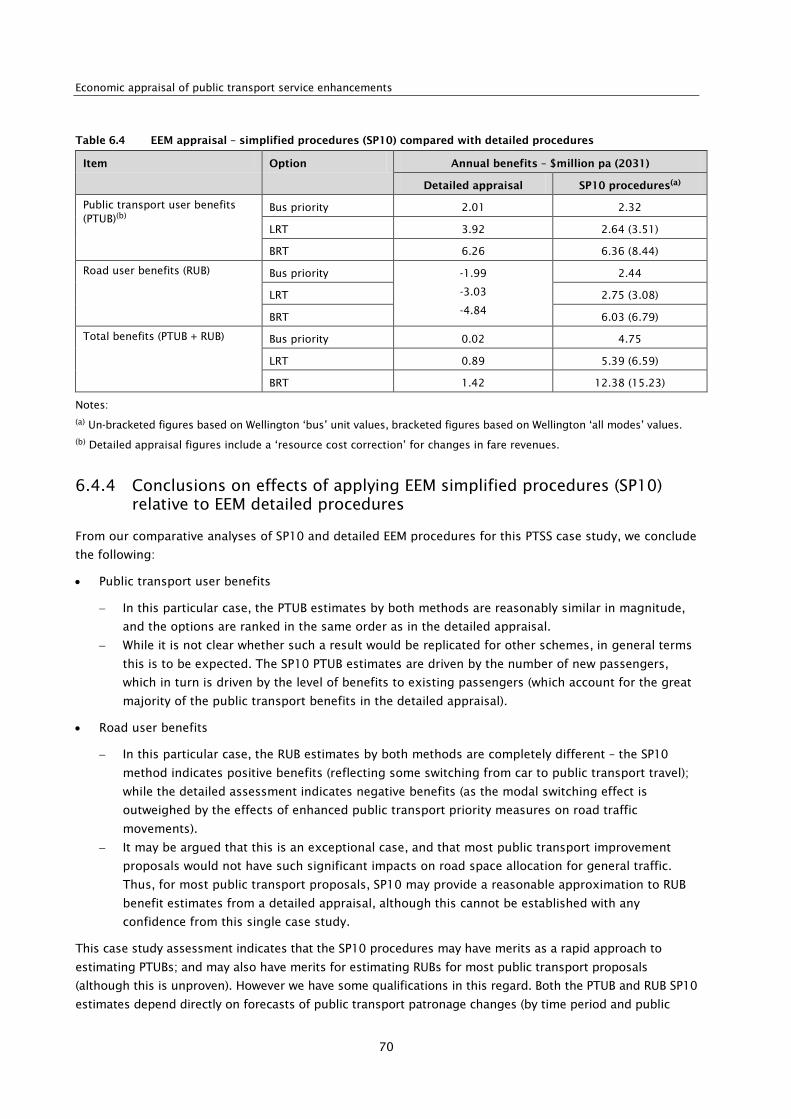
Economic appraisal of public transport service enhancements
70
Table 6.4 EEM appraisal – simplified procedures (SP10) compared with detailed procedures
Item Option Annual benefits – $million pa (2031)
Detailed appraisal SP10 procedures(a)
Public transport user benefits (PTUB)(b)
Bus priority 2.01 2.32
LRT 3.92 2.64 (3.51)
BRT 6.26 6.36 (8.44)
Road user benefits (RUB) Bus priority -1.99
-3.03
-4.84
2.44
LRT 2.75 (3.08)
BRT 6.03 (6.79)
Total benefits (PTUB + RUB) Bus priority 0.02 4.75
LRT 0.89 5.39 (6.59)
BRT 1.42 12.38 (15.23)
Notes:
(a) Un-bracketed figures based on Wellington ‘bus’ unit values, bracketed figures based on Wellington ‘all modes’ values.
(b) Detailed appraisal figures include a ‘resource cost correction’ for changes in fare revenues.
6.4.4 Conclusions on effects of applying EEM simplified procedures (SP10) relative to EEM detailed procedures
From our comparative analyses of SP10 and detailed EEM procedures for this PTSS case study, we conclude
the following:
• Public transport user benefits
− In this particular case, the PTUB estimates by both methods are reasonably similar in magnitude,
and the options are ranked in the same order as in the detailed appraisal.
− While it is not clear whether such a result would be replicated for other schemes, in general terms
this is to be expected. The SP10 PTUB estimates are driven by the number of new passengers,
which in turn is driven by the level of benefits to existing passengers (which account for the great
majority of the public transport benefits in the detailed appraisal).
• Road user benefits
− In this particular case, the RUB estimates by both methods are completely different – the SP10
method indicates positive benefits (reflecting some switching from car to public transport travel);
while the detailed assessment indicates negative benefits (as the modal switching effect is
outweighed by the effects of enhanced public transport priority measures on road traffic
movements).
− It may be argued that this is an exceptional case, and that most public transport improvement
proposals would not have such significant impacts on road space allocation for general traffic.
Thus, for most public transport proposals, SP10 may provide a reasonable approximation to RUB
benefit estimates from a detailed appraisal, although this cannot be established with any
confidence from this single case study.
This case study assessment indicates that the SP10 procedures may have merits as a rapid approach to
estimating PTUBs; and may also have merits for estimating RUBs for most public transport proposals
(although this is unproven). However we have some qualifications in this regard. Both the PTUB and RUB SP10
estimates depend directly on forecasts of public transport patronage changes (by time period and public
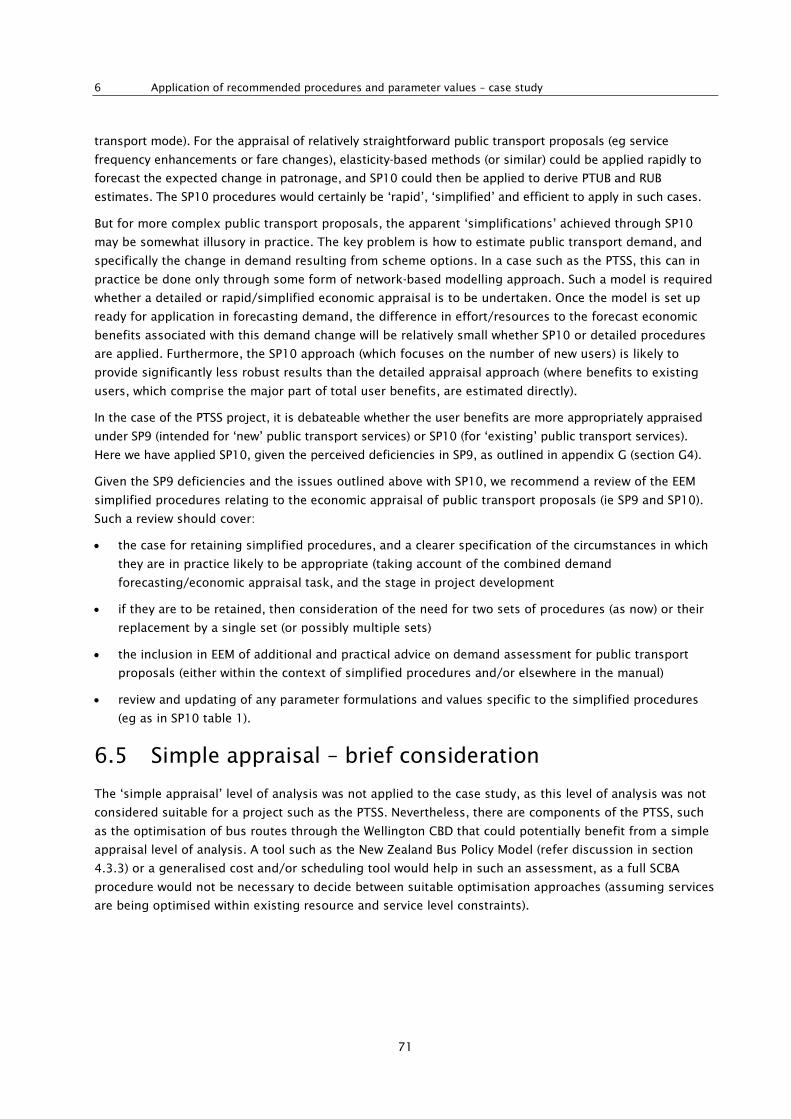
6 Application of recommended procedures and parameter values – case study
71
transport mode). For the appraisal of relatively straightforward public transport proposals (eg service
frequency enhancements or fare changes), elasticity-based methods (or similar) could be applied rapidly to
forecast the expected change in patronage, and SP10 could then be applied to derive PTUB and RUB
estimates. The SP10 procedures would certainly be ‘rapid’, ‘simplified’ and efficient to apply in such cases.
But for more complex public transport proposals, the apparent ‘simplifications’ achieved through SP10
may be somewhat illusory in practice. The key problem is how to estimate public transport demand, and
specifically the change in demand resulting from scheme options. In a case such as the PTSS, this can in
practice be done only through some form of network-based modelling approach. Such a model is required
whether a detailed or rapid/simplified economic appraisal is to be undertaken. Once the model is set up
ready for application in forecasting demand, the difference in effort/resources to the forecast economic
benefits associated with this demand change will be relatively small whether SP10 or detailed procedures
are applied. Furthermore, the SP10 approach (which focuses on the number of new users) is likely to
provide significantly less robust results than the detailed appraisal approach (where benefits to existing
users, which comprise the major part of total user benefits, are estimated directly).
In the case of the PTSS project, it is debateable whether the user benefits are more appropriately appraised
under SP9 (intended for ‘new’ public transport services) or SP10 (for ‘existing’ public transport services).
Here we have applied SP10, given the perceived deficiencies in SP9, as outlined in appendix G (section G4).
Given the SP9 deficiencies and the issues outlined above with SP10, we recommend a review of the EEM
simplified procedures relating to the economic appraisal of public transport proposals (ie SP9 and SP10).
Such a review should cover:
• the case for retaining simplified procedures, and a clearer specification of the circumstances in which
they are in practice likely to be appropriate (taking account of the combined demand
forecasting/economic appraisal task, and the stage in project development
• if they are to be retained, then consideration of the need for two sets of procedures (as now) or their
replacement by a single set (or possibly multiple sets)
• the inclusion in EEM of additional and practical advice on demand assessment for public transport
proposals (either within the context of simplified procedures and/or elsewhere in the manual)
• review and updating of any parameter formulations and values specific to the simplified procedures
(eg as in SP10 table 1).
6.5 Simple appraisal – brief consideration
The ‘simple appraisal’ level of analysis was not applied to the case study, as this level of analysis was not
considered suitable for a project such as the PTSS. Nevertheless, there are components of the PTSS, such
as the optimisation of bus routes through the Wellington CBD that could potentially benefit from a simple
appraisal level of analysis. A tool such as the New Zealand Bus Policy Model (refer discussion in section
4.3.3) or a generalised cost and/or scheduling tool would help in such an assessment, as a full SCBA
procedure would not be necessary to decide between suitable optimisation approaches (assuming services
are being optimised within existing resource and service level constraints).
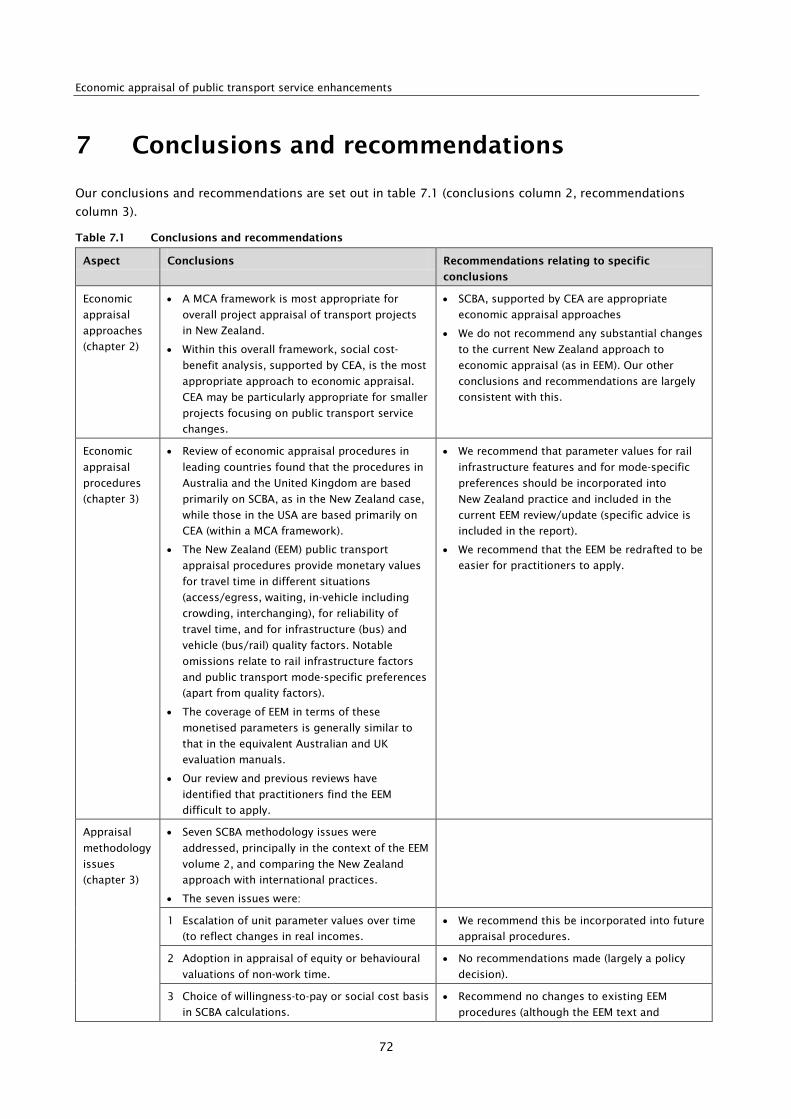
Economic appraisal of public transport service enhancements
72
7 Conclusions and recommendations
Our conclusions and recommendations are set out in table 7.1 (conclusions column 2, recommendations
column 3).
Table 7.1 Conclusions and recommendations
Aspect Conclusions Recommendations relating to specific
conclusions
Economic
appraisal
approaches
(chapter 2)
• A MCA framework is most appropriate for
overall project appraisal of transport projects
in New Zealand.
• Within this overall framework, social cost-
benefit analysis, supported by CEA, is the most
appropriate approach to economic appraisal.
CEA may be particularly appropriate for smaller
projects focusing on public transport service
changes.
• SCBA, supported by CEA are appropriate
economic appraisal approaches
• We do not recommend any substantial changes
to the current New Zealand approach to
economic appraisal (as in EEM). Our other
conclusions and recommendations are largely
consistent with this.
Economic
appraisal
procedures
(chapter 3)
• Review of economic appraisal procedures in
leading countries found that the procedures in
Australia and the United Kingdom are based
primarily on SCBA, as in the New Zealand case,
while those in the USA are based primarily on
CEA (within a MCA framework).
• The New Zealand (EEM) public transport
appraisal procedures provide monetary values
for travel time in different situations
(access/egress, waiting, in-vehicle including
crowding, interchanging), for reliability of
travel time, and for infrastructure (bus) and
vehicle (bus/rail) quality factors. Notable
omissions relate to rail infrastructure factors
and public transport mode-specific preferences
(apart from quality factors).
• The coverage of EEM in terms of these
monetised parameters is generally similar to
that in the equivalent Australian and UK
evaluation manuals.
• Our review and previous reviews have
identified that practitioners find the EEM
difficult to apply.
• We recommend that parameter values for rail
infrastructure features and for mode-specific
preferences should be incorporated into
New Zealand practice and included in the
current EEM review/update (specific advice is
included in the report).
• We recommend that the EEM be redrafted to be
easier for practitioners to apply.
Appraisal
methodology
issues
(chapter 3)
• Seven SCBA methodology issues were
addressed, principally in the context of the EEM
volume 2, and comparing the New Zealand
approach with international practices.
• The seven issues were:
1 Escalation of unit parameter values over time
(to reflect changes in real incomes.
• We recommend this be incorporated into future
appraisal procedures.
2 Adoption in appraisal of equity or behavioural
valuations of non-work time.
• No recommendations made (largely a policy
decision).
3 Choice of willingness-to-pay or social cost basis
in SCBA calculations.
• Recommend no changes to existing EEM
procedures (although the EEM text and

7 Conclusions and recommendations
73
Aspect Conclusions Recommendations relating to specific
conclusions
4 Choice of market price or factor cost units of
account.
presentation could usefully be enhanced).
5 Treatment of key benefit and cost items in
deriving SCBA decision criteria (NPV, BCR etc)
• Recommend clarification in EEM of the roles for
BCRN and BCRG for public transport schemes,
and on a number of other aspects.
6 Discount rate.
7 Analysis period.
• No recommendations made as these aspects
are not specific to public transport and are
being addressed in a wider context.
Application
of
procedures
(chapter 4)
• Identified three key considerations for
determining an appropriate level of analysis: type
of proposal, cost and risk profile, and stage of
assessment (within the decision-making process).
• Three levels of analysis that might be used in
the economic appraisal of public transport
proposals were identified:
1 ‘Detailed appraisal’ based on full SCBA
2 ‘Rapid appraisal’ based on SCBA with
simplified consideration of externalities
3 ‘Simple appraisal’ based on CEA and
including operating costs, patronage and
revenue impacts.
• Recommend the appraisal method for public
transport proposals be tailored to ensure an
appropriate level of analysis, based on a
consideration of the type of proposal, cost and
risk profile, and stage of the assessment within
the decision-making process.
• Recommend further research on the selection
of an appropriate level of analysis, based on
relevant decision-making requirements.
• Recommend further research to determine the
extent to which rapid appraisal procedures
might differ for single-stage and multi-stage
decision-making processes.
Parameter
values
(chapter 5)
• Undertook an in-depth analysis of evidence on
public transport parameter values from market
research undertaken since 1990 (principally
using SP surveys) in Australia (28 studies) and
New Zealand (7 studies), covering the following
parameters: values of travel time in a range of
situations (access/egress, waiting, in-vehicle
including crowding, interchanging), reliability
of travel time and vehicle and stop/station
quality factors (the latter factors are the focus
of a concurrent Transport Agency market
research project).
• For each parameter, conclusions were drawn
on the mean and distribution of values, any
differences between New Zealand and
Australian values, values by various market
segments (eg public transport mode, peak vs
off-peak), and any changes in values over time
(where applicable). Comparisons were made
with current New Zealand (EEM) and Australian
(NGTSM) values.
• In-vehicle time, headway (frequency), vehicle
quality and stop/station quality features.
Recommend that any changes to these
parameters in EEM be considered once the
public transport pricing strategies research
project is completed (refer section 5.6)
• Access/egress (walk) time, travel time
reliability and seat availability/crowding.
Recommend no changes in these parameters in
EEM (current parameter values more-or-less
consistent with weight of evidence examined).
• Interchange (wait time and transfer
‘penalty’). Recommend changes to both these
sub-parameters in the EEM. Also note need for
additional New Zealand-based market research
on this aspect (important in the context of
service and modal integration/coordination
policies being considered in Auckland,
Wellington and other centres).
• Mode-specific factors. Recommend that:
- these be incorporated into the EEM
- in the short term, adopt the NGTSM
formulations
- in the medium term, undertake a more
comprehensive review of international
evidence and integrate with the findings on
quality factors from the public transport
pricing strategies project.
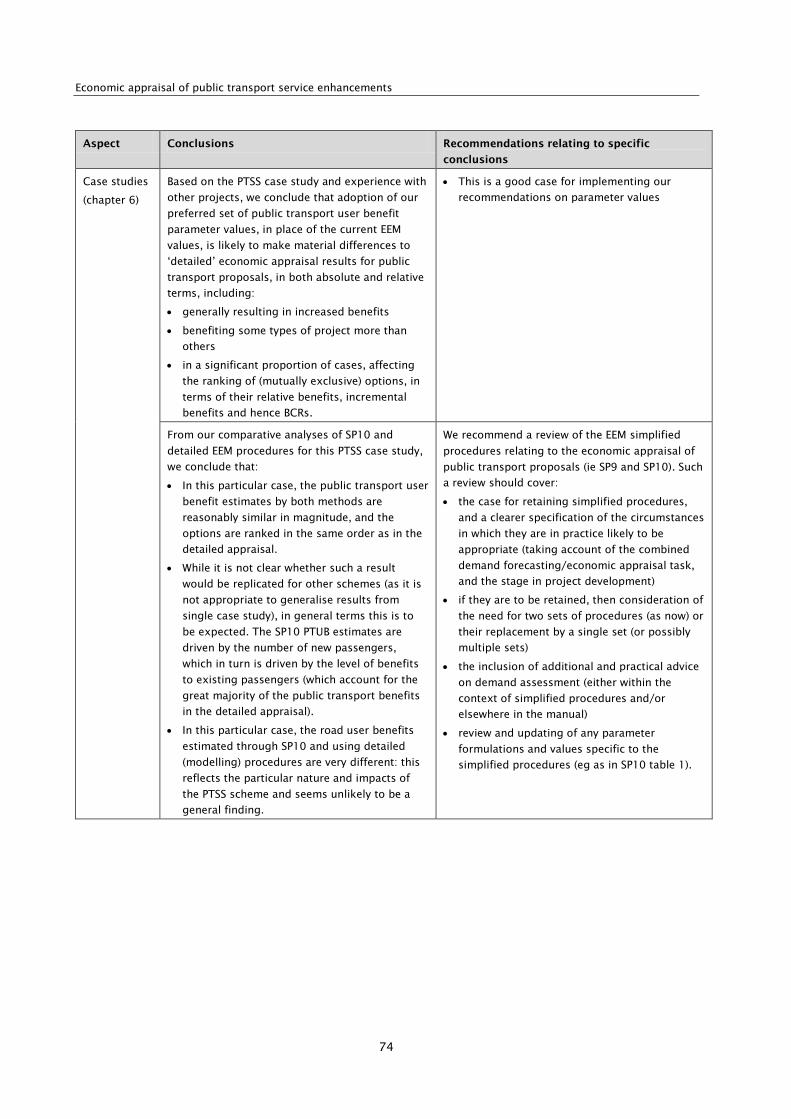
Economic appraisal of public transport service enhancements
74
Aspect Conclusions Recommendations relating to specific
conclusions
Case studies
(chapter 6)
Based on the PTSS case study and experience with
other projects, we conclude that adoption of our
preferred set of public transport user benefit
parameter values, in place of the current EEM
values, is likely to make material differences to
‘detailed’ economic appraisal results for public
transport proposals, in both absolute and relative
terms, including:
• generally resulting in increased benefits
• benefiting some types of project more than
others
• in a significant proportion of cases, affecting
the ranking of (mutually exclusive) options, in
terms of their relative benefits, incremental
benefits and hence BCRs.
• This is a good case for implementing our
recommendations on parameter values
From our comparative analyses of SP10 and
detailed EEM procedures for this PTSS case study,
we conclude that:
• In this particular case, the public transport user
benefit estimates by both methods are
reasonably similar in magnitude, and the
options are ranked in the same order as in the
detailed appraisal.
• While it is not clear whether such a result
would be replicated for other schemes (as it is
not appropriate to generalise results from
single case study), in general terms this is to
be expected. The SP10 PTUB estimates are
driven by the number of new passengers,
which in turn is driven by the level of benefits
to existing passengers (which account for the
great majority of the public transport benefits
in the detailed appraisal).
• In this particular case, the road user benefits
estimated through SP10 and using detailed
(modelling) procedures are very different: this
reflects the particular nature and impacts of
the PTSS scheme and seems unlikely to be a
general finding.
We recommend a review of the EEM simplified
procedures relating to the economic appraisal of
public transport proposals (ie SP9 and SP10). Such
a review should cover:
• the case for retaining simplified procedures,
and a clearer specification of the circumstances
in which they are in practice likely to be
appropriate (taking account of the combined
demand forecasting/economic appraisal task,
and the stage in project development)
• if they are to be retained, then consideration of
the need for two sets of procedures (as now) or
their replacement by a single set (or possibly
multiple sets)
• the inclusion of additional and practical advice
on demand assessment (either within the
context of simplified procedures and/or
elsewhere in the manual)
• review and updating of any parameter
formulations and values specific to the
simplified procedures (eg as in SP10 table 1).
8 References
75
8 References
8.1 Appraisal approaches and procedures
AECOM (2012) Wellington public transport spine study: inception and scoping report. Wellington, New
Zealand: Greater Wellington Regional Council. www.gw.govt.nz/ptspinestudy-2/
Ashford, A and T Van Geldermalsen (2007). Review of economic evaluation procedures for passenger
transport. Wellington, New Zealand: Land Transport NZ.
Australian Transport Council (ATC) (2006a) National guidelines for transport system management in
Australia. Volume 2: Strategic transport planning and development. Canberra: ATC.
Australian Transport Council (ATC) (2006b) National guidelines for transport system management in
Australia. Canberra: ATC.
Australian Transport Council (ATC) (2006c) National guidelines for transport system management in
Australia. Volume 3: Appraisal of initiatives. Canberra: ATC.
Australian Transport Council (ATC) (2006d) National guidelines for transport system management in
Australia. Volume 1: Introduction to the guidelines and framework. Canberra: ATC.
Australian Transport Council (2006e) National guidelines for transport system management in Australia.
Volume 4: Urban transport. Canberra: ATC.
Bureau of Transport Economics (BTE) (1999) Facts and furphies in benefit-cost analysis: transport.
Canberra: BTE.
Cambridge Systematics Inc, R Cervero and D Aschauer (1998) Economic impact analysis of transit
investments: guidebook for practitioners. TCRP Report 35. Washington DC.
Department for Transport (DfT) (2011a) Transport analysis guidance: guidance for the technical project
manager. WebTAG2. Accessed 28 December 2012. www.dft.gov.uk/webtag/documents/webtag2.php
Department for Transport (DfT) (2011b) Transport analysis guidance – WebTAG. Accessed 14 January
2013. www.dft.gov.uk/webtag/index.php
Department for Transport (DfT) (2011c) Transport analysis guidance: an overview of transport appraisal.
WebTAG2. Retrieved 28 December. www.dft.gov.uk/webtag/documents/webtag2.php
Department for Transport (DfT) (2012) TAG unit 2.7.2: Appraisal summary table. WebTAG. Accessed 28
December 2012. www.dft.gov.uk/webtag/documents/project-manager/unit2.7.2.php
Department of Transport (2009) Guidelines on a common appraisal framework for transport projects and
programmes. Ireland. Accessed 4 September 2013. www.transport.ie/upload/general/11801-
DOT_COMMON_APPRAISAL_FRAMEWORK1-0.PDF
Department of Transport (DoT) (2010) Guidelines for cost benefit analysis. Melbourne: DoT.
Department of Transportation (2011) The value of travel time savings: departmental guidance for
conducting economic evaluations, revision 2. Accessed 4 September 2013.
www.dot.gov/sites/dot.dev/files/docs/vot_guidance_092811c.pdf
Eijgenraam, CJJ, CC Koopmans, PJC Tang and ACP Verster (Nol) (2000) Evaluation of infrastructural
projects: Guide for cost-benefit analysis. Accessed 4 September 2013.
www.rws.nl/en/images/Guide%20for%20Cost-Benefit%20Analysis%20I_tcm224-324078.pdf
Economic appraisal of public transport service enhancements
76
Federal Transit Administration (2013) Proposed new starts and small starts policy guidance. Accessed 4
September 2013. www.fta.dot.gov/documents/NewStartsPolicyGuidance.pdf
Ferreira, L and M Lake (2002) Towards a methodology to evaluate public transport projects. Accessed 4
September 2013. http://eprints.qut.edu.au/2494/1/2494_2.pdf
Flanagan, J and P Nicholls (2007) Public sector business cases using the five case model: a toolkit. London:
HM Treasury.
GHD (2012) Updating the ATC national guidelines for transport system management in Australia: stage 1
scoping issues paper. Accessed 4 September 2013.
www.bitre.gov.au/ngc/files/NGTSM_update_scoping_issues_paper_December_2012.pdf
Goodbody Economic Consultants (2004) Cost benefit parameters and application rules for transport
project appraisal. Accessed 4 September 2013. www.transport.ie/upload/general/5830-1.pdf
Griffith, M, J Leal, A Mendoza, T Mocsari, JL Santos and W Wijnen (2012) State of the practice for cost-
effectiveness analysis (CEA), cost-benefit analysis (CBA) and resource allocation. La Défense cedex,
France: World Road Association (PIARC)
HM Treasury (2003) The green book: appraisal and evaluation in central government. Accessed 4
September 2013.
www.gov.uk/government/uploads/system/uploads/attachment_data/file/220541/green_book_complet
e.pdf
HM Treasury (2012) Business case guidance. London, U.K. Accessed 28 December 2012.
http://webarchive.nationalarchives.gov.uk/20130129110402/http://www.hm-
treasury.gov.uk/data_greenbook_business.htm
Infrastructure Australia (2012) Infrastructure Australia’s reform and investment framework: guidelines for
making submissions to Infrastructure Australia’s infrastructure priority list using the reform and
investment framework. Canberra: Department of Infrastructure and Transport.
John Bolland Consulting (2006) Critique of passenger transport evaluation A report for ARTA..
Litman, T (2006) What’s it worth? Economic evaluation for transportation decision-making. Accessed 4
September 2013. www.vtpi.org/worth.pdf
McCabe, C (2009) What is cost-utility analysis? Accessed 4 September 2013.
www.ppge.ufrgs.br/giacomo/arquivos/farmaco/mccabe-cost-util.pdf
Ministry of Transport (MoT) (2011) Government policy statement on land transport funding 2012/2013 -
2021/2022. Wellington, New Zealand: Ministry of Transport.
Nash, CA (2010) Current debates on the cost-benefit analysis of transport projects in Great Britain.
Seminario Sobre Evaluacion Economica de Proyectos de Transporte. Madrid, Spain. 15–16 November
2010. Accessed 4 September 2013.
http://s364660668.mialojamiento.es/EistArch/Doc_Sem/Pon/Pdfs/CA_Nash.pdf
National Infrastructure Unit (NZ) (2012) Better business cases – investing for change for better value.
Accessed 28 December 2012. www.infrastructure.govt.nz/publications/betterbusinesscases
NSW Treasury (2007) NSW government guidelines for economic appraisal. Accessed 4 September 2013.
www.treasury.nsw.gov.au/__data/assets/pdf_file/0016/7414/tpp07-5.pdf
NZ Transport Agency (2010a) Economic evaluation manual (volume 1). Accessed 4 September 2013.
www.nzta.govt.nz/resources/economic-evaluation-manual/volume-1/docs/eem1-july-2010.pdf
8 References
77
NZ Transport Agency (2010b) Economic evaluation manual (volume 2). Accessed 4 September 2013.
www.nzta.govt.nz/resources/economic-evaluation-manual/volume-2/docs/eem2-july-2010.pdf
NZ Transport Agency (2011) Planning and investment knowledgebase. Accessed 1 February 2013.
www.nzta.govt.nz/resources/planning-and-investment-knowledge-base/
NZ Transport Agency (2013) Consultation to support the implementation of PTOM. Wellington, New
Zealand. Accessed 4 September 2013. www.nzta.govt.nz/consultation/ptom/
NZ Treasury (2005) Cost benefit analysis primer. Accessed 4 September 2013.
www.treasury.govt.nz/publications/guidance/planning/costbenefitanalysis/primer
NZ Treasury (2012) Better business cases: overview. Accessed 4 September 2013.
www.infrastructure.govt.nz/publications/betterbusinesscases/files/bbc-oview.pdf
Office of Asset Management (2002) Life-cycle cost analysis primer. Accessed 4 September 2013.
http://isddc.dot.gov/OLPFiles/FHWA/010621.pdf
Parker, C (2009) The implications of discount rate reductions on transport investments and sustainable
transport futures. NZ Transport Agency research report 392.
Parker, C (2012) Scoping approach and measuring the impact of indexing unit cost parameters in cost-
benefit analysis. NZ Transport Agency research report 492.
PCIE (1996) A comparison of evaluation methods for alternatives to roading. A report to Transit New
Zealand.
Price Waterhouse Coopers and NZIER (2011) Additional Waitemata Harbour crossing – preliminary
business case. Wellington: NZ Transport Agency.
State of Victoria Department of Treasury and Finance (2004) Investment management standard. Accessed
1 April 2013. www.dtf.vic.gov.au/CA25713E0002EF43/pages/investment-management#.UX8PPrVkPK0
Sugden, R (1999) Review of cost/benefit analysis of transport projects. UK Department for Transport.
The World Bank (2005a) A framework for the economic evaluation of transport projects. Washington DC:
World Bank.
The World Bank (2005b) Where to use cost effectiveness techniques rather than cost benefit analysis.
Washington DC: World Bank.
Transport Canada (1994) Guide to benefit-cost analysis in Transport Canada. Accessed 4 September 2013.
www.tc.gc.ca/media/documents/corporate-services/bca.pdf
Transport for London (2008) Business case development manual. London: Transport for London.
Transport for NSW (2012) Principles and guidelines for economic appraisal of transport investment and
initiatives (draft). Sydney, Australia.
UITP (2009) Assessing the benefits of public transport. Accessed 4 September 2013.
http://ec.europa.eu/environment/newprg/pdf/Position%20Papers%20received/UITP%20-
%20Public%20Transport.pdf
Wallis, I (2007) Review of value of time relativities in the economic evaluation manual. Report to Land
Transport New Zealand.
Wallis, I (2009) Economic development benefits of transport investment. NZ Transport Agency research
report 350.
Economic appraisal of public transport service enhancements
78
Wallis, I and D Schneiders (2012) New Zealand bus policy model. NZ Transport Agency research report
472.
Wignall, D. (2012a). EEM review – passenger transport (PT) procedures. A report for the NZ Transport
Agency.
Wignall, D (2012b) Northern busway review report. Accessed 4 September 2013.
www.nzta.govt.nz/planning/monitoring/audits/docs/northern-busway-review-report.pdf
8.2 Parameter values
Beca Carter Hollings & Ferner, SDG Forsyte Research and Brown Copeland & Co (2002) Project evaluation
benefit parameter values. Report to Transfund New Zealand.
Booz Allen Hamilton (2001) Sydney ferries market research. Report for State Transit NSW.
Booz Allen Hamilton (2003a) ACT transport demand elasticities study. Report to Canberra Department of
Urban Services.
Booz Allen Hamilton (2003b) Patronage funding report. Wellington, New Zealand: Transfund NZ.
Booz Allen Hamilton (2005) Values for project evaluation – mode switching user benefits. Wellington, New
Zealand: Land Transport NZ, Z1488/PAP 26 Aug 2005.
Booz Allen Hamilton and NJ Douglas (2003) Stated preference market research working paper. Report for
Transport for NSW.
Booz Allen Hamilton and Pacific Consulting (1995) Ultimo Pyrmont light rail project CBD extension
demand study. Sydney: NSW Department of Transport.
Department for Transport (1987) Values of journey time savings and accident prevention. UK Department
for Transport.
Douglas Economics (2004a) Value of rail travel time. Report for RailCorp Train Services Rail Development.
Douglas Economics (2004b) Value of station crowding. Report to RailCorp.
Douglas Economics (2006a) Value and demand effect of rail service attributes. Report to RailCorp.
Douglas Economics (2006b) Valuing the cost to passengers of train crowding. Report to RailCorp.
Douglas Economics. (2012a) Pricing strategies for public transport: literature review. Wellington, New
Zealand: NZ Transport Agency.
Douglas Economics (2012b) Pricing strategies for public transport: pilot survey report. Wellington, New
Zealand: NZ Transport Agency.
Douglas Economics (2012b) Value of rail travel of time. Report to RailCorp NSW.
Douglas, N and M Jones (2013) Estimating interchange penalties by stated preference survey. Brisbane,
Australia.
Douglas, NJ, LJ Franzmann and TW Frost (2003) The estimation of demand parameters for primary public
transport service in Brisbane attributes. Australasian Transport Research Forum (pp1–19).
Fosgerau, M (2005) Unit income elasticity of the value of travel time savings. In VIII Nectar Conference
Proceedings, Las Palmas, Gran Canaria. Association for European Transport.

8 References
79
Fox, J, A Daly and B Patruni (2010) Sydney strategic re-estimation mode-destination model. Prepard for
Bureau of Transport Studies, Transport NSW.
Hague Consulting (1996) Sydney travel model based on household travel survey calibration report. Report
for NSW Department of Transport. Sydney, Australia.
Halcrow (2000) Bondi Beach rail extension patronage study. Lend Lease Capital Services – Macquarie Bank
Joint Venture.
Halcrow (2005) Dandenong rail corridor market assessment stated preference survey of train passengers.
Report to Department of Infrastructure Public Transport Division.
Hensher, DA and P Prioni (2002). A service quality index for area-wide contract performance assessment.
Journal of Transport Economics and Policy 36, no.1: 93–113.
Hensher, DA and JM Rose (2003) The North-West Transport Study patronage survey: stated choice model
estimation for work and non-work travel. Report for Auckland Regional Council.
Hensher, DA, P Stopher and P Bullock (2003) Service quality – developing a service index in the provision
of commercial bus contracts. Transportation Research 37A, no.6: 419–517.
Ian Wallis Associates (2008) Wellington trolley bus seat market research. Report for NZ Bus.
Independent Transport Safety and Reliability Regulator (ITSRR) (2009) Survey of Sydney metropolitan bus
users 2009. Sydney, Australia.
ITS Sydney (2011) Estimation of parameters to forecast demand for metro services in NW Sydney. Report
for NSW Department of Transport.
Mueller, S, K Thompson and L Hirsch (2011) A socio economic study of platform and carriage crowding in
the Australian railway industry: summary: quantitative research summary. Brisbane, Australia: CRC
for Rail Innovation.
MVA (2007) Passengers’ priorities for improvements in rail services. Report for Passenger Focus. London,
UK.
Pacific Consulting (1995) Value of rail service quality.: Report for CityRail Planning and Business
Development. Sydney, Australia.
PCIE (2000) Sungold/CityWest stated preference market research. For Ove Arup Pty for QR by PCIE.
PCIE & BNR Consulting (2000) Sydney to Newcastle rail upgrade project patronage analysis. Report for
State Rail Operations Development.
PPK (1998) Liverpool–Parramatta transitway. Sydney, Australia: NSW Department of Transport.
Rust PPK (1996a) Parramatta–Chatswood rail link patronage demand study, calibration and validation.
Report to RAC.
Rust PPK (1996b) M2 busway in Parramatta-Chatswood rail link patronage demand study, calibration and
validation. Report to RAC.
Steer Davies Gleave (1990) Critical corridors assessment forecasting the demand effects of bus
competition. Report prepared for the Greater Wellington Regional Council.
Steer Davies Gleave (1991a) The effects of quality improvements in public transport: Part IIb detailed
market research results and parameters estimates. Final report for Greater Wellington Regional
Council.
Economic appraisal of public transport service enhancements
80
Steer Davies Gleave (1991b) Public preferences for LRT and busway in Auckland (executive summary).
Auckland: Auckland Regional Council.
Steer Davies Gleave and GHD-Transmark (1993) Estimation of elasticities for primary service attributes.
Final report for CityRail, NSW. Sydney.
Travers Morgan (1995) Market research for demand forecasts for western CBD extension of Sydney LRT.
NSW Department of Transport. Sydney.
Vincent, M (2008) Measurement valuation of public transport reliability. NZ Transport Agency research
report 339.
Wardman, M (2001) Public transport values of time. Institute of Transport Studies, University of Leeds.
Appendix A: Business case decision making
81
Appendix A: Business case decision making
A1 NZ Transport Agency application of NZ Treasury’s Better Business Cases
The NZ Transport Agency (‘the Transport Agency’) is considering the application of the NZ Treasury’s Better
Business Cases (TBBC) within its procedures and is looking to adopt a ‘principles based approach’ (ie not
rules) to business case development as part of the Transport Agency’s Planning and investment
knowledgebase. This is significant for public transport proposals in New Zealand, as the appraisal and
funding approval of these projects is dependent on meeting Transport Agency requirements.
The Transport Agency considers the current system to be reasonably robust; with only relatively minor
changes required to align existing procedures with the TBBC framework (D List, NZ Transport Agency –
pers comm, March 2013). One key change would be to include greater emphasis on developing and
agreeing on a strategic case for change, prior to committing resources to, for example, the development
of a detailed economic assessment of options. Changes will be published as part of the Transport
Agency’s Planning and investment knowledgebase.
The Transport Agency is also looking to modify aspects of the TBBC framework so that it is ‘fit for
purpose’ when considering transport projects (D List, NZ Transport Agency – pers comm, March 2013).
The TBBC framework was developed for use by state sector agencies when seeking Cabinet decisions on
capital proposals, whereas transport programmes and projects are generally developed within the local
government sector, which is quite a different environment. For example, transport investment within the
local government sector requires the agreement and commitment of a diverse range of business owners
with different interests (eg local councils, regional councils, transport operators, NZ Transport Agency).
There is also a statutory requirement for local and regional councils to consult with stakeholders and the
general public, this requirement does not easily fit within the existing TBBC framework.
A2 UK application of business case procedures to transport project appraisal
In the UK, central government requirements for economic appraisal are set out in the HM Treasury’s
(2003) Green book. Supplementary guidance is provided in the form of HM Treasury’s (2012) best-practice
five case model guidelines for preparing business cases (Flanagan and Nicholls 2007). This has been
adapted for use in New Zealand, as discussed above.
The Department for Transport requirements for appraisal and decision making are published online as WebTAG
(www.dft.gov.uk/webtag/)30. WebTAG is fully consistent with HM Treasury’s (2003) Green book but has been
designed specifically for transport projects. It provides detailed guidance on setting objectives, developing
solutions, modelling and appraising options. WebTAG is mandatory for central government funding, and
should be considered best practice guidelines in all other instances (DfT 2011b).
30 WebTAG is the UK equivalent of the New Zealand EEM.
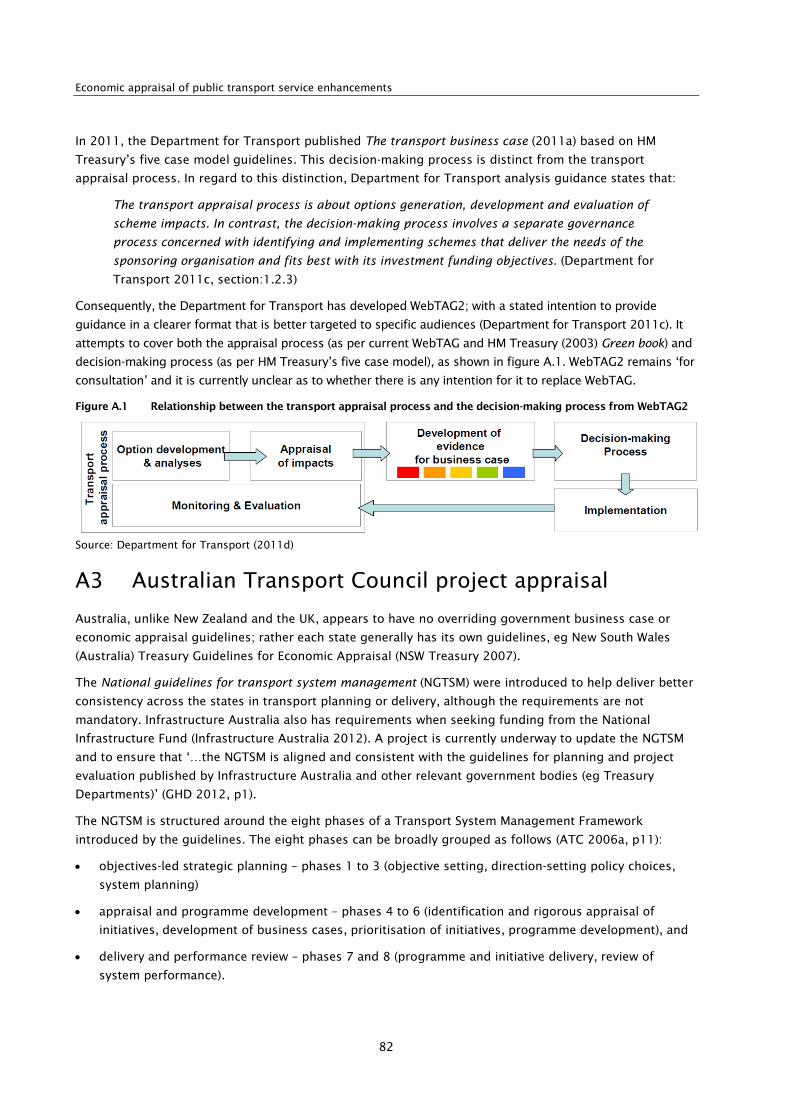
Economic appraisal of public transport service enhancements
82
In 2011, the Department for Transport published The transport business case (2011a) based on HM
Treasury’s five case model guidelines. This decision-making process is distinct from the transport
appraisal process. In regard to this distinction, Department for Transport analysis guidance states that:
The transport appraisal process is about options generation, development and evaluation of
scheme impacts. In contrast, the decision-making process involves a separate governance
process concerned with identifying and implementing schemes that deliver the needs of the
sponsoring organisation and fits best with its investment funding objectives. (Department for
Transport 2011c, section:1.2.3)
Consequently, the Department for Transport has developed WebTAG2; with a stated intention to provide
guidance in a clearer format that is better targeted to specific audiences (Department for Transport 2011c). It
attempts to cover both the appraisal process (as per current WebTAG and HM Treasury (2003) Green book) and
decision-making process (as per HM Treasury’s five case model), as shown in figure A.1. WebTAG2 remains ‘for
consultation’ and it is currently unclear as to whether there is any intention for it to replace WebTAG.
Figure A.1 Relationship between the transport appraisal process and the decision-making process from WebTAG2
Source: Department for Transport (2011d)
A3 Australian Transport Council project appraisal
Australia, unlike New Zealand and the UK, appears to have no overriding government business case or
economic appraisal guidelines; rather each state generally has its own guidelines, eg New South Wales
(Australia) Treasury Guidelines for Economic Appraisal (NSW Treasury 2007).
The National guidelines for transport system management (NGTSM) were introduced to help deliver better
consistency across the states in transport planning or delivery, although the requirements are not
mandatory. Infrastructure Australia also has requirements when seeking funding from the National
Infrastructure Fund (Infrastructure Australia 2012). A project is currently underway to update the NGTSM
and to ensure that ‘…the NGTSM is aligned and consistent with the guidelines for planning and project
evaluation published by Infrastructure Australia and other relevant government bodies (eg Treasury
Departments)’ (GHD 2012, p1).
The NGTSM is structured around the eight phases of a Transport System Management Framework
introduced by the guidelines. The eight phases can be broadly grouped as follows (ATC 2006a, p11):
• objectives-led strategic planning – phases 1 to 3 (objective setting, direction-setting policy choices,
system planning)
• appraisal and programme development – phases 4 to 6 (identification and rigorous appraisal of
initiatives, development of business cases, prioritisation of initiatives, programme development), and
• delivery and performance review – phases 7 and 8 (programme and initiative delivery, review of
system performance).

Appendix A: Business case decision making
83
The appraisal process (phase 5) involves three stages (strategic merit test, rapid appraisal and detailed
appraisal). The economic appraisal of projects takes place at the rapid appraisal and detailed appraisal
stages – the key difference being that rapid appraisal is less precise and may even exclude benefits and
costs that are small or difficult to estimate (ATC 2006c, p18).

Economic appraisal of public transport service enhancements
84
Appendix B: Approaches and methods used in the appraisal of transport projects
This appendix provides an overview of the various approaches and methods used in the appraisal of
transport projects. Figure B.1 shows the five broad appraisal approaches identified and associated
methods. We note that these approaches overlap and many methods may apply to more than one
approach. A summary of these appraisal approaches and methods is given in table B.1.
Figure B.1 Appraisal approaches and methods
Table B.1 Summary of appraisal approaches and methods
Approach/method Description References (selected)
Financial appraisal (FA) Compares revenue and financial costs directly
attributable to a project – the normal ‘business’
approach.
ATC 2006b section 5.6;
Department of Transport 2009;
Eijgenraam et al 2000; NSW
Treasury 2007, section 2.3; PCIE
1996
• Exchequer cash-flow
analysis
Refer fiscal impact analysis. Department of Transport 2009
Appraisal approaches
Social cost-benefit analysis (SCBA)
Cost-effectiveness assessment (CEA)
Multi-criteria analysis (MCA)
Economic impact assessment (EIA)
Financial appraisal (FA)
Adjusted cost-benefit analysis
Computable general equilibrium models
Cost utility analysis
Lifecycle cost analysis
Input-output analysis
Incidence analysis
Regression / econometric models
Real estate market analysis
Statistical / non-statistical comparisons
Multi-objective analysis
Goal achievement matrix
Exchequer cash-flow analysis
Fiscal impact analysis
Planning balance sheet Approaches recommended as most
appropriate for the economic appraisal of changes to public transport services in New Zealand
Funding gap analysis
Weighted cost-effectiveness analysis
Weighted cost-effectiveness analysis
Adjusted cost-benefit analysis
Appraisal summary technique
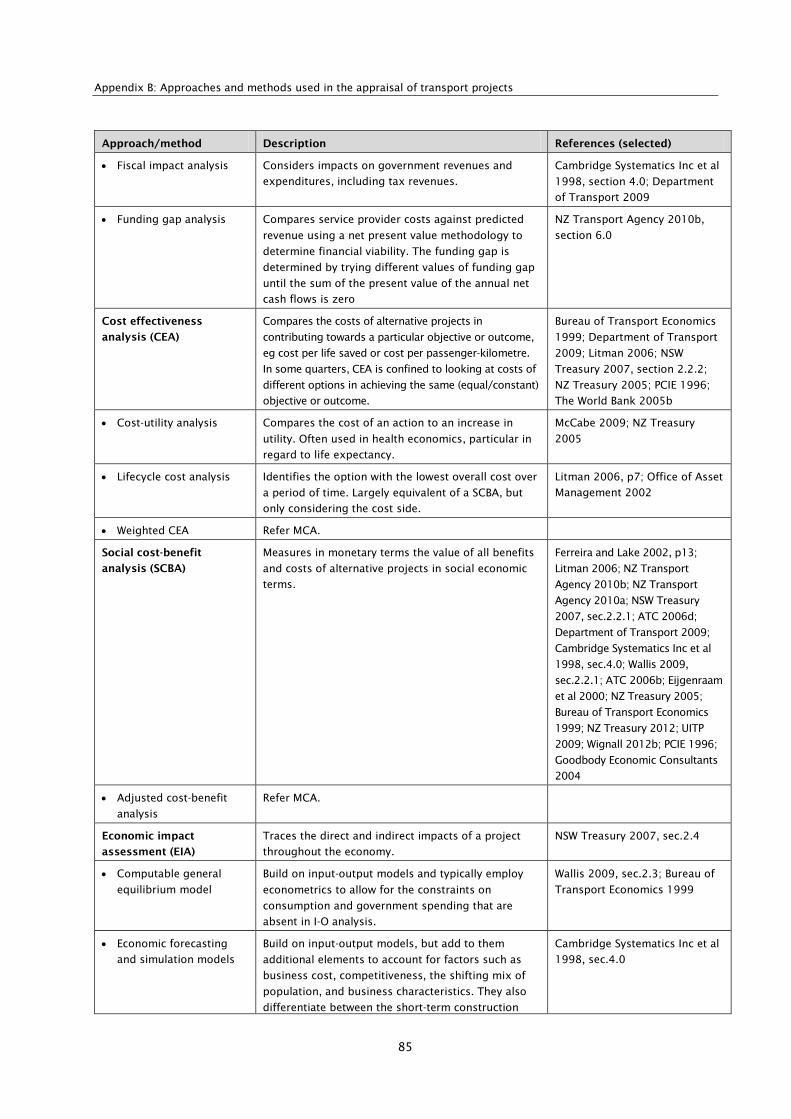
Appendix B: Approaches and methods used in the appraisal of transport projects
85
Approach/method Description References (selected)
• Fiscal impact analysis Considers impacts on government revenues and
expenditures, including tax revenues.
Cambridge Systematics Inc et al
1998, section 4.0; Department
of Transport 2009
• Funding gap analysis Compares service provider costs against predicted
revenue using a net present value methodology to
determine financial viability. The funding gap is
determined by trying different values of funding gap
until the sum of the present value of the annual net
cash flows is zero
NZ Transport Agency 2010b,
section 6.0
Cost effectiveness
analysis (CEA)
Compares the costs of alternative projects in
contributing towards a particular objective or outcome,
eg cost per life saved or cost per passenger-kilometre.
In some quarters, CEA is confined to looking at costs of
different options in achieving the same (equal/constant)
objective or outcome.
Bureau of Transport Economics
1999; Department of Transport
2009; Litman 2006; NSW
Treasury 2007, section 2.2.2;
NZ Treasury 2005; PCIE 1996;
The World Bank 2005b
• Cost-utility analysis Compares the cost of an action to an increase in
utility. Often used in health economics, particular in
regard to life expectancy.
McCabe 2009; NZ Treasury
2005
• Lifecycle cost analysis Identifies the option with the lowest overall cost over
a period of time. Largely equivalent of a SCBA, but
only considering the cost side.
Litman 2006, p7; Office of Asset
Management 2002
• Weighted CEA Refer MCA.
Social cost-benefit
analysis (SCBA)
Measures in monetary terms the value of all benefits
and costs of alternative projects in social economic
terms.
Ferreira and Lake 2002, p13;
Litman 2006; NZ Transport
Agency 2010b; NZ Transport
Agency 2010a; NSW Treasury
2007, sec.2.2.1; ATC 2006d;
Department of Transport 2009;
Cambridge Systematics Inc et al
1998, sec.4.0; Wallis 2009,
sec.2.2.1; ATC 2006b; Eijgenraam
et al 2000; NZ Treasury 2005;
Bureau of Transport Economics
1999; NZ Treasury 2012; UITP
2009; Wignall 2012b; PCIE 1996;
Goodbody Economic Consultants
2004
• Adjusted cost-benefit
analysis
Refer MCA.
Economic impact
assessment (EIA)
Traces the direct and indirect impacts of a project
throughout the economy.
NSW Treasury 2007, sec.2.4
• Computable general
equilibrium model
Build on input-output models and typically employ
econometrics to allow for the constraints on
consumption and government spending that are
absent in I-O analysis.
Wallis 2009, sec.2.3; Bureau of
Transport Economics 1999
• Economic forecasting
and simulation models
Build on input-output models, but add to them
additional elements to account for factors such as
business cost, competitiveness, the shifting mix of
population, and business characteristics. They also
differentiate between the short-term construction
Cambridge Systematics Inc et al
1998, sec.4.0

Economic appraisal of public transport service enhancements
86
Approach/method Description References (selected)
impacts and longer-term impacts of maintaining and
operating it, and the growth and expansion of user
benefits over time.
• Incidence analysis Disaggregates the overall impacts of the options
according to the impact on individual community
groups
NSW Treasury 2007, sec.2.4
• Input-output (multiplier)
analysis
In the simplest form of input-output analysis, input-
output multipliers are applied to measures of direct
impact to determine estimates of flow-on impacts in
terms of income and employment (NSW Treasury
2007, section 2.4).
NSW Treasury 2007, sec.2.4;
Cambridge Systematics Inc et al
1998, sec.4.0; Wallis 2009,
sec.2.2.2
• Land use transport
interface models
Refer real estate market analysis.
• Multiple regression and
econometric models
Seeks to isolate the effects of transit investments on
mode choice or economic conditions, controlling for
non-transit-related influences, such as exogenous
economic trends and demographic changes.
Regression models also serve as the basis for
establishing causal relationships (eg measuring
production functions) in many predictive techniques,
including input-output
Cambridge Systematics Inc et al
1998, sec.4.0
• National economic
modelling
Refer Computable general equilibrium model.
• Real estate market
analysis
Attempts to predict the effects on land use of
changes in the price, quality and availability of
transport brought about by transport schemes or
policies, and also the effect of land-use changes on
transport networks.
Cambridge Systematics Inc et al
1998, sec.4.0; Wallis 2009,
sec.2.4
• Statistical/non-statistical
comparisons
If the data needed to support regression analysis are
not available, researchers may opt to make simpler
statistical comparisons. Researchers can compare
data on development, employment, wages, and other
variables from both before and after data on a transit
investment (ie longitudinal analysis) and similar data
from another transit corridor as a control (ie a cross-
sectional analysis).
Cambridge Systematics Inc et al
1998, sec.4.0
Multiple criteria analysis
(MCA)
Compares options against a range of criteria, with
results often presented in terms of a score. Criteria
may have different weightings and be rated
subjectively or quantitatively. CEA or SCBA can often
provide some of the criteria.
Ferreira and Lake 2002, p13;
Litman 2006, p7; Department of
Transport 2009; ATC 2006b;
Bureau of Transport Economics
1999; NZ Treasury 2012; NZ
Treasury 2005; UITP 2009; PCIE
1996; Transport for NSW 2012,
sec.3
• Adjusted cost-benefit
analysis
Incorporates the concept of applying weights to
benefits and costs (and hence objectives) to reflect
their relative importance. It is a hybrid of BCA
(retaining the monetary measuring rod) and the
versions of MCA that use scores or weights.
ATC 2006b
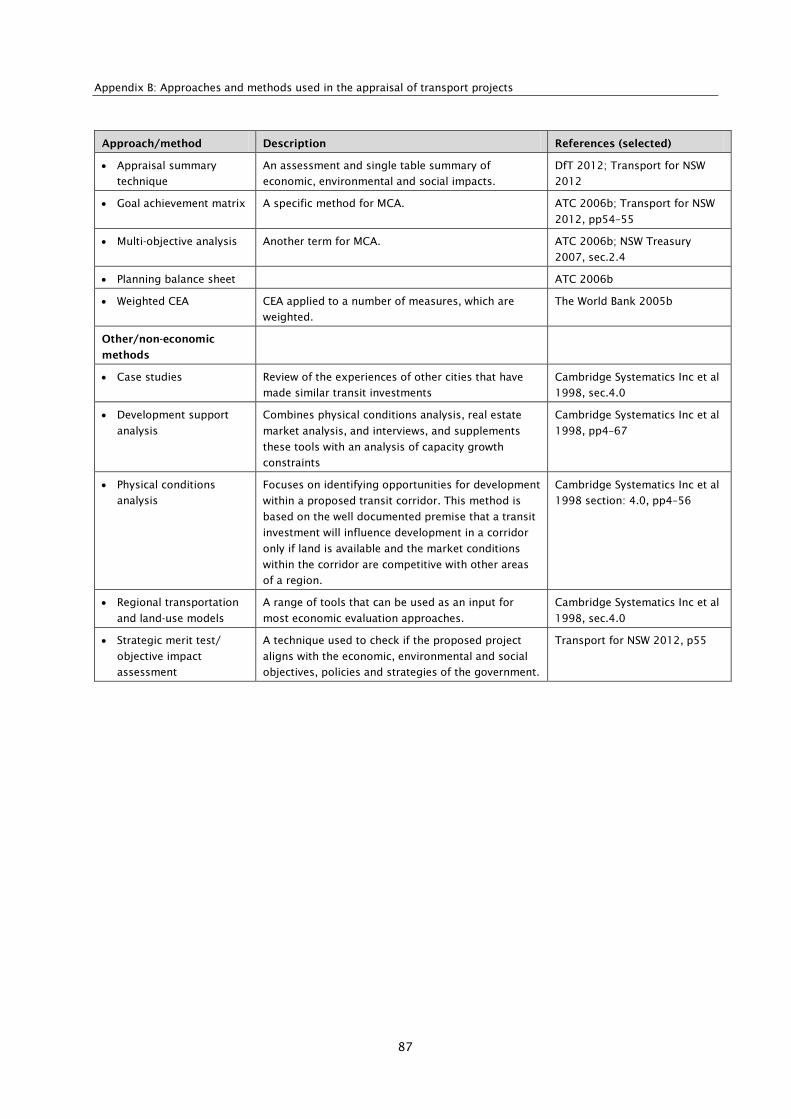
Appendix B: Approaches and methods used in the appraisal of transport projects
87
Approach/method Description References (selected)
• Appraisal summary
technique
An assessment and single table summary of
economic, environmental and social impacts.
DfT 2012; Transport for NSW
2012
• Goal achievement matrix A specific method for MCA. ATC 2006b; Transport for NSW
2012, pp54–55
• Multi-objective analysis Another term for MCA. ATC 2006b; NSW Treasury
2007, sec.2.4
• Planning balance sheet ATC 2006b
• Weighted CEA CEA applied to a number of measures, which are
weighted.
The World Bank 2005b
Other/non-economic
methods
• Case studies Review of the experiences of other cities that have
made similar transit investments
Cambridge Systematics Inc et al
1998, sec.4.0
• Development support
analysis
Combines physical conditions analysis, real estate
market analysis, and interviews, and supplements
these tools with an analysis of capacity growth
constraints
Cambridge Systematics Inc et al
1998, pp4–67
• Physical conditions
analysis
Focuses on identifying opportunities for development
within a proposed transit corridor. This method is
based on the well documented premise that a transit
investment will influence development in a corridor
only if land is available and the market conditions
within the corridor are competitive with other areas
of a region.
Cambridge Systematics Inc et al
1998 section: 4.0, pp4–56
• Regional transportation
and land-use models
A range of tools that can be used as an input for
most economic evaluation approaches.
Cambridge Systematics Inc et al
1998, sec.4.0
• Strategic merit test/
objective impact
assessment
A technique used to check if the proposed project
aligns with the economic, environmental and social
objectives, policies and strategies of the government.
Transport for NSW 2012, p55

Economic appraisal of public transport service enhancements
88
Appendix C: International review of procedures for economic appraisal
Table C.1 provides a comparison of the decision criteria (and associated considerations) and benefit
parameters included in the economic appraisal procedures reviewed.
Table C.1 Comparison of the decision criteria (and associated considerations) and benefit parameters
Aspect of methodology Economic appraisal procedure
NZ
EEM
Aust.
NGTSM
Aust.
TfNSW
UK
WebTAG
UK
TfL
US ‘new
starts’
Decision criteria and associated considerations
Approach SCBA (a) x
CEA - × ×
Decision
criteria
Net present value (NPV) x
Benefit-cost ratio (BCR) x
First year rate of return x x x
Internal rate of return × x x x
Multi-criteria
Period of
analysis
Discount rate (%) 8 Varies 7 3.5 3.5 n/a
Evaluation period (years) 10–30 20–50 20–50 60 3–40 1–20
Residual values allowed X
Public transport user benefit parameters
Value of IVT IVT (standard values) (M) (M) (M) (M) (M) x
Journey time
attributes
Access time
• walk time (access/egress)
• car access
• public transport access(b)
(M)(f)
×
×
(M)
×
×
(M)
(M)
(M)
(M)
-
-
(M)
-
-
x
x
x
Headway (service interval)(c) (M) (M) (M) (M)(i) (M) x
Seat availability/crowding (M) (M) (M)(h) (M)(i) (M) x
Interchange (transfer penalty
and wait time)
(M) (M) (M) (M) (M) x
Reliability of travel time(d) (M) (M) (M) (N) (M) x
Mode-specific factors(e) × (M) × – – x
Pre-journey/ticketing x x x x (M) x
Quality
attributes
Vehicle features (M) (M) (M) (M)(j) (M) x
Stop/station features (M)(g) (M) (M) (M)(j) (M) x
Provision for ‘simplified procedures’
Provision for simplified procedures (m) x x x
Benefit
parameters
included (k)
Public transport user benefits (M)(l) × × × x (N)
Road user benefits (M) (M)(n) × × x (N)
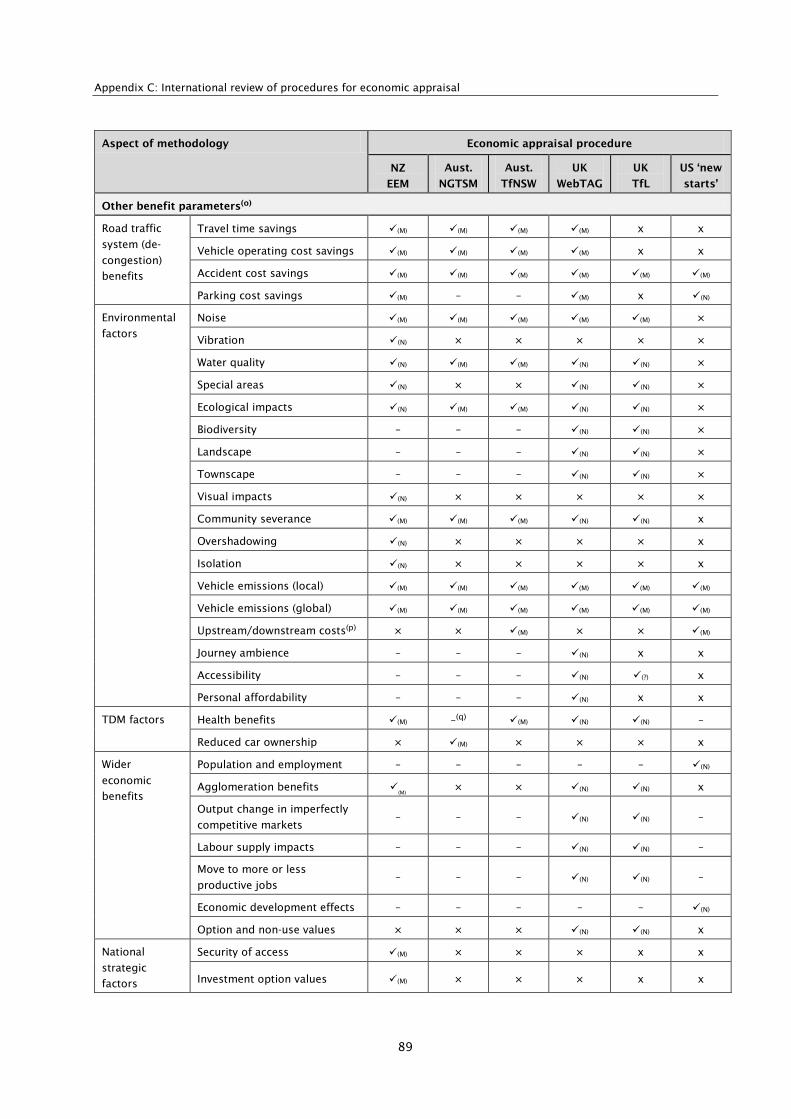
Appendix C: International review of procedures for economic appraisal
89
Aspect of methodology Economic appraisal procedure
NZ
EEM
Aust.
NGTSM
Aust.
TfNSW
UK
WebTAG
UK
TfL
US ‘new
starts’
Other benefit parameters(o)
Road traffic
system (de-
congestion)
benefits
Travel time savings (M) (M) (M) (M) x x
Vehicle operating cost savings (M) (M) (M) (M) x x
Accident cost savings (M) (M) (M) (M) (M) (M)
Parking cost savings (M) – – (M) x (N)
Environmental
factors
Noise (M) (M) (M) (M) (M) ×
Vibration (N) × × × × ×
Water quality (N) (M) (M) (N) (N) ×
Special areas (N) × × (N) (N) ×
Ecological impacts (N) (M) (M) (N) (N) ×
Biodiversity – – – (N) (N) ×
Landscape – – – (N) (N) ×
Townscape – – – (N) (N) ×
Visual impacts (N) × × × × ×
Community severance (M) (M) (M) (N) (N) x
Overshadowing (N) × × × × x
Isolation (N) × × × × x
Vehicle emissions (local) (M) (M) (M) (M) (M) (M)
Vehicle emissions (global) (M) (M) (M) (M) (M) (M)
Upstream/downstream costs(p) × × (M) × × (M)
Journey ambience – – – (N) x x
Accessibility – – – (N) (?) x
Personal affordability – – – (N) x x
TDM factors Health benefits (M) –(q) (M) (N) (N) –
Reduced car ownership × (M) × × × x
Wider
economic
benefits
Population and employment – – – – – (N)
Agglomeration benefits (M)
× × (N) (N) x
Output change in imperfectly
competitive markets – – – (N) (N) –
Labour supply impacts – – – (N) (N) –
Move to more or less
productive jobs – – – (N) (N) –
Economic development effects – – – – – (N)
Option and non-use values × × × (N) (N) x
National
strategic
factors
Security of access (M) × × × x x
Investment option values (M) × × × x x
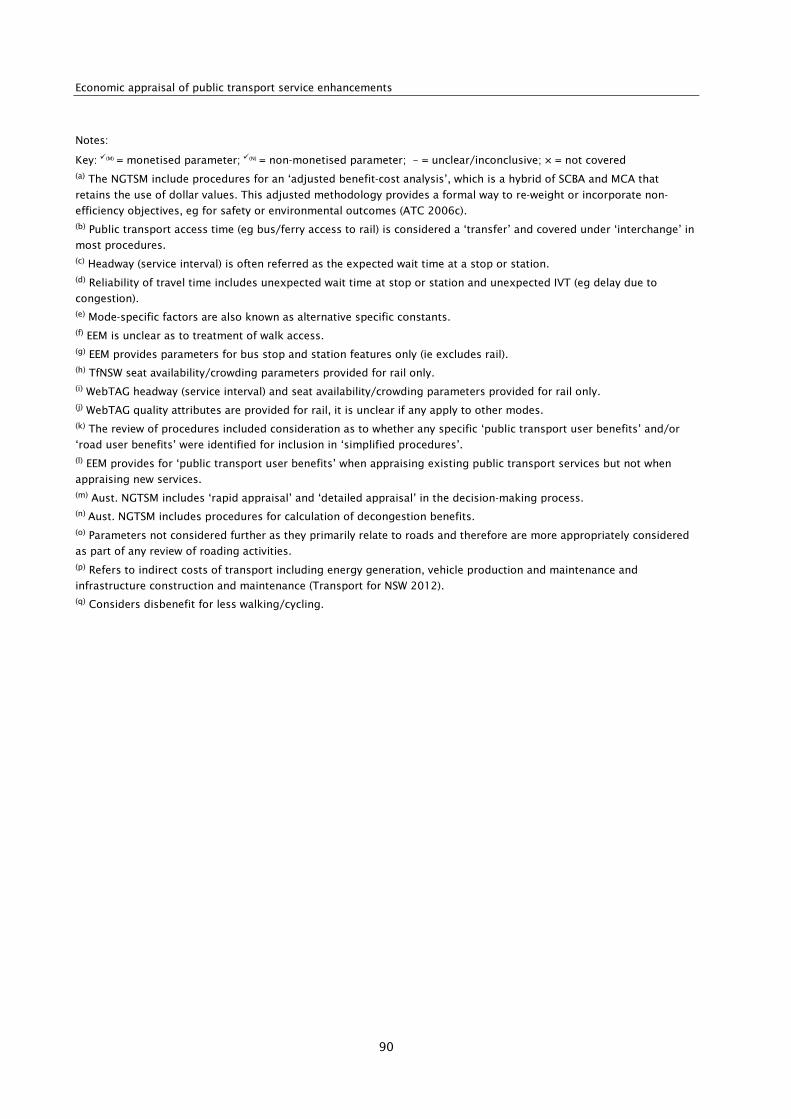
Economic appraisal of public transport service enhancements
90
Notes:
Key: (M) = monetised parameter; (N) = non-monetised parameter; – = unclear/inconclusive; × = not covered (a) The NGTSM include procedures for an ‘adjusted benefit-cost analysis’, which is a hybrid of SCBA and MCA that
retains the use of dollar values. This adjusted methodology provides a formal way to re-weight or incorporate non-
efficiency objectives, eg for safety or environmental outcomes (ATC 2006c). (b) Public transport access time (eg bus/ferry access to rail) is considered a ‘transfer’ and covered under ‘interchange’ in
most procedures. (c) Headway (service interval) is often referred as the expected wait time at a stop or station. (d) Reliability of travel time includes unexpected wait time at stop or station and unexpected IVT (eg delay due to
congestion). (e) Mode-specific factors are also known as alternative specific constants. (f) EEM is unclear as to treatment of walk access. (g) EEM provides parameters for bus stop and station features only (ie excludes rail). (h) TfNSW seat availability/crowding parameters provided for rail only. (i) WebTAG headway (service interval) and seat availability/crowding parameters provided for rail only. (j) WebTAG quality attributes are provided for rail, it is unclear if any apply to other modes. (k) The review of procedures included consideration as to whether any specific ‘public transport user benefits’ and/or
‘road user benefits’ were identified for inclusion in ‘simplified procedures’. (l) EEM provides for ‘public transport user benefits’ when appraising existing public transport services but not when
appraising new services. (m) Aust. NGTSM includes ‘rapid appraisal’ and ‘detailed appraisal’ in the decision-making process. (n) Aust. NGTSM includes procedures for calculation of decongestion benefits. (o) Parameters not considered further as they primarily relate to roads and therefore are more appropriately considered
as part of any review of roading activities. (p) Refers to indirect costs of transport including energy generation, vehicle production and maintenance and
infrastructure construction and maintenance (Transport for NSW 2012). (q) Considers disbenefit for less walking/cycling.
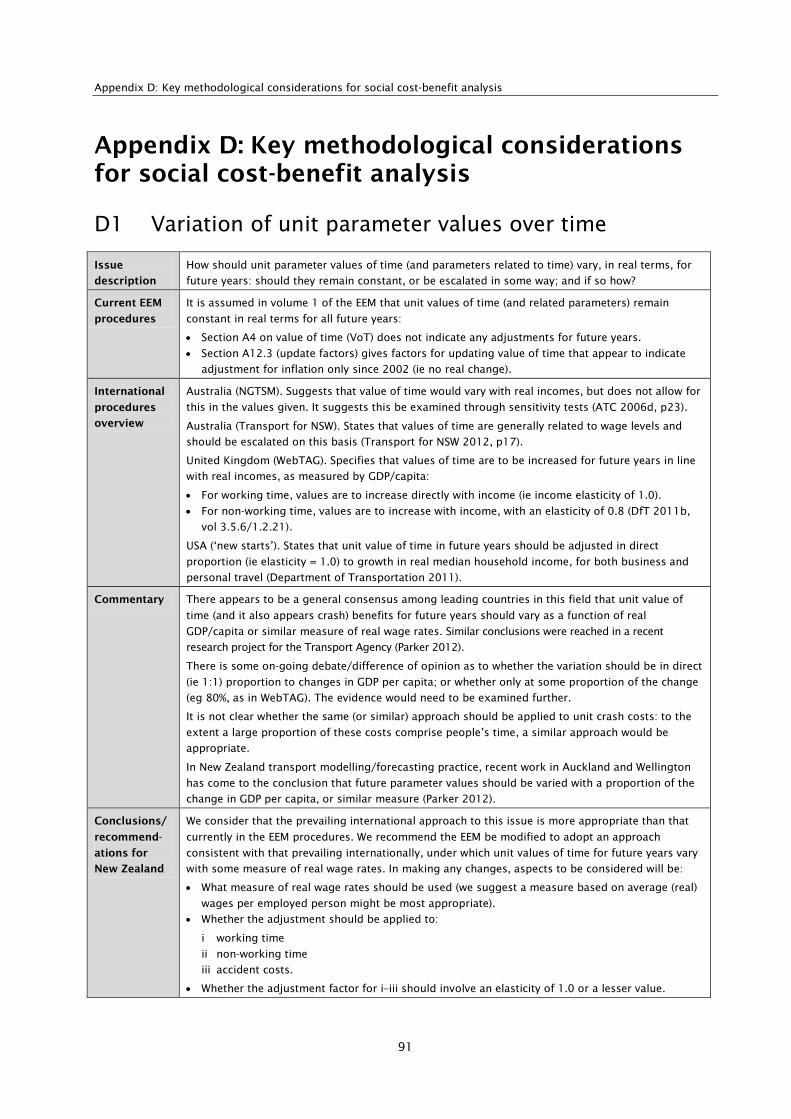
Appendix D: Key methodological considerations for social cost-benefit analysis
91
Appendix D: Key methodological considerations for social cost-benefit analysis
D1 Variation of unit parameter values over time
Issue
description
How should unit parameter values of time (and parameters related to time) vary, in real terms, for
future years: should they remain constant, or be escalated in some way; and if so how?
Current EEM
procedures
It is assumed in volume 1 of the EEM that unit values of time (and related parameters) remain
constant in real terms for all future years:
• Section A4 on value of time (VoT) does not indicate any adjustments for future years.
• Section A12.3 (update factors) gives factors for updating value of time that appear to indicate
adjustment for inflation only since 2002 (ie no real change).
International
procedures
overview
Australia (NGTSM). Suggests that value of time would vary with real incomes, but does not allow for
this in the values given. It suggests this be examined through sensitivity tests (ATC 2006d, p23).
Australia (Transport for NSW). States that values of time are generally related to wage levels and
should be escalated on this basis (Transport for NSW 2012, p17).
United Kingdom (WebTAG). Specifies that values of time are to be increased for future years in line
with real incomes, as measured by GDP/capita:
• For working time, values are to increase directly with income (ie income elasticity of 1.0).
• For non-working time, values are to increase with income, with an elasticity of 0.8 (DfT 2011b,
vol 3.5.6/1.2.21).
USA (‘new starts’). States that unit value of time in future years should be adjusted in direct
proportion (ie elasticity = 1.0) to growth in real median household income, for both business and
personal travel (Department of Transportation 2011).
Commentary There appears to be a general consensus among leading countries in this field that unit value of
time (and it also appears crash) benefits for future years should vary as a function of real
GDP/capita or similar measure of real wage rates. Similar conclusions were reached in a recent
research project for the Transport Agency (Parker 2012).
There is some on-going debate/difference of opinion as to whether the variation should be in direct
(ie 1:1) proportion to changes in GDP per capita; or whether only at some proportion of the change
(eg 80%, as in WebTAG). The evidence would need to be examined further.
It is not clear whether the same (or similar) approach should be applied to unit crash costs: to the
extent a large proportion of these costs comprise people’s time, a similar approach would be
appropriate.
In New Zealand transport modelling/forecasting practice, recent work in Auckland and Wellington
has come to the conclusion that future parameter values should be varied with a proportion of the
change in GDP per capita, or similar measure (Parker 2012).
Conclusions/
recommend-
ations for
New Zealand
We consider that the prevailing international approach to this issue is more appropriate than that
currently in the EEM procedures. We recommend the EEM be modified to adopt an approach
consistent with that prevailing internationally, under which unit values of time for future years vary
with some measure of real wage rates. In making any changes, aspects to be considered will be:
• What measure of real wage rates should be used (we suggest a measure based on average (real)
wages per employed person might be most appropriate).
• Whether the adjustment should be applied to:
i working time
ii non-working time
iii accident costs.
• Whether the adjustment factor for i–iii should involve an elasticity of 1.0 or a lesser value.

Economic appraisal of public transport service enhancements
92
D2 Adoption of ‘equity’ or ‘perceived’ valuations of non-work time
Issue
description
Perceived non-work unit time values are generally based on willingness-to-pay research and are
strongly related to incomes (resulting in ability to pay). If such values are also applied in economic
appraisal, it may be argued that project selection will be biased in favour of projects used by high-
income people, and this may be seen as undesirable on ‘equity’ grounds. An alternative is to adopt a
single ‘equity’ value of non-work time for use in all economic appraisals.
Current EEM
procedures
Current EEM values of non-work time relevant to public transport vary by:
• mode (ie car, bus/train, pedestrian/cyclist)
• purpose (ie commuting vs other non-work purpose)
• person role and situation (ie driver vs passenger for car, seated vs standing for bus/train).
EEM also notes that ‘the travel time values relating to the original mode (where these values are
highest) should be adopted for proposals that have a high proportion of mode switching’ (NZ
Transport Agency 2010a, sec.A4.2).
In terms of the above, it may be said that EEM does not adopt ‘equity’ values, although there is,
inevitably, a considerable degree of averaging within each mode/person/purpose category. In the
public transport context, we note that no differentiation is made between unit values for bus, train
(and ferry) users.
We also note that no information is given in EEM as to the extent to which the spread of values by
mode/person/purpose categories reflects:
• differences in average incomes within user category
• differences in the perceived desirability of different modes, situations (eg seated vs standing etc),
or
• other factors.
Recognising differences in disutility, we note that an ‘equity’ adjustment, to ‘standardise’ for the
income differences in each category, would not result in a single value across all non-work situations.
International
procedures
overview
Australia (NGTSM). Recommends a set of default values for public transport user IVT split only
between peak and off-peak periods. Also gives option of using public transport mode-specific values
(bus, rail/LRT, ferry) where appropriate for specific initiatives – while noting that this may present
problems in situations where, for example, a new public transport mode is being introduced. Does not
address the issue of ‘equity’ values between car and public transport users (by implication, does not
adopt equity values across these modes).
Australia (Transport for NSW 2012, p.154). This adopts an ‘equity’ value of time. It states the
following:
From the perspective of strategic resource allocation, the value of travel time savings used in
economic evaluation in all transport projects should be harmonised. The higher value used for
road projects than public transport projects means that the resource us tilted to road project at
the expense of public transport investments. To harmonise the economic evaluation, [Transport
for NSW] recommends that:
Value of travel time (private) = $13.76 per hour applicable to private car occupants, on-board
train time, on-board bus time, ferry travel, cycling time and walking time.
United Kingdom (WebTAG). WebTAG essentially adopts an ‘equity’ approach to the valuation of non-
working time. It states the following (DfT 2011b, vol.3.5.6/1.2.14).
Time savings to travellers in their own time typically make up a large proportion of the benefits
of transport investment. If values of time for appraisal are based on an individual’s willingness-
to-pay (behavioural values) which are related to income, then strategies and plans will be biased
toward those measures which most benefit travellers with higher incomes (which may favour
some modes over others). Investment will then be concentrated into high-income areas, and the
interests of those on lower incomes, who mat already suffer from relatively lower mobility and
accessibility, will be given less weight. For this reason, multi-modal transport appraisal should
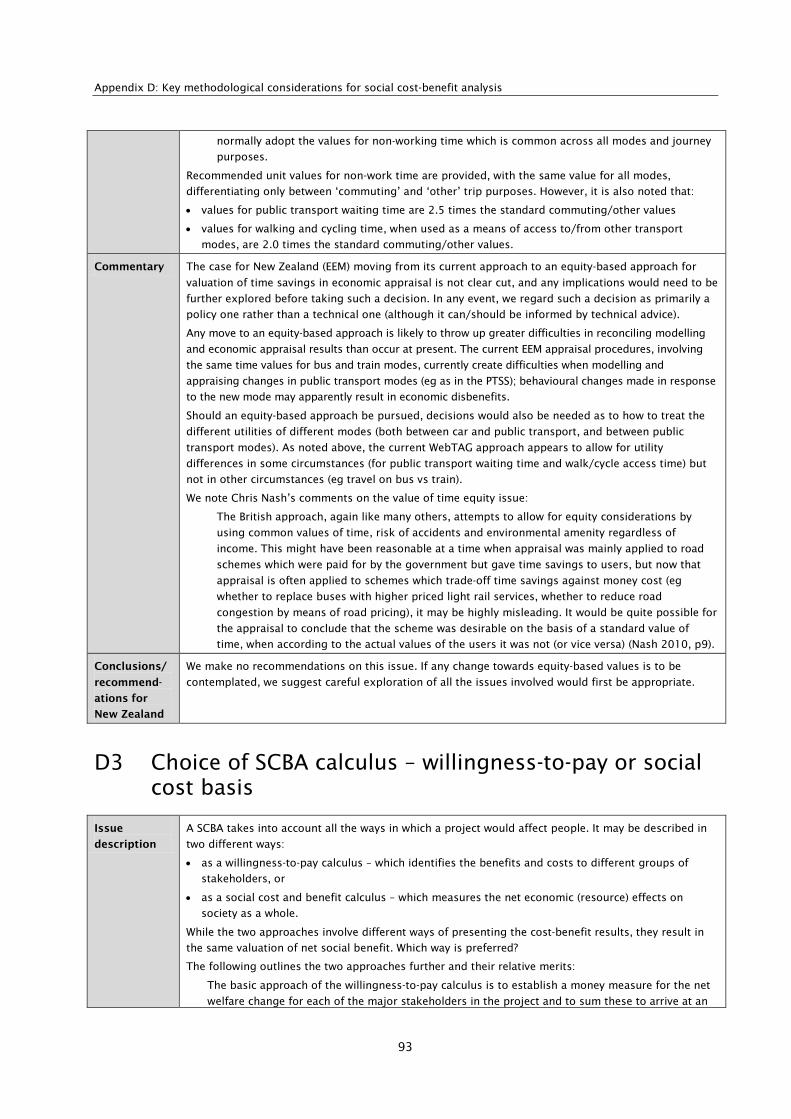
Appendix D: Key methodological considerations for social cost-benefit analysis
93
normally adopt the values for non-working time which is common across all modes and journey
purposes.
Recommended unit values for non-work time are provided, with the same value for all modes,
differentiating only between ‘commuting’ and ‘other’ trip purposes. However, it is also noted that:
• values for public transport waiting time are 2.5 times the standard commuting/other values
• values for walking and cycling time, when used as a means of access to/from other transport
modes, are 2.0 times the standard commuting/other values.
Commentary The case for New Zealand (EEM) moving from its current approach to an equity-based approach for
valuation of time savings in economic appraisal is not clear cut, and any implications would need to be
further explored before taking such a decision. In any event, we regard such a decision as primarily a
policy one rather than a technical one (although it can/should be informed by technical advice).
Any move to an equity-based approach is likely to throw up greater difficulties in reconciling modelling
and economic appraisal results than occur at present. The current EEM appraisal procedures, involving
the same time values for bus and train modes, currently create difficulties when modelling and
appraising changes in public transport modes (eg as in the PTSS); behavioural changes made in response
to the new mode may apparently result in economic disbenefits.
Should an equity-based approach be pursued, decisions would also be needed as to how to treat the
different utilities of different modes (both between car and public transport, and between public
transport modes). As noted above, the current WebTAG approach appears to allow for utility
differences in some circumstances (for public transport waiting time and walk/cycle access time) but
not in other circumstances (eg travel on bus vs train).
We note Chris Nash’s comments on the value of time equity issue:
The British approach, again like many others, attempts to allow for equity considerations by
using common values of time, risk of accidents and environmental amenity regardless of
income. This might have been reasonable at a time when appraisal was mainly applied to road
schemes which were paid for by the government but gave time savings to users, but now that
appraisal is often applied to schemes which trade-off time savings against money cost (eg
whether to replace buses with higher priced light rail services, whether to reduce road
congestion by means of road pricing), it may be highly misleading. It would be quite possible for
the appraisal to conclude that the scheme was desirable on the basis of a standard value of
time, when according to the actual values of the users it was not (or vice versa) (Nash 2010, p9).
Conclusions/
recommend-
ations for
New Zealand
We make no recommendations on this issue. If any change towards equity-based values is to be
contemplated, we suggest careful exploration of all the issues involved would first be appropriate.
D3 Choice of SCBA calculus – willingness-to-pay or social cost basis
Issue
description
A SCBA takes into account all the ways in which a project would affect people. It may be described in
two different ways:
• as a willingness-to-pay calculus – which identifies the benefits and costs to different groups of
stakeholders, or
• as a social cost and benefit calculus – which measures the net economic (resource) effects on
society as a whole.
While the two approaches involve different ways of presenting the cost-benefit results, they result in
the same valuation of net social benefit. Which way is preferred?
The following outlines the two approaches further and their relative merits:
The basic approach of the willingness-to-pay calculus is to establish a money measure for the net
welfare change for each of the major stakeholders in the project and to sum these to arrive at an

Economic appraisal of public transport service enhancements
94
overall cost-benefit. In contrast, the social cost calculus seeks to measure the resources used by
and the benefits arising from the project. This latter approach distinguishes between social
costs/benefits and transfer payments, and only takes into account the former. It is important to
note that the two approaches represent a difference in presentation only: identical effects are
present in both methods.
The key advantage of adopting a willingness-to-pay method of calculus is that it allows a
comprehensive picture of the impacts of a project to be presented. That is, the effects of a project
on differing groups of society (taxpayers, private sector operators, car users, etc.) are identified
separately. The impacts of financial (toll revenue, fare revenue, tax revenue) over non-financial
(time savings, accident savings) can also be identified. The converse is true of the social cost
method, such distributional impacts being hidden through a netting-out of impacts, prior to
application of SCBA methods.
The willingness-to-pay method therefore lends itself well to understanding the distributional
impacts of public transport projects, projects with partnering arrangements (PPP/developer
contributions) and toll road projects. For traditionally procured road schemes, without partnering
or private sector contributions, the application of social cost calculus would effectively be the
same with the exception of the minor impacts on government tax revenue. (Goodbody Economic
Consultants 2004)
Further discussion of the two approaches is given in WebTAG (DfT 2011b, vol.3.5.4).
Current EEM
procedures
EEM volume 2 appears to essentially follow the willingness to pay approach, although clarification in
the EEM of the various steps in this approach would be desirable.
International
procedures
overview
Australia NGTSM (Urban transport, volume 4) adopts the willingness-to-pay approach, although it is
noted that other parts of the guidelines follow an alternative (essentially social cost and benefit)
approach:
In this volume, benefits are estimated on the basis of reduced travel costs perceived by travellers,
plus other impacts on travellers and the community that are not perceived by travellers. This
method differs from the general approach presented in volume 3, but both methods give the same
total benefit. The general formulation of the approach described in this section is commonly used
for appraising urban transport initiatives and can more readily draw on the results of
computerised travel demand models. Use the approach as described in volume 3 if it is more
appropriate. It is essential that only one method is used: it is not appropriate to mix components
from the two approaches (ATC 2006d)
Australia (Transport for NSW) does not seem to mention this topic. United Kingdom (WebTAG) follows
the willingness-to-pay approach. This was adopted following a review by Prof Robert Sugden (1999),
which was particularly focused on the most appropriate approach in the context of multi-modal
transport appraisal (DfT 2011b, units 3.5.4/3.17).
Commentary For the economic appraisal of projects having cross-modal impacts (including public transport
proposals), there seems to be a reasonable consensus that the approach based on the willingness-to-pay
calculus is preferred. This has the substantial advantage that it can show the project impacts on each of
the different groups affected – typically for a public transport scheme being the government sector,
public transport operators, users, road traffic and other/external impacts.
The willingness-to-pay approach is used in the current EEM volume 2 (and in NGTSM volume 4) and
WebTAG). In the EEM context, it would be desirable to improve the description of the willingness-to-
pay methodology and the various inputs to it (including the treatment of resource cost corrections –
refer below).
Conclusions/
recommend-
ations for
New Zealand
The willingness-to-pay approach adopted in the EEM volume 2 is appropriate, particularly in the
context of multi-modal and public transport studies. It would be useful in the EEM to improve the
description of the willingness-to-pay methodology and the inputs to it, and to provide examples of
outputs (disaggregated by groups affected, separated into financial and non-financial impacts).
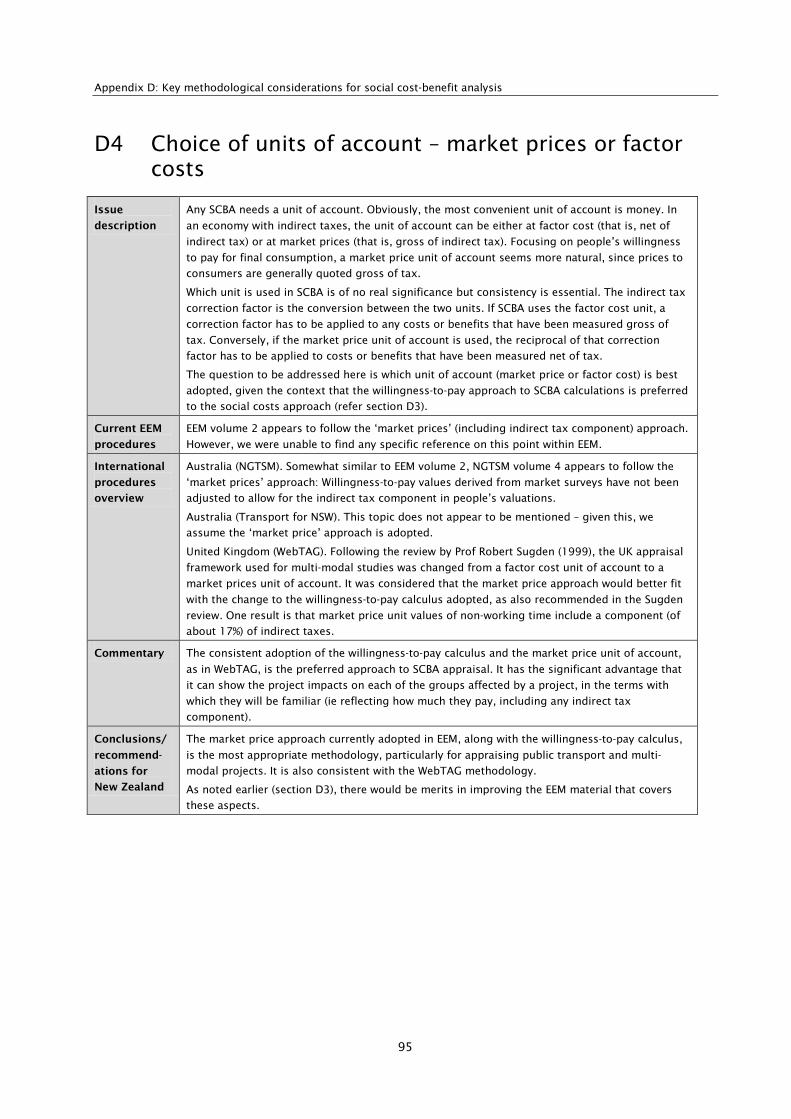
Appendix D: Key methodological considerations for social cost-benefit analysis
95
D4 Choice of units of account – market prices or factor costs
Issue
description
Any SCBA needs a unit of account. Obviously, the most convenient unit of account is money. In
an economy with indirect taxes, the unit of account can be either at factor cost (that is, net of
indirect tax) or at market prices (that is, gross of indirect tax). Focusing on people’s willingness
to pay for final consumption, a market price unit of account seems more natural, since prices to
consumers are generally quoted gross of tax.
Which unit is used in SCBA is of no real significance but consistency is essential. The indirect tax
correction factor is the conversion between the two units. If SCBA uses the factor cost unit, a
correction factor has to be applied to any costs or benefits that have been measured gross of
tax. Conversely, if the market price unit of account is used, the reciprocal of that correction
factor has to be applied to costs or benefits that have been measured net of tax.
The question to be addressed here is which unit of account (market price or factor cost) is best
adopted, given the context that the willingness-to-pay approach to SCBA calculations is preferred
to the social costs approach (refer section D3).
Current EEM
procedures
EEM volume 2 appears to follow the ‘market prices’ (including indirect tax component) approach.
However, we were unable to find any specific reference on this point within EEM.
International
procedures
overview
Australia (NGTSM). Somewhat similar to EEM volume 2, NGTSM volume 4 appears to follow the
‘market prices’ approach: Willingness-to-pay values derived from market surveys have not been
adjusted to allow for the indirect tax component in people’s valuations.
Australia (Transport for NSW). This topic does not appear to be mentioned – given this, we
assume the ‘market price’ approach is adopted.
United Kingdom (WebTAG). Following the review by Prof Robert Sugden (1999), the UK appraisal
framework used for multi-modal studies was changed from a factor cost unit of account to a
market prices unit of account. It was considered that the market price approach would better fit
with the change to the willingness-to-pay calculus adopted, as also recommended in the Sugden
review. One result is that market price unit values of non-working time include a component (of
about 17%) of indirect taxes.
Commentary The consistent adoption of the willingness-to-pay calculus and the market price unit of account,
as in WebTAG, is the preferred approach to SCBA appraisal. It has the significant advantage that
it can show the project impacts on each of the groups affected by a project, in the terms with
which they will be familiar (ie reflecting how much they pay, including any indirect tax
component).
Conclusions/
recommend-
ations for
New Zealand
The market price approach currently adopted in EEM, along with the willingness-to-pay calculus,
is the most appropriate methodology, particularly for appraising public transport and multi-
modal projects. It is also consistent with the WebTAG methodology.
As noted earlier (section D3), there would be merits in improving the EEM material that covers
these aspects.
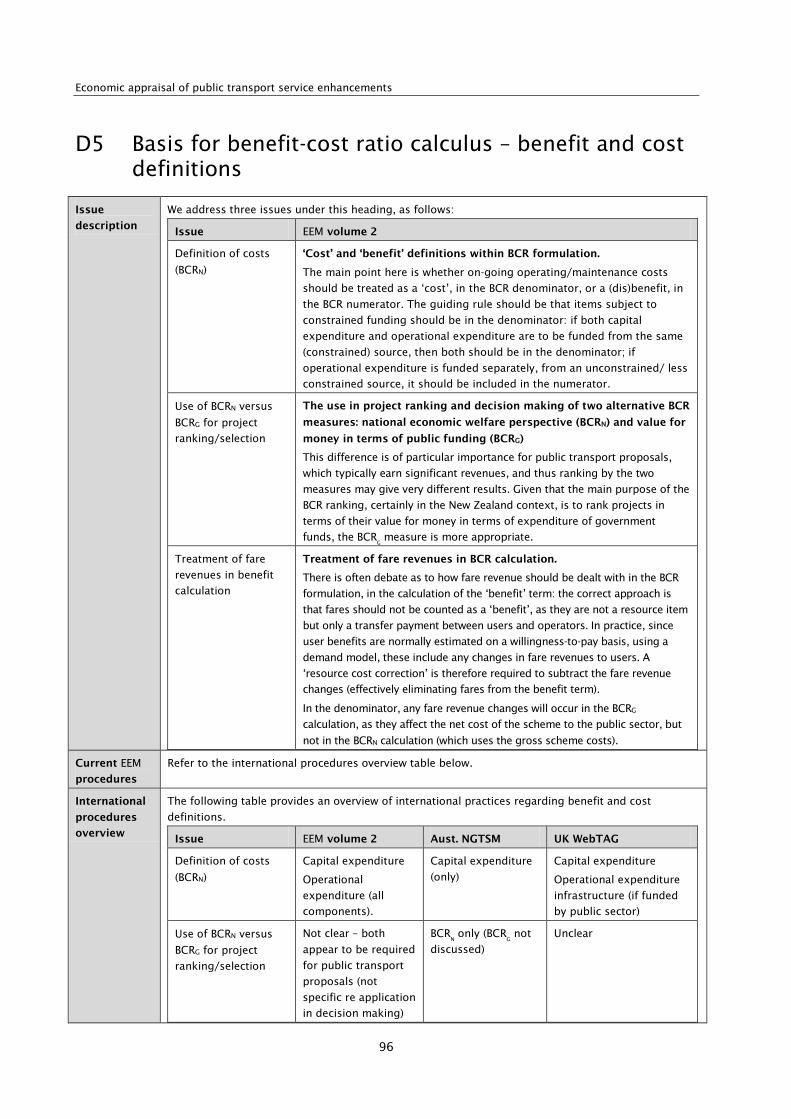
Economic appraisal of public transport service enhancements
96
D5 Basis for benefit-cost ratio calculus – benefit and cost definitions
Issue
description
We address three issues under this heading, as follows:
Issue EEM volume 2
Definition of costs
(BCRN)
‘Cost’ and ‘benefit’ definitions within BCR formulation.
The main point here is whether on-going operating/maintenance costs
should be treated as a ‘cost’, in the BCR denominator, or a (dis)benefit, in
the BCR numerator. The guiding rule should be that items subject to
constrained funding should be in the denominator: if both capital
expenditure and operational expenditure are to be funded from the same
(constrained) source, then both should be in the denominator; if
operational expenditure is funded separately, from an unconstrained/ less
constrained source, it should be included in the numerator.
Use of BCRN versus
BCRG for project
ranking/selection
The use in project ranking and decision making of two alternative BCR
measures: national economic welfare perspective (BCRN) and value for
money in terms of public funding (BCRG)
This difference is of particular importance for public transport proposals,
which typically earn significant revenues, and thus ranking by the two
measures may give very different results. Given that the main purpose of the
BCR ranking, certainly in the New Zealand context, is to rank projects in
terms of their value for money in terms of expenditure of government
funds, the BCRG measure is more appropriate.
Treatment of fare
revenues in benefit
calculation
Treatment of fare revenues in BCR calculation.
There is often debate as to how fare revenue should be dealt with in the BCR
formulation, in the calculation of the ‘benefit’ term: the correct approach is
that fares should not be counted as a ‘benefit’, as they are not a resource item
but only a transfer payment between users and operators. In practice, since
user benefits are normally estimated on a willingness-to-pay basis, using a
demand model, these include any changes in fare revenues to users. A
‘resource cost correction’ is therefore required to subtract the fare revenue
changes (effectively eliminating fares from the benefit term).
In the denominator, any fare revenue changes will occur in the BCRG
calculation, as they affect the net cost of the scheme to the public sector, but
not in the BCRN calculation (which uses the gross scheme costs).
Current EEM
procedures
Refer to the international procedures overview table below.
International
procedures
overview
The following table provides an overview of international practices regarding benefit and cost
definitions.
Issue EEM volume 2 Aust. NGTSM UK WebTAG
Definition of costs
(BCRN)
Capital expenditure
Operational
expenditure (all
components).
Capital expenditure
(only)
Capital expenditure
Operational expenditure
infrastructure (if funded
by public sector)
Use of BCRN versus
BCRG for project
ranking/selection
Not clear – both
appear to be required
for public transport
proposals (not
specific re application
in decision making)
BCRN only (BCR
G not
discussed)
Unclear
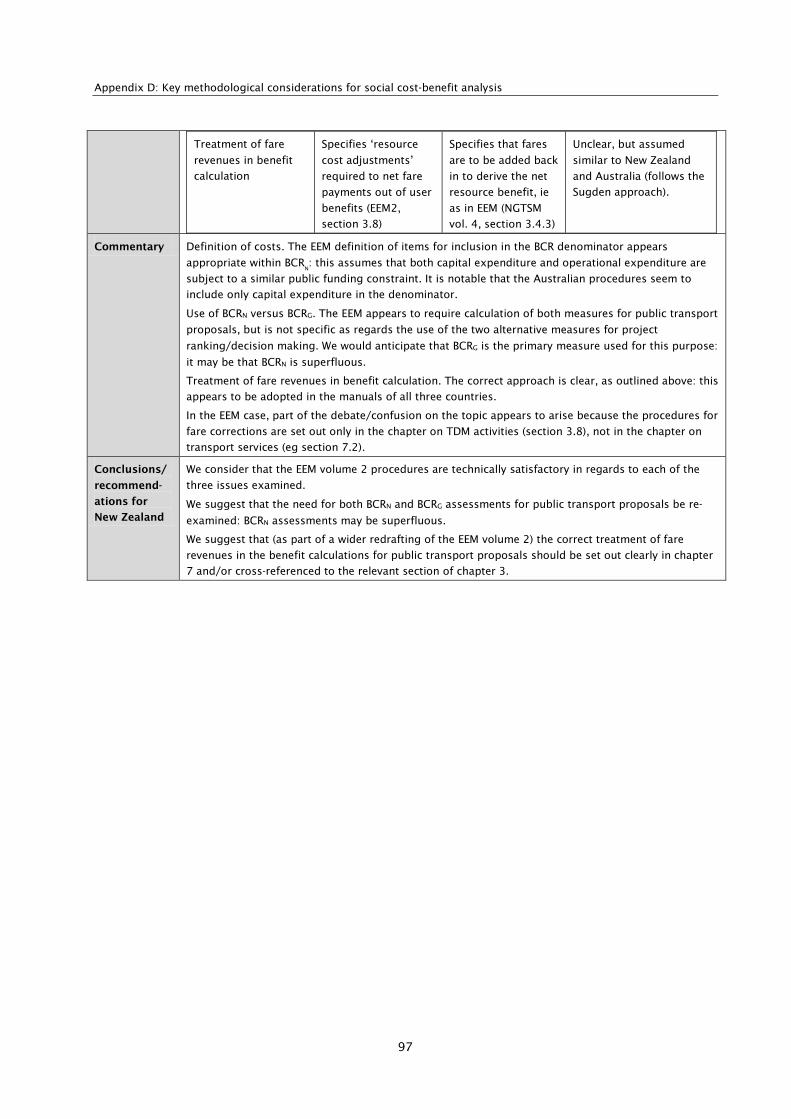
Appendix D: Key methodological considerations for social cost-benefit analysis
97
Treatment of fare
revenues in benefit
calculation
Specifies ‘resource
cost adjustments’
required to net fare
payments out of user
benefits (EEM2,
section 3.8)
Specifies that fares
are to be added back
in to derive the net
resource benefit, ie
as in EEM (NGTSM
vol. 4, section 3.4.3)
Unclear, but assumed
similar to New Zealand
and Australia (follows the
Sugden approach).
Commentary Definition of costs. The EEM definition of items for inclusion in the BCR denominator appears
appropriate within BCRN: this assumes that both capital expenditure and operational expenditure are
subject to a similar public funding constraint. It is notable that the Australian procedures seem to
include only capital expenditure in the denominator.
Use of BCRN versus BCRG. The EEM appears to require calculation of both measures for public transport
proposals, but is not specific as regards the use of the two alternative measures for project
ranking/decision making. We would anticipate that BCRG is the primary measure used for this purpose:
it may be that BCRN is superfluous.
Treatment of fare revenues in benefit calculation. The correct approach is clear, as outlined above: this
appears to be adopted in the manuals of all three countries.
In the EEM case, part of the debate/confusion on the topic appears to arise because the procedures for
fare corrections are set out only in the chapter on TDM activities (section 3.8), not in the chapter on
transport services (eg section 7.2).
Conclusions/
recommend-
ations for
New Zealand
We consider that the EEM volume 2 procedures are technically satisfactory in regards to each of the
three issues examined.
We suggest that the need for both BCRN and BCRG assessments for public transport proposals be re-
examined: BCRN assessments may be superfluous.
We suggest that (as part of a wider redrafting of the EEM volume 2) the correct treatment of fare
revenues in the benefit calculations for public transport proposals should be set out clearly in chapter
7 and/or cross-referenced to the relevant section of chapter 3.
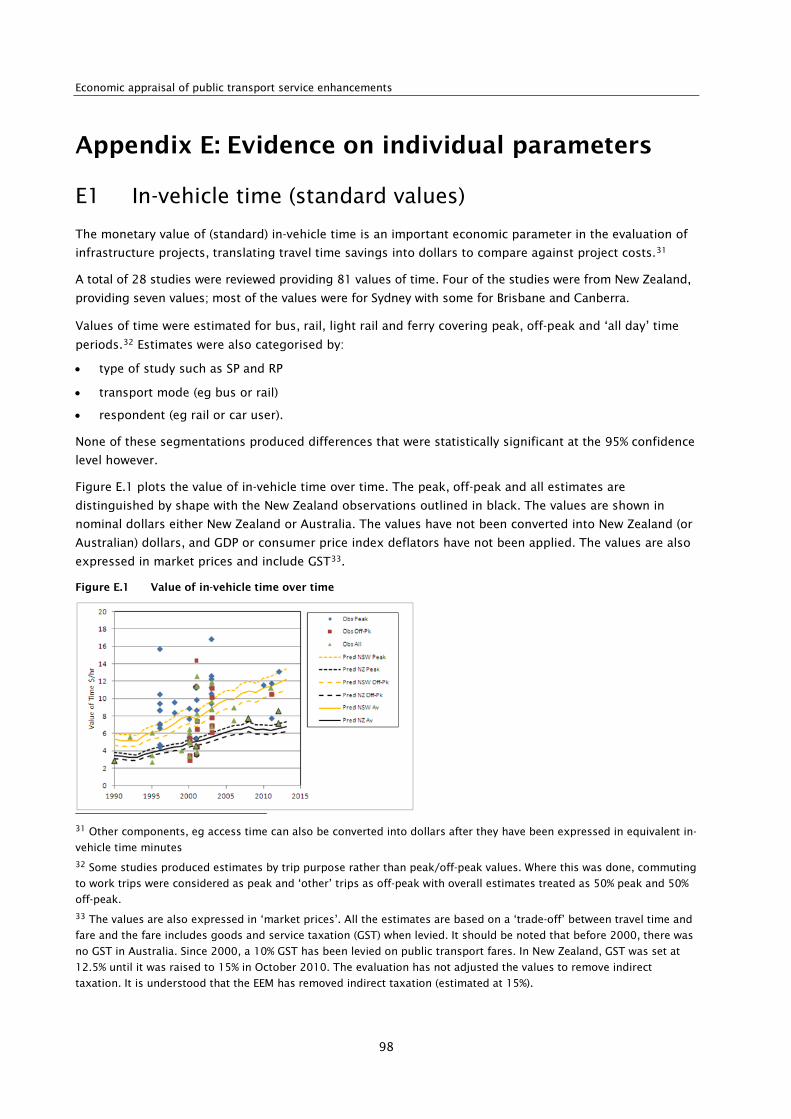
Economic appraisal of public transport service enhancements
98
Appendix E: Evidence on individual parameters
E1 In-vehicle time (standard values)
The monetary value of (standard) in-vehicle time is an important economic parameter in the evaluation of
infrastructure projects, translating travel time savings into dollars to compare against project costs.31
A total of 28 studies were reviewed providing 81 values of time. Four of the studies were from New Zealand,
providing seven values; most of the values were for Sydney with some for Brisbane and Canberra.
Values of time were estimated for bus, rail, light rail and ferry covering peak, off-peak and ‘all day’ time
periods.32 Estimates were also categorised by:
• type of study such as SP and RP
• transport mode (eg bus or rail)
• respondent (eg rail or car user).
None of these segmentations produced differences that were statistically significant at the 95% confidence
level however.
Figure E.1 plots the value of in-vehicle time over time. The peak, off-peak and all estimates are
distinguished by shape with the New Zealand observations outlined in black. The values are shown in
nominal dollars either New Zealand or Australia. The values have not been converted into New Zealand (or
Australian) dollars, and GDP or consumer price index deflators have not been applied. The values are also
expressed in market prices and include GST33.
Figure E.1 Value of in-vehicle time over time
31 Other components, eg access time can also be converted into dollars after they have been expressed in equivalent in-
vehicle time minutes
32 Some studies produced estimates by trip purpose rather than peak/off-peak values. Where this was done, commuting
to work trips were considered as peak and ‘other’ trips as off-peak with overall estimates treated as 50% peak and 50%
off-peak. 33 The values are also expressed in ‘market prices’. All the estimates are based on a ‘trade-off’ between travel time and
fare and the fare includes goods and service taxation (GST) when levied. It should be noted that before 2000, there was
no GST in Australia. Since 2000, a 10% GST has been levied on public transport fares. In New Zealand, GST was set at
12.5% until it was raised to 15% in October 2010. The evaluation has not adjusted the values to remove indirect
taxation. It is understood that the EEM has removed indirect taxation (estimated at 15%).

Appendix E: Evidence on individual parameters
99
The graph also shows the predicted value of time for each year for New Zealand and Australia or more
particularly New South Wales (Australia). Three lines are shown for each: peak (the highest-value); average
and off-peak (the lowest value). The predictions are based on GDP per person (GDPP). Alternative models
using a time trend and a consumer price index (CPI) were also fitted but a GDP-based model was preferred
because it gave a better fit than CPI and had the benefit of being able to explain the projection unlike a
time-trend model.
GDP per person for New Zealand was calculated using Statistics NZ figures of national GDP and
population. For Australia, it was calculated using Australian Bureau of Statistics figures of gross state
product and population for New South Wales34 divided by population were used. To relate to values of
time which are on an hourly basis, annual GDP per person was divided by 2000 working hours per year
(based on US and UK DoT).
Rather than modelling the value of time itself, the model fit the ratio of the value of time over hourly GDPP.
The best prediction model allowed for different responsiveness to GDP for New Zealand and also for peak
trips. Equation E.1 shows the fitted model with standard errors in parenthesis.
VOT/(GDPP/hr) = -0.577 + (0.276 + 0.063NZ + 0.024Pk) (in GDPP/hr) (0.401) (0.126) (0.028) (0.011) (Equation E.1)
The fitted model indicates that the ratio of the value of time to GDPP increased over the 20-year period as
GDP increased. People were willing to spend proportionately more to save time as incomes rose. This is
reflected in the 0.276 parameter. New Zealand was estimated to be more responsive per dollar
(New Zealand versus Australian dollar) than New South Wales (Australia) (reflected in the 0.063
parameter). Finally, peak travellers were more responsive than off-peak travellers (reflected in the 0.024
parameter). The functional form means that the relationship flattens off as GDPP continues to increase.
For 1990, hourly GDP was NZ$11.85 for New Zealand and A$19.34 for New South Wales (Australia).
New Zealand hourly GDPP was therefore 61% that of New South Wales (Australia). The first-value of time
was an estimate of $2.87 per hour for Wellington rail travel. Thus the value of time was around one
quarter of hourly GDPP. The first tabulated Australia value of time was $5.61 per hour for Sydney rail in
1992, around 30% of hourly GDPP.
By 2012, hourly GDPP in New South Wales (Australia) had increased to A$29.60 and to NZ$16.30 per hour
in New Zealand. By comparison, values of time increased to just over A$13 per hour for Sydney public
transport and to NZ$8.56 and NZ$7.13 per hour for Wellington rail and bus services. As a percentage of
hourly GDPP, the average value of time in 2012 had risen to 41% for New South Wales (Australia) and 42%
for New Zealand. Thus with these examples, it can be seen that the value of time increased
proportionately more than GDPP over the two decades from around 25% to 30% in 1990 to just over 40% in
2012.35 Moreover, as can be seen from figure E.1, the value of time rose consistently with the rise steeper
for New South Wales (Australia) than for New Zealand.
Comparing 2012 with 1992, New South Wales (Australia) GDPP rose by 156% and New Zealand GDPP by
142% which compares with more than a doubling in the predicted average value of time (New South Wales
228% and New Zealand 203%). Thus at 1.45, the elasticity of the value of time with respect to GDPP was
34 Gross state product is equivalent to GDP.
35 By comparison, in the 1970s and 80s, the Ministry of Transport in the United Kingdom set the standard value of time
at 25% of the average gross wage rate. In 1987, the Department of Transport increased the standard value to 43% of
average hourly earnings of full time adult employees and updated the value in proportion to the change in real income
(DfT 1987).
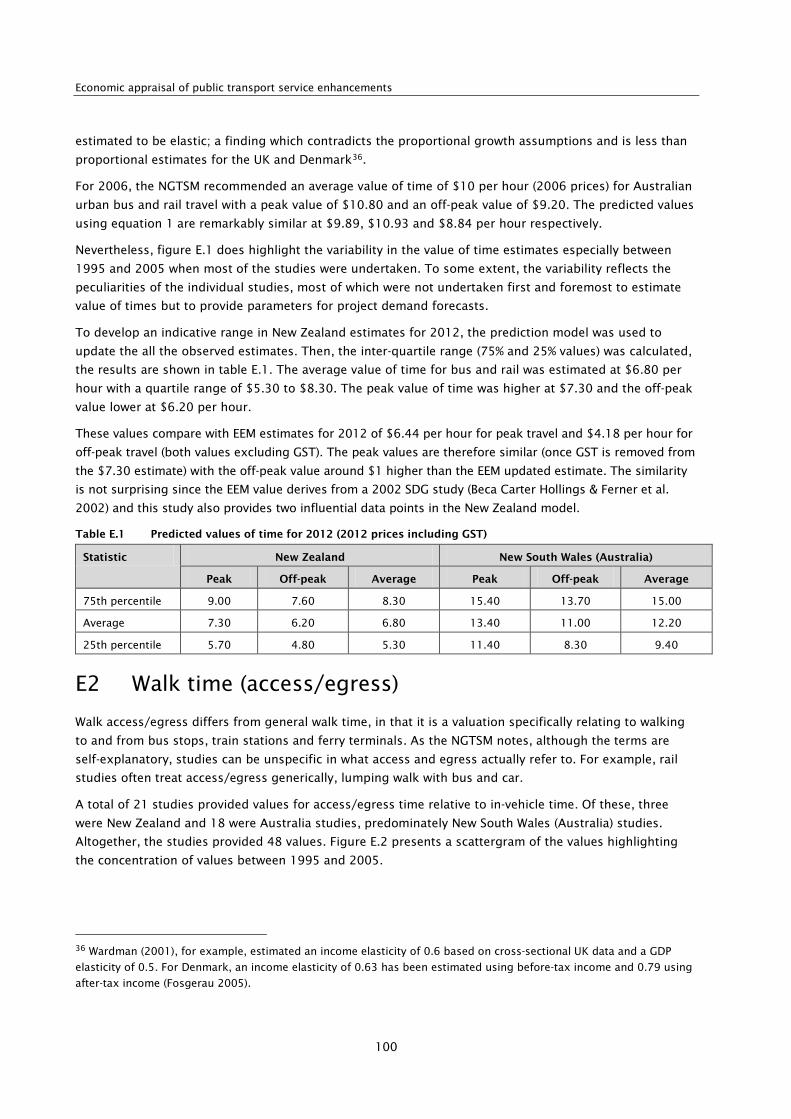
Economic appraisal of public transport service enhancements
100
estimated to be elastic; a finding which contradicts the proportional growth assumptions and is less than
proportional estimates for the UK and Denmark36.
For 2006, the NGTSM recommended an average value of time of $10 per hour (2006 prices) for Australian
urban bus and rail travel with a peak value of $10.80 and an off-peak value of $9.20. The predicted values
using equation 1 are remarkably similar at $9.89, $10.93 and $8.84 per hour respectively.
Nevertheless, figure E.1 does highlight the variability in the value of time estimates especially between
1995 and 2005 when most of the studies were undertaken. To some extent, the variability reflects the
peculiarities of the individual studies, most of which were not undertaken first and foremost to estimate
value of times but to provide parameters for project demand forecasts.
To develop an indicative range in New Zealand estimates for 2012, the prediction model was used to
update the all the observed estimates. Then, the inter-quartile range (75% and 25% values) was calculated,
the results are shown in table E.1. The average value of time for bus and rail was estimated at $6.80 per
hour with a quartile range of $5.30 to $8.30. The peak value of time was higher at $7.30 and the off-peak
value lower at $6.20 per hour.
These values compare with EEM estimates for 2012 of $6.44 per hour for peak travel and $4.18 per hour for
off-peak travel (both values excluding GST). The peak values are therefore similar (once GST is removed from
the $7.30 estimate) with the off-peak value around $1 higher than the EEM updated estimate. The similarity
is not surprising since the EEM value derives from a 2002 SDG study (Beca Carter Hollings & Ferner et al.
2002) and this study also provides two influential data points in the New Zealand model.
Table E.1 Predicted values of time for 2012 (2012 prices including GST)
Statistic New Zealand New South Wales (Australia)
Peak Off-peak Average Peak Off-peak Average
75th percentile 9.00 7.60 8.30 15.40 13.70 15.00
Average 7.30 6.20 6.80 13.40 11.00 12.20
25th percentile 5.70 4.80 5.30 11.40 8.30 9.40
E2 Walk time (access/egress)
Walk access/egress differs from general walk time, in that it is a valuation specifically relating to walking
to and from bus stops, train stations and ferry terminals. As the NGTSM notes, although the terms are
self-explanatory, studies can be unspecific in what access and egress actually refer to. For example, rail
studies often treat access/egress generically, lumping walk with bus and car.
A total of 21 studies provided values for access/egress time relative to in-vehicle time. Of these, three
were New Zealand and 18 were Australia studies, predominately New South Wales (Australia) studies.
Altogether, the studies provided 48 values. Figure E.2 presents a scattergram of the values highlighting
the concentration of values between 1995 and 2005.
36 Wardman (2001), for example, estimated an income elasticity of 0.6 based on cross-sectional UK data and a GDP
elasticity of 0.5. For Denmark, an income elasticity of 0.63 has been estimated using before-tax income and 0.79 using
after-tax income (Fosgerau 2005).
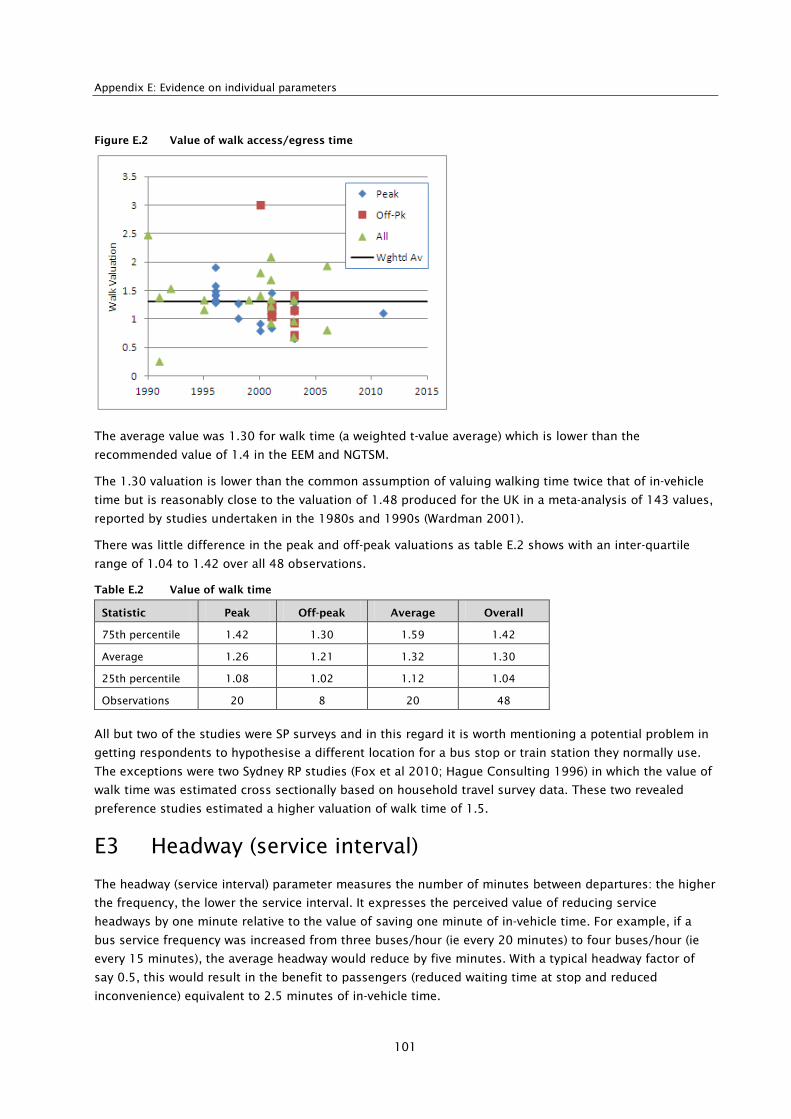
Appendix E: Evidence on individual parameters
101
Figure E.2 Value of walk access/egress time
The average value was 1.30 for walk time (a weighted t-value average) which is lower than the
recommended value of 1.4 in the EEM and NGTSM.
The 1.30 valuation is lower than the common assumption of valuing walking time twice that of in-vehicle
time but is reasonably close to the valuation of 1.48 produced for the UK in a meta-analysis of 143 values,
reported by studies undertaken in the 1980s and 1990s (Wardman 2001).
There was little difference in the peak and off-peak valuations as table E.2 shows with an inter-quartile
range of 1.04 to 1.42 over all 48 observations.
Table E.2 Value of walk time
Statistic Peak Off-peak Average Overall
75th percentile 1.42 1.30 1.59 1.42
Average 1.26 1.21 1.32 1.30
25th percentile 1.08 1.02 1.12 1.04
Observations 20 8 20 48
All but two of the studies were SP surveys and in this regard it is worth mentioning a potential problem in
getting respondents to hypothesise a different location for a bus stop or train station they normally use.
The exceptions were two Sydney RP studies (Fox et al 2010; Hague Consulting 1996) in which the value of
walk time was estimated cross sectionally based on household travel survey data. These two revealed
preference studies estimated a higher valuation of walk time of 1.5.
E3 Headway (service interval)
The headway (service interval) parameter measures the number of minutes between departures: the higher
the frequency, the lower the service interval. It expresses the perceived value of reducing service
headways by one minute relative to the value of saving one minute of in-vehicle time. For example, if a
bus service frequency was increased from three buses/hour (ie every 20 minutes) to four buses/hour (ie
every 15 minutes), the average headway would reduce by five minutes. With a typical headway factor of
say 0.5, this would result in the benefit to passengers (reduced waiting time at stop and reduced
inconvenience) equivalent to 2.5 minutes of in-vehicle time.
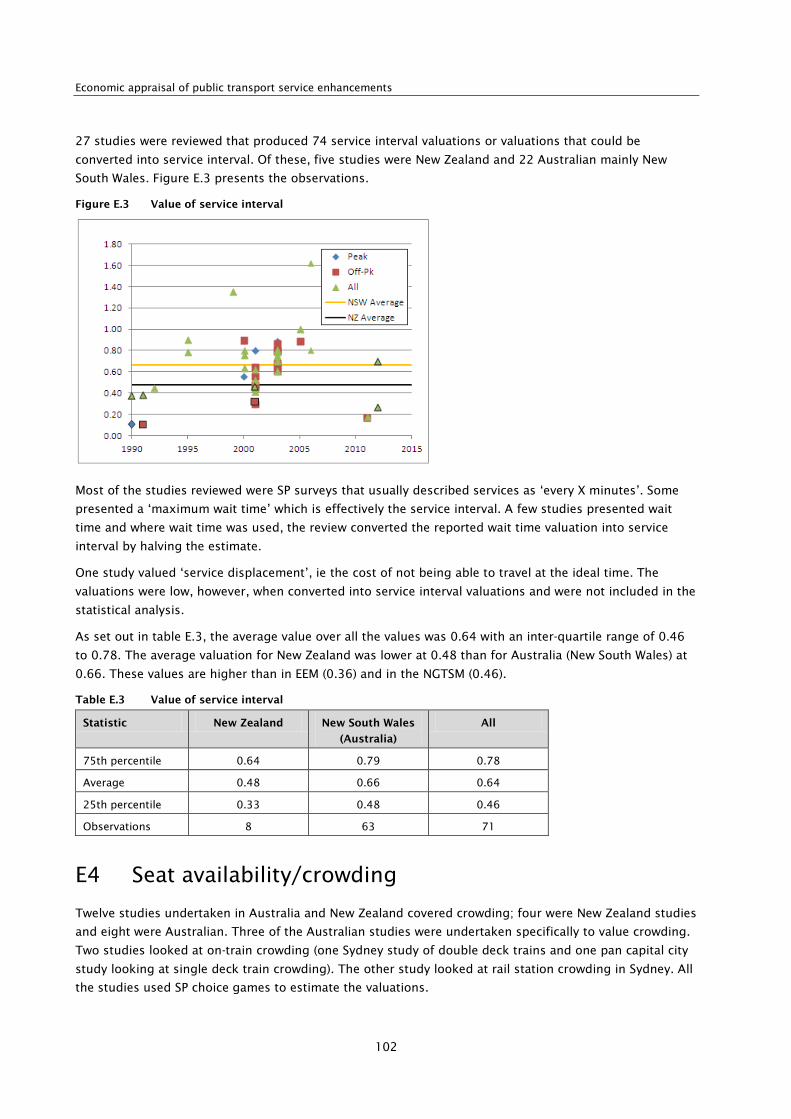
Economic appraisal of public transport service enhancements
102
27 studies were reviewed that produced 74 service interval valuations or valuations that could be
converted into service interval. Of these, five studies were New Zealand and 22 Australian mainly New
South Wales. Figure E.3 presents the observations.
Figure E.3 Value of service interval
Most of the studies reviewed were SP surveys that usually described services as ‘every X minutes’. Some
presented a ‘maximum wait time’ which is effectively the service interval. A few studies presented wait
time and where wait time was used, the review converted the reported wait time valuation into service
interval by halving the estimate.
One study valued ‘service displacement’, ie the cost of not being able to travel at the ideal time. The
valuations were low, however, when converted into service interval valuations and were not included in the
statistical analysis.
As set out in table E.3, the average value over all the values was 0.64 with an inter-quartile range of 0.46
to 0.78. The average valuation for New Zealand was lower at 0.48 than for Australia (New South Wales) at
0.66. These values are higher than in EEM (0.36) and in the NGTSM (0.46).
Table E.3 Value of service interval
Statistic New Zealand New South Wales
(Australia)
All
75th percentile 0.64 0.79 0.78
Average 0.48 0.66 0.64
25th percentile 0.33 0.48 0.46
Observations 8 63 71
E4 Seat availability/crowding
Twelve studies undertaken in Australia and New Zealand covered crowding; four were New Zealand studies
and eight were Australian. Three of the Australian studies were undertaken specifically to value crowding.
Two studies looked at on-train crowding (one Sydney study of double deck trains and one pan capital city
study looking at single deck train crowding). The other study looked at rail station crowding in Sydney. All
the studies used SP choice games to estimate the valuations.
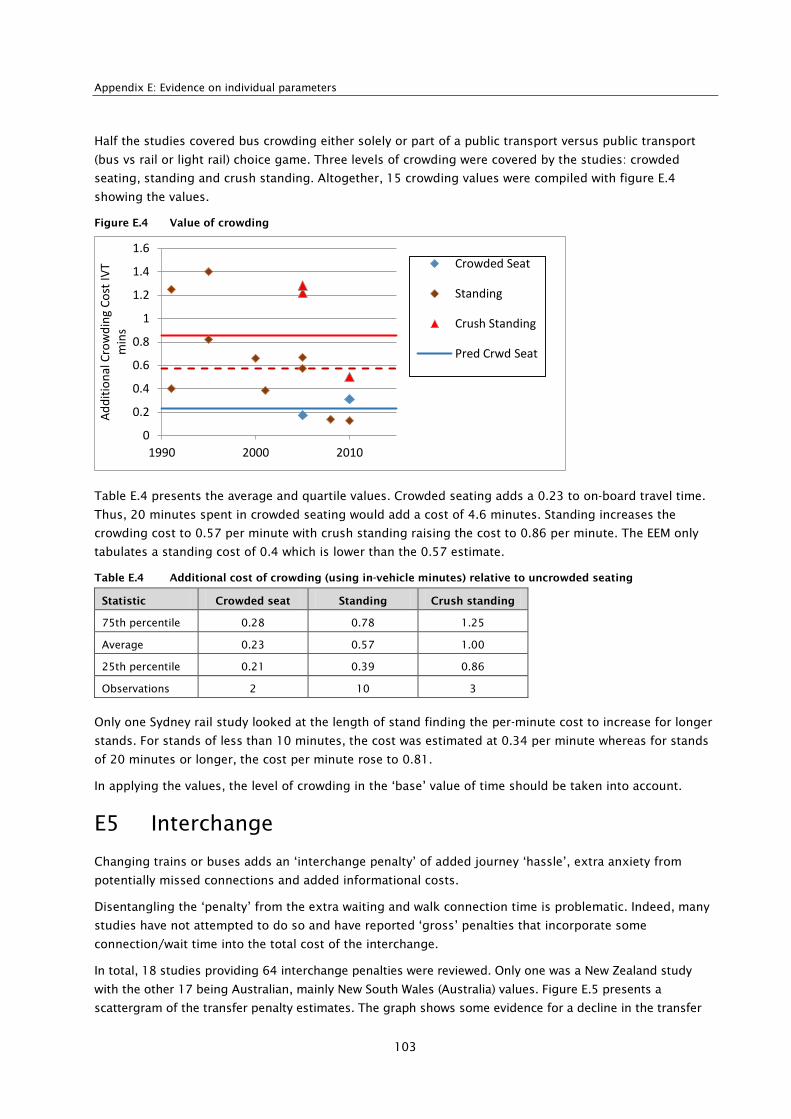
Appendix E: Evidence on individual parameters
103
Half the studies covered bus crowding either solely or part of a public transport versus public transport
(bus vs rail or light rail) choice game. Three levels of crowding were covered by the studies: crowded
seating, standing and crush standing. Altogether, 15 crowding values were compiled with figure E.4
showing the values.
Figure E.4 Value of crowding
Table E.4 presents the average and quartile values. Crowded seating adds a 0.23 to on-board travel time.
Thus, 20 minutes spent in crowded seating would add a cost of 4.6 minutes. Standing increases the
crowding cost to 0.57 per minute with crush standing raising the cost to 0.86 per minute. The EEM only
tabulates a standing cost of 0.4 which is lower than the 0.57 estimate.
Table E.4 Additional cost of crowding (using in-vehicle minutes) relative to uncrowded seating
Statistic Crowded seat Standing Crush standing
75th percentile 0.28 0.78 1.25
Average 0.23 0.57 1.00
25th percentile 0.21 0.39 0.86
Observations 2 10 3
Only one Sydney rail study looked at the length of stand finding the per-minute cost to increase for longer
stands. For stands of less than 10 minutes, the cost was estimated at 0.34 per minute whereas for stands
of 20 minutes or longer, the cost per minute rose to 0.81.
In applying the values, the level of crowding in the ‘base’ value of time should be taken into account.
E5 Interchange
Changing trains or buses adds an ‘interchange penalty’ of added journey ‘hassle’, extra anxiety from
potentially missed connections and added informational costs.
Disentangling the ‘penalty’ from the extra waiting and walk connection time is problematic. Indeed, many
studies have not attempted to do so and have reported ‘gross’ penalties that incorporate some
connection/wait time into the total cost of the interchange.
In total, 18 studies providing 64 interchange penalties were reviewed. Only one was a New Zealand study
with the other 17 being Australian, mainly New South Wales (Australia) values. Figure E.5 presents a
scattergram of the transfer penalty estimates. The graph shows some evidence for a decline in the transfer
0
0.2
0.4
0.6
0.8
1
1.2
1.4
1.6
1990 2000 2010
Add
ition
al C
row
ding
Cos
t IV
T m
ins
Crowded Seat
Standing
Crush Standing
Pred Crwd Seat
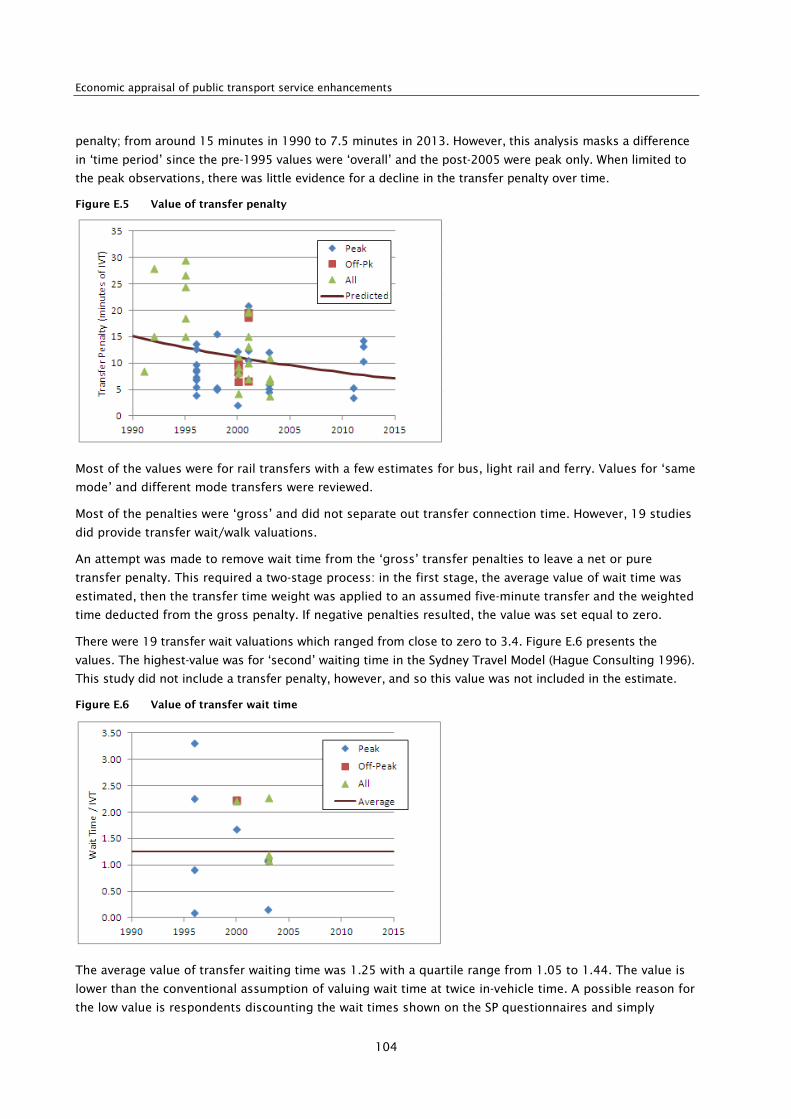
Economic appraisal of public transport service enhancements
104
penalty; from around 15 minutes in 1990 to 7.5 minutes in 2013. However, this analysis masks a difference
in ‘time period’ since the pre-1995 values were ‘overall’ and the post-2005 were peak only. When limited to
the peak observations, there was little evidence for a decline in the transfer penalty over time.
Figure E.5 Value of transfer penalty
Most of the values were for rail transfers with a few estimates for bus, light rail and ferry. Values for ‘same
mode’ and different mode transfers were reviewed.
Most of the penalties were ‘gross’ and did not separate out transfer connection time. However, 19 studies
did provide transfer wait/walk valuations.
An attempt was made to remove wait time from the ‘gross’ transfer penalties to leave a net or pure
transfer penalty. This required a two-stage process: in the first stage, the average value of wait time was
estimated, then the transfer time weight was applied to an assumed five-minute transfer and the weighted
time deducted from the gross penalty. If negative penalties resulted, the value was set equal to zero.
There were 19 transfer wait valuations which ranged from close to zero to 3.4. Figure E.6 presents the
values. The highest-value was for ‘second’ waiting time in the Sydney Travel Model (Hague Consulting 1996).
This study did not include a transfer penalty, however, and so this value was not included in the estimate.
Figure E.6 Value of transfer wait time
The average value of transfer waiting time was 1.25 with a quartile range from 1.05 to 1.44. The value is
lower than the conventional assumption of valuing wait time at twice in-vehicle time. A possible reason for
the low value is respondents discounting the wait times shown on the SP questionnaires and simply
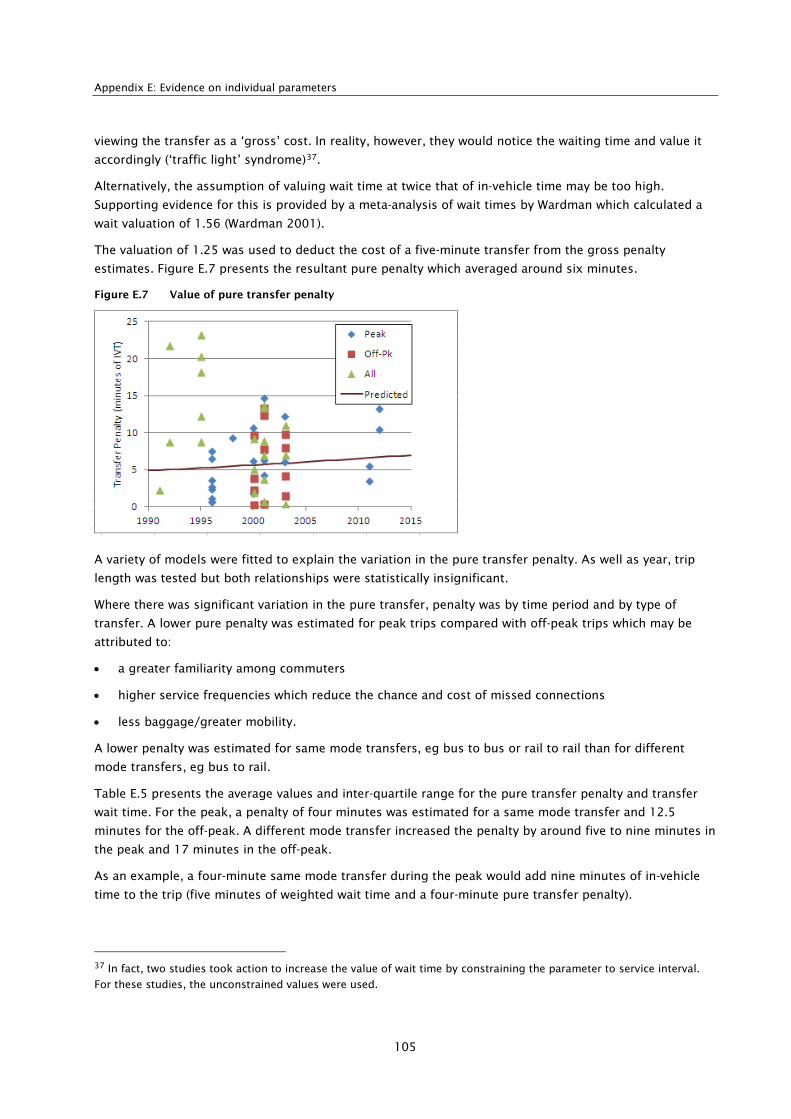
Appendix E: Evidence on individual parameters
105
viewing the transfer as a ‘gross’ cost. In reality, however, they would notice the waiting time and value it
accordingly (‘traffic light’ syndrome)37.
Alternatively, the assumption of valuing wait time at twice that of in-vehicle time may be too high.
Supporting evidence for this is provided by a meta-analysis of wait times by Wardman which calculated a
wait valuation of 1.56 (Wardman 2001).
The valuation of 1.25 was used to deduct the cost of a five-minute transfer from the gross penalty
estimates. Figure E.7 presents the resultant pure penalty which averaged around six minutes.
Figure E.7 Value of pure transfer penalty
A variety of models were fitted to explain the variation in the pure transfer penalty. As well as year, trip
length was tested but both relationships were statistically insignificant.
Where there was significant variation in the pure transfer, penalty was by time period and by type of
transfer. A lower pure penalty was estimated for peak trips compared with off-peak trips which may be
attributed to:
• a greater familiarity among commuters
• higher service frequencies which reduce the chance and cost of missed connections
• less baggage/greater mobility.
A lower penalty was estimated for same mode transfers, eg bus to bus or rail to rail than for different
mode transfers, eg bus to rail.
Table E.5 presents the average values and inter-quartile range for the pure transfer penalty and transfer
wait time. For the peak, a penalty of four minutes was estimated for a same mode transfer and 12.5
minutes for the off-peak. A different mode transfer increased the penalty by around five to nine minutes in
the peak and 17 minutes in the off-peak.
As an example, a four-minute same mode transfer during the peak would add nine minutes of in-vehicle
time to the trip (five minutes of weighted wait time and a four-minute pure transfer penalty).
37 In fact, two studies took action to increase the value of wait time by constraining the parameter to service interval.
For these studies, the unconstrained values were used.
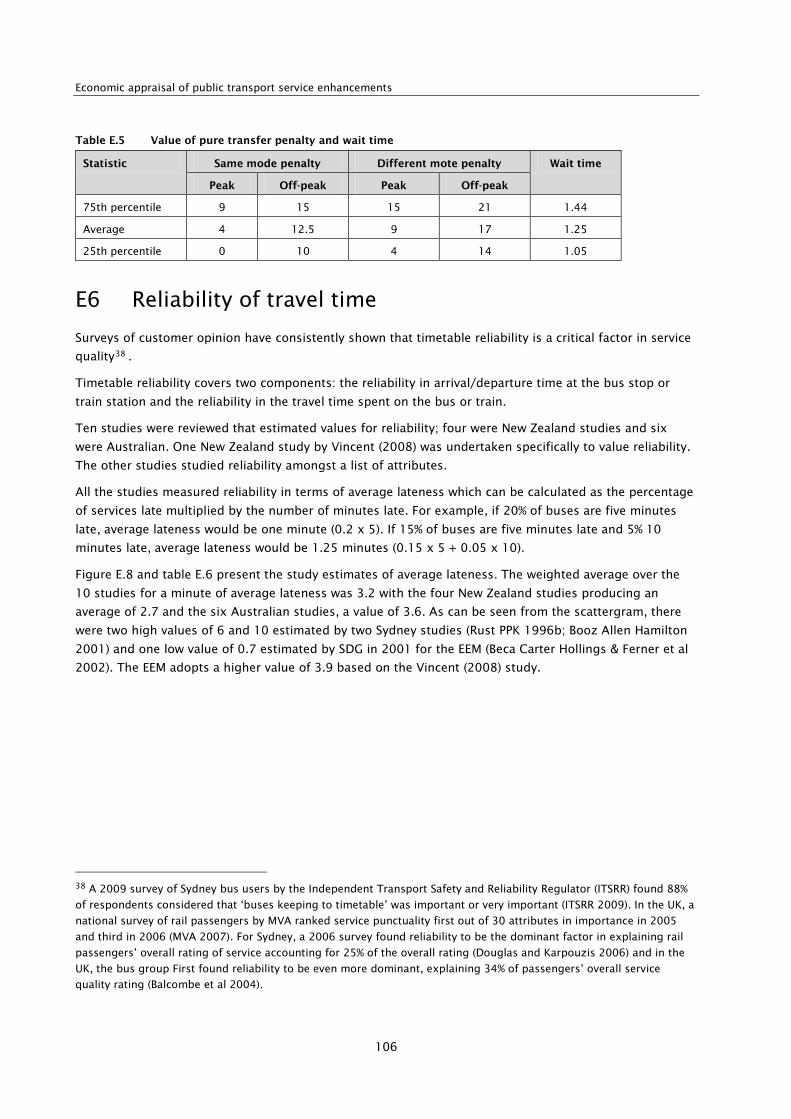
Economic appraisal of public transport service enhancements
106
Table E.5 Value of pure transfer penalty and wait time
Statistic Same mode penalty Different mote penalty Wait time
Peak Off-peak Peak Off-peak
75th percentile 9 15 15 21 1.44
Average 4 12.5 9 17 1.25
25th percentile 0 10 4 14 1.05
E6 Reliability of travel time
Surveys of customer opinion have consistently shown that timetable reliability is a critical factor in service
quality38 .
Timetable reliability covers two components: the reliability in arrival/departure time at the bus stop or
train station and the reliability in the travel time spent on the bus or train.
Ten studies were reviewed that estimated values for reliability; four were New Zealand studies and six
were Australian. One New Zealand study by Vincent (2008) was undertaken specifically to value reliability.
The other studies studied reliability amongst a list of attributes.
All the studies measured reliability in terms of average lateness which can be calculated as the percentage
of services late multiplied by the number of minutes late. For example, if 20% of buses are five minutes
late, average lateness would be one minute (0.2 x 5). If 15% of buses are five minutes late and 5% 10
minutes late, average lateness would be 1.25 minutes (0.15 x 5 + 0.05 x 10).
Figure E.8 and table E.6 present the study estimates of average lateness. The weighted average over the
10 studies for a minute of average lateness was 3.2 with the four New Zealand studies producing an
average of 2.7 and the six Australian studies, a value of 3.6. As can be seen from the scattergram, there
were two high values of 6 and 10 estimated by two Sydney studies (Rust PPK 1996b; Booz Allen Hamilton
2001) and one low value of 0.7 estimated by SDG in 2001 for the EEM (Beca Carter Hollings & Ferner et al
2002). The EEM adopts a higher value of 3.9 based on the Vincent (2008) study.
38 A 2009 survey of Sydney bus users by the Independent Transport Safety and Reliability Regulator (ITSRR) found 88%
of respondents considered that ‘buses keeping to timetable’ was important or very important (ITSRR 2009). In the UK, a
national survey of rail passengers by MVA ranked service punctuality first out of 30 attributes in importance in 2005
and third in 2006 (MVA 2007). For Sydney, a 2006 survey found reliability to be the dominant factor in explaining rail
passengers’ overall rating of service accounting for 25% of the overall rating (Douglas and Karpouzis 2006) and in the
UK, the bus group First found reliability to be even more dominant, explaining 34% of passengers’ overall service
quality rating (Balcombe et al 2004).
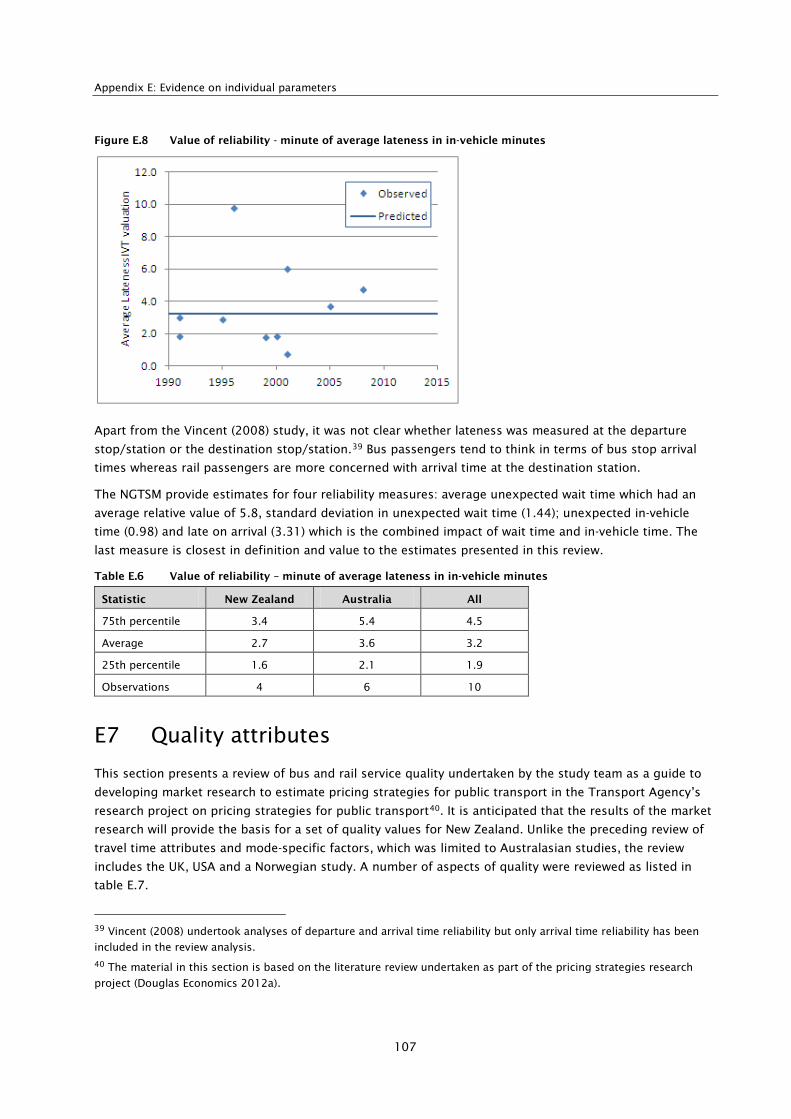
Appendix E: Evidence on individual parameters
107
Figure E.8 Value of reliability - minute of average lateness in in-vehicle minutes
Apart from the Vincent (2008) study, it was not clear whether lateness was measured at the departure
stop/station or the destination stop/station.39 Bus passengers tend to think in terms of bus stop arrival
times whereas rail passengers are more concerned with arrival time at the destination station.
The NGTSM provide estimates for four reliability measures: average unexpected wait time which had an
average relative value of 5.8, standard deviation in unexpected wait time (1.44); unexpected in-vehicle
time (0.98) and late on arrival (3.31) which is the combined impact of wait time and in-vehicle time. The
last measure is closest in definition and value to the estimates presented in this review.
Table E.6 Value of reliability – minute of average lateness in in-vehicle minutes
Statistic New Zealand Australia All
75th percentile 3.4 5.4 4.5
Average 2.7 3.6 3.2
25th percentile 1.6 2.1 1.9
Observations 4 6 10
E7 Quality attributes
This section presents a review of bus and rail service quality undertaken by the study team as a guide to
developing market research to estimate pricing strategies for public transport in the Transport Agency’s
research project on pricing strategies for public transport40. It is anticipated that the results of the market
research will provide the basis for a set of quality values for New Zealand. Unlike the preceding review of
travel time attributes and mode-specific factors, which was limited to Australasian studies, the review
includes the UK, USA and a Norwegian study. A number of aspects of quality were reviewed as listed in
table E.7.
39 Vincent (2008) undertook analyses of departure and arrival time reliability but only arrival time reliability has been
included in the review analysis.
40 The material in this section is based on the literature review undertaken as part of the pricing strategies research
project (Douglas Economics 2012a).
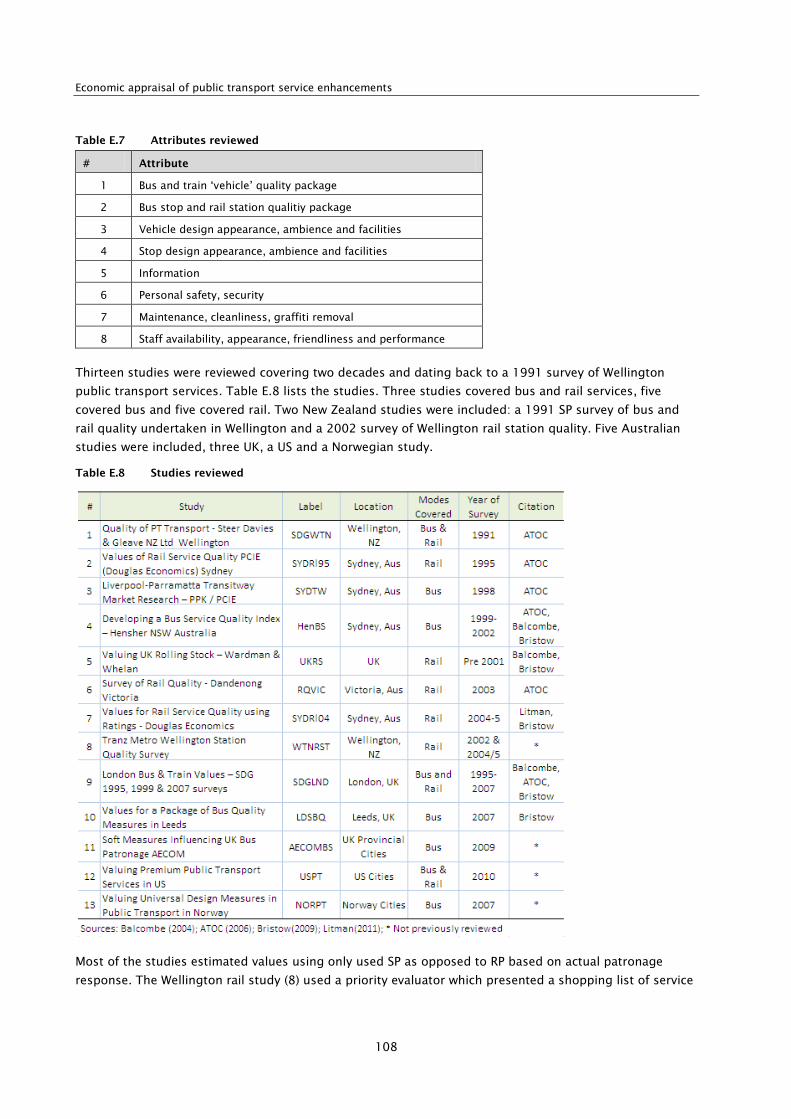
Economic appraisal of public transport service enhancements
108
Table E.7 Attributes reviewed
# Attribute
1 Bus and train ‘vehicle’ quality package
2 Bus stop and rail station qualitiy package
3 Vehicle design appearance, ambience and facilities
4 Stop design appearance, ambience and facilities
5 Information
6 Personal safety, security
7 Maintenance, cleanliness, graffiti removal
8 Staff availability, appearance, friendliness and performance
Thirteen studies were reviewed covering two decades and dating back to a 1991 survey of Wellington
public transport services. Table E.8 lists the studies. Three studies covered bus and rail services, five
covered bus and five covered rail. Two New Zealand studies were included: a 1991 SP survey of bus and
rail quality undertaken in Wellington and a 2002 survey of Wellington rail station quality. Five Australian
studies were included, three UK, a US and a Norwegian study.
Table E.8 Studies reviewed
Most of the studies estimated values using only used SP as opposed to RP based on actual patronage
response. The Wellington rail study (8) used a priority evaluator which presented a shopping list of service
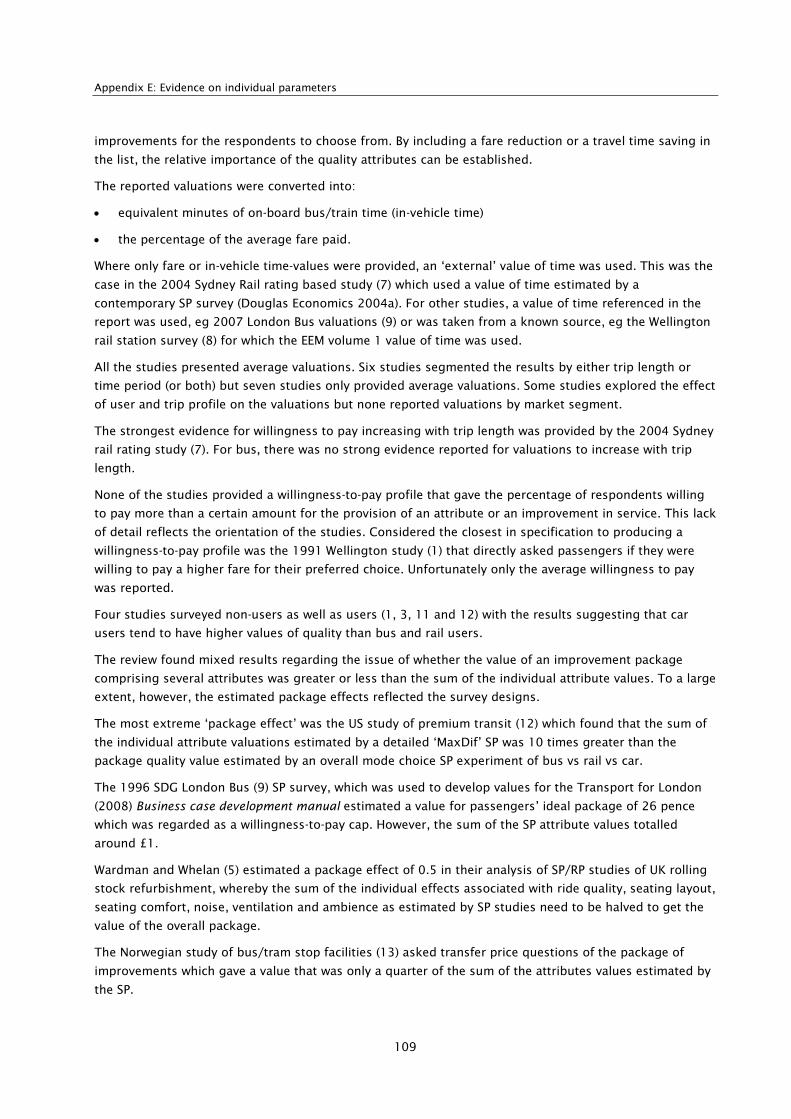
Appendix E: Evidence on individual parameters
109
improvements for the respondents to choose from. By including a fare reduction or a travel time saving in
the list, the relative importance of the quality attributes can be established.
The reported valuations were converted into:
• equivalent minutes of on-board bus/train time (in-vehicle time)
• the percentage of the average fare paid.
Where only fare or in-vehicle time-values were provided, an ‘external’ value of time was used. This was the
case in the 2004 Sydney Rail rating based study (7) which used a value of time estimated by a
contemporary SP survey (Douglas Economics 2004a). For other studies, a value of time referenced in the
report was used, eg 2007 London Bus valuations (9) or was taken from a known source, eg the Wellington
rail station survey (8) for which the EEM volume 1 value of time was used.
All the studies presented average valuations. Six studies segmented the results by either trip length or
time period (or both) but seven studies only provided average valuations. Some studies explored the effect
of user and trip profile on the valuations but none reported valuations by market segment.
The strongest evidence for willingness to pay increasing with trip length was provided by the 2004 Sydney
rail rating study (7). For bus, there was no strong evidence reported for valuations to increase with trip
length.
None of the studies provided a willingness-to-pay profile that gave the percentage of respondents willing
to pay more than a certain amount for the provision of an attribute or an improvement in service. This lack
of detail reflects the orientation of the studies. Considered the closest in specification to producing a
willingness-to-pay profile was the 1991 Wellington study (1) that directly asked passengers if they were
willing to pay a higher fare for their preferred choice. Unfortunately only the average willingness to pay
was reported.
Four studies surveyed non-users as well as users (1, 3, 11 and 12) with the results suggesting that car
users tend to have higher values of quality than bus and rail users.
The review found mixed results regarding the issue of whether the value of an improvement package
comprising several attributes was greater or less than the sum of the individual attribute values. To a large
extent, however, the estimated package effects reflected the survey designs.
The most extreme ‘package effect’ was the US study of premium transit (12) which found that the sum of
the individual attribute valuations estimated by a detailed ‘MaxDif’ SP was 10 times greater than the
package quality value estimated by an overall mode choice SP experiment of bus vs rail vs car.
The 1996 SDG London Bus (9) SP survey, which was used to develop values for the Transport for London
(2008) Business case development manual estimated a value for passengers’ ideal package of 26 pence
which was regarded as a willingness-to-pay cap. However, the sum of the SP attribute values totalled
around £1.
Wardman and Whelan (5) estimated a package effect of 0.5 in their analysis of SP/RP studies of UK rolling
stock refurbishment, whereby the sum of the individual effects associated with ride quality, seating layout,
seating comfort, noise, ventilation and ambience as estimated by SP studies need to be halved to get the
value of the overall package.
The Norwegian study of bus/tram stop facilities (13) asked transfer price questions of the package of
improvements which gave a value that was only a quarter of the sum of the attributes values estimated by
the SP.
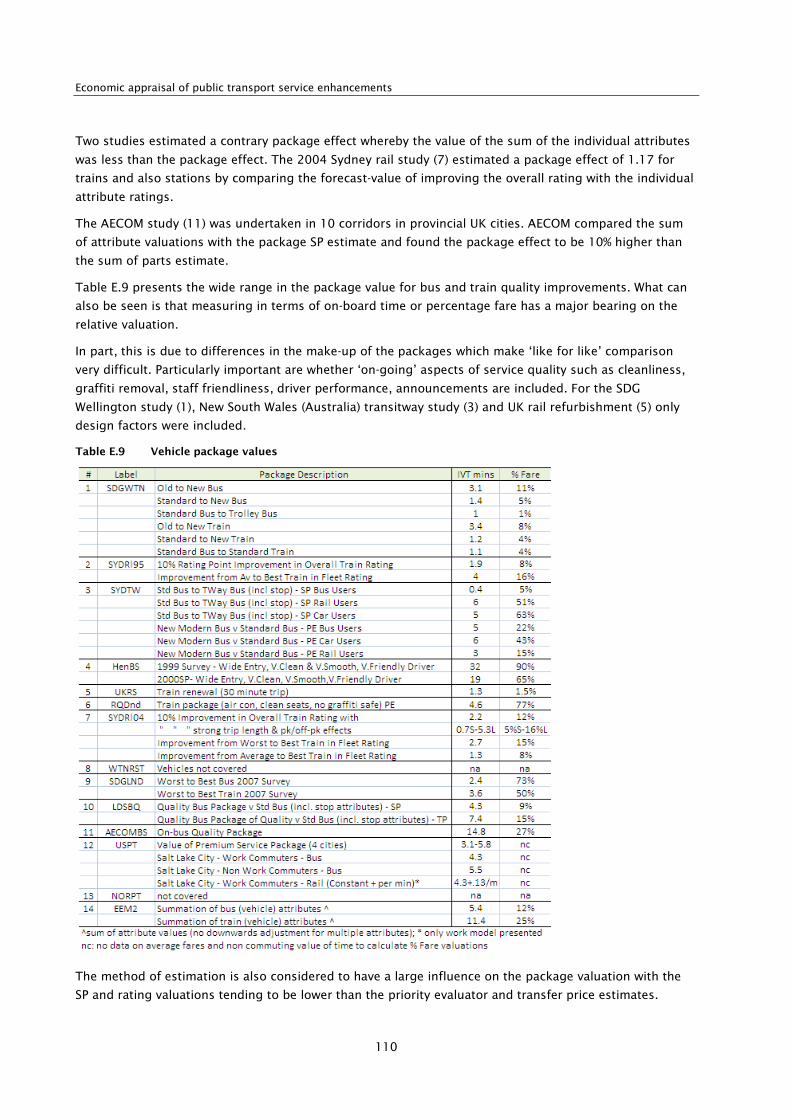
Economic appraisal of public transport service enhancements
110
Two studies estimated a contrary package effect whereby the value of the sum of the individual attributes
was less than the package effect. The 2004 Sydney rail study (7) estimated a package effect of 1.17 for
trains and also stations by comparing the forecast-value of improving the overall rating with the individual
attribute ratings.
The AECOM study (11) was undertaken in 10 corridors in provincial UK cities. AECOM compared the sum
of attribute valuations with the package SP estimate and found the package effect to be 10% higher than
the sum of parts estimate.
Table E.9 presents the wide range in the package value for bus and train quality improvements. What can
also be seen is that measuring in terms of on-board time or percentage fare has a major bearing on the
relative valuation.
In part, this is due to differences in the make-up of the packages which make ‘like for like’ comparison
very difficult. Particularly important are whether ‘on-going’ aspects of service quality such as cleanliness,
graffiti removal, staff friendliness, driver performance, announcements are included. For the SDG
Wellington study (1), New South Wales (Australia) transitway study (3) and UK rail refurbishment (5) only
design factors were included.
Table E.9 Vehicle package values
The method of estimation is also considered to have a large influence on the package valuation with the
SP and rating valuations tending to be lower than the priority evaluator and transfer price estimates.

Appendix E: Evidence on individual parameters
111
A third factor influencing the value was how the package value was calculated. That is, whether it was (a) a
package that was actually presented to respondents enabling a direct estimate to be reported or (b) whether
it has been subsequently calculated by adding the estimated values for individual attributes. If (a), the
package value may have then been adjusted or constrained. A fourth factor was the ‘base’ quality from which
the improvement was measured. Lastly, as should be expected, some of the variation was due to study
context: differences in attribute quality (both base and ‘improvement’); differences in fare and travel time by
which the qualitative attributes were measured against; and differences in respondent and trip profile.
The highest package values were estimated by Hensher from a 1999 survey of bus users. The vehicle
package offering wide entry doors, very clean and smooth buses and very friendly drivers was valued
equal to 32 minutes of travel time or 90% of fare (Hensher and Prioni 2002).
Next highest was the AECOM (11) study which estimated a value of 14.8 minutes (27% of fare) for a bus
quality package including new low floor buses, with climate control (air conditioning), trained drivers, on-
screen displays, audio announcements, CCTV, leather seats, customer charter and in-vehicle seating plan.
The US study of premium bus services (12) estimated lower package values of between 3.1 to 5.8 minutes.
However, the package covered fewer attributes: Wifi, on-board seating availability, seating comfort,
temperature control and vehicle cleanliness. For rail, the package value was estimated to increase with trip
length (0.13 minutes per minute of on-board train time).
The values for London included in the Transport for London (2008) Business case development manual (9)
were lower when expressed in terms of travel time at 2.4 minutes for bus and 3.6 minutes for rail but higher
in terms of fare (73% and 50%). It should be noted that the values were estimated in terms of fare and were
converted as part of this review into minutes by applying an externally derived value of time.
The EEM package values were reasonably exhaustive in attributes included but had not been halved as
recommended in the NGTSM. The estimated bus value of 5.4 minutes was similar to the US public
transport study but was only half the AECOM value. The rail value was higher than the other estimates
when measured in train minutes (11.4) but lower when measured in percentage fare (25%).
A summary of the estimated value of bus stop and rail station values is presented in table E.10. An issue
that was not well addressed was whether the bus stop and rail station values applied to only the board
stop or to the board and alight stops (ie the values were an average for the two stops).
For bus, most of the value was likely to be for the board stop because that is where passengers spend
most of their time (waiting for a bus). Virtually no time is be spent at the alight stop. However, city centre
bus stations may add value through the provision of facilities. Also, the return trip reverses the board and
alight stations.
For rail stations, amenities and ambience offered at an alight station were more important. These included
ease of getting off train, alighting the platform, attractiveness/lighting of the accessways and concourse
and the ease of exiting the ticket barriers. There were also interchange stations to consider where
passengers both alighted, moved around the station and waited for trains.
Only the 1995 Sydney rail study (2) made reference to the number of stations. The station values were
factored down to represent station values according to the number of stations used per trip (2.1) whereas
the 2004 study (7) asked passengers only about their board station. The 2004 study referred to board
station on the questionnaire and the Wellington survey (8) referred to a nominated station.
Like the vehicle package values, the composition of the packages varied which makes comparisons
difficult. Some included information such as the Hensher value (4). The US study (12) included personal
security whereas others were limited to weather protection, seat provision, lighting etc.

Economic appraisal of public transport service enhancements
112
The highest package value was 44 minutes estimated using the priority evaluator for the redevelopment of
a station in Wellington (8). The high value is considered to result from questionnaire design focusing
passenger attention on station improvements.
Next highest was the Norwegian study (13) which estimated value of 13.8 minutes for bus stops with
weather protection and seating versus neither. This study, by focusing attention on bus stop facilities,
probably overestimated passenger valuations.
The London 2007 survey estimated low values when expressed in in-vehicle time of 1.9 minutes for
improving bus stops from worst to best and 3.6 minutes for rail stations. Higher values of 58% and 50%
respectively were produced when the values were expressed in terms of fare. A similar finding was
produced for the Dandenong priority evaluator (5.4 minutes but 91% of fare).
The EEM values of four minutes for a full package of bus stop improvements and seven minutes for a rail
station were towards the lower end of the estimates.
Table E.10 Bus stop and station package values
E8 Mode-specific factors
Mode-specific factors (MSF), sometimes known as alternative specific constants (ASC), account for residual
qualitative differences in modes as perceived by users after travel times, frequencies and fares have been
taken account of.

Appendix E: Evidence on individual parameters
113
In the NGTSM, the MSFs are split into a constant and an in-vehicle time factor. The first component
accounts for differences in ‘accessing the system’ and ‘boarding’ the vehicle. The MSF thus reflects the
quality of stop/station facilities and aspects of boarding the system (such as negotiating steps and
payment).41
The in-vehicle time factor accounts for differences in the quality of in-vehicle travel (such as comfort and
air conditioning) and is distance/time related. The NGTSM adopted a ‘rule of a half’ to split the reported
values into the constant and in-vehicle time factor. Half the MSF was assumed to relate to the constant (ie
account for stop/boarding) and half was assumed to be related to travel time and reflect differences in
vehicle quality.
In this review, a total of 13 Australasian studies were found to provide MSF information. Only four studies
‘compartmentalised’ the MSF into a constant and a time factor. The remaining nine studies presented only
a constant MSF.
Eleven of the studies used SP market research with most undertaken as part of producing patronage
forecasts for new transport services. As such, the values were based more on respondent perceptions of
likely future services rather than attitudes to existing services. Logically, MSFs based on actual experience
should provide valuations that are more accurate valuations and less prone to policy response bias.
The remaining two studies used RP data. For these studies, the MSF was a direct result of comparing
observed and predicted patronage against modelled travel times and costs. As a result, the MSF may be
more an artefact of the modelling process than reflecting true qualitative differences between modes.
In total, 40 MSFs were reported for five mode comparisons: bus-rail (21 observations); bus–light rail (10
observations); bus-transitway (five observations); rail-transitway (one observation) and bus-ferry (three
observations).
Table E.11 presents the average and quartile range for each MSF. All the MSFs are positive indicating the
extra time cost (in in-vehicle minutes) of travelling by the first mode compared with the second. Thus the
MSF of 12 minutes for bus-rail indicates that 12 minutes needs to be added to travelling by bus to account
for the lesser stop/station and vehicle ‘quality’.
Table E.11 Mode-specific factors in in-vehicle minutes
Bus – rail Bus – light
rail
Bus –
transitway
Rail –
transitway
Bus – ferry
75th percentile 15 19 6 4 25
Weighted average 12 16 5 4 21
25th percentile 0 1 4 4 7
Observations 21 10 5 1 3
Studies 9 4 2 1 1
A higher MSF of 16 minutes was estimated for bus versus LRT which at face value implies that LRT is
perceived to be four minutes better than heavy rail. However, the estimate is based on only four studies
and the quartile range of 1 to 19 minutes overlaps the range in the bus-rail MSF.
The transitway or busway MSF was smaller at five minutes. The value for rail-transitway of four minutes
was based on one observation for a Sydney transitway demand forecast.
41 The MSF constant also presumably accounts for egressing the system and alighting the vehicle.

Economic appraisal of public transport service enhancements
114
The MSFs for bus-rail and bus-light rail were combined and compared against trip length. Figure E.9
presents the fitted model. As can be seen, off-peak trips had a bus-rail MSF around 1.5 times that of peak
trips. For a trip length of 30 minutes, the MSF for bus adds eight minutes to a peak trip and 19 minutes
for an off-peak trip compared with travelling by rail. Mathematically, the peak bus-rail MSF is calculated by
multiplying the bus in-vehicle time by 0.26 and the off-peak in-vehicle time by 0.64.42
Figure E.9 Mode-specific factor with trip length in in-vehicle minutes
Unlike the NGTSM, there is no MSF at a zero travel time. In fact, the analysis estimated a negative constant
term indicating that bus was preferred to rail at short distances. The constant was not statistically
significant, however, and was not included in the final model.
42 To calculate the reduction in rail time (as per the NGTSM) the MSF factor should be subtracted from 1 and multiplied
by the travel time (ie 0.74 for the peak).
Time Peak Off-Pk0 0 05 1 310 3 615 4 1020 5 1325 7 1630 8 1935 9 2240 10 2645 12 2950 13 3255 14 3560 16 38
Off-Peak MSF = 0.64 (IVT); Peak MSF = 0.26 (IVT)
MSF
-10
0
10
20
30
40
50
60
0 20 40 60 80
Bus
MSF
in m
inut
es
Trip Length minutes
Heavy Rail
Light Rail
Peak
Off-Pk
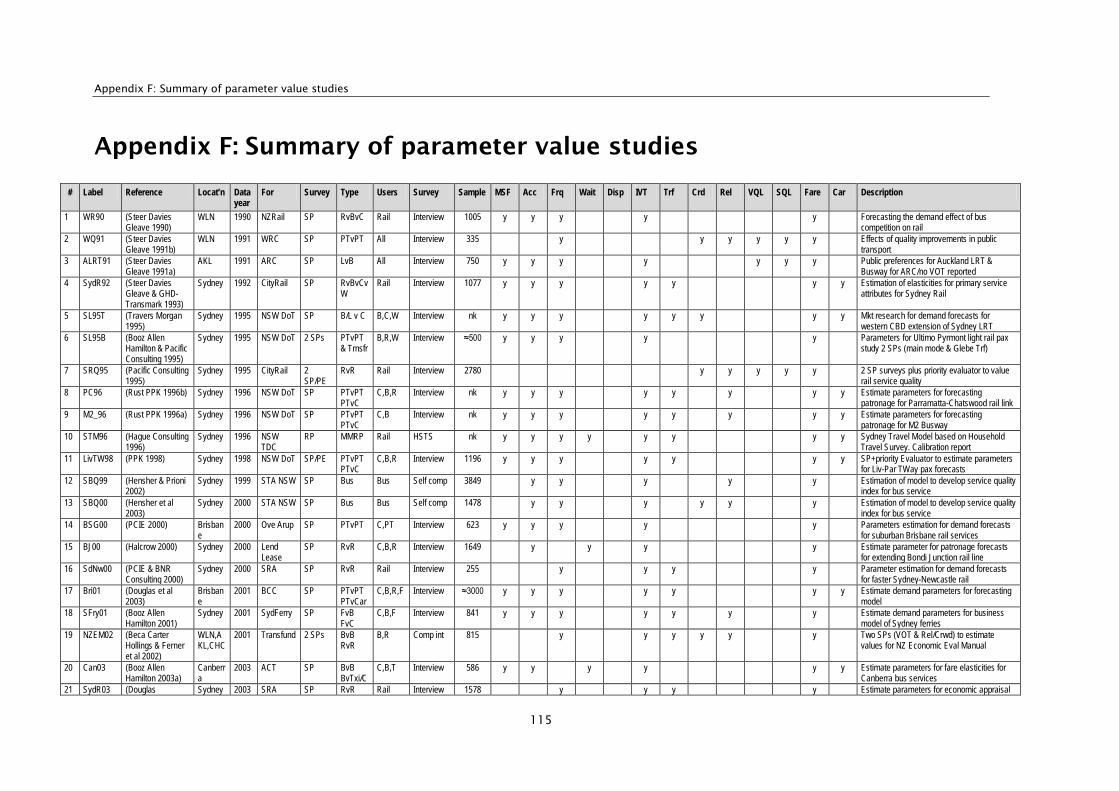
Appendix F: Summary of parameter value studies
115
Appendix F: Summary of parameter value studies
# Label Reference Locat’n Data year
For Survey Type Users Survey Sample MSF Acc Frq Wait Disp IVT Trf Crd Rel VQL SQL Fare Car Description
1 WR90 (Steer Davies Gleave 1990)
WLN 1990 NZRail SP RvBvC Rail Interview 1005 y y y y y Forecasting the demand effect of bus competition on rail
2 WQ91 (Steer Davies Gleave 1991b)
WLN 1991 WRC SP PTvPT All Interview 335 y y y y y y Effects of quality improvements in public transport
3 ALRT91 (Steer Davies Gleave 1991a)
AKL 1991 ARC SP LvB All Interview 750 y y y y y y y Public preferences for Auckland LRT & Busway for ARC/no VOT reported
4 SydR92 (Steer Davies Gleave & GHD-Transmark 1993)
Sydney 1992 CityRail SP RvBvCvW
Rail Interview 1077 y y y y y y y Estimation of elasticities for primary service attributes for Sydney Rail
5 SL95T (Travers Morgan 1995)
Sydney 1995 NSW DoT SP B/L v C B,C,W Interview nk y y y y y y y y Mkt research for demand forecasts for western CBD extension of Sydney LRT
6 SL95B (Booz Allen Hamilton & Pacific Consulting 1995)
Sydney 1995 NSW DoT 2 SPs PTvPT & Trnsfr
B,R,W Interview ≈500 y y y y y Parameters for Ultimo Pyrmont light rail pax study 2 SPs (main mode & Glebe Trf)
7 SRQ95 (Pacific Consulting 1995)
Sydney 1995 CityRail 2 SP/PE
RvR Rail Interview 2780 y y y y y 2 SP surveys plus priority evaluator to value rail service quality
8 PC96 (Rust PPK 1996b) Sydney 1996 NSW DoT SP PTvPT PTvC
C,B,R Interview nk y y y y y y y y Estimate parameters for forecasting patronage for Parramatta-Chatswood rail link
9 M2_96 (Rust PPK 1996a) Sydney 1996 NSW DoT SP PTvPT PTvC
C,B Interview nk y y y y y y y y Estimate parameters for forecasting patronage for M2 Busway
10 STM96 (Hague Consulting 1996)
Sydney 1996 NSW TDC
RP MMRP Rail HSTS nk y y y y y y y y Sydney Travel Model based on Household Travel Survey. Calibration report
11 LivTW98 (PPK 1998) Sydney 1998 NSW DoT SP/PE PTvPT PTvC
C,B,R Interview 1196 y y y y y y y SP+priority Evaluator to estimate parameters for Liv-Par TWay pax forecasts
12 SBQ99 (Hensher & Prioni 2002)
Sydney 1999 STA NSW SP Bus Bus Self comp 3849 y y y y y Estimation of model to develop service quality index for bus service
13 SBQ00 (Hensher et al 2003)
Sydney 2000 STA NSW SP Bus Bus Self comp 1478 y y y y y y Estimation of model to develop service quality index for bus service
14 BSG00 (PCIE 2000) Brisbane
2000 Ove Arup SP PTvPT C,PT Interview 623 y y y y y Parameters estimation for demand forecasts for suburban Brisbane rail services
15 BJ00 (Halcrow 2000) Sydney 2000 Lend Lease
SP RvR C,B,R Interview 1649 y y y y Estimate parameter for patronage forecasts for extending Bondi Junction rail line
16 SdNw00 (PCIE & BNR Consulting 2000)
Sydney 2000 SRA SP RvR Rail Interview 255 y y y y Parameter estimation for demand forecasts for faster Sydney-Newcastle rail
17 Bri01 (Douglas et al 2003)
Brisbane
2001 BCC SP PTvPT PTvCar
C,B,R,F Interview ≈3000 y y y y y y y Estimate demand parameters for forecasting model
18 SFry01 (Booz Allen Hamilton 2001)
Sydney 2001 SydFerry SP FvB FvC
C,B,F Interview 841 y y y y y y y Estimate demand parameters for business model of Sydney ferries
19 NZEM02 (Beca Carter Hollings & Ferner et al 2002)
WLN,AKL,CHC
2001 Transfund 2 SPs BvB RvR
B,R Comp int 815 y y y y y y Two SPs (VOT & Rel/Crwd) to estimate values for NZ Economic Eval Manual
20 Can03 (Booz Allen Hamilton 2003a)
Canberra
2003 ACT SP BvB BvTxi/C
C,B,T Interview 586 y y y y y y Estimate parameters for fare elasticities for Canberra bus services
21 SydR03 (Douglas Sydney 2003 SRA SP RvR Rail Interview 1578 y y y y Estimate parameters for economic appraisal
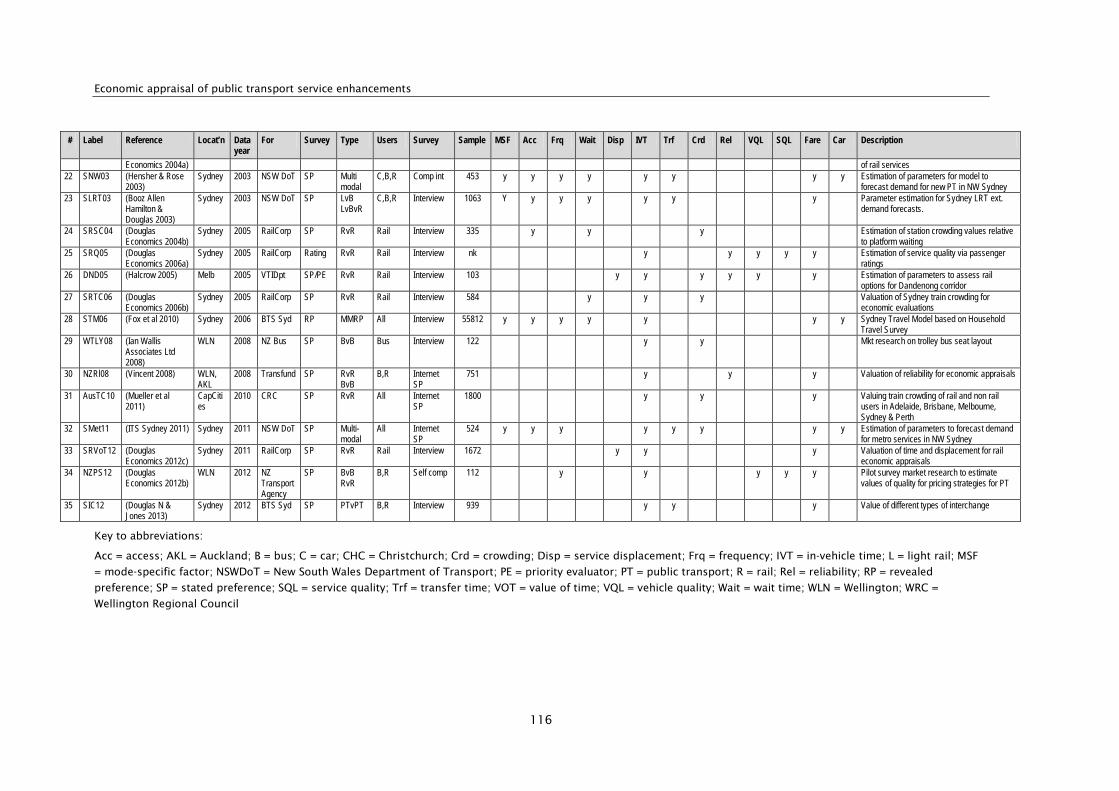
Economic appraisal of public transport service enhancements
116
# Label Reference Locat’n Data year
For Survey Type Users Survey Sample MSF Acc Frq Wait Disp IVT Trf Crd Rel VQL SQL Fare Car Description
Economics 2004a) of rail services 22 SNW03 (Hensher & Rose
2003) Sydney 2003 NSW DoT SP Multi
modal C,B,R Comp int 453 y y y y y y y y Estimation of parameters for model to
forecast demand for new PT in NW Sydney 23 SLRT03 (Booz Allen
Hamilton & Douglas 2003)
Sydney 2003 NSW DoT SP LvB LvBvR
C,B,R Interview 1063 Y y y y y y y Parameter estimation for Sydney LRT ext. demand forecasts.
24 SRSC04 (Douglas Economics 2004b)
Sydney 2005 RailCorp SP RvR Rail Interview 335 y y y Estimation of station crowding values relative to platform waiting
25 SRQ05 (Douglas Economics 2006a)
Sydney 2005 RailCorp Rating RvR Rail Interview nk y y y y y Estimation of service quality via passenger ratings
26 DND05 (Halcrow 2005) Melb 2005 VTIDpt SP/PE RvR Rail Interview 103 y y y y y y Estimation of parameters to assess rail options for Dandenong corridor
27 SRTC06 (Douglas Economics 2006b)
Sydney 2005 RailCorp SP RvR Rail Interview 584 y y y Valuation of Sydney train crowding for economic evaluations
28 STM06 (Fox et al 2010) Sydney 2006 BTS Syd RP MMRP All Interview 55812 y y y y y y y Sydney Travel Model based on Household Travel Survey
29 WTLY08 (Ian Wallis Associates Ltd 2008)
WLN 2008 NZ Bus SP BvB Bus Interview 122 y y Mkt research on trolley bus seat layout
30 NZRl08 (Vincent 2008) WLN, AKL
2008 Transfund SP RvR BvB
B,R Internet SP
751 y y y Valuation of reliability for economic appraisals
31 AusTC10 (Mueller et al 2011)
CapCities
2010 CRC SP RvR All Internet SP
1800 y y y Valuing train crowding of rail and non rail users in Adelaide, Brisbane, Melbourne, Sydney & Perth
32 SMet11 (ITS Sydney 2011) Sydney 2011 NSW DoT SP Multi-modal
All Internet SP
524 y y y y y y y y Estimation of parameters to forecast demand for metro services in NW Sydney
33 SRVoT12 (Douglas Economics 2012c)
Sydney 2011 RailCorp SP RvR Rail Interview 1672 y y y Valuation of time and displacement for rail economic appraisals
34 NZPS12 (Douglas Economics 2012b)
WLN 2012 NZ Transport Agency
SP BvB RvR
B,R Self comp 112 y y y y y Pilot survey market research to estimate values of quality for pricing strategies for PT
35 SIC12 (Douglas N & Jones 2013)
Sydney 2012 BTS Syd SP PTvPT B,R Interview 939 y y y Value of different types of interchange
Key to abbreviations:
Acc = access; AKL = Auckland; B = bus; C = car; CHC = Christchurch; Crd = crowding; Disp = service displacement; Frq = frequency; IVT = in-vehicle time; L = light rail; MSF
= mode-specific factor; NSWDoT = New South Wales Department of Transport; PE = priority evaluator; PT = public transport; R = rail; Rel = reliability; RP = revealed
preference; SP = stated preference; SQL = service quality; Trf = transfer time; VOT = value of time; VQL = vehicle quality; Wait = wait time; WLN = Wellington; WRC =
Wellington Regional Council

Appendix G: Review of existing ‘simplified procedures’ in NZ Transport Agency Economic evaluation manual
117
Appendix G: Review of existing ‘simplified procedures’ in NZ Transport Agency Economic evaluation manual
G1 Basis of assessment
This appendix outlines the implications of any suggested/recommended changes in public transport
parameter values (as assessed in chapter 5 of the report) on the EEM volume 2 ‘simplified procedures’
relating to public transport services, ie:
• SP9: new passenger transport services
• SP10: existing passenger transport services.
Our assessment sets out which public transport benefit parameters are included (explicitly or implicitly) in
the simplified procedure formulations, and hence the modifications that would be appropriate to the
current formulations should any change to the relevant parameter values be adopted.
The appendix also comments more generally on the differences between the SP9 and SP10 procedures and
on issues relating to their application (the project’s case study application of SP10 and points relating to
this are described in chapter 6).
G2 Scope and application of EEM simplified procedures SP9 and SP10
EEM volume 2 states that SP9 may be used for evaluation of all new public transport services; while SP10
may be used for evaluation of all improvements to existing public transport services. However, it does
not set out the distinction between these two types of service enhancement.
Apart from these words, there seems to be little difference between the assumptions and applications for
the two procedures. For example, for SP10, EEM states the following:
This procedure provides a simplified method for appraising the costs and benefits of activities
to improve an existing passenger transport service through the provision of capital
infrastructure and/or service improvements.
This simplified procedure assumes that:
Service improvements primarily concern existing peak period services and as a result of
improvements commuters change modes from private vehicle to bus or rail.
1 The primary benefits are travel time savings (including congestion reduction), vehicle
operating cost (VOC) savings, accident cost savings, parking and environmental benefits
(including CO2 reduction), reliability benefits and vehicle and infrastructure benefits.
2 The activity will not generate road maintenance and renewal cost savings, as the majority
of traffic removed from the road network will be light vehicles. There will also be no road
capital cost savings.
3 Other benefits (positive or negative) are not significant. However, allowance can be made
for other benefits in these procedures.

Economic appraisal of public transport service enhancements
118
The corresponding statement for SP9 is essentially similar, except for the replacement of the phrase ‘to
improve an existing passenger transport service’ with ‘new passenger transport activities’.
G3 Implications of parameter value changes for SP10
Table G.1 sets out for SP10:
• the four benefit categories that make up the total benefits under these procedures
• within each category, the benefit parameters involved in the calculation of the relevant benefits
• how the suggested/recommended changes in the individual benefit parameter values (from chapter 5
of this report) should be incorporated in the benefit formulations for each category, and hence affect
the combined parameter values used in the simplified procedures.
If our recommendations on changes in parameter values are adopted, it is noted that:
• In the shorter term, the main impacts would, in principle, be on benefit category 2.2 (public transport
user benefits – time and costs).
• However, the SP10 table 1 figures are composite values based on estimates of two aggregate
parameters: (a) the typical total generalised user cost for public transport trips of different lengths
(not broken down by user cost components); and (b) the generalised cost elasticity of demand for
such trips. Item (a) will vary in proportion to the standard value of (in-vehicle) time, but is likely to be
affected to only a small extent by the other proposed changes in component parameter values. Item
(b) would be essentially unaffected by the proposed changes.
• In the medium term (once the results from the public transport pricing strategies project surveys have
been considered), there are likely also to be significant impacts on benefit category 4 (public transport
user benefits – quality factors).
• If the proposed changes in parameter values are adopted, then we suggest the public transport user
benefit formula in SP10 be reviewed across all its sub-categories.
• It is not possible to comment on any potential impacts on benefit category 1 (road traffic benefits), as
a review of evidence on the appropriate parameter values for road traffic is outside the project scope
(refer section 5.2).
Table G.1 Implications of proposed parameter value changes on EEM simplified procedures for existing
public transport services (SP10)
Item
ref(a)
Benefit
category
Market
segments
Parameters applied in
estimation(b)
Implications, comments
2.1 Road traffic
benefits
Urban area
Rail,
bus/ferry
Peak, off-peak
Changes in road user:
• travel time
• vehicle operating cost
• accidents
• environmental
(emissions etc)
Composite values given in
SP10, table 1.
Values for these parameters are outside
scope of project.
Details of basis/composition of SP10, table
1 values are given in Values for project
evaluation – mode switching user benefits
(2005), which also refers to an earlier
patronage funding report to Transfund NZ
(Booz Allen Hamilton 2003b).
Note that values are based on trips of
average length (by mode, time period).
2.2 Public
transport user
Urban area
Rail,
Changes in public transport
user time and cost
Values (SP10, table 1) would, in principle,
be affected by any changes in parameters

Appendix G: Review of existing ‘simplified procedures’ in NZ Transport Agency Economic evaluation manual
119
Item
ref(a)
Benefit
category
Market
segments
Parameters applied in
estimation(b)
Implications, comments
benefits –
time and
costs
bus/ferry
Peak, off-peak
attributes:
• journey time
• service frequency (table
7.2)
• interchange time (section
7.2)
• fares.
Composite values given in
SP10, table 1.
for (i) standard IVT values; (ii) service
intervals (frequency); (iii) transfers
(transfer penalty, transfer walk and wait
functions).
Refer text for further discussion.
Details of basis/composition of SP10
table 1 values as above.
Note that values are expressed per
additional passenger, but cover both
additional and existing passenger
benefits.
Note that values are based on trips of
average length (by mode, time period).
3 Public
transport user
benefits –
reliability
Departure
stop, in-
vehicle,
combined
Average minutes late (AML)
factor * standard in-vehicle
time values.
AML factors given in SP10,
table 2, drawn from table
7.1.
Values will be affected by any changes in
values for either (or both) of these
parameters.
4 Public
transport user
benefits –
quality factors
Attribute and
sub-attribute
Unit values for public
transport infrastructure and
vehicle features (tables 7.3,
7.4, 7.5).
Values will be affected by any changes in
values for these infrastructure/vehicle
features.
Notes:
(a) Reference numbers as in SP10, worksheet 4.
(b) References all relate to EEM volume 2.
G4 Implications of parameter value changes for SP9
The methodology used in SP9 for categorising benefits and estimating benefits in each category appears,
prima facie, to be considerably different from that in SP10, although the principles behind the methods
are similar:
• Both SP9 and SP10 calculate road traffic benefits as a separate category. The formulations for the
calculations in the two procedures are structurally somewhat different (compare SP9 table 1 with SP10
table 1 for road traffic reduction benefits). The SP9 formulation for road traffic does not incorporate
any of the parameters researched in the project, and therefore any consideration of changes to this
formulation is outside the project scope.
• For public transport user benefits, SP9 essentially incorporates into one formulation the three public
transport user benefit categories used in SP10 (see table G.1, items 2.2, 3, 4). The simplified
procedure explanation (worksheet 4) states that ‘the calculation of the passenger transport user
benefits for a new service is based on the willingness to pay of the users for the new service in the
peak period, usually expressed as the maximum user charge (fare) they are willing to pay. The
proposed user charge is subtracted from the maximum user charge to find the net passenger
transport user benefit’.
• This ‘guidance’ appears of limited assistance to the analyst in practice. Its reference to the ‘net public
transport user benefit’ should probably be to the user (consumer) surplus associated with use of the
Economic appraisal of public transport service enhancements
120
service: the net benefit of the service to its user is more usefully related to their consumer surplus
from using the mode relative to that of travelling by their next best alternative.
• In terms of guidance, SP9 goes on to state: ‘for a new passenger transport service, the evaluator may
draw on information from existing services to derive a willingness-to-pay value for the new service’. It
is unclear how this guidance would be applied in practice43.
• We would expect that, for appraising the economic benefits of a new service, some form of transport
model (public transport-only or multi-modal) would be used. With such a model, the benefits per user
are essentially the difference between the user’s generalised cost of travel with and without the new
service. Such a benefit formulation would thus potentially incorporate any differences (with/without
the new service) in all the public transport parameters covered in this report.
Hence, in regard to the current SP9, we conclude that:
• Any changes in the parameters covered in this report would be expected to affect the ‘generalised
costs’ of public transport travel, and hence have implications for the calculation of user benefits under
SP9.
• SP9, as currently defined, does not provide much helpful guidance to the analyst: there would be
merits in restructuring these procedures and possibly combining them with SP10.
43 To the best of our knowledge, no public transport proposals submitted to the Transport Agency for funding have
been based on a SP9 economic appraisal.
Appendix H: Glossary
121
Appendix H: Glossary
ASC refer MSF
ATC Australian Transport Council
BCR benefit–cost ratio
BPM Bus Policy Model
BRT bus rapid transit
CBD central business district
CEA cost-effectiveness analysis
CPI consumer price index
EEM NZ Transport Agency Economic evaluation manual
EIA economic impact assessment
FA financial appraisal
GPS Government Policy Statement on Transport Funding
GDP gross domestic product
GDPP GDP per person
GST goods and services tax
IVT in-vehicle-time (in minutes)
LRT light rail transit
MCA multi-criteria analysis
MSF mode-specific factor, sometimes referred to as alternative specific constant (ASC)
NGTSM Australian Transport Council, National guidelines for transport system
management in Australia
NPV net present value
PT public transport
PTSS Wellington public transport spine study
PTUB public transport user benefits
RP revealed preference
RUB road traffic (user) benefits
SCBA social cost-benefit analysis
SP stated preference
TBBC New Zealand Treasury Better Business Cases
TDM travel demand management
Transport Agency New Zealand Transport Agency
VoT value of time (savings)
Related Documents