13 Chapter Two ECONOMIC AND SOCIAL BENEFITS OF INVESTMENT IN EDUCATION 2.0 Introduction 2.1 Investment in education has played a central role in Sri Lankan government policy for several generations. Key aims of public education policy have included: (i) enhancing economic equity; (ii) promoting inter-generational social mobility; (iii) increasing labor productivity and earnings through human capital accumulation; and (iv) producing a healthy and prosperous society. The economic and development policy literature identifies two important streams of social benefits that flow from investment in education, efficiency gains and equity improvements. This chapter analyzes the performance of the Sri Lankan education system in terms of both these streams of benefits, efficiency and equity. 2.1 Economic Benefits of Investment in Education: External Efficiency Social and private rates of return to education 2.2. The external efficiency of human capital investment is substantial. The three main education levels, compulsory schooling, senior secondary schooling and university education, yield generous Source: World Bank estimates, based on the Department of Census and Statistics, Labor Force Survey 2002. Social and private rates of return to education have been computed by the elaborate method, where earnings streams are simulated for individuals at different levels of education. The public cost of education is included in the computation of social returns. Regression equations underlying the simulations are controlled for other factors affecting earnings, such as experience, technical training, labor supply, employment sector and economic sector. The life-cycle earnings streams for the various education levels were set to commence after the average job search duration for each level of education. Values in the table have been rounded to the nearest integer. Education Level Social Rates of Private Rates of Return to Education Return to Education Men % Women % Men % Women % Table 2.1. Social and Private Rates of Return to Education, 2002 Compulsory Education 15 20 19 25 Senior Secondary 20 18 25 22 University 11 10 26 24

Welcome message from author
This document is posted to help you gain knowledge. Please leave a comment to let me know what you think about it! Share it to your friends and learn new things together.
Transcript
13
Chapter Two
ECONOMIC AND SOCIALBENEFITS OF INVESTMENTIN EDUCATION
2.0 Introduction2.1 Investment in educationhas played a central role in SriLankan government policy forseveral generations. Key aims ofpublic education policy haveincluded: (i) enhancingeconomic equity; (ii) promotinginter-generational socialmobility; (iii) increasing laborproductivity and earningsthrough human capitalaccumulation; and (iv)
producing a healthy andprosperous society. Theeconomic and developmentpolicy literature identifies twoimportant streams of socialbenefits that flow frominvestment in education,efficiency gains and equityimprovements. This chapteranalyzes the performance of theSri Lankan education system interms of both these streams ofbenefits, efficiency and equity.
2.1 Economic Benefits ofInvestment in Education:External EfficiencySocial and private rates ofreturn to education
2.2. The external efficiency ofhuman capital investment issubstantial. The three maineducation levels, compulsoryschooling, senior secondaryschooling and universityeducation, yield generous
Source: World Bank estimates, based on the Department of Census and Statistics, Labor Force Survey 2002. Social and private rates ofreturn to education have been computed by the elaborate method, where earnings streams are simulated for individuals at differentlevels of education. The public cost of education is included in the computation of social returns. Regression equations underlyingthe simulations are controlled for other factors affecting earnings, such as experience, technical training, labor supply, employmentsector and economic sector. The life-cycle earnings streams for the various education levels were set to commence after the averagejob search duration for each level of education. Values in the table have been rounded to the nearest integer.
Education Level Social Rates of Private Rates ofReturn to Education Return to Education
Men % Women % Men % Women %
Table 2.1. Social and Private Rates of Return to Education, 2002
Compulsory Education 15 20 19 25Senior Secondary 20 18 25 22University 11 10 26 24
14
economic benefits [see Table2.1]. Among men, social rates ofreturn to education are highest atthe senior secondary schoolinglevel, 20%, followed bycompulsory schooling, 15%, anduniversity education, 11%.Among women, social rates ofreturn to education are highest atthe compulsory schooling level,20%, followed by seniorsecondary schooling, 18%, anduniversity education, 10%.Private rates of return toeducation are also considerable.Among men, the private rate ofreturn is largest for universityeducation, 26%, followed bysenior secondary education,25%, and compulsory schooling,19%. Among women, theprivate rate of return is highestat the compulsory schoolinglevel, 25%, followed byuniversity education, 24% andsenior secondary schooling,22%. The difference betweenprivate and social rates of returnto education at the compulsoryschooling and senior secondaryschooling levels is modest,mainly due to the low unit costsof education at these schoolinglevels. In contrast, the differencebetween private and social ratesof return to education at theuniversity level is considerable,chiefly due to the high unit costof university education, whichlowers the social return.
2.3. The estimated levels andpattern of social rates of returnto education produce threeimportant policy conclusions.First, education is clearly aneconomically profitableinvestment, with a high socialrate of return.6 In consequence,there is a strong case forincreasing investment ineducation. Second, the socialbenefits of education are highestat the senior secondary andcompulsory education levels.Hence, when extra publicresources become available foreducation, these funds should beallocated to expand enrolmentand completion, and increase thequality of education, at thecompulsory basic schoolinglevel and the senior secondaryeducation level. Third, at theuniversity level, as well-knownin the economic literature, themajor portion of benefits accrueas private gains to universitygraduates. Further, these privatebenefits to university educationare substantial. In consequence,from a policy perspective,further expansion of universityeducation should be left mainlyto private investment.
Education and earnings
2.4. The relationship betweeneducation and earnings isstatistically significant andstrongly positive, for both men
and women, over a large range ofthe education system [see Table2.2]. Among men, all levels ofeducation are significantly andpositively associated withearnings. In addition, therelationship between educationand male earnings increases asthe level of education rises,implying positive incrementalprivate returns to education overall education grade cycles.Among women, too, alleducation levels are significantlyand positively related toearnings, provided the individualhas at least completed primaryeducation. Further, theassociation between educationand female earnings rises as theeducation level increases fromprimary schooling upwards,indicating favorable privatemarginal returns to education.Overall, the findings stronglysupport the notion that educationis a profitable investment, forboth men and women, in termsof increasing earnings. Thesefindings are consistent with theidea that education enablesindividuals to accumulate humancapital, increase laborproductivity and improveearnings. The findings are alsoconsistent with the notion thateducation enables individuals tosignal innate abilities to potentialemployers during job search.
6. Research studies have shown that the returns to education, measured in terms of education attainment, also contains a returnto education achievement, if education quality indicators are not explicitly incorporated into the regression equations [seeGlewwe (2002)]. The Sri Lankan labor force data sets from which returns to education have been measured do not containeducation quality measures. Hence, the estimated rates of return above combine returns to education attainment andeducation achievement. This implies that the country can benefit from both expanding education access and increasingeducation quality, especially at compulsory basic and senior secondary education levels, where the social returns are high.
15
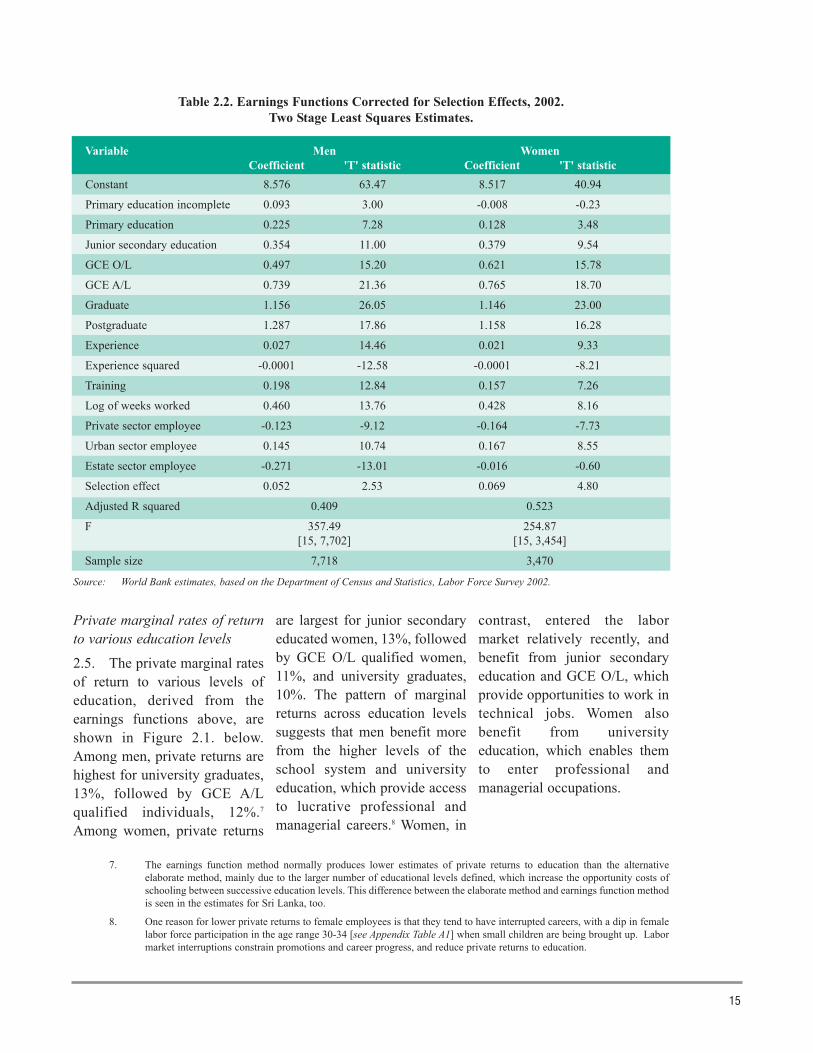
Private marginal rates of returnto various education levels
2.5. The private marginal ratesof return to various levels ofeducation, derived from theearnings functions above, areshown in Figure 2.1. below.Among men, private returns arehighest for university graduates,13%, followed by GCE A/Lqualified individuals, 12%.7
Among women, private returns
are largest for junior secondaryeducated women, 13%, followedby GCE O/L qualified women,11%, and university graduates,10%. The pattern of marginalreturns across education levelssuggests that men benefit morefrom the higher levels of theschool system and universityeducation, which provide accessto lucrative professional andmanagerial careers.8 Women, in
contrast, entered the labormarket relatively recently, andbenefit from junior secondaryeducation and GCE O/L, whichprovide opportunities to work intechnical jobs. Women alsobenefit from universityeducation, which enables themto enter professional andmanagerial occupations.
7. The earnings function method normally produces lower estimates of private returns to education than the alternativeelaborate method, mainly due to the larger number of educational levels defined, which increase the opportunity costs ofschooling between successive education levels. This difference between the elaborate method and earnings function methodis seen in the estimates for Sri Lanka, too.
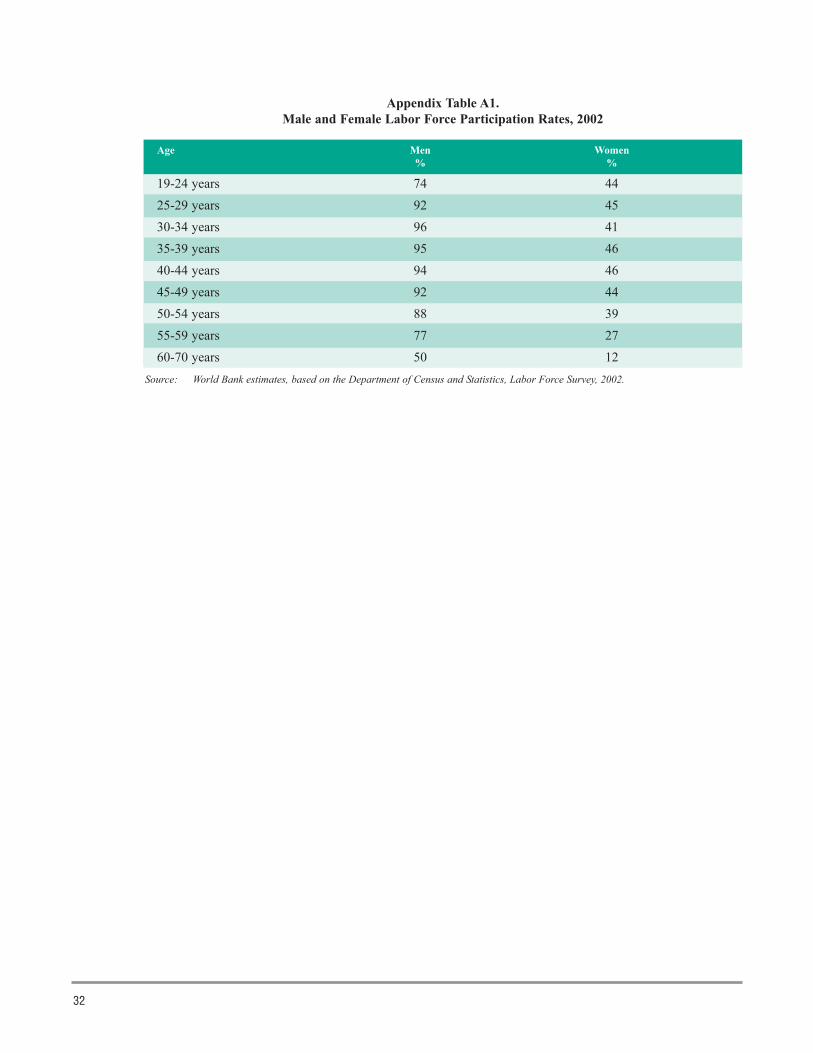
8. One reason for lower private returns to female employees is that they tend to have interrupted careers, with a dip in femalelabor force participation in the age range 30-34 [see Appendix Table A1] when small children are being brought up. Labormarket interruptions constrain promotions and career progress, and reduce private returns to education.
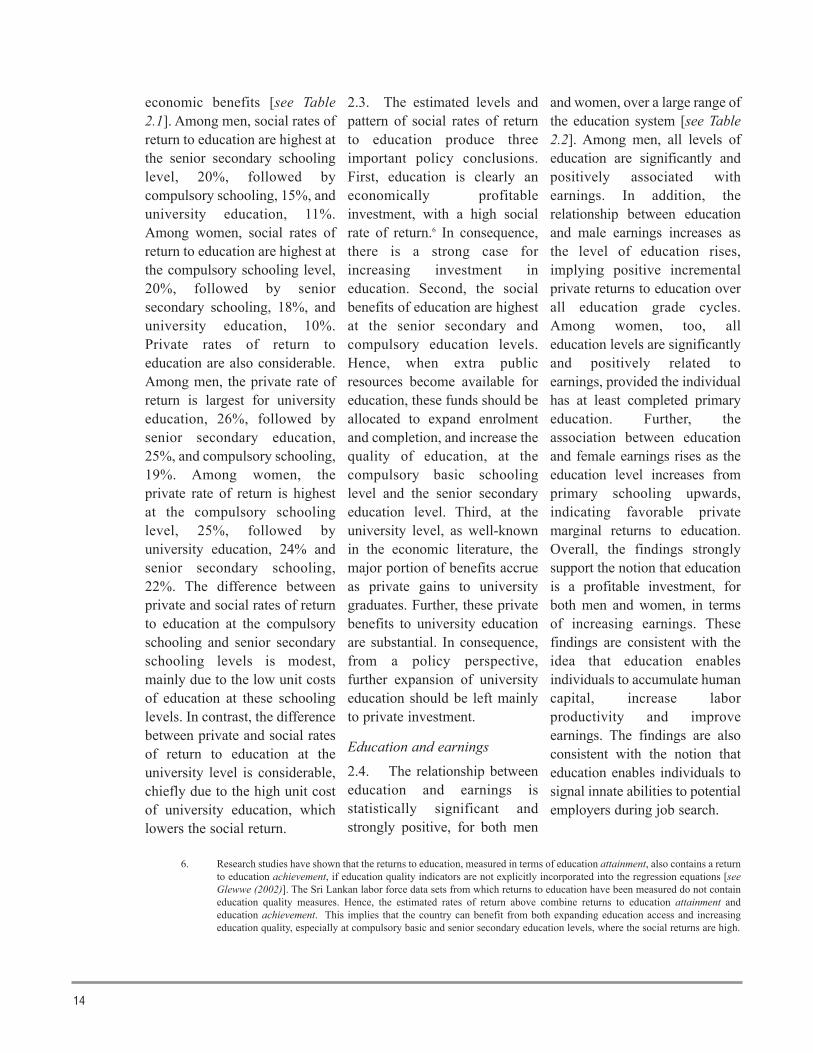
Table 2.2. Earnings Functions Corrected for Selection Effects, 2002.Two Stage Least Squares Estimates.
Source: World Bank estimates, based on the Department of Census and Statistics, Labor Force Survey 2002.
Variable Men WomenCoefficient 'T' statistic Coefficient 'T' statistic
Constant 8.576 63.47 8.517 40.94
Primary education incomplete 0.093 3.00 -0.008 -0.23
Primary education 0.225 7.28 0.128 3.48
Junior secondary education 0.354 11.00 0.379 9.54
GCE O/L 0.497 15.20 0.621 15.78
GCE A/L 0.739 21.36 0.765 18.70
Graduate 1.156 26.05 1.146 23.00
Postgraduate 1.287 17.86 1.158 16.28
Experience 0.027 14.46 0.021 9.33
Experience squared -0.0001 -12.58 -0.0001 -8.21
Training 0.198 12.84 0.157 7.26
Log of weeks worked 0.460 13.76 0.428 8.16
Private sector employee -0.123 -9.12 -0.164 -7.73
Urban sector employee 0.145 10.74 0.167 8.55
Estate sector employee -0.271 -13.01 -0.016 -0.60
Selection effect 0.052 2.53 0.069 4.80
Adjusted R squared 0.409 0.523
F 357.49 254.87[15, 7,702] [15, 3,454]
Sample size 7,718 3,470
2.6. Overall, the privatemarginal rates of return toeducation show that both menand women enjoy substantialeconomic benefits frominvesting in education. This islikely to be the outcome of
multiple causal channels,including human capitalproduction and accumulation,the role of education as asignaling-screening mechanismthrough which ability levels ofjob seekers are communicated
and assessed in the labor market,and the certification effects ofeducation.
Education and occupationalattainment
2.7. The impact of educationon an individual's occupationalattainment can be an importantsource of economic benefit, as itfacilitates inter-generationalsocial mobility. The impact ofeducation on occupationalattainment, controlling forfamily background factors suchas parental earnings, educationand occupational attainment, isshown in Table 2.3. Educationclearly has a strong and positiveeffect on occupationalattainment. Among men, theprobability of working in a highlevel occupation, such as amanagerial, senioradministrative or professionalposition, is positively andsignificantly affected by seniorsecondary and tertiary educationattainment. Among women, too,
16
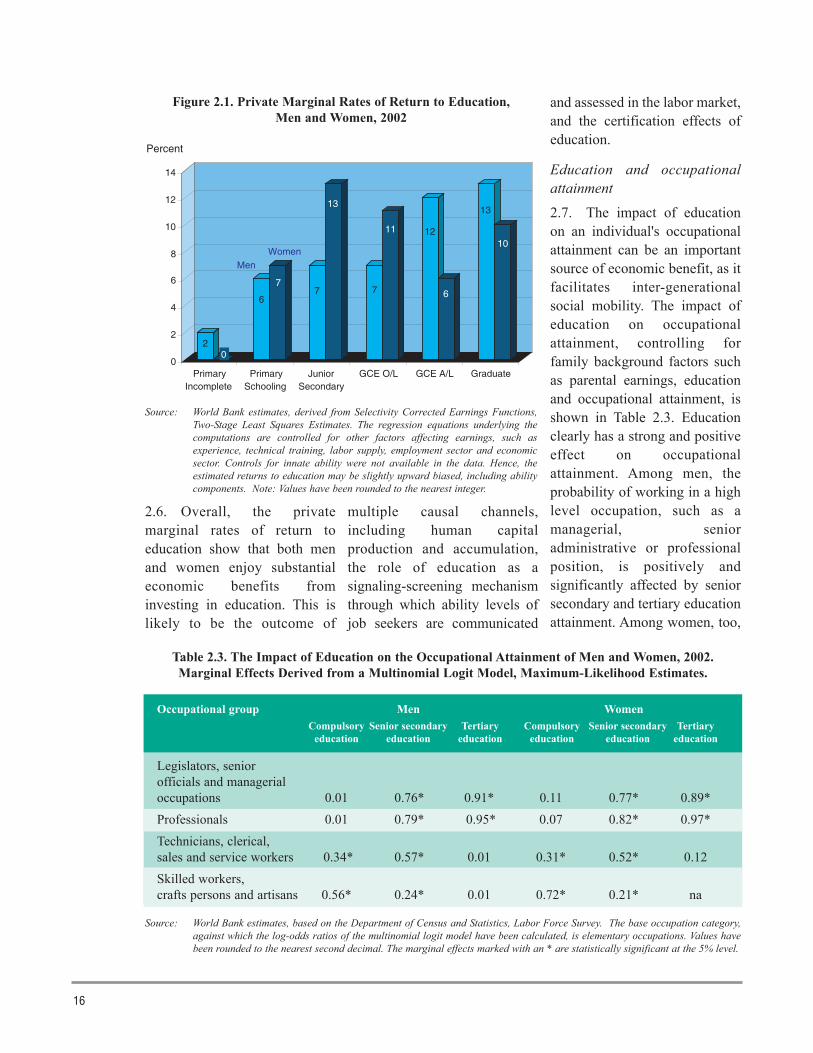
Table 2.3. The Impact of Education on the Occupational Attainment of Men and Women, 2002.Marginal Effects Derived from a Multinomial Logit Model, Maximum-Likelihood Estimates.
Source: World Bank estimates, based on the Department of Census and Statistics, Labor Force Survey. The base occupation category,against which the log-odds ratios of the multinomial logit model have been calculated, is elementary occupations. Values havebeen rounded to the nearest second decimal. The marginal effects marked with an * are statistically significant at the 5% level.
Occupational group Men WomenCompulsory Senior secondary Tertiary Compulsory Senior secondary Tertiary
education education education education education education
Legislators, seniorofficials and managerialoccupations 0.01 0.76* 0.91* 0.11 0.77* 0.89*Professionals 0.01 0.79* 0.95* 0.07 0.82* 0.97*Technicians, clerical,sales and service workers 0.34* 0.57* 0.01 0.31* 0.52* 0.12Skilled workers,crafts persons and artisans 0.56* 0.24* 0.01 0.72* 0.21* na
20
6
77
13
7
11 12
6
13
10
0
2
4
6
8
10
12
14
PrimaryIncomplete
PrimarySchooling
JuniorSecondary
GCE O/L GCE A/L Graduate
MenWomen
Percent
Source: World Bank estimates, derived from Selectivity Corrected Earnings Functions,Two-Stage Least Squares Estimates. The regression equations underlying thecomputations are controlled for other factors affecting earnings, such asexperience, technical training, labor supply, employment sector and economicsector. Controls for innate ability were not available in the data. Hence, theestimated returns to education may be slightly upward biased, including abilitycomponents. Note: Values have been rounded to the nearest integer.
Figure 2.1. Private Marginal Rates of Return to Education,Men and Women, 2002
17
the likelihood of reaching a highlevel occupation is positivelyand significantly influenced bytertiary and senior secondaryeducation. The probability ofholding a middle-classoccupation, such as a technical,clerical, sales or service job, andthe likelihood of being in aworking class-occupation, suchas a skilled craft or artisan job,are also positively andsignificantly affected bycompulsory basic education andsenior secondary education, forboth men and women. Overall,education has a strong positiveimpact on the occupationalattainment of men and women.This favorable relationshipbetween education attainmentand occupation class representsthe central avenue of socialmobility for individuals fromdisadvantaged and low statushousehold backgrounds.
Education and female laborforce participation
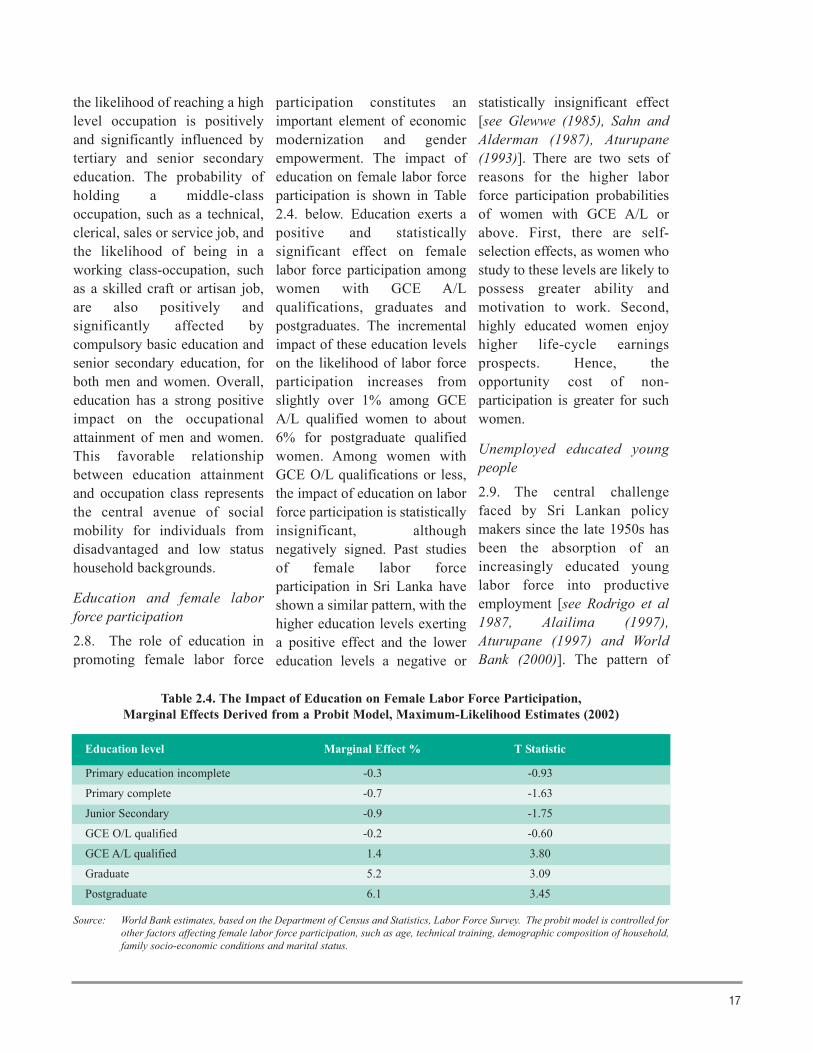
2.8. The role of education inpromoting female labor force
participation constitutes animportant element of economicmodernization and genderempowerment. The impact ofeducation on female labor forceparticipation is shown in Table2.4. below. Education exerts apositive and statisticallysignificant effect on femalelabor force participation amongwomen with GCE A/Lqualifications, graduates andpostgraduates. The incrementalimpact of these education levelson the likelihood of labor forceparticipation increases fromslightly over 1% among GCEA/L qualified women to about6% for postgraduate qualifiedwomen. Among women withGCE O/L qualifications or less,the impact of education on laborforce participation is statisticallyinsignificant, althoughnegatively signed. Past studiesof female labor forceparticipation in Sri Lanka haveshown a similar pattern, with thehigher education levels exertinga positive effect and the lowereducation levels a negative or
statistically insignificant effect[see Glewwe (1985), Sahn andAlderman (1987), Aturupane(1993)]. There are two sets ofreasons for the higher laborforce participation probabilitiesof women with GCE A/L orabove. First, there are self-selection effects, as women whostudy to these levels are likely topossess greater ability andmotivation to work. Second,highly educated women enjoyhigher life-cycle earningsprospects. Hence, theopportunity cost of non-participation is greater for suchwomen.
Unemployed educated youngpeople
2.9. The central challengefaced by Sri Lankan policymakers since the late 1950s hasbeen the absorption of anincreasingly educated younglabor force into productiveemployment [see Rodrigo et al1987, Alailima (1997),Aturupane (1997) and WorldBank (2000)]. The pattern of
Table 2.4. The Impact of Education on Female Labor Force Participation,Marginal Effects Derived from a Probit Model, Maximum-Likelihood Estimates (2002)
Source: World Bank estimates, based on the Department of Census and Statistics, Labor Force Survey. The probit model is controlled forother factors affecting female labor force participation, such as age, technical training, demographic composition of household,family socio-economic conditions and marital status.
Education level Marginal Effect % T Statistic
Primary education incomplete -0.3 -0.93
Primary complete -0.7 -1.63
Junior Secondary -0.9 -1.75
GCE O/L qualified -0.2 -0.60
GCE A/L qualified 1.4 3.80
Graduate 5.2 3.09
Postgraduate 6.1 3.45
18
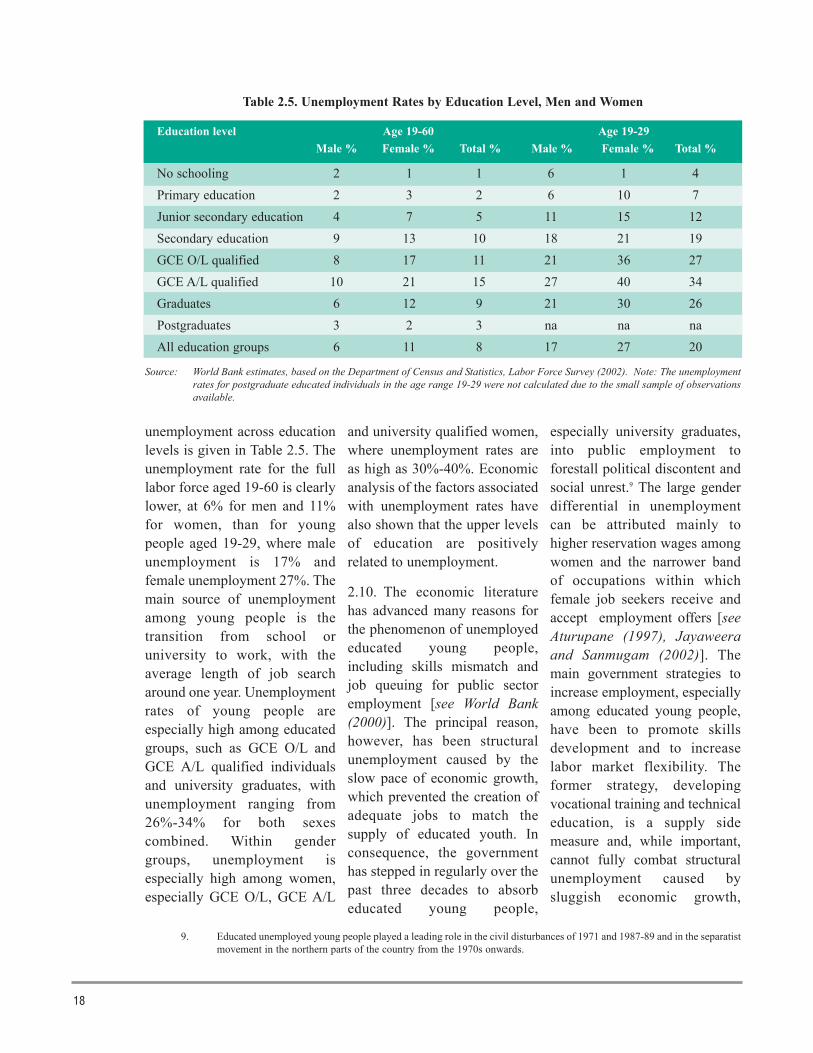
unemployment across educationlevels is given in Table 2.5. Theunemployment rate for the fulllabor force aged 19-60 is clearlylower, at 6% for men and 11%for women, than for youngpeople aged 19-29, where maleunemployment is 17% andfemale unemployment 27%. Themain source of unemploymentamong young people is thetransition from school oruniversity to work, with theaverage length of job searcharound one year. Unemploymentrates of young people areespecially high among educatedgroups, such as GCE O/L andGCE A/L qualified individualsand university graduates, withunemployment ranging from26%-34% for both sexescombined. Within gendergroups, unemployment isespecially high among women,especially GCE O/L, GCE A/L
and university qualified women,where unemployment rates areas high as 30%-40%. Economicanalysis of the factors associatedwith unemployment rates havealso shown that the upper levelsof education are positivelyrelated to unemployment.
2.10. The economic literaturehas advanced many reasons forthe phenomenon of unemployededucated young people,including skills mismatch andjob queuing for public sectoremployment [see World Bank(2000)]. The principal reason,however, has been structuralunemployment caused by theslow pace of economic growth,which prevented the creation ofadequate jobs to match thesupply of educated youth. Inconsequence, the governmenthas stepped in regularly over thepast three decades to absorbeducated young people,
especially university graduates,into public employment toforestall political discontent andsocial unrest.9 The large genderdifferential in unemploymentcan be attributed mainly tohigher reservation wages amongwomen and the narrower bandof occupations within whichfemale job seekers receive andaccept employment offers [seeAturupane (1997), Jayaweeraand Sanmugam (2002)]. Themain government strategies toincrease employment, especiallyamong educated young people,have been to promote skillsdevelopment and to increaselabor market flexibility. Theformer strategy, developingvocational training and technicaleducation, is a supply sidemeasure and, while important,cannot fully combat structuralunemployment caused bysluggish economic growth,
9. Educated unemployed young people played a leading role in the civil disturbances of 1971 and 1987-89 and in the separatistmovement in the northern parts of the country from the 1970s onwards.
Source: World Bank estimates, based on the Department of Census and Statistics, Labor Force Survey (2002). Note: The unemploymentrates for postgraduate educated individuals in the age range 19-29 were not calculated due to the small sample of observationsavailable.
Table 2.5. Unemployment Rates by Education Level, Men and Women
No schooling 2 1 1 6 1 4Primary education 2 3 2 6 10 7Junior secondary education 4 7 5 11 15 12Secondary education 9 13 10 18 21 19GCE O/L qualified 8 17 11 21 36 27GCE A/L qualified 10 21 15 27 40 34Graduates 6 12 9 21 30 26Postgraduates 3 2 3 na na naAll education groups 6 11 8 17 27 20
Education level Age 19-60 Age 19-29Male % Female % Total % Male % Female % Total %
19
which results in insufficientdemand for educated labor. Thelatter strategy, improving labormarket flexibility, is a promisingdemand side measure. However,it is also a measure that has beenintroduced very recently,January 2004, and has not yethad time to affect the labormarket fully.
2.2 Social Benefits ofInvestment in Education:Externality EffectsImpact on nutrition and familyhealth outcomes
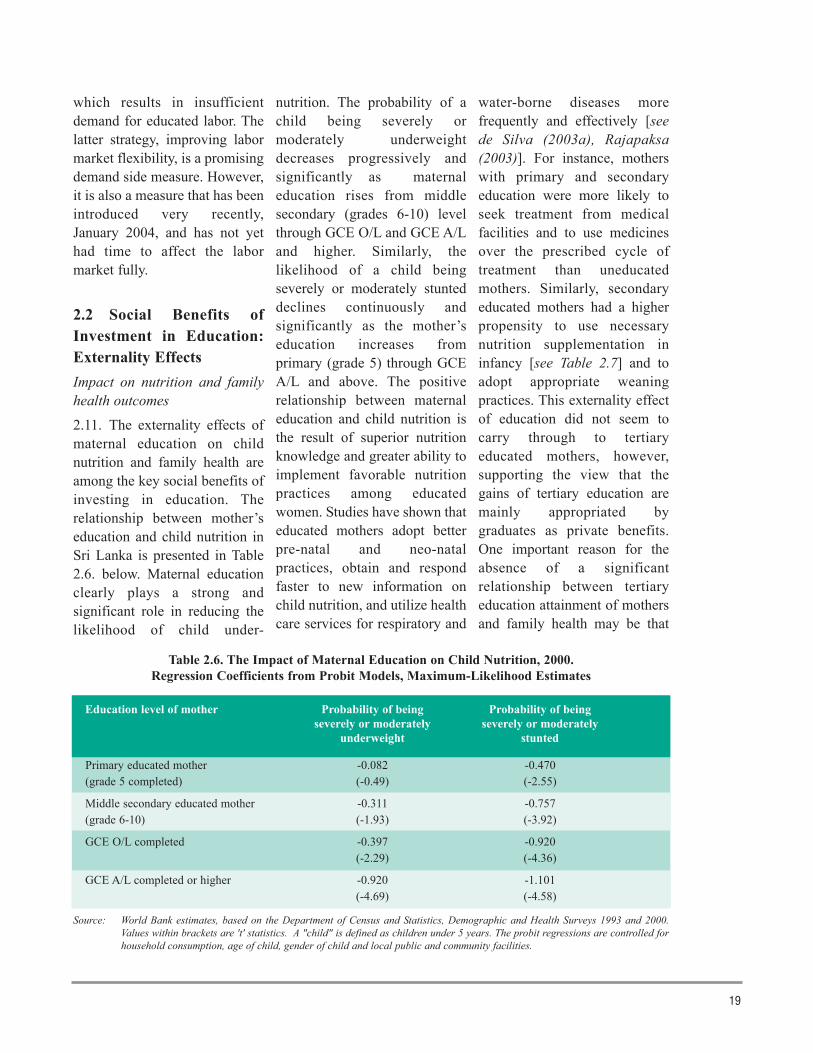
2.11. The externality effects ofmaternal education on childnutrition and family health areamong the key social benefits ofinvesting in education. Therelationship between mother’seducation and child nutrition inSri Lanka is presented in Table2.6. below. Maternal educationclearly plays a strong andsignificant role in reducing thelikelihood of child under-
nutrition. The probability of achild being severely ormoderately underweightdecreases progressively andsignificantly as maternaleducation rises from middlesecondary (grades 6-10) levelthrough GCE O/L and GCE A/Land higher. Similarly, thelikelihood of a child beingseverely or moderately stunteddeclines continuously andsignificantly as the mother’seducation increases fromprimary (grade 5) through GCEA/L and above. The positiverelationship between maternaleducation and child nutrition isthe result of superior nutritionknowledge and greater ability toimplement favorable nutritionpractices among educatedwomen. Studies have shown thateducated mothers adopt betterpre-natal and neo-natalpractices, obtain and respondfaster to new information onchild nutrition, and utilize healthcare services for respiratory and
water-borne diseases morefrequently and effectively [seede Silva (2003a), Rajapaksa(2003)]. For instance, motherswith primary and secondaryeducation were more likely toseek treatment from medicalfacilities and to use medicinesover the prescribed cycle oftreatment than uneducatedmothers. Similarly, secondaryeducated mothers had a higherpropensity to use necessarynutrition supplementation ininfancy [see Table 2.7] and toadopt appropriate weaningpractices. This externality effectof education did not seem tocarry through to tertiaryeducated mothers, however,supporting the view that thegains of tertiary education aremainly appropriated bygraduates as private benefits.One important reason for theabsence of a significantrelationship between tertiaryeducation attainment of mothersand family health may be that
Table 2.6. The Impact of Maternal Education on Child Nutrition, 2000.Regression Coefficients from Probit Models, Maximum-Likelihood Estimates
Source: World Bank estimates, based on the Department of Census and Statistics, Demographic and Health Surveys 1993 and 2000.Values within brackets are 't' statistics. A "child" is defined as children under 5 years. The probit regressions are controlled forhousehold consumption, age of child, gender of child and local public and community facilities.
Primary educated mother -0.082 -0.470(grade 5 completed) (-0.49) (-2.55)
Middle secondary educated mother -0.311 -0.757(grade 6-10) (-1.93) (-3.92)
GCE O/L completed -0.397 -0.920(-2.29) (-4.36)
GCE A/L completed or higher -0.920 -1.101(-4.69) (-4.58)
Education level of mother Probability of being Probability of beingseverely or moderately severely or moderately
underweight stunted
20
Source: Department of Census and Statistics, Demographic and Health Surveys, 1993 and 2000.
Table 2.7. Proportion of Babies given Colostrum atBirth by Mother’s Education Level, 1993 and 2002
Education 1993 2000% %
No schooling 34 65
Primary 45 66
Junior Secondary 54 74
GCE O/L 69 83
GCE A/L na 92
women educated to these levelsnormally go to work, so thattheir time at home is too limitedto help improve health andnutrition outcomes.
2.3 Social Benefits ofInvestment in Education:Equity and DistributiveJustice2.12. A cardinal principle of SriLankan public policy, rangingover several generations andsuccessive governments, hasbeen the promotion of equityand distributive justice throughinvestment in education.Important education legislation,such as the EducationOrdinances of (1939) and(1947), stressed the central roleof education in achievingeconomic and social equity.Recent policy statements, suchas NEC (1997) and NEC(2003), have restated thatadvancing equity througheducation is a fundamentalprinciple of national policy. Insupport of this principle, GOSLmaintains and financiallysupports several policyinitiatives and measures. Theseinclude the island-wide network
of free government primary andsecondary schools; incentiveschemes such as free textbooks,free uniforms and transportsubsidies to promote schoolattendance, especially amonglow-income families; tuitionfree public universities withadmission quotas for studentsfrom disadvantaged districts; aregionally widespread systemof vocational training centers,many of which offer tuition freeinstruction; and a publiclyfunded apprenticeship training
scheme through which on-sitefactory and firm placements canbe received for skillsdevelopment through on-the-job training.
Education and deprivation:poverty rates by educationattainment of household heads
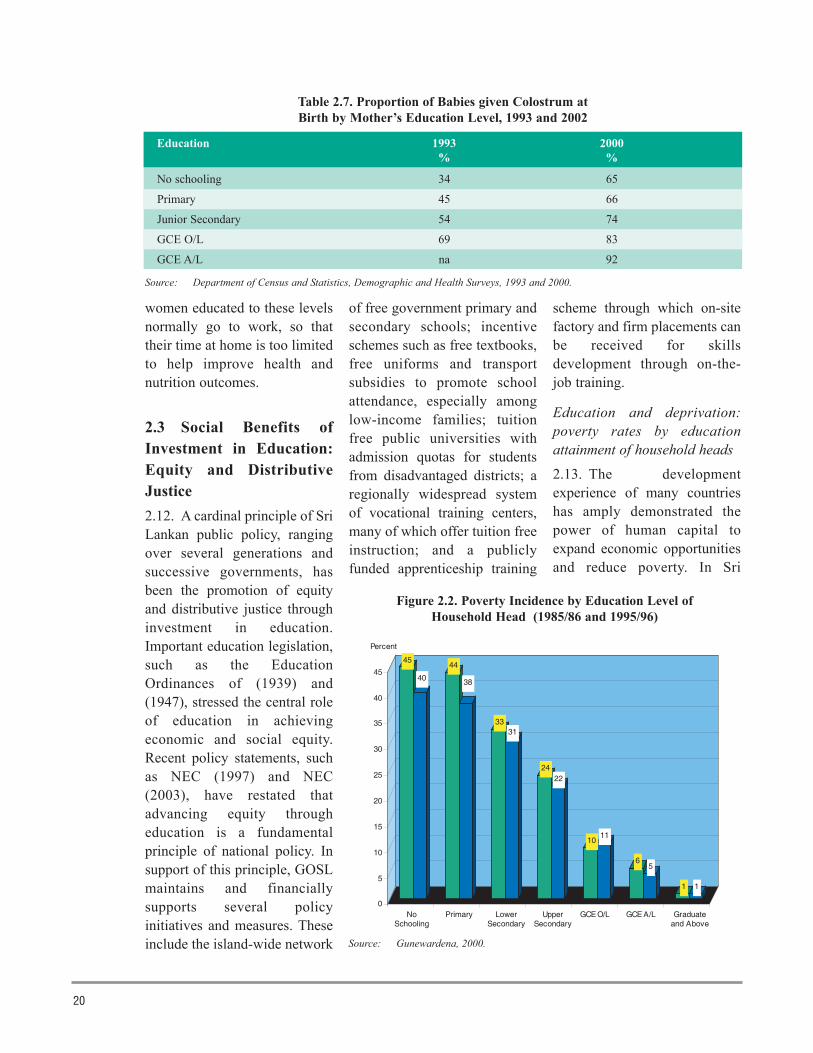
2.13. The developmentexperience of many countrieshas amply demonstrated thepower of human capital toexpand economic opportunitiesand reduce poverty. In Sri
Source: Gunewardena, 2000.
Figure 2.2. Poverty Incidence by Education Level ofHousehold Head (1985/86 and 1995/96)
45
40
44
38
3331
2422
1011
65
1 1
0
5
10
15
20
25
30
35
40
45
NoSchooling
Primary LowerSecondary
UpperSecondary
GCE O/L GCE A/L Graduateand Above
Percent
21
Lanka, too, education attainmentis strongly correlated with lowerpoverty rates [see Figure 2.2].The incidence of poverty ishighest among households withuneducated heads, 45% in1985/86 and 40% in 1995/96.Poverty rates are marginallylower among households withprimary educated heads, 44% in
1985/86 and 38% in 1995/96. Asthe education level of thehousehold head increaseshousehold poverty ratesdecrease continually, falling tojust 1% among households witha tertiary educated head. Povertyrates fall most sharply whenhousehold heads move throughthe secondary education cycle,
from junior secondary throughto GCE O/L and GCE A/L. Thispattern of declining poverty asthe education level of thehousehold head increases is alsosupported by studies whichshow the same decreasingpattern between poverty ratesand education levels of principalincome earners of households
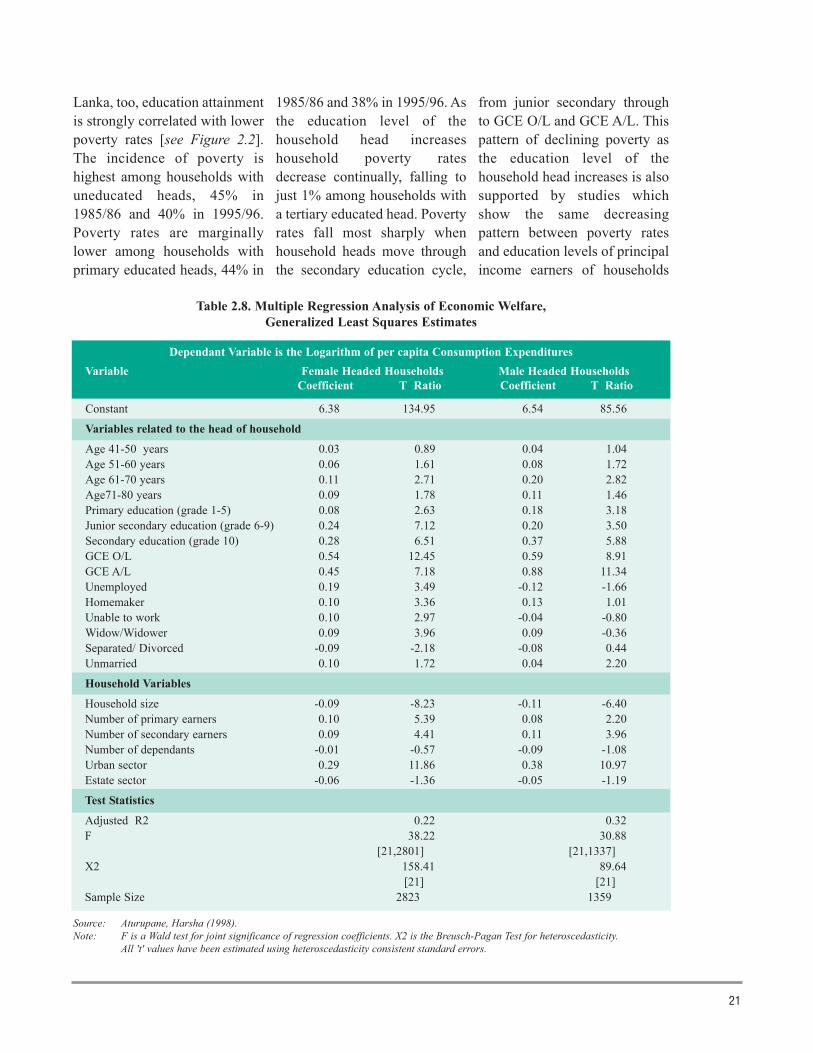
Table 2.8. Multiple Regression Analysis of Economic Welfare,Generalized Least Squares Estimates
Source: Aturupane, Harsha (1998).Note: F is a Wald test for joint significance of regression coefficients. X2 is the Breusch-Pagan Test for heteroscedasticity.
All 't' values have been estimated using heteroscedasticity consistent standard errors.
Dependant Variable is the Logarithm of per capita Consumption ExpendituresVariable Female Headed Households Male Headed Households
Coefficient T Ratio Coefficient T Ratio
Constant 6.38 134.95 6.54 85.56
Variables related to the head of household
Age 41-50 years 0.03 0.89 0.04 1.04Age 51-60 years 0.06 1.61 0.08 1.72Age 61-70 years 0.11 2.71 0.20 2.82Age71-80 years 0.09 1.78 0.11 1.46Primary education (grade 1-5) 0.08 2.63 0.18 3.18Junior secondary education (grade 6-9) 0.24 7.12 0.20 3.50Secondary education (grade 10) 0.28 6.51 0.37 5.88GCE O/L 0.54 12.45 0.59 8.91GCE A/L 0.45 7.18 0.88 11.34Unemployed 0.19 3.49 -0.12 -1.66Homemaker 0.10 3.36 0.13 1.01Unable to work 0.10 2.97 -0.04 -0.80Widow/Widower 0.09 3.96 0.09 -0.36Separated/ Divorced -0.09 -2.18 -0.08 0.44Unmarried 0.10 1.72 0.04 2.20
Household Variables
Household size -0.09 -8.23 -0.11 -6.40Number of primary earners 0.10 5.39 0.08 2.20Number of secondary earners 0.09 4.41 0.11 3.96Number of dependants -0.01 -0.57 -0.09 -1.08Urban sector 0.29 11.86 0.38 10.97Estate sector -0.06 -1.36 -0.05 -1.19
Test Statistics
Adjusted R2 0.22 0.32F 38.22 30.88
[21,2801] [21,1337]X2 158.41 89.64
[21] [21]Sample Size 2823 1359
22
[see Gunewardena (2000)]. Thehigher earnings received byeducated household heads orprincipal income earners clearlyhelp to lift households above thepoverty thresholds. Otherfactors are also likely tocontribute, such as betterfertility control and smallerfamily size, more regularemployment, and informedconsumption choices, amongeducated households.
Education and economicwelfare of poor households
2.14. The economic welfarelevels of poor families areclosely related to the educationattainment of the householdhead. A study of householdexpenditures among householdsin the poorest regions of SriLanka showed that consumptionincreased sharply as theeducation level of the householdhead rose, among both femaleand male headed households
[see Table 2.8]. All educationregression coefficients fromprimary education upwards arepositively signed andstatistically significant atconventional levels ofconfidence. Further, thecoefficients generally increaseas the education level rises. Theregression coefficients suggestthat, among male headedhouseholds in poor regions,families with primary educatedheads consume 20% more thanhouseholds with uneducatedheads. This consumptiondifferential rises continuously,with households containingheads educated up to GCE A/Lenjoying consumption levels142% higher. Among femaleheaded households, familieswith primary educated headsconsume 8% more thanhouseholds with uneducatedheads. Among households withheads educated up to GCE O/L,this difference in consumption is
72% greater. These findingsshow that poor households enjoystrong welfare gains fromeducation.
Education enrolment acrosseconomic groups
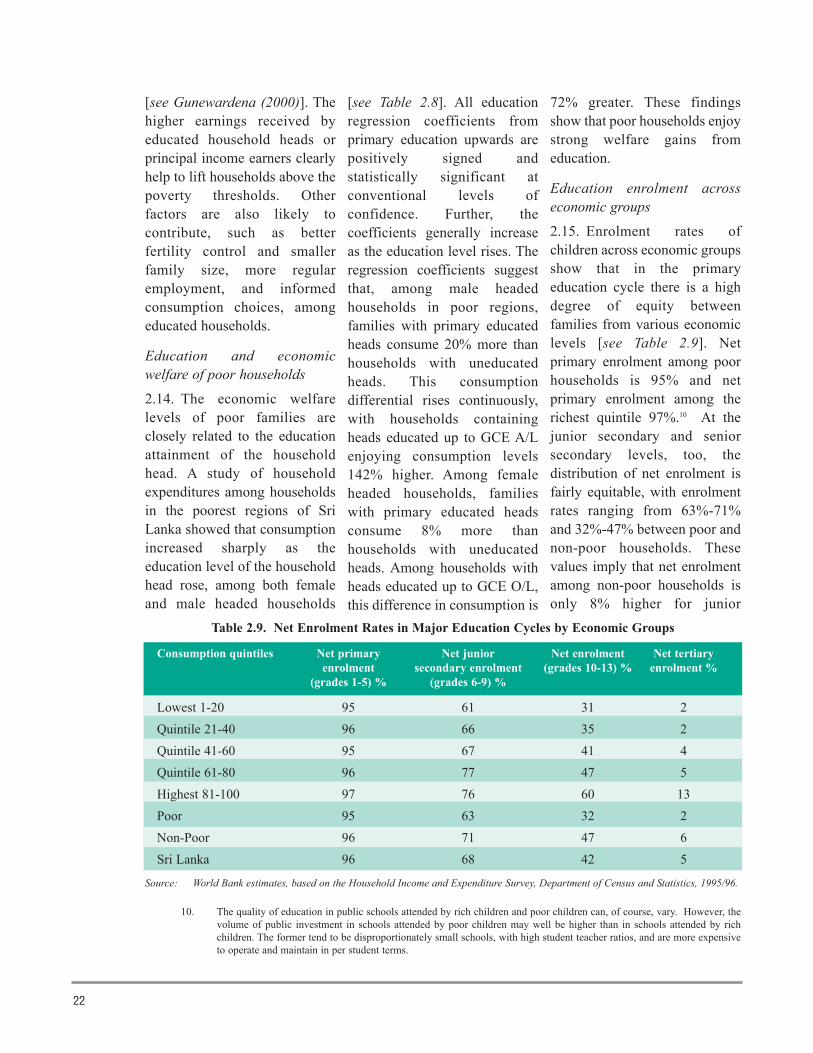
2.15. Enrolment rates ofchildren across economic groupsshow that in the primaryeducation cycle there is a highdegree of equity betweenfamilies from various economiclevels [see Table 2.9]. Netprimary enrolment among poorhouseholds is 95% and netprimary enrolment among therichest quintile 97%.10 At thejunior secondary and seniorsecondary levels, too, thedistribution of net enrolment isfairly equitable, with enrolmentrates ranging from 63%-71%and 32%-47% between poor andnon-poor households. Thesevalues imply that net enrolmentamong non-poor households isonly 8% higher for junior
Source: World Bank estimates, based on the Household Income and Expenditure Survey, Department of Census and Statistics, 1995/96.
Table 2.9. Net Enrolment Rates in Major Education Cycles by Economic Groups
Consumption quintiles Net primary Net junior Net enrolment Net tertiaryenrolment secondary enrolment (grades 10-13) % enrolment %
(grades 1-5) % (grades 6-9) %
10. The quality of education in public schools attended by rich children and poor children can, of course, vary. However, thevolume of public investment in schools attended by poor children may well be higher than in schools attended by richchildren. The former tend to be disproportionately small schools, with high student teacher ratios, and are more expensiveto operate and maintain in per student terms.
Lowest 1-20 95 61 31 2Quintile 21-40 96 66 35 2Quintile 41-60 95 67 41 4Quintile 61-80 96 77 47 5Highest 81-100 97 76 60 13Poor 95 63 32 2Non-Poor 96 71 47 6Sri Lanka 96 68 42 5
23
secondary education and 15%higher for senior secondaryeducation in comparison to poorhouseholds. Further, theseenrolment rates by economicquintile are calculated from1995/96 data, as this is the mostrecent household income andexpenditure survey available.Evidence from other sources,such as school censuses, showthat secondary enrolment ratesamong poorer households haverisen considerably since then, sothat the school enrolment gapbetween low income and highincome households is likely tohave narrowed further. Overall,GOSL policy to provideuniversal access to free publicprimary and secondaryeducation, reinforced byincentives to enroll in school,appears to have benefitedchildren from poor householdssubstantially.
2.16. Enrolment in tertiaryeducation, however, revealssharp disparities between poorand non-poor households. Thetertiary enrolment rate amongnon-poor households is aboutthree times higher than amongpoor households. Further, themost affluent consumptiongroup accounts for about half ofall enrolment. These findingssuggest that the benefits oftertiary education accrue mainlyto prosperous households. Thisis plausible, as overall tertiaryenrolment levels in Sri Lankawere about 5% in 1995/96 andare currently about 11%. Thevast majority of students from
poor households do not survivethrough the secondary educationsystem to reach the tertiaryeducation cycle. The disparity intertiary education enrolmentbetween poorer households andwealthier households is likely tohave remained constant or evenwidened since 1995/96, asenrolment expansion in tuitionfree public universities has beenmoderate. The main increase intertiary education enrolmentover the past 8 years or so hasbeen in fee levying privatedegree awarding institutions andprofessional courses andprograms. These private tertiaryeducation programs and coursesare likely to be too expensive forlower income households,especially as many of theseprograms are examined andcertified from overseasinstitutions in developed
countries such as the U.K.,Australia and Singapore.
2.4 Equity of PublicEducation ExpenditurePublic education spendingacross economic groups
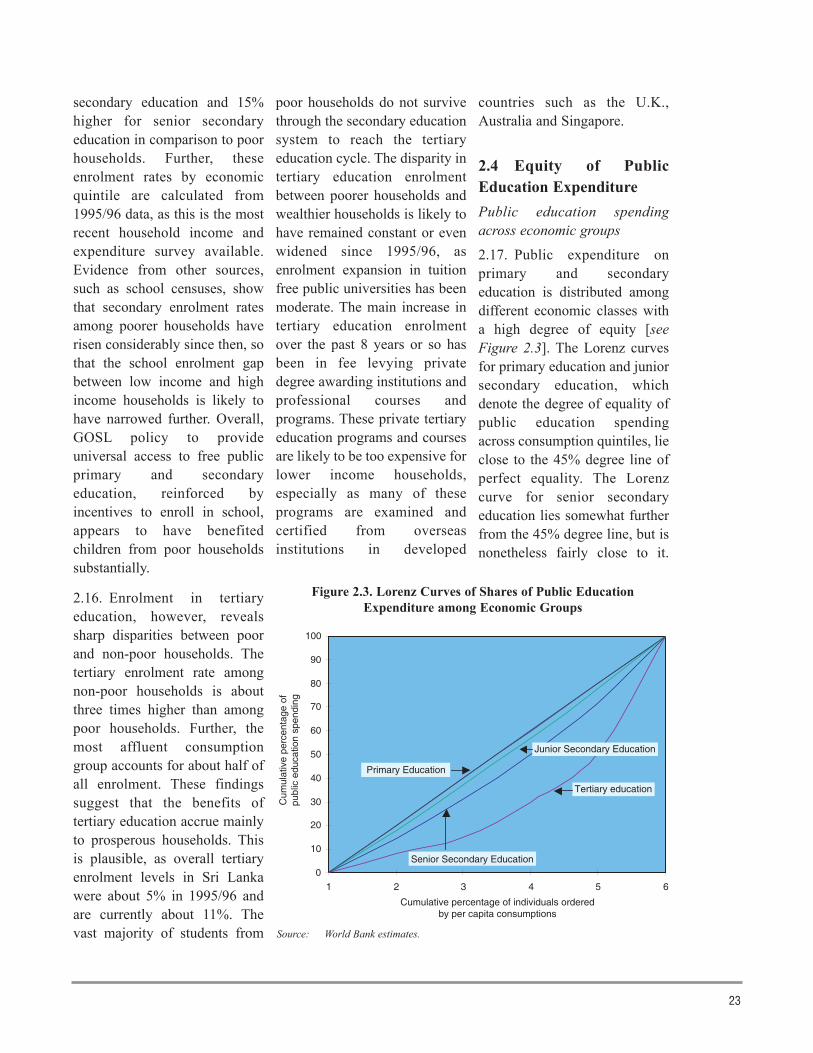
2.17. Public expenditure onprimary and secondaryeducation is distributed amongdifferent economic classes witha high degree of equity [seeFigure 2.3]. The Lorenz curvesfor primary education and juniorsecondary education, whichdenote the degree of equality ofpublic education spendingacross consumption quintiles, lieclose to the 45% degree line ofperfect equality. The Lorenzcurve for senior secondaryeducation lies somewhat furtherfrom the 45% degree line, but isnonetheless fairly close to it.
0
10
20
30
40
50
60
70
80
90
100
1 2 3 4 5 6
Tertiary education
Senior Secondary Education
Junior Secondary Education
Primary Education
Cumulative percentage of individuals orderedby per capita consumptions
Cum
ulat
ive
perc
enta
ge o
fpu
blic
edu
catio
n sp
endi
ng
Figure 2.3. Lorenz Curves of Shares of Public EducationExpenditure among Economic Groups
Source: World Bank estimates.
24
This implies that publicinvestment in education over theprimary and secondaryeducation cycles are sharedfairly evenly between affluent,middle class, working class andpoor households. This isespecially the case for primaryschooling and junior secondaryschooling.11 Public expenditureon tertiary education, incontrast, is distributedinequitably across economicgroups, with increasing sharesof expenditure accruing toprosperous households. TheLorenz curve of tertiaryeducation spending deviatessubstantially from the 45%degree line of equality. Thisimplies that the incidence ofpublic tertiary educationspending is quite unequallydistributed. Further, the largestshare of tertiary educationspending benefits only therichest 20% of households.
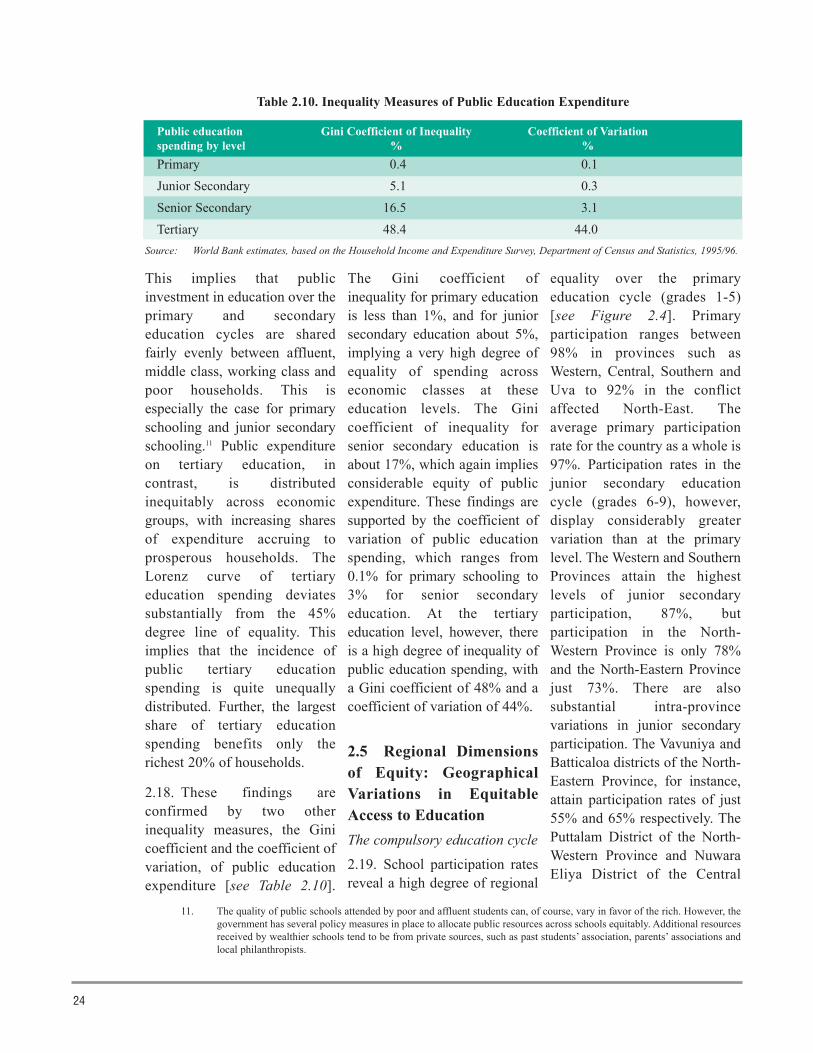
2.18. These findings areconfirmed by two otherinequality measures, the Ginicoefficient and the coefficient ofvariation, of public educationexpenditure [see Table 2.10].
The Gini coefficient ofinequality for primary educationis less than 1%, and for juniorsecondary education about 5%,implying a very high degree ofequality of spending acrosseconomic classes at theseeducation levels. The Ginicoefficient of inequality forsenior secondary education isabout 17%, which again impliesconsiderable equity of publicexpenditure. These findings aresupported by the coefficient ofvariation of public educationspending, which ranges from0.1% for primary schooling to3% for senior secondaryeducation. At the tertiaryeducation level, however, thereis a high degree of inequality ofpublic education spending, witha Gini coefficient of 48% and acoefficient of variation of 44%.
2.5 Regional Dimensionsof Equity: GeographicalVariations in EquitableAccess to EducationThe compulsory education cycle
2.19. School participation ratesreveal a high degree of regional
equality over the primaryeducation cycle (grades 1-5)[see Figure 2.4]. Primaryparticipation ranges between98% in provinces such asWestern, Central, Southern andUva to 92% in the conflictaffected North-East. Theaverage primary participationrate for the country as a whole is97%. Participation rates in thejunior secondary educationcycle (grades 6-9), however,display considerably greatervariation than at the primarylevel. The Western and SouthernProvinces attain the highestlevels of junior secondaryparticipation, 87%, butparticipation in the North-Western Province is only 78%and the North-Eastern Provincejust 73%. There are alsosubstantial intra-provincevariations in junior secondaryparticipation. The Vavuniya andBatticaloa districts of the North-Eastern Province, for instance,attain participation rates of just55% and 65% respectively. ThePuttalam District of the North-Western Province and NuwaraEliya District of the Central
Source: World Bank estimates, based on the Household Income and Expenditure Survey, Department of Census and Statistics, 1995/96.
Table 2.10. Inequality Measures of Public Education Expenditure
Public education Gini Coefficient of Inequality Coefficient of Variationspending by level % %
11. The quality of public schools attended by poor and affluent students can, of course, vary in favor of the rich. However, thegovernment has several policy measures in place to allocate public resources across schools equitably. Additional resourcesreceived by wealthier schools tend to be from private sources, such as past students’ association, parents’ associations andlocal philanthropists.
Primary 0.4 0.1Junior Secondary 5.1 0.3Senior Secondary 16.5 3.1Tertiary 48.4 44.0
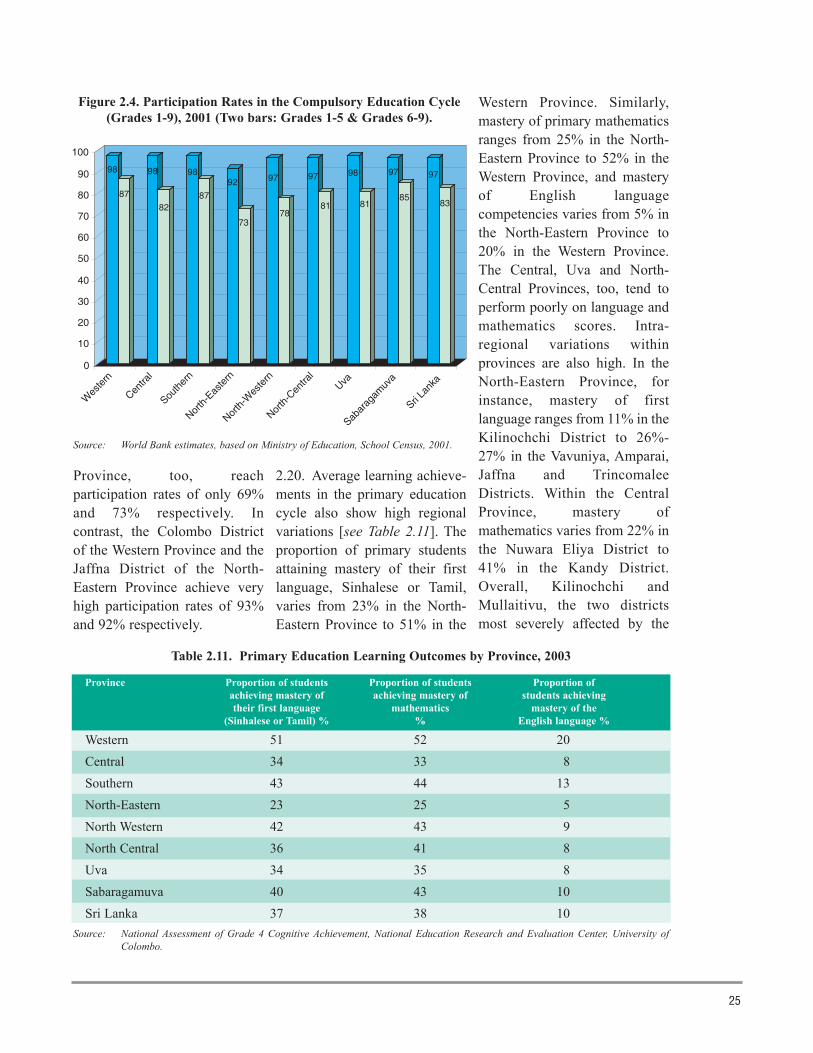
Province, too, reachparticipation rates of only 69%and 73% respectively. Incontrast, the Colombo Districtof the Western Province and theJaffna District of the North-Eastern Province achieve veryhigh participation rates of 93%and 92% respectively.
2.20. Average learning achieve-ments in the primary educationcycle also show high regionalvariations [see Table 2.11]. Theproportion of primary studentsattaining mastery of their firstlanguage, Sinhalese or Tamil,varies from 23% in the North-Eastern Province to 51% in the
Western Province. Similarly,mastery of primary mathematicsranges from 25% in the North-Eastern Province to 52% in theWestern Province, and masteryof English languagecompetencies varies from 5% inthe North-Eastern Province to20% in the Western Province.The Central, Uva and North-Central Provinces, too, tend toperform poorly on language andmathematics scores. Intra-regional variations withinprovinces are also high. In theNorth-Eastern Province, forinstance, mastery of firstlanguage ranges from 11% in theKilinochchi District to 26%-27% in the Vavuniya, Amparai,Jaffna and TrincomaleeDistricts. Within the CentralProvince, mastery ofmathematics varies from 22% inthe Nuwara Eliya District to41% in the Kandy District.Overall, Kilinochchi andMullaitivu, the two districtsmost severely affected by the
25
Table 2.11. Primary Education Learning Outcomes by Province, 2003
Source: National Assessment of Grade 4 Cognitive Achievement, National Education Research and Evaluation Center, University ofColombo.
Province Proportion of students Proportion of students Proportion ofachieving mastery of achieving mastery of students achievingtheir first language mathematics mastery of the
(Sinhalese or Tamil) % % English language %
Western 51 52 20Central 34 33 8Southern 43 44 13North-Eastern 23 25 5North Western 42 43 9North Central 36 41 8Uva 34 35 8Sabaragamuva 40 43 10Sri Lanka 37 38 10
98
87
98
82
98
87
92
73
97
78
97
81
98
81
97
85
97
83
0
10
20
30
40
50
60
70
80
90
100
Wes
tern
Centra
l
South
ern
North
-Eas
tern
North
-Wes
tern
North
-Cen
tral
Uva
Sabar
agam
uva
Sri La
nka
Figure 2.4. Participation Rates in the Compulsory Education Cycle(Grades 1-9), 2001 (Two bars: Grades 1-5 & Grades 6-9).
Source: World Bank estimates, based on Ministry of Education, School Census, 2001.
secessionist conflict, performworst in the country, while theColombo District performs best.
2.21. The comparatively highregional variations inparticipation rates within thejunior secondary educationcycle and the substantialgeographical disparities inlearning achievements can beattributed to several factors,such as: (i) variations in thequality of education acrossregions, including teachercapabilities, availability andattendance, classroom practices,school leadership, physicalfacilities and quality inputs; (ii)variations in social andeconomic conditions ofhouseholds and students, withlower education participationand achievement in poorerdistricts and provinces, andhigher education participationand achievement in wealthierdistricts and provinces; and (iii)the impact of the secessionist
conflict, which disrupted theeducation system in the North-Eastern Province and thesurrounding regions ofneighboring provinces.
Senior secondary education
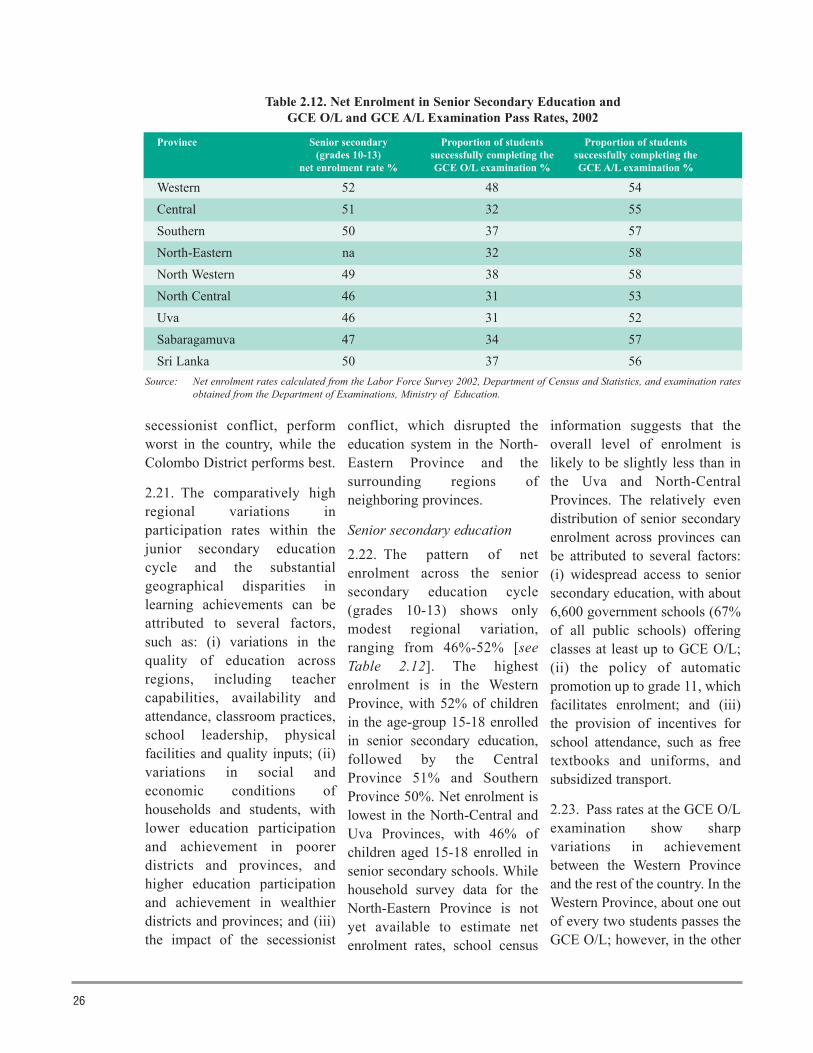
2.22. The pattern of netenrolment across the seniorsecondary education cycle(grades 10-13) shows onlymodest regional variation,ranging from 46%-52% [seeTable 2.12]. The highestenrolment is in the WesternProvince, with 52% of childrenin the age-group 15-18 enrolledin senior secondary education,followed by the CentralProvince 51% and SouthernProvince 50%. Net enrolment islowest in the North-Central andUva Provinces, with 46% ofchildren aged 15-18 enrolled insenior secondary schools. Whilehousehold survey data for theNorth-Eastern Province is notyet available to estimate netenrolment rates, school census
information suggests that theoverall level of enrolment islikely to be slightly less than inthe Uva and North-CentralProvinces. The relatively evendistribution of senior secondaryenrolment across provinces canbe attributed to several factors:(i) widespread access to seniorsecondary education, with about6,600 government schools (67%of all public schools) offeringclasses at least up to GCE O/L;(ii) the policy of automaticpromotion up to grade 11, whichfacilitates enrolment; and (iii)the provision of incentives forschool attendance, such as freetextbooks and uniforms, andsubsidized transport.
2.23. Pass rates at the GCE O/Lexamination show sharpvariations in achievementbetween the Western Provinceand the rest of the country. In theWestern Province, about one outof every two students passes theGCE O/L; however, in the other
26
Source: Net enrolment rates calculated from the Labor Force Survey 2002, Department of Census and Statistics, and examination ratesobtained from the Department of Examinations, Ministry of Education.
Table 2.12. Net Enrolment in Senior Secondary Education andGCE O/L and GCE A/L Examination Pass Rates, 2002
Province Senior secondary Proportion of students Proportion of students(grades 10-13) successfully completing the successfully completing the
net enrolment rate % GCE O/L examination % GCE A/L examination %
Western 52 48 54Central 51 32 55Southern 50 37 57North-Eastern na 32 58North Western 49 38 58North Central 46 31 53Uva 46 31 52Sabaragamuva 47 34 57Sri Lanka 50 37 56
provinces only one out of everythree students passes the GCEO/L examination. Pass rates arelowest in the North-Central andUva Provinces, with only 31%of candidates passing the GCEO/L examination. There are twomain reasons for the steepdifference between the WesternProvince and the rest of thecountry. First, the WesternProvince has some of the besteducational facilities in thecountry, and is a popularlocation with principals,teachers and educationadministrators. In consequence,the education system in theWestern Province is superior,both in terms of humanresources and the stock ofphysical capital, to the rest of thecountry. Second, the WesternProvince is considerablywealthier and better developedthan the rest of the country, andstudents come from moreeducated families and investgreater private resources ineducation. Hence, householdand student specificdeterminants of educationoutcomes are more favorable inthe Western Province.
2.24. GCE A/L examinationpass rates are fairly even acrossprovinces, ranging from 52% inUva to 58% in the North-Western and North-EasternProvinces. The low regionalvariation in GCE A/L pass ratesacross provinces can beattributed to several factors: (i)students who appear for thisexamination are among the
brightest and best motivated intheir age cohort and belong toabout the top 25% of the abilitydistribution; (ii) GCE A/Lclasses are chiefly offered inschools located in cities andtowns, where differences inschool facilities and theavailability of educationalresources are modest; and (iii)households incur substantialprivate expenses to support GCEA/L students, especially throughprivate tuition. The mainregional inequality in the GCEA/L cycle is in access to sciencesubjects and mathematics [seeNEC (2003)]. Only 600 schoolsin the country offer GCE A/Lscience classes. Further,effective GCE A/L scienceteaching is confined to about200 urban schools. Inconsequence, access to GCEA/L education in sciencesubjects is tightly constrained.In the distribution of suchschools, the North-Central, Uvaand North-Eastern Provinces areparticularly disadvantaged.
2.6 Regional Dimensionsof Equity: GovernmentPolicies to OvercomeRegional Variations inEducation Access, Qualityand Opportunity2.25. Government policy toreduce regional disparities andincrease education access andquality in disadvantaged areascontains two main components:(i) progressive centralgovernment financing, with
favorable treatment for poorprovinces and regions; and (ii)special policy measures topromote equity of educationaccess, quality and opportunity,especially: (a) a norm-based unitcost resource allocationmechanism to distribute publicresources to schools equitably;(b) a scholarship examination atgrade 5 to provide poor buttalented children access tohigher quality schools; and (c)district and special quotas forstudents from disadvantagedregions to attend universities.
Progressive governmentfinancing
2.26. One of the cardinalpolicies guiding governmenteducation expenditure is thedevelopment of educationsystems in the poorer provinces;especially those, such as theNorth-Eastern, Uva and North-Central Provinces, whoseprovincial revenue raisingcapabilities are either low ornon-existent. In contrast,affluent areas of the countrysuch as the Western Province areawarded considerably lowerresources for education by thecentral government. Forinstance, the share of centralgovernment financing ofprovincial educationexpenditure ranges from about45%-50% in the WesternProvince to 100% in the North-Eastern Province. The pattern ofpublic primary and secondaryeducation expenditure perstudent as a proportion ofprovincial per capita income, is
27
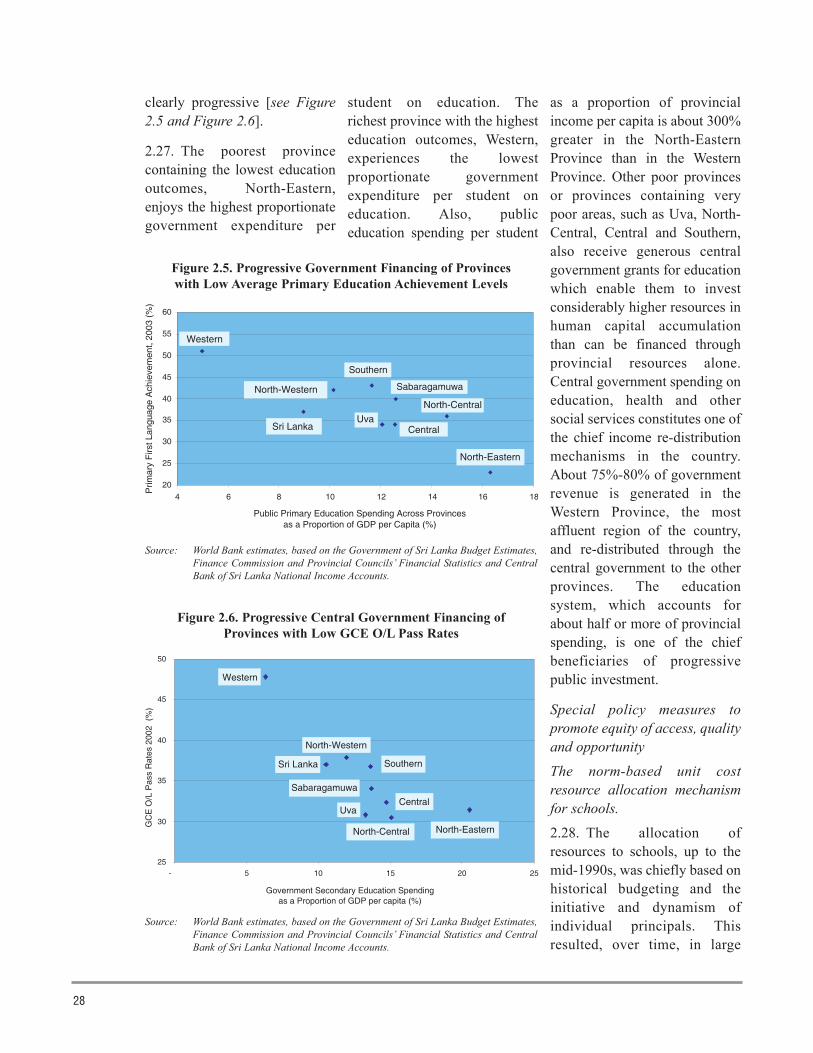
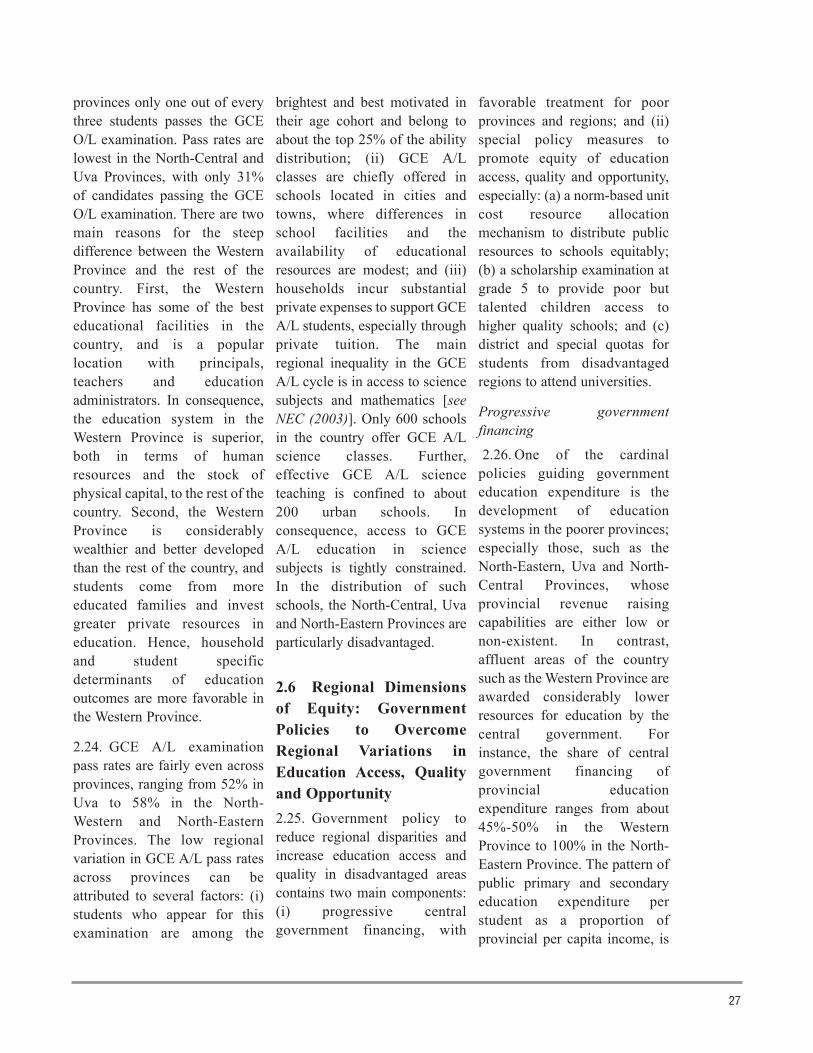
clearly progressive [see Figure2.5 and Figure 2.6].
2.27. The poorest provincecontaining the lowest educationoutcomes, North-Eastern,enjoys the highest proportionategovernment expenditure per
student on education. Therichest province with the highesteducation outcomes, Western,experiences the lowestproportionate governmentexpenditure per student oneducation. Also, publiceducation spending per student
as a proportion of provincialincome per capita is about 300%greater in the North-EasternProvince than in the WesternProvince. Other poor provincesor provinces containing verypoor areas, such as Uva, North-Central, Central and Southern,also receive generous centralgovernment grants for educationwhich enable them to investconsiderably higher resources inhuman capital accumulationthan can be financed throughprovincial resources alone.Central government spending oneducation, health and othersocial services constitutes one ofthe chief income re-distributionmechanisms in the country.About 75%-80% of governmentrevenue is generated in theWestern Province, the mostaffluent region of the country,and re-distributed through thecentral government to the otherprovinces. The educationsystem, which accounts forabout half or more of provincialspending, is one of the chiefbeneficiaries of progressivepublic investment.
Special policy measures topromote equity of access, qualityand opportunity
The norm-based unit costresource allocation mechanismfor schools.
2.28. The allocation ofresources to schools, up to themid-1990s, was chiefly based onhistorical budgeting and theinitiative and dynamism ofindividual principals. Thisresulted, over time, in large
28
25
30
35
40
45
50
- 5 10 15 20 25
North-EasternGC
E O
/L P
ass
Rat
es 2
002
(%
)
Government Secondary Education Spendingas a Proportion of GDP per capita (%)
North-Central
Central
North-Western
Sabaragamuwa
Southern
Uva
Sri Lanka
Western
Source: World Bank estimates, based on the Government of Sri Lanka Budget Estimates,Finance Commission and Provincial Councils’ Financial Statistics and CentralBank of Sri Lanka National Income Accounts.
20
25
30
35
40
45
50
55
60
4 6 8 10 12 14 16 18
Western
UvaCentral
North-Central
Sri Lanka
North-Western
Prim
ary
Firs
t Lan
guag
e A
chie
vem
ent,
2003
(%
)
Public Primary Education Spending Across Provincesas a Proportion of GDP per Capita (%)
Sabaragamuwa
Southern
North-Eastern
Figure 2.5. Progressive Government Financing of Provinceswith Low Average Primary Education Achievement Levels
Figure 2.6. Progressive Central Government Financing ofProvinces with Low GCE O/L Pass Rates
Source: World Bank estimates, based on the Government of Sri Lanka Budget Estimates,Finance Commission and Provincial Councils’ Financial Statistics and CentralBank of Sri Lanka National Income Accounts.
29
budgetary disparities betweenschools, with funding variationsbetween schools of similarcharacteristics as large as 1:300in 1996 [see GOSL-ADB (1996),Aturupane andAbeygunawardena (2000)]. Toaddress this issue, thegovernment adopted a policy offunding schools based on anorm-based, unit cost resourceallocation formula [seeAturupane and Abeyguna-wardena (2000)]. This formulais built on five criteria: (i)quality input norms produced bycurriculum developers, teachereducators and master teachers;(ii) a central equation to allocateresources for recurrentexpenditures to schools on a perstudent basis; (iii) fine tuning ofthe central equation toaccommodate economies ofscale enjoyed by large schoolsand diseconomies of scaleexperienced by small schools;(iv) variations across gradecycles, based on quality inputnorms; and (v) the application ofa stock adjustment principle forcapital investments, whereschools are allocated resourcesto enable gradual developmentfrom their existing capital stockto the desired capital stockimplied by the quality inputnorms. This resource allocationformula was pilot tested in a fewprovinces during 1999, andintroduced island-wide from2000 onwards. The formula hasproved highly successful,reducing disparities betweenschools with similarcharacteristics from 1:300 in
1996 to about 1:15 by 2002 [seeFinance Commission (2002)].Poor schools have enjoyed largeinflows of quality inputs andcentral government andprovincial council educationstaff members have welcomedthe increased equity of resourceallocation to schools. Educationpolicy makers have affirmed theuse of the norm-based unit costresource allocation mechanismas the basis on which publicresources should be distributedto schools in the future [see NEC(2003)].
Grade 5 scholarship for poorbut talented pupils
2.29. The variations ineducation quality, obviously,reach deeper than thegeographical boundaries ofprovincial councils. The qualityof education varies amongschools within provincialboundaries as much as acrossprovinces. Students from poorrural homes tend to bedisadvantaged, in particular, asschools located in cities andtowns are on average of higherquality than schools in ruralareas. The government has aspecial policy measure, theGrade 5 scholarship scheme, toincrease educationalopportunities for talentedchildren from poor householdsand schools. Students uponreaching grade 5 are allowed tosit a national scholarshipexamination, and successfulpupils from disadvantagedschools are entitled to transfer,with state assistance, to better
schools for their secondaryeducation. The Grade 5scholarship scheme has beenextremely popular amongparents and families, andgovernment policy is to continuethis scheme, with periodic finetuning [see NEC (2003)].
University quotas to providepreferential access to studentsfrom poor districts
2.30. The government allocatesa proportion of university placeson the basis of district quotas, tocompensate for educationaldisadvantages to students frompoorer districts. For subjectssuch as Medicine, Engineering,Science, Agriculture, Law andCommerce only 40% ofuniversity places are allocatedpurely on GCE A/L marks. Afurther 55% of places areawarded on a district quotasystem, with each districtreceiving a quota proportional toits population. Within thedistrict quotas, allocation ofuniversity positions is again onthe basis of GCE A/L marks.The final 5% of universityplaces are reserved for studentsfrom educationallydisadvantaged districts. Atpresent, the disadvantageddistricts, which receivepreferential treatment in theallocation of university quotas,are: (i) seven of the eightdistricts of the North-EasternProvince, Jaffna, Kilinochchi,Mullativu, Vavuniya, Mannar,Trincomalee and Amparai; (ii)the two districts of the UvaProvince, Moneragala and
Badulla; (iii) the two districts ofthe North-Central Province,Anuradhapura and Pollonaruwa;and (iv) one district each fromthe Southern and CentralProvinces, Hambantota andNuwara Eliya, respectively.However, university admissionis based purely on marks at theGCE A/L for arts subjects, aseducational opportunities areconsidered fairly even acrossdistricts for arts subjects.
2.7 Conclusions andOptions for the Future2.31. The preceding analysisshows that investment ineducation produces a wide arrayof economic and social benefits,ranging from increased laborproductivity, occupationalattainment and earnings tosuperior family health and childnutrition outcomes. The socialrate of return to education ishigh, especially at thecompulsory basic and seniorsecondary education gradecycles, and suggests that SriLanka under-invests ineducation at these levels.Externality effects, such ashealth and nutrition benefits, arealso strong among primary andsecondary educated mothers.Tertiary education generateshigh private returns toindividuals, through suchoutcomes as higher female laborforce participation, superioroccupational attainment andincreased earnings. However,social returns to tertiaryeducation are considerably
smaller than for compulsorybasic and secondary education,suggesting that the benefits oftertiary education accrue chieflyto individuals as private gains.
2.32. The potential benefits ofinvestment in education havenot been fully utilized, as sloweconomic growth has resulted inpoor expansion of the demandfor educated labor, resulting inseveral episodes of social unrestand political instability led byfrustrated, unemployed educatedyoung people. The main causesof slow growth were economicpolicies that, over a long periodof time from the 1950s to the1970s, stifled markets andreduced incentives, and thesecessionist conflict in theNorth-Eastern area from the1980s onwards. Currently, thepro-market policies of the majorpolitical parties and the ceasefirein the North-Eastern region offerpromise of faster economicgrowth and higher demand foreducated labor. Peace wouldespecially benefit householdsand students in the North-Eastern province, which is nowthe least developed region in thecountry.
2.33. Education exerts apowerful effect on povertyreduction and the economicwelfare of the poor. There is alsoa high degree of equity ofgovernment educationinvestment across provinces,with progressively higher perstudent allocations foreducationally disadvantagedregions. The wide range of
policy measures to promoteenrolment, attendance andschool completion, especially atprimary and compulsory basiceducation levels, have enjoyed ahigh measure of success. Andsuccessful and popular policies,such as the norm-based unit costresource allocation mechanism,have greatly enhanced the equityof resource distribution amongschools. The allocation of publiceducation spending acrosseconomic groups is progressiveat the primary and secondaryeducation levels, with benefitsrelatively evenly distributedamong all economic groups.However, at tertiary educationlevel the pattern of publiceducation spending isregressive, with benefitsaccruing disproportionately tothe highest economic class.
2.34. These findings, especiallythe pattern of social and privaterates of return to education, theexternality benefits ofschooling, and the equity ofgovernment educationexpenditure among economicclasses, suggest four importantpolicy directions for futurepublic investment in education.
a. Expansion of publicinvestment in primary andsecondary education,while controllingexpenditure on tertiaryeducation, especiallycostly universityeducation. This can beaccomplished byallocating the largest shareof any increase in
30
budgetary resources foreducation to primary andsecondary education. Inaddition, resourcesgenerated within theeducation system throughcost saving measures canalso be channeled towardsthe school system.
b. Increased resources forprimary and secondaryschooling could beallocated to meet the extracost of achievinguniversal enrolment andcompletion in thecompulsory schoolingcycle, grades 1-9, and toraise the quality ofprimary and secondaryeducation. Policymeasures to attract the last18% of the populationaged 6-14 into theeducation system caninclude expanding anddeveloping the specialeducation and non-formaleducation programs,reconstructing andrehabilitating thedamaged schools in theconflict affected regions,improving facilities fordisabled children, andincreasing the coverage ofbasic services in schoolslocated in disadvantagedareas, such as watersupply and sanitation.Increasing the quality ofeducation can includeinvesting greaterresources in qualityinputs, such as teachingmaterial, learning
resources, equipment andtechnology, and qualityprocesses, such asprofessional developmentof teachers, training ofprincipals to provideeffective schoolleadership, and on-siteacademic and managerialsupport to schools.
c. Creating a favorableenvironment for privateinvestment in education.The private sector cancontribute considerableresources to the educationsystem. However, thelegal restriction onestablishing privateschools over the grade 1-9cycle needs to be lifted toexploit this potentialsource of additionalinvestment into theeducation sector. Inaddition, the governmentneeds to take steps tolighten the limitations onprivate investmentimposed by the politicaleconomy environment,which is highly negativetoward privateinvestment. Removing thelegal barrier to privateinvestment in the basiceducation cycle would beone important step. Afurther key step would bean official publicendorsement of therecommendations madeby the NEC (2003) toallow the establishment ofprivate schools,international schools and
private degree awardinginstitutions, under suitablequality assurance criteriaand measures.
d. Expansion of tertiaryeducation, especially theexpensive universitysystem, could be leftchiefly to the privatesector. To furtherencourage privateinvestment in tertiaryeducation the governmentneeds to advance policymeasures to counter thepresent negative politicaleconomy environmentsurrounding the tertiarysystem. Currently, severalpromising policy actionshave been initiated,including reform of thelegislative frameworkgoverning the universitysystem to provide greaterautonomy to individualinstitutions, financialstipends for tertiary levelskills developmentactivities, and the creationof an accreditationframework to cover bothprivate degree awardinginstitutions and publicuniversities. Furthermeasures could includedeveloping a student loanscheme, especially forpoor but talented students,and introducing a vouchersystem that tertiary levelstudents can use in eitherprivate or public tertiaryeducation institutions.
31
32
Source: World Bank estimates, based on the Department of Census and Statistics, Labor Force Survey, 2002.
Appendix Table A1.Male and Female Labor Force Participation Rates, 2002
19-24 years 74 4425-29 years 92 4530-34 years 96 4135-39 years 95 4640-44 years 94 4645-49 years 92 4450-54 years 88 3955-59 years 77 2760-70 years 50 12
Age Men Women% %
Related Documents


