Economic and Revenue Outlook FY 2019-20, FY 2020-21 and FY 2021-22 Michigan Department of Treasury Rachael Eubanks, State Treasurer Office of Revenue and Tax Analysis Eric Bussis, Chief Economist and Director Andrew Lockwood, Manager, Forecasting and Economic Analysis Melissa Gibson, Economic Specialist Thomas Patchak-Schuster, Economic Specialist January 10, 2020

Welcome message from author
This document is posted to help you gain knowledge. Please leave a comment to let me know what you think about it! Share it to your friends and learn new things together.
Transcript

Economic and Revenue Outlook
FY 2019-20, FY 2020-21 and FY 2021-22 Michigan Department of Treasury
Rachael Eubanks, State Treasurer
Office of Revenue and Tax Analysis Eric Bussis, Chief Economist and Director
Andrew Lockwood, Manager, Forecasting and Economic Analysis Melissa Gibson, Economic Specialist
Thomas Patchak-Schuster, Economic Specialist
January 10, 2020

Economic and Revenue Outlook
FY 2019-20, FY 2020-21 and FY 2021-22 Michigan Department of Treasury
Acknowledgements
The Economic and Revenue Outlook was prepared by Eric Bussis, Director of the Office and Revenue and Tax Analysis (ORTA), Andrew Lockwood, Melissa Gibson and Thomas Patchak-Schuster of ORTA. ORTA economists Scott Darragh, Denise Heidt, and Eric Krupka contributed to the estimates contained in the report.

Table of Contents
SECTION I: Administration Estimates--Executive Summary ..................... 1
Administration Estimates--Executive Summary ...................................................................... 2
Revenue Review and Outlook ............................................................................................... 2
2020, 2021 and 2022 U.S. Economic Outlook ...................................................................... 3
2020, 2021 and 2022 Michigan Economic Outlook ............................................................. 3
Forecast Risks......................................................................................................................... 4
SECTION II: Economic Review ................................................................................ 5
Economic Review ......................................................................................................................... 6
Current U.S. Economic Situation ......................................................................................... 6 Overall Economic Growth ................................................................................................. 6 Employment....................................................................................................................... 7
Overall Wage and Salary Employment.................................................................. 7 Unemployment Rate .............................................................................................. 9
Housing Market .............................................................................................................. 10 House Construction and Sales ............................................................................. 10 Mortgage Interest Rates ....................................................................................... 11
Monetary Policy ............................................................................................................... 11 Fiscal Policy ..................................................................................................................... 14 Inflation ............................................................................................................................ 14 Major Economic Indices .................................................................................................. 16 Vehicle Sales and Production .......................................................................................... 18
Current Michigan Economic Conditions........................................................................... 20 Vehicle Production........................................................................................................... 20 Employment..................................................................................................................... 21 Unemployment Rate ........................................................................................................ 22 Housing Market ............................................................................................................... 24 Personal Income............................................................................................................... 25 State Real Gross Domestic Product ................................................................................. 26
SECTION III: Administration Economic Outlook............................................. 27
Administration Economic Forecast Summary .................................................................. 28
Michigan Department of Treasury Economic and Revenue Outlook - i -January 10, 2020

2020, 2021 and 2022 U.S. Economic Outlook .................................................................... 28 Summary .......................................................................................................................... 28 Assumptions..................................................................................................................... 31
2020, 2021 and 2021 Michigan Economic Outlook ........................................................... 32
Fiscal Year Economics......................................................................................................... 34
Forecast Risks....................................................................................................................... 36
SECTION IV: Administration Revenue Estimates ............................................ 40
Administration Revenue Estimates .......................................................................................... 41
Revenue Estimate Overview ............................................................................................... 41
FY 2019 Revenue Outlook................................................................................................... 42
FY 2020 Revenue Outlook................................................................................................... 43
FY 2021 Revenue Outlook................................................................................................... 44
FY 2022 Revenue Outlook................................................................................................... 45
Constitutional Revenue Limit............................................................................................. 46
Budget Stabilization Fund Calculation.............................................................................. 46
School Aid Fund Revenue Adjustment Factor.................................................................. 47
Revenue Detail...................................................................................................................... 48
List of Tables
Table 1 Administration Economic Forecast ........................................................................ 29
Table 2 FY 2018-19 Preliminary Final Revenue Estimates ............................................... 42
Table 3 FY 2019-20 Administration Revenue Estimates.................................................... 43
Table 4 FY 2020-21 Administration Revenue Estimates.................................................... 44
Table 5 FY 2021-22 Administration Revenue Estimates.................................................... 45
Michigan Department of Treasury Economic and Revenue Outlook - ii -January 10, 2020

Table 6 Administration Revenue Limit Calculation .......................................................... 46
Table 7 Administration School Aid Revenue Adjustment Factor for FY 2021 ................ 47
Table 8 Administration School Aid Revenue Adjustment Factor for FY 2022 ................ 48
Table 9 Administration General Fund General Purpose Revenue Detail .......................... 49
Table 10 Administration School Aid Fund Revenue Detail ................................................ 50
Table 11 Administration Major Tax Totals ......................................................................... 50
Michigan Department of Treasury Economic and Revenue Outlook - iii -January 10, 2020

SECTION I
Administration Estimates Executive Summary
Michigan Department of Treasury - 1 -Economic and Revenue Outlook January 10, 2020

Administration Estimates Executive Summary
January 10, 2020
Revenue Review and Outlook
Over the forecast horizon, revenue growth is projected as economic growth continues at a slightly slower pace than recent years. Earmarking changes from GF-GP income tax will also restrain growth of that fund.
FY 2020 GF-GP revenue is forecast to decrease 1.3 percent to $10,968.8 million, up $191.9 million from the May 2019 Consensus estimate. FY 2020 SAF revenue is forecast to increase 2.5 percent to $13,905.2 million, up $65.4 million from the May 2019 Consensus estimate.
FY 2021 GF-GP revenue is forecast to increase 0.9 percent to $11,065.0 million, up $144.5 million from the May 2019 Consensus estimate. FY 2021 SAF revenue is forecast to increase 2.7 percent to $14,283.0 million, up $103.5 million from the May 2019 Consensus estimate.
FY 2022 GF-GP revenue is forecast to increase 2.4 percent to $11,329.0 million. FY 2022 SAF revenue is forecast to increase 2.1 percent to $14,585.5 million.
Administration GF-GP and School Aid Fund Revenue Estimates (millions of dollars)
$14,586 $14,283 $13,905
$10,969 $11,065 $11,329
FY 2020 FY 2021 FY 2022
GF-GP SAF
Michigan Department of Treasury - 2 -Economic and Revenue Outlook January 10, 2020

2020, 2021 and 2022 U.S. Economic Outlook
Modest economic growth is expected throughout the forecast horizon.
In 2018, real GDP growth accelerated to 2.9 percent from 2.4 percent. However, economic growth decelerated to an estimated 2.3 percent in 2019. Real GDP is forecast to rise 1.6 percent in 2020 and in 2021 and to increase 1.5 percent in 2022.
In 2019, national employment increased an estimated 1.6 percent marking its ninth straight national annual increase. U.S. employment is projected to rise 1.2 percent in 2020, 0.9 percent in 2021 and 0.9 percent in 2022.
The U.S. unemployment rate has declined in each of the past nine years. In 2019, the national unemployment rate dropped an estimated 0.2 of a point to 3.7 percent – the lowest annual unemployment rate since 1969. The national unemployment rate is forecast to fall to 3.5 percent in 2020, remain at 3.5 percent in 2021 and rise to 3.6 percent in 2022.
Housing starts increased an estimated 0.3 percent in 2019, marking the 10th straight annual increase. Housing starts are forecast to increase 0.6 percent in 2020, rise 0.2 percent in 2021 and decline 0.7 percent in 2022. Throughout the forecast horizon, starts are expected to remain at historically low levels.
In 2019, light vehicle sales fell to 17.0 million units. Over the forecast horizon, light vehicle sales are projected to fall to 16.8 million units in 2020, 16.5 million units in 2021 and 16.4 million units in 2022.
In 2019, CPI inflation slowed to an estimated 1.7 percent. Inflation is forecast to rise slightly to 1.8 percent in 2020 and then accelerate to 1.9 percent in 2021 and remain at 1.9 percent in 2022.
2020, 2021 and 2022 Michigan Economic Outlook
The Michigan economy is expected to grow over the forecast from 2020 to 2022. Michigan wage and salary employment is expected to record slight growth and personal income is expected to show modest growth.
Michigan wage and salary employment increased an estimated 0.5 percent in 2019 – marking the ninth straight annual increase. Michigan employment is forecast to rise 0.6 percent in 2020, 0.5 percent in 2021 and 0.4 percent in 2022.
The Michigan unemployment rate dropped each year between 2010 and 2018. In 2018, the Michigan unemployment rate fell to 4.1 percent, where the rate is estimated to have remained in 2019. The Michigan unemployment rate is forecast to fall to 3.9 percent in 2020, decline to 3.8 percent in 2021 and fall to 3.7 percent in 2022.
Michigan Department of Treasury - 3 -Economic and Revenue Outlook January 10, 2020

In 2019, Michigan wages and salaries grew an estimated 3.3 percent. Michigan wages and salaries are forecast to rise 4.1 percent in 2020, increase 3.9 percent in 2021 and rise 3.7 percent in 2022.
Michigan personal income increased an estimated 4.1 percent in 2019. Michigan income is projected to increase by 3.7 percent in 2020, 3.5 percent in 2021 and 3.4 percent in 2022.
On a fiscal year basis, Michigan disposable income rose an estimated 4.2 percent in FY 2019. Disposable income is projected to rise 4.0 percent in FY 2020 and increase 3.4 percent both in FY 2021 and in FY 2022.
Wages and salaries increased 2.2 percent in FY 2019. Wages and salaries are forecast to increase 4.6 percent in FY 2020 and to rise 3.8 percent both in FY 2021 and in FY 2022.
Forecast Risks
International geopolitical and international trade tensions and U.S. household and business concerns about these tensions remain substantial. Significant international trade risks surround continued U.S.-China trade tensions and negotiations and when and how the United Kingdom will depart from the European Union. In addition, the tensions in the Middle East represent a major geopolitical risk.
Uncertainty surrounds if and when the Fed might lower/raise interest rates and/or modify its quantitative easing program and the impact of Fed actions on consumer and business sentiment, spending and investment.
To the extent to which consumer and business expectations drop going forward, sentiment could drop sharply and, in turn, weaken the macroeconomy.
Slower than expected economic growth across Asia and Europe would have a negative impact on the U.S. economy.
Lower than expected vehicle sales and manufacturing demand would weaken the U.S. and Michigan economies.
Michigan Department of Treasury - 4 -Economic and Revenue Outlook January 10, 2020

SECTION II
Economic Review
Michigan Department of Treasury - 5 -Economic and Revenue Outlook January 10, 2020

Economic Review January 10, 2020
Current U.S. Economic Situation
Overall Economic Growth
The current U.S. economic expansion represents the longest U.S. economic expansion in recorded history. However, the current expansion is also one of the slowest expansions on record.
The current U.S. economic expansion is more than ten years old – the longest expansion in recorded history. According to the Institute for Supply Management’s Purchasing Managers’ Index (PMI), the overall U.S. economy expanded for its 128th straight month in December 2019. Real Gross Domestic Product (GDP) has grown in all but three quarters since the end of the Great Recession. The last quarterly decline was in 2014Q1.
After growing 2.9 percent in 2015, real GDP slowed to 1.6 percent in 2016 – matching 2011 growth as the slowest annual real GDP gain in the current expansion. However, growth accelerated to 2.4 percent in 2017 and to 2.9 percent in 2018. Comprising the largest share of the level of real GDP, consumption has played the largest role in supporting overall annual real GDP growth as the graph below illustrates.
GDP Growth 1.6%
GDP Growth 2.4%
GDP Growth 2.9%
-2.0%
-1.0%
0.0%
1.0%
2.0%
3.0%
-2.0%
-1.0%
0.0%
1.0%
2.0%
3.0%
2016 2017 2018
Real GDP Growth and Contributions to Percent Change in GDP
2016, 2017 and 2018
Personal consumption expenditures Fixed investment Private inventories Net exports Government
Source: Bureau of Economic Analysis.
Michigan Department of Treasury - 6 -Economic and Revenue Outlook January 10, 2020

After slowing sharply in 2018Q4, annualized real GDP growth rebounded in the first quarter of 2019. In 2019Q1, consumption’s contribution to overall growth was disproportionately small with smaller and more volatile components of real GDP (fixed investment, change in inventories and net exports) accounting for an outsized share of overall 2019Q1 growth. In 2019Q2, consumption growth added 3.0 percentage points to overall growth – equaling 150 percent of the quarter’s overall real 2.0 percent GDP growth. The smaller and more volatile GDP components subtracted a combined 1.8 points from overall growth. In the third quarter, declines in fixed investment, inventories and net exports subtracted a much smaller amount from overall growth (0.3 points) while consumption added 2.1 points and government spending added 0.3 points.
-3.0% -2.0% -1.0% 0.0% 1.0% 2.0% 3.0% 4.0%
2018Q3 2018Q4 2019Q1 2019Q2 2019Q3
Real Annualized GDP Growth and Contributions To Growth
GDP Growth Personal consumption expenditures
Fixed investment Private inventories
Net exports Government
Source: Bureau of Economic Analysis.
Employment
Overall Wage and Salary Employment
Wage and salary employment growth remains strong, with employment at an all-time high in November 2019.
The current streak of 110 months of employment gains is by far the longest on record.
U.S. wage and salary employment has continued rising since the May 2019 Consensus Conference. November 2019 marked the 110th consecutive increase from the prior month in national wage and salary employment. Consequently, at 152.3 million jobs, the November 2019 employment level represents the all-time high monthly U.S. employment level. Year-to-date (YTD) through November, 2019 national employment has risen by 1.98 million jobs, an average increase of 180,000 jobs per month. The YTD 180,000 per month jobs increase in 2019 is
Michigan Department of Treasury - 7 -Economic and Revenue Outlook January 10, 2020

substantially smaller than last year’s 223,000 jobs per month average. Over the 110 straight monthly jobs gains, the monthly jobs increase has averaged 199,000 jobs.
U.S. Payroll Employment Monthly Increases Varied Widely in 2019
(Monthly Change in Thousands)
227
312
56
153
216
62
178 166
219 193
156
266
Source: Bureau of Labor Statistics, U.S. Department of Labor.
Through November 2019, employment was up 1.6 percent which will likely make 2019 the ninth straight calendar year of U.S. payroll employment increases.
U.S. Wage and Salary Employment – Percentage Change
1.2%
1.7%
1.6%
2.1%
1.6%
1.7%
1.6%
0.0%
0.5%
1.0%
1.5%
2.0%
2.5%
2011 2012 2013 2014 2015 2016 2017 2018 2019 YTD
Source: Bureau of Labor Statistics, U.S. Department of Labor.
Michigan Department of Treasury - 8 -Economic and Revenue Outlook January 10, 2020

Unemployment Rate
In both September 2019 and November 2019, the national unemployment rate equaled 3.5 percent, the lowest monthly U.S. jobless rate since May 1969.
In 2018, the U.S. unemployment rate averaged 3.9 percent, the lowest calendar year national unemployment rate since 1969. Over the first eleven months of 2019, the national unemployment rate averaged 3.7 percent.
After rising to 4.0 percent in January 2019, the monthly U.S. unemployment rate fell to 3.8 percent in February and then to 3.6 percent in April. In June, the national unemployment rate rose to 3.7 percent, where the rate remained through August. Then, in September the U.S. unemployment rate dropped to 3.5 percent – the lowest monthly unemployment rate since May 1969. Most recently, after rising to 3.6 percent in October, the U.S. unemployment rate fell again to 3.5 percent in November.
The annual U.S. unemployment rate has fallen in each of the past eight years. After peaking at a 28-year high of 9.6 percent in 2010, the national unemployment rate fell to 8.9 percent in 2011 and by 2017 dropped to 4.4 percent. In 2018, the U.S. unemployment rate averaged 3.9 percent which was the lowest calendar year U.S. jobless rate since 1969. Through November, the 2019 U.S. unemployment rate has averaged 3.7 percent – strongly indicating that the annual national unemployment rate will drop for the ninth straight year in 2019.
United States Unemployment Rate 2008-2019 YTD
9.6
8.1
5.3
3.9
3.7
0.0
2.0
4.0
6.0
8.0
10.0
Source: Bureau of Labor Statistics, U.S. Department of Labor.
The four-week average of initial unemployment claims has remained below 300,000 for 250 consecutive weeks (through December 28, 2019) which is the longest streak of sub-300,000
Michigan Department of Treasury - 9 -Economic and Revenue Outlook January 10, 2020

readings since 1970, when the U.S. workforce and population were much smaller. Similarly, the four-week average has remained below 250,000 for 116 straight weeks, the longest streak of sub-250,000 readings since 1970. Most recently, the four-week average stood at 233,250 initial claims at the end of 2019.
Housing Market
Despite gains over the past nine years, housing starts remain at historically low levels.
On net, mortgage rates have fallen modestly over the past year.
House Construction and Sales
Since the Great Recession, calendar year housing starts have strengthened but remain at a historically low level. Compared to the 2009 record annual low, 2018 annual housing starts averaged 125.6 percent higher. However, 2018 housing starts were 39.6 percent below the record high 2005 level and are 8.9 percent lower than average annual housing starts in the 1990s, before the housing boom. Through November 2019 year-to-date annualized housing starts have averaged 1.27 million—up slightly (0.6 percent) from the first eleven months of 2018.
November 2019 marked the 56th straight month in which housing starts were above 1.0 million units at an annualized rate and marked the 38th straight month in which annualized starts exceeded 1.1 million units. On a year-over-year (y-o-y) basis, monthly housing starts have risen in each of the past six months.
After declining from a year ago in eight straight months, the three-month average of housing starts has been up in each of the past five months. In November 2019, the three-month average of housing starts was up 13.6 percent from November 2018’s three-month average.
Following a 9.3 percent increase in 2017, new home sales rose slightly (0.7 percent) in 2018 --marking the seventh straight annual sales increase. Through November 2019, new home sales were up 10.3 percent from the first 11 months of 2018. In each of the past five months for which data are available (July 2019-November 2019), monthly existing home sales were up from a year earlier.
The National Association of Home Builders Housing Market Index has remained in positive territory (above 50) in each month since July 2014. In December 2017, the Index rose to 74, the then highest level in over 18 years. The index remained around the high 60s through most of 2018. However, weighed down by poor housing affordability, the Index fell substantially in final two months of 2018. Consequently, between December 2017 and December 2018, the Index fell a net 18 points to 56 (the Index’s lowest reading in three and a half years). However, over the past year, homebuilder confidence has improved tremendously. In December 2019, the Index rose to 76 – up 20 points from a year ago and reaching its highest level in over 20 years.
Michigan Department of Treasury - 10 -Economic and Revenue Outlook January 10, 2020

Housing Starts Growth Continues to Accelerate Levels Remain Historically Low
1,216
1,185
1,212
1,194
1,213 1,206
1,244 1,256
1,234
1,271 1,282
1,321 1,318
-10.0%
-8.0%
-6.0%
-4.0%
-2.0%
0.0%
2.0%
4.0%
6.0%
8.0%
10.0%
Nov 2018
Dec 2018
Jan 2019
Feb 2019
Mar 2019
Apr 2019
May 2019
Jun 2019
Jul 2019
Aug 2019
Sep 2019
Oct 2019
Nov 2019
Annualized Starts Level (1000s) Y-o-y Change (3 Mo Avg)
Source: Bureau of the Census.
Mortgage Interest Rates
Compared to a year ago, the 30-year fixed mortgage rate is down 0.90 of a percentage point.
At the time of the May 2019 Consensus Conference, the most recent available 30-year fixed mortgage rate stood at 4.20 percent. Between late-April and early September, the rate fell a net 0.71 of a percentage point to 3.49 percent. Between early September and later October, the rate trended upward – rising to 3.78 percent at the end of October. In November, the rate fluctuated between 3.66 percent and 3.75 percent with the rate averaging 3.70 percent in November and the first week of December. At the end of December, the rate stood at 3.74 percent -- 0.81 of a percentage point lower than a year earlier.
Monetary Policy
Since the May 2019 Consensus Conference, the FOMC lowered its target interest rate range by 25 basis points three times (July, September and October) before leaving the range unchanged in December at 1.50-1.75 basis points.
Uncertainty surrounds the timing and direction (increase or decrease) of the FOMC’s next rate change.
After maintaining the target federal funds rate range at a record low 0.00 to 0.25 percent for seven years, the Federal Open Market Committee (FOMC) raised the target interest rate range 25
Michigan Department of Treasury - 11 -Economic and Revenue Outlook January 10, 2020

basis points in December 2015 and raised the range an additional 25 basis points in December 2016. The FOMC raised the target range by 25 basis points three times in 2017 and four times in 2018. At its first four meetings in 2019, the FOMC left the target range unchanged. However, the FOMC lowered its target interest rate range by 25 basis points at each of the Committee’s next three scheduled meetings in late-July, mid-September and late-October. At its early-December meeting, the FOMC left the target range unchanged. Consequently, the Fed’s current federal funds rate range stands at 1.50-1.75 percent.
Federal Funds Interest Rate (lower limit) 2009-2020
0.00
0.25
0.50
0.75
1.00
1.25
1.50
1.75
2.00
2.25
2.50
Source: Board of Governors of the United States Federal Reserve System
The FOMC’s statements have changed substantially over the past year. At the mid-December 2018 meeting, the Committee strongly indicated that the Fed would continue with its program of gradual interest rate hikes into 2019:
The Committee judges that some further gradual increases in the target range for the federal funds rate will be consistent with sustained expansion of economic activity, strong labor market conditions, and inflation near the Committee’s symmetric 2 percent objective over the medium term. (FOMC Statement, December 19, 2018)
However, at its next meeting in late January 2019, the FOMC statement strongly suggested that the Committee would put its program of gradual interest rate increases on hold for an extended period of time. After leaving the target interest rate range unchanged at its next three meetings, the FOMC lowered the range 25 basis points at each of its next three meetings in July, September and October. At each of the three meetings, the Fed acknowledged strength in household spending but also pointed to weakness in business fixed investment. At its October meeting, the Fed also pointed to weakness in exports.
Michigan Department of Treasury - 12 -Economic and Revenue Outlook January 10, 2020

At the July, September and October meetings, while maintaining that sustained growth and inflation near its 2.0 percent goal was the most likely outcome, the FOMC lowered the target range each time “[i]n light of the implications of global developments for the economic outlook as well as muted inflation pressures.” Global developments likely include weaker global economic and financial conditions, international trade conflicts and those conflicts’ uncertainties.
At its December 2019 meeting, the FOMC left the target interest rate range unchanged. In so doing, the Fed judged “that the current stance of monetary policy is appropriate to support sustained expansion of economic activity, strong labor market conditions, and inflation near the Committee’s symmetric 2 percent objective.”
The Fed’s most recent dot plots anticipate that the federal funds rate target range will remain unchanged through 2020 before slowly rising in 2021 and 2022. However, as the FOMC has at each of its recent meetings, the Committee stated that its future interest rate actions would remain substantially data dependent. At its December 2019 meeting, the Fed explicitly pointed to incoming information on the “global developments and muted inflation pressures.”
Complicating the implementation of monetary interest rate policy, money markets underwent unexpected turmoil in mid-September 2019. Due to an unexpected lack of liquidity, the repo rate (the rate charged for an overnight loan secured by Treasury or Agency debt and whose rate typically tracks the federal funds rate) shot up past eight percent on September 17. Since mid-September, seeking to stabilize the repo market, the Federal Reserve has been injecting substantial amounts of liquidity by purchasing short-term government bonds with cash. The Fed has stressed that the short-term government bond purchases are aimed --- not a stimulating the macroeconomy-- but at providing money markets sufficient liquidity to keep the effective federal funds rate in the FOMC’s target range. While the Fed’s recent actions have helped calm money markets, uncertainty remains as to whether money markets (and short-term interest rates) will remain calm over the forecast horizon.
Aimed at stimulating the U.S. economy, the Fed amassed massive long-term securities holdings between late 2008 and late 2014 in three rounds of quantitative easing. Over the next three years, the Fed maintained the massive securities holdings it has amassed by reinvesting all principal payments from its securities. Then, between October 2017 and July 2019, the Fed undertook a partial unwinding of the massive long-term securities holdings. In March 2019, the FOMC slowed the pace of its reduction of securities’ holdings. Effective August 1, 2019, the FOMC halted altogether reducing its long-term security holdings altogether. To this end, the FOMC directed that all principal payments from its securities be reinvested. (FOMC Minutes, July 30-31, 2019).
Largely as a result of Fed’s quantitative easing programs, Federal Reserve assets rose from $0.9 trillion in August 2007 to $4.5 trillion in January 2015. Most recently, the Fed’s assets totaled $4.1 trillion.
Michigan Department of Treasury - 13 -Economic and Revenue Outlook January 10, 2020

Fiscal Policy
The stimulus provided by the Tax Cuts and Jobs Act of 2017 and the Bipartisan Budget Act of 2018 has faded.
In late December 2017, the House and Senate passed and the President signed the Tax Cuts and Jobs Act of 2017 (TCJA). The Congressional Budget Office and Joint Committee on Taxation estimated that the TCJA would reduce federal government revenues by $1.7 trillion and reduce federal outlays by $200 billion over the next ten years – increasing the deficit by $1.5 trillion over the next ten years. In March 2018, Congress passed and the President signed the Bipartisan Budget Act of 2018. The Act increased spending caps for fiscal years 2018 and 2019 by nearly a combined $300 billion above spending caps – a dramatic spending increase especially with a U.S. economy near full employment.
The federal tax cut and spending increase legislation played a substantial role in boosting the U.S. economy through early 2019. However, the legislation’s impact has since lessened substantially. The legislation’s impact will continue to fade over the forecast horizon.
In mid-December 2019, avoiding a partial government shutdown, the House and Senate passed and the President signed two spending packages totaling nearly $1.4 trillion in funding. With the packages (comprising a dozen bills), the federal government will spend nearly $50 billion more in discretionary spending in FY 2020 than in FY 2019. The packages fund the federal government through September 30, 2020. The legislation’s enactment avoided the need to pass another temporary funding fix for FY 2020 and enacted spending increases negotiated over the summer.
Inflation
In all but one year, the overall personal consumption expenditures (PCE) price index inflation remained below the Federal Reserve’s target 2.0 percent level between 2009 and 2017. In 2018, the overall PCE rose 2.1 percent. Further, annual core PCE inflation (excluding food and energy) remained below 2.0 percent every year between 2009 and 2018.
U.S. consumer price index inflation remains moderate. From 2013 to 2016, CPI inflation remained below 2.0 percent. CPI inflation rose to 2.1 percent in 2017 and 2.4 percent in 2018.
Between 2009 and 2017, the personal consumption expenditures (PCE) price index, which the Federal Reserve emphasizes in evaluating whether the U.S. economy is meeting the Fed’s 2.0 percent inflation target, grew less than 2.0 percent each year except 2011. In 2018, the PCE price index grew 2.1 percent. Core PCE price index inflation, which excludes the direct impact of volatile food and energy prices, stayed below 2.0 percent each year between 2009 and 2018. In 2018, core PCE price inflation was 1.9 percent.
On average through November, the overall PCE price index was up 1.4 percent in 2019 while the core PCE price index was up 1.6 percent. Most recently in November 2019, the PCE price index was up 1.5 percent from a year ago and the core PCE price index was up 1.6 percent from last
Michigan Department of Treasury - 14 -Economic and Revenue Outlook January 10, 2020

October. In every month between May 2012 and February 2018, inclusive, the core PCE was up less than 2.0 percent from a year ago. Further, while the core PCE was up by 2.0 percent or more in all but one month between March 2018 and December 2018, the greatest y-o-y increase was 2.1 percent. Further, in every month between January 2019 and November 2019, the core PCE was up less than 2.0 percent. (Bureau of Economic Analysis).
The U.S. Consumer Price Index (CPI) has risen each year beginning in 2010. In recent years, inflation has remained moderate. In each year between 2013 and 2016, overall CPI inflation remained below 2.0 percent. Overall CPI inflation did accelerate to 2.1 percent in 2017 and to 2.4 percent in 2018. However, on average through November, 2019 overall CPI inflation slowed to 1.8 percent. Core CPI inflation accelerated from 1.8 percent in 2017 to 2.1 percent in 2018. Through the first eleven months of 2019, the average overall core CPI is up 2.2 percent from a year earlier. In 2019, through November, monthly y-o-y CPI inflation ranged between 1.5 percent and 2.1 percent while core CPI inflation ranged between 2.0 percent and 2.4 percent.
Oil prices rose substantially from February 2016 to October 2018. Still more, through October, the average 2018 price of oil was up 35.6 percent from a year ago. However, the price of oil per barrel fell sharply in November 2018 and December 2018 – falling from $70.75 to $49.52. In each of the first four months of 2019, oil prices rose – rising to $63.86 per barrel in April. Oil prices fell to $53.96 per barrel in October and then rose to $57.03 per barrel – essentially unchanged from November 2018. Year-to-date through November 2019, oil prices have averaged $56.69 – down 14.5 percent from the first eleven months of 2018.
Oil Prices Down Modestly in Recent Months Down Sharply from 2014
06/2008 $133.88
02/2009 $39.09
06/2014 $105.79
02/2016 $30.32
10/2018 $70.75
11/2019 $57.03
$0
$20
$40
$60
$80
$100
$120
$140
$160
1990 1995 2000 2005 2010 2015
Source: Federal Reserve Bank of St. Louis. Price per Barrel, West Texas Intermediate
Michigan Department of Treasury - 15 -Economic and Revenue Outlook January 10, 2020

Major Economic Indices
While the NMI signaled growth in the nonmanufacturing sector for the 119th straight month in December 2019, the PMI signaled a contracting manufacturing sector for the fifth straight month.
Compared to a year ago, December 2019 consumer sentiment was up slightly and remained at a historically high level. CEO confidence in 2019Q3 was down sharply from a year ago and remains well into negative territory (below 50).
Since the May 2019 Consensus Conference, the stock market has risen substantially (+12.2 percent net increase at the end of 2019).
In December 2019, the ISM manufacturing index, known as the PMI (Purchasing Managers’ Index), marked the fifth straight month of a contracting manufacturing sector (reading below 50). Since April 2019 (the most recent reading available at the May 2019 Consensus Conference), the PMI has fallen in all but one month with the PMI dropping a net 5.6 points. At 47.2, the December 2019 PMI represents the lowest PMI reading since June 2009. From a year ago, the December 2019 PMI is down 7.1 points.
The December 2019 ISM non-manufacturing index (NMI) signaled the 119th straight month of an expanding service sector. Since the May 2019 Consensus Conference, the NMI has fluctuated. The NMI increased from 55.5 to 56.9 in May 2019 but then fell in both June 2019 and July 2019 -- dropping to 53.7 in July. The NMI rose to 56.4 in August but then fell to 52.6 in September. The index then rose to 54.7 in October before giving back some of October’s gains in November, dropping to 53.9. The NMI then rose in December to 55.0. On net, the December NMI is down slightly (-0.5) since the May 2019 Conference.
In May 2019, the first month for which a final value was available following the May 2019 Consensus Conference, the University of Michigan index of consumer sentiment rose from 97.2 to 100.0 before dropping to 98.2 in June. After rising slightly in July, the index dropped substantially in August – falling to 89.8 (the index’s lowest reading in almost three years). The index rose in each of the next four months with the index rising to 99.3 in December. The December 2019 sentiment index reading was up 2.1 points since the May 2019 Consensus Conference and was up 1.0 point compared to a year ago.
Michigan Department of Treasury - 16 -Economic and Revenue Outlook January 10, 2020

Consumer Sentiment up Modestly Still Historically High
Jan-2000 112.0
Aug-2011 55.8
Jan-2015 98.1
Mar-2018 101.4
Dec-2019 99.3
40
50
60
70
80
90
100
110
120
1999 2001 2003 2005 2007 2009 2011 2013 2015 2017 2019
Source: University of Michigan Survey of Consumers.
Between 2016Q4 and 2018Q3, the Conference Board Measure of CEO Confidence Index had remained in positive territory (above 50). However, in each quarter between 2018Q2 and 2018Q4, CEO Confidence fell from the previous quarter and dropped 23 points over the three quarters. As a result, CEO Confidence dropped into negative territory (below 50) to 42 in 2018Q4. CEO Confidence rose very slightly in 2009Q1 to 43, where it remained in 2019Q2. However, the index fell sharply in 2019Q3 –dropping to 34, the lowest CEO Confidence Index reading in over 10 years.
The equities markets have improved since the May 2019 Consensus Conference as the Dow Jones Industrial Index and S&P 500 Index are currently up from their mid-May 2019 levels. Another measure, the Wilshire 5000 Index, is a weighted index of all actively traded U.S. stocks and represents the broadest index of the total value of the U.S. stock market. Between mid-May 2019 and early June 2019, the Wilshire 5000 trended downward before heading upward through late July. The Index fell significantly in early August 2019 and then moved sideways through early October. However, since early October, the Index has risen steadily. As a result, Wilshire 500 Index rose to a new all-time high in late-December 2019. While the Index fell slightly over the following few days, the Wilshire 5000 finished 2019 up 12.2 percent since the May 17, 2019 Consensus Conference and up 28.5 percent from the end of 2018.
The Economic Cycle Research Institute (ECRI) weekly leading index (WLI) growth rate has fluctuated since the May 2019 Consensus Conference with the growth rate ranging from -2.9 percent and +2.4 percent. Most recently, in each week in November, the ECRI weekly leading index growth rate improved with the growth rate rising in late November to 2.4 percent – the
Michigan Department of Treasury - 17 -Economic and Revenue Outlook January 10, 2020

fastest growth rate since mid-June 2018. In early December 2019, the growth rate slowed slightly to 2.2 percent before ending 2019 with a 2.3 percent growth rate.
Industrial production growth has worsened substantially over the past year. In September 2018, y-o-y industrial production growth accelerated to 5.4 percent (the fastest industrial production growth rate in nearly eight years). However, y-o-y growth slowed markedly over the next seven months with y-o-y growth slowing to 0.7 percent in April 2019. While accelerating to 1.7 percent in May 2019, industrial production y-o-y growth then slowed to 0.4 percent in July and August. The UAW-GM strike did substantially curtail vehicle sector production and hence overall industrial production in both September and October. However, most recently, even with a substantial rebound in vehicle production in November 2019, overall industrial production was still down 0.8 percent from last November.
Following 23 monthly declines over the 24-month period between March 2015 and February 2017, the capacity utilization rate rose from the prior year in each of the following 25 months from March 2017 to March 2019. However, y-o-y capacity utilization rate changes slowed in 13 of the 14 months between September 2018 and October 2019. Over the 14 months, capacity utilization rate y-o-y changes dropped from a 3.1-point increase to a 2.7-point decline. Still more, in each month beginning in April 2019, the capacity utilization rate has fallen from a year ago. The UAW-GM strike did weigh on the capacity utilization rate in September and October. However, even after the strike, in November 2019, the capacity utilization rate was down 2.3 points from last November.
In 2018, overall retail and food services sales rose 4.8 percent, marking the third straight year of accelerating retail sales and the fastest sales growth since 2011. However, year-to-date through November, 2019 retail and food services sales were up only 3.4 percent. Excluding gasoline stations, average 2018 retail and food services sales were up 4.1 percent, slightly slower than the 4.3 percent growth in 2017. Year-to-date through November, 2019 retail and food services sales excluding gasoline stations rose 3.7 percent from 2018.
Vehicle Sales and Production
In 2019, light vehicle sales fell from 17.2 million units to 17.0 million units. In 2019, light truck sales share of light vehicle sales rose 2.9 percentage points to 72.1 percent.
In 2015, U.S. light vehicle sales rose to a then record high of 17.40 million units, slightly exceeding the previous record of 17.35 million units set in 2000. In 2016, light vehicle sales rose slightly by 0.4 percent to a new record high of 17.46 million units. Annual light vehicle sales fell in 2017, but, at 17.14 million units, sales remained strong. After rising to 17.21 million units in 2018, light vehicle sales fell to 16.97 million units in 2019.
Michigan Department of Treasury - 18 -Economic and Revenue Outlook January 10, 2020

Light Vehicle Sales At Historically High Levels (millions of units)
13.2
10.4 11.6
12.7 14.4
15.5 16.5
17.4 17.5 17.1 17.2 17.0
2008 2009 2010 2011 2012 2013 2014 2015 2016 2017 2018 2019
Autos Lt Trks
Source: U.S. Bureau of Economic Analysis.
Light truck sales share of the light vehicle sales market has continued to grow. In 2019, light truck sales share of light vehicle sales rose 2.9 percentage points to yet another new record high of 72.1 percent. December 2019 marked the 45th straight month the light truck sales share exceeded 60.0 percent and the 27th straight month in which the light truck share exceeded 65.0 percent. While bringing vehicle makers higher profitability per unit, the record high light truck sales share exposes makers to greater downward risks from economic slowdowns.
U.S. vehicle production increased each year from 2010 to 2016. By 2016, production was up 113.8 percent from 2009. In 2016, national vehicle production was up to 12.3 million units – its highest production level since 2000. However, U.S. vehicle production fell 8.3 percent in 2017 and dropped 2.0 percent in 2018. Through the first 11 months of 2019, year-to-date national vehicle production was down 3.4 percent from last year.
On December 11, 2019, with the ratification of its contract with FCA, the UAW completed its contract negotiations with the Big Three for next four years. The contracts’ ratifications removed a substantial risk for the U.S. and Michigan economic forecasts.
Michigan Department of Treasury - 19 -Economic and Revenue Outlook January 10, 2020

Current Michigan Economic Conditions
Vehicle Production
In 2017 and 2018, both Michigan’s vehicle production and Michigan’s share of U.S. vehicle production fell.
Year-to-date through November, Michigan 2019 vehicle production rose 3.3 percent and Michigan’s share of national production increased by 1.2 percentage points.
Michigan vehicle production rose substantially each year between 2010 and 2013 with Michigan production rising from 1.15 million units in 2009 to 2.47 million units in 2013. The number of vehicles produced in Michigan fell 12.1 percent in 2017 and dropped 12.7 percent in 2018. However, in 2019 through November, Michigan vehicle production was up 3.3 percent compared with the first 11 months of 2018.
In 2013, Michigan’s share of U.S. vehicle production rose to 22.3 percent. However, in 2014, the State’s share of U.S. vehicle production fell 2.4 percentage points to 19.9 percent. In 2015, Michigan’s share of national vehicle production fell an additional 0.5 of a percentage point to 19.4 percent, where it remained in 2016. Michigan’s share of national vehicle production fell to 18.6 percent in 2017 and dropped to 16.6 percent in 2018. In 2019 through November, Michigan’s share of national vehicle production (17.8 percent) was up 1.2 percentage points from the first 11 months of 2018.
37.7%
2019ytd Michigan Vehicle Production 34.7%
22.0%
17.4%
9.5%
-4.7%
-1.3%
2.6% 3.3%
11.5%
20.5%
6.7% 6.8%
1.2% 2.5%
-2.0% -3.4%
Up Slightly through November
Michigan U.S.
-8.3%
-12.1% -12.7%
2010 2011 2012 2013 2014 2015 2016 2017 2018 2019ytd
Automotive News and Michigan Department of Treasury.
Michigan Department of Treasury - 20 -Economic and Revenue Outlook January 10, 2020

Employment
In 2018, Michigan wage and salary employment increased for the eighth straight year. Year-to-date through November, average Michigan employment in 2019 was up 0.6 percent.
In 2018, Michigan wage and salary employment rose for an eighth straight year with 1.1 percent growth. Through November, average 2019 Michigan wage and salary employment was up 0.6 percent compared with the first 11 months of 2018. The 0.6 percent year-to-date growth rate would rank as Michigan’s weakest annual employment growth since 2010 when Michigan’s employment fell 0.2 percent.
Rising by a total of 555,000 jobs between 2010 and 2018, Michigan wage and salary employment increased 14.4 percent, the 16th fastest percent growth among U.S. states. Michigan employment rose in six straight months between October 2018 and March 2019. In three of the following four months, Michigan employment fell and, on net, lost 4,500 jobs. However, Michigan employment gained 8,200 jobs in August. As a result, in August 2019, Michigan employment rose to 4,449,500 jobs, the State’s highest monthly employment level since December 2002.
Michigan employment fell by 3,200 jobs in September. In October, largely as a result of the UAW-GM strike, Michigan employment dropped sharply -- falling by 24,000 jobs. For the most part, the large October employment decline was the result of the UAW-GM strike. (Striking workers are not counted as employed in the payroll survey. In addition, October’s employment drop was partially the result of non-striking worker layoffs caused by the strike.) With the end of the strike, Michigan employment rebounded in November with a 24,800 jobs increase. Compared to a year earlier, November 2019 Michigan employment was up by 18,200 jobs (0.4 percent). The 0.4 percent change ranked 40th among U.S. states.
Michigan’s overall wage and salary employment has increased 15.9 percent since the end of the Great Recession (June 2009). The 15.9 percent growth represents the 16th strongest growth rate among all U.S. states.
Michigan Department of Treasury - 21 -Economic and Revenue Outlook January 10, 2020

Michigan Manufacturing Employment Change (thousands of jobs)
-44.9
-107.8
11.1
35.6 28.7
18.2 26.0
17.0 14.0 10.4 13.7
2008 2009 2010 2011 2012 2013 2014 2015 2016 2017 2018
Source: Bureau of Labor Statistics, U.S. Department of Labor.
Over the past eight years, manufacturing employment in Michigan increased by 163,600 total jobs. Manufacturing employment accounted for 29.5 percent of the overall State employment increase over the past eight years, even while comprising only 12.1 percent of the overall level of base year 2010 Michigan wage and salary employment. In 2018, manufacturing employment accounted for 27.7 percent of the overall calendar year State employment increase. Year-to-date through November 2019, manufacturing employment accounted for only 4.8 percent of Michigan’s overall employment increase.
Unemployment Rate
Michigan’s unemployment rate fell between 2010 and 2018, inclusive. In 2018, the unemployment rate dropped to 4.1 percent. Michigan’s 2019 unemployment rate has averaged 4.1 percent through November.
The gap between the Michigan unemployment rate and the U.S. unemployment stood at 0.5 of a percentage point in November 2019.
In 2009, Michigan’s unemployment rate rose to 13.7 percent which was the State’s highest rate since 1983 when the rate stood at 14.4 percent. However, the State’s unemployment rate has decreased each year since. Over the past nine years, Michigan’s unemployment rate dropped a combined 9.6 percentage points. In 2018, the Michigan unemployment rate fell 0.5 of a percentage point to 4.1 percent, the State’s lowest annual rate since 2000. Through November, Michigan’s unemployment rate averaged 4.1—matching Michigan’s average unemployment rate through the first 11 months of 2018.
Michigan Department of Treasury - 22 -Economic and Revenue Outlook January 10, 2020

Since the Great Recession Michigan’s Unemployment Rate Has Dropped Sharply
Oct-09 10.0%
Nov-19 3.5%
Jun-09 14.6%
Nov-19 4.0%
0.0%
2.0%
4.0%
6.0%
8.0%
10.0%
12.0%
14.0%
16.0%
Michigan
U.S.
Source: Michigan Bureau of Labor Market Information and the U.S. Bureau of Labor Statistics.
During the Great Recession (December 2007-June 2009), the gap between Michigan’s unemployment rate and the U.S. unemployment rate rose to 5.1 percentage points. Within a year after the Great Recession, the gap shrank to 3.2 percentage points and within two years, the gap fell to 1.5 percentage points. The gap trended downward through early 2012, falling to 0.8 of a percentage point. The gap then trended upward through late 2013, rising to 1.6 percentage points in December 2013. The gap fell steadily through mid-2015. Between May 2015 and October 2016, the gap ranged narrowly between +0.2 of a percentage point and -0.2 of a percentage point. Since October 2016, the unemployment rate gap has ranged between 0.0 and +0.7 of a percentage point. Since April 2019, the range has narrowed to 0.5 to 0.7 of a percentage point.
Compared to the number of Michigan unemployed at the end of the Great Recession in June 2009, November 2019 unemployment was down by 528,000 persons. However, compared to a year ago, November 2019 unemployment was little changed – increasing by 1,000 persons.
Michigan’s labor force fell every year between 2006 and 2012. Over the seven years, the State’s annual labor force dropped a combined 410,000 persons. However, in five of the most recent six years, the State’s annual labor force increased. On net, calendar year Michigan labor force rose 229,400 persons, or 4.9 percent over the six years. Michigan’s average labor force between January 2019-November 2019 was up 48,300 persons compared with the State’s average labor force through the first 11 months of 2018.
Michigan Department of Treasury - 23 -Economic and Revenue Outlook January 10, 2020

Housing Market
After rising 15.8 percent in 2017, Michigan housing authorizations fell 17.1 percent in 2018. Through November, Michigan housing authorizations were up 3.9 percent in 2019 compared with the first 11 months of 2018.
The share of mortgage properties with negative equity in Michigan is higher than the national average.
In 2018, Michigan housing unit authorizations decreased 17.1 percent while authorizations increased 3.7 percent nationally. Through November, Michigan housing authorizations were up 3.9 percent in 2019 from the first 11 months of 2018, compared to a 3.2 percent increase nationally.
Michigan Housing Unit Authorizations Percent Change
34.8% 31.8%
2.9%
25.2%
0.5%
15.1% 12.0%
15.8%
3.9%
-17.1%
-39.1%-38.6%-36.9%
Source: U.S. Census Bureau.
The share of mortgage properties with negative equity in Michigan is higher than the national average. In the third quarter of 2019, nationwide, 3.7 percent of residential properties with mortgages were underwater. In Michigan, 4.5 percent of such properties were underwater – ranking Michigan 14th highest among U.S. states.
Michigan Department of Treasury - 24 -Economic and Revenue Outlook January 10, 2020

Personal Income
Michigan total personal income has continued to grow but grew more slowly than national total personal income in each of the past two years.
Since the Great Recession, Michigan per capita personal income has grown faster than the national average.
In 2018, Michigan total personal income grew 4.9 percent from 2017 Michigan total personal income, compared with 5.6 percent growth nationally. Growth in Michigan’s personal income in 2018 ranked 38th among the 50 states. In 2017, Michigan personal income growth ranked 34th . In contrast Michigan’s personal income growth had ranked 11th in 2015 and 16th in 2016.
Michigan’s 2018 annual personal income growth (4.9 percent) was up from 3.4 percent in 2017 and 3.3 percent in 2016. Through the first three quarters of 2019, Michigan’s personal income was up 3.5 percent from the first three quarters of 2018 – ranking 42nd among the 50 states. U.S. personal income in the first three quarters of 2019 was up 4.0 percent from 2018Q1-2018Q3.
Over the past nine years, Michigan annual personal income has grown each year. As a result, compared with 2009 personal income, 2018 Michigan personal income is up 43.6 percent, ranking 22nd among U.S. states. Nationwide, personal income grew 47.8 percent between 2009 and 2018.
Of Michigan’s 4.9 percent growth in total personal income in 2018, net earnings, which accounted for 2.4 percentage points of the overall percentage point increase, drove most of the growth rate. Dividends, interest, and rent accounted for 1.6 percentage points of overall growth, and transfer receipts comprised 0.9 of a percentage point of overall growth.
In 2018, total earnings grew $12.7 billion in Michigan for all industries. This was led by the manufacturing sector increase of $2.6 billion, which accounted for slightly more than one-fifth of the overall increase. Durable manufacturing alone accounted for $2.0 billion of the manufacturing increase. The health care and social assistance sector accounted for the second largest share of the total earnings increase ($1.5 billion), followed by combined federal, state and local governments ($1.4 billion).
In 2018, Michigan’s annual per capita income ranked 32nd among U.S. states and matched its 2017 ranking. Michigan’s 2018 annual per capita income of $48,423 equaled 88.9 percent of the U.S. annual per capita personal income average of $54,446. Between 2017 and 2018, Michigan’s annual per capita income rose 4.7 percent (ranking 26th among the 50 states). Nationally, annual per capita income rose 4.9 percent in 2018. Between 2009 (the year in which the Great Recession ended) and 2018, Michigan’s per capita income increased 42.3 percent – ranking 7th among U.S. states and exceeding the national increase of 38.6 percent.
Through the first three quarters of CY 2019, Michigan’s per capita income rose 3.5 percent – ranking 42nd among the 50 states. In comparison, U.S. per capita income was up 4.0 percent between 2018Q1-2018Q3 and 2019Q1-2019Q3.
Michigan Department of Treasury - 25 -Economic and Revenue Outlook January 10, 2020

State Real Gross Domestic Product
In 2018, Michigan real (inflation adjusted) gross domestic product (GDP) rose 2.5 percent – up from 2.2 percent growth in 2016 and 1.5 percent growth in 2017. Michigan’s 2.5 percent growth rate in 2018 matched 2015 with Michigan’s highest real GDP growth since 2011, when Michigan’s real GDP rose 2.6 percent. Michigan real GDP has risen in each of the past nine years.
Michigan real GDP growth in 2018 ranked 22nd among all U.S. states and first among the five Great Lakes states. However, year-to-date through the first two quarters in 2019, average Michigan real GDP is up only 0.6 percent from the first two quarters in 2018–-the second lowest growth rate among all states and well below the median state real GDP growth of 2.3 percent.
Michigan Department of Treasury - 26 -Economic and Revenue Outlook January 10, 2020

SECTION III
Administration Economic Forecast
Michigan Department of Treasury - 27 -Economic and Revenue Outlook January 10, 2020

Administration Economic Forecast Summary%
Ch
an
ge
Yea
r-to
-Yea
r
Table 1 (next page) provides a one-page summary table of the Administration forecast of the U.S. and Michigan economies.
2020, 2021 and 2022 U.S. Economic Outlook
Summary
Real (inflation adjusted) GDP rose an estimated 2.3 percent in 2019 -- marking the 10th straight year of annual growth. Real GDP is forecast to increase 1.6 percent in 2020, 1.6 percent in 2021 and 1.5 percent in 2022.
Real GDP Forecast to Rise for 13th Straight Year in 2022
2.9% 2.9% 2.6% 2.5%
-0.1%
1.6% 2.2%
1.8% 1.6%
2.4% 2.3%
1.6% 1.6% 1.5%
-2.5%
2008 2010 2012 2014 2016 2018 2020 2022
January 2020 Forecast
Source: Bureau of Economic Analysis, U.S. Department of Commerce, and Administration Forecast, January 2020.
In 2019, light vehicle sales fell to 17.0 million units. Light vehicle sales are forecast to decline to 16.8 million units in 2020, 16.5 million units in 2021 and 16.4 million units in 2022.
Michigan Department of Treasury - 28 -Economic and Revenue Outlook January 10, 2020

Table 1
Administration Economic Forecast January 2020
Percent Percent Percent Percent
Calendar Calendar Change Calendar Change Calendar Change Calendar Change
2018 2019 from Prior 2020 from Prior 2021 from Prior 2022 from Prior
Actual Actual Year Forecast Year Forecast Year Forecast Year
United States
Real Gross Domestic Product $18,638 $19,067 2.3% $19,372 1.6% $19,682 1.6% $19,977 1.5%
(Billions of Chained 2012 Dollars)
Implicit Price Deflator GDP 110.4 112.0 1.7% 113.9 1.7% 116.2 2.0% 118.6 2.1%
(2012 = 100)
Consumer Price Index 251.107 255.480 1.7% 260.137 1.8% 265.067 1.9% 270.166 1.9%
(1982-84 = 100)
Consumer Price Index - Fiscal Year 249.749 254.376 1.9% 258.945 1.8% 263.821 1.9% 268.878 1.9%
(1982-84 = 100)
Personal Consumption Deflator 108.1 110.0 1.4% 111.9 1.7% 113.8 1.7% 115.8 1.8%
(2012 = 100)
3-month Treasury Bills 1.9 2.1 1.6 1.6 1.7
Interest Rate (percent)
Unemployment Rate - Civilian 3.9 3.7 3.5 3.5 3.6
(percent)
Wage and Salary Employment 149.074 151.459 1.6% 153.277 1.2% 154.656 0.9% 156.048 0.9%
(millions)
Housing Starts 1.250 1.254 0.3% 1.261 0.6% 1.264 0.2% 1.256 -0.7%
(millions of starts)
Light Vehicle Sales 17.2 17.0 -1.4% 16.8 -1.0% 16.5 -1.8% 16.4 -0.6%
(millions of units)
Passenger Car Sales 5.3 4.7 -10.8% 4.2 -11.2% 3.7 -11.9% 3.3 -10.8%
(millions of units)
Light Truck Sales 11.9 12.2 2.8% 12.6 2.9% 12.8 1.6% 13.1 2.3%
(millions of units)
Big 3 Share of Light Vehicles 41.7 41.0 41.0 41.3 41.4
(percent)
Michigan
Wage and Salary Employment 4,419 4,441 0.5% 4,467 0.6% 4,490 0.5% 4,508 0.4%
(thousands)
Unemployment Rate 4.1 4.1 3.9 3.8 3.7
(percent)
Personal Income $484,030 $503,875 4.1% $522,518 3.7% $540,807 3.5% $559,194 3.4%
(millions of dollars)
Real Personal Income $208,409 $214,532 2.9% $218,475 1.8% $222,314 1.8% $225,759 1.5%
(millions of 1982-84 dollars)
Wages and Salaries $240,365 $248,341 3.3% $258,448 4.1% $268,572 3.9% $278,485 3.7%
(millions of dollars)
Detroit Consumer Price Index 232.250 234.872 1.1% 239.166 1.8% 243.262 1.7% 247.695 1.8%
(1982-84 = 100)
Detroit CPI - Fiscal Year 231.441 233.840 1.0% 238.175 1.9% 242.213 1.7% 246.554 1.8%
(1982-84 = 100)
Michigan Department of Treasury Economic and Revenue Outlook
- 29 -
January 10, 2020

Vehicle Sales Fall Modestly Over Forecast M
illi
on
s o
f V
ehic
les
17.4 17.5 17.1 17.2 17.0 16.8 16.5 16.5 16.4 15.5
14.4 13.2 12.7 13.0 12.6 12.8 12.3 11.6 11.9
11.1 10.4 10.6 9.9
8.7
7.9 7.6 7.7 7.5 7.27.2 6.9 6.8 6.6 6.4 5.9 6.1 6.1 5.6 5.4 5.3 5.0 4.7 4.2 3.7 3.3
2008 2010 2012 2014 2016 2018 2020 2022
Cars Light Trucks Light Vehicles January 2020 Forecast
Source: Bureau of Economic Analysis, U.S. Department of Commerce, and Administration Forecast, January 2020.
The U.S. unemployment rate has fallen in each of the past nine years with the unemployment rate dropping from a near record high 9.6 percent in 2010 to an estimated 3.7 percent in 2019. In 2020, the U.S. rate is forecast to fall to 3.5 percent and remain at 3.5 percent in 2021. In 2022, the national unemployment rate is expected to rise to 3.6 percent.
U.S. wage and salary employment increased 1.7 percent in 2018 and rose an estimated 1.6 percent in 2019. U.S. employment growth is forecast to slow to 1.2 percent in 2020 and 0.9 percent in 2021. In 2022, U.S. employment growth is forecast to remain steady at 0.9 percent. The U.S. employment level rose to a new record annual high each year from 2014 to 2019. With forecasted increases, calendar year 2022 national employment is forecast to rise to a new all-time record high that is 13.1 percent above the pre-2014 peak employment level.
U.S. consumer price inflation accelerated to 2.1 percent in 2017 and to 2.4 percent in 2018. Inflation slowed significantly in 2019 to an estimated 1.7 percent. Inflation is forecast to accelerate slightly to 1.8 percent in 2020 and 1.9 percent in 2021. In 2022, inflation is expected to remain at 1.9 percent. The personal consumption price deflator inflation rate is projected to accelerate from an estimated 1.4 percent in 2019 to 1.7 percent in 2020 and then remain at 1.7 percent in 2021. In 2022, the consumption price deflator is forecast to rise 1.8 percent.
In 2016, the short-term Treasury bill rate (calendar year average) rose to 0.3 percent. As a result of increases in the federal funds rate, the short-term Treasury bill rate increased to 0.9 percent in 2017, 1.9 percent in 2018 and 2.1 percent (estimated) in 2019. In 2020, the average Treasury bill rate is forecast to fall to 1.6 percent, where it is expected to remain in 2021. In 2022, the Treasury bill rate is forecast to rise slightly to 1.7 percent.
Michigan Department of Treasury - 30 -Economic and Revenue Outlook January 10, 2020

The 30-year fixed mortgage rate fell to 3.65 percent in 2016 and then rose to 4.0 percent in 2017 and 4.5 percent in 2018. In 2019, the mortgage rate fell to an estimated 3.9 percent. After falling to 3.7 percent in 2020, the mortgage rate is expected to rise to 3.8 percent in 2021 and 3.9 percent in 2022.
Housing starts are expected to change little over the forecast horizon. Starts are forecast to rise 0.6 percent in 2020, increase 0.2 percent in 2021 and then fall 0.7 percent in 2022. Consequently housing starts are expected to remain at historically low levels.
Assumptions
After rising an estimated 3.4 percent in 2019, real (inflation-adjusted) federal government expenditures are forecast to rise 2.0 percent in calendar year 2020 and then slow substantially to 0.3 percent in 2021 and to 0.1 percent in 2022.
Real state and local government expenditures are estimated to have increased 1.7 percent in 2019. Real state and local government expenditures are expected to rise 2.0 percent in 2020, increase 1.2 percent in 2021 and rise 0.9 percent in 2022.
The Fed raised the federal funds rate by 25 basis points four times in 2018. In 2019, the Fed lowered the federal funds rate by 25 basis points three times. Most recently, at its December 2019 meeting, the FOMC voted to keep the federal funds rate target range unchanged at 1.50-1.75 basis points through late 2022. The federal funds rate range is expected to remain unchanged through late 2022. The range is then forecast to rise 25 basis points late in 2022Q3.
The average savings rate averaged an estimated 8.1 percent in 2019. The average rate is expected to remain at 8.1 percent in 2020, rise to 8.5 percent in 2021 and increase to 8.6 percent in 2022.
Economic growth among Germany, United Kingdom, Japan, Canada and Mexico slowed considerably from 3.1 percent growth in 2017 to 1.8 percent growth in 2018. The growth rate is estimated to have fallen to 1.0 percent in 2019. Economic growth among the five nations is expected to remain at 1.0 percent in 2020 and then to accelerate to 1.4 percent in 2021 and to 1.5 percent in 2022. After growing 6.6 percent in 2018 and an estimated 6.1 percent in 2019, China’s economy is expected to grow 5.9 percent in each of the forecast’s three years.
Michigan Department of Treasury - 31 -Economic and Revenue Outlook January 10, 2020

2020, 2021 and 2022 Michigan Economic Outlook
Michigan wage and salary employment reported its ninth straight annual employment increase in 2019. In 2019, Michigan employment increased an estimated 0.5 percent – down from 1.1 percent growth in 2018. Michigan employment is forecast to rise 0.6 percent in 2020, 0.5 percent in 2021 and 0.4 percent in 2022. At 4.51 million jobs, the forecasted Michigan wage and salary employment level in 2022 would represent the State’s highest employment level since 2001. However, forecasted 2022 Michigan employment would remain 168,000 jobs (3.6 percent) below the State’s peak annual employment set in 2000 (4.7 million jobs).
After rising 33,000 jobs in 2018, Michigan private non-manufacturing employment rose an estimated 17,300 jobs in 2019. Private non-manufacturing employment is forecast to gain 19,800 jobs in 2020, 21,100 jobs in 2021 and 15,900 jobs in 2022.
In 2018, Michigan manufacturing employment rose 2.2 percent. The State’s manufacturing employment rose an estimated 0.3 percent in 2019. Michigan manufacturing employment is forecast to rise 0.3 percent in 2020, increase 0.1 percent in 2021 and rise 0.2 percent in 2022.
Michigan Wage and Salary Employment Continues to Rise
4,162
3,871 3,864 3,952 4,034 4,110 4,182 4,243 4,320 4,369 4,419 4,441 4,467 4,490 4,508
Th
ou
san
ds
of
Jo
bs
2008 2010 2012 2014 2016 2018 2020 2022
January 2020 Forecast
Source: Michigan Department of Technology, Management, & Budget, U.S. Bureau of Labor Statistics and January 2020 Administration Forecast.
After rising 2.6 percent in 2018, transportation equipment employment growth slowed to an estimated 0.5 percent in 2019. Transportation equipment employment is forecast to rise 1.4 percent in 2020 and then decline 0.1 percent both in 2021 and in 2022. Forecasted 2022 transportation equipment employment of 196,500 jobs would be down 41.4 percent from the sector’s CY 2000 peak employment of 335,500 jobs.
Michigan Department of Treasury - 32 -Economic and Revenue Outlook January 10, 2020
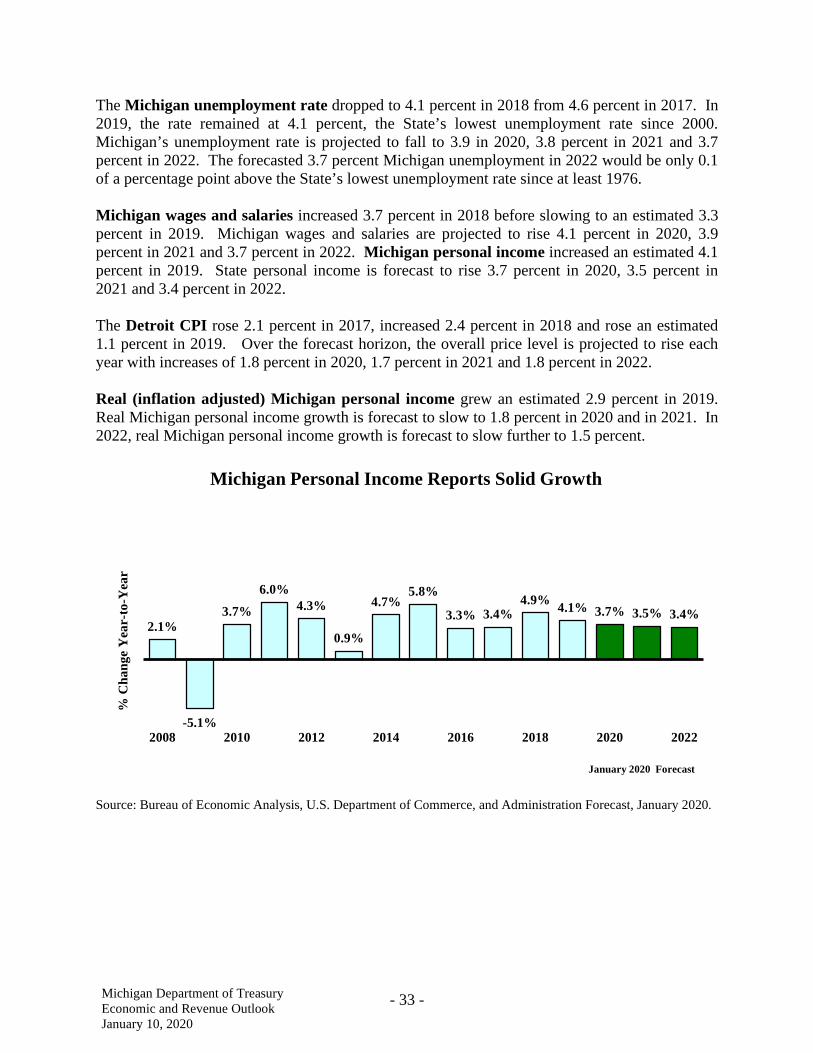
The Michigan unemployment rate dropped to 4.1 percent in 2018 from 4.6 percent in 2017. In 2019, the rate remained at 4.1 percent, the State’s lowest unemployment rate since 2000. Michigan’s unemployment rate is projected to fall to 3.9 in 2020, 3.8 percent in 2021 and 3.7 percent in 2022. The forecasted 3.7 percent Michigan unemployment in 2022 would be only 0.1 of a percentage point above the State’s lowest unemployment rate since at least 1976.
Michigan wages and salaries increased 3.7 percent in 2018 before slowing to an estimated 3.3 percent in 2019. Michigan wages and salaries are projected to rise 4.1 percent in 2020, 3.9 percent in 2021 and 3.7 percent in 2022. Michigan personal income increased an estimated 4.1 percent in 2019. State personal income is forecast to rise 3.7 percent in 2020, 3.5 percent in 2021 and 3.4 percent in 2022.
The Detroit CPI rose 2.1 percent in 2017, increased 2.4 percent in 2018 and rose an estimated 1.1 percent in 2019. Over the forecast horizon, the overall price level is projected to rise each year with increases of 1.8 percent in 2020, 1.7 percent in 2021 and 1.8 percent in 2022.
Real (inflation adjusted) Michigan personal income grew an estimated 2.9 percent in 2019. Real Michigan personal income growth is forecast to slow to 1.8 percent in 2020 and in 2021. In 2022, real Michigan personal income growth is forecast to slow further to 1.5 percent.
Michigan Personal Income Reports Solid Growth
6.0% 5.8% 4.9%
2.1% 3.7% 4.3%
0.9%
4.7% 3.3% 3.4% 4.1% 3.7% 3.5% 3.4%
% C
ha
ng
e Y
ear-
to-Y
ear
-5.1% 2008 2010 2012 2014 2016 2018 2020 2022
January 2020 Forecast
Source: Bureau of Economic Analysis, U.S. Department of Commerce, and Administration Forecast, January 2020.
Michigan Department of Treasury - 33 -Economic and Revenue Outlook January 10, 2020

Consumer Prices Forecast to Record Moderate Growth Detroit CPI
3.3%
2.3%
-0.6%
0.8%
2.0% 1.6%
1.0%
-1.4%
1.6% 2.1%
2.4%
1.1% 1.8% 1.7% 1.8%
% C
ha
ng
e Y
ear-
to-Y
ear
2008 2010 2012 2014 2016 2018 2020 2022
January 2020 Forecast
Source: U.S. Bureau of Labor Statistics and Administration Forecast, January 2020.
Fiscal Year Economics
Michigan’s largest taxes are the individual income tax ($12.6 billion in FY 2019) and sales and use taxes ($10.0 billion). Income tax withholding is the largest component of the income tax. Withholding ($9.9 billion) is most affected by growth in wages and salaries. After rising 2.2 percent in FY 2019, Michigan wages and salaries are projected to grow 4.6 percent in FY 2020 and to increase 3.8 percent both in FY 2021 and in FY 2022.
Sales and use taxes depend primarily on Michigan disposable (after tax) income and inflation. Disposable income is estimated to have increased 4.2 percent in FY 2019. Michigan disposable income is forecast to increase 4.0 percent in FY 2020 and to rise 3.4 percent both in FY 2021 and in FY 2022. Prices, as measured by the Detroit CPI, are forecast to rise 1.8 percent in FY 2020, to increase 1.7 percent in FY 2021 and to rise 1.8 percent in FY 2022.
Michigan Department of Treasury - 34 -Economic and Revenue Outlook January 10, 2020

Michigan Wages and Salaries to Report Moderate Growth Basis for Income Tax Withholding Collections
5.0%4.3%3.5%3.8%5.2%
4.1%4.1%4.2% 4.6%3.8%3.8%
-0.3%
-6.7%
-1.2%
2.2%
% C
ha
ng
e Y
ear-
to-Y
ear
January 2020 Forecast
Source: Bureau of Economic Analysis, U.S. Department of Commerce, and Administration Forecast, January 2020.
2.5%
-1.9%
2.1%
4.8% 4.2%
1.7% 2.6%
5.6% 3.9% 3.2%
5.1% 4.2% 4.0% 3.4% 3.4%
% C
ha
ng
e Y
ear-
to-Y
ear
Michigan Disposable Income Increases Basis for Sales and Use Tax Collections
January 2020 Forecast
Source: Research Seminar in Quantitative Economics, University of Michigan, and Administration Forecast, January 2020.
Michigan Department of Treasury - 35 -Economic and Revenue Outlook January 10, 2020

Forecast Risks
As with any economic forecast, the current recovery faces risks.
Consumer and Economic Sentiment. Consumer sentiment is up slightly from a year ago, and CEO confidence is down sharply. To the extent to which expectations are disappointed, sentiment could drop sharply and, in turn, weaken the macroeconomy.
International Economies and Geopolitical Tensions. Since the May Consensus Revenue Estimating Conference, there have been some positive steps toward lessening international trade tensions and uncertainties. However, substantial tensions and uncertainties remain surrounding ongoing geopolitical, military and international trade conflicts. Escalating military conflict in the Middle East would pose a significant risk to the economy
Less than a week after the May 2019 Consensus Conference, the United States lifted steel and aluminum tariffs on Canada and Mexico. In early December 2019, House Democrats and the President reached a compromise on a revised U.S-Mexico-Canada Agreement (USMCA) trade pact. The House of Representatives passed the USMCA pact in mid-December and the Senate will likely pass the pact in early 2020. In addition, Mexico has ratified the pact and, once the U.S. has ratified the pact, Canada is expected to ratify the agreement as well. The pact’s ratification would maintain a now 26-year trade relationship among North America’s three nations without which all three countries – including the U.S. – would have likely suffered economically. The pact’s ratification would remove a substantial degree of uncertainty for governments, consumers and businesses and lessen the drag that the uncertainty has placed on the U.S., Canada and Mexico trade and economies. However, once signed and implemented, difficulties and uncertainties surround the enforcement of some of the trade pact’s provisions – particularly with respect to labor compensation requirements.
The ongoing U.S. trade war with China represents a significant risk to the U.S. economy. In December 2019, the U.S. and China reportedly reached, in principle, a “phase-one” agreement. According to U.S. negotiators, under the agreement, China agreed to increase purchases from U.S. farmers by $32 billion over the next two years. Overall, China reportedly agreed to increasing U.S. exports to China by $200 billion over the next two years. In return, the U.S. canceled its plans to impose fresh tariffs on $156 billion of Chinese imports to the U.S. (of which consumer goods constituted a substantial share). In addition, the U.S. agreed to cut the tariff rate on approximately $120 billion of Chinese imports to the U.S. from 15 percent to 7.5 percent. The agreement also reportedly covers the areas of intellectual property protection, technology transfers access to China’s financial sector and foreign exchange policy.
Increasing U.S. exports to China by the reported agreement’s amounts would represent an upside risk to the forecasted U.S. economic growth. However, realizing the reported export increases is unlikely. The agreement’s reported increase in U.S. agricultural exports to China would require a volume of U.S. agricultural exports to China (approximately $40 billion) in 2020 far exceeding any period over the past twenty years. Agriculture exports to China peaked around $25 billion in 2013 and 2014 when agricultural export prices were substantially higher than today. Overall, the reported overall $200 billion increase in U.S. exports to China would require an annual growth
Michigan Department of Treasury - 36 -Economic and Revenue Outlook January 10, 2020

rate of U.S. exports to China far exceeding any growth rate achieved by U.S. exporters since China joined the World Trade Organization (WTO) in 2001. Both China and the U.S. affirm that any purchase increases made must not violate WTO rules. Thus, China may be able to argue that WTO restrictions account for any shortfall in its meeting the stipulated U.S. export increases to China (e.g., in order to increase U.S. exports to China, China would need to reduce exports from other WTO members).
The phase one agreement also reportedly covers the areas of intellectual property protection, technology transfers access to China’s financial sector and foreign exchange policy. A proposed agreement in May 2019 required numerous changes to China’s own law and regulations so as to ensure that China did not violate the intellectual property of U.S. companies, to ensure that China did not unfairly subsidize its own domestic businesses and to ensure that U.S. businesses were not unfairly disadvantaged. However, the proposed May agreement fell apart in large part because of its requirements to change Chinese laws and regulations as guarantees against unfair trade practices. Thus, it is unlikely that the phase one agreement will include the necessary substantive provisions needed to protect U.S. businesses doing business in/with China. Consequently, even with the agreement, substantial uncertainty still surrounds U.S.-China trade relations, particularly relating to business investment and employment plans.
The United Kingdom’s departure from the European Union (Brexit) continues to pose a risk to the U.K., E.U., world and U.S. economies. In mid-December 2019, the incumbent Conservative Party won a substantial majority in the British legislature. With the Conservative Party’s clear majority, the U.K’s departure from the E.U. is nearly certain. Uncertainty remains as to whether the U.K. will depart with or without a trade agreement with the E.U. Given the Prime Minister’s current conviction that the U.K. withdraw from the E.U. by the end of January 2020, it appears more likely than not that the U.K. will depart from the E.U. without a trade agreement. In a first (but not final) step toward Brexit, the House of Commons voted, in December 2019, to back the Prime Minister’s accord for the U.K’s departure from the E.U. on January 31, 2020. However, with an 80-member majority in the legislature, the Prime Minister would likely be able to request a longer transition period for Brexit – which would decrease the likelihood the U.K.’s departure from the E.U. without a trade agreement. Without an agreement, the U.K. and the European Union would face trade barriers and tariffs in their trade with each other. Consequently, the U.K’s exit from the E.U. would weigh more heavily on the economies of the U.K, the E.U. and the nations comprising the E.U. Still more, given the U.K.’s central role in European financial markets, the Euro Zone would also be impacted financially. The drag that Brexit without a trade agreement would place on economies across Europe would slow the world economy and consequently the U.S. economy. The extent of the economic drag is uncertain.
Finally, trade tensions among the U.S. and the E.U. and the Union’s member nations have heightened since the May 2019 Consensus Conference. In addition, since the May Conference, geopolitical tensions have grown significantly – notably in the Middle East.
Light Vehicle Sales. According to the forecast, light vehicle sales fall modestly over the forecast period but remain at historically high levels in 2020, 2021 and 2022. As a result, there is likely more downside risk to the vehicle forecast than upside risk. In addition, light trucks’
Michigan Department of Treasury - 37 -Economic and Revenue Outlook January 10, 2020

historically large share of light vehicle sales likely heightens the severity of the negative impact that a weaker economy will have on light vehicle sales.
Fiscal Policy. In late December 2017, Congress passed and the President signed a tax reform legislation package that will result in a $1.5 trillion reduction in federal revenues over the next ten years, excluding effects from macroeconomic feedback. In March 2018, Congress passed and the President signed the Bipartisan Budget Act (BBA) of 2018. The Act increased federal government spending by nearly $300 billion above budget caps set in 2011. The major federal tax cut and spending legislation provided a short-term stimulus to the U.S. economy. However, as of late-2019, the simulative impact of the tax cuts and spending increases has faded substantially. Further, any minimal simulative impact now remaining will likely end early on over the forecast horizon. At the same time, the resulting larger federal deficit will increase federal government borrowing and could raise interest rates, which could lessen economic growth.
In December 2019, the U.S. Congress passed, and the President signed a bipartisan spending package for FY 2020. In addition, the President did enact a set of tax cut measures totaling $54 billion which passed the Congress with bipartisan support. However, the spending package expenditure increase is substantially smaller than the BBA and provides an agreed-upon budget only through September 2020 and Congress was not able to reach a broader deal that would have made some of the tax cuts permanent. The November 2020 elections also introduce uncertainty into the state of federal fiscal policy.
Oil Prices. Two major uncertainties surround oil price’s impact on the U.S. and Michigan economies:
The direction and magnitude of changes in oil prices. Geopolitical concerns, increased demand, or a major supply disruption could substantially raise oil prices. On the other hand, stronger/weaker foreign economies than predicted will raise/lower oil prices.
The net impact of oil price’s more immediate impact on capital investment and financial markets and oil price’s less immediate impact on consumer spending. Given that the U.S is producing record amounts of crude oil, and thus oil production is accounting for a growing share of overall U.S. business investment, a sharp drop in oil prices could depress business investment and confidence even as lower gasoline prices increase consumers’ discretionary income and sentiment.
Monetary Policy. The economic baseline forecast assumes that, until late 2022, the FOMC will leave the target federal funds interest rate range unchanged at the current range (1.50 to 1.75 percent). However, as the following excerpt from the FOMC’s December 11, 2019 statement indicates, future Fed policy is substantially data-dependent:
In determining the timing and size of future adjustments to the target range for the federal funds rate, the Committee will assess realized and expected economic conditions relative to its maximum employment objective and its symmetric 2 percent
Michigan Department of Treasury - 38 -Economic and Revenue Outlook January 10, 2020

inflation objective. This assessment will take into account a wide range of information, including measures of labor market conditions, indicators of inflation pressures and inflation expectations, and readings on financial and international developments.
Thus, uncertainty surrounds whether the FOMC will leave the target range unchanged until late 2022 and, if not, the direction, magnitude and timing of any changes to the target range. In addition, recent liquidity shortages in money markets and consequent turmoil in the repo market may pose difficulties for the Fed’s keeping the actual federal funds interest rate within the FOMC’s target range.
Uncertainty also surrounds whether the FOMC’s target federal funds rate is too high/too low to meet its twin inflation and employment objectives. Setting the target range too low heightens the risk of overheating and destabilizing financial markets and the macroeconomy in general. Conversely, setting the target range too high increases the risk of an economic contraction. Uncertainty also surrounds households’ and businesses’ reactions to future Fed actions --especially given the great length of time over which interest rates have been extremely low. Uncertainty also surrounds whether the Fed would initiate another round of quantitative easing if worsening economic conditions warrant.
Housing Market. Projected 2022 housing starts are slightly higher than 2018 starts. A weaker than forecasted housing market would result in weaker U.S. and Michigan economies. Higher than expected mortgage rates could severely curtail housing market growth. However, over the forecast horizon, starts are expected to remain around 1.3 million – significantly below average starts in the ten years prior to the housing bust (1.7 million units). A stronger than forecasted housing market would boost the overall economy.
Recession Risk. A worsening of one or a combination of risks could weigh very heavily on the U.S. financial markets and macroeconomy and push the U.S. economy into a recession.
Michigan Department of Treasury - 39 -Economic and Revenue Outlook January 10, 2020

SECTION IV
Administration Revenue Estimates
Michigan Department of Treasury - 40 -Economic and Revenue Outlook January 10, 2020

Administration Revenue Estimates January 10, 2020
Revenue Estimate Overview
The revenue estimates presented in this section consist of baseline revenues, revenue adjustments, and net revenues. Baseline revenues provide an estimate of the effects of the economy on tax revenues. For these estimates, FY 2019 is the base year. Any non-economic changes to the taxes occurring in FY 2020, FY 2021 and FY 2022 are not included in the baseline estimates. Non-economic changes are referred to in the tables as "tax adjustments". The net revenue estimates are the baseline revenues adjusted for tax adjustments.
This treatment of revenue is best illustrated with an example. Suppose tax revenues are $10.0 billion in a given year, and that based on the economic forecast, revenues are expected to grow by 5.0 percent per year. Baseline revenue would be $10.0 billion in Year 1, $10.5 billion in Year 2, and $11.0 billion in Year 3. Assume a tax rate cut is in place that would reduce revenues by $100 million in Year 1, $200 million in Year 2, and $300 million in Year 3. If Year 1 is the base year, the revenue adjustments for Year 1 would be $0 since the tax cut for this year is included in the base. The revenue adjustments for Year 2 would be $100 million, and the revenue adjustments for Year 3 would be $200 million, since the revenue adjustments are compared to the base year.
In the example above, the baseline revenues would be $10.0 billion, $10.5 billion, and $11.0 billion, for Years 1 through 3, respectively. The revenue adjustments would be $0 in Year 1, $100 million in Year 2, and $200 million in Year 3. The $200 million in Year 3 represents the tax cuts since Year 1. Net revenue would be $10.0 billion in Year 1, $10.4 billion in Year 2, and $10.8 billion in Year 3.
The following revenue figures are presented on a Consensus basis. Generally speaking, the Consensus estimates do not include certain one-time budget measures, such as withdrawals from the Budget Stabilization Fund, the sale of buildings, and so on. The figures also do not include constitutional revenue sharing payments to local governments from the sales tax. In addition, the estimates only include enacted legislation and do not include the effects of any proposed changes. The School Aid Fund estimates consist of taxes plus the transfer from the State Lottery Fund.
Michigan Department of Treasury - 41 -Economic and Revenue Outlook January 10, 2020

---
---
---
---
---
---
FY 2019 Revenue Outlook
Preliminary FY 2019 GF-GP revenue is estimated to be $11,108.0 million, a 0.8 percent increase compared to FY 2018. The FY 2019 GF-GP revenue estimate is $256.3 million above the May 2019 Consensus estimate. SAF revenue is estimated to be $13,560.0 million, a 1.9 percent increase compared to FY 2018. The FY 2019 SAF estimate is $77.7 million above the May 2019 Consensus estimate (see Table 2).
Table 2
FY 2018-19 Preliminary Final Revenue Estimates (millions)
Administration
January 10, 2020
Amount Growth
General Fund - General Purpose
Baseline Revenue $12,330.6 0.9%
Tax Cut Adjustments ($1,222.6) ---
Net Resources $11,108.0 0.8%
School Aid Fund
Baseline Revenue $13,621.8 2.3%
Tax Cut Adjustments ($61.8) ---
Net Resources $13,560.0 1.9%
Combined
Baseline Revenue $25,952.4 1.6%
Tax Cut Adjustments ($1,284.4) ---
Net Resources $24,668.0 1.4%
Change from
May 2019
Consensus
$256.3
$77.7
$334.0
Prepared By: Office of Revenue and Tax Analysis, Michigan Department of Treasury
Michigan Department of Treasury - 42 -Economic and Revenue Outlook January 10, 2020

FY 2020 Revenue Outlook
FY 2020 GF-GP revenue is estimated to be $10,968.8 million, down 1.3 percent compared to FY 2019. The FY 2020 GF-GP revenue estimate is $191.9 million above the May 2019 Consensus estimate. SAF revenue is forecast to be $13,905.2 million, a 2.5 percent increase compared to FY 2019. The FY 2020 SAF estimate is $65.4 million above the May 2019 Consensus estimate (see Table 3).
Table 3
FY 2019-20 Administration Revenue Estimates (millions)
Administration Change from
January 10, 2020 May 2019
Amount Growth Consensus
General Fund - General Purpose
Baseline Revenue $12,479.1 1.2% ---
Tax Cut Adjustments ($1,510.3) --- ---
Net Resources $10,968.8 -1.3% $191.9
School Aid Fund
Baseline Revenue $13,853.3 1.7% ---
Tax Cut Adjustments $51.9 --- ---
Net Resources $13,905.2 2.5% $65.4
Combined
Baseline Revenue $26,332.4 1.5% ---
Tax Cut Adjustments ($1,458.4) --- ---
Net Resources $24,874.0 0.8% $257.3
Prepared By: Office of Revenue and Tax Analysis, Michigan Department of Treasury
Michigan Department of Treasury - 43 -Economic and Revenue Outlook January 10, 2020

FY 2021 Revenue Outlook
FY 2021 GF-GP revenue is estimated to be $11,065.0 million, a 0.9 percent increase compared to FY 2020. The FY 2021 GF-GP revenue estimate is $144.5 million above the May 2019 Consensus estimate. SAF revenue is forecast to be $14,283.0 million, a 2.7 percent increase compared to FY 2020. The FY 2021 SAF estimate is $103.5 million above the May 2019 Consensus estimate (see Table 4).
Table 4
FY 2020-21 Administration Revenue Estimates (millions)
Administration Change from
January 10, 2020 May 2019
Amount Growth Consensus
General Fund - General Purpose
Baseline Revenue $12,758.8 2.2% ---
Tax Cut Adjustments ($1,693.8) --- ---
Net Resources $11,065.0 0.9% $144.5
School Aid Fund
Baseline Revenue $14,175.8 2.3% ---
Tax Cut Adjustments $107.2 --- ---
Net Resources $14,283.0 2.7% $103.5
Combined
Baseline Revenue $26,934.6 2.3% ---
Tax Cut Adjustments ($1,586.6) --- ---
Net Resources $25,348.0 1.9% $248.0
Prepared By: Office of Revenue and Tax Analysis, Michigan Department of Treasury
Michigan Department of Treasury - 44 -Economic and Revenue Outlook January 10, 2020

FY 2022 Revenue Outlook
FY 2022 GF-GP revenue is estimated to be $11,329.0 million, a 2.4 percent increase compared to FY 2021. SAF revenue is forecast to be $14,585.5 million, a 2.1 percent increase compared to FY 2021 (see Table 5).
Table 5
FY 2021-22 Administration Revenue Estimates (millions)
Administration
January 10, 2020
Amount Growth
General Fund - General Purpose
Baseline Revenue $13,028.8 2.1%
Tax Cut Adjustments ($1,699.8) ---
Net Resources $11,329.0 2.4%
School Aid Fund
Baseline Revenue $14,476.1 2.1%
Tax Cut Adjustments $109.4 ---
Net Resources $14,585.5 2.1%
Combined
Baseline Revenue $27,504.9 2.1%
Tax Cut Adjustments ($1,590.4) ---
Net Resources $25,914.5 2.2%
Prepared By: Office of Revenue and Tax Analysis, Michigan Department of Treasury
Michigan Department of Treasury - 45 -Economic and Revenue Outlook January 10, 2020

Constitutional Revenue Limit
Article IX, Section 26, of the Michigan Constitution establishes a limit on the amount of revenue State government can collect in any given fiscal year. The revenue limit for a given fiscal year is equal to 9.49 percent of the State’s personal income for the calendar year prior to the year in which the fiscal year begins. For example, FY 2017 revenue is compared to CY 2015 personal income. If revenues exceed the limit by less than 1 percent, the State may deposit the excess into the Budget Stabilization Fund (BSF). If the revenues exceed the limit by more than 1 percent, the excess revenue is refunded to taxpayers.
FY 2018 revenues were $8.7 billion below the revenue limit. State revenues will also be well below the limit for FY 2019 through FY 2022. FY 2019 revenues are expected to be $9.9 billion below the limit, FY 2020 revenues $11.6 billion below the limit, FY 2021 revenues $12.7 billion below the limit, and FY 2022 revenues $13.7 billion below the limit (See Table 6).
Table 6
Administration Revenue Limit Calculation (millions)
FY 2018
Final
June 2018
FY 2019
Admin
Jan 2020
FY 2020
Admin
Jan 2020
FY 2021
Admin
Jan 2020
FY 2022
Admin
Jan 2020
Revenue Subject to Limit $32,956.1 $33,733.3 $34,330.3 $35,118.8 $35,879.5
Revenue Limit
Personal Income
Ratio
Revenue Limit
CY 2016
$439,361
9.49%
$41,695.4
CY 2017
$460,270
9.49%
$43,679.6
CY 2018
$484,030
9.49%
$45,934.4
CY 2019
$503,875
9.49%
$47,817.7
CY 2020
$522,518
9.49%
$49,587.0
Amount Under (Over) Limit $8,739.3 $9,946.3 $11,604.1 $12,699.0 $13,707.4
Budget Stabilization Fund Calculation
The Management and Budget Act contains provisions for calculating a recommended deposit or withdrawal from the BSF. The calculation looks at personal income net of transfer payments. The net personal income figure is adjusted for inflation. The change in this figure for the calendar year determines whether a pay-in or pay-out is recommended. If the formula calls for a deposit into the BSF, the deposit is made in the next fiscal year. If the formula calls for a withdrawal, the withdrawal is made during the current fiscal year.
Recently enacted legislation, PA 613 of 2018, prohibits the legislature from appropriating money from the fund for a fiscal year when the annual growth rate for the calendar year in which that fiscal year ends is estimated to be greater than 0% at the most recent consensus revenue
Michigan Department of Treasury - 46 -Economic and Revenue Outlook January 10, 2020

estimating conference. When the annual growth rate is estimated to be less than 0% at the most recent consensus revenue estimating conference, the legislature may appropriate by law for the fiscal year ending in the current calendar year no more than 25% of the prior fiscal year ending balance in the fund as reported in the comprehensive annual financial report.
If real personal income grows by more than 2 percent in a given calendar year, the fraction of income growth over 2 percent is multiplied by the current fiscal year’s GF-GP revenue to determine the pay-in for the next fiscal year.
Real calendar year personal income is not projected to be below 0% during the forecast horizon. Therefore, no payouts are projected. Real calendar year personal income is projected to be above 2 percent in only 2019. This results in a pay-in for FY 2020 of $7.8 million
School Aid Fund Revenue Adjustment Factor
The School Aid Fund (SAF) revenue adjustment factor for the next fiscal year is calculated by dividing the sum of current year and subsequent year SAF revenue by the sum of current year and prior year SAF revenue. For example, the FY 2021 SAF revenue adjustment factor is calculated by dividing the sum of FY 2020 and FY 2021 SAF revenue by the sum of FY 2019 and FY 2020 SAF revenue. The SAF revenue totals are adjusted for any change in the rate and base of the SAF taxes. The year for which the adjustment factor is being calculated is used as the base year for any tax adjustments. For FY 2021, the SAF revenue adjustment factor is calculated to be 1.0200 (See Table 7). For FY 2021, the SAF revenue adjustment factor is calculated to be 1.0220 (See Table 8).
Table 7
Administration School Aid Revenue Adjustment Factor For Fiscal Year 2021
FY 2019 FY 2020 FY 2021
Baseline SAF Revenue $13,621.8 $13,853.3 $14,175.8
Balance Sheet Adjustments ($61.8) $51.9 $107.2
Net SAF Estimates $13,560.0 $13,905.2 $14,283.0
Subtotal Adjustments to FY 2021 Base $169.0 $55.3 $0.0
Baseline Revenue on a FY 2021 Base $13,729.0 $13,960.5 $14,283.0
School Aid Fund Revenue Adjustment Calculation for FY 2021
Sum of FY 2019 & FY 2020 $13,729.0 + $13,960.5 = $27,689.5
Sum of FY 2020 & FY 2021 $13,960.5 + $14,283.0 = $28,243.5
FY 2021 Revenue Adjustment Factor 1.0200 Note: Factor is calculated off a FY 2021 base year.
Michigan Department of Treasury - 47 -Economic and Revenue Outlook January 10, 2020

Table 8
Administration School Aid Revenue Adjustment Factor For Fiscal Year 2022
FY 2020 FY 2021 FY 2022
Baseline SAF Revenue $13,853.3 $14,175.8 $14,476.1
Balance Sheet Adjustments $51.9 $107.2 $109.4
Net SAF Estimates $13,905.2 $14,283.0 $14,585.5
Subtotal Adjustments to FY 2022 Base $57.5 $2.2 $0.0
Baseline Revenue on a FY 2022 Base $13,962.7 $14,285.2 $14,585.5
School Aid Fund Revenue Adjustment Calculation for FY 2022
Sum of FY 2020 & FY 2021 $13,962.7 + $14,285.2 = $28,247.8
Sum of FY 2021 & FY 2022 $14,285.2 + $14,585.5 = $28,870.6
FY 2022 Revenue Adjustment Factor 1.0220 Note: Factor is calculated off a FY 2022 base year.
Revenue Detail
The estimated tax and revenue totals include the effects of all enacted tax changes. The revenue totals by tax are presented separately for GF-GP and for the SAF (See Tables 9 and 10). Tax totals for the income, sales, use, CIT/MBT, tobacco and casino taxes for all funds are also included (See Table 11).
Michigan Department of Treasury - 48 -Economic and Revenue Outlook January 10, 2020

Table 9
Administration General Fund General Purpose Revenue Detail
(millions)
FY 2020 FY 2021 FY 2022
Amount Growth Amount Growth Amount Growth
GF-GP Tax Amounts
Income Tax $7,169.9 -1.1% $7,261.7 1.3% $7,459.4 2.7%
Sales $1,363.1 6.7% $1,408.9 3.4% $1,442.2 2.4%
Use $715.0 -5.1% $702.4 -1.8% $687.2 -2.2%
Cigarette $170.7 -2.8% $168.2 -1.5% $166.4 -1.0%
Beer & Wine $51.5 2.6% $52.5 1.9% $53.5 1.9%
Liquor Specific $61.0 -0.5% $62.0 1.6% $63.0 1.6%
Insurance Co. Premium $342.3 8.7% $362.0 5.8% $370.0 2.2%
CIT/MBT $572.9 42.8% $509.8 -11.0% $544.4 6.8%
Telephone & Telegraph $30.0 -1.0% $30.0 0.0% $30.0 0.0%
Oil & Gas Severance $25.0 12.1% $27.0 8.0% $28.5 5.6%
Essential Services Assess. $118.0 6.1% $127.1 7.7% $130.0 2.3%
Penalties and Interest $128.0 2.0% $130.0 1.6% $133.0 2.3%
Railroad/Car Loaning $2.0 0.0% $2.0 0.0% $2.0 0.0%
Enhanc. Enforce/ACS ($150.0) 1.9% ($152.0) 1.3% ($154.0) 1.3%
Total GF-GP Taxes $10,599.4 -1.2% $10,691.6 0.9% $10,955.6 2.5%
GF-GP Non-Tax Revenue
Federal Aid $13.3 533.3% $13.3 0.0% $13.3 0.0%
From Local Agencies $0.1 NA $0.1 0.0% $0.1 0.0%
From Services $7.0 1066.7% $7.0 0.0% $7.0 0.0%
From Licenses & Permits $14.0 50.5% $14.0 0.0% $14.0 0.0%
Miscellaneous $10.0 -41.2% $10.0 0.0% $10.0 0.0%
Interfund Interest $8.0 -22.3% $7.0 -12.5% $7.0 0.0%
Liquor Purchase $240.0 -5.1% $245.0 2.1% $250.0 2.0%
Charitable Games $2.0 5.3% $2.0 0.0% $2.0 0.0%
Transfer From Escheats $75.0 -11.6% $75.0 0.0% $70.0 -6.7%
Other Non Tax $0.0 0.0% $0.0 0.0% $0.0 0.0%
Total Non Tax $369.4 -2.5% $373.4 1.1% $373.4 0.0%
Total GF-GP Revenue $10,968.8 -1.3% $11,065.0 0.9% $11,329.0 2.4%
Michigan Department of Treasury - 49 -Economic and Revenue Outlook January 10, 2020

Table 10
Administration School Aid Fund Revenue Detail
FY 2020 FY 2021 FY 2022
Amount Growth Amount Growth Amount Growth
School Aid Fund
Income Tax $2,861.9 0.6% $2,937.6 2.6% $3,011.3 2.5%
Sales Tax $6,298.7 4.8% $6,512.5 3.4% $6,663.8 2.3%
Use Tax $593.5 -1.5% $600.0 1.1% $606.5 1.1%
Liquor Excise Tax $60.6 0.7% $61.6 1.7% $62.6 1.6%
Cigarette & Tobacco $322.7 -1.5% $316.6 -1.9% $312.9 -1.2%
Marijuana Excise Tax $23.6 0.0% $43.1 82.6% $53.9 25.1%
State Education Tax $2,176.9 3.0% $2,233.4 2.6% $2,286.0 2.4%
Real Estate Transfer $351.0 0.3% $356.0 1.4% $360.0 1.1%
Industrial Facilities Tax $38.5 -2.5% $38.0 -1.3% $37.5 -1.3%
Casino (45% of 18%) $121.5 3.6% $151.9 25.0% $154.8 1.9%
Commercial Forest $3.8 -2.6% $3.8 0.0% $3.8 0.0%
Other Spec Taxes $22.5 2.3% $22.5 0.0% $22.5 0.0%
Subtotal Taxes $12,875.2 3.1% $13,277.0 3.1% $13,575.6 2.2%
Lottery Transfer $1,030.0 -3.8% $1,006.0 -2.3% $1,009.9 0.4%
Total SAF Revenue $13,905.2 2.5% $14,283.0 2.7% $14,585.5 2.1%
Table 11
Administration Major Tax Totals
FY 2020 FY 2021 FY 2022
Amount Growth Amount Growth Amount Growth
Major Tax Totals (Includes all Funds)
Income Tax $10,569.6 1.3% $10,869.1 2.8% $11,140.5 2.5%
Sales Tax $8,650.8 4.9% $8,943.3 3.4% $9,149.7 2.3%
Use Tax $1,774.4 -3.8% $1,793.9 1.1% $1,815.0 1.2%
CIT/MBT $572.9 42.8% $509.8 -11.0% $544.4 6.8%
Cigarette and Tobacco $877.8 -0.1% $849.3 -3.2% $841.0 -1.0%
Casino Tax $119.3 1.6% $121.0 1.4% $121.0 0.0%
Michigan Department of Treasury - 50 -Economic and Revenue Outlook January 10, 2020
Related Documents