Economic and Market Report EU Automotive Industry Quarter 3 2015 December 2015

Welcome message from author
This document is posted to help you gain knowledge. Please leave a comment to let me know what you think about it! Share it to your friends and learn new things together.
Transcript
Economic and Market Report
EU Automotive Industry Quarter 3 2015
December 2015
ACEA Economic and Market Report: EU Automotive Industry – Quarter 3 2015 1
CONTENTS EU Economic Outlook ................................................................................................................... 2
Passenger cars ............................................................................................................................... 4
Registrations ............................................................................................................................. 4
World ..................................................................................................................................... 4
The European Union ............................................................................................................... 7
Production ................................................................................................................................. 9
World ..................................................................................................................................... 9
The European Union ............................................................................................................ 12
Trade ........................................................................................................................................ 13
Imports ................................................................................................................................ 14
Exports ................................................................................................................................. 15
Commercial vehicles .................................................................................................................... 16
Registrations in the EU ............................................................................................................ 16
Global production outlook ....................................................................................................... 21
Trade ....................................................................................................................................... 22
Imports ................................................................................................................................ 23
Exports ................................................................................................................................ 24

ACEA Economic and Market Report: EU Automotive Industry – Quarter 3 2015 2
EU ECONOMIC OUTLOOK
This year, the economic recovery in the EU has been supported by a combination of positive factors
including low oil prices, accommodative monetary policy and a relatively weak external value of
the euro. However, the EU’s growth outlook is likely to remain moderate over the forecast horizon.
Real GDP in the EU is projected to grow from 1.9% in 2015 to 2.0% in 2016 and 2.1% in 2017,
according to the European Commission’s 2015 Autumn Economic Forecast.
Table 1: EU forecast autumn 2015
Source: European Commission, DG ECFIN
2015 2016 2017 2015 2016 2017 2015 2016 2017
Austria 0.6 1.5 1.4 0.9 1.8 2 6.1 6.1 6
Belgium 1.3 1.3 1.7 0.6 1.7 1.5 8.6 8.4 7.9
Bulgaria 1.7 1.5 2 ‐0.8 0.7 1.1 10.1 9.4 8.8
Croatia 1.1 1.4 1.7 ‐0.1 0.9 1.7 16.2 15.6 14.7
Cyprus 1.2 1.4 2 ‐1.6 0.6 1.3 15.6 14.6 13.3
Czech Republic 4.3 2.2 2.7 0.4 1 1.6 5.2 5 4.8
Denmark 1.6 2 1.8 0.4 1.5 1.9 6.1 5.8 5.5
Estonia 1.9 2.6 2.6 0.1 1.8 2.9 6.5 6.5 7.6
Finland 0.3 0.7 1.1 ‐0.2 0.6 1.5 9.6 9.5 9.4
France 1.1 1.4 1.7 0.1 0.9 1.3 10.4 10.4 10.2
Germany 1.7 1.9 1.9 0.2 1 1.7 4.7 4.9 5.2
Greece ‐1.4 ‐1.3 2.7 ‐1 1 0.9 25.7 25.8 24.4
Hungary 2.9 2.2 2.5 0.1 1.9 2.5 7.1 6.7 6.2
Ireland 6 4.5 3.5 0.3 1.4 1.6 9.5 8.7 7.9
Italy 0.9 1.5 1.4 0.2 1 1.9 12.2 11.8 11.6
Latvia 2.4 3 3.3 0.2 1.4 2.1 10.1 9.5 8.8
Lithuania 1.7 2.9 3.4 ‐0.8 0.6 2.2 9.4 8.6 8.1
Luxembourg 3.1 3.2 3 0.3 1.7 1.7 5.9 5.8 5.8
Malta 4.3 3.6 3.1 1.1 1.8 2.2 5.8 5.7 5.8
Netherlands 2 2.1 2.3 0.2 1.2 1.5 6.9 6.6 6.3
Poland 3.5 3.5 3.5 ‐0.6 1.4 1.9 7.6 7.2 6.8
Portugal 1.7 1.7 1.8 0.5 1.1 1.3 12.6 11.7 10.8
Romania 3.5 4.1 3.6 ‐0.4 ‐0.3 2.3 6.7 6.6 6.5
Slovakia 3.2 2.9 3.3 ‐0.2 1 1.6 11.6 10.5 9.6
Slovenia 2.6 1.9 2.5 ‐0.6 0.8 1.4 9.4 9.2 8.7
Spain 3.1 2.7 2.4 ‐0.5 0.7 1.2 22.3 20.5 19
Sweden 3 2.8 2.7 0.8 1.5 1.7 7.7 7.7 7.4
United Kingdom 2.5 2.4 2.2 0.1 1.5 1.7 5.4 5.4 5.5
EU 1.9 2 2.1 0 1.1 1.6 9.5 9.2 8.9
Real GDP Inflation Unemployment rate

ACEA Economic and Market Report: EU Automotive Industry – Quarter 3 2015 3
Figure 1: EU GDP growth forecast 2016 (in %)
Source: European Commission, DG ECFIN
Annual inflation in the EU is expected to rise from 0% this year, to 1.1% next year, and to 1.6% in
2017, as wage growth, strengthening private consumption and the narrowing of the output gap all
begin to add increasing pressure on prices.
Labour market conditions continue to make slow but stable improvements in line with rising
economic activity. The unemployment rate, however, is expected to continue to decline only
gradually, with substantial disparities between member states. In the EU, forecast predicts a fall
from 9.5% this year to 9.2% in 2016 and 8.9% in 2017, according to the latest figures of the
European Commission.

ACEA Economic and Market Report: EU Automotive Industry – Quarter 3 2015 4
PASSENGER CARS
REGISTRATIONS
WORLD
Over the first three quarters of this year, global passenger car demand grew (+0.9%) to 53.2 million
units. Global demand picture showed diverse results, with mature markets generally continuing
their recovery, while many emerging markets are struggling to maintain car sales momentum
despite support by lower oil prices.
EU registrations remained positive till the end of the third quarter of 2015. With 10.4 million
passenger cars sold, results for the period were higher (+8.8%) than in the first nine months of 2014.
This represents a solid and rather consistent performance, although the market is still far from
being healthy. The EU market is benefiting from a natural recovery and a low base of comparison.
Sales still need to catch up for the losses registered in the recent post‐crisis years, as Europe’s car
fleet otherwise will become too old.
So far in 2015, the Russian market went down by 33.3%, as a result of geopolitical tensions as well
as the economy’s overdependence on oil and gas resources. Likewise, Ukraine showed a similar
trend, posting a double‐digit decline (‐61.2%). Only Turkey is on a recovery path (+36.6%),
essentially rebounding from last year’s credit crisis. Overall in Europe1, sales increased (+3.1%),
accounting for 23.6% of the global market.
Looking at the other Triad markets, Japanese sales were down (‐10.5%) compared with 2014.
The weaker domestic economy and consumption momentum are mainly the result of Japan’s
recent 8% of its consumption tax and the announcement of another increase in 2017 to 10%.
Three quarters into the year, sales growth in the United States was above the year‐earlier levels
(+3.9%) reaching 10.9 million units and accounting for 20.5% of the global market.
1 Includes Belarus, Bosnia‐Herzegovina, Kazakhstan, Macedonia, Russia, Serbia, Turkey, Ukraine and
Uzbekistan

ACEA Economic and Market Report: EU Automotive Industry – Quarter 3 2015 5
The absence of credit remains a key constraint to vehicle demand in Brazil, since banks are cautious
about lending. Passenger car sales in Brazil dropped (‐20.6%) in the first three quarters of the year,
the market contracted by 416,192 units to 1.6 million units over the period.
Chinese sales increased (+4.3%) in the first nine months of 2015, thanks to more stable market
conditions, especially in the stock markets, reaching 13.5 million units and accounting for more
than a quarter of global passenger car sales.
Looking at the other emerging markets, South Korean sales were up (+4.4%) compared to 2014.
Indian passenger car sales grew by (+4.9%) in the first three quarters of 2015, while Indonesia and
Thailand posted double‐digit declines over the period. This resulted in an overall sales decline in
the ASEAN2 market and hence only in modest growth for the Asian region (+1.0%).
2 Indonesia, Malaysia, Philippines, Singapore, Thailand and Vietnam
ACEA Economic and Market Report: EU Automotive Industry – Quarter 3 2015 6
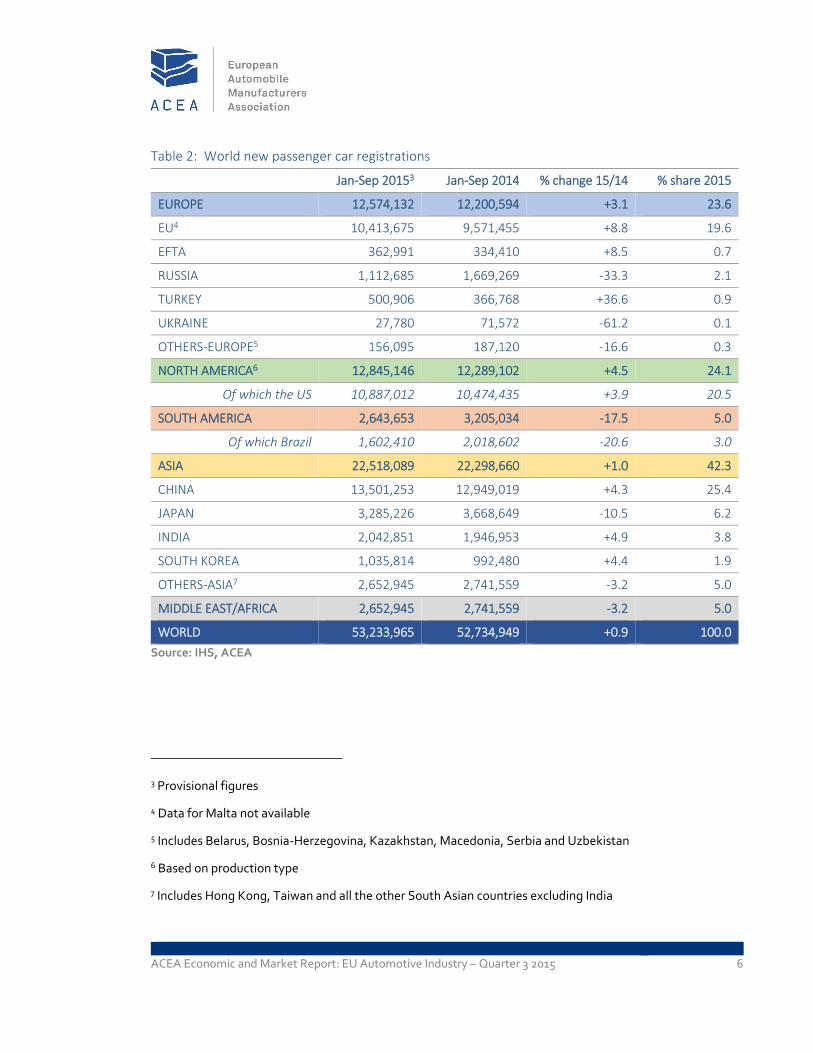
Table 2: World new passenger car registrations
Jan‐Sep 20153 Jan‐Sep 2014 % change 15/14 % share 2015
EUROPE 12,574,132 12,200,594 +3.1 23.6
EU4 10,413,675 9,571,455 +8.8 19.6
EFTA 362,991 334,410 +8.5 0.7
RUSSIA 1,112,685 1,669,269 ‐33.3 2.1
TURKEY 500,906 366,768 +36.6 0.9
UKRAINE 27,780 71,572 ‐61.2 0.1
OTHERS‐EUROPE5 156,095 187,120 ‐16.6 0.3
NORTH AMERICA6 12,845,146 12,289,102 +4.5 24.1
Of which the US 10,887,012 10,474,435 +3.9 20.5
SOUTH AMERICA 2,643,653 3,205,034 ‐17.5 5.0
Of which Brazil 1,602,410 2,018,602 ‐20.6 3.0
ASIA 22,518,089 22,298,660 +1.0 42.3
CHINA 13,501,253 12,949,019 +4.3 25.4
JAPAN 3,285,226 3,668,649 ‐10.5 6.2
INDIA 2,042,851 1,946,953 +4.9 3.8
SOUTH KOREA 1,035,814 992,480 +4.4 1.9
OTHERS‐ASIA7 2,652,945 2,741,559 ‐3.2 5.0
MIDDLE EAST/AFRICA 2,652,945 2,741,559 ‐3.2 5.0
WORLD 53,233,965 52,734,949 +0.9 100.0
Source: IHS, ACEA
3 Provisional figures
4 Data for Malta not available
5 Includes Belarus, Bosnia‐Herzegovina, Kazakhstan, Macedonia, Serbia and Uzbekistan
6 Based on production type
7 Includes Hong Kong, Taiwan and all the other South Asian countries excluding India

ACEA Economic and Market Report: EU Automotive Industry – Quarter 3 2015 7
THE EUROPEAN UNION
In September 2015, the EU passenger car market showed another strong month (+9.8%), marking
the 25th month of consecutive growth. Demand for new passenger cars was sustained in all major
markets, driven by ongoing scrappage schemes and economic recovery in Southern Europe.
Over the first nine months of 2015, new passenger car registrations in the EU increased (+8.8%),
surpassing 10 million units (10,413,675). However, this is still far from the pre‐crisis level of almost
12 million units registered during the same period in 2007.
All major markets posted growth, contributing to the overall upturn of the EU market over the first
three quarters of the year. Spain (+22.4%) and Italy (+15.3%) both benefited from strong growth
and posted double‐digit percentage gains, followed by the UK (+7.1%), France (+6.3%) and
Germany (+5.5%).
Table 3: Top 5 – New passenger car registrations in the EU
Jan‐Sep 2015 Jan‐Sep 2014 % change 15/14
Germany 2,407,938 2,281,671 +5.5
United Kingdom 2,096,886 1,958,196 +7.1
France 1,421,435 1,337,315 +6.3
Italy 1,196,270 1,037,388 +15.3
Spain 783,892 640,673 +22.4
EU8 10,413,675 9,571,455 +8.8
Source: ACEA
8 Data for Malta not available

ACEA Economic and Market Report: EU Automotive Industry – Quarter 3 2015 8
Figure 2: New passenger car registrations in the EU | 12 month trend
Source: ACEA

ACEA Economic and Market Report: EU Automotive Industry – Quarter 3 2015 9
PRODUCTION
WORLD
Production in Europe showed signs of contraction over the first three quarters of 2015. On the EU
perimeter (+6.8%) and in Turkey (+4.4%), passenger car production increase. However, production
decreased in Russia (‐28.2%), Ukraine (‐86.6%) and in the other Commonwealth of Independent
States because of the Russian market’s collapse.
Production in North America continued to grow (+2.6%) reaching 10.6 million passenger cars. US
output increased (+3.7%) to 7 million units in the first nine months of the year, based on the
continuing growth in domestic demand. On the other hand, passenger car production in South
America keep dropped significantly (‐16.6%) over the same period. In Brazil several factors,
including high inflation and interest rates, are affecting production. Brazilian production declined
(‐17.2%) during the first three quarters compared with the same period a year earlier to a total of
1.6 million passenger cars.
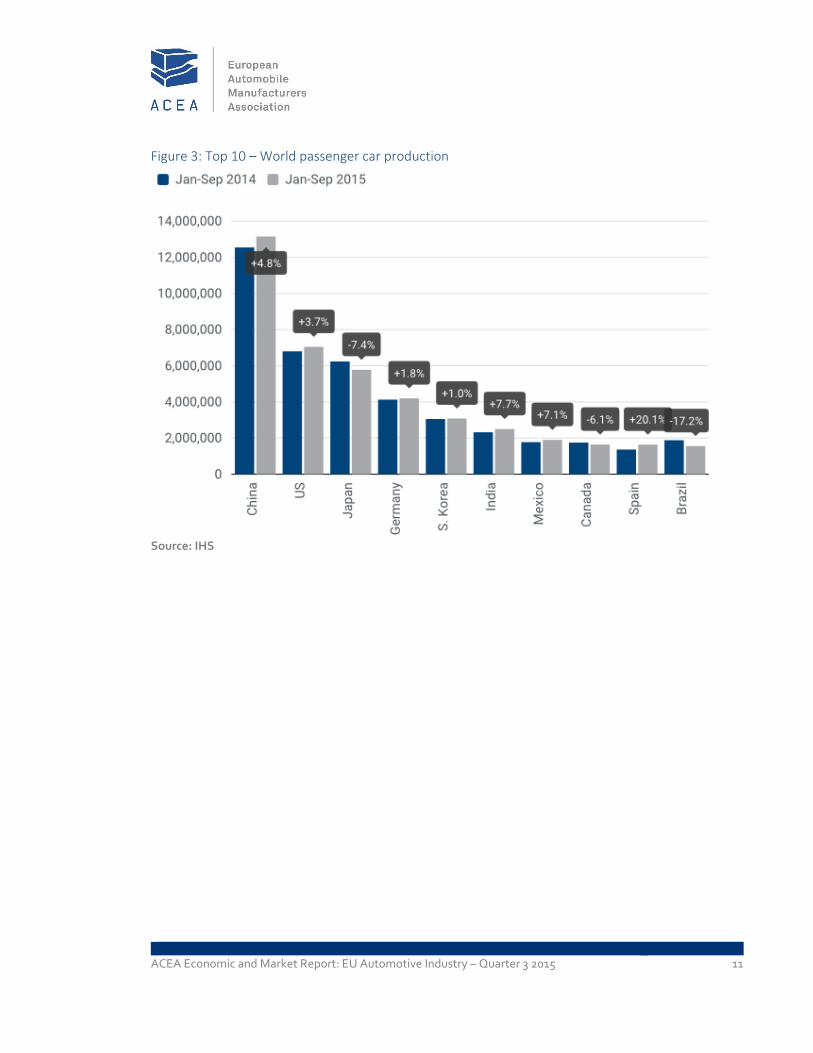
Through the first three quarters of the year, growth of Chinese passenger car production, slowed
(+4.8%, down from +9.6% registered during the first half of the year), reaching 13.2 million units.
However, China maintained its leading position among passenger car producers, accounting for
24.2% of global production.
Japanese production decreased (‐7.4%) to 5.8 million units because of stagnant domestic sales,
following the country’s 2014 consumption tax increase. So far in 2015, South Korean production
accounted 3.1 million units. This translates into modest growth (+1.0%), as a result of sluggish
exports after Chevrolet’s withdrawal from Europe.
During the first three quarters of 2015, Indian passenger car production increased (+7.7%) to 2.5
million units, largely based on strong domestic sales and improved economic sentiment following
the election of a new government. Indonesia’s production reached 0.6 million units, down 15.6%
compared to the same period one year ago. This decline in production was primarily due to
weakening domestic demand affected by a slowdown in the economic growth, inflation and high
interest rates. Thailand, on the other hand, showed signs of recovery (+5.8%) after last year’s
military coup, thanks to robust exports growth.

ACEA Economic and Market Report: EU Automotive Industry – Quarter 3 2015 10
Table 4: World passenger car production
Jan‐Sep 20159 Jan‐Sep 2014 % change 15/14 % share 2015
EUROPE 13,693,476 13,361,689 +2.5 25.2
EU 12,032,634 11,264,180 +6.8 22.2
RUSSIA 904,619 1,260,150 ‐28.2 1.7
TURKEY 526,582 504,214 +4.4 1.0
UKRAINE 3,475 25,976 ‐86.6 0.0
OTHERS‐EUROPE10 226,166 307,169 ‐26.4 0.4
NORTH AMERICA 10,591,741 10,324,031 +2.6 19.5
Of which the US 7,047,448 6,798,488 +3.7 13.0
SOUTH AMERICA 1,917,369 2,299,803 ‐16.6 3.5
Of which Brazil 1,559,339 1,882,748 ‐17.2 2.9
ASIA 26,842,861 26,534,797 +1.2 49.5
CHINA 13,151,639 12,548,550 +4.8 24.2
JAPAN 5,776,758 6,238,551 ‐7.4 10.6
SOUTH KOREA 3,083,944 3,054,169 +1.0 5.7
INDIA 2,501,425 2,322,996 +7.7 4.6
INDONESIA 646,244 765,243 ‐15.6 1.2
THAILAND 658,224 622,338 +5.8 1.2
OTHERS‐ASIA11 1,024,627 982,950 +4.2 1.9
MIDDLE EAST/AFRICA 1,230,929 1,027,907 +19.8 2.3
WORLD 54,276,376 53,548,227 +1.4 100.0
Source: IHS
9 Provisional figures
10 Includes Belarus, Kazakhstan, Serbia and Uzbekistan
11 Includes Taiwan, Australia, Malaysia, Pakistan, Philippines and Vietnam
ACEA Economic and Market Report: EU Automotive Industry – Quarter 3 2015 11
Figure 3: Top 10 – World passenger car production
Source: IHS

ACEA Economic and Market Report: EU Automotive Industry – Quarter 3 2015 12
THE EUROPEAN UNION
EU production continued to increase (+6.8%), with 12 million passenger cars produced in the first
three quarters of 2015. These results confirm the EU’s position as world’s second largest producer
after China, accounting for 22.2% of global passenger car production.
Among the main production countries of Western Europe, the UK (+2.2%), Germany (+1.8%) and
France (+0.9%) showed modest growth, while Spain (+20.1%) and Italy (+61.3%) posted double‐
digit percentage gains. Spain ranked ninth in worldwide passenger car production and second in
the EU. Production in Central European countries, especially in Poland (+19.7%), Hungary (+17.0%)
and Czech Republic (+9.9%), significantly contributed to the positive outcome of the EU perimeter.
Table 5: Top 10 – Passenger car production in the EU
Jan‐Sep 2015 Jan‐Sep 2014 % change 15/14
Germany 4,200,880 4,127,607 +1.8
Spain 1,639,478 1,365,007 +20.1
United Kingdom 1,157,629 1,132,730 +2.2
France 1,133,313 1,123,198 +0.9
Czech Republic 929,313 845,589 +9.9
Slovakia 686,182 655,203 +4.7
Italy 483,841 299,911 +61.3
Hungary 385,281 329,342 +17.0
Poland 367,244 306,915 +19.7
Romania 291,360 287,408 +1.4
EU 12,032,634 11,264,180 +6.8
Source: IHS

ACEA Economic and Market Report: EU Automotive Industry – Quarter 3 2015 13
TRADE
So far in 2015, the EU exported 4.3 million passenger cars worth €96.5 billion. The value of EU
imports significantly increased (+22.6%) over the first nine months of the year, representing
roughly a quarter of the export value (€23.7 billion).
EU exports also grew in value during this same period, although at a slower pace (+14.0%). This
resulted in an EU trade surplus of €72.8 billion, up (+11.4%) compared to the same period in 2014.
Table 6: EU passenger car trade
Trade in value (€m) Jan‐Sep 2015 Jan‐Sep 2014 % change 15/14
Imports 23,705 19,335 +22.6
Exports 96,516 84,680 +14.0
Trade balance 72,811 65,345 +11.4
Trade in volume (units) Jan‐Sep 2015 Jan‐Sep 2014 % change 15/14
Imports 1,838,144 1,648,848 +11.5
Exports 4,291,716 4,104,812 +4.6
Source: Eurostat
ACEA Economic and Market Report: EU Automotive Industry – Quarter 3 2015 14
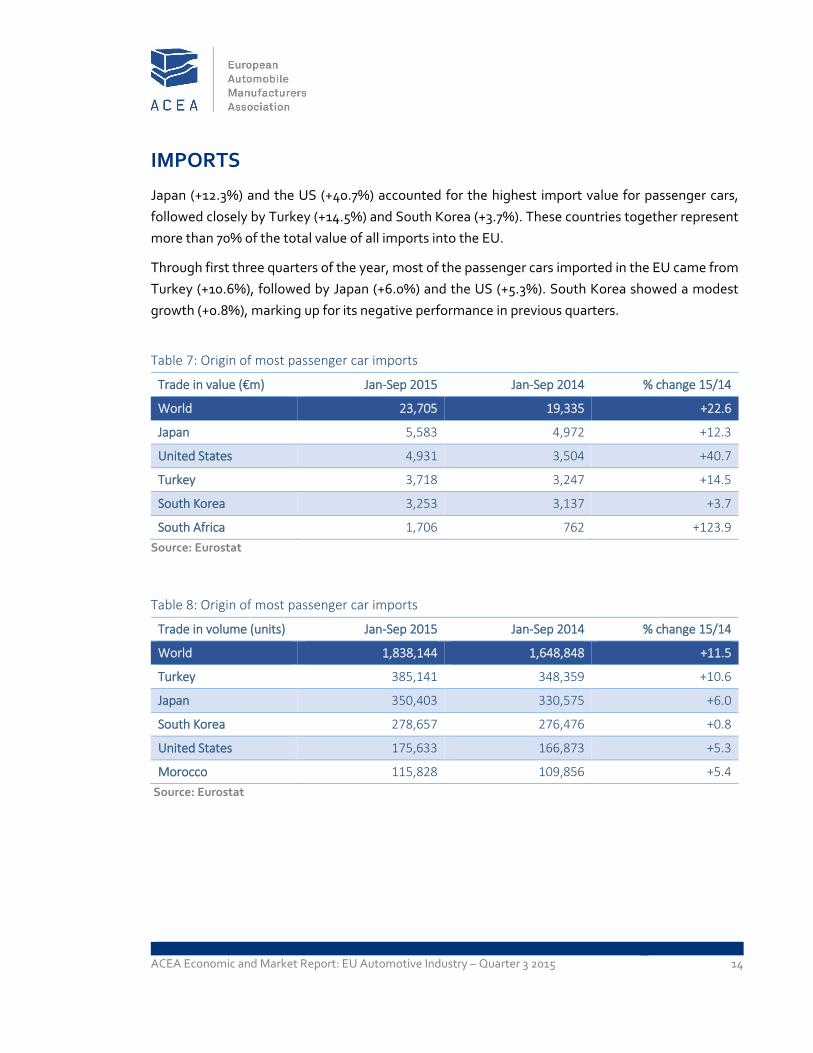
IMPORTS
Japan (+12.3%) and the US (+40.7%) accounted for the highest import value for passenger cars,
followed closely by Turkey (+14.5%) and South Korea (+3.7%). These countries together represent
more than 70% of the total value of all imports into the EU.
Through first three quarters of the year, most of the passenger cars imported in the EU came from
Turkey (+10.6%), followed by Japan (+6.0%) and the US (+5.3%). South Korea showed a modest
growth (+0.8%), marking up for its negative performance in previous quarters.
Table 7: Origin of most passenger car imports
Trade in value (€m) Jan‐Sep 2015 Jan‐Sep 2014 % change 15/14
World 23,705 19,335 +22.6
Japan 5,583 4,972 +12.3
United States 4,931 3,504 +40.7
Turkey 3,718 3,247 +14.5
South Korea 3,253 3,137 +3.7
South Africa 1,706 762 +123.9
Source: Eurostat
Table 8: Origin of most passenger car imports
Trade in volume (units) Jan‐Sep 2015 Jan‐Sep 2014 % change 15/14
World 1,838,144 1,648,848 +11.5
Turkey 385,141 348,359 +10.6
Japan 350,403 330,575 +6.0
South Korea 278,657 276,476 +0.8
United States 175,633 166,873 +5.3
Morocco 115,828 109,856 +5.4
Source: Eurostat
ACEA Economic and Market Report: EU Automotive Industry – Quarter 3 2015 15
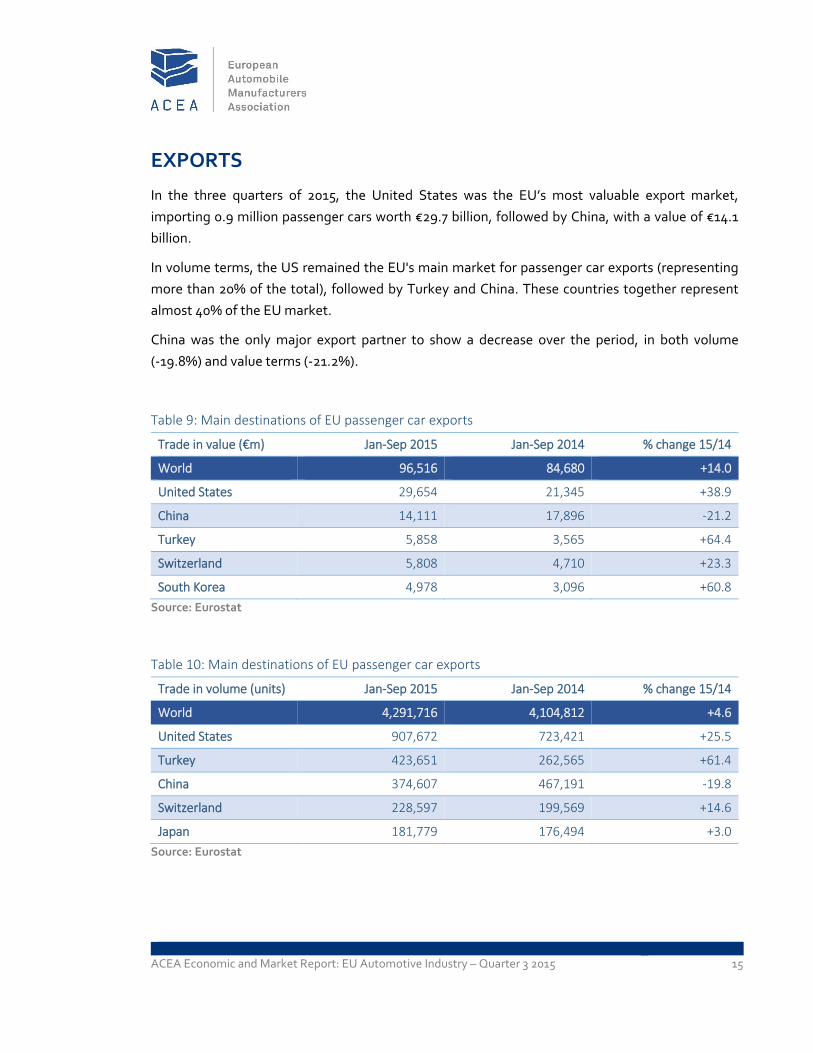
EXPORTS
In the three quarters of 2015, the United States was the EU’s most valuable export market,
importing 0.9 million passenger cars worth €29.7 billion, followed by China, with a value of €14.1
billion.
In volume terms, the US remained the EU's main market for passenger car exports (representing
more than 20% of the total), followed by Turkey and China. These countries together represent
almost 40% of the EU market.
China was the only major export partner to show a decrease over the period, in both volume
(‐19.8%) and value terms (‐21.2%).
Table 9: Main destinations of EU passenger car exports
Trade in value (€m) Jan‐Sep 2015 Jan‐Sep 2014 % change 15/14
World 96,516 84,680 +14.0
United States 29,654 21,345 +38.9
China 14,111 17,896 ‐21.2
Turkey 5,858 3,565 +64.4
Switzerland 5,808 4,710 +23.3
South Korea 4,978 3,096 +60.8
Source: Eurostat
Table 10: Main destinations of EU passenger car exports
Trade in volume (units) Jan‐Sep 2015 Jan‐Sep 2014 % change 15/14
World 4,291,716 4,104,812 +4.6
United States 907,672 723,421 +25.5
Turkey 423,651 262,565 +61.4
China 374,607 467,191 ‐19.8
Switzerland 228,597 199,569 +14.6
Japan 181,779 176,494 +3.0
Source: Eurostat

ACEA Economic and Market Report: EU Automotive Industry – Quarter 3 2015 16
COMMERCIAL VEHICLES
REGISTRATIONS IN THE EU
In September 2015, demand for new commercial vehicles in the EU increased (+14.7%) for the ninth
consecutive month, totalling 208,077 units. Growth was sustained across all commercial vehicle
segments. Spain (+53.2%) and the UK (+19.9%) confirmed positive momentum by posting double‐
digit percentage growth, followed by France (+9.7%) and Italy (+4.9%), while Germany remained
stable (+0.6%).
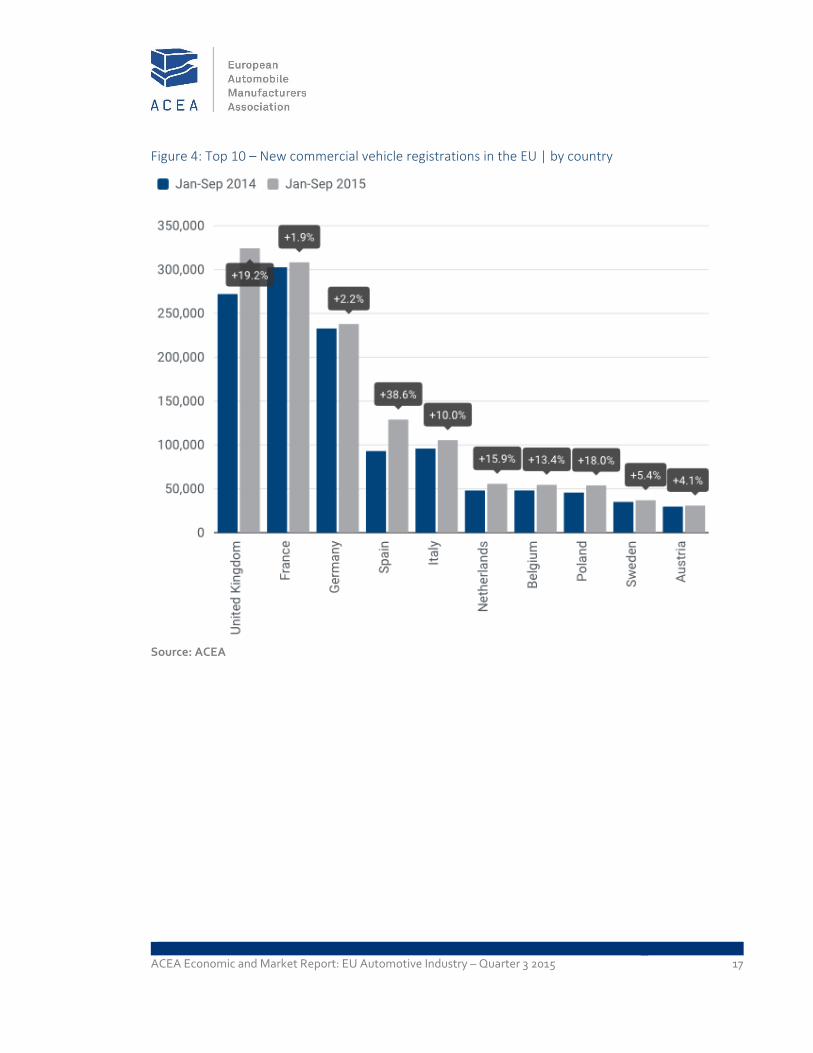
Over nine months in 2015, the EU market expanded (+12.2%), totalling 1,517,247 commercial
vehicles. During the same period, Spain (+38.6%), the UK (+19.2%), Italy (+10.0%), Germany
(+2.2%) and France (+1.9%) all posted growth.
Table 11: New commercial vehicle registrations in the EU | by type
Jan‐Sep 2015 Jan‐Sep 2014 % change 15/14
LCV ≤ 3,5t 1,253,009 1,126,431 +11.2
MHCV >3,5t 235,238 201,737 +16.6
MHBC>3,5t 29,000 24,540 +18.2
TOTAL CV 1,517,247 1,352,708 +12.2
Source: ACEA
ACEA Economic and Market Report: EU Automotive Industry – Quarter 3 2015 17
Figure 4: Top 10 – New commercial vehicle registrations in the EU | by country
Source: ACEA

ACEA Economic and Market Report: EU Automotive Industry – Quarter 3 2015 18
New light commercial vehicles (LCV) up to 3.5 tonnes
In September 2015, new registrations of light commercial vehicles totalled 173,515 units, up
(+14.0%) compared to September last year. This marked the 25th consecutive month of growth in
the segment. Spain (+50.8%), the UK (+19.6%), France (+8.8%) and Italy (+2.0%) positively
contributed to the upturn, while Germany showed a slight decline (‐0.9%).
From January to September 2015, 1,253,009 new vans were registered in the EU (+11.2%). Spain
(+37.0%), the UK (+17.4%), Italy (+8.5%) and Germany (+2.4%) saw demand for vans increase over
this period, while France remained stable (+0.9%).
Figure 5: New light commercial vehicle registrations in the EU | 12 month trend
Source: ACEA

ACEA Economic and Market Report: EU Automotive Industry – Quarter 3 2015 19
New medium and heavy commercial vehicles (MHCV) over 3.5 tonnes12
September 2015 results showed an increase in new heavy truck registrations (+17.0%), totalling
30,544 units. Spain (+75.0%), still benefiting from the government incentive programme, largely
contributed to this positive outcome, followed by Italy (+39.7%), the UK (+17.7%), France (+17.5%)
and Germany (+5.3%) which all posted growth.
Nine months into the year, the EU market grew (+16.6%), reaching 235,238. In particular, Spain
(+51.9%), the UK (+34.2%) and Italy (+22.1%) recorded significant increases over the period,
followed by France (+8.8%) and Germany (+1.5%) which reported more modest growth.
Figure 6: New medium and heavy commercial vehicle registrations in the EU | 12 month trend
Source: ACEA
12 Excluding buses & coaches

ACEA Economic and Market Report: EU Automotive Industry – Quarter 3 2015 20
New medium and heavy buses & coaches (MHBC) over 3.5 tonnes
In September 2015, new bus and coach registrations increased (+29.8%) compared to September
2014, totalling 4,018 units. The UK (+55.9%), Spain (+44.3%), Italy (+21.7%) and France (+15.5%)
positively contributed to the overall expansion, while Germany (‐13.2%) performed less well than
in September 2014.
Over nine months in 2015, the EU market increased (+18.2%), totalling 29,000 new buses and
coaches. Demand was primarily driven by Spain (+42.8%) and the UK (+30.0%), followed by France
(+18.3%), Italy (+15.3%) and Germany (+7.0%).
Figure 7: New medium and heavy bus & coach registrations in the EU | 12 month trend
Source: ACEA
ACEA Economic and Market Report: EU Automotive Industry – Quarter 3 2015 21
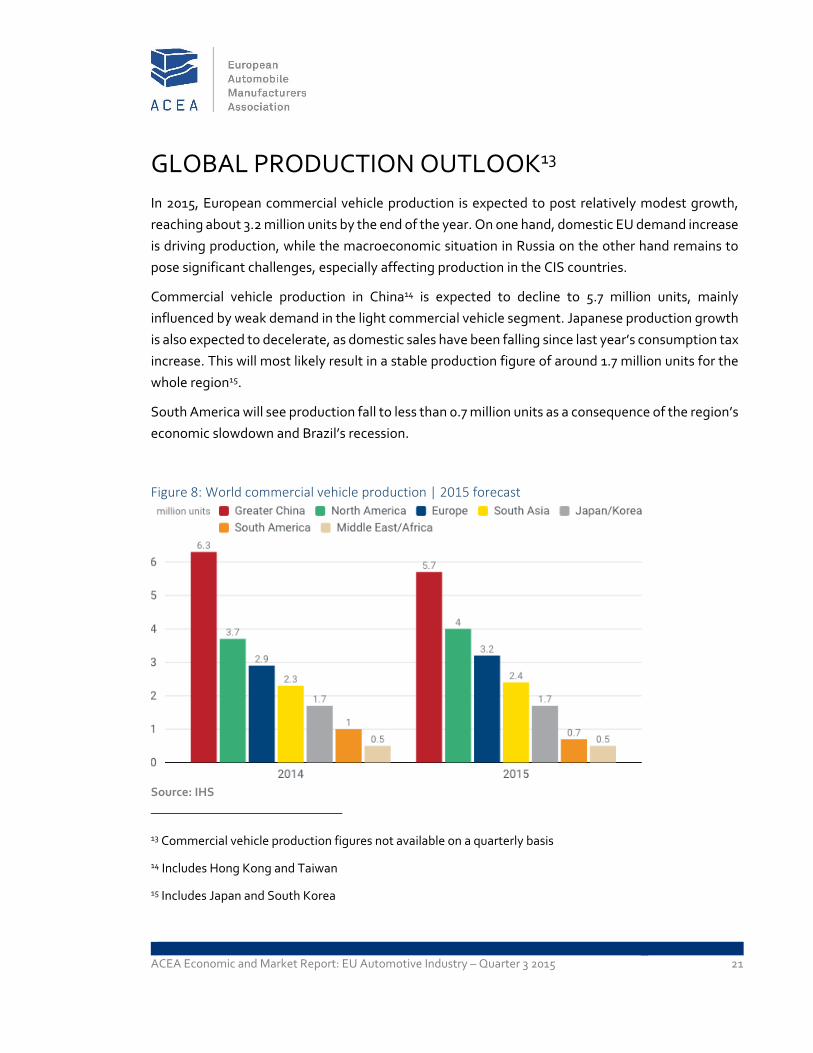
GLOBAL PRODUCTION OUTLOOK13
In 2015, European commercial vehicle production is expected to post relatively modest growth,
reaching about 3.2 million units by the end of the year. On one hand, domestic EU demand increase
is driving production, while the macroeconomic situation in Russia on the other hand remains to
pose significant challenges, especially affecting production in the CIS countries.
Commercial vehicle production in China14 is expected to decline to 5.7 million units, mainly
influenced by weak demand in the light commercial vehicle segment. Japanese production growth
is also expected to decelerate, as domestic sales have been falling since last year’s consumption tax
increase. This will most likely result in a stable production figure of around 1.7 million units for the
whole region15.
South America will see production fall to less than 0.7 million units as a consequence of the region’s
economic slowdown and Brazil’s recession.
Figure 8: World commercial vehicle production | 2015 forecast
Source: IHS
13 Commercial vehicle production figures not available on a quarterly basis
14 Includes Hong Kong and Taiwan
15 Includes Japan and South Korea

ACEA Economic and Market Report: EU Automotive Industry – Quarter 3 2015 22
TRADE
Over the first nine months of 2015, EU light commercial vehicle exports remained stable (‐0.2%),
worth around €3 billion, while the export value of heavy commercial vehicles, buses and coaches
increased (+2.9%).
Despite a marked increase in total commercial vehicle imports (+24.8%), the EU’s trade balance
remains positive over the period, with a trade surplus of some €3.2 billion.
Table 12: EU commercial vehicle (CV) trade | by type
Trade in value (€m) CV up to 5t
CV over 5t +
buses and coaches Total CV
Jan‐Sep 2015
Imports 3,382 1,115 4,498
Exports 2,984 4,708 7,693
Trade balance ‐398 3,593 3,195
Jan‐Sep 2014
Imports 2,776 828 3,604
Exports 2,992 4,576 7,568
Trade balance 216 3,748 3,964
% change 15/14
Imports +21.9 +34.6 +24.8
Exports ‐0.2 +2.9 +1.6
Source: Eurostat
ACEA Economic and Market Report: EU Automotive Industry – Quarter 3 2015 23
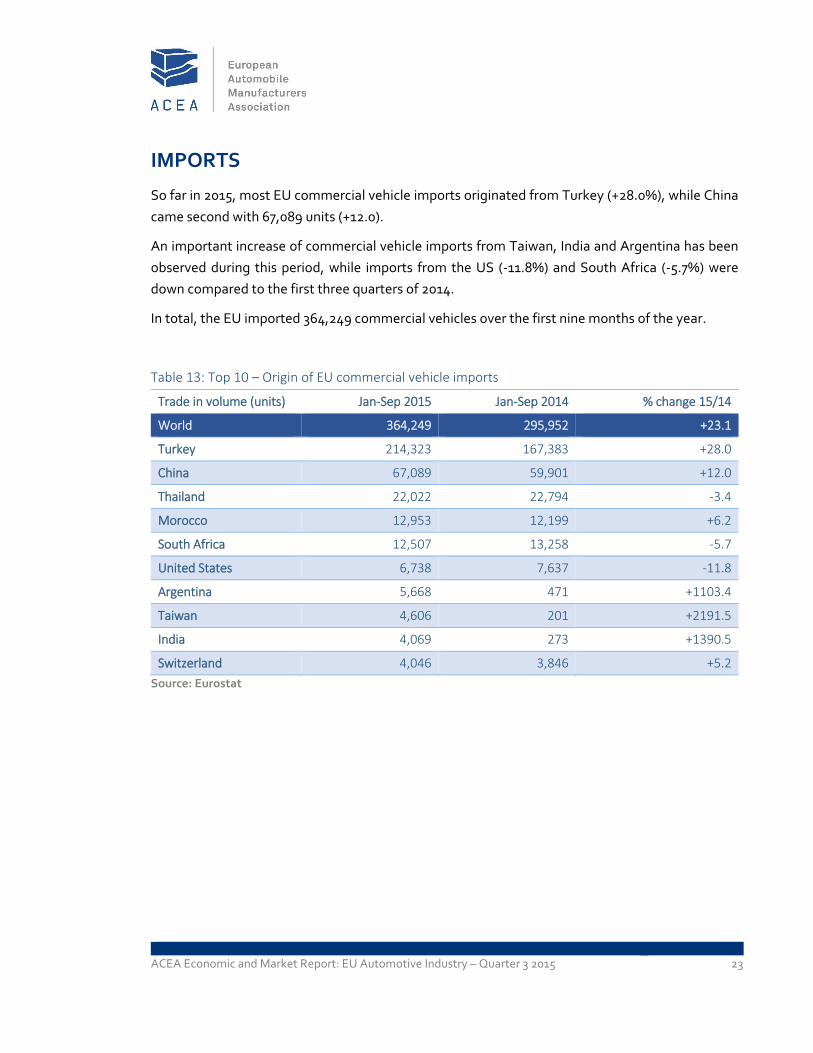
IMPORTS
So far in 2015, most EU commercial vehicle imports originated from Turkey (+28.0%), while China
came second with 67,089 units (+12.0).
An important increase of commercial vehicle imports from Taiwan, India and Argentina has been
observed during this period, while imports from the US (‐11.8%) and South Africa (‐5.7%) were
down compared to the first three quarters of 2014.
In total, the EU imported 364,249 commercial vehicles over the first nine months of the year.
Table 13: Top 10 – Origin of EU commercial vehicle imports
Trade in volume (units) Jan‐Sep 2015 Jan‐Sep 2014 % change 15/14
World 364,249 295,952 +23.1
Turkey 214,323 167,383 +28.0
China 67,089 59,901 +12.0
Thailand 22,022 22,794 ‐3.4
Morocco 12,953 12,199 +6.2
South Africa 12,507 13,258 ‐5.7
United States 6,738 7,637 ‐11.8
Argentina 5,668 471 +1103.4
Taiwan 4,606 201 +2191.5
India 4,069 273 +1390.5
Switzerland 4,046 3,846 +5.2
Source: Eurostat

ACEA Economic and Market Report: EU Automotive Industry – Quarter 3 2015 24
EXPORTS
From January to September 2015, EU commercial vehicle exports to Turkey (+57.8%) and especially
to the US (+426.6%) grew, the latter driven by the buses and coaches segment. At the same time,
exports to Algeria, Australia, Nigeria and EFTA countries declined in comparison with 2014.
Russia and Ukraine, traditionally key markets for EU commercial vehicle exports, disappeared from
the top 10 due to ongoing geopolitical tensions.
Significant growth was observed in exports to Jordan, Albania and Benin, contributing to the
general upturn in EU exports (+7.2%).
Table 14: Top 10 – Destinations of EU commercial vehicle exports
Trade in volume (units) Jan‐Sep 2015 Jan‐Sep 2014 % change 15/14
World 417,189 389,159 +7.2
Turkey 49,509 31,370 +57.8
United States 45,506 8,641 +426.6
Switzerland 21,328 21,879 ‐2.5
Norway 17,940 19,085 ‐6.0
Benin 15,040 2,832 +431.1
Algeria 14,482 23,878 ‐39.4
Australia 13,951 17,445 ‐20.0
Nigeria 13,552 18,582 ‐27.1
Albania 13,353 1,181 +1030.7
Jordan 12,549 4,969 +152.6
Source: Eurostat
ACEA Economic and Market Report: EU Automotive Industry – Quarter 3 2015 25
ABOUT ACEA
ACEA’s members are BMW Group, DAF Trucks, Daimler, Fiat Chrysler Automobiles,
Ford of Europe, Hyundai Motor Europe, Iveco, Jaguar Land Rover, Opel Group, PSA
Peugeot Citroën, Renault Group, Toyota Motor Europe, Volkswagen Group, Volvo Cars,
Volvo Group. More information can be found on www.acea.be.
ABOUT THE EU AUTOMOBILE INDUSTRY
Some 12.1 million people ‐ or 5.6% of the EU employed population ‐ work in the
sector.
The 3.1 million jobs in automotive manufacturing represent 10.4% of EU's
manufacturing employment.
Motor vehicles account for €396 billion in tax contribution in the EU15.
The sector is also a key driver of knowledge and innovation, representing
Europe's largest private contributor to R&D, with €41.5 billion invested annually.
European Automobile Manufacturers' Association – ACEA Avenue des Nerviens 85 | B‐1040 Brussels | www.acea.be T +32 2 732 55 50 | M +32 485 886 647 | F +32 738 73 10 | [email protected] | @ACEA_eu
Related Documents