Economic and Demographic Outlook for Michigan and Its Counties to 2035 February 12, 2008 George A. Fulton Donald R. Grimes Institute of Labor and Industrial Relations University of Michigan Final Results

Welcome message from author
This document is posted to help you gain knowledge. Please leave a comment to let me know what you think about it! Share it to your friends and learn new things together.
Transcript
Economic and Demographic Outlookfor Michigan and Its Counties to 2035
February 12, 2008
George A. FultonDonald R. Grimes
Institute of Labor and Industrial RelationsUniversity of Michigan
Final Results

Background on the Forecasts

• Today we are presenting to the MPOs and the stateregional planning organizations our final economicand demographic outlook for Michigan and its counties.
• This outlook updates our forecast from the previouscycle in 2003.
• The forecast is in partnership with MDOT and is theproduct of:
• The REMI economic and demographic forecasting andsimulation model
• The forecasting expertise of the U-M economists
• Comments and insights of a number of local MPOsand regional planning organizations
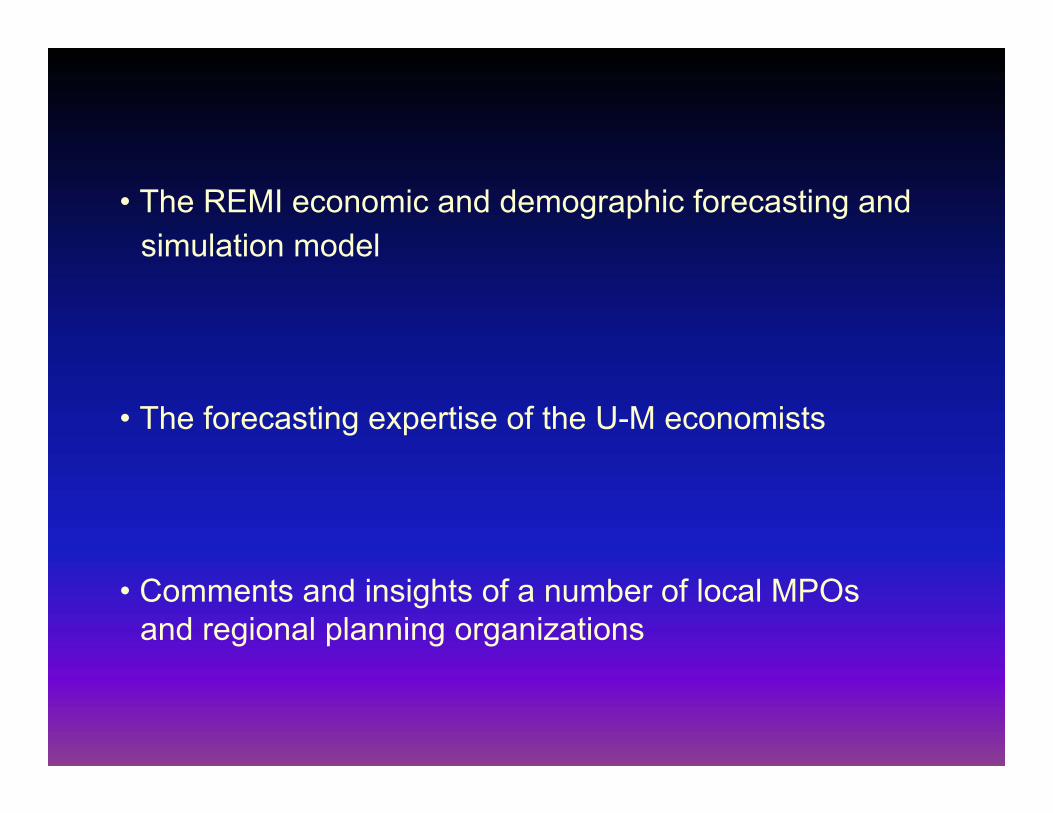
Long-term forecasts are intended to identify economictrends
●
— NOT to predict business cycle movements
Forecasts are unable to capture major one-time events●
— unless there is prior knowledge of the event andexternal information is directly introduced intothe forecast
— e.g., Google and Pfizer in Washtenaw County
General Observations on theState and County Forecasts for 2005–2035

• Some counties have special circumstances that causethem to deviate from the general trends—for example, acounty with a large college-age population.
General Observations on theState and County Forecasts for 2005–2035
• The long-term outlook for regions is governed by:
1. Prospects at the national level
2. Trends in productivity growth
3. The mix of industries within regions (e.g., growingservice sector, declining goods-producing sector)
4. Demographic trends
Fundamental Drivers in Michigan’sLong-term Outlook
1. The consequences of profound changes in theauto industry
2. The level of investment in other activities that showpromise for future growth and prosperity, and forwhich the region has supporting assets
3. The impact of the aging of the “baby-boomer”generation, and the migration patterns of theyounger and well-educated populace

Forecasts of Population for Michigan

9.6
9.8
10.0
10.2
10.4
10.6
10.8
11.0
11.2
’00 ’05 ’10 ’15 ’20 ’25 ’30 ’35
Millions
Actual
Michigan Population, 2000–2035
Long-term forecast
Short-term forecast
per+ 0.23%
yearper
– 0.10%
yearper
+ 0.35%
year
*2014 exceeds 2005
population level

– 600– 400– 200
0200400600800
1000
=+ + =+ +
2000–2005 2005–2010 2010–2035
Components of Population Changein Michigan
Net domestic migrationNet international migration
Natural change in populationTotal change in population
Thousands
=+ +

0%
5%
10%
15%
20%
25%
30%
35%
40%
0 to 24 25 to 44 45 to 64 65 plus
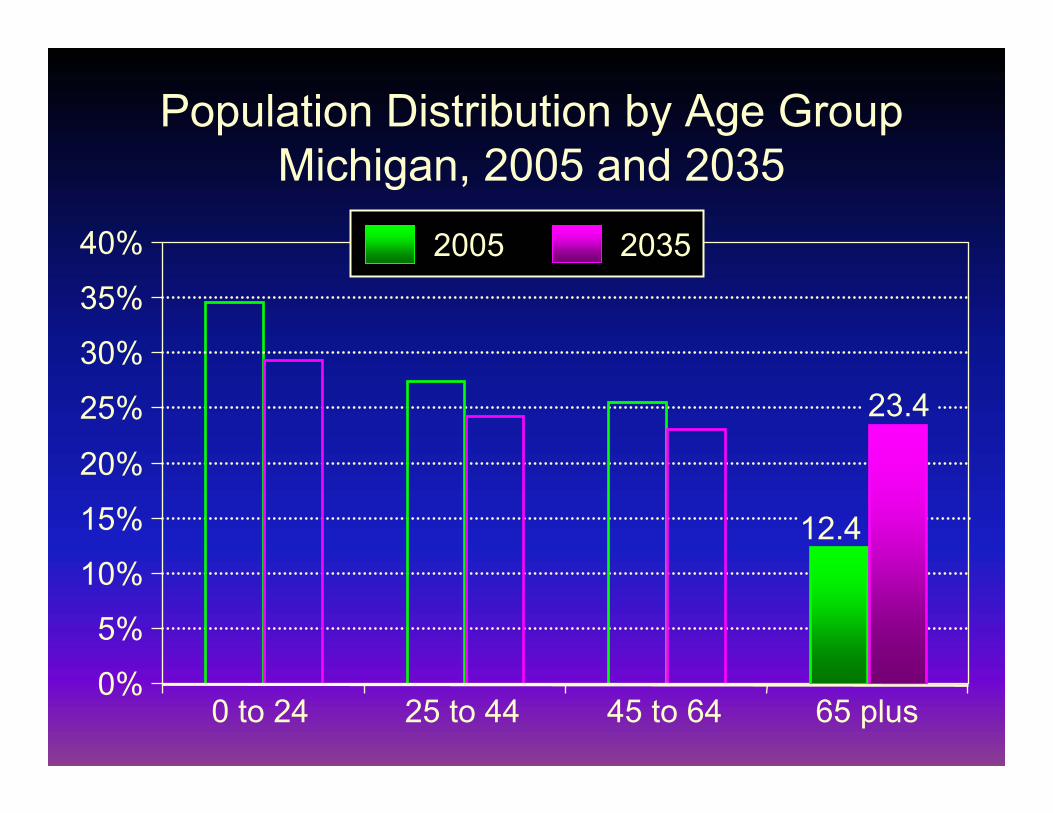
Population Distribution by Age GroupMichigan, 2005 and 2035
34.6
29.327.5
24.2 25.523.1
2005 2035
0%
5%
10%
15%
20%
25%
30%
35%
40%
0 to 24 25 to 44 45 to 64 65 plus
Population Distribution by Age GroupMichigan, 2005 and 2035
12.4
23.4
2005 2035

Forecasts of Employment for Michigan

5.305.355.405.455.505.555.605.655.705.755.80 Actual
’00 ’05 ’10 ’15 ’20 ’25 ’30 ’35
Millions
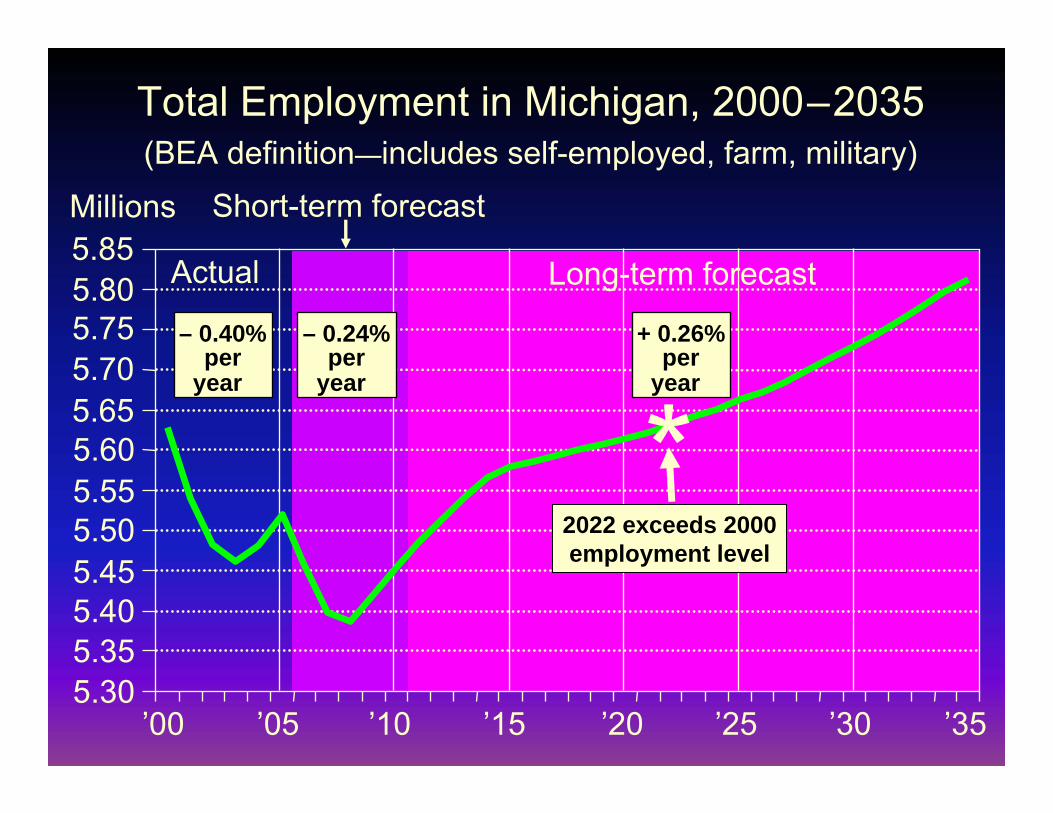
Total Employment in Michigan, 2000–2035(BEA definition—includes self-employed, farm, military)
per– 0.40%
year
5.85

–400,000
–300,000
–200,000
–100,000
0
100,000
200,000
300,000
–110,551
BEATotal
Employment
190,784
BEASelf-
employed
–301,335
BEAW & S
Employment
–286,400
BLSW & S
Employment
Change in Michigan Employment, 2000–2005
5.305.355.405.455.505.555.605.655.705.755.80 Actual Long-term forecast
’00 ’05 ’10 ’15 ’20 ’25 ’30 ’35
Millions
Total Employment in Michigan, 2000–2035(BEA definition—includes self-employed, farm, military)
Short-term forecast
per– 0.40%
year
5.85
per– 0.24%
yearper
+ 0.26%
year
*2022 exceeds 2000employment level

Total Employment in Michigan
5,629,498
2000 2005 2010 2035
2000–2005 2005–2010 2010–2035
5,812,239
+ 359,168
Change
5,453,071
– 65,876
– 13,175 + 14,367
5,518,947
– 110,551
– 22,110Avg. per year
Total change
Industry Employment Forecastsfor Michigan

High-Education Industries% of U.S.
Employmentwith Bachelor’sor More, 2000
Average for all industries 27.2%
Private education services 61.2%Professional & technical services 58.0%Management of companies 49.1%Information 39.1%Financial activities 36.0%Government 33.4%Health care, social assistance 32.7%
Average, all high-education industries$42,157
30,11168,82891,79854,62549,69343,40339,530
MichiganAverage
Wage2006
48,216
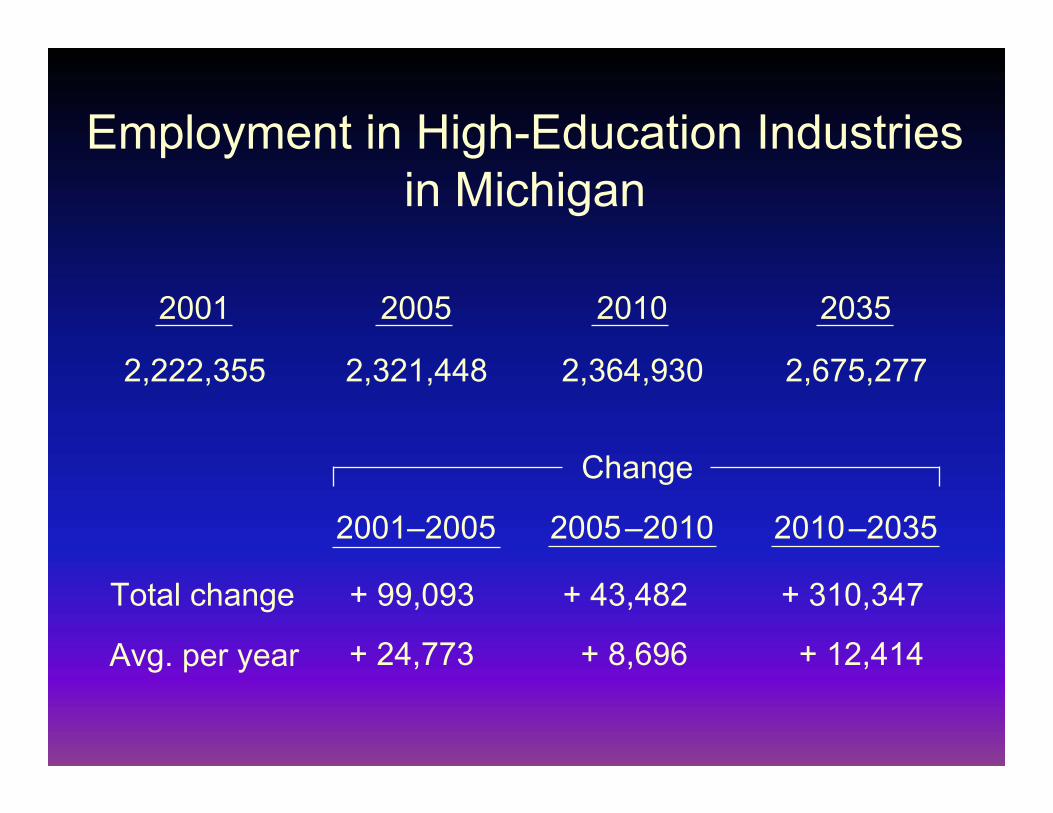
Employment in High-Education Industriesin Michigan
2,222,355
2001 2005 2010 2035
2001–2005 2005–2010 2010–2035
2,675,277
+ 310,347
Change
2,364,930
+ 43,482
+ 8,696 + 12,414
2,321,448
+ 99,093
+ 24,773Avg. per year
Total change

High-Education Industries in Michigan
Pvt. education svcs.Prof. & tech. svcs.Mgmt. of companiesInformationFinancial activitiesGovernmentHealth care,
social assistance
73,183366,306
68,84887,123
375,624699,496
551,775
2001High-ed. industries 2,222,355
’01–’05
19,105– 2,267– 1,558– 6,40948,933
– 12,367
53,656
99,093
3,37518,195– 1,361– 1,342
1,804– 26,529
49,340
43,482
’05–’10
15,795104,913
2,131– 4,75924,845
– 15,292
182,714
310,347
’10–’35Employment Change

Low-Education Industries
Average for all industries 27.2%
Arts, entertainment, recreation 26.4%Other services (repair, personal, civic) 19.5%Manufacturing 19.2%Trade, transportation, & utilities 16.4%Administrative services 15.5%Farm, natural resources, mining 13.7%Construction 9.7%Accommodation, food services 8.7%
Average, all low-education industries
% of U.S.Employment
with Bachelor’sor More, 2000
$42,15737,80726,13525,70058,07035,63831,24129,43646,56112,664
MichiganAverage
Wage2006
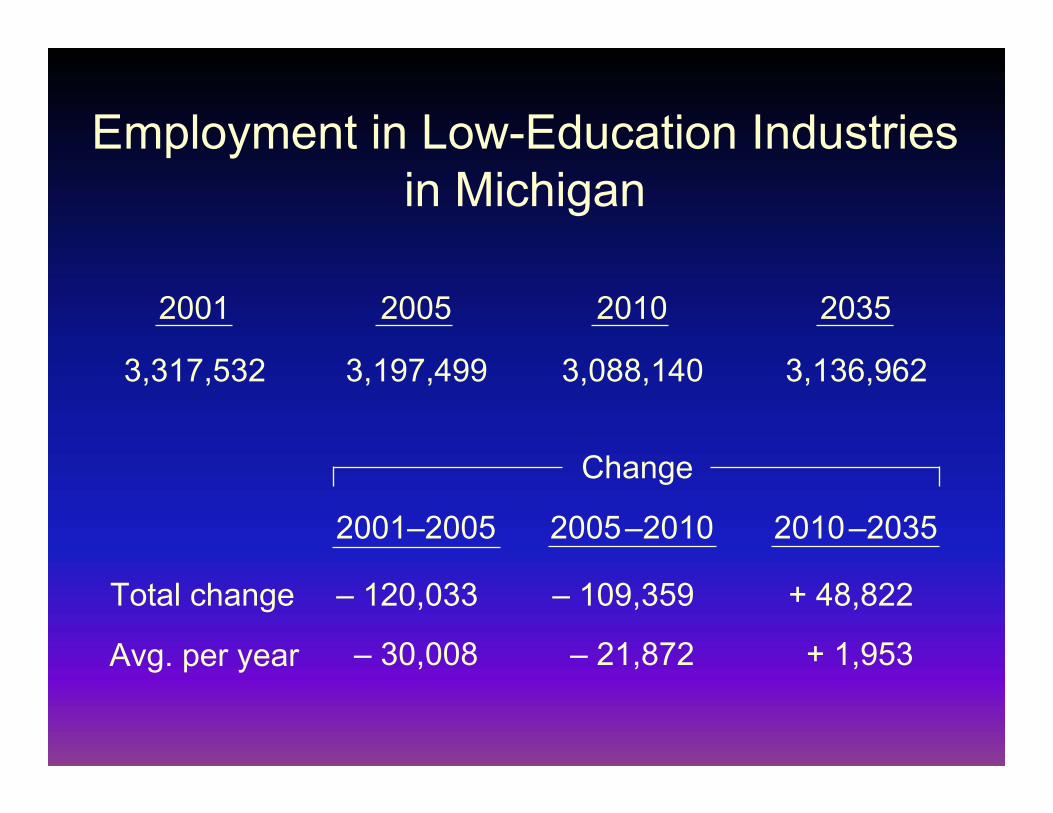
Employment in Low-Education Industriesin Michigan
3,317,532
2001 2005 2010 2035
2001–2005 2005–2010 2010–2035
Change
3,088,140
– 109,359
– 21,872
3,136,962
+ 48,822
+ 1,953
3,197,499
– 120,033
– 30,008Avg. per year
Total change

Low-Education Industries in Michigan
2001 ’01–’05 ’05–’10 ’10–’35
Employment Change
Arts, enter., rec.Other servicesManufacturingTrade, trans., util.Admin. servicesFarm, nat. res., miningConstructionAccommodation, food
Low-ed. industries
100,369285,445843,743
1,007,145322,152104,019304,276350,383
3,317,532
6,40613,638
–142,839–37,912
33,941–3,658–2,92313,314
–120,033
3,066–3,283
–74,382–22,158
17,744–4,708
–35,6119,973
–109,359
30,95216,162
–154,412–40,532107,167–23,161
26,72585,921
48,822

Educational Attainmentand the Local Economy
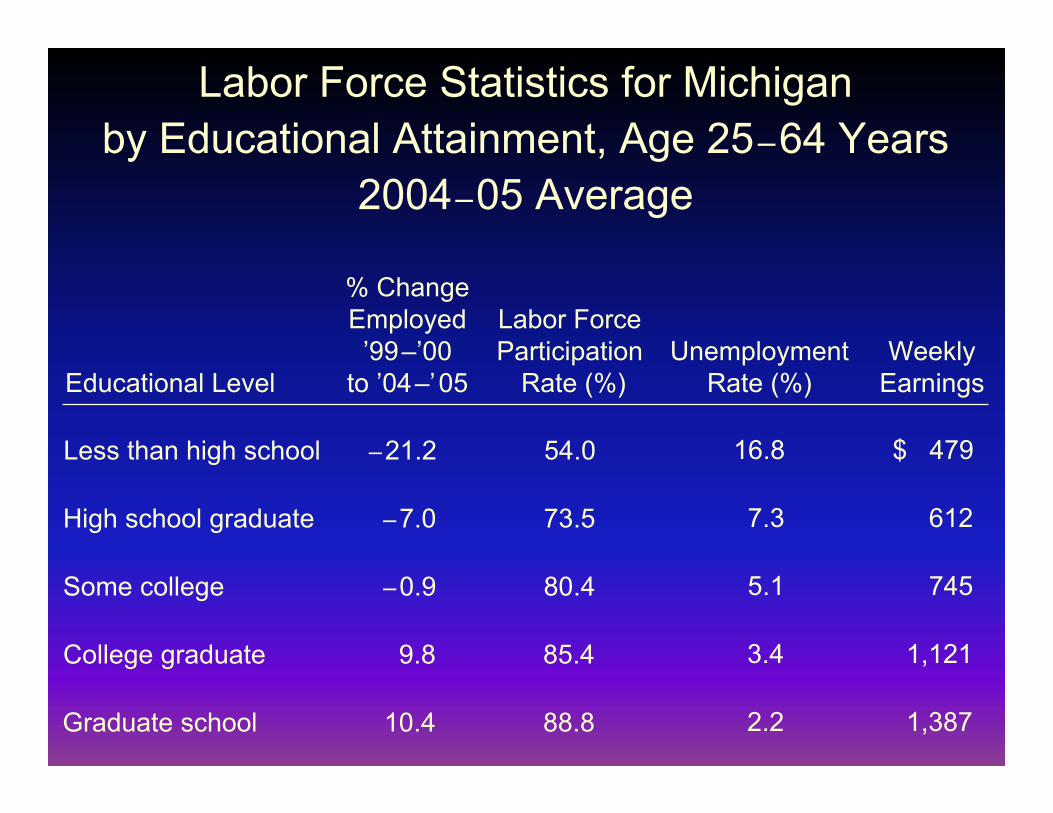
Labor Force Statistics for Michiganby Educational Attainment, Age 25–64 Years
2004–05 Average
% ChangeEmployed’99–’00
to ’04–’05
–21.2
–7.0
–0.9
10.4
9.8
Labor ForceParticipation
Rate (%)
54.0
73.5
80.4
88.8
85.4
UnemploymentRate (%)
16.8
7.3
5.1
2.2
3.4
WeeklyEarnings
$ 479
612
745
1,387
1,121
Less than high school
High school graduate
Some college
Graduate school
College graduate
Educational Level

0%5%
10%15%
20%25%
30%35%
40%
Percentage of Population Age 25 or Olderwith a Bachelor’s Degree or More
20062000
Michigan
Ohio
Pennsylvania
U.S.
Illinois
Georgia
Mass.
Minnesota
Washington

0%
10%
20%
30%
40%
50%
60%
Detroit
Cleveland
Philadelphia
U.S.
Chicago
Atlanta
Boston
Minneapolis
Seattle
Percentage of Population Age 25 or Olderwith a Bachelor’s Degree or More
20062000

Forecasts of Income and Householdsfor Michigan

0%
0.2%
0.4%
0.6%
0.8%
1%
1.2%
2001–2005 2005–2010 2010–2035
0.3%
0.8%
1.0%
Total Growth over the Interval1.3% 4.1% 29.2%
Average Annual Growth inMichigan Per Capita Income (2005 $)

Number of Households in Michigan2005–2035
2005–2035% Change
Total population 8.7%
Group quarters 32.3%
Population inhouseholds 8.2%
2005
10,100,833
224,190
9,876,643
2010
10,057,256
227,781
9,829,475
2035
10,982,682
296,548
10,686,134
Households 20.0%
Average household size
3,863,662
2.56 NA
3,981,427
2.47
4,635,109
2.31

Distribution of Michigan Householdsby Size, 2005 and 2035
0%5%
10%15%20%25%30%35%40%
1 2 3 4 5+Number of persons in household
2035200526.4
30.433.8
36.0
16.014.1 13.811.3 10.0
8.2

County Population andEmployment Forecasts

Change in Populationby Michigan County
2005–2035
Growth > statewide average
Growth < statewide average
Decline
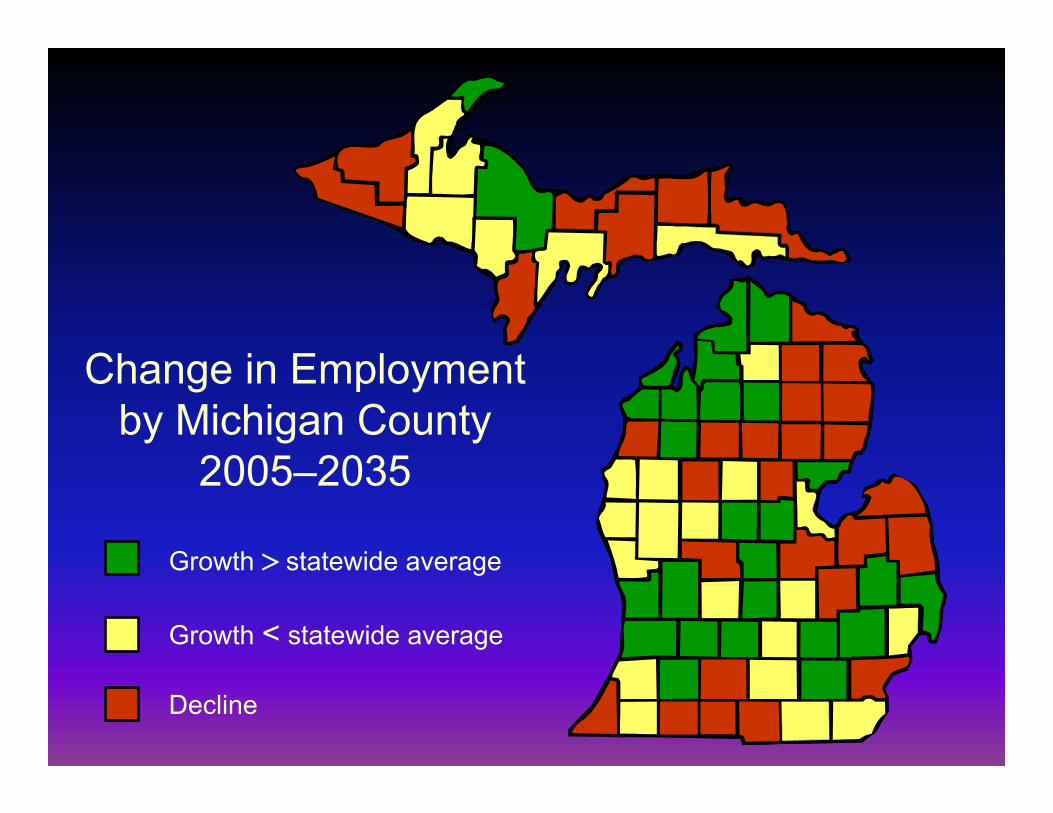
Change in Employmentby Michigan County
2005–2035
Growth > statewide average
Growth < statewide average
Decline

Change in Employmentby Michigan County
2005–2035
Growth > twice statewide average
Rest of state
Summary and Conclusions
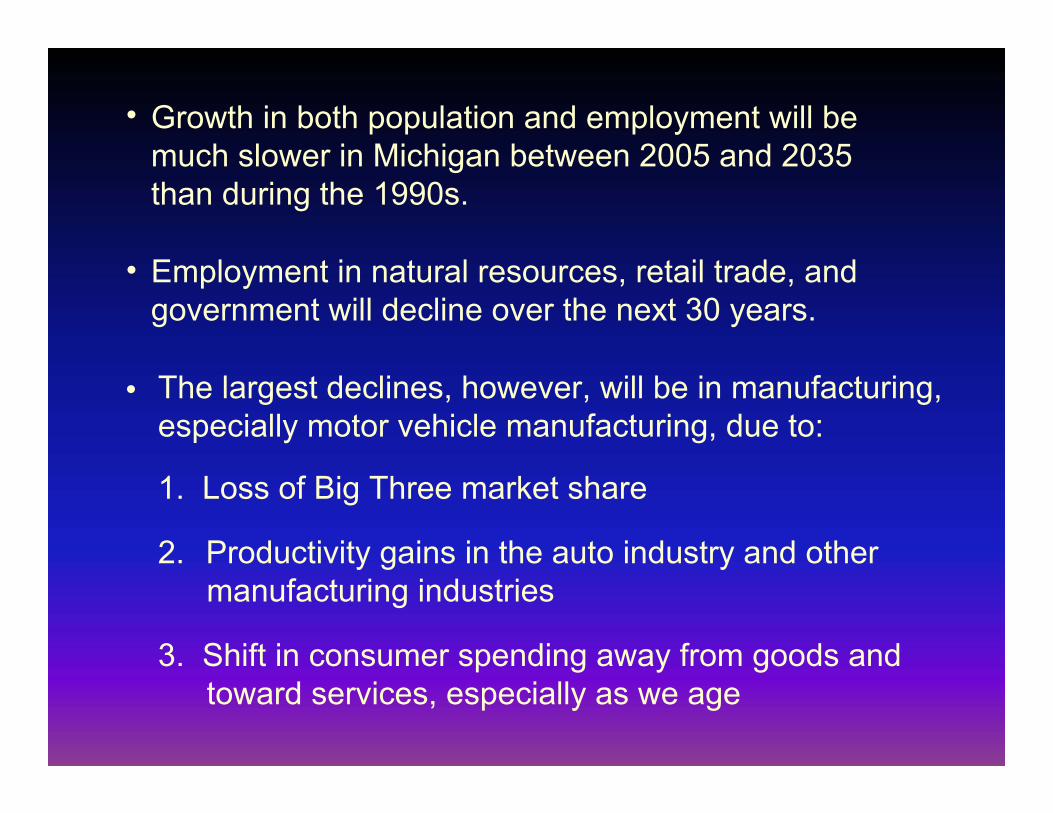
Employment in natural resources, retail trade, andgovernment will decline over the next 30 years.
●
Growth in both population and employment will bemuch slower in Michigan between 2005 and 2035than during the 1990s.
●
The largest declines, however, will be in manufacturing,especially motor vehicle manufacturing, due to:
●
1. Loss of Big Three market share
2. Productivity gains in the auto industry and othermanufacturing industries
3. Shift in consumer spending away from goods andtoward services, especially as we age
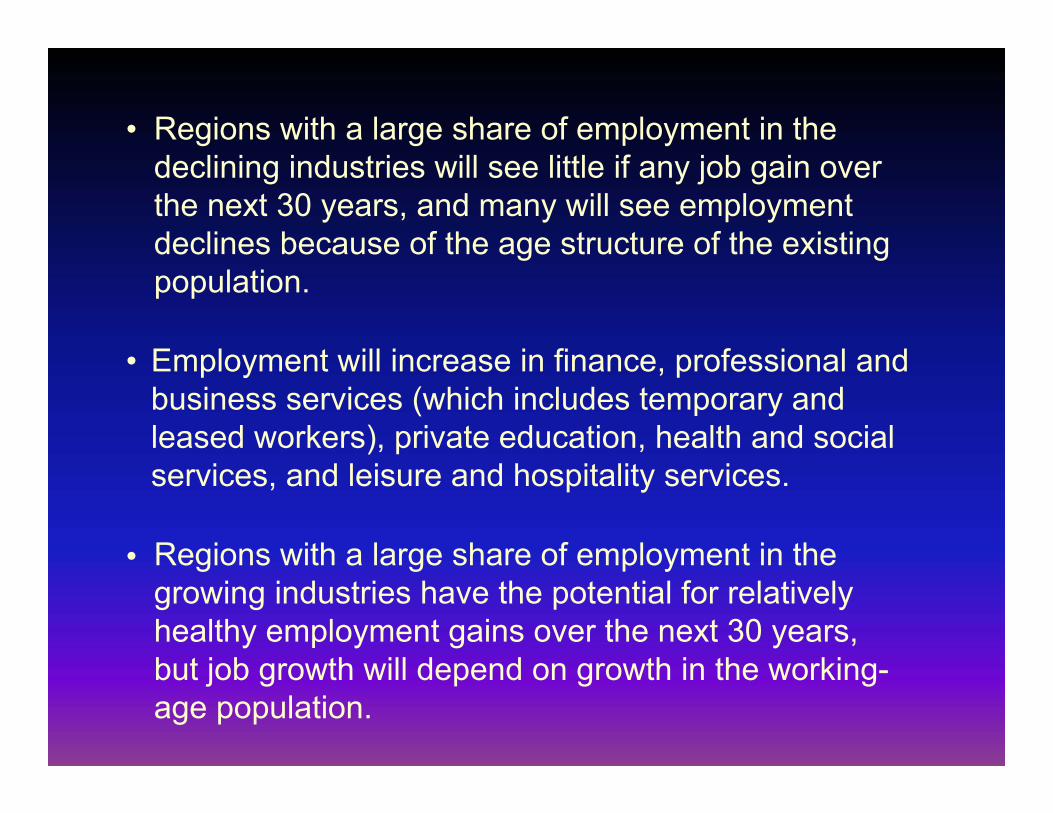
Regions with a large share of employment in thedeclining industries will see little if any job gain overthe next 30 years, and many will see employmentdeclines because of the age structure of the existingpopulation.
●
Regions with a large share of employment in thegrowing industries have the potential for relativelyhealthy employment gains over the next 30 years,but job growth will depend on growth in the working-age population.
●
Employment will increase in finance, professional andbusiness services (which includes temporary andleased workers), private education, health and socialservices, and leisure and hospitality services.
●
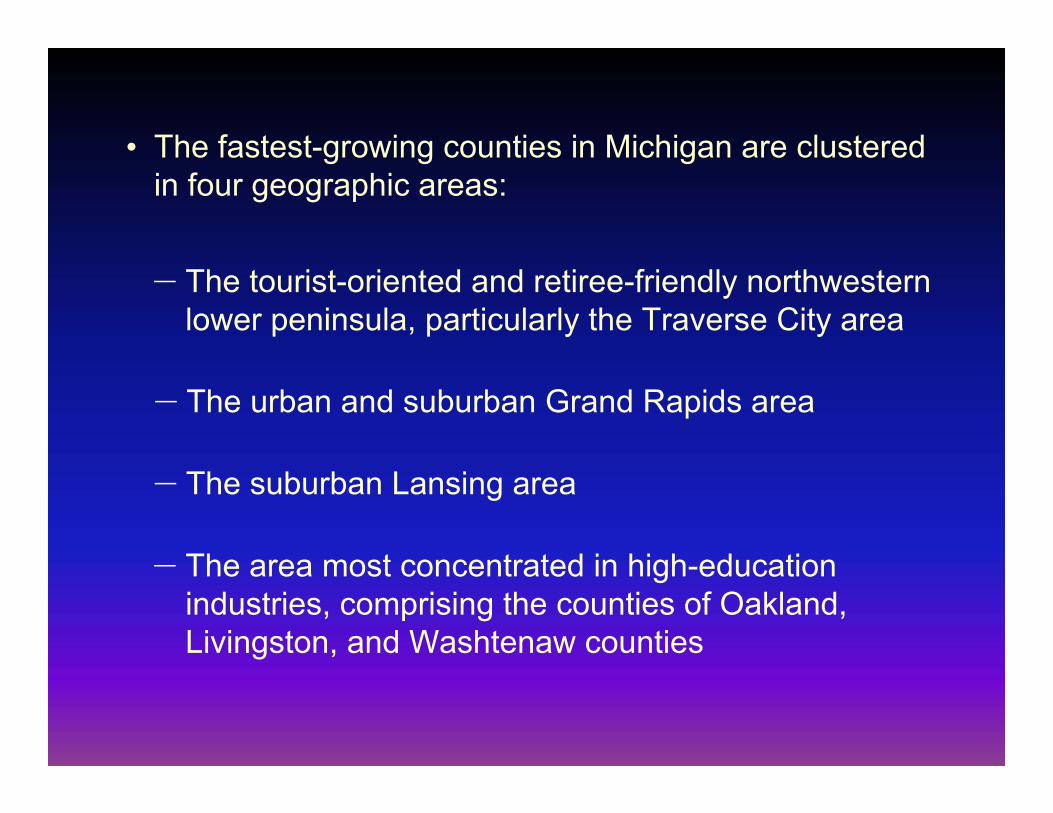
The fastest-growing counties in Michigan are clusteredin four geographic areas:
●
The tourist-oriented and retiree-friendly northwesternlower peninsula, particularly the Traverse City area
—
The urban and suburban Grand Rapids area—
The suburban Lansing area—
The area most concentrated in high-educationindustries, comprising the counties of Oakland,Livingston, and Washtenaw counties
—

Although the slowest-growing counties in Michigan arescattered throughout the state, there are three generalareas of greater concentration:
●
The rural areas of the Upper Peninsula—
The area along the shores of Lake Huron—
The strip of counties along the state’s southernborder
—
We are getting much older. By 2035, more than23 percent of Michigan’s residents will be 65 orolder.
●
Compare this with the situation in Florida today.In the state known as “God’s waiting room,”17 percent of the residents are 65 or older.
●
Total population in Michigan increases by 8.7 percentbetween 2005 and 2035.
●
Group home population increases by 32.3 percentover this period as the aging population enters assistedliving facilities, including nursing homes.
●

Average household size is declining because olderresidents tend to live in smaller-sized households.Except as related to age, we have not made any otherassumptions about household size preferences.
●
The population living in households increases by 8.2percent, but the number of households increases by20 percent.
●
Inflation-adjusted incomes will increase over time, butMichigan’s economic position will be determined byits residents’ level of education.
●
Despite sluggish job growth over the forecast period,healthy aggregate productivity growth leads to a risingstandard of living.
●

The knowledge-based economy, and the educated workers who fuel it, are the fulcrum of futureprosperity in Michigan.
●
Michigan and its communities need to invest in programsto provide the education and training essential for theeconomy of the future.
●
Opportunities for Economic Developmentin Michigan
Bill Gates observed that for knowledge-basedenterprises, educational attainment trumps everythingwhen they’re deciding where to invest.
●
Among activities with fewer educational requirements, the hospitality industry shows promise for the future,providing services to visitors as well as to a growingnumber of older people.
●
Support personnel for industries with the most favorablegrowth prospects—health care and professional/technical services—require skills but often notprofessional degrees.
●
Other actions may show promise for the economicwell-being of the state, but none is more compellingthan investing in workforce development.
●
Opportunities for Economic Developmentin Michigan

UNIVERSITY OF MICHIGANUNIVERSITY OF MICHIGAN
www.ilir.umich.edu/lmr/
Related Documents