Spring 2018 ECONOMIC AND BUDGET OUTLOOK Assessing Ontario’s Medium-term Budget Plan

Welcome message from author
This document is posted to help you gain knowledge. Please leave a comment to let me know what you think about it! Share it to your friends and learn new things together.
Transcript

Spring 2018
ECONOMIC AND BUDGET OUTLOOK Assessing Ontario’s Medium-term Budget Plan
Financial Accountability Office of Ontario | 2 Bloor Street West, Suite 900, Toronto, ON M4W 3E2 | fao-on.org | [email protected] 416-644-0702 | This document is also available in an accessible format and as a downloadable PDF on our website. Photo credit: © Can Stock Photo / balounm
About this DocumentEstablished by the Financial Accountability Officer Act, 2013, the Financial Accountability Office (FAO) provides independent analysis on the state of the Province’s finances, trends in the provincial economy and related matters important to the Legislative Assembly of Ontario.
The FAO’s Economic and Budget Outlook (EBO) reports are released each spring and fall, providing an assessment of the province’s medium-term economic performance and fiscal position. This report also provides the FAO’s assessment of the reasonableness and risks associated with the government’s fiscal recovery plan presented in the 2018 Budget.
This report was prepared by Nicolas Rhodes, Luan Ngo and Edward Crummey, with contributions from Matt Gurnham and Andy Tran, under the direction of David West. External reviewers were provided with earlier drafts of this report for their comments. However, the input of external reviewers implies no responsibility for this final report, which rests solely with the FAO.
The content is based on information available to April 6, 2018. Background data used in this report are available upon request.
In keeping with the FAO’s mandate to provide the Legislative Assembly of Ontario with independent economic and financial analysis, this report makes no policy recommendations.
FAO’s Fiscal Projections
The FAO forecasts provincial finances based on projections of existing and announced revenue and spending policies. The forecast represents the FAO’s view of the most likely fiscal outcomes given existing policies, without anticipating any new government policy decisions. The FAO’s tax revenue projections are based on an assessment of the outlook for the provincial economy and current tax policies. Given the govern-ment’s discretion over spending, the FAO adopts the government’s announced spending plans from fiscal documents and incorporates policy announcements as appropriate. Beyond the government’s published spending projections, the FAO forecasts spending based on the outlook for underlying cost drivers including demographics and price inflation.
ISSN 2561-6404 (Print) ISSN 2561-6412 (Online)
© Queen’s Printer for Ontario, 2018

Table of Contents
1 | Summary 1FAO Projects Sharp Increase in Budget Deficit 1
2 | Economic Outlook 5Overview 5 Global Economic Growth Improves 6 U.S. Economy Expected to Strengthen in 2018 7 Canadian Economic Growth to Moderate 8 Ontario Economic Outlook 10 Key Risks to the Ontario Outlook 13
3 | Medium-term Budget Outlook 15FAO Projects Budget Deficit to Increase Sharply 15 Revenue Outlook 16 Spending Outlook 19 Budget Balance 23
4 | Extended Budget Outlook 25Assessing the 2018 Budget’s Fiscal Recovery Plan 25 Revenue Outlook 27 Spending Outlook 28 Budget Balance 31 The Implications of Ontario’s Elevated Debt Burden 32 Budget Sensitivities 35
5 | Appendices 36Forecast Tables 36


Summary 1
1 | Summary
FAO Projects Sharp Increase in Budget DeficitIn 2017-18, the FAO estimates that Ontario will record a budget deficit of $3.6 billion, consistent with the Auditor General’s recommended accounting treatment for net pension assets and the Fair Hydro Plan.
For 2018-19, the FAO projects that Ontario’s budget deficit will increase sharply to $11.8 billion, the result of higher spending from the 2018 Budget combined with only a weak gain in revenue. Going forward, the FAO projects a continued deterioration in Ontario’s budget, with the deficit reaching $12.7 billion by 2020-21.
Ontario budget balance deteriorates significantly
-8.1 -7.2-6.1
-3.7 -5.2 -6.5
-5.0
-2.4-3.6
-11.8-12.4 -12.7
-14
-12
-10
-8
-6
-4
-2
-2015-16 2016-17 2017-18 2018-19 2019-20 2020-21
Historical Forecast
($ B
illio
ns)
Impact of 2018 Budget Measures
Budget Balance -Excluding 2018 Budget Measures
Budget Balance - FAO - Spring 2018
Note: The budget balance excludes the reserve and is presented on the Auditor General’s recommended accounting basis. Source: Ontario Public Accounts, 2018 Ontario Budget and FAO.
Over the past four years, the Ontario economy has shown significant strength, primarily due to strong gains in household spending and residential investment. Most economic forecasters, including the FAO, expect this robust pace of growth will moderate somewhat over the next few years as rising interest rates, combined with high levels of household debt, slow the growth of household spending. The slower

2 Financial Accountability Office of Ontario | Economic and Budget Outlook
pace of economic growth results in more modest growth in Ontario’s revenues, which in turn, contributes to Ontario’s worsening budget deficit.
Importantly, the FAO estimates that Ontario was facing an $8.1 billion deficit in 2018-19 prior to the introduction of the 2018 Budget.
In this context, the government introduced the 2018 Budget which included a broad range of new public spending initiatives. While many of these new programs would provide significant social and economic benefits for Ontarians, the government has not raised adequate revenue to pay for them, adding to continued deficits over the outlook.
Large, on-going deficits will contribute to a steady increase in Ontario’s debt over the next three years. The FAO projects that Ontario’s net debt will increase by almost $70 billion, reaching $394 billion in 2020-21, pushing the net debt-to-GDP ratio to 42 per cent, well above today’s ratio of 39 per cent.
To address the budget deficit, the government introduced a ‘fiscal recovery plan’ which projects a balanced budget by 2024-25, based on restricting the growth in program spending. The fiscal recovery plan provides few policy specifics, but assumes that the government will dramatically cut spending growth from an average of 4.2 per cent over the next three years, to just 2.1 per cent from 2020-21 to 2025-26.
Based on the FAO’s analysis, severely restraining the growth in program spending, below the pace of population growth and price inflation, could lead to a balanced budget by 2025-26. However, this plan implies that the Province would have to lower spending by approximately $15 billion, or eight per cent, by 2025-26.
Even with the significant spending restraint planned by the government in the 2020s, Ontario’s debt burden would remain elevated, and the Province would miss its 2023-24 net debt-to-GDP target by a wide margin.

Summary 3
The Province will not meet its 2023-24 net debt-to-GDP target
39.1
42.0 42.7
40.8
35.0 34
36
38
40
42
44
46
2013
-14
2014
-15
2015
-16
2016
-17
2017
-18
2018
-19
2019
-20
2020
-21
2021
-22
2022
-23
2023
-24
2024
-25
2025
-26
Historical Forecast
Net
Deb
t-to
-GD
P Ra
tio (P
er C
ent)
Province will miss its netdebt-to-GDP target by at
least 7 percentage points
Note: Projection incorporates the Auditor General’s recommended accounting treatment of the Fair Hydro Plan and net pension assets. Source: 2018 Ontario Budget, Ontario Public Accounts and FAO.
The 2018 Budget postpones deficit recovery, leading to the accumulation of additional debt into the 2020s when demographic pressures on the budget will intensify. This additional debt will increase the challenge of stabilizing Ontario’s public finances, shift the burden from the baby boom generation to younger Ontarians, and would leave future governments with less flexibility to respond to future crises, including recessions.
Alternate fiscal plans that address the deficit would also involve difficult trade-offs. Raising revenue leaves less money for households to spend and businesses to invest, and would contribute to the already moderating pace of economic growth.
However, achieving continued spending restraint may be more difficult in the coming years. The government has been limiting spending growth since 2010, and many public services are currently facing budget pressures.


Economic Outlook 5
2 | Economic Outlook
Overview Over the past four years1, the Ontario economy recorded the strongest pace of growth since the early 2000s, with real GDP increasing by an average of 2.7 per cent per year. Over this period, strong gains in household spending and residential investment were the primary drivers of economic growth.
Consistent with the strong economy, Ontario job growth surged last year, with 128,400 net new jobs (+1.8 per cent), the largest annual employment increase since 2003. The strong job gain helped lower Ontario’s unemployment rate to 6.0 per cent in 2017, the lowest annual rate since 2000.
Most economic forecasters, including the FAO, expect this robust pace of growth to moderate somewhat over the next few years. The FAO is forecasting average real GDP growth of 1.9 per cent per year from 2017 to 2022, as rising interest rates, combined with high levels of household debt, slow the growth of household spending. The FAO’s current economic outlook for Ontario is also broadly consistent with the FAO’s fall forecast.
Nominal GDP – the broadest measure of the tax base – increased 4.5 per cent in 2017, driven by a strong gain in corporate profits. The FAO expects overall nominal GDP growth to return to a more moderate 4.2 per cent pace in 2018 and average 4.0 per cent over the remainder of the economic outlook.
1 From 2013 to 2017.

6 Financial Accountability Office of Ontario | Economic and Budget Outlook
Economic growth to moderate after four years of strong growth
2.72.2 2.0 1.9 1.9 1.9
4.54.2 4.1 4.1
3.9 3.9
0.0
1.0
2.0
3.0
4.0
5.0
2017* 2018 2019 2020 2021 2022Forecast
Ont
ario
GD
P Gr
owth
(Per
Cen
t)
Real Nominal
* 2017 are estimates. Source: Statistics Canada, Ontario Economic Accounts and FAO.
As was the case for the FAO’s fall report2, the key risks to Ontario’s economic outlook continue to include weaker than expected exports and business investment given the rise in protectionist trade policies in the US, as well as a more pronounced slowing in consumer spending and residential construction, reflecting the elevated level of household debt (see ‘Key Risks‘ section).
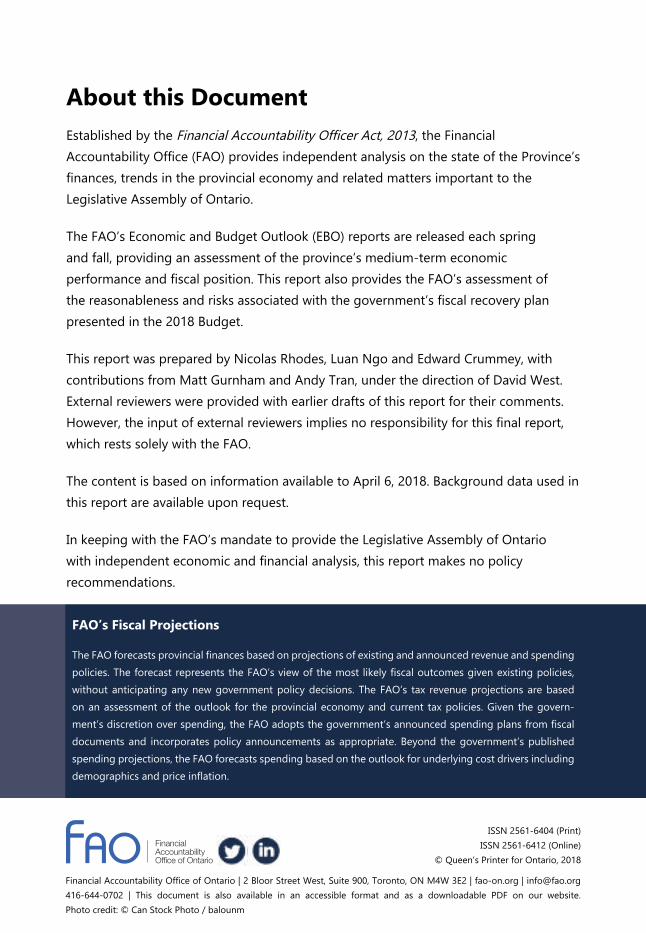
Global Economic Growth ImprovesThe global economy posted solid, broad-based growth of 3.7 per cent in 2017, up from 3.2 per cent in 2016.3 The International Monetary Fund (IMF) expects the current economic momentum to carry forward into 2018 and 2019, with global growth of 3.9 per cent projected for both years.
The IMF estimates that advanced economies grew by a solid 2.3 per cent in 2017. In its latest report, the IMF revised up the outlook for most advanced economies, based on the expectation that favourable conditions will continue to support stronger business investment.4
Growth in emerging market and developing economies is also expected to accelerate slightly over the next two years. While the IMF expects Chinese economic growth to moderate, the forecast for the Indian economy has improved.
2 See the FAO’s Economic and Fiscal Outlook, Fall 2017 Update. 3 World Economic Outlook Update, January 2018, International Monetary Fund. 4 Global Economic Prospects: Broad-Based Upturn, but for How Long? – Chapter 1, January 2018, World Bank.
Economic Outlook 7
Global growth to accelerate in 2018 and 2019
0
1
2
3
4
5
6
7
2011 2012 2013 2014 2015 2016 2017 2018 2019
Historical Forecast
Real
GD
P Gr
owth
(Per
Cen
t)
WorldAdvanced economies
Emerging market and developing economies
Source: International Monetary Fund, World Economic Outlook Update, January 2018.
U.S. Economy Expected to Strengthen in 2018The United States posted real GDP growth of 2.3 per cent in 2017, driven by solid household consumption, business investment and exports.
US to grow strongly in the next two years
2.9
1.5
2.3
2.6
2.3
2.0 2.0 1.9
0.0
0.5
1.0
1.5
2.0
2.5
3.0
3.5
2015 2016 2017 2018 2019 2020 2021 2022Forecast
US R
eal G
DP
Grow
th (P
er C
ent)
HistoricalSource: US Bureau of Economic Analysis, Conference Board of Canada, Bank of Canada and FAO.

8 Financial Accountability Office of Ontario | Economic and Budget Outlook
Significant changes to the US tax system, coupled with Congress’s recent $1.3 trillion spending plan5 should provide strong support for US domestic demand in the short-term. This fiscal policy stimulus combined with the upswing in the global economy will result in a temporary boost to US growth, with real GDP projected to increase by 2.6 per cent and 2.3 per cent, over the next two years.
Beyond 2019, the boost from fiscal stimulus will fade, while US interest rates are expected to continue rising, slowing economic growth over the outlook.
Canadian Economic Growth to ModerateThe Canadian economy grew by 3.0 per cent in 2017, the strongest annual gain since 2011. Growth was driven by household spending, particularly durable goods, and residential investment. Despite the strong overall growth, Canada’s export performance disappointed.
Over the outlook, real GDP growth is expected to moderate, averaging 2.0 per cent, as the Bank of Canada gradually raises its policy interest rate, contributing to slower growth in household consumption and residential investment. However, strong global demand is expected to boost Canadian business investment and exports, assuming that current trade tensions are resolved positively (see the ‘Key Risks’ section for more details).
Canada growth expected to moderate following surge in 2017
1.0
1.4
3.0
2.12.0 2.0 2.0 1.9
0.0
0.5
1.0
1.5
2.0
2.5
3.0
3.5
2015 2016 2017 2018 2019 2020 2021 2022Forecast
Cana
da R
eal G
DP
Grow
th (P
er C
ent)
Historical
Source: Statistics Canada and FAO.
5 Rules Committee Print 115-66, the Consolidated Appropriations Act, 2018, Congressional Budget Office.

Economic Outlook 9
In recent public statements6, the Bank of Canada noted that strong economic growth in 2017 pushed the Canadian economy close to its production capacity, putting upward pressure on wages and prices.
As a result, the Bank increased its policy interest rate twice in 2017 and once so far in 2018. Going forward, the Bank has indicated that it will continue to gradually and cautiously increase interest rates, depending on the strength of new economic data.7
Given the Bank’s cautious approach to rate setting, and the current economic and inflation outlook for Canada, the FAO continues to expect a gradual but steady rise in interest rates over the outlook.
Interest rates to increase gradually over outlook
0.7
2.9
1.8
3.5
0.0
0.5
1.0
1.5
2.0
2.5
3.0
3.5
4.0
4.5
Historical Forecast
(Per
Cen
t)
3-month Treasury Bill Rate
10-year Government of Canada Bond Yield
Source: Statistics Canada and FAO.
The Canadian dollar exchange rate averaged 77 cents (US) in 2017. Over the outlook, the FAO projects that the dollar will remain relatively steady, reaching 78 cents (US) by 2022.
6 Remarks by Timothy Lane, Deputy Governor of the Bank of Canada, March 8, 2018.7 Bank of Canada Press Release, March 7, 2018.

10 Financial Accountability Office of Ontario | Economic and Budget Outlook
Ontario Economic OutlookGrowth Expected to Ease
Ontario real GDP grew by a strong 2.7 per cent in 2017, driven primarily by household spending and residential investment. While household spending and residential investment have been the primary sources of overall economic growth since 2012, both lost momentum in the second half of 2017.8
Rising debt service payments – a reflection of high debt loads and interest rate increases - will lead to slower growth in household spending and residential investment over the outlook.9 At the same time, exports and business investment are expected to pick-up given the strong US economy, new trade agreements,10 and the need for Ontario businesses to expand production capacity to meet higher demand. Overall, the FAO projects real GDP growth to slow to 2.2 per cent in 2018 and average 1.9 per cent over the remainder of the economic outlook.
Economic growth expected to become more balanced over outlook
2.7
3.2
2.01.91.8
2.3
0.0
1.0
2.0
3.0
4.0
Real GDP Household Spending andResidential Investment
Exports and BusinessInvestment*
Aver
age
Annu
al G
row
th (P
er C
ent)
2013 to 2017 2017 to 2022
* Business Investment includes both Non-Residential Investment and Machinery & Equipment Investment.Source: Statistics Canada, Ontario Economic Accounts and FAO.
The FAO’s forecast is broadly consistent with the outlook of most economic forecasters and largely in-line with the FAO’s fall economic outlook.
8 Consumption and residential investment have accounted for over 50 per cent of real economic growth since 2012.9 The strong growth of Ontario’s housing sector was more subdued following the introduction of the Fair Housing
Plan in April of 2017. As well, stricter mortgage qualification rules introduced by the Office of the Superintendent of Financial Institutions (OSFI) at the start of 2018 are expected to further reduce housing demand.
10 Foreign exporters are expected to benefit from the introduction of the Comprehensive Economic and Trade Agreement (CETA) and the Comprehensive and Progressive Agreement for Trans-Pacific Partnership (CPTPP).

Economic Outlook 11
Income Growth Also Expected to Moderate
Total economy-wide income (as measured by nominal GDP) grew by 4.5 per cent in 2017, driven by a significant increase in corporate profits. Labour income posted a more moderate gain of 3.7 per cent in 2017. The increase in the minimum wage in 2018 and the planned increase for 2019 are expected to strengthen labour income growth in these years. Beyond 2019, labour income growth is expected to moderate, partially reflecting a gradual slowing in the growth of Ontario’s labour force.
From 2018 to 2022, nominal GDP growth is projected to average 4.0 per cent per year.
Labour income to lead nominal GDP growth in 2018
4.5 4.23.7
5.3
9.9
2.4
0
2
4
6
8
10
12
2017 2018 2019 2020 2021 2022Forecast
Grow
th (P
er C
ent)
Nominal GDP Labour Income Corporate Income
Estimate
Note: Labour and corporate income comprise roughly 65 per cent of nominal GDP. The other categories include mixed income (from proprietorships) and net taxes. Source: Statistics Canada, Ontario Economic Accounts and FAO.
Steady Job Gains in Ontario’s Labour Markets
The Ontario economy created 128,400 net new jobs in 2017, the largest annual job gain since 2003, while the annual unemployment rate dropped to 6.0 per cent, the lowest rate since 2000. The majority of the job gains last year were full-time, private sector positions. The service sector added 114,000 positions, while the goods sector (led by solid employment gains in manufacturing industries) added 14,500 new jobs.

12 Financial Accountability Office of Ontario | Economic and Budget Outlook
Employment growth eased in the first quarter of 2018, with 110,300 jobs created on a year-over-year basis. Over the forecast, the FAO is projecting average annual job growth of 1.1 per cent, consistent with the outlook for continued but more modest economic growth.
Steady employment gains over outlook
128.4
63.5
6.0
5.9
0
1
2
3
4
5
6
7
8
9
0
20
40
60
80
100
120
140
2011 2012 2013 2014 2015 2016 2017 2018 2019 2020 2021 2022Historical Forecast
Unem
ploy
men
t Rat
e (P
er C
ent)
Job
Gain
s (T
hous
ands
)
Net Employment Gains (left) Unemployment Rate (right)
Source: Statistics Canada and FAO.
Sustained economic growth over the outlook, combined with recent increases to the minimum wage are expected to support labour force growth. The projections for the labour force and employment are expected to keep the unemployment rate roughly stable over the outlook.
An Extended Outlook for Ontario
The FAO’s economic outlook covers the five-year period from 2018 to 2022. However, to assess the government’s ‘fiscal recovery plan’ which projects a balanced budget by fiscal year 2024-25, the economic outlook was extended by an additional three years to 2025, based on the FAO’s latest long-term economic projection.11
11 ‘Long-term Budget Outlook, Fiscal Implications of the Coming Demographic and Economic Changes in Ontario’, Fall 2017, Financial Accountability Office of Ontario.

Economic Outlook 13
Summary of the FAO’s economic outlook
(Per Cent Growth) Historical 2013-2017
Forecast 2017-2022
Extended Forecast 2022-2025
Nominal GDP 4.5 4.0 3.9Real GDP 2.7 1.9 2.0Labour Force 0.7 1.1 0.8Employment 1.1 1.1 0.8
Unemployment Rate* 6.8 5.9 5.9
Population 1.1 1.2 1.1CPI Inflation 1.7 2.1 2.0
* Unemployment Rate is presented as the average rate for the period.Source: Statistics Canada and FAO.
Key Risks to the Ontario OutlookThe FAO’s current economic forecast is a reasonable outlook for the Ontario economy and an appropriate foundation for fiscal projections. However, several key risks could materialize, with implications for the outlook.
Protectionist Trade Policies in the United States
Most economic forecasters continue to assume that existing global trade arrangements will remain in place over the outlook. However, the US administration’s recent decision to impose tariffs on a broad cross-section of Chinese imports combined with the Chinese government’s retaliatory response, present a serious risk for the global economy. In addition, the current renegotiation of the North American Free Trade Agreement (NAFTA) also poses a direct risk for Ontario exporters.
It is likely that the uncertainty surrounding NAFTA, and global trade more generally, has already resulted in businesses scaling-back or postponing planned investments. If the renegotiation of NAFTA or other protectionist trade policies adversely impact the US economy or places Ontario businesses at a competitive disadvantage, there could be significant negative implications for the Ontario economy, and export-dependent industries in particular.
Household Spending and Debt
From the 1980s to the 2008-2009 financial crisis, growth in labour income generally kept pace with the growth in household consumption and residential investment. However, since the financial crisis, slower income growth combined with record low

14 Financial Accountability Office of Ontario | Economic and Budget Outlook
interest rates encouraged households to boost spending through higher borrowing. This resulted in spending on consumption and housing outpacing income growth.
Household spending growth outpaces growth in incomes
80
90
100
110
120
130
140
150
160
(Inde
x, 20
07 =
100
)
Household Spending* Labour Income
* Household spending is household consumption and residential investment.** 2017 values are estimated.Source: Statistics Canada and FAO.
Ontario household debt reached record levels in 2016, at 171 per cent of disposable income.12 To service this debt, Ontarians spent an average of 14 per cent of their disposable income on debt payments – a share that is expected to increase as interest rates rise over the outlook.
If economic developments lead the Bank of Canada to raise interest rates more quickly (or higher) than currently anticipated, households would have to further increase debt payments, forcing them to scale back other spending. This could have negative implications for the broader economy.
Stronger US Growth
While the FAO expects the US to perform well in the coming years, growth could turn out to be stronger than anticipated, lifting demand for Ontario’s exports, raising employment and leading to stronger wage and profit growth for the province.
12 For more details on Ontario household debt, see the FAO’s January 2018 Commentary: Assessing Ontario Households’ Debt Burden and Financial Vulnerability
Medium-term Budget Outlook 15
3 | Medium-term Budget Outlook
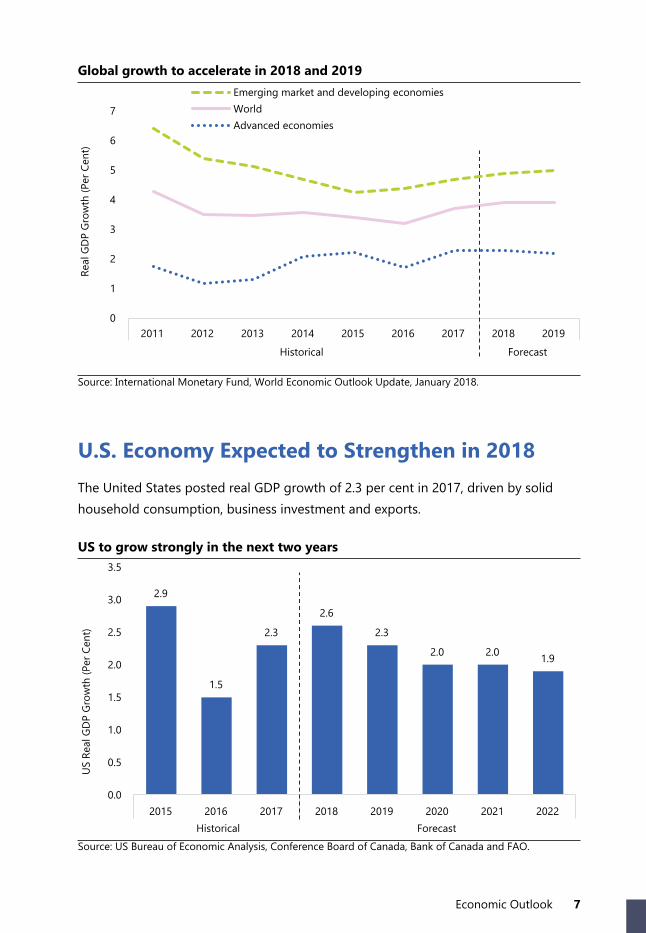
FAO Projects Budget Deficit to Increase SharplyIn 2017-18, the FAO estimates that Ontario will record a budget deficit of $3.6 billion, based on the Auditor General’s recommended accounting treatment for the Fair Hydro Plan and net pension assets.
For 2018-19, the FAO projects that Ontario’s budget deficit will increase sharply to $11.8 billion, the result of significant increases in program spending from the 2018 Budget combined with only a weak gain in revenue. Going forward, the FAO is projecting that the budget deficit will increase to $12.7 billion by 2020-21.
Ontario budget balance deteriorates significantly
-8.1 -7.2-6.1
-3.7 -5.2 -6.5
-5.0
-2.4-3.6
-11.8-12.4 -12.7
-14
-12
-10
-8
-6
-4
-2
-2015-16 2016-17 2017-18 2018-19 2019-20 2020-21
Historical Forecast
($ B
illio
ns)
Impact of 2018 Budget Measures
Budget Balance -Excluding 2018 Budget Measures
Budget Balance - FAO - Spring 2018
Note: The budget balance excludes the reserve and is based on the Auditor General’s recommended accounting treatment for the Fair Hydro Plan and net pension assets.Source: Ontario Public Accounts, 2018 Ontario Budget and FAO.
The 2018 Budget introduced a broad range of new spending initiatives. While many of these new spending programs would provide significant social and economic benefits for Ontario, the government has not raised adequate new revenue to pay for them. Based on the FAO’s analysis, the 2018 Ontario Budget measures will add $3.7 billion to the deficit in 2018-19, increasing to $6.5 billion by 2020-21.

16 Financial Accountability Office of Ontario | Economic and Budget Outlook
Importantly, even before the introduction of the 2018 Budget, the FAO projects that the Province would have already been in deficit over the next three years. In 2018-19, the FAO estimates that Ontario would have recorded a deficit of $8.1 billion, before the impact of the 2018 Budget measures.
The FAO’s projection for persistent budget deficits, despite strong economic growth and low unemployment, suggests that the Province is facing a fundamental imbalance between revenues and spending, resulting in a structural deficit.13 As a result, Ontario’s current deficit cannot be eliminated by economic growth alone, but would instead require fiscal policy changes to raise revenue or reduce spending.
Revenue OutlookIn 2017-18, the FAO estimates that revenue grew by 6.7 per cent, reflecting strong gains from both tax and non-tax sources. Over the medium-term, the FAO is projecting that revenue growth will slow significantly to 2.7 per cent per year on average from 2017-18 to 2020-21. This slower growth reflects several factors.
• Tax revenues are projected to increase more slowly, in-line with moderating economic growth, following several years of stronger than average economic growth.
13 The OECD defines a “structural” deficit as a fundamental mismatch between revenue and expense, after adjusting for temporary factors such as economic cycles and one-time budget measures. See OECD’s ‘Government at a Glance 2015’ report, pg. 56.
The FAO’s fiscal projections are based on the Auditor General of Ontario’s recommended accounting treatment for the Fair Hydro Plan and net pension assets.*
The Auditor General and the government continue to disagree over the appropriate accounting treatment of the refinancing portion of the Fair Hydro Plan (FHP) and the net pension assets of the government’s jointly sponsored pension plans.
In the 2018 Ontario Budget, the government did not adopt the Auditor General’s recommended accounting framework, reducing the clarity and reliability of Ontario’s fiscal projections. The Auditor General has indicated that the government’s financial statements may continue to receive a qualified opinion.
See the Appendix for the FAO’s budget projections consistent with the government’s accounting treatment.
* The FAO looks to the Auditor General as the provincial authority on the appropriate interpretation and application of accounting standards for the Province.

Medium-term Budget Outlook 17
• Increases in federal transfers are expected to slow, reflecting current federal-provincial agreements.
• Time-limited revenues totaling $2.1 billion will end in 2018-19.
In addition, the 2018 Budget introduced several modest new revenue measures, which result in a net increase in government revenue of about $0.6 billion in 2018-19, growing to $0.8 billion by 2020-21. These measures include:
• the elimination of the personal income tax (PIT) surtax along with adjustments to tax rates and income brackets;
• enhancements to the Ontario Research and Development Tax Credit and the Ontario Innovation Tax Credit14; and
• changes to the Employer Health Tax exemption for small employers.
The budget also included new revenues from the federal cannabis excise duty as well as several measures to parallel federal tax changes.
FAO medium-term revenue assumptions
* The FAO reduces Hydro One net income by about $400 million in 2018-19 to reflect the decision by the Ontario Energy Board (OEB) to allocate a portion of the company’s tax gain to ratepayers. Hydro One is appealing the OEB decision and if successful, this adjustment could be reversed. (See the FAO’s report Hydro One: Updated Financial Analysis of the Partial Sale of Hydro One for more details).
Tax Revenue Growth Expected to Moderate
Nominal GDP, the broadest measure of the tax base, grew by 4.5 per cent in 2017, supporting a 5.3 per cent increase in tax revenues in 2017-18. From 2017 to 2020, the FAO is projecting annual GDP growth to ease to an average of 4.1 per cent, while tax
14 The enhancement to the Ontario Innovation Tax Credit represents an increase in government expenditures.
Revenue Source Assumption Forecast
Taxation RevenueGrows with key economic drivers includ-ing labour income, corporate income and household spending
Projected to average 3.9 per cent growth per year from 2017-18 to 2020-21
Federal TransfersBased on legislated growth rates and economic forecasts for Ontario and Canada
Federal transfers are projected to grow by 1.8 per cent per year from 2017-18 to 2020-21
Government Business Enterprises (GBE) Based on government projections
Income from GBEs are projected to grow at 2.4 per cent on average from 2017-18 to 2020-21*
Other RevenueBased on government projections, and includes asset sales, and proceeds from the sale of cap and trade allowances
These revenues are projected to decrease from $19.3 billion in 2017-18 to $18.0 billion by 2020-21

18 Financial Accountability Office of Ontario | Economic and Budget Outlook
revenue is projected to increase by 3.9 per cent on average over the same period.
The slower pace of tax revenue growth relative to economic growth is in part a reflection of the minimum wage increases in 2018 and 2019. While the higher minimum wage will boost the growth in labour income over the next two years, minimum wage workers typically pay below average rates of personal income tax. To reflect this, the FAO made a moderate downward adjustment to the projection for PIT revenues for 2018-19 and 2019-20. However, even after this adjustment, the FAO projects PIT revenues will increase by a strong 8.7 per cent in 2018-19 and by 5.0 per cent in 2019-20.
Federal Transfer Growth Slows
Since 2010-11, federal transfers grew much faster than the economy. This reflected federal stimulus spending (in response to the 2008-2009 recession), the federal-provincial agreement to grow the Canada Health Transfer by six per cent per year, as well as Ontario’s receipt of Equalization payments following the recession.
Consistent with current federal-provincial agreements, federal transfers are projected to grow slower than the economy over the outlook, reflecting:
• three per cent annual increases in the Canada Social Transfer;
• the Canada Health Transfer growing in-line with Canadian nominal GDP; and
• the expectation that Ontario will no longer qualify for Equalization payments after 2018-19, based on FAO estimates.
Time-Limited Revenues Expire
In 2017-18, Ontario’s revenue included several one-time or time-limited sources of revenue that are set to expire.15 These include:
• a temporary increase to sales and rentals revenue, reflecting additional asset sales16;
• the final year of the debt retirement charge17; and15 Some of these temporary revenues - notably proceeds from the sale of carbon allowances - are tied to corresponding
spending commitments, which would partially offset the reductions in these revenue sources.16 Asset sales include the Province’s 20 per cent sale of Hydro One equity in a secondary offering in 2017-18, which the
FAO estimates generated about $0.7 billion in revenue.17 The debt retirement charge (DRC) is a charge payable on electricity consumed in Ontario and replaces a portion
of debt servicing costs previously included as part of electricity bills before the restructuring of the former Ontario Hydro. The government ended the DRC on residential bills as of January 1, 2016. The DRC remained on non-residential electricity users’ bills until March 31, 2018.

Medium-term Budget Outlook 19
• additional one-time proceeds from Ontario’s cap and trade program in 2017-18.18
In total, the FAO projects that $2.1 billion in time-limited revenues will expire in 2018-19.
Time-limited revenues decline after 2017-18
0.0
1.0
2.0
3.0
4.0
2012-13 2013-14 2014-15 2015-16 2016-17 2017-18 2018-19 2019-20 2020-21Historical Forecast
($ B
illio
ns)
Debt Retirement ChargeOne-time Boost to Carbon Allowance ProceedsSales and Rentals
$2.1 billion decrease in 2018-19
Source: Ontario Budgets, Ministry of Finance and FAO.
Spending OutlookThe FAO projects total spending to grow by 4.5 per cent from 2017-18 to 2020-21. The strong growth in spending is driven by the new spending initiatives announced in the 2018 Budget combined with rising interest on debt payments.
Program Spending
Program spending is projected to grow at an average annual pace of 4.5 per cent over the outlook.
In the 2018 Budget, the government increased spending by $5.5 billion in 2018-19, growing to $8.1 billion in 2020-21, compared to the 2017 Fall Economic Statement.19 This new spending covers initiatives such as publicly funded pre-school child care, an expansion of the government’s pharma-care plan, an increase in public coverage for dental care, more resources for mental health care services, and income security reform.20
18 In the 2017-18 fiscal year, Ontario held five carbon market auctions. Going forward, the Province expects to hold four auctions each year.
19 This increase excludes new spending for the Early Learning and Child Care agreement, which was already announced in the 2017 Fall Economic Statement. See Table 3.23 of the 2018 Budget.
20 The new spending also includes other adjustments related to government expenditure management.

20 Financial Accountability Office of Ontario | Economic and Budget Outlook
HealthThe 2018 Budget increased health sector spending by a total of $5.0 billion from 2018-19 to 2020-21, compared to the 2017 Fall Economic Statement. Approximately $1.8 billion of this new spending is to support two new health care programs.
• The Province is expanding the OHIP+ program to make eligible prescription drugs free for all people aged 65 and over. This is an extension of the Ontario Drug Benefit Program that removes the deductible and co-payment, and is estimated to save the average senior $240 annually. The program will be introduced August 1, 2019 with an estimated cumulative cost of $1.0 billion over fiscal years 2019-20 and 2020-21.21
• The Province is introducing a new drug and dental insurance plan to cover Ontarians without an extended health plan. The program covers up to $700 of drug and dental costs per year for an eligible family of four, and will be introduced in the summer of 2019. The estimated cumulative cost of the program is $0.8 billion over the fiscal years 2019-20 and 2020-21.22
The majority of the remaining $3.2 billion of new health spending is to increase funding for existing programs such as improving access to mental health services, more long-term care staff, increasing access to home and community care and increases in hospital funding.
Health spending and core cost drivers
2.5 2.72.8
1.5
4.2
5.1 4.8
3.7
1.9
4.4
3.53.2
0.0
1.0
2.0
3.0
4.0
5.0
6.0
2012-13 2013-14 2014-15 2015-16 2016-17 2017-18 2018-19 2019-20 2020-21Historical Forecast
Annu
al G
row
th (P
er C
ent)
Health InflationImpact of Population AgingPopulation GrowthTotal Health SpendingExisting Health Spending
Source: 2018 Ontario Budget and FAO analysis of data from the Ontario Ministry of Health and Long-term Care and Treasury Board Secretariat.
21 2018 Ontario Budget.22 Ibid.

Medium-term Budget Outlook 21
Overall, the 2018 Budget increased health spending by $0.8 billion in 2018-19 rising to $2.4 billion in 2020-21 compared to the 2017 Fall Economic Statement. This raised the planned average annual growth of health sector spending from 3.5 per cent to 4.6 per cent from 2017-18 to 2020-21. The pace of health spending growth is now projected to approximately match the growth of core cost pressures, including population growth and aging, and price inflation.23
However, if the spending on new health care programs is excluded,24 the FAO projects that spending on existing health care services will grow by an annual average of 3.7 per cent, which is below the rate of population growth, aging, and price inflation.25 This indicates that budget pressures in existing health services may not be fully relieved by this additional spending.
EducationIn the 2018 Budget, the government projected education sector spending to grow by 4.7 per cent per year from 2017-18 to 2020-21. This is partially driven by additional spending for new child care initiatives, such as reducing child care fees and adding more subsidized child care spaces for infants and toddlers. In addition, beginning in September 2020, the 2018 Budget proposes to implement publicly-funded preschool for children aged 2½ until kindergarten.
Aside from absorbing the financial burden of child care from young Ontario families, studies have shown that expanding early childhood education and care would yield significant economic and social benefits, including improvements in children’s academic outcomes, reducing income inequality and boosting women’s labour force participation.26
Social ServicesIn the 2018 Budget, the government projected spending in the children and social services sector to grow by 5.6 per cent per year from 2017-18 to 2020-21. This strong growth is partly due to the government’s proposed reforms to income security, which is expected to cost $1.3 billion by 2020-21.
23 There are other factors that influence health care costs, including: the introduction of new health care services (or the removal of old ones), the adoption of new technologies and medications, efficiency measures, rising incomes, government policies, and the underlying health of the population.
24 Excluded programs are: OHIP+, extended health benefits including dental, and other minor new initiatives announced in the 2018 Budget.
25 These are the “core” cost drivers of health spending. See the FAO’s “Ontario Health Sector - An Updated Assessment of Ontario Health Spending”.
26 See The Conference Board of Canada’s report: “Ready for Life: A Socio-Economic Analysis of Early Childhood Education and Care.”

22 Financial Accountability Office of Ontario | Economic and Budget Outlook
These reforms include increasing Ontario Works and Ontario Disability Support Program rates by 3 per cent annually – a rate exceeding inflation – and increasing the threshold that a recipient can earn income before reducing their benefits. Overall, these reforms would be expected to provide social benefits, including boosting disposable income for low-income households.
Interest on Debt Payments to Increase
The FAO projects interest on debt (IOD) payments to increase by an average of 4.4 per cent per year from 2017-18 to 2020-21, reflecting rising interest rates and growing deficits.
The 2018 Budget measures will result in increased borrowing, contributing to higher IOD payments. The FAO estimates that budget measures will increase IOD payments by $0.5 billion in 2020-21, and by increasing amounts over the outlook.
Rising interest on debt payments will increase the ratio of IOD to revenue – a key measure of the government’s ability to finance its debt. Over the next three years, IOD payments are projected to increase by $1.7 billion, reaching $13.6 billion in 2020-21 and accounting for 8.4 per cent of total revenues.
Interest on debt to rise
Inte
rest
on
Deb
t-to
-Rev
enue
(P
er C
ent)
Interest on Debt - Including 2018 Budget Measures (right axis)Interest on Debt to Total Revenue - FAO Projection (left axis)Interest on Debt to Total Revenue - Excluding 2018 Budget Measures (left axis)
12.0
13.6
8.4
8.0 8.1
0
2
4
6
8
10
12
14
16
7.4
7.6
7.8
8.0
8.2
8.4
8.6
8.8
9.0
2014-15 2015-16 2016-17 2017-18 2018-19 2019-20 2020-21
Historical Forecast
Inte
rest
on
Deb
t ($
Billi
ons)
Source: Ontario Public Accounts, 2018 Ontario Budget and FAO.
Medium-term Budget Outlook 23
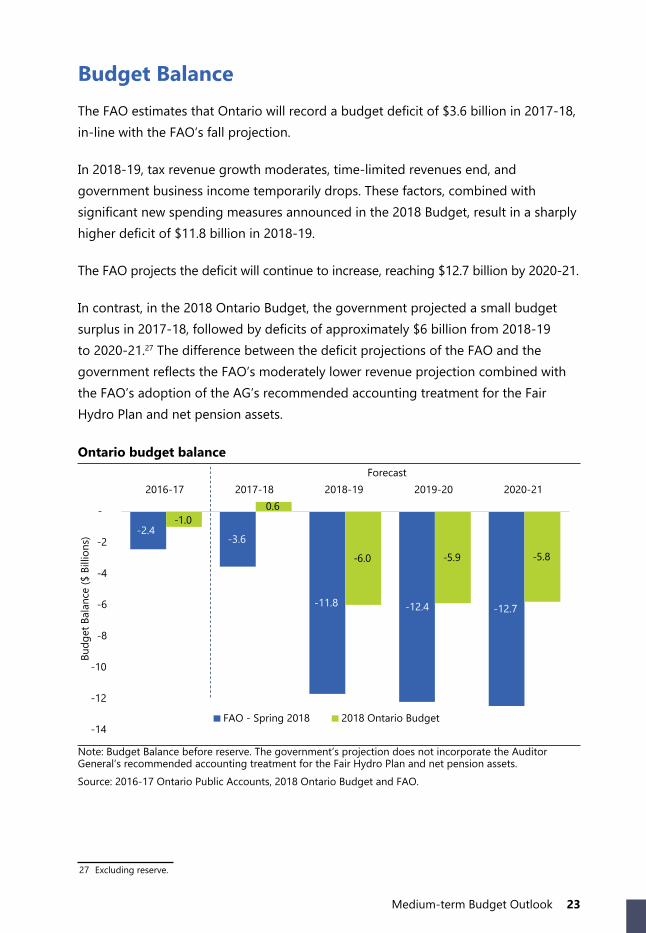
Budget BalanceThe FAO estimates that Ontario will record a budget deficit of $3.6 billion in 2017-18, in-line with the FAO’s fall projection.
In 2018-19, tax revenue growth moderates, time-limited revenues end, and government business income temporarily drops. These factors, combined with significant new spending measures announced in the 2018 Budget, result in a sharply higher deficit of $11.8 billion in 2018-19.
The FAO projects the deficit will continue to increase, reaching $12.7 billion by 2020-21.
In contrast, in the 2018 Ontario Budget, the government projected a small budget surplus in 2017-18, followed by deficits of approximately $6 billion from 2018-19 to 2020-21.27 The difference between the deficit projections of the FAO and the government reflects the FAO’s moderately lower revenue projection combined with the FAO’s adoption of the AG’s recommended accounting treatment for the Fair Hydro Plan and net pension assets.
Ontario budget balance
-2.4-3.6
-11.8 -12.4 -12.7
-1.00.6
-6.0 -5.9 -5.8
-14
-12
-10
-8
-6
-4
-2
-
2016-17 2017-18 2018-19 2019-20 2020-21Forecast
Budg
et B
alan
ce ($
Bill
ions
)
FAO - Spring 2018 2018 Ontario Budget
Note: Budget Balance before reserve. The government’s projection does not incorporate the Auditor General’s recommended accounting treatment for the Fair Hydro Plan and net pension assets.Source: 2016-17 Ontario Public Accounts, 2018 Ontario Budget and FAO.
27 Excluding reserve.

24 Financial Accountability Office of Ontario | Economic and Budget Outlook
Ontario Deficit Outlook Excluding 2018 Budget MeasuresThe FAO developed a ‘baseline’ budget projection that excludes the new measures introduced in the 2018 Budget and includes the AG’s recommended accounting treatment for the Fair Hydro Plan and net pension assets.
Based on the FAO’s baseline projection, the Ontario budget was in deficit prior to the introduction of the 2018 Budget. Specifically, excluding 2018 Budget measures, the FAO projects budget deficits of $3.6 billion in 2017-18 and $8.1 billion in 2018-19. The baseline deficit improves to $6.1 billion by 2020-21 due to strengthening non-tax revenues.
Baseline budget balance, excluding 2018 budget measures
Note: May not add due to rounding. * Revenue measures exclude automatic policy changes such as the paralleling of recent federal tax measures and new cannabis excise duty revenues.** Spending measures represent the FAO’s estimate of additional spending for programs and services in the 2018 Budget, but excludes other adjustments related to government expenditure management.Source: 2018 Ontario Budget and FAO.
This baseline deficit averages $6.0 billion from 2021-22 to 2025-26*, despite steady ongoing economic growth. This permanent imbalance between Ontario’s revenues and expenditures suggests a structural deficit existed prior to the introduction of the 2018 Budget.
*details available upon request
2017-18 2018–19 2019–20 2020-21
Baseline Budget Balance -3.6 -8.1 -7.2 -6.1
2018 Budget Measures
Revenue Measures* 0.1 0.3 0.3 0.3
Spending Measures** -3.9 -5.2 -6.3
Interest on Debt Impact -0.1 -0.3 -0.5
Net Changes 0.1 -3.7 -5.2 -6.5
Budget Balance with 2018 Budget Measures
-3.6 -11.8 -12.4 -12.7
Extended Budget Outlook 25
4 | Extended Budget Outlook
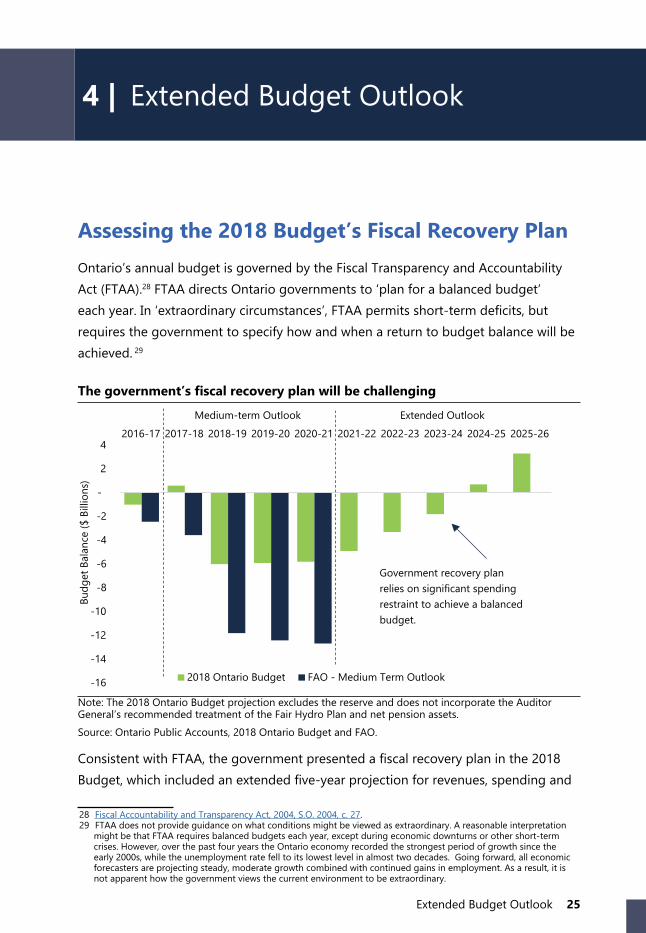
Assessing the 2018 Budget’s Fiscal Recovery PlanOntario’s annual budget is governed by the Fiscal Transparency and Accountability Act (FTAA).28 FTAA directs Ontario governments to ‘plan for a balanced budget’ each year. In ‘extraordinary circumstances’, FTAA permits short-term deficits, but requires the government to specify how and when a return to budget balance will be achieved. 29
The government’s fiscal recovery plan will be challenging
-16
-14
-12
-10
-8
-6
-4
-2
-
2
42016-17 2017-18 2018-19 2019-20 2020-21 2021-22 2022-23 2023-24 2024-25 2025-26
Medium-term Outlook Extended Outlook
Budg
et B
alan
ce ($
Bill
ions
)
2018 Ontario Budget FAO - Medium Term Outlook
Government recovery plan relies on significant spending restraint to achieve a balanced budget.
Note: The 2018 Ontario Budget projection excludes the reserve and does not incorporate the Auditor General’s recommended treatment of the Fair Hydro Plan and net pension assets.Source: Ontario Public Accounts, 2018 Ontario Budget and FAO.
Consistent with FTAA, the government presented a fiscal recovery plan in the 2018 Budget, which included an extended five-year projection for revenues, spending and
28 Fiscal Accountability and Transparency Act, 2004, S.O. 2004, c. 27.29 FTAA does not provide guidance on what conditions might be viewed as extraordinary. A reasonable interpretation
might be that FTAA requires balanced budgets each year, except during economic downturns or other short-term crises. However, over the past four years the Ontario economy recorded the strongest period of growth since the early 2000s, while the unemployment rate fell to its lowest level in almost two decades. Going forward, all economic forecasters are projecting steady, moderate growth combined with continued gains in employment. As a result, it is not apparent how the government views the current environment to be extraordinary.
26 Financial Accountability Office of Ontario | Economic and Budget Outlook
the budget balance from 2021-22 to 2025-2630. The government’s recovery plan projects a balanced budget by 2024-25, based largely on restricting the growth in program spending. The government’s plan provides few policy specifics on how it intends to limit spending growth, but assumes the government will dramatically cut the growth in program spending from an average of 4.2 per cent per year over the next three years, to an average of just 2.1 per cent beginning in 2021-22.
The FAO’s Extended Budget Projections
The FAO extended its fiscal projections from 2020-21 to 2025-26 to assess the reasonableness and risks associated with the government’s fiscal recovery plan to eliminate the budget deficit.
The FAO’s extended outlook includes a detailed revenue projection to 2025-26, incorporates the 2018 Budget’s projection for program spending to 2020-21 and continues to adopt the AG’s recommended accounting treatment for the Fair Hydro Plan and net pension assets. However, due to the critical importance of the assumption for program spending growth over the extended outlook, the FAO developed two projections.
• The FAO’s ‘spending restraint’ projection is based on the government’s plan to limit the growth in program spending to 2.1 per cent per year from 2020-21 to 2025-26.
• The FAO also developed a ‘status quo’ projection which assumes program spending will grow by approximately 3.5 per cent per year from 2020-21 to 2025-26. This projection implies that the quality of public services would be maintained, as program spending increases to accommodate population growth and aging as well as price inflation, core cost drivers which contribute to the rising cost of providing public services.
The FAO’s ‘spending restraint’ projection shows that Ontario could achieve a balanced budget by 2025-26, roughly consistent with the government’s own fiscal recovery plan, which anticipates a balanced budget a year earlier. This projection relies on a dramatic slow-down in spending growth beginning in 2021-22, compared with the government’s planned spending over the next three years.
30 See 2018 Ontario Budget, page 171.
Extended Budget Outlook 27
In contrast, under the FAO’s ‘status quo’ projection, which assumes program spending matches the growth in core cost drivers, Ontario’s budget deficit would continue to deteriorate steadily over the extended outlook.
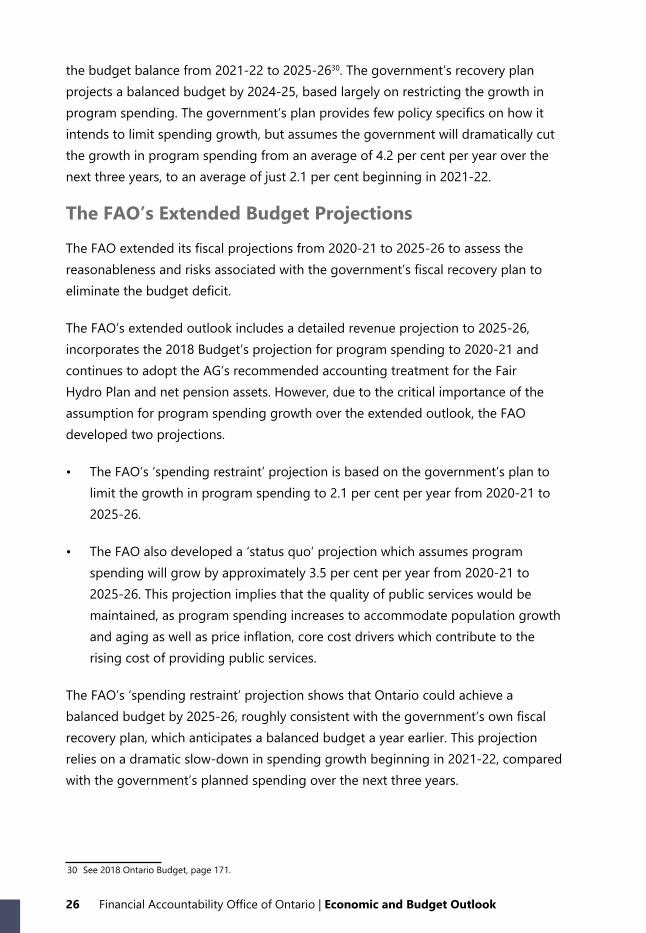
Revenue Outlook From 2020-21 to 2025-26, the economic projections of both the FAO and the government are roughly similar, with nominal GDP growth averaging approximately 4.0 per cent (see the Economic Outlook chapter for more details on the FAO’s extended economic outlook).
Despite a similar projection for economic growth, the government forecasts revenue growth will average 3.3 per cent annually over this period, lower than the FAO’s forecast of 3.7 per cent and well below the expected growth rate of nominal GDP.
The government’s projection for slower revenue growth reflects slower growth in taxes and other revenue (e.g. service fees, and sales and rentals). As a result, the FAO projects total revenue will be $2.1 billion higher than the government forecast by 2025-26.
Revenue projection assumptions, 2020-21 to 2025-26
Revenue Source FAO Growth Assumptions FAO Spring Extended Forecast
2023-2025
Taxation RevenueGrows with key economic drivers including labour income, corporate income and household spending
3.8 3.6
Federal TransfersBased on legislated growth rates and economic forecasts for Ontario and Canada
3.1 2.9
Government Business Enterprises (GBE) Based on nominal GDP growth 3.9 4.3
Other RevenueBased on nominal GDP growth and the FAO projection of revenue from cap and trade allowances
3.6 2.0
Total Revenue 3.7 3.3
Source: FAO and Ontario Ministry of Finance.
The slow pace of revenue growth over the government’s recovery plan implies that Ontario revenues would decline as a share of the economy, falling from 17.5 per cent of GDP in 2020-21 to 17.0 per cent by 2025-26. This declining trend is unlikely to be sustained over the longer term.

28 Financial Accountability Office of Ontario | Economic and Budget Outlook
Spending OutlookThe demand for public services generally increases as the population grows and ages, while the cost of providing services increases with price inflation. To maintain the quality of public services, program spending would typically need to grow at the rate of these core cost drivers.
Based on these core cost drivers, the FAO’s status quo outlook assumes program spending growth of 3.5 per cent per year from 2020-21 to 2025-26, to maintain the existing quantity and quality of public services.
In contrast, the government’s fiscal recovery plan relies on limiting the annual growth in spending to an average of 2.1 per cent per year over five years, well below the pace of population growth and inflation. The FAO’s ‘spending restraint’ projection assumes program spending growth consistent with the government’s recovery plan.
By limiting the growth in spending, the 2018 Budget’s fiscal recovery plan implies that government spending on goods and services would be reduced by $650 per person by 2025-26, after adjusting for inflation.
Fiscal recovery plan assumes $650 reduction in program spending per person, after adjusting for inflation
$650 decreaseby 2025-26
$10,769$10,551
$9,904
9,000
9,500
10,000
10,500
11,000
2015
-16
2016
-17
2017
-18
2018
-19
2019
-20
2020
-21
2021
-22
2022
-23
2023
-24
2024
-25
2025
-26
History Medium-term Outlook Extended Outlook
Real
per
Cap
ita P
rogr
am S
pend
ing
($ 2
018)
FAO - Status Quo FAO - Spending Restraint
Note: Both projections incorporate the Auditor General’s recommended treatment of the Fair Hydro Plan and net pension assets. Source: 2018 Ontario Budget and FAO.
Extended Budget Outlook 29
Implications of Program Spending Restraint
There are three broad strategies jurisdictions can use to manage and reduce the pace of program spending growth:
• adopt transformational changes to public services that improve the efficiency of program delivery;
• temporarily reduce planned spending (such as wage restraint or postponing maintenance), and
• reduce the quantity or quality of existing services.
Transformational changes to public services that lead to permanent efficiency gains have generally been difficult to achieve.31 But the simple elimination of government programs is also difficult to implement, because of the concerns of current stakeholders.
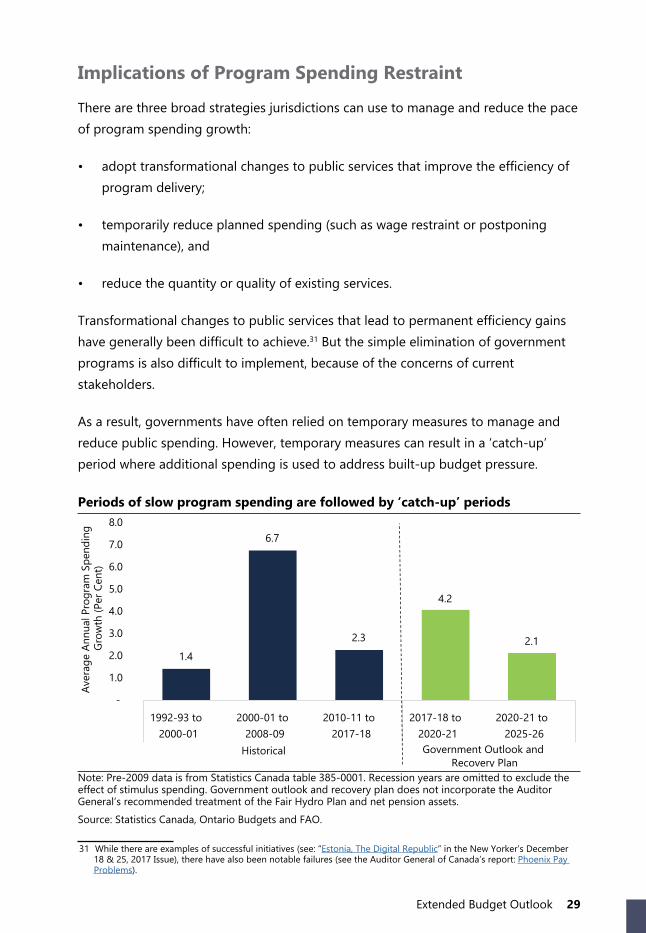
As a result, governments have often relied on temporary measures to manage and reduce public spending. However, temporary measures can result in a ‘catch-up’ period where additional spending is used to address built-up budget pressure.
Periods of slow program spending are followed by ‘catch-up’ periods
1.4
6.7
2.3
4.2
2.1
-
1.0
2.0
3.0
4.0
5.0
6.0
7.0
8.0
1992-93 to2000-01
2000-01 to2008-09
2010-11 to2017-18
2017-18 to2020-21
2020-21 to2025-26
Historical Government Outlook and Recovery Plan
Aver
age
Annu
al P
rogr
am S
pend
ing
Grow
th (P
er C
ent)
Note: Pre-2009 data is from Statistics Canada table 385-0001. Recession years are omitted to exclude the effect of stimulus spending. Government outlook and recovery plan does not incorporate the Auditor General’s recommended treatment of the Fair Hydro Plan and net pension assets.Source: Statistics Canada, Ontario Budgets and FAO.
31 While there are examples of successful initiatives (see: “Estonia, The Digital Republic” in the New Yorker’s December 18 & 25, 2017 Issue), there have also been notable failures (see the Auditor General of Canada’s report: Phoenix Pay Problems).

30 Financial Accountability Office of Ontario | Economic and Budget Outlook
Since 1991, there have been two periods of prolonged spending restraint in Ontario similar to that being proposed in the government’s fiscal recovery plan. After the onset of the early-1990s recession, successive governments used a combination of strategies to limit the growth in program spending to 1.4 per cent annually from 1992-93 to 2000-01.
The spending restraint of the 1990s was followed by a ‘catch-up’ period during the 2000s, when program spending grew by 6.7 per cent annually. This period of strong growth reflected the introduction of new public services, but was also a response to relieve the “temporary” cost pressures (including infrastructure backlogs and public-sector wage restraint) that had built-up during the 1990s.
After the 2008-2009 recession, limiting spending growth was a critical part of the Province’s plan to balance the budget in 2017-18. This was achieved through a combination of strategies, including delivering public services more efficiently,32 restraining public-sector wage growth, and deferring maintenance for schools and hospitals.33 This reduced program spending to an average of 2.3 per cent per year over the 2011-12 to 2017-18 period.
As in the 1990s, the spending restraint in the years following the 2008-2009 recession created future budget risks, as additional funding would be required if the Province chooses to address the built-up cost pressures.34
Over the next three years (2018-19 to 2020-21), the 2018 Budget provides a substantial boost to program spending, lifting the average annual growth rate to 4.2 per cent. However, much of this spending is allocated to new initiatives, which may not fully relieve the budget pressure in existing public services.
Beginning in 2021-22, the government plans to grow program spending by an average of just 2.1 per cent per year, below the 2.3 per cent growth of the 2011 to 2017 period, and well below the 3.5 per cent that is necessary to meet the cost pressures of population growth, aging and inflation.
Spending restraint of this magnitude implies that the government would have to find $15 billion in permanent savings to achieve a balanced budget by 2025-26, compared to the FAO’s status quo projection.32 One example is the increasing efficiency of Ontario’s hospitals, see FAO’s 2018 Health Sector report. 33 While capital renewal funding has been increasing, the Auditor General indicated that “significant infrastructure
investments are needed to maintain Ontario’s existing schools and hospitals, which current funding levels cannot meet.” See the Auditor General’s 2015 Annual Report, page 289.
34 For example, after years of wage restraint for Ontario’s doctors, the Province is currently negotiating with the Ontario Medical Association (OMA) on a new physician services agreement. As of March 2018, the Ontario Medical Association is entering binding arbitration with the Province, and the OMA’s key priority is redressing the 2015 fee cuts.

Extended Budget Outlook 31
FAO program spending projections
$15 billiondifference
in 2025-26
100 110 120 130 140 150 160 170 180 190 200
2012
-13
2013
-14
2014
-15
2015
-16
2016
-17
2017
-18
2018
-19
2019
-20
2020
-21
2021
-22
2022
-23
2023
-24
2024
-25
2025
-26
Historical Medium-termOutlook
Extended Outlook
Prog
ram
Spe
ndin
g ($
Bill
ions
)FAO - Status Quo FAO - Spending Restraint
Note: Both projections incorporate the Auditor General’s recommended treatment of the Fair Hydro Plan and net pension assets.Source: Ontario Public Accounts, 2017 and 2018 Ontario Budgets and FAO.
To address Ontario’s significant deficit exclusively through spending restraint would require permanent solutions, such as transformational changes in service delivery, reductions in the quality of public services, or simply eliminating services.
Given that the government’s plan provides few specifics on how it intends to limit spending growth, and the difficulty of cutting or transforming public services, there is a risk that the government will be unable to achieve the planned restraint in program spending.
Budget Balance By 2020-21, the FAO projects that Ontario’s deficit will be $12.7 billion. To reduce the deficit and achieve a balanced budget over the next five years, the government’s recovery plan involves a significant shift in fiscal policy that focuses on dramatically cutting spending growth.
Under the FAO’s ‘spending restraint’ projection (consistent with the government’s recovery plan), Ontario’s budget deficit would improve rapidly, reaching a small surplus by 2025-26. But the balanced budget would be achieved by severely restricting the growth in government spending over a five-year period.
In contrast, based on the FAO’s ‘status quo’ projection, public services would be maintained, but Ontario’s budget deficit would steadily deteriorate over the extended outlook. By 2025-26, the FAO projects that the deficit would reach $16.6 billion, or 1.5 per cent of GDP.

32 Financial Accountability Office of Ontario | Economic and Budget Outlook
FAO budget balance outlook
-16
-14
-12
-10
-8
-6
-4
-2
-
2
42016-17 2017-18 2018-19 2019-20 2020-21 2021-22 2022-23 2023-24 2024-25 2025-26
Hist. Medium-term Outlook Extended Outlook
Budg
et B
alan
ce ($
Bill
ions
)
FAO - Status Quo FAO - Spending Restraint
Note: Both projections incorporate the Auditor General’s recommended treatment of the Fair Hydro Plan and net pension assets.Source: Ontario Public Accounts, 2018 Ontario Budget and FAO.
The Implications of Ontario’s Elevated Debt BurdenOver the next three years, the FAO projects that Ontario’s net debt will increase by almost $70 billion, reaching $394 billion by 2020-21,35 pushing the net debt-to-GDP ratio to 42 per cent. Over the extended outlook (from 2020-21 to 2025-26), Ontario’s debt would continue to rise under both of the FAO’s spending projections.
Under the FAO’s ‘spending restraint’ projection, Ontario’s net debt-to-GDP ratio would peak at 43 per cent in 2022-23 before beginning to gradually decline. But even with this improvement, Ontario’s net debt-to-GDP ratio in 2025-26 would remain above today’s level of 39 per cent.
Under the FAO’s status quo projection, Ontario’s net debt-to-GDP ratio would increase to over 45 per cent by 2025-26.
In the 2017 Budget, the government set a target of reducing the net debt-to-GDP ratio to 35 per cent by 2023-24, on the path to achieving a 27 per cent ratio by 2029-30. In the 2018 Budget, the government did not acknowledge these previous targets for reducing Ontario’s debt burden.
35 The FAO’s net debt projections include the fiscal impact of the accounting treatment for the Fair Hydro Plan and net pension assets as recommended by the Auditor General.
Extended Budget Outlook 33
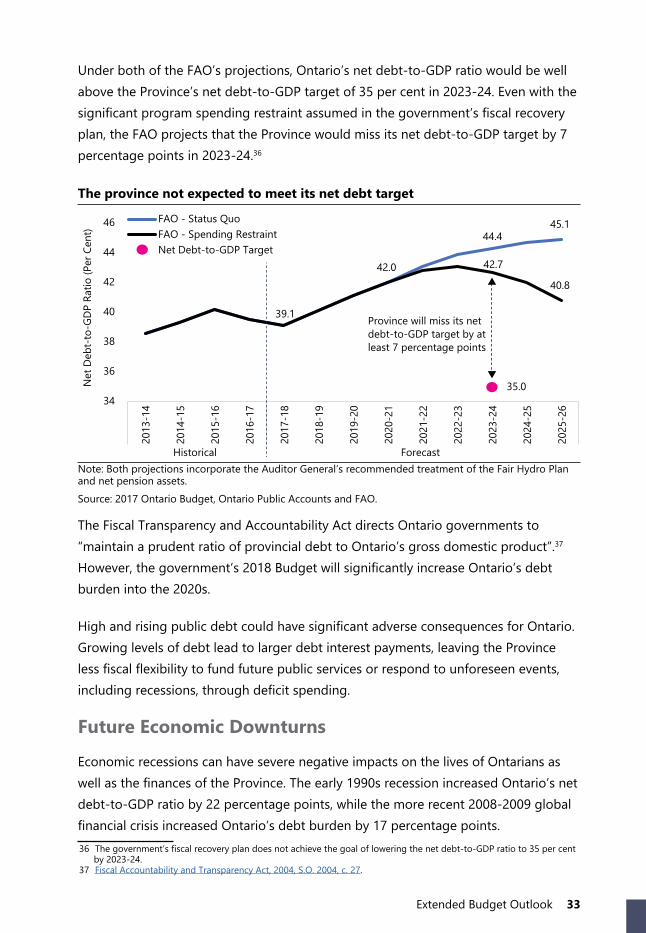
Under both of the FAO’s projections, Ontario’s net debt-to-GDP ratio would be well above the Province’s net debt-to-GDP target of 35 per cent in 2023-24. Even with the significant program spending restraint assumed in the government’s fiscal recovery plan, the FAO projects that the Province would miss its net debt-to-GDP target by 7 percentage points in 2023-24.36
The province not expected to meet its net debt target
39.1
44.445.1
42.0 42.7
40.8
35.0 34
36
38
40
42
44
46
2013
-14
2014
-15
2015
-16
2016
-17
2017
-18
2018
-19
2019
-20
2020
-21
2021
-22
2022
-23
2023
-24
2024
-25
2025
-26
Historical Forecast
Net
Deb
t-to
-GD
P Ra
tio (P
er C
ent)
FAO - Status QuoFAO - Spending RestraintNet Debt-to-GDP Target
Province will miss its netdebt-to-GDP target by atleast 7 percentage points
Note: Both projections incorporate the Auditor General’s recommended treatment of the Fair Hydro Plan and net pension assets.Source: 2017 Ontario Budget, Ontario Public Accounts and FAO.
The Fiscal Transparency and Accountability Act directs Ontario governments to “maintain a prudent ratio of provincial debt to Ontario’s gross domestic product”.37 However, the government’s 2018 Budget will significantly increase Ontario’s debt burden into the 2020s.
High and rising public debt could have significant adverse consequences for Ontario. Growing levels of debt lead to larger debt interest payments, leaving the Province less fiscal flexibility to fund future public services or respond to unforeseen events, including recessions, through deficit spending.
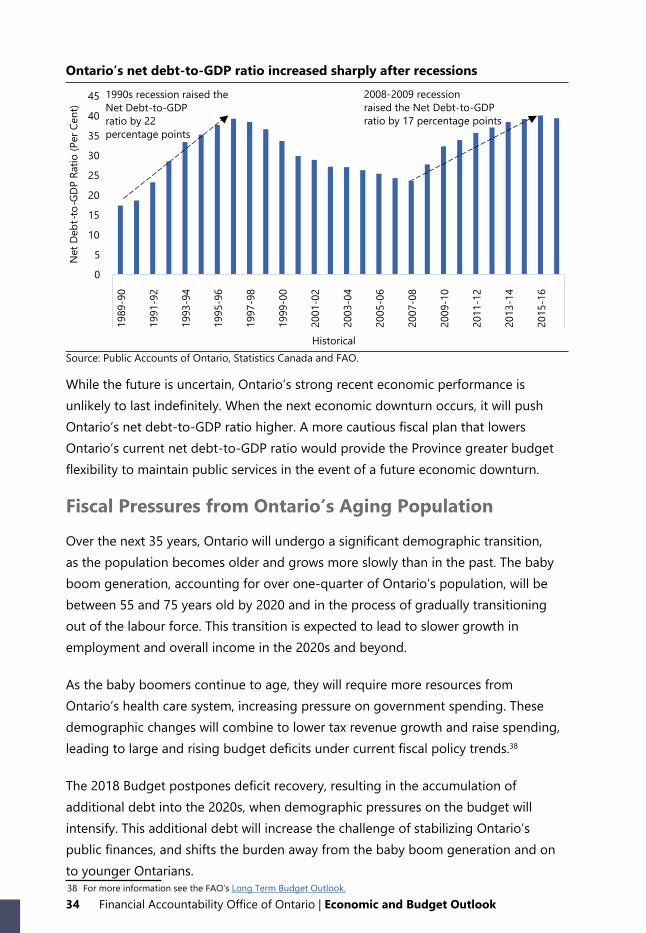
Future Economic Downturns
Economic recessions can have severe negative impacts on the lives of Ontarians as well as the finances of the Province. The early 1990s recession increased Ontario’s net debt-to-GDP ratio by 22 percentage points, while the more recent 2008-2009 global financial crisis increased Ontario’s debt burden by 17 percentage points.36 The government’s fiscal recovery plan does not achieve the goal of lowering the net debt-to-GDP ratio to 35 per cent
by 2023-24.37 Fiscal Accountability and Transparency Act, 2004, S.O. 2004, c. 27.
34 Financial Accountability Office of Ontario | Economic and Budget Outlook
Ontario’s net debt-to-GDP ratio increased sharply after recessions1990s recession raised theNet Debt-to-GDP ratio by 22 percentage points
0
5
10
15
20
25
30
35
40
45
1989
-90
1991
-92
1993
-94
1995
-96
1997
-98
1999
-00
2001
-02
2003
-04
2005
-06
2007
-08
2009
-10
2011
-12
2013
-14
2015
-16
Historical
Net
Deb
t-to
-GD
P Ra
tio (P
er C
ent)
2008-2009 recessionraised the Net Debt-to-GDPratio by 17 percentage points
Source: Public Accounts of Ontario, Statistics Canada and FAO.
While the future is uncertain, Ontario’s strong recent economic performance is unlikely to last indefinitely. When the next economic downturn occurs, it will push Ontario’s net debt-to-GDP ratio higher. A more cautious fiscal plan that lowers Ontario’s current net debt-to-GDP ratio would provide the Province greater budget flexibility to maintain public services in the event of a future economic downturn.
Fiscal Pressures from Ontario’s Aging Population
Over the next 35 years, Ontario will undergo a significant demographic transition, as the population becomes older and grows more slowly than in the past. The baby boom generation, accounting for over one-quarter of Ontario’s population, will be between 55 and 75 years old by 2020 and in the process of gradually transitioning out of the labour force. This transition is expected to lead to slower growth in employment and overall income in the 2020s and beyond.
As the baby boomers continue to age, they will require more resources from Ontario’s health care system, increasing pressure on government spending. These demographic changes will combine to lower tax revenue growth and raise spending, leading to large and rising budget deficits under current fiscal policy trends.38
The 2018 Budget postpones deficit recovery, resulting in the accumulation of additional debt into the 2020s, when demographic pressures on the budget will intensify. This additional debt will increase the challenge of stabilizing Ontario’s public finances, and shifts the burden away from the baby boom generation and on to younger Ontarians.38 For more information see the FAO’s Long Term Budget Outlook.

Extended Budget Outlook 35
Budget SensitivitiesChanges in Ontario’s current revenue or expense policies, as well as external factors can have a significant impact on Ontario’s budget balance by 2025-26. To gauge the sensitivity of Ontario’s finances to changes in key variables, the FAO estimated the impact of changes in four key areas to Ontario’s budget balance in 2025-26. These areas include: tax policy, federal transfers, spending and interest rates.
For example, if the government permanently raised personal income tax (PIT) rates in 2018-19 to generate 10 per cent more PIT revenue (roughly an additional $510 per taxpayer on average in that year), Ontario’s deficit would fall by $6.5 billion by 2025-26.
For the HST, if the government permanently raised the rate from 8.0 per cent to 9.0 per cent beginning in 2018-19, it would raise about $3.4 billion in the first year. Over time, this amount would grow, while interest on debt payments would be somewhat lower. The combined effect would lower Ontario’s deficit in 2025-26 by $6.0 billion.
For spending, if the government was able to reduce the growth rate of health care spending by 1 per cent in each year of the projection, Ontario’s deficit would improve by $7.5 billion by 2025-26.
Sensitivity of Ontario’s budget balance to select factors
Change Beginning in 2018-19Deficit Reduction in: 2018-19 2025-26
TaxationA sustained 10 per cent increase in Personal Income Tax revenues ($510 per tax filer in 2018-19) over the projection $3.6 billion $6.5 billion
A sustained 1 percentage point increase in the general Corporations Tax rate over the projection $1.2 billion $2.1 billion
A sustained 1 percentage point increase in the HST rate over the projection $3.4 billion $6.0 billion
Federal TransfersA sustained 1 percentage point increase in the annual growth of the Canada Health Transfer over the projection $0.1 billion $1.9 billion
A sustained 1 percentage point increase in the annual growth of the Canada Social Transfer over the projection $0.1 billion $0.7 billion
Health Care SpendingA sustained 1 percentage point decrease in the growth rate of health care spending over the projection $0.6 billion $7.5 billion
Interest RatesA sustained 1 percentage point decrease in Ontario’s effective borrowing rate over the projection $0.4 billion $3.1 billion
Note: These estimates include the associated impact to interest on debt, but do not incorporate any economic feedback effects.Source: FAO.

36 Financial Accountability Office of Ontario | Economic and Budget Outlook
Forecast TablesTable 1a: FAO outlook for key revenue drivers(Per Cent Growth) 2016a 2017e 2018f 2019f 2020f 2021f 2022f Average*Nominal GDP FAO - Spring 2018 4.3 4.5 4.2 4.1 4.1 3.9 3.9 4.1Ontario Budget 2018 4.3 4.4 4.1 3.9 4.0 3.9 - 4.0Current FAO Consensus ** 4.3 4.5 4.1 4.0 3.9 4.1 4.1 4.0Labour Income FAO - Spring 2018 3.4 3.7 5.3 4.4 4.0 3.8 3.8 4.4Ontario Budget 2018 *** 3.3 3.6 5.9 4.5 4.2 4.2 - 4.7Corporate Profits FAO - Spring 2018 7.3 9.9 2.4 3.1 4.4 4.1 4.1 3.5Ontario Budget 2018 7.3 9.2 1.5 3.5 2.8 4.1 - 3.0Household Consumption FAO - Spring 2018 4.2 4.4 4.5 4.2 3.8 3.8 3.8 4.1Ontario Budget 2018**** 4.2 - 4.8 4.2 4.0 - - 4.3
a = Actual e = Estimate f = Forecast * For comparison purposes, average is calculated from 2017 to 2021. ** FAO Consensus includes forecasts from the Centre for Spatial Economics, the Policy and Economic Analysis Program at the University of Toronto, and the Conference Board of Canada. *** 2018 Ontario Budget reports Labour Income on a National Basis, whereas FAO reports Labour Income on a Domestic Basis. **** The average for Household Consumption in the 2018 Ontario Budget is from 2018 to 2020. Source: Statistics Canada, 2018 Ontario Budget, Ontario Economic Accounts, FAO Consensus and FAO.
Table 1b: FAO outlook for Ontario real GDP and components(Per Cent Growth) 2016a 2017e 2018f 2019f 2020f 2021f 2022f Average*
Real GDP FAO - Spring 2018 2.6 2.7 2.2 2.0 1.9 1.9 1.9 2.0Ontario Budget 2018 2.6 2.7 2.2 1.8 1.9 1.7 - 1.9Current FAO Consensus ** 2.6 2.8 2.1 2.0 2.1 2.1 2.0 2.1Real GDP ComponentsHousehold Consumption *** 2.9 3.5 2.5 1.9 1.8 1.8 1.8 2.0Residential Investment 7.4 2.9 -3.5 0.9 1.8 2.1 2.4 0.3Business Investment **** -8.8 4.8 5.9 4.8 3.4 3.0 2.7 4.3Government (Consumption and Investment) 2.1 2.9 3.3 1.7 1.2 1.2 1.2 1.9
Exports 2.5 -1.4 1.9 2.2 2.0 2.0 2.0 2.0Imports 0.0 1.2 1.6 1.9 1.8 1.8 1.8 1.8
a = Actual e = Estimate f = Forecast * For comparison purposes, average is calculated from 2017 to 2021. ** FAO Consensus includes forecasts from the Centre for Spatial Economics, the Policy and Economic Analysis Program at the University of Toronto, and the Conference Board of Canada. *** Household Consumption is Household and Non-Profit Consumption Expenditure. **** Business Investment is Non-residential Investment and Machinery & Equipment. Source: Statistics Canada, 2018 Ontario Budget, Ontario Economic Accounts, FAO Consensus and FAO.
5 | Appendices
Appendices 37
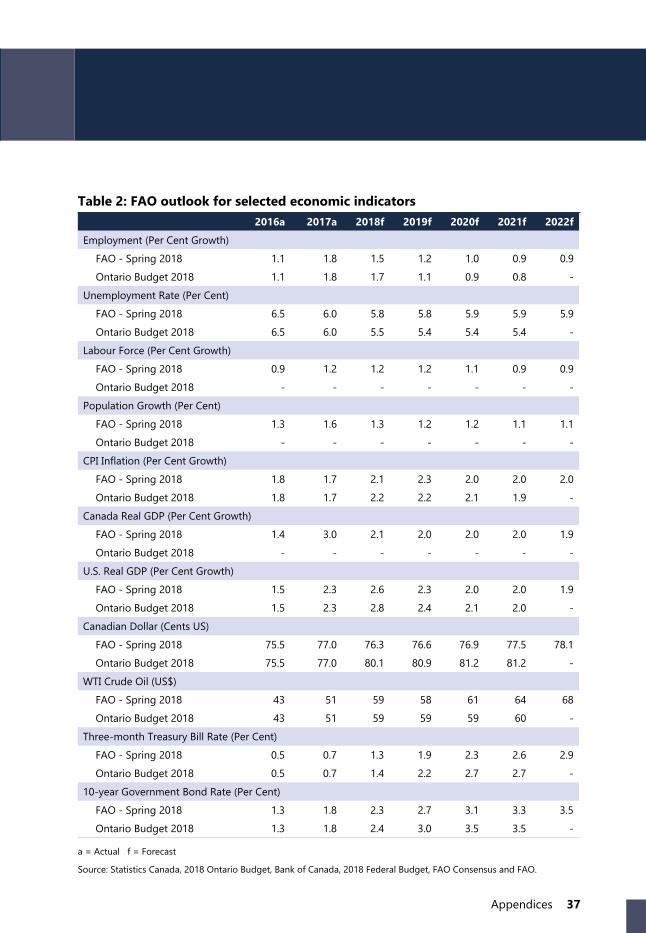
Table 2: FAO outlook for selected economic indicators 2016a 2017a 2018f 2019f 2020f 2021f 2022f
Employment (Per Cent Growth)FAO - Spring 2018 1.1 1.8 1.5 1.2 1.0 0.9 0.9Ontario Budget 2018 1.1 1.8 1.7 1.1 0.9 0.8 -
Unemployment Rate (Per Cent)FAO - Spring 2018 6.5 6.0 5.8 5.8 5.9 5.9 5.9Ontario Budget 2018 6.5 6.0 5.5 5.4 5.4 5.4 -
Labour Force (Per Cent Growth)FAO - Spring 2018 0.9 1.2 1.2 1.2 1.1 0.9 0.9Ontario Budget 2018 - - - - - - -
Population Growth (Per Cent)FAO - Spring 2018 1.3 1.6 1.3 1.2 1.2 1.1 1.1Ontario Budget 2018 - - - - - - -
CPI Inflation (Per Cent Growth)FAO - Spring 2018 1.8 1.7 2.1 2.3 2.0 2.0 2.0Ontario Budget 2018 1.8 1.7 2.2 2.2 2.1 1.9 -
Canada Real GDP (Per Cent Growth)FAO - Spring 2018 1.4 3.0 2.1 2.0 2.0 2.0 1.9Ontario Budget 2018 - - - - - - -
U.S. Real GDP (Per Cent Growth)FAO - Spring 2018 1.5 2.3 2.6 2.3 2.0 2.0 1.9Ontario Budget 2018 1.5 2.3 2.8 2.4 2.1 2.0 -
Canadian Dollar (Cents US)FAO - Spring 2018 75.5 77.0 76.3 76.6 76.9 77.5 78.1Ontario Budget 2018 75.5 77.0 80.1 80.9 81.2 81.2 -
WTI Crude Oil (US$)FAO - Spring 2018 43 51 59 58 61 64 68Ontario Budget 2018 43 51 59 59 59 60 -
Three-month Treasury Bill Rate (Per Cent)FAO - Spring 2018 0.5 0.7 1.3 1.9 2.3 2.6 2.9Ontario Budget 2018 0.5 0.7 1.4 2.2 2.7 2.7 -
10-year Government Bond Rate (Per Cent)FAO - Spring 2018 1.3 1.8 2.3 2.7 3.1 3.3 3.5Ontario Budget 2018 1.3 1.8 2.4 3.0 3.5 3.5 -
a = Actual f = Forecast
Source: Statistics Canada, 2018 Ontario Budget, Bank of Canada, 2018 Federal Budget, FAO Consensus and FAO.

38 Financial Accountability Office of Ontario | Economic and Budget Outlook
Table 3a: Medium-term FAO fiscal outlook($ Billions) 2016a 2017f 2018f 2019f 2020f
Revenue
Personal Income Tax 30.7 32.4 35.2 37.0 38.8
Sales Tax 24.8 26.0 26.8 27.9 28.9
Corporations Tax 14.9 15.7 15.2 15.7 16.2
All Other Taxes 24.1 25.3 25.9 26.7 27.5
Total Taxation Revenue 94.3 99.4 103.1 107.2 111.4
Transfers from Government of
Canada24.5 25.3 26.0 25.6 26.7
Income from Government
Business Enterprise5.6 6.1 4.9 6.0 6.6
Other Non-Tax Revenue 16.3 19.3 17.6 17.7 18.0
Total Revenue 140.7 150.2 151.5 156.6 162.8
Expense
Health Sector 55.9 58.3 61.3 64.2 66.6
Education Sector 26.6 27.5 29.1 30.1 31.5
Postsecondary and Training
Sector10.1 11.1 11.8 12.0 12.0
Children’s and Social Services
Sector16.1 16.8 17.9 18.7 19.8
Justice Sector 4.6 4.9 5.0 5.0 5.0
Other Programs 18.2 23.2 25.8 26.1 26.8
Total Program Expense 131.5 141.8 150.9 156.1 161.8
Interest on Debt 11.7 12.0 12.4 13.0 13.6
Total Expense 143.2 153.7 163.3 169.0 175.4
Budget Balance * (AG Presentation) -2.4 -3.6 -11.8 -12.4 -12.7
Accounting Adjustments
Fair Hydro Plan - 2.0 2.4 2.6 2.8
Net Pension Assets 1.4 2.2 2.6 3.0 3.2
Total Accounting Adjustments 1.4 4.2 5.0 5.6 6.0
FAO Budget Balance* (Government’s Presentation) -1.0 0.7 -6.8 -6.8 -6.6
Budget Balance* (2018 Budget) -1.0 0.6 -6.0 -5.9 -5.8
a = Actual f = Forecast
* Budget balance is presented without reserve.
Note: Years represent fiscal years starting in number presented (i.e. 2017 is fiscal year 2017-18). Numbers may not add up due to rounding. All values presented on Auditor General’s recommended accounting standards.
Source: 2018 Ontario Budget, Public Accounts of Ontario and FAO.

Appendices 39
Table 3b: Medium-term FAO debt outlook($ Billions) 2016a 2017f 2018f 2019f 2020f
Budget Balance* -2.4 -3.6 -11.8 -12.4 -12.7
AG Presentation
Accumulated Deficit 205.9 209.5 221.3 233.7 246.4
Net Debt 314.1 324.8 346.7 370.2 393.8
Net Debt to GDP (Per Cent) 39.5 39.1 40.1 41.1 42.0
Impact of Accounting Adjustments 12.4 16.7 21.7 27.3 33.3
Government Presentation
Net Debt 301.6 308.1 325.0 342.9 360.5
Net Debt to GDP (Per Cent) 38.0 37.1 37.6 38.1 38.5
a = Actual f = Forecast
* Budget Balance is presented without reserve.
Note: Years represent fiscal years starting in number presented (i.e. 2017 is fiscal year 2017-18). Numbers may not add up due to rounding. All values presented on Auditor General’s recommended accounting standards.
Source: Statistics Canada, 2018 Ontario Budget and FAO.
Table 4: Extended FAO fiscal outlook ($ Billions) 2021f 2022f 2023f 2024f 2025f
Spending Restraint ProjectionTotal Revenue 169.1 175.2 181.5 188.1 195.0Total Expense 179.9 183.5 186.9 190.3 193.9Program Expense 165.5 168.4 171.2 174.2 177.5Interest on Debt 14.4 15.1 15.6 16.1 16.4
Budget Balance* -10.8 -8.2 -5.3 -2.2 1.1Net Debt to GDP (Per Cent) 42.8 43.1 42.7 42.0 40.8Status Quo Projection Total Revenue 169.1 175.2 181.5 188.1 195.0Total Expense 182.4 189.3 196.2 203.6 211.6Program Expense 167.9 173.9 179.8 186.1 193.0Interest on Debt 14.5 15.4 16.4 17.5 18.7
Budget Balance* -13.3 -14.1 -14.7 -15.4 -16.6Net Debt to GDP (Per Cent) 43.1 43.9 44.4 44.8 45.1Impact of Accounting Adjustments To Budget Balance ($ Billions) 6.0 5.7 5.3 5.0 4.8To Net Debt-to-GDP (Per Cent) 4.0 4.5 4.8 5.1 5.3
a = Actual f = Forecast
*Budget Balance is presented without reserve.
Note: Years represent fiscal years starting in number presented (i.e. 2017 is fiscal year 2017-18). Numbers may not add up due to rounding. All values presented on Auditor General’s recommended accounting standards.
Source: Statistics Canada, 2018 Ontario Budget, Public Accounts of Ontario and FAO.

40 Financial Accountability Office of Ontario | Economic and Budget Outlook
Table 5: Provincial comparisons
* Ontario 2016-17 Fiscal Performance measures are presented after adjustment for pension assets.Source: FAO, Department of Finance Canada’s Fiscal Reference Tables (September 2017) and Statistics Canada.
NL PE NS NB QC Ontario* MB SK AB BCFiscal Performance (2016-17) Total Revenue Per Capita ($) 13,803 11,590 10,345 11,654 12,313 10,069 11,868 11,863 10,009 10,816to GDP (%) 23.5 27.4 23.5 25.8 26.0 17.7 23.1 18.1 13.5 19.5Total Program Expenditures Per Capita ($) 13,743 10,881 9,764 11,041 10,861 9,406 11,818 12,451 12,315 9,697to GDP (%) 23.4 25.7 22.2 24.4 22.9 16.5 23.0 19.0 16.6 17.5Interest on Debt Per Capita ($) 2,097 829 868 918 1,164 838 712 473 240 544to GDP (%) 3.6 2.0 2.0 2.0 2.5 1.5 1.4 0.7 0.3 1.0to Revenue (%) 15.2 7.2 8.4 7.9 9.5 8.3 6.0 4.0 2.4 5.0Total Expenditures Per Capita ($) 15,840 11,710 10,633 11,959 12,025 10,244 12,529 12,924 12,555 10,241to GDP (%) 27.0 27.7 24.2 26.5 25.3 18.0 24.3 19.7 16.9 18.5Primary Balance Per Capita ($) 60 709 581 613 1,451 664 50 -587 -2,305 1,119to GDP (%) 0.2 11.2 1.4 1.8 0.4 0.1 0.1 -0.8 -0.7 0.4Deficit (-) or surplus Level (Millions $) -1,080 -18 150 -231 -100 -2,435 -872 -1,218 -10,784 2,737Per Capita ($) -2,037 -120 158 -305 275 -174 -662 -1,061 -2,546 575to GDP (%) -3.5 -0.3 0.4 -0.7 0.6 -0.3 -1.3 -1.6 -3.4 1.0Net Debt Level (Millions $) 14,251 2,196 14,955 13,997 185,214 314,077 23,111 10,192 -3,919 37,795Per Capita ($) 26,874 14,694 15,765 18,481 22,256 22,472 17,533 8,873 2,101 7,944to GDP (%) 45.8 34.7 35.8 40.9 46.9 39.5 34.1 13.5 2.8 14.3
Economic and Demographic Indicator Growth (2016) (Per Cent) Real GDP 1.9 2.3 0.8 1.2 1.4 2.6 2.2 -0.5 -3.7 3.5Nominal GDP 2.6 4.0 2.8 3.6 2.7 4.3 2.3 -4.0 -4.9 4.8Employment -1.5 -2.3 -0.4 -0.1 0.9 1.1 -0.4 -0.9 -1.6 3.2Population 0.3 1.8 0.8 0.5 0.8 1.4 1.8 1.5 1.4 1.3

Appendices 41
NL PE NS NB QC Ontario* MB SK AB BCFiscal Performance (2016-17) Total Revenue Per Capita ($) 13,803 11,590 10,345 11,654 12,313 10,069 11,868 11,863 10,009 10,816to GDP (%) 23.5 27.4 23.5 25.8 26.0 17.7 23.1 18.1 13.5 19.5Total Program Expenditures Per Capita ($) 13,743 10,881 9,764 11,041 10,861 9,406 11,818 12,451 12,315 9,697to GDP (%) 23.4 25.7 22.2 24.4 22.9 16.5 23.0 19.0 16.6 17.5Interest on Debt Per Capita ($) 2,097 829 868 918 1,164 838 712 473 240 544to GDP (%) 3.6 2.0 2.0 2.0 2.5 1.5 1.4 0.7 0.3 1.0to Revenue (%) 15.2 7.2 8.4 7.9 9.5 8.3 6.0 4.0 2.4 5.0Total Expenditures Per Capita ($) 15,840 11,710 10,633 11,959 12,025 10,244 12,529 12,924 12,555 10,241to GDP (%) 27.0 27.7 24.2 26.5 25.3 18.0 24.3 19.7 16.9 18.5Primary Balance Per Capita ($) 60 709 581 613 1,451 664 50 -587 -2,305 1,119to GDP (%) 0.2 11.2 1.4 1.8 0.4 0.1 0.1 -0.8 -0.7 0.4Deficit (-) or surplus Level (Millions $) -1,080 -18 150 -231 -100 -2,435 -872 -1,218 -10,784 2,737Per Capita ($) -2,037 -120 158 -305 275 -174 -662 -1,061 -2,546 575to GDP (%) -3.5 -0.3 0.4 -0.7 0.6 -0.3 -1.3 -1.6 -3.4 1.0Net Debt Level (Millions $) 14,251 2,196 14,955 13,997 185,214 314,077 23,111 10,192 -3,919 37,795Per Capita ($) 26,874 14,694 15,765 18,481 22,256 22,472 17,533 8,873 2,101 7,944to GDP (%) 45.8 34.7 35.8 40.9 46.9 39.5 34.1 13.5 2.8 14.3
Economic and Demographic Indicator Growth (2016) (Per Cent) Real GDP 1.9 2.3 0.8 1.2 1.4 2.6 2.2 -0.5 -3.7 3.5Nominal GDP 2.6 4.0 2.8 3.6 2.7 4.3 2.3 -4.0 -4.9 4.8Employment -1.5 -2.3 -0.4 -0.1 0.9 1.1 -0.4 -0.9 -1.6 3.2Population 0.3 1.8 0.8 0.5 0.8 1.4 1.8 1.5 1.4 1.3
Related Documents