Economic and Banking Environment Economic and Banking Environment Economic activities slowed notably in the second half of 2008 as a result of the global financial crisis and the downturn among Hong Kong’s major trading partners. Inflationary pressures receded following weaker domestic demand and smaller increases in food prices and rental costs. Unemployment rose towards the end of the year. With the effects of the global financial crisis on the real sector still unfolding, and the depth and length of recessions in major industrialised economies uncertain, there are significant risks to the economic outlook for 2009.

Welcome message from author
This document is posted to help you gain knowledge. Please leave a comment to let me know what you think about it! Share it to your friends and learn new things together.
Transcript
Economic and Banking Environment
34 ANNUAL REPORT 2008 • HONG KONG MONETARY AUTHORITY
Economic and Banking EnvironmentEconomic activities slowed notably in the second half of 2008 as
a result of the global fi nancial crisis and the downturn among
Hong Kong’s major trading partners. Infl ationary pressures
receded following weaker domestic demand and smaller
increases in food prices and rental costs. Unemployment
rose towards the end of the year. With the effects of the global
fi nancial crisis on the real sector still unfolding, and the depth
and length of recessions in major industrialised economies
uncertain, there are signifi cant risks to the economic outlook
for 2009.
35HONG KONG MONETARY AUTHORITY • ANNUAL REPORT 2008
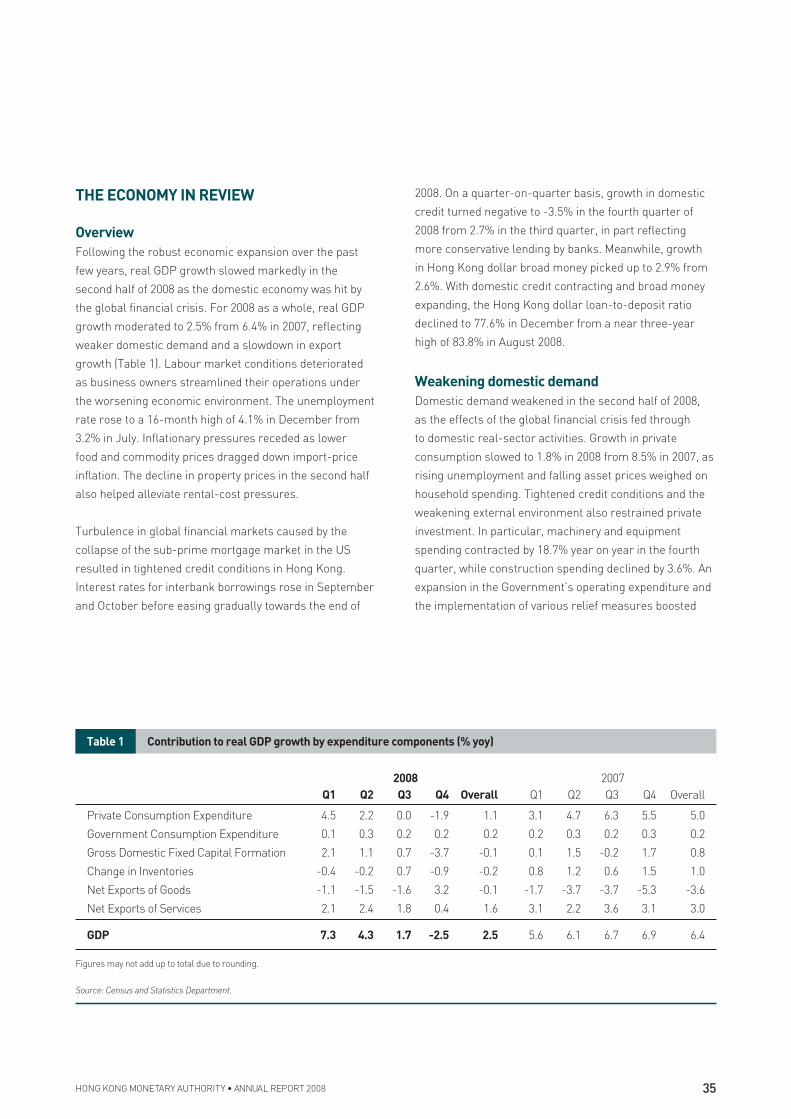
THE ECONOMY IN REVIEW
Overview
Following the robust economic expansion over the past
few years, real GDP growth slowed markedly in the
second half of 2008 as the domestic economy was hit by
the global financial crisis. For 2008 as a whole, real GDP
growth moderated to 2.5% from 6.4% in 2007, reflecting
weaker domestic demand and a slowdown in export
growth (Table 1). Labour market conditions deteriorated
as business owners streamlined their operations under
the worsening economic environment. The unemployment
rate rose to a 16-month high of 4.1% in December from
3.2% in July. Inflationary pressures receded as lower
food and commodity prices dragged down import-price
inflation. The decline in property prices in the second half
also helped alleviate rental-cost pressures.
Turbulence in global financial markets caused by the
collapse of the sub-prime mortgage market in the US
resulted in tightened credit conditions in Hong Kong.
Interest rates for interbank borrowings rose in September
and October before easing gradually towards the end of
Table 1 Contribution to real GDP growth by expenditure components (% yoy)
2008 2007
Q1 Q2 Q3 Q4 Overall Q1 Q2 Q3 Q4 Overall
Private Consumption Expenditure 4.5 2.2 0.0 -1.9 1.1 3.1 4.7 6.3 5.5 5.0
Government Consumption Expenditure 0.1 0.3 0.2 0.2 0.2 0.2 0.3 0.2 0.3 0.2
Gross Domestic Fixed Capital Formation 2.1 1.1 0.7 -3.7 -0.1 0.1 1.5 -0.2 1.7 0.8
Change in Inventories -0.4 -0.2 0.7 -0.9 -0.2 0.8 1.2 0.6 1.5 1.0
Net Exports of Goods -1.1 -1.5 -1.6 3.2 -0.1 -1.7 -3.7 -3.7 -5.3 -3.6
Net Exports of Services 2.1 2.4 1.8 0.4 1.6 3.1 2.2 3.6 3.1 3.0
GDP 7.3 4.3 1.7 -2.5 2.5 5.6 6.1 6.7 6.9 6.4
Figures may not add up to total due to rounding.
Source: Census and Statistics Department.
2008. On a quarter-on-quarter basis, growth in domestic
credit turned negative to -3.5% in the fourth quarter of
2008 from 2.7% in the third quarter, in part reflecting
more conservative lending by banks. Meanwhile, growth
in Hong Kong dollar broad money picked up to 2.9% from
2.6%. With domestic credit contracting and broad money
expanding, the Hong Kong dollar loan-to-deposit ratio
declined to 77.6% in December from a near three-year
high of 83.8% in August 2008.
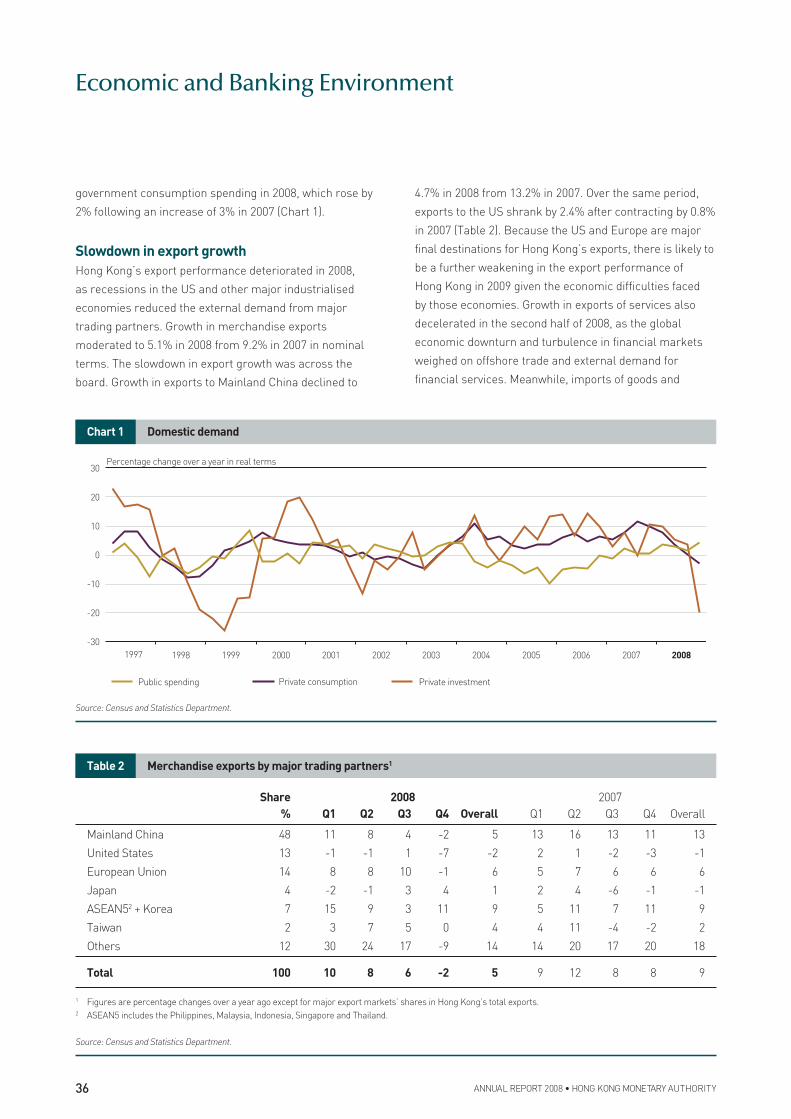
Weakening domestic demand
Domestic demand weakened in the second half of 2008,
as the effects of the global financial crisis fed through
to domestic real-sector activities. Growth in private
consumption slowed to 1.8% in 2008 from 8.5% in 2007, as
rising unemployment and falling asset prices weighed on
household spending. Tightened credit conditions and the
weakening external environment also restrained private
investment. In particular, machinery and equipment
spending contracted by 18.7% year on year in the fourth
quarter, while construction spending declined by 3.6%. An
expansion in the Government’s operating expenditure and
the implementation of various relief measures boosted
Economic and Banking Environment
36 ANNUAL REPORT 2008 • HONG KONG MONETARY AUTHORITY
government consumption spending in 2008, which rose by
2% following an increase of 3% in 2007 (Chart 1).
Slowdown in export growth
Hong Kong’s export performance deteriorated in 2008,
as recessions in the US and other major industrialised
economies reduced the external demand from major
trading partners. Growth in merchandise exports
moderated to 5.1% in 2008 from 9.2% in 2007 in nominal
terms. The slowdown in export growth was across the
board. Growth in exports to Mainland China declined to
Chart 1 Domestic demand
10
20
30Percentage change over a year in real terms
-30
-20
-10
0
1997 1998 1999 2000 2001 2002 2003 2004 2005 2006 2007 2008
Private consumption Private investmentPublic spending
Source: Census and Statistics Department.
Table 2 Merchandise exports by major trading partners1
Share 2008 2007
% Q1 Q2 Q3 Q4 Overall Q1 Q2 Q3 Q4 Overall
Mainland China 48 11 8 4 -2 5 13 16 13 11 13
United States 13 -1 -1 1 -7 -2 2 1 -2 -3 -1
European Union 14 8 8 10 -1 6 5 7 6 6 6
Japan 4 -2 -1 3 4 1 2 4 -6 -1 -1
ASEAN52 + Korea 7 15 9 3 11 9 5 11 7 11 9
Taiwan 2 3 7 5 0 4 4 11 -4 -2 2
Others 12 30 24 17 -9 14 14 20 17 20 18
Total 100 10 8 6 -2 5 9 12 8 8 9
1 Figures are percentage changes over a year ago except for major export markets’ shares in Hong Kong’s total exports.2 ASEAN5 includes the Philippines, Malaysia, Indonesia, Singapore and Thailand.
Source: Census and Statistics Department.
4.7% in 2008 from 13.2% in 2007. Over the same period,
exports to the US shrank by 2.4% after contracting by 0.8%
in 2007 (Table 2). Because the US and Europe are major
final destinations for Hong Kong’s exports, there is likely to
be a further weakening in the export performance of
Hong Kong in 2009 given the economic difficulties faced
by those economies. Growth in exports of services also
decelerated in the second half of 2008, as the global
economic downturn and turbulence in financial markets
weighed on offshore trade and external demand for
financial services. Meanwhile, imports of goods and
37HONG KONG MONETARY AUTHORITY • ANNUAL REPORT 2008
Chart 2 Overall trade balance and export growth (in nominal terms)
0
-20
-10
10
20
30
40
0
-20
-10
10
20
30
40
Overall trade balance (Right-hand scale) Exports of goods (Left-hand scale)
1997 1998 1999 2000 2001 2002 2003 2004 2005 2006 2007 2008
Exports of services (Left-hand scale)
Percentage change over a year In % of GDP
Source: Census and Statistics Department.
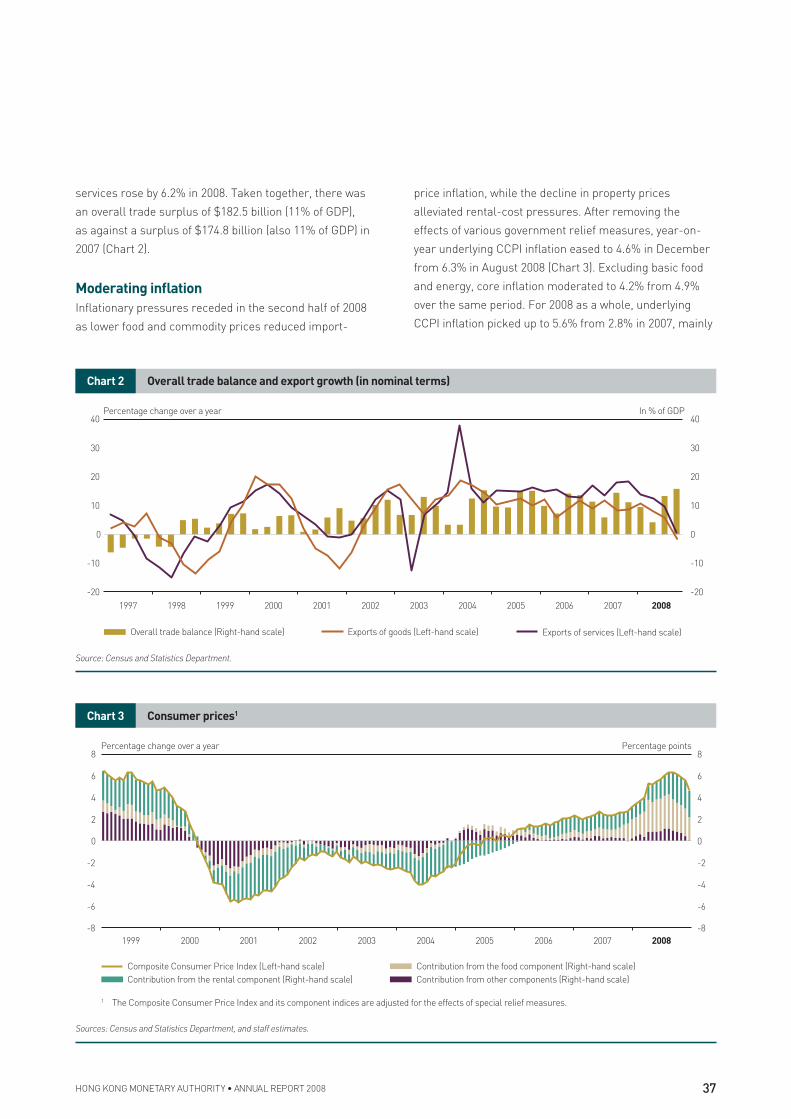
services rose by 6.2% in 2008. Taken together, there was
an overall trade surplus of $182.5 billion (11% of GDP),
as against a surplus of $174.8 billion (also 11% of GDP) in
2007 (Chart 2).
Moderating infl ation
Inflationary pressures receded in the second half of 2008
as lower food and commodity prices reduced import-
price inflation, while the decline in property prices
alleviated rental-cost pressures. After removing the
effects of various government relief measures, year-on-
year underlying CCPI inflation eased to 4.6% in December
from 6.3% in August 2008 (Chart 3). Excluding basic food
and energy, core inflation moderated to 4.2% from 4.9%
over the same period. For 2008 as a whole, underlying
CCPI inflation picked up to 5.6% from 2.8% in 2007, mainly
Chart 3 Consumer prices1
2008200720062005200420032002200120001999
Composite Consumer Price Index (Left-hand scale)
Contribution from the rental component (Right-hand scale)
1 The Composite Consumer Price Index and its component indices are adjusted for the effects of special relief measures.
Contribution from the food component (Right-hand scale)
Contribution from other components (Right-hand scale)
-8
-6
-4
-2
0
2
4
6
8
-8
-6
-4
-2
0
2
4
6
8Percentage change over a year Percentage points
Sources: Census and Statistics Department, and staff estimates.
Economic and Banking Environment
38 ANNUAL REPORT 2008 • HONG KONG MONETARY AUTHORITY
Plummeting stock prices
The bankruptcy of Lehman Brothers and the failure of a
number of large financial institutions in the US and Europe
triggered a wave of selling in global stock markets, putting
downward pressure on domestic equity prices. The
Hang Seng Index (HSI) lost nearly half its value during
2008, closing at 14,387 at the end of the year. The decline
was across the board, with financial and property-related
stocks registering the biggest drop in value, while the
H-share index fell more than 50% in 2008. Heightened
risk aversion and shattered investor confidence restrained
stock market activities, with the average daily turnover
shrinking by 18% to $71.8 billion in 2008. The sharp decline
in equity prices drove down the price/earnings ratio of
the HSI to 8.5 times at the end of 2008 from 21 times a
year earlier. The domestic stock market is expected to
remain volatile in the near term given the uncertain global
economic outlook.
driven by higher food prices and rental costs. With the
stabilisation of food prices in Mainland China and the
moderation in market housing rents, consumer price
inflation is expected to ease further in the first half of 2009.
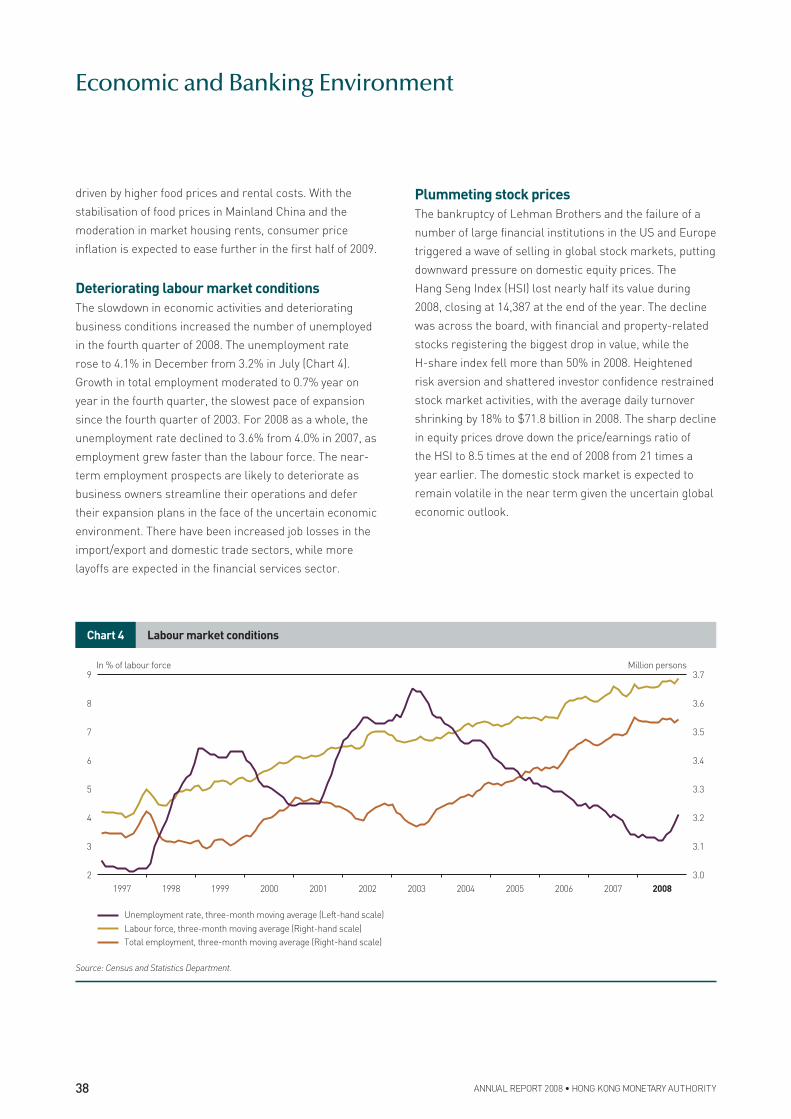
Deteriorating labour market conditions
The slowdown in economic activities and deteriorating
business conditions increased the number of unemployed
in the fourth quarter of 2008. The unemployment rate
rose to 4.1% in December from 3.2% in July (Chart 4).
Growth in total employment moderated to 0.7% year on
year in the fourth quarter, the slowest pace of expansion
since the fourth quarter of 2003. For 2008 as a whole, the
unemployment rate declined to 3.6% from 4.0% in 2007, as
employment grew faster than the labour force. The near-
term employment prospects are likely to deteriorate as
business owners streamline their operations and defer
their expansion plans in the face of the uncertain economic
environment. There have been increased job losses in the
import/export and domestic trade sectors, while more
layoffs are expected in the financial services sector.
Chart 4 Labour market conditions
9
8
7
6
5
4
3
2
3.7
3.6
3.5
3.4
3.3
3.2
3.1
3.0
1997 1999 20001998 2001 2002 2003 2004 2005 2006 2007 2008
Labour force, three-month moving average (Right-hand scale)
Total employment, three-month moving average (Right-hand scale)
Unemployment rate, three-month moving average (Left-hand scale)
In % of labour force Million persons
Source: Census and Statistics Department.
39HONG KONG MONETARY AUTHORITY • ANNUAL REPORT 2008
Downturn in the property market
The residential property market experienced a marked
downturn in the second half of 2008, reversing most of
the gains recorded between late 2007 and early 2008.
By the end of 2008, house prices declined by 17% and
transaction volumes by 54% from June, as tightened credit
and worsening economic prospects restrained demand
from home buyers. The sharp correction in property prices
also exerted downward pressure on rental costs, which
declined by 19% for residential property and by 4% for
office space between June and December 2008. Increased
uncertainty surrounding the economic outlook and less
favourable labour market conditions will continue to weigh
on property market activity in 2009.
OUTLOOK FOR THE ECONOMY
Slowdown in economic growth
The economic outlook for 2009 has deteriorated. Domestic
demand is expected to weaken as rising unemployment
and worsening business conditions drag down both
household and business spending. Re-export trade
and exports of services may slow further in the face of
recessions in the economies of our major trading partners.
Market consensus suggests that the domestic economy
will contract by 3.4% in 2009, as economic activities are
likely to decline in the first half of the year. The prospects
of a recovery hinge on the duration of the US recession
and the resilience of Mainland China’s economy in
withstanding the recession in developed economies.
Easing infl ation and rising unemployment
Consumer price inflation is likely to ease further in 2009
as domestic cost pressures moderate due to weaker
aggregate demand. Lower food costs and energy prices
will keep import-price inflation in check. Residential rents,
which have been a major contributor to inflation, are likely
to continue their downward trend in early 2009 following
the sharp decline in house prices in 2008. Unemployment
may rise, as the weakening external environment and
deteriorating business sentiment continue to restrain
employment growth.
Uncertainties and risks
There are significant risks to the economic outlook for
2009 as the impact of the global financial crisis on the
domestic real sector is still unfolding and the depth and
length of recessions in major industrialised economies
remain uncertain. Sharper-than-expected recessions
in the US and Europe, continuing turbulence in global
financial markets and a more visible slowdown in the
Mainland economy would deepen and prolong the
economic downturn in Hong Kong. Despite this highly
uncertain external environment, the domestic economy
may weather the current global financial crisis better than
the Asian financial crisis in 1997-98. The Asian region,
particularly Mainland China, has much stronger economic
fundamentals than a decade ago, and policymakers have
room for manoeuvre, as demonstrated by the RMB4 trillion
fiscal package announced by the Mainland authorities.
The ultra loose monetary policy in the US has cushioned
the Hong Kong economy under the Linked Exchange
Rate system in the current downturn. Policy measures
unveiled in the 2008/09 Budget and the supplementary
relief measures announced by the Chief Executive in
July 2008 have also provided a timely fiscal stimulus to
the real economy.
› Publications › Half-Yearly Monetary and Financial Stability Report
› Statistics
Economic and Banking Environment
40 ANNUAL REPORT 2008 • HONG KONG MONETARY AUTHORITY
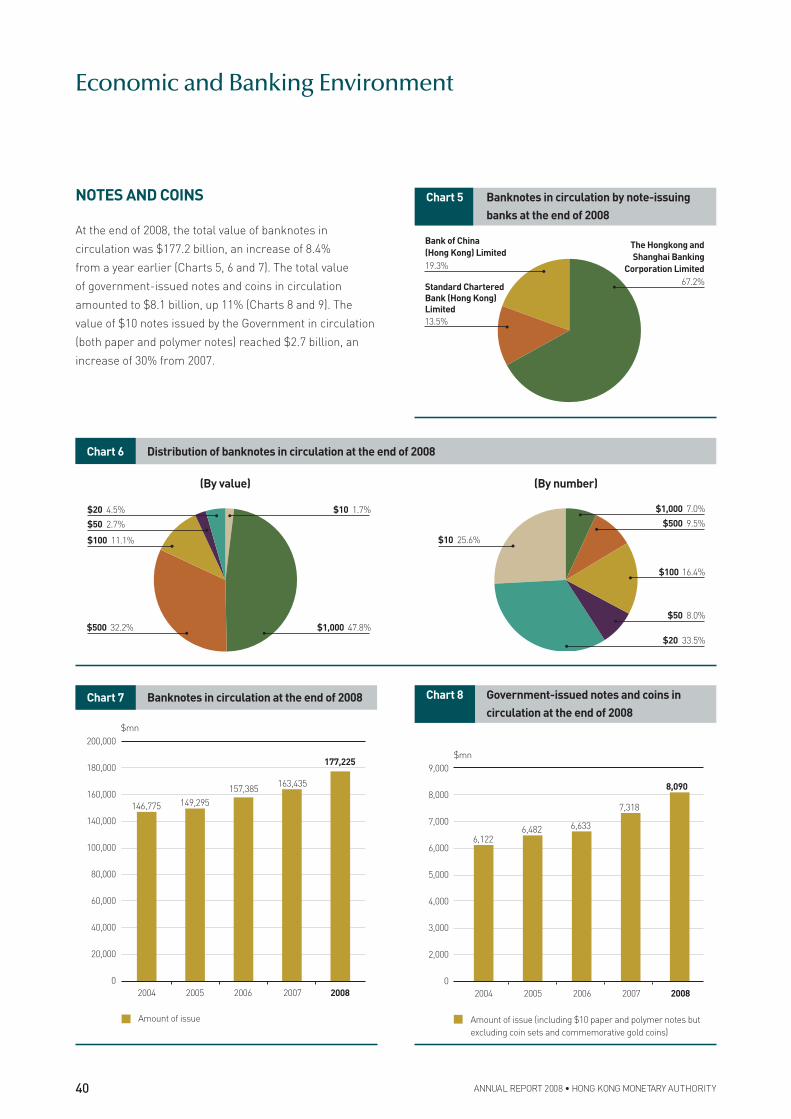
NOTES AND COINS
At the end of 2008, the total value of banknotes in
circulation was $177.2 billion, an increase of 8.4%
from a year earlier (Charts 5, 6 and 7). The total value
of government-issued notes and coins in circulation
amounted to $8.1 billion, up 11% (Charts 8 and 9). The
value of $10 notes issued by the Government in circulation
(both paper and polymer notes) reached $2.7 billion, an
increase of 30% from 2007.
Chart 5 Banknotes in circulation by note-issuing
banks at the end of 2008
The Hongkong and
Shanghai Banking
Corporation Limited
67.2%
Bank of China
(Hong Kong) Limited
19.3%
Standard Chartered
Bank (Hong Kong)
Limited
13.5%
Chart 6 Distribution of banknotes in circulation at the end of 2008
(By value)
$10 1.7%
$1,000 47.8%
$20 4.5%
$50 2.7%
$100 11.1%
$500 32.2%
(By number)
$1,000 7.0%
$500 9.5%
$50 8.0%
$20 33.5%
$100 16.4%
$10 25.6%
Chart 7 Banknotes in circulation at the end of 2008 Chart 8 Government-issued notes and coins in
circulation at the end of 2008
200,000
180,000
160,000
140,000
100,000
80,000
60,000
40,000
20,000
0
$mn
20082007200620052004
177,225
163,435157,385149,295146,775
Amount of issue
9,000
8,000
7,000
6,000
5,000
4,000
3,000
2,000
0
$mn
20082007200620052004
8,090
7,318
6,6336,4826,122
Amount of issue (including $10 paper and polymer notes but excluding coin sets and commemorative gold coins)
41HONG KONG MONETARY AUTHORITY • ANNUAL REPORT 2008
Hong Kong banknotes
Public education programmes on the security features
of the latest series of banknotes issued in 2003 and
2004 continued to be well received. During the year,
31 seminars were organised for over 3,200 bank tellers
and retail cashiers, providing them with knowledge and
skills for authenticating banknotes.
The HKMA continued its efforts to promote the use of
“good-as-new notes”, instead of brand new notes for
lai see (customary gifts of money given during Chinese
New Year). During the year, the HKMA organised a cartoon
competition for secondary school students in Hong Kong
to promote the use of the “good-as-new notes”. Over 750
students participated.
$10 polymer note
The Hong Kong $10 polymer note, which was launched
in mid-2007, was in continuous demand. More than
96 million polymer notes were in circulation at the end
of 2008, representing 36% of the $10 notes issued by the
Government.
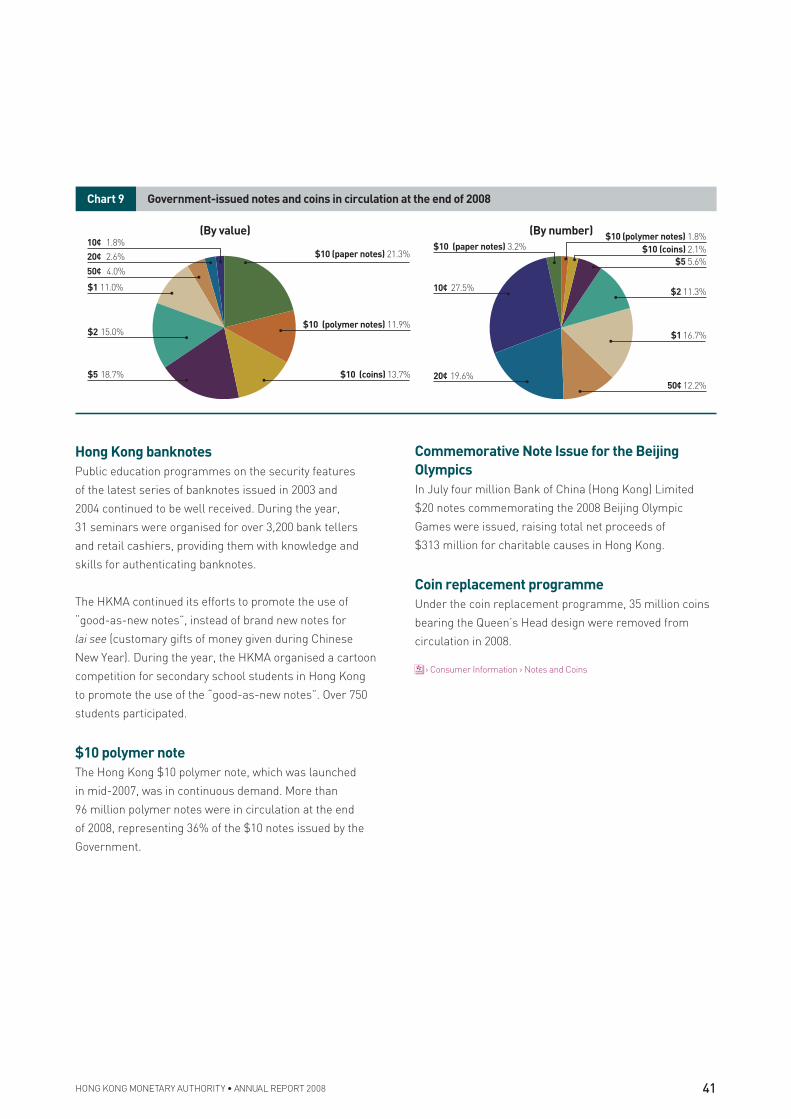
Chart 9 Government-issued notes and coins in circulation at the end of 2008
(By value)
$10 (paper notes) 21.3%
$10 (polymer notes) 11.9%
$10 (coins) 13.7%
20¢ 2.6%
10¢ 1.8%
50¢ 4.0%
$1 11.0%
$5 18.7%
$2 15.0%
(By number) $10 (polymer notes) 1.8%$10 (coins) 2.1%
$1 16.7%
50¢ 12.2%
$2 11.3%
$5 5.6%
10¢ 27.5%
$10 (paper notes) 3.2%
20¢ 19.6%
Commemorative Note Issue for the Beijing
Olympics
In July four million Bank of China (Hong Kong) Limited
$20 notes commemorating the 2008 Beijing Olympic
Games were issued, raising total net proceeds of
$313 million for charitable causes in Hong Kong.
Coin replacement programme
Under the coin replacement programme, 35 million coins
bearing the Queen’s Head design were removed from
circulation in 2008.
› Consumer Information › Notes and Coins
Economic and Banking Environment
42 ANNUAL REPORT 2008 • HONG KONG MONETARY AUTHORITY
PERFORMANCE OF THE BANKING SECTOR
Despite a challenging year with profits adversely affected
by the global financial crisis, the Hong Kong banking
sector remained financially sound and well capitalised.
Various asset quality indicators remained good by
historical standards, although signs of deterioration in a
few of the indicators appeared towards the end of the year.
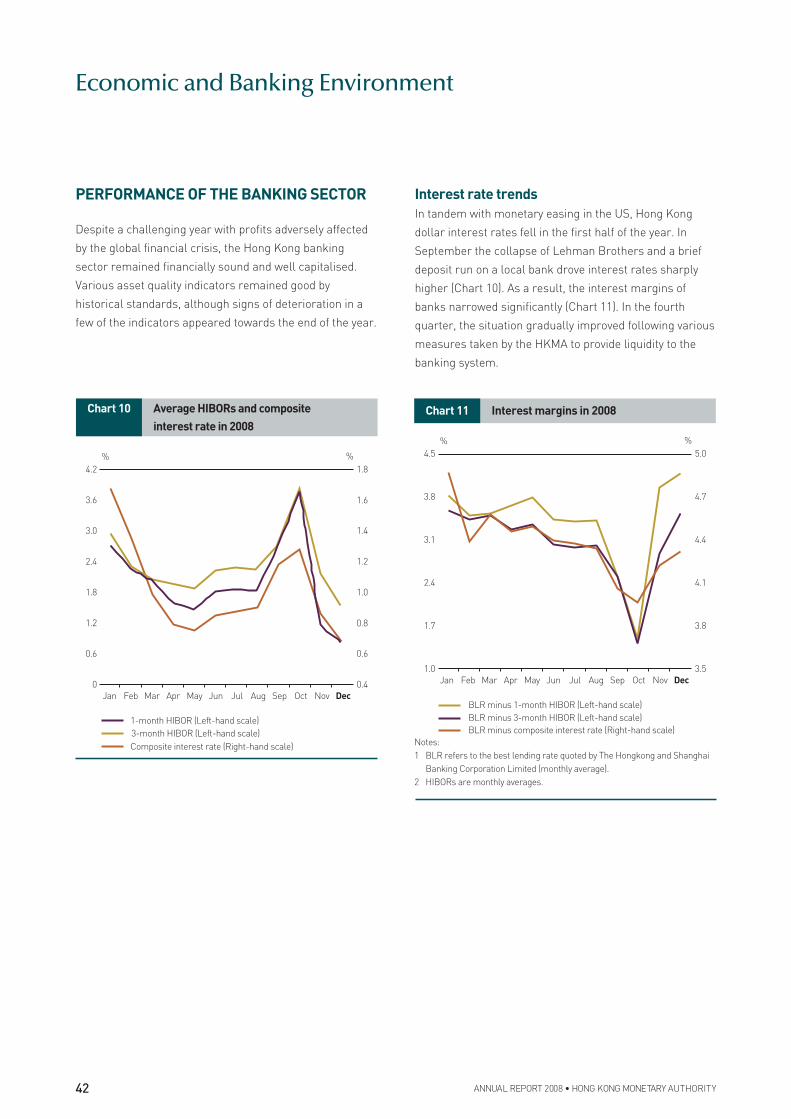
Interest rate trends
In tandem with monetary easing in the US, Hong Kong
dollar interest rates fell in the first half of the year. In
September the collapse of Lehman Brothers and a brief
deposit run on a local bank drove interest rates sharply
higher (Chart 10). As a result, the interest margins of
banks narrowed significantly (Chart 11). In the fourth
quarter, the situation gradually improved following various
measures taken by the HKMA to provide liquidity to the
banking system.
Chart 10 Average HIBORs and composite
interest rate in 2008
% %
Jan Feb Mar Apr May Jun Jul Aug Sep NovOct Dec
1-month HIBOR (Left-hand scale)3-month HIBOR (Left-hand scale)
2.4
3.6
3.0
4.2
1.4
1.6
1.8
0
0.6
1.2
1.8
0.4
0.6
0.8
1.0
1.2
Composite interest rate (Right-hand scale)
Chart 11 Interest margins in 2008
% %
Jan Feb Mar Apr May Jun Jul Aug Sep NovOct Dec
BLR minus 3-month HIBOR (Left-hand scale)BLR minus 1-month HIBOR (Left-hand scale)
BLR minus composite interest rate (Right-hand scale)
3.8
4.5
4.4
4.7
5.0
1.0
1.7
2.4
3.1
3.5
3.8
4.1
Notes:
1 BLR refers to the best lending rate quoted by The Hongkong and Shanghai
Banking Corporation Limited (monthly average).
2 HIBORs are monthly averages.
43HONG KONG MONETARY AUTHORITY • ANNUAL REPORT 2008
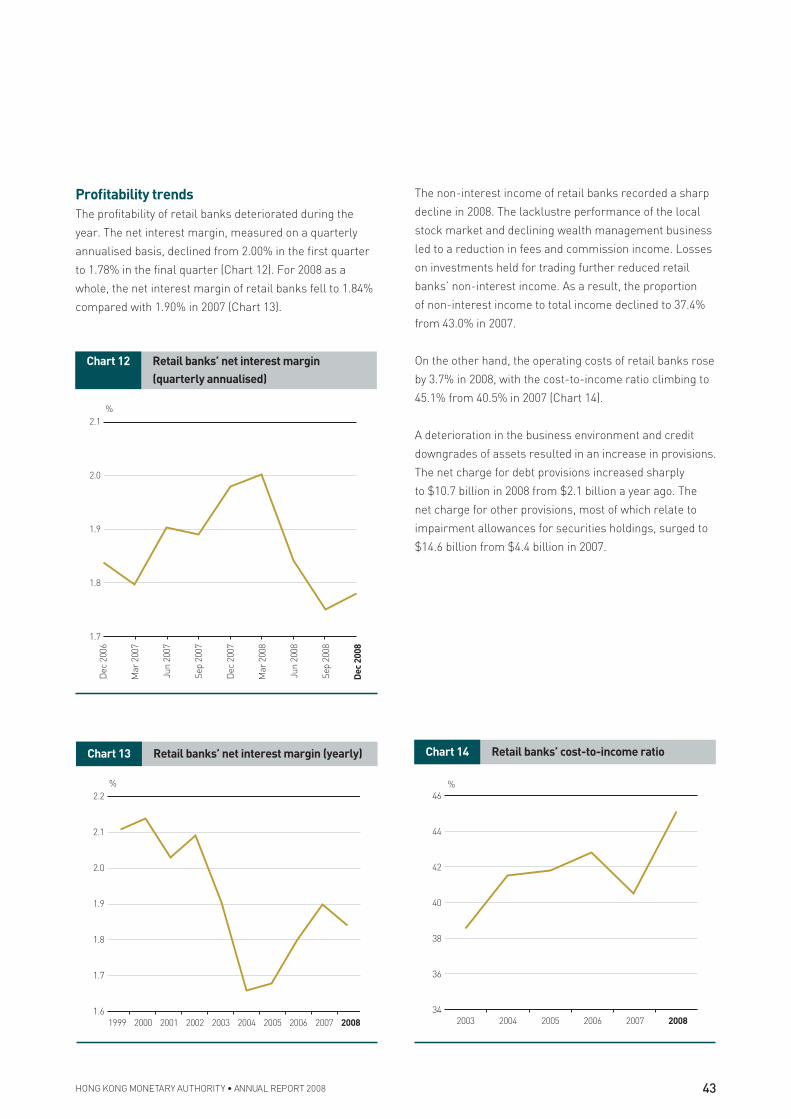
Profi tability trends
The profitability of retail banks deteriorated during the
year. The net interest margin, measured on a quarterly
annualised basis, declined from 2.00% in the first quarter
to 1.78% in the final quarter (Chart 12). For 2008 as a
whole, the net interest margin of retail banks fell to 1.84%
compared with 1.90% in 2007 (Chart 13).
The non-interest income of retail banks recorded a sharp
decline in 2008. The lacklustre performance of the local
stock market and declining wealth management business
led to a reduction in fees and commission income. Losses
on investments held for trading further reduced retail
banks’ non-interest income. As a result, the proportion
of non-interest income to total income declined to 37.4%
from 43.0% in 2007.
On the other hand, the operating costs of retail banks rose
by 3.7% in 2008, with the cost-to-income ratio climbing to
45.1% from 40.5% in 2007 (Chart 14).
A deterioration in the business environment and credit
downgrades of assets resulted in an increase in provisions.
The net charge for debt provisions increased sharply
to $10.7 billion in 2008 from $2.1 billion a year ago. The
net charge for other provisions, most of which relate to
impairment allowances for securities holdings, surged to
$14.6 billion from $4.4 billion in 2007.
Chart 12 Retail banks’ net interest margin
(quarterly annualised)
%
Dec
200
6
Mar
200
7
Jun
2007
Sep
2007
Dec
200
7
Mar
200
8
Jun
2008
Sep
2008
Dec
200
8
2.0
2.1
1.7
1.8
1.9
Chart 13 Retail banks’ net interest margin (yearly)
%
1999 2000 2001 2002 2003 2004 2005 20072006 2008
2.0
2.2
2.1
1.6
1.8
1.7
1.9
Chart 14 Retail banks’ cost-to-income ratio
%
2003 2004 2005 2006 2007 2008
42
44
46
34
36
38
40
Economic and Banking Environment
44 ANNUAL REPORT 2008 • HONG KONG MONETARY AUTHORITY
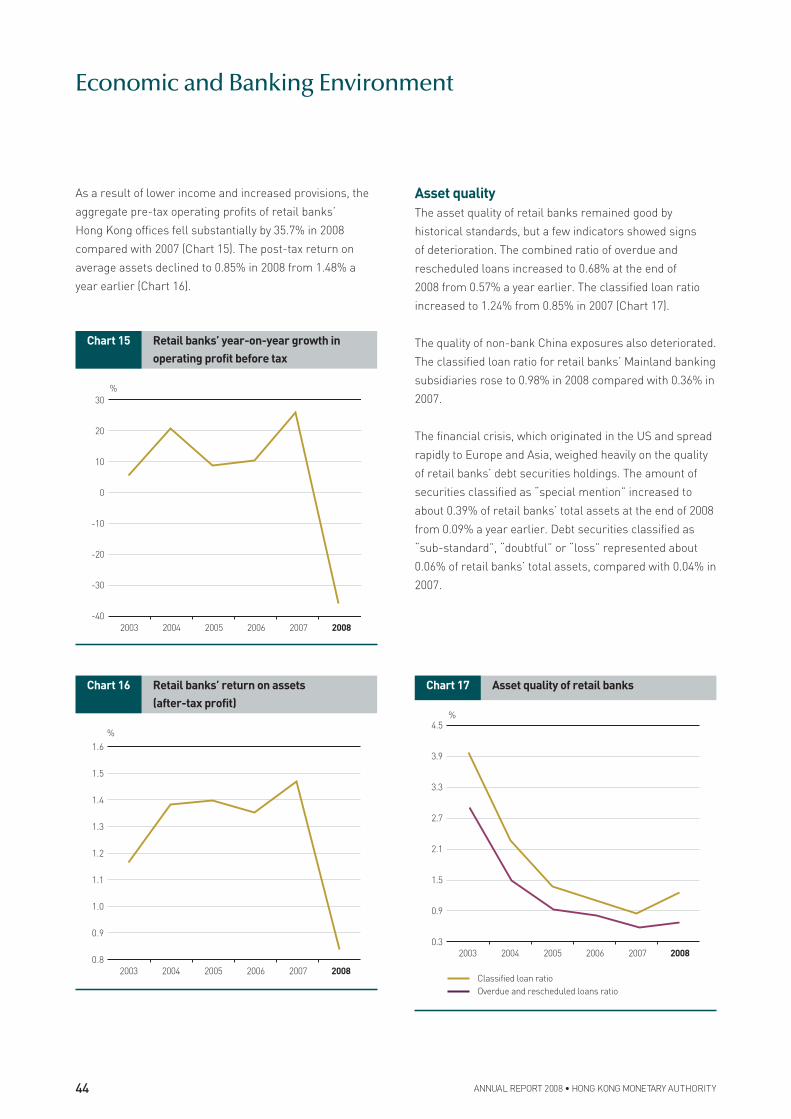
As a result of lower income and increased provisions, the
aggregate pre-tax operating profits of retail banks’
Hong Kong offices fell substantially by 35.7% in 2008
compared with 2007 (Chart 15). The post-tax return on
average assets declined to 0.85% in 2008 from 1.48% a
year earlier (Chart 16).
Asset quality
The asset quality of retail banks remained good by
historical standards, but a few indicators showed signs
of deterioration. The combined ratio of overdue and
rescheduled loans increased to 0.68% at the end of
2008 from 0.57% a year earlier. The classified loan ratio
increased to 1.24% from 0.85% in 2007 (Chart 17).
The quality of non-bank China exposures also deteriorated.
The classified loan ratio for retail banks’ Mainland banking
subsidiaries rose to 0.98% in 2008 compared with 0.36% in
2007.
The financial crisis, which originated in the US and spread
rapidly to Europe and Asia, weighed heavily on the quality
of retail banks’ debt securities holdings. The amount of
securities classified as “special mention” increased to
about 0.39% of retail banks’ total assets at the end of 2008
from 0.09% a year earlier. Debt securities classified as
“sub-standard”, “doubtful” or “loss” represented about
0.06% of retail banks’ total assets, compared with 0.04% in
2007.
Chart 15 Retail banks’ year-on-year growth in
operating profit before tax
2003 2004 2005 2006 2007 2008
10
20
30 %
-40
-30
-20
-10
0
Chart 16 Retail banks’ return on assets
(after-tax profit)
2003 2004 2005 2006 2007 2008
1.3
1.4
1.5
1.6 %
0.8
0.9
1.0
1.1
1.2
Chart 17 Asset quality of retail banks
2003 2004 2005 2006 2007 2008
2.7
3.3
3.9
4.5 %
0.3
0.9
1.5
2.1
Overdue and rescheduled loans ratioClassified loan ratio
45HONG KONG MONETARY AUTHORITY • ANNUAL REPORT 2008
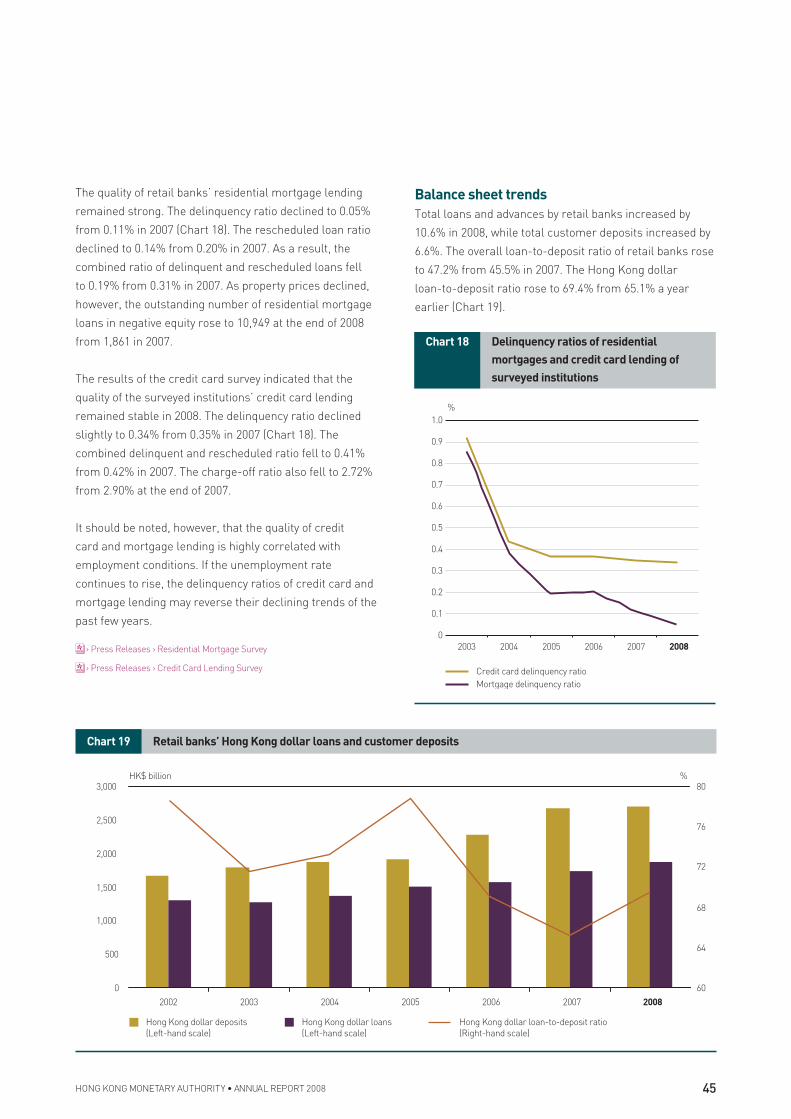
The quality of retail banks’ residential mortgage lending
remained strong. The delinquency ratio declined to 0.05%
from 0.11% in 2007 (Chart 18). The rescheduled loan ratio
declined to 0.14% from 0.20% in 2007. As a result, the
combined ratio of delinquent and rescheduled loans fell
to 0.19% from 0.31% in 2007. As property prices declined,
however, the outstanding number of residential mortgage
loans in negative equity rose to 10,949 at the end of 2008
from 1,861 in 2007.
The results of the credit card survey indicated that the
quality of the surveyed institutions’ credit card lending
remained stable in 2008. The delinquency ratio declined
slightly to 0.34% from 0.35% in 2007 (Chart 18). The
combined delinquent and rescheduled ratio fell to 0.41%
from 0.42% in 2007. The charge-off ratio also fell to 2.72%
from 2.90% at the end of 2007.
It should be noted, however, that the quality of credit
card and mortgage lending is highly correlated with
employment conditions. If the unemployment rate
continues to rise, the delinquency ratios of credit card and
mortgage lending may reverse their declining trends of the
past few years.
› Press Releases › Residential Mortgage Survey
› Press Releases › Credit Card Lending Survey
Balance sheet trends
Total loans and advances by retail banks increased by
10.6% in 2008, while total customer deposits increased by
6.6%. The overall loan-to-deposit ratio of retail banks rose
to 47.2% from 45.5% in 2007. The Hong Kong dollar
loan-to-deposit ratio rose to 69.4% from 65.1% a year
earlier (Chart 19).
Chart 19 Retail banks’ Hong Kong dollar loans and customer deposits
0
500
1,000
1,500
2,000
2,500
3,000
2002
HK$ billion %
60
64
68
72
76
80
Hong Kong dollar deposits(Left-hand scale)
Hong Kong dollar loans(Left-hand scale)
Hong Kong dollar loan-to-deposit ratio(Right-hand scale)
200820072006200520042003
Chart 18 Delinquency ratios of residential
mortgages and credit card lending of
surveyed institutions
%
2003 2004 2005 2006 2007 2008
0.6
1.0
0.8
0.9
0.7
0
0.3
0.2
0.1
0.4
0.5
Mortgage delinquency ratioCredit card delinquency ratio
Economic and Banking Environment
46 ANNUAL REPORT 2008 • HONG KONG MONETARY AUTHORITY
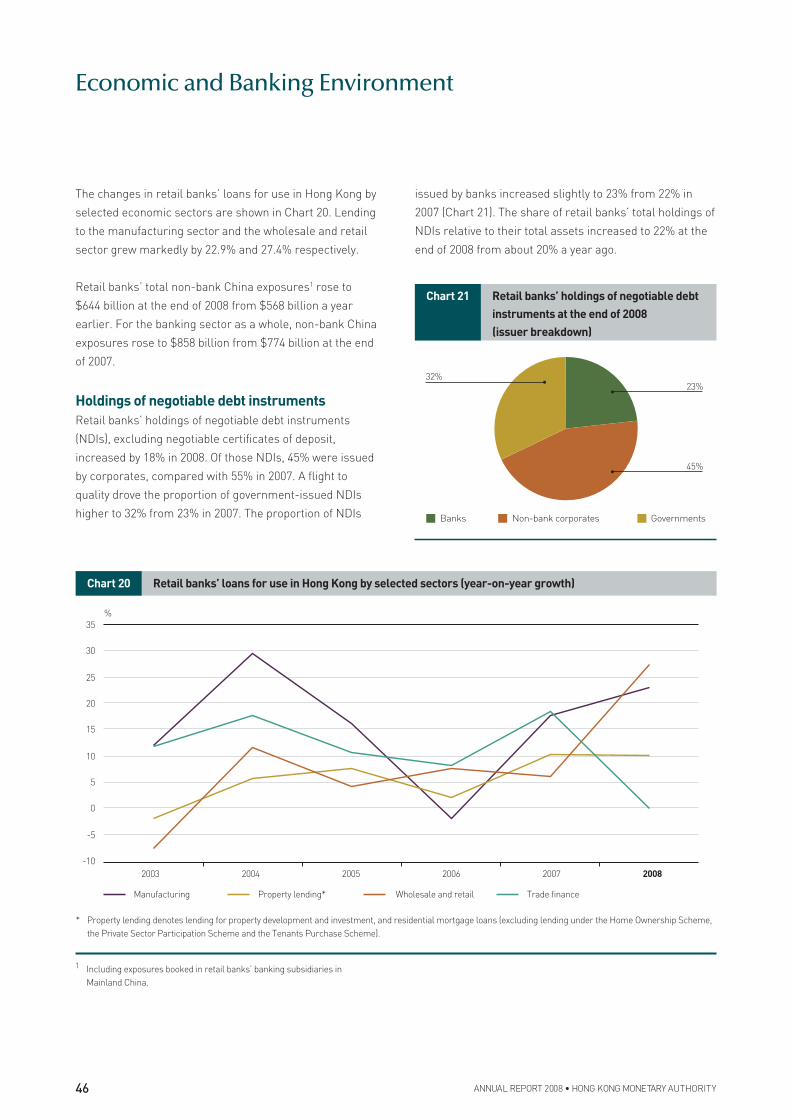
The changes in retail banks’ loans for use in Hong Kong by
selected economic sectors are shown in Chart 20. Lending
to the manufacturing sector and the wholesale and retail
sector grew markedly by 22.9% and 27.4% respectively.
Retail banks’ total non-bank China exposures1 rose to
$644 billion at the end of 2008 from $568 billion a year
earlier. For the banking sector as a whole, non-bank China
exposures rose to $858 billion from $774 billion at the end
of 2007.
Holdings of negotiable debt instruments
Retail banks’ holdings of negotiable debt instruments
(NDIs), excluding negotiable certificates of deposit,
increased by 18% in 2008. Of those NDIs, 45% were issued
by corporates, compared with 55% in 2007. A flight to
quality drove the proportion of government-issued NDIs
higher to 32% from 23% in 2007. The proportion of NDIs
Chart 21 Retail banks’ holdings of negotiable debt
instruments at the end of 2008
(issuer breakdown)
Banks Non-bank corporates Governments
32%23%
45%
Chart 20 Retail banks’ loans for use in Hong Kong by selected sectors (year-on-year growth)
-10
-5
0
5
10
15
20
25
30
35
2003
%
Manufacturing Property lending* Wholesale and retail Trade finance
20082007200620052004
* Property lending denotes lending for property development and investment, and residential mortgage loans (excluding lending under the Home Ownership Scheme,
the Private Sector Participation Scheme and the Tenants Purchase Scheme).
1 Including exposures booked in retail banks’ banking subsidiaries in
Mainland China.
issued by banks increased slightly to 23% from 22% in
2007 (Chart 21). The share of retail banks’ total holdings of
NDIs relative to their total assets increased to 22% at the
end of 2008 from about 20% a year ago.
47HONG KONG MONETARY AUTHORITY • ANNUAL REPORT 2008
Chart 22 Consolidated capital adequacy ratio of
locally incorporated AIs
6
7
8
9
10
11
12
13
14
15
16
2003
%
Capital adequacy ratio Tier-one capital adequacy ratio
20082007200620052004
Chart 23 Retail banks’ liquidity ratio
(quarterly average)
20
25
30
35
40
45
50
55
Dec 2003
%
Dec 2008Dec 2007Dec 2006Dec 2005Dec 2004
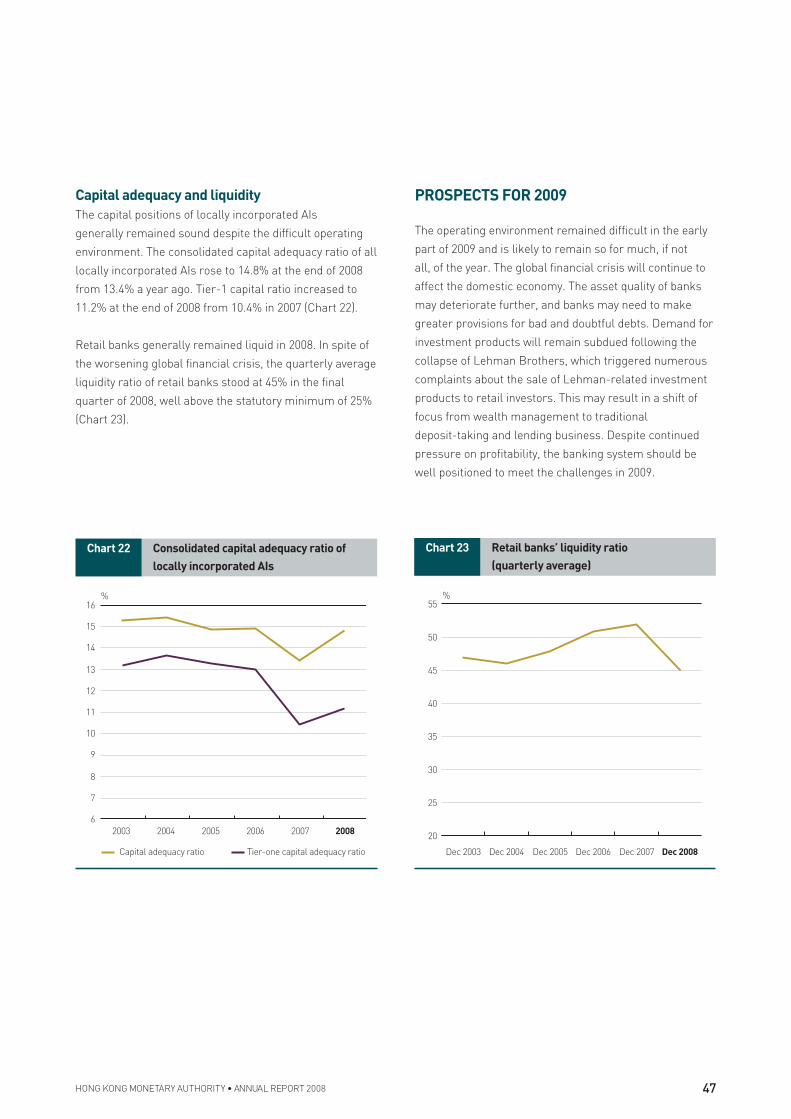
Capital adequacy and liquidity
The capital positions of locally incorporated AIs
generally remained sound despite the difficult operating
environment. The consolidated capital adequacy ratio of all
locally incorporated AIs rose to 14.8% at the end of 2008
from 13.4% a year ago. Tier-1 capital ratio increased to
11.2% at the end of 2008 from 10.4% in 2007 (Chart 22).
Retail banks generally remained liquid in 2008. In spite of
the worsening global financial crisis, the quarterly average
liquidity ratio of retail banks stood at 45% in the final
quarter of 2008, well above the statutory minimum of 25%
(Chart 23).
PROSPECTS FOR 2009
The operating environment remained difficult in the early
part of 2009 and is likely to remain so for much, if not
all, of the year. The global financial crisis will continue to
affect the domestic economy. The asset quality of banks
may deteriorate further, and banks may need to make
greater provisions for bad and doubtful debts. Demand for
investment products will remain subdued following the
collapse of Lehman Brothers, which triggered numerous
complaints about the sale of Lehman-related investment
products to retail investors. This may result in a shift of
focus from wealth management to traditional
deposit-taking and lending business. Despite continued
pressure on profitability, the banking system should be
well positioned to meet the challenges in 2009.
Related Documents