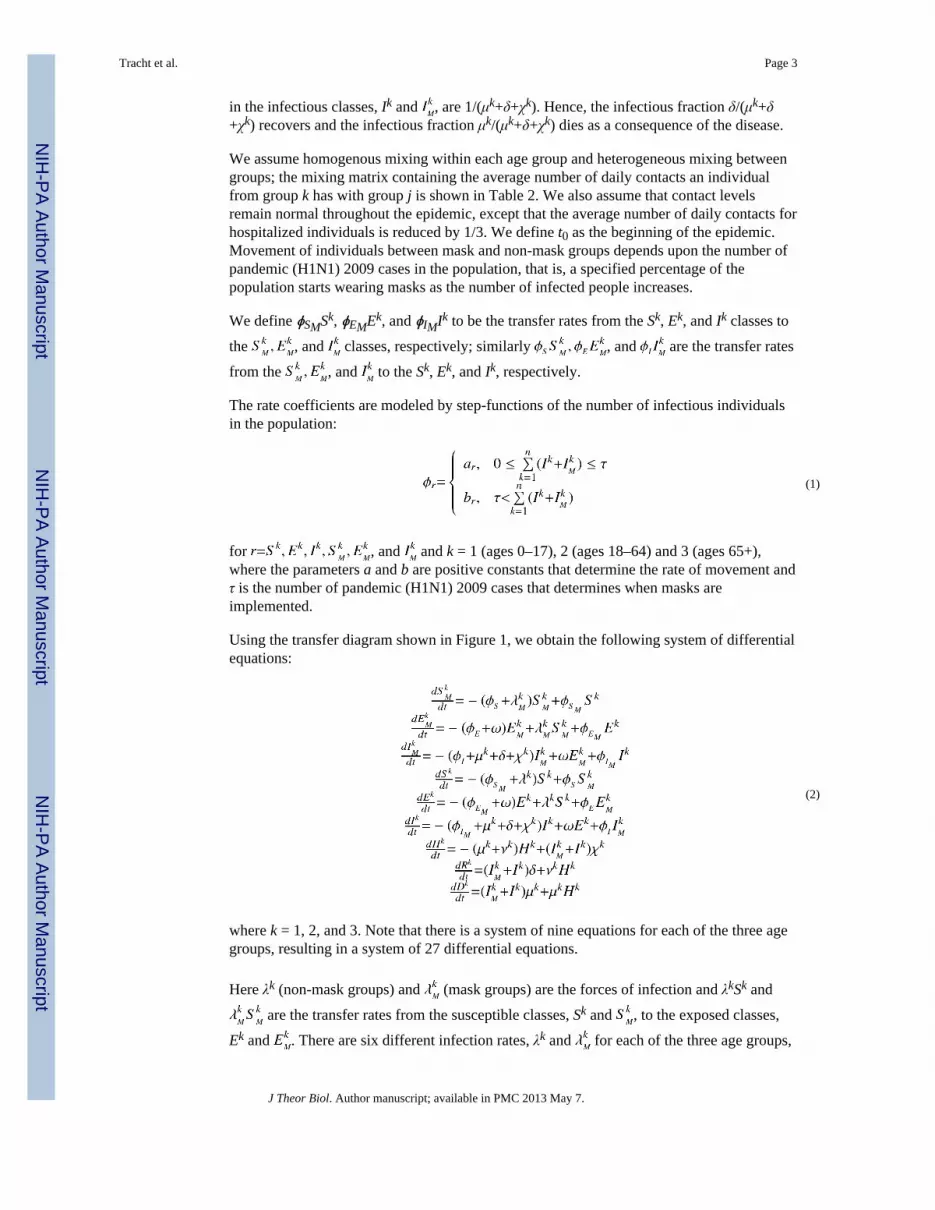
Economic Analysis of the Use of Facemasks During Pandemic (H1N1) 2009 Samantha M. Tracht a,b,* , Sara Y. Del Valle a , and Brian K. Edwards a a Energy & Infrastructure Analysis Group, Decisions Applications Division, Los Alamos National Laboratory, Los Alamos, NM b Mathematics Department, University of Tennessee, Knoxville, TN Abstract A large-scale pandemic could cause severe health, social, and economic impacts. The recent 2009 H1N1 pandemic confirmed the need for mitigation strategies that are cost-effective and easy to implement. Typically, in the early stages of a pandemic, as seen with pandemic (H1N1) 2009, vaccines and antivirals may be limited or non-existent, resulting in the need for non- pharmaceutical strategies to reduce the spread of disease and the economic impact. We construct and analyze a mathematical model for a population comprised of three different age groups and assume that some individuals wear facemasks. We then quantify the impact facemasks could have had on the spread of pandemic (H1N1) 2009 and examine their cost effectiveness. Our analyses show that an unmitigated pandemic could result in losses of nearly $832 billion in the United States during the length of the pandemic. Based on present value of future earnings, hospital costs, and lost income estimates due to illness, this study estimates that the use of facemasks by 10%, 25%, and 50% of the population could reduce economic losses by $478 billion, $570 billion, and $573 billion, respectively. The results show that facemasks can significantly reduce the number of influenza cases as well as the economic losses due to a pandemic. Keywords Influenza; Mathematical Models; Epidemic Models; Facemask; Mitigation Strategies 1. Introduction On June 11, 2009, the World Health Organization (WHO) declared the outbreak of novel influenza A (H1N1) (referred to as pandemic (H1N1) 2009 per WHO nomenclature) a pandemic. The emergence of an unexpected or novel strain of influenza poses problems in combating the spread of infection. Vaccines are typically the first line of defense against influenza viruses (Germann et al., 2006), however, in the case of novel viruses vaccines may not be readily available. In addition to vaccines, public health campaigns encouraging good hygiene have been used to reduce the spread of influenza. © 2012 Elsevier Ltd. All rights reserved. * [email protected]. Publisher's Disclaimer: This is a PDF file of an unedited manuscript that has been accepted for publication. As a service to our customers we are providing this early version of the manuscript. The manuscript will undergo copyediting, typesetting, and review of the resulting proof before it is published in its final citable form. Please note that during the production process errors may be discovered which could affect the content, and all legal disclaimers that apply to the journal pertain. NIH Public Access Author Manuscript J Theor Biol. Author manuscript; available in PMC 2013 May 7. Published in final edited form as: J Theor Biol. 2012 May 7; 300: 161–172. doi:10.1016/j.jtbi.2012.01.032. NIH-PA Author Manuscript NIH-PA Author Manuscript NIH-PA Author Manuscript

Welcome message from author
This document is posted to help you gain knowledge. Please leave a comment to let me know what you think about it! Share it to your friends and learn new things together.
Transcript
Economic Analysis of the Use of Facemasks During Pandemic(H1N1) 2009
Samantha M. Trachta,b,*, Sara Y. Del Vallea, and Brian K. Edwardsa
aEnergy & Infrastructure Analysis Group, Decisions Applications Division, Los Alamos NationalLaboratory, Los Alamos, NMbMathematics Department, University of Tennessee, Knoxville, TN
AbstractA large-scale pandemic could cause severe health, social, and economic impacts. The recent 2009H1N1 pandemic confirmed the need for mitigation strategies that are cost-effective and easy toimplement. Typically, in the early stages of a pandemic, as seen with pandemic (H1N1) 2009,vaccines and antivirals may be limited or non-existent, resulting in the need for non-pharmaceutical strategies to reduce the spread of disease and the economic impact. We constructand analyze a mathematical model for a population comprised of three different age groups andassume that some individuals wear facemasks. We then quantify the impact facemasks could havehad on the spread of pandemic (H1N1) 2009 and examine their cost effectiveness. Our analysesshow that an unmitigated pandemic could result in losses of nearly $832 billion in the UnitedStates during the length of the pandemic. Based on present value of future earnings, hospital costs,and lost income estimates due to illness, this study estimates that the use of facemasks by 10%,25%, and 50% of the population could reduce economic losses by $478 billion, $570 billion, and$573 billion, respectively. The results show that facemasks can significantly reduce the number ofinfluenza cases as well as the economic losses due to a pandemic.
KeywordsInfluenza; Mathematical Models; Epidemic Models; Facemask; Mitigation Strategies
1. IntroductionOn June 11, 2009, the World Health Organization (WHO) declared the outbreak of novelinfluenza A (H1N1) (referred to as pandemic (H1N1) 2009 per WHO nomenclature) apandemic. The emergence of an unexpected or novel strain of influenza poses problems incombating the spread of infection. Vaccines are typically the first line of defense againstinfluenza viruses (Germann et al., 2006), however, in the case of novel viruses vaccines maynot be readily available. In addition to vaccines, public health campaigns encouraging goodhygiene have been used to reduce the spread of influenza.
© 2012 Elsevier Ltd. All rights reserved.*[email protected]'s Disclaimer: This is a PDF file of an unedited manuscript that has been accepted for publication. As a service to ourcustomers we are providing this early version of the manuscript. The manuscript will undergo copyediting, typesetting, and review ofthe resulting proof before it is published in its final citable form. Please note that during the production process errors may bediscovered which could affect the content, and all legal disclaimers that apply to the journal pertain.
NIH Public AccessAuthor ManuscriptJ Theor Biol. Author manuscript; available in PMC 2013 May 7.
Published in final edited form as:J Theor Biol. 2012 May 7; 300: 161–172. doi:10.1016/j.jtbi.2012.01.032.
NIH
-PA Author Manuscript
NIH
-PA Author Manuscript
NIH
-PA Author Manuscript

During the pandemic (H1N1) 2009 outbreak several non-pharmaceutical mitigationstrategies were used including school closures, social distancing, and facemasks (Condonand Sinha, 2009). Influenza spreads through person-to-person contact via airborne particlesas well as by direct and indirect (e.g., via fomites) contacts. Several studies have shown thatfacemasks can be an effective mitigation strategy. A recent study on facemasks and handhygiene showed a 10 – 50% transmission reduction for influenza-like illnesses (Aiello et al.,2010). Other studies have also shown that facemasks can not only act as a barrier (Del Valleet al., 2010) but they can redirect and decelerate exhaled air flows to prevent them fromentering the breathing zones of others (Tang and Settles, 2009). Several laboratory studieson mask effectiveness have shown that N95 respirators are 21.5% effective in protectingagainst the inhalation of nanoparticles, while surgical masks were only 2.4% effective (anLee et al., 2008). However, a study by Loeb et al. (Loeb et al., 2009) found that surgicalmasks and N95 respirators offered about the same percentage of protection for nurses inhospitals. Although several studies have shown that both surgical masks and N95 providesimilar protection against influenza, a recent editorial by Killingley (Killingley, 2011)discusses two studies and argues that the results are still inconclusive and that more researchis needed. For our model we will focus on N95 respirators since we are interested inanalyzing optimal interventions, however, our analyses may be applicable to surgical masksbased on Loeb et al. (Loeb et al., 2009) results.
Using a mathematical model, Tracht et al. (Tracht et al., 2010) analyzed the effectiveness offacemasks in reducing the spread of pandemic (H1N1) 2009. They compared the impact thatsurgical and N95 masks could have on reducing the spread of influenza. Their resultsshowed that facemasks can be an effective intervention strategy for mitigating an airbornedisease. We expand upon that model by dividing the population into three age groups andquantifying the impact of facemasks (also referred to as N95 respirators) have on the spreadof the disease as well as their cost effectiveness.
2. MethodsFollowing the approaches developed in (Del Valle et al., 2005) and (Tracht et al., 2010), thepopulation is divided into two subgroups: a mask-wearing group (subscript M) and a non-mask wearing group. People alternate between mask and non-mask groups based on thenumber of individuals infected with pandemic (H1N1) 2009. We also separate thepopulation into three different age group classifications: children between ages 0–17(superscript 1), adults between ages 18–64 (superscript 2), and seniors older than 65(superscript 3). Individuals are characterized by their epidemiological status: susceptible, Sk
and , exposed, Ek and (i.e., people who are infected but not yet fully contagious), and
infectious individuals, Ik and , where k = 1 (ages 0–17), 2 (ages 18–64) and 3 (ages 65+).Definitions of the epidemiological classes are summarized in Table 1 and the transfers areshown diagrammatically in Figure 1. Because we are evaluating the potential economicimpact of masks during the pandemic (H1N1) 2009 outbreak, we use a closed system withno migration in or out; births and natural deaths are not included in the model.
As seen in Figure 1, the transfer rates from the exposed classes, Ek and , to the infectious
classes, Ik and , are ωEk and , respectively. Infectious individuals can move to group
Dk at rate μkIk and when they die from infection to group Rk, at rate δIk and upon
recovery, or to group Hk at rate of χkHk and if they are hospitalized. Those individualswho are hospitalized either recover at a rate of νkHk or die at a rate of μkHk. The mean times
Tracht et al. Page 2
J Theor Biol. Author manuscript; available in PMC 2013 May 7.
NIH
-PA Author Manuscript
NIH
-PA Author Manuscript
NIH
-PA Author Manuscript
in the infectious classes, Ik and , are 1/(μk+δ+χk). Hence, the infectious fraction δ/(μk+δ+χk) recovers and the infectious fraction μk/(μk+δ+χk) dies as a consequence of the disease.
We assume homogenous mixing within each age group and heterogeneous mixing betweengroups; the mixing matrix containing the average number of daily contacts an individualfrom group k has with group j is shown in Table 2. We also assume that contact levelsremain normal throughout the epidemic, except that the average number of daily contacts forhospitalized individuals is reduced by 1/3. We define t0 as the beginning of the epidemic.Movement of individuals between mask and non-mask groups depends upon the number ofpandemic (H1N1) 2009 cases in the population, that is, a specified percentage of thepopulation starts wearing masks as the number of infected people increases.
We define ϕSMSk, ϕEMEk, and ϕIMIk to be the transfer rates from the Sk, Ek, and Ik classes to
the , and classes, respectively; similarly , and are the transfer rates
from the , and to the Sk, Ek, and Ik, respectively.
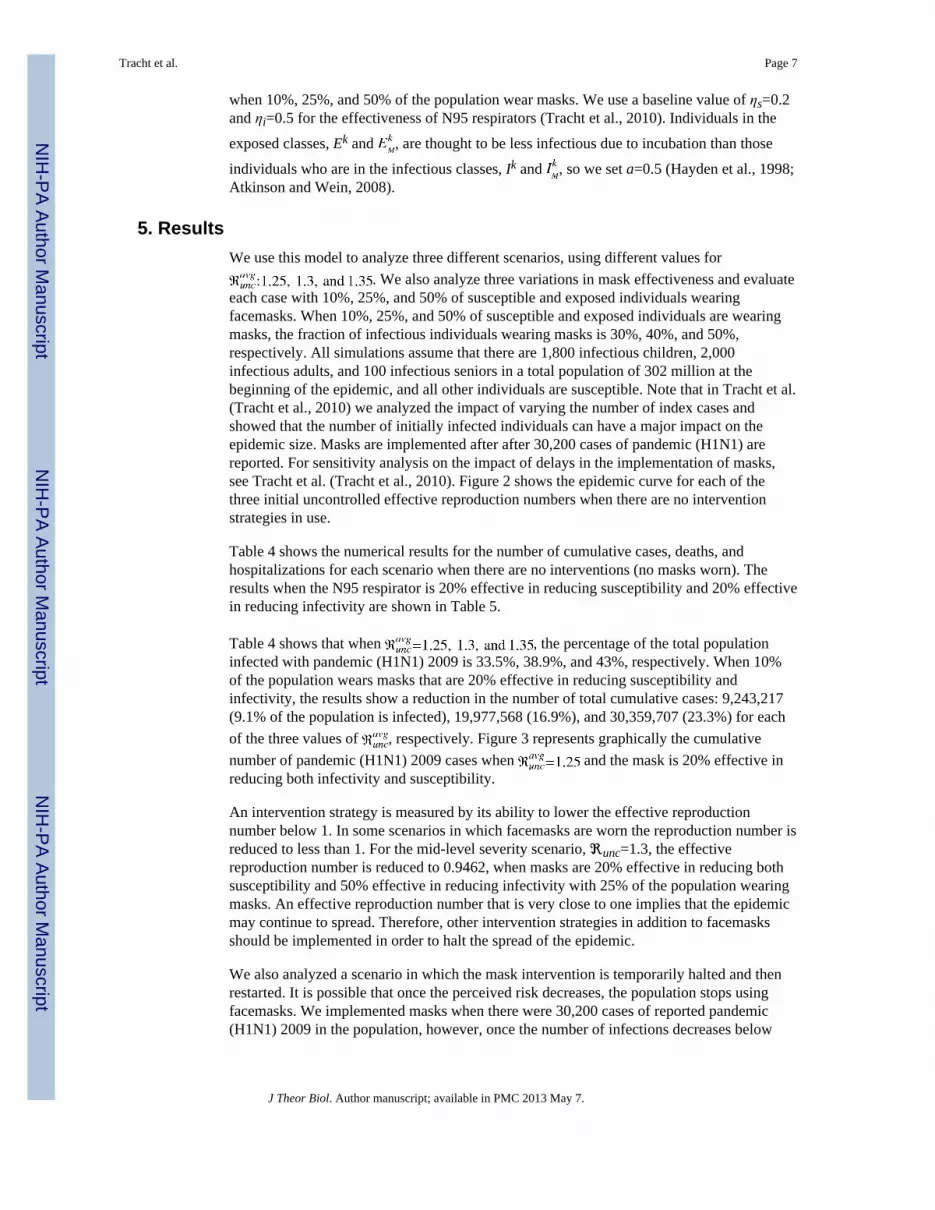
The rate coefficients are modeled by step-functions of the number of infectious individualsin the population:
(1)
for , and and k = 1 (ages 0–17), 2 (ages 18–64) and 3 (ages 65+),where the parameters a and b are positive constants that determine the rate of movement andτ is the number of pandemic (H1N1) 2009 cases that determines when masks areimplemented.
Using the transfer diagram shown in Figure 1, we obtain the following system of differentialequations:
(2)
where k = 1, 2, and 3. Note that there is a system of nine equations for each of the three agegroups, resulting in a system of 27 differential equations.
Here λk (non-mask groups) and (mask groups) are the forces of infection and λkSk and
are the transfer rates from the susceptible classes, Sk and , to the exposed classes,
Ek and . There are six different infection rates, λk and for each of the three age groups,
Tracht et al. Page 3
J Theor Biol. Author manuscript; available in PMC 2013 May 7.
NIH
-PA Author Manuscript
NIH
-PA Author Manuscript
NIH
-PA Author Manuscript

which incorporate the probability of transmission per contact from an individual in agegroup k to an individual in age group j (βkj); the reduced infectiousness due to incubation(α), and 1 − ηt (t = i or s), which accounts for the effectiveness of the mask in reducingeither susceptibility (ηs) or infectivity (ηi). The transmissibility, βkj, is defined as thesusceptibility of the population, multiplied by the infectivity of the disease, multiplied by theaverage number of contacts an individual has per day. The definitions of the parameters aresummarized in Table 3. The forces of infection for the non-mask group and mask group aregiven by:
(3)
We define in (3) as the product of the transmissibility of a disease, βkj, and the fraction ofcontacts that are infected. βkj is the product of the average number of contacts per unit timethat each individual in age group k has with age group j, κkj; the susceptibility of thepopulation, which is set to 1 for children and adults and 0.85 for seniors (Center for DiseaseControl and Prevention, 2009b; Xing and Cardona, 2009), ιj; and the infectivity of thedisease for age group k, ξk. That is:
(4)
where N is the total population.
3. Effective Reproduction Number, ℜeff
The effective reproduction number, ℜeff, is the average number of secondary cases producedby a typical infectious individual during the infectious period (Hethcote, 2000; van denDriessche and Watmough, 2002). The success of mitigation strategies is measured by theirability to reduce the spread of disease. In an epidemic model the magnitude of the effectivereproduction number, ℜeff, determines whether an epidemic occurs and its severity (DelValle et al., 2005). When ℜeff > 1, the disease will spread and an epidemic will occur,however, when ℜeff < 1, the disease will die out (Del Valle et al., 2005; Tracht et al., 2010).
Each individual age group has a unique initial effective reproduction number denoted ,however, when we average these three values, we obtain an average effective reproduction
number, , for the entire model. Without any intervention strategies in place, the modelhas an initial average effective reproduction number (uncontrolled), .
The ‘next generation operator’ approach (van den Driessche and Watmough, 2002) can beused to find an expression for the effective reproduction number (controlled), ℜcon, todetermine the effectiveness of masks as an intervention strategy. This is done by linearizing
the system of equations (3) around the disease-free equilibrium (DFE). The DFE has Ek, ,
Ik, , and Hk equal to zero with S0k, , and R0k positive, where k = 1, 2, and 3. Theresulting 15-dimensional linearized system is of the form , where
Tracht et al. Page 4
J Theor Biol. Author manuscript; available in PMC 2013 May 7.
NIH
-PA Author Manuscript
NIH
-PA Author Manuscript
NIH
-PA Author Manuscript

The F matrix is a 15 × 15 matrix that can be described in blocks of 5 × 5 with the first tworows having nonzero entries in every column and the third, fourth, and fifth rows containingall zeros. The first two rows are of the form:
where k and j represent the three age group classifications, k = 1, 2, and 3 and j = 1, 2, and 3,
ms = 1 − ηs, mi = 1 − ηi, and . The V matrix is block diagonalwith 5 × 5 blocks of the form:
which has an inverse of the form:
where γ1 = ϕE+ϕEM+ω, γ2 = ϕIM+ϕI+μk+δ, γ3 = μk+δ, and γ4 = νk+μk.
FV−1 will have zeros in rows 3, 4, 5, 8, 9, 10, 13, 14, and 15, so the eigenvectors must alsohave zeros in these rows. Thus, the 15 × 15 matrix consists of the rows 5(f − 1) + 1, 2 andcolumns 5(g − 1) + 1, 2. This matrix E = FV−1 will have fg blocks of 5 × 5, with entriesgiven by:
where
, and .
Tracht et al. Page 5
J Theor Biol. Author manuscript; available in PMC 2013 May 7.
NIH
-PA Author Manuscript
NIH
-PA Author Manuscript
NIH
-PA Author Manuscript

The effective reproduction number ℜcon is the largest eigenvalue of the matrix E = FV−1
(van den Driessche and Watmough, 2002). We cannot obtain an explicit form of the ℜconfor our model, thus we estimated ℜcon numerically for a specific set of parameter values andinitial population size for the three different age groups. The resulting ℜcon is an average ofthe three different age groups ℜcon, thus we refer to it as .
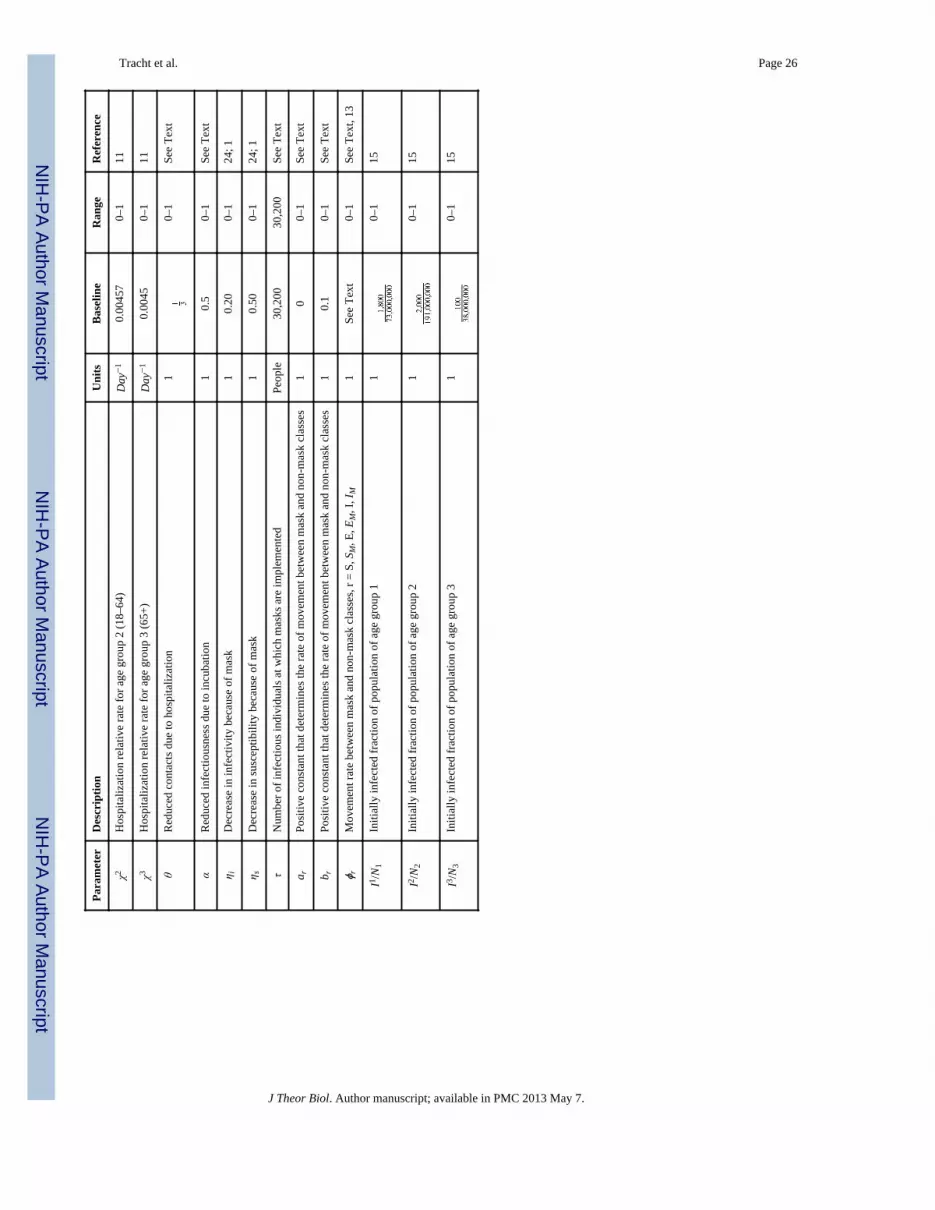
4. Estimation of Parameter ValuesWhile the use of facemasks and our model can be applicable to other viral respiratoryinfections, we use pandemic (H1N1) 2009 parameter values. The epidemiology of pandemic(H1N1) 2009 has been estimated by several researchers since the outbreak in May 2009(Tuite et al., 2010; Tang et al., 2010; Yang et al., 2009; Pourbohloul et al., 2009; Center forInfectious Disease Research and Policy, 2010; Centers for Disease Control and Prevention,2010; Xing and Cardona, 2009; Center for Disease Control and Prevention, 2009b). Theparameter values shown in Table 3 were selected based on the most recent and best availabledata. The incubation period for pandemic (H1N1) 2009 has been reported to be one to fourdays with a mean of four days (Tuite et al., 2010; Center for Infectious Disease Research
and Policy, 2010). The mean time in the exposed classes, Ek and , corresponding to theincubation period has been assumed to be 4 days, making the transfer rate to the infectious
classes, Ik and , constant at ω=1/4.
The infectious period is believed to be between one and seven days, with an average of fivedays (Tuite et al., 2010; Center for Infectious Disease Research and Policy, 2010). Thusmaking the baseline value for the recovery rate constant at δ=1/5. The fatality rate ofpandemic (H1N1) 2009 varies depending on age and is thought to be in the range of0.001%–0.3% for all age groups, with a mean of 0.0064% for ages 0–17, 0.02734% for ages18–64, and 0.027% for ages 65+ (Centers for Disease Control and Prevention, 2010; Tuite etal., 2010; Writing Committee of the WHO Consultation on Clinical Aspects of Pandemic(H1N1) 2009 Influenza, 2010; Tang et al., 2010). The case fatality rate for our model is μk/(μk+δ), setting this equal to 0.0064%, 0.02734%, and 0.027% results in μ1=0.0000192,μ2=0.0008224, and μ3=0.00008102, respectively.
The estimates for the transmission of pandemic (H1N1) 2009 indicate that one infectedperson typically infected one to two people (Tuite et al., 2010; Tang et al., 2010; Yang et al.,2009; Pourbohloul et al., 2009). The transmissibility, βkj, is the product of the susceptibilityof the population, the infectivity of the disease, and the average number of daily contacts(Stroud et al., 2006; Chowell et al., 2006). The susceptibility of the population is set to onefor children (0–17) and adults (18–64), as pandemic (H1N1) 2009 was a novel virus, and at0.835 for seniors (65+), since it is believed about 33% of the senior population has existingimmunity that correlates to a 50% reduction in susceptibility to pandemic (H1N1) 2009(Xing and Cardona, 2009; Center for Disease Control and Prevention, 2009b). The numberof contacts an individual from age group k has with age group j can be found in Table 2,(Del Valle et al., 2007). The infectivity of the disease is estimated numerically.
Consistent with the U.S. Census Bureau, the baseline population size, N, for the model is setat 302 million people, all of whom are initially in the susceptible class, Sk, depending on agegroup classification. The model uses a baseline population of 73 million for children (ages0–17), N1; 191 million for adults (ages 18–64), N2; and 38 million for seniors (ages 65+),N3. The initially infected fractions I1/N1, I2/N2, and I3/N3 are set at 1,800/73,000,000,2,000/191,000,000, and 100/38,000,000 respectively. We assume that individuals startwearing masks after there are 30,200 (or 0.001% of the population) cases of pandemic(H1N1) 2009 present in the population. We analyze the impact of mask implementation
Tracht et al. Page 6
J Theor Biol. Author manuscript; available in PMC 2013 May 7.
NIH
-PA Author Manuscript
NIH
-PA Author Manuscript
NIH
-PA Author Manuscript
when 10%, 25%, and 50% of the population wear masks. We use a baseline value of ηs=0.2and ηi=0.5 for the effectiveness of N95 respirators (Tracht et al., 2010). Individuals in the
exposed classes, Ek and , are thought to be less infectious due to incubation than those
individuals who are in the infectious classes, Ik and , so we set a=0.5 (Hayden et al., 1998;Atkinson and Wein, 2008).
5. ResultsWe use this model to analyze three different scenarios, using different values for
. We also analyze three variations in mask effectiveness and evaluateeach case with 10%, 25%, and 50% of susceptible and exposed individuals wearingfacemasks. When 10%, 25%, and 50% of susceptible and exposed individuals are wearingmasks, the fraction of infectious individuals wearing masks is 30%, 40%, and 50%,respectively. All simulations assume that there are 1,800 infectious children, 2,000infectious adults, and 100 infectious seniors in a total population of 302 million at thebeginning of the epidemic, and all other individuals are susceptible. Note that in Tracht et al.(Tracht et al., 2010) we analyzed the impact of varying the number of index cases andshowed that the number of initially infected individuals can have a major impact on theepidemic size. Masks are implemented after after 30,200 cases of pandemic (H1N1) arereported. For sensitivity analysis on the impact of delays in the implementation of masks,see Tracht et al. (Tracht et al., 2010). Figure 2 shows the epidemic curve for each of thethree initial uncontrolled effective reproduction numbers when there are no interventionstrategies in use.
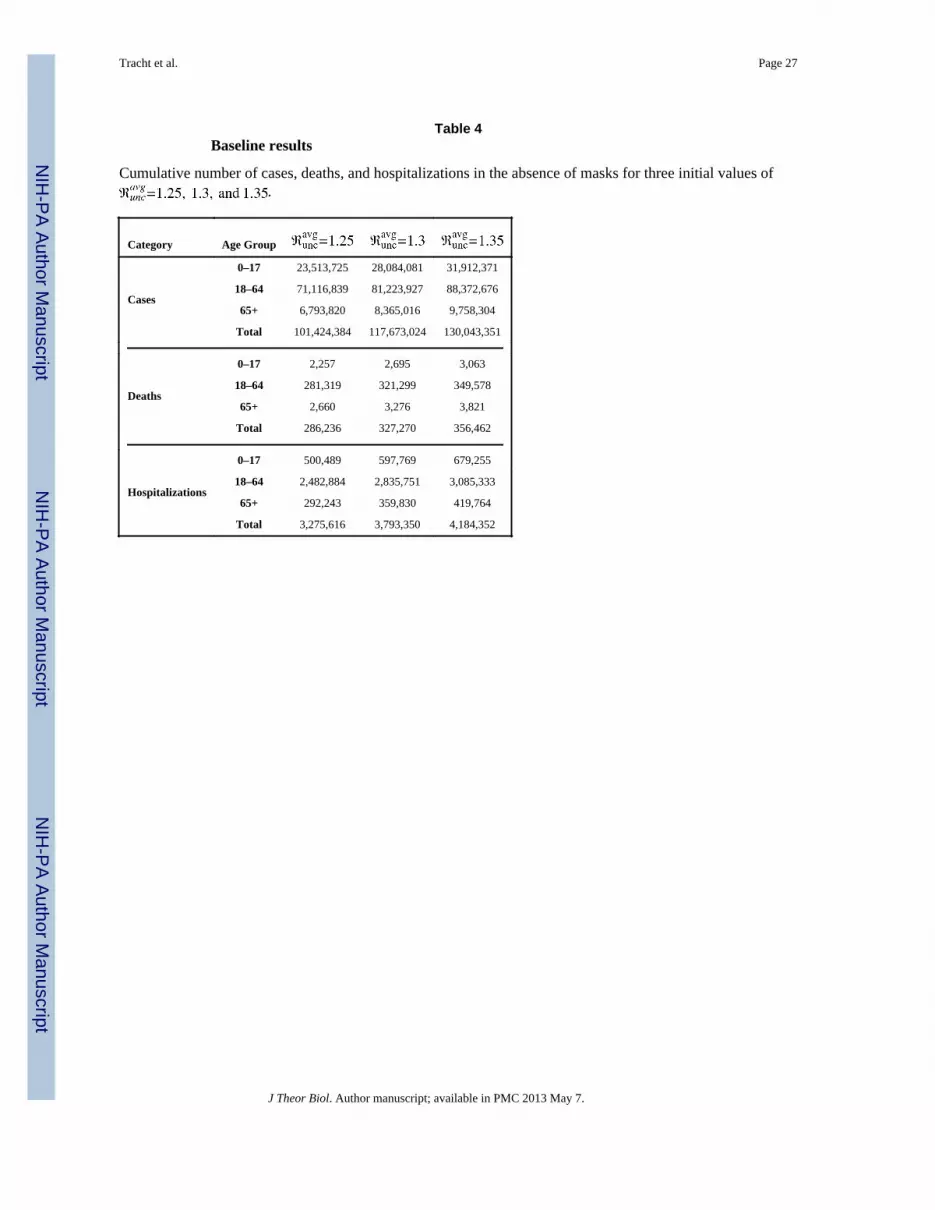
Table 4 shows the numerical results for the number of cumulative cases, deaths, andhospitalizations for each scenario when there are no interventions (no masks worn). Theresults when the N95 respirator is 20% effective in reducing susceptibility and 20% effectivein reducing infectivity are shown in Table 5.
Table 4 shows that when , the percentage of the total populationinfected with pandemic (H1N1) 2009 is 33.5%, 38.9%, and 43%, respectively. When 10%of the population wears masks that are 20% effective in reducing susceptibility andinfectivity, the results show a reduction in the number of total cumulative cases: 9,243,217(9.1% of the population is infected), 19,977,568 (16.9%), and 30,359,707 (23.3%) for eachof the three values of , respectively. Figure 3 represents graphically the cumulativenumber of pandemic (H1N1) 2009 cases when and the mask is 20% effective inreducing both infectivity and susceptibility.
An intervention strategy is measured by its ability to lower the effective reproductionnumber below 1. In some scenarios in which facemasks are worn the reproduction number isreduced to less than 1. For the mid-level severity scenario, ℜunc=1.3, the effectivereproduction number is reduced to 0.9462, when masks are 20% effective in reducing bothsusceptibility and 50% effective in reducing infectivity with 25% of the population wearingmasks. An effective reproduction number that is very close to one implies that the epidemicmay continue to spread. Therefore, other intervention strategies in addition to facemasksshould be implemented in order to halt the spread of the epidemic.
We also analyzed a scenario in which the mask intervention is temporarily halted and thenrestarted. It is possible that once the perceived risk decreases, the population stops usingfacemasks. We implemented masks when there were 30,200 cases of reported pandemic(H1N1) 2009 in the population, however, once the number of infections decreases below
Tracht et al. Page 7
J Theor Biol. Author manuscript; available in PMC 2013 May 7.
NIH
-PA Author Manuscript
NIH
-PA Author Manuscript
NIH
-PA Author Manuscript
this number, individuals stop wearing masks. This results in an epidemic that never dies out,but remains oscillating, as shown in Figure 4.
6. Sensitivity AnalysisThe results presented above used assumptions based on the best available information,however, in order to better understand the model and its sensitivity to certain parameters, weanalyzed different parameter values and scenarios. This sensitivity analysis examines theeffects of age-specific compliance rates, which age groups wear masks, limiting the numberof available masks, and limiting the amount of money spent on masks.
Age-specific complianceHigher compliance rates from the adult group can reduce the cumulative number of cases.Here we analyzed three scenarios for compliance: 1) 10% of children, 25% of adults, and10% of seniors wear masks; 2) 10% of children, 50% of adults, and 25% of seniors wearmasks; 3) 25% of children, 50% of adults, and 10% of seniors wear masks. We used a
and ηi=0.2 and ηs=0.2. The results are shown graphically in Figure 5, Part a.
Which age group wears masksThe simulation results are most sensitive to the adult group. The results show that if theadult population wears masks, the epidemic can be mitigated. We analyzed three cases: 1)children do not wear masks, 2) adults do not wear masks, and 3) seniors do not wear masks;in each case we assumed the remaining two age groups have a 25% compliance rate. Figure5, Part b shows the results for these three scenarios for and ηi=0.2 and ηs=0.2.
Limit on the number of available masksDuring a pandemic there may be a limited number of masks available. If this situation arises,we need to know how to effectively distribute the masks in order to minimize the number ofdeaths. We analyzed two scenarios: 1) there are 75,500,000 masks available (e.g., enoughfor about 25% of the population); and 2) there are 100,000,000 masks available (e.g.,enough for about 1/3 of the population). We assumed and masks to be 20%effective in reducing susceptibility and infectivity. We performed an optimization analysisto determine how best to distribute the limited number of masks to reduce the number ofdeaths. If only 75.5 million masks are available, 14.5% of them should go to children (ages0–17), 83.5% to adults (ages 18–64), and 2% to seniors (ages 65+). In other words, 15% ofchildren, 33% of adults, and 4% of seniors should wear masks. This combination results inthe lowest number of deaths (3,004). If there are 100 million masks available, 9.5% shouldgo to children, 86% to adults, and 4.5% to seniors, or in other words, 13% of children, 45%of adults, and 12% of seniors should wear masks. This combination results in the lowestnumber of deaths (2,352). These results are shown in Figure 5, Part c.
Reduce deaths below 24,000Seasonal influenza typically results in 24,000 deaths per year (Center for Disease Controland Prevention, 2010). In an influenza pandemic, the number of deaths could dramaticallyincrease. We examined the level of intervention necessary to reduce the number of deathsduring pandemic (H1N1) 2009 to less than that of typical seasonal influenza. To reduce thenumber of pandemic (H1N1) 2009 deaths to below 24,000, we considered two scenarios: 1)what percentage of adults need to wear masks and 2) what percentage of the entirepopulation would need to wear masks. If and masks are 20% effective in reducingboth susceptibility and infectivity, 19% of adults would need to wear masks to reduce thenumber of deaths to less than 24,000; the total number of deaths in this scenario is 22,820. If
Tracht et al. Page 8
J Theor Biol. Author manuscript; available in PMC 2013 May 7.
NIH
-PA Author Manuscript
NIH
-PA Author Manuscript
NIH
-PA Author Manuscript

and masks are 20% effective in reducing both susceptibility and infectivity, 15% ofall age groups would need to wear masks to reduce the number of deaths below 24,000; inthis scenario deaths are reduced to 22,192. Even if 100% of children and seniors wearmasks, but adults to do not wear masks, the number of deaths is still greater than 24,000. Itis important that the adult age group wears masks. Figure 5, Part d shows the number ofcumulative cases that result from both scenarios.
7. Economic AnalysisAn influenza pandemic has the potential to have a tremendous impact on the economy;several loss estimates have been predicted (Ewers and Dauelsberg, 2007). TheCongressional Budget O3ce estimated a 4.25% reduction in Gross Domestic Product (GDP)as the result of a severe pandemic similar to the 1918 Spanish Influenza pandemic, and a 1%drop in GDP for a more mild pandemic (Arnold et al., 2006). While there are manymitigation strategies that can be used to reduce the impact of a pandemic, such as vaccines,school closures, and social distancing, these options can be very costly and are notnecessarily economically efficient. The potential cost of school closures for pandemic(H1N1) 2009 was estimated at $10 billion to $47 billion (Lempel et al., 2009). The U.S.spent an estimated $6.4 billion dollars on an immunization program (Morgan, 2009).
To estimate one measure of the benefits of facemasks, we use the results from our model toestimate the net savings that could be gained by a percentage of the population wearingfacemasks, a potentially cheaper alternative to other mitigation strategies such as vaccinesand school closures. We do not, however, compare estimated savings from facemasks to thebenefits obtained from other options. We define three sources of savings from the use offace-masks: 1) avoided hospitalization costs, 2) reductions in lost future income due tofatalities, and 3) reductions in lost earnings due to illness. Finally, we subtract the estimatedcosts of the masks from this equation to arrive at the net savings estimate. These threemeasures are presented in Equation 5 with the parameter values and their decriptions givenin Table 6.
(5)
where k = 1, 2, and 3 (corresponding to children, adults, and seniors, respectively). Weassume that seniors do not work, thus, their average income (AI) is set to zero. We alsoassume that at least one parent of sick children take o3 from work to care for them.
A baseline estimate of the hospitalization costs, losses in future income due to fatalities, andlost earnings, due to an unmitigated pandemic could cost nearly $832 billion in the U.S. It isagainst this baseline estimate of unmitigated losses due to pandemic influenza that we lookat the potential savings from facemasks, and we do so in four ways. The first estimatessavings that depend on the effective reproduction number, the percentage of each age groupthat wears facemasks, and the effectiveness of the masks (in term of susceptibility andinfectivity). The second considers the effects of age specific compliance rates on netsavings. The third examines the impacts of one group no wearing masks. The fourthaddresses net savings when the number of masks available is limited and the objective is toreduce fatalities.
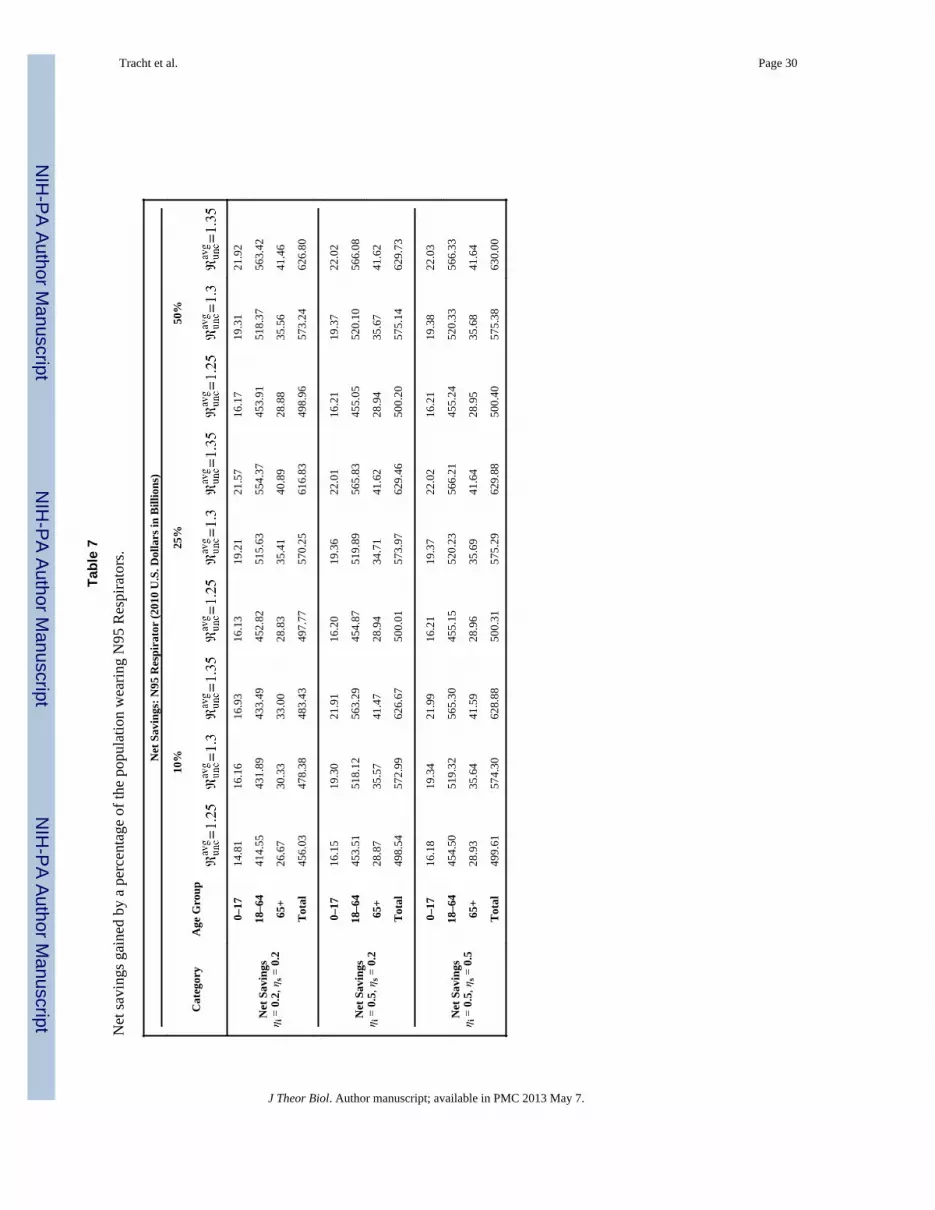
For the first analysis, if facemasks are worn by 10% of the population and they are 20%effective in reducing both susceptibility and infectivity and , the net savings wouldamount to approximately $478 billion. Under comparable assumptions, if 50% of thepopulation wears masks, the net savings increases to $573 billion. As one might expect, net
Tracht et al. Page 9
J Theor Biol. Author manuscript; available in PMC 2013 May 7.
NIH
-PA Author Manuscript
NIH
-PA Author Manuscript
NIH
-PA Author Manuscript
savings increases with higher rates of mask use and effectiveness for each value of . Inall cases, the greatest net savings result when the adult age group (18–64) wears masks,while the lowest net savings occur when children wear masks. Table 7 summarizes the netsavings from all scenarios and Figure 6 shows the total net savings and the net savings foreach age group for 10% of the population wearing masks when masks are 20% effective.
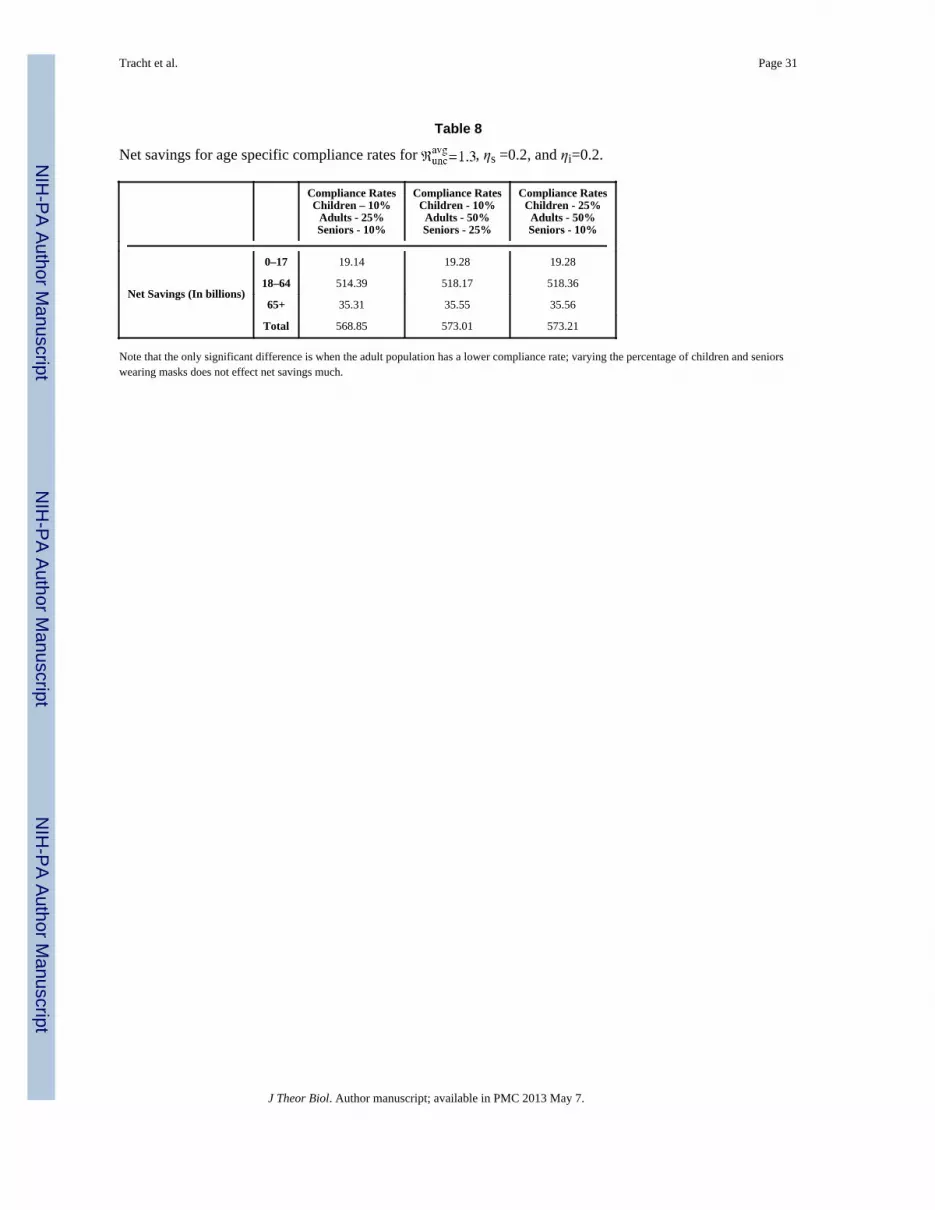
For the second analysis, we considered the effect of age-specific compliance rates on netsavings. We examined the net savings under three different scenarios in which all agegroups have different compliance rates: 1) 10% of children, 25% of adults, and 10% ofseniors wear masks, 2) 10% of children, 50% of adults, and 25% of seniors wear masks, and3) 25% of children, 50% of adults, and 10% of seniors wear masks. All three scenarios resultin nearly the same net savings: $568.8 biliion, $573 billion, and $573.2 billion, respectively.The results are shown numerically in Table 8 and graphically in Figure 7, Part a.
These results also suggest that net savings will increase with higher adult compliance rates,but at a decreasing rate. For example, doubling the adult compliance rate (from 25% to50%), increasing children’s compliance rate (from 10% to 25%) and holding the seniorcompliance rate constant (at 10%) increases net savings to adults by about $4.4 billion, a farsmaller increase in net savings than occurs when the compliance rate of adults is increasedfrom 0% to 25%.
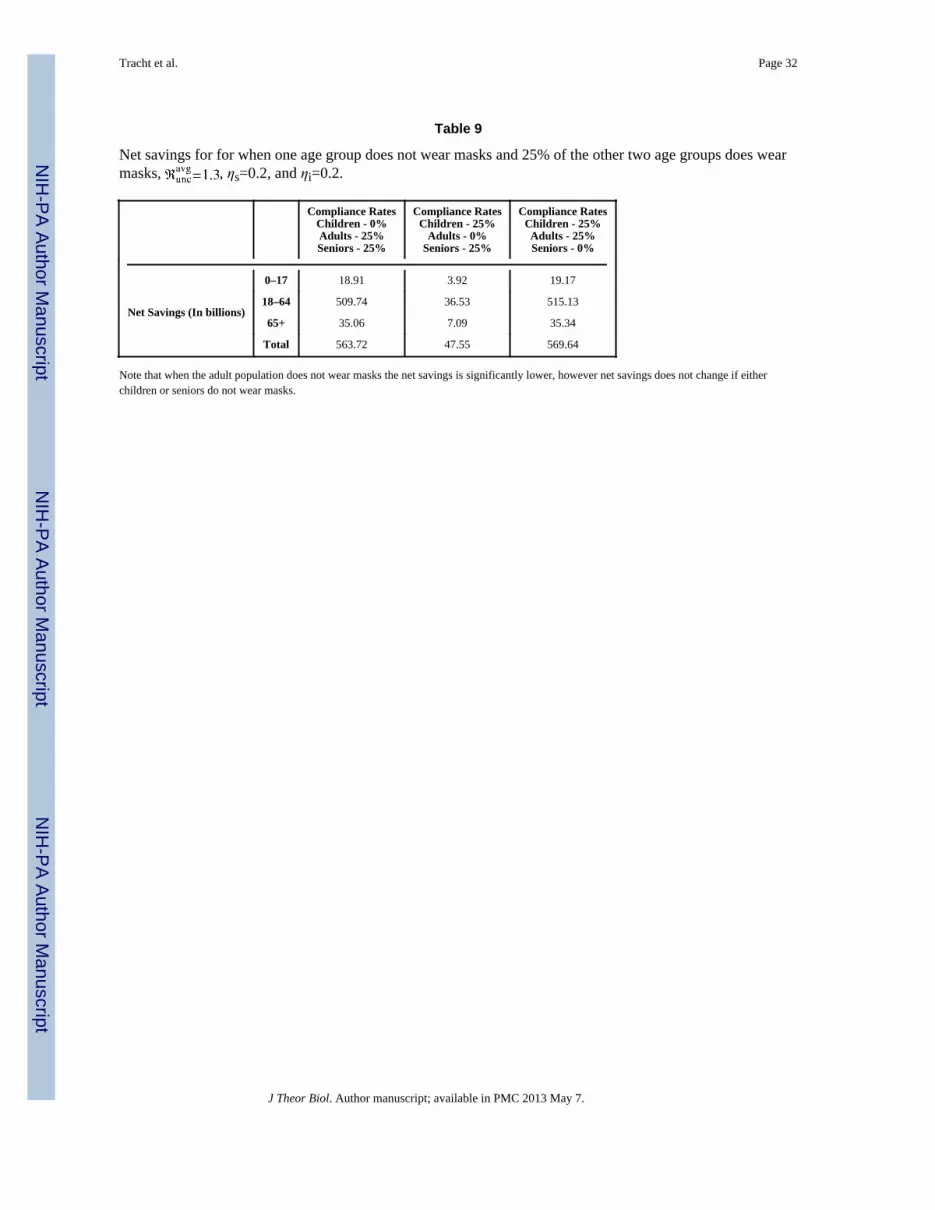
For the third analysis, we examined the effect of one age group not wearing masks, whilethe other two age groups maintained a 25% compliance rate. When children or seniors donot wear masks, the net savings are not significantly different. However, if the adult agegroup does not wear masks the net savings is significantly reduced. The net savings whenchildren, adults, and seniors do not wear masks is $563.7 billion, $47.5 billion, and $569.6billion, respectively. The results are shown graphically in Figure 7, Part b and numerically inTable 9.
Comparing the results across adult compliance rates for children and seniors reveals theimportance of adult compliance rates. For example, when the adult compliance rate is 25%,increasing compliance rates of children (from 0% to 25%) or reducing the compliance rateof seniors (from 25% to 0%) has little effect on estimated net savings for either group. Incontrast, reducing the adult compliance rate (from 25% to 0%) while increasing thecompliance rate of children (from 0% to 25%) actually reduces the net savings for childrenfrom $18.9 billion to $3.9 billion.
For the final analysis, we calculated the optimal distribution of masks if there is a limitedsupply; Figure 7, part c shows the net savings for two scenarios in which the number ofmasks is limited. During a pandemic, one of the most important goals is to reduce thenumber of deaths, thus we also considered an objective of minimizing deaths. Figure 7, partc shows the net savings gained from two different scenarios that reduce the number ofdeaths to less than 24,000 (e.g., below typical seasonal influenza mortality rates (Center forDisease Control and Prevention, 2010)).
8. DiscussionThe standard pharmaceutical mitigation strategies used during an influenza outbreak arevaccines and antivirals. In the case of a novel virus these strategies may not be readilyavailable and can be very costly, thus, there is a need for non-pharmaceutical interventionsto reduce disease spread. In the absence of vaccines, non-pharmaceutical interventions, suchas hand washing and facemasks, become the first line of defense. We used a mathematicalmodel with three different age groups to examine the effect facemasks could have had on
Tracht et al. Page 10
J Theor Biol. Author manuscript; available in PMC 2013 May 7.
NIH
-PA Author Manuscript
NIH
-PA Author Manuscript
NIH
-PA Author Manuscript

disease spread during the pandemic (H1N1) 2009. We then used these results to evaluate thecost effectiveness of the use of facemasks.
The numerical simulations results indicate that without any intervention strategies in place, alarge percentage of the population could be infected with pandemic (H1N1) 2009;approximately 33%–43% of the population could become infected. If 10% of the populationwears masks with an effectiveness of 20% in reducing susceptibility and infectivity, there isa large reduction in the cumulative number of cases.
We used present value of future earnings, hospital costs, and lost income estimates due toillness to estimate the economic losses resulting from pandemic (H1N1) 2009. Our modelestimates that without any intervention strategies economic losses could be in the range of$662 billion to $832 billion (2010 dollars). The model suggests that wearing masks couldresult in significant savings.
If 10% of the population wears facemasks and they are 20% effective in reducing bothsusceptibility and infectivity, there is the potential for net savings in the range of $456billion to $483 billion (2010 dollars), depending on the value of the initial effectivereproduction number. Net savings increases greatly if N95 respirators are 50% effective inreducing susceptibility and infectivity. If 10%, 25%, and 50% of the total population wearsmasks, there is a $500.4 billion, $575.3 billion, and $630 billion (2010 dollars) net savings,respectively.
The highest net savings result when the adult age group wears masks, partially due to thisage group having the largest population and to the fact that they contribute most to theeconomy. It is most important for the adult population to wear masks during a pandemic inorder to reduce economic losses and the total number of deaths. Facemasks can provideeconomic savings not only from diverted losses caused by death and illness, but othermeasures such as social distancing and school closures can pose a large economic burden.
Evidence shows that people would be willing to wear masks during an epidemic (Condonand Sinha, 2009; kum Tang and yan Wong, 2004). During pandemic (H1N1) 2009, MexicoCity officials required the use of facemasks for bus and taxi drivers and suggested their usefor passengers. Condon and Sinha found a compliance rate for bus and taxi drivers to be 20–90% and for passengers 8–55% during the beginning of the pandemic (Condon and Sinha,2009). However, for facemasks to be effective in reducing the spread of disease they need tobe: (1) available, (2) affordable, (3) worn properly, (4) replaced or sanitized daily, and (5)fit-tested (if using N95 respirators) (Tracht et al., 2010).
Only 25% of the adult population would have to wear masks in order to achieve significantnet savings. One of the policy implications of our results is that people should considerwearing masks, as it is typically done in some Asian countries, to prevent the spread ofairborne viruses. Facemasks are not only inexpensive, but are easy to implement and lesscostly than most other mitigation strategies. N95 respirators come in varying sizes, rangingfrom extra small to large, thus is would be feasible for people to buy them based on theirface size. Although we used N95 respirators as the basis for out analyses, recent studies(Loeb et al., 2009) have shown that surgical masks and N95 respirators can provide similarprotection. We can conclude from our model that facemasks are an effective interventionstrategy in reducing the spread of pandemic (H1N1) 2009 and are an extremely cost-effective tool to reduce economic losses due to illness.
AcknowledgmentsWe would like to thank Lori R. Daeulsberg her helpful comments and suggestions.
Tracht et al. Page 11
J Theor Biol. Author manuscript; available in PMC 2013 May 7.
NIH
-PA Author Manuscript
NIH
-PA Author Manuscript
NIH
-PA Author Manuscript
This research has been supported at Los Alamos National Laboratory under the Department of Energy contract DE-AC52-06NA25396 and a grant from NIH/NIGMS in the Models of Infectious Disease Agent Study (MIDAS)program (U01-GM097658-01).
ReferencesAiello A, Murray G, Coulborn R, Davis BM, Uddin M, Shay DK, Waterman SH, Monto AS. Mask
use, hand hygiene, and seasonal influenza-like illness among young adults: A randomizedintervention trial. The Journal of Infectious Diseases. 2010; 201:491–8. [PubMed: 20088690]
Akazawa M, Sindelar JL, Paltiel AD. Economic costs of influenza-related work absenteeism. Value inHealth. 2003:6. [PubMed: 12535233]
Arnold, R.; De Sa, J.; Gronniger, T.; Percy, A.; Somers, J.; Dennis, R.; Kile, J.; Moore, D.; Sunshine,R. [Online; accessed 30-June-2010] A potential influenza pandemic: possible macroeconomiceffects and policy issues. 2006. www.cbo.gov/ftpdocs/69xx/doc6946/12-08-BirdFlu.pdf
Atkinson MP, Wein LM. Quantifying the routes of transmission for pandemic influenza. Bulletin ofMathematical Biology. 2008; 70:820–867. [PubMed: 18278533]
Bureau of Labor Statistics, U.S. Department of Labor. [Online; accessed 7-June-2010] Employer costsfor employee compensation - march 2010. 2010a. http://www.bls.gov/ect/
Bureau of Labor Statistics, U.S. Department of Labor. Employment situation summary. 2010b.Center for Disease Control and Prevention. [Online; accessed 29-June-2010] Hospitalized patients
with novel influenza A (H1N1) virus infection – California. 2009a.http://www.cdc.gov/mmwr/preview/mmwrhtml/mm58e0518a1.htm
Center for Disease Control and Prevention. [Online; accessed 17-May-2011] Serum cross-reactiveantibody response to a novel influenza A (H1N1) virus after vaccination with seasonal influenzavaccine. 2009b. http://www.cdc.gov/mmwr/preview/mmwrhtml/mm5819a1.htm
Center for Disease Control and Prevention. [Online; accessed 25-May-2011] Estimates of deathsassociated with seasonal influenza—United States, 1976–2007. 2010.http://www.cdc.gov/mmwr/preview/mmwrhtml/mm5933a1.htm?s_cid=mm5933a1_e%0D%0A
Center for Infectious Disease Research and Policy. [Online; accessed June-2010] Novel H1N1influenza (swine flu) overview. 2010.http://www.cidrap.umn.edu/cidrap/content/influenza/swineflu/biofacts/swinefluoverview.html$#$_2009_Pandemic:_Case
Centers for Disease Control and Prevention. [Online; accessed 20-May-2010] Updated CDC estimatesof 2009 H1N1 influenza cases, hospitalizations, and deaths in the United States, April 2009 –April 2010. 2010. http://www.cdc.gov/h1n1flu/estimates_2009_h1n1.htm
Chowell G, Ammon CE, Hengartner NW, Hyman JM. Transmission dynamics of the great influenzapandemic of 1918 in geneva, switzerland: Aassessing the effects of hypothetical interventions.Theoretical Biology. 2006; 241:193–204.
Condon BJ, Sinha T. Who is that masked person: The use of face masks on Mexico City publictransportation during the influenza A (H1N1) outbreak. Health Policy. 2009; 95:50–56. [PubMed:19962777]
Cooper Safety Supply. [Online; accessed 28-June-2010] 3M N95 Respirator. 2010.http://www.coopersafety.com/product/3m-8511-n95-respirator-10-pack-1458.aspx
Del Valle, S.; Ambrosiano, J.; Daniel, W.; Dauelsberg, L.; Doyle, J., et al. Los Alamos UnlimitedRelease 09-06335. 2009. National population and economic impacts of 2009 influenza A (H1N1).
Del Valle S, Stroud P, Sydoriak S, Riese J, Mniszewski S. Spatial dynamics of pandemic influenza in amassive artificial society. Journal of Artificial Societies and Social Simulation. 2007:10.
Del Valle S, Tellier R, Settles GS, Tang JW. Can we reduce the spread of influenza in schools withface masks. American Journal of Infection Control. 2010 In Press.
Del Valle SY, Hethcote H, Hyman JM, Castillo-Chavez C. Effects of behavioral changes in a smallpoxattack model. Mathematical Biosciences. 2005; 195:228–251. [PubMed: 15913667]
Ewers, M.; Dauelsberg, LR. Pandemic influenza mitigation strategies and their economic impacts.Proceedings of 2007 System Dynamics Conference; 2007.
Tracht et al. Page 12
J Theor Biol. Author manuscript; available in PMC 2013 May 7.
NIH
-PA Author Manuscript
NIH
-PA Author Manuscript
NIH
-PA Author Manuscript

Germann TC, Kadau K, Ira M, Longini J, Macken CA. Mitigation strategies for pandemic influenza inthe United States. Proceedings of the National Academy of Sciences of the United States ofAmerica. 2006; 103:5935–5940. [PubMed: 16585506]
Hayden FG, Fritz R, Lobo MC, Alvord W, Strober W, Straus SE. Local and systemic cytokineresponse during experimental human influenza A virus infection. relation to symptom formationand host defense. Journal of Clinical Investigation. 1998; 101:346–649.
Hethcote HW. The mathematics of infectious diseases. SIAM Review. 2000; 42:599–653.Killingley B. Respirators versus medical masks: evidence accumulates but the jury remains out.
Influenza and Other Respiratory Viruses. 2011; 5:143–145. [PubMed: 21477131]an Lee S, Grinshpun SA, Reponen T. Respiratory performance offered by N95 respirators and surgical
masks: Human subject evaluation with NaCl aerosol representing bacterial and viral particle sizerange. The Annals of Occupational Hygiene. 2008; 52:177–185. [PubMed: 18326870]
Lempel, H.; Hammond, RA.; Epstein, JM. [Online; accessed 30-June-2010] Economic cost and healthcare workforce effects of school closures in the US. 2009.http://www.brookings.edu/papers/2009/0930_school_closure_lempel_hammond_epstein.aspx
Loeb M, Dafoe N, Mahony J, John M, Sarabia A, Glavin V, Webby R, Smieja M, Earn DJD, Chong S,Webb A, Walter SD. Surgical mask vs N95 respirator for preventing influenza among health careworkers. Journal of the American Medical Association. 2009; 302:1865–1871. [PubMed:19797474]
Meltzer MI, Cox NJ, Fukuda K. The economic impact of pandemic influenza in the United States:Priorities for intervention. Emerging Infectious Diseases. 1999:5.
Morgan, D. [Online; accessed 30-June-2010] US sees no undue H1N1 economic impact. 2009.http://www.reuters.com/article/idUSTRE59I5IR20091019
Pourbohloul B, Ahued A, Davoudi B, Meza R, Meyers LA, Skowron-ski DM, Villasenor I, Galvan F,Cravioto P, Earn DJD, Dushoff J, Fisman D, Edmunds WJ, Hupert N, Scarpino SV, Trujillo J,Lutzow M, Morales J, Contreras A, Chavez C, Patrick DM, Brunham RC. Initial humantransmission dynamics of pandemic (H1N1) 2009 virus in North America. Influenza and OtherRespiratory Viruses. 2009; 3:215–222. [PubMed: 19702583]
Stroud, PD.; Valle, SYD.; Mniszewski, SM.; Riese, JM.; Sydoriak, SJ.; Kubicek, D.; Romero, PR.;Smith, JP. [Online; accessed 30-June-2010] EpiSimS Los Angeles Case Study. 2006.http://public.lanl.gov/stroud/LACaseStudy5.pdf
kum Tang CS, yan Wong C. Factors Influencing the Wearing of Facemasks to Prevent the SevereAcute Respiratory Syndrome Among Adult Chinese in Hong Kong. Preventive Medicine. 2004;39:1187–1193. [PubMed: 15539054]
Tang JW, Shetty N, Tsan-Yuk Lam T. Features of the new pandemic influenza A/H1N1/2009 virus:virology, epidemiology, clinical and public health aspects. Current Opinions in PulmonaryMedicine. 2010:16.
Tang JWT, Settles G. Coughing and masks. The New England Journal of Medicine. 2009:361.Tracht SM, Del Valle SY, Hyman JM. Mathematical modeling of the effectiveness of facemasks in
reducing the spread of novel influenza A (H1N1). PLoS ONE. 2010:5.Tuite AR, Greer AL, Whelan M, Winter AL, Lee B, Yan P, Wu J, Moghadas S, Buckeridge D,
Pourbohloul B, Fisman D. Estimated epidemiologic parameters and morbidity associated withpandemic H1N1 influenza. Canadian Medical Association Journal. 2010:182.
United States Census Bureau. [Online; accessed 20-May-2010] Resident population projections byrace, Hispanic origin, and single years of age: 2008. 2010.http://www.census.gov/compendia/statab/cats/population.html
van den Driessche P, Watmough J. Reproduction numbers and sub-threshold endemic equilibria forcompartmental models of disease transmission. Mathematical Biosciences. 2002; 180:29–48.[PubMed: 12387915]
Writing Committee of the WHO Consultation on Clinical Aspects of Pandemic (H1N1). Influenza,2010. Clinical aspects of pandemic 2009 influenza A (H1N1) virus infection. The New EnglandJournal of Medicine. 2009; 362:1708–1719.
Xing Z, Cardona CJ. Preexisting immunity to pandemic H1N1 2009. Emerging Infectious Diseases.2009:15.
Tracht et al. Page 13
J Theor Biol. Author manuscript; available in PMC 2013 May 7.
NIH
-PA Author Manuscript
NIH
-PA Author Manuscript
NIH
-PA Author Manuscript
Yang Y, Sugimoto J, Halloran ME, Basta NE, Chao DL, Matrajt L, Potter G, Kenah E Jr, IML. Thetransmissibility and control of pandemic influenza A (H1N1) virus. Science Express. 2009;326:729–733.
Tracht et al. Page 14
J Theor Biol. Author manuscript; available in PMC 2013 May 7.
NIH
-PA Author Manuscript
NIH
-PA Author Manuscript
NIH
-PA Author Manuscript
Highlights
• We model an influenza epidemic where three age groups wear facemasks.
• We analyze the cost effectiveness of the use of facemasks during an epidemic.
• Facemasks can reduce the number of influenza cases as well as economic losses.
• Our analyses show facemasks could reduce economic losses by $570 billion.
Tracht et al. Page 15
J Theor Biol. Author manuscript; available in PMC 2013 May 7.
NIH
-PA Author Manuscript
NIH
-PA Author Manuscript
NIH
-PA Author Manuscript
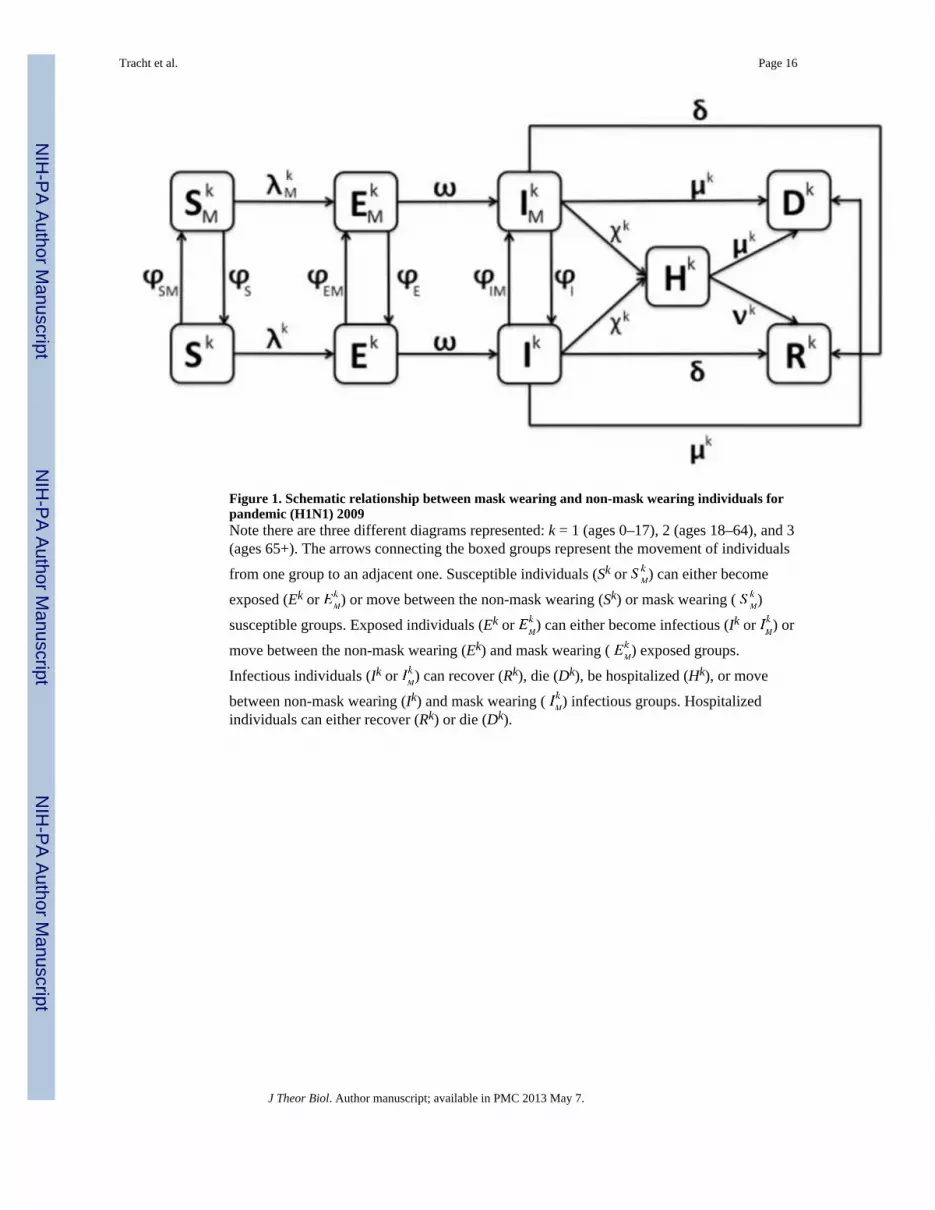
Figure 1. Schematic relationship between mask wearing and non-mask wearing individuals forpandemic (H1N1) 2009Note there are three different diagrams represented: k = 1 (ages 0–17), 2 (ages 18–64), and 3(ages 65+). The arrows connecting the boxed groups represent the movement of individuals
from one group to an adjacent one. Susceptible individuals (Sk or ) can either become
exposed (Ek or ) or move between the non-mask wearing (Sk) or mask wearing ( )
susceptible groups. Exposed individuals (Ek or ) can either become infectious (Ik or ) or
move between the non-mask wearing (Ek) and mask wearing ( ) exposed groups.
Infectious individuals (Ik or ) can recover (Rk), die (Dk), be hospitalized (Hk), or move
between non-mask wearing (Ik) and mask wearing ( ) infectious groups. Hospitalizedindividuals can either recover (Rk) or die (Dk).
Tracht et al. Page 16
J Theor Biol. Author manuscript; available in PMC 2013 May 7.
NIH
-PA Author Manuscript
NIH
-PA Author Manuscript
NIH
-PA Author Manuscript
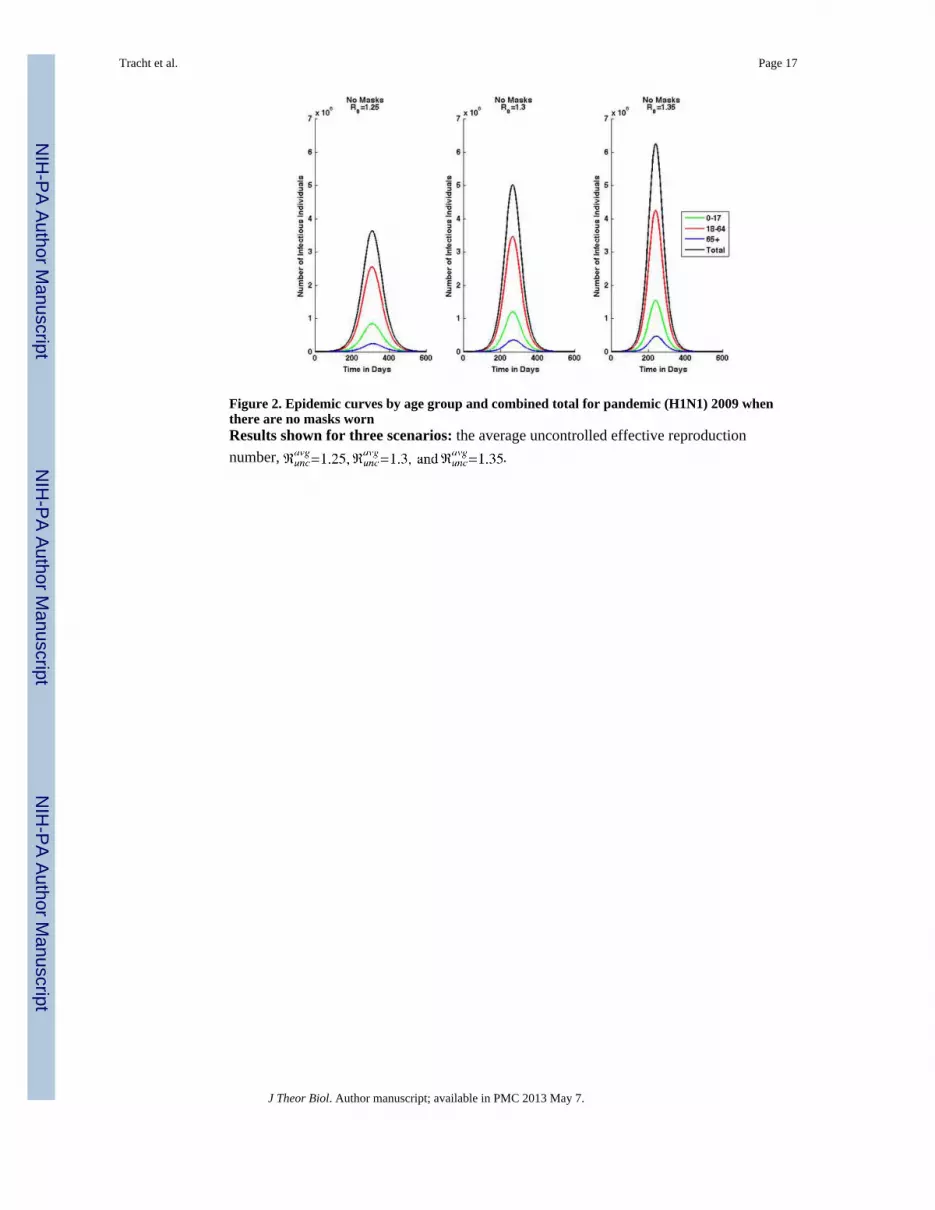
Figure 2. Epidemic curves by age group and combined total for pandemic (H1N1) 2009 whenthere are no masks wornResults shown for three scenarios: the average uncontrolled effective reproductionnumber, .
Tracht et al. Page 17
J Theor Biol. Author manuscript; available in PMC 2013 May 7.
NIH
-PA Author Manuscript
NIH
-PA Author Manuscript
NIH
-PA Author Manuscript
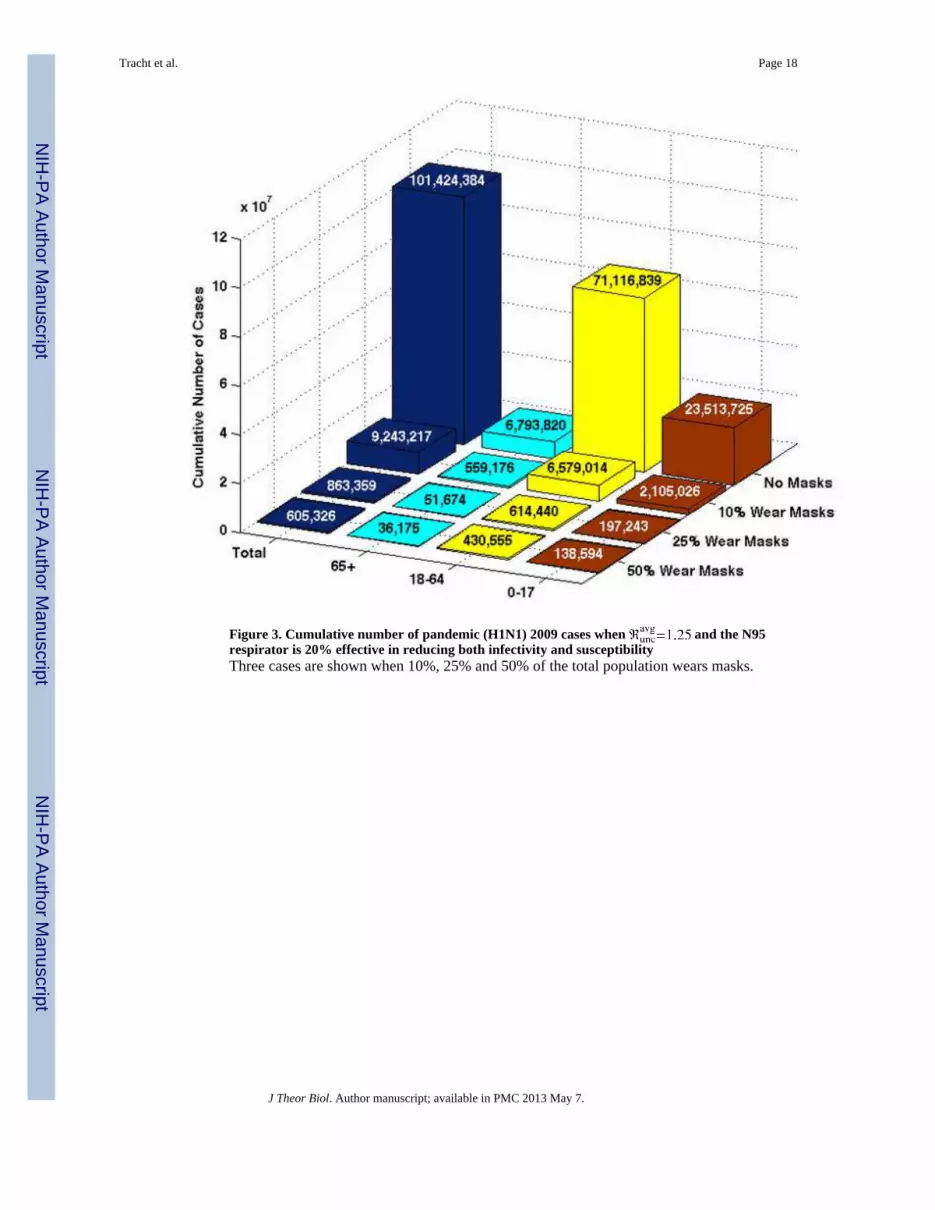
Figure 3. Cumulative number of pandemic (H1N1) 2009 cases when and the N95respirator is 20% effective in reducing both infectivity and susceptibilityThree cases are shown when 10%, 25% and 50% of the total population wears masks.
Tracht et al. Page 18
J Theor Biol. Author manuscript; available in PMC 2013 May 7.
NIH
-PA Author Manuscript
NIH
-PA Author Manuscript
NIH
-PA Author Manuscript
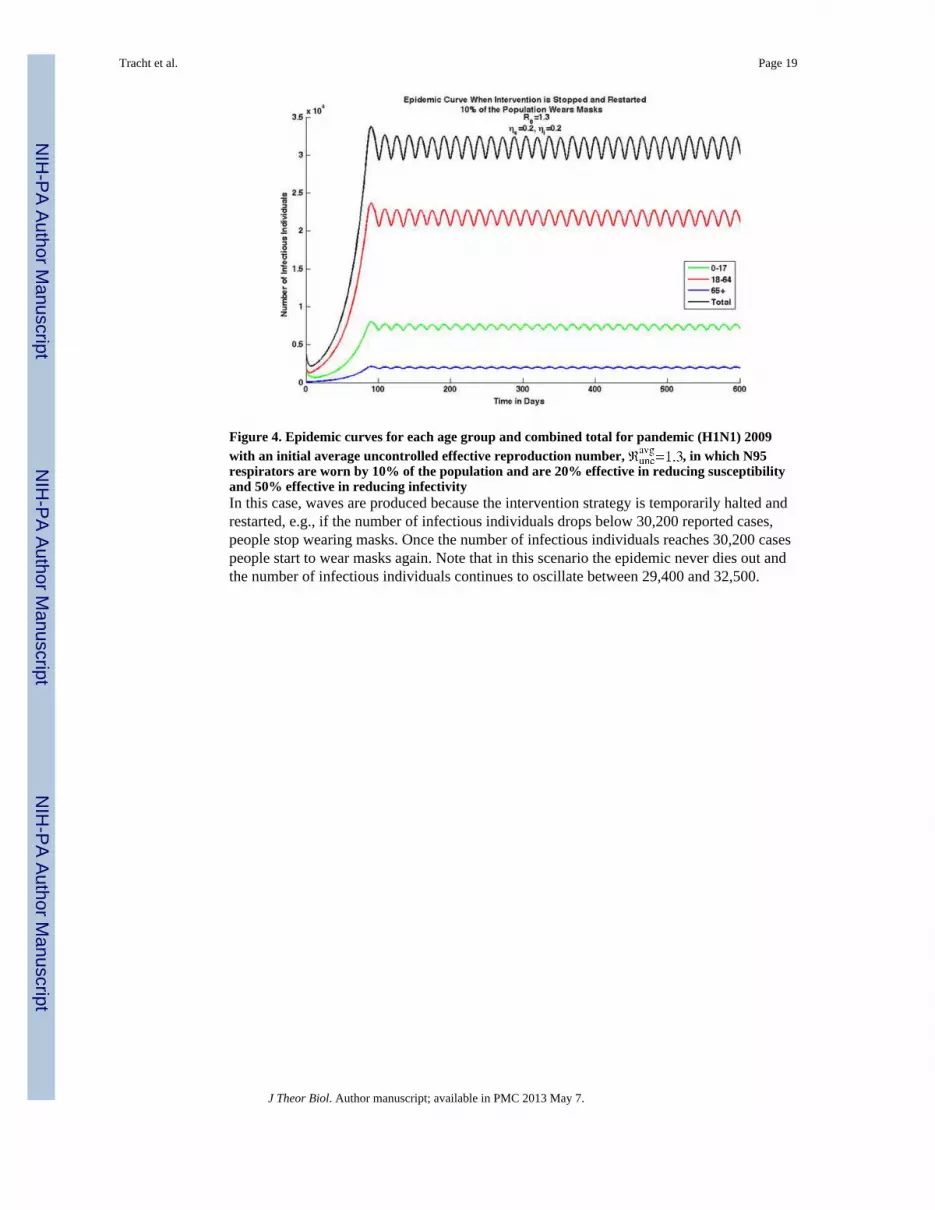
Figure 4. Epidemic curves for each age group and combined total for pandemic (H1N1) 2009with an initial average uncontrolled effective reproduction number, , in which N95respirators are worn by 10% of the population and are 20% effective in reducing susceptibilityand 50% effective in reducing infectivityIn this case, waves are produced because the intervention strategy is temporarily halted andrestarted, e.g., if the number of infectious individuals drops below 30,200 reported cases,people stop wearing masks. Once the number of infectious individuals reaches 30,200 casespeople start to wear masks again. Note that in this scenario the epidemic never dies out andthe number of infectious individuals continues to oscillate between 29,400 and 32,500.
Tracht et al. Page 19
J Theor Biol. Author manuscript; available in PMC 2013 May 7.
NIH
-PA Author Manuscript
NIH
-PA Author Manuscript
NIH
-PA Author Manuscript

Figure 5. The number of cumulative cases for when N95 respirators are 20% effectivein reducing both susceptibility and infectivityPart a shows the results for age specific compliance. Three different scenarios are shown: 1)10% of children, 25% of adults, and 10% of seniors wear masks (blue bar), 2) 10% ofchildren, 50% of adults, and 25% of seniors wear masks (green bar), 3) 25% of children,50% of adults, and 10% of seniors wear masks (red bar). Note that the compliance rates ofthe children and seniors do not appear to decrease the disease spread, but the compliancerates of adults greatly reduces the number of cases. If only 25% of adults comply comparedto 50% the number of cases nearly doubles. Part b shows the results when one group is notwearing masks and 25% of the other two remaining groups wearing masks. Note that ifchildren or seniors do not wear masks the results are very similar, however, there is a largeincrease in the number of cases if adults do not wear masks. Part c shows the results whenthere is a limited number of masks available. The blue bar shows the number of cases ifthere are 75,500,000 masks available and the red bar shows if there are 100,000,000 masksavailable. Note that the goal in distributing the masks is to reduce the total number of deaths.Part d shows the results when the objective is to reduce the number of deaths below 24,000.The blue bars represent when 19% of adults wear N95 respirators and 0% of children andseniors wear them. The red bars represent when 15% of all age groups wear masks. Notethat the number of cumulative cases is lower when 15% of the entire population; while it isimportant for the adult age group to wear masks, better results are seen when all age groupscomply.
Tracht et al. Page 20
J Theor Biol. Author manuscript; available in PMC 2013 May 7.
NIH
-PA Author Manuscript
NIH
-PA Author Manuscript
NIH
-PA Author Manuscript

Figure 6. Net savings when 10% of the population is wearing N95 respirators and they are 20%effective in reducing both susceptibility and infectivityThree different pandemic severity scenarios are shown. The greatest net savings for thelength of the pandemic are seen when the adult (18–64) age group wears masks.
Tracht et al. Page 21
J Theor Biol. Author manuscript; available in PMC 2013 May 7.
NIH
-PA Author Manuscript
NIH
-PA Author Manuscript
NIH
-PA Author Manuscript

Figure 7. Net savings when the population wears N95 respirators that are 20% effective inreducing both infectivity and susceptibility, with an Part a shows the net savings for the age specific compliance scenario. There are threescenarios shown: 1) 10% of children, 25% of adults, and 10% of seniors wear masks (bluebar), 2) 10% of children, 50% of adults, and 25% of seniors wear masks (green bar), and 3)25% of children, 50% of adults, and 10% of seniors wear masks (red bar). Part b shows thenet savings when one group is not wearing masks and 25% of the other two remaininggroups wearing masks. If adults do not wear facemasks, net savings are reduced. Part cshows net savings when there are a limited number of masks available. Similar net savingsare seen in both cases; the goal is to distribute masks effectively to reduce the total numberof deaths. Part d shows the net savings when the objective is to reduce the number of deathsbelow 24,000. Note that similar net savings are seen in both cases; the goal is to distributemasks effectively to reduce the total number of deaths to less than 24,000.
Tracht et al. Page 22
J Theor Biol. Author manuscript; available in PMC 2013 May 7.
NIH
-PA Author Manuscript
NIH
-PA Author Manuscript
NIH
-PA Author Manuscript

NIH
-PA Author Manuscript
NIH
-PA Author Manuscript
NIH
-PA Author Manuscript
Tracht et al. Page 23
Table 1
State variables and definitions for the model.
Variable Definition
Sk Number of susceptible individuals not wearing a mask in age group k
Number of susceptible individuals wearing a mask in age group k
Ek Number of exposed individuals not wearing a mask in age group k
Number of exposed individuals wearing a mask in age group k
Ik Number of infected individuals not wearing a mask in age group k
Number of infected individuals wearing a mask in age group k
Hk Number of hospitalized individuals in age group k
Rk Number of recovered individuals in age group k
Dk Number of dead individuals in age group k
J Theor Biol. Author manuscript; available in PMC 2013 May 7.

NIH
-PA Author Manuscript
NIH
-PA Author Manuscript
NIH
-PA Author Manuscript
Tracht et al. Page 24
Table 2Mixing matrix
The average number of daily contacts age group k has with age group j (Del Valle et al., 2007).
Age Children (0–17) Adults (18–64) Seniors (65+)
Children (0–17) 23.3824 31.7305 1.9396
Adults (18–64) 7.9593 37.1030 3.4924
Seniors (65+) 3.1534 21.8981 7.6981
J Theor Biol. Author manuscript; available in PMC 2013 May 7.

NIH
-PA Author Manuscript
NIH
-PA Author Manuscript
NIH
-PA Author Manuscript
Tracht et al. Page 25
Tabl
e 3
Para
met
er v
alue
s and
des
crip
tions
Para
met
erD
escr
iptio
nU
nits
Bas
elin
eR
ange
Ref
eren
ce
N1
Popu
latio
n of
age
gro
up 1
(0–1
7)Pe
ople
73,0
00,0
001–
100
mill
ion
36
N2
Popu
latio
n of
age
gro
up 2
(18–
64)
Peop
le19
1,00
0,00
01–
250
mill
ion
36
N3
Popu
latio
n of
age
gro
up 3
(65+
)Pe
ople
38,0
00,0
001–
50 m
illio
n36
Effe
ctiv
e re
prod
uctio
n nu
mbe
r (un
cont
rolle
d) fo
r age
gro
up 1
(0–1
7)1
1.3
& 1
.35
& 1
.40–
235
; 32;
40;
29
effe
ctiv
e re
prod
uctio
n nu
mbe
r (un
cont
rolle
d) fo
r age
gro
up 2
(18–
64)
11.
25 &
1.3
& 1
.35
0–2
35; 3
2; 4
0; 2
9
effe
ctiv
e re
prod
uctio
n nu
mbe
r (un
cont
rolle
d) fo
r age
gro
up 3
(65+
)1
1.2
& 1
.25
& 1
.30–
235
; 32;
40;
29
Ave
rage
eff
ectiv
e re
prod
uctio
n nu
mbe
r (un
cont
rolle
d)1
1.25
& 1
.3 &
1.3
50–
235
; 32;
40;
29
βkj
Tran
smis
sion
rate
from
age
gro
up k
to a
ge g
roup
j1
See
Text
0–1
See
Text
κ kj
Ave
rage
num
ber o
f con
tact
s age
gro
up k
has
with
age
gro
up j
See
Text
0–40
16
ξ kIn
fect
ivity
of a
ge g
roup
k1
See
Text
0–1
See
Text
ι jSu
scep
tibili
ty o
f age
gro
up j
11
0–1
8; 3
9
ωIn
cuba
tion
rela
tive
rate
Day
−1
0.25
0–1
35; 1
0
δN
on-h
ospi
taliz
ed re
cove
ry re
lativ
e ra
teD
ay−
10.
200–
110
ν1H
ospi
taliz
ed re
cove
ry ra
te re
lativ
e fo
r age
gro
up 1
(0–1
7)D
ay−
10–
127
ν2H
ospi
taliz
ed re
cove
ry ra
te re
lativ
e fo
r age
gro
up 2
(18–
64)
Day
−1
0–1
27
ν3H
ospi
taliz
ed re
cove
ry ra
te re
lativ
e fo
r age
gro
up 3
(65+
)D
ay−
10–
127
μ1D
eath
rela
tive
rate
for a
ge g
roup
1 (0
–17)
Day
−1
0.00
0019
20–
111
; 32
μ2D
eath
rela
tive
rate
for a
ge g
roup
2 (1
8–64
)D
ay−
10.
0008
224
0–1
11; 3
2
μ3D
eath
rela
tive
rate
for a
ge g
roup
3 (6
5+)
Day
−1
0.00
0081
020–
111
; 32
χ1H
ospi
taliz
atio
n re
lativ
e ra
te fo
r age
gro
up 1
(0–1
7)D
ay−
10.
0043
50–
111
J Theor Biol. Author manuscript; available in PMC 2013 May 7.
NIH
-PA Author Manuscript
NIH
-PA Author Manuscript
NIH
-PA Author Manuscript
Tracht et al. Page 26
Para
met
erD
escr
iptio
nU
nits
Bas
elin
eR
ange
Ref
eren
ce
χ2H
ospi
taliz
atio
n re
lativ
e ra
te fo
r age
gro
up 2
(18–
64)
Day
−1
0.00
457
0–1
11
χ3H
ospi
taliz
atio
n re
lativ
e ra
te fo
r age
gro
up 3
(65+
)D
ay−
10.
0045
0–1
11
θR
educ
ed c
onta
cts d
ue to
hos
pita
lizat
ion
10–
1Se
e Te
xt
αR
educ
ed in
fect
ious
ness
due
to in
cuba
tion
10.
50–
1Se
e Te
xt
η iD
ecre
ase
in in
fect
ivity
bec
ause
of m
ask
10.
200–
124
; 1
η sD
ecre
ase
in su
scep
tibili
ty b
ecau
se o
f mas
k1
0.50
0–1
24; 1
τN
umbe
r of i
nfec
tious
indi
vidu
als a
t whi
ch m
asks
are
impl
emen
ted
Peop
le30
,200
30,2
00Se
e Te
xt
a rPo
sitiv
e co
nsta
nt th
at d
eter
min
es th
e ra
te o
f mov
emen
t bet
wee
n m
ask
and
non-
mas
k cl
asse
s1
00–
1Se
e Te
xt
b rPo
sitiv
e co
nsta
nt th
at d
eter
min
es th
e ra
te o
f mov
emen
t bet
wee
n m
ask
and
non-
mas
k cl
asse
s1
0.1
0–1
See
Text
ϕ rM
ovem
ent r
ate
betw
een
mas
k an
d no
n-m
ask
clas
ses,
r = S
, SM
, E, E
M, I
, IM
1Se
e Te
xt0–
1Se
e Te
xt, 1
3
I1 /N1
Initi
ally
infe
cted
frac
tion
of p
opul
atio
n of
age
gro
up 1
10–
115
I2 /N2
Initi
ally
infe
cted
frac
tion
of p
opul
atio
n of
age
gro
up 2
10–
115
I3 /N3
Initi
ally
infe
cted
frac
tion
of p
opul
atio
n of
age
gro
up 3
10–
115
J Theor Biol. Author manuscript; available in PMC 2013 May 7.
NIH
-PA Author Manuscript
NIH
-PA Author Manuscript
NIH
-PA Author Manuscript
Tracht et al. Page 27
Table 4Baseline results
Cumulative number of cases, deaths, and hospitalizations in the absence of masks for three initial values of.
Category Age Group
Cases
0–17 23,513,725 28,084,081 31,912,371
18–64 71,116,839 81,223,927 88,372,676
65+ 6,793,820 8,365,016 9,758,304
Total 101,424,384 117,673,024 130,043,351
Deaths
0–17 2,257 2,695 3,063
18–64 281,319 321,299 349,578
65+ 2,660 3,276 3,821
Total 286,236 327,270 356,462
Hospitalizations
0–17 500,489 597,769 679,255
18–64 2,482,884 2,835,751 3,085,333
65+ 292,243 359,830 419,764
Total 3,275,616 3,793,350 4,184,352
J Theor Biol. Author manuscript; available in PMC 2013 May 7.

NIH
-PA Author Manuscript
NIH
-PA Author Manuscript
NIH
-PA Author Manuscript
Tracht et al. Page 28
Tabl
e 5
Cum
ulat
ive
num
ber
of c
ases
, dea
ths,
and
hosp
italiz
atio
ns fo
r 10
%, 2
5%, a
nd 5
0% o
f the
pop
ulat
ion
wea
ring
N95
res
pira
tors
whe
n th
ey a
re20
% e
ffect
ive
in r
educ
ing
susc
eptib
ility
and
infe
ctiv
ity
The
resu
lts fr
om th
ree
diff
eren
t ini
tial a
vera
ge e
ffec
tive
repr
oduc
tion
num
bers
unc
ontro
lled
are
show
n:
.
N95
Res
pira
tor:
ηi=
0.2
and η s
=0.2
Cat
egor
yA
ge G
roup
10%
25%
50%
Cas
es
0–17
2,10
5,02
64,
715,
016
7,43
1,06
419
7,24
331
7,59
173
1,98
813
8,59
417
0,44
822
7785
18–6
46,
579,
014
13,9
87,2
7020
,886
,048
614,
440
942,
665
2,06
1,78
643
0,55
550
4,21
463
9348
65+
559,
176
1,27
5,28
12,
042,
594
51,6
7484
,198
196,
065
36,1
7544
,965
6060
5
Tot
al9,
243,
216
19,9
77,5
6730
,359
,706
863,
357
1,34
4,45
42,
989,
839
605,
324
719,
627
9277
38
Dea
ths
0–17
202
452
713
1830
7013
1621
18–6
426
,024
55,3
2982
,619
2,43
03,
728
8,15
51,
703
1,99
425
29
65+
219
499
799
2032
7614
1723
Tot
al26
,445
56,2
8084
,131
2,46
83,
790
8,30
11,
730
2,02
725
73
Hos
pita
lizat
ions
0–17
44,8
0510
0,35
715
8,17
04,
198
6,75
915
,580
2,94
93,
627
4848
18–6
422
9,68
948
8,31
972
9,18
921
,451
32,9
1171
,982
15,0
3117
,603
2232
1
65+
24,0
5354
,855
87,8
642,
222
3,62
18,
433
1,55
61,
934
2607
Tot
al29
8,54
764
3,53
197
5,22
327
,871
43,2
9195
,995
19,5
3623
,164
2977
6
J Theor Biol. Author manuscript; available in PMC 2013 May 7.

NIH
-PA Author Manuscript
NIH
-PA Author Manuscript
NIH
-PA Author Manuscript
Tracht et al. Page 29
Tabl
e 6
Para
met
er v
alue
s and
des
crip
tions
use
d to
cal
cula
te th
e ne
t sav
ings
from
usi
ng m
asks
Mon
etar
y va
lues
are
exp
ress
ed in
yea
r 201
0 U
.S. d
olla
rs. k
repr
esen
ts th
e di
ffer
ent a
ge g
roup
s.
Eco
nom
ic A
naly
sis P
aram
eter
s and
Des
crip
tions
Use
d to
Cal
cula
te N
et S
avin
gs
Para
met
erD
escr
iptio
nU
nits
Bas
elin
eR
ange
Ref
eren
ce
HP k
Num
ber o
f hos
pita
lizat
ions
pre
vent
ed in
age
gro
up k
Peop
leSe
e Te
xtSe
e Te
xtSe
e Te
xt
DP k
Num
ber o
f dea
ths p
reve
nted
in a
ge g
roup
kPe
ople
See
Text
See
Text
See
Text
CP k
Num
ber o
f cas
es p
reve
nted
in a
ge g
roup
kPe
ople
See
Text
See
Text
See
Text
WM
kN
umbe
r of i
ndiv
idua
ls w
earin
g m
asks
in a
ge g
roup
kPe
ople
See
Text
0–50
%Se
e Te
xt
LFk
Perc
enta
ge o
f pop
ulat
ion
in th
e la
bor f
orce
164
.7%
60–7
0%6
AH
D1
Ave
rage
hos
pita
l dur
atio
n fo
r chi
ldre
nD
ays
51–
107
AH
D2
Ave
rage
hos
pita
l dur
atio
n fo
r adu
ltsD
ays
81–
107
AH
D3
Ave
rage
hos
pita
l dur
atio
n fo
r sen
iors
Day
s10
1–10
7
AH
C1
Ave
rage
hos
pita
l cos
t for
chi
ldre
n4,
235.
31*
1,00
0–10
,000
27
AH
C2
Ave
rage
hos
pita
l cos
t for
adu
lts8,
678.
35*
1,00
0–10
,000
27
AH
C3
Ave
rage
hos
pita
l cos
t for
seni
ors
9,89
0.09
*1,
000–
10,0
0027
AI
Ave
rage
inco
me
165.
3610
0–50
05
PV1
Pres
ent v
alue
ear
ning
s los
t for
chi
ldre
n1,
465,
771*
3–10
mill
ion
27
PV2
Pres
ent v
alue
ear
ning
s los
t for
adu
lts1,
496,
890*
3–10
mill
ion
27
PV3
Pres
ent v
alue
ear
ning
s los
t for
seni
ors
94,9
72*
3–10
mill
ion
27
AA
Ave
rage
abs
ente
eism
due
to in
fluen
za-li
ke il
lnes
sD
ays
1.3
0–5
2
CM
Cos
t of N
95 re
spira
tor (
5 Pa
ck)
$9.0
015
–35
14
* Adj
uste
d to
U.S
. 201
0 do
llars
.
J Theor Biol. Author manuscript; available in PMC 2013 May 7.
NIH
-PA Author Manuscript
NIH
-PA Author Manuscript
NIH
-PA Author Manuscript
Tracht et al. Page 30
Tabl
e 7
Net
savi
ngs g
aine
d by
a p
erce
ntag
e of
the
popu
latio
n w
earin
g N
95 R
espi
rato
rs.
Net
Sav
ings
: N95
Res
pira
tor
(201
0 U
.S. D
olla
rs in
Bill
ions
)
Cat
egor
yA
ge G
roup
10%
25%
50%
Net
Sav
ings
η i =
0.2
, ηs =
0.2
0–17
14.8
116
.16
16.9
316
.13
19.2
121
.57
16.1
719
.31
21.9
2
18–6
441
4.55
431.
8943
3.49
452.
8251
5.63
554.
3745
3.91
518.
3756
3.42
65+
26.6
730
.33
33.0
028
.83
35.4
140
.89
28.8
835
.56
41.4
6
Tot
al45
6.03
478.
3848
3.43
497.
7757
0.25
616.
8349
8.96
573.
2462
6.80
Net
Sav
ings
η i =
0.5
, ηs =
0.2
0–17
16.1
519
.30
21.9
116
.20
19.3
622
.01
16.2
119
.37
22.0
2
18–6
445
3.51
518.
1256
3.29
454.
8751
9.89
565.
8345
5.05
520.
1056
6.08
65+
28.8
735
.57
41.4
728
.94
34.7
141
.62
28.9
435
.67
41.6
2
Tot
al49
8.54
572.
9962
6.67
500.
0157
3.97
629.
4650
0.20
575.
1462
9.73
Net
Sav
ings
η i =
0.5
, ηs =
0.5
0–17
16.1
819
.34
21.9
916
.21
19.3
722
.02
16.2
119
.38
22.0
3
18–6
445
4.50
519.
3256
5.30
455.
1552
0.23
566.
2145
5.24
520.
3356
6.33
65+
28.9
335
.64
41.5
928
.96
35.6
941
.64
28.9
535
.68
41.6
4
Tot
al49
9.61
574.
3062
8.88
500.
3157
5.29
629.
8850
0.40
575.
3863
0.00
J Theor Biol. Author manuscript; available in PMC 2013 May 7.
NIH
-PA Author Manuscript
NIH
-PA Author Manuscript
NIH
-PA Author Manuscript
Tracht et al. Page 31
Table 8
Net savings for age specific compliance rates for , ηs =0.2, and ηi=0.2.
Compliance RatesChildren – 10%
Adults - 25%Seniors - 10%
Compliance RatesChildren - 10%Adults - 50%Seniors - 25%
Compliance RatesChildren - 25%Adults - 50%Seniors - 10%
Net Savings (In billions)
0–17 19.14 19.28 19.28
18–64 514.39 518.17 518.36
65+ 35.31 35.55 35.56
Total 568.85 573.01 573.21
Note that the only significant difference is when the adult population has a lower compliance rate; varying the percentage of children and seniorswearing masks does not effect net savings much.
J Theor Biol. Author manuscript; available in PMC 2013 May 7.
NIH
-PA Author Manuscript
NIH
-PA Author Manuscript
NIH
-PA Author Manuscript
Tracht et al. Page 32
Table 9
Net savings for for when one age group does not wear masks and 25% of the other two age groups does wearmasks, , ηs=0.2, and ηi=0.2.
Compliance RatesChildren - 0%Adults - 25%Seniors - 25%
Compliance RatesChildren - 25%
Adults - 0%Seniors - 25%
Compliance RatesChildren - 25%Adults - 25%Seniors - 0%
Net Savings (In billions)
0–17 18.91 3.92 19.17
18–64 509.74 36.53 515.13
65+ 35.06 7.09 35.34
Total 563.72 47.55 569.64
Note that when the adult population does not wear masks the net savings is significantly lower, however net savings does not change if eitherchildren or seniors do not wear masks.
J Theor Biol. Author manuscript; available in PMC 2013 May 7.
Related Documents