ECONOMIC ANALYSIS OF CRITICAL HABITAT DESIGNATION FOR THE NORTHERN SPOTTED OWL Final Report| November 20, 2012 prepared for: U.S. Fish and Wildlife Service 4401 N. Fairfax Drive Arlington, VA 22203 prepared by: Industrial Economics, Incorporated 2067 Massachusetts Avenue Cambridge, MA 02140 617/354-0074

Welcome message from author
This document is posted to help you gain knowledge. Please leave a comment to let me know what you think about it! Share it to your friends and learn new things together.
Transcript
ECONOMIC ANALYSIS OF
CRITICAL HABITAT DESIGNATION
FOR THE NORTHERN SPOTTED
OWL
Final Report| November 20, 2012
prepared for:
U.S. Fish and Wildlife Service
4401 N. Fairfax Drive
Arlington, VA 22203
prepared by:
Industrial Economics, Incorporated
2067 Massachusetts Avenue
Cambridge, MA 02140
617/354-0074
Final Economic Analysis - November 20, 2012
i
ACKNOWLEDGEMENTS
This report was completed by Industrial Economics, Incorporated (IEc) for the U.S. Fish
and Wildlife Service (the Service), under Contract Number GS-10F-0244J; Blanket
Purchase Agreement Number F08PA60467; Delivery Order Number F11PD02610.
The effort was directed by Service staff in Regions 1 and 9 with significant additional
technical support provided by the Oregon Fish and Wildlife Office.
Advice and guidance on this report was provided by K. Norman Johnson, University
Distinguished Professor, Oregon State University College of Forestry. In addition, Dr.
Randal Rucker, Professor, Department of Agricultural Economics and Economics,
Montana State University provided technical review of the draft analysis.
Final Economic Analysis - November 20, 2012
ii
TABLE OF CONTENTS
LIST OF ACRONYMS AND ABBREVIATIONS
EXECUTIVE SUMMARY TES-1
CHAPTER 1 INTRODUCTION 1-1
1.1 Previous Federal Actions 1-2
1.2 Proposed Critical Habitat Designation 1-3
1.3 Economic Activities Considered in this Analysis 1-7
1.4 Organization of the Report 1-8
CHAPTER 2 FRAMEWORK FOR THE ANALYSIS 2-1
2.1 Background 2-2
2.2 Categories of Potential Economic Effects of Species Conservation 2-4
2.3 Analytic Framework and Scope of the Analysis 2-7
2.4 Sources of Information 2-15
2.5 Presentation of Results 2-15
CHAPTER 3 BACKGROUND 3-1
3.1 Timber Industry Trends 3-1
3.2 Forces Driving Timber Industry Trends 3-17
3.3 Background on Federal Land Payment Programs 3-19
3.4 Background on Ecological Forestry 3-23
CHAPTER 4 TIMBER IMPACTS – FEDERAL LANDS 4-1
4.1 Step 1 – Identify Federal Lands Proposed for Critical Habitat Designation 4-2
4.2 Step 2 – Identify Areas Where Potential Incremental Impacts May Occur 4-3
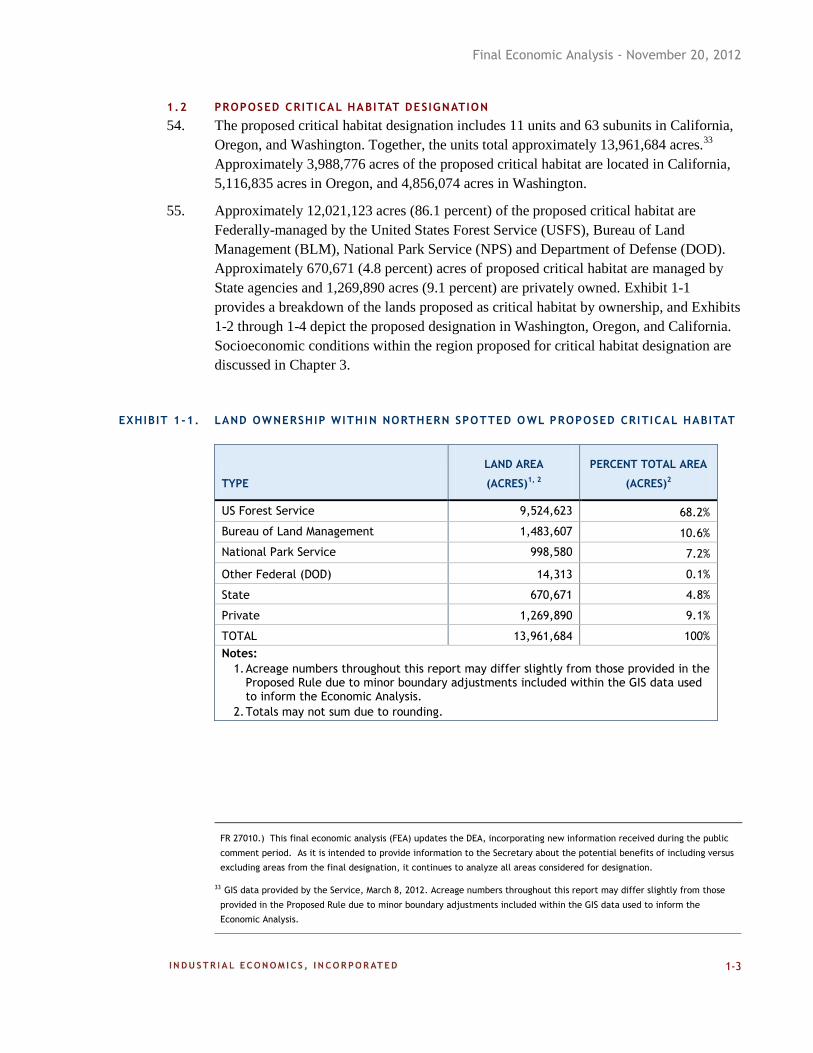
4.3 Step 3 – Evaluate the Geographic Distribution of Areas Where Potential Incremental
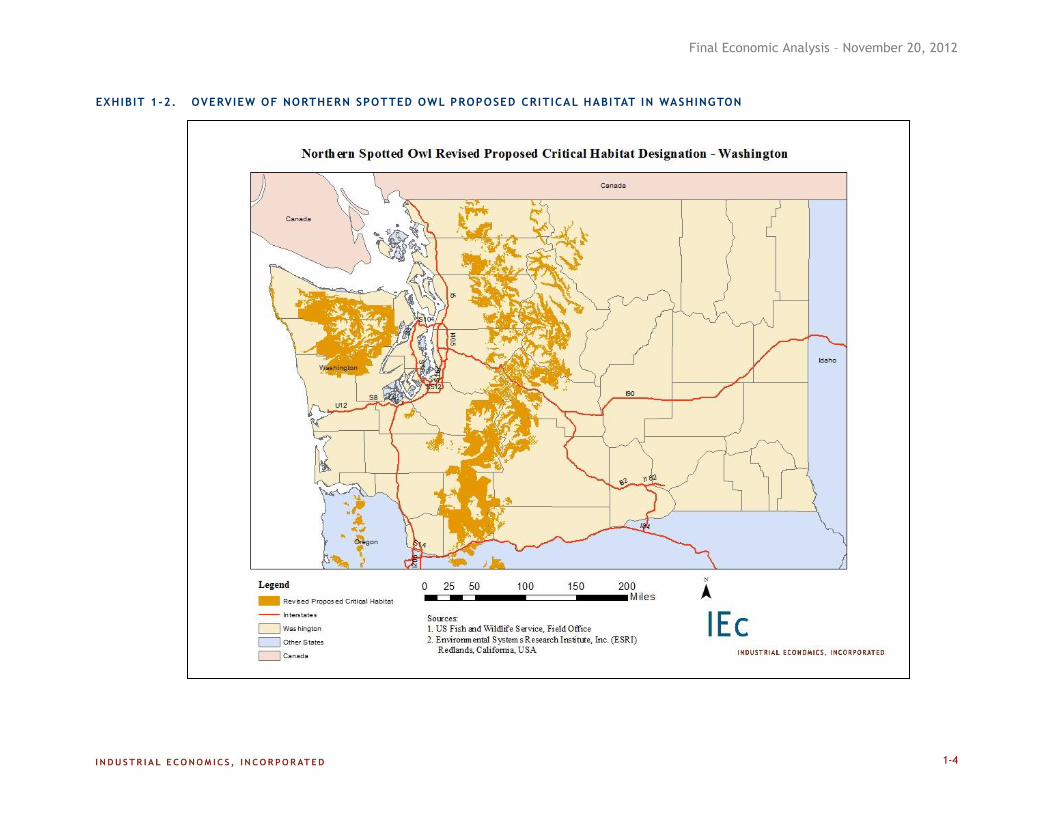
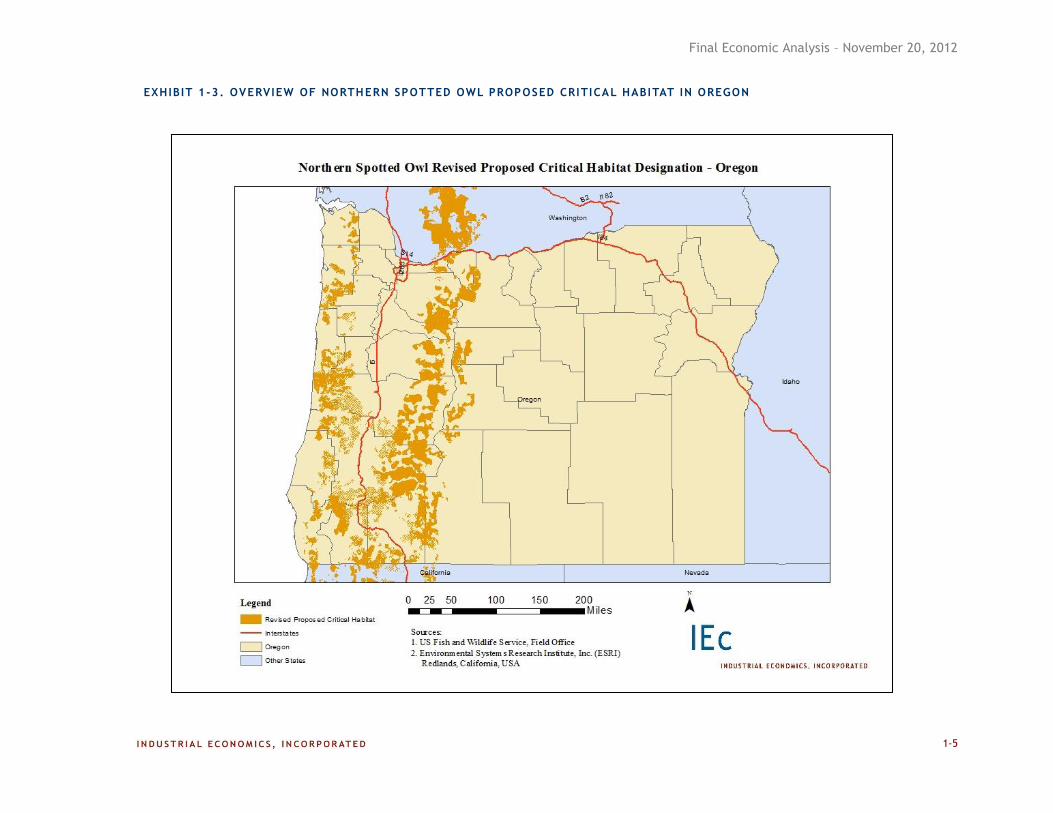
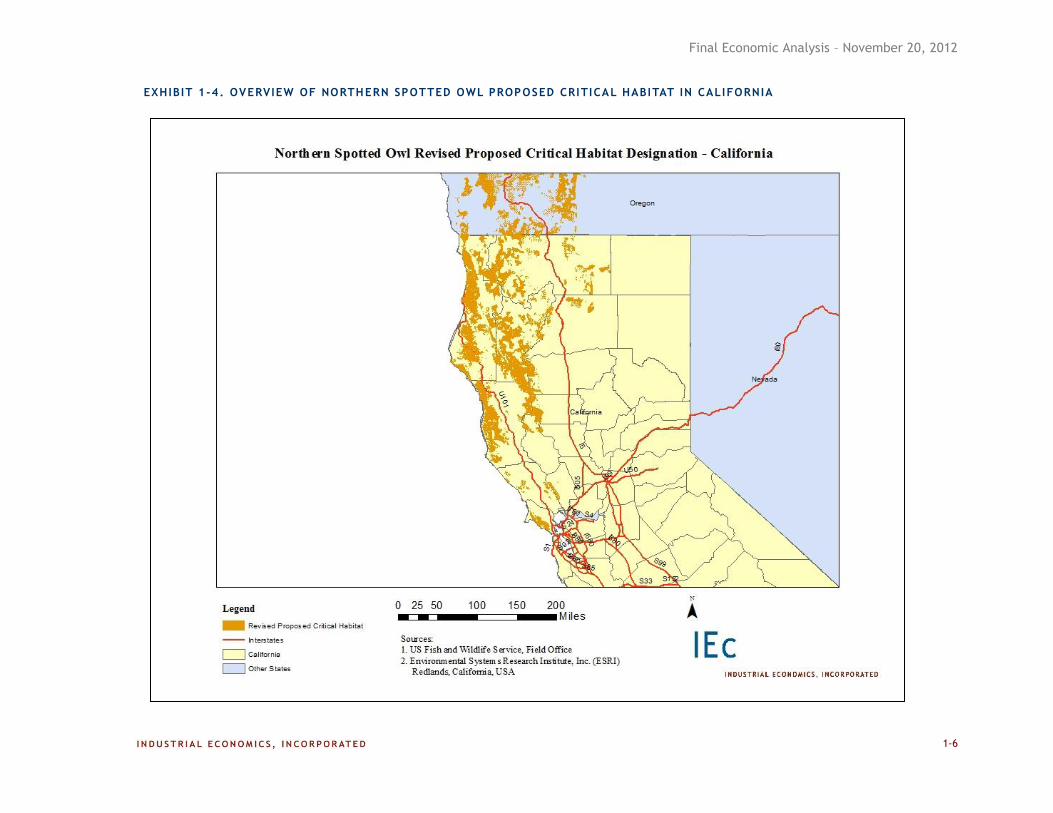
Effects May Occur Across Critical Habitat Subunits 4-9
4.4 Step 4 – Quantify the Relative Magnitude of Potential Changes in Future Timber
Harvest Volumes 4-16
4.5 Analytic Results 4-32
4.6 Additional Sensitivity Analysis 4-37
CHAPTER 5 TIMBER IMPACTS – STATE AND PRIVATE LANDS 5-1
5.1 Step 1 – Identify State and Private Acres Proposed for Designation 5-1
5.2 Step 2 – Identify Acres Potentially Subject to Incremental Impacts 5-3
5.3 Step 3 – Estimate the Relative Costs of Changes to Timber Harvest on
Private Lands 5-29
5.4 Key Sources of Uncertainty 5-31
Final Economic Analysis - November 20, 2012
iii
CHAPTER 6 REGIONAL IMPACTS 6-1
6.1 Socioeconomic Profiles of Subject Counties 6-1
6.2 Summary of Socioeconomic Analysis 6-8
6.3 Discussion of Potential Impacts of Critical Habitat 6-9
6.4 Key Sources of Uncertainty 6-11
CHAPTER 7 POTENTIAL ECONOMIC IMPACTS TO LINEAR PROJECTS 7-1
7.1 Existing Baseline Protections 7-1
7.2 Frequency of Future Linear Project Activity 7-4
7.3 Summary of Administrative Costs 7-11
CHAPTER 8 POTENTIAL ECONOMIC BENEFITS 8-1
8.1 Estimating Conservation Benefits 8-2
8.2 Qualitative Discussion of the Ancillary Benefits of Critical Habitat Designation for
the Northern Spotted Owl 8-9
8.3 Discussion 8-13
REFERENCES R-1
APPENDIX A ADDITIONAL STATUTORY REQUIREMENTS A-1
A.1 RFA/SBREFA Analysis A-1
A.2 UMBRA Analysis A-10
A.3 Federalism Implications A-10
A.4 Potential Impacts to the Energy Industry A-11
APPENDIX B INCREMENTAL EFFECTS MEMORANDUM FOR THE ECONOMIC ANALYSIS OF
THE PROPOSED RULE TO REVISE CRITICAL HABITAT FOR THE NORTHERN
SPOTTED OWL B-1
APPENDIX C CONTACTS C-1
APPENDIX D SENSITIVITY OF RESULTS TO DISCOUNT RATE D-1
Final Economic Analysis - November 20, 2012
iv
LIST OF ACRONYMS AND ABBREVIATIONS
BLM Bureau of Land Management
BMP Best Management Practices
CAL FIRE California Department of Forestry and Fire Protection
CalTrans California Department of Transportation
CEC California Energy Commission
CEQA California Environmental Quality Act
Corps U.S. Army Corps of Engineers
CWA Clean Water Act
DFW Department of Fish and Wildlife
DNR Department of Natural Resources
DOD Department of Defense
DOTs Departments of Transportation
EFSC Energy Facility Siting Council
EFSEC Energy Facility Site Evaluation Council
EIS Environmental Impact Statement
EPA Environmental Protection Agency
ESA or Act Endangered Species Act
FERC Federal Energy Regulatory Commission
HCPs Habitat Conservation Plans
IE Incremental Effects
ISC Interagency Scientific Committee
ITP Incidental Take Permit
LRMP Land and Resource Management Plan
LSR Late Successional Reserves
MBF thousand board feet
MMBF million board feet
NAICS North American Industry Classification System
NEPA National Environmental Policy Act
NPDES National Pollution Discharge Elimination System
Final Economic Analysis - November 20, 2012
v
NPS National Park Service
NSO or species northern spotted owl (Strix occidentalis caurina)
NWFP Northwest Forest Plan
ODOT Oregon Department of Transportation
O&C Oregon and California Land Grant
OMB U.S. Office of Management and Budget
PILT Payments in Lieu of Taxes
PSQ Probable Sale Quantity
REIT Real Estate Investment Trust
RFA Regulatory Flexibility Act
RFP Registered Professional Forester
RMP Resource Management Plan
SBREFA Small Business Regulatory Enforcement Fairness Act
SEPA State Environmental Policy Act
Service U.S. Fish and Wildlife Service
SHAs Safe Harbor Agreements
SOSEAs Spotted Owl Special Emphasis Areas
SRS Secure Rural Schools and Community Self-Determination Act
THP Timber Harvesting Plan
TIMO Timberland Investment Management Organizations
UMBR Unfunded Mandates Reform Act
USFS United States Forest Service
WSDOT Washington Department of Transportation
WTP Willingness to Pay
Final Economic Analysis - November 20, 2012
ES-1
EXECUTIVE SUMMARY
1. The purpose of this report is to identify and analyze the potential economic impacts of the
designation of critical habitat for the northern spotted owl (Strix occidentalis caurina)
(hereafter, “NSO” or “species”) in the United States.1
2. Section 4(b)(2) of the Endangered Species Act (the Act) directs the Secretary of the
Interior to designate critical habitat
“…on the basis of the best scientific data available and after taking into
consideration the economic impact, and any other relevant impact, of
specifying any particular area as critical habitat. The Secretary may
exclude any area from critical habitat if he determines that the benefits of
such exclusion outweigh the benefits of specifying such area as part of
the critical habitat, unless he determines, based on the best scientific and
commercial data available, that the failure to designate such area as
critical habitat will result in the extinction of the species concerned.”2
3. The information presented in this report is intended to assist the Secretary in determining
whether the benefits of excluding particular areas from the designation outweigh the
benefits of including those areas in the designation. In addition, this information allows
the Service to address the requirements of Executive Orders 12866, “Regulatory Review
and Planning,” and 13563, “Improving Regulation and Regulatory Review;” the
Regulatory Flexibility Act (RFA), as amended by the Small Business Regulatory
Enforcement Fairness Act (SBREFA, 5 U.S.C. 601-612); the Unfunded Mandates
Reform Act (UMRA; P.L.104-4); Executive Order 13132, “Federalism;” and Executive
Order 13211, “Actions Concerning Regulations that Significantly Affect Energy Supply,
Distribution, or Use.”
4. Finally, this report was prepared with attention to the memorandum issued by the
President to the Secretary of the Interior on February 28, 2012, regarding the proposed
revised critical habitat for the northern spotted owl, and focusing on minimizing
regulatory burdens. We re-state in the text box below the information regarding this
memorandum provided in the Notice of Availability (NOA) for this report.3
1 This final economic analysis analyzes the proposed designation as described in the Proposed Rule, incorporating information received during the public comment period on the draft economic analysis. This analysis does not reflect changes to the proposed critical habitat designation made in the Final Rule. Consequently, description of the habitat designation in the Final Rule may differ from maps and figures presented in this report. 2 16 U.S.C. §1533(b)(2)
3 2012 Proposed Rule; Extension of Public Comment Period; Announcement of Public Meetings and Public Hearing, 77 FR
27010.
Final Economic Analysis - November 20, 2012
ES-2
SERVICE RESPONSE CONCERNING PRESIDENTIAL DIRECTIVE
On February 28, 2012, the President issued a memorandum to the Secretary of the Interior regarding the
proposed revised critical habitat for the northern spotted owl, specifically on minimizing regulatory
burdens. In that memo, the President gave the following direction to the Secretary:
“In order to avoid unnecessary costs and burdens and to advance the principles of Executive
Order 13563, consistent with the ESA, I hereby direct you to take the following actions:
(1) publish, within 90 days of the date of this memorandum, a full analysis of the economic
impacts of the proposed rule, including job impacts, and make that analysis available
for public comment;
(2) consider excluding private lands and State lands from the final revised critical habitat,
consistent with applicable law and science;
(3) develop clear direction, as part of the final rule, for evaluating logging activity in areas
of critical habitat, in accordance with the scientific principles of active forestry
management and to the extent permitted by law;
(4) carefully consider all public comments on the relevant science and economics,
including those comments that suggest potential methods for minimizing regulatory
burdens;
(5) give careful consideration to providing the maximum exclusion from the final revised
critical habitat, consistent with applicable law and science; and
(6) to the extent permitted by law, adopt the least burdensome means, including avoidance
of unnecessary burdens on States, tribes, localities, and the private sector, of promoting
compliance with the ESA, considering the range of innovative ecosystem management
tools available to the Department and landowners.”
To comply with this directive, the Service has taken the following steps:
(1) We conducted and completed, as per normal practice, an economic analysis on the
probable impacts of the proposed revised critical habitat, specifically in the areas of
timber harvest and linear projects, and included a consideration of potential impacts to
jobs. In this document, we announce the availability of this draft economic analysis for
public review and comment. As discussed in more detail below, we found that,
depending on the decisions made and future directions taken by Federal action
agencies, the incremental impacts of the proposed critical habitat revision will likely be
minimal, or may even have a positive impact, if ecological forestry prescriptions are
applied. This analysis will be refined and revised, based on information we receive
during our comment period, and a final economic analysis will be made available at the
time of publication of the final rule.
(2) In our proposed rule (77 FR 14062; March 8, 2012), we proposed several options that
we are considering for our final designation, three of which address the potential
exclusion of private and State lands from the final critical habitat determination. In
making the final determination, we will consider the best available scientific and
commercial information, including information we receive during our public comment
period. This information will be used in our evaluation process, described in section
4(b)(2) of the Act, which will examine the benefits of inclusion and the benefits of
exclusion of specific areas from the final critical habitat designation, so that the
Secretary may make informed decisions regarding exclusions.
Final Economic Analysis - November 20, 2012
ES-3
DESCRIPTION OF PROPOSED CRITICAL HABITAT
5. The proposed critical habitat designation includes 11 units and 63 subunits in California,
Oregon, and Washington. Together, the units total approximately 13,961,684 acres.4
Approximately 3,988,776 acres of the proposed critical habitat are located in California,
5,116,835 acres in Oregon, and 4,856,074 acres in Washington.
4 GIS data provided by the Service, March 8, 2012. Acreage numbers throughout this report may differ slightly from those
provided in the Proposed Rule due to minor boundary adjustments included within the GIS data used to inform the
Economic Analysis.
(3) In our proposed rule, we provided a description of ecological forestry management
actions that are compatible with both northern spotted owl recovery and timber harvest,
as recommended in the Revised Recovery Plan for the Northern Spotted Owl (76 FR
38575; July 1, 2011), which, in some areas, may actually increase harvest relative to
recent realized levels (but not necessarily to planned levels under the NWFP). While it
is outside the purview of the Service to direct forestry management, we will consult
with Federal action agencies and make recommendations on the best measures to
provide protections for the owl and have minimal negative economic impacts.
(4) It is the normal practice of the Service to solicit public review and comment on all rule-
making actions, and, as noted above, we consistently follow the standard of using the
best available scientific information in making critical habitat determinations. In our
proposed rule (77 FR 14062; March 8, 2012), we requested specific information from
all interested parties, and additionally have requested comment from expert peer
reviewers. In this notice, we have added several additional specific questions for
comment, including questions on the analytic framework and information in our draft
economic analysis, and we will use all information received in our analysis and final
determination.
(5) In our March 8, 2012, proposed rule (77 FR 14062), we identified several options we
are considering for the final designation which include the consideration of excluding
private, State, and Congressionally Reserved lands within the proposed critical habitat.
Additionally, we have solicited comments and information regarding any other areas
that may be appropriate for exclusion. Again, the Secretary will consider all
appropriate exclusions, and use the best available scientific and commercial information
to inform his evaluation in making any exclusions to the final designation, as provided
by section 4(b)(2) of the Act.
(6) The Service appreciates, and is sensitive to, the potential for regulatory burden that may
result from our designation of critical habitat for the northern spotted owl under the Act.
Our analysis indicates that the proposed revision of critical habitat, as informed by the
Revised Recovery Plan for the Northern Spotted Owl (76 FR 38575; July 1, 2011), is
anticipated to have little incremental effects above and beyond the conservation
measures already required as a result of its threatened status, and thus is expected to
impose minimal additional regulatory burden. The Service appreciates, and relies on
the many partners we have in conservation, including private landowners, Tribes,
States, and local governments, and strongly desires to promote conservation
partnerships to conserve, protect, and enhance fish, wildlife, plants, and their habitats
for the continuing benefit of the American people.
Final Economic Analysis - November 20, 2012
ES-4
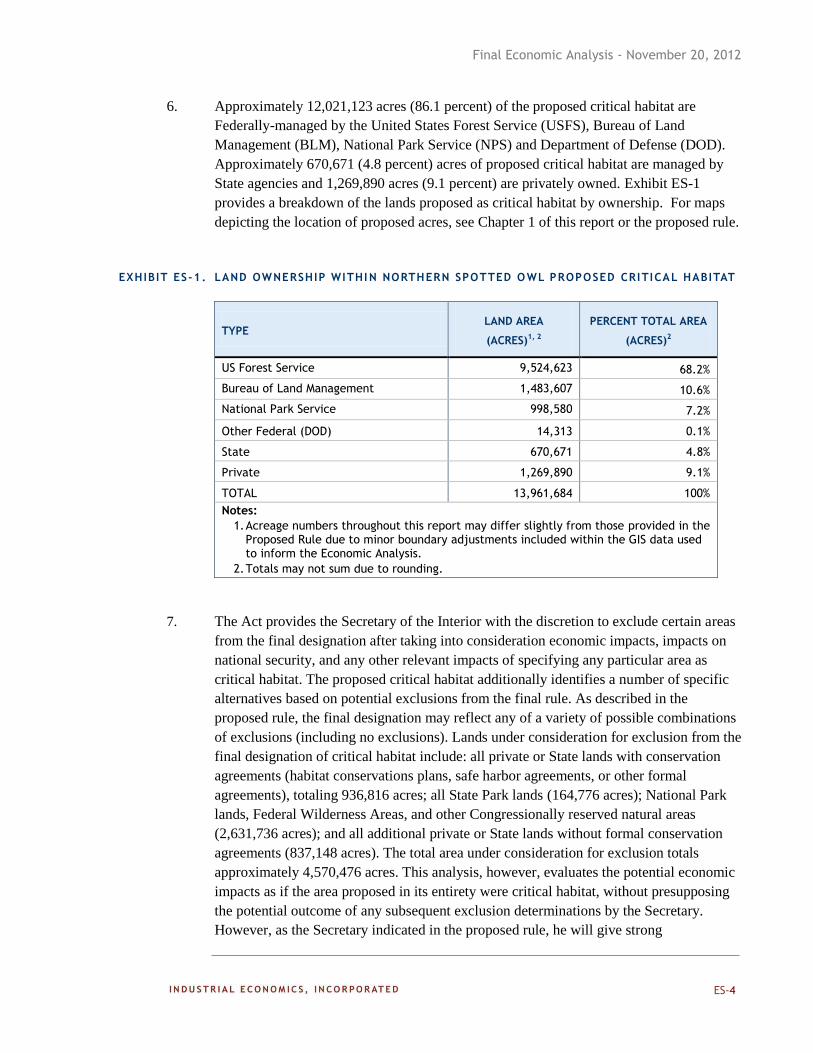
6. Approximately 12,021,123 acres (86.1 percent) of the proposed critical habitat are
Federally-managed by the United States Forest Service (USFS), Bureau of Land
Management (BLM), National Park Service (NPS) and Department of Defense (DOD).
Approximately 670,671 (4.8 percent) acres of proposed critical habitat are managed by
State agencies and 1,269,890 acres (9.1 percent) are privately owned. Exhibit ES-1
provides a breakdown of the lands proposed as critical habitat by ownership. For maps
depicting the location of proposed acres, see Chapter 1 of this report or the proposed rule.
EXHIBIT ES-1 . LAND OWNERSHIP WITHI N NORTHERN SPOTTED OWL PROPOSED CRITICAL HABITAT
TYPE LAND AREA
(ACRES)1, 2
PERCENT TOTAL AREA
(ACRES)2
US Forest Service 9,524,623 68.2%
Bureau of Land Management 1,483,607 10.6%
National Park Service 998,580 7.2%
Other Federal (DOD) 14,313 0.1%
State 670,671 4.8%
Private 1,269,890 9.1%
TOTAL 13,961,684 100%
Notes:
1. Acreage numbers throughout this report may differ slightly from those provided in the Proposed Rule due to minor boundary adjustments included within the GIS data used to inform the Economic Analysis.
2. Totals may not sum due to rounding.
7. The Act provides the Secretary of the Interior with the discretion to exclude certain areas
from the final designation after taking into consideration economic impacts, impacts on
national security, and any other relevant impacts of specifying any particular area as
critical habitat. The proposed critical habitat additionally identifies a number of specific
alternatives based on potential exclusions from the final rule. As described in the
proposed rule, the final designation may reflect any of a variety of possible combinations
of exclusions (including no exclusions). Lands under consideration for exclusion from the
final designation of critical habitat include: all private or State lands with conservation
agreements (habitat conservations plans, safe harbor agreements, or other formal
agreements), totaling 936,816 acres; all State Park lands (164,776 acres); National Park
lands, Federal Wilderness Areas, and other Congressionally reserved natural areas
(2,631,736 acres); and all additional private or State lands without formal conservation
agreements (837,148 acres). The total area under consideration for exclusion totals
approximately 4,570,476 acres. This analysis, however, evaluates the potential economic
impacts as if the area proposed in its entirety were critical habitat, without presupposing
the potential outcome of any subsequent exclusion determinations by the Secretary.
However, as the Secretary indicated in the proposed rule, he will give strong
Final Economic Analysis - November 20, 2012
ES-5
consideration to exclude the maximum areas from the final designation consistent with
applicable law and science.
REGULATORY CONTEXT
8. Considerable efforts have already been undertaken to protect the NSO. The species was
first listed under the Act as a threatened species on June 26, 1990, and critical habitat was
designated on Federal lands less than two years later, in early 1992.5 During the same
period, a series of lawsuits over Federal timber sales led to the 1991 court injunction that
halted the majority of timber sales occurring on Federal lands within the range of the
NSO. In response to the lawsuits, President Clinton convened a forest conference in 1993
and issued a mandate for Federal land-management and regulatory agencies to develop a
plan to resolve the conflict. The resulting Northwest Forest Plan (NWFP) was adopted in
1994. This plan has been the primary tool guiding Federal forest management and
endangered species protection in the region since its adoption.
9. In 2008, the Service finalized a revised designation of critical habitat, which was based
on the Service’s Draft Recovery Plan published the same year.6 Again, the Service
limited its designation to Federal lands. Both the 2008 critical habitat designation and the
2008 recovery plan were challenged in court.7 On October 12, 2010, the Court remanded
the 2008 critical habitat designation and adopted the Service’s proposed schedule to issue
a new proposed revised critical habitat rule for public comment by November 15, 2011,
and a final rule by November 15, 2012. The deadline for publication of the Proposed
Rule was later extended to February 28, 2012.
10. In response to the Court’s order, the Service published the current proposed rule.8 As
described above, this revised rule proposes 13,961,684 acres of critical habitat. The
Service’s proposal includes State and private lands as critical habitat for the NSO,
although the Service has proposed alternatives that consider excluding these lands to
various degrees from the Final Rule. To support the Secretary’s decision process, the
study area for the analysis presented in this report covers all acres considered in the
proposed rule, including lands under consideration for exclusion from the Final Rule.
Thus, we analyze all acres as though they are ultimately designated as critical habitat.
The results provide information on the potential benefits of excluding these acres from
designation.
11. The Service identifies a series of economic activities potentially affecting the NSO and its
habitat within the boundaries of the proposed critical habitat. These activities include
timber management, wildfire management, road construction and linear projects, and
other forest and species management activities. We focus our efforts on analyzing
potential impacts to timber management. We also discuss wildfire management in the
context of timber management activities and separately estimate economic impacts to
5 1990 Final Listing Rule, 55 FR 26114; 1992 Final Critical Habitat Rule, 57 FR 1796.
6 2008 Final Critical Habitat Rule, 73 FR 47325.
7 Carpenters’ Industrial Council v. Salazar, Case No. 1:08–cv–01409–EGS (D.DC)
8 2012 Proposed critical Habitat Rule, 77 FR 14104.
Final Economic Analysis - November 20, 2012
ES-6
road construction and linear projects. Finally, we consider the potential distributional
effects of the rule, including regional employment and governmental revenue impacts.
REGIONAL ECONOMIC CO NTEXT
12. The timber industry has long been an economic driver in the Pacific Northwest, providing
a substantial share of the economic foundation for many rural communities. Over the past
20 years, the industry has undergone significant changes that have manifested in reduced
timber-related jobs and revenues. The drivers of change are many and varied; some are
politically contentious and high-profile, such as the controversies over forest management
practices and protective measures for endangered species (including the NSO, marbled
murrelets, and Pacific salmon), and others are complex and variable, such as
globalization of the timber market and modernization of the industry.
13. Overall, the volume of timber harvested in the 56 counties where revised critical habitat
is proposed has decreased by 51 percent over the past 20 years, from approximately 12.4
billion board feet to 6.0 billion board feet. 9,10,11,12
In addition, actual Federal timber
harvests have not kept pace with the levels anticipated by the NWFP due in part to
controversy over harvesting mature and old-growth stands, which were expected to be the
primary harvest component in the first few decades of the plan. For example, planned
annual harvest levels under the NWFP totaled over 800 million board feet from 1999 to
the present, while actual harvest levels in recent years have been approximately 60
percent of this planned total. 13
As the availability of Federal timber sales decreased, the
relative importance of harvests from private lands increased.
14. Employment in the Pacific Northwest timber industry has also declined over the past 20
years by approximately 52 percent. Many variables have contributed to the decline in
timber industry employment, including the decline in the availability of Federal timber,
mechanization, transfer of capital investment away from the region, closure of less
efficient mills, and fluctuating demand for wood products. It is important to view
changes in timber industry employment in the Pacific Northwest within the greater
context of regional market conditions.
15. Between 1990 and 2000, timber industry employment in the NWFP area declined by
approximately 30,000 jobs. Meanwhile, there were increases in both population and total
9 California State Board of Equalization, "California Timber Harvest By County: Year 2010 Quarter 1 to 4." Accessed at
http://www.boe.ca.gov/proptaxes/pdf/ytr362010.pdf March 2012.
10 California State Board of Equalization, "California Timber Harvest By County: 1994-2009." Accessed at
http://www.boe.ca.gov/proptaxes/pdf/yr3694to09.pdf March 2012.
11 Oregon Department of Forestry, "Oregon Annual Timber Reports." Accessed at
http://www.oregon.gov/ODF/STATE_FORESTS/FRP/annual_reports.shtml March 2012.
12 Washington State Department of Natural Resources, “Washington State Timber Harvest.” Accessed at
http://www.dnr.wa.gov/BusinessPermits/Topics/EconomicReports/Pages/obe_washington_timber_harvest_reports.aspx
March 2012.
13 USFS, Pacific Northwest Region, Northwest Forest Plan—The First 15 Years (1994-2008): Socioeconomic Status and Trends,
R6-RPM-TP-03-2011, 2011.
Final Economic Analysis - November 20, 2012
ES-7
employment in the tri-state area of California, Oregon, and Washington; population
increased by 15 percent and employment grew 18 percent, representing a total of 3.8
million jobs gained.14
During the following decade, however, population in the tri-state
area continued to grow but job growth slowed, with total employment increasing only
three percent between 2000 and 2010.15 As of 2009, the timber industry accounted for
approximately two percent of employment overall in the counties where revised critical
habitat is proposed. On a county-by-county basis employment in the timber industry
ranges from zero to 24 percent of total county employment.
16. In addition to employment opportunities, counties in our study area are dependent on
several Federal land payment programs that compensate county governments for the tax-
exempt status of Federal public lands within their boundaries. The payments, which have
undergone significant reforms over the past century, have at times constituted significant
portions of county and school budgets. The future of the two largest sources of payments
in recent years, Payments in Lieu of Taxes (PILT) and the Secure Rural Schools and
Community Self-Determination Act (SRS), are both uncertain. The remaining programs,
the U.S. Forest Service (USFS) 25% Fund and the U.S. Bureau of Land Management
Oregon and California Land Grant (O&C) Revenue Sharing Payment are permanently
authorized; however, the payments from these programs are closely linked to the amount
of timber harvested from Federal lands.
ANALYTIC APPROACH
17. This analysis estimates the incremental impacts resulting from the designation of critical
habitat. Specifically, the U.S. Office of Management and Budget’s (OMB) guidelines for
best practices concerning the conduct of economic analysis of Federal regulations direct
agencies to measure the costs of a regulatory action against a baseline, which it defines as
the “best assessment of the way the world would look absent the proposed action.”16
Significant debate has occurred regarding whether assessing the impact of critical habitat
designations using this baseline approach is appropriate, with several courts issuing
divergent opinions.
18. In order to address these court opinions and provide the most complete information to
decision-makers, this economic analysis both: (1) describes the baseline protections
afforded the NSO absent critical habitat; and (2) quantifies the potential incremental
impacts precipitated specifically by the designation. The most challenging part of this
analysis involves isolating the new requirements imposed on regulated entities as a result
of the designation.
19. The baseline for this analysis is the existing state of regulation, prior to the designation of
critical habitat, which provides protection to the species under the Act, as well as under
14 Routman, K. 2007. Forest Communities and the Northwest Forest Plan: What Socioeconomic Monitoring Can Tell Us.
Science Findings (95). Pacific Northwest Research Station, USDA Forest Service.
15 U.S. Bureau of Economic Analysis, “Interactive Data: Regional Data: GDP & Personal Income: Annual State Personal Income
and Employment,” as viewed at http://www.bea.gov/iTable/iTable.cfm?ReqID=70&step=1 on September 30, 2012.
16 OMB, “Circular A-4,” September 17, 2003, available at http://www.whitehouse.gov/omb/circulars/a004/a-4.pdf.
Final Economic Analysis - November 20, 2012
ES-8
other Federal, State and local laws and guidelines. To characterize the “world without
critical habitat,” our baseline for this analysis, we also attempt to forecast these
conditions into the future over the time frame of our analysis, recognizing that such
projections are subject to uncertainty.
20. The NSO is already subject to a variety of Federal, State, and local protections throughout
most of its range, due to its threatened status under the ESA and regardless of the
designation of critical habitat. On Federal lands, these protections include the standards
and guidelines of the NWFP and the protections provided by sections 7, 9, and 10 of the
Act. Most State lands within the proposed designation are either covered under a Habitat
Conservation Plan (HCP) or are composed of State Parks or State Fish and Wildlife
lands. Many of these lands have State regulations or guidelines in place that provide
habitat protection for NSO, regardless of critical habitat. Finally, most private lands with
within the proposed designation are subject to existing or proposed HCPs, Safe Harbor
Agreements (SHAs), or conservation easements.
21. Next, the most challenging part of this analysis involves isolating the new requirements
imposed on regulated entities as a result of the designation of critical habitat given the
considerable baseline protection already provided this species. When critical habitat is
designated, section 7 of the Act requires Federal agencies to ensure that their actions will
not result in the destruction or adverse modification of critical habitat. Agencies engage
in consultation with the Service whenever activities they undertake, authorize, permit, or
fund may affect designated critical habitat. The administrative costs of this process, and
the additional impacts of implementing project modifications necessary to avoid adverse
modification, are the direct compliance costs of the designation. Quantifying the related
effect on owl population is not possible with the current modeling.
22. The Service is the best source of information concerning potential direct incremental
regulatory impacts, which result from the conduct of consultations under section 7 of the
Act. It describes its likely recommendations in a memorandum drafted to support this
analysis, titled “Incremental Effects Memorandum for the Economic Analysis of the
Proposed Rule to Revise Critical Habitat for the Northern Spotted Owl.”17
This
memorandum is provided in Appendix B of this report.
23. In addition to the direct implementation of the regulation, the informational nature of
critical habitat designation may also influence State and local regulators or private
entities. For example, State agencies responsible for the management of State
timberlands may choose to impose greater restrictions on those lands overlapping Federal
critical habitat, or State permitting agencies may request additional protective measures
prior to the issuance of permits for harvests on private lands. In addition, because critical
habitat for NSO has not previously been designated on private lands, private landowners
may be concerned about additional restrictions resulting from Federal or State oversight
or third-party lawsuits. Regardless of whether such restrictions are ultimately realized,
17 U.S. Fish and Wildlife Service, “Incremental Effects Memorandum for the Economic Analysis of the Proposed Rule to Revise
Critical Habitat for the Northern Spotted Owl,” March 23, 2012.
Final Economic Analysis - November 20, 2012
ES-9
the regulatory uncertainty created by the rule may incentivize private landowners to alter
current management practices.
24. Such outcomes are unintended consequences of the regulation; however, these outcomes
may result in real costs or benefits. To better understand the potential for such indirect
effects, we conducted extensive interviews with State regulators, private landowners, and
industry representatives. These conversations are documented throughout the report, and
a complete list of the sources contacted is provided in Appendix C.
25. Once we established the potential changes in economic behavior potentially resulting
from the direct and indirect implementation of the rule, we use available market and other
data to quantify, and monetize where possible, incremental effects. We also consider the
distribution of these impacts across sensitive subpopulations and the effect of these
changes on employment in the region. Finally, we qualitatively discuss the potential
benefits of the regulation.
26. The general approach described above is similar to the approach followed in the 2008
Economic Analysis supporting the 2008 designation of critical habitat for the NSO.
However, key differences exist. These differences are summarized in Exhibit ES-2.
ANALYSIS RESULTS
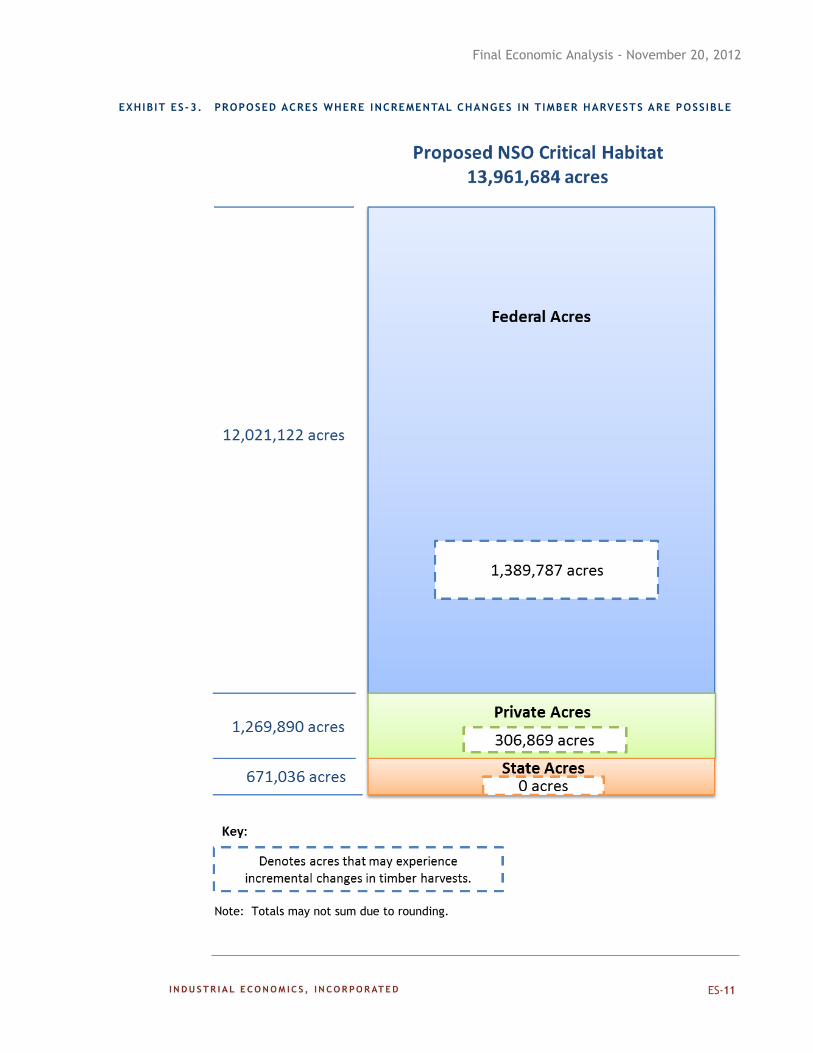
27. Based on our discussion with relevant Federal and State regulators and private
stakeholders, we conclude that only a fraction of the overall proposed revised designation
will result in more than incremental, minor administrative costs. Exhibit ES-3 highlights
these findings. Specifically, of the 13,961,684 acres proposed for designation, we
consider potential incremental changes in timber harvest practices on 1,389,787 acres of
USFS and BLM land, or approximately 10 percent of the total acres proposed. In
addition, potential exists for the owners of 306,869 acres of private land to experience
incremental changes in harvests (approximately 2 percent of total acres proposed). No
incremental changes in harvests are expected on State lands.
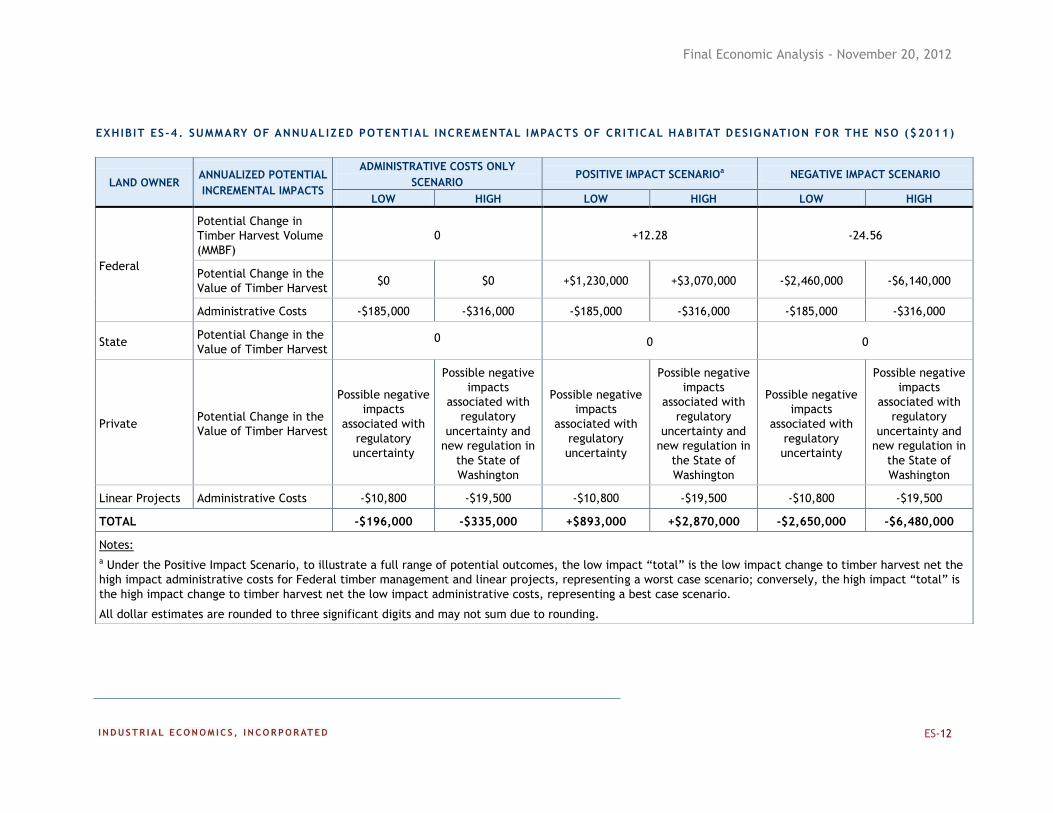
28. Exhibit ES-4 summarizes our measures of potential incremental impacts within these
areas of focus by economic activity and land ownership type. With respect to Federal
lands, consultations with Federal land managers, the Service, and other experts indicate
varying opinions regarding potential critical habitat effects on timber management
practices, and noted the difficulty and limitations of deriving precise measures of positive
or negative incremental change. Therefore, we contemplate three alternative scenarios,
which are described in greater detail below and in Chapter 4. These scenarios include:
(1) administrative costs only; (2) potential positive incremental impacts to timber harvest
on Federal lands; and (3) potential negative incremental impacts to timber harvest on
Federal lands. Furthermore, we present a potential low impact and high impact outcome
for each of the three scenarios. In addition, the exhibit presents our qualitative
conclusions concerning potential timber harvest impacts to private lands, and notes the
conclusion that zero timber harvest impacts are likely to occur on State lands. Finally,
the exhibit notes the potential incremental administrative effects related to linear projects.
We discuss each of these impact categories in further detail below. More detailed results
by critical habitat unit and subunit are presented in Chapters 4, 5, and 7.
Final Economic Analysis - November 20, 2012
ES-10
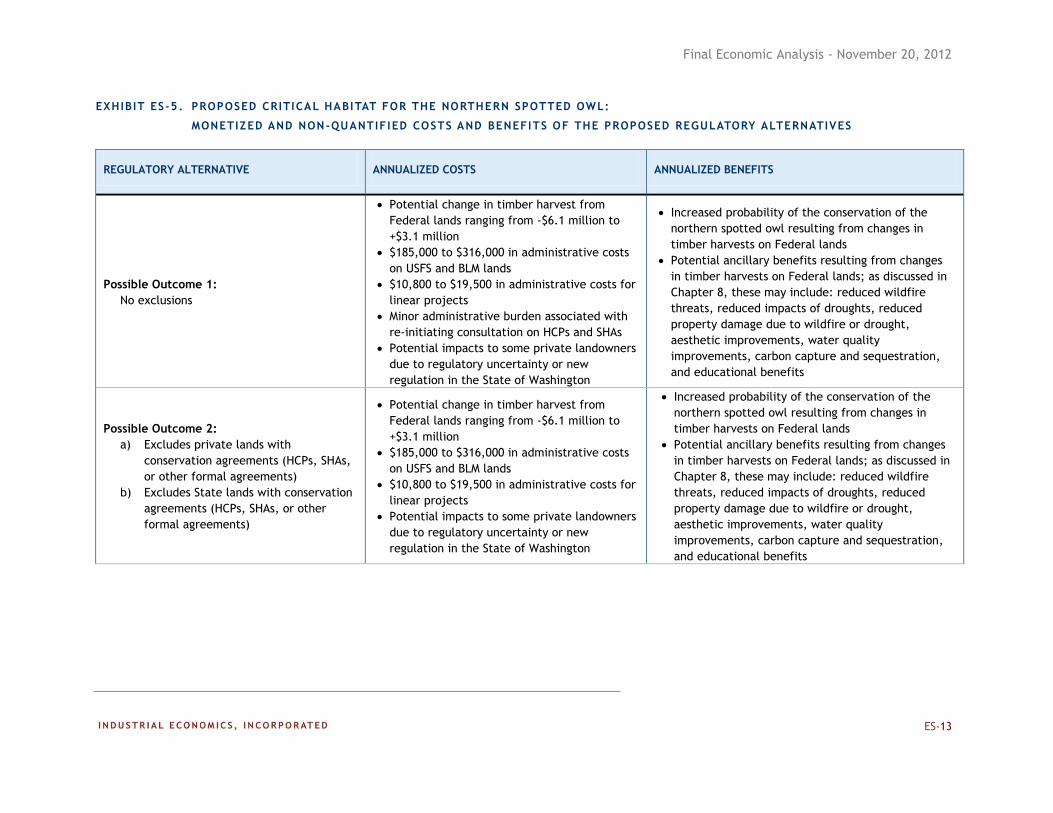
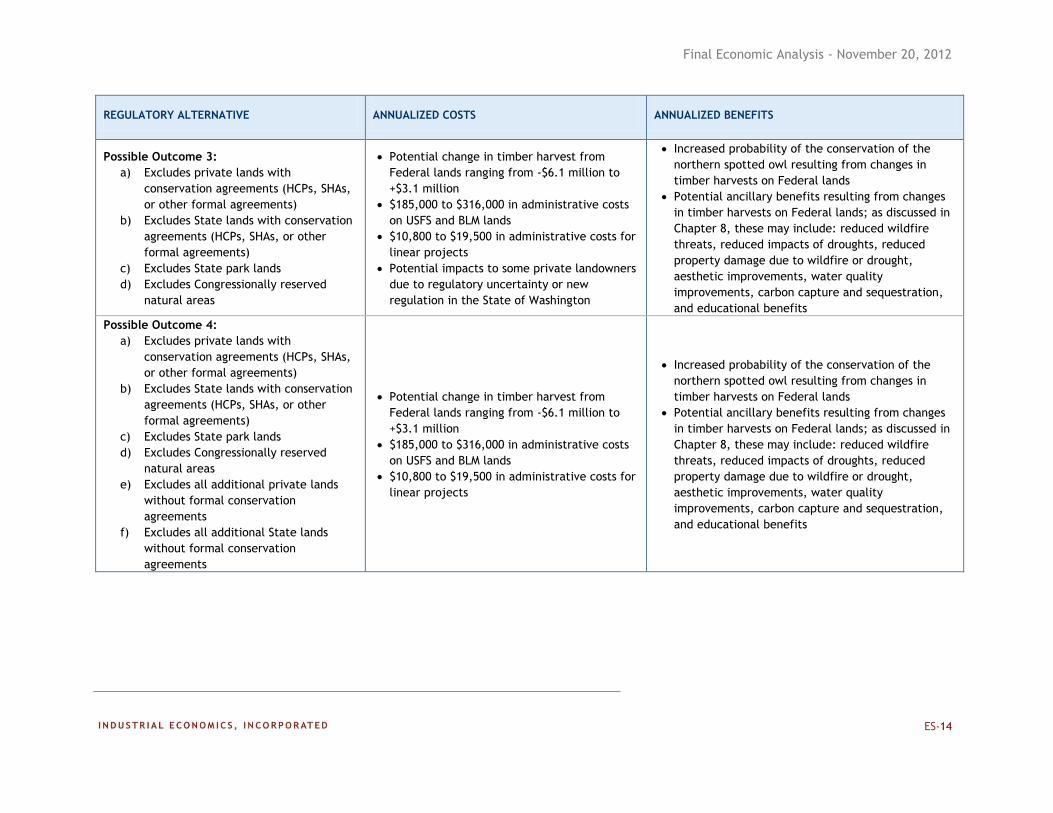
29. In the proposed rule, the Service has identified areas for possible exclusion from the final
designation of critical habitat. Exhibit ES-5 summarizes the four regulatory alternatives
and how the measures of potential incremental impacts vary across each of these possible
outcomes. The exhibit discusses the annualized costs and benefits of the proposed
regulatory alternatives.
EXHIBIT ES-2 . DIFFERENCES IN ANALYTICAL APPROACH BETWEEN THE 2008 AND CURRENT (2012)
ECONOMIC ANALYSES
The 2012 Economic Analysis distinguishes the incremental costs of designation from baseline costs, and
quantifies specific potential effects to timber harvest practices and volume along with administrative
costs. As discussed in detail in this report, the annualized incremental impacts under the negative impact
scenario range from a loss of approximately $2.65 to $6.48 million, while the positive impact scenario
ranges from a gain of approximately $900,000 to $2.9 million. The analysis also contemplates an
“administrative cost only” scenario, with annualized losses of $196,000 to $335,000.
o In contrast, in its evaluation of the incremental costs of the designation, the 2008 Economic Analysis did
not identify any incremental effects beyond administrative costs related to the consultation process.
On an annualized basis, these losses totaled $132,000 to $202,000 (similar to the range of
administrative costs estimated in this 2012 analysis).
This 2012 Economic Analysis characterizes all potential future NSO conservation as either baseline (i.e.,
expected to occur absent the designation of critical habitat) or incremental (i.e., expected to occur as a
result of critical habitat designation). The Service provided guidance on distinguishing the incremental costs
of the designation, as described in Appendix B of this report. The analysis only quantifies incremental
impacts because these are the costs, or benefits, that would be avoided if the Secretary of the DOI chooses
to exclude certain areas from the final designation. Where we include quantitative or qualitative
information about the historical impacts of northern spotted owl conservation, this information is intended
only to provide context for potential future incremental impacts.
o The 2008 Economic Analysis provided a comprehensive quantitative assessment of baseline impacts
related to NSO conservation and recovery, inclusive of all effects resulting from the species’ listing in
1990. For the pre-designation period (1990 – 2007), the annualized estimate of these baseline impacts
totaled $563 to $600 million. For the post-designation period, annualized baseline impacts (i.e., those
impacts expected to occur regardless of whether critical habitat is designated) were estimated to be
approximately $602 million.
This analysis considers and estimates the impacts of the rule as currently proposed and as if the existing 2008 critical habitat designation does not exist. Those areas already designated as critical habitat under the 2008 designation are subject to re-examination by the Secretary. Thus, future costs that may result from their designation should be considered. As a result, costs incurred as a result of the 2008 designation are not separately documented in this analysis.
Final Economic Analysis - November 20, 2012
ES-11
EXHIBIT ES-3. PROPOSED ACRES WHERE INCREMENTAL CHANGES IN TIMBER HARVESTS ARE POSSIBLE
Note: Totals may not sum due to rounding.
Final Economic Analysis - November 20, 2012
ES-12
EXHIBIT ES-4. SUMMARY OF ANNUALIZED POTENTIAL INCREMENTAL IMPACTS OF CR ITICAL HABITAT DESIG NATION FOR THE NSO ($2011)
LAND OWNER ANNUALIZED POTENTIAL
INCREMENTAL IMPACTS
ADMINISTRATIVE COSTS ONLY
SCENARIO POSITIVE IMPACT SCENARIOa NEGATIVE IMPACT SCENARIO
LOW HIGH LOW HIGH LOW HIGH
Federal
Potential Change in
Timber Harvest Volume
(MMBF)
0 +12.28 -24.56
Potential Change in the
Value of Timber Harvest $0 $0 +$1,230,000 +$3,070,000 -$2,460,000 -$6,140,000
Administrative Costs -$185,000 -$316,000 -$185,000 -$316,000 -$185,000 -$316,000
State Potential Change in the
Value of Timber Harvest 0 0 0
Private Potential Change in the
Value of Timber Harvest
Possible negative
impacts
associated with
regulatory
uncertainty
Possible negative
impacts
associated with
regulatory
uncertainty and
new regulation in
the State of
Washington
Possible negative
impacts
associated with
regulatory
uncertainty
Possible negative
impacts
associated with
regulatory
uncertainty and
new regulation in
the State of
Washington
Possible negative
impacts
associated with
regulatory
uncertainty
Possible negative
impacts
associated with
regulatory
uncertainty and
new regulation in
the State of
Washington
Linear Projects Administrative Costs -$10,800 -$19,500 -$10,800 -$19,500 -$10,800 -$19,500
TOTAL -$196,000 -$335,000 +$893,000 +$2,870,000 -$2,650,000 -$6,480,000
Notes:
a Under the Positive Impact Scenario, to illustrate a full range of potential outcomes, the low impact “total” is the low impact change to timber harvest net the
high impact administrative costs for Federal timber management and linear projects, representing a worst case scenario; conversely, the high impact “total” is
the high impact change to timber harvest net the low impact administrative costs, representing a best case scenario.
All dollar estimates are rounded to three significant digits and may not sum due to rounding.
Final Economic Analysis - November 20, 2012
ES-13
EXHIBIT ES-5 . PROPOSED CRITICAL HABITAT FOR THE NORTHERN SPOTTED OWL:
MONETIZED AND NON-QUANTIFIED COSTS AND BENEFITS OF THE PROPOSED REGULATORY ALTERNATIVES
REGULATORY ALTERNATIVE ANNUALIZED COSTS ANNUALIZED BENEFITS
Possible Outcome 1:
No exclusions
Potential change in timber harvest from
Federal lands ranging from -$6.1 million to
+$3.1 million
$185,000 to $316,000 in administrative costs
on USFS and BLM lands
$10,800 to $19,500 in administrative costs for
linear projects
Minor administrative burden associated with
re-initiating consultation on HCPs and SHAs
Potential impacts to some private landowners
due to regulatory uncertainty or new
regulation in the State of Washington
Increased probability of the conservation of the
northern spotted owl resulting from changes in
timber harvests on Federal lands
Potential ancillary benefits resulting from changes
in timber harvests on Federal lands; as discussed in
Chapter 8, these may include: reduced wildfire
threats, reduced impacts of droughts, reduced
property damage due to wildfire or drought,
aesthetic improvements, water quality
improvements, carbon capture and sequestration,
and educational benefits
Possible Outcome 2:
a) Excludes private lands with
conservation agreements (HCPs, SHAs,
or other formal agreements)
b) Excludes State lands with conservation
agreements (HCPs, SHAs, or other
formal agreements)
Potential change in timber harvest from
Federal lands ranging from -$6.1 million to
+$3.1 million
$185,000 to $316,000 in administrative costs
on USFS and BLM lands
$10,800 to $19,500 in administrative costs for
linear projects
Potential impacts to some private landowners
due to regulatory uncertainty or new
regulation in the State of Washington
Increased probability of the conservation of the
northern spotted owl resulting from changes in
timber harvests on Federal lands
Potential ancillary benefits resulting from changes
in timber harvests on Federal lands; as discussed in
Chapter 8, these may include: reduced wildfire
threats, reduced impacts of droughts, reduced
property damage due to wildfire or drought,
aesthetic improvements, water quality
improvements, carbon capture and sequestration,
and educational benefits
Final Economic Analysis - November 20, 2012
ES-14
REGULATORY ALTERNATIVE ANNUALIZED COSTS ANNUALIZED BENEFITS
Possible Outcome 3:
a) Excludes private lands with
conservation agreements (HCPs, SHAs,
or other formal agreements)
b) Excludes State lands with conservation
agreements (HCPs, SHAs, or other
formal agreements)
c) Excludes State park lands
d) Excludes Congressionally reserved
natural areas
Potential change in timber harvest from
Federal lands ranging from -$6.1 million to
+$3.1 million
$185,000 to $316,000 in administrative costs
on USFS and BLM lands
$10,800 to $19,500 in administrative costs for
linear projects
Potential impacts to some private landowners
due to regulatory uncertainty or new
regulation in the State of Washington
Increased probability of the conservation of the
northern spotted owl resulting from changes in
timber harvests on Federal lands
Potential ancillary benefits resulting from changes
in timber harvests on Federal lands; as discussed in
Chapter 8, these may include: reduced wildfire
threats, reduced impacts of droughts, reduced
property damage due to wildfire or drought,
aesthetic improvements, water quality
improvements, carbon capture and sequestration,
and educational benefits
Possible Outcome 4:
a) Excludes private lands with
conservation agreements (HCPs, SHAs,
or other formal agreements)
b) Excludes State lands with conservation
agreements (HCPs, SHAs, or other
formal agreements)
c) Excludes State park lands
d) Excludes Congressionally reserved
natural areas
e) Excludes all additional private lands
without formal conservation
agreements
f) Excludes all additional State lands
without formal conservation
agreements
Potential change in timber harvest from
Federal lands ranging from -$6.1 million to
+$3.1 million
$185,000 to $316,000 in administrative costs
on USFS and BLM lands
$10,800 to $19,500 in administrative costs for
linear projects
Increased probability of the conservation of the
northern spotted owl resulting from changes in
timber harvests on Federal lands
Potential ancillary benefits resulting from changes
in timber harvests on Federal lands; as discussed in
Chapter 8, these may include: reduced wildfire
threats, reduced impacts of droughts, reduced
property damage due to wildfire or drought,
aesthetic improvements, water quality
improvements, carbon capture and sequestration,
and educational benefits
Final Economic Analysis - November 20, 2012
ES-15
Timber Harvest Impacts - Federa l Lands
30. The majority of direct economic impacts on Federal lands are expected to result from
changes in timber harvest. Therefore, the analysis focuses on identifying where potential
changes to timber harvest may occur, and then estimating which critical habitat subunits
may experience the highest relative degree of impacts. As noted, we find that
approximately 1,389,787 acres on Federal lands are the primary areas where potential
impacts to timber harvest may occur. Specifically, these areas include matrix lands with
predominantly younger forest stands and matrix lands with NSO habitat that are likely to
be unoccupied.18
31. To conduct this assessment, we employed a two-pronged approach:
Acreage-Based Approach. We use acres of Federal lands with potential impacts
to rank subunits by the relative magnitude of potential changes to timber harvest.
Each subunit is assigned a score on a scale of 0 to 100, with 100 being the highest
level of potential impacts, based on total acres of Federal lands with potential
impacts to timber harvest (i.e., matrix lands unoccupied by the NSO). Then, we
rank each subunit on a relative basis. We also identify subunits that have
proportionally greater areas of younger forests that are considered essential to
NSO conservation.
Harvest Volume Approach. First, for areas within each subunit that may
experience incremental changes to timber harvest (as identified above), we
estimate future timber harvest volumes absent critical habitat. Second, we scale
these projected volumes under various potential scenarios, and derive an estimate
of resulting changes in projected timber harvest volumes. Finally, these changes
in harvest volumes are monetized based upon representative stumpage values.
32. We note that critical habitat’s regulatory impact is limited to the ESA section 7
requirement that Federal agencies avoid “destruction or adverse modification” of critical
habitat after consultation with the Service. As noted, consultations with Federal land
managers, the Service, and other experts indicate varying opinions regarding potential
critical habitat effects, and noted the difficulty and limitations of deriving precise
measures of positive or negative incremental change. For example, Federal land
managers have expressed concern about critical habitat representing a potential constraint
on their timber management preferences across the designation. Service representatives
suggest that there is potential for an increase in harvest levels compared to recent Federal
matrix timber harvest in some areas (although at levels below what was originally
envisioned for these lands under the NWFP in 1994). Finally, the relevant parties also
contemplate that no material changes may result from critical habitat concerns relative to
the baseline, given the long and established history of existing management plans and
conservation efforts related to the NSO.
18 With respect to the term “unoccupied”, we are explicitly referring to those areas not currently occupied by territorial or
nesting owls.
Final Economic Analysis - November 20, 2012
ES-16
33. To capture a range of potential outcomes, this analysis presents three scenarios. The first
scenario contemplates that minimal or no changes to current timber management
practices will occur; thus, the incremental costs of the designation will be predominantly
administrative. The majority of NSO consultations under section 7 of the Act occur
between the Service and BLM and/or USFS. On Federal lands managed by these
agencies, the vast majority of consultations on proposed projects affecting the NSO
concern timber sales or timber management projects. The potential additional
administrative costs due to critical habitat designation on Federal lands range from
$185,000 to $316,000 on an annualized basis.
34. The second scenario posits that action agencies may choose to implement management
practices yielding an increase in timber harvest relative to the baseline. Under this
scenario, we consider the potential effect related to the implementation of ecological
forestry prescriptions consistent with the Revised Recovery Plan and the Standards and
Guidelines of the NFWP. Such an outcome would not likely result in harvest levels
lower than the first scenario, and it may result in a net increase in harvest in some areas.
To illustrate the magnitude of this potential effect, we scale baseline harvest projections
up by 10 percent.
35. The third scenario considers that action agencies may choose to adopt a more restrictive
harvest posture in response to critical habitat designation, leading to a decline in harvest
volumes relative to the baseline. That is, they will conclude that some of their timber
harvest activities would be incompatible with the goals of critical habitat, and they will
decide to reduce or not plan timber harvest in some portion of the incremental matrix
forests that are within proposed critical habitat. If BLM or USFS does reduce planned
harvest due to critical habitat, it will likely be in those portions of the matrix that they
believe have greater value to NSO recovery and should not be subject to timber
management. To illustrate the potential magnitude of this potential effect, we scale
baseline harvest projections down by 20 percent.
36. Furthermore, Chapter 4 provides sensitivity analyses based on several comments
submitted during the public comment period providing information to inform certain
alternative assumptions concerning the baseline timber harvest projection. The economic
analysis uses a baseline harvest projection of approximately 122.80 MMBF per year. In
the sensitivity analyses contemplated, the baseline timber harvest projection increases by
up to an additional 27.99 MMBF per year. Therefore, the range of incremental impacts to
Federal timber harvest widens from a potential increase in stumpage value of $3.58
million (under Scenario 2) to a potential decrease of $7.86 million (under Scenario 3) per
year. This represents an annualized increase of $0.7 million (under Scenario 2) and an
annualized decrease of $1.4 million (under Scenario 3) relative to the economic analysis
presented above.
37. As discussed in further detail in Chapter 4, the results should be interpreted with care.
These outcomes, variations on them, or combinations of them, are dependent on future
policy decisions by the Federal agencies and other uncertain factors, including the
approaches undertaken by the land management agencies and the cooperative section 7
processes between the Forest Service or BLM and the Service. There is considerable
Final Economic Analysis - November 20, 2012
ES-17
uncertainty regarding the timber management prescriptions that land managers may
implement as a result of the proposed revised critical habitat designation. Any actual
impacts would depend on the nature and location of the proposed project and future
management decisions by the land managing agencies consistent with their land use plans
and the legal authorities under which they operate. Therefore, our assessment of the
economic effects is limited by this uncertainty.
Timber Harvest Impacts - Private Lands
38. The Service is considering designating critical habitat on 1,269,890 acres of private land
in Washington and California. No private land in Oregon is proposed for designation.19
Of these acres, activities on 873,621 (69 percent) are subject to existing or proposed
habitat conservation plans (HCPs) or Safe Harbor Agreements (SHAs). Thus,
incremental changes in timber management practices on these acres are unlikely. Some
minor administrative costs may be incurred to re-initiate section 7 consultation with the
Service to consider the potential for the plans or agreements to adversely modify critical
habitat. In addition, 89,400 acres (7 percent) are subject to existing conservation
agreements; no incremental impacts are anticipated.
39. A Federal nexus compelling consultation with the Service under section 7 of the Act is
unlikely for activities on the remaining 306,869 private acres (24 percent); thus,
regulation of these private acres via section 7 of the Act is unlikely. However, indirect
incremental impacts may result from the informational nature of the designation and
associated regulatory uncertainty. Specifically, by highlighting areas on a map (e.g., the
proposed critical habitat designation) that may require additional protection, State and
local regulators and private landowners are provided with additional information as they
make decisions regarding future uses of these areas. Based on our assessment, areas
where this additional information could result in land use changes include 117,628 acres
in Washington and 189,241 acres in California.
40. For purposes of this analysis, we assume that faced with regulatory uncertainty, private
landowners in both States may harvest their timber sooner than they otherwise would (if
the stands presently provide suitable habitat for the species) or shorten their harvest
rotations to prevent the stands from becoming suitable habitat. Such changes may
negatively affect the net present value of these acres. In addition, under our high-end
impact scenario, we assume the Washington Forest Practices Board redefines “critical
habitat state” to include suitable owl habitat within existing Spotted Owl Special
Emphasis Areas (SOSEAs) overlapping Federally-designated critical habitat, diminishing
the likelihood that these stands will be harvested.
41. We lack information regarding the probability that individual landowners will change
their harvest practices, and potential regulatory changes in Washington are speculative.
19 A public comment submitted by Green Crow, a private timberland owner in Oregon, showed that two tracts in Oregon,
thought to be owned by the State and included in the proposed designation, had been purchased by the company in 2010
(see public comment submitted by Green Crow on July 2, 2012). These private acres are not included in the final
designation.
Final Economic Analysis - November 20, 2012
ES-18
Because the necessary data are not readily available, quantification of potential reductions
in timber harvests from private lands and/or incremental reductions in land values is not
possible at this time. Therefore, we undertake an analysis of the potential relative
magnitude of impacts across the proposed private acres. This provides decision-makers
with information about the specific geographic areas within proposed subunits most
susceptible to incremental impacts.
42. Private lands in Washington potentially affected if the Forest Practices Board redefines
“critical habitat state” are found in the following subunits: ECN 3, ECN 4, ECN 5, ECN
6, WCC 1, WCC 3, and NCO1. Even if such a regulatory change does not occur,
landowners in these subunits could alter harvest practices as a result of regulatory
uncertainty. Additional subunits with potentially affected acres are located in California
and include ICC 6, RDC 1, RDC 2, RDC 4, and RDC 5. In these areas, impacts could
occur as a result of regulatory uncertainty.
Timber Harvest Impacts - State Lands
43. Of the 671,036 acres of State lands proposed for designation as critical habitat, 225,013
(34 percent) are already protected by an approved HCP; 164,776 acres (25 percent) are
State park lands where timber harvests are not anticipated; and 1,752 acres (less than one
percent) are lands managed by the Washington DFW which is preparing an HCP. The
remaining 279,495 acres (42 percent) are State forests managed by the Oregon
Department of Forestry and CAL FIRE, which have stated that existing regulations
provide protection for the NSO.20
These agencies do not intend to alter timber
management practices in response to the designation of critical habitat. Thus, we
conclude that timber harvests on State lands are unlikely to be affected by the designation
of critical habitat for the NSO.
Distr ibutional Timber Harvest Impacts to the Reg ional Economy and
Employment
44. Timber activity is a source of employment and governmental revenue within the area of
proposed critical habitat designation. The illustrated changes in timber harvest volume
summarized above may also manifest in distributional effects to the regional economy.
We consider the potential employment effects using established relationships between
harvest volume and jobs, as identified in available literature.
45. In general, estimates of the number of jobs associated with each MMBF of harvest vary
depending on the type of harvest and degree of primary and secondary manufacturing
considered.21
A recent report published by the Pacific Northwest Research Station of the
USFS states that in Oregon there were 9.4 direct jobs per MMBF of timber harvested in
20 Totals may not sum due to rounding.
21 In addition to direct timber-related employment (e.g., loggers, mills), many indirect jobs result from timber harvesting.
There are very few recent estimates of indirect jobs created per MMBF of harvest, and estimates vary widely based on the
definitions of “direct” versus “indirect” jobs. For example, as discussed in Chapter 6, per MMBF measures inclusive of
indirect jobs range as high as 17. Above we cite the number of direct jobs associated with changes in harvest levels.
Final Economic Analysis - November 20, 2012
ES-19
2010, and 9.9 direct jobs per MMBF in Washington, for a weighted average of 9.61.22
Other studies focusing on specific geographic regions or earlier time periods estimate a
broader range of jobs multipliers, suggesting any change in the number of direct jobs
resulting from variation in timber harvest volumes in a specific geographic location could
be smaller or larger depending on the specific characteristics of the industry in that
affected region.23
Thus, increases or decreases in timber harvests from Federal or private
lands could result in positive or negative changes in jobs, respectively.
46. Note that the “jobs per unit of timber volume” relationships identified here are static in
nature, and would not necessarily be representative of the marginal change in
employment associated with the incremental change in timber harvest potentially
resulting from critical habitat designation. Furthermore, many additional factors
contribute to changes in timber industry employment, which are discussed in greater
detail in chapter 6 of this report. Thus, this analysis does not explicitly derive an
employment effect related to the proposed rule. Finally, it is important to recognize that
the scope of the analysis is limited to the incremental effects of critical habitat related to
and within the geographic area of the proposed designation for the NSO. The analysis
does not consider potential changes in timber activities on lands outside the proposed
critical habitat designation. As such, this analysis cannot evaluate the potential effects
related to the timber industry as a whole.
Road Construction and L inear Projects
47. Activity related to road and bridge construction and maintenance, and installation and
maintenance of power transmission lines and other utility pipelines can affect NSO
habitat. As described in detail in Chapter 7, based on certain factors concerning existing
baseline protections, the nature and scale of these projects, and their number and density,
this analysis does not anticipate incremental impacts to linear project activities beyond
administrative costs due to the designation of critical habitat. These estimated
administrative costs, on an annualized basis, range from $10,800 to $19,500, assuming a
seven percent discount rate.
22 Warren, Debra. 2011. Production, Prices, Employment, and Trade in Northwest Forest Industries, All Quarters 2010. USDA.
http://www.fs.fed.us/pnw/pubs/pnw_rb260.pdf. Note that on page 1 of the report, the USFS states these averages are
based on 2007 data; however, we believe this to be a typographical error.
23 The study by Warren (2011) calculates the reported jobs multipliers for 2010 based on data on total timber harvested and
total timber-related jobs in that year. Applying the same methodology and using the historical data provided by USFS in its
report, the jobs multiplier has been as high as 12.8 for Washington (2009) and 15.6 for Oregon (2001). A study of the region
by Lippke and Mason (2005) provides estimates for the direct and total employment for forest products activity based on a
model developed by Richard Conway in 1996. The report estimates 12.34 jobs in the logging, sawn wood, primary wood,
secondary wood, and primary paper industries per MMBF harvested. (Lippke, B.R. and L.C. Mason. Implications of Working
Forest Impacts on Jobs and Local Economies. October 24, 2005. Accessed at
https://digital.lib.washington.edu/researchworks/bitstream/handle/1773/2235/tp4.pdf?sequence=1 on April 6, 2012). In
contrast to these multi-State studies, the Oregon Forest Research Institute estimates 17.4 jobs per MMBF in Oregon based
on data provided by the Oregon Department of Employment and the Oregon Department of Forestry (Email communication
with Michael Haske, U.S. Bureau of Land Management, May 24, 2012.). Adding jobs created through induced effects (e.g.,
non-timber-related industries supporting workers in the timber industry) would further increase these multipliers.
Final Economic Analysis - November 20, 2012
ES-20
Benef its
48. With regard to the benefits of the designation, in its guidance for implementing Executive
Order12866, OMB acknowledges that it may not be feasible to monetize, or even
quantify, the benefits of environmental regulations due to either an absence of defensible,
relevant studies or a lack of resources on the implementing agency’s part to conduct new
research.24
The Service believes that the direct benefits of critical habitat are best
expressed in biological terms that can be weighed against the expected cost impacts of the
rulemaking. Thus, we include a qualitative discussion of the potential benefits of this
proposed rule in this report and summarize available literature describing the potential
benefits of NSO conservation.
24 U.S. Office of Management and Budget, “Circular A-4,” September 17, 2003, available at
http://www.whitehouse.gov/omb/circulars/a004/a-4.pdf.
Final Economic Analysis - November 20, 2012
1-1
CHAPTER 1 | INTRODUCTION
49. The purpose of this report is to identify and analyze the potential economic impacts of the
designation of critical habitat for the northern spotted owl (Strix occidentalis caurina)
(hereafter, “NSO” or “species”) in the United States.
50. Section 4(b)(2) of the Endangered Species Act (the Act) directs the Secretary of the
Interior to designate critical habitat
“…on the basis of the best scientific data available and after taking into
consideration the economic impact, and any other relevant impact, of
specifying any particular area as critical habitat. The Secretary may
exclude any area from critical habitat if he determines that the benefits of
such exclusion outweigh the benefits of specifying such area as part of
the critical habitat, unless he determines, based on the best scientific and
commercial data available, that the failure to designate such area as
critical habitat will result in the extinction of the species concerned.”25
The information presented in this report is intended to assist the Secretary in determining
whether the benefits of excluding particular areas from the designation outweigh the
benefits of including those areas in the designation. In addition, this information allows
the Service to address the requirements of Executive Orders 12866, “Regulatory Review
and Planning,” and 13563, “Improving Regulation and Regulatory Review;” the
Regulatory Flexibility Act (RFA), as amended by the Small Business Regulatory
Enforcement Fairness Act (SBREFA, 5 U.S.C. 601-612); the Unfunded Mandates
Reform Act (UMRA; P.L.104-4); Executive Order 13132, “Federalism;” and Executive
Order 13211, “Actions Concerning Regulations that Significantly Affect Energy Supply,
Distribution, or Use.”
51. This chapter provides an overview of the proposed critical habitat for the NSO. It
includes a summary of past Federal actions that relate to the current proposal, a
description of the area proposed for designation, and a discussion of the economic
activities potentially affecting the species. We conclude with a summary of the
organization of the remainder of this report.
52. The information contained in this chapter provides context for the analysis. All official
definitions and proposed critical habitat boundaries are provided in the Proposed Rule.26
25 16 U.S.C. §1533(b)(2).
26 2012 Proposed Critical Habitat Rule, 77 FR 14062.
Final Economic Analysis - November 20, 2012
1-2
1.1 PREVIOUS FEDERAL ACTIONS
53. Below, we summarize key milestones in the Federal regulatory history for the NSO.
Listing: The U.S. Fish and Wildlife Service (Service) published a rule listing the
NSO as threatened on June 26, 1990.27
Original critical habitat designation: The Service published a final rule
designating 6,887,000 acres of critical habitat for the NSO on January 15, 1992.28
2004 five-year review: The Service completed a five-year status review of the
NSO on November 15, 2004 as part of a settlement agreement with the timber
industry. At that time, the Service concluded that the NSO should remain listed
as a threatened species under the Endangered Species Act (Act). An amended
settlement agreement called for the Service to revise critical habitat.
Revised critical habitat: In 2008, the Service finalized a revised designation of
5,337,839 acres as critical habitat, which was based on the Service’s 2007 Draft
Recovery Plan and 2008 Recovery Plan for the Northern Spotted Owl. published
that same year.29
Both the 2008 critical habitat designation and the 2008
recovery plan were challenged in court.30
In addition, on December 15, 2008, the
Inspector General of the Department of the Interior issued a report entitled
‘‘Investigative Report of the Endangered Species Act and the Conflict between
Science and Policy,’’ which concluded that the integrity of the agency decision
making process for the NSO recovery plan was potentially jeopardized by
improper political influence.
2008 critical habitat remanded: On October 12, 2010, the Court remanded the
2008 critical habitat designation, which had been based on the 2008 Recovery
Plan, and adopted the Service’s proposed schedule to submit a new proposed
revised critical habitat rule for public comment to the Federal Register by
November 15, 2011, and a final revised rule by November 15, 2012. The Court
later extended the deadline for the proposed rule to February 28, 2012; the
deadline for the final rule remains unchanged.
Current proposed rule revising critical habitat: In response to the Court’s
order, the Service published the current proposed rule revising the critical habitat
designation on March 8, 2012.31
This economic analysis will inform the final
critical habitat designation for the species.32
27 1990 Final Listing Rule, 55 FR 26114.
28 1992 Final Critical Habitat Rule, 57 FR 1796.
29 2008 Final Critical Habitat Rule, 73 FR 47325.
30 Carpenters’ Industrial Council v. Salazar, Case No. 1:08–cv–01409–EGS (D.DC)
31 2012 Proposed critical Habitat Rule, 77 FR 14104.
32 On May 8, 2012, the Service made available for public comment a draft of this report (the “draft economic analysis” or
“DEA”) (2012 Proposed Rule; Extension of Public Comment Period; Announcement of Public Meetings and Public Hearing, 77
Final Economic Analysis - November 20, 2012
1-3
1.2 PROPOSED CRITICAL HABITAT DESIGNATION
54. The proposed critical habitat designation includes 11 units and 63 subunits in California,
Oregon, and Washington. Together, the units total approximately 13,961,684 acres.33
Approximately 3,988,776 acres of the proposed critical habitat are located in California,
5,116,835 acres in Oregon, and 4,856,074 acres in Washington.
55. Approximately 12,021,123 acres (86.1 percent) of the proposed critical habitat are
Federally-managed by the United States Forest Service (USFS), Bureau of Land
Management (BLM), National Park Service (NPS) and Department of Defense (DOD).
Approximately 670,671 (4.8 percent) acres of proposed critical habitat are managed by
State agencies and 1,269,890 acres (9.1 percent) are privately owned. Exhibit 1-1
provides a breakdown of the lands proposed as critical habitat by ownership, and Exhibits
1-2 through 1-4 depict the proposed designation in Washington, Oregon, and California.
Socioeconomic conditions within the region proposed for critical habitat designation are
discussed in Chapter 3.
EXHIBIT 1-1. LAND OWNERSHIP WITHI N NORTHERN SPOTTED OWL PROPOSED CRITICAL HABITAT
TYPE
LAND AREA
(ACRES)1, 2
PERCENT TOTAL AREA
(ACRES)2
US Forest Service 9,524,623 68.2%
Bureau of Land Management 1,483,607 10.6%
National Park Service 998,580 7.2%
Other Federal (DOD) 14,313 0.1%
State 670,671 4.8%
Private 1,269,890 9.1%
TOTAL 13,961,684 100%
Notes:
1. Acreage numbers throughout this report may differ slightly from those provided in the Proposed Rule due to minor boundary adjustments included within the GIS data used to inform the Economic Analysis.
2. Totals may not sum due to rounding.
FR 27010.) This final economic analysis (FEA) updates the DEA, incorporating new information received during the public
comment period. As it is intended to provide information to the Secretary about the potential benefits of including versus
excluding areas from the final designation, it continues to analyze all areas considered for designation.
33 GIS data provided by the Service, March 8, 2012. Acreage numbers throughout this report may differ slightly from those
provided in the Proposed Rule due to minor boundary adjustments included within the GIS data used to inform the
Economic Analysis.
Final Economic Analysis – November 20, 2012
1-4
EXHIBIT 1-2. OVERVIEW OF NORTHERN SPOTTED OWL PROPOSED CRITICAL HABITAT IN WASHINGTON
Final Economic Analysis – November 20, 2012
1-5
EXHIBIT 1-3. OVERVIEW OF NORTHERN SPOTTED OWL PROPOSED CRITICAL HABITAT IN OREGON
Final Economic Analysis – November 20, 2012
1-6
EXHIBIT 1-4. OVERVIEW OF NORTHERN SPOTTED OWL PROPOSED CRITICAL HABITAT IN CALIFORNIA
Final Economic Analysis – November 20, 2012
1-7
1.3 ECONOMIC ACTIVITIES CONSIDERED IN THIS ANALYSIS
56. The following economic activities potentially affect the NSO and its habitat within the
boundaries of proposed critical habitat. These activities were identified through review
of the proposed rule, consultation history, and existing conservation plans.
Timber Management: Timber harvest has contributed to NSO habitat loss,
degradation, and fragmentation and was the main basis for the original listing of
the NSO in 1990.34
Timber management activities represent the primary land use
within proposed critical habitat. Thus, timber management is the central focus of
our analysis, discussed in detail in Chapters 3 through 5.
Wildfire Management: NSO habitat is particularly vulnerable to wildfire in
drier forest systems, which have experienced recent wildfire losses that have
exceeded the range of historical variability.35
Some habitat losses resulting from
increased wildfire frequency, intensity, and size can be attributed to excessive
fuel buildup resulting from many decades of fire suppression. Fire management
activities that benefit the NSO may include modified fuel reduction and fire
suppression practices. These activities are discussed along with timber
management activities in Chapters 3.
Road Construction and other Linear Projects: Construction and maintenance
of linear projects such as roads, natural gas pipelines, and electric power
transmission lines can negatively impact the NSO and its critical habitat through
direct habitat loss related to removal of hazard trees and noise disturbance related
to blasting actions.36
These activities are discussed in Chapter 6.
Other Forest and Species Management: The presence of the barred owl in
NSO habitat is considered one of the most significant threats currently facing the
NSO.37
In areas where these species co-exist, the NSO faces competition for
habitat, nest sites and prey; the two species may hybridize; and the barred owl
may occasionally prey on the NSO. Management programs to control the barred
owl may possibly include direct removal of the species. Forest management
activities recommended to benefit the NSO may include minimization of
blowdowns and windthrow events through maintenance of large, contiguous
blocks of older forest. Opportunity costs associated with barred owl management
are not quantified in this report.38
34 1990 Final Listing Rule, 55 FR 26114; 2012 Proposed Critical Habitat Rule, 77 FR 14062.
35 Entrix, “Final Economic Analysis of Critical Habitat Designation for the Northern Spotted Owl,” prepared for the U.S. Fish
and Wildlife Service, July 15, 2008.
36 Ibid.
37 2012 Proposed Critical Habitat Rule, 77 FR 14062.
38 Certain other economic activities were noted in public comments regarding the draft Economic Analysis, including impacts
to the regional ski industry and livestock grazing on public and private lands. The Service notes in its response to these
comments that ski area development actions generally tend not to conflict with spotted owl and critical habitat conservation
needs, and thus they do not anticipate any significant regulatory burden associated with the designation of these lands as
critical habitat. In addition, the Service notes that the rule does not prescribe limitations on grazing. Based on these
Final Economic Analysis – November 20, 2012
1-8
1.4 ORGANIZATION OF THE REPORT
57. The remainder of this report proceeds through seven additional Chapters.
Chapter 2 provides a detailed discussion of the framework for the economic
analysis;
Chapter 3 discusses the socioeconomic context in the region and characterizes
the area’s timber industry;
Chapter 4 estimates impacts to timber production resulting from the designation
of Federal lands;
Chapter 5 estimates the impacts to timber production resulting from the
designation of State and private lands;
Chapter 6 synthesizes the results of Chapters 3 and 4 and considers the regional
effects of changes in timber harvests on local communities and employment;
Chapter 7 describes the potential incremental economic impacts to other
activities, such as the construction and maintenance of linear projects; and
Chapter 8 describes the potential benefits of the proposed critical habitat
designation.
58. In addition, the report includes four appendices:
Appendix A addresses additional statutory requirements, including consideration
of small entities under RFA/SBREFA, unfunded mandates under UMRA, the
potential for federalism concerns; and impacts on the supply, distribution, and
use of energy in the U.S.;
Appendix B provides the Service’s Incremental Effects memorandum to IEc
describing potential changes in conservation recommendations for these species
due to critical habitat designation;
Appendix C provides a detailed list of the entities contacted during our data
collection efforts; and
Appendix D provides monetized estimates assuming a discount rate of three
percent and the undiscounted stream of impacts.
representations and additional review, we have not added an explicit analysis of these activities in the final Economic
Analysis.
Final Economic Analysis - November 20, 2012
2-1
CHAPTER 2 | FRAMEWORK FOR THE ANALYSIS
59. The purpose of this report is to estimate the economic impact of critical habitat
designation to protect the Federally-listed northern spotted owl and its habitat. This
analysis examines the impacts of restricting or modifying specific land uses or activities
for the benefit of the species and its habitat within the areas considered for the proposed
revised critical habitat designation.39
This analysis employs "without critical habitat" and
"with critical habitat" scenarios. The "without critical habitat" scenario represents the
baseline for the analysis, considering protections afforded the NSO absent critical habitat
designation; for example, under the Federal listing and other Federal, State, and local
regulations. The "with critical habitat" scenario describes the incremental impacts
associated specifically with the designation of critical habitat for the species. The
incremental conservation efforts and associated impacts are those not expected to occur
absent the designation of critical habitat for the NSO. This document uses the term
“conservation efforts” to describe a variety of measures that may be suggested or required
by the Service to address impacts to critical habitat during informal or formal
consultations under section 7 of the Endangered Species Act (“ESA” or “Act”).
60. According to section 4(b)(2) of the ESA, the Service must consider the economic
impacts, impacts to national security, and other relevant impacts of designating any
particular area as critical habitat. An area may be excluded from designation as critical
habitat if the benefits of exclusion (i.e., the impacts that would be avoided if an area were
excluded from the designation) outweigh the benefits of designation so long as exclusion
of the area will not result in extinction of the species. Such an exclusion is made at the
discretion of the Secretary of the U.S. Department of the Interior (DOI). The purpose of
the economic analysis is to provide information to assist the Secretary in
determining whether the benefits of excluding particular areas from the designation
outweigh the benefits of including those areas in the designation.40
In addition, this
information allows the Service to address the requirements of Executive Orders 12866,
13563, 13132, and 13211; the Unfunded Mandates Reform Act (UMRA); and the
Regulatory Flexibility Act (RFA), as amended by the Small Business Regulatory
Enforcement Fairness Act (SBREFA).41
39 2012 Critical Habitat Rule, 77 FR 14062.
40 16 U.S.C. §1533(b)(2).
41 Executive Order 12866, Regulatory Planning and Review, September 30, 1993; Executive Order 13563, Improving Regulation
and Regulatory Review, January 18, 2011; Executive Order 13211, Actions Concerning Regulations That Significantly Affect
Energy Supply, Distribution, or Use, May 18, 2001; Executive Order 13132, Federalism, August 4, 1999; 2 U.S.C. 1531 et seq;
5 U.S.C. §§601 et seq; and Pub Law No. 104-121.
Final Economic Analysis - November 20, 2012
2-2
61. This Chapter describes the framework for this analysis. We first provide background on
the case law that led to the selection of the framework applied in this report. Next, the
Chapter describes in economic terms the general categories of economic effects that are
the focus of the impact analysis, including a discussion of both efficiency and
distributional effects. This Chapter then defines the analytic framework used to measure
these impacts in the context of critical habitat regulation and the consideration of benefits.
It concludes with a description of the information sources relied upon in the analysis and
notes on the presentation of the results.
2.1 BACKGROUND
62. This analysis examines the impacts of restricting or modifying specific land uses or
activities for the benefit of the species and its habitat within the proposed critical habitat
area. The U.S. Office of Management and Budget’s (OMB) guidelines for conducting
economic analysis of regulations direct Federal agencies to measure the costs of a
regulatory action against a baseline, which it defines as the "best assessment of the way
the world would look absent the proposed action."42
In other words, the baseline includes
the existing regulatory and socio-economic burden imposed on landowners, managers, or
other resource users potentially affected by the designation of critical habitat. Impacts
that are incremental to that baseline (i.e., occurring over and above existing constraints)
are attributable to the proposed regulation. Significant debate has occurred regarding
whether assessing the impacts of the Service’s proposed regulations using this baseline
approach is appropriate in the context of critical habitat designations.
63. In 2001, the U.S. Court of Appeals for the Tenth Circuit instructed the Service to conduct
a full analysis of all of the economic impacts of proposed critical habitat, regardless of
whether those impacts are attributable co-extensively to other causes.43
Specifically, the
court stated,
“The statutory language is plain in requiring some kind of consideration
of economic impact in the CHD [critical habitat designation] phase.
Although 50 C.F.R. 402.02 is not at issue here, the regulation’s definition
of the jeopardy standard as fully encompassing the adverse modification
standard renders any purported economic analysis done utilizing the
baseline approach virtually meaningless. We are compelled by the
canons of statutory interpretation to give some effect to the congressional
directive that economic impacts be considered at the time of critical
habitat designation…. Because economic analysis done using the FWS’s
[Fish and Wildlife Service’s] baseline model is rendered essentially
without meaning by 50 C.F.R. § 402.02, we conclude Congress intended
that the FWS conduct a full analysis of all of the economic impacts of a
critical habitat designation, regardless of whether those impacts are
42 OMB, “Circular A-4,” September 17, 2003, available at
www.whitehouse.gov/sites/default/files/omb/assets/omb/circulars/a004/a-4.pdf.
43 New Mexico Cattle Growers Assn v. United States Fish and Wildlife Service, 248 F.3d 1277 (10th Cir. 2001).
Final Economic Analysis - November 20, 2012
2-3
attributable co-extensively to other causes. Thus, we hold the baseline
approach to economic analysis is not in accord with the language or
intent of the ESA [Endangered Species Act].”44
64. Since that decision, however, courts in other cases have held that an incremental analysis
of impacts stemming solely from the critical habitat rulemaking is proper.45
For example,
in the March 2006 ruling that the August 2004 critical habitat rule for the Peirson's milk-
vetch was arbitrary and capricious, the United States District Court for the Northern
District of California stated,
“The Court is not persuaded by the reasoning of New Mexico Cattle
Growers, and instead agrees with the reasoning and holding of Cape
Hatteras Access Preservation Alliance v. U.S. Dep’t of the Interior, 344
F. Supp 2d 108 (D.D.C. 2004). That case also involved a challenge to
the Service’s baseline approach and the court held that the baseline
approach was both consistent with the language and purpose of the ESA
and that it was a reasonable method for assessing the actual costs of a
particular critical habitat designation Id at 130. ‘To find the true cost of a
designation, the world with the designation must be compared to the
world without it.’”46
65. More recently, in 2010, the U.S. Court of Appeals for the Ninth Circuit came to similar
conclusions during its reviews of critical habitat designations for the Mexican spotted owl
and 15 vernal pool species.47
In order to address the divergent opinions of the courts and
provide the most complete information to decision-makers, this economic analysis will
employ “without critical habitat” and “with critical habitat” scenarios:
The "without critical habitat" scenario represents the baseline for the analysis,
considering protections already accorded the NSO. The baseline for this analysis
is the state of regulation, absent designation of critical habitat, that provides
protection to the species under the Act, as well as under other Federal, State and
local laws and conservation plans. The baseline includes sections 7, 9, and 10 of
the Act to the extent that they are expected to apply absent the designation of
critical habitat for the species. The analysis will qualitatively describe how
baseline conservation for the NSO is currently implemented across the proposed
designation in order to provide context for the incremental analysis.
44 Ibid.
45 In explanation of their differing conclusion, later decisions note that in New Mexico Cattle Growers, the U.S. Tenth Circuit
Court of Appeals relied on a Service regulation that defined “destruction and adverse modification” in the context of
section 7 consultation as effectively identical to the standard for “jeopardy.” Courts had since found that this definition of
“adverse modification” was too narrow. For more details, see the discussion of Gifford Pinchot Task Force v. United States
Fish and Wildlife Service provided later in this section.
46 Center for Biological Diversity v. United States Bureau of Land Management, 422 F. Supp.2d 1115 (N.D. Cal. 2006).
47 Home Builders Association of Northern California v. United States Fish and Wildlife Service, 616 F.3d 983 (9th Cir. 2010),
cert. denied, 179 L. Ed 2d 301, 2011 U.S. Lexis 1392, 79 U.S.L.W. 3475 (2011); Arizona Cattle Growers v. Salazar, 606 F. 3d
1160 (9th Cir. 2010), cert. denied, 179 L. Ed. 2d 300, 2011 U.S. Lexis 1362, 79 U.S.L.W. 3475 (2011).
Final Economic Analysis - November 20, 2012
2-4
The "with critical habitat" scenario describes and monetizes the incremental
impacts due specifically to the designation of critical habitat for the species. The
incremental NSO conservation efforts and associated impacts are those not
expected to occur absent the designation of critical habitat. This report focuses
on the incremental analysis.
66. Incremental effects of critical habitat designation are determined using the Service's
December 9, 2004 interim guidance on “Application of the ‘Destruction or Adverse
Modification’ Standard Under Section 7(a)(2) of the Endangered Species Act” and
information from the Service regarding what potential consultations and project
modifications may be imposed as a result of critical habitat designation over and above
those associated with the listing.48
Specifically, in Gifford Pinchot Task Force v. United
States Fish and Wildlife Service, the U.S. Court of Appeals for the Ninth Circuit
invalidated the Service’s regulation defining destruction or adverse modification of
critical habitat, and the Service no longer relies on this regulatory definition when
analyzing whether an action is likely to destroy or adversely modify critical habitat.49
Under the statutory provisions of the Act, the Service determines destruction or adverse
modification on the basis of whether, with implementation of the proposed Federal
action, the affected critical habitat would remain functional to serve its intended
conservation role for the species.
67. A detailed description of the methodology used to define baseline and incremental
impacts is provided in Appendix B.
2.2 CATEGORIES OF POTENTIAL ECONOMIC EFFECTS OF SPECIES CONSERVATION
68. This economic analysis considers both the economic efficiency and distributional effects
that may result from efforts to protect the NSO and its habitat (hereinafter referred to
collectively as “NSO conservation efforts”). Economic efficiency effects generally
reflect “opportunity costs” associated with the commitment of resources required to
accomplish species and habitat conservation. For example, if the set of activities that
may take place on a parcel of land is limited as a result of the designation or the presence
of the species, and thus the market value of the land is reduced, this reduction in value
represents one measure of opportunity cost or change in economic efficiency. Similarly,
the costs incurred by a Federal action agency to consult with the Service under section 7
represent opportunity costs of NSO conservation efforts.
69. This analysis also addresses the distribution of impacts associated with the designation,
including an assessment of any local or regional impacts of habitat conservation and the
potential effects of conservation efforts on small entities and the energy industry. This
information may be used by decision-makers to assess whether the effects of species
conservation efforts unduly burden a particular group or economic sector. For example,
48 Director, U.S. Fish and Wildlife Service, Memorandum to Regional Directors and Manager of the California-Nevada
Operations Office, Subject: Application of the “Destruction or Adverse Modification” Standard under Section 7(a)(2) of the
Endangered Species Act, dated December 9, 2004.
49 Gifford Pinchot Task Force v. United States Fish and Wildlife Service, No. 03-35279 (9th Circuit 2004).
Final Economic Analysis - November 20, 2012
2-5
while conservation efforts may have a small impact relative to the national economy,
individuals employed in a particular sector of the regional economy may experience
relatively greater impacts. The differences between economic efficiency effects and
distributional effects, as well as their application in this analysis, are discussed in greater
detail below.
2.2.1. ECONOMIC EFFICIENCY EFFECTS
70. At the guidance of OMB and in compliance with Executive Order 12866 "Regulatory
Planning and Review," Federal agencies measure changes in economic efficiency in order
to understand how society, as a whole, will be affected by a regulatory action. In the
context of regulations that protect NSO habitat, these efficiency effects represent the
opportunity cost of resources used or benefits foregone by society as a result of the
regulations. Economists generally characterize opportunity costs in terms of changes in
producer and consumer surpluses in affected markets.50
71. In some instances, compliance costs may provide a reasonable approximation for the
efficiency effects associated with a regulatory action. For example, a Federal land
manager may enter into a consultation with the Service to ensure that a particular activity
will not adversely modify critical habitat. The effort required for the consultation is an
economic opportunity cost because the landowner or manager's time and effort would
have been spent in an alternative activity had the parcel not been included in the
designation. When compliance activity is not expected to significantly affect markets --
that is, not result in a shift in the quantity of a good or service provided at a given price,
or in the quantity of a good or service demanded given a change in price -- the
measurement of compliance costs can provide a reasonable estimate of the change in
economic efficiency.
72. Where habitat protection measures are expected to significantly impact a market, it may
be necessary to estimate changes in producer and consumer surpluses. For example,
protection measures that reduce or preclude the development of large areas of land may
shift the price and quantity of housing supplied in a region. In this case, changes in
economic efficiency (i.e., social welfare) can be measured by considering changes in
producer and consumer surplus in the market.
73. This analysis begins by measuring impacts associated with efforts undertaken to protect
the NSO and its habitat. As noted above, in some cases, compliance costs can provide a
reasonable estimate of changes in economic efficiency. However, if the cost of
conservation efforts is expected to significantly impact markets, the analysis will consider
potential changes in consumer and/or producer surplus in affected markets.
50 For additional information on the definition of "surplus" and an explanation of consumer and producer surplus in the
context of regulatory analysis, see: Gramlich, Edward M., A Guide to Benefit-Cost Analysis (2nd Ed.), Prospect Heights,
Illinois: Waveland Press, Inc., 1990; and U.S. Environmental Protection Agency, Guidelines for Preparing Economic Analyses,
EPA 240-R-00-003, September 2000, available at http://yosemite.epa.gov/ee/epa/eed.nsf/ webpages/Guidelines.html.
Final Economic Analysis - November 20, 2012
2-6
2.2.2. DISTRIBUTIONAL AND REGIONAL ECONOMIC EFFECTS
74. Measurements of changes in economic efficiency focus on the net impact of conservation
efforts, without consideration of how certain economic sectors or groups of people are
affected. Thus, a discussion of efficiency effects alone may miss important distributional
considerations. OMB encourages Federal agencies to consider distributional effects
separately from efficiency effects.51
This analysis considers several types of
distributional effects, including impacts on small entities; impacts on energy supply,
distribution, and use; and regional economic impacts. It is important to note that these
are fundamentally different measures of economic impact than efficiency effects, and
thus cannot be added to or compared with estimates of changes in economic efficiency.
Impacts on Smal l Ent i t ies and Energy Supply, D i st r ibut ion, and Use
75. This analysis considers how small entities, including small businesses, organizations, and
governments, as defined by the RFA, might be affected by future species conservation
efforts. We also consider the potential for impacts to State, local, and Tribal governments
and the private sector under the UMRA. In addition, in response to Executive Order
13132, “Federalism” we consider the potential federalism implications of the proposed
rule. Finally, in response to Executive Order 13211 "Actions Concerning Regulations
That Significantly Affect Energy Supply, Distribution, or Use," this analysis considers
the future impacts of conservation efforts on the energy industry and its customers.
Reg ional Economic Ef fects
76. Regional economic impact analysis can provide an assessment of the potential localized
effects of conservation efforts. Specifically, regional economic impact analysis produces
a quantitative estimate of the potential magnitude of the initial change in the regional
economy resulting from a regulatory action. Regional economic impacts are commonly
measured using regional input/output models. These models rely on multipliers that
represent the relationship between a change in one sector of the economy (e.g., output by
timber mills) and the effect of that change on economic output, income, or employment in
other local industries (e.g., suppliers of goods and services to mills). These economic
data provide a quantitative estimate of the magnitude of shifts of jobs and revenues in the
local economy.
77. The use of regional input/output models in an analysis of the impacts of species and
habitat conservation efforts can overstate the long-term impacts of a regulatory change.
Most importantly, these models provide a static view of the economy of a region. That is,
they measure the initial impact of a regulatory change on an economy but do not consider
long-term adjustments that the economy will make in response to this change. For
example, these models provide estimates of the number of jobs lost as a result of a
regulatory change, but do not consider re-employment of these individuals over time or
other adaptive responses by impacted businesses. In addition, the flow of goods and
services across the regional boundaries defined in the model may change as a result of the
regulation, compensating for a potential decrease in economic activity within the region.
51 U.S. Office of Management and Budget, “Circular A-4,” September 17, 2003, available at
http://www.whitehouse.gov/sites/default/files/omb/assets/omb/circulars/a004/a-4.pdf.
Final Economic Analysis - November 20, 2012
2-7
78. Despite these and other limitations, in certain circumstances regional economic impact
analysis may provide useful information about the scale and scope of localized impacts.
It is important to remember that measures of regional economic effects generally reflect
shifts in resource use rather than efficiency losses. Thus, these types of distributional
effects are reported separately from efficiency effects (i.e., not summed). In addition,
measures of regional economic impact cannot be compared with estimates of efficiency
effects, but should be considered as distinct measures of impact.
2.3 ANALYTIC FRAMEWORK A ND SCOPE OF THE ANALYSIS
79. This analysis: 1) identifies those economic activities most likely to affect the NSO and its
habitat; 2) describes the baseline regulation protection for the species; and 3) monetizes
the incremental economic impacts to avoid adverse modification of the proposed critical
habitat study area. This section provides a description of the methods used to separately
identify baseline protections from the incremental impacts stemming from the proposed
designation of critical habitat for the NSO. This evaluation of impacts in a "with critical
habitat designation" versus a "without critical habitat designation" framework effectively
measures the net change in economic activity associated with the proposed rulemaking.
2.3.1. BASELINE ECONOMIC IMPACTS
80. The baseline for this analysis is the existing state of regulation, prior to the designation of
critical habitat, which provides protection to the species under Act, as well as under other
Federal, State and local laws and guidelines. This "without critical habitat designation"
scenario also considers a wide range of additional factors beyond the compliance costs of
regulations that provide protection to the listed species. As recommended by OMB, the
baseline incorporates, as appropriate, trends in market conditions, implementation of
other regulations and policies by the Service and other government entities, and trends in
other factors that have the potential to affect economic costs and benefits, such as the rate
of regional economic growth in potentially affected industries.
81. Baseline protections include sections 7, 9, and 10 of the Act, and economic impacts
resulting from these protections to the extent that they are expected to occur absent the
designation of critical habitat for the species. This analysis describes these baseline
regulations qualitatively. The primary focus is not on baseline costs, since these will not
be affected by the proposed regulation. Instead, the focus of this analysis is on
monetizing the incremental impacts forecast to result from the proposed critical habitat
designation.
Section 7 of the Act, absent critical habitat designation, requires Federal agencies
to consult with the Service to ensure that any action authorized, funded, or carried
out by that agency will not likely jeopardize the continued existence of any
endangered or threatened species. Consultations under the jeopardy standard result
in administrative costs, as well as impacts of conservation efforts resulting from
consideration of this standard.
Section 9 defines the actions that are prohibited by the Act. In particular, it
prohibits the "take" of endangered wildlife, where "take" means to "harass, harm,
Final Economic Analysis - November 20, 2012
2-8
pursue, hunt, shoot, wound, kill, trap, capture, or collect, or to attempt to engage in
any such conduct."52
Subsequent regulation has made prohibitions against take of
endangered species under section 9 applicable to threatened species, such as the
NSO, as well.53
The economic impacts associated with this section manifest
themselves in sections 7 and 10.
Under section 10(a)(1)(B) of the Act, an entity (e.g., a landowner or local
government) may develop a HCP for a listed animal species in order to meet the
conditions for issuance of an incidental take permit in connection with a land or
water use activity or project.54
The requirements posed by the HCP may have
economic impacts associated with the goal of ensuring that the effects of incidental
take are adequately avoided or minimized. The development and implementation
of HCPs is considered a baseline protection for the species and habitat unless the
HCP is determined to be precipitated by the designation of critical habitat, or the
designation influences stipulated conservation efforts under HCPs.
Enforcement actions taken in response to violations of the Act are not included in this
analysis.
82. The protection of listed species and habitat is not limited to the Act. Other Federal
agencies, as well as State and local governments, may also seek to protect the natural
resources under their jurisdiction. If compliance with State forest practices laws, for
example, protects habitat for the species, such protective efforts are considered to be
baseline protections and costs associated with these efforts are categorized accordingly.
Of note, however, is that such efforts may not be considered baseline in the case that they
would not have been triggered absent the designation of critical habitat. In these cases,
they are considered incremental impacts and are discussed below.
2.3.2. INCREMENTAL ECONOMIC IMPACTS
83. This analysis quantifies the potential incremental impacts of this rulemaking. The focus
of the incremental analysis is to determine the impacts on land uses and activities from
the designation of critical habitat that are above and beyond those impacts resulting from
existing required or voluntary conservation efforts being undertaken due to other Federal,
State, and local regulations or guidelines.
84. When critical habitat is designated, section 7 requires Federal agencies to ensure that their
actions will not result in the destruction or adverse modification of critical habitat (in
addition to considering whether the actions are likely to jeopardize the continued
existence of the species). The added administrative costs of including consideration of
critical habitat in section 7 consultations, and the additional impacts of implementing
conservation efforts (i.e., reasonable and prudent alternatives) resulting from the
52 16 U.S.C. 1532.
53 16 U.S.C. 1538(a)(1)(G); 50 C.F.R. 17.31(a).
54 U.S. Fish and Wildlife Service, “Endangered Species and Habitat Conservation Planning,” August 6, 2002, accessed at
http://endangered.fws.gov/hcp/.
Final Economic Analysis - November 20, 2012
2-9
protection of critical habitat are the direct compliance costs of designating critical habitat.
These costs are not in the baseline and are considered incremental impacts of the
rulemaking.
85. To inform the economic analysis, the Service has provided a memorandum describing its
expected approach to conservation for the NSO following critical habitat designation.55
Specifically, this memorandum provides information on how the Service intends to
address projects that might lead to adverse modification of critical habitat as distinct from
projects that pose jeopardy to the species. The Service’s memorandum is provided in
Appendix B. Based on the information provided in Appendix B, the incremental effects
of designating critical habitat for NSO are dependent on the effect of a proposed action
on NSO habitat, the location of the proposed action relative to a land-use allocation, the
occupancy status, and the design of the proposed action.56
Direct Impacts
86. The direct, incremental impacts of critical habitat designation stem from the consideration
of the potential for destruction or adverse modification of critical habitat during section 7
consultations. The two categories of direct, incremental impacts of critical habitat
designation are: 1) the administrative costs of conducting section 7 consultation; and 2)
implementation of any conservation efforts required by the Service through section 7
consultation to avoid potential destruction or adverse modification of critical habitat.
87. Section 7(a)(2) of the Act requires Federal agencies to consult with the Service whenever
activities that they undertake, authorize, permit, or fund may affect a listed species or
designated critical habitat. In some cases, consultations will involve the Service and
another Federal agency only, such as the Corps. Often, they will also include a third
party involved in projects that involve a permitted entity, such as the recipient of a Clean
Water Act section 404 permit.
88. During a consultation, the Service, the Action agency, and the entity applying for Federal
funding or permitting (if applicable) communicate in an effort to minimize potential
adverse effects to the species and/or to the proposed critical habitat. Communication
between these parties may occur via written letters, phone calls, in-person meetings, or
any combination of these. The duration and complexity of these interactions depends on
a number of variables, including the type of consultation, the species, the activity of
concern, and the potential effects to the species and designated critical habitat associated
with the proposed activity, the Federal agency, and whether there is a private applicant
involved.
89. Section 7 consultations with the Service may be either informal or formal. Informal
consultations consist of discussions between the Service, the Action agency, and the
applicant concerning an action that may affect a listed species or its designated critical
habitat, and are designed to identify and resolve potential concerns at an early stage in the
55 U.S. Fish and Wildlife Service to Industrial Economics, Inc. “Incremental Effects Memorandum for the Economic Analysis of
the Proposed Rule to Revise Critical Habitat for the Northern Spotted Owl,” May 2, 2012.
56 Ibid.
Final Economic Analysis - November 20, 2012
2-10
planning process. By contrast, a formal consultation is required if the Action agency or
the Service determines that its proposed action may or will adversely affect the listed
species or designated critical habitat in ways that cannot be resolved through informal
consultation. The formal consultation process results in the Service’s determination in its
Biological Opinion of whether the action is likely to jeopardize a species or adversely
modify critical habitat, and if so, reasonable and prudent alternatives to avoid jeopardy or
adverse modification. If the action is not likely to result in jeopardy or adverse
modification of critical habitat, the Service specifies the amount or extent of incidental
take of the species, the reasonable and prudent measures necessary or appropriate to
minimize such impact and the terms and conditions necessary to implement the
reasonable and prudent measures. Regardless of the type of consultation or proposed
project, section 7 consultations can require substantial administrative effort on the part of
all participants.
Administrative Section 7 Consultation Costs
90. Parties involved in section 7 consultations include the Service, a Federal "action agency,”
and in some cases, a private entity involved in the project or land use activity. The action
agency (i.e., the Federal nexus necessitating the consultation) serves as the liaison with
the Service. While consultations are required for activities that involve a Federal nexus
and may affect a species regardless of whether critical habitat is designated, the
designation may increase the effort for consultations in the case that the project or activity
in question may adversely modify critical habitat. Administrative efforts for consultation
may therefore result in both baseline and incremental impacts.
91. In general, three different scenarios associated with the designation of critical habitat may
trigger incremental administrative consultation costs:
1. Additional effort to address adverse modification in a new consultation -
New consultations taking place after critical habitat designation may require
additional effort to address critical habitat issues above and beyond the listing
issues. In this case, the additional administrative effort required to consider
critical habitat is considered an incremental impact of the designation.
(Incremental impacts related to incremental conservation efforts are discussed
later in this section.)
2. Re-initiation of consultation to address adverse modification - Consultations
that have already been completed on a project or activity may require re-initiation
to address critical habitat. In this case, the costs of re-initiating the consultation,
including all associated administrative costs and costs associated with measures
to address impacts to critical habitat are considered incremental impacts of the
designation.
3. Incremental consultation resulting entirely from critical habitat designation
- Critical habitat designation may trigger additional consultations that may not
occur absent the designation. These incremental consultations may address
adverse modification alone (e.g., consultations triggered in critical habitat areas
that are not occupied by the species) or may address adverse modification and
Final Economic Analysis - November 20, 2012
2-11
jeopardy (e.g., consultations resulting from the new information about the
potential presence of the species provided by the designation). All administrative
costs and costs of conservation efforts associated with incremental consultations
are considered incremental impacts of the designation.
92. The administrative costs of these consultations vary depending on the specifics of the
project. One way to address this variability is to show a range of possible costs of
consultation, as it may not be possible to predict the precise outcome of each future
consultation in terms of level of effort. The Service provides estimates of the level of
effort associated with section 7 consultations in the Incremental Effects Memorandum
included in Appendix B.
Section 7 Conservation Effort Impacts
93. Section 7 consultation considering critical habitat may also result in additional
conservation effort recommendations specifically addressing potential destruction or
adverse modification of critical habitat. For forecast consultations considering jeopardy
and adverse modification, and for re-initiations of past consultations to consider critical
habitat, the economic impacts of conservation efforts undertaken to avoid adverse
modification are considered incremental impacts of critical habitat designation. For
consultations that are forecast to occur specifically because of the designation
(incremental consultations), impacts of all associated conservation efforts are assumed to
be incremental impacts of the designation. This is summarized below.
1. Additional effort to address adverse modification in a new consultation -
Only project modifications above and beyond what would be requested to avoid
or minimize jeopardy are considered incremental.
2. Re-initiation of consultation to address adverse modification - Only project
modifications above and beyond what was requested to avoid or minimize
jeopardy are considered incremental.
3. Incremental consultation resulting entirely from critical habitat designation
Impacts of all project modifications are considered incremental.
I ndi rect Impacts
94. The designation of critical habitat may, under certain circumstances, affect actions that do
not have a Federal nexus and thus are not subject to the provisions of section 7 under the
Act. Indirect impacts are those unintended changes in economic behavior that may occur
outside of the Act, through other Federal, State, or local actions, and that are caused by
the designation of critical habitat. This section identifies common types of indirect
impacts that may be associated with the designation of critical habitat. Importantly, these
types of impacts are not always considered incremental. In the case that these types of
conservation efforts and economic effects are expected to occur regardless of critical
habitat designation, they are appropriately considered baseline impacts in this analysis.
Final Economic Analysis - November 20, 2012
2-12
Habitat Conservation Plans
95. Under section 10 of the Act, landowners seeking an incidental take permit must develop
an HCP to counterbalance the potential harmful effects that an otherwise lawful activity
may have on a species. As such, the purpose of the habitat conservation planning process
is to ensure that the effects of incidental take are adequately avoided or minimized. Thus,
HCPs are developed to meet the requirements of section 10 of the Act and avoid
unauthorized take of listed species. Several existing and proposed HCPs include the NSO
as a covered species.57
96. Application for an incidental take permit and completion of an HCP are not required or
necessarily recommended by a critical habitat designation. However, in certain situations
the new information provided by the proposed critical habitat rule may prompt a
landowner to apply for an incidental take permit. For example, a landowner may have
been previously unaware of the potential presence of the species on his or her property,
and expeditious completion of an HCP may offer the landowner regulatory relief in the
form of exclusion from the final critical habitat designation. In this case, the effort
involved in creating the HCP and undertaking associated conservation efforts are
considered an incremental effect of designation. No specific plans to prepare new HCPs
in response to this proposed designation were identified for the NSO.
Other State and Local Laws
97. Under certain circumstances, critical habitat designation may provide new information to
a community about the sensitive ecological nature of a geographic region, potentially
triggering additional economic impacts under other State or local laws. In cases where
these impacts would not have been triggered absent critical habitat designation, they are
considered indirect, incremental impacts of the designation.
98. The California Environmental Quality Act (CEQA), for example, requires that lead
agencies, public agencies responsible for project approval, consider the environmental
effects of proposed projects that are considered discretionary in nature and not
categorically or statutorily exempt. In some instances, critical habitat designation may
trigger CEQA-related requirements. This is most likely to occur in areas where the
critical habitat designation provides clearer information on the importance of particular
areas as habitat for a listed species. In addition, applicants who were “categorically
exempt” from preparing an EIR under CEQA may no longer be exempt once critical
habitat is designated. In cases where the designation triggers the CEQA significance test
or results in a reduction of categorically exempt activities, associated impacts are
considered to be an indirect, incremental effect of the designation.
Additional Indirect Impacts
99. In addition to the indirect effects of compliance with other laws or triggered by the
designation, project proponents, land managers and landowners may face additional
indirect impacts, including the following:
57 2012 Proposed Critical Habitat Rule, 76 FR 14134
Final Economic Analysis - November 20, 2012
2-13
Time Delays - Both public and private entities may experience incremental time
delays for projects and other activities due to requirements associated with the
need to reinitiate the section 7 consultation process and/or compliance with other
laws triggered by the designation. To the extent that delays result from the
designation, they are considered indirect, incremental impacts of the designation.
Regulatory Uncertainty - The Service conducts each section 7 consultation on a
case-by-case basis and issues a biological opinion on formal consultations based
on species-specific and site-specific information. As a result, government
agencies and affiliated private parties who consult with the Service under section
7 may face uncertainty concerning whether project modifications will be
recommended by the Service and what the nature of these modifications will be.
This uncertainty may diminish as consultations are completed and additional
information becomes available on the effects of critical habitat on specific
activities. Where information suggests that this type of regulatory uncertainty
stemming from the designation may affect a project or economic behavior,
associated impacts are considered indirect, incremental impacts of the designation.
Stigma - In some cases, the public may perceive that critical habitat designation
may result in limitations on private property uses above and beyond those
associated with anticipated project modifications and regulatory uncertainty
described above. Public attitudes about the limits or restrictions that critical
habitat may impose can cause real economic effects to property owners, regardless
of whether such limits are actually imposed. All else equal, a property that is
designated as critical habitat may have a lower market value than an identical
property that is not within the boundaries of critical habitat due to perceived
limitations or restrictions.58
As the public becomes aware of the true regulatory
burden imposed by critical habitat, the impact of the designation on property
markets may decrease. To the extent that potential stigma effects on markets are
probable and identifiable, these impacts are considered indirect, incremental
impacts of the designation.
Indirect impacts may also result from critical habitat providing new information
regarding where project proponents should consult regarding potential impacts on the
species or habitat. As described in Appendix B, critical habitat designation for the NSO
is not likely to provide new information about the presence of the species for the 63
subunits considered occupied by the NSO. The one unoccupied unit (NSO-3) is
Federally managed by the Department of Defense, which currently does not consult on
58 Several studies have attempted to estimate the impact of perceptions about the effect of critical habitat designation on
land values and economic activity. Examples include Auffhammer, M., M. Oren, and D. Sunding. 2009. “Economic Impacts
of Critical habitat Designation: Evidence from the Market for Vacant Land.” Workshop Paper, The University of Arizona,
Program on Economics, Law, and the Environment, available at http://ele.arizona.edu/files/ELEsunding1-30-09.pdf ; List,
J.A., M. Margolis, and D. E. Osgood. 2006. “Is the Endangered Species Act Endangering Species?” National Bureau of
Economic Research Working Paper Series, Working Paper 12777, available at http://www.nber.org/papers/w12777; and
Lueck, Dean and Jeffrey A. Michael, April 2003, “Preemptive Habitat Destruction Under the Endangered Species Act,”
Journal of Law and Economics, 46: 27-60.
Final Economic Analysis - November 20, 2012
2-14
proposed actions relative to effects on the spotted owl.59
Therefore, indirect impacts may
result in this subunit and are addressed in Chapter 4.
2.3.3. BENEFITS
100. Under Executive Order 12866, OMB directs Federal agencies to provide an assessment of
both the social costs and benefits of proposed regulatory actions.60
OMB’s Circular A-4
distinguishes two types of economic benefits: direct benefits and ancillary benefits.
Ancillary benefits are defined as favorable impacts of a rulemaking that are typically
unrelated, or secondary, to the statutory purpose of the rulemaking.61
101. In the context of critical habitat, the primary purpose of the rulemaking (i.e., the direct
benefit) is the potential to enhance conservation of the species. The published economics
literature has documented that social welfare benefits can result from the conservation
and recovery of endangered and threatened species. In its guidance for implementing
Executive Order 12866, OMB acknowledges that it may not be feasible to monetize, or
even quantify, the benefits of environmental regulations due to either an absence of
defensible, relevant studies or a lack of resources on the implementing agency’s part to
conduct new research.62
Rather than rely on economic measures, the Service believes that
the direct benefits of the proposed rule are best expressed in biological terms that can be
weighed against the expected cost impacts of the rulemaking.
102. Critical habitat designation may also generate ancillary benefits. Critical habitat aids in
the conservation of species specifically by protecting the primary constituent elements on
which the species depends. To this end, critical habitat designation can result in
maintenance of particular environmental conditions that may generate other social
benefits aside from the preservation of the species. That is, management actions
undertaken to conserve a species or habitat may have coincident, positive social welfare
implications, such as increased recreational opportunities in a region. While they are not
the primary purpose of critical habitat, these ancillary benefits may result in gains in
employment, output, or income that may offset the direct, negative impacts to a region’s
economy resulting from actions to conserve a species or its habitat. The potential
ancillary benefits of critical habitat designation are described qualitatively in Chapter 8 of
this report.
2.3.4. GEOGRAPHIC SCOPE
103. The geographic scope of the analysis includes the areas proposed for critical habitat
designation. The analysis focuses on activities within or affecting these areas, and
presents impacts at the lowest level of resolution feasible, given available data. Where
possible, impacts are reported for each subunit identified in the proposed rule.
59 U.S. Fish and Wildlife Service to Industrial Economics, Inc. “Incremental Effects Memorandum for the Economic Analysis of
the Proposed Rule to Revise Critical Habitat for the Northern Spotted Owl,” March 21, 2012.
60 Executive Order 12866, Regulatory Planning and Review, September 30, 1993.
61 U.S. Office of Management and Budget, “Circular A-4,” September 17, 2003, available at
http://www.whitehouse.gov/sites/default/files/omb/assets/omb/circulars/a004/a-4.pdf
62 Ibid.
Final Economic Analysis - November 20, 2012
2-15
2.3.5. ANALYTIC T IMEFRAME
104. Ideally, the time frame of this analysis would be based on the expected time period over
which the critical habitat regulation is expected to be in place. Specifically, the analysis
would forecast impacts of implementing this rule through species recovery (i.e., when the
rule is no longer required). Recent guidance from OMB indicates that “if a regulation has
no predetermined sunset provision, the agency will need to choose the endpoint of its
analysis on the basis of a judgment about the foreseeable future.”63
The “foreseeable
future” for this analysis includes, but it not limited to, activities that are currently
authorized, permitted, or funded, or for which proposed plans are currently available to
the public. Forecasted impacts will be based on the planning periods for potentially
affected projects and will look out over a 20-year time horizon. OMB supports this time
frame stating that “for most agencies, a standard time period of analysis is ten to 20 years,
and rarely exceeds 50 years.”64
The timeframe for this analysis varies depending on the
economic activity under consideration. Impacts to Federal timberlands are generally
considered over a 20-year time period. We qualitatively discuss the potential for
permanent changes in the value of private timberlands. Linear projects are forecast over
a range of time periods based on data availability.
2.4 SOURCES OF INFORMATION
105. The primary sources of information for this report are communications with, and data
provided by, personnel from the Service (in particular, the Incremental Effects
Memorandum provided by the Service, included as Appendix B), personnel from other
Federal agencies, State governments and timber industry representatives. See Appendix
C for a complete list of entities contacted during stakeholder outreach. In addition, this
analysis relies upon the Service’s section 7 consultation record and existing habitat
management and conservation plans that consider the NSO. Finally, this analysis relies
on relevant information and data from the economic analysis prepared in support of the
2008 proposed critical habitat rule.65
A complete list of references is provided at the end
of this document.
2.5 PRESENTATION OF RESULTS
106. Impacts are described in present value and annualized terms applying discount rates of
three and seven percent throughout the body of the report. Appendix D provides
additional detail for the present and annualized value of impacts in each unit applying
these discount rates.66
Additionally, Appendix D presents undiscounted annual impact
values by activity and subunit. Present value and annualized impacts are calculated
according to the methods described in Exhibit 2-1.
63 The U.S. Office of Management and Budget, February 7. 2011. “Regulatory Impact Analysis: Frequently Asked Questions
(FAQs).” Accessed on May 3, 2011 by http://www.whitehouse.gov/sites/default/files/omb/circulars/a004/a-4_FAQ.pdf.
64 Ibid.
65 Entrix, “Final Economic Analysis of Critical Habitat Designation for the Northern Spotted Owl,” prepared for the U.S. Fish
and Wildlife Service, July 15, 2008.
66 The U.S. Office of Management and Budget (OMB) requires Federal agencies to report results using discount rates of three
and seven percent (see OMB, Circular A-4, 2003).
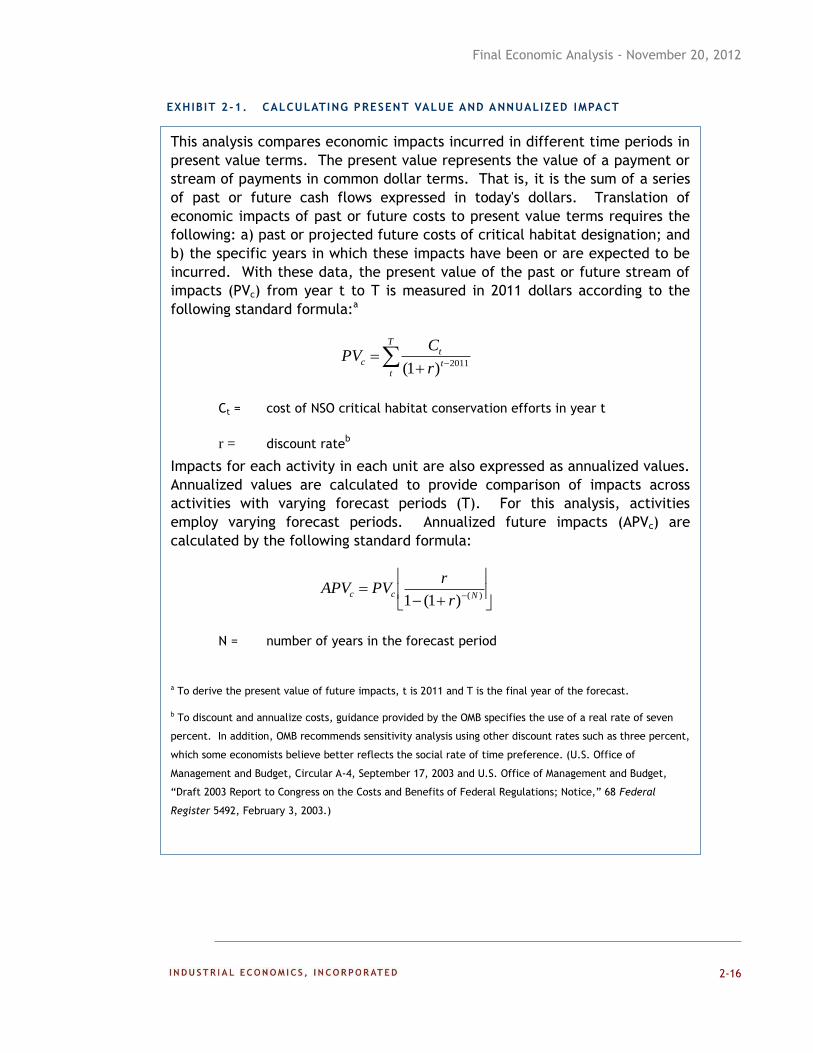
Final Economic Analysis - November 20, 2012
2-16
EXHIBIT 2-1. CALCULATING PRESENT VALUE AND ANNUALIZED IMPACT
This analysis compares economic impacts incurred in different time periods in
present value terms. The present value represents the value of a payment or
stream of payments in common dollar terms. That is, it is the sum of a series
of past or future cash flows expressed in today's dollars. Translation of
economic impacts of past or future costs to present value terms requires the
following: a) past or projected future costs of critical habitat designation; and
b) the specific years in which these impacts have been or are expected to be
incurred. With these data, the present value of the past or future stream of
impacts (PV Bc B) from year t to T is measured in 2011 dollars according to the
following standard formula:a
C BtB = cost of NSO critical habitat conservation efforts in year t
r = discount rateb
Impacts for each activity in each unit are also expressed as annualized values.
Annualized values are calculated to provide comparison of impacts across
activities with varying forecast periods (T). For this analysis, activities
employ varying forecast periods. Annualized future impacts (APV Bc B) are
calculated by the following standard formula:
N = number of years in the forecast period
a To derive the present value of future impacts, t is 2011 and T is the final year of the forecast.
b To discount and annualize costs, guidance provided by the OMB specifies the use of a real rate of seven
percent. In addition, OMB recommends sensitivity analysis using other discount rates such as three percent,
which some economists believe better reflects the social rate of time preference. (U.S. Office of
Management and Budget, Circular A-4, September 17, 2003 and U.S. Office of Management and Budget,
“Draft 2003 Report to Congress on the Costs and Benefits of Federal Regulations; Notice,” 68 Federal
Register 5492, February 3, 2003.)
T
tt
tc
r
CPV
2011)1(
)()1(1 Nccr
rPVAPV
Final Economic Analysis - November 20, 2012
3-1
CHAPTER 3 | BACKGROUND
107. The timber industry has long been an economic driver in the Pacific Northwest, providing
a substantial share of the economic foundation for many rural communities. Over the
past 20 years, the industry has undergone significant changes that have manifested in
reduced timber-related jobs and revenues. The drivers of change are many and varied;
some are politically contentious and high-profile, such as the controversies over forest
management practices and protective measures for endangered species (including the
NSO, marbled murrelets, and Pacific salmon), and others are complex and variable, such
as globalization of the timber market and modernization of the industry. This chapter
provides an overview of recent trends in the timber industry, with a focus on the past 20
years, in terms of timber harvest, employment, and revenues. It also provides a brief
overview of some of the major forces driving changes in industry trends.
3.1 TIMBER INDUSTRY TRENDS
108. In general, timber harvests and employment within the timber industry have decreased
within the study area over the last 20 years. As discussed more fully below, many
variables have contributed to the decline in timber industry employment, including the
decline in the availability of Federal timber, mechanization, transfer of capital investment
away from the region, closure of less efficient mills, and fluctuating demand for wood
products. It is important to view changes in timber industry employment in the Pacific
Northwest within the greater context of regional market conditions. Between 1990 and
2000, timber industry employment in the NWFP area declined significantly, by
approximately 30,000 jobs. Meanwhile, there were substantial increases in both
population and total employment in the tri-state area of California, Oregon, and
Washington; population increased by 15 percent and employment grew 18 percent,
representing a total of 3.8 million jobs gained.67
During the following decade, however,
population in the tri-state area continued to grow while job growth slowed, with total
employment increasing only three percent between 2000 and 2010.68
3.1.1 REGULATORY BACKGROUND
109. After the NSO was designated as a threatened species in 1990, a series of lawsuits over
Federal timber sales led to the 1991 court injunction that halted the majority of timber
sales occurring on Federal lands within the range of the NSO. In response to the lawsuits,
President Clinton convened a forest conference in 1993 and issued a mandate for Federal
67 Routman, K. 2007. Forest Communities and the Northwest Forest Plan: What Socioeconomic Monitoring Can Tell Us.
Science Findings (95). Pacific Northwest Research Station, USDA Forest Service.
68 U.S. Bureau of Economic Analysis, “Interactive Data: Regional Data: GDP & Personal Income: Annual State Personal Income
and Employment,” as viewed at http://www.bea.gov/iTable/iTable.cfm?ReqID=70&step=1 on September 30, 2012.
Final Economic Analysis - November 20, 2012
3-2
land-management and regulatory agencies to develop a plan to resolve the conflict. The
resulting NWFP was adopted in 1994. It amended existing management plans for 19
National Forests and seven BLM districts in California, Oregon, and Washington.69
One
of the main goals of the plan was to produce predictable levels of timber and non-timber
resources in order to provide stability to local and regional economies.70
110. Exhibit 3-1 shows the areas covered by the NWFP and how these areas fall within the
larger study area.71
Most of the proposed designation is subject to the plan. Areas in
blue, which are proposed for designation but not covered by the plan, are largely State
and private lands.
3.1.2 HARVEST TRENDS
111. In this section, we present data on trends in timber harvests from 1990 through 2010. The
volume of timber harvested in the 56 counties where critical habitat is proposed has
decreased sharply in the past 20 years. In 1990, harvests from all counties overlapping
the study area totaled 12,368,023 mbf. Harvests from these same counties totaled
6,034,956 mbf in 2010, representing a 51 percent decrease in production.72,73,74,75
Exhibits
3-2 through 3-4 provide annual timber harvest data within the study area for 2010, as well
as the proportion of timber harvested on public lands, and the percent decrease from 1990
harvest levels (for both public and private lands).
112. In addition to an overall decrease in harvests over the last 20 years, the relative
contribution of Federal and private lands to those totals has shifted, as shown in Exhibit
3-5. In 1990, harvests from public lands within the 56 counties where critical habitat is
proposed accounted for 32 percent of all timber harvested in that region.76,77,78
Ten years
69 Charnley, S, EM Donoghue, and C Moseley. 2008. “Forest Management Policy and Community Well-Being in the Pacific
Northwest.” Journal of Forestry (December 2008). Accessed at
http://www.fs.fed.us/pnw/pubs/journals/pnw_2008_charnley001.pdf on April 6, 2012.
70 The NWFP established land use designations that included a network of connected reserves to conserve the species of
concern. The reserve network was embedded in a matrix of “working” forests; all lands outside reserves and withdrawn
areas were available for regularly scheduled timber harvests.
71 The NWFP covers 26,887,086 acres, 14,801,009 of which are not included as part of the 2012 proposed critical habitat. An
additional 1,876,756 acres of the proposed critical habitat are not included in the NWFP.
72 California State Board of Equalization, "California Timber Harvest By County: Year 2010 Quarter 1 to 4." Accessed at
http://www.boe.ca.gov/proptaxes/pdf/ytr362010.pdf March 2012.
73 California State Board of Equalization, "California Timber Harvest By County: 1994-2009." Accessed at
http://www.boe.ca.gov/proptaxes/pdf/yr3694to09.pdf March 2012.
74 Oregon Department of Forestry, "Oregon Annual Timber Reports." Accessed at
http://www.oregon.gov/ODF/STATE_FORESTS/FRP/annual_reports.shtml March 2012.
75 Washington State Department of Natural Resources, “Washington State Timber Harvest.” Accessed at
http://www.dnr.wa.gov/BusinessPermits/Topics/EconomicReports/Pages/obe_washington_timber_harvest_reports.aspx
March 2012.
76 California State Board of Equalization, 2009
77 Oregon Department of Forestry. 2012
78 Washington State Department of Natural Resources, 2012
Final Economic Analysis - November 20, 2012
3-3
later, in 2000, harvests from public lands accounted for only 14 percent. In 2010, the
proportion of timber harvested from public lands had risen back up to 24 percent.
However, this rise in the proportional share of timber from public lands appears to be
driven more by a decrease in harvests on private lands, rather than large increase in
harvests on public lands. These trends are particularly important given that private
timberlands are approximately nine percent of the total acreage of proposed critical
habitat.79
113. Timber harvests between 2000 and 2010 did not keep pace with NWFP projections. The
plan predicted that harvests from public lands within the NWFP area would be over 800
million board feet (MMBF) annually from 1999 to present.80
Predicted harvests have not
been met within the NWFP area, in part due to controversy over harvesting mature and
old-growth stands, which were expected to be the primary harvest component in the first
few decades of the NWFP.81,82,83
79 2012 Proposed Critical Habitat Rule, 77 FR 14062.
80 Phillips, R.H. 2006. Jobs and income associated with resource and recreation outputs. P. 37-51 in Northwest Forest Plan:
The first ten years (1994-2003): Socioeconomic monitoring results. Volume III: Rural communities and economies, Charnley,
S. (tech. coord.). US For. Serv. Gen. Tech. Rep. PNW-GTR-649, Pacific Northwest Res. Stn., Portland, OR. 206 p.
81 Exhibit 3-5 illustrates timber production on public lands within the proposed critical habitat counties and is not limited to
the public lands within the NWFP area. While harvest from the proposed critical habitat counties was greater than 800
MMBP in each year, this was not true for the public lands within the NWFP area.
82 Charnley, Susan. 2006. The Northwest Forest Plan as a Model for Broad-Scale Ecosystem Management: a Social Perspective.
U.S. Department of Agriculture Forest Service, Pacific Northwest Research Station. Portland, OR.
83 Routman, K. 2007. Forest Communities and the Northwest Forest Plan: What Socioeconomic Monitoring Can Tell Us.
Science Findings (95). Pacific Northwest Research Station, USDA Forest Service.
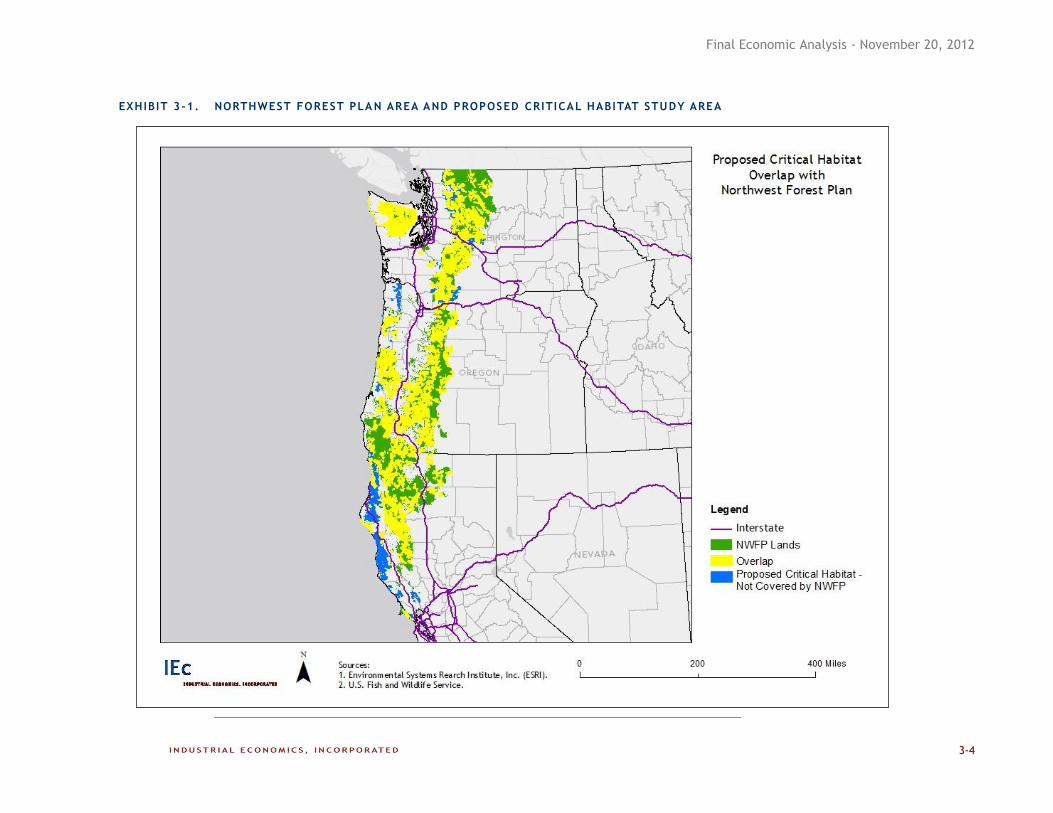
Final Economic Analysis - November 20, 2012
3-4
EXHIBIT 3-1. NORTHWEST FOREST PLA N AREA AND PROPOSED CRITICAL HABITAT STUDY AREA
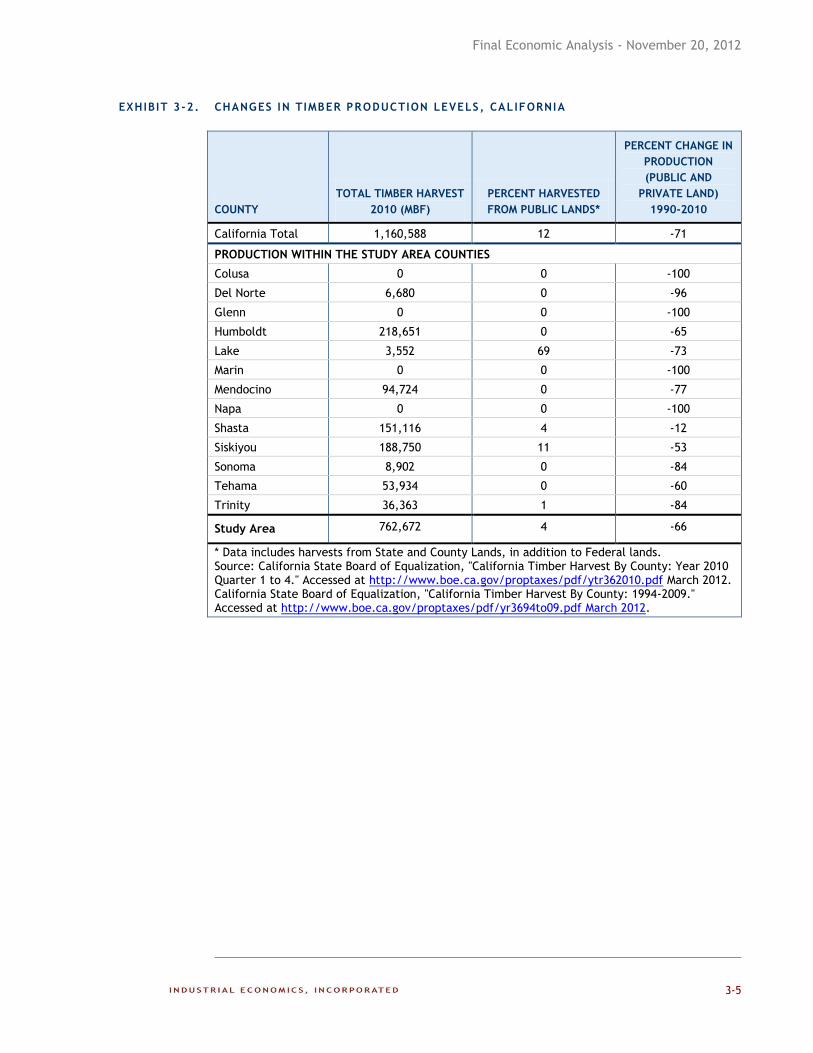
Final Economic Analysis - November 20, 2012
3-5
EXHIBIT 3-2. CHANGES IN TIMBER PRODUCTION LEVELS, CAL IFORNIA
COUNTY
TOTAL TIMBER HARVEST
2010 (MBF)
PERCENT HARVESTED
FROM PUBLIC LANDS*
PERCENT CHANGE IN
PRODUCTION
(PUBLIC AND
PRIVATE LAND)
1990-2010
California Total 1,160,588 12 -71
PRODUCTION WITHIN THE STUDY AREA COUNTIES
Colusa 0 0 -100
Del Norte 6,680 0 -96
Glenn 0 0 -100
Humboldt 218,651 0 -65
Lake 3,552 69 -73
Marin 0 0 -100
Mendocino 94,724 0 -77
Napa 0 0 -100
Shasta 151,116 4 -12
Siskiyou 188,750 11 -53
Sonoma 8,902 0 -84
Tehama 53,934 0 -60
Trinity 36,363 1 -84
Study Area 762,672 4 -66
* Data includes harvests from State and County Lands, in addition to Federal lands. Source: California State Board of Equalization, "California Timber Harvest By County: Year 2010 Quarter 1 to 4." Accessed at http://www.boe.ca.gov/proptaxes/pdf/ytr362010.pdf March 2012. California State Board of Equalization, "California Timber Harvest By County: 1994-2009." Accessed at http://www.boe.ca.gov/proptaxes/pdf/yr3694to09.pdf March 2012.
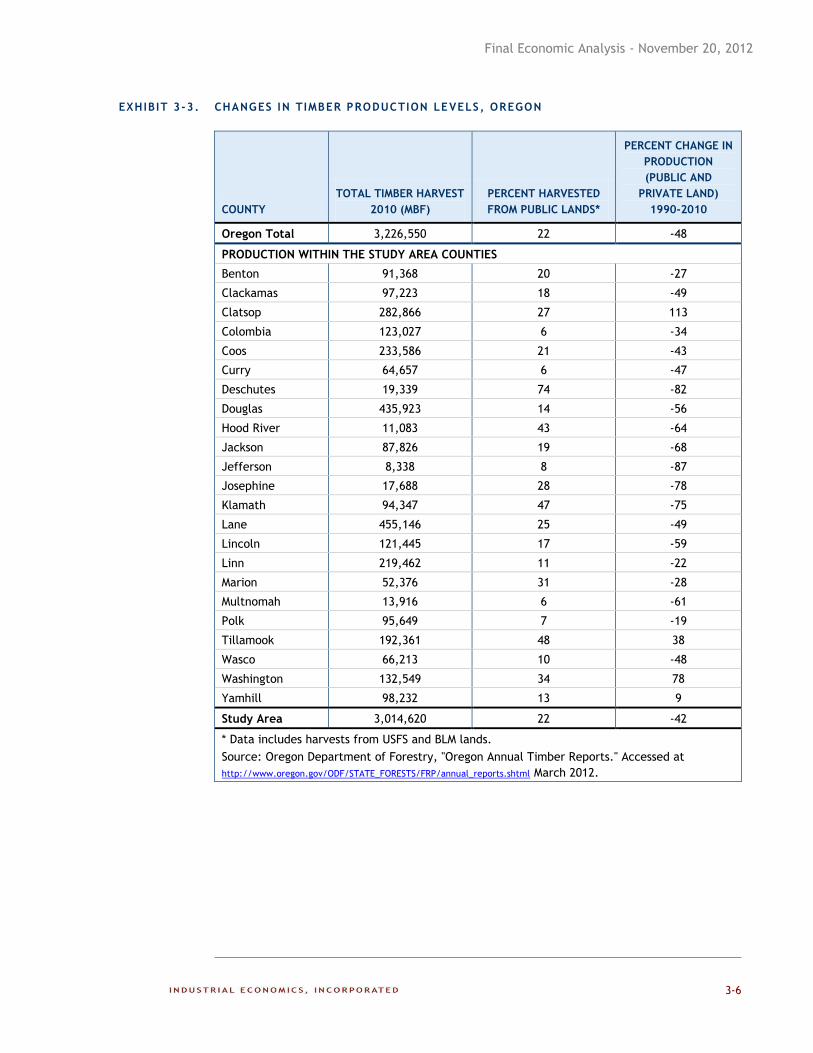
Final Economic Analysis - November 20, 2012
3-6
EXHIBIT 3-3. CHANGES IN TIMBER PRODUCTION LEVELS, OREGON
COUNTY
TOTAL TIMBER HARVEST
2010 (MBF)
PERCENT HARVESTED
FROM PUBLIC LANDS*
PERCENT CHANGE IN
PRODUCTION
(PUBLIC AND
PRIVATE LAND)
1990-2010
Oregon Total 3,226,550 22 -48
PRODUCTION WITHIN THE STUDY AREA COUNTIES
Benton 91,368 20 -27
Clackamas 97,223 18 -49
Clatsop 282,866 27 113
Colombia 123,027 6 -34
Coos 233,586 21 -43
Curry 64,657 6 -47
Deschutes 19,339 74 -82
Douglas 435,923 14 -56
Hood River 11,083 43 -64
Jackson 87,826 19 -68
Jefferson 8,338 8 -87
Josephine 17,688 28 -78
Klamath 94,347 47 -75
Lane 455,146 25 -49
Lincoln 121,445 17 -59
Linn 219,462 11 -22
Marion 52,376 31 -28
Multnomah 13,916 6 -61
Polk 95,649 7 -19
Tillamook 192,361 48 38
Wasco 66,213 10 -48
Washington 132,549 34 78
Yamhill 98,232 13 9
Study Area 3,014,620 22 -42
* Data includes harvests from USFS and BLM lands.
Source: Oregon Department of Forestry, "Oregon Annual Timber Reports." Accessed at
http://www.oregon.gov/ODF/STATE_FORESTS/FRP/annual_reports.shtml March 2012.
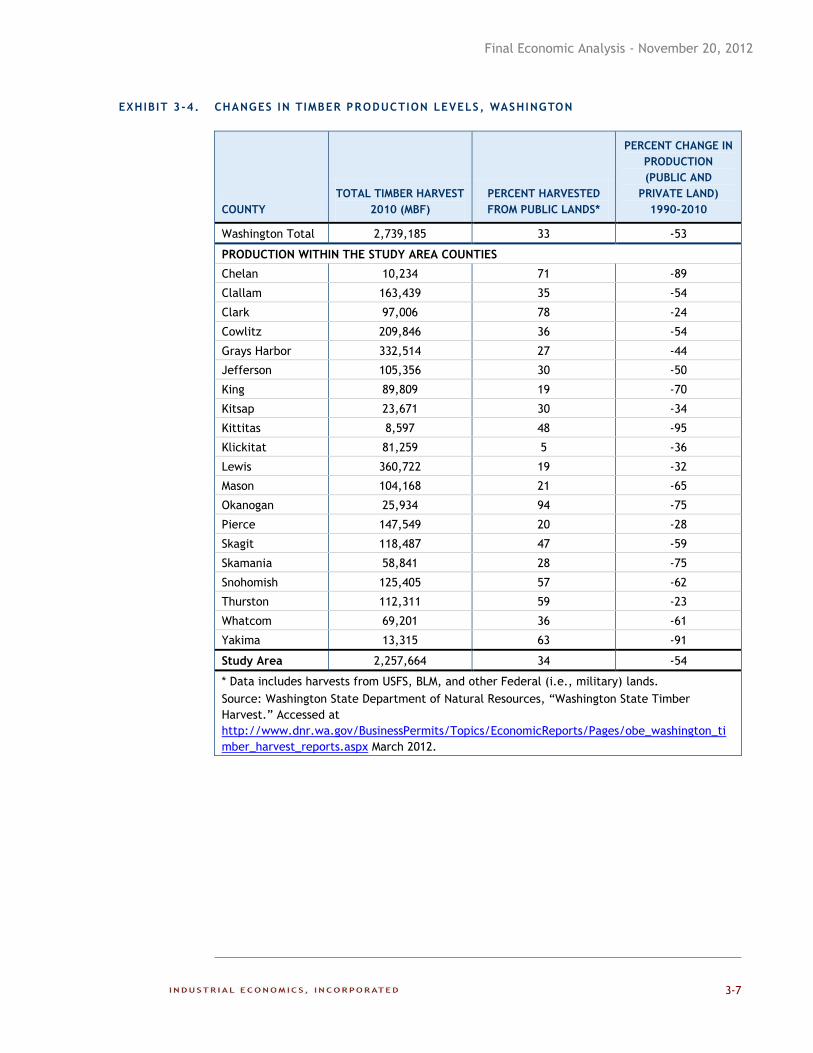
Final Economic Analysis - November 20, 2012
3-7
EXHIBIT 3-4. CHANGES IN TIMBER PRODUCTION LEVELS, WASHINGTON
COUNTY
TOTAL TIMBER HARVEST
2010 (MBF)
PERCENT HARVESTED
FROM PUBLIC LANDS*
PERCENT CHANGE IN
PRODUCTION
(PUBLIC AND
PRIVATE LAND)
1990-2010
Washington Total 2,739,185 33 -53
PRODUCTION WITHIN THE STUDY AREA COUNTIES
Chelan 10,234 71 -89
Clallam 163,439 35 -54
Clark 97,006 78 -24
Cowlitz 209,846 36 -54
Grays Harbor 332,514 27 -44
Jefferson 105,356 30 -50
King 89,809 19 -70
Kitsap 23,671 30 -34
Kittitas 8,597 48 -95
Klickitat 81,259 5 -36
Lewis 360,722 19 -32
Mason 104,168 21 -65
Okanogan 25,934 94 -75
Pierce 147,549 20 -28
Skagit 118,487 47 -59
Skamania 58,841 28 -75
Snohomish 125,405 57 -62
Thurston 112,311 59 -23
Whatcom 69,201 36 -61
Yakima 13,315 63 -91
Study Area 2,257,664 34 -54
* Data includes harvests from USFS, BLM, and other Federal (i.e., military) lands.
Source: Washington State Department of Natural Resources, “Washington State Timber
Harvest.” Accessed at
http://www.dnr.wa.gov/BusinessPermits/Topics/EconomicReports/Pages/obe_washington_ti
mber_harvest_reports.aspx March 2012.
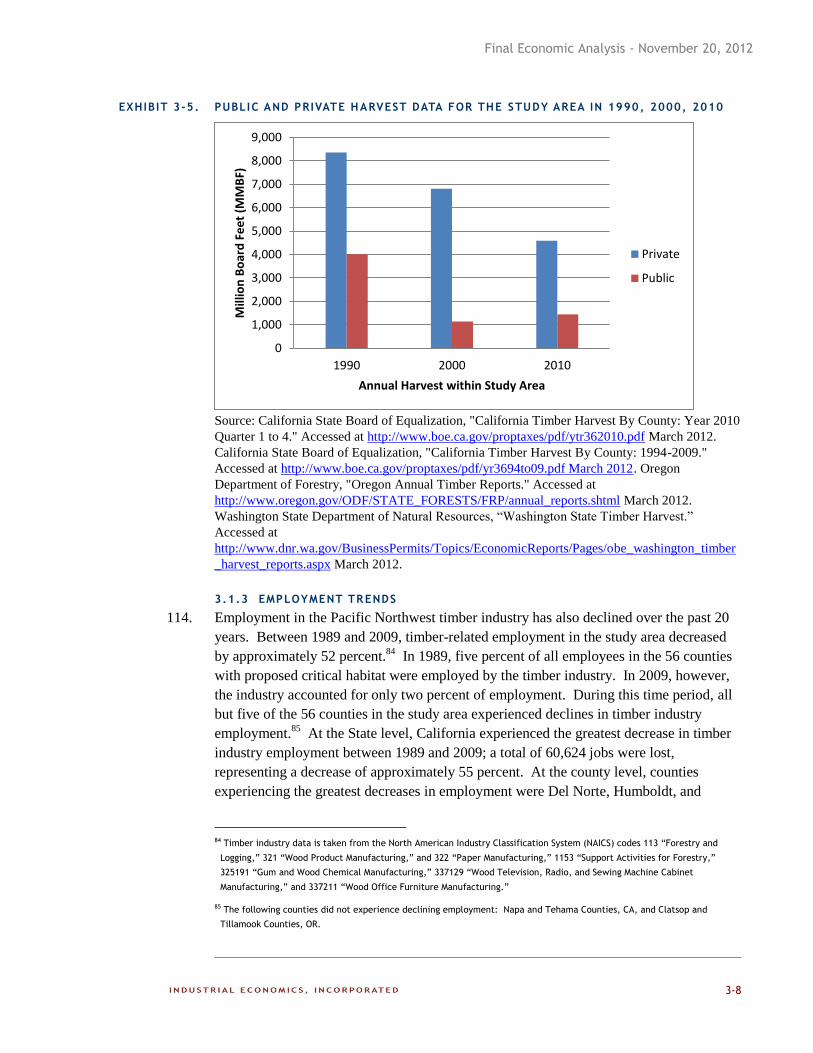
Final Economic Analysis - November 20, 2012
3-8
EXHIBIT 3-5. PUBLIC AND PRIVATE HARVEST DATA FOR THE STUDY AREA IN 1990, 2000, 2010
Source: California State Board of Equalization, "California Timber Harvest By County: Year 2010
Quarter 1 to 4." Accessed at http://www.boe.ca.gov/proptaxes/pdf/ytr362010.pdf March 2012.
California State Board of Equalization, "California Timber Harvest By County: 1994-2009."
Accessed at http://www.boe.ca.gov/proptaxes/pdf/yr3694to09.pdf March 2012. Oregon
Department of Forestry, "Oregon Annual Timber Reports." Accessed at
http://www.oregon.gov/ODF/STATE_FORESTS/FRP/annual_reports.shtml March 2012.
Washington State Department of Natural Resources, “Washington State Timber Harvest.”
Accessed at
http://www.dnr.wa.gov/BusinessPermits/Topics/EconomicReports/Pages/obe_washington_timber
_harvest_reports.aspx March 2012.
3.1.3 EMPLOYMENT TRENDS
114. Employment in the Pacific Northwest timber industry has also declined over the past 20
years. Between 1989 and 2009, timber-related employment in the study area decreased
by approximately 52 percent.84
In 1989, five percent of all employees in the 56 counties
with proposed critical habitat were employed by the timber industry. In 2009, however,
the industry accounted for only two percent of employment. During this time period, all
but five of the 56 counties in the study area experienced declines in timber industry
employment.85
At the State level, California experienced the greatest decrease in timber
industry employment between 1989 and 2009; a total of 60,624 jobs were lost,
representing a decrease of approximately 55 percent. At the county level, counties
experiencing the greatest decreases in employment were Del Norte, Humboldt, and
84 Timber industry data is taken from the North American Industry Classification System (NAICS) codes 113 “Forestry and
Logging,” 321 “Wood Product Manufacturing,” and 322 “Paper Manufacturing,” 1153 “Support Activities for Forestry,”
325191 “Gum and Wood Chemical Manufacturing,” 337129 “Wood Television, Radio, and Sewing Machine Cabinet
Manufacturing,” and 337211 “Wood Office Furniture Manufacturing.”
85 The following counties did not experience declining employment: Napa and Tehama Counties, CA, and Clatsop and
Tillamook Counties, OR.
0
1,000
2,000
3,000
4,000
5,000
6,000
7,000
8,000
9,000
1990 2000 2010
Mill
ion
Bo
ard
Fe
et
(MM
BF)
Annual Harvest within Study Area
Private
Public
Final Economic Analysis - November 20, 2012
3-9
Trinity Counties, CA, and Okanogan and Thurston Counties, WA. Timber industry
employment increased as a share of total employment in in Clatsop, Jefferson, and
Tillamook Counties, OR.
115. Exhibits 3-6 through 3-8 provide detailed data on the change in employment and payroll
in the timber industry in the 56 counties where critical habitat is proposed. These exhibits
demonstrate the change in employment between 1989 and 2009, the most recent year for
which these data are readily available. For each county, we list the proposed subunits
overlapping that county. Next, we present the number of individuals employed in 1989,
1999, and 2009, as well as the percentage of all jobs in the county accounted for by the
timber industry. Then, we calculate the percentage change in the number of jobs between
1989 and 2009. Negative changes indicate employment decreased over the period.
116. For each county, Exhibits 3-6 through 3-8 provide the annual payroll paid by the timber
industry and the proportion of total payroll in the county accounted for by the industry.
The exhibits also provide the degree to which payroll has increased or declined over the
past 20 years. The final column of each exhibit provides the county-wide average
unemployment rate for 2010. This information provides context for the timber industry
employment reductions, highlighting those counties for which available jobs are already
limited.
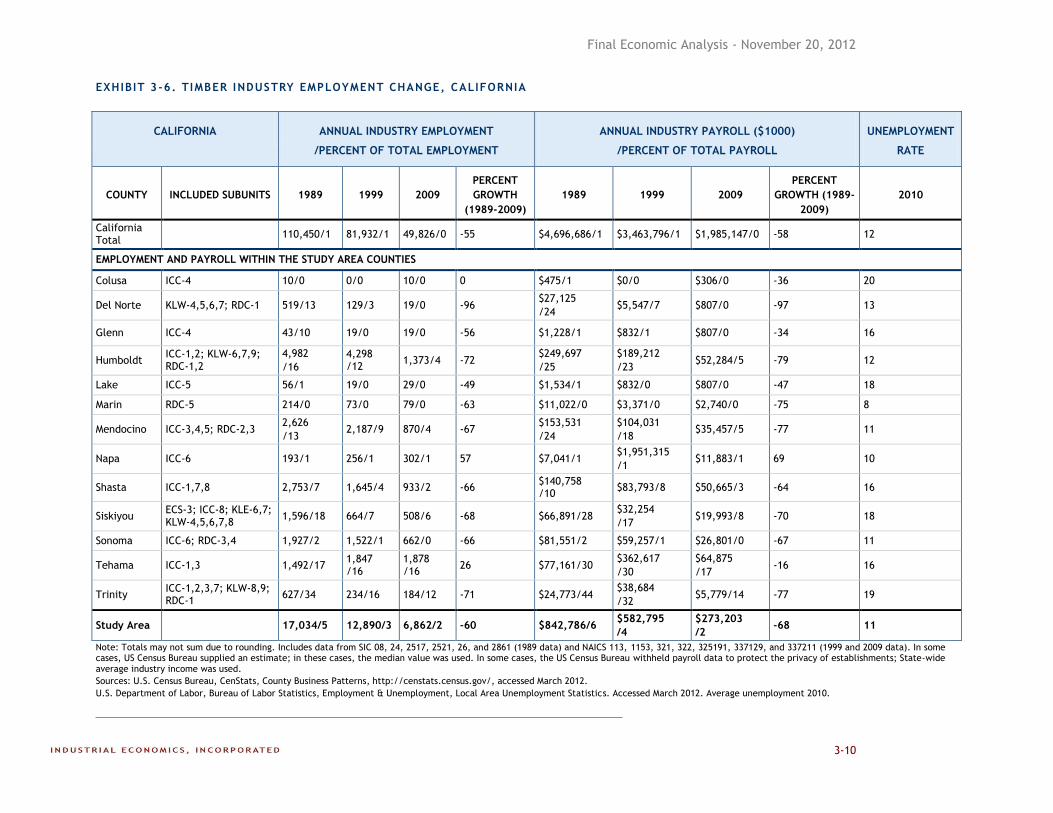
Final Economic Analysis - November 20, 2012
3-10
EXHIBIT 3 -6. TIMBER INDUSTRY EMPLOYMENT CHANGE, CALIFORNIA
CALIFORNIA ANNUAL INDUSTRY EMPLOYMENT
/PERCENT OF TOTAL EMPLOYMENT
ANNUAL INDUSTRY PAYROLL ($1000)
/PERCENT OF TOTAL PAYROLL
UNEMPLOYMENT
RATE
COUNTY INCLUDED SUBUNITS 1989 1999 2009
PERCENT
GROWTH
(1989-2009)
1989 1999 2009
PERCENT
GROWTH (1989-
2009)
2010
California Total
110,450/1 81,932/1 49,826/0 -55 $4,696,686/1 $3,463,796/1 $1,985,147/0 -58 12
EMPLOYMENT AND PAYROLL WITHIN THE STUDY AREA COUNTIES
Colusa ICC-4 10/0 0/0 10/0 0 $475/1 $0/0 $306/0 -36 20
Del Norte KLW-4,5,6,7; RDC-1 519/13 129/3 19/0 -96 $27,125
/24 $5,547/7 $807/0 -97 13
Glenn ICC-4 43/10 19/0 19/0 -56 $1,228/1 $832/1 $807/0 -34 16
Humboldt ICC-1,2; KLW-6,7,9; RDC-1,2
4,982
/16
4,298 /12
1,373/4 -72 $249,697
/25
$189,212
/23 $52,284/5 -79 12
Lake ICC-5 56/1 19/0 29/0 -49 $1,534/1 $832/0 $807/0 -47 18
Marin RDC-5 214/0 73/0 79/0 -63 $11,022/0 $3,371/0 $2,740/0 -75 8
Mendocino ICC-3,4,5; RDC-2,3 2,626
/13 2,187/9 870/4 -67
$153,531
/24
$104,031
/18 $35,457/5 -77 11
Napa ICC-6 193/1 256/1 302/1 57 $7,041/1 $1,951,315
/1 $11,883/1 69 10
Shasta ICC-1,7,8 2,753/7 1,645/4 933/2 -66 $140,758 /10
$83,793/8 $50,665/3 -64 16
Siskiyou ECS-3; ICC-8; KLE-6,7; KLW-4,5,6,7,8
1,596/18 664/7 508/6 -68 $66,891/28 $32,254
/17 $19,993/8 -70 18
Sonoma ICC-6; RDC-3,4 1,927/2 1,522/1 662/0 -66 $81,551/2 $59,257/1 $26,801/0 -67 11
Tehama ICC-1,3 1,492/17 1,847 /16
1,878 /16
26 $77,161/30 $362,617
/30
$64,875
/17 -16 16
Trinity ICC-1,2,3,7; KLW-8,9; RDC-1
627/34 234/16 184/12 -71 $24,773/44 $38,684
/32 $5,779/14 -77 19
Study Area 17,034/5 12,890/3 6,862/2 -60 $842,786/6 $582,795
/4
$273,203
/2 -68 11
Note: Totals may not sum due to rounding. Includes data from SIC 08, 24, 2517, 2521, 26, and 2861 (1989 data) and NAICS 113, 1153, 321, 322, 325191, 337129, and 337211 (1999 and 2009 data). In some cases, US Census Bureau supplied an estimate; in these cases, the median value was used. In some cases, the US Census Bureau withheld payroll data to protect the privacy of establishments; State-wide average industry income was used.
Sources: U.S. Census Bureau, CenStats, County Business Patterns, http://censtats.census.gov/, accessed March 2012.
U.S. Department of Labor, Bureau of Labor Statistics, Employment & Unemployment, Local Area Unemployment Statistics. Accessed March 2012. Average unemployment 2010.
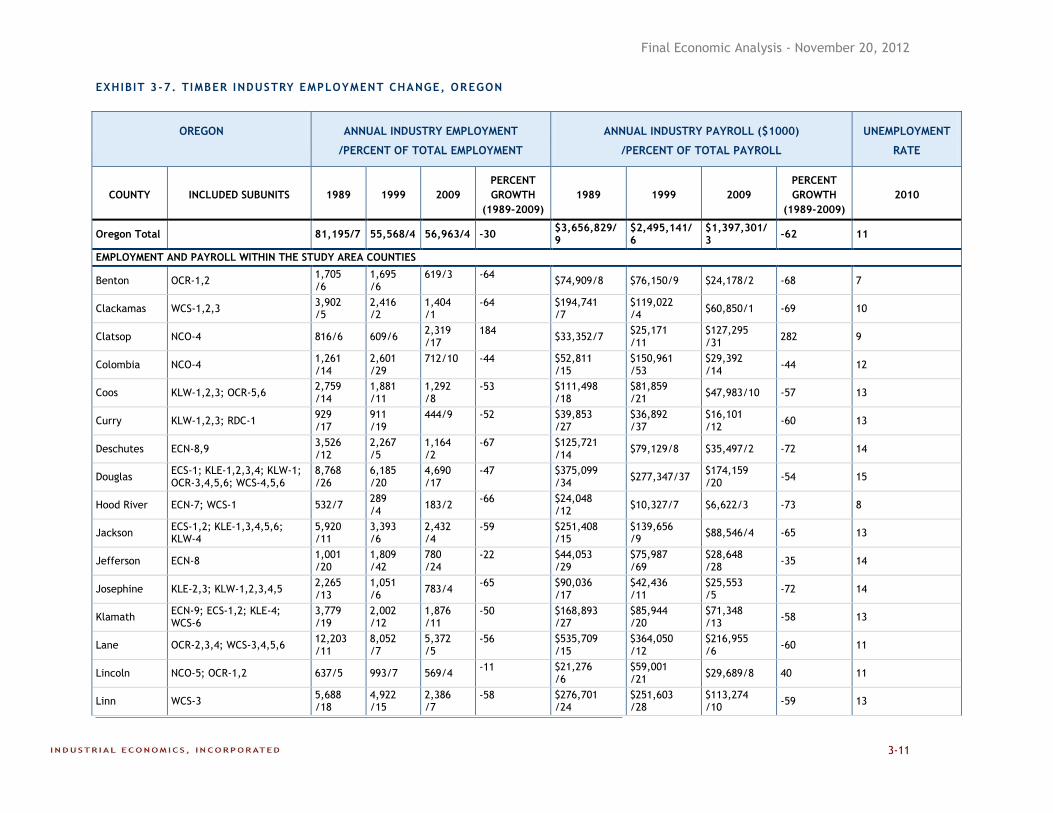
Final Economic Analysis - November 20, 2012
3-11
EXHIBIT 3 -7. TIMBER INDUSTRY EMPLOYMENT CHANGE, OREGON
OREGON ANNUAL INDUSTRY EMPLOYMENT
/PERCENT OF TOTAL EMPLOYMENT
ANNUAL INDUSTRY PAYROLL ($1000)
/PERCENT OF TOTAL PAYROLL
UNEMPLOYMENT
RATE
COUNTY INCLUDED SUBUNITS 1989 1999 2009
PERCENT
GROWTH
(1989-2009)
1989 1999 2009
PERCENT
GROWTH
(1989-2009)
2010
Oregon Total 81,195/7 55,568/4 56,963/4 -30 $3,656,829/9
$2,495,141/6
$1,397,301/3
-62 11
EMPLOYMENT AND PAYROLL WITHIN THE STUDY AREA COUNTIES
Benton OCR-1,2 1,705 /6
1,695 /6
619/3 -64 $74,909/8 $76,150/9 $24,178/2 -68 7
Clackamas WCS-1,2,3 3,902 /5
2,416 /2
1,404 /1
-64 $194,741 /7
$119,022 /4
$60,850/1 -69 10
Clatsop NCO-4 816/6 609/6 2,319 /17
184 $33,352/7
$25,171 /11
$127,295 /31
282 9
Colombia NCO-4 1,261 /14
2,601 /29
712/10 -44 $52,811 /15
$150,961 /53
$29,392 /14
-44 12
Coos KLW-1,2,3; OCR-5,6 2,759 /14
1,881 /11
1,292 /8
-53 $111,498 /18
$81,859 /21
$47,983/10 -57 13
Curry KLW-1,2,3; RDC-1 929 /17
911 /19
444/9 -52 $39,853 /27
$36,892 /37
$16,101 /12
-60 13
Deschutes ECN-8,9 3,526 /12
2,267 /5
1,164 /2
-67 $125,721 /14
$79,129/8 $35,497/2 -72 14
Douglas ECS-1; KLE-1,2,3,4; KLW-1; OCR-3,4,5,6; WCS-4,5,6
8,768 /26
6,185 /20
4,690 /17
-47 $375,099 /34
$277,347/37 $174,159 /20
-54 15
Hood River ECN-7; WCS-1 532/7 289 /4
183/2 -66 $24,048
/12 $10,327/7 $6,622/3 -73 8
Jackson ECS-1,2; KLE-1,3,4,5,6; KLW-4
5,920 /11
3,393 /6
2,432 /4
-59 $251,408 /15
$139,656 /9
$88,546/4 -65 13
Jefferson ECN-8 1,001 /20
1,809 /42
780 /24
-22 $44,053 /29
$75,987 /69
$28,648 /28
-35 14
Josephine KLE-2,3; KLW-1,2,3,4,5 2,265 /13
1,051 /6
783/4 -65 $90,036
/17 $42,436 /11
$25,553 /5
-72 14
Klamath ECN-9; ECS-1,2; KLE-4; WCS-6
3,779 /19
2,002 /12
1,876 /11
-50 $168,893 /27
$85,944 /20
$71,348 /13
-58 13
Lane OCR-2,3,4; WCS-3,4,5,6 12,203 /11
8,052 /7
5,372 /5
-56 $535,709 /15
$364,050 /12
$216,955 /6
-60 11
Lincoln NCO-5; OCR-1,2 637/5 993/7 569/4 -11 $21,276
/6 $59,001 /21
$29,689/8 40 11
Linn WCS-3 5,688 /18
4,922 /15
2,386 /7
-58 $276,701 /24
$251,603 /28
$113,274 /10
-59 13
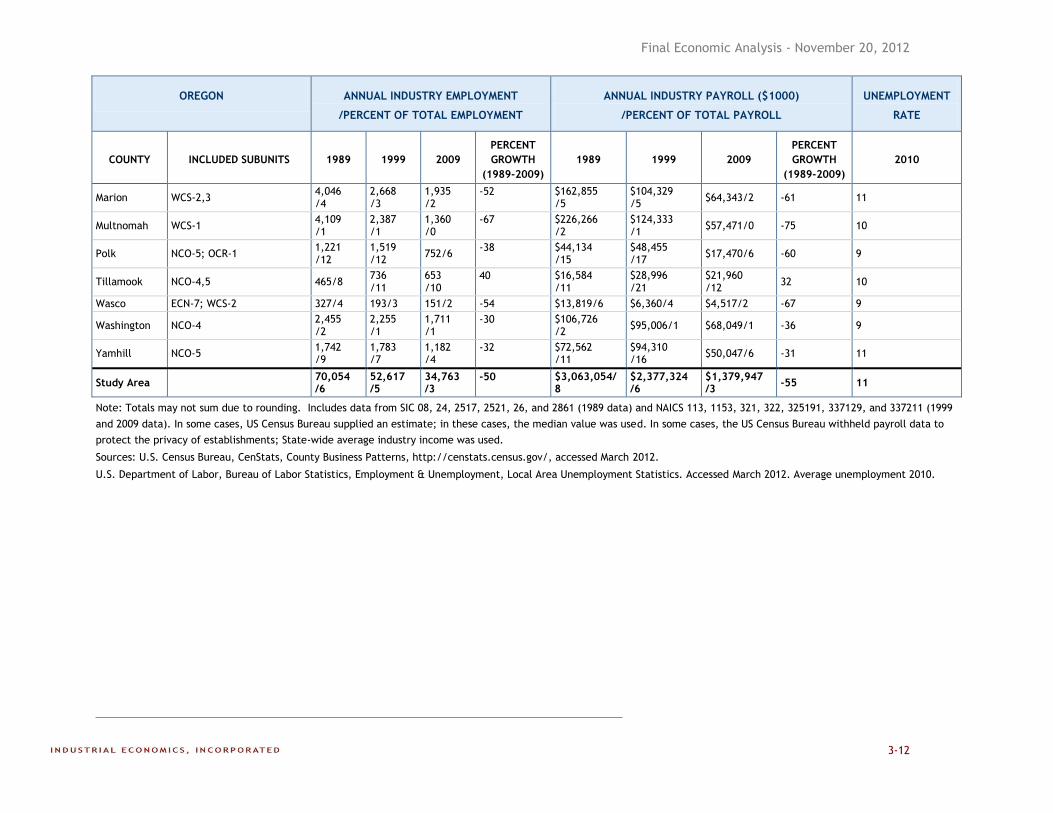
Final Economic Analysis - November 20, 2012
3-12
OREGON ANNUAL INDUSTRY EMPLOYMENT
/PERCENT OF TOTAL EMPLOYMENT
ANNUAL INDUSTRY PAYROLL ($1000)
/PERCENT OF TOTAL PAYROLL
UNEMPLOYMENT
RATE
COUNTY INCLUDED SUBUNITS 1989 1999 2009
PERCENT
GROWTH
(1989-2009)
1989 1999 2009
PERCENT
GROWTH
(1989-2009)
2010
Marion WCS-2,3 4,046 /4
2,668 /3
1,935 /2
-52 $162,855 /5
$104,329 /5
$64,343/2 -61 11
Multnomah WCS-1 4,109 /1
2,387 /1
1,360 /0
-67 $226,266 /2
$124,333 /1
$57,471/0 -75 10
Polk NCO-5; OCR-1 1,221 /12
1,519 /12
752/6 -38 $44,134
/15 $48,455 /17
$17,470/6 -60 9
Tillamook NCO-4,5 465/8 736 /11
653 /10
40 $16,584 /11
$28,996 /21
$21,960 /12
32 10
Wasco ECN-7; WCS-2 327/4 193/3 151/2 -54 $13,819/6 $6,360/4 $4,517/2 -67 9
Washington NCO-4 2,455 /2
2,255 /1
1,711 /1
-30 $106,726 /2
$95,006/1 $68,049/1 -36 9
Yamhill NCO-5 1,742 /9
1,783 /7
1,182 /4
-32 $72,562 /11
$94,310 /16
$50,047/6 -31 11
Study Area 70,054 /6
52,617 /5
34,763 /3
-50 $3,063,054/8
$2,377,324 /6
$1,379,947 /3
-55 11
Note: Totals may not sum due to rounding. Includes data from SIC 08, 24, 2517, 2521, 26, and 2861 (1989 data) and NAICS 113, 1153, 321, 322, 325191, 337129, and 337211 (1999
and 2009 data). In some cases, US Census Bureau supplied an estimate; in these cases, the median value was used. In some cases, the US Census Bureau withheld payroll data to
protect the privacy of establishments; State-wide average industry income was used.
Sources: U.S. Census Bureau, CenStats, County Business Patterns, http://censtats.census.gov/, accessed March 2012.
U.S. Department of Labor, Bureau of Labor Statistics, Employment & Unemployment, Local Area Unemployment Statistics. Accessed March 2012. Average unemployment 2010.
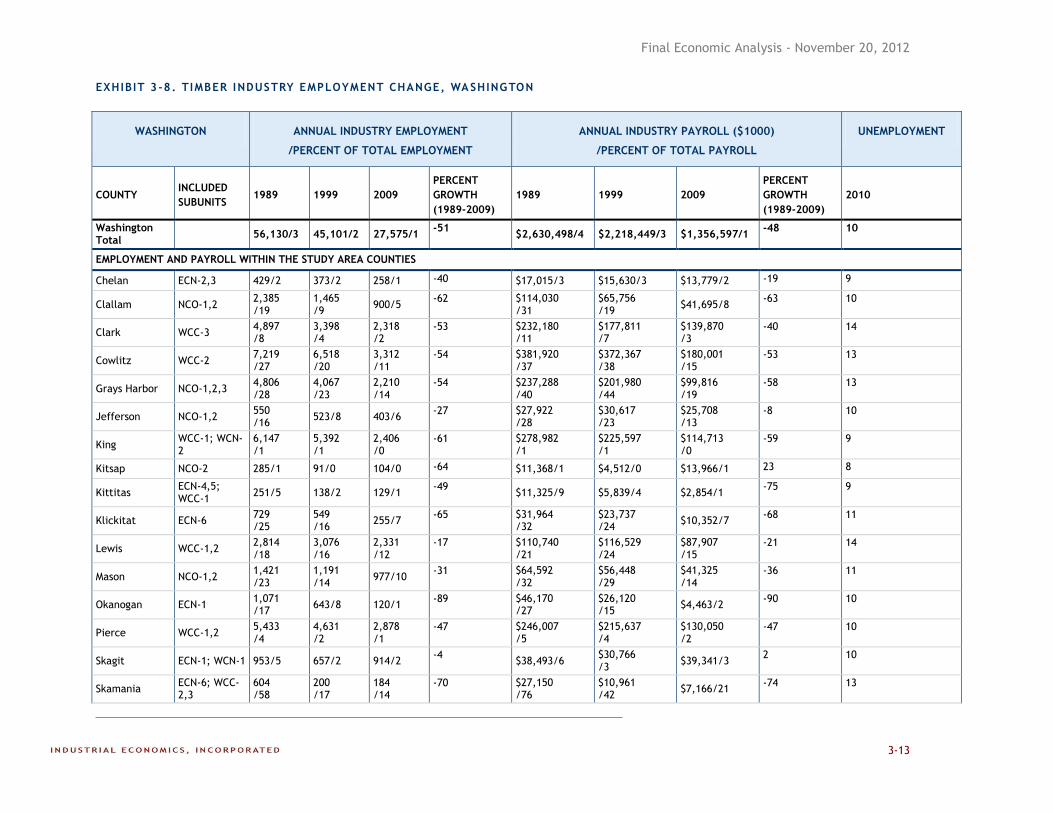
Final Economic Analysis - November 20, 2012
3-13
EXHIBIT 3 -8. TIMBER INDUSTRY EMPLOYMENT CHANGE, WASHINGTON
WASHINGTON ANNUAL INDUSTRY EMPLOYMENT
/PERCENT OF TOTAL EMPLOYMENT
ANNUAL INDUSTRY PAYROLL ($1000)
/PERCENT OF TOTAL PAYROLL
UNEMPLOYMENT
COUNTY INCLUDED
SUBUNITS 1989 1999 2009
PERCENT
GROWTH
(1989-2009)
1989 1999 2009
PERCENT
GROWTH
(1989-2009)
2010
Washington Total
56,130/3 45,101/2 27,575/1 -51
$2,630,498/4 $2,218,449/3 $1,356,597/1 -48 10
EMPLOYMENT AND PAYROLL WITHIN THE STUDY AREA COUNTIES
Chelan ECN-2,3 429/2 373/2 258/1 -40 $17,015/3 $15,630/3 $13,779/2 -19 9
Clallam NCO-1,2 2,385 /19
1,465 /9
900/5 -62 $114,030
/31 $65,756 /19
$41,695/8 -63 10
Clark WCC-3 4,897 /8
3,398 /4
2,318 /2
-53 $232,180 /11
$177,811 /7
$139,870 /3
-40 14
Cowlitz WCC-2 7,219 /27
6,518 /20
3,312 /11
-54 $381,920 /37
$372,367 /38
$180,001 /15
-53 13
Grays Harbor NCO-1,2,3 4,806 /28
4,067 /23
2,210 /14
-54 $237,288 /40
$201,980 /44
$99,816 /19
-58 13
Jefferson NCO-1,2 550 /16
523/8 403/6 -27 $27,922
/28 $30,617 /23
$25,708 /13
-8 10
King WCC-1; WCN-2
6,147 /1
5,392 /1
2,406 /0
-61 $278,982 /1
$225,597 /1
$114,713 /0
-59 9
Kitsap NCO-2 285/1 91/0 104/0 -64 $11,368/1 $4,512/0 $13,966/1 23 8
Kittitas ECN-4,5; WCC-1
251/5 138/2 129/1 -49
$11,325/9 $5,839/4 $2,854/1 -75 9
Klickitat ECN-6 729 /25
549 /16
255/7 -65 $31,964
/32 $23,737 /24
$10,352/7 -68 11
Lewis WCC-1,2 2,814 /18
3,076 /16
2,331 /12
-17 $110,740 /21
$116,529 /24
$87,907 /15
-21 14
Mason NCO-1,2 1,421 /23
1,191 /14
977/10 -31 $64,592
/32 $56,448 /29
$41,325 /14
-36 11
Okanogan ECN-1 1,071 /17
643/8 120/1 -89 $46,170
/27 $26,120 /15
$4,463/2 -90 10
Pierce WCC-1,2 5,433 /4
4,631 /2
2,878 /1
-47 $246,007 /5
$215,637 /4
$130,050 /2
-47 10
Skagit ECN-1; WCN-1 953/5 657/2 914/2 -4
$38,493/6 $30,766 /3
$39,341/3 2 10
Skamania ECN-6; WCC-2,3
604 /58
200 /17
184 /14
-70 $27,150 /76
$10,961 /42
$7,166/21 -74 13
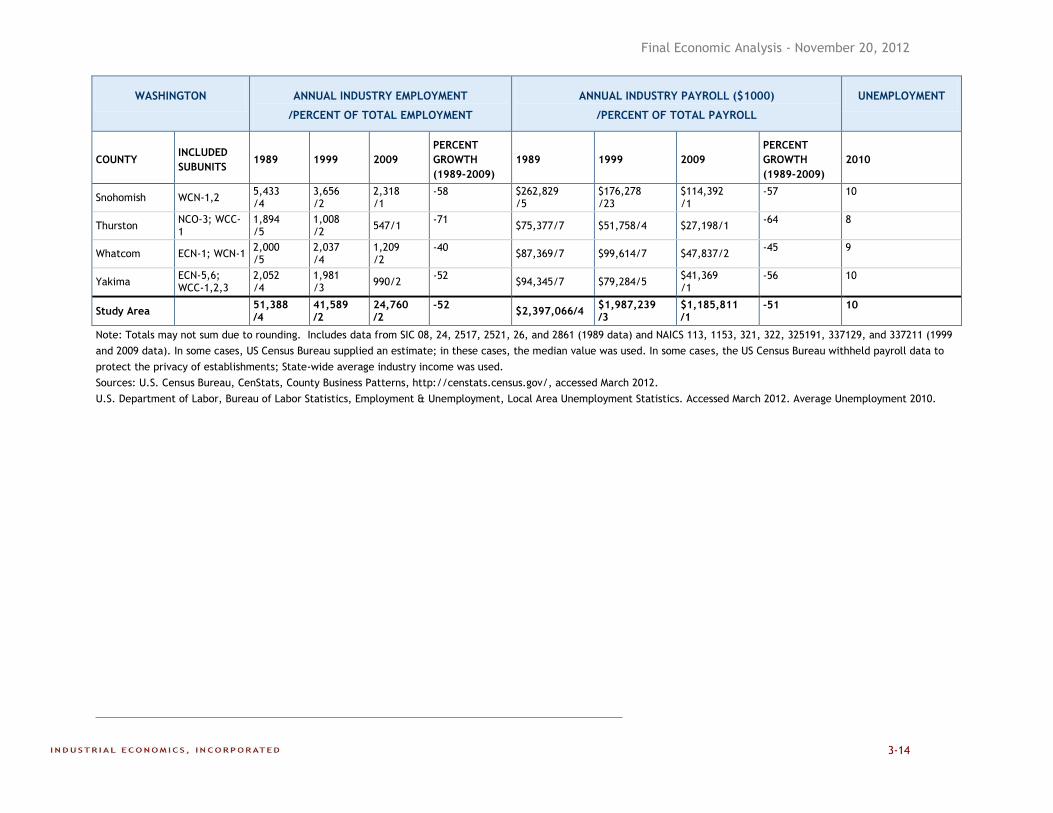
Final Economic Analysis - November 20, 2012
3-14
WASHINGTON ANNUAL INDUSTRY EMPLOYMENT
/PERCENT OF TOTAL EMPLOYMENT
ANNUAL INDUSTRY PAYROLL ($1000)
/PERCENT OF TOTAL PAYROLL
UNEMPLOYMENT
COUNTY INCLUDED
SUBUNITS 1989 1999 2009
PERCENT
GROWTH
(1989-2009)
1989 1999 2009
PERCENT
GROWTH
(1989-2009)
2010
Snohomish WCN-1,2 5,433 /4
3,656 /2
2,318 /1
-58 $262,829 /5
$176,278 /23
$114,392 /1
-57 10
Thurston NCO-3; WCC-1
1,894 /5
1,008 /2
547/1 -71
$75,377/7 $51,758/4 $27,198/1 -64 8
Whatcom ECN-1; WCN-1 2,000 /5
2,037 /4
1,209 /2
-40 $87,369/7 $99,614/7 $47,837/2
-45 9
Yakima ECN-5,6; WCC-1,2,3
2,052 /4
1,981 /3
990/2 -52
$94,345/7 $79,284/5 $41,369 /1
-56 10
Study Area 51,388 /4
41,589 /2
24,760 /2
-52 $2,397,066/4
$1,987,239 /3
$1,185,811 /1
-51 10
Note: Totals may not sum due to rounding. Includes data from SIC 08, 24, 2517, 2521, 26, and 2861 (1989 data) and NAICS 113, 1153, 321, 322, 325191, 337129, and 337211 (1999
and 2009 data). In some cases, US Census Bureau supplied an estimate; in these cases, the median value was used. In some cases, the US Census Bureau withheld payroll data to
protect the privacy of establishments; State-wide average industry income was used.
Sources: U.S. Census Bureau, CenStats, County Business Patterns, http://censtats.census.gov/, accessed March 2012.
U.S. Department of Labor, Bureau of Labor Statistics, Employment & Unemployment, Local Area Unemployment Statistics. Accessed March 2012. Average Unemployment 2010.
Final Economic Analysis - November 20, 2012
3-15
117. In 2009, jobs in the timber industry accounted for more than 10 percent of total
employment in the following counties in the study area: Tehama and Trinity Counties,
CA; Clatsop, Douglas, Jefferson, Klamath, and Tillamook Counties, OR; and Cowlitz,
Grays Harbor, Lewis, and Skamania Counties, WA.86
118. Between 1989 and 2009, total timber industry payroll in the study area fell by $3.5 billion
(approximately 55 percent).87
Timber industry payroll as a share of the total payroll also
fell within the study area counties, decreasing from six percent in 1989 to two percent in
2009. The greatest decrease in timber industry annual payroll within the study area was
in Oregon, where annual timber industry payroll fell by $1.7 billion in the counties within
the study area (approximately 62 percent) between 1989 and 2009. In these counties, the
timber industry’s share of the total payroll decreased from eight to three percent.
119. The greatest decreases in industry payroll on the county level took place in Del Norte,
Humboldt, Marin, Mendocino, and Trinity Counties, CA, and Okanogan County, WA.
Total payroll grew over this period in Napa County, CA, Clatsop, Lincoln, and Tillamook
Counties, OR, and Kitsap and Skagit Counties, WA. The timber industry’s share of the
total payroll increased in Clatsop, Lincoln, and Tillamook Counties, OR.
120. In general, the decrease in employment in the timber industry has had a greater impact on
nonmetropolitan counties because they are less economically diverse and more strongly
tied to the wood products industry. A report on NWFP monitoring initiatives revealed
that forest products manufacturing employment accounts for roughly ten percent of total
employment in nonmetropolitan counties and only one percent in metropolitan counties.88
121. Many communities have adapted to changes in the timber industry by diversifying their
economies to include more services-oriented industries—a shift that has been made
throughout the country. In addition, the region has been successful in attracting
businesses, commuters, and amenity-seekers.89
Overall the population of the
communities in the NWFP study area increased by 21 percent between 1990 and 2000,
higher than the nation as a whole, which grew by 13 percent.90
122. More recently, unemployment rates have risen nationwide due to the economic downturn,
making it difficult to isolate the socioeconomic effects of changes in the timber industry.
86 Timber industry data is taken from the North American Industry Classification System (NAICS) codes 113 “Forestry and
Logging,” 321 “Wood Product Manufacturing,” and 322 “Paper Manufacturing,” 1153 “Support Activities for Forestry,”
325191 “Gum and Wood Chemical Manufacturing,” 337129 “Wood Television, Radio, and Sewing Machine Cabinet
Manufacturing,” and 337211 “Wood Office Furniture Manufacturing.”
87 Data from Data from U.S. Census Bureau, CenStats, County Business Patterns, http://censtats.census.gov/, accessed March
2012.
88 Davis, Ray; Falxa, Gary; Grinspoon, Elisabeth; Harris, Gary; Lanigan, Steven; Moeur, Melinda; Mohoric, Shawne. 2011.
Northwest Forest Plan- The First 15 Years (1994-2008) : Summary of Key Monitoring Findings. Tech. Paper R6-RPM-TP-03-
2011. Portland, OR: U.S. Department of Agriculture, Forest Service, Pacific Northwest Region.
89 Routman, K. 2007. Forest Communities and the Northwest Forest Plan: What Socioeconomic Monitoring Can Tell Us.
Science Findings (95). Pacific Northwest Research Station, USDA Forest Service.
90 Routman, K. 2007. Forest Communities and the Northwest Forest Plan: What Socioeconomic Monitoring Can Tell Us.
Science Findings (95). Pacific Northwest Research Station, USDA Forest Service.
Final Economic Analysis - November 20, 2012
3-16
Exhibits 3-6 through 3-8 provide information on the unemployment rates in the counties
containing critical habitat in 2010. This information provides context for the timber
industry employment effects described in the Exhibits.
Additional Background Information on Historical and Current Socioeconomic Conditions
In response to the Service’s Notice of Availability (NOA) of the May 29, 2012 draft of this report and request for public comment, the Sierra Institute for Community and Environment and Spatial Informatics Group provided additional, potentially-relevant data. Funding for the effort was provided by the National Forest Counties and Schools Coalition.
Their report includes detailed discussion and data concerning a variety of socioeconomic characteristics for communities potentially affected by the designation, including: number of mills and mill closures; employment patterns; revenue sharing payments to counties; family income; poverty levels; home ownership; health outcomes and factors; and enrollment in programs such as School Free and Reduced-price Meals (FRPM). The authors include retrospective data beginning in 1990, generally documenting adverse changes in many of these factors over a twenty-year period. The report does not forecast future socioeconomic conditions or make predictions about potential changes in these factors if critical habitat is designated.
We note that the authors state, “The limited time associated with the review period did not allow direct evaluation of the connection between land management restrictions and NSO management to specific job losses and decline in natural resource and timber industry sectors.” (page 168) It also notes, “Other reasons for mill closure also include, but are not limited to, industry closing older, less efficient mills, closure of mills that handled only larger trees coupled with less old-growth timber available, and shipping raw logs and cants out of the region for processing elsewhere.” (page 31) The authors conclude “A linkage appears to exist, but additional research is needed to determine the strength of this relationship. (page 168).
The report is included in the administrative record for this rulemaking and is available for review by the Secretary as he weighs the benefits of exclusion against the benefits of including specific areas in the final designation.
Citation: Sierra Institute for Community and Environment and Spatial Informatics Group, Response to the Economic Analysis of Critical Habitat Designation for the Northern Spotted Owl by Industrial Economics: In Response to the 2012 Critical Habitat Designation of the Spotted Owl, August
2012.
Final Economic Analysis - November 20, 2012
3-17
3.2 FORCES DRIVING TIMBER INDUSTRY TRENDS
123. Multiple forces have contributed to the recent changes in the Pacific Northwest timber
industry. In general, the timber industry is characterized as being highly competitive;
there is a relatively low degree of concentration of production among the largest
producers and there is essentially a single national price for commodity grades of
lumber.91
In recent decades, competition has intensified with increased harvesting in the
U.S. South and interior Canadian Provinces.92,93
New technologies and increased
mechanization have led to mill closures; generally, less efficient mills located near
Federal forests have been closed in favor of larger more advanced facilities closer to
major transportation corridors or private timberlands.94,95
In addition, other forces such as
endangered species protections, fluctuations in domestic consumption, shifts in
international trade, and changes in timberland ownership, have contributed to changes in
the Pacific Northwest timber industry.
3.2.1 FLUCTUATIONS IN DEMAND
124. The demand for timber is driven by demand for the final products into which wood is a
material input. End uses for harvested wood have evolved over the years, moving from
solid wood outputs to composite products such as particleboard and paper.96
In addition,
increasing wood-use efficiency, use of recycled fiber, and product substitutes have
contributed to a reduction in timber demand.97
In recent years, demand for softwood
lumber and structural panels has been increasingly unstable due to the downturn in
housing construction.98
91 Haynes, Richard. 2008. Emergency Lessons from a Century of Experience with Pacific Northwest Timber Markets. United
States Department of Agriculture, Forest Service, Pacific Northwest Research Station. General Technical Report: PNW-GTR-
747. April 2008. Accessed at http://www.fs.fed.us/pnw/pubs/pnw_gtr747.pdf on April 9, 2012.
92 Ibid.
93 The U.S. South now accounts for the largest regional share of U.S. timber harvest, and is expected to continue to be the
largest timber-producing region of the country, accounting for half or more of total harvests (Ince, Peter, Andrew Kramp,
Kenneth Skog, Henry Spelter, and David N. Wear. 2011. U.S. Forest Products Module: A Technical Document Supporting the
Forest Service 2010 RPA Assessment. Research Paper FPL-RP-662. Madison WI: U.S. Department of Agriculture, Forest
Service, Forest Products Laboratory.)
94 Routman, K. 2007. Forest Communities and the Northwest Forest Plan: What Socioeconomic Monitoring Can Tell Us.
Science Findings (95). Pacific Northwest Research Station, USDA Forest Service.
95 Haynes, Richard. 2009. "Contribution of Old-Growth Timber to Regional Economies in the Pacific Northwest." Old Growth in
a New World: A Pacific Northwest Icon Reexamined. Eds. Thomas A. Spies and Sally L. Duncan. Washington, DC: Island,
2009. 83-94.
96 Prestemon, Jeffrey and Robert Abt. “Chapter 13: Timber Products Supply and Demand.” Southern forest resource
assessment. Wear, David, and John Greis, eds. 2002. Asheville, NC: U.S. Department of Agriculture, Forest Service,
Southern Research Station.
97 Ibid.
98 Ince, Peter, Andrew Kramp, Kenneth Skog, Henry Spelter, and David N. Wear. 2011. U.S. Forest Products Module: A
Technical Document Supporting the Forest Service 2010 RPA Assessment. Research Paper FPL-RP-662. Madison WI: U.S.
Department of Agriculture, Forest Service, Forest Products Laboratory.
Final Economic Analysis - November 20, 2012
3-18
125. Since the mid-1990s, stumpage prices have been stable or declining, causing landowners
to move towards forest management regimes that favor shorter rotations and threatening
commitments to sustainable forest management practices.99
3.2.2 EXPORT MARKETS
126. Over the past two decades, timber exports have fluctuated significantly. Prior to 1990,
the Pacific Northwest was the dominant supplier of building materials to the Pacific Rim,
particularly Japan, South Korea, and China. However, during the 1990s exports fell
dramatically as the Japanese and South Korean economies collapsed. For example,
exports to Japan declined about 70 percent from their 1989 peak of 2.4 billion board feet
to 706,000 board feet in 2000.100
In recent years, exporters have seen a sharp increase in
demand from China; total timber exports from the U.S. to China more than doubled
between 2009 and 2010 and more than tripled between 2010 and 2011.101
3.2.3 CHANGES IN OWNERSHIP
127. As of 2009, the ownership of U.S. timberland (by acres) comprises individuals (54
percent), government (28 percent), forest product firms (13 percent) and institutions (five
percent).102
Recent years have seen increased institutional ownership and decreased
forest product company ownership, driven in part by the increasing significance of
timberland in real estate portfolios.103
The increasing institutional investor role played by
timberland investment management organizations (TIMOs) and timberland real estate
investment trusts (REITs) has influenced demand for certain end uses of timber (driven
by market trends), and is likely to continue to grow as an influential force in the timber
market in the future.104
Industry representatives note that an important effect of
increasing institutional management of timberlands is that management decisions, such as
when to harvest given market conditions and regulatory uncertainty, are made
considering a larger portfolio of lands located across the country or continents.
3.2.4 INCREASED MECHANIZATION AND PRODUCTIV ITY
128. The reductions in timber harvests since the early 1990s and increasing economic
incentives for private landowners to grow smaller, more uniform trees have led to a
99 Haynes, Richard. 2009. "Contribution of Old-Growth Timber to Regional Economies in the Pacific Northwest." Old Growth in
a New World: A Pacific Northwest Icon Reexamined. Eds. Thomas A. Spies and Sally L. Duncan. Washington, DC: Island,
2009. 83-94.
100 Daniels, Jean. 2005. The Rise and Fall of the Pacific Northwest Log Export Market. U.S. Department of Agriculture, Forest
Service, Pacific Northwest Research Station. PNW-GTR-624. Available at http://www.fs.fed.us/pnw/pubs/pnw_gtr624.pdf.
101 United States International Trade Commission. 2012. Interactive Tariff and Trade DataWeb. Accessed at
dataweb.usitc.gov on March 19, 2012.
102 Newell, Graeme, and Chris Eves. “The Role of U.S. Timberland in Real Estate Portfolios.” Journal of Real Estate Portfolio
Management 15.1(2009).
103 Ibid.
104 Ibid.
Final Economic Analysis - November 20, 2012
3-19
number of mill closures.105
In particular, mills located near Federal forests that were once
dependent on the larger (and older) log mixes have been closed in favor of more
advanced facilities closer to major transportation corridors or private timberlands, that
can efficiently process smaller logs.106,107,108
According to a 2011 report by the Federal
Forest Resource Coalition, a total of 347 mills closed between 1990 and 2010 in
California, Oregon and Washington, 145 of which were located in Oregon.109
There are
currently few mills capable of efficiently processing logs larger than 24 inches in
diameter; as of 2009, much of the production in the Pacific Northwest was in highly
efficient mills that produce commodity lumber from 14- to 20-inch logs primarily for the
domestic market and using timber from private timberlands.110
In addition, increasing
industry productivity (a combination of worker productivity and mill productivity) means
that mills do not require the amount of labor that they have in the past.111,112
3.3 BACKGROUND ON FEDERA L LAND PAYMENT PROGRAMS
129. Four main Federal land payment programs compensate county governments for the tax-
exempt status of Federal lands within their boundaries. The payments, which have
undergone significant reforms over the past century, have at times constituted significant
portions of county and school budgets.113
Only two of the programs, however, are
permanently authorized and have dedicated funding sources; the other two are either set
to expire or require an appropriation:
105 Haynes, Richard. 2009. "Contribution of Old-Growth Timber to Regional Economies in the Pacific Northwest." Old Growth
in a New World: A Pacific Northwest Icon Reexamined. Eds. Thomas A. Spies and Sally L. Duncan. Washington, DC: Island,
2009. 83-94.
106 Routman, K. 2007. Forest Communities and the Northwest Forest Plan: What Socioeconomic Monitoring Can Tell Us.
Science Findings (95). Pacific Northwest Research Station, USDA Forest Service.
107 Haynes, Richard. 2008. “Emergent Lessons from a Century of Experience with Pacific Northwest Timber Markets.” U.S.
Department of Agriculture, Forest Service, Pacific Northwest Research Station. PNW-GTR-747. Accessed at
http://www.fs.fed.us/pnw/pubs/pnw_gtr747.pdf.
108 Haynes, Richard. 2009. "Contribution of Old-Growth Timber to Regional Economies in the Pacific Northwest." Old Growth
in a New World: A Pacific Northwest Icon Reexamined. Eds. Thomas A. Spies and Sally L. Duncan. Washington, DC: Island,
2009. 83-94.
109 Federal Forest Resource Coalition. 2011. “Is Federal Timber Still in Demand?” Accessed at
http://www.foresthealth.org/pdf/Federal%20Timber%20Demand%20Feb%202011.pdf on April 10, 2012.
110 Haynes, Richard. 2009. "Contribution of Old-Growth Timber to Regional Economies in the Pacific Northwest." Old Growth
in a New World: A Pacific Northwest Icon Reexamined. Eds. Thomas A. Spies and Sally L. Duncan. Washington, DC: Island,
2009. 83-94.
111 Oregon Office of Economic Analysis. 2012. Wood Products Productivity. January 26, 2012. Oregon Office of Economic
Analysis: A Blog of Oregon Economic News and Analysis. Accessed at
http://oregoneconomicanalysis.wordpress.com/2012/01/26/wood-products-productivity-an-update/ on April 10, 2012.
112 Headwaters Economics. 2010. The Siskiyou Region: Demographic, Economic, and Fiscal Fundamentals. Accessed at
http://headwaterseconomics.org/land/reports/the-siskiyou-region/ on April 10, 2012.
113 Headwaters Economics. December 2010. “County Payments, Jobs, and Forest Health: Ideas for Reforming the Secure Rural
Schools and Community Self-Determination Act (SRS) and Payments in Lieu of Taxes (PILT).” White Paper. Accessed at
http://headwaterseconomics.org/wphw/wp-content/uploads/Reform_County_Payments_WhitePaper_LowRes.pdf.
Final Economic Analysis - November 20, 2012
3-20
U.S. Forest Service (USFS) 25% Fund: The USFS 25% Fund is a permanently
authorized revenue sharing program wherein 25 percent of commodity receipts
generated on USFS lands, mainly from timber, goes to counties as compensation
for non-taxable Federal lands.114,115
Federal legislation mandates that payments
fund county roads and schools, but leaves decisions about how to allocates the
funds across counties to the States.116
Since 2008, the Fund has based annual
revenue sharing payments on a seven-year rolling average of receipts, rather than
on the current year’s receipts.
Bureau of Land Management Oregon and California Land Grant (O&C) Revenue
Sharing Payment: BLM oversees a revenue sharing program for counties
containing O&C lands that is similar to the USFS 25% Fund. Counties receive 50
percent of commercial receipts generated on O&C lands (based on the previous
year’s receipts), and payments are made directly to the county government,
which can use them for any governmental purpose.117
This program is
permanently authorized.118
Secure Rural Schools and Community Self-Determination Act (SRS): Congress
passed SRS in 2000 to provide optional assistance to States and counties whose
payments from the USFS 25% Fund and BLM O&C Revenue Sharing Program
had declined significantly. States and counties may choose to receive SRS
payments instead of revenue sharing payments under the USFS 25% Fund and
the BLM O&C Revenue Sharing Program. The SRS payments are based on
historical revenue sharing payments under the pre-existing programs.
In 2008, when SRS was reauthorized for fiscal years 2008-2011, Congress made
significant changes to the Title I funding formula. Certain States—including
California, Oregon, and Washington—received transition payments in 2008 that
were equal to 90 percent of those paid to States and counties under SRS in 2006.
This percentage decreased in 2009 and 2010, and in 2011 the States received a
“Formula Payment” based on a share of the full funding amount (the total
funding allocated on a nationwide basis for SRS).119
As a result, total SRS
payments have decreased from a high of $623 million in FY 2008 to a low of
114 Headwaters Economics. December 2010. “County Payments, Jobs, and Forest Health: Ideas for Reforming the Secure Rural
Schools and Community Self-Determination Act (SRS) and Payments in Lieu of Taxes (PILT).” White Paper. Accessed at
http://headwaterseconomics.org/wphw/wp-content/uploads/Reform_County_Payments_WhitePaper_LowRes.pdf.
115 This program began in 1906 with counties receiving 10 percent of commodity receipts. In 1908 the portion of receipts was
raised to the current 25 percent.
116 16 USC § 500
117 43 USC § 1181f
118 Personal communication with Bureau of Land Management, Oregon & Washington State Office, on April 9, 2012.
119 For more information on the Formula Payments, see U.S. Forest Service, Title I- Secure Payments for States and Counties
Containing Federal Land, http://www.fs.usda.gov/Internet/FSE_DOCUMENTS/stelprdb5253425.pdf (Accessed 4/5/2012)

Final Economic Analysis - November 20, 2012
3-21
$347 million in 2011.120
On March 14, 2012, the Senate voted to pass an
amendment to extend SRS through FY 2012, but the House of Representatives
has yet to act on a reauthorization. If the Act is not reauthorized, payments under
this program will no longer be available to States and counties.
Payments in Lieu of Taxes (PILT): PILT are Federal payments to county
governments that help offset losses in property taxes due to nontaxable Federal
lands within their boundaries.121
PILT was passed in 1976 in large part to
increase and stabilize the USFS 25% Fund and the BLM O&C Revenue Sharing
Program; the formula used to calculate payments is based on the amount of
eligible Federally-owned land within a county and then reduced by the amount of
revenue sharing payments from the previous year (including optional payments
under SRS). Payments are subject to a population cap. Although it is
permanently authorized, payments for PILT must be appropriated by Congress on
a recurring basis. The program must receive a new appropriation for fiscal year
2013, so its future is currently uncertain.122
130. Exhibit 3-9 illustrates the historical level of payments to counties from the four programs.
Since 2000, with the implementation of the SRS and continuation of PILT payments,
county funding has not been closely linked to actual revenues from timber sales on
Federal lands. However, in the future, if funding is not appropriated to PILT, and/or SRS
is not reauthorized, payments from USFS 25% Fund and the BLM O&C lands—which
are tied to timber receipts from Federal lands—become relatively more important.
131. Exhibit 3-10 illustrates the dependency of counties on all forms of Federal land payments
in 2009.123
Federal land payments made up between 14 and 25 percent of total county
and school budgets in Curry and Douglas Counties, OR and between 26 and 50 percent of
the budgets in Skamania County, WA.124
120 http://www.fs.usda.gov/Internet/FSE_DOCUMENTS/stelprdb5352831.pdf; http://www.blm.gov/or/news/files/official-
2011-payments.pdf
121 31 USC § 69
122 Headwaters Economics. December 2010. “County Payments, Jobs, and Forest Health: Ideas for Reforming the Secure Rural
Schools and Community Self-Determination Act (SRS) and Payments in Lieu of Taxes (PILT).” White Paper. Accessed at
http://headwaterseconomics.org/wphw/wp-content/uploads/Reform_County_Payments_WhitePaper_LowRes.pdf.
123 Presumably most counties in the study area opt to receive SRS payments.
124 Headwaters Economics. December 2010. “County Payments, Jobs, and Forest Health: Ideas for Reforming the Secure Rural
Schools and Community Self-Determination Act (SRS) and Payments in Lieu of Taxes (PILT).” White Paper. Accessed at
http://headwaterseconomics.org/wphw/wp-content/uploads/Reform_County_Payments_WhitePaper_LowRes.pdf.
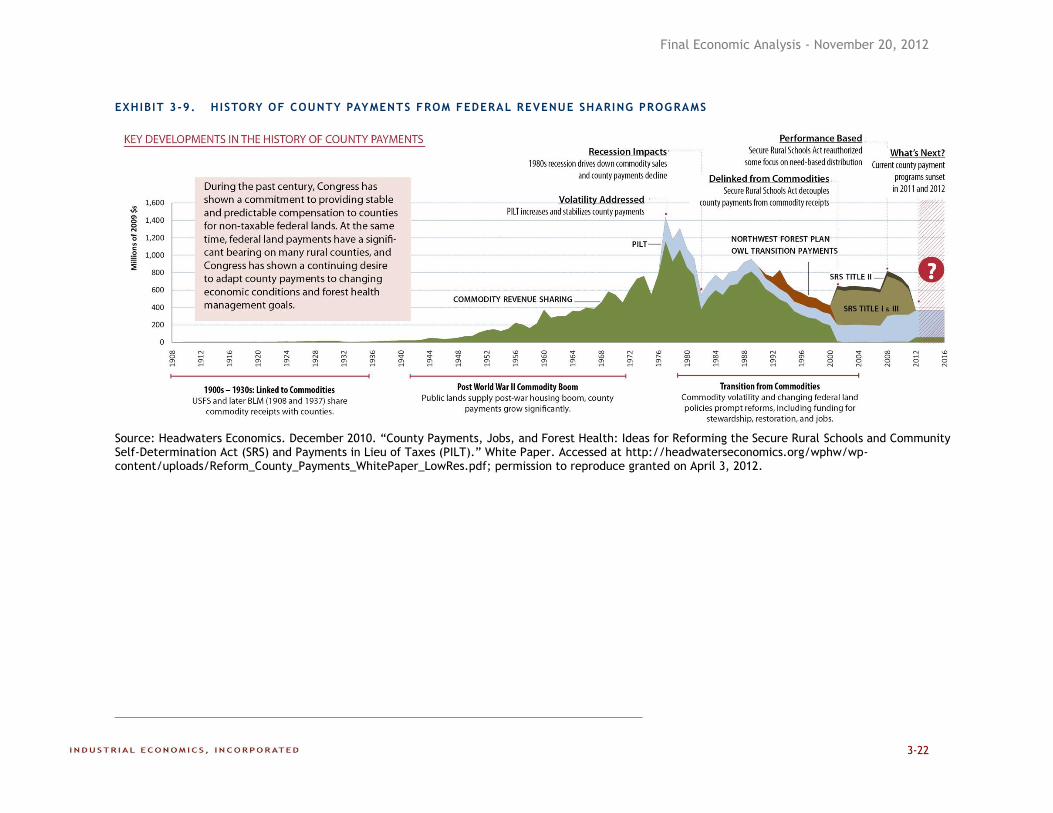
Final Economic Analysis - November 20, 2012
3-22
EXHIBIT 3-9. HISTORY OF COUNTY PAYMENTS FROM FEDERAL REVENUE SHARING PROG RAMS
Source: Headwaters Economics. December 2010. “County Payments, Jobs, and Forest Health: Ideas for Reforming the Secure Rural Schools and Community Self-Determination Act (SRS) and Payments in Lieu of Taxes (PILT).” White Paper. Accessed at http://headwaterseconomics.org/wphw/wp-content/uploads/Reform_County_Payments_WhitePaper_LowRes.pdf; permission to reproduce granted on April 3, 2012.
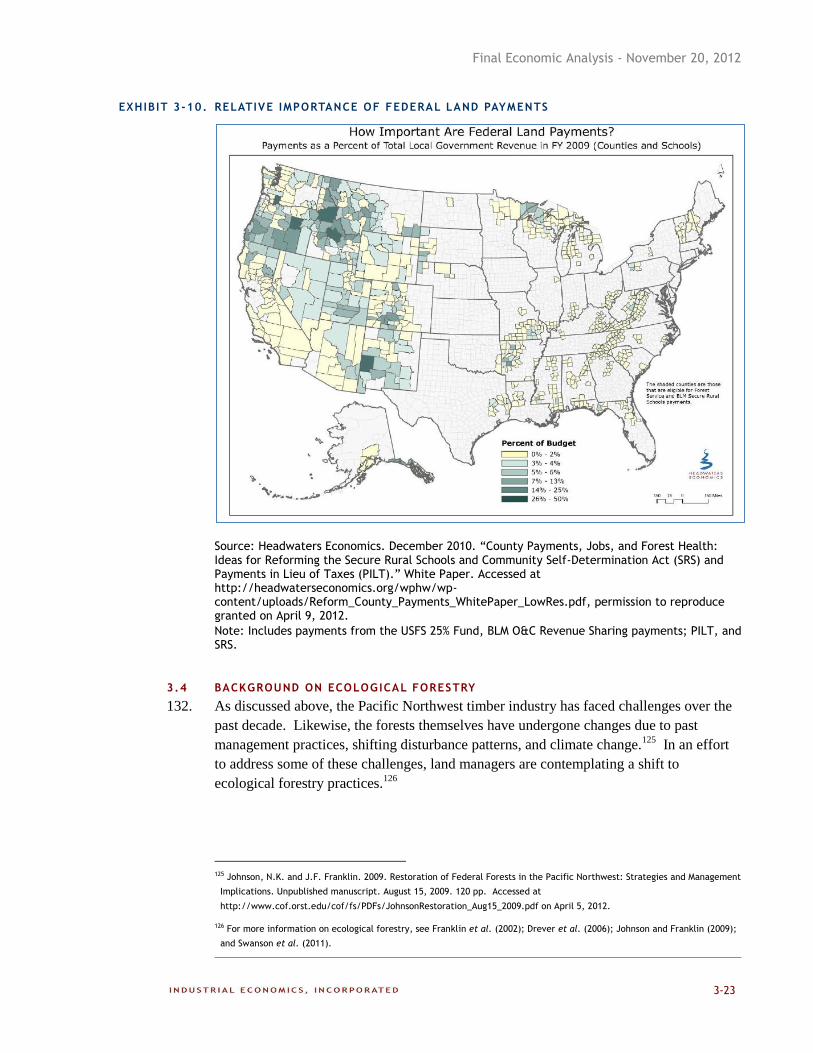
Final Economic Analysis - November 20, 2012
3-23
EXHIBIT 3-10. RELATIVE IMPORTANCE OF FEDERAL LAND PAYMENTS
Source: Headwaters Economics. December 2010. “County Payments, Jobs, and Forest Health: Ideas for Reforming the Secure Rural Schools and Community Self-Determination Act (SRS) and Payments in Lieu of Taxes (PILT).” White Paper. Accessed at http://headwaterseconomics.org/wphw/wp-content/uploads/Reform_County_Payments_WhitePaper_LowRes.pdf, permission to reproduce granted on April 9, 2012.
Note: Includes payments from the USFS 25% Fund, BLM O&C Revenue Sharing payments; PILT, and SRS.
3.4 BACKGROUND ON ECOLOG ICAL FORESTRY
132. As discussed above, the Pacific Northwest timber industry has faced challenges over the
past decade. Likewise, the forests themselves have undergone changes due to past
management practices, shifting disturbance patterns, and climate change.125
In an effort
to address some of these challenges, land managers are contemplating a shift to
ecological forestry practices.126
125 Johnson, N.K. and J.F. Franklin. 2009. Restoration of Federal Forests in the Pacific Northwest: Strategies and Management
Implications. Unpublished manuscript. August 15, 2009. 120 pp. Accessed at
http://www.cof.orst.edu/cof/fs/PDFs/JohnsonRestoration_Aug15_2009.pdf on April 5, 2012.
126 For more information on ecological forestry, see Franklin et al. (2002); Drever et al. (2006); Johnson and Franklin (2009);
and Swanson et al. (2011).
Final Economic Analysis - November 20, 2012
3-24
133. The main goal of ecological forestry-based management is to achieve ecological goals
while simultaneously providing economic and social benefits.127
In general, the approach
follows the principles of natural forest stand development; it values the role of natural
disturbances in initiating, developing, and maintaining forest ecosystems, and encourages
active restoration of spatial heterogeneity and conservation of older stands and trees.128
In addition, it recognizes that desirable ecological conditions are maintained through a
program of active management that includes periodic timber harvest.129
134. The Proposed Rule states that, “In general, actions that promote ecological restoration
and those that apply ecological forestry principles as described in the Revised Recovery
Plan (USFWS 2011, pp. III–11 to III–41)…are likely to be consistent with the
conservation of the northern spotted owl and the management of its critical habitat.”130,131
It recommends that land managers consider managing NSO critical habitat according to
the following basic management practices, which are consistent with ecological forestry
and recommended in the Revised Recovery Plan:
Conserve the older growth, high quality and occupied forest habitat as necessary
to meet recovery goals;
Implement science-based active vegetation management to restore forest health,
especially in drier forests in the eastern and southern portions of the species’
range;
Encourage landscape-level planning and vegetation management that allow
historical ecological processes, such as characteristic fire regimes and natural
forest succession, to occur on these landscapes throughout the range of the NSO.
This approach has the best chance of resulting in forests that are resilient to future
changes that may arise due to climate change.132
135. Ideally, implementation of ecological forestry would allow Federal land managers to
increase the overall amount of timber harvested from Federal lands while simultaneously
improving habitat for the NSO and other listed species. Exactly how these practices
would be implemented by the land management agencies is currently uncertain. Various
pilot projects on BLM lands are ongoing to test alternatives and learn more about the
127 Johnson, N.K. and J.F. Franklin. 2009. Restoration of Federal Forests in the Pacific Northwest: Strategies and Management
Implications. Unpublished manuscript. August 15, 2009. 120 pp. Accessed at
http://www.cof.orst.edu/cof/fs/PDFs/JohnsonRestoration_Aug15_2009.pdf on April 5, 2012.
128 Ibid.
129 Ibid.
130 2012 Proposed Critical Habitat Rule, 77 FR 14062
131 U.S. Fish and Wildlife Service. 2011. Revised Recovery Plan for the Northern Spotted Owl (Strix occidentalis caurina). U.S.
Fish and Wildlife Service, Portland, Oregon. Xvi + 258 pp. Accessed at
http://www.fws.gov/arcata/es/birds/NSO/documents/USFWS2011RevisedRecoveryPlanNorthernSpottedOwl.pdf on April 5,
2012.
132 2012 Proposed Critical Habitat Rule, 77 FR 14062
Final Economic Analysis - November 20, 2012
3-25
challenges and opportunities associated with ecological forestry practices.133
In addition,
the land managing agencies must make decisions consistent with their land use
management plans, forestry programs, and other statutory and regulatory
responsibilities.134
Thus, capturing the interface between ecological forestry and critical
habitat concerns, and assessing related economic impacts, is an uncertain exercise.
133 Johnson, N.K. and J.F. Franklin. 2012. Southwest Oregon Secretarial Pilot Projects on BLM Lands: Our Experience So Far
and Broader Considerations for Long-term Plans. Pilot Report. February 15, 2012. Accessed at
http://www.blm.gov/or/news/files/pilot-report-feb2012.pdf on April 6, 2012.
134 Personal communication with U.S. Fish and Wildlife Service on April 6, 2012.
Final Economic Analysis - November 20, 2012
4-1
CHAPTER 4 | TIMBER IMPACTS - FEDERAL LANDS
136. This chapter provides a detailed breakdown of the proposed revised critical habitat
designation within Federal lands and outlines the methodology for assessing economic
impacts potentially associated with the designation. The majority of any economic
impacts on Federal lands would be expected to result from potential changes in timber
harvest. Therefore, the analysis focuses on identifying where potential changes to timber
harvest may occur, and then estimating which critical habitat subunits may experience the
highest relative magnitude of impacts.
Specifically, we undertake the following steps to estimate impacts:
Step 1 – First, we identify the Federal lands proposed for designation and the
relevant land managers.
Step 2 – Next, based on the best available data, we discern discrete geographic
areas within the proposed critical habitat designation that may experience
incremental impacts as a result of the proposed rule.
Step 3 – Once we have distinguished areas that may experience incremental
impacts, we evaluate the distribution of these areas across proposed critical
habitat subunits.
Step 4 – Finally, we endeavor to quantify the relative magnitude of impacts across
proposed critical habitat subunits using projected timber harvests based on data
from BLM and USFS.
137. Overall, incremental impacts on most Federal lands are unlikely due to the conservation
objectives and protections already in place for the NSO. Specifically, of approximately
12.0 million acres of proposed Federal lands, we find that approximately 1.4 million acres
are more likely to experience incremental impacts to timber harvest relative to other lands
as a result of critical habitat designation for the NSO. Identifying the nature and scope of
potential changes within these 1.4 million acres is challenging. Federal agencies are
legally obligated to avoid the destruction or adverse modification of critical habitat in
implementing timber management practices; however, the means by which they choose to
do so is uncertain.
138. To provide an illustrative bound of this uncertainty, the analysis contemplates three
scenarios under Step 4, including:
Scenario 1 – Administrative Costs Only. If minimal or no changes to current
management practices are adopted by the action agencies as a result of critical
habitat, the incremental impacts of the designation would be predominantly
administrative.
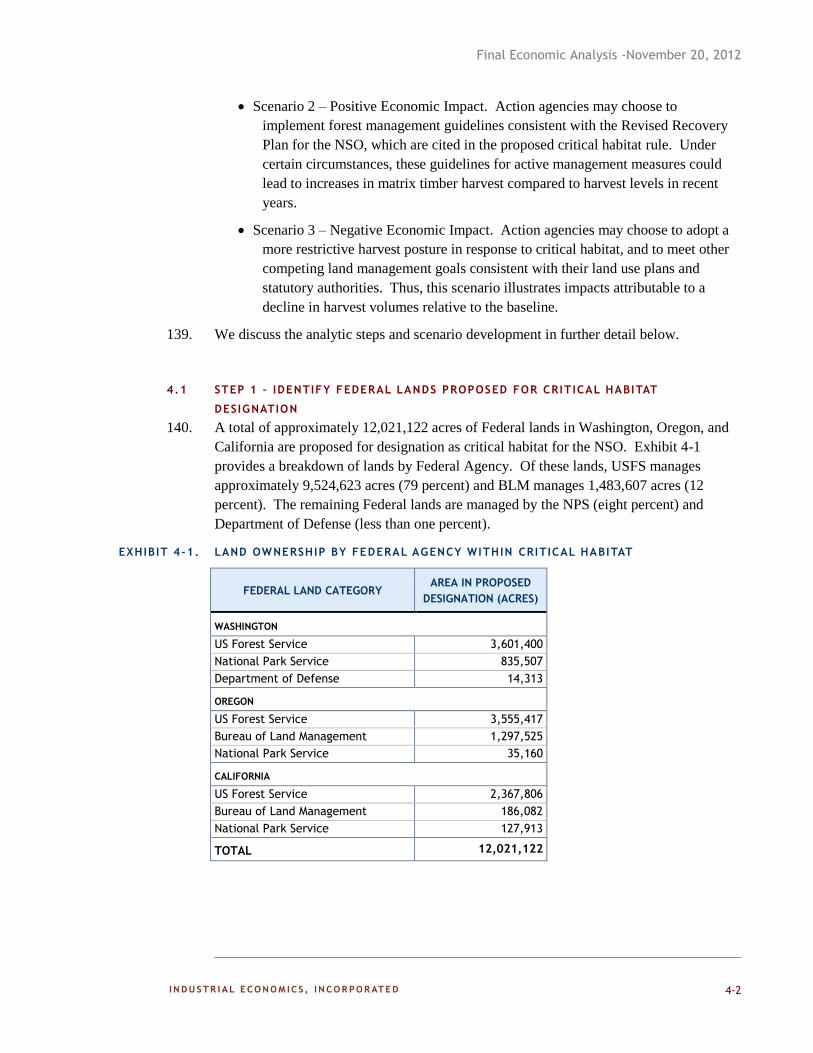
Final Economic Analysis -November 20, 2012
4-2
Scenario 2 – Positive Economic Impact. Action agencies may choose to
implement forest management guidelines consistent with the Revised Recovery
Plan for the NSO, which are cited in the proposed critical habitat rule. Under
certain circumstances, these guidelines for active management measures could
lead to increases in matrix timber harvest compared to harvest levels in recent
years.
Scenario 3 – Negative Economic Impact. Action agencies may choose to adopt a
more restrictive harvest posture in response to critical habitat, and to meet other
competing land management goals consistent with their land use plans and
statutory authorities. Thus, this scenario illustrates impacts attributable to a
decline in harvest volumes relative to the baseline.
139. We discuss the analytic steps and scenario development in further detail below.
4.1 STEP 1 – IDENTIFY FEDERAL LANDS PROPOSED FOR CRIT ICAL HABITAT
DESIGNATION
140. A total of approximately 12,021,122 acres of Federal lands in Washington, Oregon, and
California are proposed for designation as critical habitat for the NSO. Exhibit 4-1
provides a breakdown of lands by Federal Agency. Of these lands, USFS manages
approximately 9,524,623 acres (79 percent) and BLM manages 1,483,607 acres (12
percent). The remaining Federal lands are managed by the NPS (eight percent) and
Department of Defense (less than one percent).
EXHIBIT 4-1. LAND OWNERSHIP BY FEDERAL AGENCY WITHIN CRITICAL HABITAT
FEDERAL LAND CATEGORY AREA IN PROPOSED
DESIGNATION (ACRES)
WASHINGTON
US Forest Service 3,601,400
National Park Service 835,507
Department of Defense 14,313
OREGON
US Forest Service 3,555,417
Bureau of Land Management 1,297,525
National Park Service 35,160
CALIFORNIA
US Forest Service 2,367,806
Bureau of Land Management 186,082
National Park Service 127,913
TOTAL 12,021,122
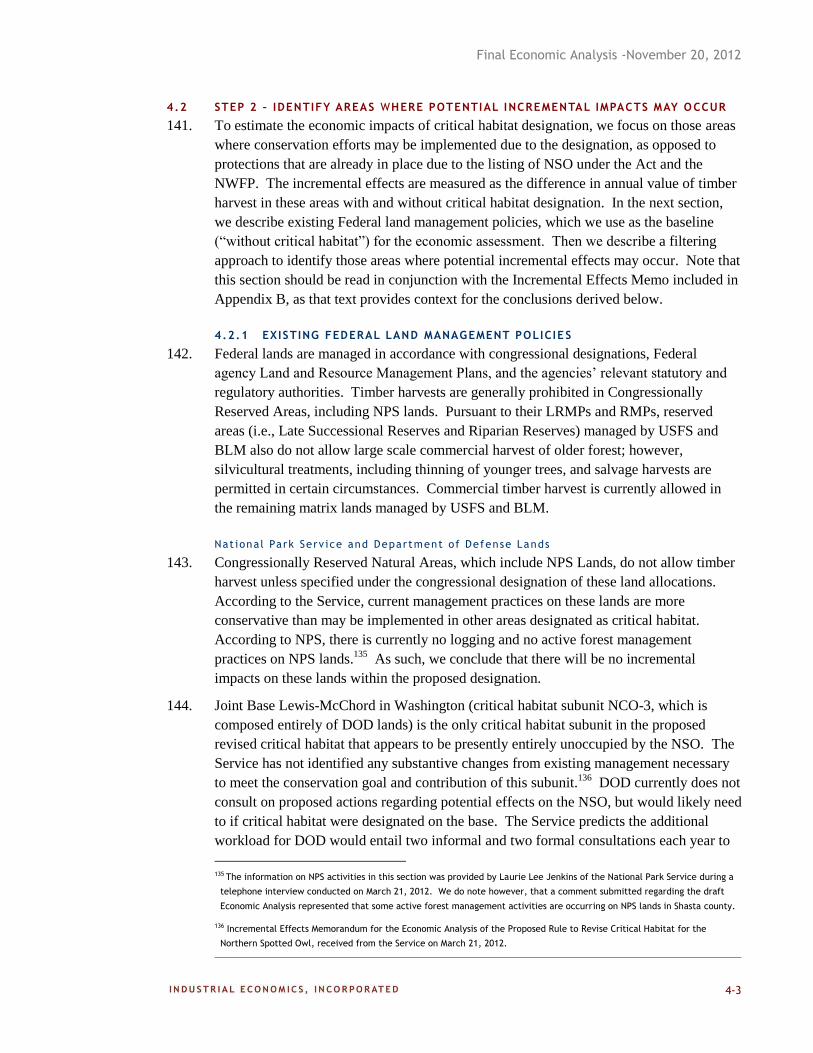
Final Economic Analysis -November 20, 2012
4-3
4.2 STEP 2 – IDENTIFY AREAS WHERE POTENTIAL INCREMENTAL IMPACTS MAY O CCUR
141. To estimate the economic impacts of critical habitat designation, we focus on those areas
where conservation efforts may be implemented due to the designation, as opposed to
protections that are already in place due to the listing of NSO under the Act and the
NWFP. The incremental effects are measured as the difference in annual value of timber
harvest in these areas with and without critical habitat designation. In the next section,
we describe existing Federal land management policies, which we use as the baseline
(“without critical habitat”) for the economic assessment. Then we describe a filtering
approach to identify those areas where potential incremental effects may occur. Note that
this section should be read in conjunction with the Incremental Effects Memo included in
Appendix B, as that text provides context for the conclusions derived below.
4.2.1 EXISTING FEDERAL LAND MANAGEMENT POLICIES
142. Federal lands are managed in accordance with congressional designations, Federal
agency Land and Resource Management Plans, and the agencies’ relevant statutory and
regulatory authorities. Timber harvests are generally prohibited in Congressionally
Reserved Areas, including NPS lands. Pursuant to their LRMPs and RMPs, reserved
areas (i.e., Late Successional Reserves and Riparian Reserves) managed by USFS and
BLM also do not allow large scale commercial harvest of older forest; however,
silvicultural treatments, including thinning of younger trees, and salvage harvests are
permitted in certain circumstances. Commercial timber harvest is currently allowed in
the remaining matrix lands managed by USFS and BLM.
Nat ional Park Serv ice and Department of Defense Lands
143. Congressionally Reserved Natural Areas, which include NPS Lands, do not allow timber
harvest unless specified under the congressional designation of these land allocations.
According to the Service, current management practices on these lands are more
conservative than may be implemented in other areas designated as critical habitat.
According to NPS, there is currently no logging and no active forest management
practices on NPS lands.135
As such, we conclude that there will be no incremental
impacts on these lands within the proposed designation.
144. Joint Base Lewis-McChord in Washington (critical habitat subunit NCO-3, which is
composed entirely of DOD lands) is the only critical habitat subunit in the proposed
revised critical habitat that appears to be presently entirely unoccupied by the NSO. The
Service has not identified any substantive changes from existing management necessary
to meet the conservation goal and contribution of this subunit.136
DOD currently does not
consult on proposed actions regarding potential effects on the NSO, but would likely need
to if critical habitat were designated on the base. The Service predicts the additional
workload for DOD would entail two informal and two formal consultations each year to
135 The information on NPS activities in this section was provided by Laurie Lee Jenkins of the National Park Service during a
telephone interview conducted on March 21, 2012. We do note however, that a comment submitted regarding the draft
Economic Analysis represented that some active forest management activities are occurring on NPS lands in Shasta county.
136 Incremental Effects Memorandum for the Economic Analysis of the Proposed Rule to Revise Critical Habitat for the
Northern Spotted Owl, received from the Service on March 21, 2012.
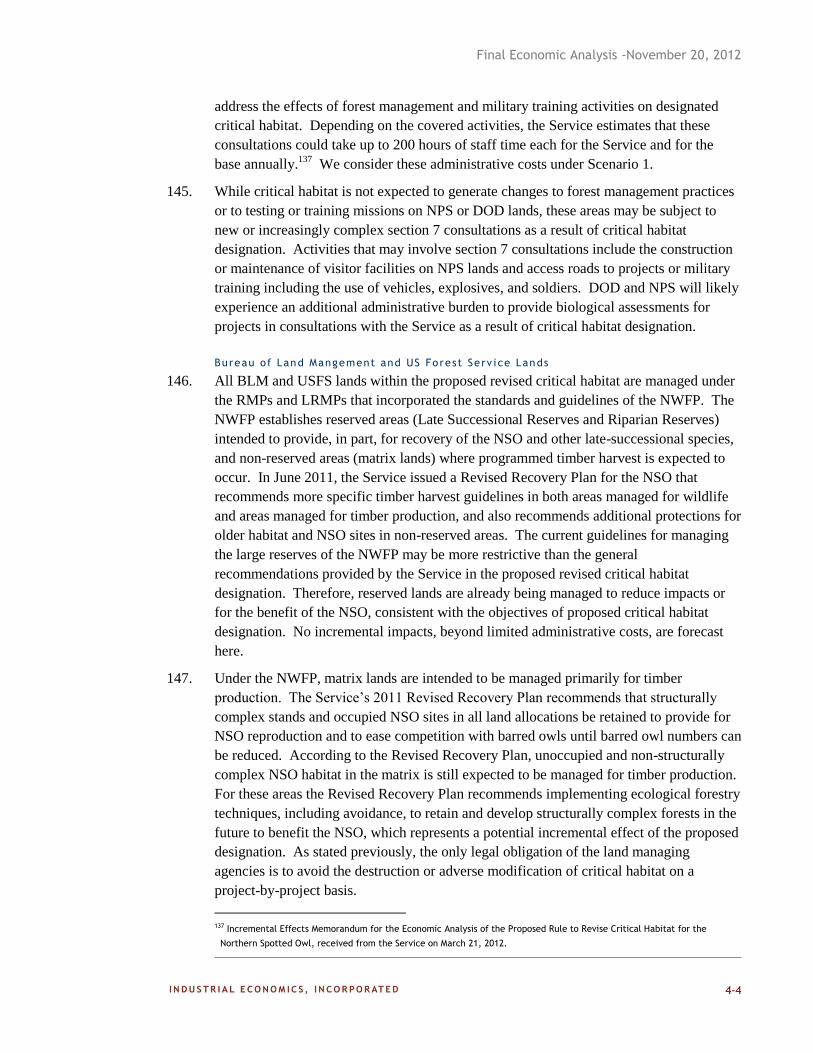
Final Economic Analysis -November 20, 2012
4-4
address the effects of forest management and military training activities on designated
critical habitat. Depending on the covered activities, the Service estimates that these
consultations could take up to 200 hours of staff time each for the Service and for the
base annually.137
We consider these administrative costs under Scenario 1.
145. While critical habitat is not expected to generate changes to forest management practices
or to testing or training missions on NPS or DOD lands, these areas may be subject to
new or increasingly complex section 7 consultations as a result of critical habitat
designation. Activities that may involve section 7 consultations include the construction
or maintenance of visitor facilities on NPS lands and access roads to projects or military
training including the use of vehicles, explosives, and soldiers. DOD and NPS will likely
experience an additional administrative burden to provide biological assessments for
projects in consultations with the Service as a result of critical habitat designation.
Bureau of Land Mangement and US Fo rest Serv i ce Lands
146. All BLM and USFS lands within the proposed revised critical habitat are managed under
the RMPs and LRMPs that incorporated the standards and guidelines of the NWFP. The
NWFP establishes reserved areas (Late Successional Reserves and Riparian Reserves)
intended to provide, in part, for recovery of the NSO and other late-successional species,
and non-reserved areas (matrix lands) where programmed timber harvest is expected to
occur. In June 2011, the Service issued a Revised Recovery Plan for the NSO that
recommends more specific timber harvest guidelines in both areas managed for wildlife
and areas managed for timber production, and also recommends additional protections for
older habitat and NSO sites in non-reserved areas. The current guidelines for managing
the large reserves of the NWFP may be more restrictive than the general
recommendations provided by the Service in the proposed revised critical habitat
designation. Therefore, reserved lands are already being managed to reduce impacts or
for the benefit of the NSO, consistent with the objectives of proposed critical habitat
designation. No incremental impacts, beyond limited administrative costs, are forecast
here.
147. Under the NWFP, matrix lands are intended to be managed primarily for timber
production. The Service’s 2011 Revised Recovery Plan recommends that structurally
complex stands and occupied NSO sites in all land allocations be retained to provide for
NSO reproduction and to ease competition with barred owls until barred owl numbers can
be reduced. According to the Revised Recovery Plan, unoccupied and non-structurally
complex NSO habitat in the matrix is still expected to be managed for timber production.
For these areas the Revised Recovery Plan recommends implementing ecological forestry
techniques, including avoidance, to retain and develop structurally complex forests in the
future to benefit the NSO, which represents a potential incremental effect of the proposed
designation. As stated previously, the only legal obligation of the land managing
agencies is to avoid the destruction or adverse modification of critical habitat on a
project-by-project basis.
137 Incremental Effects Memorandum for the Economic Analysis of the Proposed Rule to Revise Critical Habitat for the
Northern Spotted Owl, received from the Service on March 21, 2012.
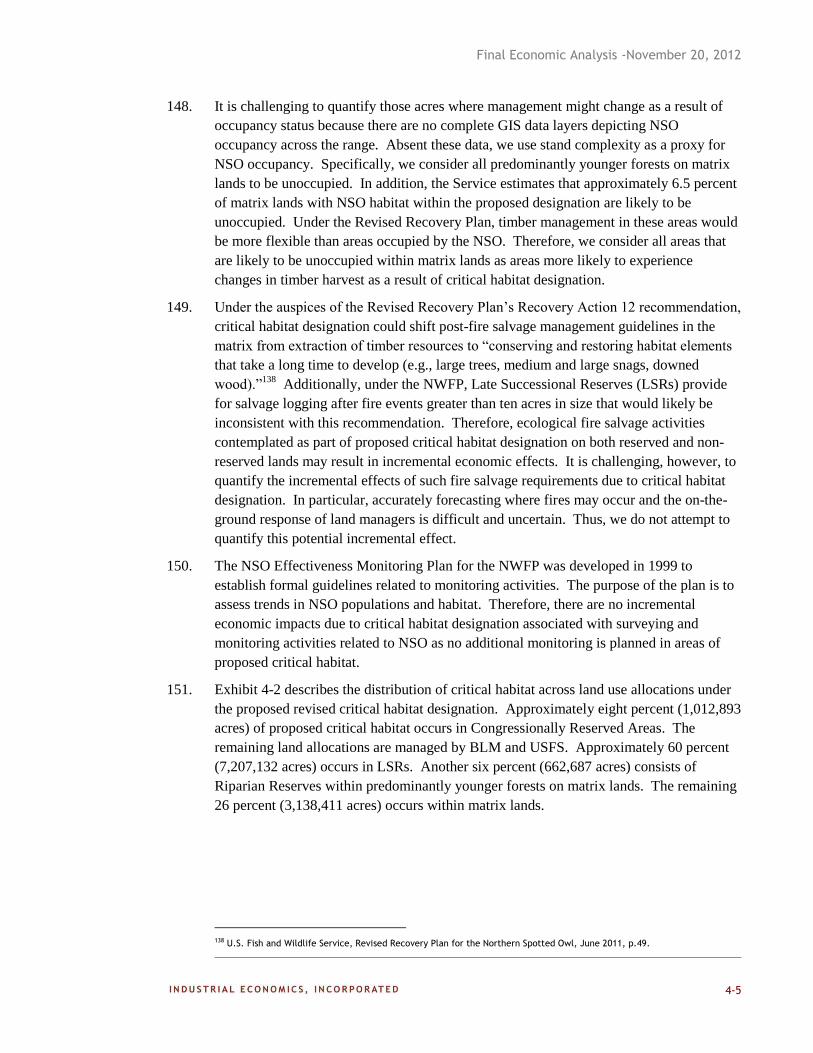
Final Economic Analysis -November 20, 2012
4-5
148. It is challenging to quantify those acres where management might change as a result of
occupancy status because there are no complete GIS data layers depicting NSO
occupancy across the range. Absent these data, we use stand complexity as a proxy for
NSO occupancy. Specifically, we consider all predominantly younger forests on matrix
lands to be unoccupied. In addition, the Service estimates that approximately 6.5 percent
of matrix lands with NSO habitat within the proposed designation are likely to be
unoccupied. Under the Revised Recovery Plan, timber management in these areas would
be more flexible than areas occupied by the NSO. Therefore, we consider all areas that
are likely to be unoccupied within matrix lands as areas more likely to experience
changes in timber harvest as a result of critical habitat designation.
149. Under the auspices of the Revised Recovery Plan’s Recovery Action 12 recommendation,
critical habitat designation could shift post-fire salvage management guidelines in the
matrix from extraction of timber resources to “conserving and restoring habitat elements
that take a long time to develop (e.g., large trees, medium and large snags, downed
wood).”138
Additionally, under the NWFP, Late Successional Reserves (LSRs) provide
for salvage logging after fire events greater than ten acres in size that would likely be
inconsistent with this recommendation. Therefore, ecological fire salvage activities
contemplated as part of proposed critical habitat designation on both reserved and non-
reserved lands may result in incremental economic effects. It is challenging, however, to
quantify the incremental effects of such fire salvage requirements due to critical habitat
designation. In particular, accurately forecasting where fires may occur and the on-the-
ground response of land managers is difficult and uncertain. Thus, we do not attempt to
quantify this potential incremental effect.
150. The NSO Effectiveness Monitoring Plan for the NWFP was developed in 1999 to
establish formal guidelines related to monitoring activities. The purpose of the plan is to
assess trends in NSO populations and habitat. Therefore, there are no incremental
economic impacts due to critical habitat designation associated with surveying and
monitoring activities related to NSO as no additional monitoring is planned in areas of
proposed critical habitat.
151. Exhibit 4-2 describes the distribution of critical habitat across land use allocations under
the proposed revised critical habitat designation. Approximately eight percent (1,012,893
acres) of proposed critical habitat occurs in Congressionally Reserved Areas. The
remaining land allocations are managed by BLM and USFS. Approximately 60 percent
(7,207,132 acres) occurs in LSRs. Another six percent (662,687 acres) consists of
Riparian Reserves within predominantly younger forests on matrix lands. The remaining
26 percent (3,138,411 acres) occurs within matrix lands.
138 U.S. Fish and Wildlife Service, Revised Recovery Plan for the Northern Spotted Owl, June 2011, p.49.
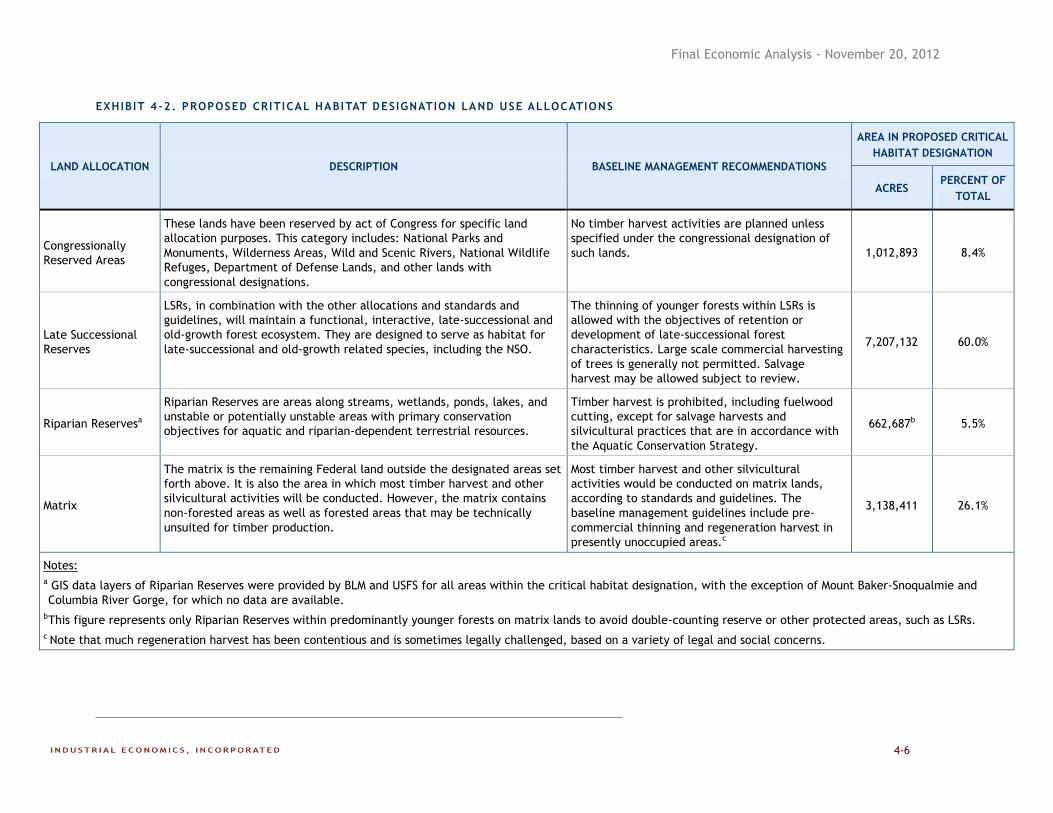
Final Economic Analysis - November 20, 2012
4-6
EXHIBIT 4 -2. PROPOSED CRITICAL HABITAT DESIGNATION LAND USE ALLOCATIONS
LAND ALLOCATION DESCRIPTION BASELINE MANAGEMENT RECOMMENDATIONS
AREA IN PROPOSED CRITICAL
HABITAT DESIGNATION
ACRES PERCENT OF
TOTAL
Congressionally
Reserved Areas
These lands have been reserved by act of Congress for specific land
allocation purposes. This category includes: National Parks and
Monuments, Wilderness Areas, Wild and Scenic Rivers, National Wildlife
Refuges, Department of Defense Lands, and other lands with
congressional designations.
No timber harvest activities are planned unless
specified under the congressional designation of
such lands. 1,012,893 8.4%
Late Successional
Reserves
LSRs, in combination with the other allocations and standards and
guidelines, will maintain a functional, interactive, late-successional and
old-growth forest ecosystem. They are designed to serve as habitat for
late-successional and old-growth related species, including the NSO.
The thinning of younger forests within LSRs is
allowed with the objectives of retention or
development of late-successional forest
characteristics. Large scale commercial harvesting
of trees is generally not permitted. Salvage
harvest may be allowed subject to review.
7,207,132 60.0%
Riparian Reservesa
Riparian Reserves are areas along streams, wetlands, ponds, lakes, and
unstable or potentially unstable areas with primary conservation
objectives for aquatic and riparian-dependent terrestrial resources.
Timber harvest is prohibited, including fuelwood
cutting, except for salvage harvests and
silvicultural practices that are in accordance with
the Aquatic Conservation Strategy.
662,687b 5.5%
Matrix
The matrix is the remaining Federal land outside the designated areas set
forth above. It is also the area in which most timber harvest and other
silvicultural activities will be conducted. However, the matrix contains
non-forested areas as well as forested areas that may be technically
unsuited for timber production.
Most timber harvest and other silvicultural
activities would be conducted on matrix lands,
according to standards and guidelines. The
baseline management guidelines include pre-
commercial thinning and regeneration harvest in
presently unoccupied areas.c
3,138,411 26.1%
Notes:
a GIS data layers of Riparian Reserves were provided by BLM and USFS for all areas within the critical habitat designation, with the exception of Mount Baker-Snoqualmie and
Columbia River Gorge, for which no data are available.
b This figure represents only Riparian Reserves within predominantly younger forests on matrix lands to avoid double-counting reserve or other protected areas, such as LSRs.
c Note that much regeneration harvest has been contentious and is sometimes legally challenged, based on a variety of legal and social concerns.
Final Economic Analysis - November 20, 2012
4-7
4.2.2 FILTERING APPROACH
152. This analysis identifies areas where potential incremental impacts may occur and
quantifies the estimated changes in timber harvest associated with critical habitat
designation. The analysis relies on a filtering approach that isolates areas that may be
subject to changes in timber harvest due to critical habitat designation. To isolate
potential incremental effects of the proposed designation, we identify areas where current
timber harvest practices may be different under proposed critical habitat objectives and
consider the total land acreage that may be affected.
153. As summarized above and described in detail in the attached Incremental Memorandum,
whether an area of critical habitat may engender incremental impacts on timber
management, including either increases or decreases in timber harvest, is a function of
three primary variables: land allocation (i.e., reserved versus non-reserved); habitat type,
and NSO occupancy or non-occupancy. We were able to identify detailed data and
spatial information concerning the first two variables. Regarding the third variable, it is
challenging to determine whether smaller discrete geographic areas are presently
occupied, as such data were not available for the purposes of this analysis. Absent these
data, we use stand complexity as a proxy for NSO occupancy.139
Therefore, we consider
all areas that are likely to be unoccupied as areas more likely to experience incremental
effects to timber harvest practices.
154. Exhibit 4-3 illustrates the filtering approach employed to identify areas where potential
incremental effects may occur. As shown in the exhibit, the first step in this approach is
to identify all Federal lands. Approximately 12,021,122 acres of Federal land are in the
proposed critical habitat designation.
155. The second step is to filter reserved Federal lands where the objectives of the allocation
are consistent with proposed critical habitat objectives. For the purposes of this analysis,
all Federal lands currently protected or managed under conservation objectives for the
benefit of the NSO are considered to be “reserved” lands. These include Congressionally
Reserved Areas, LSRs, and Riparian Reserves. Management guidelines for
Congressionally Reserved Areas are considered by the Service to be more conservative
than those that could be implemented under critical habitat. Furthermore, under the
NWFP, BLM and USFS timber harvest practices on LSRs are consistent with proposed
critical habitat objectives as these lands are currently being managed for the benefit of the
NSO and other species associated with old growth. The NWFP also restricts or limits
timber harvest on Riparian Reserves, consistent with proposed critical habitat objectives.
Therefore, reserved lands are not likely to experience any changes in proposed timber
management as a result of critical habitat designation. There are approximately
8,882,712 acres of Federal reserved lands.
139 We note that in the absence of information to the contrary, in the section 7 consultation process the land managing
agencies may rely on habitat characterization as a proxy for occupancy, assuming that structurally complex or other NSO
habitat, such as that suitable for foraging, is presently occupied. The Service estimates that 6.5 percent of NSO habitat is
not occupied.
Final Economic Analysis - November 20, 2012
4-8
156. The third step is to filter non-reserved Federal lands by habitat characterization and
occupancy status. As noted, we use habitat characterization, as defined by stand
complexity, as a proxy for occupancy. Thus, we filter areas of matrix lands with NSO
habitat that are likely to be occupied because of the section 7 requirement that Federal
agencies avoid jeopardizing the species. As stated, the Service estimates that
approximately 6.5 percent of matrix lands with NSO habitat are likely to be unoccupied,
while the remaining 93.5 percent are assumed to be occupied. Therefore, there are
approximately 1,748,624 acres of non-reserved Federal lands with NSO habitat that are
likely to be occupied.
157. The remaining lands within the critical habitat designation, approximately 1,389,787
acres or 11.6 percent of total Federal critical habitat acres, represent matrix lands likely to
be unoccupied by nesting or territorial NSO. These acreages represent the focus of our
assessment of potential impacts to timber harvest. For these remaining areas, project
modifications associated with critical habitat designation may affect timber management
practices. Additionally, these areas will be subject to ecological fire salvage requirements
and increased administrative burden of section 7 consultations.
158. The filtered lands (areas noted on the left side of Exhibit 4-3), are generally already
protected or managed consistent with the needs of the NSO due to the section 7
requirement to avoid jeopardy of the species. The Revised Recovery Plan recommends
that occupied NSO sites in all land allocations be retained for conservation objectives.
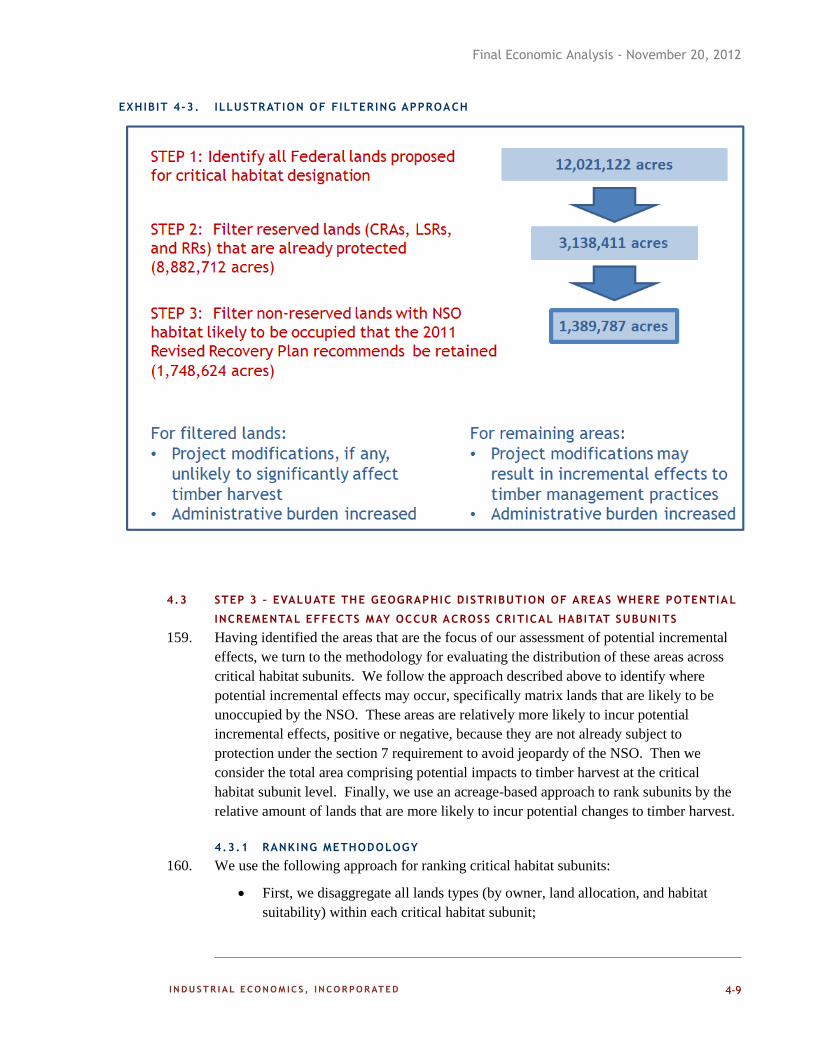
Final Economic Analysis - November 20, 2012
4-9
EXHIBIT 4-3. ILLUSTRATION OF FILTERING APPROACH
4.3 STEP 3 – EVALUATE THE GEOGRAPHIC DISTRIBUTION OF AREAS WHERE POTENTIA L
INCREMENTAL EFFECTS MAY OCCUR ACROSS CRI TICAL HABITAT SUBUNI TS
159. Having identified the areas that are the focus of our assessment of potential incremental
effects, we turn to the methodology for evaluating the distribution of these areas across
critical habitat subunits. We follow the approach described above to identify where
potential incremental effects may occur, specifically matrix lands that are likely to be
unoccupied by the NSO. These areas are relatively more likely to incur potential
incremental effects, positive or negative, because they are not already subject to
protection under the section 7 requirement to avoid jeopardy of the NSO. Then we
consider the total area comprising potential impacts to timber harvest at the critical
habitat subunit level. Finally, we use an acreage-based approach to rank subunits by the
relative amount of lands that are more likely to incur potential changes to timber harvest.
4.3.1 RANKING METHODOLOGY
160. We use the following approach for ranking critical habitat subunits:
First, we disaggregate all lands types (by owner, land allocation, and habitat
suitability) within each critical habitat subunit;
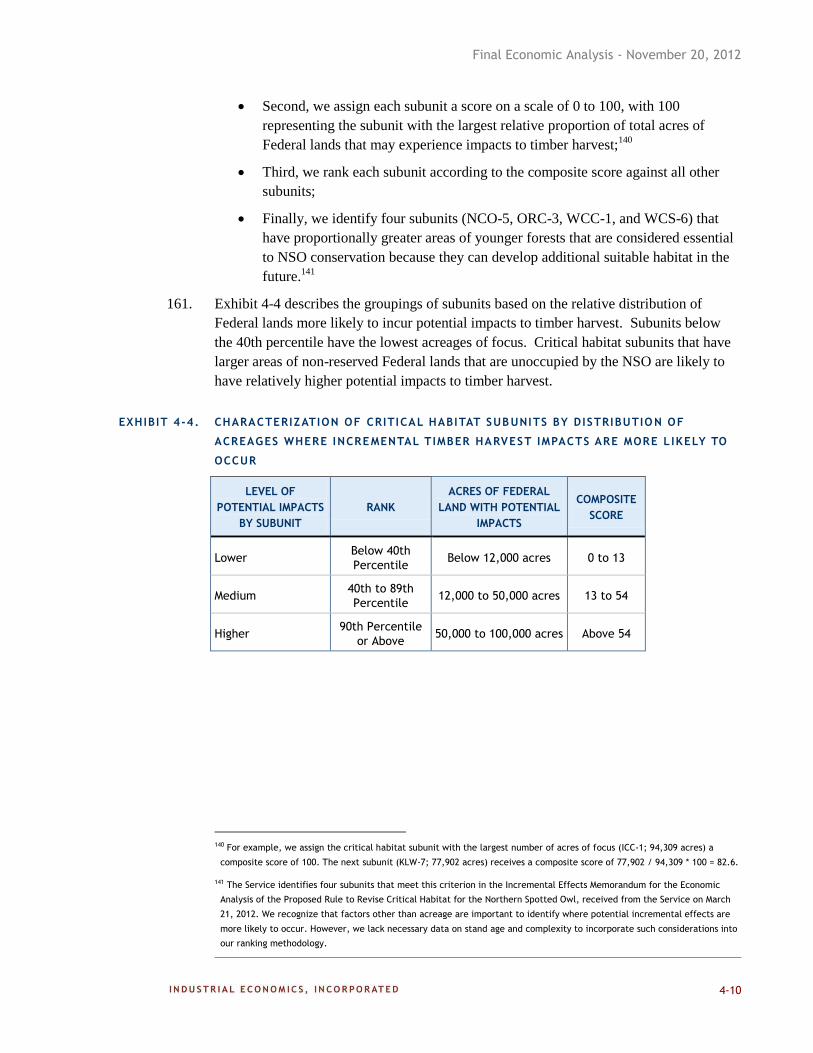
Final Economic Analysis - November 20, 2012
4-10
Second, we assign each subunit a score on a scale of 0 to 100, with 100
representing the subunit with the largest relative proportion of total acres of
Federal lands that may experience impacts to timber harvest;140
Third, we rank each subunit according to the composite score against all other
subunits;
Finally, we identify four subunits (NCO-5, ORC-3, WCC-1, and WCS-6) that
have proportionally greater areas of younger forests that are considered essential
to NSO conservation because they can develop additional suitable habitat in the
future.141
161. Exhibit 4-4 describes the groupings of subunits based on the relative distribution of
Federal lands more likely to incur potential impacts to timber harvest. Subunits below
the 40th percentile have the lowest acreages of focus. Critical habitat subunits that have
larger areas of non-reserved Federal lands that are unoccupied by the NSO are likely to
have relatively higher potential impacts to timber harvest.
EXHIBIT 4-4. CHARACTERIZATION OF CRITICAL HABITAT SUBUNITS BY DISTRIBUTIO N OF
ACREAGES WHERE INCREMENTAL TIMBER HARVEST IMPACTS ARE MORE L IKELY TO
OCCUR
LEVEL OF
POTENTIAL IMPACTS
BY SUBUNIT
RANK
ACRES OF FEDERAL
LAND WITH POTENTIAL
IMPACTS
COMPOSITE
SCORE
Lower Below 40th
Percentile Below 12,000 acres 0 to 13
Medium 40th to 89th
Percentile 12,000 to 50,000 acres 13 to 54
Higher 90th Percentile
or Above 50,000 to 100,000 acres Above 54
140 For example, we assign the critical habitat subunit with the largest number of acres of focus (ICC-1; 94,309 acres) a
composite score of 100. The next subunit (KLW-7; 77,902 acres) receives a composite score of 77,902 / 94,309 * 100 = 82.6.
141 The Service identifies four subunits that meet this criterion in the Incremental Effects Memorandum for the Economic
Analysis of the Proposed Rule to Revise Critical Habitat for the Northern Spotted Owl, received from the Service on March
21, 2012. We recognize that factors other than acreage are important to identify where potential incremental effects are
more likely to occur. However, we lack necessary data on stand age and complexity to incorporate such considerations into
our ranking methodology.
Final Economic Analysis - November 20, 2012
4-11
162. Exhibit 4-5 provides a map of all proposed critical habitat subunits in Washington,
Oregon, and California. The shading of the subunits describes the relative distribution of
Federal lands more likely to experience potential impacts to timber harvest. The critical
habitat subunits with highest composite scores (approximately the top ten percent) are
located across all three states. Conversely, critical habitat subunits with relatively larger
proportions of coastal areas, national parks, and private lands in California and
Washington have fewer acres where incremental impacts may occur. One area that is an
exception to this is Olympic National Forest in Washington (NCO-1 and NCO-2), which
has relatively larger areas of matrix lands managed by USFS in addition to
Congressionally Reserved Natural Areas where potential impacts are less likely to occur.
The map also identifies four subunits that have proportionally greater areas of younger
forests that are considered essential to NSO conservation.
163. Exhibit 4-6 provides a summary of all critical habitat subunits ranked by the relative
distribution of Federal lands more likely to experience potential impacts to timber
harvest. The exhibit shows the breakdown of land type by land owner, land allocation,
and NSO habitat. Column O indicates the total acres of the critical habitat subunit with
potential impacts to Federal timber harvest.142
State and private lands, Congressionally
Reserved Areas, LSRs, and Riparian Reserves do not factor into the rankings. Column P
reports the composite score and Column Q characterizes the relative potential impact of
critical habitat designation. The critical habitat subunits with the top rankings include:
ECN-3, ECN-5, ICC-1, ICC-2, KLW-1, KLW-7, and WCC-2. In addition, we identify
the four subunits that have proportionally greater areas of younger forests that are
considered essential to NSO conservation. These subunits do not feature prominently in
the rankings because they contain relatively small areas of Federal lands with potential
impacts (less than 18,000 acres per subunit).
142 In Exhibit 4-6, Column O is calculated as 0.065 × (Column D + Column G) + Column E + Column H.
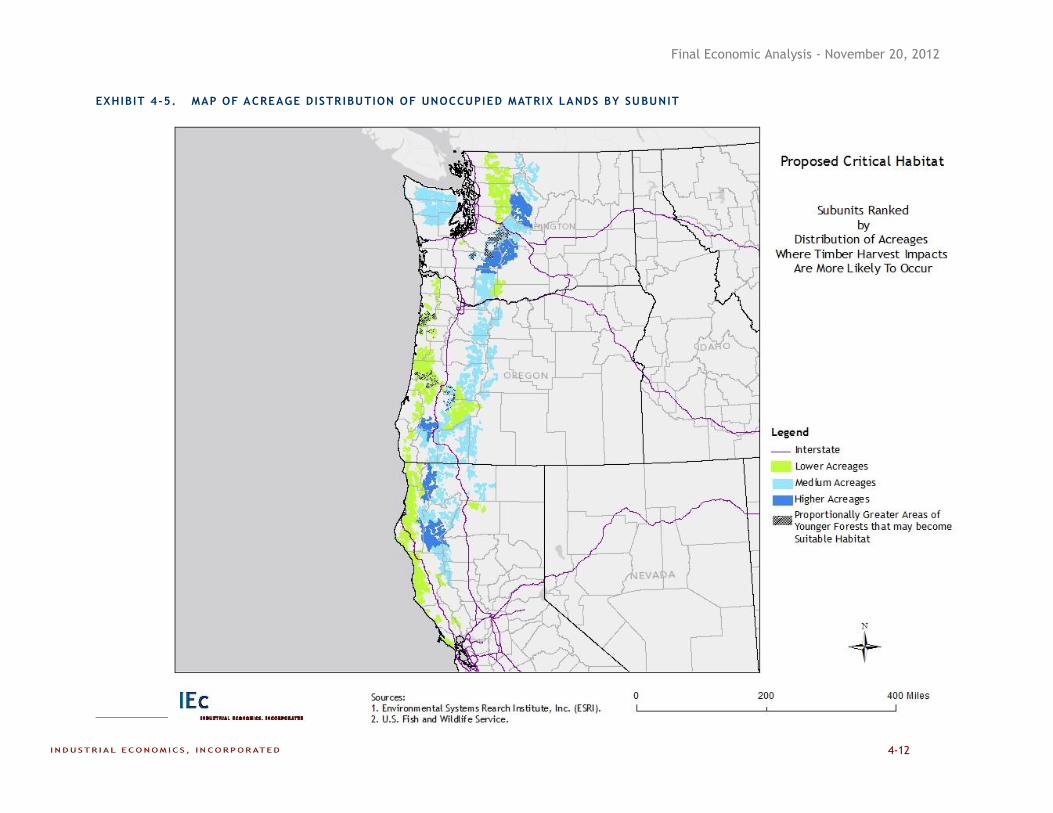
Final Economic Analysis - November 20, 2012
4-12
EXHIBIT 4-5. MAP OF ACREAGE DISTR IBUTION OF UNOCCUPIED MATRIX LANDS BY SUBUNIT
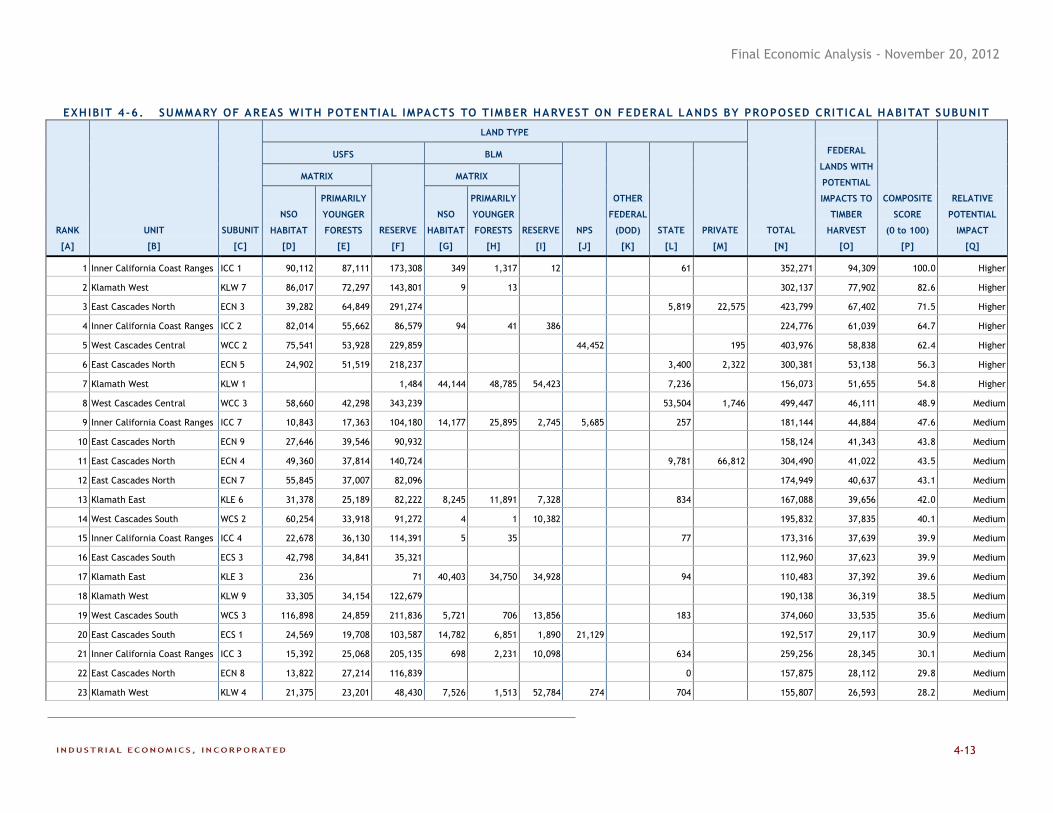
Final Economic Analysis - November 20, 2012
4-13
EXHIBIT 4-6. SUMMARY OF AREAS WITH POTENTIAL IMPACTS TO TIMBER HARVEST ON FEDERAL LANDS BY PROPOSED CRITICAL HABITAT SUBUNIT
RANK
[A]
UNIT
[B]
SUBUNIT
[C]
LAND TYPE
TOTAL
[N]
FEDERAL
LANDS WITH
POTENTIAL
IMPACTS TO
TIMBER
HARVEST
[O]
COMPOSITE
SCORE
(0 to 100)
[P]
RELATIVE
POTENTIAL
IMPACT
[Q]
USFS BLM
NPS
[J]
OTHER
FEDERAL
(DOD)
[K]
STATE
[L]
PRIVATE
[M]
MATRIX
RESERVE
[F]
MATRIX
RESERVE
[I]
NSO
HABITAT
[D]
PRIMARILY
YOUNGER
FORESTS
[E]
NSO
HABITAT
[G]
PRIMARILY
YOUNGER
FORESTS
[H]
1 Inner California Coast Ranges ICC 1 90,112 87,111 173,308 349 1,317 12 61 352,271 94,309 100.0 Higher
2 Klamath West KLW 7 86,017 72,297 143,801 9 13 302,137 77,902 82.6 Higher
3 East Cascades North ECN 3 39,282 64,849 291,274 5,819 22,575 423,799 67,402 71.5 Higher
4 Inner California Coast Ranges ICC 2 82,014 55,662 86,579 94 41 386 224,776 61,039 64.7 Higher
5 West Cascades Central WCC 2 75,541 53,928 229,859 44,452 195 403,976 58,838 62.4 Higher
6 East Cascades North ECN 5 24,902 51,519 218,237 3,400 2,322 300,381 53,138 56.3 Higher
7 Klamath West KLW 1 1,484 44,144 48,785 54,423 7,236 156,073 51,655 54.8 Higher
8 West Cascades Central WCC 3 58,660 42,298 343,239 53,504 1,746 499,447 46,111 48.9 Medium
9 Inner California Coast Ranges ICC 7 10,843 17,363 104,180 14,177 25,895 2,745 5,685 257 181,144 44,884 47.6 Medium
10 East Cascades North ECN 9 27,646 39,546 90,932 158,124 41,343 43.8 Medium
11 East Cascades North ECN 4 49,360 37,814 140,724 9,781 66,812 304,490 41,022 43.5 Medium
12 East Cascades North ECN 7 55,845 37,007 82,096 174,949 40,637 43.1 Medium
13 Klamath East KLE 6 31,378 25,189 82,222 8,245 11,891 7,328 834 167,088 39,656 42.0 Medium
14 West Cascades South WCS 2 60,254 33,918 91,272 4 1 10,382 195,832 37,835 40.1 Medium
15 Inner California Coast Ranges ICC 4 22,678 36,130 114,391 5 35 77 173,316 37,639 39.9 Medium
16 East Cascades South ECS 3 42,798 34,841 35,321 112,960 37,623 39.9 Medium
17 Klamath East KLE 3 236 71 40,403 34,750 34,928 94 110,483 37,392 39.6 Medium
18 Klamath West KLW 9 33,305 34,154 122,679 190,138 36,319 38.5 Medium
19 West Cascades South WCS 3 116,898 24,859 211,836 5,721 706 13,856 183 374,060 33,535 35.6 Medium
20 East Cascades South ECS 1 24,569 19,708 103,587 14,782 6,851 1,890 21,129 192,517 29,117 30.9 Medium
21 Inner California Coast Ranges ICC 3 15,392 25,068 205,135 698 2,231 10,098 634 259,256 28,345 30.1 Medium
22 East Cascades North ECN 8 13,822 27,214 116,839 0 157,875 28,112 29.8 Medium
23 Klamath West KLW 4 21,375 23,201 48,430 7,526 1,513 52,784 274 704 155,807 26,593 28.2 Medium
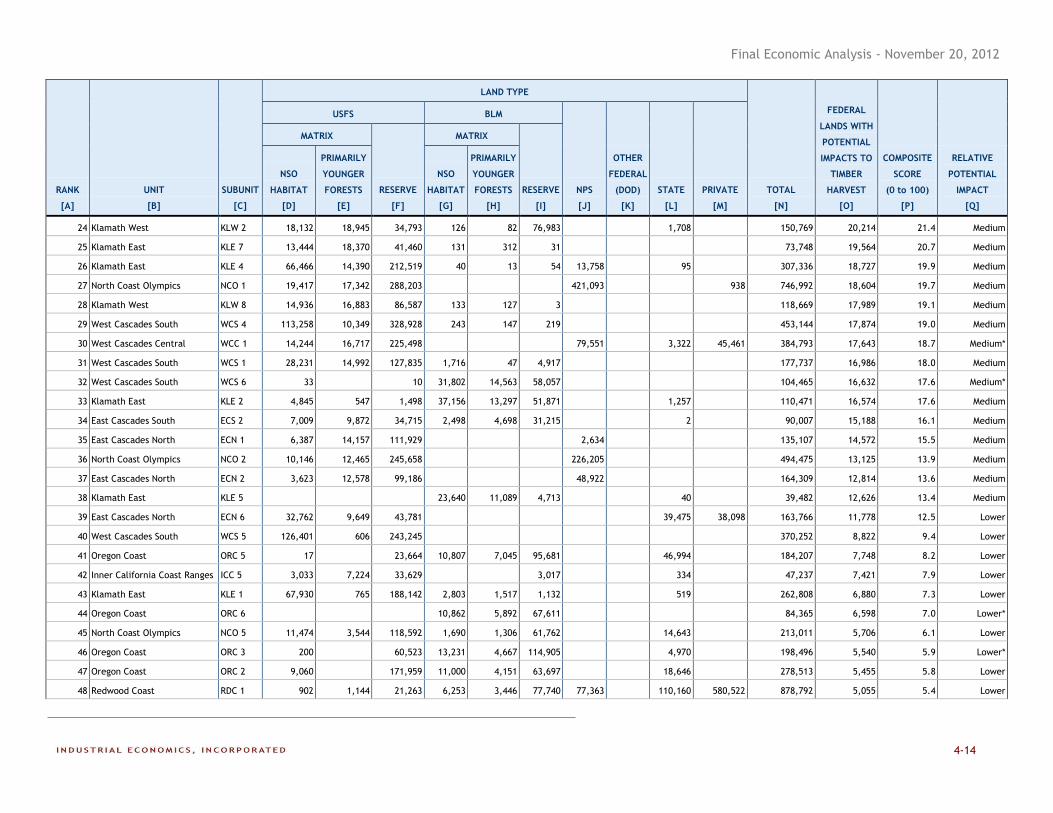
Final Economic Analysis - November 20, 2012
4-14
RANK
[A]
UNIT
[B]
SUBUNIT
[C]
LAND TYPE
TOTAL
[N]
FEDERAL
LANDS WITH
POTENTIAL
IMPACTS TO
TIMBER
HARVEST
[O]
COMPOSITE
SCORE
(0 to 100)
[P]
RELATIVE
POTENTIAL
IMPACT
[Q]
USFS BLM
NPS
[J]
OTHER
FEDERAL
(DOD)
[K]
STATE
[L]
PRIVATE
[M]
MATRIX
RESERVE
[F]
MATRIX
RESERVE
[I]
NSO
HABITAT
[D]
PRIMARILY
YOUNGER
FORESTS
[E]
NSO
HABITAT
[G]
PRIMARILY
YOUNGER
FORESTS
[H]
24 Klamath West KLW 2 18,132 18,945 34,793 126 82 76,983 1,708 150,769 20,214 21.4 Medium
25 Klamath East KLE 7 13,444 18,370 41,460 131 312 31 73,748 19,564 20.7 Medium
26 Klamath East KLE 4 66,466 14,390 212,519 40 13 54 13,758 95 307,336 18,727 19.9 Medium
27 North Coast Olympics NCO 1 19,417 17,342 288,203 421,093 938 746,992 18,604 19.7 Medium
28 Klamath West KLW 8 14,936 16,883 86,587 133 127 3 118,669 17,989 19.1 Medium
29 West Cascades South WCS 4 113,258 10,349 328,928 243 147 219 453,144 17,874 19.0 Medium
30 West Cascades Central WCC 1 14,244 16,717 225,498 79,551 3,322 45,461 384,793 17,643 18.7 Medium*
31 West Cascades South WCS 1 28,231 14,992 127,835 1,716 47 4,917 177,737 16,986 18.0 Medium
32 West Cascades South WCS 6 33 10 31,802 14,563 58,057 104,465 16,632 17.6 Medium*
33 Klamath East KLE 2 4,845 547 1,498 37,156 13,297 51,871 1,257 110,471 16,574 17.6 Medium
34 East Cascades South ECS 2 7,009 9,872 34,715 2,498 4,698 31,215 2 90,007 15,188 16.1 Medium
35 East Cascades North ECN 1 6,387 14,157 111,929 2,634 135,107 14,572 15.5 Medium
36 North Coast Olympics NCO 2 10,146 12,465 245,658 226,205 494,475 13,125 13.9 Medium
37 East Cascades North ECN 2 3,623 12,578 99,186 48,922 164,309 12,814 13.6 Medium
38 Klamath East KLE 5 23,640 11,089 4,713 40 39,482 12,626 13.4 Medium
39 East Cascades North ECN 6 32,762 9,649 43,781 39,475 38,098 163,766 11,778 12.5 Lower
40 West Cascades South WCS 5 126,401 606 243,245 370,252 8,822 9.4 Lower
41 Oregon Coast ORC 5 17 23,664 10,807 7,045 95,681 46,994 184,207 7,748 8.2 Lower
42 Inner California Coast Ranges ICC 5 3,033 7,224 33,629 3,017 334 47,237 7,421 7.9 Lower
43 Klamath East KLE 1 67,930 765 188,142 2,803 1,517 1,132 519 262,808 6,880 7.3 Lower
44 Oregon Coast ORC 6 10,862 5,892 67,611 84,365 6,598 7.0 Lower*
45 North Coast Olympics NCO 5 11,474 3,544 118,592 1,690 1,306 61,762 14,643 213,011 5,706 6.1 Lower
46 Oregon Coast ORC 3 200 60,523 13,231 4,667 114,905 4,970 198,496 5,540 5.9 Lower*
47 Oregon Coast ORC 2 9,060 171,959 11,000 4,151 63,697 18,646 278,513 5,455 5.8 Lower
48 Redwood Coast RDC 1 902 1,144 21,263 6,253 3,446 77,740 77,363 110,160 580,522 878,792 5,055 5.4 Lower
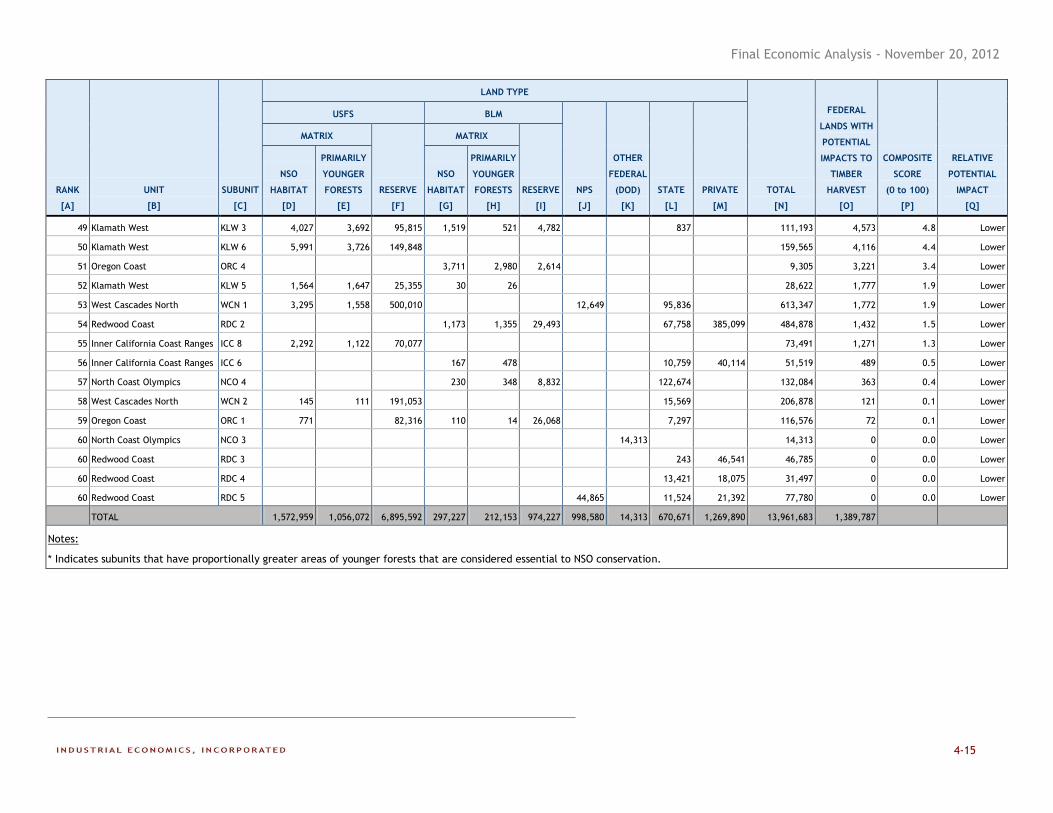
Final Economic Analysis - November 20, 2012
4-15
RANK
[A]
UNIT
[B]
SUBUNIT
[C]
LAND TYPE
TOTAL
[N]
FEDERAL
LANDS WITH
POTENTIAL
IMPACTS TO
TIMBER
HARVEST
[O]
COMPOSITE
SCORE
(0 to 100)
[P]
RELATIVE
POTENTIAL
IMPACT
[Q]
USFS BLM
NPS
[J]
OTHER
FEDERAL
(DOD)
[K]
STATE
[L]
PRIVATE
[M]
MATRIX
RESERVE
[F]
MATRIX
RESERVE
[I]
NSO
HABITAT
[D]
PRIMARILY
YOUNGER
FORESTS
[E]
NSO
HABITAT
[G]
PRIMARILY
YOUNGER
FORESTS
[H]
49 Klamath West KLW 3 4,027 3,692 95,815 1,519 521 4,782 837 111,193 4,573 4.8 Lower
50 Klamath West KLW 6 5,991 3,726 149,848 159,565 4,116 4.4 Lower
51 Oregon Coast ORC 4 3,711 2,980 2,614 9,305 3,221 3.4 Lower
52 Klamath West KLW 5 1,564 1,647 25,355 30 26 28,622 1,777 1.9 Lower
53 West Cascades North WCN 1 3,295 1,558 500,010 12,649 95,836 613,347 1,772 1.9 Lower
54 Redwood Coast RDC 2 1,173 1,355 29,493 67,758 385,099 484,878 1,432 1.5 Lower
55 Inner California Coast Ranges ICC 8 2,292 1,122 70,077 73,491 1,271 1.3 Lower
56 Inner California Coast Ranges ICC 6 167 478 10,759 40,114 51,519 489 0.5 Lower
57 North Coast Olympics NCO 4 230 348 8,832 122,674 132,084 363 0.4 Lower
58 West Cascades North WCN 2 145 111 191,053 15,569 206,878 121 0.1 Lower
59 Oregon Coast ORC 1 771 82,316 110 14 26,068 7,297 116,576 72 0.1 Lower
60 North Coast Olympics NCO 3 14,313 14,313 0 0.0 Lower
60 Redwood Coast RDC 3 243 46,541 46,785 0 0.0 Lower
60 Redwood Coast RDC 4 13,421 18,075 31,497 0 0.0 Lower
60 Redwood Coast RDC 5 44,865 11,524 21,392 77,780 0 0.0 Lower
TOTAL 1,572,959 1,056,072 6,895,592 297,227 212,153 974,227 998,580 14,313 670,671 1,269,890 13,961,683 1,389,787
Notes:
* Indicates subunits that have proportionally greater areas of younger forests that are considered essential to NSO conservation.
Final Economic Analysis - November 20, 2012
4-16
4.4 STEP 4 – QUANTIFY THE RELATIVE MAGNITUDE OF POTENTIAL CHANGES IN
FUTURE TIMBER HARVEST VOLUMES
164. In the previous sections, we first identified the areas of critical habitat that represent the
focus of our assessment of critical habitat impacts on Federal timber management
practices, namely, matrix lands unoccupied by the NSO. These lands represent the areas
where action agencies are more likely to consider whether to make changes to present
management practices to potentially avoid the destruction or adverse modification of
critical habitat. We then ranked the designation’s subunits by the distribution of these
acreages within their boundaries. We now turn to an illustration of potential changes in
Federal timber harvest in these areas attributable to critical habitat designation.
165. To estimate these potential effects, the analysis generally proceeds as follows:
First, for areas within each subunit that may experience incremental changes to
timber harvest (as identified above), estimate future timber harvest volumes
absent critical habitat. This projection represents the harvest baseline.
Second, scale these projected volumes based upon a measure of the potential
incremental effect of critical habitat considerations. As noted, we consider three
scaling scenarios that yield no change, positive change, or negative change to
these projected volumes.
Third, monetize calculated changes in timber volume under Scenarios 2 and 3
based upon representative stumpage values.
166. We discuss each of these steps in greater detail below and present the results of the
analysis.
4.4.1 FUTURE TIMBER HARVEST VOLUMES
167. To fully implement this valuation exercise across the entire range of proposed critical
habitat on Federal lands would require data on projected timber harvests for the discrete
areas within each subunit that may experience incremental changes to harvest practices.
We were unable to develop such comprehensive projections within the timeframe of this
report. In addition, for some areas, such data at this fine a scale are simply not available.
The BLM Oregon State Office, however, was able to provide relevant data for areas
within its jurisdiction. Thus, we use this information, and additional relevant data from
USFS, to derive a forecast of baseline timber harvest absent critical habitat.
168. BLM provided detailed reporting on potential future timber management activities based
on the No Action Alternative for the 2008 Final Environmental Impact Statement (FEIS)
for the revision of the Western Oregon RMPs.143
The analysis of the No Action
Alternative in the 2008 FEIS represented the 1995 RMPs, as written.144
This analysis
provided detailed information concerning forest conditions, allocations, types of harvest,
and the development of habitat for the BLM lands. Specifically, the report provided
143 Submission provided by Chris Cadwell, BLM, Oregon State Office under report entitled, “Proposed Spotted Owl Critical
Habitat – Economic Analysis Assumptions for BLM Timber Harvest Effects,” April 17, 2012.
144 This basis is consistent with our prior note concerning the Pacific Rivers Council case.
Final Economic Analysis - November 20, 2012
4-17
timber harvest projections for three decade increments, by land allocation type (reserve,
matrix), forest conditions (NSO habitat, predominantly younger forests), and harvest type
(thinning, regeneration). The harvest data were provided at the subunit level.
169. USFS also provided information on timber harvest activities. Specifically, USFS Region
6 provided actual historic timber harvest data by forest from 1995 to 2010,145
and USFS
Region 5 provided projected future timber harvest levels by forest based on past actual
harvest levels.146
For Region 6, we rely on the past five years (2006 to 2010) of actual
harvest levels to be illustrative of projected future timber harvest. To allocate projected
timber harvest volumes we overlay GIS data layers of national forests obtained from the
Protected Areas Database of the United States with proposed critical habitat subunit maps
provided by the Service.147
We then use a weighted average of national forest acres by
subunit to distribute harvest volumes.148
Therefore, in the absence of detailed geospatial
information on timber management activities, we assume that harvests are approximately
evenly distributed within national forests managed by USFS. We calculate the annual
average harvest yield for USFS matrix lands in subunit i (and national forest j) as:
where the first term on the right side of the equation is the projected harvest yield for
forest j and the second term is the proportion of USFS lands in subunit i within forest j.
170. This derivation yields the following overall approach to determine baseline timber
harvest volumes:
For BLM lands in Oregon, we rely on projected timber harvest volume by critical
habitat subunit, by habitat type within the subunit, provided by BLM.
For BLM matrix lands outside of Oregon, we apply the average timber harvest
yield per acre projected in the first decade for Oregon BLM matrix lands
(approximately 192 bd. ft./acre/year for predominantly younger forests and
approximately 621 bd. ft./acre/year for NSO habitat).
145 Submission provided by Tracy Beck, USFS Region 6, in a workbook entitled, “NWFP-OfficialOfferCutSoldByForest1995-
2010.xls,” February 24, 2012.
146 Submission provided by Joe Sherlock, USFS Region 5, in a workbook entitled, “ProjectedandASQ_Volumes.xlsx,” April 12,
2012.
147 The Protected Areas Database of the United States (PAD-US) is a GIS database hosted by the U.S. Geological Survey Gap
Analysis Program that illustrates and describes public land ownership, management and conservation lands nationally.
Version 1.2 of this data set was released in April 2011. Accessed at http://gapanalysis.usgs.gov/padus/.
148 We did not receive data on timber harvests in Lassen National Forest or Modoc National Forest, which account for
approximately 22,000 acres of USFS lands within the proposed designation. Therefore, in the absence of information to the
contrary, we assume USFS lands in these areas have an annual projected harvest yield equal to the average across all other
national forests.
Final Economic Analysis - November 20, 2012
4-18
For USFS lands, we apply the weighted-average projected timber harvest yield
per acre (averaging approximately 63 bd. ft./acre/year) for each critical habitat
subunit.
171. To assign an annual baseline harvest rate to the discrete areas of focus within each
subunit, for BLM lands outside of Oregon and USFS lands we multiply the per acre
measure of timber harvest yield projections by acres of matrix lands likely to be
unoccupied to obtain a projected annualized harvest volume. As noted, for BLM lands in
Oregon, we can directly use the projected timber harvest volumes for matrix lands
unoccupied by the NSO, as they are identified by subunit.149
Also, note that differences
in projected timber harvest yields between the two agencies reflect dissimilarities in
actual on-the-ground timber management practices. However, across national forests
managed by USFS, annual projected timber harvest yield ranges from 14 to more than
200 bd. ft./acre/year.
172. To calculate average annual projected timber harvest volume for subunit i we use the
following approach:
173. Exhibit 4-7 provides a map showing the distribution of annualized projected timber
harvest by critical habitat subunit. The map characterizes projected subunit-level harvests
as higher (approximately 3.5 to 20 MMBF), medium (approximately 0.5 to 3.5 MMBF),
and lower (less than 0.5 MMBF). The higher range comprises the top nine subunits in the
proposed critical habitat designation (approximately the top 14 percent), while the lower
range comprises 24 subunits (approximately the bottom 40 percent). The middle range
covers the remaining 30 subunits. As the map shows, the subunits with relatively higher
projected harvests are located primarily in northern California and Oregon.
149 We carry through the assumption that approximately 6.5 percent of matrix lands with NSO habitat are unoccupied.
Therefore, for BLM matrix lands with NSO habitat we multiply the annualized projected timber harvest by this factor to
calculate the baseline harvest under the NWFP. We do not quantify potential changes to timber harvest in riparian reserves
that may occur due to changes in timber management activities in adjacent matrix lands. As a result of this filtering
process, where we identify discrete acres within each subunit where incremental timber harvest effects may occur, our
projection of baseline timber harvest by subunit is lower than that provided by BLM in its data submission.
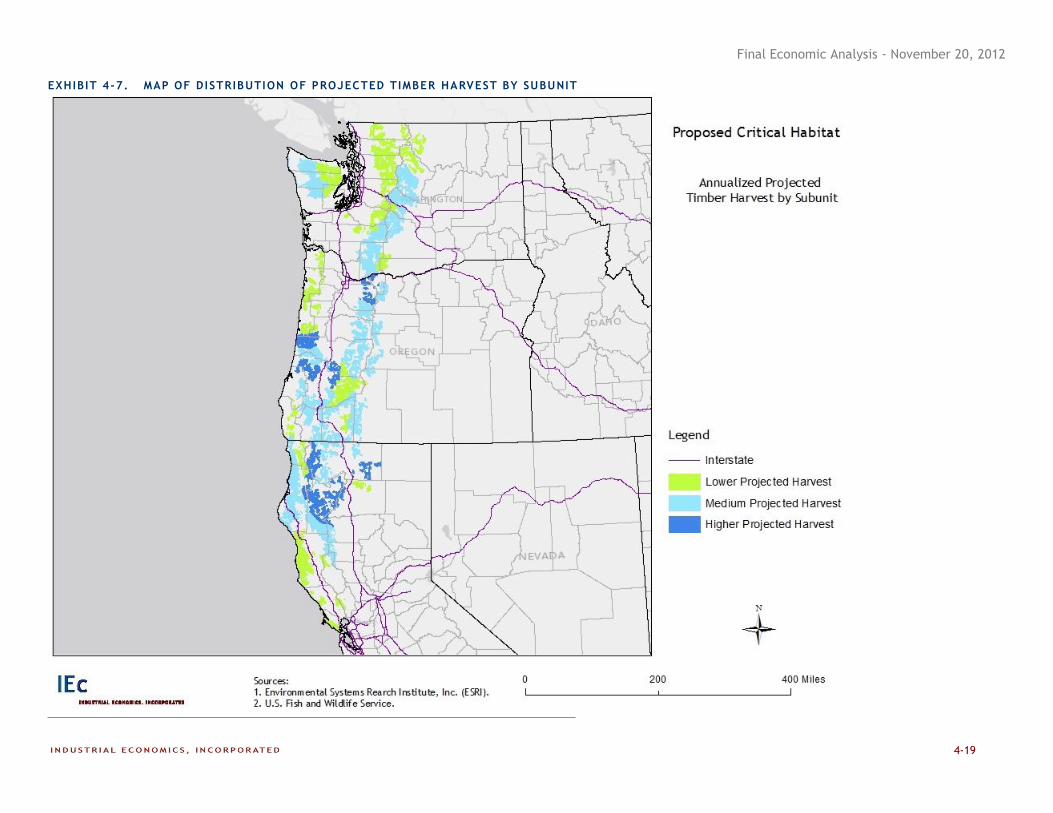
Final Economic Analysis - November 20, 2012
4-19
EXHIBIT 4-7. MAP OF DISTRIBUTION OF PROJECTED TIMBER HARVEST BY SUBUNIT
Final Economic Analysis - November 20, 2012
4-20
174. Exhibit 4-8 walks through the calculations by subunit. The calculations begin by
restating the number of unoccupied matrix acres by subunit and land manager (Columns
D, E, and F). Columns G through I present the projected baseline annual harvest yields
(per acre) or actual projected volumes.150
Combined, these values yield projected
baseline timber harvest volume by acres within each subunit that may experience
incremental effects (Column J). In total, the analysis contemplates an annualized
projected baseline timber harvest of approximately 122.8 MMBF within the areas of
focus.
175. We further note several important caveats related to this baseline harvest projection.
First, for BLM lands in Oregon, the baseline projections discussed above comport with
BLM’s 1995 RMPs. Actual historical harvest volumes have been lower than plan
volumes. This historical performance suggests that actual future harvest volumes,
irrespective of critical habitat effects, may differ from these plan-based volumes.
However, we employ these data due to their specificity at the subunit level, including
explicit allocations by stand and harvest type, and habitat category. Second, our
application of the BLM-based results and generalized USFS volumes to other relevant
acres represents a blunt analytic instrument, and does not capture potential material
differences in stand types and harvest goals. For USFS projected timber harvest volumes,
in particular, we assume proportional distribution between various land allocations, which
may overstate or understate the actual harvest yield from matrix lands unoccupied by the
NSO. Finally, for the purposes of this analysis, we assume harvest volumes remain
constant over a 20 year time horizon. However, planned harvest rotations may vary from
actual timber harvest volumes from year to year. For example, the BLM Oregon State
Office expects harvest volume on BLM matrix lands with predominantly younger habitat
to increase by approximately 20 percent in the second decade. Potential thinning harvest
yield in the matrix may also decrease over time.
176. Despite these limitations, the analytic goal was to create a baseline timber harvest
projection that could serve as a reasonable basis for considering potential incremental
changes related to critical habitat. When reviewing the analytic results, however, the
reader should recognize that our projection of baseline timber harvest within the discrete
areas of each subunit where incremental effects may occur could vary materially from
future actual timber harvest in these areas.
150 Note that, for BLM matrix lands in Oregon, we rely on projected volumes (rather than yields) provided by BLM. We use
this approach because the GIS data layers developed by the Service do not precisely align with the BLM data layers;
therefore, there is an acreage discrepancy at the subunit level. This makes it challenging to calculate a realistic projected
yield for each subunit (the Service may overstate or understate the actual number of acres from which BLM makes its
projections). Despite the alignment issue, the BLM data provide a reasonable representation of the projected harvest
levels for each subunit. Therefore, we use projected harvest levels for Oregon and calculate an average projected yield
based on the BLM data layers across all subunits in Oregon (approximately 192 bd. ft./acre/year for predominantly younger
forests and approximately 621 bd. ft./acre/year for NSO habitat), which we apply to all other BLM matrix lands unoccupied
by the NSO.
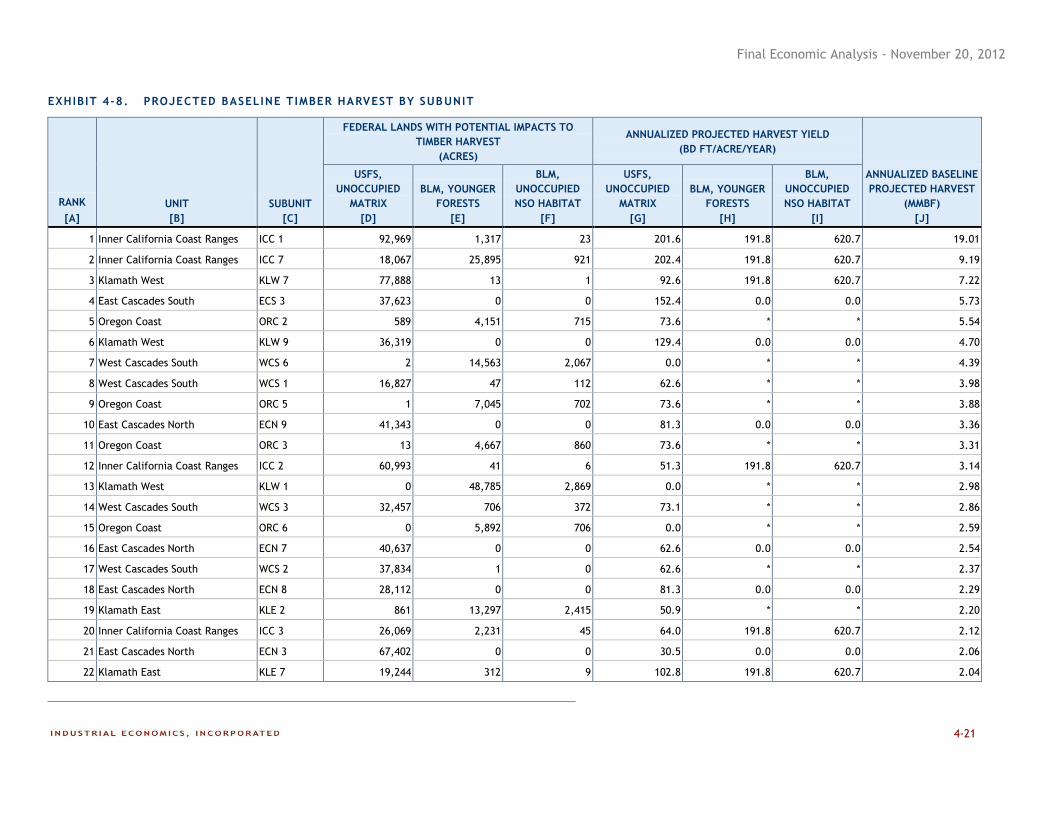
Final Economic Analysis - November 20, 2012
4-21
EXHIBIT 4-8. PROJECTED BASELINE T IMBER HARVEST BY SUBUNIT
RANK
[A]
UNIT
[B]
SUBUNIT
[C]
FEDERAL LANDS WITH POTENTIAL IMPACTS TO
TIMBER HARVEST
(ACRES)
ANNUALIZED PROJECTED HARVEST YIELD
(BD FT/ACRE/YEAR)
ANNUALIZED BASELINE
PROJECTED HARVEST
(MMBF)
[J]
USFS,
UNOCCUPIED
MATRIX
[D]
BLM, YOUNGER
FORESTS
[E]
BLM,
UNOCCUPIED
NSO HABITAT
[F]
USFS,
UNOCCUPIED
MATRIX
[G]
BLM, YOUNGER
FORESTS
[H]
BLM,
UNOCCUPIED
NSO HABITAT
[I]
1 Inner California Coast Ranges ICC 1 92,969 1,317 23 201.6 191.8 620.7 19.01
2 Inner California Coast Ranges ICC 7 18,067 25,895 921 202.4 191.8 620.7 9.19
3 Klamath West KLW 7 77,888 13 1 92.6 191.8 620.7 7.22
4 East Cascades South ECS 3 37,623 0 0 152.4 0.0 0.0 5.73
5 Oregon Coast ORC 2 589 4,151 715 73.6 * * 5.54
6 Klamath West KLW 9 36,319 0 0 129.4 0.0 0.0 4.70
7 West Cascades South WCS 6 2 14,563 2,067 0.0 * * 4.39
8 West Cascades South WCS 1 16,827 47 112 62.6 * * 3.98
9 Oregon Coast ORC 5 1 7,045 702 73.6 * * 3.88
10 East Cascades North ECN 9 41,343 0 0 81.3 0.0 0.0 3.36
11 Oregon Coast ORC 3 13 4,667 860 73.6 * * 3.31
12 Inner California Coast Ranges ICC 2 60,993 41 6 51.3 191.8 620.7 3.14
13 Klamath West KLW 1 0 48,785 2,869 0.0 * * 2.98
14 West Cascades South WCS 3 32,457 706 372 73.1 * * 2.86
15 Oregon Coast ORC 6 0 5,892 706 0.0 * * 2.59
16 East Cascades North ECN 7 40,637 0 0 62.6 0.0 0.0 2.54
17 West Cascades South WCS 2 37,834 1 0 62.6 * * 2.37
18 East Cascades North ECN 8 28,112 0 0 81.3 0.0 0.0 2.29
19 Klamath East KLE 2 861 13,297 2,415 50.9 * * 2.20
20 Inner California Coast Ranges ICC 3 26,069 2,231 45 64.0 191.8 620.7 2.12
21 East Cascades North ECN 3 67,402 0 0 30.5 0.0 0.0 2.06
22 Klamath East KLE 7 19,244 312 9 102.8 191.8 620.7 2.04
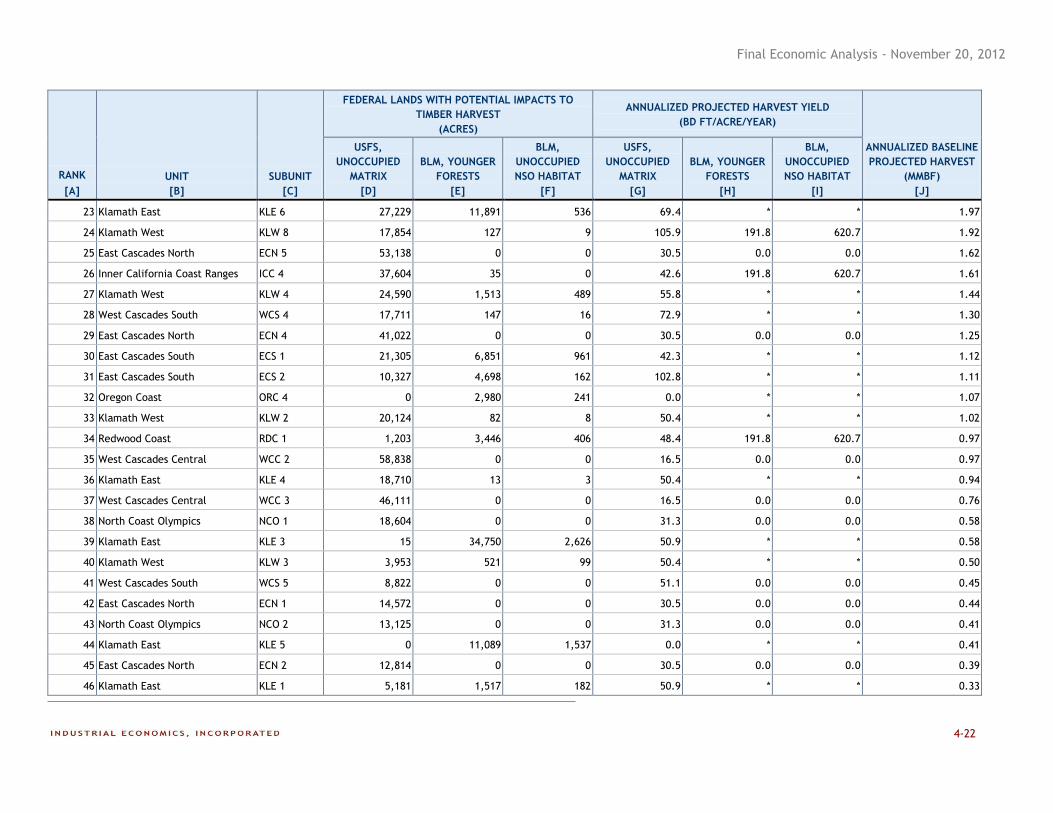
Final Economic Analysis - November 20, 2012
4-22
RANK
[A]
UNIT
[B]
SUBUNIT
[C]
FEDERAL LANDS WITH POTENTIAL IMPACTS TO
TIMBER HARVEST
(ACRES)
ANNUALIZED PROJECTED HARVEST YIELD
(BD FT/ACRE/YEAR)
ANNUALIZED BASELINE
PROJECTED HARVEST
(MMBF)
[J]
USFS,
UNOCCUPIED
MATRIX
[D]
BLM, YOUNGER
FORESTS
[E]
BLM,
UNOCCUPIED
NSO HABITAT
[F]
USFS,
UNOCCUPIED
MATRIX
[G]
BLM, YOUNGER
FORESTS
[H]
BLM,
UNOCCUPIED
NSO HABITAT
[I]
23 Klamath East KLE 6 27,229 11,891 536 69.4 * * 1.97
24 Klamath West KLW 8 17,854 127 9 105.9 191.8 620.7 1.92
25 East Cascades North ECN 5 53,138 0 0 30.5 0.0 0.0 1.62
26 Inner California Coast Ranges ICC 4 37,604 35 0 42.6 191.8 620.7 1.61
27 Klamath West KLW 4 24,590 1,513 489 55.8 * * 1.44
28 West Cascades South WCS 4 17,711 147 16 72.9 * * 1.30
29 East Cascades North ECN 4 41,022 0 0 30.5 0.0 0.0 1.25
30 East Cascades South ECS 1 21,305 6,851 961 42.3 * * 1.12
31 East Cascades South ECS 2 10,327 4,698 162 102.8 * * 1.11
32 Oregon Coast ORC 4 0 2,980 241 0.0 * * 1.07
33 Klamath West KLW 2 20,124 82 8 50.4 * * 1.02
34 Redwood Coast RDC 1 1,203 3,446 406 48.4 191.8 620.7 0.97
35 West Cascades Central WCC 2 58,838 0 0 16.5 0.0 0.0 0.97
36 Klamath East KLE 4 18,710 13 3 50.4 * * 0.94
37 West Cascades Central WCC 3 46,111 0 0 16.5 0.0 0.0 0.76
38 North Coast Olympics NCO 1 18,604 0 0 31.3 0.0 0.0 0.58
39 Klamath East KLE 3 15 34,750 2,626 50.9 * * 0.58
40 Klamath West KLW 3 3,953 521 99 50.4 * * 0.50
41 West Cascades South WCS 5 8,822 0 0 51.1 0.0 0.0 0.45
42 East Cascades North ECN 1 14,572 0 0 30.5 0.0 0.0 0.44
43 North Coast Olympics NCO 2 13,125 0 0 31.3 0.0 0.0 0.41
44 Klamath East KLE 5 0 11,089 1,537 0.0 * * 0.41
45 East Cascades North ECN 2 12,814 0 0 30.5 0.0 0.0 0.39
46 Klamath East KLE 1 5,181 1,517 182 50.9 * * 0.33
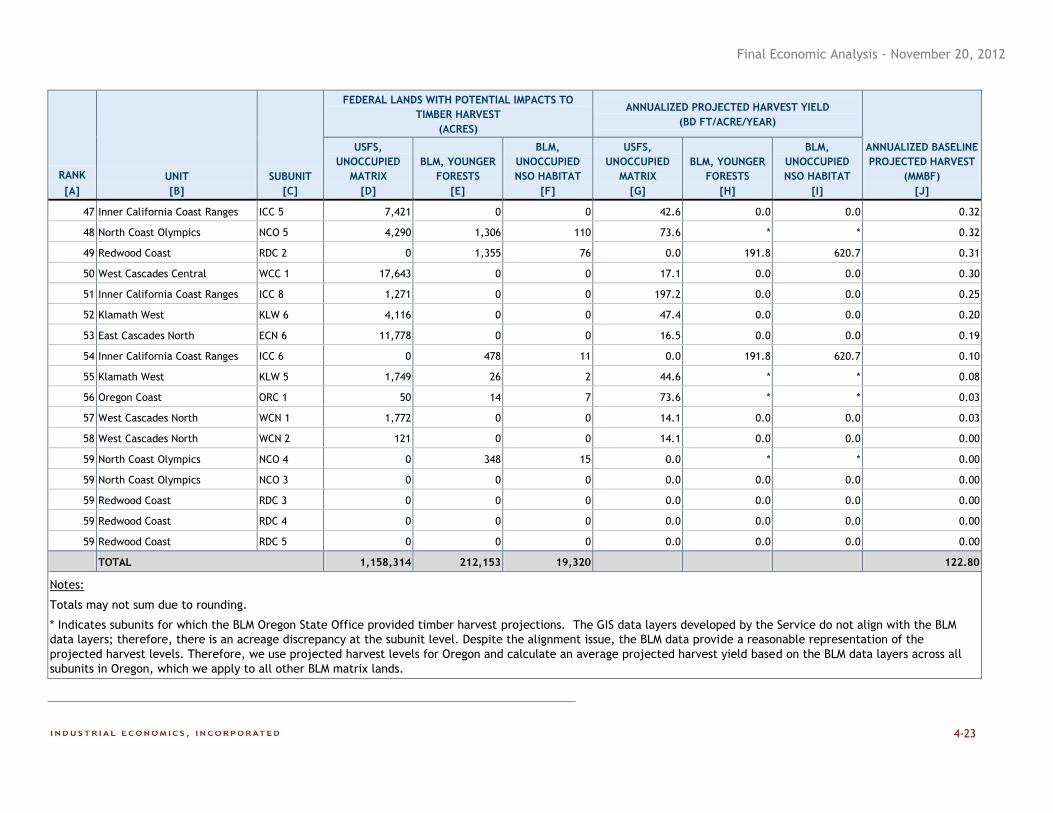
Final Economic Analysis - November 20, 2012
4-23
RANK
[A]
UNIT
[B]
SUBUNIT
[C]
FEDERAL LANDS WITH POTENTIAL IMPACTS TO
TIMBER HARVEST
(ACRES)
ANNUALIZED PROJECTED HARVEST YIELD
(BD FT/ACRE/YEAR)
ANNUALIZED BASELINE
PROJECTED HARVEST
(MMBF)
[J]
USFS,
UNOCCUPIED
MATRIX
[D]
BLM, YOUNGER
FORESTS
[E]
BLM,
UNOCCUPIED
NSO HABITAT
[F]
USFS,
UNOCCUPIED
MATRIX
[G]
BLM, YOUNGER
FORESTS
[H]
BLM,
UNOCCUPIED
NSO HABITAT
[I]
47 Inner California Coast Ranges ICC 5 7,421 0 0 42.6 0.0 0.0 0.32
48 North Coast Olympics NCO 5 4,290 1,306 110 73.6 * * 0.32
49 Redwood Coast RDC 2 0 1,355 76 0.0 191.8 620.7 0.31
50 West Cascades Central WCC 1 17,643 0 0 17.1 0.0 0.0 0.30
51 Inner California Coast Ranges ICC 8 1,271 0 0 197.2 0.0 0.0 0.25
52 Klamath West KLW 6 4,116 0 0 47.4 0.0 0.0 0.20
53 East Cascades North ECN 6 11,778 0 0 16.5 0.0 0.0 0.19
54 Inner California Coast Ranges ICC 6 0 478 11 0.0 191.8 620.7 0.10
55 Klamath West KLW 5 1,749 26 2 44.6 * * 0.08
56 Oregon Coast ORC 1 50 14 7 73.6 * * 0.03
57 West Cascades North WCN 1 1,772 0 0 14.1 0.0 0.0 0.03
58 West Cascades North WCN 2 121 0 0 14.1 0.0 0.0 0.00
59 North Coast Olympics NCO 4 0 348 15 0.0 * * 0.00
59 North Coast Olympics NCO 3 0 0 0 0.0 0.0 0.0 0.00
59 Redwood Coast RDC 3 0 0 0 0.0 0.0 0.0 0.00
59 Redwood Coast RDC 4 0 0 0 0.0 0.0 0.0 0.00
59 Redwood Coast RDC 5 0 0 0 0.0 0.0 0.0 0.00
TOTAL 1,158,314 212,153 19,320 122.80
Notes:
Totals may not sum due to rounding.
* Indicates subunits for which the BLM Oregon State Office provided timber harvest projections. The GIS data layers developed by the Service do not align with the BLM
data layers; therefore, there is an acreage discrepancy at the subunit level. Despite the alignment issue, the BLM data provide a reasonable representation of the
projected harvest levels. Therefore, we use projected harvest levels for Oregon and calculate an average projected harvest yield based on the BLM data layers across all
subunits in Oregon, which we apply to all other BLM matrix lands.
Final Economic Analysis - November 20, 2012
4-24
4.4.2 INCREMENTAL CHANGES IN HARVEST VOLUMES
177. The next step involves scaling these projected baseline harvest volumes to account for
incremental changes potentially resulting from critical habitat. The extent to which
critical habitat may affect timber management practices is subject to considerable
uncertainty. The implementation of this critical habitat proposal will occur within a
complex set of additional factors, including volatility in global demand for wood products
and general timber industry transformation, existing regulatory and statutory
requirements, evolving approaches to timber management under the NWFP, and ongoing
legal uncertainty.
178. For the past two decades, Federal land managers have worked collaboratively with the
Service to consult on actions occurring within NSO critical habitat. However, the current
proposed revision of critical habitat is larger than the final designations of 1992 and 2008,
and we believe it is informative to consider alternative scenarios of its potential impact on
Federal timber harvest. No one scenario is a precise prediction of what might happen in
the future. Rather, these scenarios serve to bracket potential outcomes and thereby
inform decision-makers who must make final decisions under the Endangered Species
Act.
179. Consultations with Federal land managers, the Service, and other experts indicate varying
opinions regarding potential critical habitat effects, and all noted the difficulty and
limitations of deriving precise measures of positive or negative incremental change. For
example, Federal land managers have expressed concern about critical habitat
representing a potential constraint on their timber management preferences across the
designation. Service representatives suggest that there is potential for an increase in
harvest levels compared to recent Federal matrix timber harvest in some areas (although
at levels below what was originally envisioned for these lands under the NWFP in 1994).
Finally, the relevant parties also contemplate that no material changes may result from
critical habitat concerns relative to the baseline, given the long and established history of
existing management plans and conservation efforts related to the NSO.
180. To capture a range of potential outcomes, this analysis presents three scenarios. Scenario
1 contemplates that minimal or no changes to current timber management practices will
occur, and therefore that the incremental costs of the designation will be predominantly
administrative. Scenario 2 posits that action agencies may choose to implement
management practices yielding an increase in timber harvest relative to the baseline.
Scenario 3 considers that action agencies may choose to adopt a more restrictive harvest
posture in response to critical habitat, leading to a decline in harvest volumes relative to
the baseline.
Final Economic Analysis - November 20, 2012
4-25
181. Analytically, the potential incremental impact on timber harvest volume due to critical
habitat designation for subunit i is:
where S is the scaling factor contemplated in each scenario. We discuss each of these
scenarios in further detail below.
4.4.2.1 SCENARIO 1 – ADMINISTRATIVE COSTS ONLY
182. Under the proposed revised critical habitat designation, Federal land managers may
choose prescriptions to maintain timber harvest in matrix lands at levels similar to recent
historical harvest. In this scenario, we assume that Federal land managers will continue
to manage these matrix forests in a manner similar to practices of recent years under the
1992 and 2008 critical habitat. Federal timber harvest has been planned under the
Standards and Guidelines of the NWFP, with an emphasis on thinning and some
regeneration harvest. However, much of the regeneration harvest has been contentious
and is sometimes legally challenged based on a variety of environmental and social
concerns, whether it is critical habitat or not.151
In this scenario, harvest will continue to
be mostly from thinning at recent historic levels. This scenario results in minimal or no
changes in timber harvest from projected levels.
183. The majority of NSO consultations under section 7 of the Act occur between the Service
and BLM and/or USFS. On Federal lands managed by these agencies, the vast majority
of consultations on proposed projects affecting the NSO are timber sales or timber
management projects. These consultations involve individual projects, batched actions,
or programmatic actions for an entire program of work (e.g., road repair, habitat
restoration, or timber harvest) in a single analysis. Timber-sale designs often involve
several actions that require consideration during the consultation process, including:
commodity extraction; habitat restoration; hazard-tree removal; building or maintenance
of roads; and recreational development. Activities on Federal lands are always subject to
a Federal nexus and routinely result in formal consultations to consider impacts to the
NSO and its critical habitat.
184. Due to the high volume of consultations with BLM and USFS, the Service has entered
into a streamlined consultation agreement with both agencies that provides for detailed
discussions prior to the informal or formal consultation process.152
This pre-consultation
process includes project design negotiations aimed at minimizing impacts to the NSO and
its critical habitat. During this process the action agency often develops project
modifications that reduce the impacts of the proposed action. Most conservation
measures for the species are also likely to benefit critical habitat.
151 Baker, S., Seeking a Balance between Forestry and Biodiversity the Role of Variable Retention Silviculture, Forest & Wood
Products Australia Limited PDG167-0910, 2011.
152 Incremental Effects Memorandum for the Economic Analysis of the Proposed Rule to Revise Critical Habitat for the
Northern Spotted Owl, received from the Service on March 21, 2012.
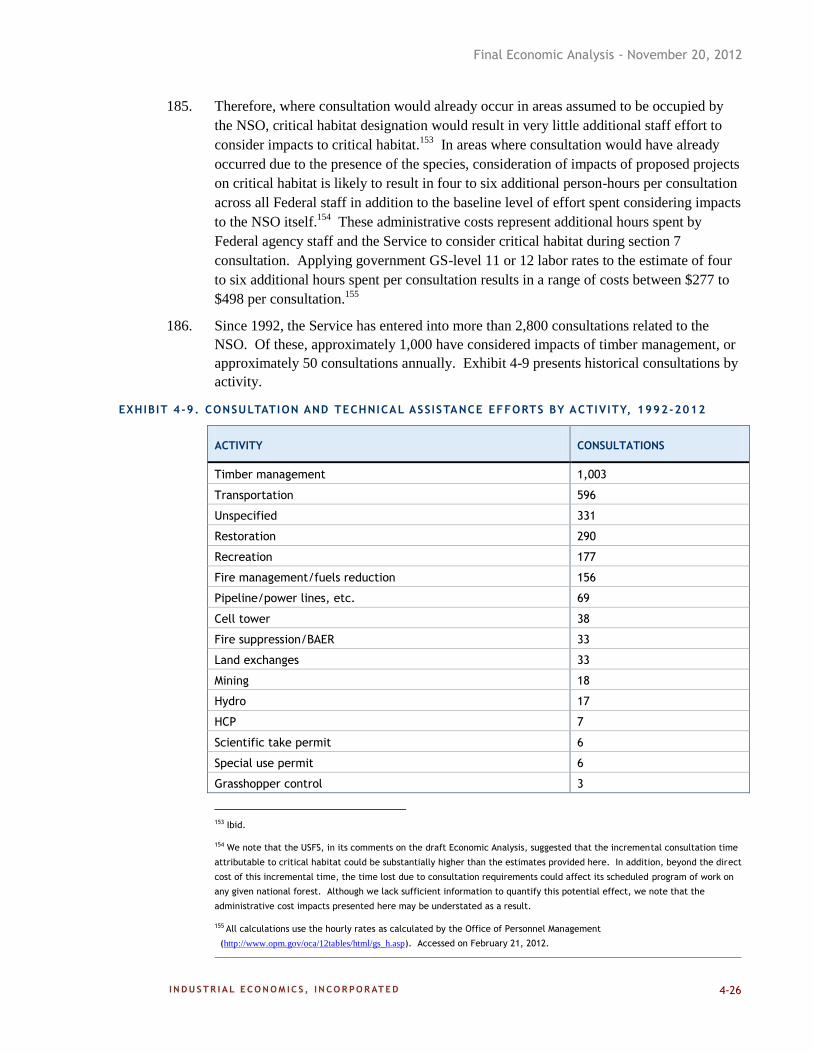
Final Economic Analysis - November 20, 2012
4-26
185. Therefore, where consultation would already occur in areas assumed to be occupied by
the NSO, critical habitat designation would result in very little additional staff effort to
consider impacts to critical habitat.153
In areas where consultation would have already
occurred due to the presence of the species, consideration of impacts of proposed projects
on critical habitat is likely to result in four to six additional person-hours per consultation
across all Federal staff in addition to the baseline level of effort spent considering impacts
to the NSO itself.154
These administrative costs represent additional hours spent by
Federal agency staff and the Service to consider critical habitat during section 7
consultation. Applying government GS-level 11 or 12 labor rates to the estimate of four
to six additional hours spent per consultation results in a range of costs between $277 to
$498 per consultation.155
186. Since 1992, the Service has entered into more than 2,800 consultations related to the
NSO. Of these, approximately 1,000 have considered impacts of timber management, or
approximately 50 consultations annually. Exhibit 4-9 presents historical consultations by
activity.
EXHIBIT 4-9. CONSULTATION AND TECHNICAL ASSISTANCE EFFORTS BY ACTIVITY, 1992-2012
ACTIVITY CONSULTATIONS
Timber management 1,003
Transportation 596
Unspecified 331
Restoration 290
Recreation 177
Fire management/fuels reduction 156
Pipeline/power lines, etc. 69
Cell tower 38
Fire suppression/BAER 33
Land exchanges 33
Mining 18
Hydro 17
HCP 7
Scientific take permit 6
Special use permit 6
Grasshopper control 3
153 Ibid.
154 We note that the USFS, in its comments on the draft Economic Analysis, suggested that the incremental consultation time
attributable to critical habitat could be substantially higher than the estimates provided here. In addition, beyond the direct
cost of this incremental time, the time lost due to consultation requirements could affect its scheduled program of work on
any given national forest. Although we lack sufficient information to quantify this potential effect, we note that the
administrative cost impacts presented here may be understated as a result.
155 All calculations use the hourly rates as calculated by the Office of Personnel Management
(http://www.opm.gov/oca/12tables/html/gs_h.asp). Accessed on February 21, 2012.
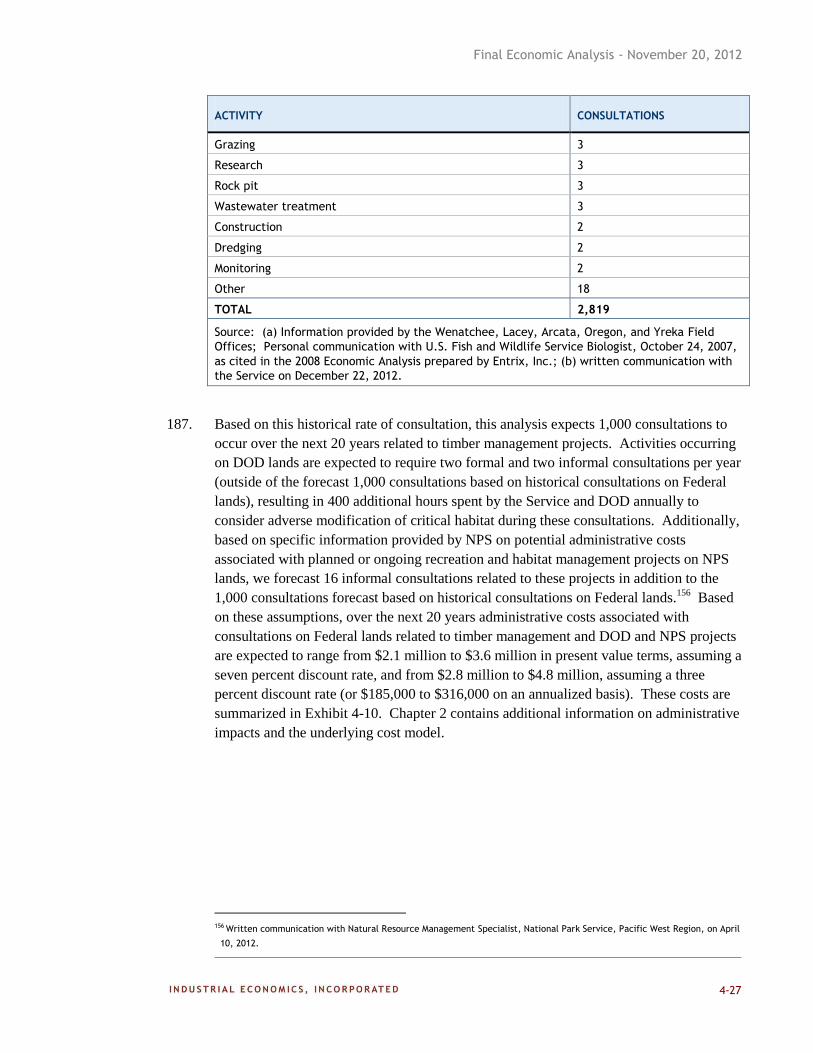
Final Economic Analysis - November 20, 2012
4-27
ACTIVITY CONSULTATIONS
Grazing 3
Research 3
Rock pit 3
Wastewater treatment 3
Construction 2
Dredging 2
Monitoring 2
Other 18
TOTAL 2,819
Source: (a) Information provided by the Wenatchee, Lacey, Arcata, Oregon, and Yreka Field
Offices; Personal communication with U.S. Fish and Wildlife Service Biologist, October 24, 2007,
as cited in the 2008 Economic Analysis prepared by Entrix, Inc.; (b) written communication with
the Service on December 22, 2012.
187. Based on this historical rate of consultation, this analysis expects 1,000 consultations to
occur over the next 20 years related to timber management projects. Activities occurring
on DOD lands are expected to require two formal and two informal consultations per year
(outside of the forecast 1,000 consultations based on historical consultations on Federal
lands), resulting in 400 additional hours spent by the Service and DOD annually to
consider adverse modification of critical habitat during these consultations. Additionally,
based on specific information provided by NPS on potential administrative costs
associated with planned or ongoing recreation and habitat management projects on NPS
lands, we forecast 16 informal consultations related to these projects in addition to the
1,000 consultations forecast based on historical consultations on Federal lands.156
Based
on these assumptions, over the next 20 years administrative costs associated with
consultations on Federal lands related to timber management and DOD and NPS projects
are expected to range from $2.1 million to $3.6 million in present value terms, assuming a
seven percent discount rate, and from $2.8 million to $4.8 million, assuming a three
percent discount rate (or $185,000 to $316,000 on an annualized basis). These costs are
summarized in Exhibit 4-10. Chapter 2 contains additional information on administrative
impacts and the underlying cost model.
156 Written communication with Natural Resource Management Specialist, National Park Service, Pacific West Region, on April
10, 2012.
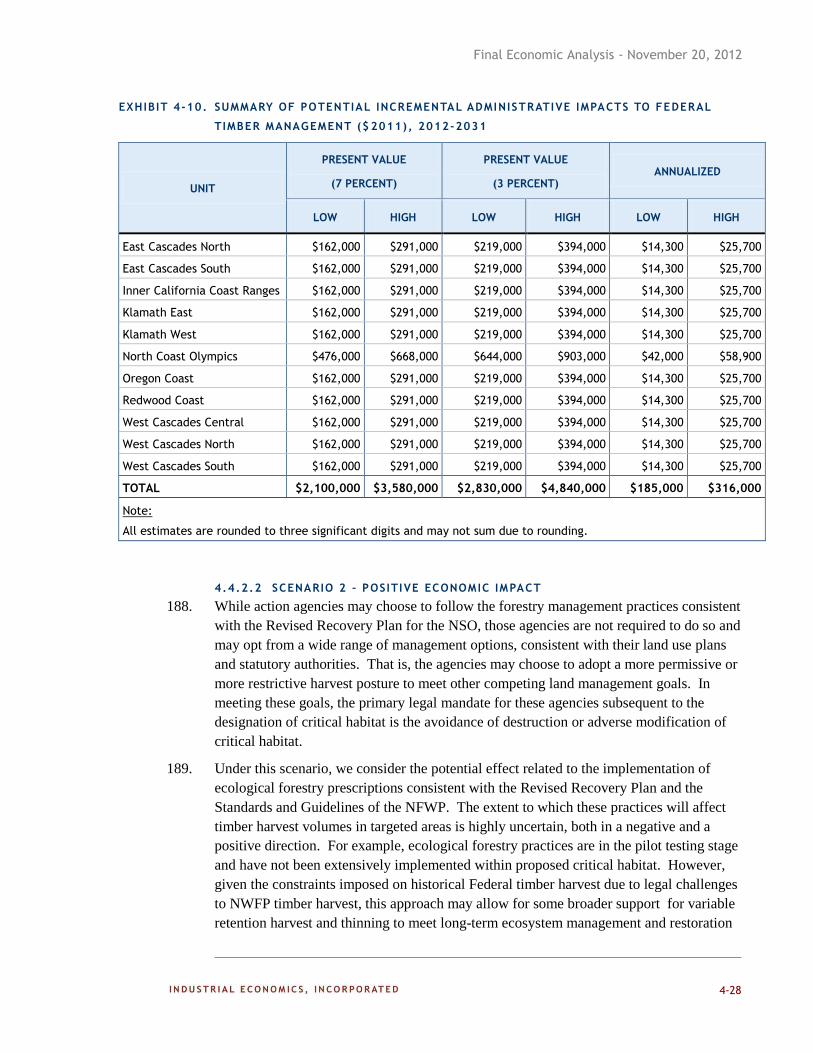
Final Economic Analysis - November 20, 2012
4-28
EXHIBIT 4-10. SUMMARY OF POTENTIAL INCREMENTAL ADMINISTRATIVE IMPACTS TO FEDERAL
TIMBER MANAGEMENT ($ 2011), 2012-2031
UNIT
PRESENT VALUE
(7 PERCENT)
PRESENT VALUE
(3 PERCENT) ANNUALIZED
LOW HIGH LOW HIGH LOW HIGH
East Cascades North $162,000 $291,000 $219,000 $394,000 $14,300 $25,700
East Cascades South $162,000 $291,000 $219,000 $394,000 $14,300 $25,700
Inner California Coast Ranges $162,000 $291,000 $219,000 $394,000 $14,300 $25,700
Klamath East $162,000 $291,000 $219,000 $394,000 $14,300 $25,700
Klamath West $162,000 $291,000 $219,000 $394,000 $14,300 $25,700
North Coast Olympics $476,000 $668,000 $644,000 $903,000 $42,000 $58,900
Oregon Coast $162,000 $291,000 $219,000 $394,000 $14,300 $25,700
Redwood Coast $162,000 $291,000 $219,000 $394,000 $14,300 $25,700
West Cascades Central $162,000 $291,000 $219,000 $394,000 $14,300 $25,700
West Cascades North $162,000 $291,000 $219,000 $394,000 $14,300 $25,700
West Cascades South $162,000 $291,000 $219,000 $394,000 $14,300 $25,700
TOTAL $2,100,000 $3,580,000 $2,830,000 $4,840,000 $185,000 $316,000
Note:
All estimates are rounded to three significant digits and may not sum due to rounding.
4.4.2.2 SCENARIO 2 – POSITIVE ECONOMIC IMPACT
188. While action agencies may choose to follow the forestry management practices consistent
with the Revised Recovery Plan for the NSO, those agencies are not required to do so and
may opt from a wide range of management options, consistent with their land use plans
and statutory authorities. That is, the agencies may choose to adopt a more permissive or
more restrictive harvest posture to meet other competing land management goals. In
meeting these goals, the primary legal mandate for these agencies subsequent to the
designation of critical habitat is the avoidance of destruction or adverse modification of
critical habitat.
189. Under this scenario, we consider the potential effect related to the implementation of
ecological forestry prescriptions consistent with the Revised Recovery Plan and the
Standards and Guidelines of the NFWP. The extent to which these practices will affect
timber harvest volumes in targeted areas is highly uncertain, both in a negative and a
positive direction. For example, ecological forestry practices are in the pilot testing stage
and have not been extensively implemented within proposed critical habitat. However,
given the constraints imposed on historical Federal timber harvest due to legal challenges
to NWFP timber harvest, this approach may allow for some broader support for variable
retention harvest and thinning to meet long-term ecosystem management and restoration
Final Economic Analysis - November 20, 2012
4-29
goals. Such an outcome would not likely result in harvest levels lower than Scenario 1
above, and it may result in a net increase in harvest in some areas.
190. Compared to actual timber harvest levels in recent years, the Service and available
literature suggest that there is the potential for increases in timber harvest on some
Federal matrix lands if the USFS and BLM apply the considerations in the proposed
critical habitat rule for active management in dry, mixed, and moist forests. The best
opportunity for increases in Federal timber harvest, compared to the recent status quo,
involve a mix of thinning and variable retention prescriptions in younger matrix forests
consistent with existing standards and guidelines of the NWFP. The proposed critical
habitat rule considers these methods and provides considerations for how to apply them
in a manner consistent with NSO recovery and to avoid destruction and adverse
modification of critical habitat.
191. Some published literature and reports exist that outline how these forestry practices might
affect timber harvest practices and volumes. Ecological forestry methods are being
applied in the Pacific Northwest, in part, in an effort to better reconcile competing
economic and conservation goals.157
Specifically, we rely on research published by Dr.
K. Norman Johnson and Dr. Jerry F. Franklin to support the analysis.158
This research
contemplates that implementation of ecological forest practices, as envisioned by the
Franklin/Johnson Moist Forest restoration strategy, could produce about two-thirds of the
per-acre timber yields anticipated by the NWFP.159
192. We utilize this ratio, in combination with the ratio of historical actual harvest volumes
relative to NWFP planned volumes, to derive an estimate of potential increases in harvest
levels relative to the regulatory baseline. Historic timber harvest on Federal lands have
equaled approximately 60 percent of the probable sale quantity (PSQ) envisioned under
the NWFP.160
The two-thirds timber harvest yield resulting from ecological forestry
practices as envisioned by Johnson and Franklin is also based on PSQ under the NWFP.
Thus, for purposes of illustrating a potential increase in timber harvest resulting from
critical habitat, we scale baseline projections up by 10 percent (0.66 ÷ 0.60 = 1.10).
193. We note two important caveats to this scenario. First, the scenario contemplates the
Franklin/Johnson Moist Forest restoration strategy as a rough proxy for implementing
157 See, for example, Aubry, K.B., C.B. Halpern, and C.E. Peterson. 2009. “Variable-retention Harvests in the Pacific
Northwest: A Review of Short-term Findings from the DEMO Study.” Forest Ecology and Management 258 (2009): 398-408;
Baker, S., Seeking a Balance between Forestry and Biodiversity the Role of Variable Retention Silviculture, Forest & Wood
Products Australia Limited, PDG167-0910, 2011; Carey, A.B., Active and Passive Forest Management for Multiple Values,
Northwest Naturalist, 87(1):18-30, 2006; North, M.P., and W.S. Keeton, Emulating Natural Disturbance Regimes: An Emerging
Approach for Sustainable Forest Management, Pgs. 341-372 in Lafortezza, R, et al. eds., Patterns and Processes in Forest
Landscapes, Springer Science+Business Media, 2008.
158 Dr. K. Norman Johnson and Dr. Jerry F. Franklin, “Southwest Oregon Secretarial Pilot Projects on BLM Lands: Our
Experience So Far and Broader Considerations for Long-term Plans, February 15, 2012; accessed at:
http://www.blm.gov/or/resources/forests/index.php
159 Ibid, p. 70.
160 Historical harvest levels and PSQs obtained from USFS, Pacific Northwest Region, Northwest Forest Plan—The First 15
Years (1994-2008): Socioeconomic Status and Trends, R6-RPM-TP-03-2011, 2011.
Final Economic Analysis - November 20, 2012
4-30
ecological forestry prescriptions in matrix lands that are likely to be unoccupied by the
NSO. However, management strategies in dry forests would likely be materially
different. For example, dry forest guidelines would be relatively more similar to existing
forest management strategies (i.e., thinning) in those areas. The data available for our
analysis did not separate younger forest stands in the matrix into moist versus dry forest
types. In addition, any potential variable retention regeneration harvest that might
possibly be applied to such stands would most likely only be utilized if such stands were
of sufficient size to be commercially viable. Our evaluation is based on a single
classification of younger forest stands, and does not provide for the ability to discriminate
between stands that may be commercially viable versus those that are not. Thus, the
potential increases in timber volume that may be realized on younger forest stands in the
matrix as presented here are likely an overestimate
4.4.2.3 SCENARIO 3 – NEGATIVE ECONOMIC IMPACT
194. In this scenario, we assume that Federal land managers will choose to reduce their timber
harvest levels from recent past harvest. That is, they will conclude that some of their
timber harvest activities would be incompatible with the goals of critical habitat, and they
will decide to reduce or not plan timber harvest in some portion of the incremental matrix
forests that are within proposed critical habitat. If BLM or USFS does reduce planned
harvest due to critical habitat, it will likely be in those portions of the matrix that they
believe have greater value to NSO recovery and should not be subject to timber
management.
195. Accordingly, we contemplate a third scenario where harvest levels are reduced under the
critical habitat regime relative to the baseline. The potential magnitude of this effect is
uncertain. For purposes of illustration, we posit a hypothetical outcome where future
harvest levels decrease 20 percent from projected levels. This effect likely represents a
maximum upper bound of possible negative impacts. In the development of both
scenarios, we have attempted to identify reasonable upper and lower bounds on timber
harvest effects, to capture the full range of possible economic outcomes.
4.4.3 STUMPAGE VALUES
196. We value the incremental change in harvest volumes using representative historical prices
from timber sales on Federal lands. We note that prices vary across forest, land manager,
and year. Furthermore, future prices are uncertain. Exhibit 4-11 shows annual average
prices from Federal timber sales on BLM and USFS managed lands between 2000 and
2011 (measured in 2011 dollars).161
The data aggregate sales across the entire jurisdiction
161 One public comment questioned whether stumpage prices for Federal timber sales adequately recover the total cost to
taxpayers of producing the timber. The entity argues that historically, revenues from Federal timber sales have been less
than the costs to Federal agencies of cost of managing the forests for sales; thus, reducing the amount of timber sold would
result in a net cost savings to taxpayers. The controversy surrounding this issue is summarized in a 2004 report by the
Congressional Research Service (CRS) (Gorte, R.W., Below Cost Timber Sales: An Overview, CRS, Order Code RL32485, July
21, 2004). That report notes, ““[i]nterest group estimates of ‘losses’ continue to be made public with much fanfare and
attendant news stories, but the estimates of financial results of [Forest Service] timber sales vary widely. This disparity is
due to differences in basic approach – profit-and-loss, cash flow, or other approach – and in assumptions about relevant
costs” (summary page). In particular, CRS notes differing assumptions regarding which Agency costs are relevant and how
to allocate those costs to specific sales may result in different answers using the same basic accounting approach.
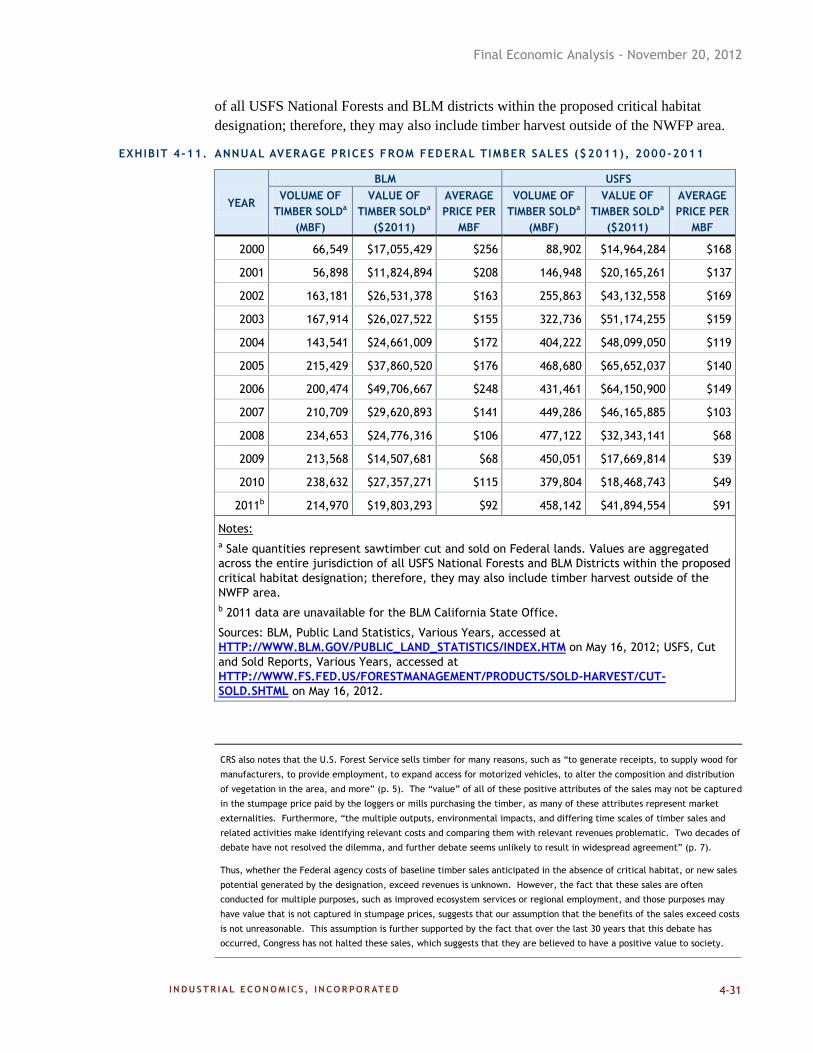
Final Economic Analysis - November 20, 2012
4-31
of all USFS National Forests and BLM districts within the proposed critical habitat
designation; therefore, they may also include timber harvest outside of the NWFP area.
EXHIBIT 4-11. ANNUAL AVERAGE PRICES FROM FEDERAL TIMBER SALES ($2011), 2000-2011
YEAR
BLM USFS
VOLUME OF
TIMBER SOLDa
(MBF)
VALUE OF
TIMBER SOLDa
($2011)
AVERAGE
PRICE PER
MBF
VOLUME OF
TIMBER SOLDa
(MBF)
VALUE OF
TIMBER SOLDa
($2011)
AVERAGE
PRICE PER
MBF
2000 66,549 $17,055,429 $256 88,902 $14,964,284 $168
2001 56,898 $11,824,894 $208 146,948 $20,165,261 $137
2002 163,181 $26,531,378 $163 255,863 $43,132,558 $169
2003 167,914 $26,027,522 $155 322,736 $51,174,255 $159
2004 143,541 $24,661,009 $172 404,222 $48,099,050 $119
2005 215,429 $37,860,520 $176 468,680 $65,652,037 $140
2006 200,474 $49,706,667 $248 431,461 $64,150,900 $149
2007 210,709 $29,620,893 $141 449,286 $46,165,885 $103
2008 234,653 $24,776,316 $106 477,122 $32,343,141 $68
2009 213,568 $14,507,681 $68 450,051 $17,669,814 $39
2010 238,632 $27,357,271 $115 379,804 $18,468,743 $49
2011b 214,970 $19,803,293 $92 458,142 $41,894,554 $91
Notes:
a Sale quantities represent sawtimber cut and sold on Federal lands. Values are aggregated
across the entire jurisdiction of all USFS National Forests and BLM Districts within the proposed
critical habitat designation; therefore, they may also include timber harvest outside of the
NWFP area.
b 2011 data are unavailable for the BLM California State Office.
Sources: BLM, Public Land Statistics, Various Years, accessed at
HTTP://WWW.BLM.GOV/PUBLIC_LAND_STATISTICS/INDEX.HTM on May 16, 2012; USFS, Cut
and Sold Reports, Various Years, accessed at
HTTP://WWW.FS.FED.US/FORESTMANAGEMENT/PRODUCTS/SOLD-HARVEST/CUT-
SOLD.SHTML on May 16, 2012.
CRS also notes that the U.S. Forest Service sells timber for many reasons, such as “to generate receipts, to supply wood for
manufacturers, to provide employment, to expand access for motorized vehicles, to alter the composition and distribution
of vegetation in the area, and more” (p. 5). The “value” of all of these positive attributes of the sales may not be captured
in the stumpage price paid by the loggers or mills purchasing the timber, as many of these attributes represent market
externalities. Furthermore, “the multiple outputs, environmental impacts, and differing time scales of timber sales and
related activities make identifying relevant costs and comparing them with relevant revenues problematic. Two decades of
debate have not resolved the dilemma, and further debate seems unlikely to result in widespread agreement” (p. 7).
Thus, whether the Federal agency costs of baseline timber sales anticipated in the absence of critical habitat, or new sales
potential generated by the designation, exceed revenues is unknown. However, the fact that these sales are often
conducted for multiple purposes, such as improved ecosystem services or regional employment, and those purposes may
have value that is not captured in stumpage prices, suggests that our assumption that the benefits of the sales exceed costs
is not unreasonable. This assumption is further supported by the fact that over the last 30 years that this debate has
occurred, Congress has not halted these sales, which suggests that they are believed to have a positive value to society.
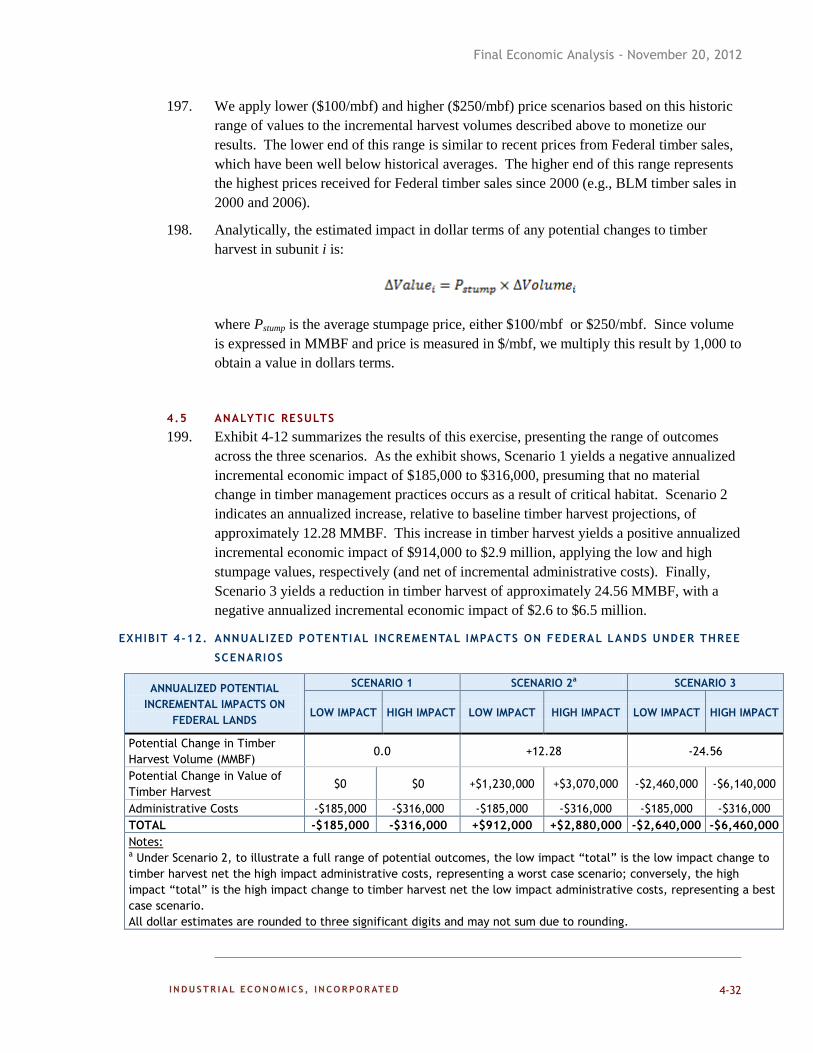
Final Economic Analysis - November 20, 2012
4-32
197. We apply lower ($100/mbf) and higher ($250/mbf) price scenarios based on this historic
range of values to the incremental harvest volumes described above to monetize our
results. The lower end of this range is similar to recent prices from Federal timber sales,
which have been well below historical averages. The higher end of this range represents
the highest prices received for Federal timber sales since 2000 (e.g., BLM timber sales in
2000 and 2006).
198. Analytically, the estimated impact in dollar terms of any potential changes to timber
harvest in subunit i is:
where Pstump is the average stumpage price, either $100/mbf or $250/mbf. Since volume
is expressed in MMBF and price is measured in $/mbf, we multiply this result by 1,000 to
obtain a value in dollars terms.
4.5 ANALYTIC RESULTS
199. Exhibit 4-12 summarizes the results of this exercise, presenting the range of outcomes
across the three scenarios. As the exhibit shows, Scenario 1 yields a negative annualized
incremental economic impact of $185,000 to $316,000, presuming that no material
change in timber management practices occurs as a result of critical habitat. Scenario 2
indicates an annualized increase, relative to baseline timber harvest projections, of
approximately 12.28 MMBF. This increase in timber harvest yields a positive annualized
incremental economic impact of $914,000 to $2.9 million, applying the low and high
stumpage values, respectively (and net of incremental administrative costs). Finally,
Scenario 3 yields a reduction in timber harvest of approximately 24.56 MMBF, with a
negative annualized incremental economic impact of $2.6 to $6.5 million.
EXHIBIT 4-12. ANNUALIZED POTENTIAL INCREMENTAL IMPACTS ON FEDERAL LANDS UNDER THREE
SCENARIOS
ANNUALIZED POTENTIAL
INCREMENTAL IMPACTS ON
FEDERAL LANDS
SCENARIO 1 SCENARIO 2a SCENARIO 3
LOW IMPACT HIGH IMPACT LOW IMPACT HIGH IMPACT LOW IMPACT HIGH IMPACT
Potential Change in Timber
Harvest Volume (MMBF) 0.0 +12.28 -24.56
Potential Change in Value of
Timber Harvest $0 $0 +$1,230,000 +$3,070,000 -$2,460,000 -$6,140,000
Administrative Costs -$185,000 -$316,000 -$185,000 -$316,000 -$185,000 -$316,000
TOTAL -$185,000 -$316,000 +$912,000 +$2,880,000 -$2,640,000 -$6,460,000
Notes: a Under Scenario 2, to illustrate a full range of potential outcomes, the low impact “total” is the low impact change to
timber harvest net the high impact administrative costs, representing a worst case scenario; conversely, the high
impact “total” is the high impact change to timber harvest net the low impact administrative costs, representing a best
case scenario.
All dollar estimates are rounded to three significant digits and may not sum due to rounding.
Final Economic Analysis - November 20, 2012
4-33
200. Exhibit 4-13 summarizes the annualized potential incremental impacts to Federal timber
harvest by critical habitat subunit under Scenario 2 and Scenario 3. Note that we do not
explicitly model administrative costs by subunit. As the exhibit shows, across subunits
the annualized potential incremental impacts to timber harvest range from no change to a
positive impact of $475,000 under Scenario 2 (high price) or a negative impact of
$951,000 under Scenario 3 (high price). Appendix D contains additional information on
potential incremental effects to Federal timber harvest and the underlying cost model.
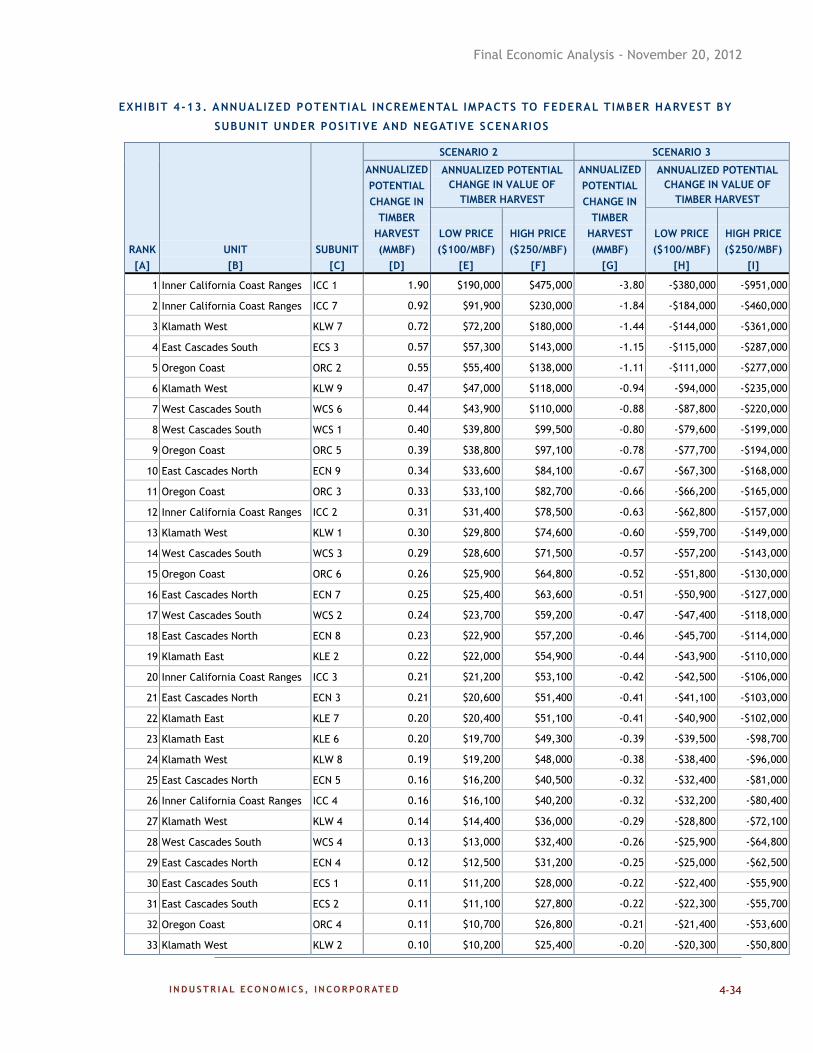
Final Economic Analysis - November 20, 2012
4-34
EXHIBIT 4-13. ANNUALIZED POTENTIAL INCREMENTAL IMPACTS TO FEDERAL TIMBER HARVEST BY
SUBUNIT UNDER POSITIVE AND NEGATIVE SCENARIOS
RANK
[A]
UNIT
[B]
SUBUNIT
[C]
SCENARIO 2 SCENARIO 3
ANNUALIZED
POTENTIAL
CHANGE IN
TIMBER
HARVEST
(MMBF)
[D]
ANNUALIZED POTENTIAL
CHANGE IN VALUE OF
TIMBER HARVEST
ANNUALIZED
POTENTIAL
CHANGE IN
TIMBER
HARVEST
(MMBF)
[G]
ANNUALIZED POTENTIAL
CHANGE IN VALUE OF
TIMBER HARVEST
LOW PRICE
($100/MBF)
[E]
HIGH PRICE
($250/MBF)
[F]
LOW PRICE
($100/MBF)
[H]
HIGH PRICE
($250/MBF)
[I]
1 Inner California Coast Ranges ICC 1 1.90 $190,000 $475,000 -3.80 -$380,000 -$951,000
2 Inner California Coast Ranges ICC 7 0.92 $91,900 $230,000 -1.84 -$184,000 -$460,000
3 Klamath West KLW 7 0.72 $72,200 $180,000 -1.44 -$144,000 -$361,000
4 East Cascades South ECS 3 0.57 $57,300 $143,000 -1.15 -$115,000 -$287,000
5 Oregon Coast ORC 2 0.55 $55,400 $138,000 -1.11 -$111,000 -$277,000
6 Klamath West KLW 9 0.47 $47,000 $118,000 -0.94 -$94,000 -$235,000
7 West Cascades South WCS 6 0.44 $43,900 $110,000 -0.88 -$87,800 -$220,000
8 West Cascades South WCS 1 0.40 $39,800 $99,500 -0.80 -$79,600 -$199,000
9 Oregon Coast ORC 5 0.39 $38,800 $97,100 -0.78 -$77,700 -$194,000
10 East Cascades North ECN 9 0.34 $33,600 $84,100 -0.67 -$67,300 -$168,000
11 Oregon Coast ORC 3 0.33 $33,100 $82,700 -0.66 -$66,200 -$165,000
12 Inner California Coast Ranges ICC 2 0.31 $31,400 $78,500 -0.63 -$62,800 -$157,000
13 Klamath West KLW 1 0.30 $29,800 $74,600 -0.60 -$59,700 -$149,000
14 West Cascades South WCS 3 0.29 $28,600 $71,500 -0.57 -$57,200 -$143,000
15 Oregon Coast ORC 6 0.26 $25,900 $64,800 -0.52 -$51,800 -$130,000
16 East Cascades North ECN 7 0.25 $25,400 $63,600 -0.51 -$50,900 -$127,000
17 West Cascades South WCS 2 0.24 $23,700 $59,200 -0.47 -$47,400 -$118,000
18 East Cascades North ECN 8 0.23 $22,900 $57,200 -0.46 -$45,700 -$114,000
19 Klamath East KLE 2 0.22 $22,000 $54,900 -0.44 -$43,900 -$110,000
20 Inner California Coast Ranges ICC 3 0.21 $21,200 $53,100 -0.42 -$42,500 -$106,000
21 East Cascades North ECN 3 0.21 $20,600 $51,400 -0.41 -$41,100 -$103,000
22 Klamath East KLE 7 0.20 $20,400 $51,100 -0.41 -$40,900 -$102,000
23 Klamath East KLE 6 0.20 $19,700 $49,300 -0.39 -$39,500 -$98,700
24 Klamath West KLW 8 0.19 $19,200 $48,000 -0.38 -$38,400 -$96,000
25 East Cascades North ECN 5 0.16 $16,200 $40,500 -0.32 -$32,400 -$81,000
26 Inner California Coast Ranges ICC 4 0.16 $16,100 $40,200 -0.32 -$32,200 -$80,400
27 Klamath West KLW 4 0.14 $14,400 $36,000 -0.29 -$28,800 -$72,100
28 West Cascades South WCS 4 0.13 $13,000 $32,400 -0.26 -$25,900 -$64,800
29 East Cascades North ECN 4 0.12 $12,500 $31,200 -0.25 -$25,000 -$62,500
30 East Cascades South ECS 1 0.11 $11,200 $28,000 -0.22 -$22,400 -$55,900
31 East Cascades South ECS 2 0.11 $11,100 $27,800 -0.22 -$22,300 -$55,700
32 Oregon Coast ORC 4 0.11 $10,700 $26,800 -0.21 -$21,400 -$53,600
33 Klamath West KLW 2 0.10 $10,200 $25,400 -0.20 -$20,300 -$50,800
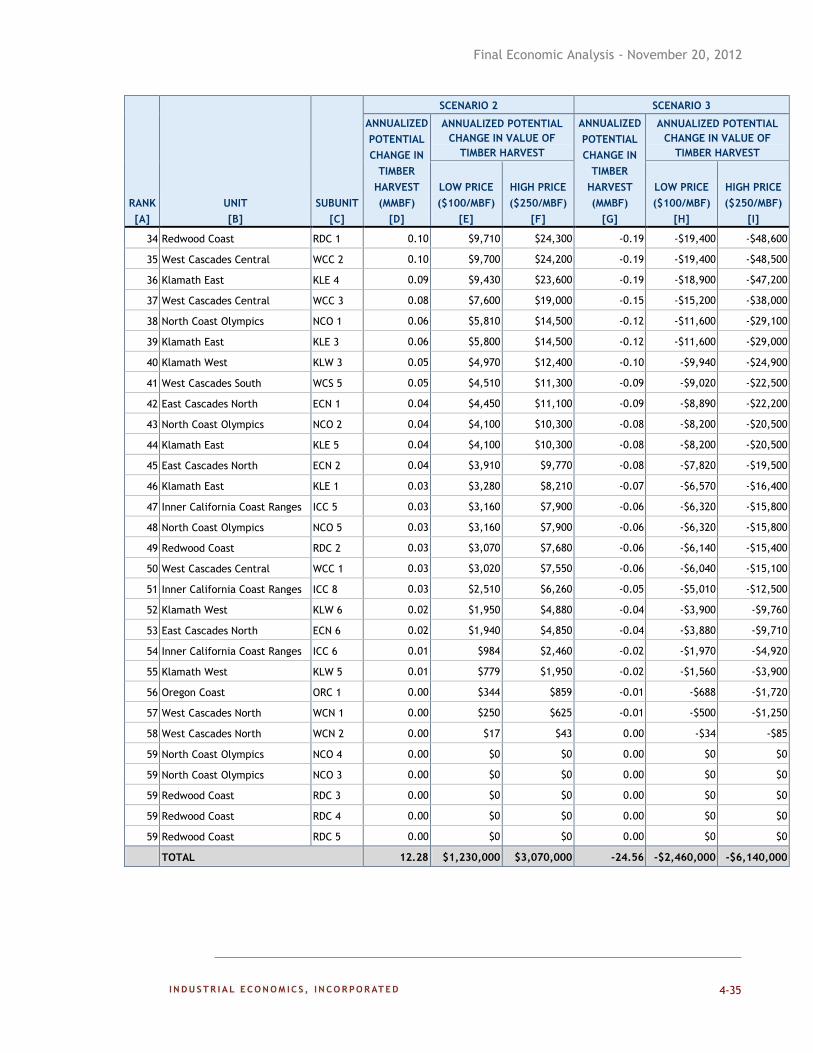
Final Economic Analysis - November 20, 2012
4-35
RANK
[A]
UNIT
[B]
SUBUNIT
[C]
SCENARIO 2 SCENARIO 3
ANNUALIZED
POTENTIAL
CHANGE IN
TIMBER
HARVEST
(MMBF)
[D]
ANNUALIZED POTENTIAL
CHANGE IN VALUE OF
TIMBER HARVEST
ANNUALIZED
POTENTIAL
CHANGE IN
TIMBER
HARVEST
(MMBF)
[G]
ANNUALIZED POTENTIAL
CHANGE IN VALUE OF
TIMBER HARVEST
LOW PRICE
($100/MBF)
[E]
HIGH PRICE
($250/MBF)
[F]
LOW PRICE
($100/MBF)
[H]
HIGH PRICE
($250/MBF)
[I]
34 Redwood Coast RDC 1 0.10 $9,710 $24,300 -0.19 -$19,400 -$48,600
35 West Cascades Central WCC 2 0.10 $9,700 $24,200 -0.19 -$19,400 -$48,500
36 Klamath East KLE 4 0.09 $9,430 $23,600 -0.19 -$18,900 -$47,200
37 West Cascades Central WCC 3 0.08 $7,600 $19,000 -0.15 -$15,200 -$38,000
38 North Coast Olympics NCO 1 0.06 $5,810 $14,500 -0.12 -$11,600 -$29,100
39 Klamath East KLE 3 0.06 $5,800 $14,500 -0.12 -$11,600 -$29,000
40 Klamath West KLW 3 0.05 $4,970 $12,400 -0.10 -$9,940 -$24,900
41 West Cascades South WCS 5 0.05 $4,510 $11,300 -0.09 -$9,020 -$22,500
42 East Cascades North ECN 1 0.04 $4,450 $11,100 -0.09 -$8,890 -$22,200
43 North Coast Olympics NCO 2 0.04 $4,100 $10,300 -0.08 -$8,200 -$20,500
44 Klamath East KLE 5 0.04 $4,100 $10,300 -0.08 -$8,200 -$20,500
45 East Cascades North ECN 2 0.04 $3,910 $9,770 -0.08 -$7,820 -$19,500
46 Klamath East KLE 1 0.03 $3,280 $8,210 -0.07 -$6,570 -$16,400
47 Inner California Coast Ranges ICC 5 0.03 $3,160 $7,900 -0.06 -$6,320 -$15,800
48 North Coast Olympics NCO 5 0.03 $3,160 $7,900 -0.06 -$6,320 -$15,800
49 Redwood Coast RDC 2 0.03 $3,070 $7,680 -0.06 -$6,140 -$15,400
50 West Cascades Central WCC 1 0.03 $3,020 $7,550 -0.06 -$6,040 -$15,100
51 Inner California Coast Ranges ICC 8 0.03 $2,510 $6,260 -0.05 -$5,010 -$12,500
52 Klamath West KLW 6 0.02 $1,950 $4,880 -0.04 -$3,900 -$9,760
53 East Cascades North ECN 6 0.02 $1,940 $4,850 -0.04 -$3,880 -$9,710
54 Inner California Coast Ranges ICC 6 0.01 $984 $2,460 -0.02 -$1,970 -$4,920
55 Klamath West KLW 5 0.01 $779 $1,950 -0.02 -$1,560 -$3,900
56 Oregon Coast ORC 1 0.00 $344 $859 -0.01 -$688 -$1,720
57 West Cascades North WCN 1 0.00 $250 $625 -0.01 -$500 -$1,250
58 West Cascades North WCN 2 0.00 $17 $43 0.00 -$34 -$85
59 North Coast Olympics NCO 4 0.00 $0 $0 0.00 $0 $0
59 North Coast Olympics NCO 3 0.00 $0 $0 0.00 $0 $0
59 Redwood Coast RDC 3 0.00 $0 $0 0.00 $0 $0
59 Redwood Coast RDC 4 0.00 $0 $0 0.00 $0 $0
59 Redwood Coast RDC 5 0.00 $0 $0 0.00 $0 $0
TOTAL 12.28 $1,230,000 $3,070,000 -24.56 -$2,460,000 -$6,140,000
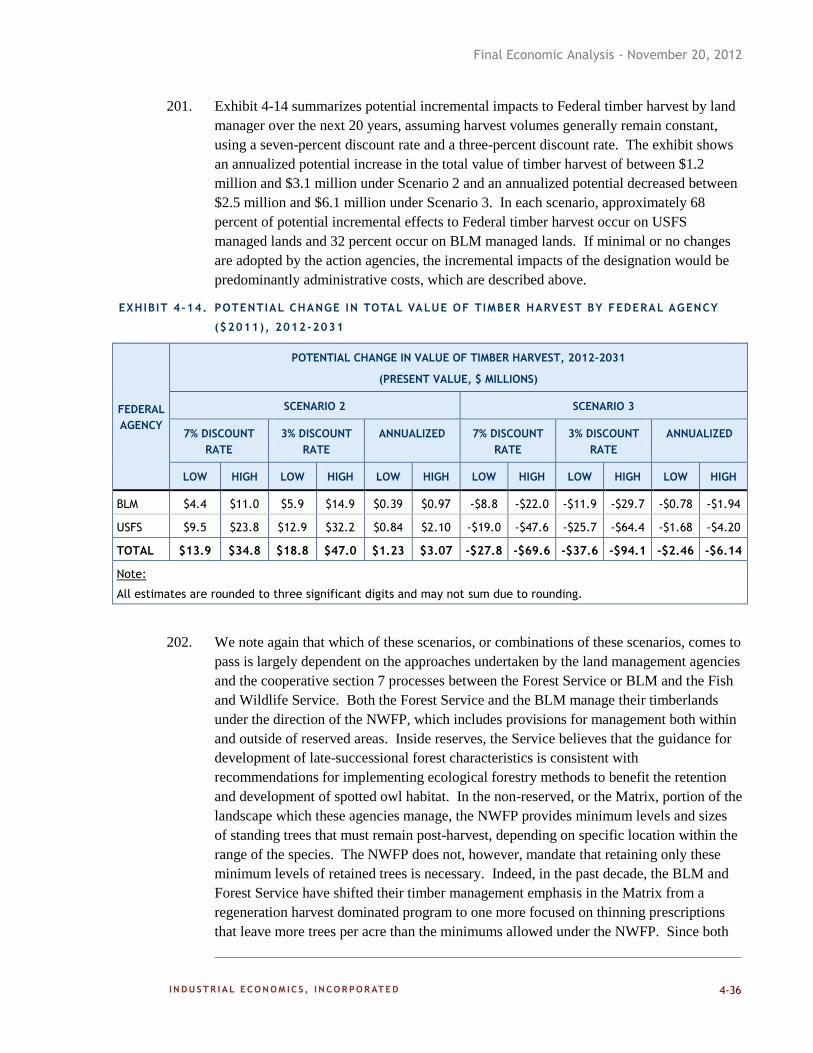
Final Economic Analysis - November 20, 2012
4-36
201. Exhibit 4-14 summarizes potential incremental impacts to Federal timber harvest by land
manager over the next 20 years, assuming harvest volumes generally remain constant,
using a seven-percent discount rate and a three-percent discount rate. The exhibit shows
an annualized potential increase in the total value of timber harvest of between $1.2
million and $3.1 million under Scenario 2 and an annualized potential decreased between
$2.5 million and $6.1 million under Scenario 3. In each scenario, approximately 68
percent of potential incremental effects to Federal timber harvest occur on USFS
managed lands and 32 percent occur on BLM managed lands. If minimal or no changes
are adopted by the action agencies, the incremental impacts of the designation would be
predominantly administrative costs, which are described above.
EXHIBIT 4-14. POTENTIAL CHANGE IN TOTAL VALUE OF TIMBER HARVEST BY FEDERAL AGENCY
($2011), 2012-2031
FEDERAL
AGENCY
POTENTIAL CHANGE IN VALUE OF TIMBER HARVEST, 2012-2031
(PRESENT VALUE, $ MILLIONS)
SCENARIO 2 SCENARIO 3
7% DISCOUNT
RATE
3% DISCOUNT
RATE
ANNUALIZED 7% DISCOUNT
RATE
3% DISCOUNT
RATE
ANNUALIZED
LOW HIGH LOW HIGH LOW HIGH LOW HIGH LOW HIGH LOW HIGH
BLM $4.4 $11.0 $5.9 $14.9 $0.39 $0.97 -$8.8 -$22.0 -$11.9 -$29.7 -$0.78 -$1.94
USFS $9.5 $23.8 $12.9 $32.2 $0.84 $2.10 -$19.0 -$47.6 -$25.7 -$64.4 -$1.68 -$4.20
TOTAL $13.9 $34.8 $18.8 $47.0 $1.23 $3.07 -$27.8 -$69.6 -$37.6 -$94.1 -$2.46 -$6.14
Note:
All estimates are rounded to three significant digits and may not sum due to rounding.
202. We note again that which of these scenarios, or combinations of these scenarios, comes to
pass is largely dependent on the approaches undertaken by the land management agencies
and the cooperative section 7 processes between the Forest Service or BLM and the Fish
and Wildlife Service. Both the Forest Service and the BLM manage their timberlands
under the direction of the NWFP, which includes provisions for management both within
and outside of reserved areas. Inside reserves, the Service believes that the guidance for
development of late-successional forest characteristics is consistent with
recommendations for implementing ecological forestry methods to benefit the retention
and development of spotted owl habitat. In the non-reserved, or the Matrix, portion of the
landscape which these agencies manage, the NWFP provides minimum levels and sizes
of standing trees that must remain post-harvest, depending on specific location within the
range of the species. The NWFP does not, however, mandate that retaining only these
minimum levels of retained trees is necessary. Indeed, in the past decade, the BLM and
Forest Service have shifted their timber management emphasis in the Matrix from a
regeneration harvest dominated program to one more focused on thinning prescriptions
that leave more trees per acre than the minimums allowed under the NWFP. Since both
Final Economic Analysis - November 20, 2012
4-37
the BLM and Forest Service have a track record of planning and implementing these
thinning sales, the Service believes there will be a smooth transition to designing and
implementing timber sales that are consistent with the ecological forestry
recommendations in the Revised Recovery Plan and the proposed critical habitat
designation and with the green-tree retention levels of the NWFP. We mention, however,
that the timing of this implementation is uncertain. Thus, Scenario 1 may be more
representative of likely outcomes in the near term.
4.6 ADDITIONAL SENSITIVITY ANALYSIS
203. As indicated above, this analysis develops one baseline projection for future timber
harvest on Federal lands, and then utilizes three scenarios to measure potential
incremental changes to timber harvest from this baseline resulting from the proposed
designation. Several comments submitted during the public comment period provided
information to inform certain alternative assumptions concerning the baseline timber
harvest projection. In this section, we test these alternative assumptions.
204. Specifically, BLM and USFS suggested certain alterations to the baseline timber harvest
projection. The details of these alterations include:
a. BLM: Information provided by the BLM Oregon State Office asserts that
occupancy in BLM matrix lands with NSO habitat may be overstated.
Specifically, BLM personnel represent that median home range data imply that a
higher percentage of acres of regular to lower quality NSO habitat are likely to be
unoccupied than the 6.5 percent contemplated in the above analysis.162
While
there is considerable uncertainty regarding precise locations, BLM estimates that
approximately 50 percent of regular to lower quality habitat is likely to be
unoccupied by the NSO, while a much lower percentage of structurally complex
NSO habitat is likely to be unoccupied. BLM also provided data showing that
approximately 54 percent of NSO habitat is structurally complex habitat, while
the remaining 46 percent consists of other NSO habitat.163
Therefore, we
contemplate a sensitivity analysis in which 6.5 percent of structurally complex
NSO habitat and 50 percent of other NSO habitat is likely to be unoccupied.
Overall, this implies that 26.6 percent of NSO habitat on BLM matrix lands is
likely to be unoccupied.164
Therefore, this sensitivity analysis includes an
additional 59,747 acres of BLM matrix lands with NSO habitat that is likely to
unoccupied where potential incremental impacts to timber harvest may occur.
Overall, this sensitivity analysis contemplates potential incremental changes in
timber harvest on 1,449,534 acres of Federal matrix lands compared to 1,389,787
acres as described in the economic analysis above (a 4.3 percent increase).
162 Information provided during public comment period from BLM Oregon State Office.
163 Submission provided by Chris Cadwell, BLM, Oregon State Office under report entitled, “Proposed Spotted Owl Critical
Habitat – Economic Analysis Assumptions for BLM Timber Harvest Effects,” April 17, 2012.
164 We calculate the percentage of unoccupied NSO habitat as 6.5 percent unoccupied × 53.7 percent structurally complex
NSO habitat + 50 percent unoccupied × 46.2 percent other NSO habitat = 26.6 percent.
Final Economic Analysis - November 20, 2012
4-38
b. USFS: Information provided by USFS Region 6 suggests that projections based
on historical timber harvest may underestimate future levels of timber harvest.
Specifically, the Region 6 timber program is endeavoring to increase production
in FY 2013 and FY 2014.165
USFS will undertake future actions related to the
use of active forest management targeting a 20 percent increase in terms of
timber harvest volume and acres. Therefore, we contemplate a sensitivity
analysis in which the baseline timber harvest accounts for a 20 percent increase
in USFS Region 6 relative to historical yields.
205. We present the results of this sensitivity analysis in Exhibit 4-15 below. As the exhibit
shows, the alternative assumptions widen the range of annualized potential impacts to
Federal timber harvest relative to the economic analysis presented above. In the
economic analysis, the incremental impacts to timber harvest range from a potential
stumpage value increase of $2.88 million (under Scenario 2) to a potential decrease of
$6.46 million (under Scenario 3) from a baseline harvest projection of approximately
122.80 MMBF per year. In the sensitivity analyses, the baseline timber harvest
projection increases by up to an additional 27.99 MMBF per year. Therefore, the range
of incremental impacts to Federal timber harvest widens from a potential increase of
$3.58 million (under Scenario 2) to a potential decrease of $7.86 million (under Scenario
3) per year. This represents an annualized increase of $0.7 million (under Scenario 2)
and an annualized decrease of $1.4 million (under Scenario 3) relative to the results
presented above.
165 Information provided during public comment period from USFS Region 6.
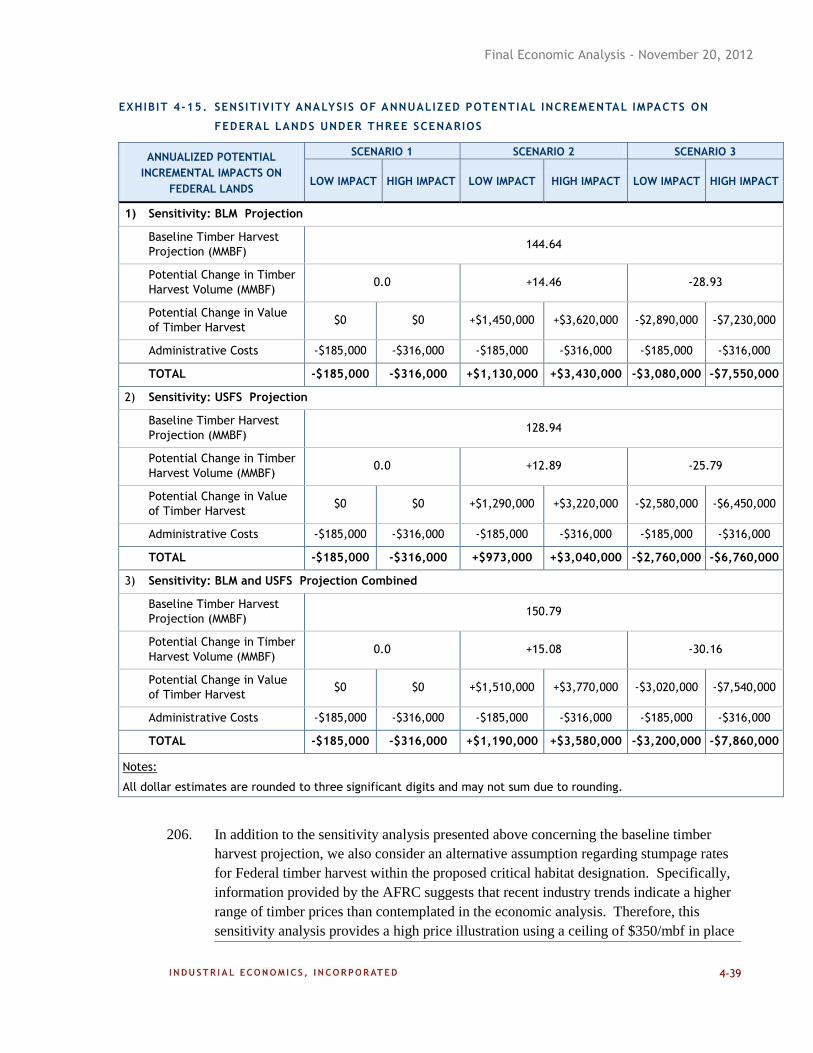
Final Economic Analysis - November 20, 2012
4-39
EXHIBIT 4-15. SENSITIV ITY ANALYSIS OF ANNUALIZED POTENTIAL INCREMENTAL IMPACTS ON
FEDERAL LANDS UNDER THREE SCENARIOS
ANNUALIZED POTENTIAL
INCREMENTAL IMPACTS ON
FEDERAL LANDS
SCENARIO 1 SCENARIO 2 SCENARIO 3
LOW IMPACT HIGH IMPACT LOW IMPACT HIGH IMPACT LOW IMPACT HIGH IMPACT
1) Sensitivity: BLM Projection
Baseline Timber Harvest
Projection (MMBF) 144.64
Potential Change in Timber
Harvest Volume (MMBF) 0.0 +14.46 -28.93
Potential Change in Value
of Timber Harvest $0 $0 +$1,450,000 +$3,620,000 -$2,890,000 -$7,230,000
Administrative Costs -$185,000 -$316,000 -$185,000 -$316,000 -$185,000 -$316,000
TOTAL -$185,000 -$316,000 +$1,130,000 +$3,430,000 -$3,080,000 -$7,550,000
2) Sensitivity: USFS Projection
Baseline Timber Harvest
Projection (MMBF) 128.94
Potential Change in Timber
Harvest Volume (MMBF) 0.0 +12.89 -25.79
Potential Change in Value
of Timber Harvest $0 $0 +$1,290,000 +$3,220,000 -$2,580,000 -$6,450,000
Administrative Costs -$185,000 -$316,000 -$185,000 -$316,000 -$185,000 -$316,000
TOTAL -$185,000 -$316,000 +$973,000 +$3,040,000 -$2,760,000 -$6,760,000
3) Sensitivity: BLM and USFS Projection Combined
Baseline Timber Harvest
Projection (MMBF) 150.79
Potential Change in Timber
Harvest Volume (MMBF) 0.0 +15.08 -30.16
Potential Change in Value
of Timber Harvest $0 $0 +$1,510,000 +$3,770,000 -$3,020,000 -$7,540,000
Administrative Costs -$185,000 -$316,000 -$185,000 -$316,000 -$185,000 -$316,000
TOTAL -$185,000 -$316,000 +$1,190,000 +$3,580,000 -$3,200,000 -$7,860,000
Notes:
All dollar estimates are rounded to three significant digits and may not sum due to rounding.
206. In addition to the sensitivity analysis presented above concerning the baseline timber
harvest projection, we also consider an alternative assumption regarding stumpage rates
for Federal timber harvest within the proposed critical habitat designation. Specifically,
information provided by the AFRC suggests that recent industry trends indicate a higher
range of timber prices than contemplated in the economic analysis. Therefore, this
sensitivity analysis provides a high price illustration using a ceiling of $350/mbf in place
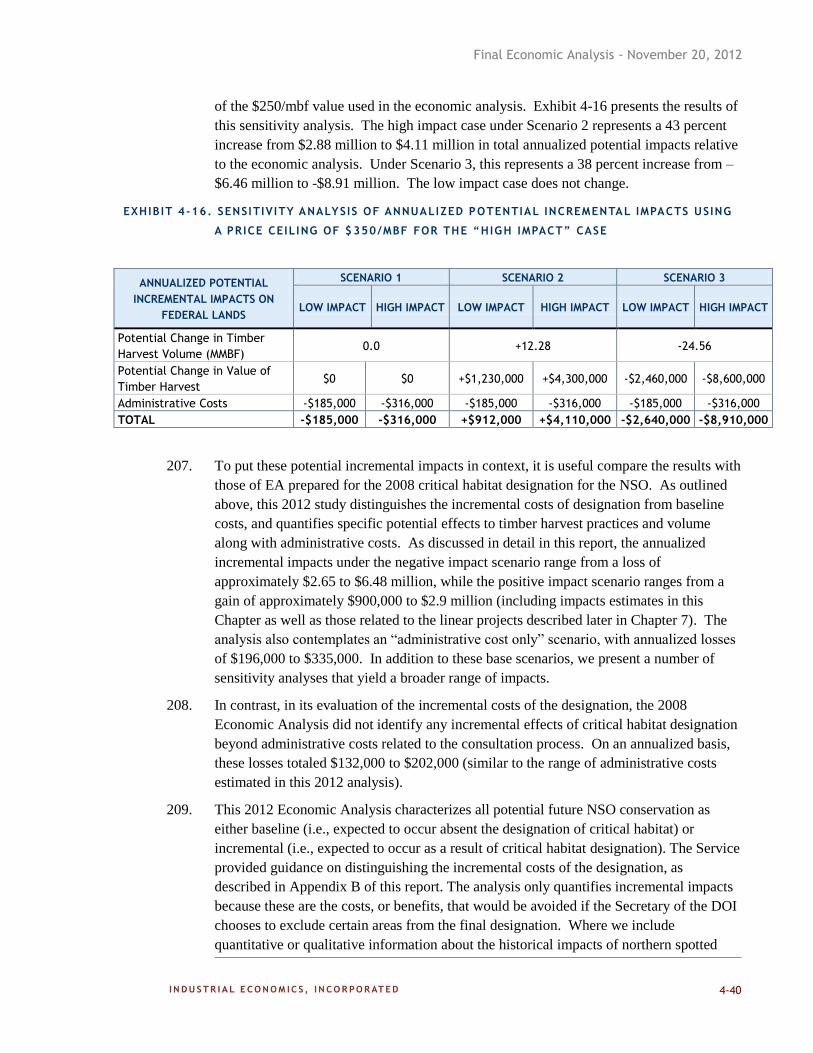
Final Economic Analysis - November 20, 2012
4-40
of the $250/mbf value used in the economic analysis. Exhibit 4-16 presents the results of
this sensitivity analysis. The high impact case under Scenario 2 represents a 43 percent
increase from $2.88 million to $4.11 million in total annualized potential impacts relative
to the economic analysis. Under Scenario 3, this represents a 38 percent increase from –
$6.46 million to -$8.91 million. The low impact case does not change.
EXHIB IT 4-16. SENSITIVITY ANALYSIS OF ANNUALIZED POTENTIAL INCREMENTAL IMPACTS USING
A PRICE CEILING OF $350/MBF FOR THE “HIGH IMPACT” CASE
207. To put these potential incremental impacts in context, it is useful compare the results with
those of EA prepared for the 2008 critical habitat designation for the NSO. As outlined
above, this 2012 study distinguishes the incremental costs of designation from baseline
costs, and quantifies specific potential effects to timber harvest practices and volume
along with administrative costs. As discussed in detail in this report, the annualized
incremental impacts under the negative impact scenario range from a loss of
approximately $2.65 to $6.48 million, while the positive impact scenario ranges from a
gain of approximately $900,000 to $2.9 million (including impacts estimates in this
Chapter as well as those related to the linear projects described later in Chapter 7). The
analysis also contemplates an “administrative cost only” scenario, with annualized losses
of $196,000 to $335,000. In addition to these base scenarios, we present a number of
sensitivity analyses that yield a broader range of impacts.
208. In contrast, in its evaluation of the incremental costs of the designation, the 2008
Economic Analysis did not identify any incremental effects of critical habitat designation
beyond administrative costs related to the consultation process. On an annualized basis,
these losses totaled $132,000 to $202,000 (similar to the range of administrative costs
estimated in this 2012 analysis).
209. This 2012 Economic Analysis characterizes all potential future NSO conservation as
either baseline (i.e., expected to occur absent the designation of critical habitat) or
incremental (i.e., expected to occur as a result of critical habitat designation). The Service
provided guidance on distinguishing the incremental costs of the designation, as
described in Appendix B of this report. The analysis only quantifies incremental impacts
because these are the costs, or benefits, that would be avoided if the Secretary of the DOI
chooses to exclude certain areas from the final designation. Where we include
quantitative or qualitative information about the historical impacts of northern spotted
ANNUALIZED POTENTIAL
INCREMENTAL IMPACTS ON
FEDERAL LANDS
SCENARIO 1 SCENARIO 2 SCENARIO 3
LOW IMPACT HIGH IMPACT LOW IMPACT HIGH IMPACT LOW IMPACT HIGH IMPACT
Potential Change in Timber
Harvest Volume (MMBF) 0.0 +12.28 -24.56
Potential Change in Value of
Timber Harvest $0 $0 +$1,230,000 +$4,300,000 -$2,460,000 -$8,600,000
Administrative Costs -$185,000 -$316,000 -$185,000 -$316,000 -$185,000 -$316,000
TOTAL -$185,000 -$316,000 +$912,000 +$4,110,000 -$2,640,000 -$8,910,000
Final Economic Analysis - November 20, 2012
4-41
owl conservation, this information is intended only to provide context for potential future
incremental impacts.
210. The 2008 Economic Analysis provided a comprehensive quantitative assessment of
baseline impacts related to NSO conservation and recovery, inclusive of all effects
resulting from the species’ listing in 1990. For the pre-designation period (1990 – 2007),
the annualized estimate of these baseline impacts totaled $563 to $600 million. For the
post-designation period, annualized baseline impacts (i.e., those impacts expected to
occur regardless of whether critical habitat is designated) were estimated to be
approximately $602 million.
Final Economic Analysis - November 20, 2012
5-1
CHAPTER 5 | TIMBER IMPACTS – STATE AND PRIVATE LANDS
211. Chapter 3 describes the importance of access to non-Federal timber to the regional
economy. As harvests from Federal lands have declined, other sources of timber have
become relatively more important to the regional economy. Many mills acquire most, if
not all of their logs from private landowners. In this chapter, we estimate the potential
effect of the proposed critical habitat designation on State and private timberlands.
We undertake the following steps to estimate impacts:
Step 1 – First, we identify the amount of State and private lands proposed for
designation and the relevant land managers.
Step 2 – Next, we evaluate which acres may experience incremental impacts as a
result of the proposed rule. These impacts may result directly from the
implementation of section 7 of the Act, or they may be the indirect effect of
changes in management by State regulators or in practices by private entities in
response to increased awareness of the ecological importance of these areas.
Step 3 – Once we have identified the acres that may experience incremental
impacts, we qualitatively discuss the potential costs resulting from the
designation.
Overall, we find that none of the State lands proposed for designation are likely to
experience incremental changes in harvested volumes of timber as a result of designating
critical habitat for the NSO. Of the approximately 1.3 million acres of private lands
proposed for designation, harvest practices on approximately one-quarter of those acres
(307,000) may be indirectly affected by the designation. Incremental impacts on the
remaining lands are unlikely due to the substantial protections, and corresponding
restrictions, already in place for the NSO. The downstream impacts of incremental
changes in harvests experienced by the timber industry (e.g., saw mills, logging
companies) and the communities dependent on this industry are discussed in Chapter 6.
5.1 STEP 1 - IDENTIFY STATE AND PRIVATE ACRES PROPOSED FOR DESIGNATION
212. In this section, we summarize the amount State and private land proposed for critical
habitat designation. For State lands, we also note the relevant management agencies.
Identification of the individual landowners is beyond the scope of this analysis.
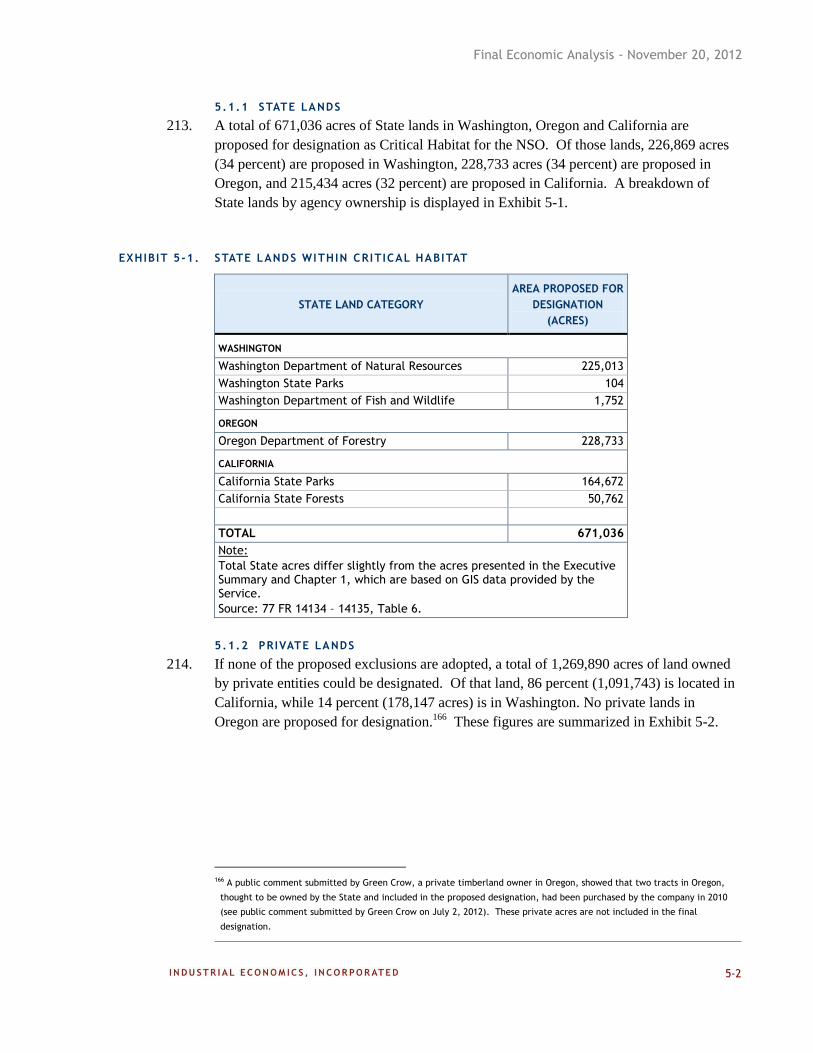
Final Economic Analysis - November 20, 2012
5-2
5.1.1 STATE LANDS
213. A total of 671,036 acres of State lands in Washington, Oregon and California are
proposed for designation as Critical Habitat for the NSO. Of those lands, 226,869 acres
(34 percent) are proposed in Washington, 228,733 acres (34 percent) are proposed in
Oregon, and 215,434 acres (32 percent) are proposed in California. A breakdown of
State lands by agency ownership is displayed in Exhibit 5-1.
EXHIBIT 5-1. STATE LANDS WITHIN CRITICAL HABITAT
STATE LAND CATEGORY
AREA PROPOSED FOR
DESIGNATION
(ACRES)
WASHINGTON
Washington Department of Natural Resources 225,013
Washington State Parks 104
Washington Department of Fish and Wildlife 1,752
OREGON
Oregon Department of Forestry 228,733
CALIFORNIA
California State Parks 164,672
California State Forests 50,762
TOTAL 671,036
Note:
Total State acres differ slightly from the acres presented in the Executive Summary and Chapter 1, which are based on GIS data provided by the Service.
Source: 77 FR 14134 – 14135, Table 6.
5.1.2 PRIVATE LANDS
214. If none of the proposed exclusions are adopted, a total of 1,269,890 acres of land owned
by private entities could be designated. Of that land, 86 percent (1,091,743) is located in
California, while 14 percent (178,147 acres) is in Washington. No private lands in
Oregon are proposed for designation.166
These figures are summarized in Exhibit 5-2.
166 A public comment submitted by Green Crow, a private timberland owner in Oregon, showed that two tracts in Oregon,
thought to be owned by the State and included in the proposed designation, had been purchased by the company in 2010
(see public comment submitted by Green Crow on July 2, 2012). These private acres are not included in the final
designation.
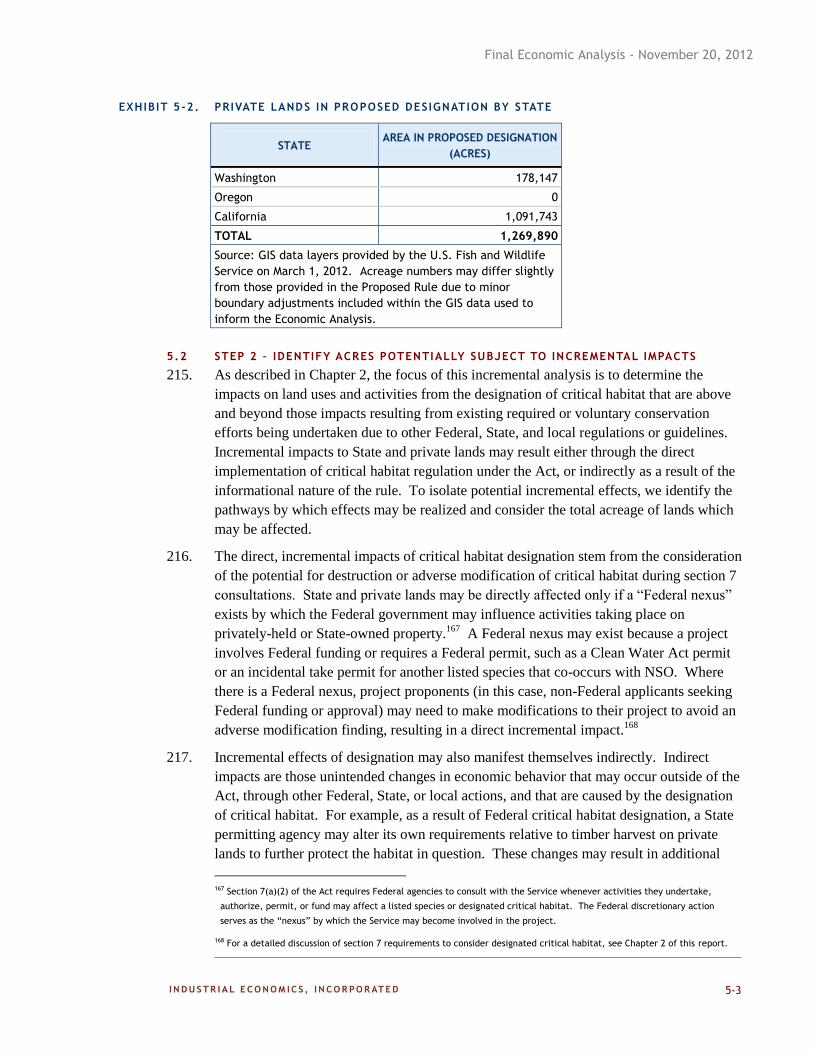
Final Economic Analysis - November 20, 2012
5-3
EXHIBIT 5-2. PRIVATE LANDS IN PROPOSED DESIGNATION BY STATE
STATE AREA IN PROPOSED DESIGNATION
(ACRES)
Washington 178,147
Oregon 0
California 1,091,743
TOTAL 1,269,890
Source: GIS data layers provided by the U.S. Fish and Wildlife
Service on March 1, 2012. Acreage numbers may differ slightly
from those provided in the Proposed Rule due to minor
boundary adjustments included within the GIS data used to
inform the Economic Analysis.
5.2 STEP 2 – IDENTIFY ACRES POTENTIALLY SUBJECT TO INCREMENTAL IMPACTS
215. As described in Chapter 2, the focus of this incremental analysis is to determine the
impacts on land uses and activities from the designation of critical habitat that are above
and beyond those impacts resulting from existing required or voluntary conservation
efforts being undertaken due to other Federal, State, and local regulations or guidelines.
Incremental impacts to State and private lands may result either through the direct
implementation of critical habitat regulation under the Act, or indirectly as a result of the
informational nature of the rule. To isolate potential incremental effects, we identify the
pathways by which effects may be realized and consider the total acreage of lands which
may be affected.
216. The direct, incremental impacts of critical habitat designation stem from the consideration
of the potential for destruction or adverse modification of critical habitat during section 7
consultations. State and private lands may be directly affected only if a “Federal nexus”
exists by which the Federal government may influence activities taking place on
privately-held or State-owned property.167
A Federal nexus may exist because a project
involves Federal funding or requires a Federal permit, such as a Clean Water Act permit
or an incidental take permit for another listed species that co-occurs with NSO. Where
there is a Federal nexus, project proponents (in this case, non-Federal applicants seeking
Federal funding or approval) may need to make modifications to their project to avoid an
adverse modification finding, resulting in a direct incremental impact.168
217. Incremental effects of designation may also manifest themselves indirectly. Indirect
impacts are those unintended changes in economic behavior that may occur outside of the
Act, through other Federal, State, or local actions, and that are caused by the designation
of critical habitat. For example, as a result of Federal critical habitat designation, a State
permitting agency may alter its own requirements relative to timber harvest on private
lands to further protect the habitat in question. These changes may result in additional
167 Section 7(a)(2) of the Act requires Federal agencies to consult with the Service whenever activities they undertake,
authorize, permit, or fund may affect a listed species or designated critical habitat. The Federal discretionary action
serves as the “nexus” by which the Service may become involved in the project.
168 For a detailed discussion of section 7 requirements to consider designated critical habitat, see Chapter 2 of this report.
Final Economic Analysis - November 20, 2012
5-4
costs associated with carrying out that activity in compliance with new regulations. In
other cases, designation of one’s property may result in concern or uncertainty about
potential future regulation, altering the decisions made about productive uses of that land,
or stigmatizing the property such that the value of the property is affected.
218. In the following sections, we consider the potential for both direct and indirect impacts on
State and private lands to result from NSO critical habitat designation. We begin by
considering the potential for a nexus to result in changes to timber harvest practices and
associated incremental costs (i.e., direct incremental impacts). We then evaluate the total
acreage of State and private land subject to any potential direct incremental costs.
219. Next, we consider the potential for changes to State policies dictating timber harvest
practices, and evaluate the extent to which identified changes would result in indirect
incremental costs. We then evaluate the total acreage of land potentially affected by
these changes. Finally, we consider other indirect impacts, and similarly identify the
acreage affected and potential incremental costs stemming from those impacts. The
potential for additional administrative costs is discussed qualitatively throughout the
Chapter.
5.2.1 D IRECT EFFECTS
220. Direct incremental effects of NSO critical habitat designation are only possible on State
or private lands where a Federal nexus exists. We identify three potential sources of a
nexus to State and private lands proposed for designation and discuss each of them in the
sections below.169
Habitat Conservat ion Plans and Safe Harbor Agreements
221. Habitat Conservation Plans (HCPs) and Safe Harbor Agreements (SHAs) are approved
by the Service, resulting in a Federal nexus. 170,171
As such, approval and renewal of these
169 We also considered and dismissed a fourth possible nexus. The U.S. Department of Agriculture’s Natural Resources
Conservation Service (NRCS) provides financial and technical assistance to private landowners through programs like the
Environmental Quality Incentives Program (EQIP) and the Wildlife Habitat Incentive Program (WHIP). The programs are
intended to assist landowners with the planning and implementation of conservation practices addressing natural resource
concerns, including improving wildlife habitat (for more information, see
www.nrcs.gov/wps/portal/nrcs/main/national/programs). We reviewed the consultation history for the NSO since the 2008
designation and did not identify any consultations with NRCS. In addition, we attempted to contact NRCS representatives in
Washington and spoke with a representative in California, and we spoke with Service biologists about its history consulting
with NRCS on any species (Personal communication with Thomas Moore, State Biologist, U.S. Department of Agriculture,
Natural Resources Conservation on October 15, 2012; and Personal communication with U.S. Fish and Wildlife Service,
Oregon Fish and Wildlife Office on August 8, 2012 and the Arcata, California Fish and Wildlife Office on August 29, 2012).
Because the NRCS does not have a history of initiating consultation with the Service on these types of grants in areas
occupied by NSO, we assume that it will continue its current practices in the future. If surveys do not detect the owl, and
the area is not subject to an existing HCP or SHA, then the likelihood of a consultation is uncertain. In general, NRCS funds
projects intended to be beneficial to the species in the long term. Thus, for the purposes of this analysis, we assume
consultations on NRCS funding are unlikely.
170 Habitat Conservation Plans (HCPs) are planning documents required as part of an application for an ‘incidental take’’
permit pursuant to section 10 of the Act. They describe the anticipated effects of the proposed taking; how those impacts
will be minimized, or mitigated; and how the HCP is to be funded. For more information, see Chapter 2.
Final Economic Analysis - November 20, 2012
5-5
agreements requires section 7 consultation, potentially necessitating the Federal
government to request changes to timber harvest activities to avoid destruction or adverse
modification of critical habitat and potentially resulting in effects on timber harvest.
222. In the proposed rule, the Service indicates that all HCPs in the proposed designation that
meet the following criteria are appropriate for consideration for exclusion from the final
designation:
“(1) It provides for the conservation of the essential physical and biological
features or areas otherwise determined to be essential;
(2) There is a reasonable expectation that the conservation management strategies
and actions contained in a management plan will be implemented into the
future;
(3) The conservation strategies in the HCP are likely to be effective; and
(4) The HCP contains a monitoring program or adaptive management to ensure
that the conservation measures are effective and can be adapted in the future
in response to new information.”172
All lands with approved HCPs are proposed for exclusion, and each HCP will be
evaluated with regard to the stated criteria in consideration of potential exclusion from
the final designation. Furthermore, in its Incremental Effects Memorandum, the Service
writes,
“Service staff in California and Washington have reviewed the HCPs and
SHAs that would be affected by the proposed revised spotted owl critical
habitat. The results of their preliminary analysis suggest that the
activities covered under these permits are not likely to result in adverse
modification of critical habitat…Thus, we do not anticipate any
incremental effects associated with HCPs or SHAs attributable to the
designation of critical habitat other than formalizing our adverse
modification analysis.”173
Thus, even if these lands were not excluded from the final designation, we conclude that
impacts would be limited to minor administrative costs associated with re-initiating
section 7 consultation to consider adverse modification. Incremental project
modifications are unlikely.
171 A Safe Harbor Agreement (SHA) is a voluntary agreement involving private or other non-Federal property owners whose
actions contribute to the recovery of listed species. The agreement is between cooperating non-Federal property owners
and the Service. In exchange for actions that contribute to the recovery of listed species on non-Federal lands, participating
property owners receive a section 10 permit allowing them to “take” the species back to the baseline level. The Service
also generally provides formal assurances that if they fulfill the conditions of the SHA, the Service will not require any
additional or different management activities by the participants without their consent.
172 77 FR 14138.
173 U.S. Fish and Wildlife Service, “Incremental Effects Memorandum for the Economic Analysis of the Proposed Rule to Revise
Critical Habitat for the Northern Spotted Owl,” March 23, 2012, pp. 16-17.
Final Economic Analysis - November 20, 2012
5-6
Clean Water Act Permitt ing for Timber Roads on Pr ivate Lands
223. Construction of roads near or affecting streams or other navigable waters is often subject
to National Pollution Discharge Elimination System (NPDES) permitting under section
404 of the Clean Water Act (CWA). However, road construction involved in silviculture
operations is exempt from section 404 permitting requirements under section 404(f) if the
operation adheres to the U.S. Army Corps of Engineer’s Best Management Practices.
Section 404(f) of the CWA, “provides that discharges that are part of normal farming,
ranching, and forestry activities associated with an active and continuous ("ongoing")
farming or forestry operation generally do not require a Section 404 permit.” “Normal”
operations are defined as “activities such as plowing, cultivating, minor drainage, and
harvesting for the production of food, fiber, and forest products, or upland soil and water
conservation practices (Section 404(f)(1)(A))”174
224. Future regulatory changes could create a circumstance in which silviculture operations
are no longer exempt from 404 permitting requirements or are otherwise subject to a
Federal nexus. Specifically, in the Ninth Circuit, Northwest Environmental Defense
Center v. Brown, redefines road construction and other common practices associated with
silviculture operations as sources of point-source pollution, as opposed to non-point
source pollution, as previously defined.175
This ruling has the potential to increase
permitting requirements for silviculture operations in States within the Ninth Circuit,
including California, Oregon, and Washington, because several common forestry
practices, when defined as sources of point-source pollution, are not subject to the section
404(f) exemptions described above.
225. Considerable uncertainty surrounds this ruling and whether it will in fact change the
permitting requirements for silvicultural operations within the next 20 years. It follows
that the likelihood for a Federal nexus for timber harvest activities on State and private
lands is likewise uncertain. For this analysis, we assume the current exemption and
subsequent lack of a Federal nexus continues, and therefore do not anticipate direct
effects on private or State lands associated with CWA permitting activities.
Commercia l Haul ing on Forest Development Roads
226. In the Northwest, many privately-held and State timberlands are co-mingled in a
checkerboard pattern with lands owned by the Federal government. Hauling of timber
from State and private lands thus, in many instances, requires transit through Federal land
and use of federally-maintained Forest Development Roads. Use of these roads for
commercial timber hauling requires a Federal permit, potentially creating a nexus
between the Federal government and State and private timber activities.
174 U.S. EPA, “Memorandum: Clean Water Act Section 404 Regulatory Program And Agricultural Activities,” accessed at
http://water.epa.gov/lawsregs/guidance/wetlands/cwaag.cfm on April 9, 2012..
175 Northwest Environmental Defense Center v. Marvin Brown, 640 F.3d 1063 (9th Cir. 2010).
Final Economic Analysis - November 20, 2012
5-7
227. According to representatives of the USFS and BLM, current policy states that formal
consultation on this type of activity is not prioritized.176
A review of Federal
consultations over the last three years indicates that no consultations related to NSO have
resulted from application for this type of permit. Additionally, according to the USFS
and BLM, any request for consultation would likely be limited to hauling activity, and
would not include the timber harvest activity itself. Thus, we do not anticipate any direct
effects on timber harvest on State or private lands as a result of this potential nexus.
Summary of Potent ia l for Direct Impacts
228. Given present conditions, including permitting exemptions currently in place, we
conclude that the designation of critical habitat for the NSO is unlikely to directly affect
timber harvests on State or private lands. Minor administrative costs are possible if
critical habitat is designated in areas with existing or planned HCPs or SHAs. These
costs arise from the need to re-initiate section 7 consultation to consider the potential for
the activity to adversely modify critical habitat. Additional project modifications are not
anticipated to result from such consultation.
5.2.2 INDIRECT EFFECTS DUE TO STATE MANAGEMENT CHANGES
229. We next consider the potential for indirect effects resulting from changes in State policies
guiding timber harvest practices on State and private lands. To identify potential
modifications to State timber management practices developed in response to Federal
critical habitat designation, we conducted a series of informational interviews with State
agencies currently involved in managing timber harvest on State and private lands. A
complete list of entities consulted during this process is included as Appendix C.
230. In the sections below, we first identify existing policies for timber harvest on State lands.
We then consider any likely modifications to those policies due to Federal designation of
critical habitat. Next, we estimate the total acreage of land that may be subject to any
identified indirect incremental costs associated with State regulators’ reaction to the
designation. Finally, we repeat the same discussion and analysis for private lands. At the
end of this section, we summarize this process and present our conclusions in two
exhibits, one for State lands and the other for private lands.
Washington
Existing Policies – State Lands
231. Timber harvest on State lands is guided by a number of State laws and policies. The
Washington State Environmental Policy Act (SEPA) requires analysis of environmental
impacts and consideration of reasonable alternatives for actions proposed by the State.
State timber harvest activities must also comply with the State Forest Practices Act
(Chapter 76.09 RCW), which regulates all forest management activities in Washington.
176 Personal communication with Lee Folliard and Chris Cadwell, U.S. Bureau of Land Management, Oregon State Office on
March 16, 2012; and Personal communication with Debbie Hollen and Tracy Beck, U.S. Forest Service, Region 6 on March 22,
2012.
Final Economic Analysis - November 20, 2012
5-8
The management of State trust lands, specifically, is guided by the Forest Resource Plan,
which was adopted by the Board of Natural Resources in 1992. Among other things, the
policies of the Plan require the Washington Department of Natural Resources (DNR)
analyze and potentially modify the impacts of its activities on watersheds, wildlife
habitat, special ecological features, wetlands, and other natural resources to maintain
healthy forests for future generations.177
232. In addition to the State policies described above, all forest lands managed by the DNR
and considered in the proposed rule are covered by an HCP. The HCP, approved in 1997,
is an ecosystem-based forest management plan designed to provide habitat for a number
of species, including NSO. It contains a specific conservation strategy for the NSO. The
HCP’s conservation objective relative to NSO is “to provide habitat that makes a
significant contribution to demographic support, maintenance of species distribution, and
facilitation of dispersal.”178
233. According to Washington Department of Fish and Wildlife (DFW) lands managers, the
DFW does not carry out commercial timber harvest on its lands, and harvest activities are
limited to some thinning. They are currently in the process of developing an HCP that
would provide protection for a number of endangered species, including the NSO.
234. Finally, the Service proposes to designate approximately 104 acres of WA State Parks
land. According to the Proposed Rule, the Service states, “these lands are managed
consistent with the conservation and recovery needs of the northern spotted owl.”179
Furthermore, a review of the Washington Administrative Code suggests that except in
limited cases, and subject to significant limitations, commercial timber harvests do not
occur in within State parks.180
Therefore, we do not anticipate that the Washington State
Parks and Recreation Commission will alter its management of these acres as a result of
the designation.
Potential Modifications and Associated Impacts – State Lands
235. According to Washington DNR State forest managers, the agency does not anticipate
revising current management practices on State lands as a result of designation of Federal
critical habitat. They believe the practices and policies established in the HCP are
successfully protecting NSO habitat, and that they have fifteen years of history (since
implementation of the HCP in 1997) that demonstrates this fact. Similarly, as timber
harvest is not occurring on lands managed by DFW or in State parks, we do not anticipate
indirect impacts on timber harvest to occur on these lands.
177 Washington State Department of Natural Resources. 1997. Final Habitat Conservation Plan. Olympia, WA. September.
178 Ibid.
179 77 FR 14142.
180 See WAC 352-28-020, which describes requirements for the limited sale or lease of State Park natural resources, and WAC
352-28-010, which describes circumstances in which cutting, collection, or removal of natural resources is allowed in State
Parks.
Final Economic Analysis - November 20, 2012
5-9
Identification of Affected Acreage – State Lands
236. A total of 226,869 acres of State lands in Washington are considered for designation as
critical habitat. Of these lands, activities on 225,013 acres are covered by the
Washington DNR’s HCP, and are not anticipated to be affected by the designation
through changes in State management policies. Furthermore, we do not anticipate
incremental effects related to activities occurring on the 1,752 acres of land managed by
the Washington DFW, as commercial timber harvest does not occur on those lands, and
an HCP is under development. Finally, we remove the 104 acres of State lands from
further consideration in this analysis because these activities on these lands are similarly
unlikely to be affected by the designation. In summary, we do not anticipate any changes
in timber harvest activities on State lands in Washington as a result of critical habitat
designation.
Existing Policies – Private Lands
237. The Washington State Forest Practices Rules, which guide State and private timber
harvest, are administered by the Washington DNR through the Forest Practices Act of
1974.181
The Rules that implement the purposes and policies of the Forest Practices Act
are adopted by a 13-member, multi-stakeholder Forest Practices Board.182
Ultimately, it
is this Forest Practices Board that will determine what, if any, response the State of
Washington implements as a result of Federal critical habitat designation.
238. In 1996, the Forest Practices Board established rules related to protection of NSO, which
included establishment of Spotted Owl Special Emphasis Areas (SOSEAs) and
designation of “critical habitat state” for the species.183
Within each SOSEA, these rules
establish “median home range” circles around identified owl “site centers.” The ultimate
goal of these management rules is to maintain the highest quality 40 percent of habitat
within each circle as such. Outside of the SOSEAs, rules are focused on protecting the
habitat around identified site centers during the nesting season. Exhibit 5-3 shows the
location of the Washington SOSEAs as they relate to the proposed designated State and
private lands. It is noteworthy that all private lands in Washington proposed for possible
designation are located in SOSEAs.
181 WAC Title 222.
182 RCW 76.09.030
183 SOSEAs represent key landscapes where spotted owl conservation is important.
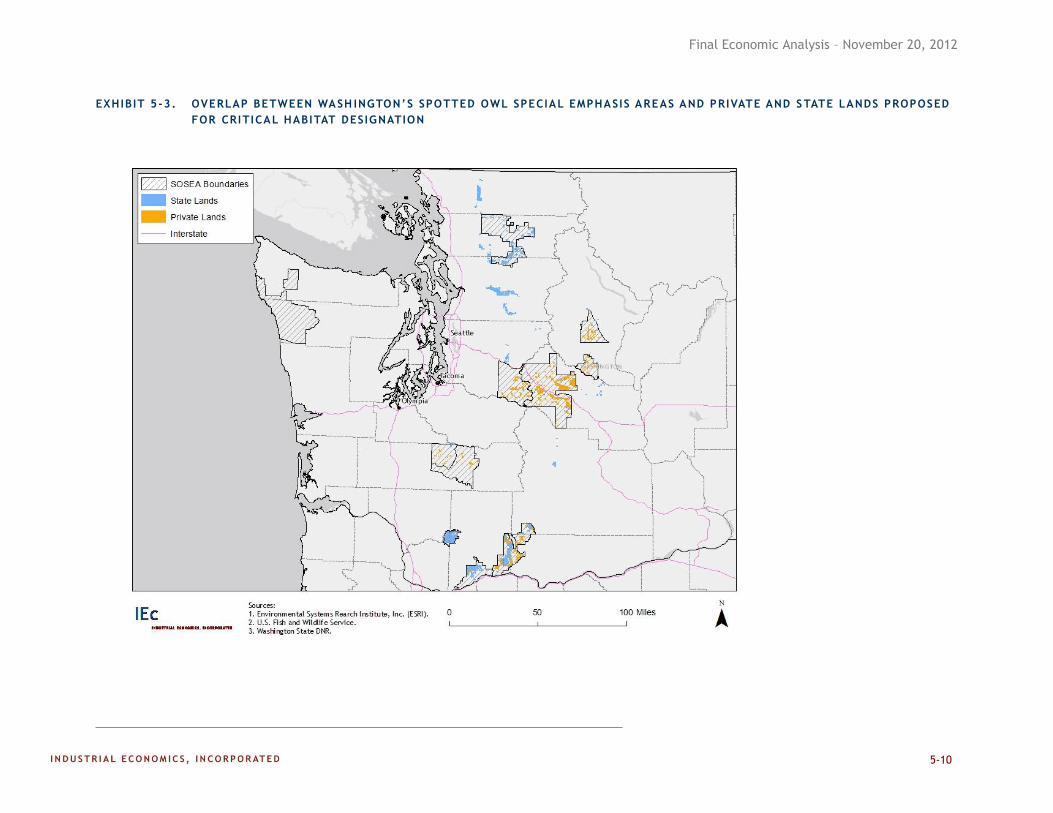
Final Economic Analysis – November 20, 2012
5-10
EXHIBIT 5-3. OVERLAP BETWEEN WASH INGTON’S SPOTTED OWL SPECIAL EMPHASIS AREAS AND PRIVATE AND STATE LANDS PROPOSED
FOR CRITICAL HABITAT DESIGNATION
Final Economic Analysis – November 20, 2012
5-11
239. All suitable habitat identified within a median home range circle is considered to be
“critical habitat state.” Timber harvest on lands identified as critical habitat state requires
a “Class IV – Special” application, which triggers the State Environmental Policy Act
(SEPA).184
Analogous to the National Environmental Policy Act (NEPA), SEPA requires
an environmental review of proposed activities based on the landowner’s existing
knowledge of his site. All activities requiring SEPA review are considered carefully by
Washington DNR prior to approval of a forest practice proposal. SEPA review may not
result in significant modifications to proposed projects; however, many landowners prefer
to avoid this review if possible as it creates additional opportunities for anyone to protest
the proposed activity.185
240. If the proposed activity is located in what the State has designated as the “best 40
percent” of habitat in the median home range circle, or on suitable habitat inside a circle
where the total suitable habitat is already limited, the guidelines created by SEPA will
often lead to a need for development of an Environmental Impact Statement (EIS) under
SEPA. Because of the time and cost associated with developing an EIS, most
landowners choose not to pursue harvest of timber on lands where an EIS would be
required as part of the harvest application.186
241. Landowners holding less than 500 acres are exempt from the requirement to submit a
Class IV Special application (i.e., their land is not considered to be “critical habitat-
state”) as long as the proposed activity will not occur within 0.7 miles of an identified
spotted owl site center.187
Potential Modifications and Associated Impacts – Private Lands
242. Any modification to State Forest Practices Rules is ultimately the decision of the State
Forest Practices Board. DNR representatives offered several scenarios of potential
responses to Federal designation of critical habitat on private lands in Washington. It is
important to note that DNR representatives did not comment upon the likelihood that any
of these scenarios would occur, but rather, offered them as examples of potential
outcomes of the designation. These examples bound the possible lowest and highest cost
outcomes.
Scenario 1: No changes. Under this scenario, the Forest Practices Board reviews
the Services’ critical habitat designation and sees that the private lands proposed
all fall within State-designated SOSEAs. The Board concludes that current
Forest Practices Rules are in line with the Service’s intent, and makes no changes
to the Forest Practices Rules.
Scenario 2: Re-designation of “critical habitat state.” Under this second
scenario, which represents perhaps the most restrictive possible response of the
184 WAC 222-16-050(1)(b)
185 Personal communication with Darin Cramer, Washington Department of Natural Resources, on March 27, 2012.
186 Personal communication with Lenny Young, Washington Department of Natural Resources, on March 14, 2012.
187 WAC 222-16-080 (1)(h)(iv)
Final Economic Analysis – November 20, 2012
5-12
State, the Forest Practices Board designates all suitable habitat overlapping
Federal critical habitat within the SOSEAs as “critical habitat state” and rewrites
the SEPA guidelines such that harvest on any suitable habitat within the SOSEAs
likely necessitates an EIS.188,189
As a result, harvest of any suitable NSO habitat
within a SOSEA will require a Class IV Special application, which triggers
SEPA and likely leads to a need to develop an EIS. Because of the expense and
time associated with development of an EIS, most landowners likely will now
choose to avoid harvesting on any suitable owl habitat anywhere within the
SOSEA. Existing exemptions for landowners holding less than 500 acres will
continue.
Identification of Affected Acreage – Private Lands
243. A total of 178,147 acres of private land are proposed for designation as critical habitat in
Washington. Of those lands, 195 acres are covered by an approved SHA, and 44,056
acres are covered by existing HCPs. Private lands with an approved HCP or SHA are
effectively exempted from the SOSEA/Median Home Range Circle requirements, as the
State feels that the landowner has provided conservation for the northern spotted owl in a
different manner that has been approved by Service.190
As such, they do not anticipate
modifying how timber harvest is carried out on those lands, and we do not anticipate
incremental effects to result under either of the identified scenarios.191
244. Of the remaining 133,896 acres of private land, 16,267 acres are currently being reviewed
for approval of a pending HCP. Since proposed HCPs are being reviewed under existing
guidelines, and the Service and the State have said existing HCPs provide adequate NSO
habitat protection, we assume this HCP will be approved and no project modifications
will be required by the State or the Service.
245. The balance of proposed private lands (117,628 acres) all fall within the State’s Spotted
Owl Special Emphasis Areas.192
Under Scenario 2 presented above, in which the Forest
Practices Board modifies its current rules, landowners could decide to avoid harvesting
on any suitable owl habitat anywhere within the SOSEA due to the additional burden of
preparing an EIS. The total number of affected acres may be overstated, as some of these
areas likely fall within median Home Range Circle requirements, where the burden of
188 DNR states that all suitable habitat within SOSEAs could be identified as “critical habitat state.” However, it is unclear
why this designation would create an incentive to increase restrictions on lands that are not designated as Federal critical
habitat. Thus, for the purposes of this analysis, we assume that only lands designated as Federal critical habitat are
reviewed by the Forest Practices Board.
189 DNR representatives did discuss the extreme possibility that the Board could consider elimination of the 500 acre
exemption as part of the most restrictive potential outcome. However, because of disproportionate impacts and the
special considerations afforded this class of landowner, DNR representatives indicated that complete elimination of the 500
acre exemption was highly unlikely. As such, we do not include an elimination of the 500 acre exemption in our analysis.
190 Personal communication with Darin Cramer, Washington Department of Natural Resources, on March 22, 2012.
191 Ibid.
192 Acreage totals may not sum due to rounding.
Final Economic Analysis – November 20, 2012
5-13
preparing an EIS already exists. Data necessary to map the Home Range Circles are not
readily available.
Oregon
Existing Policies – State Lands
246. Timber harvests on State lands in Oregon are guided by the Forest Practices Act and
Forest Practices Rules. An existing statute requires that State forests are managed to
achieve “greatest permanent value,” which has been interpreted by the Forest Policy
Board as being holistic, considering economics, environmental, and cultural goals.193
Each State Forest has a Forest Management Plan that seeks to implement these ideals.
Ultimately, the State’s goal is to produce timber revenue and also provide for a range of
habitats across ownership.
247. Thirty percent of Oregon State forests must be managed for “complex forest structures”
and late seral tree species, for the benefit of a number of wildlife species. The locations
of these managed lands are based in part on locations of spotted owl nests. Within these
areas, a variety of treatments are employed to manage for diversity.194
In addition,
specific policies and procedures have been adopted which provide for the protection and
conservation of NSO and its habitat. In particular, circles are designated around all
known spotted owl activity sites and a variety of protections are employed to maintain
proximal habitat and avoid take and disturbance of the species.195
Potential Modifications and Associated Impacts – State Lands
248. Managers from the Oregon Department of Forestry have indicated that they do not
anticipate altering timber harvest policies on State lands in response to critical habitat
designation, as current planning and management practices are already contributing
effectively to the conservation of NSO and its habitat.196
Identification of Affected Acreage – State Lands
249. A total of 228,733 acres of State lands, all managed by the Department of Forestry, are
proposed for critical habitat designation in Oregon. We do not anticipate changes in
timber harvest on any of these lands due to an indication by the agency that it does not
anticipate revising timber harvest policies on state lands as a result of critical habitat
designation.
Identification of Affected Acreage – Private Lands
250. No private lands in Oregon are considered for designation as critical habitat.
193 Personal communication with Mike Bordelon, Oregon Department of Forestry, on March 19, 2012.
194 Ibid.
195 Oregon Department of Forestry, State Forests Division. 2012. Northern Spotted Owl Operational Policies. Effective
January 3.
196 Personal communication with Mike Bordelon, Oregon Department of Forestry, on March 19, 2012.
Final Economic Analysis – November 20, 2012
5-14
Cal i forn ia
Existing Policies – State Land
251. The California Department of Forestry and Fire Protection (CAL FIRE) manages State
forestland for research purposes and to demonstrate different forest management
techniques, including demonstrating timber harvests. The forests are used for
“experimentation to determine the economic feasibility of artificial reforestation, and to
demonstrate the productive and economic possibilities of good forest practices toward
maintaining forest crop land in productive condition.”197
Harvests are regulated by the
California Forest Practice Rules, promulgated under the Z’berg-Nejedly Forest Practice
Act of 1973, and other applicable laws and regulations.198
The Forest Practice Rules
contain specific provisions for the protection of NSO, described in greater detail later in
this Chapter in reference to the management of private timberlands in California.
252. In addition, under State law, a Forest Management Plan (FMP) is developed for each
State forest.199
The Plans are reviewed in a public Board of Forestry and Fire Protection
process every five years, and each plan is revised and updated at least every 10 years.
Any plan revisions are subject to review under CEQA.
253. California State Parks are managed by the California Department of Parks and
Recreation. The Agency’s mission is to "administer, protect, provide for recreational
opportunity, and develop the State Park System…”200
We are unaware of any commercial
timber harvests in State Parks.
Identification of Affected Acreage and Potential Modifications and Associated Impacts – State Lands
254. The Service proposes to designate as critical habitat 50,762 acres of State Forest land.
According to a representative of CAL FIRE, these lands include the Jackson
Demonstration State Forest (JDSF) located in Mendocino County.201
Representatives of
CAL FIRE believe that the Forest Practice Rules are sufficiently protective of NSO.202
Specifically, JDSF is currently managed subject to its 2008 FMP, which underwent
extensive review in 2008 through 2011 by a public advisory committee, the Jackson
Demonstration State Forest Advisory Group (JAG).203
According to CAL FIRE,
197 California Department of Forestry and Fire Protection, “Demonstration Forests,” as viewed at
http://www.fire.ca.gov/resource_mgt/resource_mgt_stateforests.php on April 8, 2012.
198 California Forest Practice Rules, Title 14, California Code of Regulations, Chapters 4, 4.5 and 10.
199 California Public Resources Code Section 4645 requires the preparation of FMPs. The remaining information in this
paragraph is taken from the public comment submitted by the California Department of Forestry and Fire Protection on July
6, 2012, p. 2.
200 California State Parks, The Seventh Generation: The Strategic Vision of California State Parks 2001, p. 9, as viewed at
http://www.parks.ca.gov/pages/91/files/seven01.pdf.
201 Personal communication with a representative of the California Department of Forestry and Fire Protection on March 12,
2012 and subsequent email communication on April 5, 2012.
202 Personal communication with a representative of the California Department of Forestry and Fire Protection on March 12,
2012 and subsequent email communication on April 5, 2012.
203 Public comment submitted by the California Department of Forestry and Fire Protection on July 6, 2012, p. 2-3.
Final Economic Analysis – November 20, 2012
5-15
“Large areas within the JDSF have management goals for a forest structure
condition that directly benefits [sic] the growth and conservation of nesting,
roosting and foraging habitat for the NSO. These land allocations include a
requirement for a mix of silvicultural methods and resultant successional stages
that range from late seral , older forest, mature and large tree, to mixed age,
regeneration and pole-size trees across the forest…Timber harvesting projects
throughout JDSF protect old growth aggregations and/or individual old growth
trees. In addition, NSO nesting, roosting, and foraging habitat is protected
through JDSF’s implementation of most recent ‘Attachment A’ (USFWS 2011
Revision of the Northern Spotted Owl Take Avoidance Analysis and Guidance
for California Coast Forests Districts) including its NSO habitat acreage
requirements and specific disturbance buffers associated with timber harvest
plans, as well as the most current California Forest Practice Rules.”204
255. The State is unlikely to promulgate additional regulations or change current timber
management practices based on the designation of critical habitat on State lands.205
Thus,
incremental changes in forest harvests on State forest lands are not anticipated.
256. Timber harvests are not anticipated on State Parks land. Furthermore, according to the
Proposed Rule, State Park lands are managed consistent with the conservation and
recovery needs of the NSO, and the Service proposes to exclude these lands from the
final designation. We do not anticipate incremental changes in timber harvest on State
Parks land.206
Existing Policies – Private Lands207
257. Timber operations on private lands, including timber harvesting for forest products or
converting land to another use other than growing and harvesting timber, are also
regulated by the State in accordance with the California Forest Practice Rules and other
applicable laws and regulations. In order to obtain approval to harvest, landowners
generally hire a registered professional forester (RPF) to prepare a Timber Harvesting
Plan (THP). THPs are environmental review documents that outline what timber will be
harvested, how it will be harvested, and the steps that will be taken to prevent damage to
the environment.
258. CAL FIRE reviews THPs under the California Environmental Quality Act (CEQA) as a
“lead agency” and trustee of the State’s natural resources.208
As a result of its review,
204 Ibid.
205 Personal communication with a representative of the California Department of Forestry and Fire Protection on March 12,
2012 and subsequent email communication on April 5, 2012.
206 77 FR 14141.
207 The information in this section was provided by Chris Browder of CAL FIRE during a telephone interview conducted on
March 12, 2012 and subsequent email exchanges on April 5 and 6, 2012, unless otherwise noted.
208 CEQA functions similarly to the National Environmental Policy Act (NEPA). It requires State and local agencies (“the lead
agency”) to determine whether a proposed project would have a “significant” impact on the environment, and for any such
impacts identified, determine whether feasible mitigation measures or feasible alternatives will reduce the impact to a
less-then-significant level.
Final Economic Analysis – November 20, 2012
5-16
CAL FIRE may recommend changes to the THP so that significant impacts to natural
resources, or “take” of Federally-listed species, will be avoided or mitigated.
259. The Forest Practice Rules prohibit CAL FIRE from approving any permit resulting in the
“take” of NSO, unless such take is covered under a State or Federal incidental take
permit. Historically, to demonstrate that “take” will not occur, project proponents had
two options. They either obtained an incidental take permit (ITP) from the Service,
which includes developing and implementing an HCP; or they had the Service review the
THP and state, in writing, that the plan would likely avoid “take.”209
260. For harvests not covered by an HCP, sections 919.9 and 919.10 of the 2012 California
Forest Practice Rules outline procedures for avoiding NSO “take” and the criteria by
which the potential for “take” will be evaluated. The Forest Practice Rules define “take”
in terms of harm or harassment if feeding, nesting, or sheltering sites are affected. These
procedures apply to actions within a Northern Spotted Owl Evaluation Area or within 1.3
miles of a known northern spotted owl activity center outside of a Northern Spotted Owl
Evaluation Area. This area is generally synonymous with the range of the NSO in
California and encompasses the areas proposed for critical habitat designation in
California (see Exhibit 5-4).210
Thus, future timber harvesting occurring within the areas
proposed for designation will be subject to these regulatory provisions regardless of
whether these areas are ultimately designated as Federal critical habitat.
261. We note that approximately 25,431 proposed acres of private land along the border of
Sonoma and Napa Counties fall outside the State’s Northern Spotted Owl Evaluation
Area (see Exhibit 5-4). These acres are located within subunit ICC-6, and activities on
these lands are not subject to an existing HCP or conservation easement. In the proposed
rule, the Service states that the expected function of this unit is to support an isolated
population, and that approximately 90 percent of the area of the entire subunit was
covered by verified spotted owl home ranges at the time of listing.211
Thus, given the
presence of the species, these areas are likely to be subject to the NSO protections
provided by the California Forest Practice Rules even though they fall outside the
boundaries of the Northern Spotted Owl Evaluation Area.
262. Other than obtaining an ITP from the Service, the procedures outlined in sections 919.9
include provisions for the contents of the THP and the measures taken to avoid or
minimize take of the NSO. These provisions include the need to provide detailed maps of
owl habitat and survey results, avoidance of nesting habitat (within 500 feet of an activity
center), retention of sufficient habitat to support roosting and to provide protection from
predation and storms (within 500 to 1,000 feet of an activity center), provision of 500
acres of owl habitat within 0.7 miles of an activity center; provision of 1,336 total acres
209 A few industrial landowners obtain programmatic approval for multiple projects through an NSO management plan;
however, fewer than five such programmatic plans currently exist.
210 This conclusion is based on a visual comparison of the proposed critical habitat designation and a map of the NSO
Evaluation Area provided by Chris Browder, CAL FIRE, on April 5, 2012.
211 77 FR 14123.
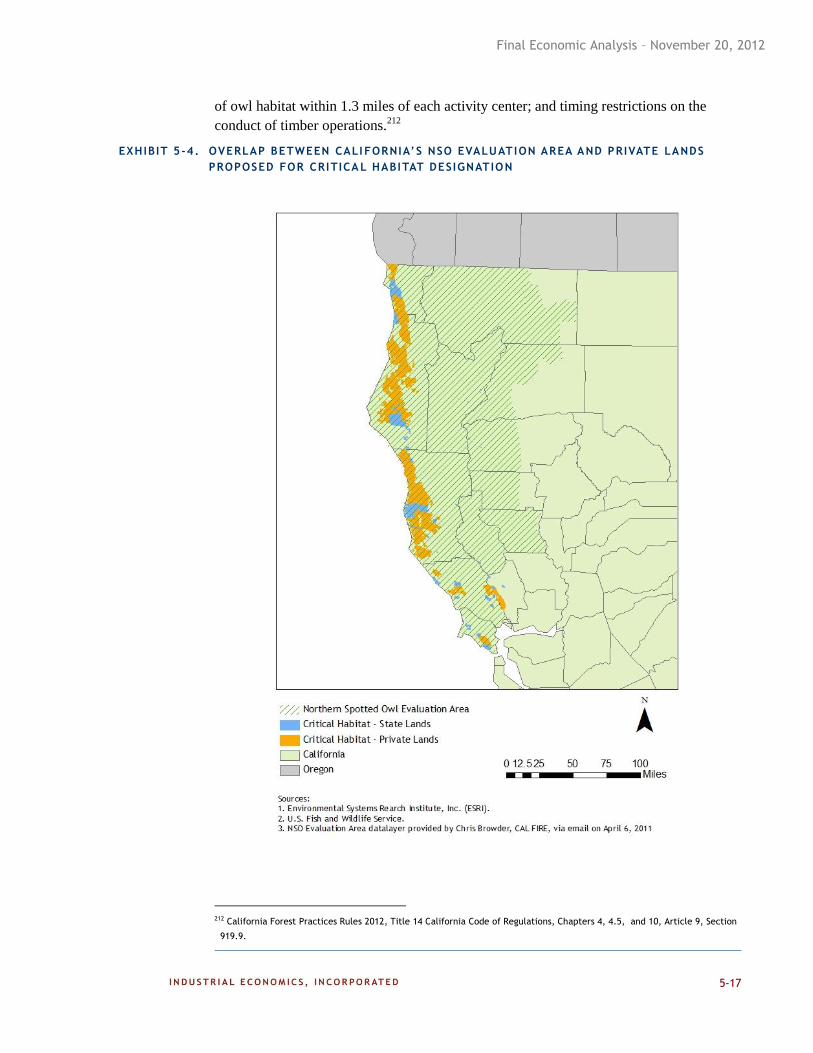
Final Economic Analysis – November 20, 2012
5-17
of owl habitat within 1.3 miles of each activity center; and timing restrictions on the
conduct of timber operations.212
EXHIBIT 5-4. OVERLAP BETWEEN CALI FORNIA’S NSO EVALUAT ION AREA AND PRIVATE LANDS
PROPOSED FOR CRITICA L HABITAT DESIGNATION
212 California Forest Practices Rules 2012, Title 14 California Code of Regulations, Chapters 4, 4.5, and 10, Article 9, Section
919.9.
Final Economic Analysis – November 20, 2012
5-18
263. The Service provides alternative standards to State law for protecting the NSO and
encourages project proponents to use its standards instead. These standards vary
depending on forest type. One set of standards applies to Coastal redwood forests; a
second set applies to Coastal non-redwood forests, the Klamath region, and the Cascades
(driest) region. If the Service’s standards are applied in the THP, CAL FIRE reviews the
THP to ensure that the paperwork is in order and may conduct a field review to ensure
that the information contained in the written document is consistent with that found in the
plan area.
264. According to CAL FIRE, in the Coastal redwood forests, project proponents tend to
follow the Service’s standards, which are somewhat more stringent than State standards.
The Coast Redwood region is very productive for owls, with smaller home ranges and
high densities of owls. In the other areas, more project proponents follow the State
standards. Following the State, rather than Service, standards requires more
documentation to demonstrate that “take” will be avoided.
265. Finally, during the preparation of the THP, the RPF may certify that owl surveys
demonstrated the absence of owls in the areas. At this time, CAL FIRE has no plans to
impose new requirements for the protection of NSO under such circumstances. A
representative of the agency noted that third-party lawsuits under CEQA are possible;
however, predicting the likelihood of such legal action is difficult.
Potential Modifications and Associated Impacts – Private Lands
266. In summary, proposed critical habitat overlaps NSO Special Evaluation Areas defined by
the State of California, or is otherwise subject to those rules, and those lands are therefore
already subject to significant requirements under the California Forest Practice Rules to
protect the owl and its habitat. Given the extensive protection already required by State
law and regulation, CAL FIRE is unlikely to impose any new requirements on project
proponents if Federal critical habitat is designated in these areas.213
Thus, indirect
impacts resulting from changes in State approval of THPs are unlikely.
267. One stakeholder noted the potential need to provide additional documentation under
CEQA to demonstrate that a THP will mitigate impacts to Federally-designated critical
habitat.214
He estimates that the additional administrative burden would, at a minimum,
add $10,000 to $25,000 in costs and might delay the initiation of harvesting by one to two
months, with additional costs, delay, or THP denial possible in some circumstances.215
If
incurred, such costs would be an incremental effect of the designation.
Identification of Affected Acreage – Private Lands
268. A total of 1,091,743 acres of private land are proposed for designation in California. Of
these, activities on 813,102 acres are already covered by approved or proposed HCPs or
213 A representative of CAL FIRE states that because owl densities are relatively high and stable in areas proposed for
designation, and so much protection is already occurring in California, it would be difficult to make an argument that an
activity was adversely modifying critical habitat.
214 Personal communication with Galen Schuler, Green Diamond Resources Company, March 5, 2012.
215 Ibid.
Final Economic Analysis – November 20, 2012
5-19
SHAs. In addition, 89,400 acres are subject to existing conservation easements. Harvests
on the remaining 189,241 acres must comply with the California Forest Practice Rules;
CAL FIRE is unlikely to request additional protective measures for habitat beyond those
already required by these regulations. Thus, incremental costs are limited to the potential
for additional administrative burden under CEQA.
5.2.3 OTHER INDIRECT EFFECTS
269. As described above, a variety of other indirect incremental effects may be experienced by
owners of private lands that are designated as critical habitat. Regulatory uncertainty
created by the designation of private lands as critical habitat may result in measurable
costs if landowners modify their management practices in response. In addition, even if
no changes are implemented, the market value of the parcels could be temporarily
stigmatized as the public gains a better understanding of the implication of the new
designation.
Regulatory Uncerta inty
270. The timber industry in the Northwest has experienced a range of new regulations and
management policies as a result of Federal species listings and critical habitat
designations, among other things. As regulations are modified or expanded over time,
landowners may become increasingly wary of the potential for future regulation, or
resulting policy decisions, to limit the use of their land for timber harvest. Where
information suggests that this type of regulatory uncertainty stemming from the
designation may affect a project or economic behavior, associated impacts are considered
indirect, incremental impacts of the designation. Examples of the changes to timber
harvest practices that private parties have suggested have already occurred, or may occur
in the future, as a result of regulatory uncertainty related to the protection of NSO and
NSO habitat include:216
Harvesting existing trees as early as is economically feasible to capture their
financial value in advance of possible future regulatory limits;
Maintaining shorter harvest rotations, which results in younger forest stands,
thereby ensuring that suitable NSO habitat does not develop on private property
and trigger additional regulation; or
Discontinuing the use of private property for timber production and switching to
development or other land uses to protect against future regulation that limits the
property’s timber production potential.
216 We note that pre-emptive efforts to avoid the establishment of forest habitat for another Federally-listed avian species,
the re-cockaded woodpecker, have been documented in the peer-reviewed, academic literature. The authors find that as
proximity of a timber lot to the species increases, the probability that the lot will be harvested increases and the age of the
timber when it is harvested decreases. (Lueck, Dean and Jeffrey A. Michael, April 2003, “Preemptive Habitat Destruction
Under the Endangered Species Act,” Journal of Law and Economics, 46: 27-60.) Furthermore, in public comments on the
DEA, several private landowners indicate that they are already taking such action in response to the NSO’s listing or may
take such action if their lands are designated as critical habitat (see, for example, comments submitted by SDS Lumber
Company, dated July 2 (p. 3), 2012; and Rayonier, July 6, 2012 (p. 2).
Final Economic Analysis – November 20, 2012
5-20
271. Given the high degree of uncertainty regarding whether landowners will implement such
measures as a result of critical habitat designation, we are unable to quantify likely
incremental costs at this time. To the extent private landowners harvest timber earlier or
shorten timber rotations, the present value of those timberlands may decrease. However,
the total value of the land will not be lost.
272. The degree to which land values may decrease if trees are cut earlier depends on multiple
factors, including the economics of when a stand would reach financial maturity and the
incremental change in the stand age at the time of harvest. Financial maturity is a
function of the time period during which a stand becomes merchantable (i.e., the trees
become large enough to enter the market), market conditions (particularly timber and log
prices), and landowner discount rates. If a landowner manages his land on a 40-year
rotation, the harvested trees are smaller on a relative basis; however, the landowner waits
a shorter period to obtain the value of those trees. Managing on a 60-year rotation
generally results in more biomass (timber) volume per acre, plus (for mill owners) the
ability to produce higher valued premium products from larger logs. However, they incur
a longer wait time (time value of money) to obtain those higher returns. Often,
landowners make decisions about the optimal time to harvest based on calculations of the
present value of their investment.
273. In proposed critical habitat for the NSO, where Douglas fir is likely to be a dominant tree
species cultivated for harvest, from a biological standpoint, the mean annual growth rate
of the trees are likely to peak at an ages of 70 to 80 years or more.217
However, in
economic terms, when balancing the preference for larger trees with a preference for
dollar returns sooner rather than later, the present value of those trees may peak earlier,
40 to 60 years.218
The optimal harvest age varies depending on landowner preferences
and market conditions.
274. If, as a result of the regulatory uncertainty created by the designation of critical habitat,
some landowners shorten their rotations from 60 to 40 years, the magnitude of their loss
is uncertain and will depend on the factors described above. It is possible that some
landowners will not experience a loss if the reduction in biomass volumes resulting from
earlier harvest is compensated for by earlier returns on their investment. However, it is
also possible, given landowners’ discount rates, that the present value of the harvest could
be incrementally lower.
275. In Washington, if the State regulations change as suggested, it is possible that some acres
will no longer be harvestable. Under such circumstances and assuming the land cannot
be put to other productive uses, most of its value could be lost. However, as discussed
earlier, the likelihood that the State will revise its existing regulations is speculative; thus
probabilistic estimates of lost land values are not possible at this time.
217 Personal communication with Jeff Jenkins, Atterbury Consultants, Inc., April 20, 2012.
218 Ibid.
Final Economic Analysis – November 20, 2012
5-21
St igma/Marketabi l i ty of Pr ivate Land
276. In some cases, the public may perceive that critical habitat designation may result in
limitations on private property uses above and beyond those associated with anticipated
project modifications and regulatory uncertainty described above. Public attitudes about
the limits or restrictions that critical habitat may impose can cause real economic effects
to property owners, regardless of whether such limits are actually imposed. All else
equal, a property that is designated as critical habitat may have a lower market value than
an identical property that is not within the boundaries of critical habitat due to perceived
limitations or restrictions.219
As the public becomes aware of the true regulatory burden
imposed by critical habitat (e.g., regulation under section 7 of the Act is unlikely), the
impact of the designation on property markets may decrease. If stigma effects on markets
were to occur, these impacts would be considered indirect, incremental impacts of the
designation.
Development of Habitat Conservat ion Plans
277. Development and approval of HCPs and/or SHAs may allow a landowner to have some
control over the measures that will be employed to protect NSO and its habitat, and some
certainty regarding potential future regulation. As a result of the new critical habitat
designation for NSO, some landowners may elect to seek approval of an HCP or SHA.
Development of such plans results in opportunity costs associated with the use of
administrative resources.
Ident i f icat ion of Potent ia l ly Af fected Acreage
278. We assume that all proposed private lands not covered by an existing HCP, SHA or other
Conservation Agreement would be subject to these categories of indirect effects and that
timber harvest practices on these lands may be affected as a result of designation. We do
not anticipate that State lands would be affected by these types of impacts.
219 Several studies have attempted to estimate the impact of perceptions about the effect of critical habitat designation on
land values and economic activity. Examples include Auffhammer, M., M. Oren, and D. Sunding. 2009. “Economic Impacts
of Critical habitat Designation: Evidence from the Market for Vacant Land.” Workshop Paper, The University of Arizona,
Program on Economics, Law, and the Environment, available at http://ele.arizona.edu/files/ELEsunding1-30-09.pdf ; List,
J.A., M. Margolis, and D. E. Osgood. 2006. “Is the Endangered Species Act Endangering Species?” National Bureau of
Economic Research Working Paper Series, Working Paper 12777, available at http://www.nber.org/papers/w12777; and
Lueck, Dean and Jeffrey A. Michael, April 2003, “Preemptive Habitat Destruction Under the Endangered Species Act,”
Journal of Law and Economics, 46: 27-60. Furthermore, the Washington Forest Protection Association (WFPA) submitted a
public comment stating, “these potential regulatory risks will lower the value of private land that has been federally
designated as critical habitat as compared to land that has not been designated as a buyer will not pay as much for
designated land because of the potential regulatory risks.” In support of this statement, WFPA quotes a member, who
stated, “When we do due diligence on potential timberland purchases for our clients or our own account we put zero value
on any timber that meets the ‘Demographic Support’ definition and appears limiting within owl circles. If a tract is all
habitat we do not even make an offer.” (as cited in the public comment submitted by WFPA, July 6, 2012, p. 2). [Note: the
WFPA member appears to be discussing areas identified by the State of Washington as places thought to be occupied by the
northern spotted owl, and thus these areas will receive protection regardless of whether critical habitat is designated.
However, the quote is indicative of the potential reaction of the organization to designating unoccupied stands as Federal
critical habitat.
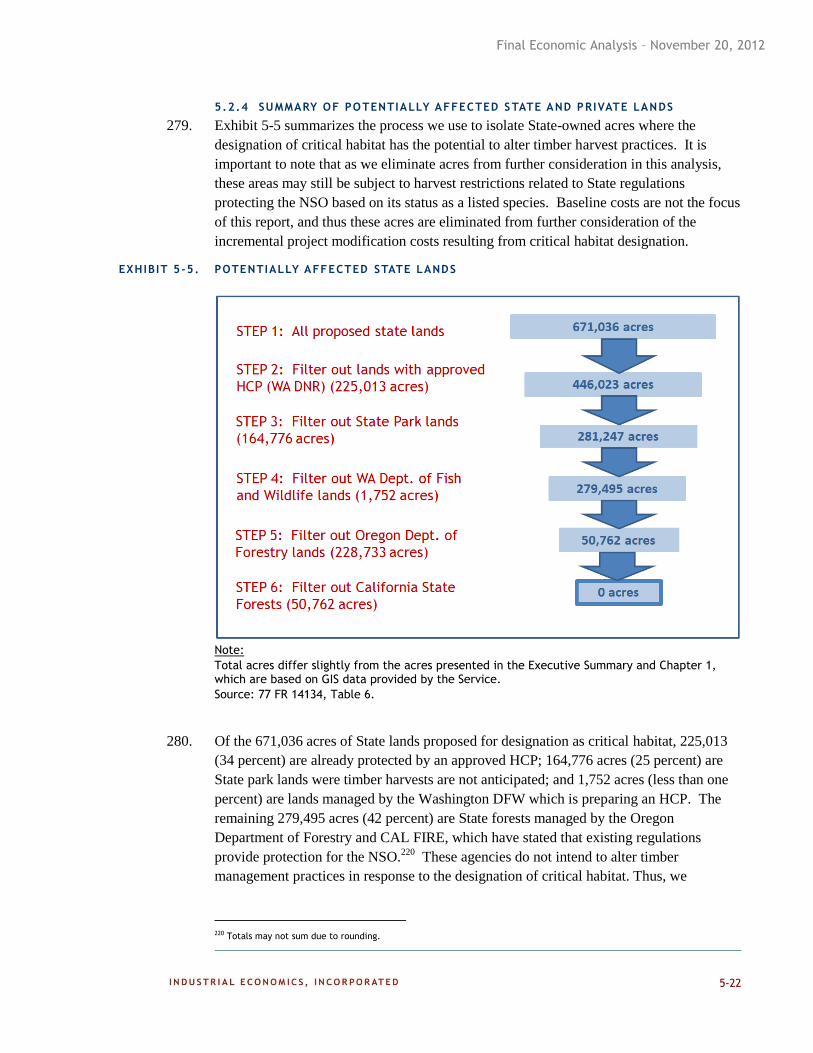
Final Economic Analysis – November 20, 2012
5-22
5.2.4 SUMMARY OF POTENTIALLY AFFECTED STATE AND PRIVATE LANDS
279. Exhibit 5-5 summarizes the process we use to isolate State-owned acres where the
designation of critical habitat has the potential to alter timber harvest practices. It is
important to note that as we eliminate acres from further consideration in this analysis,
these areas may still be subject to harvest restrictions related to State regulations
protecting the NSO based on its status as a listed species. Baseline costs are not the focus
of this report, and thus these acres are eliminated from further consideration of the
incremental project modification costs resulting from critical habitat designation.
EXHIBIT 5-5. POTENTIALLY AFFECTED STATE LANDS
Note:
Total acres differ slightly from the acres presented in the Executive Summary and Chapter 1, which are based on GIS data provided by the Service.
Source: 77 FR 14134, Table 6.
280. Of the 671,036 acres of State lands proposed for designation as critical habitat, 225,013
(34 percent) are already protected by an approved HCP; 164,776 acres (25 percent) are
State park lands were timber harvests are not anticipated; and 1,752 acres (less than one
percent) are lands managed by the Washington DFW which is preparing an HCP. The
remaining 279,495 acres (42 percent) are State forests managed by the Oregon
Department of Forestry and CAL FIRE, which have stated that existing regulations
provide protection for the NSO.220
These agencies do not intend to alter timber
management practices in response to the designation of critical habitat. Thus, we
220 Totals may not sum due to rounding.
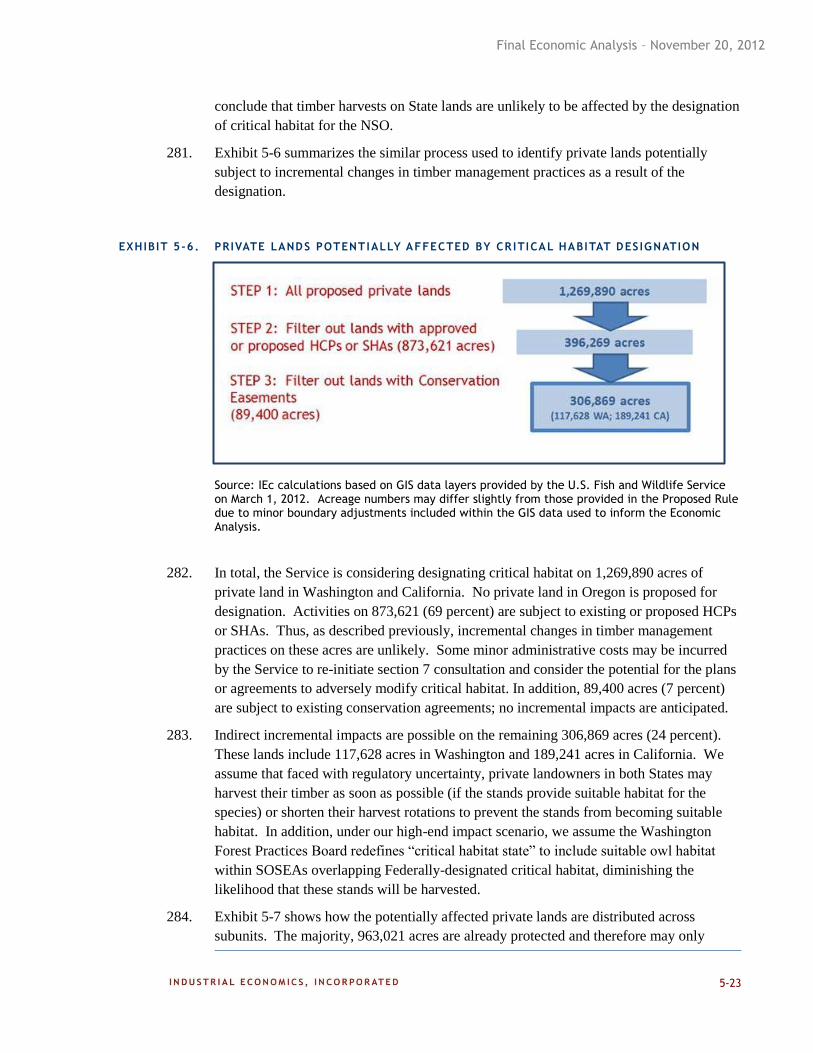
Final Economic Analysis – November 20, 2012
5-23
conclude that timber harvests on State lands are unlikely to be affected by the designation
of critical habitat for the NSO.
281. Exhibit 5-6 summarizes the similar process used to identify private lands potentially
subject to incremental changes in timber management practices as a result of the
designation.
EXHIBIT 5-6. PRIVATE LANDS POTENTIALLY AFFECTED BY CR ITICAL HABITAT DES IGNATION
Source: IEc calculations based on GIS data layers provided by the U.S. Fish and Wildlife Service on March 1, 2012. Acreage numbers may differ slightly from those provided in the Proposed Rule due to minor boundary adjustments included within the GIS data used to inform the Economic Analysis.
282. In total, the Service is considering designating critical habitat on 1,269,890 acres of
private land in Washington and California. No private land in Oregon is proposed for
designation. Activities on 873,621 (69 percent) are subject to existing or proposed HCPs
or SHAs. Thus, as described previously, incremental changes in timber management
practices on these acres are unlikely. Some minor administrative costs may be incurred
by the Service to re-initiate section 7 consultation and consider the potential for the plans
or agreements to adversely modify critical habitat. In addition, 89,400 acres (7 percent)
are subject to existing conservation agreements; no incremental impacts are anticipated.
283. Indirect incremental impacts are possible on the remaining 306,869 acres (24 percent).
These lands include 117,628 acres in Washington and 189,241 acres in California. We
assume that faced with regulatory uncertainty, private landowners in both States may
harvest their timber as soon as possible (if the stands provide suitable habitat for the
species) or shorten their harvest rotations to prevent the stands from becoming suitable
habitat. In addition, under our high-end impact scenario, we assume the Washington
Forest Practices Board redefines “critical habitat state” to include suitable owl habitat
within SOSEAs overlapping Federally-designated critical habitat, diminishing the
likelihood that these stands will be harvested.
284. Exhibit 5-7 shows how the potentially affected private lands are distributed across
subunits. The majority, 963,021 acres are already protected and therefore may only
Final Economic Analysis – November 20, 2012
5-24
experience increased administrative burden, if any costs are incurred at all. Of the
306,869 acres potentially experiencing incremental costs, most (285,154) will only be
affected if landowners react to regulatory uncertainty by changing harvest schedule
decisions. We make this conclusion because of the 117,628 acres potentially affected
acres in Washington, only 21,725 are identified by the State as “suitable” habitat that
could be subject to additional State regulation. We also note that this figure is likely
overstated because some of these acres may already fall within median home range
circles and thus are already subject to the more stringent requirements contemplated in
this analysis.
285. Importantly, we note that although likely incremental impacts in approximately ¾ of
proposed private acres are limited to minor administrative costs, incremental project
modifications are possible in all but two of the proposed subunits with private acres. This
counter-intuitive finding results from the fact that each subunit includes a mix of private
acres with varying levels of potential effects. Exhibits 5-8 through 5-10 illustrates this
phenomenon by showing the distribution of private acres in the three subunits in
Washington with the most acres potentially subject to new State regulation. In each map,
we identify the private lands proposed for critical habitat designation, and color-code
each parcel to reflect the nature of potential incremental effects anticipated on that
land.221
221 Note that these maps illustrate the type/extent of incremental effects anticipated on each parcel, rather than the
relative subunit-wide ranking identified in Exhibit 5-6 (as all three of the depicted subunits have been identified as having a
relative effect level of “high”).
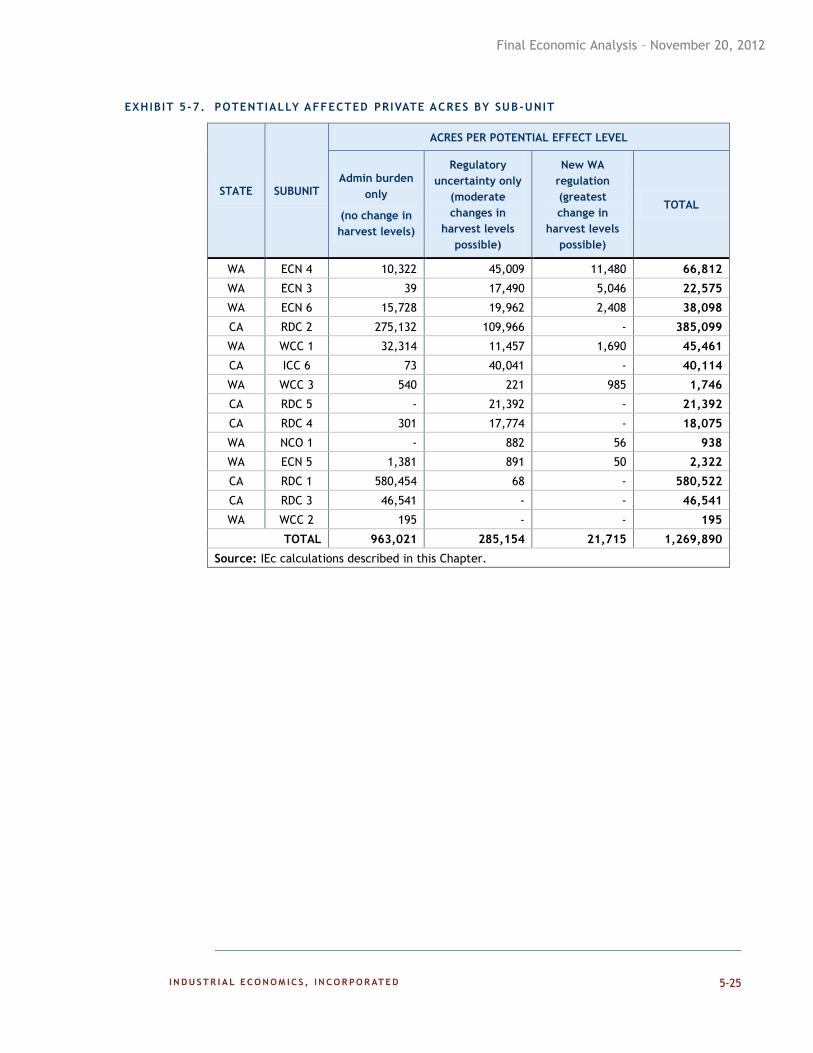
Final Economic Analysis – November 20, 2012
5-25
EXHIBIT 5-7. POTENTIALLY AFFECTED PRIVATE ACRES BY SUB-UNIT
STATE SUBUNIT
ACRES PER POTENTIAL EFFECT LEVEL
Admin burden
only
(no change in
harvest levels)
Regulatory
uncertainty only
(moderate
changes in
harvest levels
possible)
New WA
regulation
(greatest
change in
harvest levels
possible)
TOTAL
WA ECN 4 10,322 45,009 11,480 66,812
WA ECN 3 39 17,490 5,046 22,575
WA ECN 6 15,728 19,962 2,408 38,098
CA RDC 2 275,132 109,966 - 385,099
WA WCC 1 32,314 11,457 1,690 45,461
CA ICC 6 73 40,041 - 40,114
WA WCC 3 540 221 985 1,746
CA RDC 5 - 21,392 - 21,392
CA RDC 4 301 17,774 - 18,075
WA NCO 1 - 882 56 938
WA ECN 5 1,381 891 50 2,322
CA RDC 1 580,454 68 - 580,522
CA RDC 3 46,541 - - 46,541
WA WCC 2 195 - - 195
TOTAL 963,021 285,154 21,715 1,269,890
Source: IEc calculations described in this Chapter.
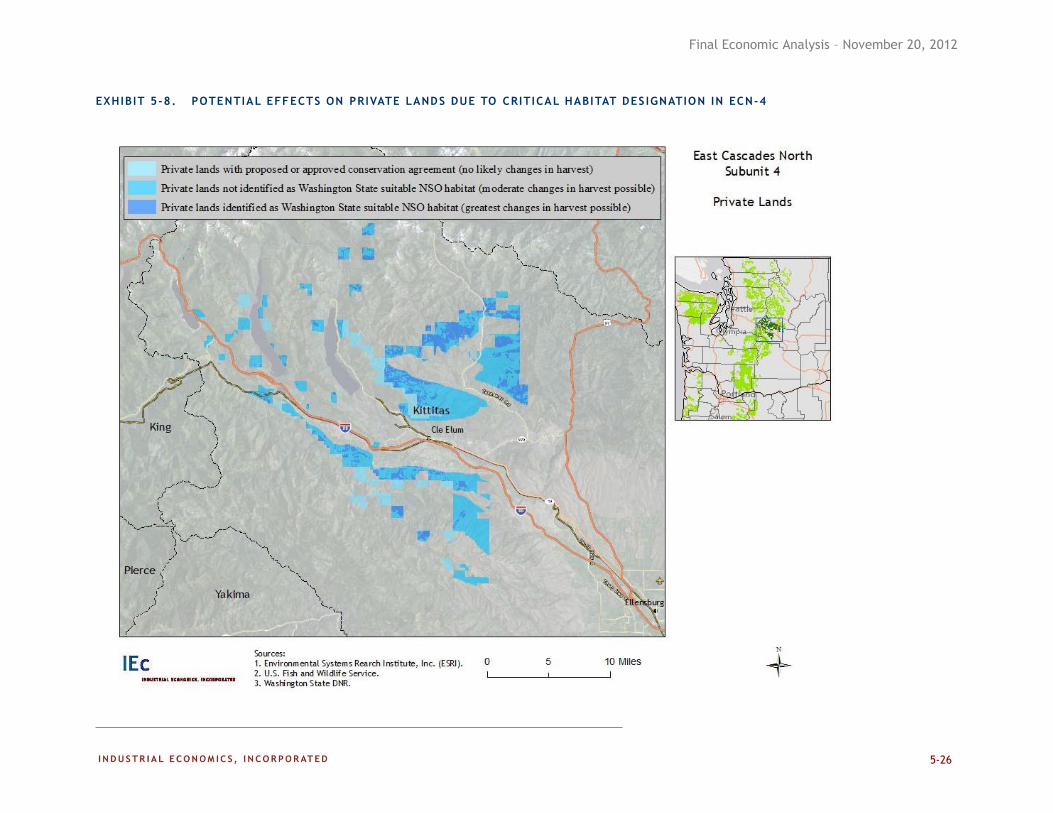
Final Economic Analysis – November 20, 2012
5-26
EXHIBIT 5-8. POTENTIAL EFFECTS ON PRIVATE LANDS DUE TO CRITICAL HABITAT DES IGNATION IN ECN-4
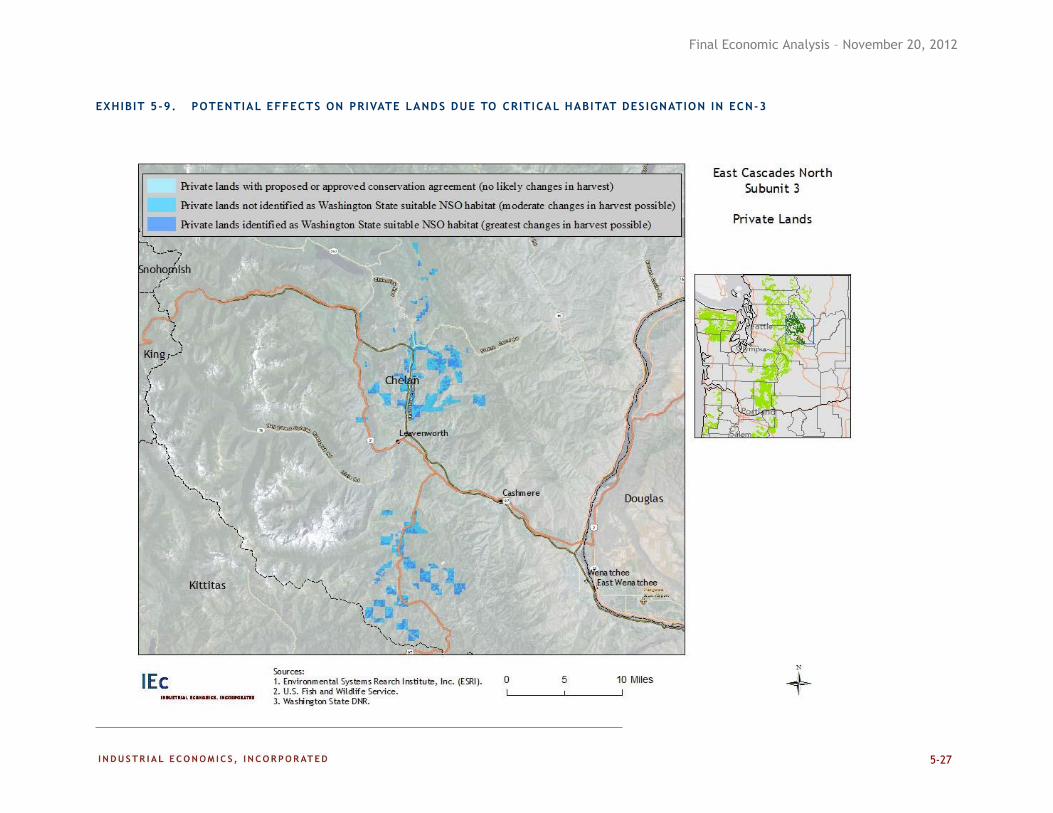
Final Economic Analysis – November 20, 2012
5-27
EXHIBIT 5-9. POTENTIAL EFFECTS ON PRIVATE LANDS DUE TO CRITICAL HABITAT DES IGNATION IN ECN-3
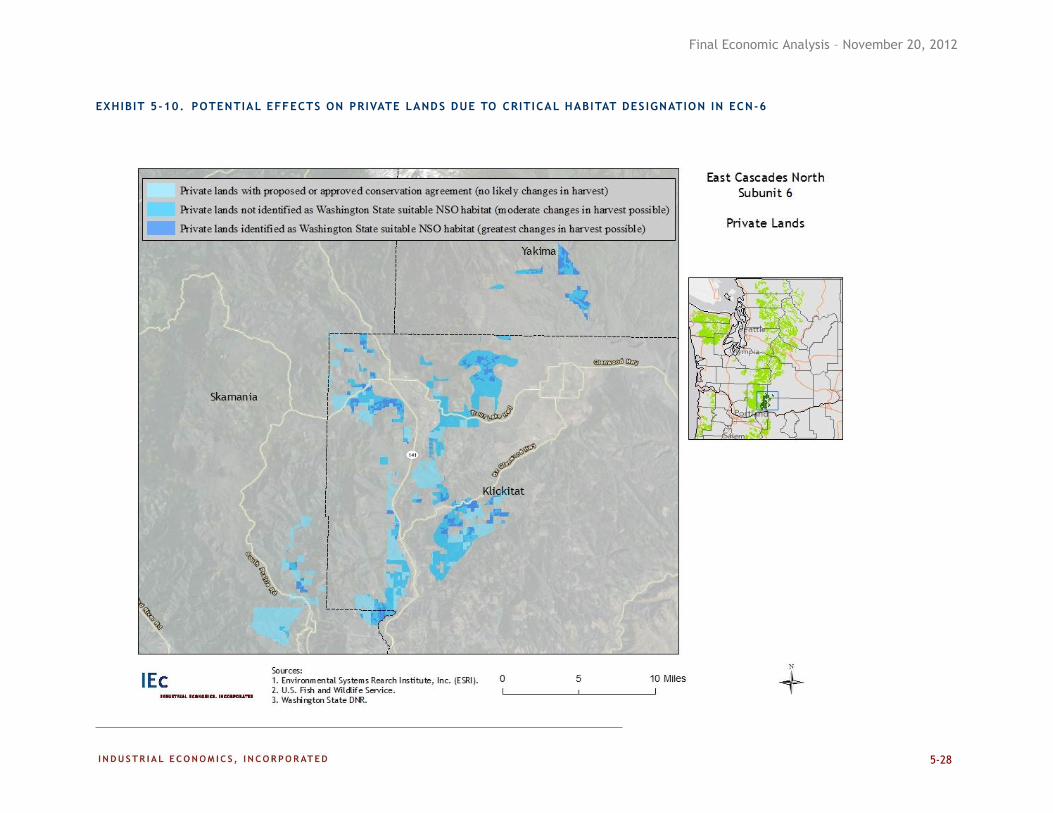
Final Economic Analysis – November 20, 2012
5-28
EXHIBIT 5-10. POTENTIAL EFFECTS ON PRIVATE LANDS DUE TO CRITICAL HABITAT DES IGNATION IN ECN-6
Final Economic Analysis – November 20, 2012
5-29
5.3 STEP 3 – ESTIMATE THE RELATIVE COSTS OF CHANGES TO TIMBER HARVEST ON
PRIVATE LANDS
286. As described above, we identify a total of 306,869 acres of land potentially subject to
critical habitat-related indirect impacts resulting from regulatory uncertainty, and of those
acres, 117,628 are potentially subject to additional indirect impacts related to possible
changes in Washington State Forest Practice Rules. In this section, we describe the data
necessary to monetize these potential impacts. First, we describe the costs associated
with changing timber rotations. Then, we describe costs associated with foregone
harvests on WA lands. Due to data limitations, we conclude with a qualitative discussion
of potential impacts.
287. To the extent private landowners harvest timber earlier or shorten timber rotations, the
present value of those timberlands may decrease. However, the total value of the land
will not be lost. The degree to which land values may decrease if trees are cut earlier
depends on multiple factors, including the economics of when a stand would reach
financial maturity and the incremental change in the stand age at the time of harvest.
Financial maturity is a function of the time period during which a stand becomes
merchantable (i.e., the trees become large enough to enter the market), market conditions
(particularly timber and log prices), and landowner discount rates. If a landowner
manages his land on a 40-year rotation, the harvested trees are smaller on a relative basis;
however, the landowner waits a shorter period to obtain the value of those trees.
Managing on a 60-year rotation generally results in more biomass (timber) volume per
acre, plus (for mill owners) the ability to produce higher valued premium products from
larger logs. However, they incur a longer wait time (time value of money) to obtain those
higher returns. Often, landowners make decisions about the optimal time to harvest
based on calculations of the present value of their investment.
288. In proposed critical habitat for the NSO, where Douglas fir is likely to be a dominant tree
species cultivated for harvest, from a biological standpoint, the mean annual growth rate
of the trees are likely to peak at an ages of 70 to 80 years or more.222
However, in
economic terms, when balancing the preference for larger trees with a preference for
dollar returns sooner rather than later, the present value of those trees may peak earlier,
40 to 60 years.223
The optimal harvest age varies depending on landowner preferences
and market conditions.
289. If, as a result of the regulatory uncertainty created by the designation of critical habitat,
some landowners shorten their rotations from 60 to 40 years, the magnitude of their loss
is uncertain and will depend on the factors described above. It is possible that some
landowners will not experience a loss if the reduction in biomass volumes resulting from
earlier harvest is compensated for by earlier returns on their investment. However, it is
222 Personal communication with Jeff Jenkins, Atterbury Consultants, Inc., April 20, 2012.
223 Ibid.
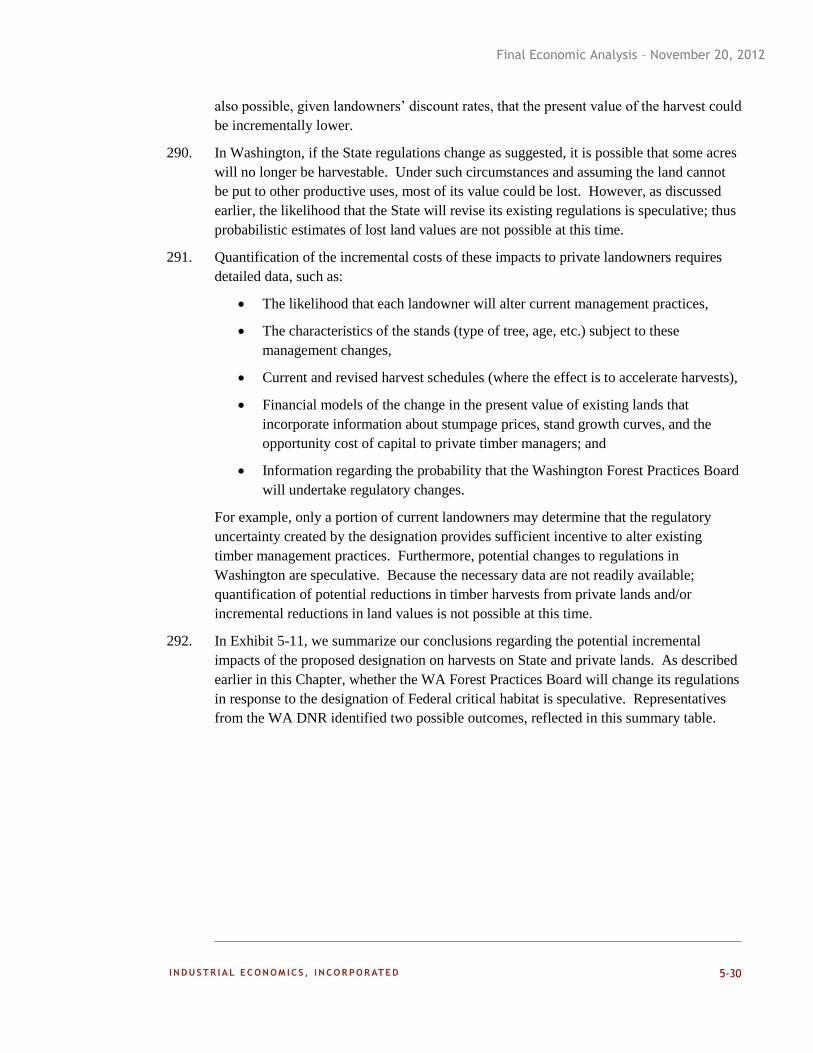
Final Economic Analysis – November 20, 2012
5-30
also possible, given landowners’ discount rates, that the present value of the harvest could
be incrementally lower.
290. In Washington, if the State regulations change as suggested, it is possible that some acres
will no longer be harvestable. Under such circumstances and assuming the land cannot
be put to other productive uses, most of its value could be lost. However, as discussed
earlier, the likelihood that the State will revise its existing regulations is speculative; thus
probabilistic estimates of lost land values are not possible at this time.
291. Quantification of the incremental costs of these impacts to private landowners requires
detailed data, such as:
The likelihood that each landowner will alter current management practices,
The characteristics of the stands (type of tree, age, etc.) subject to these
management changes,
Current and revised harvest schedules (where the effect is to accelerate harvests),
Financial models of the change in the present value of existing lands that
incorporate information about stumpage prices, stand growth curves, and the
opportunity cost of capital to private timber managers; and
Information regarding the probability that the Washington Forest Practices Board
will undertake regulatory changes.
For example, only a portion of current landowners may determine that the regulatory
uncertainty created by the designation provides sufficient incentive to alter existing
timber management practices. Furthermore, potential changes to regulations in
Washington are speculative. Because the necessary data are not readily available;
quantification of potential reductions in timber harvests from private lands and/or
incremental reductions in land values is not possible at this time.
292. In Exhibit 5-11, we summarize our conclusions regarding the potential incremental
impacts of the proposed designation on harvests on State and private lands. As described
earlier in this Chapter, whether the WA Forest Practices Board will change its regulations
in response to the designation of Federal critical habitat is speculative. Representatives
from the WA DNR identified two possible outcomes, reflected in this summary table.
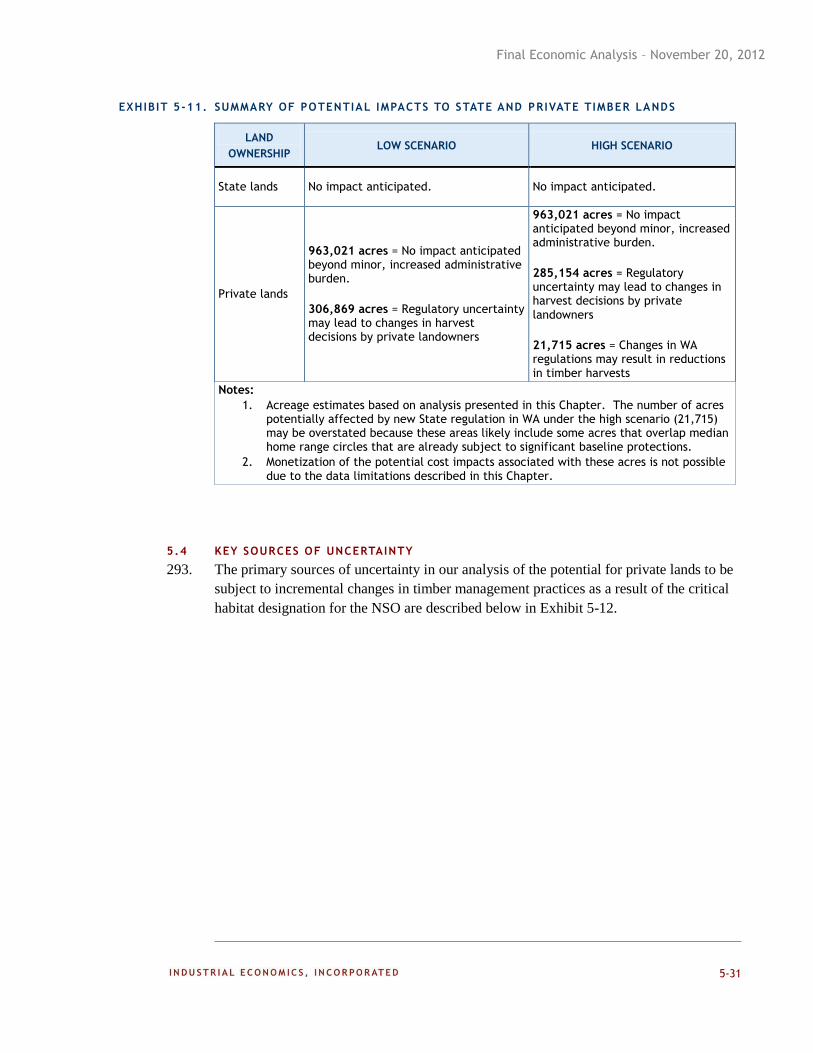
Final Economic Analysis – November 20, 2012
5-31
EXHIBIT 5-11. SUMMARY OF POTENTIAL IMPACTS TO STATE AND PRIVATE TIMBER LANDS
LAND
OWNERSHIP LOW SCENARIO HIGH SCENARIO
State lands No impact anticipated. No impact anticipated.
Private lands
963,021 acres = No impact anticipated beyond minor, increased administrative burden.
306,869 acres = Regulatory uncertainty may lead to changes in harvest decisions by private landowners
963,021 acres = No impact anticipated beyond minor, increased administrative burden.
285,154 acres = Regulatory uncertainty may lead to changes in harvest decisions by private landowners
21,715 acres = Changes in WA regulations may result in reductions in timber harvests
Notes:
1. Acreage estimates based on analysis presented in this Chapter. The number of acres potentially affected by new State regulation in WA under the high scenario (21,715) may be overstated because these areas likely include some acres that overlap median home range circles that are already subject to significant baseline protections.
2. Monetization of the potential cost impacts associated with these acres is not possible due to the data limitations described in this Chapter.
5.4 KEY SOURCES OF UNCERTAINTY
293. The primary sources of uncertainty in our analysis of the potential for private lands to be
subject to incremental changes in timber management practices as a result of the critical
habitat designation for the NSO are described below in Exhibit 5-12.
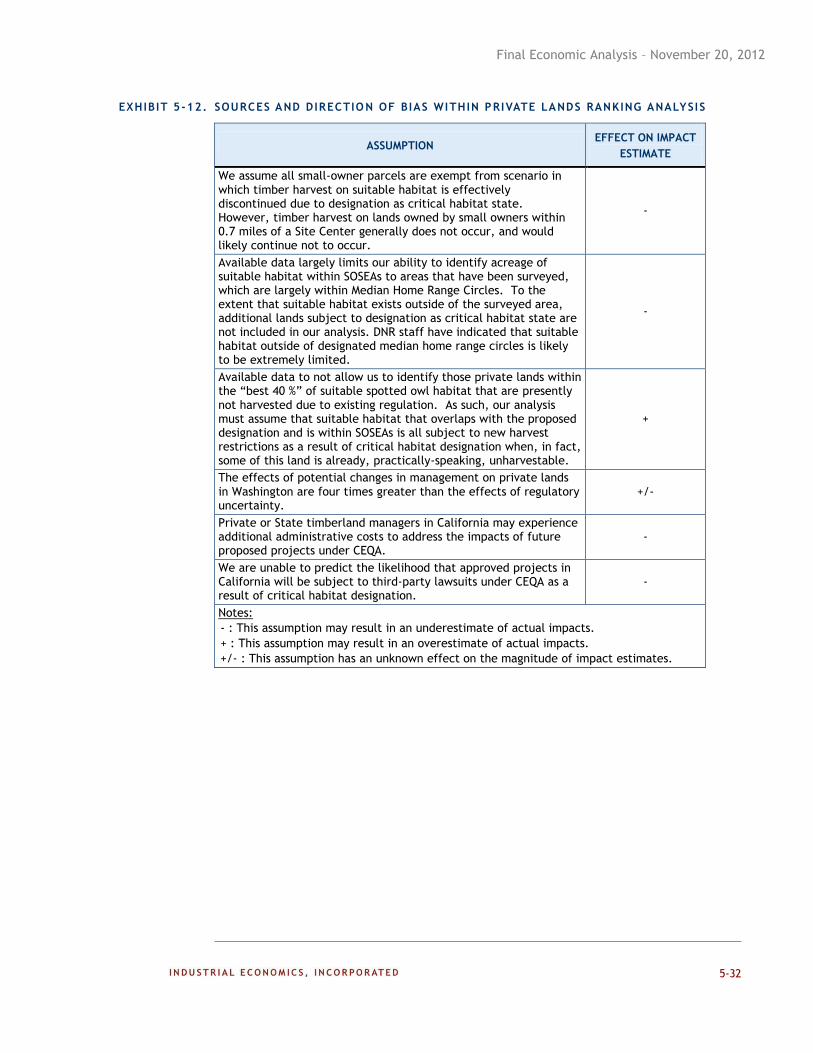
Final Economic Analysis – November 20, 2012
5-32
EXHIBIT 5-12. SOURCES AND DIRECTIO N OF BIAS WITHIN PRIVATE LANDS RANKING ANALYSIS
ASSUMPTION EFFECT ON IMPACT
ESTIMATE
We assume all small-owner parcels are exempt from scenario in which timber harvest on suitable habitat is effectively discontinued due to designation as critical habitat state. However, timber harvest on lands owned by small owners within 0.7 miles of a Site Center generally does not occur, and would likely continue not to occur.
-
Available data largely limits our ability to identify acreage of suitable habitat within SOSEAs to areas that have been surveyed, which are largely within Median Home Range Circles. To the extent that suitable habitat exists outside of the surveyed area, additional lands subject to designation as critical habitat state are not included in our analysis. DNR staff have indicated that suitable habitat outside of designated median home range circles is likely to be extremely limited.
-
Available data to not allow us to identify those private lands within the “best 40 %” of suitable spotted owl habitat that are presently not harvested due to existing regulation. As such, our analysis must assume that suitable habitat that overlaps with the proposed designation and is within SOSEAs is all subject to new harvest restrictions as a result of critical habitat designation when, in fact, some of this land is already, practically-speaking, unharvestable.
+
The effects of potential changes in management on private lands in Washington are four times greater than the effects of regulatory uncertainty.
+/-
Private or State timberland managers in California may experience additional administrative costs to address the impacts of future proposed projects under CEQA.
-
We are unable to predict the likelihood that approved projects in California will be subject to third-party lawsuits under CEQA as a result of critical habitat designation.
-
Notes:
- : This assumption may result in an underestimate of actual impacts.
+ : This assumption may result in an overestimate of actual impacts.
+/- : This assumption has an unknown effect on the magnitude of impact estimates.
Final Economic Analysis - November 20, 2012
6-1
CHAPTER 6 | REGIONAL IMPACTS
294. We have identified approximately 1.3 million acres of Federal lands and 307,000 acres of
private lands where timber harvest practices may be directly or indirectly affected by the
designation. As described in Chapters 4 and 5, we expect that changes in harvest
practices resulting from the designation could reduce or increase harvests from portions
of these lands, but these changes are unlikely to eliminate the harvests completely. In this
chapter, we assess the potential distributional effects of the designation based on
historical trends and current economic conditions in the region.
6.1 SOCIOECONOMIC PROFILES OF SUBJECT COUNTI ES
295. As described in Chapters 4 and 5, certain subunits contain a higher proportion of lands
that are relatively more likely to experience incremental impacts due to the designation of
critical habitat. Exhibit 6-1 presents these subunits, along with their respective units and
the counties in which they are located (hereafter, “subject counties”).224
There are 23
subject counties in total (nine in California; nine in Oregon; and five in Washington).
EXHIBIT 6-1. SUBUNITS WITH RESPECTIVE UNITS AND SUBJECT COUNTIES
SUBUNIT UNIT COUNTY
ECN-3 East Cascades North Chelan, WA
ECN-4 East Cascades North Kittitas, WA
ECN-6 East Cascades North
Klickitat, WA
Skamania, WA
Yakima, WA
ECS-3 East Cascades South Siskiyou, CA
ICC-1 Inner California Coast Ranges
Humboldt, CA
Shasta, CA
Tehama, CA
Trinity, CA
ICC-6 Inner California Coast Ranges Napa, CA
Sonoma, CA
ICC-7 Inner California Coast Ranges Shasta, CA
Trinity, CA
KLW-7 Klamath West Del Norte, CA
224 With regard to private lands, we include subunits with relatively larger amounts of land in Washington potentially
susceptible to changes in State regulations as well as subunits in California with a relatively greater number of acres
potentially subject to the effects of regulatory uncertainty (see Exhibit 5-7).
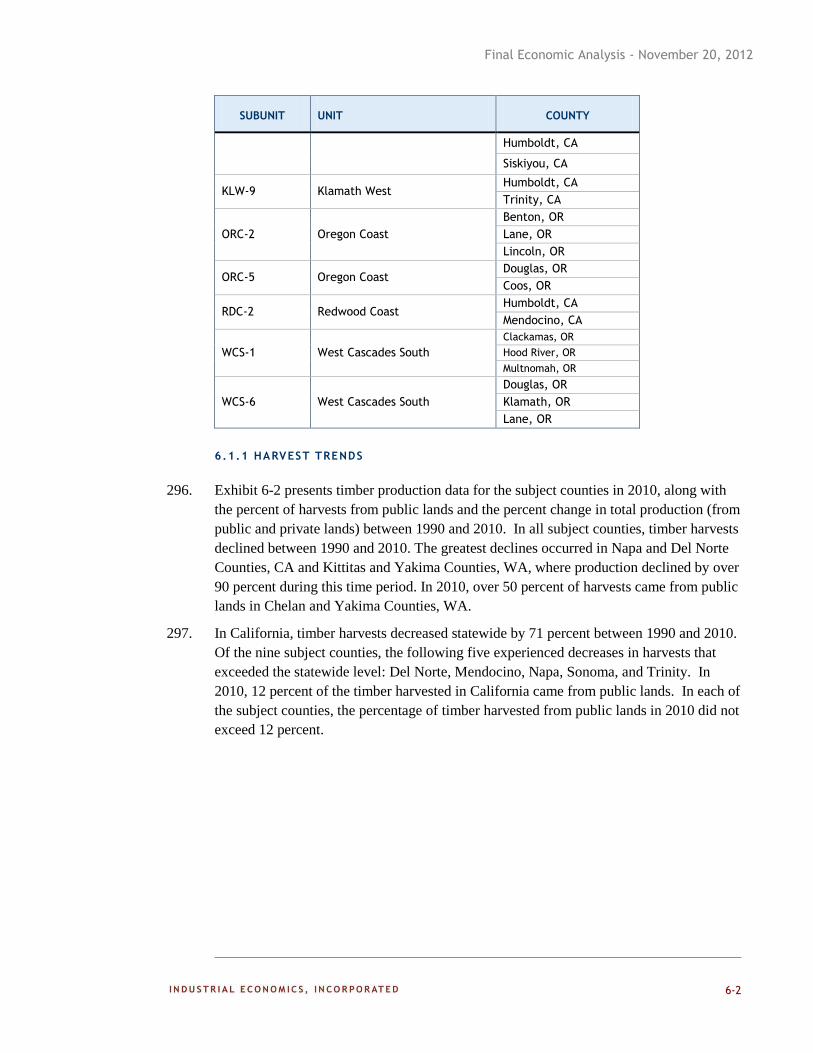
Final Economic Analysis - November 20, 2012
6-2
SUBUNIT UNIT COUNTY
Humboldt, CA
Siskiyou, CA
KLW-9 Klamath West Humboldt, CA
Trinity, CA
ORC-2 Oregon Coast
Benton, OR
Lane, OR
Lincoln, OR
ORC-5 Oregon Coast Douglas, OR
Coos, OR
RDC-2 Redwood Coast Humboldt, CA
Mendocino, CA
WCS-1 West Cascades South
Clackamas, OR
Hood River, OR
Multnomah, OR
WCS-6 West Cascades South
Douglas, OR
Klamath, OR
Lane, OR
6.1.1 HARVEST TRENDS
296. Exhibit 6-2 presents timber production data for the subject counties in 2010, along with
the percent of harvests from public lands and the percent change in total production (from
public and private lands) between 1990 and 2010. In all subject counties, timber harvests
declined between 1990 and 2010. The greatest declines occurred in Napa and Del Norte
Counties, CA and Kittitas and Yakima Counties, WA, where production declined by over
90 percent during this time period. In 2010, over 50 percent of harvests came from public
lands in Chelan and Yakima Counties, WA.
297. In California, timber harvests decreased statewide by 71 percent between 1990 and 2010.
Of the nine subject counties, the following five experienced decreases in harvests that
exceeded the statewide level: Del Norte, Mendocino, Napa, Sonoma, and Trinity. In
2010, 12 percent of the timber harvested in California came from public lands. In each of
the subject counties, the percentage of timber harvested from public lands in 2010 did not
exceed 12 percent.
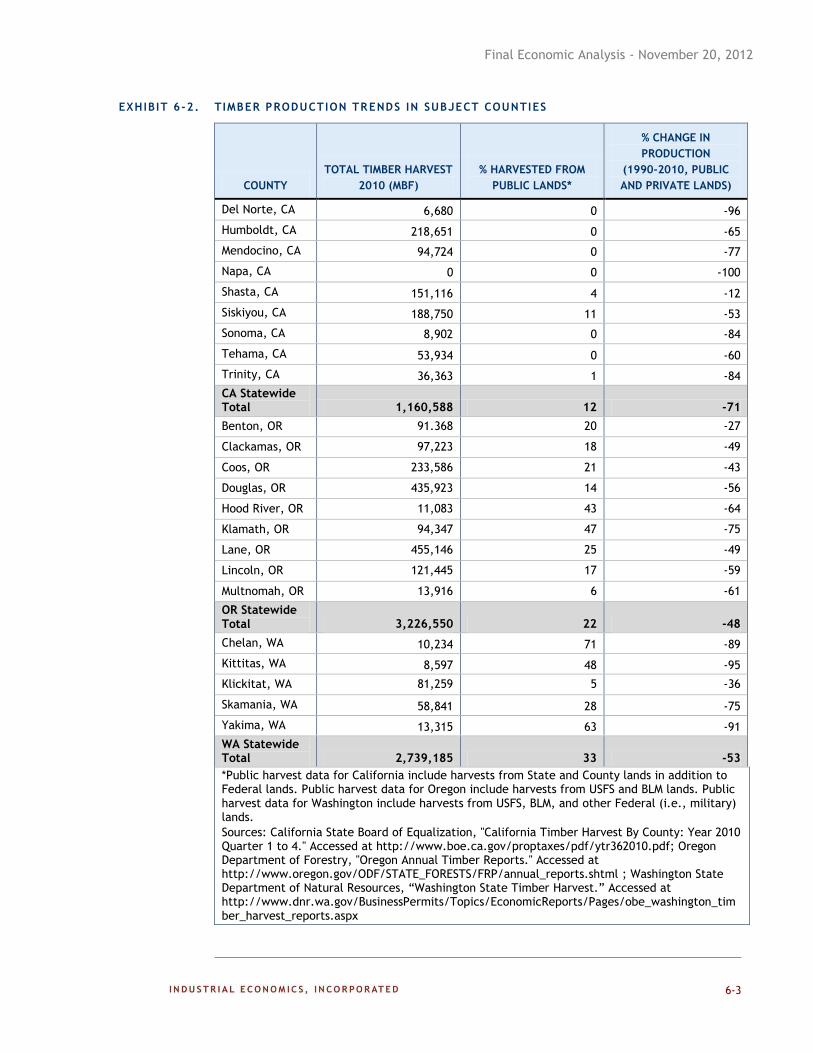
Final Economic Analysis - November 20, 2012
6-3
EXHIBIT 6-2. TIMBER PRODUCTION TRENDS IN SUBJECT COUNTIES
COUNTY
TOTAL TIMBER HARVEST
2010 (MBF)
% HARVESTED FROM
PUBLIC LANDS*
% CHANGE IN
PRODUCTION
(1990-2010, PUBLIC
AND PRIVATE LANDS)
Del Norte, CA 6,680 0 -96
Humboldt, CA 218,651 0 -65
Mendocino, CA 94,724 0 -77
Napa, CA 0 0 -100
Shasta, CA 151,116 4 -12
Siskiyou, CA 188,750 11 -53
Sonoma, CA 8,902 0 -84
Tehama, CA 53,934 0 -60
Trinity, CA 36,363 1 -84
CA Statewide Total 1,160,588 12 -71
Benton, OR 91.368 20 -27
Clackamas, OR 97,223 18 -49
Coos, OR 233,586 21 -43
Douglas, OR 435,923 14 -56
Hood River, OR 11,083 43 -64
Klamath, OR 94,347 47 -75
Lane, OR 455,146 25 -49
Lincoln, OR 121,445 17 -59
Multnomah, OR 13,916 6 -61
OR Statewide Total 3,226,550 22 -48
Chelan, WA 10,234 71 -89
Kittitas, WA 8,597 48 -95
Klickitat, WA 81,259 5 -36
Skamania, WA 58,841 28 -75
Yakima, WA 13,315 63 -91
WA Statewide Total 2,739,185 33 -53
*Public harvest data for California include harvests from State and County lands in addition to Federal lands. Public harvest data for Oregon include harvests from USFS and BLM lands. Public harvest data for Washington include harvests from USFS, BLM, and other Federal (i.e., military) lands.
Sources: California State Board of Equalization, "California Timber Harvest By County: Year 2010 Quarter 1 to 4." Accessed at http://www.boe.ca.gov/proptaxes/pdf/ytr362010.pdf; Oregon Department of Forestry, "Oregon Annual Timber Reports." Accessed at http://www.oregon.gov/ODF/STATE_FORESTS/FRP/annual_reports.shtml ; Washington State Department of Natural Resources, “Washington State Timber Harvest.” Accessed at http://www.dnr.wa.gov/BusinessPermits/Topics/EconomicReports/Pages/obe_washington_timber_harvest_reports.aspx
Final Economic Analysis - November 20, 2012
6-4
298. In Oregon, timber harvests decreased statewide by 48 percent between 1990 and 2010.
During the same time period, the following seven subject counties experienced decreases
in timber harvests that exceeded the statewide level: Clackamas, Douglas, Hood River,
Klamath, Lane, Lincoln, and Multnomah. In 2010, 22 percent of statewide harvests came
from public lands. In three of the nine subject counties (Hood River, Klamath, and Lane),
the percentage of total harvests coming from public lands exceeded 22 percent.
299. In Washington, timber harvests decreased statewide by 53 percent between 1990 and
2010. Harvests in the following four subject counties decreased by 75 percent or more:
Chelan, Kittitas, Skamania, and Yakima. In 2010, 33 percent of statewide harvests came
from public lands. In three of the five subject counties (Chelan, Kittitas, and Yakima),
public harvests represented greater than 33 percent of total harvests.
6.1.2 EMPLOYMENT TRENDS
300. Exhibit 6-3 illustrates timber industry employment trends in the subject counties. In all
but two subject counties (Napa and Tehama Counties, CA), employment in the timber
industry decreased between 1989 and 2009. In 2009, timber industry employment
represented less than ten percent of total employment in 18 of the 23 subject counties.
301. In California, timber industry employment decreased statewide by 55 percent between
1989 and 2009. During the same time period, seven of the nine subject counties
experienced decreases in timber employment that exceeded the statewide level, with the
greatest decrease occurring in Del Norte County. The remaining two counties (Napa and
Tehama) experienced increases in timber industry employment. In 2009, timber industry
employment represented over 10 percent of employment in Tehama and Trinity Counties.
302. In Oregon, timber industry employment decreased statewide by 30 percent between 1989
and 2009. In the subject counties, timber industry employment declined significantly
during this period, with the greatest declines occurring in Hood River and Multnomah
Counties. In 2009, timber industry employment represented over ten percent of total
employment in Douglas and Klamath Counties.
303. In Washington, timber industry employment declined statewide by 51 percent between
1989 and 2009. Timber industry employment declined by 40 percent of more in all five
of the subject counties during this period, most significantly in Skamania County. In
2009, timber industry employment represented 14 percent of total employment in
Skamania County.
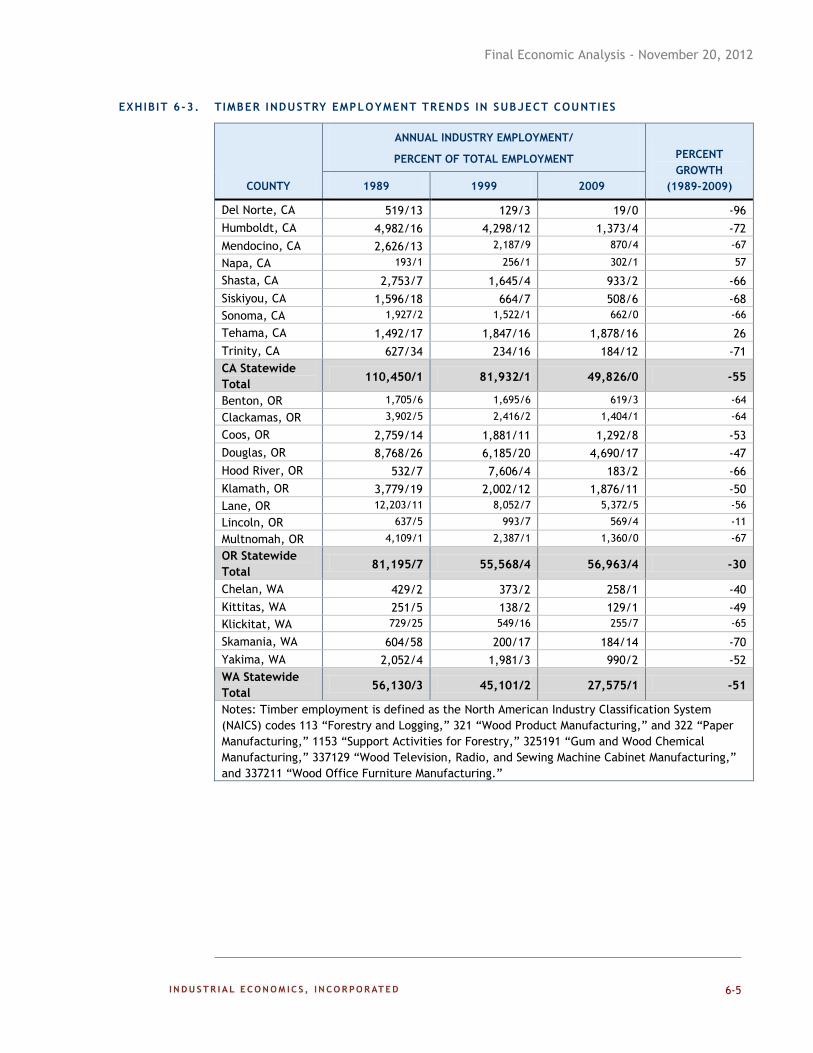
Final Economic Analysis - November 20, 2012
6-5
EXHIBIT 6-3. TIMBER INDUSTRY EMPLOYMENT TRENDS IN SUBJECT COUNTIES
COUNTY
ANNUAL INDUSTRY EMPLOYMENT/
PERCENT OF TOTAL EMPLOYMENT PERCENT
GROWTH
(1989-2009) 1989 1999 2009
Del Norte, CA 519/13 129/3 19/0 -96
Humboldt, CA 4,982/16 4,298/12 1,373/4 -72
Mendocino, CA 2,626/13 2,187/9 870/4 -67
Napa, CA 193/1 256/1 302/1 57
Shasta, CA 2,753/7 1,645/4 933/2 -66
Siskiyou, CA 1,596/18 664/7 508/6 -68
Sonoma, CA 1,927/2 1,522/1 662/0 -66
Tehama, CA 1,492/17 1,847/16 1,878/16 26
Trinity, CA 627/34 234/16 184/12 -71
CA Statewide
Total 110,450/1 81,932/1 49,826/0 -55
Benton, OR 1,705/6 1,695/6 619/3 -64
Clackamas, OR 3,902/5 2,416/2 1,404/1 -64
Coos, OR 2,759/14 1,881/11 1,292/8 -53
Douglas, OR 8,768/26 6,185/20 4,690/17 -47
Hood River, OR 532/7 7,606/4 183/2 -66
Klamath, OR 3,779/19 2,002/12 1,876/11 -50
Lane, OR 12,203/11 8,052/7 5,372/5 -56
Lincoln, OR 637/5 993/7 569/4 -11
Multnomah, OR 4,109/1 2,387/1 1,360/0 -67
OR Statewide
Total 81,195/7 55,568/4 56,963/4 -30
Chelan, WA 429/2 373/2 258/1 -40
Kittitas, WA 251/5 138/2 129/1 -49
Klickitat, WA 729/25 549/16 255/7 -65
Skamania, WA 604/58 200/17 184/14 -70
Yakima, WA 2,052/4 1,981/3 990/2 -52
WA Statewide
Total 56,130/3 45,101/2 27,575/1 -51
Notes: Timber employment is defined as the North American Industry Classification System
(NAICS) codes 113 “Forestry and Logging,” 321 “Wood Product Manufacturing,” and 322 “Paper
Manufacturing,” 1153 “Support Activities for Forestry,” 325191 “Gum and Wood Chemical
Manufacturing,” 337129 “Wood Television, Radio, and Sewing Machine Cabinet Manufacturing,”
and 337211 “Wood Office Furniture Manufacturing.”
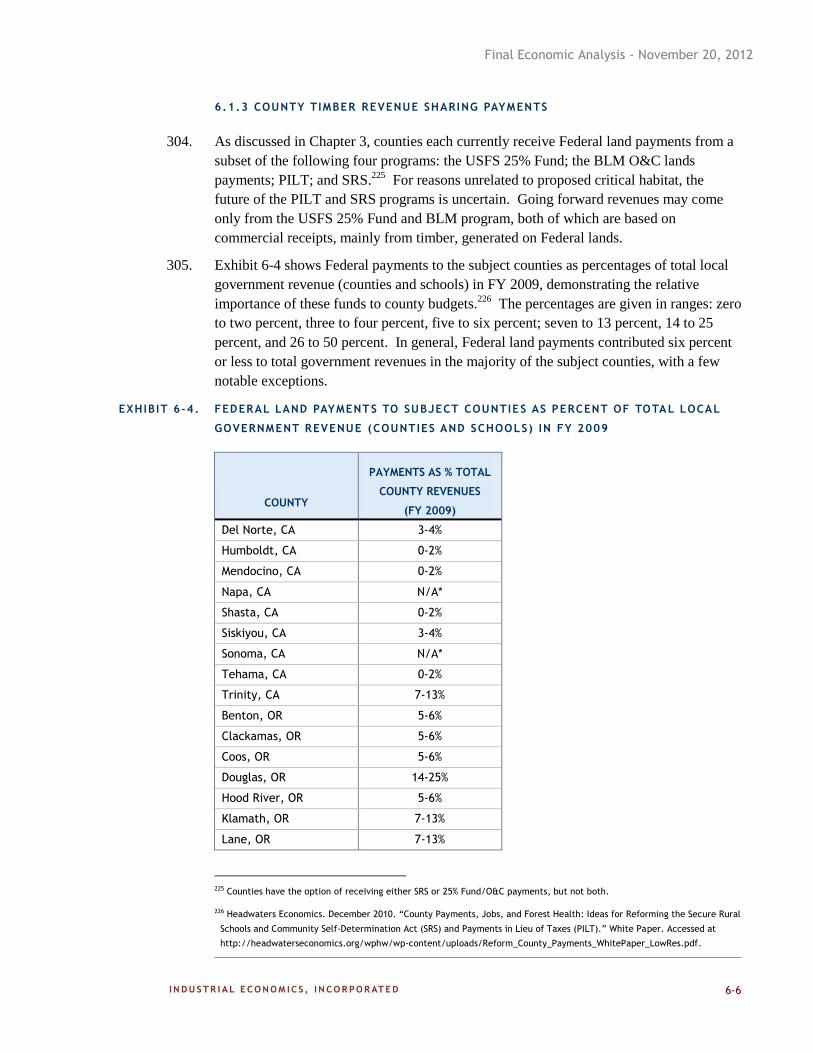
Final Economic Analysis - November 20, 2012
6-6
6.1.3 COUNTY TIMBER REVENUE SHARING PAYMENTS
304. As discussed in Chapter 3, counties each currently receive Federal land payments from a
subset of the following four programs: the USFS 25% Fund; the BLM O&C lands
payments; PILT; and SRS.225
For reasons unrelated to proposed critical habitat, the
future of the PILT and SRS programs is uncertain. Going forward revenues may come
only from the USFS 25% Fund and BLM program, both of which are based on
commercial receipts, mainly from timber, generated on Federal lands.
305. Exhibit 6-4 shows Federal payments to the subject counties as percentages of total local
government revenue (counties and schools) in FY 2009, demonstrating the relative
importance of these funds to county budgets.226
The percentages are given in ranges: zero
to two percent, three to four percent, five to six percent; seven to 13 percent, 14 to 25
percent, and 26 to 50 percent. In general, Federal land payments contributed six percent
or less to total government revenues in the majority of the subject counties, with a few
notable exceptions.
EXHIBIT 6-4. FEDERAL LAND PAYMENTS TO SUBJECT COUNTIES AS PERCENT OF TOTAL LOCAL
GOVERNMENT REVENUE (COUNTIES AND SCHOOLS) IN FY 2009
COUNTY
PAYMENTS AS % TOTAL
COUNTY REVENUES
(FY 2009)
Del Norte, CA 3-4%
Humboldt, CA 0-2%
Mendocino, CA 0-2%
Napa, CA N/A*
Shasta, CA 0-2%
Siskiyou, CA 3-4%
Sonoma, CA N/A*
Tehama, CA 0-2%
Trinity, CA 7-13%
Benton, OR 5-6%
Clackamas, OR 5-6%
Coos, OR 5-6%
Douglas, OR 14-25%
Hood River, OR 5-6%
Klamath, OR 7-13%
Lane, OR 7-13%
225 Counties have the option of receiving either SRS or 25% Fund/O&C payments, but not both.
226 Headwaters Economics. December 2010. “County Payments, Jobs, and Forest Health: Ideas for Reforming the Secure Rural
Schools and Community Self-Determination Act (SRS) and Payments in Lieu of Taxes (PILT).” White Paper. Accessed at
http://headwaterseconomics.org/wphw/wp-content/uploads/Reform_County_Payments_WhitePaper_LowRes.pdf.
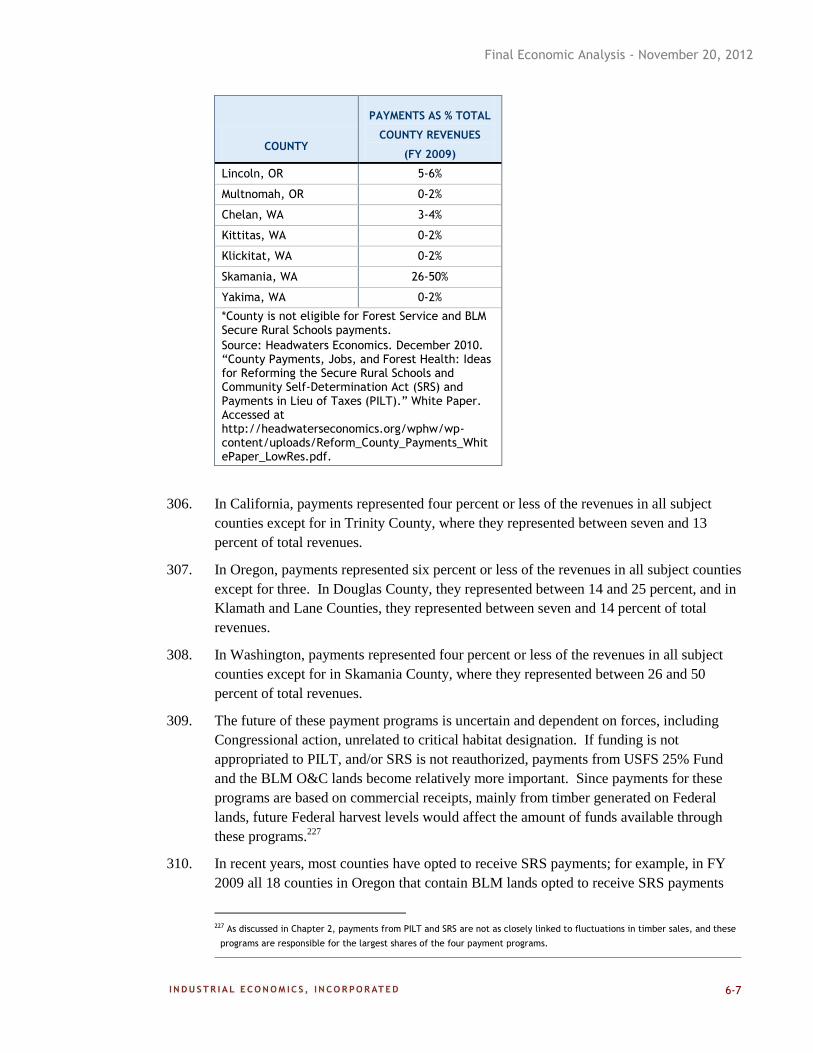
Final Economic Analysis - November 20, 2012
6-7
COUNTY
PAYMENTS AS % TOTAL
COUNTY REVENUES
(FY 2009)
Lincoln, OR 5-6%
Multnomah, OR 0-2%
Chelan, WA 3-4%
Kittitas, WA 0-2%
Klickitat, WA 0-2%
Skamania, WA 26-50%
Yakima, WA 0-2%
*County is not eligible for Forest Service and BLM Secure Rural Schools payments.
Source: Headwaters Economics. December 2010. “County Payments, Jobs, and Forest Health: Ideas for Reforming the Secure Rural Schools and Community Self-Determination Act (SRS) and Payments in Lieu of Taxes (PILT).” White Paper. Accessed at http://headwaterseconomics.org/wphw/wp-content/uploads/Reform_County_Payments_WhitePaper_LowRes.pdf.
306. In California, payments represented four percent or less of the revenues in all subject
counties except for in Trinity County, where they represented between seven and 13
percent of total revenues.
307. In Oregon, payments represented six percent or less of the revenues in all subject counties
except for three. In Douglas County, they represented between 14 and 25 percent, and in
Klamath and Lane Counties, they represented between seven and 14 percent of total
revenues.
308. In Washington, payments represented four percent or less of the revenues in all subject
counties except for in Skamania County, where they represented between 26 and 50
percent of total revenues.
309. The future of these payment programs is uncertain and dependent on forces, including
Congressional action, unrelated to critical habitat designation. If funding is not
appropriated to PILT, and/or SRS is not reauthorized, payments from USFS 25% Fund
and the BLM O&C lands become relatively more important. Since payments for these
programs are based on commercial receipts, mainly from timber generated on Federal
lands, future Federal harvest levels would affect the amount of funds available through
these programs.227
310. In recent years, most counties have opted to receive SRS payments; for example, in FY
2009 all 18 counties in Oregon that contain BLM lands opted to receive SRS payments
227 As discussed in Chapter 2, payments from PILT and SRS are not as closely linked to fluctuations in timber sales, and these
programs are responsible for the largest shares of the four payment programs.
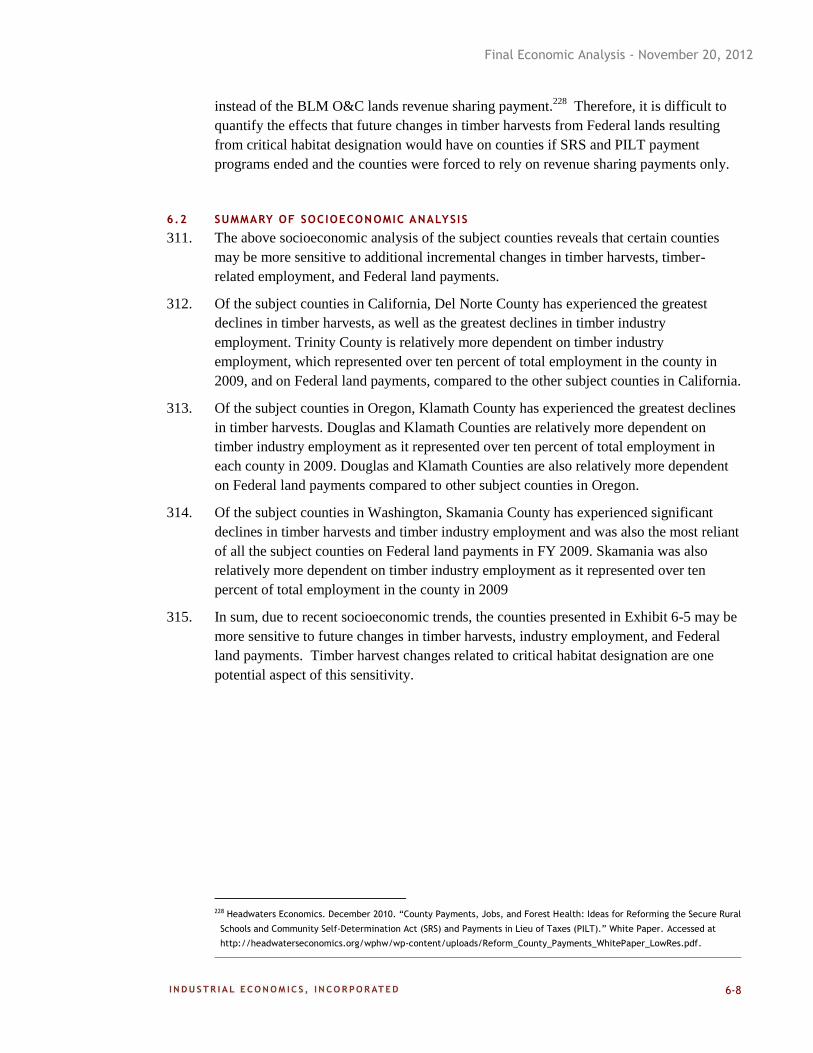
Final Economic Analysis - November 20, 2012
6-8
instead of the BLM O&C lands revenue sharing payment.228
Therefore, it is difficult to
quantify the effects that future changes in timber harvests from Federal lands resulting
from critical habitat designation would have on counties if SRS and PILT payment
programs ended and the counties were forced to rely on revenue sharing payments only.
6.2 SUMMARY OF SOCIOECONOMIC ANALYSIS
311. The above socioeconomic analysis of the subject counties reveals that certain counties
may be more sensitive to additional incremental changes in timber harvests, timber-
related employment, and Federal land payments.
312. Of the subject counties in California, Del Norte County has experienced the greatest
declines in timber harvests, as well as the greatest declines in timber industry
employment. Trinity County is relatively more dependent on timber industry
employment, which represented over ten percent of total employment in the county in
2009, and on Federal land payments, compared to the other subject counties in California.
313. Of the subject counties in Oregon, Klamath County has experienced the greatest declines
in timber harvests. Douglas and Klamath Counties are relatively more dependent on
timber industry employment as it represented over ten percent of total employment in
each county in 2009. Douglas and Klamath Counties are also relatively more dependent
on Federal land payments compared to other subject counties in Oregon.
314. Of the subject counties in Washington, Skamania County has experienced significant
declines in timber harvests and timber industry employment and was also the most reliant
of all the subject counties on Federal land payments in FY 2009. Skamania was also
relatively more dependent on timber industry employment as it represented over ten
percent of total employment in the county in 2009
315. In sum, due to recent socioeconomic trends, the counties presented in Exhibit 6-5 may be
more sensitive to future changes in timber harvests, industry employment, and Federal
land payments. Timber harvest changes related to critical habitat designation are one
potential aspect of this sensitivity.
228 Headwaters Economics. December 2010. “County Payments, Jobs, and Forest Health: Ideas for Reforming the Secure Rural
Schools and Community Self-Determination Act (SRS) and Payments in Lieu of Taxes (PILT).” White Paper. Accessed at
http://headwaterseconomics.org/wphw/wp-content/uploads/Reform_County_Payments_WhitePaper_LowRes.pdf.
Final Economic Analysis - November 20, 2012
6-9
EXHIBIT 6-5. SUBJECT COUNTIES THAT MAY BE RELATIVELY MORE SENSITIVE TO FUTURE
CHANGES IN TIMBER HA RVESTS, EMPLOYMENT AND PAYMENTS
COUNTY
Del Norte, CA
Trinity, CA
Douglas, OR
Klamath, OR
Skamania, WA
6.3 DISCUSSION OF POTENTIAL IMPACTS OF CRITI CAL HABITAT
316. As discussed in Chapter 3 of this report, myriad forces affect harvest and employment
trends in the Pacific Northwest timber industry, including fluctuations in national
demand; changes in export markets; changes in timberland ownership; and increasing
mechanization and productivity. In evaluating trends in harvests and employment in the
subject counties, it is important to remember that timber-related employment includes
jobs other than those associated with growing and harvesting timber (for example, wood
product manufacturing).229,230,231
Therefore, timber-related jobs in a certain county are
not necessarily closely correlated with the amount of timber being harvested in that
specific county. Jobs in a particular county are likely to be affected by broader, region-
wide changes in harvests.
317. It is important to note that although the subject counties—and in particular those listed in
Exhibit 6-5—have experienced declines in timber-related employment, the Siskiyou
region, which contains all of the California and Oregon counties listed in Exhibit 6-5, has
experienced population and employment growth that has outpaced the U.S. as a whole.232
Although the Siskiyou region still relies on the timber industry to some extent, its
economy has diversified significantly away from timber-related manufacturing and into
services sectors.233
Although the region lost 5,726 timber-related jobs between 1998 and
2007, it added 45,555 new non-timber jobs.234
Many of these new jobs are associated
229 Mason, L.C. and B.R. Lippke. 2007. Jobs, Revenues, and Taxes from Timber Harvest: An Examination of the Forest
Industry Contribution to the Washington State Economy. Working Paper 9: September 2007. Rural Technology Initiative.
Accessed at http://www.ruraltech.org/pubs/working/09/index.asp on April 6, 2012.
230 Lippke, B.R. and L.C. Mason. Implications of Working Forest Impacts on Jobs and Local Economies. October 24, 2005.
Accessed at https://digital.lib.washington.edu/researchworks/bitstream/handle/1773/2235/tp4.pdf?sequence=1 on April
6, 2012.
231 Power, Thomas M. "Public Timber Supply, Market Adjustments, and Local Economies: Economic Assumptions of the
Northwest Forest Plan." Conservation Biology 20.2 (2006): 341-50.
232 Headwaters Economics. 2010. The Siskiyou Region: Demographic, Economic, and Fiscal Fundamentals. Accessed at
http://headwaterseconomics.org/land/reports/the-siskiyou-region/ on April 10, 2012.
233 Ibid.
234 Ibid.
Final Economic Analysis - November 20, 2012
6-10
with the services economy, which had been growing nationwide; in 2008, 66 percent of
all jobs in the Siskiyou region were considered “services” jobs. 235
318. In general, estimates of the number of jobs created per MMBF of harvest vary depending
on the type of harvest and degree of primary and secondary manufacturing considered.236
A recent report published by the Pacific Northwest Research Station of the USFS states
that in Oregon there were 9.4 direct jobs per MMBF of timber harvested in 2010, and 9.9
direct jobs per MMBF in Washington, for a weighted average of 9.61.237
Other studies
focusing on specific geographic regions or earlier time periods estimate a broader range
of jobs multipliers, suggesting the number of direct jobs affected in a specific geographic
location could be smaller or larger depending on the specific characteristics of the
industry in that affected region.238
Thus, increases or decreases in timber harvests from
Federal or private lands could result in positive or negative changes in jobs, respectively.
319. As described in Chapters 4 and 5, the potential impact of the designation of critical
habitat on timber harvest levels, and whether that change will be positive or negative, is
uncertain. Therefore, how critical habitat designation—and the adoption of ecological
forestry practices—may impact the timber industry in terms of future harvest levels,
employment, and revenue-sharing payments to counties is also uncertain. Note that the
“jobs per unit of timber volume” relationships identified here are static in nature, and
would not necessarily be representative of the marginal change in employment associated
with the incremental change in timber harvest potentially resulting from critical habitat
designation. Furthermore, timber industry employment is affected not only by harvest
trends but also by fluctuations in national and international markets; changes in land
ownership; and increasing mechanization and productivity in the industry. Please note
that the scope of the analysis is limited to the incremental effects of critical habitat related
to and within the geographic area of the proposed designation for the NSO. The analysis
does not consider potential changes in timber activities on lands outside the proposed
235 Ibid.
236 In addition to direct timber-related employment, many indirect jobs result from timber harvesting. There are very few
recent estimates of indirect jobs created per MMBF of harvest, and estimates vary widely based on the definitions of
“direct” versus “indirect” jobs. Thus, we are unable to estimate potential indirect job losses at this time.
237 Warren, Debra. 2011. Production, Prices, Employment, and Trade in Northwest Forest Industries, All Quarters 2010.
USDA. http://www.fs.fed.us/pnw/pubs/pnw_rb260.pdf. Note that on page 1 of the report, the USFS states these
multipliers are based on 2007 data; however, we believe this to be a typographical error.
238 The study by Warren (2011) calculates the reported averages for 2010 based on data on total timber harvested and total
timber-related jobs in that year. Applying the same methodology and using the historical data provided by USFS in its
report, the jobs multiplier has been as high as 12.8 for Washington (2009) and 15.6 for Oregon (2001). A study of the region
by Lippke and Mason (2005) provides estimates for the direct and total employment for forest products activity based on a
model developed by Richard Conway in 1996. The report estimates 12.34 jobs in the logging, sawn wood, primary wood,
secondary wood, and primary paper industries per MMBF harvested. (Lippke, B.R. and L.C. Mason. Implications of Working
Forest Impacts on Jobs and Local Economies. October 24, 2005. Accessed at
https://digital.lib.washington.edu/researchworks/bitstream/handle/1773/2235/tp4.pdf?sequence=1 on April 6, 2012). In
contrast to these multi-State studies, the Oregon Forest Research Institute estimates 17.4 jobs per MMBF in Oregon based
on data provided by the Oregon Department of Employment and the Oregon Department of Forestry (Email communication
with Michael Haske, U.S. Bureau of Land Management, May 24, 2012.). Adding jobs created through induced effects (e.g.,
non-timber-related industries supporting workers in the timber industry) would further increase these multipliers.
Final Economic Analysis - November 20, 2012
6-11
critical habitat designation. As such, this analysis cannot evaluate the potential effects
related to the timber industry as a whole.
320. As described in Chapter 4, the analysis considers three scenarios to provide an illustrative
bounding of the uncertainty associated with potential changes in harvests on Federal
lands, including:
Scenario 1 – Administrative Costs Only. If minimal or no changes to current
management practices are adopted by the action agencies as a result of critical
habitat, the incremental impacts of the designation would be predominantly
administrative. Such an outcome would be unlikely to affect timber industry
employment.
Scenario 2 – Positive Economic Impact. This scenario contemplates that changes
in timber management practices as result of critical habitat could yield an
increase in harvest levels on federal lands, relative to the baseline. Such an
outcome could result in increased employment in the timber industry.
Scenario 3 – Negative Economic Impact. This scenario illustrates impacts
attributable to a decline in harvest volumes relative to the baseline. Such an
outcome could result in decreased employment in the timber industry.
321. Furthermore, as described in Chapter 5, the analysis considers two scenarios of possible
impacts associated with designating private lands, including:
Low Scenario – Regulatory uncertainty may cause private landowners to harvest
earlier and/or more frequently. Such changes in timber management could result
in near term increases in employment.
High Scenario – In addition to the effects of regulatory uncertainty described in the
low scenario, regulatory changes in Washington could result in decreased
harvests on some private lands. Such a regulatory change could result in a
counterbalancing negative effect on jobs.
322. As discussed above, given the baseline uncertainty associated with the continuance of
SRS and PILT payments, we are unable to quantify possible changes in county revenue
payments that could result from the critical habitat designation in the absence of these
other programs.
6.4 KEY SOURCES OF UNCERTAINTY
323. Exhibit 6-6 summarizes the key sources of uncertainty in our analysis. In each case, we
indicate the direction of potential bias associated with our assumptions. A “plus” sign
suggests that the assumption may result in an underestimate of actual impacts, while a
“minus” sign suggests the opposite. In many cases, the direction of potential bias is
unknown.
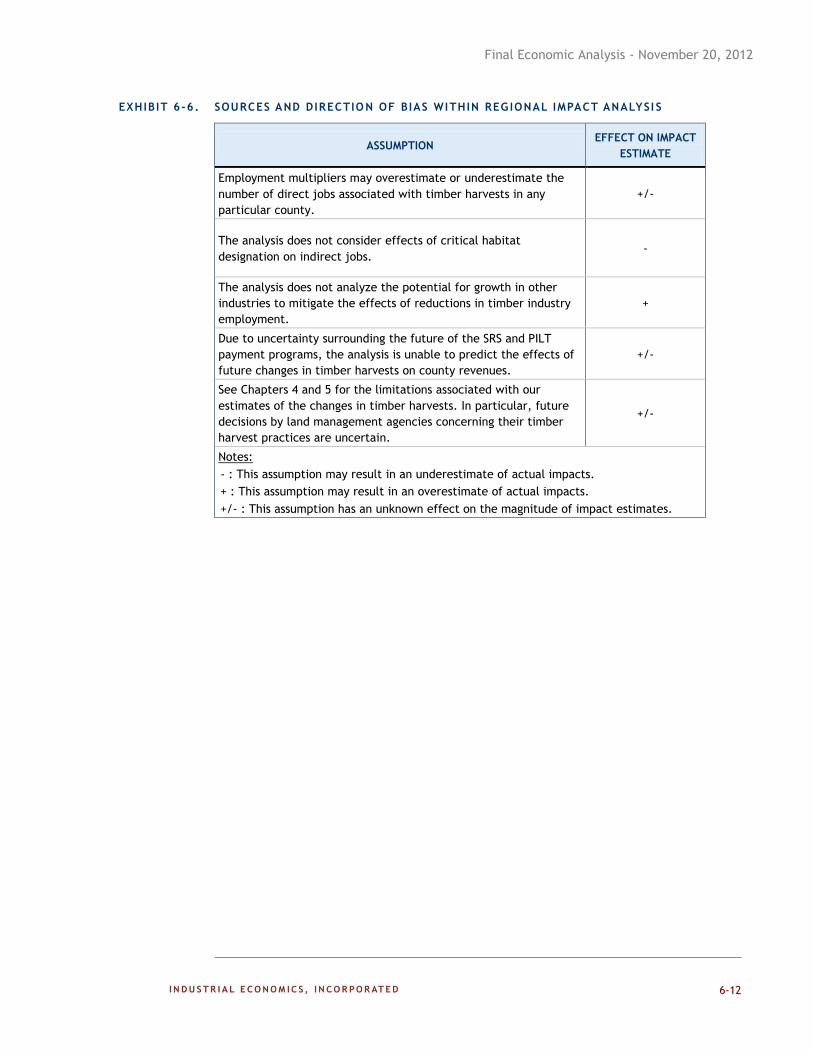
Final Economic Analysis - November 20, 2012
6-12
EXHIBIT 6-6. SOURCES AND DIRECTIO N OF BIAS WITHIN REG IONAL IMPACT ANALYSI S
ASSUMPTION EFFECT ON IMPACT
ESTIMATE
Employment multipliers may overestimate or underestimate the
number of direct jobs associated with timber harvests in any
particular county.
+/-
The analysis does not consider effects of critical habitat
designation on indirect jobs. -
The analysis does not analyze the potential for growth in other
industries to mitigate the effects of reductions in timber industry
employment.
+
Due to uncertainty surrounding the future of the SRS and PILT
payment programs, the analysis is unable to predict the effects of
future changes in timber harvests on county revenues. +/-
See Chapters 4 and 5 for the limitations associated with our
estimates of the changes in timber harvests. In particular, future
decisions by land management agencies concerning their timber
harvest practices are uncertain.
+/-
Notes:
- : This assumption may result in an underestimate of actual impacts.
+ : This assumption may result in an overestimate of actual impacts.
+/- : This assumption has an unknown effect on the magnitude of impact estimates.
Final Economic Analysis - November 20, 2012
7-1
CHAPTER 7 | POTENTIAL ECONOMIC IMPACTS TO LINEAR
PROJECTS
324. Activity related to road and bridge construction and maintenance, and installation and
maintenance of power transmission lines and other utility pipelines, (hereafter, “linear
projects”) can affect the NSO and its habitat.239
The primary threats related to these
activities are the limited removal of habitat for staging areas during construction or for
the roadways, pipelines, or transmission lines themselves.
325. This chapter considers the potential for linear projects to be affected by critical habitat
designation for the NSO. It first describes existing baseline protections for the species,
including Best Management Practices employed by State Departments of Transportation
(DOTs). The chapter then discusses the expected temporal and spatial distribution of
linear projects over the next 20 years. Finally, it quantifies potential incremental costs
associated with linear projects in critical habitat areas. As described more fully below,
given the extent of baseline protections related to NSO conservation, incremental costs
attributable to critical habitat are limited to the administrative costs of section 7
consultation on these projects.
7.1 EXISTING BASELINE PROTECTIONS
326. Section 7 of the Act provides baseline protections to the Owl based on the presence of the
species, as described in Chapter 2 of this report. This subsection describes typical
conservation efforts requested in the section 7 consultation process. In addition to the Act
and other Federal and State regulations that provide baseline conservation to the NSO,
agencies in charge of transportation and energy transmission projects in each State adhere
to Best Management Practices (BMPs) and other guidance in order to prevent or
minimize the negative effects of these activities on the NSO.
327. Project proponents are generally aware of the owl’s presence and take precautions in
early project design stages to avoid take of the species during activities like linear
projects. The Washington Department of Transportation (WSDOT), Oregon Department
of Transportation (ODOT), and California Department of Transportation (CalTrans)
commonly retain Fish and Wildlife Service staff to serve as liaisons between the Service
and State DOTs. FWS liaisons assist DOT staff in early stages of project design, as well
as during section 7 consultation, in order to avoid impacts to the species by minimizing
tree removal and noise disturbance during project implementation.
328. When conducting road and bridge construction and maintenance projects, the WSDOT
employs BMPs to avoid several detrimental impacts of transportation activity. Of
239 U.S. Fish and Wildlife Service. Proposed Rule to List the Northern Spotted Owl as Endangered. (57 FR 1796) January 15,
1990.
Final Economic Analysis - November 20, 2012
7-2
particular concern are noise disturbance and tree removal.240
In order to mitigate such
impacts, WSDOT BMPs used in the design of, and after the completion of construction,
require compliance with all standards and guidelines of the NWFP and special procedures
in Federal areas with listed species or critical habitat present.241
Special procedures
include minimization of contaminant spills, erosion prevention, and re-vegetation of
construction and staging areas.242
329. ODOT also considers whether listed species or critical habitat are present when
developing plans for roadwork. When ESA listed avian species, such as the NSO, are
present within or in proximity to a proposed project, ODOT adheres to site specific
guidelines that dictate adjustments to the timing of activities, staging locations, and other
aspects of projects, which the project proponent must implement during construction to
minimize or eliminate incidental take of listed species.243
CalTrans observes guidelines
containing similar management practices to the WSDOT and ODOT BMPs listed
above.244
330. In addition to broadly applied guidelines provided in DOT BMPs, past section
331. 7 consultations have outlined a number of conservation measures for transportation and
powerline and pipeline activity. These typical baseline conservation efforts requested by
the Service during the section 7 consultation process are presented in Exhibit 7-1.
332. Baseline impacts associated with conservation efforts requested during section 7
consultation on linear projects, such as those described in the exhibit, are not quantified in
this analysis. Based on these existing protections, however, potential incremental impacts
to all linear activity are limited to administrative costs.
240 Personal communication with WSDOT on March 19, 2012.
241 WSDOT, Environmental Procedures Manual M 31-11.10. June 2011
242 WSDOT, Maintenance and Operations Division, Best Management Practices Field Guide for ESA § 4 (d) Habitat Protection.
March 2004.
243 ODOT, Endangered Species Act Biological Assessment Guidance Manual. October 2005.
244 Personal communication with official FWS Liaison to CalTrans on March 14, 2012.
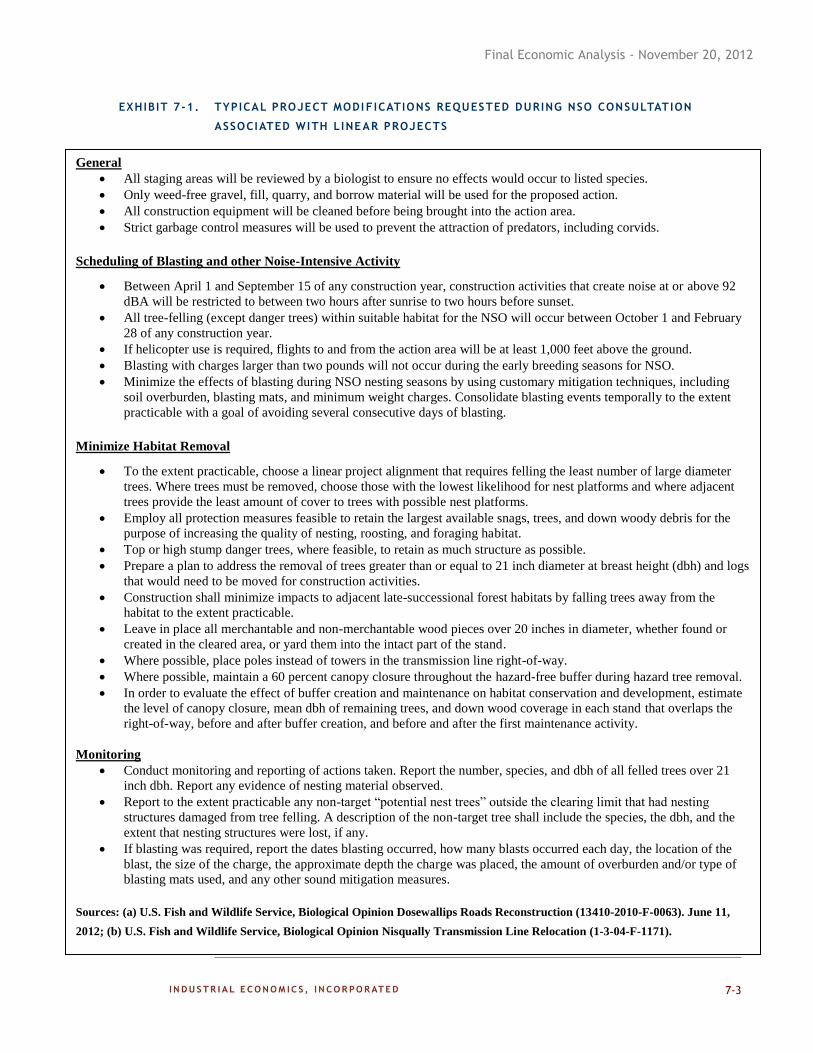
Final Economic Analysis - November 20, 2012
7-3
EXHIBIT 7-1. TYPICAL PROJECT MODI FICATIONS REQUESTED DURING NSO CONSULTATION
ASSOCIATED WITH LINEAR PROJECTS
General
All staging areas will be reviewed by a biologist to ensure no effects would occur to listed species.
Only weed-free gravel, fill, quarry, and borrow material will be used for the proposed action.
All construction equipment will be cleaned before being brought into the action area.
Strict garbage control measures will be used to prevent the attraction of predators, including corvids.
Scheduling of Blasting and other Noise-Intensive Activity
Between April 1 and September 15 of any construction year, construction activities that create noise at or above 92
dBA will be restricted to between two hours after sunrise to two hours before sunset.
All tree-felling (except danger trees) within suitable habitat for the NSO will occur between October 1 and February
28 of any construction year.
If helicopter use is required, flights to and from the action area will be at least 1,000 feet above the ground.
Blasting with charges larger than two pounds will not occur during the early breeding seasons for NSO.
Minimize the effects of blasting during NSO nesting seasons by using customary mitigation techniques, including
soil overburden, blasting mats, and minimum weight charges. Consolidate blasting events temporally to the extent
practicable with a goal of avoiding several consecutive days of blasting.
Minimize Habitat Removal
To the extent practicable, choose a linear project alignment that requires felling the least number of large diameter
trees. Where trees must be removed, choose those with the lowest likelihood for nest platforms and where adjacent
trees provide the least amount of cover to trees with possible nest platforms.
Employ all protection measures feasible to retain the largest available snags, trees, and down woody debris for the
purpose of increasing the quality of nesting, roosting, and foraging habitat.
Top or high stump danger trees, where feasible, to retain as much structure as possible.
Prepare a plan to address the removal of trees greater than or equal to 21 inch diameter at breast height (dbh) and logs
that would need to be moved for construction activities.
Construction shall minimize impacts to adjacent late-successional forest habitats by falling trees away from the
habitat to the extent practicable.
Leave in place all merchantable and non-merchantable wood pieces over 20 inches in diameter, whether found or
created in the cleared area, or yard them into the intact part of the stand.
Where possible, place poles instead of towers in the transmission line right-of-way.
Where possible, maintain a 60 percent canopy closure throughout the hazard-free buffer during hazard tree removal.
In order to evaluate the effect of buffer creation and maintenance on habitat conservation and development, estimate
the level of canopy closure, mean dbh of remaining trees, and down wood coverage in each stand that overlaps the
right-of-way, before and after buffer creation, and before and after the first maintenance activity.
Monitoring
Conduct monitoring and reporting of actions taken. Report the number, species, and dbh of all felled trees over 21
inch dbh. Report any evidence of nesting material observed.
Report to the extent practicable any non-target “potential nest trees” outside the clearing limit that had nesting
structures damaged from tree felling. A description of the non-target tree shall include the species, the dbh, and the
extent that nesting structures were lost, if any.
If blasting was required, report the dates blasting occurred, how many blasts occurred each day, the location of the
blast, the size of the charge, the approximate depth the charge was placed, the amount of overburden and/or type of
blasting mats used, and any other sound mitigation measures.
Sources: (a) U.S. Fish and Wildlife Service, Biological Opinion Dosewallips Roads Reconstruction (13410-2010-F-0063). June 11,
2012; (b) U.S. Fish and Wildlife Service, Biological Opinion Nisqually Transmission Line Relocation (1-3-04-F-1171).
Final Economic Analysis - November 20, 2012
7-4
7.2 FREQUENCY OF FUTURE LINEAR PROJECT ACTIV ITY
333. Past consultations on linear activities have primarily included bridge and road
construction and maintenance projects. From 1990, when the NSO was listed, to 2008,
the Service conducted 593 consultations on transportation projects and 69 on pipelines
and powerlines (an annual rate of approximately 33 and four consultations, respectively).
More recently, the number of consultations on linear projects has declined. Since 2008,
the Service has conducted three section 7 consultation on transportation projects related
to the NSO, as presented in Exhibit 4-8. The Service has not completed a consultation on
powerlines and pipelines since 2008, however two consultations were initiated in relation
to FERC-licensed projects discussed later in this Section.245
334. This analysis does not anticipate incremental impacts to linear project activities beyond
administrative costs due to the designation of critical habitat. The Service’s Incremental
Memorandum states that “at the scale energy-transportation projects are planned, it would
be highly unlikely for there to be impacts to spotted owl critical habitat but not to spotted
owls … Therefore, we anticipate consultations will be formal in nature, will require
effects on spotted owls to be minimized to the extent possible (thus likely minimizing
impacts to critical habitat as well), and … would have very few incremental effects to the
project beyond including an additional adverse-modification analysis in the
consultations.”
335. In addition, as discussed below, representatives of State DOTS, State energy agencies,
FERC, and the Corps generally expect a relatively low level of activity for these projects
in proposed critical habitat. Representatives of these agencies also report that
incremental project modifications due to critical habitat are extremely rare. State DOTS
report that construction of new roadways seldom occurs and the majority of
transportation projects are “maintenance related” and are far less disruptive in nature than
new road construction activity. State energy agencies identified relatively few
transmission line projects in areas containing proposed critical habitat. Based on the
historical level of activity and the number of current pending permits/licenses, this
analysis anticipates relatively few Corps- and FERC-regulated linear projects.
Transpor tat ion
336. Washington Department of Transportation (WSDOT), Oregon Department of
Transportation (ODOT), and the California Department of Transportation (CalTrans)
permit or conduct all State and county road and bridge construction in Washington,
Oregon, and California, respectively. The three agencies generally enter into section 7
consultation with the Service regarding the effects of these projects on listed species and
critical habitats. The vast majority of these consultations are expected to be informal, due
to their high frequency and repetitive nature.246
Additionally, State DOTs are not
245 Written communication with the Service on May 14, 2012.
246 Personal communication with WSDOT March 19, 2012; personal communication with official FWS Liaison to CalTrans on
March 14, 2012.
Final Economic Analysis - November 20, 2012
7-5
currently carrying out construction of new roads in the area of proposed critical habitat,
so the majority of planned or ongoing projects involve maintenance activities only, which
are far less invasive.
337. Using five-year plans from CalTrans and WSDOT, and a programmatic biological
assessment carried out by ODOT that estimates the number of ODOT consultations
related to the NSO from 2012 to 2015, this analysis forecasts planned or ongoing road
and bridge maintenance projects located within proposed critical habitat and describes the
geographical and temporal distribution of consultation costs related to these projects
within the next four to five years.247
It is expected that one informal consultation will
result from each planned or ongoing road or bridge project included in WSDOT’s and
CalTrans’ five-year plans.248
ODOT, in its programmatic biological assessment,
anticipates both formal and informal consultations related to road and bridge projects
over the next four years between 2012 and 2015. Outside of routine resurfacing and
maintenance occurring within the next four to five years, considerable uncertainty
surrounds the frequency and location of future DOT construction activity beyond five
years due to the recent economic downturn and fluctuations in demand for such
projects.249
Therefore, this analysis does not attempt to forecast future projects beyond
five years.
338. Over the next four to five years, we estimate a total of 13 formal and 122 informal section
7 consultations associated with road and bridge maintenance projects. Conversations
with CalTrans and WSDOT indicate that road construction activity will result in
consultation whenever roadways enter proposed critical habitat in Washington and
Oregon.250
In California and Washington, we rely on GIS data to determine the number
of road crossings in critical habitat and forecast road and bridge construction and
maintenance projects based on these figures. In Oregon, the expected number of
consultations is based on the conclusions of the programmatic biological assessment,
which includes a detailed analysis of the kinds of projects that are likely to occur in
proposed critical habitat and specifically those that will require consultation. Although
this biological assessment uses the current critical habitat boundaries as a basis for its
analysis, representatives from ODOT do not anticipate the frequency or level of effort of
consultations to increase significantly due to the inclusion of state and private lands in the
proposed critical habitat designation.251
247 Personal communication with WSDOT on March 19, 2012; personal communication with official FWS Liaison to CalTrans on
March 14 2012; personal communication official FWS Liaison to ODOT on March 12, 2012.
248 Personal communication with WSDOT on March 19, 2012; personal communication with official FWS Liaison to CalTrans on
March 14 2012.
249 Personal communication with WSDOT on March 19, 2012; personal communication with official FWS Liaison to CalTrans on
March 14 2012; personal communication official FWS Liaison to ODOT on March 12, 2012.
250 Personal communication with WSDOT on March 19, 2012; personal communication with official FWS Liaison to CalTrans on
March 14 2012.
251 Personal communication official FWS Liaison to ODOT on March 12, 2012.
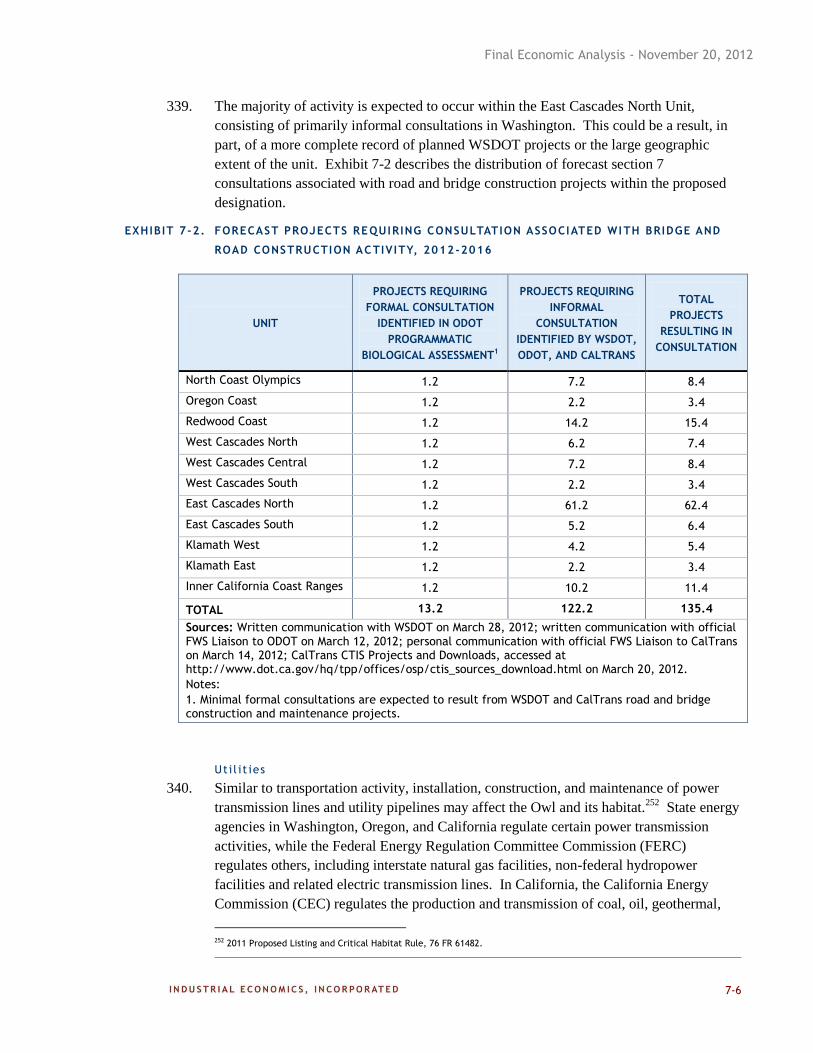
Final Economic Analysis - November 20, 2012
7-6
339. The majority of activity is expected to occur within the East Cascades North Unit,
consisting of primarily informal consultations in Washington. This could be a result, in
part, of a more complete record of planned WSDOT projects or the large geographic
extent of the unit. Exhibit 7-2 describes the distribution of forecast section 7
consultations associated with road and bridge construction projects within the proposed
designation.
EXHIBIT 7-2. FORECAST PROJECTS REQUIRING CONSULTATION ASSOCIATED WI TH BRIDGE AND
ROAD CONSTRUCTION ACTIVITY, 2012-2016
UNIT
PROJECTS REQUIRING
FORMAL CONSULTATION
IDENTIFIED IN ODOT
PROGRAMMATIC
BIOLOGICAL ASSESSMENT1
PROJECTS REQUIRING
INFORMAL
CONSULTATION
IDENTIFIED BY WSDOT,
ODOT, AND CALTRANS
TOTAL
PROJECTS
RESULTING IN
CONSULTATION
North Coast Olympics 1.2 7.2 8.4
Oregon Coast 1.2 2.2 3.4
Redwood Coast 1.2 14.2 15.4
West Cascades North 1.2 6.2 7.4
West Cascades Central 1.2 7.2 8.4
West Cascades South 1.2 2.2 3.4
East Cascades North 1.2 61.2 62.4
East Cascades South 1.2 5.2 6.4
Klamath West 1.2 4.2 5.4
Klamath East 1.2 2.2 3.4
Inner California Coast Ranges 1.2 10.2 11.4
TOTAL 13.2 122.2 135.4
Sources: Written communication with WSDOT on March 28, 2012; written communication with official FWS Liaison to ODOT on March 12, 2012; personal communication with official FWS Liaison to CalTrans on March 14, 2012; CalTrans CTIS Projects and Downloads, accessed at http://www.dot.ca.gov/hq/tpp/offices/osp/ctis_sources_download.html on March 20, 2012.
Notes:
1. Minimal formal consultations are expected to result from WSDOT and CalTrans road and bridge construction and maintenance projects.
Uti l i t ies
340. Similar to transportation activity, installation, construction, and maintenance of power
transmission lines and utility pipelines may affect the Owl and its habitat.252
State energy
agencies in Washington, Oregon, and California regulate certain power transmission
activities, while the Federal Energy Regulation Committee Commission (FERC)
regulates others, including interstate natural gas facilities, non-federal hydropower
facilities and related electric transmission lines. In California, the California Energy
Commission (CEC) regulates the production and transmission of coal, oil, geothermal,
252 2011 Proposed Listing and Critical Habitat Rule, 76 FR 61482.
Final Economic Analysis - November 20, 2012
7-7
solar thermal, and all other sources of thermal-electric power over 25 megawatts in the
State.253
Oregon’s Department of Energy (ODOE) regulates generation and transmission
of wind, solar, natural gas, and thermal-electric power.254
Washington’s Energy Facility
Site Evaluation Council (EFSEC) regulates a wide range of energy generation and
transmission, including:255
Any stationary thermal (non-hydro) power plants with electrical generating
capacity of 350 Megawatts or more including associated facilities such as
transmission lines in excess of 115 kilovolts; Floating thermal power plants of
100 MW (100,000 kilowatts) or more.
Wind, Solar, Geothermal, Landfill gas, Wave or tidal action, and Biomass.
Crude or refined petroleum or liquid petroleum product pipelines larger than 6
inches in diameter and greater than 15 miles in length.
Natural gas, synthetic fuel, gas, or liquefied petroleum gas pipelines larger than
14 inches in diameter and greater than 15 miles in length (intrastate only).
Electrical transmission facilities in a national interest electric transmission
corridor.
Electrical transmission facilities for which an applicant chooses to receive
certification under EFSEC, and the facility is:
o Greater than 115 kilovolts and located outside an electrical
transmission corridor; or
o At least 115 kilovolts and located in a new corridor or located in more
than one jurisdiction that has promulgated land use plans and
zoning ordinances.
341. EFSEC identified three planned or ongoing energy transmission projects in the vicinity of
NSO proposed critical habitat in Washington; however, none of these projects are
expected to result in a section 7 consultation as they all occur outside of proposed critical
habitat boundaries. The projects include:256
The I-5 Corridor Reinforcement Project in Multnomah County, Oregon and Clark
County, Washington;
The Big Eddy-Knight Transmission Project in Wasco County, Oregon and
Klickitat County, Washington; and
253 Personal communication with CEC on March 12, 2012.
254 Personal communication with ODOE on March 12, 2012.
255 Energy Facility Site Evaluation Council, Siting/Review Process, accessed at http://www.efsec.wa.gov/cert.shtml#Energy
Facility on April 5, 2012.
256 Energy Facility Site Evaluation Council, Siting/Review Process, accessed at http://www.efsec.wa.gov/cert.shtml#Energy
Facility on April 5, 2012.
Final Economic Analysis - November 20, 2012
7-8
Central Ferry-Lower Monumental Transmission Line Project in Columbia, Walla
Walla, Franklin, Whitman, and Garfield Counties, Washington.
342. Outside of the I-5 Corridor Reinforcement Project and the Big Eddy-Knight Transmission
Project mentioned above, which overlap lands in both Oregon and Washington, officials
at ODOE identified only one other project with the potential to incur impacts from NSO
critical habitat designation in Oregon.257
ODOE, along with the USFS and the BLM are
currently reviewing Portland General Electric’s application for the Cascade Crossing
Transmission Line Project (Cascade Crossing Project), which overlaps eight counties in
Oregon, including Linn, Marion, Clackamas, Jefferson, Wasco, Sherman, Gilliam, and
Morrow Counties.258
The project proposes to cross critical habitat subunits ECN7,
WCS1, WCS2, and WCS3. The proposed transmission line will cross Federal, tribal,
state, and private lands and requires a site certificate from the Energy Facility Siting
Council (EFSC), as well. In addition to the EFSC site certificate, the project requires an
EIS under the NEPA. The NEPA process is required for any proposed action on
Federally-managed lands. The new line would cross 64 percent privately-owned lands,
20 percent lands managed by Federal agencies, 14 percent tribal lands on the Warm
Springs Reservation of Oregon and two percent state or municipal lands.259
The project
consists of installation of approximately 215 miles of 500-kilovolt transmission line
running from Boardman to Salem, Oregon. Pacific General Electric would also construct
four new power substations and upgrade existing ones. Operations are expected to begin
by 2017.260
Because the Cascade Crossing Project action area directly overlaps portions
of critical habitat, we anticipate the need for one incremental formal section 7
consultation upon finalization of critical habitat related to this project. As previously
stated, linear projects are not expected to incur incremental project modifications.
343. According to the CEC, no projects are currently ongoing or in the planning stages in
California counties containing proposed critical habitat.261
344. FERC-licensed linear projects include interstate natural gas pipelines and primary electric
transmission lines associated with non-federal hydroelectric projects.262
FERC is
currently considering applications for two projects in counties containing proposed
critical habitat.263
These projects include the Pacific Connector Gas Pipeline and the
257 Personal communication with ODOE March 12, 2012.
258 Cascade Crossing Project, accessed at http://www.cascadecrossingproject.com/pge.aspx on April 5, 2012.
259 ODOE, Energy Facility Siting: Cascade Crossing Transmission Line Project, accessed at
http://oregon.gov/ENERGY/SITING/CCTx.shtml on April 5, 2012.
260 Cascade Crossing Project, accessed at http://www.cascadecrossingproject.com/pge.aspx on April 5, 2012.
261 Personal communication with CEC on March 12, 2012.
262 FERC-Regulated Industries, Project Siting, accessed at http://www.ferc.gov/industries/electric/indus-act/siting.asp on
April 5, 2012.
263 FERC “Approved Pipeline Projects, 2003 to the Present,” accessed at http://www.ferc.gov/industries/gas/indus-
act/pipelines/approved-projects.asp on April 1, 2012; FERC Pending Natural Gas Pipelines National Outlook, accessed at
Final Economic Analysis - November 20, 2012
7-9
Oregon Pipeline Company Project, both of which are located in Oregon.264,265
More
detailed geographic information on the projects’ action areas was not readily available for
comparison with proposed critical habitat boundaries. Therefore, this analysis makes the
conservative assumption that the two known FERC-licensed or pending projects in
counties containing critical habitat will each require one formal section7 consultation
when critical habitat is finalized. No incremental project modification impacts are
anticipated related to FERC-licensed projects.
345. Historically, since 2003, FERC has approved 21 utility line projects in California,
Washington, and Oregon counties containing proposed critical habitat.266
Future FERC
utility line construction activities, however, are closely linked to the demand for
transportation and storage of natural gas and hydroelectric electricity, which is in turn
closely linked to the demand for these forms of energy. Consequently, considerable
uncertainty surrounds the future level of construction of natural gas pipelines and electric
transmission lines as significant uncertainty exists related to the level of demand for
natural gas and electricity from hydropower sources.267
346. Due to this uncertainty, this analysis does not attempt to forecast activity associated with
the construction of new natural gas pipelines and storage facilities or transmission lines
related to hydro-power generation based on historical activity levels within the proposed
critical habitat area in the foreseeable future. The analysis does, however, forecast
maintenance projects permitted by the Army Corps of Engineers (the Corps) related to
existing natural gas pipelines and electricity lines based on historical frequency, which
occur more consistently than the construction of new linear projects.
347. As stated, utility line projects may also be subject to the Corps’ permitting requirements
under section 404 of the CWA. Between 1992 and 2012, the Corps’ Seattle District has
permitted 111 pipeline and transmission line maintenance projects in areas proposed for
critical habitat in Washington, or roughly six per year.268
Since 2006, throughout Oregon
the Corps’ Portland District has permitted 27 pipeline and transmission line maintenance
projects related to NSO, at an annual rate of 4.5 projects.269
Based on conversations with
officials at the Corps, the past level of activity shown in this historical data is likely
representative of future levels of activity in areas proposed for critical habitat. 270
The
analysis uses the historical permitting levels as a basis for forecasting future Corps
pipeline and transmission line maintenance projects. Historical data on the number of
264 FERC “Approved Pipeline Projects, 2003 to the Present,” accessed at http://www.ferc.gov/industries/gas/indus-
act/pipelines/approved-projects.asp on April 1, 2012.
265 Written communication with the Service on May 14, 2012.
266 FERC “Approved Pipeline Projects, 2003 to the Present,” accessed at http://www.ferc.gov/industries/gas/indus-
act/pipelines/approved-projects.asp on April 1, 2012.
267 Personal communication with Energy Industry Analyst, FERC, November 16, 2011.
268 Written communication with the Corps’ Seattle District on April 3, 2012.
269 Written communication with the Corps’ Portland District on April 20, 2012.
270 Written communication with the Corps’ Portland District on April 20, 2012; written communication with the Corps’ Seattle
District on April 3, 2012.
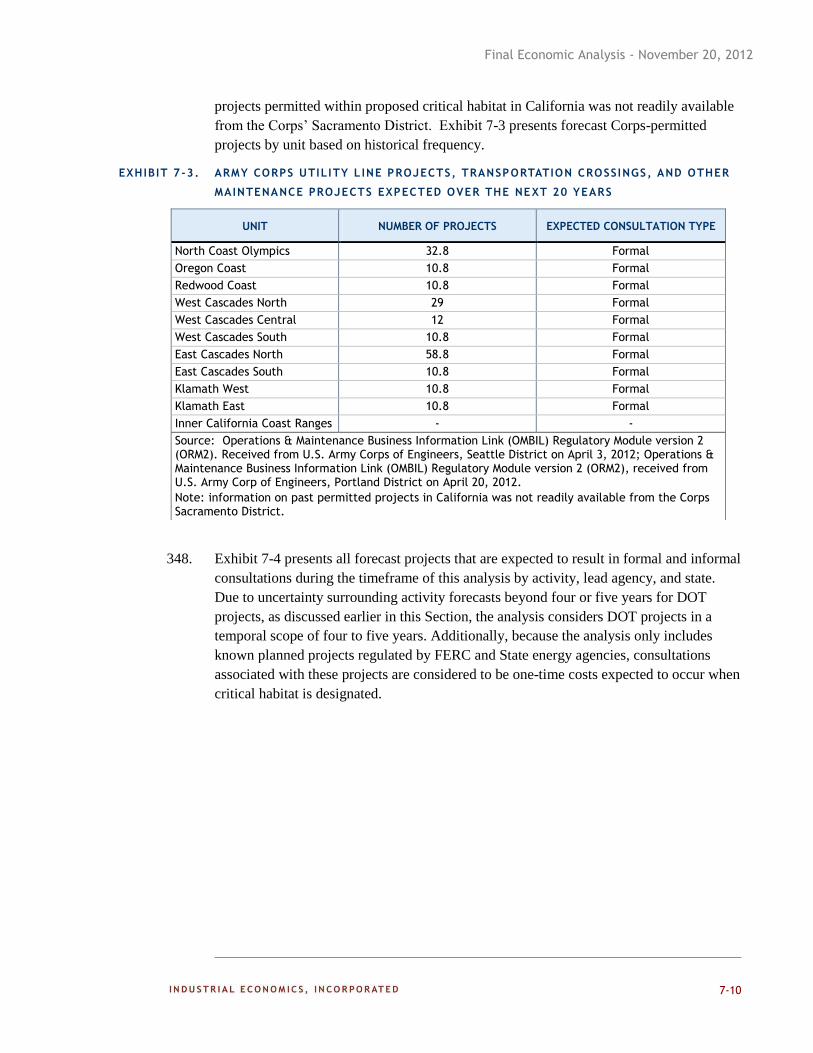
Final Economic Analysis - November 20, 2012
7-10
projects permitted within proposed critical habitat in California was not readily available
from the Corps’ Sacramento District. Exhibit 7-3 presents forecast Corps-permitted
projects by unit based on historical frequency.
EXHIBIT 7-3. ARMY CORPS UTILITY L INE PROJECTS, TRANSPORTATION CROSSINGS, AND OTHER
MAINTENANCE PROJECTS EXPECTED OVER THE NEXT 20 YEARS
348. Exhibit 7-4 presents all forecast projects that are expected to result in formal and informal
consultations during the timeframe of this analysis by activity, lead agency, and state.
Due to uncertainty surrounding activity forecasts beyond four or five years for DOT
projects, as discussed earlier in this Section, the analysis considers DOT projects in a
temporal scope of four to five years. Additionally, because the analysis only includes
known planned projects regulated by FERC and State energy agencies, consultations
associated with these projects are considered to be one-time costs expected to occur when
critical habitat is designated.
UNIT NUMBER OF PROJECTS EXPECTED CONSULTATION TYPE
North Coast Olympics 32.8 Formal
Oregon Coast 10.8 Formal
Redwood Coast 10.8 Formal
West Cascades North 29 Formal
West Cascades Central 12 Formal
West Cascades South 10.8 Formal
East Cascades North 58.8 Formal
East Cascades South 10.8 Formal
Klamath West 10.8 Formal
Klamath East 10.8 Formal
Inner California Coast Ranges - -
Source: Operations & Maintenance Business Information Link (OMBIL) Regulatory Module version 2 (ORM2). Received from U.S. Army Corps of Engineers, Seattle District on April 3, 2012; Operations & Maintenance Business Information Link (OMBIL) Regulatory Module version 2 (ORM2), received from U.S. Army Corp of Engineers, Portland District on April 20, 2012.
Note: information on past permitted projects in California was not readily available from the Corps Sacramento District.
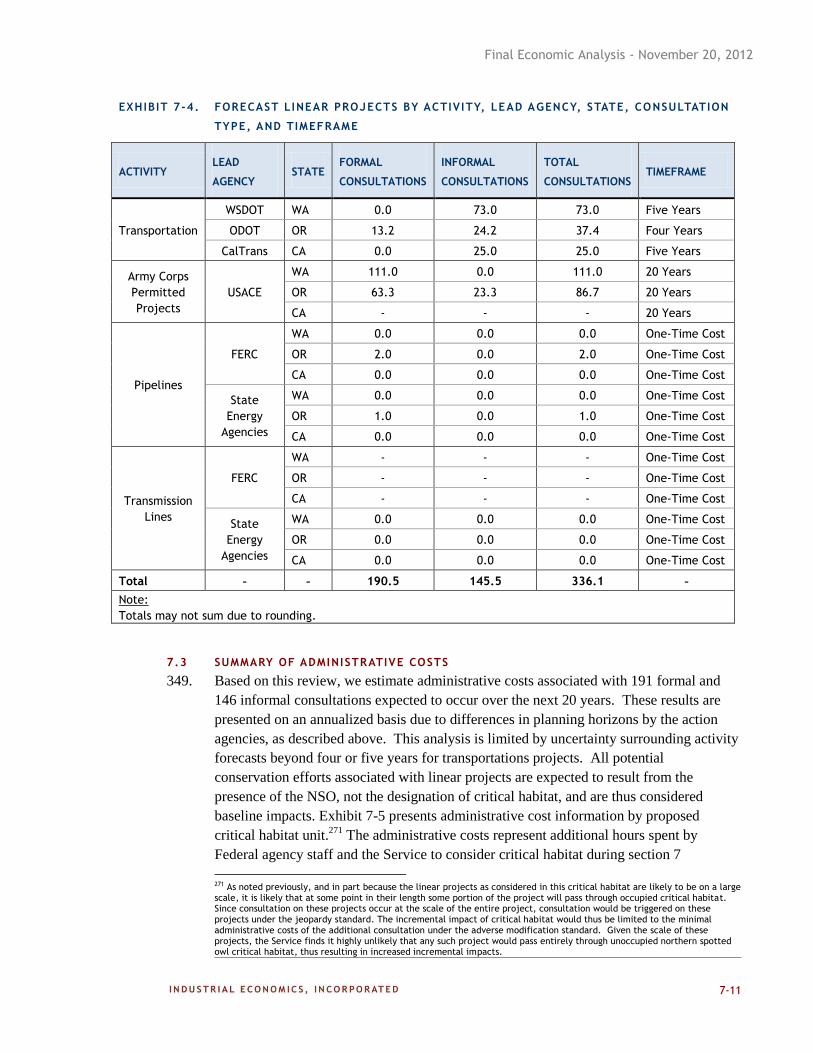
Final Economic Analysis - November 20, 2012
7-11
EXHIBIT 7-4. FORECAST LINEAR PROJECTS BY ACTIVITY, LEAD AGENCY, STATE, CONSULTATION
TYPE, AND TIMEFRAME
ACTIVITY LEAD
AGENCY STATE
FORMAL
CONSULTATIONS
INFORMAL
CONSULTATIONS
TOTAL
CONSULTATIONS TIMEFRAME
Transportation
WSDOT WA 0.0 73.0 73.0 Five Years
ODOT OR 13.2 24.2 37.4 Four Years
CalTrans CA 0.0 25.0 25.0 Five Years
Army Corps
Permitted
Projects
USACE
WA 111.0 0.0 111.0 20 Years
OR 63.3 23.3 86.7 20 Years
CA - - - 20 Years
Pipelines
FERC
WA 0.0 0.0 0.0 One-Time Cost
OR 2.0 0.0 2.0 One-Time Cost
CA 0.0 0.0 0.0 One-Time Cost
State
Energy
Agencies
WA 0.0 0.0 0.0 One-Time Cost
OR 1.0 0.0 1.0 One-Time Cost
CA 0.0 0.0 0.0 One-Time Cost
Transmission
Lines
FERC
WA - - - One-Time Cost
OR - - - One-Time Cost
CA - - - One-Time Cost
State
Energy
Agencies
WA 0.0 0.0 0.0 One-Time Cost
OR 0.0 0.0 0.0 One-Time Cost
CA 0.0 0.0 0.0 One-Time Cost
Total - - 190.5 145.5 336.1 -
Note:
Totals may not sum due to rounding.
7.3 SUMMARY OF ADMINISTRATIVE COSTS
349. Based on this review, we estimate administrative costs associated with 191 formal and
146 informal consultations expected to occur over the next 20 years. These results are
presented on an annualized basis due to differences in planning horizons by the action
agencies, as described above. This analysis is limited by uncertainty surrounding activity
forecasts beyond four or five years for transportations projects. All potential
conservation efforts associated with linear projects are expected to result from the
presence of the NSO, not the designation of critical habitat, and are thus considered
baseline impacts. Exhibit 7-5 presents administrative cost information by proposed
critical habitat unit.271
The administrative costs represent additional hours spent by
Federal agency staff and the Service to consider critical habitat during section 7
271 As noted previously, and in part because the linear projects as considered in this critical habitat are likely to be on a large scale, it is likely that at some point in their length some portion of the project will pass through occupied critical habitat. Since consultation on these projects occur at the scale of the entire project, consultation would be triggered on these projects under the jeopardy standard. The incremental impact of critical habitat would thus be limited to the minimal administrative costs of the additional consultation under the adverse modification standard. Given the scale of these projects, the Service finds it highly unlikely that any such project would pass entirely through unoccupied northern spotted owl critical habitat, thus resulting in increased incremental impacts.
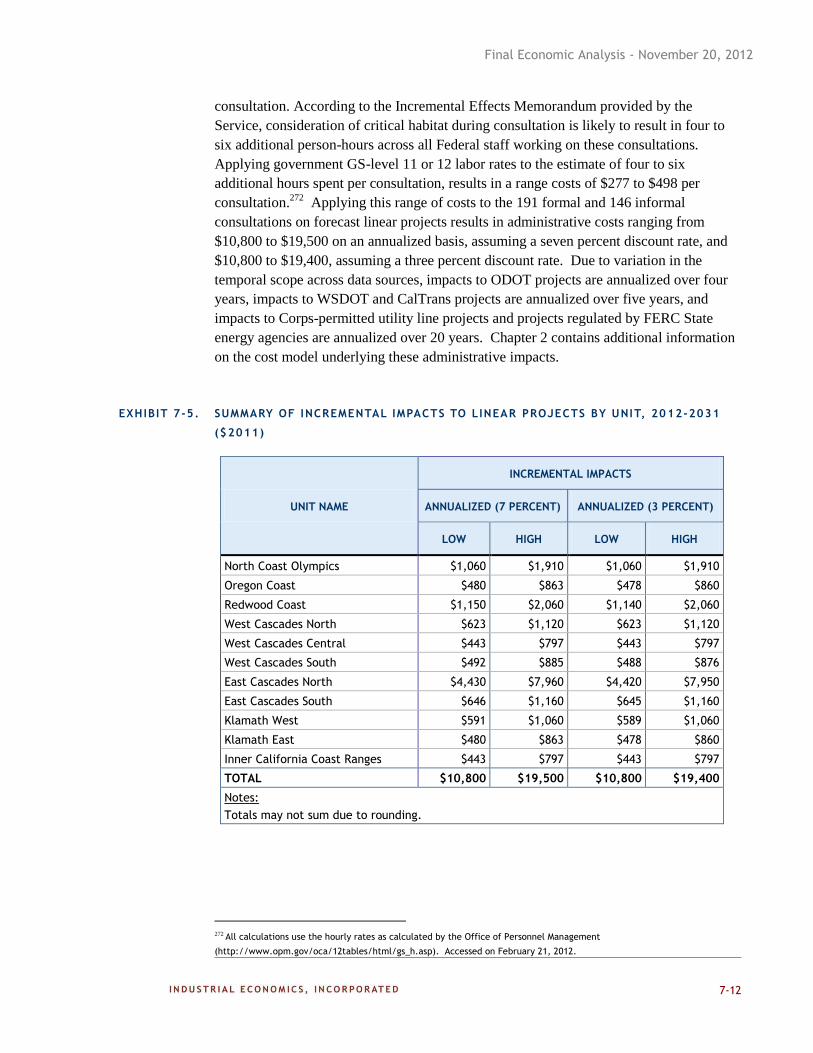
Final Economic Analysis - November 20, 2012
7-12
consultation. According to the Incremental Effects Memorandum provided by the
Service, consideration of critical habitat during consultation is likely to result in four to
six additional person-hours across all Federal staff working on these consultations.
Applying government GS-level 11 or 12 labor rates to the estimate of four to six
additional hours spent per consultation, results in a range costs of $277 to $498 per
consultation.272
Applying this range of costs to the 191 formal and 146 informal
consultations on forecast linear projects results in administrative costs ranging from
$10,800 to $19,500 on an annualized basis, assuming a seven percent discount rate, and
$10,800 to $19,400, assuming a three percent discount rate. Due to variation in the
temporal scope across data sources, impacts to ODOT projects are annualized over four
years, impacts to WSDOT and CalTrans projects are annualized over five years, and
impacts to Corps-permitted utility line projects and projects regulated by FERC State
energy agencies are annualized over 20 years. Chapter 2 contains additional information
on the cost model underlying these administrative impacts.
EXHIBIT 7-5. SUMMARY OF INCREMENTAL IMPACTS TO LINEAR PROJECTS BY UNIT, 2012-2031
($2011)
UNIT NAME
INCREMENTAL IMPACTS
ANNUALIZED (7 PERCENT) ANNUALIZED (3 PERCENT)
LOW HIGH LOW HIGH
North Coast Olympics $1,060 $1,910 $1,060 $1,910
Oregon Coast $480 $863 $478 $860
Redwood Coast $1,150 $2,060 $1,140 $2,060
West Cascades North $623 $1,120 $623 $1,120
West Cascades Central $443 $797 $443 $797
West Cascades South $492 $885 $488 $876
East Cascades North $4,430 $7,960 $4,420 $7,950
East Cascades South $646 $1,160 $645 $1,160
Klamath West $591 $1,060 $589 $1,060
Klamath East $480 $863 $478 $860
Inner California Coast Ranges $443 $797 $443 $797
TOTAL $10,800 $19,500 $10,800 $19,400
Notes:
Totals may not sum due to rounding.
272 All calculations use the hourly rates as calculated by the Office of Personnel Management
(http://www.opm.gov/oca/12tables/html/gs_h.asp). Accessed on February 21, 2012.
Final Economic Analysis - November 20, 2012
8-1
CHAPTER 8 | POTENTIAL ECONOMIC BENEFITS
350. The previous chapters of this report evaluate the potential project modifications and
associated economic impacts that may be generated by the designation of critical habitat
for the NSO. Most significantly, we estimate the potential positive or negative changes in
timber harvests that could result from the proposed rule. Potential beneficial changes in
harvest levels are quantified in Chapter 4 of this report.
351. This chapter contemplates other potential economic benefits resulting from possible
conservation efforts. First, we introduce economic methods employed to quantify benefits
of species and habitat conservation, and discuss the availability of existing literature to
support valuation in the context of this rulemaking. We then provide a qualitative
description of the potential categories of ancillary benefits that may result from the
designation, and identify the units where such benefits may be generated.
KEY ISSUES AND CONCLUSIONS:
The primary goal of critical habitat designation for the NSO is to support its long-term conservation. Conservation and recovery of the species may result in benefits, including use benefits (wildlife-viewing), non-use benefits (existence values), and ancillary ecosystem service benefits (e.g., public safety benefits of reduced wildfire risks). Potential increases in timber harvests are quantified in Chapter 4 of this report.
The extent to which critical habitat designation for the NSO may improve the species’ population is unknown. That is, information is not available on the potential percent increase in NSO populations, or the incremental change in the probability of recovery, generated by the incremental conservation efforts described in this analysis.
Absent information on the incremental change in owl populations or recovery potential associated with this rulemaking, we are unable to monetize associated incremental use and non-use benefits economic benefits. However, this chapter summarizes available information on use and non-use values of the NSO from existing studies. These studies evaluate the benefits of conserving the NSO and its old-growth habitat (or the habitat of the closely-related Mexican spotted owl) using the contingent valuation method to elicit the public’s willingness to pay.
This Chapter also qualitatively discusses the potential ancillary ecosystem service benefits, such as water quality improvements and public safety that may be generated
by NSO conservation efforts described in Chapters 4 through 7 of this report.
Final Economic Analysis - November 20, 2012
8-2
8.1 ESTIMATING CONSERVATION BENEFITS
352. The primary intended benefit of critical habitat is to support the conservation of
threatened and endangered species, such as NSO. Thus, attempts to develop monetary
estimates of the benefits of this proposed critical habitat designation would focus on the
public’s willingness to pay to achieve the conservation benefits to NSO resulting from
this designation.
353. Quantification and monetization of species conservation benefits requires two primary
pieces of information: (1) data on the incremental change in the probability of NSO
conservation that is expected to result from the designation; and (2) data on the public’s
willingness to pay for this incremental change. Neither data element is readily available
for this analysis. Specifically, the statutory provisions for identifying critical habitat do
not require, nor do any available models allow, the Service to utilize this process to
predict either the future owl productivity as a result of this designation, or an economic
value that can be readily assigned to the benefits of such designation. Thus, we do not
quantify or monetize the conservation benefits of this proposed rule.
354. The proposed critical habitat designation is the result of extensive modeling effort,
including evaluating and discarding numerous habitat network scenarios based on the
Service’s criteria for determining the relatively most efficient network of habitat that
simultaneously prioritized Federal lands and best met the recovery goals for the species.
The proposed critical habitat is the result of that process, and as described in the proposed
rule and the Service’s supporting documentation (Dunk et al. 2012), represents the
configuration of habitat that demonstrated the greatest likelihood of achieving population
goals such as increasing population trend in the maximum number of recovery units.273
355. Determining the incremental effect of critical habitat on owl conservation, however, is a
very complicated exercise, and the Service does not have a model that can perform such
an analysis. Such an evaluation would require the ability to isolate and quantify the effect
of the designated critical habitat separately from all other ongoing or planned
conservation efforts for the NSO, such as the potential removal of barred owls from
spotted owl habitat, or the voluntary implementation of any of the numerous recovery
actions recommended in the Revised Recovery Plan (such as Recovery Action 10). Thus
the Service can make qualitative statements about the benefit of critical habitat to NSO,
based on the modeling results as summarized above. The Service does not, however, have
data of sufficient precision that would allow it to tease out and quantify the incremental
effect of the proposed designation from numerous other recovery actions that may
likewise manifest in positive conservation outcomes for the owl.
356. Furthermore, while a number of published studies estimate the value the public places on
protecting the NSO, none of these studies specifically estimates the value of the types of
273 Dunk, J.R., Woodbridge, B., D. LaPlante, N. Schumaker, B. Glenn, B. White, S. Livingston, M.M. Zwartjes, J. Peters, K.
Halupka, and J. Caicco. 2012. Modeling and Analysis Procedures used to Identify and Evaluate Potential Critical Habitat
Networks for the Northern Spotted Owl. Unpublished report, U.S. Fish & Wildlife Service, Portland, OR. February 28, 2012.
48 pp.
Final Economic Analysis - November 20, 2012
8-3
incremental changes in conservation probability that could result from the designation.
Rather, in general, existing studies value programs to ensure the species’ survival or that
it will not go extinct. Thus, even if information about the incremental change in
conservation probability were available, monetary estimates of the value of this change
are not possible at this time.
357. In the remainder of this section, we provide a more detailed description of the economic
techniques that economists would employ to monetize these types of conservation
benefits. We also present a brief review of the existing literature valuing NSO protection.
These studies provide evidence that the public may have a positive value for efforts that
will increase the conservation probability of the species. However, for the reasons
described above, they cannot be applied to estimate the incremental changes resulting
from critical habitat designation.
8.1.1 ECONOMIC METHODS USED TO VALUE USE AND NON-USE VALUES OF
SPECIES AND HABITAT CONSERVATION
358. The primary intended benefit of listing a species and designating its critical habitat is to
ensure the long-term conservation of the species.274
Various economic benefits, measured
in terms of social welfare or regional economic performance, may result from
conservation efforts. The benefits can be placed into two broad categories: (1) those
associated with the primary goal of species conservation (i.e. direct benefits), and (2)
those additional beneficial services that derive from the conservation efforts but are not
the purpose of the Act (i.e., ancillary benefits, such as decreased wildfire threat).
359. Because the purpose of the Act is to provide for the conservation of endangered and
threatened species, the benefits of actions taken under the Act are often measured in
terms of the value placed by the public on species preservation (e.g., avoidance of
extinction, and/or increase in a species’ population). Such social welfare values for a
species may reflect both use and non-use values for the species. Use values derive from a
direct use for a species, such as commercial harvesting or recreational wildlife-viewing
opportunities. Non-use values are not derived from direct use of the species, but instead
reflect the utility the public derives from knowledge that a species continues to exist (e.g.,
existence or bequest values).
360. As a result of actions taken to preserve endangered and threatened species, such as habitat
management, various other benefits may accrue to the public. Conservation efforts may
result in improved environmental quality, which in turn may have collateral human health
or recreational use benefits. In addition, conservation efforts undertaken for the benefit of
a threatened or endangered species may enhance shared habitat for other wildlife. Such
benefits may result from modifications to projects, or may be collateral to such actions.
For example, critical habitat designation may change timber harvest practices so as to
274 The term “conservation” means “the use of all methods and procedures which are necessary to bring any endangered
species or threatened species to the point at which the measures provided pursuant to this Act are no longer necessary” (16
U.S.C. 1532).
Final Economic Analysis - November 20, 2012
8-4
increase the resiliency of the forest stands. This in turn improves the ability of the forests
to survive wildfire, droughts, and insect threats.
361. Economists apply a variety of methodological approaches in estimating both use and non-
use values for species and for habitat improvements, including stated preference and
revealed preference methods. Stated preference techniques include such tools as the
contingent valuation method, conjoint analysis, or contingent ranking methods. In
simplest terms, these methods employ survey techniques, asking respondents to state
what they would be willing to pay for a resource or for programs designed to protect that
resource. A substantial body of literature has developed that describes the application of
this technique to the valuation of natural resource assets.
362. More specific to use values for species or habitats, revealed preference techniques
examine individuals’ behavior in markets in response to changes in environmental or
other amenities (i.e., people “reveal” their value by their behavior). For example, travel
cost models are frequently applied to value access to recreational opportunities, as well as
to value changes in the quality and characteristics of these opportunities. Basic travel cost
models are rooted in the idea that the value of a recreational resource can be estimated by
analyzing the travel and time costs incurred by individuals visiting the site. Another
revealed preference technique is hedonic analysis, which is often employed to determine
the effect of site-specific characteristics on property values.
8.1.2 LIMITS TO QUANTIFYING THE EFFECT OF CRITICAL HABITAT DESIGNATION
ON OWL POPULATION
363. The critical habitat identified by the Service is based, in part, on the utilization of a
habitat modeling framework that was developed as part of the Revised Recovery Plan for
the Northern Spotted Owl (USFWS 2011). The use of this modeling framework allowed
the Service to compare the relative potential for various habitat networks to contribute to
the conservation of the northern spotted owl. As detailed in their Modeling Supplement, a
technical support document for the critical habitat rule (Dunk et al. 2012), the Service
used a spatially explicit northern spotted owl population model to predict relative
responses of northern spotted owl populations to different habitat network designs, and
evaluated these responses against the recovery objectives and criteria for the species
using a rule set based on those criteria.
364. Simulations from these models are not intended to be estimates of future conditions, but
rather provide information on trends predicted to occur under different network designs.
The models thus allow for the comparison of the relative performance of various critical
habitat scenarios, using metrics associated with owl population performance (e.g.,
population trend). The models do not produce definitive quantitative predictions of
future owl population numbers.
365. The Service used these models to determine which of the potential habitat networks best
met the statutory definition of critical habitat. In addition, the Service did so in a way
that was efficient (i.e., did not designate more habitat than was necessary) and prioritized
reliance on Federal lands, as evaluated against the recovery goals for the northern spotted
owl. The Modeling Supplement (Dunk et al. 2012) describes the various assessments
Final Economic Analysis - November 20, 2012
8-5
conducted by the Service in the course of evaluating potential habitat networks, and the
results of those evaluations. However, it is important to recognize that neither the
statutory requirements for identifying critical habitat, nor any available models, allow the
Service to utilize this process to predict either the future owl productivity as a result of
this designation, or an economic value that can be readily assigned to the benefits of such
designation.
8.1.3 USE AND NON-USE VALUATION STUDIES
366. Numerous published studies estimate individuals’ willingness to pay to protect
endangered species.275
The economic values reported in these studies reflect various
groupings of benefit categories (including both use and non-use values). For example,
these studies assess public willingness to pay for wildlife-viewing opportunities, for the
option for seeing or experiencing the species in the future, to assure that the species will
exist for future generations, and simply knowing a species exists, among other values.
This literature, however, addresses a relatively narrow range of species and circumstances
compared to the hundreds of species and habitats that are the focus of the Act.
367. An ideal study for use in valuing the use and non-use values that may derive from critical
habitat designation for the NSO would be specific to the species, the policy question at
hand (implementation of the specific conservation efforts associated with critical habitat
designation), and the relevant population holding such values (e.g., citizens of the
relevant states or of the United States as a whole). No such study has been undertaken to
date for the NSO.
368. Absent primary research specific to the policy question (benefits of critical habitat
designation for the NSO), resource management decisions can often be informed by
applying the results of existing valuation research to a new policy question − a process
known to economists as benefit transfer. Benefit transfer involves the application of unit
value estimates, functions, data, and/or models from existing studies to estimate the
benefits associated with the resource under consideration.
369. OMB has written guidelines for conducting credible benefit transfers. The important steps
in the OMB guidance are: (1) specify the value to be estimated for the rulemaking; and
(2) identify appropriate studies to conduct benefits transfer based on the following
criteria:
The selected studies should be based on adequate data, sound and defensible
empirical methods and techniques;
The selected studies should document parameter estimates of the valuation
function;
The study and policy contexts should have similar populations (e.g., demographic
characteristics). The market size (e.g., target population) between the study site
and the policy site should be similar;
275 See, for example, the summary in Richardson, L. and J. Loomis. March 2009. The Total Economic Value of Threatened,
Endangered, and Rare Species: An Updated Meta-Analysis. Ecological Economics 68(5): 1535-1548.
Final Economic Analysis - November 20, 2012
8-6
The good, and the magnitude of change in that good, should be similar in the
study and policy contexts;
The relevant characteristics of the study and policy contexts should be similar;
The distribution of property rights should be similar so that the analysis uses the
same welfare measure (i.e., if the property rights in the study context support the
use of willingness-to-accept measures while the rights in the rulemaking context
support the use of willingness-to-pay measures, benefits transfer is not
appropriate); and
The availability of substitutes across study and policy contexts should be similar.
8.1.4 AVAILABLE LITERATURE VALUING NSO POPULATIONS
370. We undertook a literature review to identify existing research regarding the use and non-
use values the public holds for conserving the NSO and the old growth habitat it relies
upon. This search identified several valuation studies focusing on use and non-use values.
These studies did not distinguish separate use (e.g., recreational opportunities) and non-
use (the knowledge that the birds and their habitat will be conserved in the present and for
future generations) values.
371. As stated earlier, existing information on potential use and non-use values does not
support a benefit transfer based analysis associated with increased NSO populations.
First, insufficient biophysical information exists to support such an analysis. Appropriate
allocation of benefits would require modeling changes in owl populations over time in
response to the specific incremental conservation efforts described in this analysis. The
timing and extent to which the owl populations would be expected to recover, and the
extent to which this recovery would be associated with these conservation efforts, are
unknown.276
Absent this information, conducting a credible benefit transfer analysis that
quantifies benefits of this rulemaking on NSO use and non-use values is not possible. The
information in this discussion is therefore provided for context to the analysis.
Furthermore, while we have reviewed these studies in order to provide general
information on previous research regarding economic values of owl populations, we do
not promote a particular estimate, nor offer judgments regarding the quality of the
underlying valuation studies.
372. Rubin et al. (1991) surveyed a random group of Washington State households to
determine willingness to pay to ensure survival of the NSO.277
The survey did not elicit
276 Richardson and Loomis (2009) developed a model to estimate the value of critical habitat designations based on a meta-
analysis of 31 studies published between 1985 and 2005. While one of these studies evaluated benefits of Mexican spotted
owl, none evaluated benefits of the NSO. The model generates composite willingness to pay values for species conservation
based on an estimate of the percent change in species population likely to result from the critical habitat designation.
Implementation of the model requires information regarding the change in the population likely to result from the
conservation efforts undertaken in response to the listing or critical habitat designation. Such information is not available
for this designation. (Richardson, L. and J. Loomis. March 2009. The Total Economic Value of Threatened, Endangered, and
Rare Species: An Updated Meta-Analysis. Ecological Economics 68(5): 1535-1548.)
277 Rubin, J., G. Helfand, and J. Loomis. 1991. A Benefit-Cost Analysis of the Northern Spotted Owl: Results from a
contingent valuation survey. Journal of Forestry. 25-30.
Final Economic Analysis - November 20, 2012
8-7
information on separate use and non-use values for the species but for willingness to pay
for the species survival. As a result, it is not clear what the public is valuing in their
responses (e.g., recreational opportunity, existence values, etc.). The study estimates
willingness to pay for NSO survival on a per household in Washington State. Results
were extrapolated to Oregon, California, and the remainder of the United States
accounting for varying socioeconomic conditions, such as per capita income and
household size, and applying a distance-decay factor assuming that willingness to pay
decreases with increased distance from the resource being valued. Importantly, this study
notes that it is difficult to determine whether these willingness to pay estimates account
for the public’s value for the NSO, or for old growth forests, more generally.
373. Loomis and White (1996) report varying willingness to pay based on varying percent
chances of survival for the NSO. The study does not, however, estimate a functional
relationship and the direction of the values is seemingly counterintuitive; the authors
report a lesser willingness to pay for an increased chance of survival of the NSO. When
presented with a scenario of a 75 percent chance of survival of the species, the
willingness to pay of Washington households was lower than for a scenario with a 30
percent chance of survival scenario.278
374. Hagen et al. (1992) estimated the economic benefits of a conservation policy for old
growth forests in the Pacific Northwest which would prevent the extinction of the
NSO.279
A random sample of households from across the United States was surveyed to
elicit willingness to pay per household. The description of the conservation policy
provided to respondents was derived from the report of the Interagency Scientific
Committee (ISC) to Address the Conservation of the Northern Spotted Owl. The
conservation policy described included, for example, precluding timber sales in particular
habitat areas. It should be noted that in eliciting willingness to pay for preserving the
NSO’s old growth forest habitat, values for collateral benefits may be reflected in a
household’s willingness to pay. In other words, this value may not reflect simply the use
and non-use values of the NSO. In considering conservation of old growth habitat, survey
respondents may contemplate elements of the entire ecosystem rather than solely
considering the survival of the NSO independently.
375. Loomis and González-Cabán (1998) estimated NSO habitat value through a contingent
valuation survey focused on the value of protecting old growth forest in California and
Oregon.280
A survey randomly mailed to households in California, Oregon, and New
England described elements of a hypothetical Fire Prevention and Control Program and
asked for households’ willingness to pay for a reduction in old growth acres burned as
well as a reduction in NSO critical habitat units burned. The study estimated a
278 Loomis, J.B. and D.S. White. 1996. Economic benefits of rare and endangered species: summary and meta-analysis.
Ecological Economics. 18:197-206.
279 Hagen, D.A., J.W. Vincent and P.G. Welle. 1992. Benefits of Preserving Old-Growth Forests and the Spotted Owl.
Contemporary Policy Issues. Vol X:13-26.
280 Loomis, J.B. and A. González-Cabán. 1998. A willingness-to-pay function for protecting acres of spotted owl habitat from
fire. Ecological Economics. 25:315-322.
Final Economic Analysis - November 20, 2012
8-8
willingness to pay function for reducing burned acres of old growth forests in Oregon and
California to determine national average per household willingness to pay values for
varying protected acres.
376. As described above, an ideal study for estimating economic use and non-use values of
critical habitat designation would be specific to the species in question (or would address
a closely related species), would consider valuation in a context close to the policy issues
in question (i.e., economic benefits of implementing the conservation efforts associated
with designating critical habitat for this species), and would address a relevant population
holding these values (citizens of the United States). While the studies identified and
described above are specific to the NSO and address willingness to pay across the United
States, none consider valuation in the context of the specific conservation efforts
associated with critical habitat designation. One published study was identified that
specifically investigates the economic benefits arising from designating critical habitat for
the closely-related Mexican spotted owl. While biologically similar to the NSO (both
birds are subspecies of the spotted owl), the endangered Mexican spotted owl inhabits
montane forests and deep canyons in the southwestern United States. Thus, there is a
difference in the commodity being valued in this study.
377. The benefits of critical habitat designation for the Mexican spotted owl in the four corners
area were explored using a contingent valuation survey.281
Specifically, the purpose of
this study was to determine whether the public expressed a difference in willingness to
pay for a single species (the Mexican spotted owl) versus a bundle of 62 threatened and
endangered species, including the Mexican spotted owl. The authors found that, indeed
willingness to pay did increase for the bundled species protections.
378. While this study estimates a value of Mexican spotted owl habitat conservation, it does
not estimate the marginal value of protecting an additional species or its habitat. Doing so
would require: (a) addressing the willingness to pay for a conservation action additional
to all other existing conservation actions; and (b) understanding the expected probability
and timing of changes in the species population. As raised by Desvousges et al., it is not
clear from the existing literature if the public’s willingness to pay for protecting the NSO
and its habitat would be any different from the public’s willingness to pay for all
endangered and threatened species.282
Loomis and Ekstrand did find a significant
difference between their determined value of critical habitat designation for the Mexican
spotted owl and their calculated value for a group of 62 species. However, this difference
is small and the authors themselves note that stated preference valuations of critical
habitat designation benefits for individual species are neither additive nor necessarily
comparable. They recognize that the value of a cohort of species is not numerically
equivalent to a single species multiplied by the number of species comprising the cohort.
281 Loomis, J. and E. Ekstrand. 1997. Economic Benefits of Critical Habitat for the Mexican Spotted Owl: A Scope Test Using a
Multiple-Bounded Contingent Valuation Survey. Journal of Agricultural and Resource Economics. 22(2):356-366.
282 Desvousges, W.H., F.R. Johnson, R.W. Dunford, K.J. Boyle, S.P. Hudson, and K.N. Wilson. 1993. Measuring Natural
Resource Damage with Contingent Valuation: Tests of Validity and Reliability. In Hausman, J. ed. Contingent Valuation: A
Critical Assessment. Amsterdam: North Holland Press, 91-164.
Final Economic Analysis - November 20, 2012
8-9
This underscores the uncertainty associated with what, specifically, the public is valuing
when expressing a willingness to pay for habitat conservation.
379. A recent study by Richardson and Loomis (2009) focused on estimating a model (i.e., a
willingness to pay function) to value threatened or endangered species based on estimates
from multiple studies. This type of study is referred to as a “meta-analysis.”283
The meta-
analysis is based on 31 studies with 67 willingness to pay (WTP) observations published
from 1985 to 2005 evaluating economic values of endangered, threatened or rare species
primarily applying contingent valuation methods. The economic values expressed in the
studies that inform the model reflect primarily recreational use, as well as nonuse values.
Some of the studies, however, are solely focused on the nonuse component of the
economic value. The species included in the study are primarily marine and riverine
species (whales, dolphins, seals, otters, sea lions, sea turtles, salmon and other listed fish
species), but include some avian and other species, including, most relevantly, spotted
owls.
380. A key variable required for the resulting willingness to pay function is the change in the
species population levels resulting from the rule. Thus, absent the information on the
effect of the critical habitat designation on owl populations, the model does not provide a
means to estimate the incremental benefit of the rule in terms of the public’s willingness
to pay.
381. Overall, the studies identified through our literature review provide some indication of
the use and non-use values of NSO populations. The absence of information on the effect
of the designation on NSO populations, however, precludes application of these values to
estimate a public willingness to pay for NSO conservation.
8.2 QUALITATIVE DISCUSSION OF THE ANCILLARY BENEFITS OF CRITICAL HABITAT
DESIGNATION FOR THE NORTHERN SPOTTED OWL
382. Benefits beyond use and non-use values may also be achieved through a species listing or
designation of critical habitat. For example, the public may hold a value for habitat
conservation, beyond its willingness to pay for conservation of a specific species. Studies
have estimated the public’s willingness to pay to preserve wilderness areas, for wildlife
management and preservation programs, and for wildlife protection in general. These
studies address categories of benefits (e.g., ecosystem integrity) that may be similar to the
types of benefits provided by the listing or critical habitat, but do not provide values that
can be used to establish the incremental values associated with this proposed critical
habitat designation (i.e., the ecosystem and species protection measures considered in
these studies are too dissimilar from the habitat protection benefits that may be afforded
by this designation).
283 Richardson, Leslie and John Loomis. The Total Economic Value of Threatened, Endangered and Rare Species: An Updated
Meta-Analysis. Ecological Economics (2009): 1535-1548. This paper updates a 1996 study on the same topic by Loomis and
White (Loomis, John and D.S. White. Economic Benefits of Rare and Endangered Species: A Meta-Analysis. Ecological
Economics (1996): 197-206).
Final Economic Analysis - November 20, 2012
8-10
383. Such benefits are not the purpose of the listing or critical habitat designation. Thus, the
Service has decided not to focus on estimating these values in the Economic Analysis.
The remainder of this Chapter includes a qualitative benefits discussion, summarizing the
NSO conservation efforts described in Chapters 4 through 7 of this report and linking
them with potential categories of economic benefit that may derive from their
implementation.
384. Exhibit 8-1 summarizes potential benefits associated with the specific conservation
efforts for the NSO that may result from critical habitat designation, as described in
Chapters 4 through 7 of this report.284
In general, the ancillary benefits described in
Exhibit 8-1 could derive from conservation measures that may be implemented to avoid
destruction or adverse modification of critical habitat, possibly such as the
implementation of improved ecological timber management practices in certain proposed
critical habitat areas (e.g., Federal lands).285
The categories of related economic benefits
include:
Public safety benefits: It is possible that the designation could result in increased
resiliency of timber stands associated with improved timber management
practices, such as thinning, partial cutting, adaptive management and monitoring,
may reduce the threat of catastrophic events such as wildfire, drought and insect
damage. This in turn may generate benefits in the form of reduced property
damage.
Improved water quality: Adjustments in riparian buffers or greater biomass
retention on slopes as the result of critical habitat designation may reduce
sedimentation in wetlands and streams and reduce adverse impacts to
downstream water quality. Improved water quality may reduce water treatment
costs and have human or ecological health benefits.
Aesthetic benefits: Critical habitat may result in a forest area that emulates
native forest development, as opposed to a patchwork of even-aged stands.286
This more natural landscape may be more aesthetically appealing and therefore
generate social welfare gains. Preferences for aesthetic improvements may be
measured, for example, through increased willingness-to-pay to visit a habitat
region for recreation, increased visitation, or changes in the value of neighboring
properties.
Carbon storage: Decreases in the volume of timber harvested, or improvement
in forest health from active management practices, may result in changes in the
284 The proposed rule also notes that critical habitat can engender “educational” benefits. These benefits may include for
example, the value of simply increasing awareness among the public of where the NSO may be present. Establishing critical
habitat boundaries also highlights the significance an area has for NSO conservation in future planning efforts.
285 Several entities provided substantive public comment referring the Service to studies and approaches for estimating the
value of ancillary benefits potentially resulting from the designation. For a detailed discussion of the Service’s judgment
regarding their applicability to this analysis, see the preamble discussion of public comments provided in the Final Rule.
286 Johnson, K. Norman, and Jerry F. Franklin. Southwest Oregon Secretarial Pilot Projects on BLM Lands: Our Experience So
Far and Broader Considerations for Long-term Plans. February 15, 2012.
Final Economic Analysis - November 20, 2012
8-11
amount of carbon stored in, and sequestered by, forest biomass. The resulting
removal of carbon from the atmosphere may result in decreases in potential
damages to crops, human health, and from shoreline erosion due to climate
change.287
385. In addition to these categories of potential benefits, all of the conservation efforts
described in Exhibit 8-1 are related to the broader conservation and recovery of the
species. All conservation efforts therefore relate to the maintenance or enhancement of
the use and non-use value (e.g., existence value) that the public may hold specifically for
the NSO. Further, many of the conservation efforts undertaken for the NSO may also
result in improvements to ecosystem health that are shared by other, coexisting species
(including other endangered or threatened species). The maintenance or enhancement of
use and non-use values for these other species, or for biodiversity in general, may also
result from these conservation efforts for the NSO.
386. The third column of Exhibit 8-1 identifies the relevant proposed critical habitat units in
which the described benefits may occur. In general, the relevant units are limited to those
units containing Federal lands, as follows:
Benefits could occur on Federal matrix lands if changes are made in timber
management practices as a result of the critical habitat designation. While
the designation of critical habitat only requires Federal agencies to comply with
section 7 on a project-by-project basis, one outcome could be that Federal land
managers modify their timber management on a broader basis within critical
habitat as appropriate within the context of their land management plans and
other legal authorities. In particular, this may be a possibility on Federal matrix
lands that are likely to be unoccupied by the NSO. We have assumed for the
purposes of this analysis that the units expected to experience these benefits are
those units containing this category of Federal lands (see Chapter 4 for a
description of the identification of these lands).
In addition, as discussed in Chapter 4, application of some of the ecological
forestry measures described in the proposed critical habitat rule may lead to a
reduction in some legal and political challenges of Federal matrix land
management, thus resulting in an increase in timber harvest from some of these
lands. For example, application of some variable retention harvest prescriptions
on matrix lands may be less controversial and less subject to successful legal
challenge under the Act, when compared to previous proposed regeneration
timber harvest and subsequent protests and legal challenges. Application of these
methods may also have long term ecological benefits for species other than NSO,
if applied as described in the proposed critical habitat rule and using the most up-
to-date science.
287 Note that, although this analysis contemplates potential timber harvest impacts over a 20 year period, any material
benefits related to carbon sequestration would be dependent upon a longer time period of alternative timber management
practices.
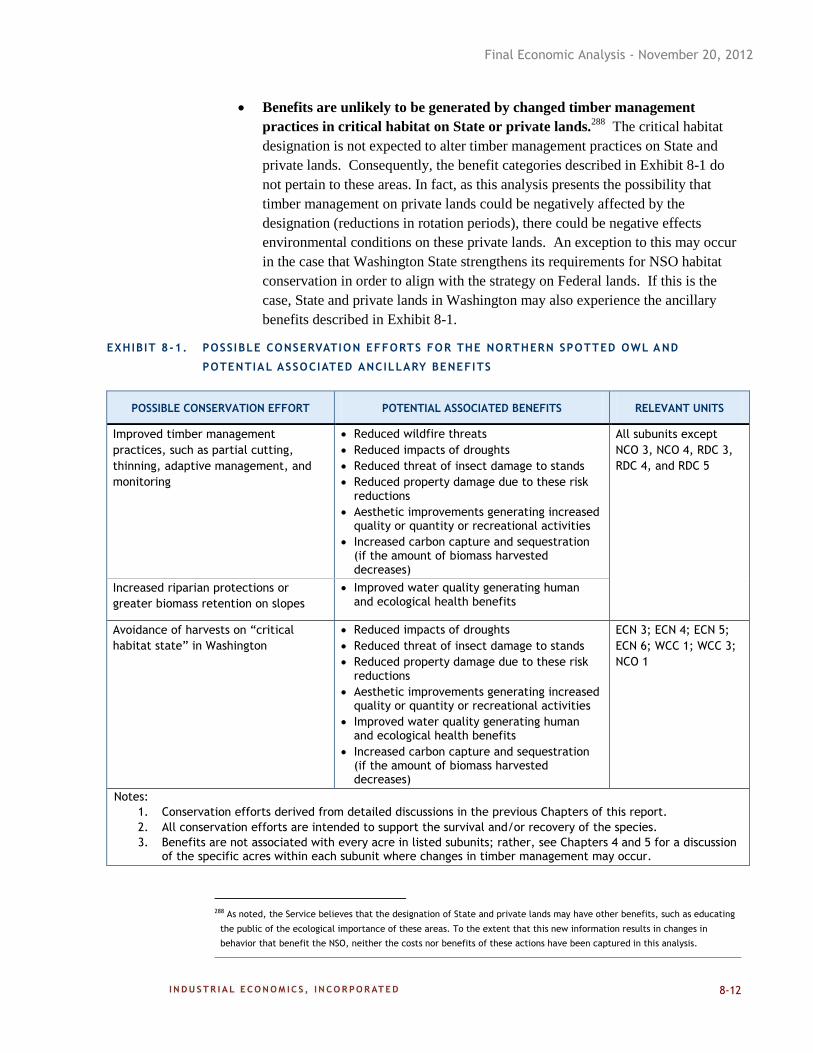
Final Economic Analysis - November 20, 2012
8-12
Benefits are unlikely to be generated by changed timber management
practices in critical habitat on State or private lands.288
The critical habitat
designation is not expected to alter timber management practices on State and
private lands. Consequently, the benefit categories described in Exhibit 8-1 do
not pertain to these areas. In fact, as this analysis presents the possibility that
timber management on private lands could be negatively affected by the
designation (reductions in rotation periods), there could be negative effects
environmental conditions on these private lands. An exception to this may occur
in the case that Washington State strengthens its requirements for NSO habitat
conservation in order to align with the strategy on Federal lands. If this is the
case, State and private lands in Washington may also experience the ancillary
benefits described in Exhibit 8-1.
EXHIBIT 8-1. POSSIBLE CONSERVATION EFFORTS FOR THE NORTHERN SPOTTED OWL AND
POTENTIAL ASSOCIATED ANCILLARY BENEFITS
POSSIBLE CONSERVATION EFFORT POTENTIAL ASSOCIATED BENEFITS RELEVANT UNITS
Improved timber management
practices, such as partial cutting,
thinning, adaptive management, and
monitoring
Reduced wildfire threats
Reduced impacts of droughts
Reduced threat of insect damage to stands
Reduced property damage due to these risk reductions
Aesthetic improvements generating increased quality or quantity or recreational activities
Increased carbon capture and sequestration (if the amount of biomass harvested decreases)
All subunits except
NCO 3, NCO 4, RDC 3,
RDC 4, and RDC 5
Increased riparian protections or
greater biomass retention on slopes
Improved water quality generating human and ecological health benefits
Avoidance of harvests on “critical
habitat state” in Washington
Reduced impacts of droughts
Reduced threat of insect damage to stands
Reduced property damage due to these risk reductions
Aesthetic improvements generating increased quality or quantity or recreational activities
Improved water quality generating human and ecological health benefits
Increased carbon capture and sequestration (if the amount of biomass harvested decreases)
ECN 3; ECN 4; ECN 5;
ECN 6; WCC 1; WCC 3;
NCO 1
Notes:
1. Conservation efforts derived from detailed discussions in the previous Chapters of this report.
2. All conservation efforts are intended to support the survival and/or recovery of the species.
3. Benefits are not associated with every acre in listed subunits; rather, see Chapters 4 and 5 for a discussion of the specific acres within each subunit where changes in timber management may occur.
288 As noted, the Service believes that the designation of State and private lands may have other benefits, such as educating
the public of the ecological importance of these areas. To the extent that this new information results in changes in
behavior that benefit the NSO, neither the costs nor benefits of these actions have been captured in this analysis.
Final Economic Analysis - November 20, 2012
8-13
8.3 DISCUSSION
387. As described above, the existing literature does not provide an adequate basis to monetize
the incremental benefits of the NSO conservation measures considered in this economic
analysis. The quantification of the incremental benefits of designating critical habitat for
the NSO is impeded by the absence of studies which provide information on the NSO
conservation probability related to the critical habitat designation, which is distinct and
separate from the conservation probability due to recovery efforts associated with the
listing. The change in NSO population likely to result from the conservation efforts
undertaken in response to the critical habitat designation would be necessary to monetize
the change in conservation probability attributable solely to critical habitat, and no such
studies currently exist.
388. Qualitative consideration of the potential benefits associated with the NSO conservation
efforts discussed in prior chapters of this report reveal a number of categories of
economic benefits additional to the use and non-use values individuals hold for the NSO
itself, including public safety, water quality, and aesthetic benefits. Furthermore,
potential increased timber harvests resulting from the designation are quantified in
Chapter 4.
Final Economic Analysis - November 20, 2012
R-1
REFERENCES
2 U.S.C. 1531 et seq.
5 U.S.C. § 601 et seq.
16 U.S.C § 500
16 U.S.C. § 620a
16 U.S.C. 1532
16 U.S.C. §1533(b)(2)
16 U.S.C. § 1538(a)(1)(G)
31 U.S.C § 69
43 U.S.C § 1181f
50 C.F.R. 17.31(a)
64 FR 43255
77 FR 14123
77 FR 14138
77 FR 14141
77 FR 14142
175 F. 3d 1027, 1044 (D.C. Cir. 1999)
773 F. 2d 327 (D.C. Cir. 1985)
1990 Final Listing Rule, 55 FR 26114
1992 Final Critical Habitat Rule, 57 FR 1796
2008 Final Critical Habitat Rule, 73 FR 47325
2011 Proposed Listing and Critical Habitat Rule, 76 FR 61482
2012 Proposed Critical Habitat Rule, 77 FR 14062
Arizona Cattle Growers v. Salazar, 606 F. 3d 1160 (9th Cir. 2010), cert. denied, 179 L.
Ed. 2d 300, 2011 U.S. Lexis 1362, 79 U.S.L.W. 3475 (2011).
Atterbury Consultants, Incorporated. “Timberland Valuation of Potential Marbled
Murrelet Habitat.” Memorandum to Industrial Economics, Incorporated. February,
13, 2007.
Aubry, K.B., C.B. Halpern, and C.E. Peterson. 2009. “Variable-retention Harvests in the
Pacific Northwest: A Review of Short-term Findings from the DEMO Study.”
Forest Ecology and Management 258 (2009): 398-408.
Final Economic Analysis - November 20, 2012
R-2
Auffhammer, M., M. Oren, and D. Sunding. 2009. “Economic Impacts of Critical habitat
Designation: Evidence from the Market for Vacant Land.” Workshop Paper, The
University of Arizona, Program on Economics, Law, and the Environment, available
at http://ele.arizona.edu/files/ELEsunding1-30-09.pdf.
Baker, S. 2011. “Seeking a Balance between Forestry and Biodiversity the Role of
Variable Retention Silviculture.” Forest & Wood Products Australia Limited,
PDG167-0910.
Beck, Tracy. USFS, Region 6. “NWFP-OfficialOfferCutSoldByForest1995-2010.xls,”
submitted on February 24, 2012.
Bordelon, Mike. Oregon Department of Forestry. Personal communication on March 19,
2012.
Browder, Chris. CAL FIRE. Personal communication on March 12, 2012 and subsequent
email exchanges on April 5 and 6, 2012.
Cadwell, Chris. BLM, Oregon State Office. “Proposed Spotted Owl Critical Habitat –
Economic Analysis Assumptions for BLM Timber Harvest Effects,” submitted on
April 17, 2012.
California Department of Forestry and Fire Protection, “Demonstration Forests,” as
viewed at http://www.fire.ca.gov/resource_mgt/resource_mgt_stateforests.php on
April 8, 2012.
California Department of Forestry and Fire Protection representative. Personal
communication on March 12, 2012 and subsequent email communication on April 5,
2012.
California Energy Commission. Personal communication on March 12, 2012.
California Forest Practices Rules 2012, Title 14 California Code of Regulations, Chapters
4, 4.5, and 10, Article 9, Section 919.9.
CA Public Resources Code § 4645-4659
California State Board of Equalization, "California Timber Harvest By County: Year
2010 Quarter 1 to 4." Accessed at
http://www.boe.ca.gov/proptaxes/pdf/ytr362010.pdf.
California State Board of Equalization, "California Timber Harvest By County: 1994-
2009." Accessed at http://www.boe.ca.gov/proptaxes/pdf/yr3694to09.pdf March
2012.
California State Parks, The Seventh Generation: The Strategic Vision of California State
Parks 2001, p. 9, as viewed at http://www.parks.ca.gov/pages/91/files/seven01.pdf.
CalTrans CTIS Projects and Downloads, accessed at
http://www.dot.ca.gov/hq/tpp/offices/osp/ctis_sources_download.html on March 20,
2012.
Final Economic Analysis - November 20, 2012
R-3
CalTrans, FWS Liaison. Personal communication on March 14, 2012.
Carpenters’ Industrial Council v. Salazar, Case No. 1:08–cv–01409–EGS (D.DC)
Carey, A.B. 2006. Active and Passive Forest Management for Multiple Values,
Northwest Naturalist, 87(1):18-30.
Cascade Crossing Project, accessed at http://www.cascadecrossingproject.com/pge.aspx
on April 5, 2012.
Center for Biological Diversity v. United States Bureau of Land Management, 422 F.
Supp.2d 1115 (N.D. Cal. 2006).
Charnley, Susan. 2006. The Northwest Forest Plan as a Model for Broad-Scale
Ecosystem Management: a Social Perspective. U.S. Department of Agriculture
Forest Service, Pacific Northwest Research Station. Portland, OR.
Charnley, S, EM Donoghue, and C Moseley. 2008. “Forest Management Policy and
Community Well-Being in the Pacific Northwest.” Journal of Forestry (December
2008). Accessed at
http://www.fs.fed.us/pnw/pubs/journals/pnw_2008_charnley001.pdf on April 6,
2012.
Consumer Price Index (CPI) Inflation Calculator available at www.bls.gov.
Cramer, Darin. Washington Department of Natural Resources. Personal communication
on March 22 and March 27, 2012.
Daniels, Jean. 2005. The Rise and Fall of the Pacific Northwest Log Export Market. U.S.
Department of Agriculture, Forest Service, Pacific Northwest Research Station.
PNW-GTR-624. Available at http://www.fs.fed.us/pnw/pubs/pnw_gtr624.pdf.
Davis, Ray; Falxa, Gary; Grinspoon, Elisabeth; Harris, Gary; Lanigan, Steven; Moeur,
Melinda; Mohoric, Shawne. 2011. Northwest Forest Plan- The First 15 Years
(1994-2008) : Summary of Key Monitoring Findings. Tech. Paper R6-RPM-TP-03-
2011. Portland, OR: U.S. Department of Agriculture, Forest Service, Pacific
Northwest Region.
Desvousges, W.H., F.R. Johnson, R.W. Dunford, K.J. Boyle, S.P. Hudson, and K.N.
Wilson. 1993. Measuring Natural Resource Damage with Contingent Valuation:
Tests of Validity and Reliability. In Hausman, J. ed. Contingent Valuation: A
Critical Assessment. Amsterdam: North Holland Press, 91-164.
Director, U.S. Fish and Wildlife Service, Memorandum to Regional Directors and
Manager of the California-Nevada Operations Office, Subject: Application of the
“Destruction or Adverse Modification” Standard under Section 7(a)(2) of the
Endangered Species Act, dated December 9, 2004.
Drever, C.R., G. Peterson, C. Messier, Y. Bergeron and M.D. Flannigan. 2006. Can
Forest Management Based on Natural Disturbances Maintain Ecological Resilience?
Canadian Journal of Forest Research 36: 2285-2299.
Final Economic Analysis - November 20, 2012
R-4
Dunk, J.R., Woodbridge, B., D. LaPlante, N. Schumaker, B. Glenn, B. White, S.
Livingston, M.M. Zwartjes, J. Peters, K. Halupka, and J. Caicco. 2012. Modeling
and Analysis Procedures used to Identify and Evaluate Potential Critical Habitat
Networks for the Northern Spotted Owl. Unpublished report, U.S. Fish & Wildlife
Service, Portland, OR. February 28, 2012. 48 pp.
Energy Facility Site Evaluation Council, Siting/Review Process, accessed at
http://www.efsec.wa.gov/cert.shtml#Energy Facility on April 5, 2012.
Entrix, “Final Economic Analysis of Critical Habitat Designation for the Northern
Spotted Owl,” prepared for the U.S. Fish and Wildlife Service, July 15, 2008.
Executive Order 12866, Regulatory Planning and Review, September 30, 1993.
Executive Order 13211, Actions Concerning Regulations That Significantly Affect
Energy Supply, Distribution, or Use, May 18, 2001.
Executive Order 13563, Improving Regulation and Regulatory Review, January 18, 2011.
Federal Forest Resource Coalition. 2011. “Is Federal Timber Still in Demand?” Accessed
at
http://www.foresthealth.org/pdf/Federal%20Timber%20Demand%20Feb%202011.p
df on April 10, 2012.
Federal Government Schedule Rates, Office of Personnel Management, 2012.
FERC, Energy Industry Analyst. Personal communication on November 16, 2011.
FERC “Approved Pipeline Projects, 2003 to the Present,” accessed at
http://www.ferc.gov/industries/gas/indus-act/pipelines/approved-projects.asp on
April 1, 2012.
FERC-Regulated Industries, Project Siting, accessed at
http://www.ferc.gov/industries/electric/indus-act/siting.asp on April 5, 2012.
Folliard, Lee and Chris Cadwell. U.S. Bureau of Land Management, Oregon State Office.
Personal communication on March 16, 2012.
Franklin, J., D. Berg, D. Thornburgh, et al. 2002. Alternative Silvicultural Approaches to
Timber Harvesting: Variable Retention Harvest Systems. Pages 111-139 in: Kohm,
K., and J. Franklin (editors), Creating a Forestry for the 21st Century. Washington,
DC: Island Press.
Gifford Pinchot Task Force v. United States Fish and Wildlife Service, No. 03-35279 (9th
Circuit 2004).
Gramlich, Edward M. 1990. A Guide to Benefit-Cost Analysis (2nd Ed.). Prospect
Heights, Illinois: Waveland Press, Inc.
Grinspoon, E. and R. Philips. U.S. Department of Agriculture, U.S. Forest Service,
Pacific Northwest Research Station. 2011. Socioeconomic Status and Trends. R6-
RPM-TP-02-2011.
Final Economic Analysis - November 20, 2012
R-5
Hagen, D.A., J.W. Vincent and P.G. Welle. 1992. Benefits of Preserving Old-Growth
Forests and the Spotted Owl. Contemporary Policy Issues. Vol X:13-26.
Haynes, Richard. 2008. Emergency Lessons from a Century of Experience with Pacific
Northwest Timber Markets. United States Department of Agriculture, Forest
Service, Pacific Northwest Research Station. General Technical Report: PNW-GTR-
747. April 2008. Accessed at http://www.fs.fed.us/pnw/pubs/pnw_gtr747.pdf on
April 9, 2012.
Haynes, Richard. 2009. "Contribution of Old-Growth Timber to Regional Economies in
the Pacific Northwest." Old Growth in a New World: A Pacific Northwest Icon
Reexamined. Eds. Thomas A. Spies and Sally L. Duncan. Washington, DC: Island,
2009. 83-94.
Headwaters Economics. 2010. The Siskiyou Region: Demographic, Economic, and Fiscal
Fundamentals. Accessed at http://headwaterseconomics.org/land/reports/the-
siskiyou-region/ on April 10, 2012.
Headwaters Economics. December 2010. “County Payments, Jobs, and Forest Health:
Ideas for Reforming the Secure Rural Schools and Community Self-Determination
Act (SRS) and Payments in Lieu of Taxes (PILT).” White Paper. Accessed at
http://headwaterseconomics.org/wphw/wp-
content/uploads/Reform_County_Payments_WhitePaper_LowRes.pdf; permission to
reproduce granted on April 3, 2012
Hollen, Debbie and Tracy Beck.U.S. Forest Service, Region 6. Personal communication
on March 22, 2012.
Home Builders Association of Northern California v. United States Fish and Wildlife
Service, 616 F.3d 983 (9th Cir. 2010), cert. denied, 179 L. Ed 2d 301, 2011 U.S.
Lexis 1392, 79 U.S.L.W. 3475 (2011).
Ince, Peter, Andrew Kramp, Kenneth Skog, Henry Spelter, and David N. Wear. 2011.
U.S. Forest Products Module: A Technical Document Supporting the Forest Service
2010 RPA Assessment. Research Paper FPL-RP-662. Madison WI: U.S. Department
of Agriculture, Forest Service, Forest Products Laboratory.
Johnson, K. Norman. College of Forestry, Oregon State University. Personal
communication on April 5, 2012.
Johnson, K. Norman, and Jerry F. Franklin. Southwest Oregon Secretarial Pilot Projects
on BLM Lands: Our Experience So Far and Broader Considerations for Long-term
Plans. February 15, 2012.
Johnson, N.K. and J.F. Franklin. 2009. Restoration of Federal Forests in the Pacific
Northwest: Strategies and Management Implications. Unpublished manuscript.
August 15, 2009. 120 pp. Accessed at
http://www.cof.orst.edu/cof/fs/PDFs/JohnsonRestoration_Aug15_2009.pdf on April
5, 2012.
Final Economic Analysis - November 20, 2012
R-6
Johnson, N.K. and J.F. Franklin. 2012. Southwest Oregon Secretarial Pilot Projects on
BLM Lands: Our Experience So Far and Broader Considerations for Long-term
Plans. Pilot Report. February 15, 2012. Accessed at
http://www.blm.gov/or/news/files/pilot-report-feb2012.pdf on April 6, 2012.
Krauss, Cameron and Don Harwick. Swanson Group. Personal communication on March
12, 2012.
List, J.A., M. Margolis, and D. E. Osgood. 2006. “Is the Endangered Species Act
Endangering Species?” National Bureau of Economic Research Working Paper
Series, Working Paper 12777, available at http://www.nber.org/papers/w12777
Lippke, B.R. and L.C. Mason. Implications of Working Forest Impacts on Jobs and Local
Economies. October 24, 2005. Accessed at
https://digital.lib.washington.edu/researchworks/bitstream/handle/1773/2235/tp4.pdf
?sequence=1 on April 6, 2012.
Loomis, J. and E. Ekstrand. 1997. Economic Benefits of Critical Habitat for the Mexican
Spotted Owl: A Scope Test Using a Multiple-Bounded Contingent Valuation
Survey. Journal of Agricultural and Resource Economics. 22(2):356-366.
Loomis, J.B. and A. González-Cabán. 1998. A willingness-to-pay function for protecting
acres of spotted owl habitat from fire. Ecological Economics. 25:315-322.
Loomis, J.B. and D.S. White. 1996. Economic benefits of rare and endangered species:
summary and meta-analysis. Ecological Economics. 18:197-206.
Lueck, Dean and Jeffrey A. Michael, April 2003, “Preemptive Habitat Destruction Under
the Endangered Species Act,” Journal of Law and Economics, 46: 27-60.
Mason, L.C. and B.R. Lippke. 2007. Jobs, Revenues, and Taxes from Timber Harvest: An
Examination of the Forest Industry Contribution to the Washington State Economy.
Working Paper 9: September 2007. Rural Technology Initiative. Accessed at
http://www.ruraltech.org/pubs/working/09/index.asp on April 6, 2012.
Meir, Bob. Rayonier. Personal communication on March 5, 2012.
Memorandum For Heads of Executive Department Agencies, and Independent
Regulatory Agencies, Guidance For Implementing E.O. 13211, M-01-27, Office of
Management and Budget, July 13, 2001,
http://www.whitehouse.gov/omb/memoranda/m01-27.html.
Mitchell, Cindy. Washington Forest Protection Association. Personal communication on
March 6, 2012.
New Mexico Cattle Growers Assn v. United States Fish and Wildlife Service, 248 F.3d
1277 (10th Cir. 2001).
Newell, Graeme, and Chris Eves. 2009. “The Role of U.S. Timberland in Real Estate
Portfolios.” Journal of Real Estate Portfolio Management 15.1.
Final Economic Analysis - November 20, 2012
R-7
North, M.P., and W.S. Keeton, Emulating Natural Disturbance Regimes: An Emerging
Approach for Sustainable Forest Management, Pgs. 341-372 in Lafortezza, R, et al.
eds., Patterns and Processes in Forest Landscapes, Springer Science+Business
Media, 2008.
Northwest Environmental Defense Center v. Marvin Brown, 640 F.3d 1063 (9th Cir.
2010).
ODOE, Energy Facility Siting: Cascade Crossing Transmission Line Project, accessed at
http://oregon.gov/ENERGY/SITING/CCTx.shtml on April 5, 2012.
ODOT, Endangered Species Act Biological Assessment Guidance Manual. October 2005.
OMB, “Circular A-4,” September 17, 2003, available at
http://www.whitehouse.gov/sites/default/files/omb/assets/omb/circulars/a004/a-
4.pdf.
Operations & Maintenance Business Information Link (OMBIL) Regulatory Module
version 2 (ORM2). Received from U.S. Army Corps of Engineers, Seattle District
on April 3, 2012.
Operations & Maintenance Business Information Link (OMBIL) Regulatory Module
version 2 (ORM2), received from U.S. Army Corp of Engineers, Portland District on
April 3, 2012.
Oregon Department of Energy. Personal communication on March 12, 2012.
Oregon Department of Forestry, State Forests Division. 2012. Northern Spotted Owl
Operational Policies. Effective January 3.
Oregon Department of Forestry. 2012. "Oregon Annual Timber Reports." Accessed at
http://www.oregon.gov/ODF/STATE_FORESTS/FRP/annual_reports.shtml March
2012.
Oregon Department of Forestry, Division 31, Log Export Rules, 629-031-0005
Oregon Office of Economic Analysis. 2012. Wood Products Productivity. January 26,
2012. Oregon Office of Economic Analysis: A Blog of Oregon Economic News and
Analysis. Accessed at
http://oregoneconomicanalysis.wordpress.com/2012/01/26/wood-products-
productivity-an-update/ on April 10, 2012.
Phillips, R.H. 2006. Jobs and income associated with resource and recreation outputs. P.
37-51 in Northwest Forest Plan: The first ten years (1994-2003): Socioeconomic
monitoring results. Volume III: Rural communities and economies, Charnley, S.
(tech. coord.). U.S. For. Serv. Gen. Tech. Rep. PNW-GTR-649, Pacific Northwest
Res. Stn., Portland, OR. 206 p.
Power, Thomas M. "Public Timber Supply, Market Adjustments, and Local Economies:
Economic Assumptions of the Northwest Forest Plan." Conservation Biology 20.2
(2006): 341-50.
Final Economic Analysis - November 20, 2012
R-8
Prestemon, Jeffrey and Robert Abt. “Chapter 13: Timber Products Supply and Demand.”
Southern forest resource assessment. Wear, David, and John Greis, eds. 2002.
Asheville, NC: U.S. Department of Agriculture, Forest Service, Southern Research
Station.
Pub Law No. 104-121.
Richardson, Leslie and John Loomis. The Total Economic Value of Threatened,
Endangered and Rare Species: An Updated Meta-Analysis. Ecological Economics
(2009): 1535-1548. This paper updates a 1996 study on the same topic by Loomis
and White (Loomis, John and D.S. White. Economic Benefits of Rare and
Endangered Species: A Meta-Analysis. Ecological Economics (1996): 197-206).
Routman, K. 2007. Forest Communities and the Northwest Forest Plan: What
Socioeconomic Monitoring Can Tell Us. Science Findings (95). Pacific Northwest
Research Station, USDA Forest Service.
Rubin, J., G. Helfand, and J. Loomis. 1991. A Benefit-Cost Analysis of the Northern
Spotted Owl: Results from a contingent valuation survey. Journal of Forestry. 25-30.
Schuler, Galen. Green Diamond Resources Company. Personal communication on March
5, 2012.
Sherlock, Joe. USFS, Region 5. “ProjectedandASQ_Volumes.xlsx,” submitted April 12,
2012.
Sierra Club v. U. S. Fish and Wildlife Service, 245 F.3d 434 (5th Cir. 2001).
Spadaro, Jason. SDS Lumber. Personal communication on March 6, 2012.
Swanson, Mark, J. Franklin, R. Beschta, C. Crisafulli, D. DellaSala, R. Hutto, D.
Lindenmayer, and F. Swanson. 2011. The Forgotten Stage of Forest Succession:
Early-Successional Ecosystems on Forest Sites, Frontiers in Ecology and the
Environment 9: 117–125.
U.S. Army Corps of Engineers, Portland District. Written communication on April 11,
2012.
U.S. Army Corps of Engineers, Seattle District. Written communication on April 3, 2012.
U.S. Census Bureau, CenStats, County Business Patterns, http://censtats.census.gov/,
accessed March 2012.
U.S. Department of Labor, Bureau of Labor Statistics, Employment & Unemployment,
Local Area Unemployment Statistics. Accessed March 2012. Average
unemployment 2010.
U.S. Department of the Interior, Bureau of Land Management, Oregon & Washington
State Office. Personal communication on April 9, 2012.
Final Economic Analysis - November 20, 2012
R-9
U.S. Environmental Protection Agency, Guidelines for Preparing Economic Analyses,
EPA 240-R-00-003, September 2000, available at
http://yosemite.epa.gov/ee/epa/eed.nsf/ webpages/Guidelines.html.
U.S. EPA, “Memorandum: Clean Water Act Section 404 Regulatory Program And
Agricultural Activities,” accessed at
http://water.epa.gov/lawsregs/guidance/wetlands/cwaag.cfm on April 9, 2012.
U.S. Fish and Wildlife Service to Industrial Economics, Inc. “Incremental Effects
Memorandum for the Economic Analysis of the Proposed Rule to Revise Critical
Habitat for the Northern Spotted Owl,” March 21, 2012.
U.S. Fish and Wildlife Service, “Endangered Species and Habitat Conservation
Planning,” August 6, 2002, accessed at http://endangered.fws.gov/hcp/.
U.S. Fish and Wildlife Service, “Incremental Effects Memorandum for the Economic
Analysis of the Proposed Rule to Revise Critical Habitat for the Northern Spotted
Owl,” March 23, 2012.
U.S. Fish and Wildlife Service, liaison to ODOT. Personal and written communication on
March 12, 2012.
U.S. Fish and Wildlife Service. Personal communication on April 6, 2012.
U.S. Fish and Wildlife Service. Proposed Rule to List the Northern Spotted Owl as
Endangered. (57 FR 1796) January 15, 1990.
U.S. Fish and Wildlife Service. 2011. Revised Recovery Plan for the Northern Spotted
Owl (Strix occidentalis caurina). U.S. Fish and Wildlife Service, Portland, Oregon.
Xvi + 258 pp. Accessed at
http://www.fws.gov/arcata/es/birds/NSO/documents/USFWS2011RevisedRecovery
PlanNorthernSpottedOwl.pdf on April 5, 2012.
U.S. Forest Service, Title I- Secure Payments for States and Counties Containing Federal
Land, http://www.fs.usda.gov/Internet/FSE_DOCUMENTS/stelprdb5253425.pdf
(Accessed 4/5/2012)
U.S. Office of Management and Budget, “Circular A-4,” September 17, 2033, available at
http://www.whitehouse.gov/omb/circulars/a004/a-4.pdf.
U.S. Office of Management and Budget, February 7, 2011. “Regulatory Impact Analysis:
Frequently Asked Questions (FAQs).” Accessed on May 3, 2011 by
http://www.whitehouse.gov/sites/default/files/omb/circulars/a004/a-4_FAQ.pdf.
United States International Trade Commission. 2012. Interactive Tariff and Trade
DataWeb. Accessed at dataweb.usitc.gov on March 19, 2012.
Warren, D. 2011. Production, Prices, Employment, and Trade in Northwest Forest
Industries, All Quarters 2010. USDA Forest Service.
www.fs.fed.us/pnw/pubs/pnw_rb258.pdf
Washington Administrative Code (WAC), Chapter 240-15, Log Export Restrictions
Final Economic Analysis - November 20, 2012
R-10
Washington State Department of Natural Resources. 1997. Final Habitat Conservation
Plan. Olympia, WA.
Washington State Department of Natural Resources. 2012. “Washington State Timber
Harvest.” Accessed at
http://www.dnr.wa.gov/BusinessPermits/Topics/EconomicReports/Pages/obe_washi
ngton_timber_harvest_reports.aspx
Wienke, Ken. Boise Cascade. Personal communication on March 14, 2012.
WSDOT, Environmental Procedures Manual M 31-11.10. June 2011.
WSDOT, Maintenance and Operations Division, Best Management Practices Field Guide
for ESA § 4 (d) Habitat Protection. March 2004.
WSDOT. Personal communication on March 19, 2012.
WSDOT. Written communication on March 28, 2012.
Young, Lenny. Washington Department of Natural Resources. Personal communication
on March 14, 2012.
Final Economic Analysis - November 20, 2012
A-1
APPENDIX A | ADDITIONAL STATUTORY REQUIREMENTS
389. This appendix addresses the remaining analytical requirements under administrative law
and executive order. Section A.1 presents an analysis of impacts to small entities which
is conducted pursuant to the Regulatory Flexibility Act (RFA), as amended by the Small
Business Regulatory Enforcement Fairness Act (SBREFA) of 1996 and Executive Order
13272. Section A.2 assesses the effects of the Proposed Rule on State, local, and Tribal
governments and the private sector as required by Title II of the Unfunded Mandates
Reform Act of 1995 (UMRA). Section A.3 addresses the potential for federalism
concerns as required by Executive Order 13132. And Section A.4 considers potential
impacts to the energy industry in response to Executive Order 13211, entitled, “Actions
Concerning Regulations That Significantly Affect Energy Supply, Distribution, or Use.”
390. The analyses in this appendix rely on the estimated incremental impacts resulting from
the proposed critical habitat designation. The incremental impacts of the rulemaking are
most relevant for these analyses because they reflect costs that may be avoided or reduced
based on decisions regarding the composition of the final rule.
A.1 RFA/SBREFA ANALYSIS
391. When a Federal agency proposes regulations, the RFA requires the agency to prepare and
make available for public comment an analysis that describes the effect of the rule on
small entities (i.e., small businesses, small organizations, and small government
jurisdictions as defined by the RFA).289
No initial regulatory flexibility analysis is
required if the head of an agency certifies that the rule will not have a significant
economic impact on a substantial number of small entities. SBREFA amended the RFA
to require Federal agencies to provide a statement of the factual basis for certifying that a
rule will not have significant economic impact on a substantial number of small entities.
392. Three types of small entities are defined in the RFA:
Small Business - Section 601(3) of the RFA defines a small business as having
the same meaning as small business concern under section 3 of the Small
Business Act. This includes any firm that is independently owned and operated
and is not dominant in its field of operation. The Small Business Administration
(SBA) has developed size standards to carry out the purposes of the Small
Business Act, and those size standards can be found in 13 CFR 121.201. The size
standards are matched to North American Industry Classification System
289 5 U.S.C. § 601 et seq.
Final Economic Analysis – November 20, 2012
A-2
(NAICS) industries. The SBA definition of a small business applies to a firm’s
parent company and all affiliates as a single entity.
Small Governmental Jurisdiction - Section 601(5) defines small governmental
jurisdictions as governments of cities, counties, towns, townships, villages,
school districts, or special districts with a population of less than 50,000. Special
districts may include those servicing irrigation, ports, parks and recreation,
sanitation, drainage, soil and water conservation, road assessment, etc. When
counties have populations greater than 50,000, those municipalities of fewer than
50,000 can be identified using population reports. Other types of small
government entities are not as easily identified under this standard, as they are
not typically classified by population.
Small Organization - Section 601(4) defines a small organization as any not-for-
profit enterprise that is independently owned and operated and not dominant in its
field. Small organizations may include private hospitals, educational institutions,
irrigation districts, public utilities, agricultural co-ops, etc.
393. The courts have held that the RFA/SBREFA requires Federal agencies to perform a
regulatory flexibility analysis of forecast impacts to small entities that are directly
regulated. In the case of Mid-Tex Electric Cooperative, Inc., v. Federal Energy
Regulatory Commission (FERC), FERC proposed regulations affecting the manner in
which generating utilities incorporated construction work in progress in their rates. The
generating utilities that expected to be regulated were large businesses; however, their
customers -- transmitting utilities such as electric cooperatives -- included numerous
small entities. In this case, the court agreed that FERC simply authorized large electric
generators to pass these costs through to their transmitting and retail utility customers,
and FERC could therefore certify that small entities were not directly impacted within the
definition of the RFA.290
394. Similarly, American Trucking Associations, Inc. v. Environmental Protection Agency
(EPA) addressed a rulemaking in which EPA established a primary national ambient air
quality standard for ozone and particulate matter.291
The basis of EPA's RFA/SBREFA
certification was that this standard did not directly regulate small entities; instead, small
entities were indirectly regulated through the implementation of State plans that
incorporated the standards. The court found that, while EPA imposed regulation on
States, it did not have authority under this rule to impose regulations directly on small
entities and therefore small entities were not directly impacted within the definition of the
RFA.
395. Following the court decisions described above, this analysis considers only those entities
directly regulated by the Proposed Rule. The regulatory mechanism through which
critical habitat protections are realized is section 7 of the Act, which requires Federal
agencies, in consultation with the Service, to insure that any action authorized, funded, or
290 773 F. 2d 327 (D.C. Cir. 1985).
291 175 F. 3d 1027, 1044 (D.C. Cir. 1999).
Final Economic Analysis – November 20, 2012
A-3
carried by the Agency is not likely to adversely modify critical habitat. Therefore, under
a strict interpretation of the definition of a “directly regulated entity,” only Federal action
agencies are subject to a regulatory requirement (i.e., to avoid adverse modification) as
the result of the designation. Because Federal agencies are not small entities, under this
interpretation, the Service may certify that the proposed critical habitat rule will not have
a significant economic impact on a substantial number of small entities.292
396. We acknowledge, however, that in some cases, third-party proponents of the action
subject to permitting or funding may participate in a section 7 consultation and thus may
be indirectly affected. While these entities are not directly regulated, the Service has
requested information regarding the potential number of third parties participating in
consultations on an annual basis in order to ensure a robust examination of the effects of
this proposed rule. Below, we provide that information. We also provide information to
assist the Service in determining whether these entities are likely to be “small,” and
whether the number of potentially affected small entities is “substantial.”293
397. Importantly, the impacts of the rule must be both significant and substantial to prevent
certification of the rule under the RFA and to require the preparation of an initial
regulatory flexibility analysis. If a substantial number of small entities are affected by the
critical habitat designation, but the per-entity economic impact is not significant, the
Service may certify. Likewise, if the per-entity economic impact is likely to be
significant, but the number of affected entities is not substantial, the Service may also
certify. We focus the remainder of the discussion in this section on the number of small
entities potentially affected.
THIRD-PARTY PARTICIPANTS I N CONSULTATIONS ON T IMBER HARVESTS
398. In Chapter 4, we estimate that approximately 1,000 consultations with BLM and USFS
will occur over the next 20 years related to timber management projects. We assume,
therefore, that 50 consultations are likely on an annual basis. These consultations involve
individual projects, batched actions, or programmatic actions. Many do not involve third
parties, particularly those involving more than one project or action, as USFS and BLM
often complete section 7 consultations with the Service prior to advertising timber
sales.294
However, because data limitations do not allow us to estimate third party
participation rates, we conservatively assume that all future consultations include a third
party. Thus, we likely overstate the number of third party participants in timber harvest-
related consultations.
399. We assume that the entities defined by the NAICS codes presented in Exhibit A-1 could
be participants in a section 7 consultation if they are buyers of Federal timber sales. This
292 We also note that the direct economic impact of the project modifications resulting from these consultations is a change
in Federal revenues generated by timber sales. In other words, if harvests are increased or decreased as a result of the
designation, the USFS and BLM will receive more or less revenues, respectively, from the sale of this timber.
293 The RFA does not provide quantitative thresholds to defining the terms “substantial” and “significant.” In its guidance to
Federal agencies on complying with the RFA, SBA provides qualitative descriptions of these terms, leaving the Agencies with
discretion to interpret these terms on a case-by-case basis.
294 Email communication, Biologist, Oregon State Office, U.S. Fish and Wildlife Service, May 22, 2012.
Final Economic Analysis – November 20, 2012
A-4
exhibit also provides the SBA’s definition of a small entity in each classification. To
identify the total number of small entities found within our 56 county study area in these
NAICS categories, we rely on data obtained from Dun’s Market Identifiers, a privately-
compiled database containing basic company data such as annual revenues and number of
employees.295
Exhibit A-1 presents the total number of entities in the 56 county study
area in each category, as well as the number and percent that are small.
400. The Dun and Bradstreet data suggest that of the 7,643 entities located in the 56 counties
overlapping proposed critical habitat, 7,140 of them, or 93 percent, are “small” entities
are defined by SBA. If we assume that all of the entities participating in section 7
consultations are small, then less than one percent (50/7,140*100 = 0.70 percent) of small
entities in the study area could be affected by the designation of critical habitat on an
annual basis.
401. We also consider a separate dataset of information regarding the number of business
entities in the study area. The U.S. Census produces County Business Patterns, a dataset
collected on an annual basis that includes information about establishments, employment
and payroll.296
Because we cannot easily extract only the number of “small” entities from
these data, we present the total number of establishments in each NAICS category for
comparison to the totals presented in Exhibit A-1. As shown below in Exhibit A-2, the
U.S. Census estimates that only 2,616 total entities exist in the study area, compared to
the 7,643 identified by Dun and Bradstreet. If we assume that all of the entities identified
in Exhibit A-2 are “small,” then approximately 1.9 percent of small entities
(50/2,616*100 = 1.9 percent) may participate annually in section 7 consultations.
402. Thus, considering the two available data sources, Dun and Bradstreet and U.S. Census,
between less than one percent and two percent of small entities may participate in section
7 consultations related to timber harvests on an annual basis. We believe this estimate is
conservative (i.e., more likely to overstate than understate the percentage of affected
entities) for two reasons. First, not all section 7 consultations will involve a third party.
Second, not all of the third parties will be small entities. In addition, we note that we have
constrained our population of potentially affected entities to those found in counties
overlapping the proposed critical habitat, as opposed to including others found outside of
the study area but within the States of Washington, Oregon, and California.
295 Dun and Bradstreet, D&B - Dun’s Market Identifiers, searched via Dialog File 516 on May 16, 2012.
296 Dun and Bradstreet collect data more frequently through daily in-person and telephone interviews, county state, and
federal government sources, third party sources, business trade tape exchange programs, and large-volume mailings.
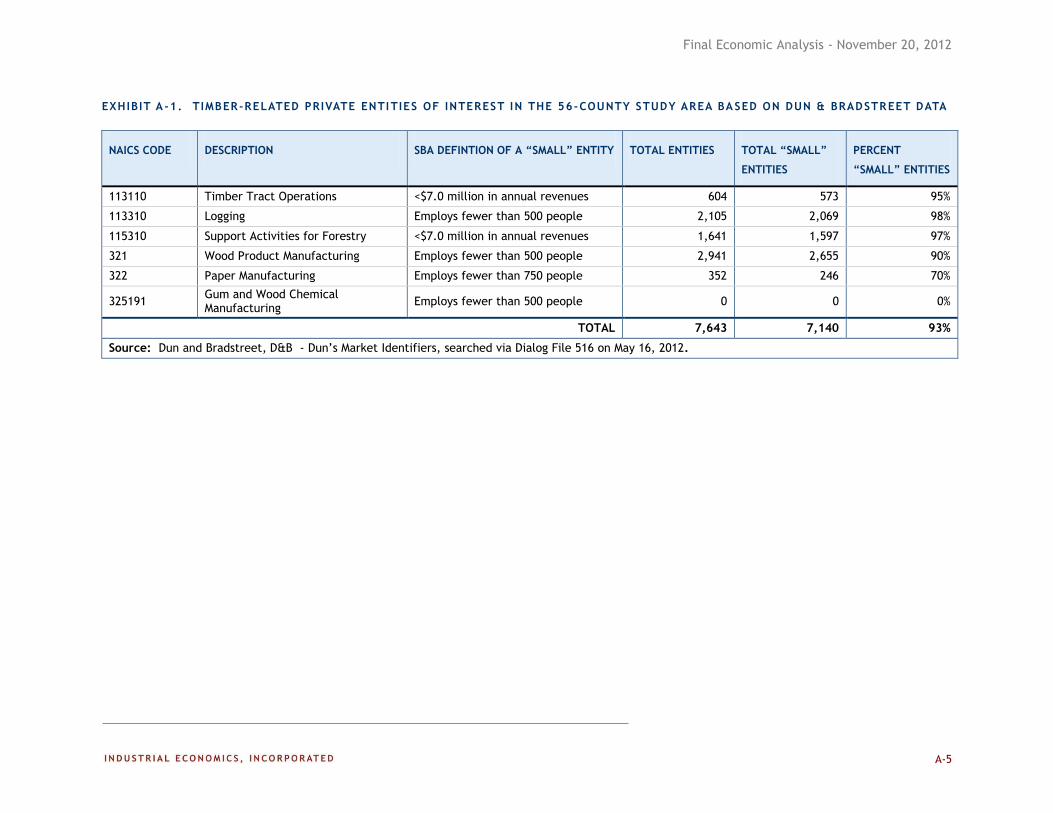
Final Economic Analysis - November 20, 2012
A-5
EXHIBIT A -1. TIMBER-RELATED PRIVATE ENTI TIES OF INTEREST IN THE 56-COUNTY STUDY AREA BASED ON DUN & BRADSTREET DATA
NAICS CODE DESCRIPTION SBA DEFINTION OF A “SMALL” ENTITY TOTAL ENTITIES TOTAL “SMALL”
ENTITIES
PERCENT
“SMALL” ENTITIES
113110 Timber Tract Operations <$7.0 million in annual revenues 604 573 95%
113310 Logging Employs fewer than 500 people 2,105 2,069 98%
115310 Support Activities for Forestry <$7.0 million in annual revenues 1,641 1,597 97%
321 Wood Product Manufacturing Employs fewer than 500 people 2,941 2,655 90%
322 Paper Manufacturing Employs fewer than 750 people 352 246 70%
325191 Gum and Wood Chemical Manufacturing
Employs fewer than 500 people 0 0 0%
TOTAL 7,643 7,140 93%
Source: Dun and Bradstreet, D&B - Dun’s Market Identifiers, searched via Dialog File 516 on May 16, 2012.
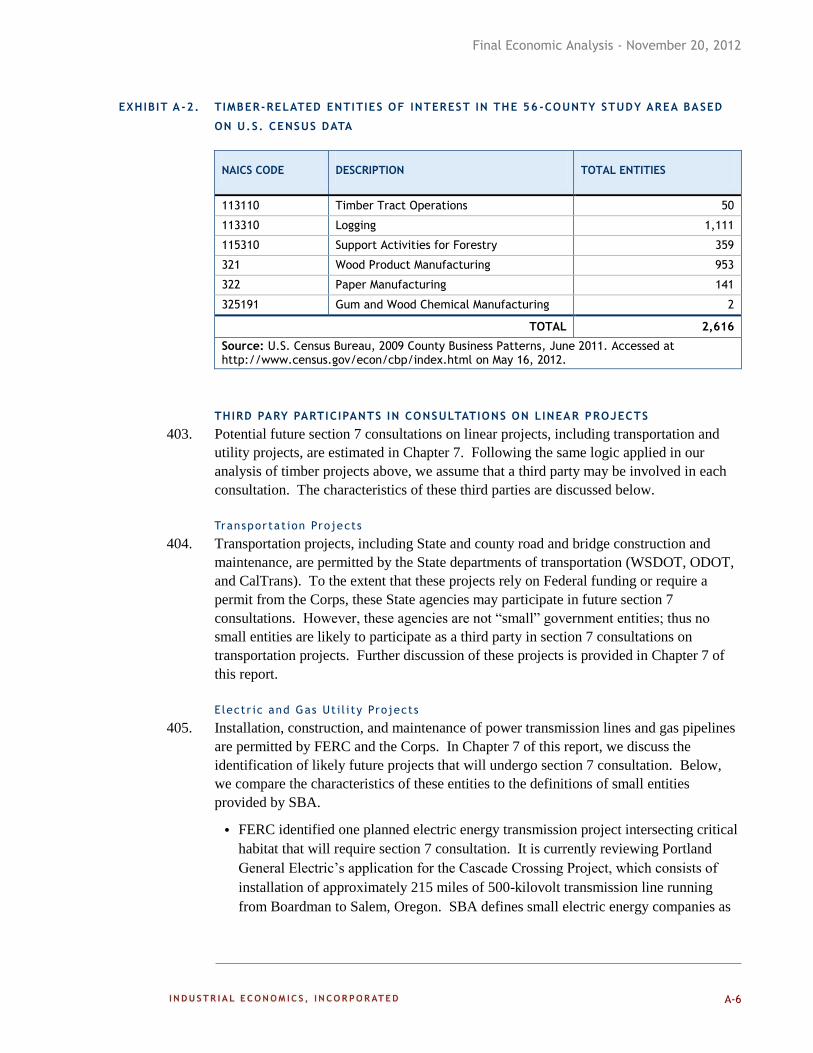
Final Economic Analysis - November 20, 2012
A-6
EXHIBIT A -2. TIMBER-RELATED ENTITIES OF INTEREST IN THE 56 -COUNTY STUDY AREA BASED
ON U.S. CENSUS DATA
NAICS CODE DESCRIPTION TOTAL ENTITIES
113110 Timber Tract Operations 50
113310 Logging 1,111
115310 Support Activities for Forestry 359
321 Wood Product Manufacturing 953
322 Paper Manufacturing 141
325191 Gum and Wood Chemical Manufacturing 2
TOTAL 2,616
Source: U.S. Census Bureau, 2009 County Business Patterns, June 2011. Accessed at http://www.census.gov/econ/cbp/index.html on May 16, 2012.
THIRD PARY PARTICIPANTS IN CONSULTATIONS ON LINEAR PROJECTS
403. Potential future section 7 consultations on linear projects, including transportation and
utility projects, are estimated in Chapter 7. Following the same logic applied in our
analysis of timber projects above, we assume that a third party may be involved in each
consultation. The characteristics of these third parties are discussed below.
Transpor tat ion Projects
404. Transportation projects, including State and county road and bridge construction and
maintenance, are permitted by the State departments of transportation (WSDOT, ODOT,
and CalTrans). To the extent that these projects rely on Federal funding or require a
permit from the Corps, these State agencies may participate in future section 7
consultations. However, these agencies are not “small” government entities; thus no
small entities are likely to participate as a third party in section 7 consultations on
transportation projects. Further discussion of these projects is provided in Chapter 7 of
this report.
Electr ic and Gas Ut i l i ty Projects
405. Installation, construction, and maintenance of power transmission lines and gas pipelines
are permitted by FERC and the Corps. In Chapter 7 of this report, we discuss the
identification of likely future projects that will undergo section 7 consultation. Below,
we compare the characteristics of these entities to the definitions of small entities
provided by SBA.
FERC identified one planned electric energy transmission project intersecting critical
habitat that will require section 7 consultation. It is currently reviewing Portland
General Electric’s application for the Cascade Crossing Project, which consists of
installation of approximately 215 miles of 500-kilovolt transmission line running
from Boardman to Salem, Oregon. SBA defines small electric energy companies as
Final Economic Analysis – November 20, 2012
A-7
having a total electric output of less than 4 million megawatt hours.297
Portland
General Electric reported annual retail energy deliveries of over 19 million megawatt
hours in 2011; thus, it is not a small entity.298
FERC also identified a gas pipeline project proposed by the Pacific Connector Gas
Pipeline, LP (Jordan Cove Project). SBA defines small companies in the business of
pipeline transportation of natural gas as having annual revenues less than 25
million.299
The Pacific Connector Gas Pipeline, LP is a subsidiary of the Williams
Companies, Inc. The company is publicly-traded with reported revenues of $7.9
billion in 2011.300
Thus, it is not a small entity.
FERC provided information related to the Palomar Gas Transmission project, which
is a partnership between NW Natural and TransCanada. Information on the number
of annual revenues each company is not readily available; however, both companies
are publicly-traded. Thus, neither is likely to be small.
FERC identified the Oregon Pipeline Company Project as one that could require
consultation. The project is proposed by Oregon LNG, which includes LNG
Development Company and Oregon Pipeline). Information about the company is not
readily available. Therefore, it is possible that Oregon LNG is a small entity.
We rely on the historical frequency at which the Corps consulted on pipeline and
transmission line maintenance projects to forecast future section 7 activity. As
described in Chapter 7, we estimate that the Corps will undertake 10 such
consultations annually. The third-party project proponents are unknown; therefore,
we conservatively assume that they are all small entities.
406. Exhibits A-3 and A-4 present the total number of electric power transmission and
distribution and gas pipeline entities in the 56 counties overlapping proposed critical
habitat based on Dun and Bradstreet and U.S. Census data, respectively. In most cases,
information on the percentage of these entities that meet SBA’s definition of small are not
available. We assume the total number of third parties that may participate in a section 7
consultation on a linear project in a single year is 11 projects, (the Oregon LNG pipeline
project plus 10 pipeline or transmission line projects permitted by the Corps). If we
assume that all of the entities listed in these exhibits are small (except for 10 pipeline
transportation companies as shown in Exhibit A-3), between five and 11 percent of small
entities in the region may be affected.
297 U.S. Small Business Administration, Table of Small Business Size Standards, NAICS 221121, March 26, 2012, as viewed at
http://www.sba.gov/sites/default/files/files/Size_Standards_Table.pdf on May 17, 2012.
298 Calculated from information provided on page 10 of Portland General Electric’s 2011 Annual Report, as viewed at
http://files.shareholder.com/downloads/POR/1878996978x0x557197/e478ffaa-8465-4317-96ba-
e243a5b51afa/PGE_Final_2011_AR.pdf on May 17, 2012.
299 U.S. Small Business Administration, Table of Small Business Size Standards, NAICS 486210, March 26, 2012, as viewed at
http://www.sba.gov/sites/default/files/files/Size_Standards_Table.pdf on May 17, 2012.
300 The Williams Companies, 2011 Annual Report, as viewed at
http://www.targetdoc.com/viewer.asp?b=630&k=rpvr6883RP&bhcp=1 on May 17, 2012.
Final Economic Analysis – November 20, 2012
A-8
407. This estimate of the percentage of affected small entities in the region may be
underestimated if a small number of the entities falling under NAICS codes 221121 and
221122 are “small entities” (i.e., the denominator in our calculation would shrink, leading
to a higher percentage of affected entities). However, the percentage of affected small
entities may also be overstated for the two reasons. First, the number of affected entities
may be less than 10 if the same entity participates in more than one section 7 consultation
in a given year. Furthermore, not all of the entities participating in section 7 consultation
are likely to be small. The magnitude of impact on small entity revenues is unknown;
however it is likely to be small as impacts are limited to minor administrative costs on the
order of a few thousand dollars.
SUMMARY
408. In conclusion, considering the two available data sources, Dun and Bradstreet and U.S.
Census, approximately 50 small entities, or between less than one percent and two
percent of small entities in our 56 county study area, may participate in section 7
consultations related to timber harvests on an annual basis. In addition, approximately 11
electricity transmission or natural gas pipeline companies may participate in section 7
consultations in a given year, representing an unknown percentage of total small entities
in the area.
409. We believe our estimates are conservative (i.e., more likely to overstate than understate
the number of affected entities) for several reasons. First, not all section 7 consultations
will involve a third party. Second, not all of the third parties will be small entities. Third,
the same entity may consult more than once in a single year. In addition, we note that we
have constrained our population of potentially affected entities to those found in counties
overlapping the proposed critical habitat, as opposed to including others found outside of
the study area but within the States of Washington, Oregon, and California. The
magnitude of the effect on these entities’ annual revenues or profits is unknown.
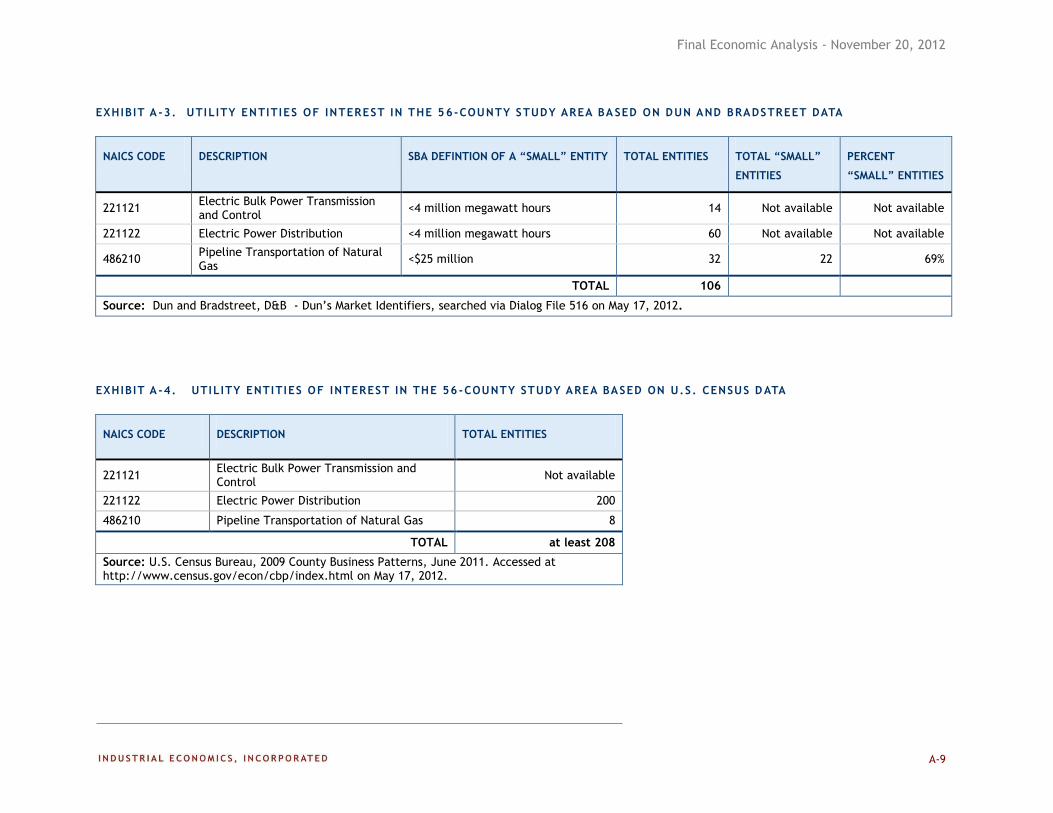
Final Economic Analysis - November 20, 2012
A-9
EXHIBIT A -3. UTILITY ENTITIES OF INTEREST IN THE 56-COUNTY STUDY AREA BA SED ON DUN AND BRADSTREET DATA
NAICS CODE DESCRIPTION SBA DEFINTION OF A “SMALL” ENTITY TOTAL ENTITIES TOTAL “SMALL”
ENTITIES
PERCENT
“SMALL” ENTITIES
221121 Electric Bulk Power Transmission and Control
<4 million megawatt hours 14 Not available Not available
221122 Electric Power Distribution <4 million megawatt hours 60 Not available Not available
486210 Pipeline Transportation of Natural Gas
<$25 million 32 22 69%
TOTAL 106
Source: Dun and Bradstreet, D&B - Dun’s Market Identifiers, searched via Dialog File 516 on May 17, 2012.
EXHIBIT A -4. UTILITY ENTITIES OF INTEREST IN THE 56 -COUNTY STUDY AREA BASED ON U.S. CENSUS DATA
NAICS CODE DESCRIPTION TOTAL ENTITIES
221121 Electric Bulk Power Transmission and Control
Not available
221122 Electric Power Distribution 200
486210 Pipeline Transportation of Natural Gas 8
TOTAL at least 208
Source: U.S. Census Bureau, 2009 County Business Patterns, June 2011. Accessed at http://www.census.gov/econ/cbp/index.html on May 17, 2012.
Final Economic Analysis – November 20, 2012
A-10
A.2 UMRA ANALYSIS
410. Title II of UMRA requires agencies to assess the effects of their regulatory actions on
State, local, and Tribal governments and the private sector.301
Under Section 202 of
UMRA, the Service must prepare a written statement, including a cost-benefit analysis,
for rules that may result in the expenditure by State, local, and Tribal governments, in the
aggregate, or by the private sector, of $100 million or more in any one year. If a written
statement is needed, Section 205 of UMRA requires the Service to identify and consider a
reasonable number of regulatory alternatives. The Service must adopt the least costly,
most cost-effective or least burdensome alternative that achieves the objectives of the
rule, unless the Secretary publishes an explanation of why that alternative was not
adopted. The provisions of Section 205 do not apply when they are inconsistent with
applicable law.
411. As stated in the Proposed Rule, “the designation of critical habitat does not impose a
legally binding duty on non-Federal Government entities or private parties. Under the
Act, the only regulatory effect is that Federal agencies must ensure that their actions do
not destroy or adversely modify critical habitat under section 7. While non-Federal
entities that receive Federal funding, assistance, or permits, or that otherwise require
approval or authorization from a Federal agency for an action, maybe indirectly impacted
by the designation of critical habitat, the legally binding duty to avoid destruction or
adverse modification of critical habitat rests squarely on the Federal agency”302
Therefore, this rule does not place an enforceable duty upon State, local, or Tribal
governments, or the private sector.
A.3 FEDERALISM IMPLICATIONS
412. Executive Order 13132, entitled “Federalism,” requires the Service to develop an
accountable process to ensure “meaningful and timely input by state and local officials in
the development of regulatory policies that have federalism implications.”303
“Policies
that have federalism implications” are defined in the Executive Order to include
regulations that have “substantial direct effects on the states, on the relationship between
the national government and the states, or on the distribution of power and
responsibilities among the various levels of government.”304
Under Executive Order
13132, the Service may not issue a regulation that has federalism implications, that
imposes substantial direct compliance costs, and that is not required by statute, unless the
Federal government provides the funds necessary to pay the direct compliance costs
301 2 U.S.C. 1531 et seq.
302 2012 Proposed Critical Habitat Rule, 77 FR 14146.
303 64 FR 43255.
304 Ibid.
Final Economic Analysis – November 20, 2012
A-11
incurred by State and local governments, or EPA consults with State and local officials
early in the process of developing the regulation.
413. This Proposed Rule does not have direct federalism implications. The designation of
critical habitat directly affects only the responsibilities of Federal agencies. As a result,
the Proposed Rule does not have substantial direct effects on the States, on the
relationship between the national government and the States, or on the distribution of
power and responsibilities among the various levels of government, as specified in the
Order.
414. State or local governments may be indirectly affected by the proposed revision if they
require Federal funds or formal approval or authorization from a Federal agency as a
prerequisite to conducting an action. In these cases, the State or local government agency
may participate in the section 7 consultation as a third party. As discussed in detail in
Chapter 4, although State timberlands have the potential to be affected by the proposed
designation, we find that none of the State lands proposed for designation are likely to
experience incremental changes in harvested volumes of timber as a result of designating
critical habitat for the NSO. This is due to a lack of Federal nexus requiring section 7
consultation on State timberlands. Therefore, the proposed revision of critical habitat is
also not expected to have substantial indirect impacts on State or local governments.
A.4 POTENTIAL IMPACTS TO THE ENERGY INDUSTRY
415. Pursuant to Executive Order No. 13211, “Actions Concerning Regulations that
Significantly Affect Energy Supply, Distribution, or Use,” issued May 18, 2001, Federal
agencies must prepare and submit a “Statement of Energy Effects” for all “significant
energy actions.” The purpose of this requirement is to ensure that all Federal agencies
“appropriately weigh and consider the effects of the Federal Government’s regulations on
the supply, distribution, and use of energy.”305
P
416. The Office of Management and Budget provides guidance for implementing this
Executive Order, outlining nine outcomes that may constitute “a significant adverse
effect” when compared with the regulatory action under consideration:
Reductions in crude oil supply in excess of 10,000 barrels per day (bbls);
Reductions in fuel production in excess of 4,000 barrels per day;
Reductions in coal production in excess of 5 million tons per year;
Reductions in natural gas production in excess of 25 million Mcf per year;
Reductions in electricity production in excess of 1 billion kilowatts-hours per year
or in excess of 500 megawatts of installed capacity;
Increases in energy use required by the regulatory action that exceed the
thresholds above;
TP
305 Memorandum For Heads of Executive Department Agencies, and Independent Regulatory Agencies, Guidance For
Implementing E.O. 13211, M-01-27, Office of Management and Budget, July 13, 2001,
http://www.whitehouse.gov/omb/memoranda/m01-27.html.
Final Economic Analysis – November 20, 2012
A-12
Increases in the cost of energy production in excess of one percent;
Increases in the cost of energy distribution in excess of one percent; or
Other similarly adverse outcomes.306
P
417. As described in Chapter 7, the proposed revised critical habitat designation for NSO is
anticipated to affect installation and maintenance of power transmission lines and other
utility pipelines. Impacts to these projects may increase the cost of energy distribution.
However, we do not anticipate incremental impacts to these projects beyond the
administrative costs of addressing the adverse modification standard in section 7
consultation. Given the small number of projects affected, the proposed designation is
not anticipated to increase the cost of energy production or distribution in the United
States in excess of one percent. Thus, none of the nine threshold levels of impact listed
above is exceeded.
306 Ibid.

Final Economic Analysis - November 20, 2012
B-1
APPENDIX B | INCREMENTAL EFFECTS MEMORANDUM FOR THE
ECONOMIC ANALYSIS OF THE PROPOSED RULE TO REVISE CRITICAL
HABITAT FOR THE NORTHERN SPOTTED OWL
May 2, 2012
B-2
Incremental Effects Memorandum for the Economic Analysis of the Proposed Rule to Revise Critical Habitat for the Northern Spotted Owl
The purpose of this memorandum is to provide information to serve as a basis for conducting an
economic analysis for the proposed revised designation of critical habitat for the northern spotted
owl (Strix occidentalis caurina) (spotted owl). Because we recently completed an economic
analysis of revised critical habitat for the spotted owl in 2008, we recognize that much of the
factual information provided in that analysis, particularly with regard to the baseline conditions,
continues to be informative for the purposes of completing the present analysis. Thus, the
information provided in this memo should not be expected to be as comprehensive in scope as
the information that would be provided for an initial designation of critical habitat. Additionally,
this document is not meant to serve as an independent evaluation of potential economic impacts;
its purpose is only to provide enough information on the probable incremental effects of this
proposed revision of critical habitat to begin the dialogue with the contracted economists as they
start to develop the draft economic analysis. This document represents only one step in this
process of coordinating with the economists. The draft economic analysis, itself, will more fully
articulate the probable economic incremental effects of the proposed revised designation of
critical habitat for the spotted owl.
Section 4(b)(2) of the Endangered Species Act (Act) requires the Secretary of Interior
(Secretary) and therefore by delegation the U.S. Fish and Wildlife Service (Service) to consider
the economic, national security, and other impacts of designating a particular area as critical
habitat. The Secretary may exclude an area from critical habitat if he determines that the
benefits of exclusion outweigh the benefits of including the area as critical habitat, unless the
exclusion will result in the extinction of the species. To comply with section 4(b)(2) of the Act
and consider the economic impacts of a proposed critical habitat designation, the Service
prepares an economic analysis that describes and monetizes, where possible, the probable
economic impacts of the proposed regulation. The data in the economic analysis are then used to
inform the balancing evaluation under section 4(b)(2) of the Act to consider any particular area
for exclusion from the final designation.
Determining the economic impacts of a critical habitat designation involves evaluating the
"without critical habitat" baseline versus the "with critical habitat" scenario, to identify those
effects expected to occur solely due to the designation of critical habitat and not from the
protections that are in place due to the species being listed under the Act. Effects of a
designation equal the difference, or increment, between these two scenarios, and include the
costs of both changes in management and increased administrative efforts that result from the
designation. These changes are often thought of as “changes in behavior” or the “incremental
effect” that would most likely result from the designation if finalized. Specific measured
differences between the baseline (without critical habitat) and the designated critical habitat
(with critical habitat) may include (but are not limited to) the economic effects stemming from
changes in land or resource use or extraction, environmental quality, or time and effort expended
on administrative and other activities by Federal landowners, Federal action agencies, and in
some instances, State and local governments or private third parties. These are the incremental
effects that serve as the basis for the economic analysis.
May 2, 2012
B-3
Although we are proposing to revise critical habitat, the existing 2008 designation is not included
in the baseline. This is a conservative approach in that it will overstate the economic effects
rather than understate them, since the economic impacts of designating revised critical habitat
where critical habitat currently exists would likely be less than designating critical habitat where
there currently is no critical habitat.
One of the primary purposes of this memorandum is to provide information on the likelihood
that activities occurring within or affecting critical habitat will be subject to restrictions above
and beyond those implemented by the baseline regulatory protections and conservation measures
that are in place directly or indirectly due to the listing of the species. There are a number of
ways that designation of critical habitat could influence activities; while no two consultations
under section 7 of the Act are exactly the same and regional differences in spotted owl habitat
exist, we’ve described the Service’s prevailing approaches to consultation and technical
assistance that may have economic effects due to the designation of critical habitat. Another
important function of this memorandum is to explain any differences between actions required to
avoid jeopardy versus actions that may be required to avoid adverse modification that may be
reflected in changes or differences in behaviors as a result of the designation. The Service is
working to update the regulatory definition of “adverse modification” since it was invalidated by
several courts, including the Ninth Circuit and the Fifth Circuit.307
At this time (without updated
regulatory language) the Service is analyzing whether destruction or adverse modification would
occur based on the statutory language of the Act itself, which requires the Service to consider
whether the agency’s action is likely “to result in the destruction or adverse modification of
habitat which is determined by the Service to be critical” to the conservation of the species. To
perform this analysis, the Service considers how a proposed action is likely to affect the
capability of the critical habitat unit or subunit to serve its conservation role in relation to that of
the entire designated critical habitat. Ultimately, however, a determination of whether an activity
may result in the adverse modification of critical habitat is based on the effects of the action to
the designated critical habitat in its entirety. The information provided below is intended to
identify the possible differences for the spotted owl under the different section 7 standards for
jeopardy to the species and adverse modification of critical habitat.
I. Background
The proposed critical habitat rule identifies the habitat we believe meets the definition of critical
habitat, i.e., areas occupied at the time of listing that contain the physical and biological features
that are essential to the conservation of the species and which may require special management
considerations or protections, and areas not occupied at the time of listing that are essential for
the conservation of the species. The initial identification of critical habitat includes
approximately 13,962,000 ac (5,649,000 ha) in 11 critical habitat units (CHUs) and 63 subunits
in the States of Washington, Oregon, and California. Ownership of the lands identified in the
proposed rule includes Federal, State, and private lands; however, the vast majority of the lands
307
Gifford Pinchot Task Force v. United States Fish and Wildlife Service, 378 F.3d 1059 (9th Cir. 2004);
Sierra Club v. U. S. Fish and Wildlife Service, 245 F.3d 434 (5th Cir. 2001).
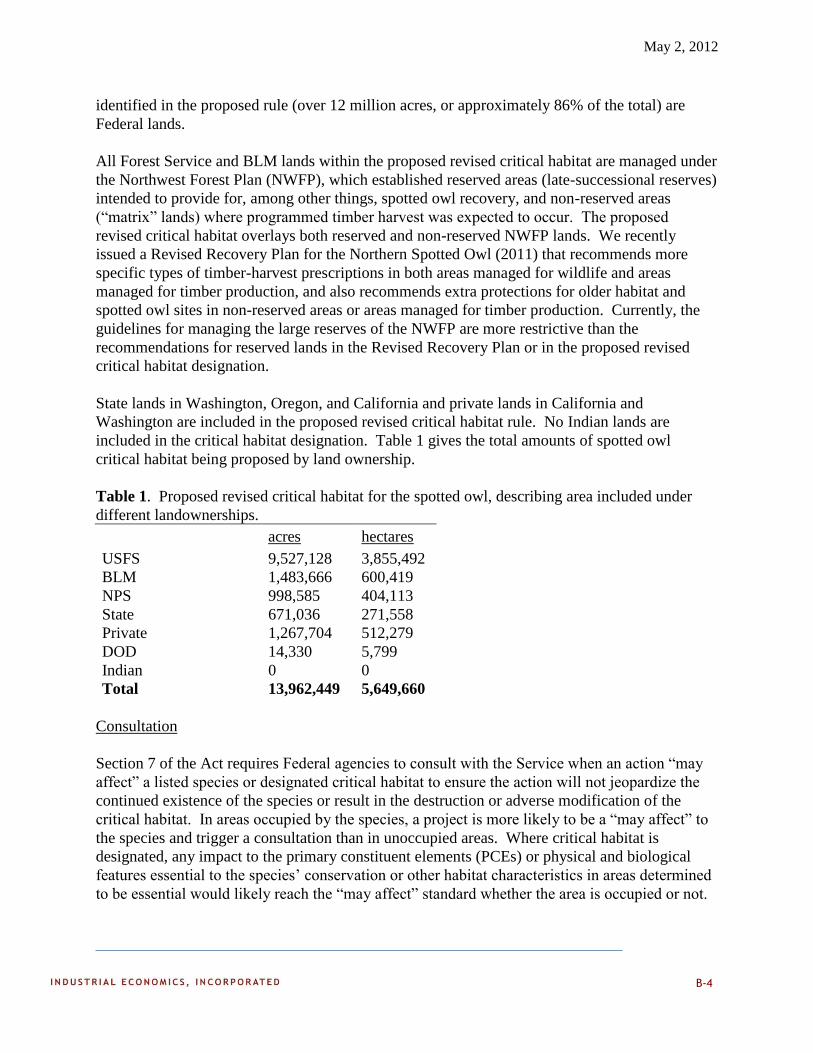
May 2, 2012
B-4
identified in the proposed rule (over 12 million acres, or approximately 86% of the total) are
Federal lands.
All Forest Service and BLM lands within the proposed revised critical habitat are managed under
the Northwest Forest Plan (NWFP), which established reserved areas (late-successional reserves)
intended to provide for, among other things, spotted owl recovery, and non-reserved areas
(“matrix” lands) where programmed timber harvest was expected to occur. The proposed
revised critical habitat overlays both reserved and non-reserved NWFP lands. We recently
issued a Revised Recovery Plan for the Northern Spotted Owl (2011) that recommends more
specific types of timber-harvest prescriptions in both areas managed for wildlife and areas
managed for timber production, and also recommends extra protections for older habitat and
spotted owl sites in non-reserved areas or areas managed for timber production. Currently, the
guidelines for managing the large reserves of the NWFP are more restrictive than the
recommendations for reserved lands in the Revised Recovery Plan or in the proposed revised
critical habitat designation.
State lands in Washington, Oregon, and California and private lands in California and
Washington are included in the proposed revised critical habitat rule. No Indian lands are
included in the critical habitat designation. Table 1 gives the total amounts of spotted owl
critical habitat being proposed by land ownership.
Table 1. Proposed revised critical habitat for the spotted owl, describing area included under
different landownerships.
acres hectares
USFS 9,527,128 3,855,492
BLM 1,483,666 600,419
NPS 998,585 404,113
State 671,036 271,558
Private 1,267,704 512,279
DOD 14,330 5,799
Indian 0 0
Total 13,962,449 5,649,660
Consultation
Section 7 of the Act requires Federal agencies to consult with the Service when an action “may
affect” a listed species or designated critical habitat to ensure the action will not jeopardize the
continued existence of the species or result in the destruction or adverse modification of the
critical habitat. In areas occupied by the species, a project is more likely to be a “may affect” to
the species and trigger a consultation than in unoccupied areas. Where critical habitat is
designated, any impact to the primary constituent elements (PCEs) or physical and biological
features essential to the species’ conservation or other habitat characteristics in areas determined
to be essential would likely reach the “may affect” standard whether the area is occupied or not.
May 2, 2012
B-5
A jeopardy analysis for the spotted owl would look at the magnitude of the proposed action’s
impacts relevant to the population(s) across the spotted owl’s range. More specifically, the
jeopardy analysis would focus on the project’s effects on the species’ reproduction, numbers, and
distribution, including impacts to: spotted owl nest sites; core areas around the nest sites; home
ranges around the nest sites; the ability of the affected landscape to support spotted owl
connectivity between populations; the effect on nesting spotted owls from noise; and the
likelihood of spotted owl interactions with barred owls.
A critical habitat adverse-modification analysis would focus on the proposed action’s impacts on
the PCEs, physical and biological features, or other habitat characteristics, and analyze the
impacts of the proposed action on the capability of the critical habitat unit to maintain its
conservation role and function for the spotted owl as part of the larger designation. Included in
this analysis would be impacts to: the ability of critical habitat to provide adequate nest sites; the
ability of critical habitat to provide adequate core areas around those nest sites; and the ability of
critical habitat to provide for spotted owl connectivity between populations. The key factor
related to evaluating potential adverse modification is whether, with implementation of the
proposed Federal action, the affected critical habitat will continue to have the capability to serve
its intended conservation role for the species. The designation of critical habitat helps ensure
that proposed project actions will not result in adverse effects that would preclude the recovery
of the species.
Due to the rarity of past determinations for section 7 consultations regarding the spotted owl
reaching the level of jeopardy or adverse modification, it is difficult for us to accurately predict
the differences between actions necessary to avoid jeopardy (reasonable and prudent alternatives
that would be part of the baseline) and actions required to avoid adverse modification
(reasonable and prudent alternatives that would be considered incremental effects since they
would be attributable solely to critical habitat). Although we do not currently have a regulatory
definition of adverse modification, we rely on the statutory definition in light of the Gifford
Pinchot ruling; this provides some guidance for distinguishing the different standards for
determining jeopardy and adverse modification. Adverse modification is aimed at preventing
significant impairment of the conservation value of critical habitat to allow for spotted owl
recovery. The Service’s jeopardy analyses for this species have also relied heavily on assessing
the effects to habitat. See Gifford Pinchot Task Force, 378 F.3d at 1065-67 (upholding use of
habitat as a proxy for the species in spotted owl jeopardy analyses). Thus, as described above,
modification of habitat can have adverse effects both on spotted owls and on spotted owl critical
habitat. As a consequence, the project modifications, conservation measures, changes in
behavior, or other commitments the Service seeks in order to minimize those habitat-based
impacts are often similar, whether we are consulting on effects to spotted owls or to critical
habitat.
Potential commitments that may be applied to avoid both jeopardy and adverse modification
include, but are not limited to: reducing the amount of habitat affected by a project; modifying a
project to reduce the impact to each acre of affected habitat (e.g., conducting a thinning instead
of a clearcut); reducing the impacts to habitat close to known spotted owl nesting areas; reducing
May 2, 2012
B-6
impacts to habitat in areas that are important for spotted owl connectivity across the landscape,
etc.
Occupancy
For the purposes of conducting a jeopardy analysis, it is important to assess whether the action
area is occupied by the listed species at the time of the consultation. The Service conducts a
jeopardy analysis if the proposed action may affect the listed species, which is more likely within
occupied habitat. The Service conducts an adverse modification analysis if an action may affect
designated critical habitat regardless of present occupancy by the listed species. This is one of
the key determinants of incremental impacts of a critical habitat designation.
All 11 of the CHUs and 63 of the 64 subunits of proposed revised critical habitat are presently
occupied by the spotted owl. The one exception is subunit NCO-3 (Joint Base Lewis-McChord
in Washington, which is composed entirely of Federal lands)—it appears to be presently entirely
unoccupied by spotted owls. Although the other 63 subunits are all occupied by the spotted owl
at the population scale, small interspersed portions within those subunits may be currently
unoccupied by the spotted owl.
While spotted owl surveys occur in all the proposed CHUs, they are not conducted evenly
throughout the range or within CHUs. When we consult on activities potentially affecting
spotted owls and their habitat, more often than not there are no current survey data to inform our
analysis. In such cases, we may rely on historical survey data, if any exists. In practice, to avoid
the cost of conducting spotted owl surveys, the consulting action agency often assumes spotted
owl habitat within a project area is occupied if the localized habitat conditions are suitable for
resident spotted owls and survey data are out of date.
Current Habitat Condition
All of the subunits contain a forested mosaic that includes a wide range of habitat quality and
includes some small interspersed portions that are either younger forest or are not currently
forested. These small interspersed portions of younger forest are typically the result of past
timber harvest or wildfire. They contain characteristics conducive to fully developing the
physical or biological features essential to the conservation of the spotted owl (they are of
suitable elevation, climate, and forest community type), but may currently be lacking some
element of the PCEs such as large trees or dense canopies that are associated with nesting
habitat.
We have determined that within the boundaries of the proposed revised critical habitat
designation those areas of younger forests are essential to the conservation of the species because
they fulfill at least one of two essential functions: population connectivity and space for
population growth. Because the primary threat to the spotted owl at the time of listing was
habitat loss and degradation, conservation and recovery of the species in some portions of its
range is dependent on development of additional habitat to allow for population expansion.
Therefore, portions of the habitat mosaic in some critical habitat subunits proposed for
May 2, 2012
B-7
designation consist of younger and/or partially-harvested forest but are essential to conservation
of the species because they are capable of developing the PCEs that support nesting, roosting, or
foraging by spotted owls that will be necessary for population expansion.
Rangewide, the proposed revised critical habitat is comprised of approximately 4.6% younger
forests that are essential to the conservation of the species, and where individual timber harvests
may occur. (For analysis purposes we used a 40-acre minimum patch size to determine such
areas, because areas smaller than 40 acres are not likely to have individual planned timber
harvests. Based on our experience, harvests in areas smaller than 40 acres would likely be
incorporated within a larger planning and consultation process). In particular, of the 63 critical
habitat subunits proposed for designation, four (NCO-5, ORC-3, WCC-1 and WCS-6) contain
proportionally greater areas of younger forests that are essential to the conservation of the
species (10.03%, 10.29%,12.58% and 10.42%, respectively) because they can develop additional
habitat necessary to support viable spotted owl populations in the future. These areas of younger
forest may or may not presently be occupied by spotted owls. These areas are important for the
purposes of distinguishing potential effects of the designation, because they represent cases
wherein section 7 consultations may not be necessary but for the designation of critical habitat.
In other words, impacts and resulting costs associated with consultation in these areas may be
solely an incremental effect of the designation.
Other Factors
Within the proposed revised critical habitat, the baseline conditions (without critical habitat) vary
by the management/ownership because of varying project types, current conservation plans or
regulatory requirements, Federal nexuses, practices occurring on these lands, and spotted owl
occupancy. These parameters determine what changes to planned activities will occur and what
type of consultation will be necessary in differing areas. As described below, the Service
anticipates that the primary incremental effects of the designation will be: (1) possible reductions
in timber volume in some limited portions of the landscape; and (2) the increased work effort to
consult (either informally or formally) on the effects of proposed actions on critical habitat,
either in addition to the action’s effects to the species where a project “may affect” spotted owls,
or because a consultation on the effects of a proposed action on the species would not otherwise
be necessary (because the project does not reach the “may affect” level).
II. Anticipated Incremental Effects
A. Federal Lands Other Than Department of Defense Lands
The majority of spotted owl consultations under section 7 of the Act occur between the Service
and the Forest Service and/or the BLM. These agencies manage approximately 19.4 and 2.7
million acres, respectively, of forest land within the range of the spotted owl. On these lands, the
vast majority of consultations on proposed projects affecting spotted owls and spotted owl
critical habitat are timber sales or timber-management projects. These consultations involve
individual projects, batched actions, or programmatic actions for an entire program of work (e.g.,
road repair, habitat restoration, or timber harvest) in a single analysis. Differing timber-sale
May 2, 2012
B-8
designs may serve different purposes, including commodity extraction (timber), habitat
restoration, hazard-tree removal, building or maintenance of roads, recreational development,
etc. Activities on Federal lands always have a Federal nexus and routinely reach the “may
affect” standard resulting in consultations considering the impacts to the spotted owl, to any
other affected listed species, and to designated critical habitat where it may be affected.
In addition, we also consult on transportation projects on State (and Federal) lands when there is
a Federal nexus (e.g., Federal Highway Administration funding). These projects routinely
remove spotted owl habitat elements in thin strips along roadways so that maintenance or
widening goals can be achieved. In some instances a relatively small block of habitat may also
be removed. We are also currently working with applicants on at least three consultations on
energy-transportation projects and their associated rights-of-way that could affect spotted owl
proposed revised critical habitat. These energy projects include one natural-gas pipeline and two
electricity-transmission power lines, all of which require the complete removal of forest structure
within their rights-of-way. The natural-gas pipeline would require an approximately 100-foot-
wide right-of-way corridor where all trees would initially be removed, but then allowed to
regrow to original forested habitat conditions over time. The electricity-transmission projects
would require an approximately 250-foot-wide right-of-way corridor where all trees would be
removed and not be allowed to regrow to original habitat conditions; these areas would remain
cleared. These rights-of-way would resemble long, narrow, clearcuts.
The incremental effects on an individual project of designating revised critical habitat will vary
depending on where on the landscape a project is located. Different land allocations and
management areas have differing baseline standards for forest management. Where more
restrictive standards apply, designating critical habitat is less likely to affect the types of projects
that would be proposed or resulting minimization measures; where more lenient standards apply,
designating critical habitat is more likely to lead to more restrictive timber-project designs and
additional administrative processes. The occupancy of spotted owls in the vicinity of a project
will also routinely affect the type of activity and type of consultation necessary, which, in turn,
influences the magnitude of the incremental effects. Where spotted owl survey data are lacking,
the BLM and Forest Service routinely assume an area is occupied in lieu of conducting costly,
multi-year surveys. Incremental effects may also be affected by the quality of habitat where the
project takes place, and whether or not habitat is considered presently occupied by spotted owls.
As stated above, approximately 4.6% of the proposed critical habitat is composed of younger
forests that are essential to the conservation of the species where individual timber harvest may
occur.
The all-or-nothing nature of the road building/maintenance projects and for energy-transportation
projects set them apart from the other projects we consult on. Their project goals require
complete forest removal, thereby precluding opportunities to request or negotiate for minimizing
the impacts to spotted owls by modifying the harvest prescriptions. Instead, in such cases we
strive to minimize impacts to spotted owls and critical habitat through early involvement in the
planning process that allows us to recommend those routes that have the least impact on spotted
owls and still meet the project’s goals. Because the impacts to spotted owl habitat are so stark,
May 2, 2012
B-9
we routinely conduct formal consultations on these projects unless they are entirely in younger
forests.
At the scale energy-transportation projects are planned, it would be highly unlikely for there to
be impacts to spotted owl critical habitat but not to spotted owls (e.g., a project limited entirely to
younger forest). Therefore, we anticipate consultations will be formal in nature, will require
effects on spotted owls to be minimized to the extent possible (thus likely minimizing impacts to
critical habitat as well), and, assuming a finding of no adverse modification, would have very
few incremental effects to the project beyond including an additional adverse-modification
analysis in the consultations.
(1) Consultations in occupied habitat
We have entered into a streamlined consultation agreement with the BLM and Forest Service
that provides for detailed discussions prior to their submission of a biological assessment for
purposes of conducting section 7 consultation under the Act. This pre-consultation process
includes discussions and negotiations on project design and how to best implement the project
while minimizing impacts to the spotted owl and its critical habitat. During this informal
consultation period, the Service and the action agency often develop project modifications that
reduce the impacts of the proposed action to the affected species and/or its designated critical
habitat. These measures may include timing restrictions on project implementation,
modifications to harvest locations based on underlying land-use allocations, modification of tree-
retention provisions near nest sites or high-quality habitat, reductions in proposed harvest
prescriptions to retain forest-stand function, etc. While not all of these measures are applicable
as provisions designed to reduce impacts to critical habitat (e.g., timing restrictions specific to
spotted owl nesting chronology), most conservation measures for the species are likely to benefit
critical habitat, too. Therefore, where consultation would already occur, critical habitat
designation would result in very little additional staff effort to the existing baseline process or
restrictions to the actual proposed action.
While reasonable and prudent alternatives could substantially change a proposed project and
affect the economic gains from a timber project, a determination that a project would result in
jeopardy or adverse modification with respect to spotted owls is an extremely rare event because:
(1) the Northwest Forest Plan (NWFP) guides the development of BLM and Forest Service
actions in a manner that considers the conservation needs of the spotted owl, and (2) the
consultation-streamlining procedures in place within the range of the spotted owl are likely to
elevate such types of actions for resolution before a formal consultation occurs. Our
consultation-streamlining process mandates that the action agency and the Service collaborate on
the effects of a proposed action prior to the submission of a biological assessment. As a
consequence, impacts that may rise to the level of jeopardy or adverse modification are unlikely
to ever be included in a biological assessment or biological opinion under this interagency effort.
May 2, 2012
B-10
Incremental Effects of Critical Habitat in Areas Managed for Late-Successional Habitat
Timber-management projects on Federal lands within the range of the spotted owl will vary in
their design depending on the land-use allocation they are in and on the management plan under
which they are administered. For example, projects located within a NWFP late-successional
reserve (LSR) will be designed to accelerate the development of older, more-complex forests for
the benefit of many late-successional species, including the spotted owl. Guidelines for
management in LSRs, whether in spotted owl habitat or in younger forest, are generally more
restrictive than our management recommendations in the Revised Recovery Plan and those
outlined in the preamble to the proposed critical habitat designation. One exception would
include timber management after a fire. The Revised Recovery Plan (Recovery Action 12 (RA
12)) recommends:
In lands where management is focused on development of spotted owl habitat, post-fire
silvicultural activities should concentrate on conserving and restoring habitat elements
that take a long time to develop (e.g., large trees, medium and large snags, downed
wood).
In the NWFP LSRs provide for salvage logging after fire events greater than 10 acres in size that
would likely be inconsistent with RA 12, identified above. Otherwise, we don’t anticipate
requesting any project modifications to proposed projects in LSRs. While we do not expect that
substantive changes to a project would be required to avoid adverse modification to critical
habitat, in LSRs that are occupied or assumed occupied by the spotted owl the critical habitat
designation will trigger an adverse modification analysis in addition to the baseline jeopardy
analysis. As referenced above, the cooperative nature of inter-agency consultations makes
jeopardy and/or adverse modification determinations for the spotted owl extremely rare. By
minimizing the impacts of proposed projects to the spotted owl and its habitat we believe it is
likely we've also minimized the impacts to the proposed critical habitat network, since many (but
not all) of the minimization actions overlap both the species and its important habitat. Therefore,
we expect the addition of an adverse modification analysis to both existing and future
consultations to be a relatively minor administrative burden of an additional 4-6 hours per
consultation between all Federal staff working on the consultation.
Transportation projects would be designed as linear clearcuts in that all vegetation would likely
be removed. Because there is little opportunity to modify these projects where we’ve made a
finding of no adverse modification (maintenance needs are site-specific and all vegetation must
be removed), there are minimal incremental effects beyond adding an additional 4-6 hours per
consultation between all Federal staff working on the consultation to include an adverse
modification analysis to the necessary consultation.
In Congressionally Reserved land allocations (e.g., National Parks and wilderness areas), there is
generally little or no timber management beyond, potentially, removal of hazard trees or fuels
reduction to protect structures and road maintenance, in addition to fire-management activities,
including “let-burn” approaches. Management guidelines for Congressionally Reserved lands
are more conservative than our recommendations for critical habitat management, so we do not
May 2, 2012
B-11
anticipate requesting any changes of proposed management as a result of a critical habitat
designation, and we would not anticipate reaching an adverse modification determination. In
parks and wilderness we are likely to consult programmatically; where we do consult, the
designation of critical habitat would likely add an adverse-modification analysis to an existing
consultation. However, we do not expect it to change an informal to a formal consultation.
Total incremental effects would likely be about 4-6 hours of staff time for both the action agency
and the Service.
Incremental Effects of Critical Habitat in Other Management Designations
Outside of LSRs, proposed timber sales may be designed to maximize timber extraction within
the NWFP guidelines, including green-tree retention, coarse-wood retention, etc. Where spotted
owl habitat would be harvested within proposed critical habitat in these land-use allocations, we
would likely request a modification to the prescriptions in an effort to retain and improve spotted
owl habitat to better meet critical habitat goals.
More recently, timber sales in all of these non-reserved areas that are occupied by spotted owls
have been generally designed following the recommendations of the Revised Recovery Plan,
which call for using ecological-forestry techniques to help create better spotted owl habitat more
quickly than if the forest was left alone while retaining existing spotted owls at their nests.
These ecological-forestry recommendations are consistent with the activities we also recommend
within critical habitat in the proposed revised rule to help develop higher-quality spotted owl
habitat. Therefore, we would not be likely to request significant changes in the project design
due to critical habitat.
In these cases, habitat-manipulating projects in areas presently occupied or assumed by the
Federal agency to be occupied would trigger formal consultation on spotted owls, and where
they overlap with the revised critical habitat, would need to include an additional adverse
modification analysis. By minimizing the impacts of proposed projects to the spotted owl and its
habitat we believe it is likely we've also minimized the impacts to the proposed critical habitat
network, since many (but not all) of the minimization actions overlap both the species and its
important habitat. Therefore, we expect the addition of an adverse modification analysis to both
existing and future consultations to be a relatively minor administrative burden of an additional
4-6 hours per consultation between all Federal staff working on the consultation.
Because there is little opportunity to modify road-maintenance or road-construction projects
during consultation (maintenance needs are site-specific and all vegetation must be removed)
where no adverse modification results, there are minimal incremental effects beyond adding an
additional 4-6 hours per consultation between all Federal staff working on the consultation to
include an adverse modification analysis to the necessary consultation.
(2) Consultations in unoccupied spotted owl habitat.
Habitat-manipulation projects within unoccupied habitat often trigger formal consultation
because of the impacts to the recovery potential of the species, dispersal, and reduced
segregation from barred owls; however, in unoccupied spotted owl habitat outside of LSRs the
May 2, 2012
B-12
designation of critical habitat may have more of an impact on the design of proposed timber
sales. The NWFP guidelines anticipated that most of the timber volume from Federal land
would come from these lands, although some provisions (e.g., downed wood and leave trees)
were included to assist species remaining after harvest. Since critical habitat is designated to
help conserve (recover) the species, the designation of critical habitat in unoccupied spotted owl
habitat may result in the Service requesting that timber sales in these areas be designed to help
retain existing habitat and speed the development of spotted owl habitat and late-successional
characteristics (including after wildland fire) instead of to maximize the extraction of timber.
These ecological-forestry techniques may include smaller pockets of tree removal to create
openings, but they would likely be significantly different than a traditional matrix timber-harvest
prescription. This would be an incremental effect of critical habitat. In addition to this possible
substantive effect of the designation, additional staff time in the timber-planning process would
be required to conduct the consultation. The amount of additional staff time would depend on
the stand type, initial prescriptions, and level of informal consultation or pre-consultation, and
therefore is difficult to quantify. However, we expect the addition of an adverse-modification
analysis to both existing and future consultations to be a relatively minor administrative burden
of an additional 4-6 hours per consultation between all Federal staff working on the consultation.
Because current spotted owl survey data are not available for large parts of the species’ range the
action agencies, in concert with the Service’s level one team members, may assume spotted owl
occupancy or make predictions about the likelihood of a project area supporting territorial
spotted owls. In an effort to analyze the incremental effects to timber harvest activities in
unoccupied spotted owl habitat we combined the known spotted owl occupancy data from 1993
– 1996 with a map of the spotted owl habitat within the proposed critical habitat layer. Using
these data we determined that within the spotted owl proposed critical habitat designation
approximately 6.5 percent of the spotted owl habitat is likely to be unoccupied by territorial
spotted owls. The modeling process we used for the proposed critical habitat designation was
designed to maximize the amount of high-quality habitat that would support nesting spotted owls
which is likely why so little presumed unoccupied habitat is included in the proposed
designation.
Because there is little opportunity to modify road-maintenance or road-construction projects
during consultation (maintenance needs are site-specific and all vegetation must be removed)
where no adverse modification results, there are minimal incremental effects beyond adding an
additional 4-6 hours per formal consultation between all Federal staff working on the
consultation to include an adverse modification analysis to the necessary consultation.
(3) Consultations in unoccupied areas of essential younger forest
Federal projects entirely in unoccupied areas that are not presently spotted owl habitat, but are
areas of younger forest essential to the conservation of the species due to their potential to
develop into suitable habitat, may not trigger any consultation if not for the designation of
critical habitat, since activities in unoccupied areas or areas that are not presently suitable
nesting, roosting, foraging, or dispersal habitat for spotted owls rarely meet the “may affect”
standard for consultation. Changes in project design could be significant in that a timber sale
May 2, 2012
B-13
could go from regeneration harvest to one more consistent with the restoration-ecology
recommendations of the Revised Recovery Plan and revised critical habitat designation. This
would be an incremental effect of critical habitat. Alternatively, if action agencies regularly
manage these unoccupied areas, whether or not they are critical habitat, by pre-commercial and
commercial thinning prescriptions, then there would be no incremental effect of the proposed
designation.
In addition, if a project included only those areas of younger forest, the baseline consultation
process may be completed by documenting the project would have no effect on listed species.
Overlaying designated critical habitat would increase the consultation workload from a “no
effect” determination to, potentially, a formal consultation that would require many hours of staff
time, and therefore would also be an incremental effect of the designation.
However, just as presently suitable habitat and areas of younger forest exist in a mosaic across
the landscape, timber-harvest projects often include a wide variety and cross section of the
habitat within a localized area or watershed. Thus, except in areas where there are large
expanses of unoccupied younger forest, it is likely that the effects of timber-harvest projects
within most such areas would be included within a larger consultation effort that would include
other areas of critical habitat as well. When included as part of a larger consultation on the
larger landscape, which would most likely be the case for relatively small areas of younger forest
within the habitat mosaic, the activities on these areas would likely be included as part of a
formal consultation that already considers the effects of the project on critical habitat and,
therefore, would add very little, if any, administrative effort to the overall consultation process.
Road-maintenance or road-construction projects could conceivably affect small parcels of
younger forest essential to the conservation of the species without affecting existing spotted owl
habitat or individual spotted owls. Depending on the severity of the impacts (adverse effects or
effects that are not likely to be adverse), the presence of spotted owl critical habitat would trigger
either a formal or informal consultation, respectively. While difficult to quantify, this could
involve many hours of staff time to complete, and therefore be an incremental effect of the
designation.
(4) Reinitiation of consultations on Federal lands
Where the Federal action agency has retained discretionary involvement or control over the
project, existing consultations on projects that may affect the proposed spotted owl critical
habitat will need to be reinitiated once critical habitat has been designated. By minimizing the
impacts of proposed projects to the spotted owl and its habitat we believe it is likely we've also
minimized the impacts to the proposed critical habitat network, since many (but not all) of the
minimization actions overlap both the species and its important habitat. Therefore, we expect the
addition of an adverse-modification analysis to both existing consultations in most cases to be a
relatively minor administrative burden of an additional 4-6 hours per consultation between all
Federal staff working on the consultation.
May 2, 2012
B-14
(5) Potential project modifications
(a) Due to the presence of the listed species. The spotted owl protections and minimization and
conservation measures triggered by the consultation process (which largely occur during the pre-
consultation phase consistent with our streamlined-consultation guidance) include such
parameters as:
Restrictions on the timing of activities to avoid disturbing spotted owls during
critical nesting periods;
Planning timber sales to avoid existing spotted owl sites;
Planning timber sales to minimize the likelihood of exacerbating barred owl and
spotted owl interactions, particularly at existing spotted owl sites;
Minimizing the impacts to existing spotted owl nesting, roosting, and foraging
habitat at the localized scale and dispersal habitat at the landscape scale (including
overall connectivity between populations); and
Following the recommendations of the Revised Recovery Plan for the Northern
Spotted Owl, including conserving known spotted owl sites, retaining older,
more-complex stands on the landscape, and following ecological-forestry
techniques when conducting timber harvest in areas important to spotted owls.
Due to the conservation mandate of critical habitat, our recommendations on
actions in critical habitat in the matrix would likely be to change the focus from
timber production to development of spotted owl habitat. Following the Revised
Recovery Plan’s RA 12 recommendation, our recommendations for post-fire
salvage management would potentially shift from extraction of timber resources
to “conserving and restoring habitat elements that take a long time to develop
(e.g., large trees, medium and large snags, downed wood).” The incremental
effects would not be dependent on the occupancy status of the stands.
The above measures may be applied in areas known or assumed to be occupied by spotted owls,
or in areas of suitable habitat whether occupied by spotted owls or not, and may result in the
action agency modifying its proposed action. Less often they may be included as mandatory
terms and conditions. Such measures are likely to be agreed to during the pre-consultation phase
of the process as outlined in our consultation-streamlining guidance. Conservation
recommendations are a standard section of our Biological Opinions and may include surveying
for spotted owls or barred owls in particular areas, testing the effects of different harvesting
techniques on habitat development, etc., but these are not mandatory and are also usually
negotiated up-front.
(b) Due to the designation of critical habitat. The conservation measures related specifically to
spotted owl critical habitat that are often raised during the consultation process include following
the recommendations of the Revised Recovery Plan for the Northern Spotted Owl by
implementing ecological-forestry techniques when conducting timber harvest in areas important
to spotted owls to more quickly develop late-successional conditions than would otherwise be
achieved if these areas were left unmanaged. We advocate following the management
recommendations for restoration management in the Revised Recovery Plan, just as we do when
consulting on projects affecting spotted owls, making these measures a subset of the process
May 2, 2012
B-15
mentioned above for spotted owls. In other words, in spotted owl habitat that is occupied,
assumed occupied, or where there are impacts that could affect the species, the conservation
measures that apply to critical habitat are consistent with those that apply to the listed species
(i.e., part of baseline effects). The only exception of a measure we’d likely seek for the sake of
spotted owl critical habitat that we would not otherwise be seeking to minimize effects to spotted
owls is to follow RA 12 in unoccupied matrix; conserve and restore habitat elements that take a
long time to develop. The designation of critical habitat is what would change our
recommendations to make these lands more “focused on the development of spotted owl
habitat,” consistent with the conservation mandate of critical habitat.
(c) Incremental effect of critical habitat. The primary scenarios for when critical habitat
conservation measures or project modifications would constitute on-the-ground incremental
effects are either in projects planned within critical habitat in unoccupied spotted owl habitat in
areas where regeneration harvest timber sales were anticipated by the NWFP or in non-LSR
undergoing post-fire salvage.
The highest potential for administrative incremental effects due to the designation of spotted owl
critical habitat is likely to be in an unoccupied, non-reserved allocation that is young forest
where an individually-planned timber harvest (not part of a larger-scale planning effort and
consultation) is likely to occur such that spotted owl-specific provisions would not be necessary.
We estimate that approximately 4.6 % of the proposed critical habitat meets this latter
description.
(6) Summary of Federal Lands
On non-DOD Federal lands, we conclude that the highest potential for on-the-ground
incremental effects due to the designation of spotted owl critical habitat is likely to be in
unoccupied spotted owl habitat (1) in areas where regeneration-harvest timber sales were
anticipated by the NWFP and (2) in post-fire salvage situations in non-LSR allocations.
We conclude that the highest potential for administrative incremental effects due to the
designation of spotted owl critical habitat is likely to be in younger forest in a non-reserved land
allocation where an individually-planned timber harvest (not part of a larger-scale planning effort
and consultation) is likely to occur. We estimate that approximately 4.6 % of the proposed
critical habitat meets this latter description. In those portions of the designation, formal
consultation may occur as a result of the designation where no consultation would be required
under the jeopardy standard. In addition, in certain circumstances, there might still have been an
informal consultation, and the effect of designation might be to require formal consultation
instead. The likelihood of either of these possibilities is reduced because (a) the designation
process will minimize the amount of young forest in the critical habitat network, and (b) many of
these activities would be included in consultations on larger scale (e.g., landscape or watershed)
projects.
May 2, 2012
B-16
B. Federal Department of Defense Lands
Currently, Joint Base Lewis-McChord is the one unoccupied subunit of proposed revised critical
habitat. The base currently does not consult on proposed actions relative to effects on the spotted
owl, but would likely need to if critical habitat were designated on the base. The Service
predicts the additional workload for Joint Base Lewis-McChord would entail two informal and
two formal consultations each year to address the effects of forest management on designated
critical habitat. Depending on the covered activities, we estimate that these consultations could
take up to 200 hours of staff time each for the Service and for the base annually. While it is
difficult to assess the impacts on these future projects since we rarely conduct consultations with
the base, this subunit primarily is expected to provide connectivity between the Olympic
Peninsula and the Washington Cascades, as well as to provide some limited demographic
support. While higher-quality habitat assists with spotted owl connectivity, we would not likely
be seeking the same amounts of nesting or roosting habitat needed to support reproducing
spotted owls as we would in subunits designed for demographic support. We have not identified
any substantive changes from the current management, which produced the current conditions on
the base, necessary to meet the conservation goal and contribution of this subunit.
The base is currently in the process of developing a new INRMP, and therefore, the Service has
not yet determined whether it qualifies for exemption under section 4(a)(3) of the Act. Since we
do not yet know whether the base will meet the exemption criteria, it is prudent to evaluate
whether the critical habitat designation would result in any incremental effects on the
installation.
C. Non-Federal Lands
(1) Effects on Private and State Land with an HCP or SHA
Private and State-managed lands within proposed critical habitat fall into two categories: (1)
lands with a Habitat Conservation Plan (HCP) or Safe Harbor Agreement (SHA), and (2) lands
without an HCP or SHA. HCPs and SHAs are incorporated into ESA section 10 permits issued
by the Service. On that basis, they would be subject to the requirements of section 7(a)(2) of the
Act. For HCPs or SHAs currently in effect that may affect spotted owl critical habitat,
reinitiation of formal intra-Service consultation may be required.
Service staff in California and Washington have reviewed the HCPs and SHAs that would be
affected by the proposed revised spotted owl critical habitat. The results of their preliminary
analysis suggest that the activities covered under these permits are not likely to result in adverse
modification of critical habitat; however, we will provide you with additional information if this
assessment changes. There are no HCPs or SHAs in Oregon that will be affected by the
proposed revised spotted owl critical habitat. Thus, we do not anticipate any incremental effects
associated with HCPs or SHAs attributable to the designation of critical habitat other than
formalizing our adverse modification analysis.
(2) Effects on Private or State Lands without an HCP or SHA
May 2, 2012
B-17
Other activities affecting spotted owl critical habitat on non-Federal lands would not be subject
to the requirements of section 7 of the Act unless a Federal nexus (permit, funding, etc.) is
involved. Absent the need for a permit under section 10 of the Act, it is anticipated that the
activities by most private timberland owners would not have any Federal nexus and, therefore,
would not be subject to the requirements of section 7 consultation. However, if take of a listed
species by a proposed non-Federal action is anticipated, an incidental-take permit issued by the
Service is required under section 10 of the Act. That permit action by the Service would be
subject to consultation under section 7 of the Act, including the prohibition of adverse
modification of critical habitat. By minimizing the impacts of proposed actions under an HCP or
SHA to the spotted owl and its habitat, we believe it is likely we will also minimize the impacts
to the proposed critical habitat network, since many (but not all) of the minimization actions
overlap both the species and its important habitat. In those cases, the critical habitat analysis
included in the internal (i.e., limited to the Service) section 7 consultation on the permit action
would involve a similar level of additional staff effort as referenced earlier in this document (i.e.,
2 to 3 hours), but would not result in any additional administrative costs to the permit applicant.
We expect that for a proposed action on private lands to result in a finding of adverse
modification (i.e., that it would likely substantially reduce the conservation value of spotted owl
critical habitat to such an extent that it would affect the ability of critical habitat to serve its
intended recovery role), it would likely have to significantly alter large areas or restrict spotted
owl connectivity through such areas. In light of our history of consultations, we believe that an
adverse-modification finding is unlikely: in over 20 years of conducting consultations on the
spotted owl, we have never had such a case. Nonetheless, should this occur, to avoid adverse
modification we would most likely recommend reducing the scale of impacts to spotted owl
habitat in the vicinity of areas important for connectivity or near population strongholds. In this
rare event, there would potentially be some cost to the landowner in terms of reduced potential
harvest.
D. Potential Future Conditions
(1) Potential for Range Contraction
The above discussion describes the current state of section 7 consultation on the effects of timber
management to spotted owls across the three-State range of the proposed revised critical habitat.
While we believe it is likely the spotted owl will persist across its range given the protections
provided by listing, as well as the conservation measures currently being implemented and those
recommended by the Revised Recovery Plan, the influence of the barred owl on the spotted owl
could conceivably cause some sort of range contraction in the future. If this were to occur in
designated spotted owl critical habitat, such that presently occupied areas were to become
unoccupied, it is possible that Federal land managers and HCP or SHA applicants may no longer
need to consult on the effects of a proposed action on spotted owls under the jeopardy standard,
but they would still be required to consult on the effects of a proposed action to spotted owl
critical habitat. This could effectively reduce the baseline against which the impact of the
designation is measured, or, put another way, could potentially increase the incremental effect of
May 2, 2012
B-18
critical habitat under such a scenario. However, the extent of any hypothetical future range
contraction, the extent of additional workload for new adverse modification analyses, and the
impact of management changes that would then be attributable solely to the designation are
speculative at this time.
In the case of an HCP or SHA on a species other than the spotted owl (because this scenario
assumes no spotted owl is present, so there would be no potential take under section 10 of the
Act, and no incidental take statement would be necessary), the consultation on that HCP or SHA
would be a formal consultation for the covered species, and adding in an analysis on spotted owl
critical habitat would not be a significant burden, although it may require more time than adding
a critical habitat analysis to a formal consultation that included spotted owl. We believe it is
extremely unlikely that any HCPs or SHAs initiated after critical habitat was designated would
result in adverse modification of spotted owl critical habitat.
Under a range-contraction scenario, on Federal lands the trigger for consultation could be more
easily met than on non-Federal lands. In the potential absence of spotted owls, we would expect
a higher administrative economic effect caused by the designation of critical habitat, since
informal and formal consultations might need to be initiated that would otherwise not be
necessary. The extent of the additional administrative burden is impossible to predict as it would
vary widely depending on the size of a hypothetical range contraction. The substantive effects
resulting from a critical habitat designation in what would be unoccupied habitat would be the
same as described above in the Federal Lands discussion. With that said, we do not anticipate
that a future range contraction is a reasonably likely scenario.
(2) Potential for Future Revision of Management Plans
(a) Forest Service. The Forest Service has begun the process of revising its Land and Resource
Management Plans (which outline the management of, usually, individual National Forests) with
the Wenatchee-Okanagan National Forests, and has plans to continue these revisions through
most of the range of the spotted owl in the coming decade or more. These revisions could
modify the current land-use allocations (e.g., change late-successional reserve to matrix), which
could greatly alter both the intended management on those specific areas and also the effect of
having designated critical habitat within those areas. It is not possible for us to predict where or
how these changes will align with the proposed revised spotted owl critical habitat, except to
assume areas of designated critical habitat will continue to be in some sort of reserve or
conservation-management status.
(b) Bureau of Land Management. In 2008, the BLM revised its resource-management plans for
western Oregon (where the large majority of its lands occur within the range of the spotted owl).
Due to legal challenges, the BLM announced on March 9, 2012 that it was initiating the revision
of their resource management plans in western Oregon. While we expect BLM to take into
account the final critical habitat designation, it would be premature to predict the how
management goals and objectives in their revision (including any potential land allocations)
would correspond to spotted owl critical habitat. Until these revisions are complete the BLM
May 2, 2012
B-19
will be managing their lands within the range of the spotted owl under the NWFP (per solicitor’s
email).
III. Conclusion
In summary, the incremental effects of designating critical habitat for the spotted owl are
determined by the effect of a proposed action on spotted owl habitat, the location of the proposed
action relative to a land-use allocation, the occupancy status, and the design of the proposed
action (see Table 1). We expect that any potential incremental effects of the critical habitat
designation would be due to: (1) an increased workload for action agencies and the Service to
conduct re-initiated consultations for ongoing actions in newly designated critical habitat (areas
proposed for designation that are not already included within the extant designation); (2)
including an analysis of the effects to critical habitat for new projects occurring in occupied areas
of designated critical habitat; and (3) potential project alterations in unoccupied critical habitat
and in post-fire salvage situations.
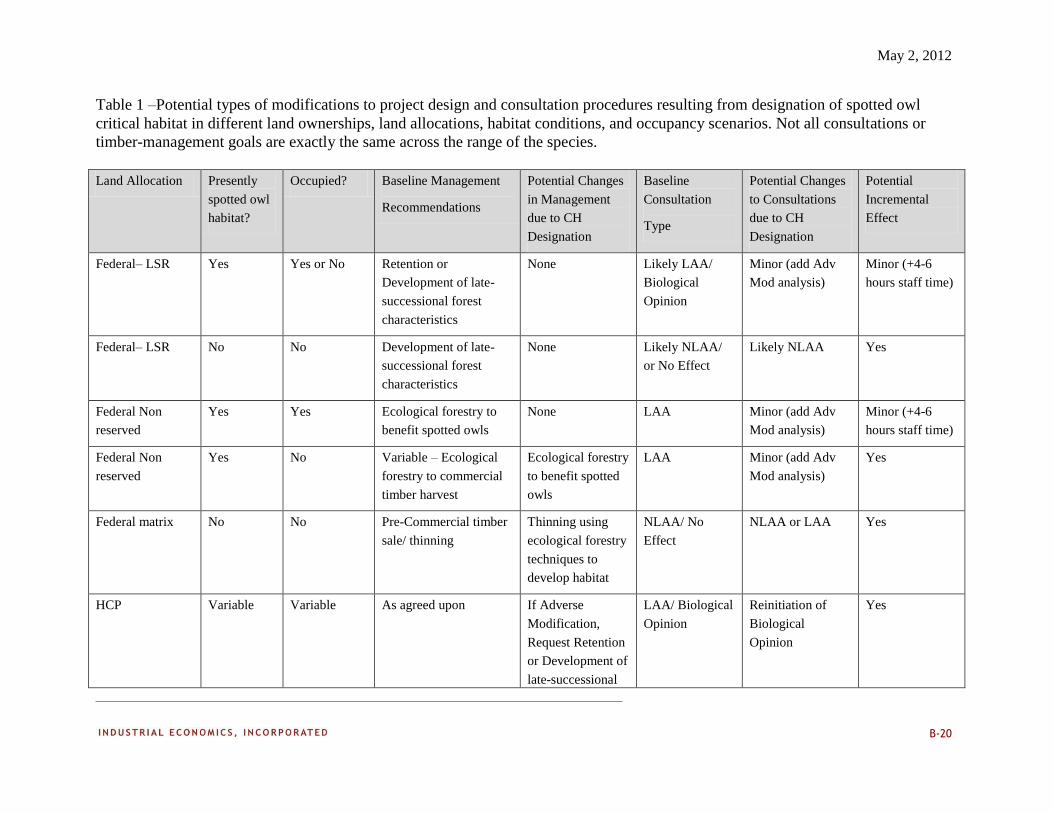
May 2, 2012
B-20
Table 1 –Potential types of modifications to project design and consultation procedures resulting from designation of spotted owl
critical habitat in different land ownerships, land allocations, habitat conditions, and occupancy scenarios. Not all consultations or
timber-management goals are exactly the same across the range of the species.
Land Allocation Presently
spotted owl
habitat?
Occupied? Baseline Management
Recommendations
Potential Changes
in Management
due to CH
Designation
Baseline
Consultation
Type
Potential Changes
to Consultations
due to CH
Designation
Potential
Incremental
Effect
Federal– LSR Yes Yes or No Retention or
Development of late-
successional forest
characteristics
None Likely LAA/
Biological
Opinion
Minor (add Adv
Mod analysis)
Minor (+4-6
hours staff time)
Federal– LSR No No Development of late-
successional forest
characteristics
None Likely NLAA/
or No Effect
Likely NLAA Yes
Federal Non
reserved
Yes Yes Ecological forestry to
benefit spotted owls
None LAA Minor (add Adv
Mod analysis)
Minor (+4-6
hours staff time)
Federal Non
reserved
Yes No Variable – Ecological
forestry to commercial
timber harvest
Ecological forestry
to benefit spotted
owls
LAA Minor (add Adv
Mod analysis)
Yes
Federal matrix No No Pre-Commercial timber
sale/ thinning
Thinning using
ecological forestry
techniques to
develop habitat
NLAA/ No
Effect
NLAA or LAA Yes
HCP Variable Variable As agreed upon If Adverse
Modification,
Request Retention
or Development of
late-successional
LAA/ Biological
Opinion
Reinitiation of
Biological
Opinion
Yes
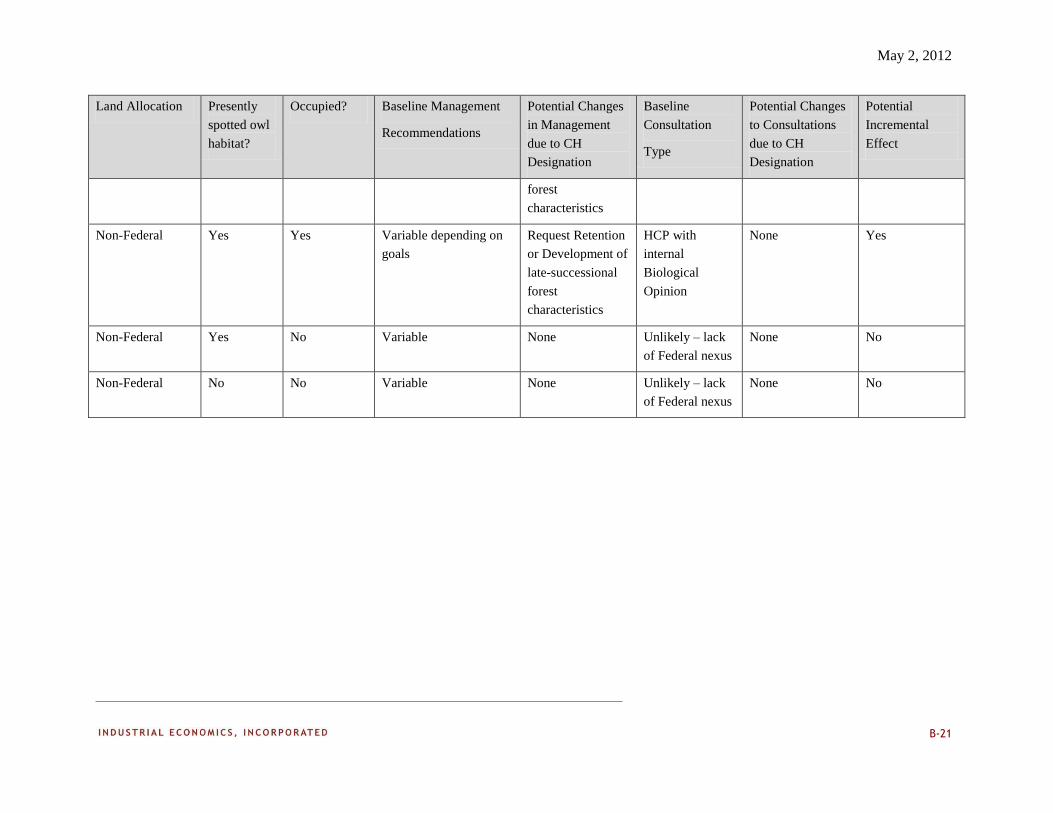
May 2, 2012
B-21
Land Allocation Presently
spotted owl
habitat?
Occupied? Baseline Management
Recommendations
Potential Changes
in Management
due to CH
Designation
Baseline
Consultation
Type
Potential Changes
to Consultations
due to CH
Designation
Potential
Incremental
Effect
forest
characteristics
Non-Federal Yes Yes Variable depending on
goals
Request Retention
or Development of
late-successional
forest
characteristics
HCP with
internal
Biological
Opinion
None Yes
Non-Federal Yes No Variable None Unlikely – lack
of Federal nexus
None No
Non-Federal No No Variable None Unlikely – lack
of Federal nexus
None No
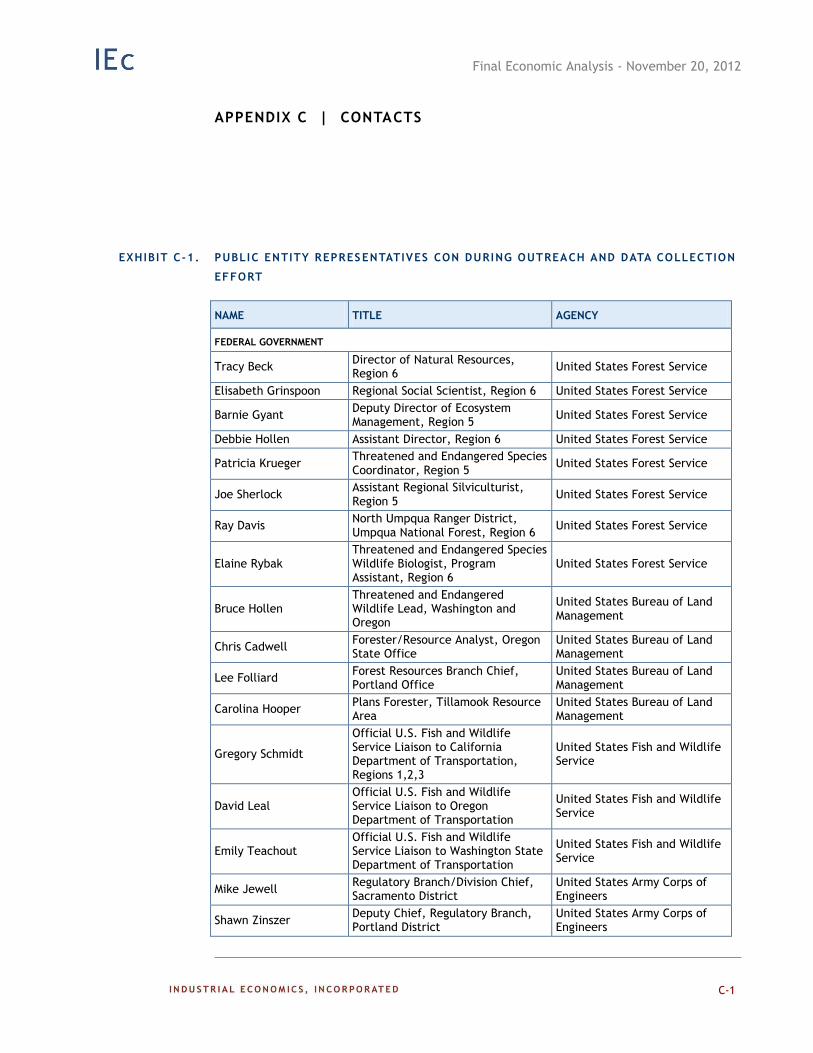
Final Economic Analysis - November 20, 2012
C-1
APPENDIX C | CONTACTS
EXHIBIT C-1. PUBLIC ENTITY REPRESENTATIVES CON DURING OUTREACH AND DATA COLLECTION
EFFORT
NAME TITLE AGENCY
FEDERAL GOVERNMENT
Tracy Beck Director of Natural Resources, Region 6
United States Forest Service
Elisabeth Grinspoon Regional Social Scientist, Region 6 United States Forest Service
Barnie Gyant Deputy Director of Ecosystem Management, Region 5
United States Forest Service
Debbie Hollen Assistant Director, Region 6 United States Forest Service
Patricia Krueger Threatened and Endangered Species Coordinator, Region 5
United States Forest Service
Joe Sherlock Assistant Regional Silviculturist, Region 5
United States Forest Service
Ray Davis North Umpqua Ranger District, Umpqua National Forest, Region 6
United States Forest Service
Elaine Rybak Threatened and Endangered Species Wildlife Biologist, Program Assistant, Region 6
United States Forest Service
Bruce Hollen Threatened and Endangered Wildlife Lead, Washington and Oregon
United States Bureau of Land Management
Chris Cadwell Forester/Resource Analyst, Oregon State Office
United States Bureau of Land Management
Lee Folliard Forest Resources Branch Chief, Portland Office
United States Bureau of Land Management
Carolina Hooper Plans Forester, Tillamook Resource Area
United States Bureau of Land Management
Gregory Schmidt
Official U.S. Fish and Wildlife Service Liaison to California Department of Transportation, Regions 1,2,3
United States Fish and Wildlife Service
David Leal Official U.S. Fish and Wildlife Service Liaison to Oregon Department of Transportation
United States Fish and Wildlife Service
Emily Teachout Official U.S. Fish and Wildlife Service Liaison to Washington State Department of Transportation
United States Fish and Wildlife Service
Mike Jewell Regulatory Branch/Division Chief, Sacramento District
United States Army Corps of Engineers
Shawn Zinszer Deputy Chief, Regulatory Branch, Portland District
United States Army Corps of Engineers
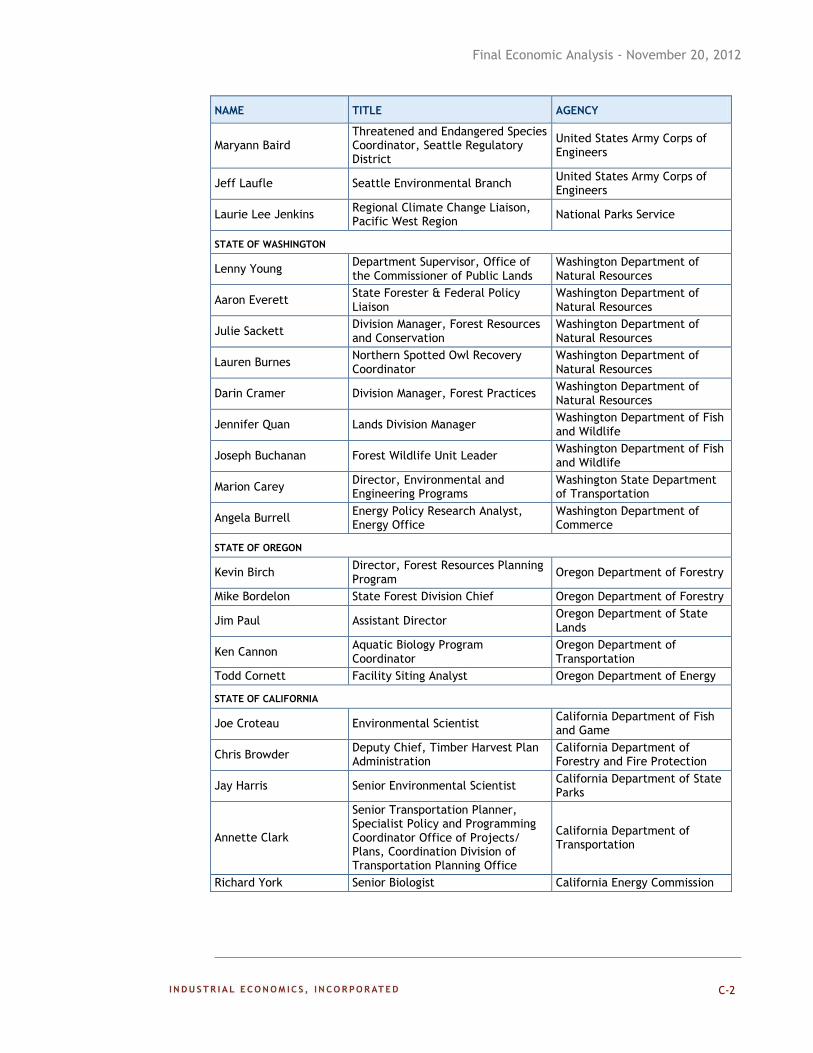
Final Economic Analysis - November 20, 2012
C-2
NAME TITLE AGENCY
Maryann Baird Threatened and Endangered Species Coordinator, Seattle Regulatory District
United States Army Corps of Engineers
Jeff Laufle Seattle Environmental Branch United States Army Corps of Engineers
Laurie Lee Jenkins Regional Climate Change Liaison, Pacific West Region
National Parks Service
STATE OF WASHINGTON
Lenny Young Department Supervisor, Office of the Commissioner of Public Lands
Washington Department of Natural Resources
Aaron Everett State Forester & Federal Policy Liaison
Washington Department of Natural Resources
Julie Sackett Division Manager, Forest Resources and Conservation
Washington Department of Natural Resources
Lauren Burnes Northern Spotted Owl Recovery Coordinator
Washington Department of Natural Resources
Darin Cramer Division Manager, Forest Practices Washington Department of Natural Resources
Jennifer Quan Lands Division Manager Washington Department of Fish and Wildlife
Joseph Buchanan Forest Wildlife Unit Leader Washington Department of Fish and Wildlife
Marion Carey Director, Environmental and Engineering Programs
Washington State Department of Transportation
Angela Burrell Energy Policy Research Analyst, Energy Office
Washington Department of Commerce
STATE OF OREGON
Kevin Birch Director, Forest Resources Planning Program
Oregon Department of Forestry
Mike Bordelon State Forest Division Chief Oregon Department of Forestry
Jim Paul Assistant Director Oregon Department of State Lands
Ken Cannon Aquatic Biology Program Coordinator
Oregon Department of Transportation
Todd Cornett Facility Siting Analyst Oregon Department of Energy
STATE OF CALIFORNIA
Joe Croteau Environmental Scientist California Department of Fish and Game
Chris Browder Deputy Chief, Timber Harvest Plan Administration
California Department of Forestry and Fire Protection
Jay Harris Senior Environmental Scientist California Department of State Parks
Annette Clark
Senior Transportation Planner, Specialist Policy and Programming Coordinator Office of Projects/ Plans, Coordination Division of Transportation Planning Office
California Department of Transportation
Richard York Senior Biologist California Energy Commission
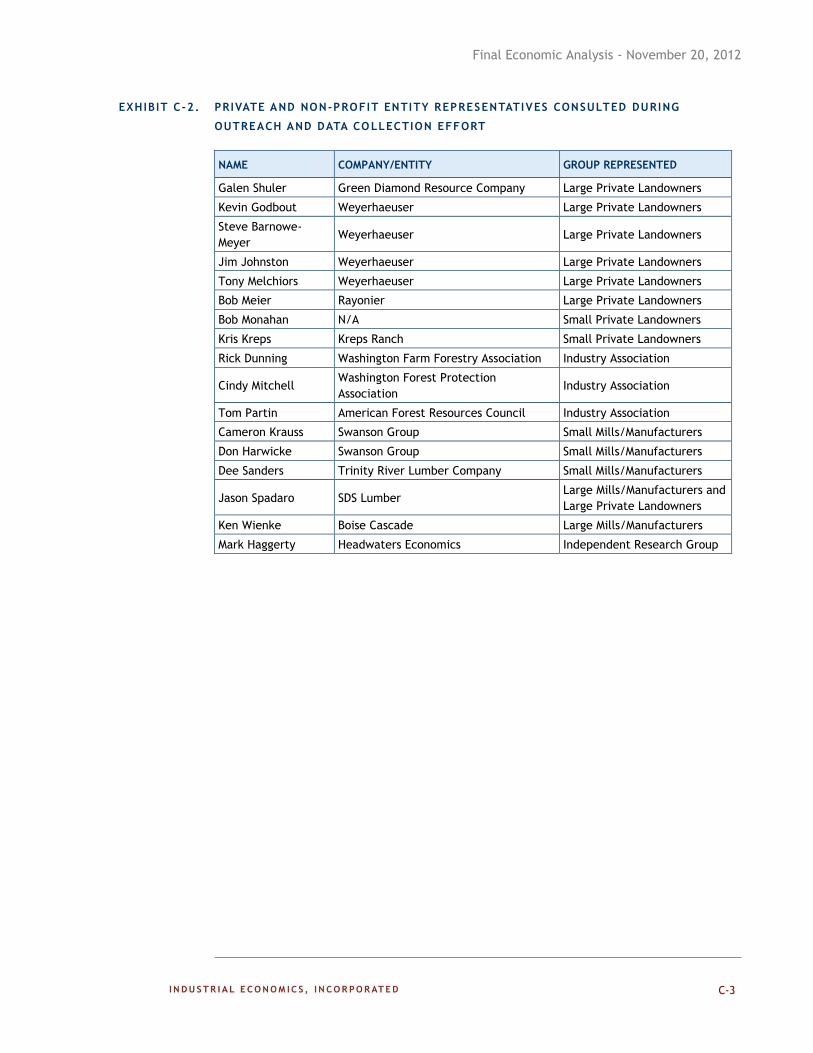
Final Economic Analysis - November 20, 2012
C-3
EXHIBIT C-2. PRIVATE AND NON-PROFIT ENTITY REPRESENTATIVES CONSULTED DURING
OUTREACH AND DATA COLLECTION EFFORT
NAME COMPANY/ENTITY GROUP REPRESENTED
Galen Shuler Green Diamond Resource Company Large Private Landowners
Kevin Godbout Weyerhaeuser Large Private Landowners
Steve Barnowe-
Meyer Weyerhaeuser Large Private Landowners
Jim Johnston Weyerhaeuser Large Private Landowners
Tony Melchiors Weyerhaeuser Large Private Landowners
Bob Meier Rayonier Large Private Landowners
Bob Monahan N/A Small Private Landowners
Kris Kreps Kreps Ranch Small Private Landowners
Rick Dunning Washington Farm Forestry Association Industry Association
Cindy Mitchell Washington Forest Protection
Association Industry Association
Tom Partin American Forest Resources Council Industry Association
Cameron Krauss Swanson Group Small Mills/Manufacturers
Don Harwicke Swanson Group Small Mills/Manufacturers
Dee Sanders Trinity River Lumber Company Small Mills/Manufacturers
Jason Spadaro SDS Lumber Large Mills/Manufacturers and
Large Private Landowners
Ken Wienke Boise Cascade Large Mills/Manufacturers
Mark Haggerty Headwaters Economics Independent Research Group
Final Economic Analysis - November 20, 2012
D-1
APPENDIX D | SENSITIVITY OF RESULTS TO DISCOUNT RATE
418. This appendix summarizes the costs of NSO critical habitat designation quantified in
Chapters 4 and 7 of this report. It presents potential incremental impacts overall and by
economic activity—including Federal timber management project modifications, Federal
timber management administrative costs, and linear project administrative costs—
assuming real discount rates of three percent and seven percent under the three alternative
scenarios described in Chapter 4.308
Then, it summarizes potential undiscounted
incremental impacts by year for each economic activity. These details are provided in
accordance with OMB guidelines for developing benefit and cost estimates. OMB directs
the analysis to: “include separate schedules of the monetized benefits and costs that show
the type and timing of benefits and costs, and express the estimates in this table in
constant, undiscounted dollars.”309
D.1 SCENARIO 1 – ADMINISTRATIVE COSTS ONLY
419. Exhibit D-1 summarizes the overall potential incremental impacts under Scenario 1
(administrative costs only). This scenario assumes minimal or no changes in Federal
timber harvest from projected levels will result from critical habitat designation. Exhibit
D-2 summarizes potential incremental administrative impacts to Federal timber harvest
management and Exhibit D-3 summarizes potential incremental administrative impacts to
linear projects. Finally, Exhibit D-4 summarizes potential undiscounted incremental
impacts by year for each economic activity.
308 A more detailed discussion of how to calculate present and annualized values, as well as the relevant discount rates, is
provided in Chapter 2 of this report. 309 Office of Management and Budget, Circular A-4, September 17, 2003, p. 18. The reference to “constant” dollars indicates
that the effects of general price level inflation (the tendency of all prices to increase over time) should be removed
through the use of an inflation adjustment index.
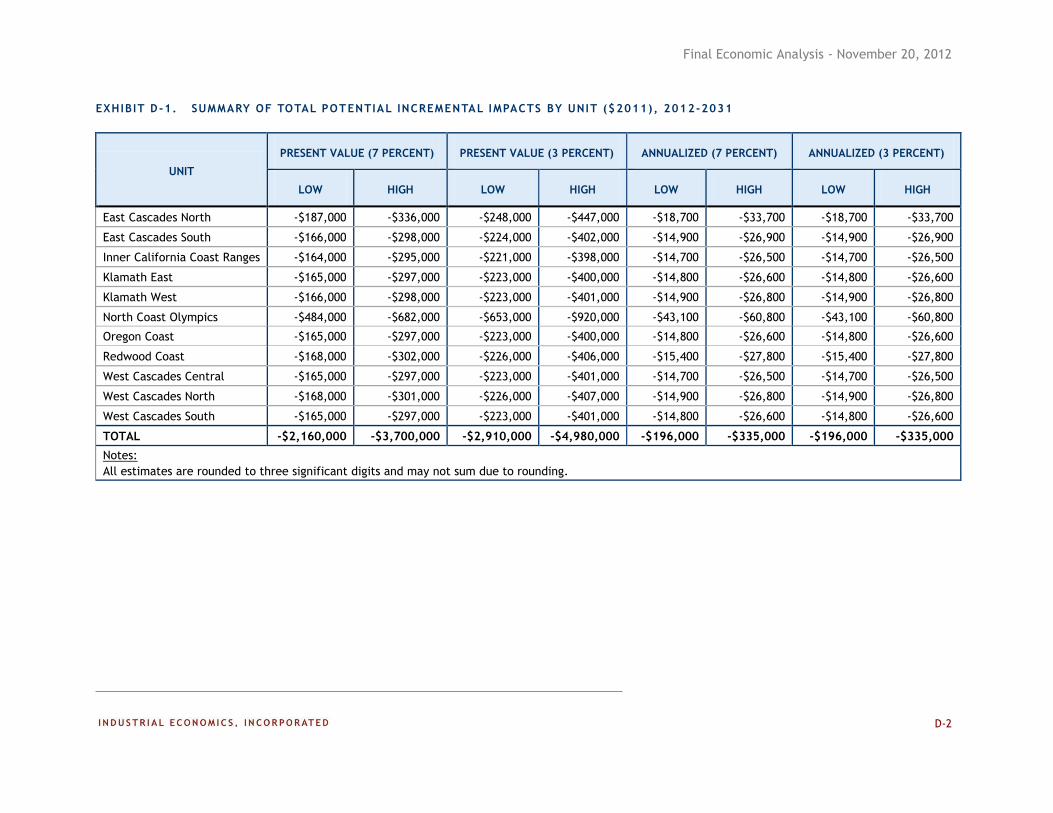
Final Economic Analysis - November 20, 2012
D-2
EXHIBIT D-1. SUMMARY OF TOTAL POTENTIAL INCREMENTAL IMPACTS BY UNIT ($2011), 2012-2031
UNIT
PRESENT VALUE (7 PERCENT) PRESENT VALUE (3 PERCENT) ANNUALIZED (7 PERCENT) ANNUALIZED (3 PERCENT)
LOW HIGH LOW HIGH LOW HIGH LOW HIGH
East Cascades North -$187,000 -$336,000 -$248,000 -$447,000 -$18,700 -$33,700 -$18,700 -$33,700
East Cascades South -$166,000 -$298,000 -$224,000 -$402,000 -$14,900 -$26,900 -$14,900 -$26,900
Inner California Coast Ranges -$164,000 -$295,000 -$221,000 -$398,000 -$14,700 -$26,500 -$14,700 -$26,500
Klamath East -$165,000 -$297,000 -$223,000 -$400,000 -$14,800 -$26,600 -$14,800 -$26,600
Klamath West -$166,000 -$298,000 -$223,000 -$401,000 -$14,900 -$26,800 -$14,900 -$26,800
North Coast Olympics -$484,000 -$682,000 -$653,000 -$920,000 -$43,100 -$60,800 -$43,100 -$60,800
Oregon Coast -$165,000 -$297,000 -$223,000 -$400,000 -$14,800 -$26,600 -$14,800 -$26,600
Redwood Coast -$168,000 -$302,000 -$226,000 -$406,000 -$15,400 -$27,800 -$15,400 -$27,800
West Cascades Central -$165,000 -$297,000 -$223,000 -$401,000 -$14,700 -$26,500 -$14,700 -$26,500
West Cascades North -$168,000 -$301,000 -$226,000 -$407,000 -$14,900 -$26,800 -$14,900 -$26,800
West Cascades South -$165,000 -$297,000 -$223,000 -$401,000 -$14,800 -$26,600 -$14,800 -$26,600
TOTAL -$2,160,000 -$3,700,000 -$2,910,000 -$4,980,000 -$196,000 -$335,000 -$196,000 -$335,000
Notes:
All estimates are rounded to three significant digits and may not sum due to rounding.
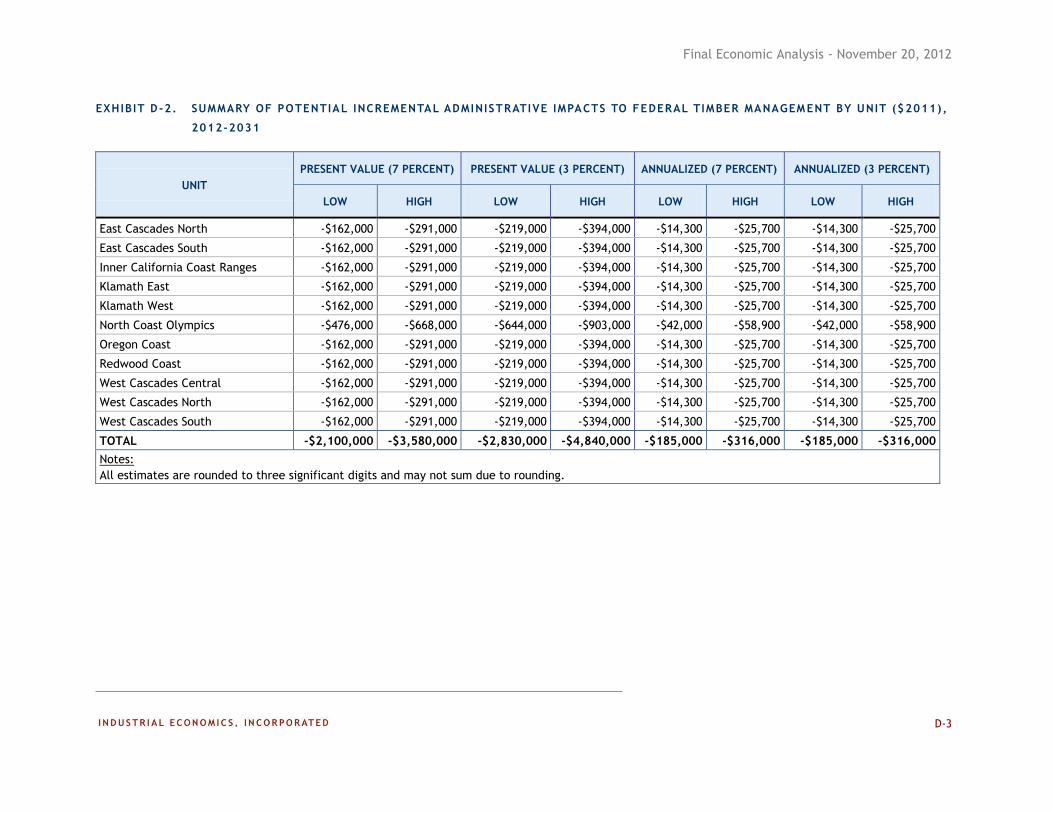
Final Economic Analysis - November 20, 2012
D-3
EXHIBIT D-2. SUMMARY OF POTENTIAL INCREMENTAL ADMINISTRATIVE IMPACTS TO FEDERAL TIMBER MANAGEM ENT BY UNIT ($2011),
2012-2031
UNIT
PRESENT VALUE (7 PERCENT) PRESENT VALUE (3 PERCENT) ANNUALIZED (7 PERCENT) ANNUALIZED (3 PERCENT)
LOW HIGH LOW HIGH LOW HIGH LOW HIGH
East Cascades North -$162,000 -$291,000 -$219,000 -$394,000 -$14,300 -$25,700 -$14,300 -$25,700
East Cascades South -$162,000 -$291,000 -$219,000 -$394,000 -$14,300 -$25,700 -$14,300 -$25,700
Inner California Coast Ranges -$162,000 -$291,000 -$219,000 -$394,000 -$14,300 -$25,700 -$14,300 -$25,700
Klamath East -$162,000 -$291,000 -$219,000 -$394,000 -$14,300 -$25,700 -$14,300 -$25,700
Klamath West -$162,000 -$291,000 -$219,000 -$394,000 -$14,300 -$25,700 -$14,300 -$25,700
North Coast Olympics -$476,000 -$668,000 -$644,000 -$903,000 -$42,000 -$58,900 -$42,000 -$58,900
Oregon Coast -$162,000 -$291,000 -$219,000 -$394,000 -$14,300 -$25,700 -$14,300 -$25,700
Redwood Coast -$162,000 -$291,000 -$219,000 -$394,000 -$14,300 -$25,700 -$14,300 -$25,700
West Cascades Central -$162,000 -$291,000 -$219,000 -$394,000 -$14,300 -$25,700 -$14,300 -$25,700
West Cascades North -$162,000 -$291,000 -$219,000 -$394,000 -$14,300 -$25,700 -$14,300 -$25,700
West Cascades South -$162,000 -$291,000 -$219,000 -$394,000 -$14,300 -$25,700 -$14,300 -$25,700
TOTAL -$2,100,000 -$3,580,000 -$2,830,000 -$4,840,000 -$185,000 -$316,000 -$185,000 -$316,000
Notes:
All estimates are rounded to three significant digits and may not sum due to rounding.
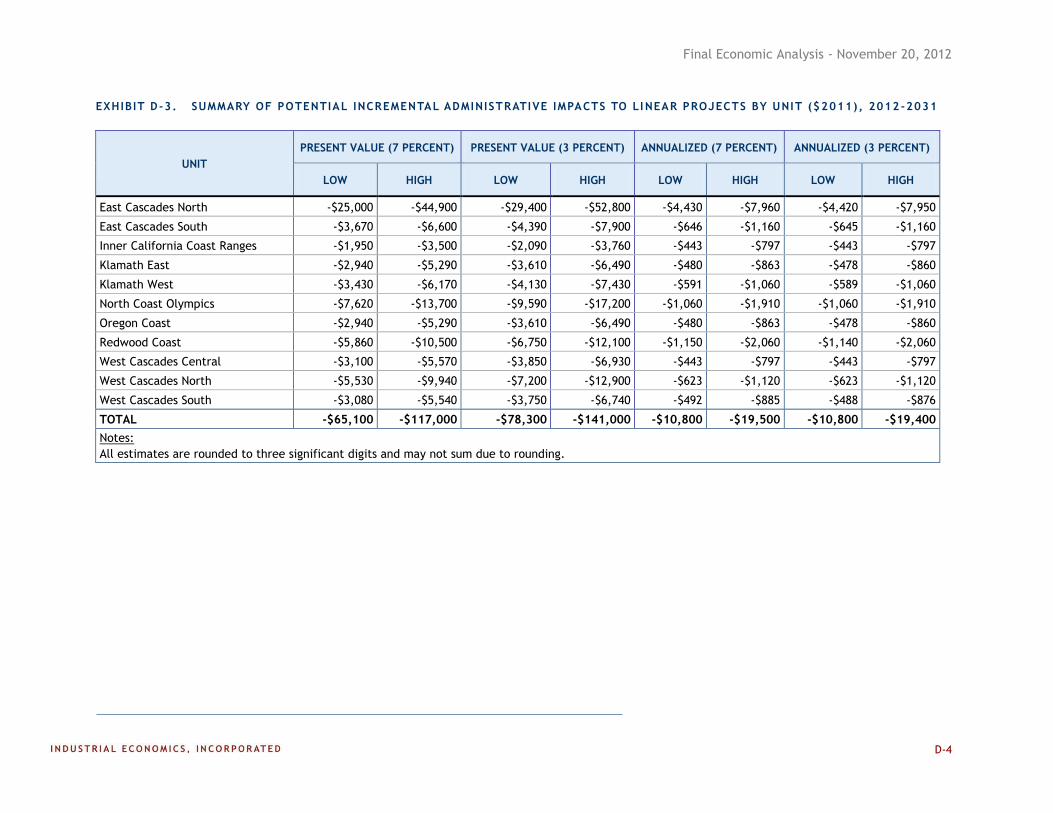
Final Economic Analysis - November 20, 2012
D-4
EXHIBIT D-3. SUMMARY OF POTENTIAL INCREMENTAL ADMINISTRATIVE IMPACTS TO LI NEAR PROJECTS BY UNIT ($2011), 2012-2031
UNIT
PRESENT VALUE (7 PERCENT) PRESENT VALUE (3 PERCENT) ANNUALIZED (7 PERCENT) ANNUALIZED (3 PERCENT)
LOW HIGH LOW HIGH LOW HIGH LOW HIGH
East Cascades North -$25,000 -$44,900 -$29,400 -$52,800 -$4,430 -$7,960 -$4,420 -$7,950
East Cascades South -$3,670 -$6,600 -$4,390 -$7,900 -$646 -$1,160 -$645 -$1,160
Inner California Coast Ranges -$1,950 -$3,500 -$2,090 -$3,760 -$443 -$797 -$443 -$797
Klamath East -$2,940 -$5,290 -$3,610 -$6,490 -$480 -$863 -$478 -$860
Klamath West -$3,430 -$6,170 -$4,130 -$7,430 -$591 -$1,060 -$589 -$1,060
North Coast Olympics -$7,620 -$13,700 -$9,590 -$17,200 -$1,060 -$1,910 -$1,060 -$1,910
Oregon Coast -$2,940 -$5,290 -$3,610 -$6,490 -$480 -$863 -$478 -$860
Redwood Coast -$5,860 -$10,500 -$6,750 -$12,100 -$1,150 -$2,060 -$1,140 -$2,060
West Cascades Central -$3,100 -$5,570 -$3,850 -$6,930 -$443 -$797 -$443 -$797
West Cascades North -$5,530 -$9,940 -$7,200 -$12,900 -$623 -$1,120 -$623 -$1,120
West Cascades South -$3,080 -$5,540 -$3,750 -$6,740 -$492 -$885 -$488 -$876
TOTAL -$65,100 -$117,000 -$78,300 -$141,000 -$10,800 -$19,500 -$10,800 -$19,400
Notes:
All estimates are rounded to three significant digits and may not sum due to rounding.
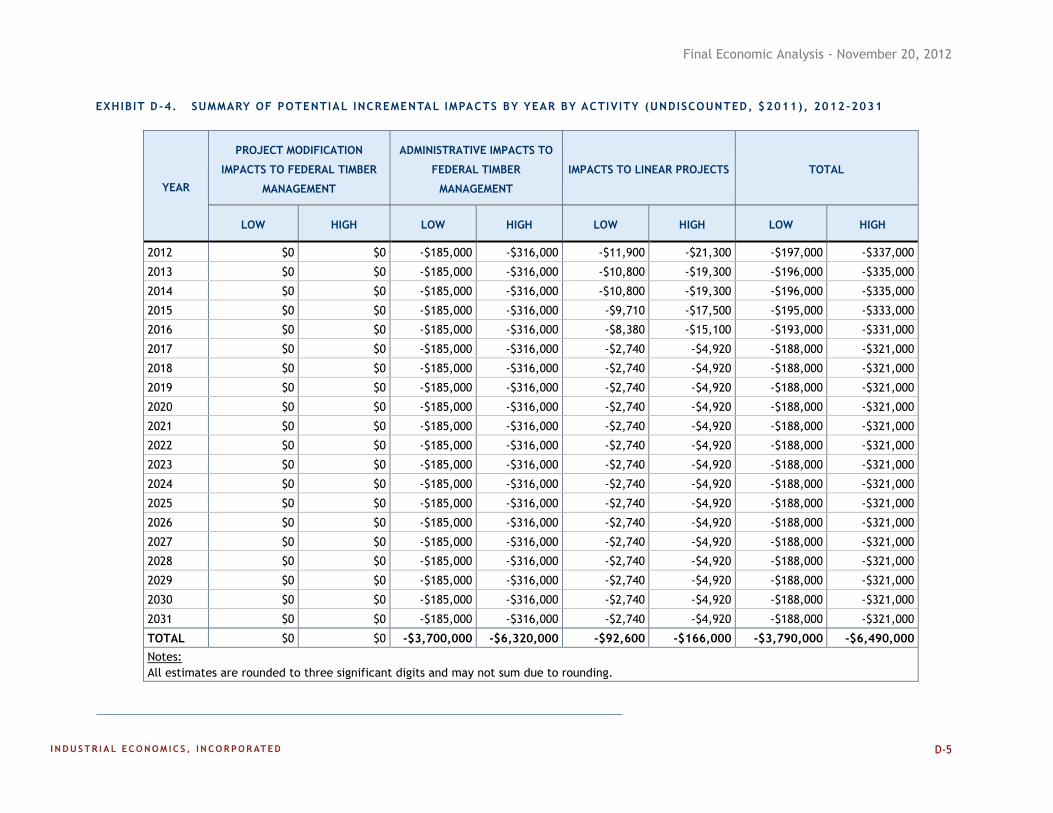
Final Economic Analysis - November 20, 2012
D-5
EXHIBIT D-4. SUMMARY OF POTENTIAL INCREMENTAL IMPACTS BY YEAR BY ACTIVITY (UNDISCOUNTED, $2011), 2012-2031
YEAR
PROJECT MODIFICATION
IMPACTS TO FEDERAL TIMBER
MANAGEMENT
ADMINISTRATIVE IMPACTS TO
FEDERAL TIMBER
MANAGEMENT
IMPACTS TO LINEAR PROJECTS TOTAL
LOW HIGH LOW HIGH LOW HIGH LOW HIGH
2012 $0 $0 -$185,000 -$316,000 -$11,900 -$21,300 -$197,000 -$337,000
2013 $0 $0 -$185,000 -$316,000 -$10,800 -$19,300 -$196,000 -$335,000
2014 $0 $0 -$185,000 -$316,000 -$10,800 -$19,300 -$196,000 -$335,000
2015 $0 $0 -$185,000 -$316,000 -$9,710 -$17,500 -$195,000 -$333,000
2016 $0 $0 -$185,000 -$316,000 -$8,380 -$15,100 -$193,000 -$331,000
2017 $0 $0 -$185,000 -$316,000 -$2,740 -$4,920 -$188,000 -$321,000
2018 $0 $0 -$185,000 -$316,000 -$2,740 -$4,920 -$188,000 -$321,000
2019 $0 $0 -$185,000 -$316,000 -$2,740 -$4,920 -$188,000 -$321,000
2020 $0 $0 -$185,000 -$316,000 -$2,740 -$4,920 -$188,000 -$321,000
2021 $0 $0 -$185,000 -$316,000 -$2,740 -$4,920 -$188,000 -$321,000
2022 $0 $0 -$185,000 -$316,000 -$2,740 -$4,920 -$188,000 -$321,000
2023 $0 $0 -$185,000 -$316,000 -$2,740 -$4,920 -$188,000 -$321,000
2024 $0 $0 -$185,000 -$316,000 -$2,740 -$4,920 -$188,000 -$321,000
2025 $0 $0 -$185,000 -$316,000 -$2,740 -$4,920 -$188,000 -$321,000
2026 $0 $0 -$185,000 -$316,000 -$2,740 -$4,920 -$188,000 -$321,000
2027 $0 $0 -$185,000 -$316,000 -$2,740 -$4,920 -$188,000 -$321,000
2028 $0 $0 -$185,000 -$316,000 -$2,740 -$4,920 -$188,000 -$321,000
2029 $0 $0 -$185,000 -$316,000 -$2,740 -$4,920 -$188,000 -$321,000
2030 $0 $0 -$185,000 -$316,000 -$2,740 -$4,920 -$188,000 -$321,000
2031 $0 $0 -$185,000 -$316,000 -$2,740 -$4,920 -$188,000 -$321,000
TOTAL $0 $0 -$3,700,000 -$6,320,000 -$92,600 -$166,000 -$3,790,000 -$6,490,000
Notes:
All estimates are rounded to three significant digits and may not sum due to rounding.
Final Economic Analysis - November 20, 2012
D-6
D.2 SCENARIO 2 – POSITIVE ECONOMIC IMPACT
420. Exhibit D-5 summarizes the overall potential incremental impacts under Scenario 2
(positive economic impact). This scenario contemplates an increase in Federal timber
harvest from projected levels due to critical habitat designation. Exhibit D-6 summarizes
potential incremental project modification impacts to Federal timber management. The
potential incremental administrative costs are identical to those described above, under
Scenario 1. Finally, Exhibit D-7 summarizes potential undiscounted incremental impacts
by year for each economic activity.
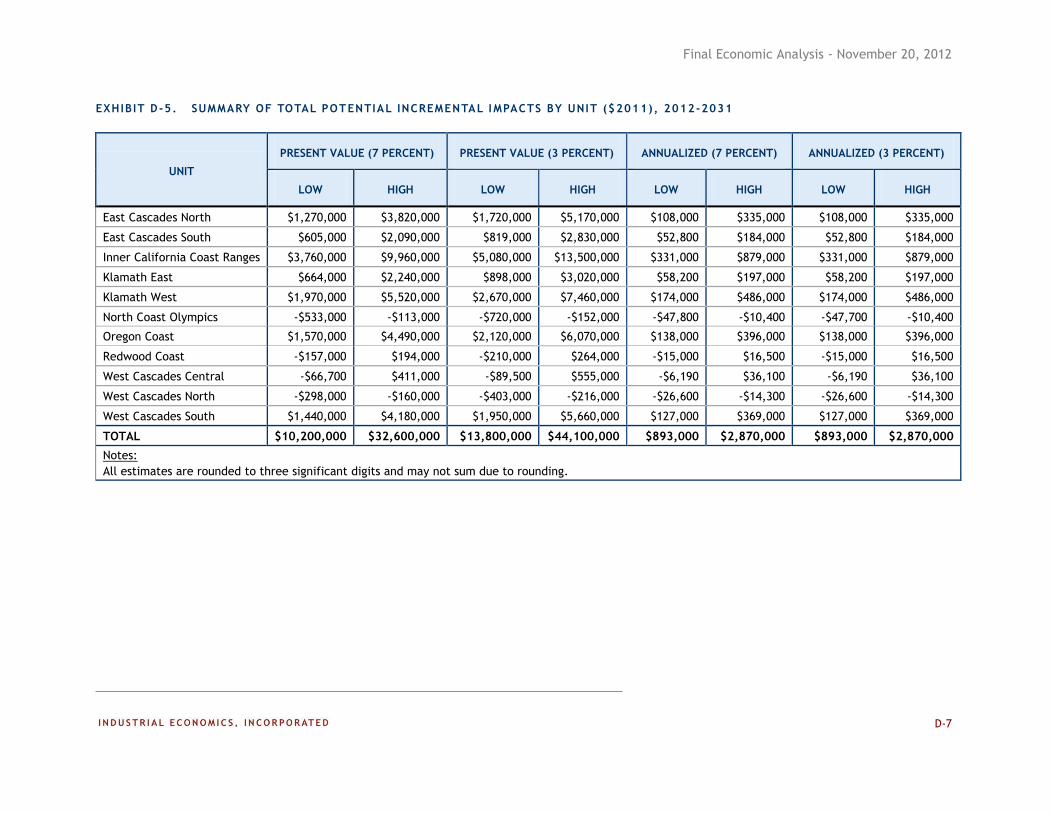
Final Economic Analysis - November 20, 2012
D-7
EXHIBIT D-5. SUMMARY OF TOTAL POTENTIAL INCREMENTAL IMPACTS BY UNIT ($2011), 2012-2031
UNIT
PRESENT VALUE (7 PERCENT) PRESENT VALUE (3 PERCENT) ANNUALIZED (7 PERCENT) ANNUALIZED (3 PERCENT)
LOW HIGH LOW HIGH LOW HIGH LOW HIGH
East Cascades North $1,270,000 $3,820,000 $1,720,000 $5,170,000 $108,000 $335,000 $108,000 $335,000
East Cascades South $605,000 $2,090,000 $819,000 $2,830,000 $52,800 $184,000 $52,800 $184,000
Inner California Coast Ranges $3,760,000 $9,960,000 $5,080,000 $13,500,000 $331,000 $879,000 $331,000 $879,000
Klamath East $664,000 $2,240,000 $898,000 $3,020,000 $58,200 $197,000 $58,200 $197,000
Klamath West $1,970,000 $5,520,000 $2,670,000 $7,460,000 $174,000 $486,000 $174,000 $486,000
North Coast Olympics -$533,000 -$113,000 -$720,000 -$152,000 -$47,800 -$10,400 -$47,700 -$10,400
Oregon Coast $1,570,000 $4,490,000 $2,120,000 $6,070,000 $138,000 $396,000 $138,000 $396,000
Redwood Coast -$157,000 $194,000 -$210,000 $264,000 -$15,000 $16,500 -$15,000 $16,500
West Cascades Central -$66,700 $411,000 -$89,500 $555,000 -$6,190 $36,100 -$6,190 $36,100
West Cascades North -$298,000 -$160,000 -$403,000 -$216,000 -$26,600 -$14,300 -$26,600 -$14,300
West Cascades South $1,440,000 $4,180,000 $1,950,000 $5,660,000 $127,000 $369,000 $127,000 $369,000
TOTAL $10,200,000 $32,600,000 $13,800,000 $44,100,000 $893,000 $2,870,000 $893,000 $2,870,000
Notes:
All estimates are rounded to three significant digits and may not sum due to rounding.
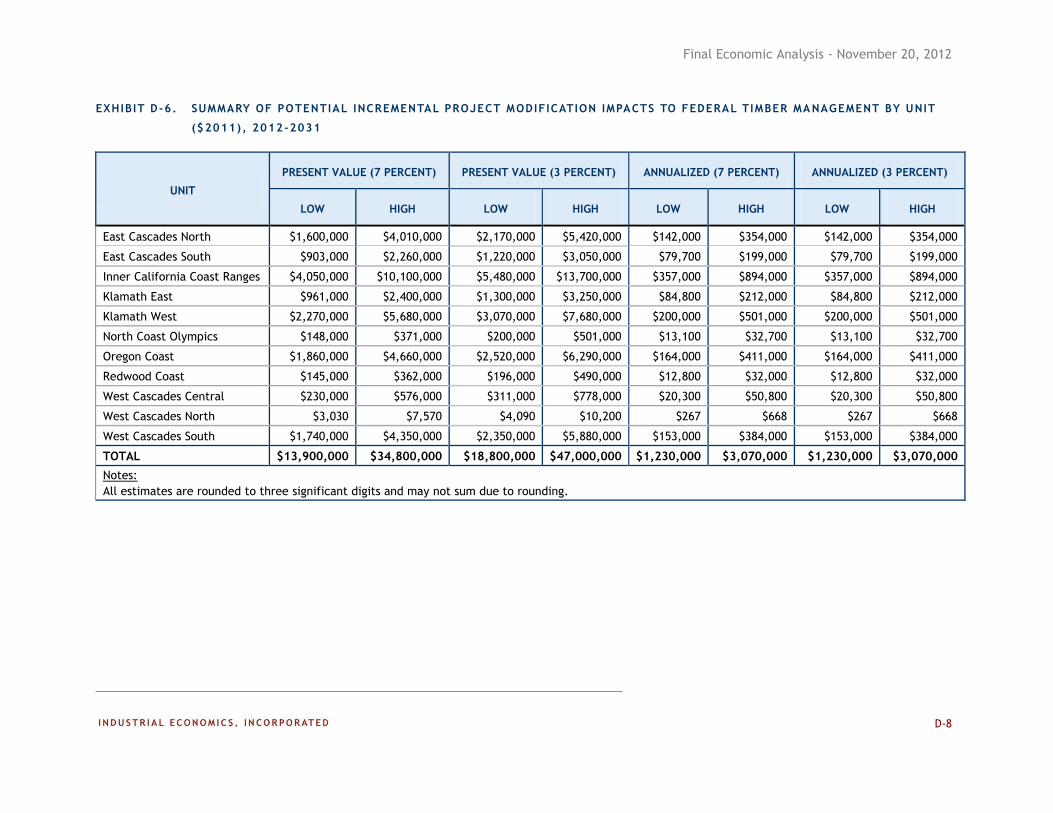
Final Economic Analysis - November 20, 2012
D-8
EXHIBIT D-6. SUMMARY OF POTENTIAL INCREMENTAL PROJECT MODIFICATION IMPACTS TO FEDERAL TIMBER MA NAGEMENT BY UNIT
($2011), 2012-2031
UNIT
PRESENT VALUE (7 PERCENT) PRESENT VALUE (3 PERCENT) ANNUALIZED (7 PERCENT) ANNUALIZED (3 PERCENT)
LOW HIGH LOW HIGH LOW HIGH LOW HIGH
East Cascades North $1,600,000 $4,010,000 $2,170,000 $5,420,000 $142,000 $354,000 $142,000 $354,000
East Cascades South $903,000 $2,260,000 $1,220,000 $3,050,000 $79,700 $199,000 $79,700 $199,000
Inner California Coast Ranges $4,050,000 $10,100,000 $5,480,000 $13,700,000 $357,000 $894,000 $357,000 $894,000
Klamath East $961,000 $2,400,000 $1,300,000 $3,250,000 $84,800 $212,000 $84,800 $212,000
Klamath West $2,270,000 $5,680,000 $3,070,000 $7,680,000 $200,000 $501,000 $200,000 $501,000
North Coast Olympics $148,000 $371,000 $200,000 $501,000 $13,100 $32,700 $13,100 $32,700
Oregon Coast $1,860,000 $4,660,000 $2,520,000 $6,290,000 $164,000 $411,000 $164,000 $411,000
Redwood Coast $145,000 $362,000 $196,000 $490,000 $12,800 $32,000 $12,800 $32,000
West Cascades Central $230,000 $576,000 $311,000 $778,000 $20,300 $50,800 $20,300 $50,800
West Cascades North $3,030 $7,570 $4,090 $10,200 $267 $668 $267 $668
West Cascades South $1,740,000 $4,350,000 $2,350,000 $5,880,000 $153,000 $384,000 $153,000 $384,000
TOTAL $13,900,000 $34,800,000 $18,800,000 $47,000,000 $1,230,000 $3,070,000 $1,230,000 $3,070,000
Notes:
All estimates are rounded to three significant digits and may not sum due to rounding.
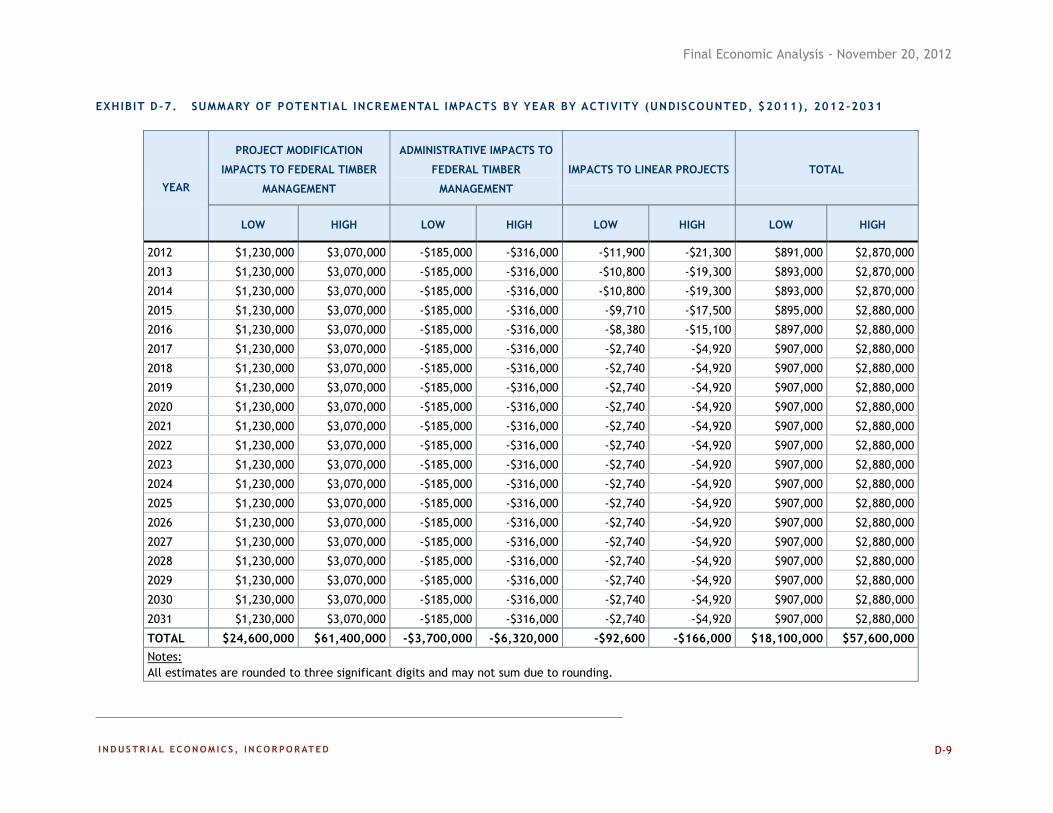
Final Economic Analysis - November 20, 2012
D-9
EXHIBIT D-7. SUMMARY OF POTENTIAL INCREMENTAL IMPACTS BY YEAR BY ACTIVITY (UNDISCOUNTED, $2011), 2012-2031
YEAR
PROJECT MODIFICATION
IMPACTS TO FEDERAL TIMBER
MANAGEMENT
ADMINISTRATIVE IMPACTS TO
FEDERAL TIMBER
MANAGEMENT
IMPACTS TO LINEAR PROJECTS TOTAL
LOW HIGH LOW HIGH LOW HIGH LOW HIGH
2012 $1,230,000 $3,070,000 -$185,000 -$316,000 -$11,900 -$21,300 $891,000 $2,870,000
2013 $1,230,000 $3,070,000 -$185,000 -$316,000 -$10,800 -$19,300 $893,000 $2,870,000
2014 $1,230,000 $3,070,000 -$185,000 -$316,000 -$10,800 -$19,300 $893,000 $2,870,000
2015 $1,230,000 $3,070,000 -$185,000 -$316,000 -$9,710 -$17,500 $895,000 $2,880,000
2016 $1,230,000 $3,070,000 -$185,000 -$316,000 -$8,380 -$15,100 $897,000 $2,880,000
2017 $1,230,000 $3,070,000 -$185,000 -$316,000 -$2,740 -$4,920 $907,000 $2,880,000
2018 $1,230,000 $3,070,000 -$185,000 -$316,000 -$2,740 -$4,920 $907,000 $2,880,000
2019 $1,230,000 $3,070,000 -$185,000 -$316,000 -$2,740 -$4,920 $907,000 $2,880,000
2020 $1,230,000 $3,070,000 -$185,000 -$316,000 -$2,740 -$4,920 $907,000 $2,880,000
2021 $1,230,000 $3,070,000 -$185,000 -$316,000 -$2,740 -$4,920 $907,000 $2,880,000
2022 $1,230,000 $3,070,000 -$185,000 -$316,000 -$2,740 -$4,920 $907,000 $2,880,000
2023 $1,230,000 $3,070,000 -$185,000 -$316,000 -$2,740 -$4,920 $907,000 $2,880,000
2024 $1,230,000 $3,070,000 -$185,000 -$316,000 -$2,740 -$4,920 $907,000 $2,880,000
2025 $1,230,000 $3,070,000 -$185,000 -$316,000 -$2,740 -$4,920 $907,000 $2,880,000
2026 $1,230,000 $3,070,000 -$185,000 -$316,000 -$2,740 -$4,920 $907,000 $2,880,000
2027 $1,230,000 $3,070,000 -$185,000 -$316,000 -$2,740 -$4,920 $907,000 $2,880,000
2028 $1,230,000 $3,070,000 -$185,000 -$316,000 -$2,740 -$4,920 $907,000 $2,880,000
2029 $1,230,000 $3,070,000 -$185,000 -$316,000 -$2,740 -$4,920 $907,000 $2,880,000
2030 $1,230,000 $3,070,000 -$185,000 -$316,000 -$2,740 -$4,920 $907,000 $2,880,000
2031 $1,230,000 $3,070,000 -$185,000 -$316,000 -$2,740 -$4,920 $907,000 $2,880,000
TOTAL $24,600,000 $61,400,000 -$3,700,000 -$6,320,000 -$92,600 -$166,000 $18,100,000 $57,600,000
Notes:
All estimates are rounded to three significant digits and may not sum due to rounding.
Final Economic Analysis - November 20, 2012
D-10
D.3 SCENARIO 3 – NEGATIVE ECONOMIC IMPACT
421. Exhibit D-8 summarizes the overall potential incremental impacts under Scenario 3
(negative economic impact). This scenario contemplates a decrease in Federal timber
harvest from projected levels due to critical habitat designation. Exhibit D-9 summarizes
potential incremental project modification impacts to Federal timber management. The
potential incremental administrative costs are identical to those described above, under
Scenario 1. Finally, Exhibit D-10 summarizes potential undiscounted incremental
impacts by year for each economic activity.
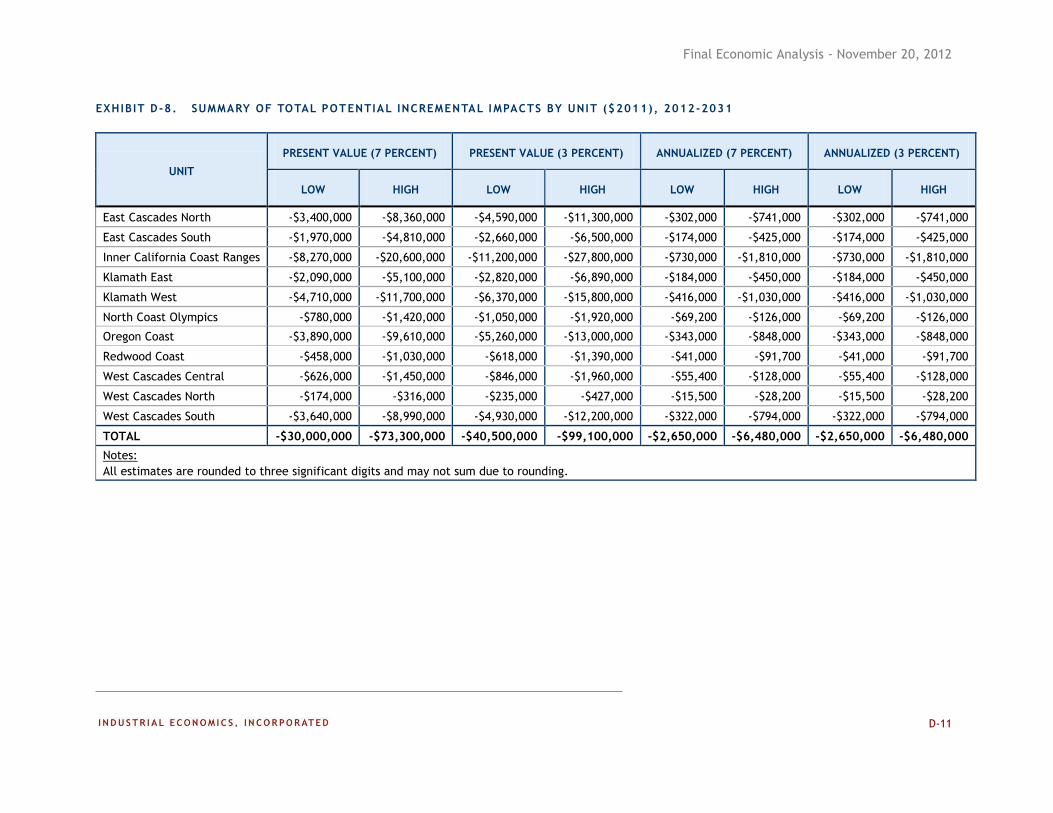
Final Economic Analysis - November 20, 2012
D-11
EXHIBIT D-8. SUMMARY OF TOTAL POTENTIAL INCREMENTAL IMPACTS BY UNIT ($2011), 2012-2031
UNIT
PRESENT VALUE (7 PERCENT) PRESENT VALUE (3 PERCENT) ANNUALIZED (7 PERCENT) ANNUALIZED (3 PERCENT)
LOW HIGH LOW HIGH LOW HIGH LOW HIGH
East Cascades North -$3,400,000 -$8,360,000 -$4,590,000 -$11,300,000 -$302,000 -$741,000 -$302,000 -$741,000
East Cascades South -$1,970,000 -$4,810,000 -$2,660,000 -$6,500,000 -$174,000 -$425,000 -$174,000 -$425,000
Inner California Coast Ranges -$8,270,000 -$20,600,000 -$11,200,000 -$27,800,000 -$730,000 -$1,810,000 -$730,000 -$1,810,000
Klamath East -$2,090,000 -$5,100,000 -$2,820,000 -$6,890,000 -$184,000 -$450,000 -$184,000 -$450,000
Klamath West -$4,710,000 -$11,700,000 -$6,370,000 -$15,800,000 -$416,000 -$1,030,000 -$416,000 -$1,030,000
North Coast Olympics -$780,000 -$1,420,000 -$1,050,000 -$1,920,000 -$69,200 -$126,000 -$69,200 -$126,000
Oregon Coast -$3,890,000 -$9,610,000 -$5,260,000 -$13,000,000 -$343,000 -$848,000 -$343,000 -$848,000
Redwood Coast -$458,000 -$1,030,000 -$618,000 -$1,390,000 -$41,000 -$91,700 -$41,000 -$91,700
West Cascades Central -$626,000 -$1,450,000 -$846,000 -$1,960,000 -$55,400 -$128,000 -$55,400 -$128,000
West Cascades North -$174,000 -$316,000 -$235,000 -$427,000 -$15,500 -$28,200 -$15,500 -$28,200
West Cascades South -$3,640,000 -$8,990,000 -$4,930,000 -$12,200,000 -$322,000 -$794,000 -$322,000 -$794,000
TOTAL -$30,000,000 -$73,300,000 -$40,500,000 -$99,100,000 -$2,650,000 -$6,480,000 -$2,650,000 -$6,480,000
Notes:
All estimates are rounded to three significant digits and may not sum due to rounding.
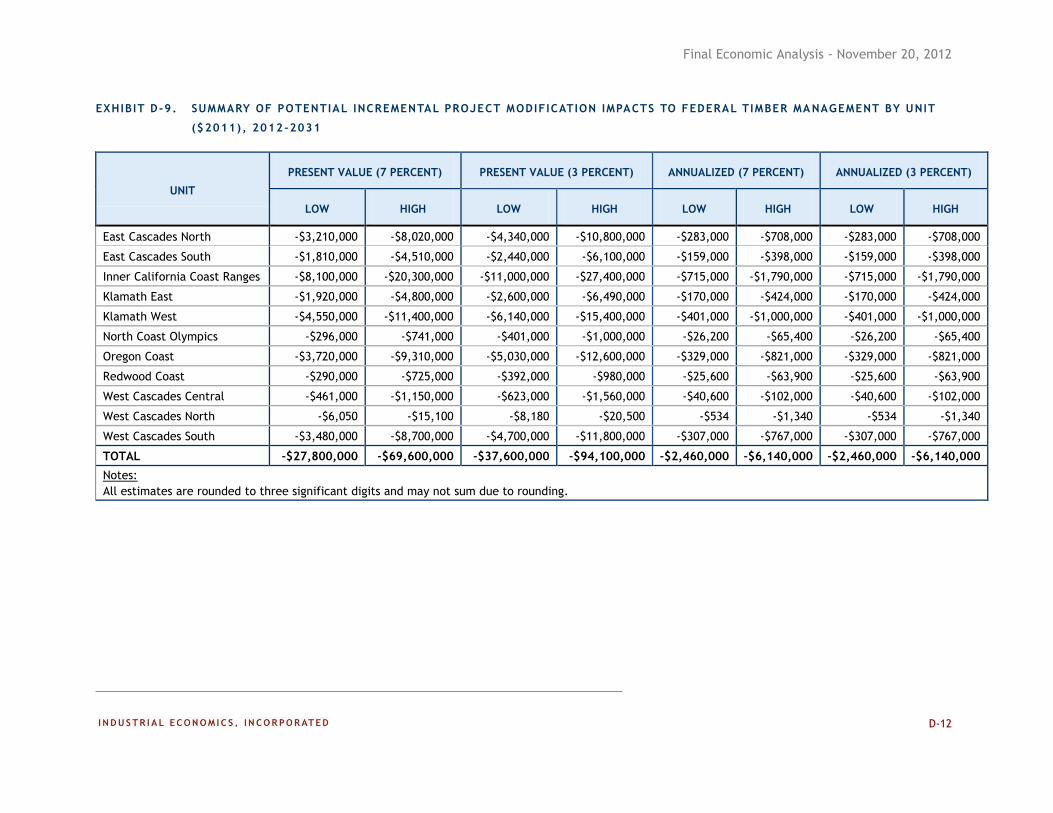
Final Economic Analysis - November 20, 2012
D-12
EXHIBIT D-9. SUMMARY OF POTENTIAL INCREMENTAL PROJECT MODIFICATION IMPACTS TO FEDERAL TIMBER MA NAGEMENT BY UNIT
($2011), 2012-2031
UNIT
PRESENT VALUE (7 PERCENT) PRESENT VALUE (3 PERCENT) ANNUALIZED (7 PERCENT) ANNUALIZED (3 PERCENT)
LOW HIGH LOW HIGH LOW HIGH LOW HIGH
East Cascades North -$3,210,000 -$8,020,000 -$4,340,000 -$10,800,000 -$283,000 -$708,000 -$283,000 -$708,000
East Cascades South -$1,810,000 -$4,510,000 -$2,440,000 -$6,100,000 -$159,000 -$398,000 -$159,000 -$398,000
Inner California Coast Ranges -$8,100,000 -$20,300,000 -$11,000,000 -$27,400,000 -$715,000 -$1,790,000 -$715,000 -$1,790,000
Klamath East -$1,920,000 -$4,800,000 -$2,600,000 -$6,490,000 -$170,000 -$424,000 -$170,000 -$424,000
Klamath West -$4,550,000 -$11,400,000 -$6,140,000 -$15,400,000 -$401,000 -$1,000,000 -$401,000 -$1,000,000
North Coast Olympics -$296,000 -$741,000 -$401,000 -$1,000,000 -$26,200 -$65,400 -$26,200 -$65,400
Oregon Coast -$3,720,000 -$9,310,000 -$5,030,000 -$12,600,000 -$329,000 -$821,000 -$329,000 -$821,000
Redwood Coast -$290,000 -$725,000 -$392,000 -$980,000 -$25,600 -$63,900 -$25,600 -$63,900
West Cascades Central -$461,000 -$1,150,000 -$623,000 -$1,560,000 -$40,600 -$102,000 -$40,600 -$102,000
West Cascades North -$6,050 -$15,100 -$8,180 -$20,500 -$534 -$1,340 -$534 -$1,340
West Cascades South -$3,480,000 -$8,700,000 -$4,700,000 -$11,800,000 -$307,000 -$767,000 -$307,000 -$767,000
TOTAL -$27,800,000 -$69,600,000 -$37,600,000 -$94,100,000 -$2,460,000 -$6,140,000 -$2,460,000 -$6,140,000
Notes:
All estimates are rounded to three significant digits and may not sum due to rounding.
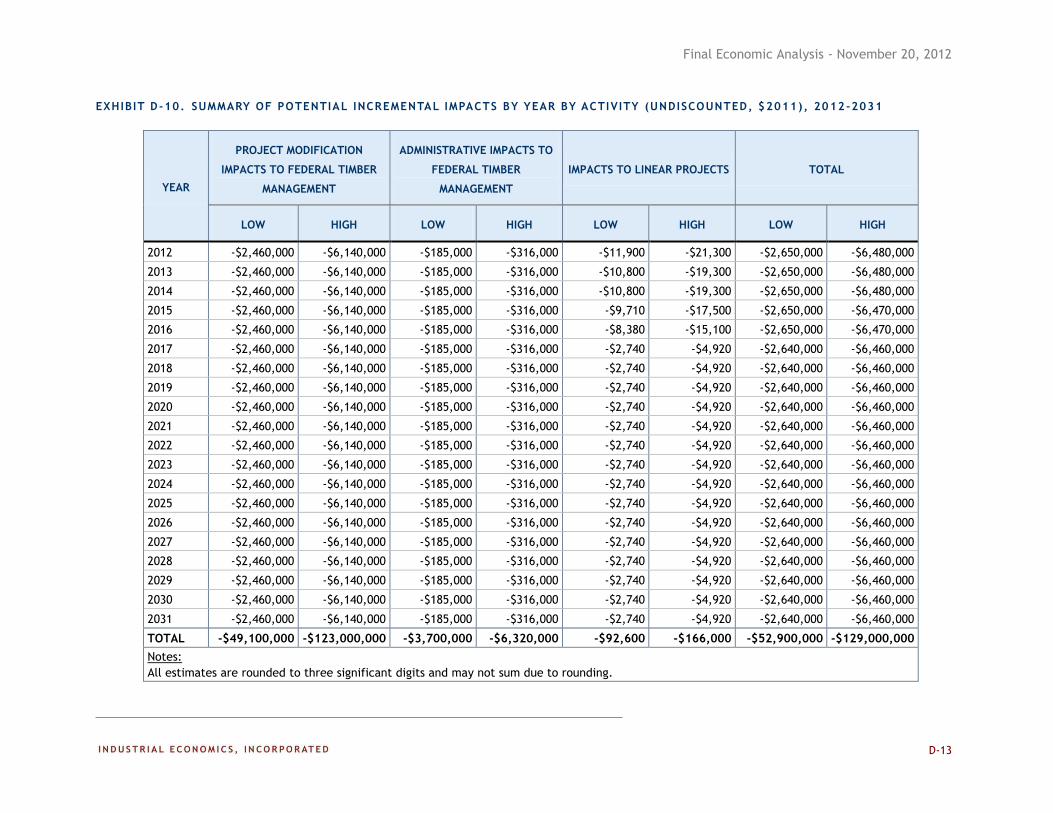
Final Economic Analysis - November 20, 2012
D-13
EXHIBIT D-10. SUMMARY OF POTENTIAL INCREMENTAL IMPACTS BY YEAR BY ACTIVITY (UNDISCOUNTED, $2011), 2012-2031
YEAR
PROJECT MODIFICATION
IMPACTS TO FEDERAL TIMBER
MANAGEMENT
ADMINISTRATIVE IMPACTS TO
FEDERAL TIMBER
MANAGEMENT
IMPACTS TO LINEAR PROJECTS TOTAL
LOW HIGH LOW HIGH LOW HIGH LOW HIGH
2012 -$2,460,000 -$6,140,000 -$185,000 -$316,000 -$11,900 -$21,300 -$2,650,000 -$6,480,000
2013 -$2,460,000 -$6,140,000 -$185,000 -$316,000 -$10,800 -$19,300 -$2,650,000 -$6,480,000
2014 -$2,460,000 -$6,140,000 -$185,000 -$316,000 -$10,800 -$19,300 -$2,650,000 -$6,480,000
2015 -$2,460,000 -$6,140,000 -$185,000 -$316,000 -$9,710 -$17,500 -$2,650,000 -$6,470,000
2016 -$2,460,000 -$6,140,000 -$185,000 -$316,000 -$8,380 -$15,100 -$2,650,000 -$6,470,000
2017 -$2,460,000 -$6,140,000 -$185,000 -$316,000 -$2,740 -$4,920 -$2,640,000 -$6,460,000
2018 -$2,460,000 -$6,140,000 -$185,000 -$316,000 -$2,740 -$4,920 -$2,640,000 -$6,460,000
2019 -$2,460,000 -$6,140,000 -$185,000 -$316,000 -$2,740 -$4,920 -$2,640,000 -$6,460,000
2020 -$2,460,000 -$6,140,000 -$185,000 -$316,000 -$2,740 -$4,920 -$2,640,000 -$6,460,000
2021 -$2,460,000 -$6,140,000 -$185,000 -$316,000 -$2,740 -$4,920 -$2,640,000 -$6,460,000
2022 -$2,460,000 -$6,140,000 -$185,000 -$316,000 -$2,740 -$4,920 -$2,640,000 -$6,460,000
2023 -$2,460,000 -$6,140,000 -$185,000 -$316,000 -$2,740 -$4,920 -$2,640,000 -$6,460,000
2024 -$2,460,000 -$6,140,000 -$185,000 -$316,000 -$2,740 -$4,920 -$2,640,000 -$6,460,000
2025 -$2,460,000 -$6,140,000 -$185,000 -$316,000 -$2,740 -$4,920 -$2,640,000 -$6,460,000
2026 -$2,460,000 -$6,140,000 -$185,000 -$316,000 -$2,740 -$4,920 -$2,640,000 -$6,460,000
2027 -$2,460,000 -$6,140,000 -$185,000 -$316,000 -$2,740 -$4,920 -$2,640,000 -$6,460,000
2028 -$2,460,000 -$6,140,000 -$185,000 -$316,000 -$2,740 -$4,920 -$2,640,000 -$6,460,000
2029 -$2,460,000 -$6,140,000 -$185,000 -$316,000 -$2,740 -$4,920 -$2,640,000 -$6,460,000
2030 -$2,460,000 -$6,140,000 -$185,000 -$316,000 -$2,740 -$4,920 -$2,640,000 -$6,460,000
2031 -$2,460,000 -$6,140,000 -$185,000 -$316,000 -$2,740 -$4,920 -$2,640,000 -$6,460,000
TOTAL -$49,100,000 -$123,000,000 -$3,700,000 -$6,320,000 -$92,600 -$166,000 -$52,900,000 -$129,000,000
Notes:
All estimates are rounded to three significant digits and may not sum due to rounding.
Related Documents