Economic Analysis Economic Analysis for Business for Business Session V: Market Forces Session V: Market Forces of Supply and Demand-II of Supply and Demand-II Instructor Instructor Sandeep Basnyat Sandeep Basnyat 9841892281 9841892281 [email protected] [email protected]

Economic Analysis for Business Session V: Market Forces of Supply and Demand-II Instructor Sandeep Basnyat [email protected].
Dec 30, 2015
Welcome message from author
This document is posted to help you gain knowledge. Please leave a comment to let me know what you think about it! Share it to your friends and learn new things together.
Transcript

Economic Analysis Economic Analysis for Businessfor Business
Session V: Market Forces of Session V: Market Forces of Supply and Demand-IISupply and Demand-II
InstructorInstructorSandeep BasnyatSandeep [email protected][email protected]

$0.00
$1.00
$2.00
$3.00
$4.00
$5.00
$6.00
0 5 10 15 20 25 30 35
P
Q
Recall: Supply and Demand Recall: Supply and Demand TogetherTogether
D S Equilibrium: P has reached
the level where
quantity supplied equals quantity demanded

Recall: Equilibrium in Automobile Recall: Equilibrium in Automobile marketmarket
Market demand curve: Qd = 20,500,000 – 500P
Market supply curve: Qs = - 42000000 +2000P
Equilibrium is at: Qd = Qs 20,500,000 – 500P = - 42000000 +2000P2500P = 62500000
Therefore, P = $25000Q = 20,500,000 – 500(25000) = 8,000,000

$0.00
$1.00
$2.00
$3.00
$4.00
$5.00
$6.00
0 5 10 15 20 25 30 35
P
Q
D S
Surplus:Surplus:
when quantity supplied is greater than quantity demanded
Surplus Example: If P = $5,
then QD = 9 lattes
and QS = 25 lattes
resulting in a surplus of 16 lattes
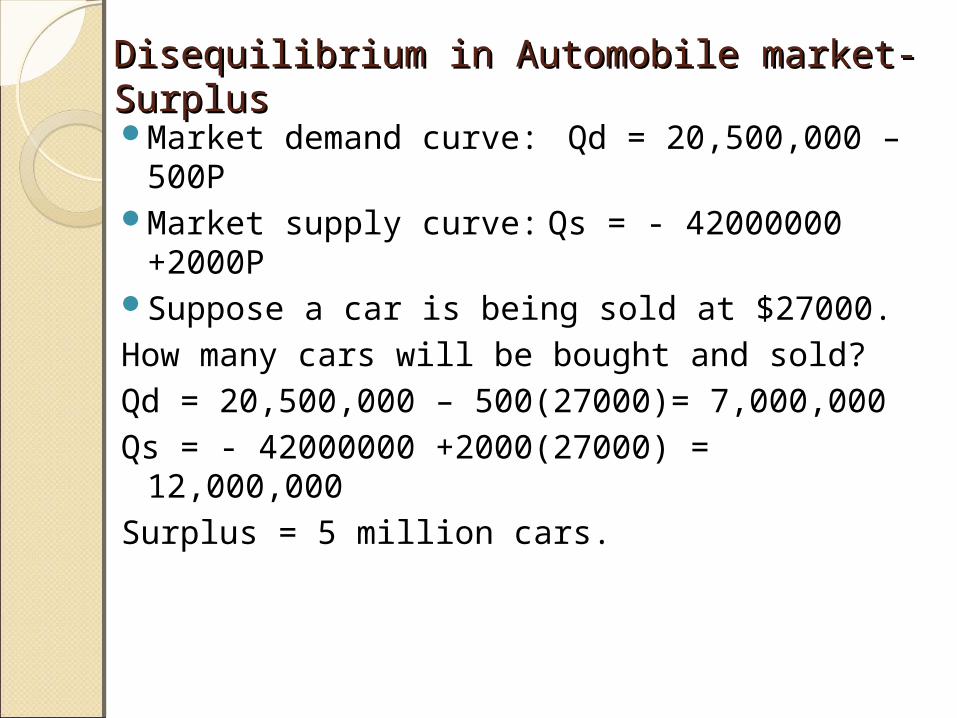
Disequilibrium in Automobile market- Disequilibrium in Automobile market- SurplusSurplusMarket demand curve: Qd = 20,500,000
– 500PMarket supply curve: Qs = - 42000000
+2000PSuppose a car is being sold at $27000.How many cars will be bought and sold? Qd = 20,500,000 – 500(27000)= 7,000,000Qs = - 42000000 +2000(27000) =
12,000,000Surplus = 5 million cars.

CHAPTER 4 THE MARKET FORCES OF
SUPPLY AND DEMAND
$0.00
$1.00
$2.00
$3.00
$4.00
$5.00
$6.00
0 5 10 15 20 25 30 35
P
Q
D S
when quantity demanded is greater than quantity supplied
Example: If P = $1,
then QD = 21 lattes
and QS = 5 lattes
resulting in a shortage of 16 lattes
Shortage
ShortageShortage

Disequilibrium in Automobile market- Disequilibrium in Automobile market- ShortageShortageMarket demand curve: Qd = 20,500,000
– 500PMarket supply curve: Qs = - 42000000
+2000PSuppose a car is being sold at $23000.How many cars will be bought and sold? Qd = 20,500,000 – 500(23000)= 9,000,000Qs = - 42000000 +2000(23000) =
4,000,000Shortage = 5 million cars.

Comparative Static AnalysisComparative Static AnalysisSensitivity analysis or “what-if” analysis.Comparison of various points of
equilibrium: price and quantityThe role of factors influencing demand is
analyzed while holding supply conditions constant.
Or, the role of factors influencing supply is analyzed by studying changes in supply while holding demand conditions constant
Short and Long run analyses

$0.00
$1.00
$2.00
$3.00
$4.00
$5.00
$6.00
0 5 10 15 20 25 30 35
P
Q
D S Facing a surplus, sellers try to increase sales by cutting the price.
This causes QD to rise
Surplus
…which reduces the surplus.
and QS to fall…
Short-run market change: Rationing Short-run market change: Rationing Mechanism of Price: Surplus caseMechanism of Price: Surplus case

CHAPTER 4 THE MARKET FORCES OF
SUPPLY AND DEMAND
$0.00
$1.00
$2.00
$3.00
$4.00
$5.00
$6.00
0 5 10 15 20 25 30 35
P
Q
D S Facing a surplus, sellers try to increase sales by cutting the price.
Falling prices cause QD to rise and QS to fall.
Surplus
Prices continue to fall until market reaches equilibrium.
Short-run market change: Rationing Short-run market change: Rationing Mechanism of Price: Surplus caseMechanism of Price: Surplus case

CHAPTER 4 THE MARKET FORCES OF
SUPPLY AND DEMAND
$0.00
$1.00
$2.00
$3.00
$4.00
$5.00
$6.00
0 5 10 15 20 25 30 35
P
Q
D S Facing a shortage, sellers raise the price,
causing QD to fall
…which reduces the shortage.
and QS to rise,
Shortage
Short-run market change: Rationing Short-run market change: Rationing Mechanism of Price: Shortage caseMechanism of Price: Shortage case

CHAPTER 4 THE MARKET FORCES OF
SUPPLY AND DEMAND
$0.00
$1.00
$2.00
$3.00
$4.00
$5.00
$6.00
0 5 10 15 20 25 30 35
P
Q
D S
Facing a shortage, sellers raise the price,
causing QD to falland QS to rise.
Shortage
Prices continue to rise until market reaches equilibrium.
Short-run market change: Rationing Short-run market change: Rationing Mechanism of Price: Shortage caseMechanism of Price: Shortage case
Rationing Mechanism: Price adjustment to balance demand and supply in market
CHAPTER 4 THE MARKET FORCES OF
SUPPLY AND DEMAND
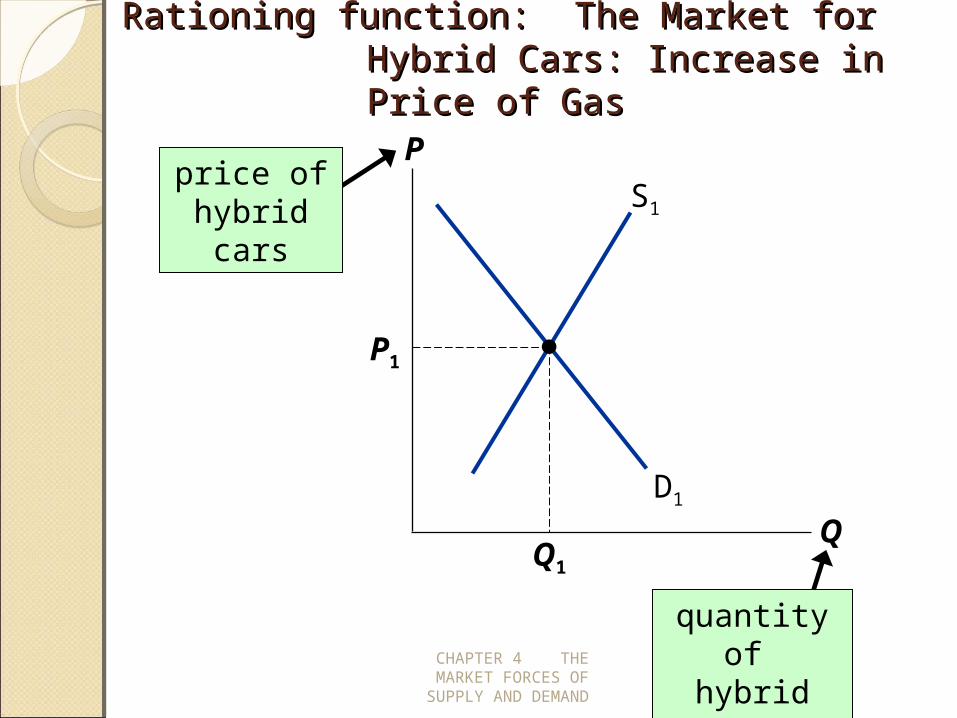
Rationing function: The Market for Hybrid Rationing function: The Market for Hybrid Cars: Increase in Price of GasCars: Increase in Price of Gas
P
Q
D1
S1
P1
Q1
price of hybrid cars
quantity of hybrid cars

CHAPTER 4 THE MARKET FORCES OF
SUPPLY AND DEMAND
D curve shifts to the right because increased price of gas increases demand for hybrid cars.
S curve does not shift, because price of gas does not affect cost of producing hybrids.
A Change in DemandA Change in Demand
Assumption: Increase in price of gas. P
Q
D1
S1
P1
Q1
D2
P2
Q2
The shift causes an increase in price and quantity of hybrid cars.

Price Rationing: A Change in DemandPrice Rationing: A Change in Demand
P
Q
D1
S1
P1
Q1
D2
P2
Q2
Notice: When P rises, producers supply a larger quantity of hybrids, even though the S curve has not shifted.

S curve shifts because event affects cost of production.
D curve does not shift, because production technology is not one of the factors that affect demand.
S shifts rightbecause event reduces cost, makes production more profitable at any given price.
EXAMPLE 2: EXAMPLE 2: A Change in SupplyA Change in Supply
P
Q
D1
S1
P1
Q1
S2
P2
Q2
EVENT: New technology reduces cost of producing hybrid cars.
The shift causes price to fall and quantity to rise.

Long run analysis: Guiding or Allocating Long run analysis: Guiding or Allocating Mechanism: Market for Mechanism: Market for Hybrid CarsHybrid Cars
P
Q
D1
S1
P1
Q1
S2
D2
P3
Q3
EVENTS: 1. Price of gas rises2.New technology reduces production costs
P2
Q2
Short-run Analysis
Long-run Analysis

Short-run vs Long-runShort-run vs Long-runShort-run or Rationing Mechanism: Period
of time buyers and sellers already in market respond to change in equilibrium price by adjusting the amount of resources (variable inputs)
Long run or Guiding or Allocating Mechanism: Period of time buyers and sellers, new or existing in market respond to change in equilibrium price by moving the amount of resources (variable/fixed inputs) in or out from the market.

Variations: Variations: A Change in Both Supply and A Change in Both Supply and DemandDemand
P
Q
D1
S1
P1
Q1
S2
D2
P2
Q2
EVENTS: Price of gas rises AND New technology reduces production costs
But supply increases more than demand.
Note: P falls compared to the original price.

AA CC TT II VV E LE L EE AA RR NN II NN G G 33: : Changes in supply and demandChanges in supply and demand
20
For a hypothetical market, use Short-run and Long analysis for the following cases:
1. When Demand and Supply both increases but D > S
2. When Demand increases and Supply decreases but D > S
3. When Demand increases and Supply decreases but D < S
4. When Demand decreases and Supply increases but D < S
5. When Demand decreases and Supply increases but D > S

Terms for Shift vs. Movement Along Terms for Shift vs. Movement Along CurveCurve
Change in supply: a shift in the S curve◦occurs when a non-price determinant of
supply changes (like technology or costs)Change in the quantity supplied:
a movement along a fixed S curve ◦occurs when P changes
Change in demand: a shift in the D curve◦occurs when a non-price determinant of
demand changes (like income or No. of buyers)
Change in the quantity demanded: a movement along a fixed D curve◦occurs when P changes

Estimated Industry Demand for New AutomobilesParameter Estimated Value
Independent Variable Estimate for Variable(1) (2) (3)
Average Price for New Cars (P) –500 $25,000Average Price for New Luxury Cars(PX) 210 $50,000Disposable Income, per Household (I) 200 $45,000 Population (Pop) (millions) 20,000 300Average Interest Rate (i) (percent) –1,000,000 8%Industry Advertising Expenditures (A) 600 $5,000 million
Ex 1: Automobile Market Demand and Supply Ex 1: Automobile Market Demand and Supply AnalysisAnalysis
Estimated Industry Supply for New AutomobileParameter Estimated Value
Independent Variable Estimate for Variable(1) (2) (3)
Average Price for New Cars (P) 2,000 $25,000Average Price for SUV(Psuv) -400 $35,000Average Hourly Wage Rate (W) -100,000 $85 Average Cost of Steel/Ton (S) -13,750 800Average Cost of Energy/mcf (E) –125,000 $4Average Interest Rate (i) in percent -1,000,000 8%

Practice 1-Market Demand-Supply Practice 1-Market Demand-Supply AnalysisAnalysis
Considering the Estimated demand and supply conditions of the new automobile in the previous slide, find the followings:1.With the increased competition in the market, the automobile industry increased its advertising expenditure by $5000 million. Will the industry be able to sell more automobile or less now? By how much? Show your results using demand and supply diagram.2.In response to part 1, the SUV sellers decreased their price of SUV by $2000. How will this affect the new automobile industry now? Is it necessary for the industry to decrease the price of new automobile? By how much? How many new cars will the industry be able to sell now? Show your results using demand and supply diagram.
(Hint: Use increased advertising expenses in demand function, keep supply function constant and find equilibrium. Use similar method for case 2.)

Thank youThank you
Related Documents


