January 6, 2013 Morgan Stanley does and seeks to do business with companies covered in Morgan Stanley Research. As a result, investors should be aware that the firm may have a conflict of interest that could affect the objectivity of Morgan Stanley Research. Investors should consider Morgan Stanley Research as only a single factor in making their investment decision. For analyst certification and other important disclosures, refer to the Disclosure Section, located at the end of this report. * = This Research Report has been partially prepared by analysts employed by non-U.S. affiliates of the member. Please see page 2 for the name of each non-U.S. affiliate contributing to this Research Report and the names of the analysts employed by each contributing affiliate. += Analysts employed by non-U.S. affiliates are not registered with FINRA, may not be associated persons of the member and may not be subject to NASD/NYSE restrictions on communications with a subject company, public appearances and trading securities held by a research analyst account. MORGAN STANLEY BLUE PAPER eCommerce Disruption: A Global Theme Transforming Traditional Retail Fulfillment execution is key to realizing eCommerce’s disruptive potential. By 2016, our AlphaWise survey and global eCommerce model suggest a nearly 50% increase in penetration of retail sales, to 9.3% (from 6.5% today), surpassing $1 trillion. As the key disruptors of the past 10 years become incumbents, their continued success hinges on building scale and brand equity. Which companies will benefit? Amazon, eBay, MercadoLibre, and Rakuten should benefit as the scale-based eCommerce platform companies. Traditional retail beneficiaries include Nordstrom, Sun Art, Williams-Sonoma, and eventually Walmart. Niche online players like ASOS and Blue Nile could also prosper from the global, disruptive, long runway trend of eCommerce. For some, eCommerce is a relatively minor issue. High-end apparel and footwear, price clubs, and specialty food retailers have business models that seem less vulnerable to market share erosion from eCommerce. We put Costco in this category. This Blue Paper leverages insights from Morgan Stanley retail and internet analysts from all over the world to arrive at five key conclusions: 1) fulfillment infrastructure is critical, 2) some categories remain resistant to change, 3) third-party marketplaces can prosper, 4) the mobile opportunity is promising, and 5) scale / brand favors incumbents. Driving those conclusions are the competitive advantages successful eCommerce players enjoy: price, selection, convenience, distribution, and cost structure. MORGAN STANLEY RESEARCH Global Scott Devitt 1 Andrew Ruud 1 David Gober 1 Joseph Parkhill 1 Kimberly Greenberger 1 Mark Wiltamuth 1 Richard Ji 2 Philip Wan 2 Timothy Chan 2 Robert Lin 2 Angela Moh 2 Geoff Ruddell 3 Edouard Aubin 3 Anisha Singhal 3 Louise Singlehurst 3 Edward Hill-Wood 3 Nicholas Ashworth 3 Maryia Berasneva 3 Loredana Serra 1 Tom Kierath 5 Crystal Wang 5 Tetsuro Tsusaka 6 Zachary Arrick 1 Nishant Verma 1 *See page 2 for all contributors to this report 1 Morgan Stanley & Co. LLC 2 Morgan Stanley Asia Limited+ 3 Morgan Stanley & Co. International plc+ 4 Morgan Stanley C.T.V.M. S.A+ 5 Morgan Stanley Australia Limited + 6 Morgan Stanley MUFG Securities Co., Ltd.+ Morgan Stanley Blue Papers focus on critical investment themes that require coordinated perspectives across industry sectors, regions, or asset classes.

Welcome message from author
This document is posted to help you gain knowledge. Please leave a comment to let me know what you think about it! Share it to your friends and learn new things together.
Transcript
January 6, 2013
Morgan Stanley does and seeks to do business with companies covered in Morgan Stanley Research. As a result, investors should be aware that the firm may have a conflict of interest that could affect the objectivity of Morgan Stanley Research. Investors should consider Morgan Stanley Research as only a single factor in making their investment decision.
For analyst certification and other important disclosures, refer to the Disclosure Section, located at the end of this report.
* = This Research Report has been partially prepared by analysts employed by non-U.S. affiliates of the member. Please see page 2 for the name of each non-U.S. affiliate contributing to this Research Report and the names of the analysts employed by each contributing affiliate.
+= Analysts employed by non-U.S. affiliates are not registered with FINRA, may not be associated persons of the member and may not be subject to NASD/NYSE restrictions on communications with a subject company, public appearances and trading securities held by a research analyst account.
M O R G A N S T A N L E Y B L U E P A P E R
eCommerce Disruption: A Global Theme Transforming Traditional Retail
Fulfillment execution is key to realizing eCommerce’s disruptive potential. By 2016, our AlphaWise survey and global eCommerce model suggest a nearly 50% increase in penetration of retail sales, to 9.3% (from 6.5% today), surpassing $1 trillion. As the key disruptors of the past 10 years become incumbents, their continued success hinges on building scale and brand equity.
Which companies will benefit? Amazon, eBay, MercadoLibre, and Rakuten should benefit as the scale-based eCommerce platform companies. Traditional retail beneficiaries include Nordstrom, Sun Art, Williams-Sonoma, and eventually Walmart. Niche online players like ASOS and Blue Nile could also prosper from the global, disruptive, long runway trend of eCommerce. For some, eCommerce is a relatively minor issue. High-end apparel and footwear, price clubs, and specialty food retailers have business models that seem less vulnerable to market share erosion from eCommerce. We put Costco in this category.
This Blue Paper leverages insights from Morgan Stanley retail and internet analysts from all over the world to arrive at five key conclusions: 1) fulfillment infrastructure is critical, 2) some categories remain resistant to change, 3) third-party marketplaces can prosper, 4) the mobile opportunity is promising, and 5) scale / brand favors incumbents. Driving those conclusions are the competitive advantages successful eCommerce players enjoy: price, selection, convenience, distribution, and cost structure.
M O R G A N S T A N L E Y R E S E A R C H
G l o b a l
Scott Devitt1
Andrew Ruud1
David Gober1
Joseph Parkhill1
Kimberly Greenberger1
Mark Wiltamuth1
Richard Ji2
Philip Wan2
Timothy Chan2
Robert Lin2
Angela Moh2
Geoff Ruddell3
Edouard Aubin3
Anisha Singhal3
Louise Singlehurst3
Edward Hill-Wood3
Nicholas Ashworth3
Maryia Berasneva3
Loredana Serra1
Tom Kierath5
Crystal Wang5
Tetsuro Tsusaka6
Zachary Arrick1
Nishant Verma1
*See page 2 for all contributors to this report
1 Morgan Stanley & Co. LLC
2 Morgan Stanley Asia Limited+ 3 Morgan Stanley & Co. International plc+ 4 Morgan Stanley C.T.V.M. S.A+ 5 Morgan Stanley Australia Limited + 6 Morgan Stanley MUFG Securities Co., Ltd.+
Morgan Stanley Blue Papers focus on critical investment themes that require coordinated perspectives across industry sectors, regions, or asset classes.
M O R G A N S T A N L E Y R E S E A R C H
2
January 6, 2013 eCommerce Disruption: A Global Theme – Transforming Traditional Retail
Global Internet and Retail Teams
Contributors to This Report
US Internet
Scott Devitt1 +1 (212) 761-3365 [email protected] Andrew Ruud1 +1 (212) 761-5978 [email protected] Zachary Arrick1 +1 (212) 761-4226 [email protected] Nishant Verma1 +1 (212) 761-6320 [email protected]
US Retail
Hardlines David Gober1 +1 (212) 761-6616 [email protected]
Branded Apparel & Footwear Joseph Parkhill1 +1 (212) 761-0766 [email protected]
Softlines Kimberly Greenberger1 +1 (212) 761-6284 [email protected]
Food, Drug and Discounters Mark Wiltamuth1 +1 (212) 761-8589 [email protected]
China Internet
Richard Ji2 +852 2848-6926 [email protected] Philip Wan2 +852 2848-8227 [email protected] Timothy Chan2 +852 2239-7107 [email protected]
China Retail
Robert Lin2 +852 2848-5835 [email protected] Angela Moh2 +852 2848-5405 [email protected]
Western Europe Retail
Geoff Ruddell3 +44 20 7425-8954 [email protected] Edouard Aubin3 +44 20 7425-3160 [email protected] Anisha Singhal3 +44 20 7425-7526 [email protected] Louise Singlehurst3 +44 20 7425-7239 [email protected]
Europe Internet
Edward Hill-Wood3 +44 20 7425-9224 [email protected] Nicholas Ashworth3 +44 20 7425-7770 [email protected] Maryia Berasneva3 +44 20 7425-7502 [email protected] Liz A. Rich3 +44 20 7425-7082 [email protected]
Brazil Retail
Loredana Serra1 +1 (212) 761-7954 [email protected] Jeronimo De Guzman1 +1 (212) 761-7084 [email protected] Franco Abelardo4 +55 11 3048-9609 [email protected]
Australia Retail
Tom Kierath5 +61 2 9770-1578 [email protected] Crystal Wang5 +61 2 9770-1195 [email protected]
Japan Internet
Tetsuro Tsusaka6 +81 3 5424-5901 [email protected]
1 Morgan Stanley & Co. LLC 2 Morgan Stanley Asia Limited+
3 Morgan Stanley & Co. International plc+ 4 Morgan Stanley C.T.V.M. S.A+
5 Morgan Stanley Australia Limited + 6 Morgan Stanley MUFG Securities Co., Ltd.+
See page 145 for recent Blue Paper reports.
M O R G A N S T A N L E Y R E S E A R C H
3
January 6, 2013 eCommerce Disruption: A Global Theme – Transforming Traditional Retail
Table of Contents
Executive Summary: Retail Transformed .......................................................................................................................... 4
Five Key Conclusions: Where Does eCommerce Go from Here?.................................................................................... 5
Disruptive Forces and Key Stock Calls............................................................................................................................... 7
Takeaways by Region ........................................................................................................................................................... 8
Key AlphaWise Conclusions ................................................................................................................................................ 12
Segment Analysis by Region
United States
Internet ........................................................................................................................................................................ 14
Retail............................................................................................................................................................................ 23
Food, Drug and Discounters ................................................................................................................................. 27
Branded Apparel & Footwear ................................................................................................................................ 28
Hardlines ................................................................................................................................................................. 31
Softlines .................................................................................................................................................................. 33
Western Europe
Retail............................................................................................................................................................................ 43
Retail – Luxury............................................................................................................................................................ 53
Brazil: Internet and Retail ................................................................................................................................ 54
China
Internet..................................................................................................................................................................... 61
Retail ........................................................................................................................................................................ 68
Russia
Internet..................................................................................................................................................................... 78
Australia
Retail ........................................................................................................................................................................ 84
Japan
Internet..................................................................................................................................................................... 89
Key Stock Calls by Region ................................................................................................................................................... 95
Morgan Stanley Global eCommerce Model......................................................................................................................... 143
M O R G A N S T A N L E Y R E S E A R C H
4
January 6, 2013 eCommerce Disruption: A Global Theme – Transforming Traditional Retail
Executive Summary: Retail Transformed
Over the past 15 years, eCommerce has evolved from what many people believed to be a convenient novelty to the single largest contributor to retail sales growth.
During the 1990s, eCommerce was dismissed as peripheral, yet the category grew on a foundation of low prices. During the early 2000s, eCommerce was tolerated and largely ignored even as selection increased, with an ever- broadening set of product categories moving online. By the mid-2000s, the disruptive effects were readily apparent, and both retailers and consumers alike accepted eCommerce as a legitimate alternative to traditional retail.
Today, we expect traditional retail sales disruption to be a global trend that may actually accelerate over the next four years.
The conclusions in this Blue Paper are supported by an AlphaWise survey, a global eCommerce model, and the insights of Morgan Stanley Internet and Retail analysts from around the world. We have examined the structural drivers of eCommerce in the largest, most relevant markets and articulate actionable stock calls on best-positioned and potentially challenged companies. We support our stock calls through bottom-up analysis of local competitive dynamics among both online and offline participants, by region.
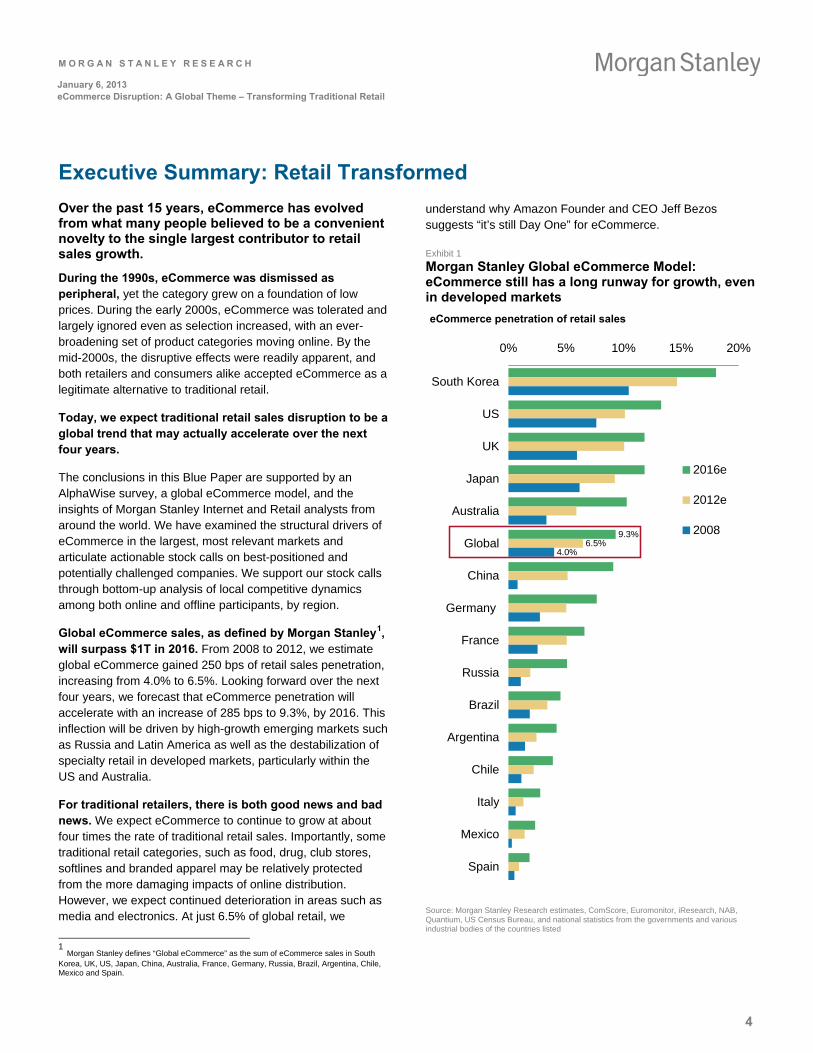
Global eCommerce sales, as defined by Morgan Stanley1, will surpass $1T in 2016. From 2008 to 2012, we estimate global eCommerce gained 250 bps of retail sales penetration, increasing from 4.0% to 6.5%. Looking forward over the next four years, we forecast that eCommerce penetration will accelerate with an increase of 285 bps to 9.3%, by 2016. This inflection will be driven by high-growth emerging markets such as Russia and Latin America as well as the destabilization of specialty retail in developed markets, particularly within the US and Australia.
For traditional retailers, there is both good news and bad news. We expect eCommerce to continue to grow at about four times the rate of traditional retail sales. Importantly, some traditional retail categories, such as food, drug, club stores, softlines and branded apparel may be relatively protected from the more damaging impacts of online distribution. However, we expect continued deterioration in areas such as media and electronics. At just 6.5% of global retail, we
1 Morgan Stanley defines “Global eCommerce” as the sum of eCommerce sales in South Korea, UK, US, Japan, China, Australia, France, Germany, Russia, Brazil, Argentina, Chile, Mexico and Spain.
understand why Amazon Founder and CEO Jeff Bezos suggests “it’s still Day One” for eCommerce.
Exhibit 1
Morgan Stanley Global eCommerce Model: eCommerce still has a long runway for growth, even in developed markets eCommerce penetration of retail sales
9.3%6.5%
4.0%
0% 5% 10% 15% 20%
South Korea
US
UK
Japan
Australia
Global
China
Germany
France
Russia
Brazil
Argentina
Chile
Italy
Mexico
Spain
2016e
2012e
2008
Source: Morgan Stanley Research estimates, ComScore, Euromonitor, iResearch, NAB, Quantium, US Census Bureau, and national statistics from the governments and various industrial bodies of the countries listed
M O R G A N S T A N L E Y R E S E A R C H
5
January 6, 2013 eCommerce Disruption: A Global Theme – Transforming Traditional Retail
Five Key Conclusions: Where Does eCommerce Go from Here?
1. Fulfillment infrastructure is critical
In the long-term, scale wins, and the right fulfillment infrastructure is the means to achieve scale. Whether the customer is driving to the store to pickup a web-based / shop in-store order or the United Parcel Service (UPS) is providing next-day delivery from a nearby fulfillment center, merchandise fulfillment is quickly becoming a key focus for both traditional retailers and eCommerce players.
Global fulfillment networks are highly capital intensive. With a projected total of 87 fulfillment centers around the world, Amazon operates the largest multi-node, one-to-one retail fulfillment network currently in existence. We estimate Amazon has invested $8-10B in its fulfillment network, not counting planned upgrades and repairs. This represents a material barrier to entry for would-be competitors. That said, 360buy in China, Rakuten in Japan and eBay (through its GSI Commerce asset) in the US are all investing to offer independent fulfillment services for their third-party marketplaces. The question is whether or not these competitors actually have the sustainable, core-competency in fulfillment logistics necessary to fulfill global ambitions.
Traditional retailers are not standing idly by. Select traditional retailers, such as Nordstrom and Marks & Spencer, are building independent fulfillment centers to support their eCommerce initiatives. Others are utilizing their retail store portfolios to fulfill customer orders, either through in-store pick-ups of items ordered online, or “true fulfillment” from existing store inventory.
2. Some categories remain resistant to change
Branded apparel, food, drug, club stores, softlines, and home improvement retailers appear relatively impervious to eCommerce disruption. Vertically integrated branded apparel companies, such as Coach, control both manufacturing and distribution of their products. By operating a portfolio of full-price retail stores, outlet stores, and an eCommerce site, Coach can afford to be selective with its offline and online retail partners. Club stores, such as Costco, are relatively immune due to their high-volume, low-SKU business model. By focusing on perishable consumables and low markups on bulk items, Costco is able to drive earnings growth through increased member growth and member fee increases while maintaining high inventory turnover.
Food retailers also have been relatively insulated from new eCommerce entrants, at least thus far. Amazon Fresh (in Seattle) and Fresh Direct (in New York City and Philadelphia) are the only two eCommerce companies operating at any sort of scale in the US. Amazon may be running Amazon Fresh at a breakeven or low operating margin and Fresh Direct appears to work best where the company can achieve sufficient route density to justify the fixed distribution costs against the contribution profit of orders. In the UK, Ocado has developed meaningful scale (it is now generating sales of $1B per annum) and is available nationwide, however, it still has yet to prove that it can generate attractive economic returns. Consumers in Europe (particularly the UK and France) have clearly shown that they are interested in shopping online for groceries and our AlphaWise survey suggests a growing interest from US consumers in doing so in the future, but we believe that the existing, store-based, operators are best placed to meet this demand.
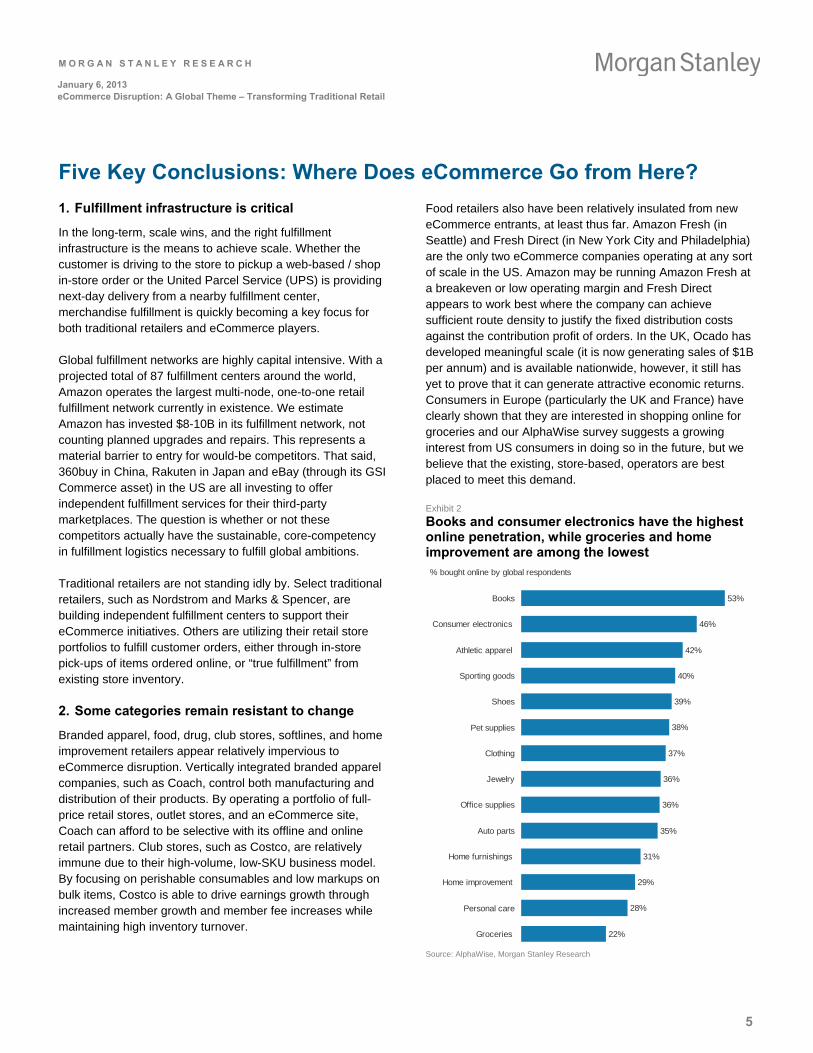
Exhibit 2
Books and consumer electronics have the highest online penetration, while groceries and home improvement are among the lowest % bought online by global respondents
53%
46%
42%
40%
39%
38%
37%
36%
36%
35%
31%
29%
28%
22%
Books
Consumer electronics
Athletic apparel
Sporting goods
Shoes
Pet supplies
Clothing
Jewelry
Office supplies
Auto parts
Home furnishings
Home improvement
Personal care
Groceries
Source: AlphaWise, Morgan Stanley Research
M O R G A N S T A N L E Y R E S E A R C H
6
January 6, 2013 eCommerce Disruption: A Global Theme – Transforming Traditional Retail
3. Third-party marketplaces can prosper
The success of owned-inventory eCommerce sites (“first party,” or 1P) versus third-party marketplaces (3P) varies by region. The US and Western Europe have seen success in integrated eCommerce platforms, 1P+3P, dominated by Amazon, although eBay has re-emerged as a capable 3P-only competitor. While one could argue that selling owned inventory alongside third-party sellers creates a conflict of interest, there are benefits to being a market maker. Amazon’s owned inventory business helps it set market pricing for third-party sellers. While this could mean lower profits on a unit basis for third-party sellers, it drives lower prices in the marketplace, which drives greater customer adoption, leading to increased third-party sell-through.
In markets like South Korea, China and Japan, 3P continues to lead. However, third-party marketplaces in these markets tend to have an inability to bundle orders (meaning products are delivered from a variety of sellers) making it tough to compete with owned inventory players on delivery speed and consistency of experience. Therefore 3P marketplaces, particularly Rakuten, are aggressively investing in building a fulfillment network. While MercadoLibre management recognizes the value of offering fulfillment, the company does not have plans to do so in the near-term.
4. Mobile eCommerce: A promising opportunity – for both online and traditional retailers
While mobile can represent an extra layer of convenience, via the ability to purchase anytime / anywhere, it can also have the opposite effect, as 1) entering billing and shipping information can be cumbersome and 2) given smaller screen size, the app must be highly intuitive. We believe larger companies, with the resources to develop well-designed apps that integrate customers’ existing account information can generate incremental sales.
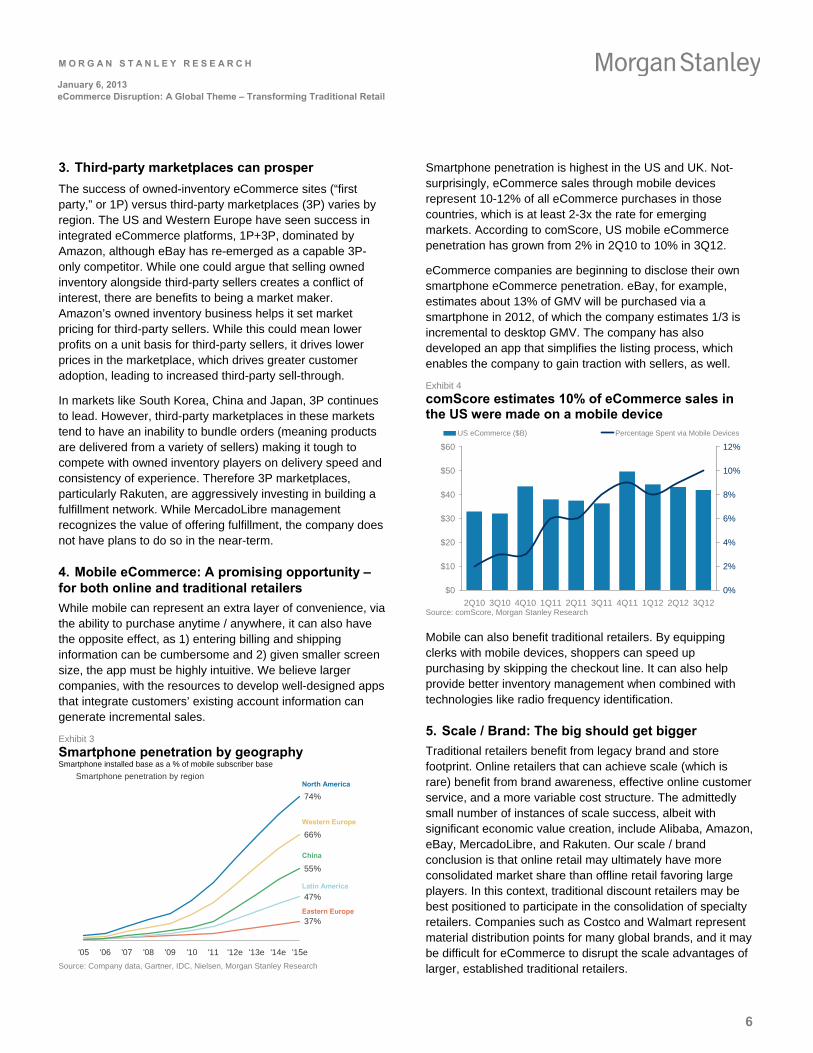
Exhibit 3
Smartphone penetration by geography Smartphone installed base as a % of mobile subscriber base
Smartphone penetration by region
37%
47%
55%
66%
74%
'05 '06 '07 '08 '09 '10 '11 '12e '13e '14e '15e
North America
Western Europe
China
Latin America
Eastern Europe
Source: Company data, Gartner, IDC, Nielsen, Morgan Stanley Research
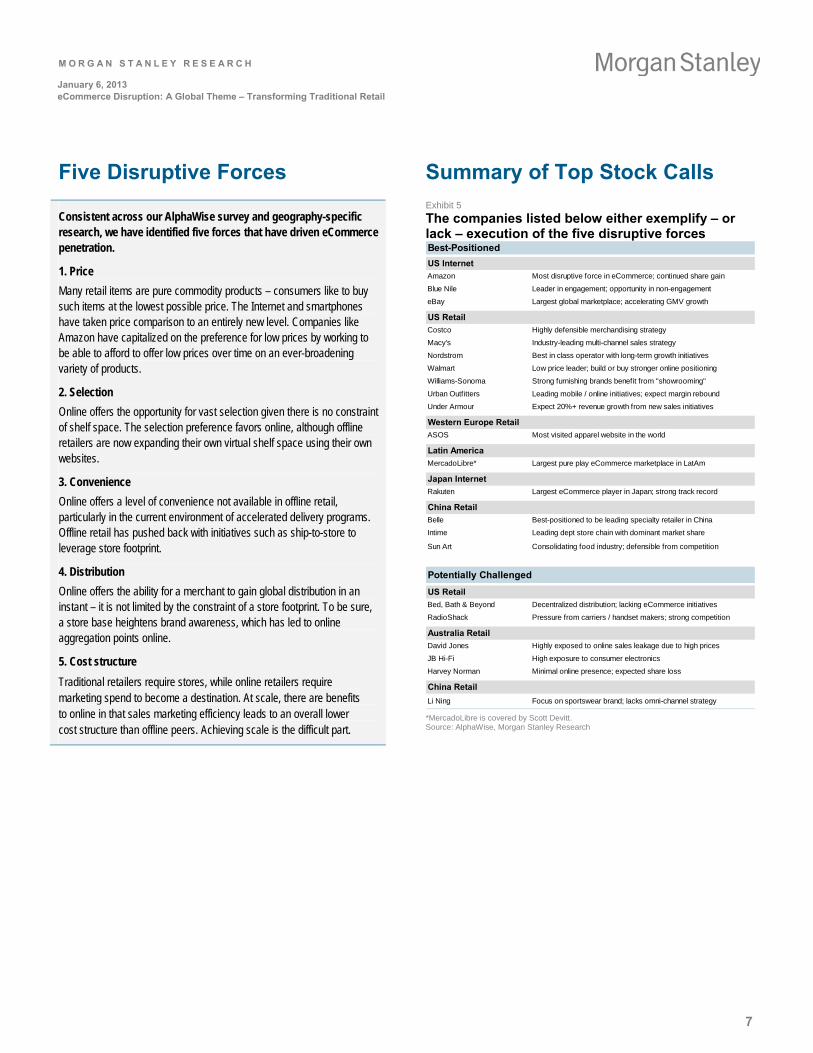
Smartphone penetration is highest in the US and UK. Not-surprisingly, eCommerce sales through mobile devices represent 10-12% of all eCommerce purchases in those countries, which is at least 2-3x the rate for emerging markets. According to comScore, US mobile eCommerce penetration has grown from 2% in 2Q10 to 10% in 3Q12.
eCommerce companies are beginning to disclose their own smartphone eCommerce penetration. eBay, for example, estimates about 13% of GMV will be purchased via a smartphone in 2012, of which the company estimates 1/3 is incremental to desktop GMV. The company has also developed an app that simplifies the listing process, which enables the company to gain traction with sellers, as well.
Exhibit 4
comScore estimates 10% of eCommerce sales in the US were made on a mobile device
$0
$10
$20
$30
$40
$50
$60
2Q10 3Q10 4Q10 1Q11 2Q11 3Q11 4Q11 1Q12 2Q12 3Q12
0%
2%
4%
6%
8%
10%
12%
US eCommerce ($B) Percentage Spent via Mobile Devices
Source: comScore, Morgan Stanley Research
Mobile can also benefit traditional retailers. By equipping clerks with mobile devices, shoppers can speed up purchasing by skipping the checkout line. It can also help provide better inventory management when combined with technologies like radio frequency identification.
5. Scale / Brand: The big should get bigger
Traditional retailers benefit from legacy brand and store footprint. Online retailers that can achieve scale (which is rare) benefit from brand awareness, effective online customer service, and a more variable cost structure. The admittedly small number of instances of scale success, albeit with significant economic value creation, include Alibaba, Amazon, eBay, MercadoLibre, and Rakuten. Our scale / brand conclusion is that online retail may ultimately have more consolidated market share than offline retail favoring large players. In this context, traditional discount retailers may be best positioned to participate in the consolidation of specialty retailers. Companies such as Costco and Walmart represent material distribution points for many global brands, and it may be difficult for eCommerce to disrupt the scale advantages of larger, established traditional retailers.
M O R G A N S T A N L E Y R E S E A R C H
7
January 6, 2013 eCommerce Disruption: A Global Theme – Transforming Traditional Retail
Five Disruptive Forces Summary of Top Stock Calls
Consistent across our AlphaWise survey and geography-specific research, we have identified five forces that have driven eCommerce penetration.
1. Price
Many retail items are pure commodity products – consumers like to buy such items at the lowest possible price. The Internet and smartphones have taken price comparison to an entirely new level. Companies like Amazon have capitalized on the preference for low prices by working to be able to afford to offer low prices over time on an ever-broadening variety of products.
2. Selection
Online offers the opportunity for vast selection given there is no constraint of shelf space. The selection preference favors online, although offline retailers are now expanding their own virtual shelf space using their own websites.
3. Convenience
Online offers a level of convenience not available in offline retail, particularly in the current environment of accelerated delivery programs. Offline retail has pushed back with initiatives such as ship-to-store to leverage store footprint.
4. Distribution
Online offers the ability for a merchant to gain global distribution in an instant – it is not limited by the constraint of a store footprint. To be sure, a store base heightens brand awareness, which has led to online aggregation points online.
5. Cost structure
Traditional retailers require stores, while online retailers require marketing spend to become a destination. At scale, there are benefits to online in that sales marketing efficiency leads to an overall lower cost structure than offline peers. Achieving scale is the difficult part.
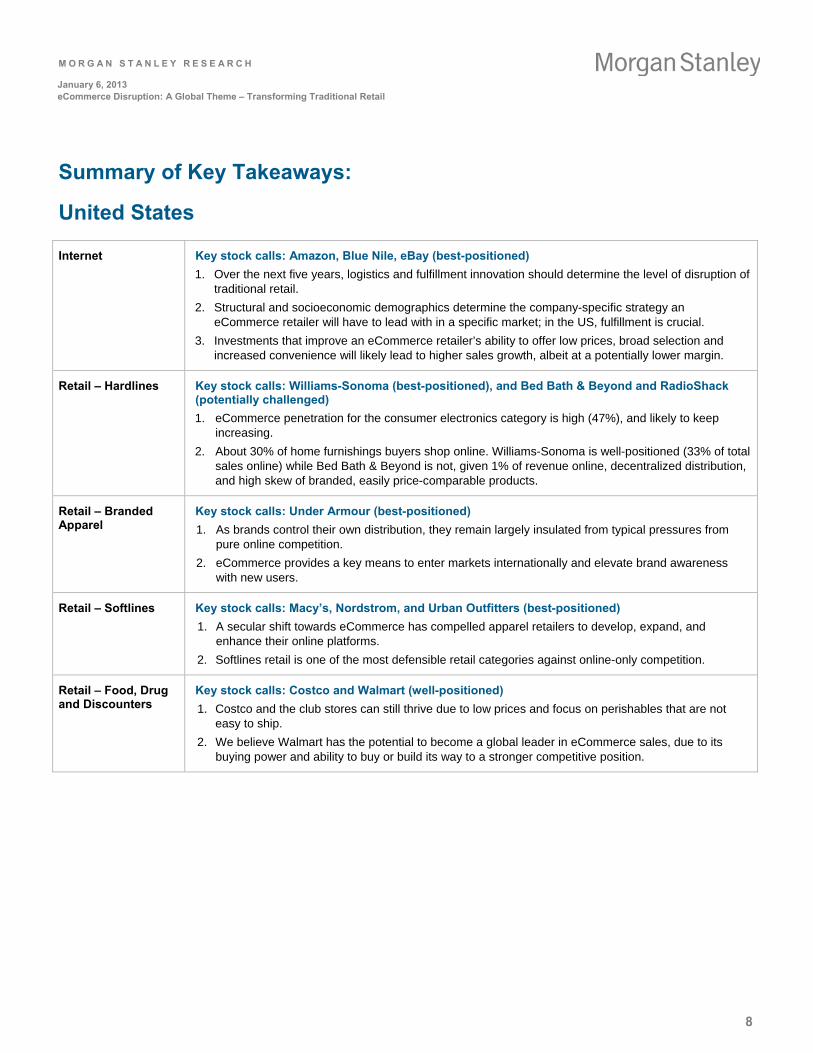
Exhibit 5
The companies listed below either exemplify – or lack – execution of the five disruptive forces Best-Positioned
US Internet
Amazon Most disruptive force in eCommerce; continued share gain
Blue Nile Leader in engagement; opportunity in non-engagement
eBay Largest global marketplace; accelerating GMV growth
US Retail
Costco Highly defensible merchandising strategy
Macy's Industry-leading multi-channel sales strategy
Nordstrom Best in class operator with long-term growth initiatives
Walmart Low price leader; build or buy stronger online positioning
Williams-Sonoma Strong furnishing brands benefit from "showrooming"
Urban Outfitters Leading mobile / online initiatives; expect margin rebound
Under Armour Expect 20%+ revenue growth from new sales initiatives
Western Europe Retail
ASOS Most visited apparel website in the world
Latin America
MercadoLibre* Largest pure play eCommerce marketplace in LatAm
Japan Internet
Rakuten Largest eCommerce player in Japan; strong track record
China Retail
Belle Best-positioned to be leading specialty retailer in China
Intime Leading dept store chain with dominant market share
Sun Art Consolidating food industry; defensible from competition
Potentially Challenged
US Retail
Bed, Bath & Beyond Decentralized distribution; lacking eCommerce initiatives
RadioShack Pressure from carriers / handset makers; strong competition
Australia Retail
David Jones Highly exposed to online sales leakage due to high prices
JB Hi-Fi High exposure to consumer electronics
Harvey Norman Minimal online presence; expected share loss
China Retail
Li Ning Focus on sportswear brand; lacks omni-channel strategy *MercadoLibre is covered by Scott Devitt. Source: AlphaWise, Morgan Stanley Research
M O R G A N S T A N L E Y R E S E A R C H
8
January 6, 2013 eCommerce Disruption: A Global Theme – Transforming Traditional Retail
Summary of Key Takeaways:
United States
Internet
Key stock calls: Amazon, Blue Nile, eBay (best-positioned)
1. Over the next five years, logistics and fulfillment innovation should determine the level of disruption of traditional retail.
2. Structural and socioeconomic demographics determine the company-specific strategy an eCommerce retailer will have to lead with in a specific market; in the US, fulfillment is crucial.
3. Investments that improve an eCommerce retailer’s ability to offer low prices, broad selection and increased convenience will likely lead to higher sales growth, albeit at a potentially lower margin.
Retail – Hardlines
Key stock calls: Williams-Sonoma (best-positioned), and Bed Bath & Beyond and RadioShack (potentially challenged)
1. eCommerce penetration for the consumer electronics category is high (47%), and likely to keep increasing.
2. About 30% of home furnishings buyers shop online. Williams-Sonoma is well-positioned (33% of total sales online) while Bed Bath & Beyond is not, given 1% of revenue online, decentralized distribution, and high skew of branded, easily price-comparable products.
Retail – Branded Apparel
Key stock calls: Under Armour (best-positioned)
1. As brands control their own distribution, they remain largely insulated from typical pressures from pure online competition.
2. eCommerce provides a key means to enter markets internationally and elevate brand awareness with new users.
Retail – Softlines
Key stock calls: Macy’s, Nordstrom, and Urban Outfitters (best-positioned)
1. A secular shift towards eCommerce has compelled apparel retailers to develop, expand, and enhance their online platforms.
2. Softlines retail is one of the most defensible retail categories against online-only competition.
Retail – Food, Drug and Discounters
Key stock calls: Costco and Walmart (well-positioned)
1. Costco and the club stores can still thrive due to low prices and focus on perishables that are not easy to ship.
2. We believe Walmart has the potential to become a global leader in eCommerce sales, due to its buying power and ability to buy or build its way to a stronger competitive position.
M O R G A N S T A N L E Y R E S E A R C H
9
January 6, 2013 eCommerce Disruption: A Global Theme – Transforming Traditional Retail
Western Europe
Retail
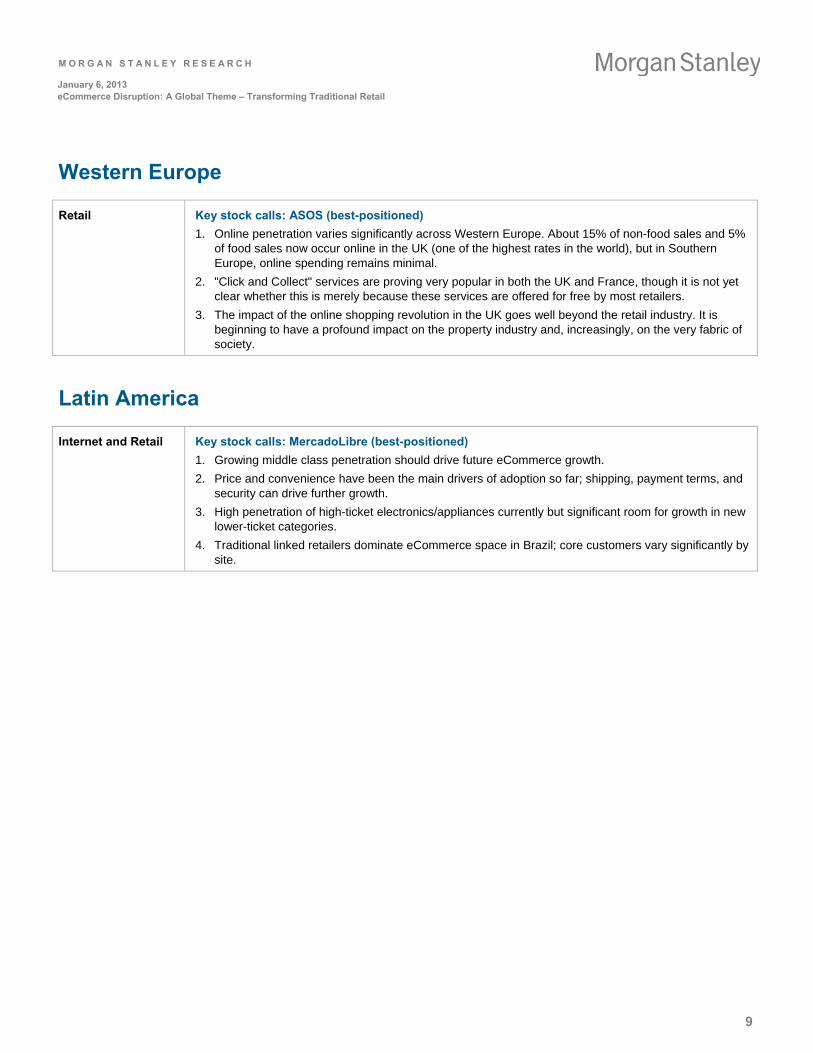
Key stock calls: ASOS (best-positioned)
1. Online penetration varies significantly across Western Europe. About 15% of non-food sales and 5% of food sales now occur online in the UK (one of the highest rates in the world), but in Southern Europe, online spending remains minimal.
2. "Click and Collect" services are proving very popular in both the UK and France, though it is not yet clear whether this is merely because these services are offered for free by most retailers.
3. The impact of the online shopping revolution in the UK goes well beyond the retail industry. It is beginning to have a profound impact on the property industry and, increasingly, on the very fabric of society.
Latin America
Internet and Retail
Key stock calls: MercadoLibre (best-positioned)
1. Growing middle class penetration should drive future eCommerce growth.
2. Price and convenience have been the main drivers of adoption so far; shipping, payment terms, and security can drive further growth.
3. High penetration of high-ticket electronics/appliances currently but significant room for growth in new lower-ticket categories.
4. Traditional linked retailers dominate eCommerce space in Brazil; core customers vary significantly by site.
M O R G A N S T A N L E Y R E S E A R C H
10
January 6, 2013 eCommerce Disruption: A Global Theme – Transforming Traditional Retail
China
Internet
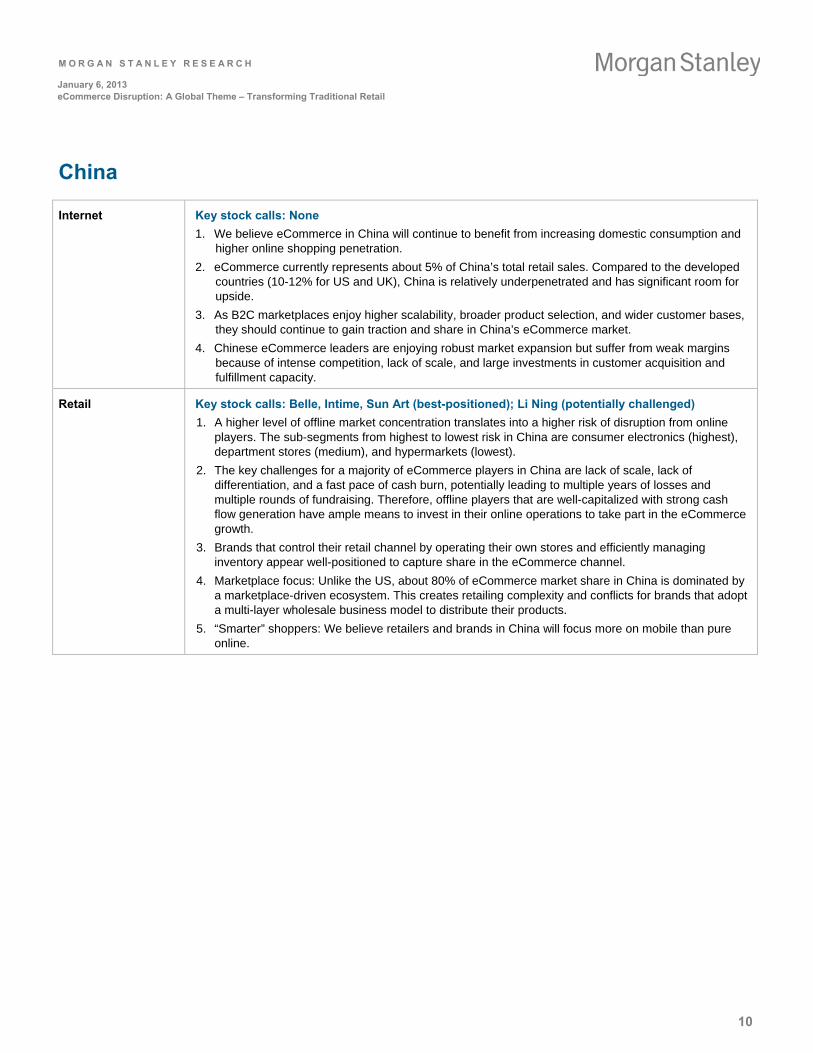
Key stock calls: None
1. We believe eCommerce in China will continue to benefit from increasing domestic consumption and higher online shopping penetration.
2. eCommerce currently represents about 5% of China’s total retail sales. Compared to the developed countries (10-12% for US and UK), China is relatively underpenetrated and has significant room for upside.
3. As B2C marketplaces enjoy higher scalability, broader product selection, and wider customer bases, they should continue to gain traction and share in China’s eCommerce market.
4. Chinese eCommerce leaders are enjoying robust market expansion but suffer from weak margins because of intense competition, lack of scale, and large investments in customer acquisition and fulfillment capacity.
Retail Key stock calls: Belle, Intime, Sun Art (best-positioned); Li Ning (potentially challenged)
1. A higher level of offline market concentration translates into a higher risk of disruption from online players. The sub-segments from highest to lowest risk in China are consumer electronics (highest), department stores (medium), and hypermarkets (lowest).
2. The key challenges for a majority of eCommerce players in China are lack of scale, lack of differentiation, and a fast pace of cash burn, potentially leading to multiple years of losses and multiple rounds of fundraising. Therefore, offline players that are well-capitalized with strong cash flow generation have ample means to invest in their online operations to take part in the eCommerce growth.
3. Brands that control their retail channel by operating their own stores and efficiently managing inventory appear well-positioned to capture share in the eCommerce channel.
4. Marketplace focus: Unlike the US, about 80% of eCommerce market share in China is dominated by a marketplace-driven ecosystem. This creates retailing complexity and conflicts for brands that adopt a multi-layer wholesale business model to distribute their products.
5. “Smarter” shoppers: We believe retailers and brands in China will focus more on mobile than pure online.
M O R G A N S T A N L E Y R E S E A R C H
11
January 6, 2013 eCommerce Disruption: A Global Theme – Transforming Traditional Retail
Russia
Internet
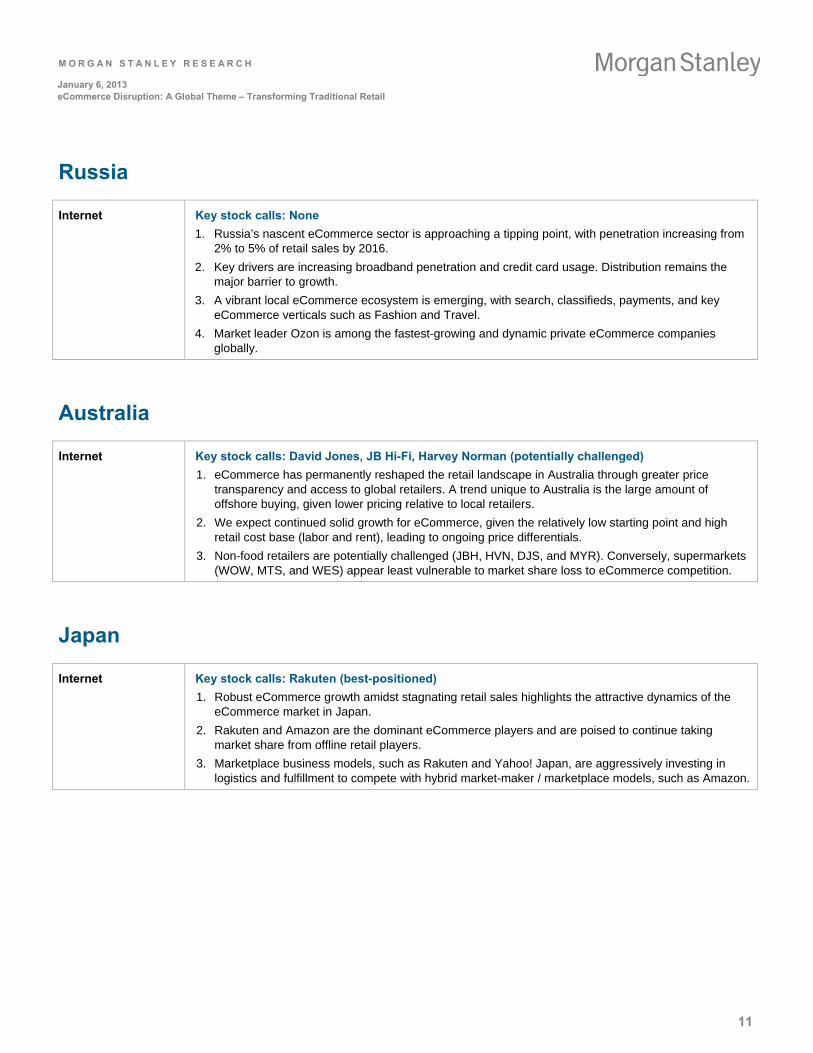
Key stock calls: None
1. Russia’s nascent eCommerce sector is approaching a tipping point, with penetration increasing from 2% to 5% of retail sales by 2016.
2. Key drivers are increasing broadband penetration and credit card usage. Distribution remains the major barrier to growth.
3. A vibrant local eCommerce ecosystem is emerging, with search, classifieds, payments, and key eCommerce verticals such as Fashion and Travel.
4. Market leader Ozon is among the fastest-growing and dynamic private eCommerce companies globally.
Australia
Internet
Key stock calls: David Jones, JB Hi-Fi, Harvey Norman (potentially challenged)
1. eCommerce has permanently reshaped the retail landscape in Australia through greater price transparency and access to global retailers. A trend unique to Australia is the large amount of offshore buying, given lower pricing relative to local retailers.
2. We expect continued solid growth for eCommerce, given the relatively low starting point and high retail cost base (labor and rent), leading to ongoing price differentials.
3. Non-food retailers are potentially challenged (JBH, HVN, DJS, and MYR). Conversely, supermarkets (WOW, MTS, and WES) appear least vulnerable to market share loss to eCommerce competition.
Japan
Internet
Key stock calls: Rakuten (best-positioned)
1. Robust eCommerce growth amidst stagnating retail sales highlights the attractive dynamics of the eCommerce market in Japan.
2. Rakuten and Amazon are the dominant eCommerce players and are poised to continue taking market share from offline retail players.
3. Marketplace business models, such as Rakuten and Yahoo! Japan, are aggressively investing in logistics and fulfillment to compete with hybrid market-maker / marketplace models, such as Amazon.
M O R G A N S T A N L E Y R E S E A R C H
12
January 6, 2013 eCommerce Disruption: A Global Theme – Transforming Traditional Retail
Key AlphaWise Conclusions
1. Pursuit of “value” and “convenience” is universal motivation that continues to drive eCommerce Of the 6,000+ online shoppers we surveyed across eight markets, 49% think the top reason to shop online is “it’s cheaper,” while 34% think it’s “to save time” or the ability to “shop from anywhere at any time.”
Similarly, the formula for success as an online retailer is largely the same across markets – “low prices,” “broad selection,” “easy to use website,” and “free shipping” are the top reasons consumer pick their “favorite” online retailers.
Consumers’ quest for cost-/time-saving will continue to propel eCommerce – 65% of online shoppers feel it is increasingly more advantageous to buy most products online.
2. In emerging markets, eCommerce needs to close the “trust” gap Consumers in emerging markets are much more likely than their counterparts in developed markets to mention lack of trust as an obstacle to buying on line, such as in the security of online payments (32% in EM vs. 27% in DM), online merchants (23% vs. 14%), quality of online merchandise (21% vs. 12%), or worry-free shipping (24% vs. 9%). In emerging markets this “trust gap” outweighs lack of credit cards (15%) or “delivery takes too long” (17%).
3. Consumers want “free” shipping more than “fast” shipping Globally, 80% of online shoppers would choose the cheapest shipping options, while just 22% are willing to pay more for faster shipping. Free shipping is already ubiquitous in developed eCommerce market such as the US and UK, and we expect it to become standard elsewhere, as the overwhelming majority in all markets surveyed (86%) think they would buy more online if retailers offer free shipping.
“Same day shipping” seems to have limited appeal in developed markets, but interestingly could be a strong stimulant for eCommerce in emerging markets, which still battle the “trust” issue.
4. Physical stores can be a strategic asset in an omni-channel retail world The success of the Amazons of the world proved that the absence of physical locations is not a handicap and consumers can be “channel-neutral” so long as their need for value, convenience, and selection is met. Not surprisingly, opinions are divided on the importance of physical stores – 35% prefer buying online from retailers with brick-and-mortar presence, while 23% prefer online-only stores.
Currently about 90% of online orders are fulfilled via delivery to a home or work address. Although in some markets many online shoppers have had the experience of ordering online and picking up in stores (UK 39%, US 33%), only one in five globally would prefer in-store pickup to delivery.
Return/exchange is an area where stores leverage their physical presence. One of the biggest obstacles to eCommerce everywhere is the notion that it is easier to return products if bought in stores. Consumers overwhelmingly (75%) prefer not having to pay shipping for return/exchange. Sixty-two percent would buy online more often if they could return or exchange products at a store.
5. Category vulnerability varies by market Books have the highest online penetration among over a dozen product categories in all but three emerging markets: , Brazil, China, and Russia.
Consumer electronics (CE) is also highly penetrated across all markets. Interestingly, a higher percentage of emerging market CE buyers bought online than those in developed markets (66% EM vs. 55% DM).
Buying apparel is immensely popular in China. In the last 12 months, 91% of urban mass-affluent Chinese consumers bought clothing online. And among shoe buyers, 82% bought online; for athletic apparel, the figure was 73%.
While groceries remains one of the most insulated categories, many consumers in densely populated markets have begun experimenting with online buying (44% in Japan, 29% in UK).
Core Questions for Evidence Research
How are consumers shopping online today?
How do consumer attitudes toward online shopping differ?
Which categories are more vulnerable to online threat?
What Gives Us Confidence
In Oct-Nov 2012, we conducted an online survey of 8,000+ consumers in 8 countries. The survey sample is representative of the 18+ population by gender, age, geography and income in Australia, Germany, Japan, Russia, UK and US. Respondents in Brazil are a national sample of online consumers from the A, B & C socio-economic classes, and in China, online consumers from 14 Tier 1&2 cities with above-average education and income. At about1,000 sample size, conclusions based on the total sample of each country have a maximum margin of error of +/- 3% at 95% confidence level.
M O R G A N S T A N L E Y R E S E A R C H
13
January 6, 2013 eCommerce Disruption: A Global Theme – Transforming Traditional Retail
eCommerce Disruption: A Global Theme
Segment Analysis by Region
M O R G A N S T A N L E Y B L U E P A P E R
M O R G A N S T A N L E Y R E S E A R C H
14
January 6, 2013 eCommerce Disruption: A Global Theme – Transforming Traditional Retail
US Internet
Scott Devitt
Andrew Ruud
Zachary Arrick
Nishant Verma
Executive Summary / Key Takeaways
Best Positioned: Amazon, eBay, and Blue Nile
1. Over the next five years, logistics and fulfillment innovation will determine the level of disruption of traditional retail; Amazon is best-positioned to breakaway from competing traditional retailers and eCommerce players that do not have a vertically integrated fulfillment network.
2. Structural and socio-economic demographics predetermine the company-specific strategy an eCommerce retailer will have to lead with in a specific market; in the US, fulfillment is crucial.
3. Investments that improve an eCommerce retailer’s ability to offer low prices, broad selection and increased convenience will likely lead to higher sales growth; albeit at a potentially lower margin. Amazon has traditionally led the way – so far there has been no proof of any competing eCommerce or traditional retailer that is willing to do so at that level.
Exhibit 6
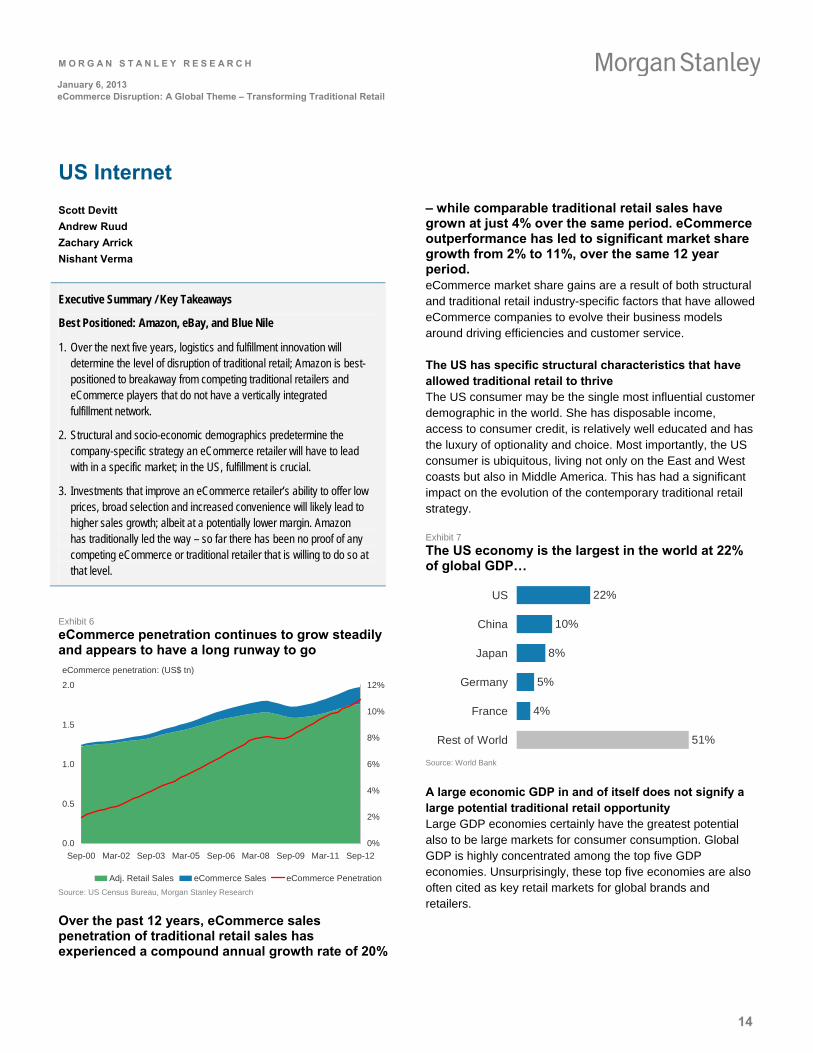
eCommerce penetration continues to grow steadily and appears to have a long runway to go
eCommerce penetration: (US$ tn)
0.0
0.5
1.0
1.5
2.0
Sep-00 Mar-02 Sep-03 Mar-05 Sep-06 Mar-08 Sep-09 Mar-11 Sep-12
0%
2%
4%
6%
8%
10%
12%
Adj. Retail Sales eCommerce Sales eCommerce Penetration Source: US Census Bureau, Morgan Stanley Research
Over the past 12 years, eCommerce sales penetration of traditional retail sales has experienced a compound annual growth rate of 20%
– while comparable traditional retail sales have grown at just 4% over the same period. eCommerce outperformance has led to significant market share growth from 2% to 11%, over the same 12 year period. eCommerce market share gains are a result of both structural and traditional retail industry-specific factors that have allowed eCommerce companies to evolve their business models around driving efficiencies and customer service.
The US has specific structural characteristics that have allowed traditional retail to thrive The US consumer may be the single most influential customer demographic in the world. She has disposable income, access to consumer credit, is relatively well educated and has the luxury of optionality and choice. Most importantly, the US consumer is ubiquitous, living not only on the East and West coasts but also in Middle America. This has had a significant impact on the evolution of the contemporary traditional retail strategy.
Exhibit 7
The US economy is the largest in the world at 22% of global GDP…
22%
10%
8%
5%
4%
51%
US
China
Japan
Germany
France
Rest of World
Source: World Bank
A large economic GDP in and of itself does not signify a large potential traditional retail opportunity Large GDP economies certainly have the greatest potential also to be large markets for consumer consumption. Global GDP is highly concentrated among the top five GDP economies. Unsurprisingly, these top five economies are also often cited as key retail markets for global brands and retailers.
M O R G A N S T A N L E Y R E S E A R C H
15
January 6, 2013 eCommerce Disruption: A Global Theme – Transforming Traditional Retail
Exhibit 8
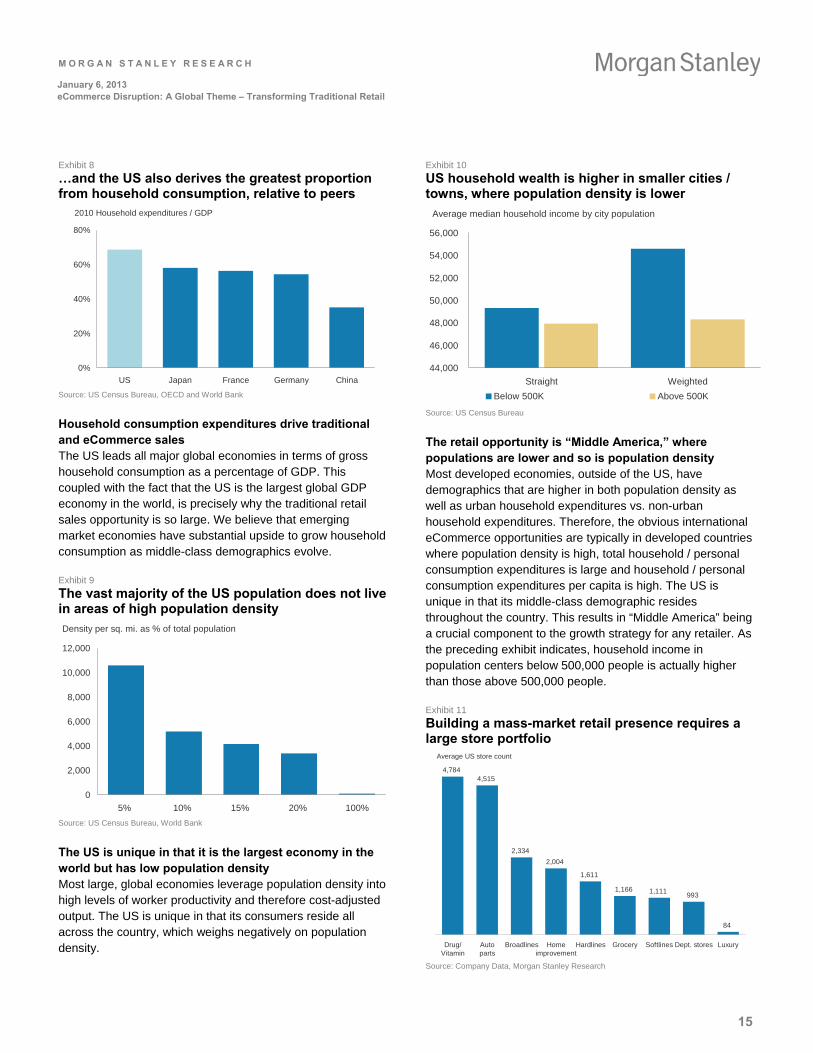
…and the US also derives the greatest proportion from household consumption, relative to peers
2010 Household expenditures / GDP
0%
20%
40%
60%
80%
US Japan France Germany China Source: US Census Bureau, OECD and World Bank
Household consumption expenditures drive traditional and eCommerce sales The US leads all major global economies in terms of gross household consumption as a percentage of GDP. This coupled with the fact that the US is the largest global GDP economy in the world, is precisely why the traditional retail sales opportunity is so large. We believe that emerging market economies have substantial upside to grow household consumption as middle-class demographics evolve.
Exhibit 9
The vast majority of the US population does not live in areas of high population density
Density per sq. mi. as % of total population
0
2,000
4,000
6,000
8,000
10,000
12,000
5% 10% 15% 20% 100% Source: US Census Bureau, World Bank
The US is unique in that it is the largest economy in the world but has low population density Most large, global economies leverage population density into high levels of worker productivity and therefore cost-adjusted output. The US is unique in that its consumers reside all across the country, which weighs negatively on population density.
Exhibit 10
US household wealth is higher in smaller cities / towns, where population density is lower
Average median household income by city population
44,000
46,000
48,000
50,000
52,000
54,000
56,000
Straight Weighted
Below 500K Above 500K
Source: US Census Bureau
The retail opportunity is “Middle America,” where populations are lower and so is population density Most developed economies, outside of the US, have demographics that are higher in both population density as well as urban household expenditures vs. non-urban household expenditures. Therefore, the obvious international eCommerce opportunities are typically in developed countries where population density is high, total household / personal consumption expenditures is large and household / personal consumption expenditures per capita is high. The US is unique in that its middle-class demographic resides throughout the country. This results in “Middle America” being a crucial component to the growth strategy for any retailer. As the preceding exhibit indicates, household income in population centers below 500,000 people is actually higher than those above 500,000 people.
Exhibit 11
Building a mass-market retail presence requires a large store portfolio
Average US store count
4,7844,515
2,334
2,004
1,611
1,166 1,111993
84
Drug/Vitamin
Autoparts
Broadlines Homeimprovement
Hardlines Grocery Softlines Dept. stores Luxury
Source: Company Data, Morgan Stanley Research
M O R G A N S T A N L E Y R E S E A R C H
16
January 6, 2013 eCommerce Disruption: A Global Theme – Transforming Traditional Retail
Traditional retailers must invest significant resources in order to address the fragmented US population In order to reach critical mass and address the entire US population, traditional retailers must either invest massive amounts of capital to build out a store base or finance off-balance sheet operating leases. With very few retailers owning a substantial portion of their stores, rent and occupancy costs represent sizable expenses for most retailers. Physical store footprints create a unique opportunity for eCommerce businesses since they can leverage centralized inventory management in fulfillment centers instead of incurring the large fixed costs associated with the rent and occupancy expenses. For US department stores that pay very little rent expense, we believe eCommerce companies have inventory management advantages.
Structurally, the domestic eCommerce retail channel also enjoys favorable characteristics eCommerce consumers tend to be of a higher income demographic. On the back-end, the US still offers relatively low-cost land and buildings to develop a fulfillment network. Finally, states bear the burden for public infrastructure; the Federal Government subsidizes the US Postal Service and there are two very reliable, global freight forwarding / logistics companies in FedEx and UPS to deliver eCommerce packages.
Exhibit 12
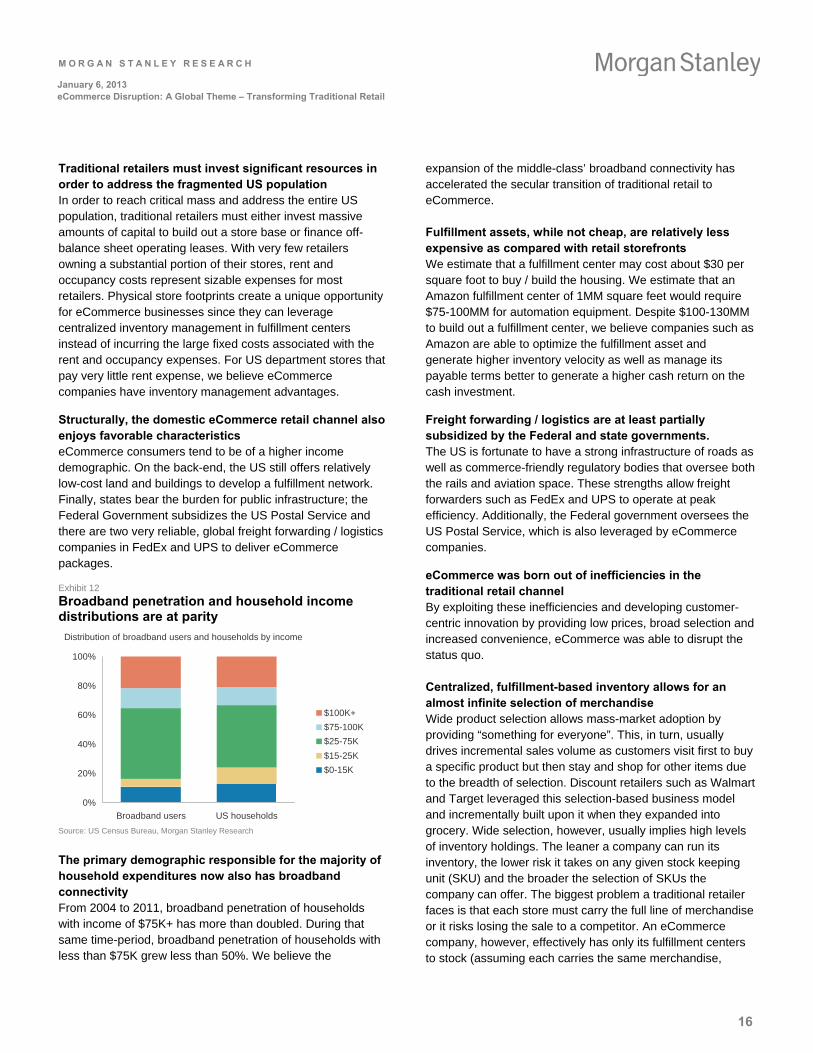
Broadband penetration and household income distributions are at parity
Distribution of broadband users and households by income
0%
20%
40%
60%
80%
100%
Broadband users US households
$100K+
$75-100K
$25-75K
$15-25K
$0-15K
Source: US Census Bureau, Morgan Stanley Research
The primary demographic responsible for the majority of household expenditures now also has broadband connectivity From 2004 to 2011, broadband penetration of households with income of $75K+ has more than doubled. During that same time-period, broadband penetration of households with less than $75K grew less than 50%. We believe the
expansion of the middle-class’ broadband connectivity has accelerated the secular transition of traditional retail to eCommerce.
Fulfillment assets, while not cheap, are relatively less expensive as compared with retail storefronts We estimate that a fulfillment center may cost about $30 per square foot to buy / build the housing. We estimate that an Amazon fulfillment center of 1MM square feet would require $75-100MM for automation equipment. Despite $100-130MM to build out a fulfillment center, we believe companies such as Amazon are able to optimize the fulfillment asset and generate higher inventory velocity as well as manage its payable terms better to generate a higher cash return on the cash investment.
Freight forwarding / logistics are at least partially subsidized by the Federal and state governments. The US is fortunate to have a strong infrastructure of roads as well as commerce-friendly regulatory bodies that oversee both the rails and aviation space. These strengths allow freight forwarders such as FedEx and UPS to operate at peak efficiency. Additionally, the Federal government oversees the US Postal Service, which is also leveraged by eCommerce companies.
eCommerce was born out of inefficiencies in the traditional retail channel By exploiting these inefficiencies and developing customer-centric innovation by providing low prices, broad selection and increased convenience, eCommerce was able to disrupt the status quo.
Centralized, fulfillment-based inventory allows for an almost infinite selection of merchandise Wide product selection allows mass-market adoption by providing “something for everyone”. This, in turn, usually drives incremental sales volume as customers visit first to buy a specific product but then stay and shop for other items due to the breadth of selection. Discount retailers such as Walmart and Target leveraged this selection-based business model and incrementally built upon it when they expanded into grocery. Wide selection, however, usually implies high levels of inventory holdings. The leaner a company can run its inventory, the lower risk it takes on any given stock keeping unit (SKU) and the broader the selection of SKUs the company can offer. The biggest problem a traditional retailer faces is that each store must carry the full line of merchandise or it risks losing the sale to a competitor. An eCommerce company, however, effectively has only its fulfillment centers to stock (assuming each carries the same merchandise,
M O R G A N S T A N L E Y R E S E A R C H
17
January 6, 2013 eCommerce Disruption: A Global Theme – Transforming Traditional Retail
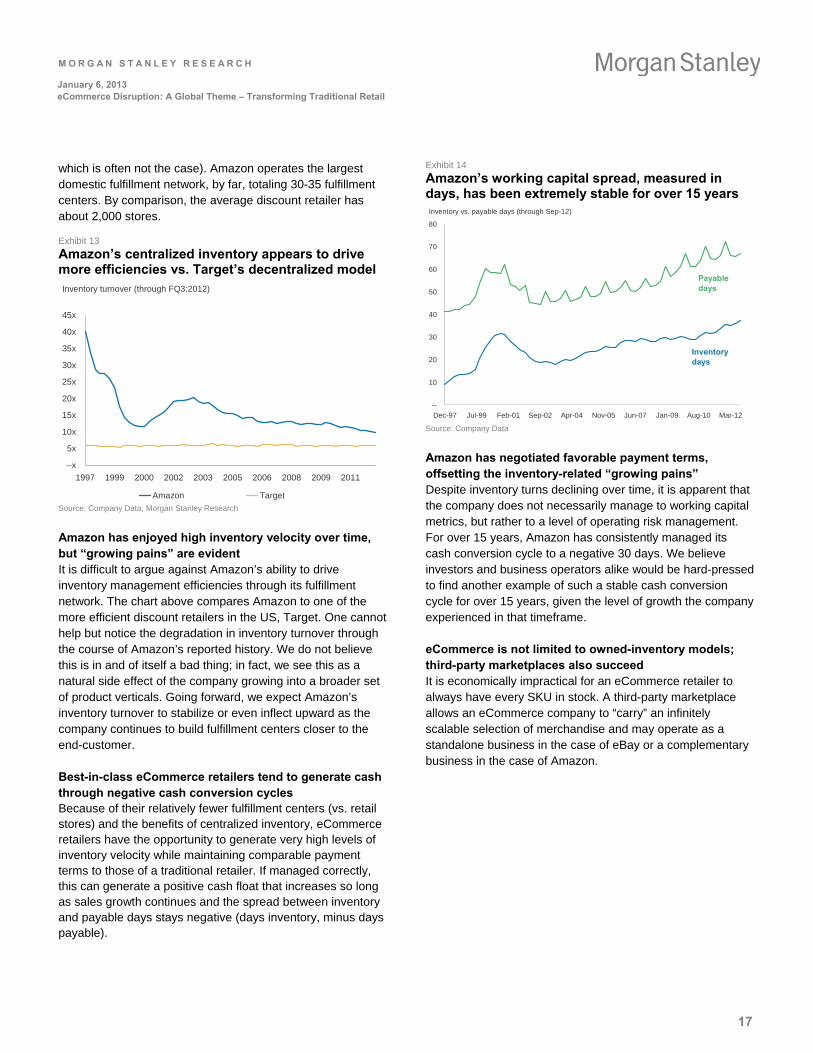
which is often not the case). Amazon operates the largest domestic fulfillment network, by far, totaling 30-35 fulfillment centers. By comparison, the average discount retailer has about 2,000 stores.
Exhibit 13
Amazon’s centralized inventory appears to drive more efficiencies vs. Target’s decentralized model Inventory turnover (through FQ3:2012)
--x
5x
10x
15x
20x
25x
30x
35x
40x
45x
1997 1999 2000 2002 2003 2005 2006 2008 2009 2011
Amazon Target Source: Company Data, Morgan Stanley Research
Amazon has enjoyed high inventory velocity over time, but “growing pains” are evident It is difficult to argue against Amazon’s ability to drive inventory management efficiencies through its fulfillment network. The chart above compares Amazon to one of the more efficient discount retailers in the US, Target. One cannot help but notice the degradation in inventory turnover through the course of Amazon’s reported history. We do not believe this is in and of itself a bad thing; in fact, we see this as a natural side effect of the company growing into a broader set of product verticals. Going forward, we expect Amazon’s inventory turnover to stabilize or even inflect upward as the company continues to build fulfillment centers closer to the end-customer.
Best-in-class eCommerce retailers tend to generate cash through negative cash conversion cycles Because of their relatively fewer fulfillment centers (vs. retail stores) and the benefits of centralized inventory, eCommerce retailers have the opportunity to generate very high levels of inventory velocity while maintaining comparable payment terms to those of a traditional retailer. If managed correctly, this can generate a positive cash float that increases so long as sales growth continues and the spread between inventory and payable days stays negative (days inventory, minus days payable).
Exhibit 14
Amazon’s working capital spread, measured in days, has been extremely stable for over 15 years Inventory vs. payable days (through Sep-12)
--
10
20
30
40
50
60
70
80
Dec-97 Jul-99 Feb-01 Sep-02 Apr-04 Nov-05 Jun-07 Jan-09 Aug-10 Mar-12
Payable days
Inventory days
Source: Company Data
Amazon has negotiated favorable payment terms, offsetting the inventory-related “growing pains” Despite inventory turns declining over time, it is apparent that the company does not necessarily manage to working capital metrics, but rather to a level of operating risk management. For over 15 years, Amazon has consistently managed its cash conversion cycle to a negative 30 days. We believe investors and business operators alike would be hard-pressed to find another example of such a stable cash conversion cycle for over 15 years, given the level of growth the company experienced in that timeframe.
eCommerce is not limited to owned-inventory models; third-party marketplaces also succeed It is economically impractical for an eCommerce retailer to always have every SKU in stock. A third-party marketplace allows an eCommerce company to “carry” an infinitely scalable selection of merchandise and may operate as a standalone business in the case of eBay or a complementary business in the case of Amazon.
M O R G A N S T A N L E Y R E S E A R C H
18
January 6, 2013 eCommerce Disruption: A Global Theme – Transforming Traditional Retail
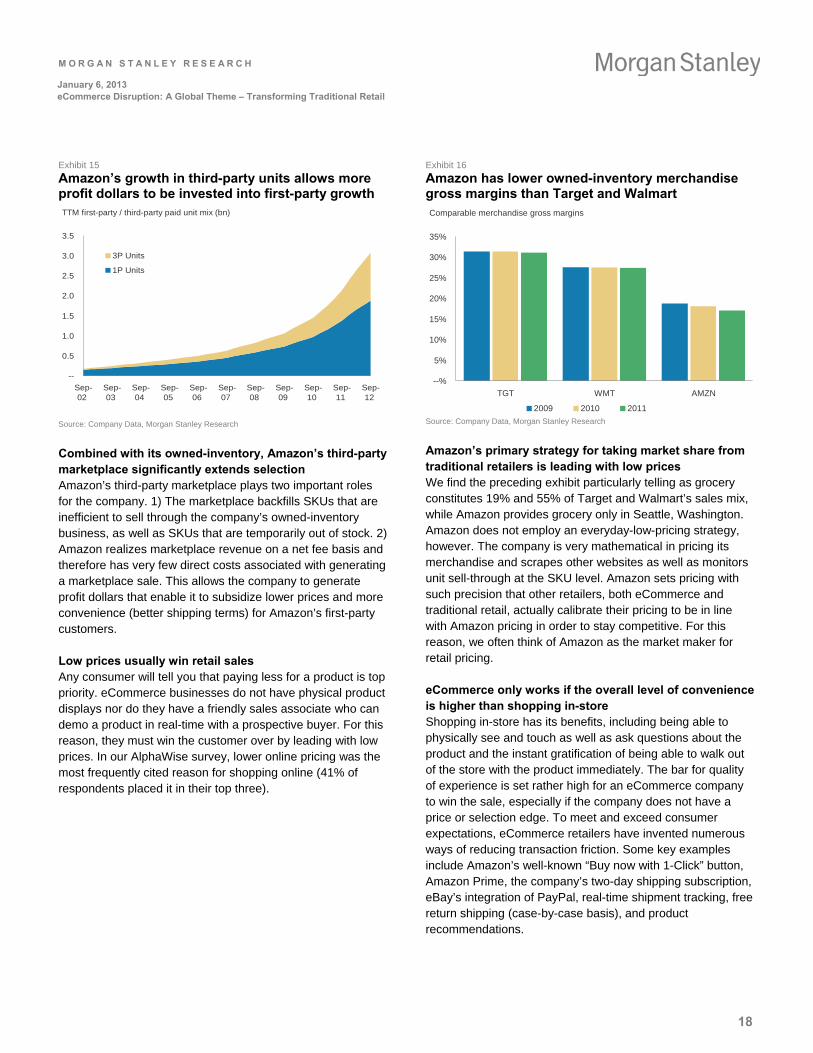
Exhibit 15
Amazon’s growth in third-party units allows more profit dollars to be invested into first-party growth TTM first-party / third-party paid unit mix (bn)
--
0.5
1.0
1.5
2.0
2.5
3.0
3.5
Sep-02
Sep-03
Sep-04
Sep-05
Sep-06
Sep-07
Sep-08
Sep-09
Sep-10
Sep-11
Sep-12
3P Units
1P Units
Source: Company Data, Morgan Stanley Research
Combined with its owned-inventory, Amazon’s third-party marketplace significantly extends selection Amazon’s third-party marketplace plays two important roles for the company. 1) The marketplace backfills SKUs that are inefficient to sell through the company’s owned-inventory business, as well as SKUs that are temporarily out of stock. 2) Amazon realizes marketplace revenue on a net fee basis and therefore has very few direct costs associated with generating a marketplace sale. This allows the company to generate profit dollars that enable it to subsidize lower prices and more convenience (better shipping terms) for Amazon’s first-party customers.
Low prices usually win retail sales Any consumer will tell you that paying less for a product is top priority. eCommerce businesses do not have physical product displays nor do they have a friendly sales associate who can demo a product in real-time with a prospective buyer. For this reason, they must win the customer over by leading with low prices. In our AlphaWise survey, lower online pricing was the most frequently cited reason for shopping online (41% of respondents placed it in their top three).
Exhibit 16
Amazon has lower owned-inventory merchandise gross margins than Target and Walmart Comparable merchandise gross margins
--%
5%
10%
15%
20%
25%
30%
35%
TGT WMT AMZN
2009 2010 2011 Source: Company Data, Morgan Stanley Research
Amazon’s primary strategy for taking market share from traditional retailers is leading with low prices We find the preceding exhibit particularly telling as grocery constitutes 19% and 55% of Target and Walmart’s sales mix, while Amazon provides grocery only in Seattle, Washington. Amazon does not employ an everyday-low-pricing strategy, however. The company is very mathematical in pricing its merchandise and scrapes other websites as well as monitors unit sell-through at the SKU level. Amazon sets pricing with such precision that other retailers, both eCommerce and traditional retail, actually calibrate their pricing to be in line with Amazon pricing in order to stay competitive. For this reason, we often think of Amazon as the market maker for retail pricing.
eCommerce only works if the overall level of convenience is higher than shopping in-store Shopping in-store has its benefits, including being able to physically see and touch as well as ask questions about the product and the instant gratification of being able to walk out of the store with the product immediately. The bar for quality of experience is set rather high for an eCommerce company to win the sale, especially if the company does not have a price or selection edge. To meet and exceed consumer expectations, eCommerce retailers have invented numerous ways of reducing transaction friction. Some key examples include Amazon’s well-known “Buy now with 1-Click” button, Amazon Prime, the company’s two-day shipping subscription, eBay’s integration of PayPal, real-time shipment tracking, free return shipping (case-by-case basis), and product recommendations.
M O R G A N S T A N L E Y R E S E A R C H
19
January 6, 2013 eCommerce Disruption: A Global Theme – Transforming Traditional Retail
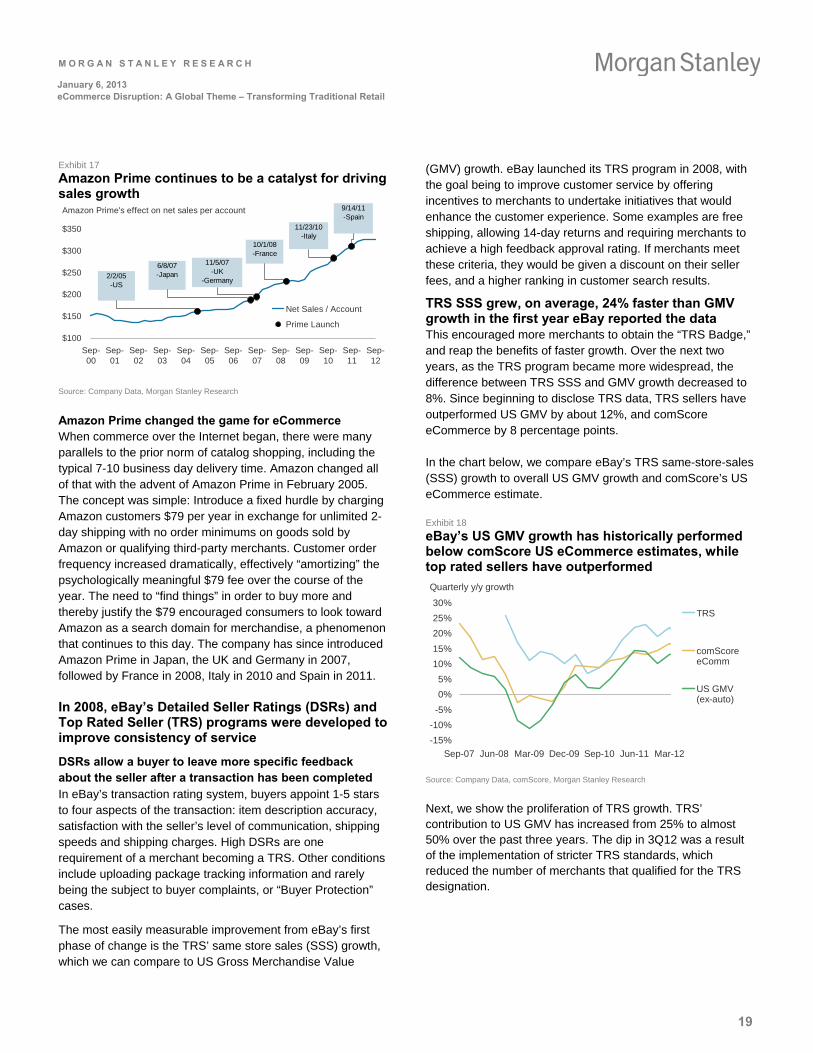
Exhibit 17
Amazon Prime continues to be a catalyst for driving sales growth Amazon Prime's effect on net sales per account
$100
$150
$200
$250
$300
$350
Sep-00
Sep-01
Sep-02
Sep-03
Sep-04
Sep-05
Sep-06
Sep-07
Sep-08
Sep-09
Sep-10
Sep-11
Sep-12
Net Sales / Account
Prime Launch
2/2/05-US
6/8/07-Japan
11/5/07-UK
-Germany
10/1/08-France
11/23/10-Italy
9/14/11-Spain
Source: Company Data, Morgan Stanley Research
Amazon Prime changed the game for eCommerce When commerce over the Internet began, there were many parallels to the prior norm of catalog shopping, including the typical 7-10 business day delivery time. Amazon changed all of that with the advent of Amazon Prime in February 2005. The concept was simple: Introduce a fixed hurdle by charging Amazon customers $79 per year in exchange for unlimited 2-day shipping with no order minimums on goods sold by Amazon or qualifying third-party merchants. Customer order frequency increased dramatically, effectively “amortizing” the psychologically meaningful $79 fee over the course of the year. The need to “find things” in order to buy more and thereby justify the $79 encouraged consumers to look toward Amazon as a search domain for merchandise, a phenomenon that continues to this day. The company has since introduced Amazon Prime in Japan, the UK and Germany in 2007, followed by France in 2008, Italy in 2010 and Spain in 2011.
In 2008, eBay’s Detailed Seller Ratings (DSRs) and Top Rated Seller (TRS) programs were developed to improve consistency of service
DSRs allow a buyer to leave more specific feedback about the seller after a transaction has been completed In eBay’s transaction rating system, buyers appoint 1-5 stars to four aspects of the transaction: item description accuracy, satisfaction with the seller’s level of communication, shipping speeds and shipping charges. High DSRs are one requirement of a merchant becoming a TRS. Other conditions include uploading package tracking information and rarely being the subject to buyer complaints, or “Buyer Protection” cases.
The most easily measurable improvement from eBay’s first phase of change is the TRS’ same store sales (SSS) growth, which we can compare to US Gross Merchandise Value
(GMV) growth. eBay launched its TRS program in 2008, with the goal being to improve customer service by offering incentives to merchants to undertake initiatives that would enhance the customer experience. Some examples are free shipping, allowing 14-day returns and requiring merchants to achieve a high feedback approval rating. If merchants meet these criteria, they would be given a discount on their seller fees, and a higher ranking in customer search results.
TRS SSS grew, on average, 24% faster than GMV growth in the first year eBay reported the data This encouraged more merchants to obtain the “TRS Badge,” and reap the benefits of faster growth. Over the next two years, as the TRS program became more widespread, the difference between TRS SSS and GMV growth decreased to 8%. Since beginning to disclose TRS data, TRS sellers have outperformed US GMV by about 12%, and comScore eCommerce by 8 percentage points.
In the chart below, we compare eBay’s TRS same-store-sales (SSS) growth to overall US GMV growth and comScore’s US eCommerce estimate.
Exhibit 18
eBay’s US GMV growth has historically performed below comScore US eCommerce estimates, while top rated sellers have outperformed
Quarterly y/y growth
-15%
-10%
-5%
0%
5%
10%
15%
20%
25%
30%
Sep-07 Jun-08 Mar-09 Dec-09 Sep-10 Jun-11 Mar-12
TRS
comScoreeComm
US GMV(ex-auto)
Source: Company Data, comScore, Morgan Stanley Research
Next, we show the proliferation of TRS growth. TRS’ contribution to US GMV has increased from 25% to almost 50% over the past three years. The dip in 3Q12 was a result of the implementation of stricter TRS standards, which reduced the number of merchants that qualified for the TRS designation.
M O R G A N S T A N L E Y R E S E A R C H
20
January 6, 2013 eCommerce Disruption: A Global Theme – Transforming Traditional Retail
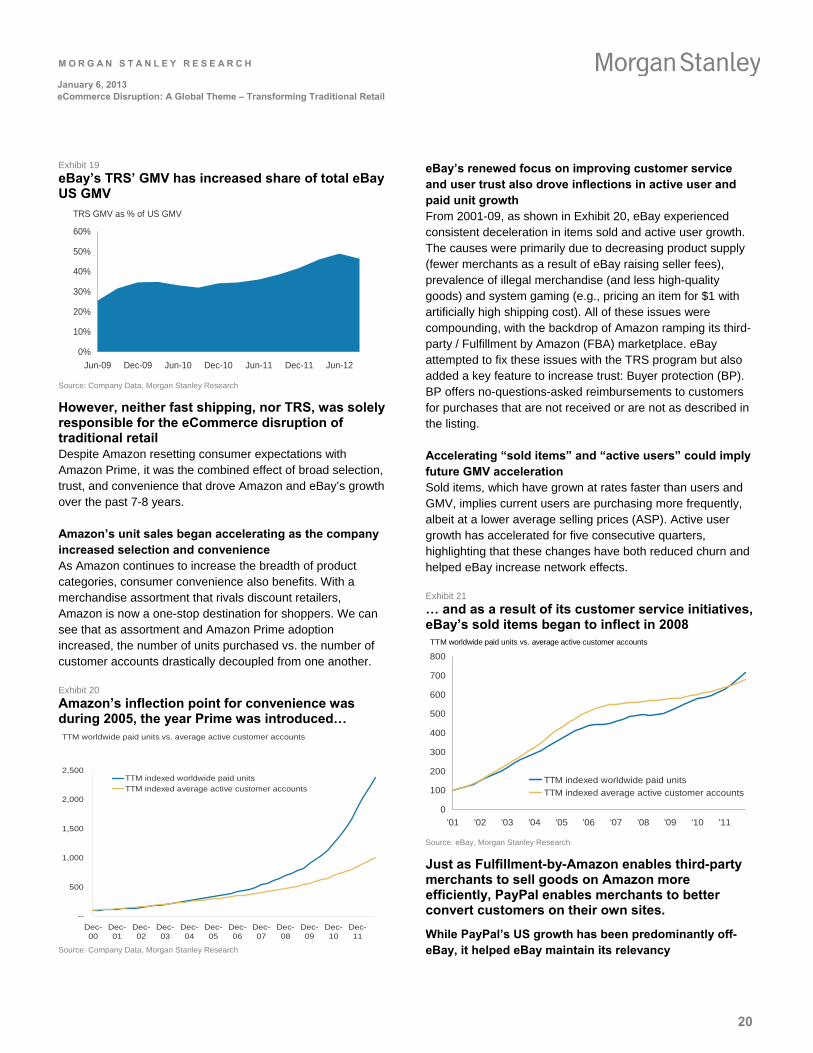
Exhibit 19
eBay’s TRS’ GMV has increased share of total eBay US GMV
TRS GMV as % of US GMV
0%
10%
20%
30%
40%
50%
60%
Jun-09 Dec-09 Jun-10 Dec-10 Jun-11 Dec-11 Jun-12
Source: Company Data, Morgan Stanley Research
However, neither fast shipping, nor TRS, was solely responsible for the eCommerce disruption of traditional retail Despite Amazon resetting consumer expectations with Amazon Prime, it was the combined effect of broad selection, trust, and convenience that drove Amazon and eBay’s growth over the past 7-8 years.
Amazon’s unit sales began accelerating as the company increased selection and convenience As Amazon continues to increase the breadth of product categories, consumer convenience also benefits. With a merchandise assortment that rivals discount retailers, Amazon is now a one-stop destination for shoppers. We can see that as assortment and Amazon Prime adoption increased, the number of units purchased vs. the number of customer accounts drastically decoupled from one another.
Exhibit 20
Amazon’s inflection point for convenience was during 2005, the year Prime was introduced… TTM worldwide paid units vs. average active customer accounts
--
500
1,000
1,500
2,000
2,500
Dec-00
Dec-01
Dec-02
Dec-03
Dec-04
Dec-05
Dec-06
Dec-07
Dec-08
Dec-09
Dec-10
Dec-11
TTM indexed worldwide paid units
TTM indexed average active customer accounts
Source: Company Data, Morgan Stanley Research
eBay’s renewed focus on improving customer service and user trust also drove inflections in active user and paid unit growth From 2001-09, as shown in Exhibit 20, eBay experienced consistent deceleration in items sold and active user growth. The causes were primarily due to decreasing product supply (fewer merchants as a result of eBay raising seller fees), prevalence of illegal merchandise (and less high-quality goods) and system gaming (e.g., pricing an item for $1 with artificially high shipping cost). All of these issues were compounding, with the backdrop of Amazon ramping its third-party / Fulfillment by Amazon (FBA) marketplace. eBay attempted to fix these issues with the TRS program but also added a key feature to increase trust: Buyer protection (BP). BP offers no-questions-asked reimbursements to customers for purchases that are not received or are not as described in the listing.
Accelerating “sold items” and “active users” could imply future GMV acceleration Sold items, which have grown at rates faster than users and GMV, implies current users are purchasing more frequently, albeit at a lower average selling prices (ASP). Active user growth has accelerated for five consecutive quarters, highlighting that these changes have both reduced churn and helped eBay increase network effects.
Exhibit 21
… and as a result of its customer service initiatives, eBay’s sold items began to inflect in 2008
0
100
200
300
400
500
600
700
800
'01 '02 '03 '04 '05 '06 '07 '08 '09 '10 '11
TTM indexed worldwide paid units
TTM indexed average active customer accounts
TTM worldwide paid units vs. average active customer accounts
Source: eBay, Morgan Stanley Research
Just as Fulfillment-by-Amazon enables third-party merchants to sell goods on Amazon more efficiently, PayPal enables merchants to better convert customers on their own sites.
While PayPal’s US growth has been predominantly off-eBay, it helped eBay maintain its relevancy
M O R G A N S T A N L E Y R E S E A R C H
21
January 6, 2013 eCommerce Disruption: A Global Theme – Transforming Traditional Retail
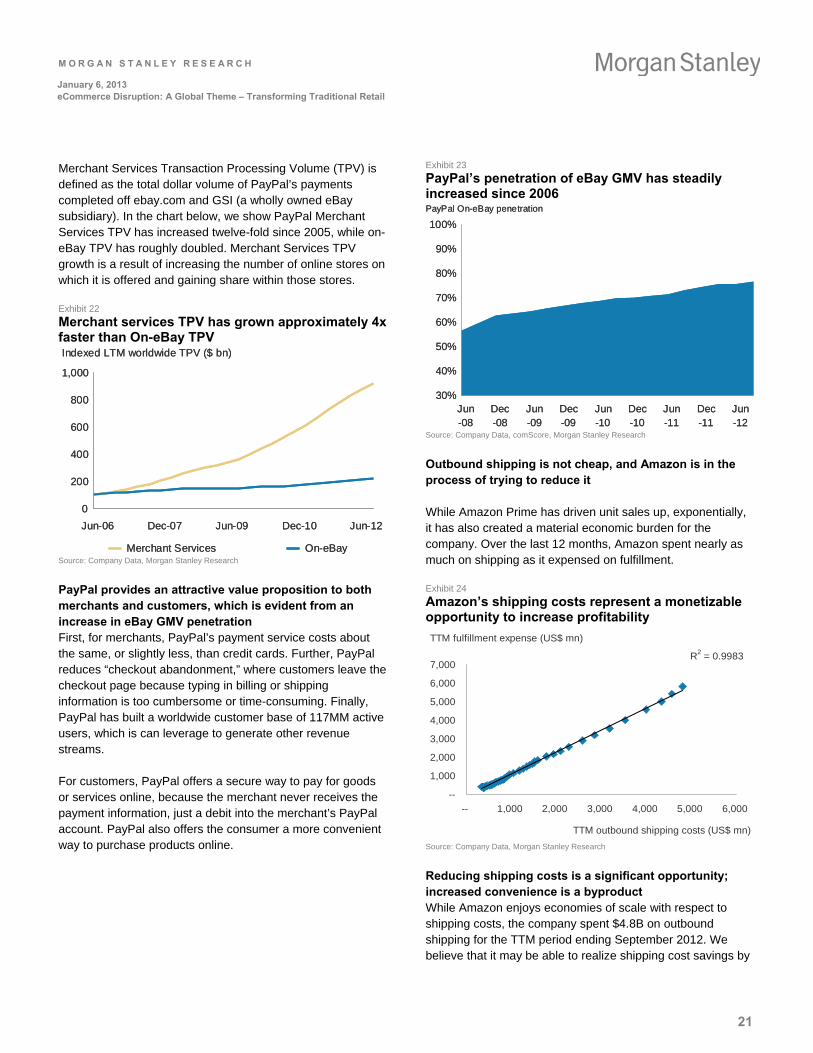
Merchant Services Transaction Processing Volume (TPV) is defined as the total dollar volume of PayPal’s payments completed off ebay.com and GSI (a wholly owned eBay subsidiary). In the chart below, we show PayPal Merchant Services TPV has increased twelve-fold since 2005, while on-eBay TPV has roughly doubled. Merchant Services TPV growth is a result of increasing the number of online stores on which it is offered and gaining share within those stores.
Exhibit 22
Merchant services TPV has grown approximately 4x faster than On-eBay TPV Indexed LTM worldwide TPV ($ bn)
0
200
400
600
800
1,000
Jun-06 Dec-07 Jun-09 Dec-10 Jun-12
Merchant Services On-eBay
Indexed LTM worldwide TPV ($ bn)
0
200
400
600
800
1,000
Jun-06 Dec-07 Jun-09 Dec-10 Jun-12
Merchant Services On-eBay Source: Company Data, Morgan Stanley Research
PayPal provides an attractive value proposition to both merchants and customers, which is evident from an increase in eBay GMV penetration First, for merchants, PayPal’s payment service costs about the same, or slightly less, than credit cards. Further, PayPal reduces “checkout abandonment,” where customers leave the checkout page because typing in billing or shipping information is too cumbersome or time-consuming. Finally, PayPal has built a worldwide customer base of 117MM active users, which is can leverage to generate other revenue streams.
For customers, PayPal offers a secure way to pay for goods or services online, because the merchant never receives the payment information, just a debit into the merchant’s PayPal account. PayPal also offers the consumer a more convenient way to purchase products online.
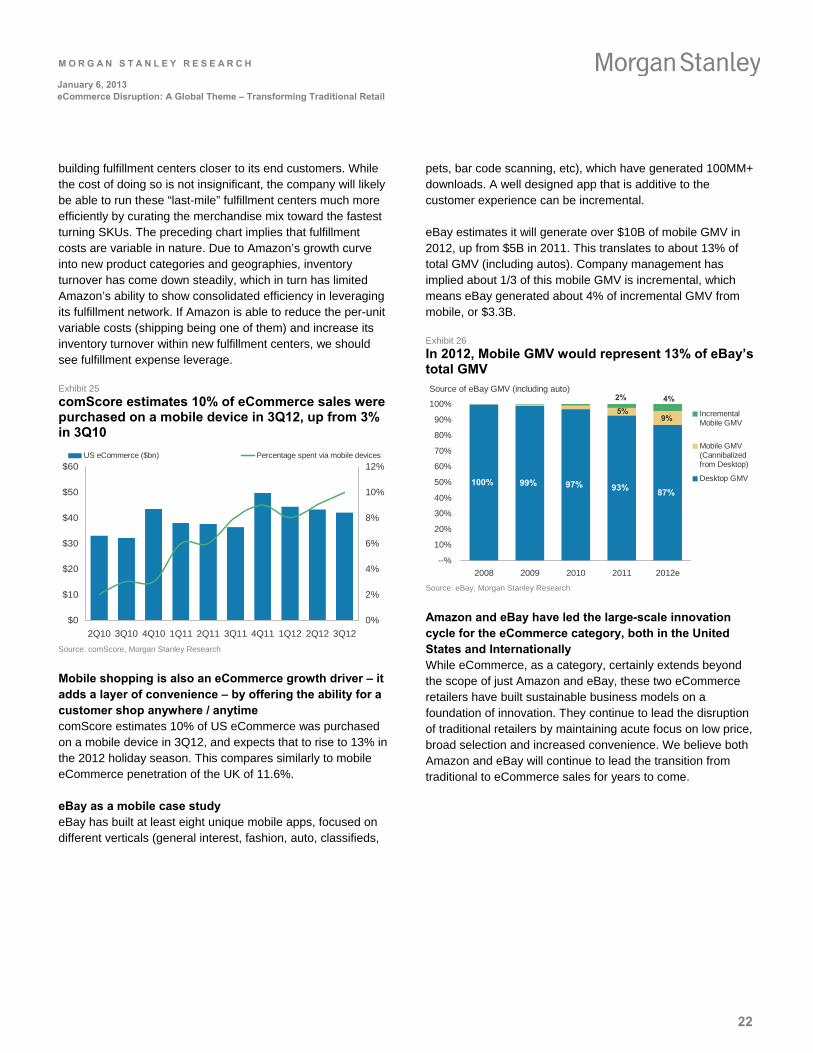
Exhibit 23
PayPal’s penetration of eBay GMV has steadily increased since 2006 PayPal On-eBay penetration
30%
40%
50%
60%
70%
80%
90%
100%
Jun-08
Dec-08
Jun-09
Dec-09
Jun-10
Dec-10
Jun-11
Dec-11
Jun-12
PayPal On-eBay penetration
30%
40%
50%
60%
70%
80%
90%
100%
Jun-08
Dec-08
Jun-09
Dec-09
Jun-10
Dec-10
Jun-11
Dec-11
Jun-12
Source: Company Data, comScore, Morgan Stanley Research
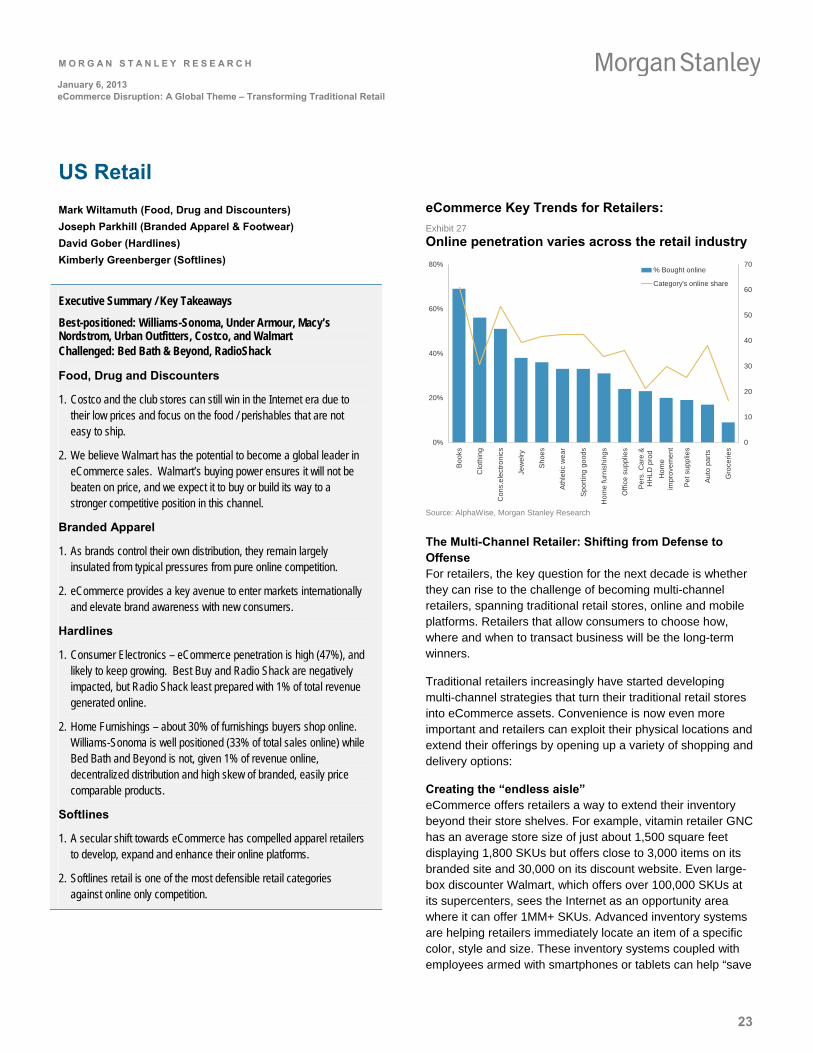
Outbound shipping is not cheap, and Amazon is in the process of trying to reduce it
While Amazon Prime has driven unit sales up, exponentially, it has also created a material economic burden for the company. Over the last 12 months, Amazon spent nearly as much on shipping as it expensed on fulfillment.
Exhibit 24
Amazon’s shipping costs represent a monetizable opportunity to increase profitability
TTM fulfillment expense (US$ mn)
R2 = 0.9983
--
1,000
2,000
3,000
4,000
5,000
6,000
7,000
-- 1,000 2,000 3,000 4,000 5,000 6,000
TTM outbound shipping costs (US$ mn)
Source: Company Data, Morgan Stanley Research
Reducing shipping costs is a significant opportunity; increased convenience is a byproduct While Amazon enjoys economies of scale with respect to shipping costs, the company spent $4.8B on outbound shipping for the TTM period ending September 2012. We believe that it may be able to realize shipping cost savings by
M O R G A N S T A N L E Y R E S E A R C H
22
January 6, 2013 eCommerce Disruption: A Global Theme – Transforming Traditional Retail
building fulfillment centers closer to its end customers. While the cost of doing so is not insignificant, the company will likely be able to run these “last-mile” fulfillment centers much more efficiently by curating the merchandise mix toward the fastest turning SKUs. The preceding chart implies that fulfillment costs are variable in nature. Due to Amazon’s growth curve into new product categories and geographies, inventory turnover has come down steadily, which in turn has limited Amazon’s ability to show consolidated efficiency in leveraging its fulfillment network. If Amazon is able to reduce the per-unit variable costs (shipping being one of them) and increase its inventory turnover within new fulfillment centers, we should see fulfillment expense leverage.
Exhibit 25
comScore estimates 10% of eCommerce sales were purchased on a mobile device in 3Q12, up from 3% in 3Q10
$0
$10
$20
$30
$40
$50
$60
2Q10 3Q10 4Q10 1Q11 2Q11 3Q11 4Q11 1Q12 2Q12 3Q12
0%
2%
4%
6%
8%
10%
12%US eCommerce ($bn) Percentage spent via mobile devices
Source: comScore, Morgan Stanley Research
Mobile shopping is also an eCommerce growth driver – it adds a layer of convenience – by offering the ability for a customer shop anywhere / anytime comScore estimates 10% of US eCommerce was purchased on a mobile device in 3Q12, and expects that to rise to 13% in the 2012 holiday season. This compares similarly to mobile eCommerce penetration of the UK of 11.6%.
eBay as a mobile case study eBay has built at least eight unique mobile apps, focused on different verticals (general interest, fashion, auto, classifieds,
pets, bar code scanning, etc), which have generated 100MM+ downloads. A well designed app that is additive to the customer experience can be incremental.
eBay estimates it will generate over $10B of mobile GMV in 2012, up from $5B in 2011. This translates to about 13% of total GMV (including autos). Company management has implied about 1/3 of this mobile GMV is incremental, which means eBay generated about 4% of incremental GMV from mobile, or $3.3B.
Exhibit 26
In 2012, Mobile GMV would represent 13% of eBay’s total GMV Source of eBay GMV (including auto)
100% 99% 97% 93% 87%
9%5%
4%2%
--%
10%
20%
30%
40%
50%
60%
70%
80%
90%
100%
2008 2009 2010 2011 2012e
IncrementalMobile GMV
Mobile GMV(Cannibalizedfrom Desktop)
Desktop GMV
Source: eBay, Morgan Stanley Research
Amazon and eBay have led the large-scale innovation cycle for the eCommerce category, both in the United States and Internationally While eCommerce, as a category, certainly extends beyond the scope of just Amazon and eBay, these two eCommerce retailers have built sustainable business models on a foundation of innovation. They continue to lead the disruption of traditional retailers by maintaining acute focus on low price, broad selection and increased convenience. We believe both Amazon and eBay will continue to lead the transition from traditional to eCommerce sales for years to come.
M O R G A N S T A N L E Y R E S E A R C H
23
January 6, 2013 eCommerce Disruption: A Global Theme – Transforming Traditional Retail
US Retail
Mark Wiltamuth (Food, Drug and Discounters)
Joseph Parkhill (Branded Apparel & Footwear)
David Gober (Hardlines)
Kimberly Greenberger (Softlines)
Executive Summary / Key Takeaways
Best-positioned: Williams-Sonoma, Under Armour, Macy’s Nordstrom, Urban Outfitters, Costco, and Walmart Challenged: Bed Bath & Beyond, RadioShack
Food, Drug and Discounters
1. Costco and the club stores can still win in the Internet era due to their low prices and focus on the food / perishables that are not easy to ship.
2. We believe Walmart has the potential to become a global leader in eCommerce sales. Walmart’s buying power ensures it will not be beaten on price, and we expect it to buy or build its way to a stronger competitive position in this channel.
Branded Apparel
1. As brands control their own distribution, they remain largely insulated from typical pressures from pure online competition.
2. eCommerce provides a key avenue to enter markets internationally and elevate brand awareness with new consumers.
Hardlines
1. Consumer Electronics – eCommerce penetration is high (47%), and likely to keep growing. Best Buy and Radio Shack are negatively impacted, but Radio Shack least prepared with 1% of total revenue generated online.
2. Home Furnishings – about 30% of furnishings buyers shop online. Williams-Sonoma is well positioned (33% of total sales online) while Bed Bath and Beyond is not, given 1% of revenue online, decentralized distribution and high skew of branded, easily price comparable products.
Softlines
1. A secular shift towards eCommerce has compelled apparel retailers to develop, expand and enhance their online platforms.
2. Softlines retail is one of the most defensible retail categories against online only competition.
eCommerce Key Trends for Retailers:
Exhibit 27
Online penetration varies across the retail industry
0%
20%
40%
60%
80%
Bo
oks
Clo
thin
g
Co
ns.e
lect
ron
ics
Jew
elry
Sh
oes
Ath
letic
we
ar
Sp
ort
ing
go
ods
Ho
me
furn
ish
ing
s
Off
ice
su
ppl
ies
Pe
rs.
Ca
re &
HH
LD
pro
d
Ho
me
impr
ove
me
nt
Pe
t su
pplie
s
Au
to p
arts
Gro
cerie
s
0
10
20
30
40
50
60
70% Bought online
Category's online share
Source: AlphaWise, Morgan Stanley Research
The Multi-Channel Retailer: Shifting from Defense to Offense For retailers, the key question for the next decade is whether they can rise to the challenge of becoming multi-channel retailers, spanning traditional retail stores, online and mobile platforms. Retailers that allow consumers to choose how, where and when to transact business will be the long-term winners.
Traditional retailers increasingly have started developing multi-channel strategies that turn their traditional retail stores into eCommerce assets. Convenience is now even more important and retailers can exploit their physical locations and extend their offerings by opening up a variety of shopping and delivery options:
Creating the “endless aisle” eCommerce offers retailers a way to extend their inventory beyond their store shelves. For example, vitamin retailer GNC has an average store size of just about 1,500 square feet displaying 1,800 SKUs but offers close to 3,000 items on its branded site and 30,000 on its discount website. Even large-box discounter Walmart, which offers over 100,000 SKUs at its supercenters, sees the Internet as an opportunity area where it can offer 1MM+ SKUs. Advanced inventory systems are helping retailers immediately locate an item of a specific color, style and size. These inventory systems coupled with employees armed with smartphones or tablets can help “save
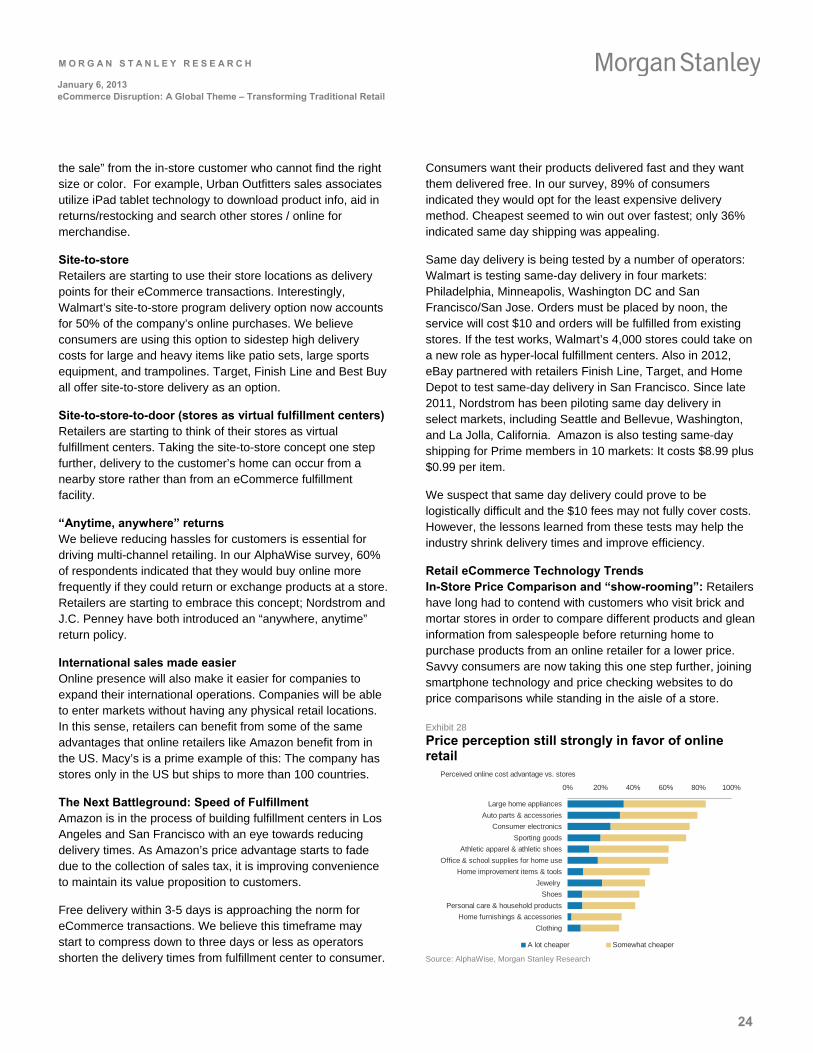
M O R G A N S T A N L E Y R E S E A R C H
24
January 6, 2013 eCommerce Disruption: A Global Theme – Transforming Traditional Retail
the sale” from the in-store customer who cannot find the right size or color. For example, Urban Outfitters sales associates utilize iPad tablet technology to download product info, aid in returns/restocking and search other stores / online for merchandise.
Site-to-store Retailers are starting to use their store locations as delivery points for their eCommerce transactions. Interestingly, Walmart’s site-to-store program delivery option now accounts for 50% of the company’s online purchases. We believe consumers are using this option to sidestep high delivery costs for large and heavy items like patio sets, large sports equipment, and trampolines. Target, Finish Line and Best Buy all offer site-to-store delivery as an option.
Site-to-store-to-door (stores as virtual fulfillment centers) Retailers are starting to think of their stores as virtual fulfillment centers. Taking the site-to-store concept one step further, delivery to the customer’s home can occur from a nearby store rather than from an eCommerce fulfillment facility.
“Anytime, anywhere” returns We believe reducing hassles for customers is essential for driving multi-channel retailing. In our AlphaWise survey, 60% of respondents indicated that they would buy online more frequently if they could return or exchange products at a store. Retailers are starting to embrace this concept; Nordstrom and J.C. Penney have both introduced an “anywhere, anytime” return policy.
International sales made easier Online presence will also make it easier for companies to expand their international operations. Companies will be able to enter markets without having any physical retail locations. In this sense, retailers can benefit from some of the same advantages that online retailers like Amazon benefit from in the US. Macy’s is a prime example of this: The company has stores only in the US but ships to more than 100 countries.
The Next Battleground: Speed of Fulfillment Amazon is in the process of building fulfillment centers in Los Angeles and San Francisco with an eye towards reducing delivery times. As Amazon’s price advantage starts to fade due to the collection of sales tax, it is improving convenience to maintain its value proposition to customers.
Free delivery within 3-5 days is approaching the norm for eCommerce transactions. We believe this timeframe may start to compress down to three days or less as operators shorten the delivery times from fulfillment center to consumer.
Consumers want their products delivered fast and they want them delivered free. In our survey, 89% of consumers indicated they would opt for the least expensive delivery method. Cheapest seemed to win out over fastest; only 36% indicated same day shipping was appealing.
Same day delivery is being tested by a number of operators: Walmart is testing same-day delivery in four markets: Philadelphia, Minneapolis, Washington DC and San Francisco/San Jose. Orders must be placed by noon, the service will cost $10 and orders will be fulfilled from existing stores. If the test works, Walmart’s 4,000 stores could take on a new role as hyper-local fulfillment centers. Also in 2012, eBay partnered with retailers Finish Line, Target, and Home Depot to test same-day delivery in San Francisco. Since late 2011, Nordstrom has been piloting same day delivery in select markets, including Seattle and Bellevue, Washington, and La Jolla, California. Amazon is also testing same-day shipping for Prime members in 10 markets: It costs $8.99 plus $0.99 per item.
We suspect that same day delivery could prove to be logistically difficult and the $10 fees may not fully cover costs. However, the lessons learned from these tests may help the industry shrink delivery times and improve efficiency.
Retail eCommerce Technology Trends In-Store Price Comparison and “show-rooming”: Retailers have long had to contend with customers who visit brick and mortar stores in order to compare different products and glean information from salespeople before returning home to purchase products from an online retailer for a lower price. Savvy consumers are now taking this one step further, joining smartphone technology and price checking websites to do price comparisons while standing in the aisle of a store.
Exhibit 28
Price perception still strongly in favor of online retail
Perceived online cost advantage vs. stores
0% 20% 40% 60% 80% 100%
Large home appliances
Auto parts & accessories
Consumer electronics
Sporting goods
Athletic apparel & athletic shoes
Office & school supplies for home use
Home improvement items & tools
Jewelry
Shoes
Personal care & household products
Home furnishings & accessories
Clothing
A lot cheaper Somewhat cheaper Source: AlphaWise, Morgan Stanley Research
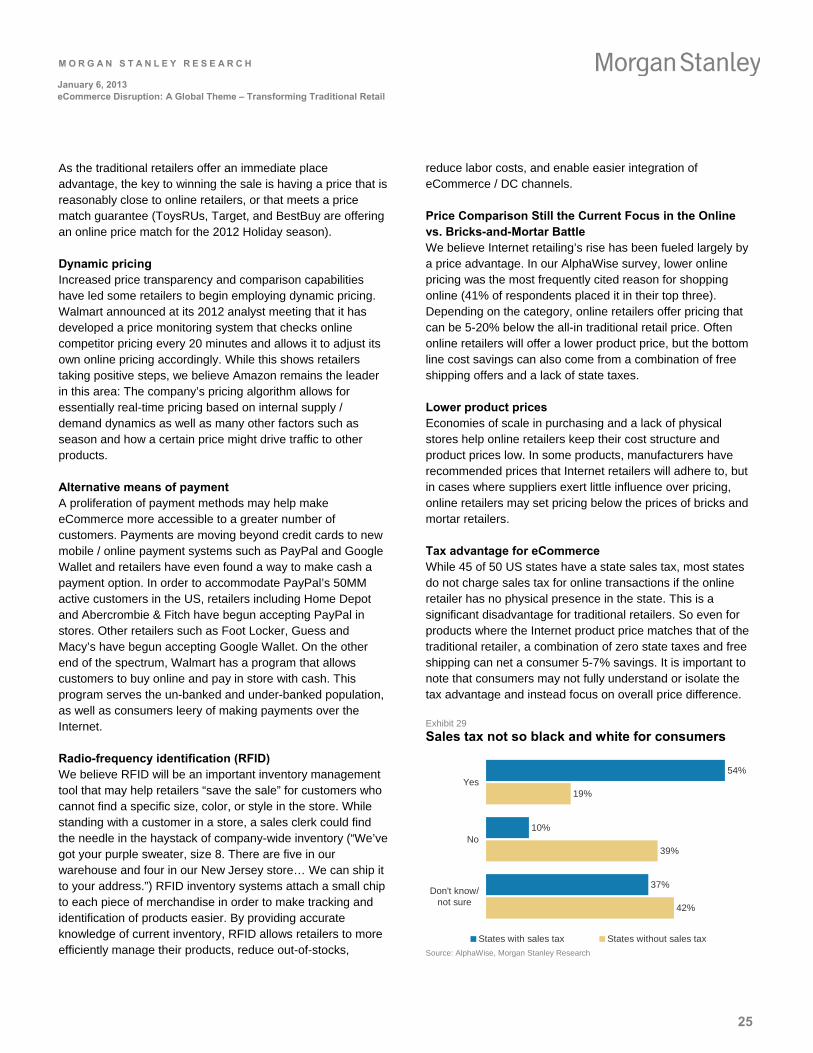
M O R G A N S T A N L E Y R E S E A R C H
25
January 6, 2013 eCommerce Disruption: A Global Theme – Transforming Traditional Retail
As the traditional retailers offer an immediate place advantage, the key to winning the sale is having a price that is reasonably close to online retailers, or that meets a price match guarantee (ToysRUs, Target, and BestBuy are offering an online price match for the 2012 Holiday season).
Dynamic pricing Increased price transparency and comparison capabilities have led some retailers to begin employing dynamic pricing. Walmart announced at its 2012 analyst meeting that it has developed a price monitoring system that checks online competitor pricing every 20 minutes and allows it to adjust its own online pricing accordingly. While this shows retailers taking positive steps, we believe Amazon remains the leader in this area: The company’s pricing algorithm allows for essentially real-time pricing based on internal supply / demand dynamics as well as many other factors such as season and how a certain price might drive traffic to other products.
Alternative means of payment A proliferation of payment methods may help make eCommerce more accessible to a greater number of customers. Payments are moving beyond credit cards to new mobile / online payment systems such as PayPal and Google Wallet and retailers have even found a way to make cash a payment option. In order to accommodate PayPal’s 50MM active customers in the US, retailers including Home Depot and Abercrombie & Fitch have begun accepting PayPal in stores. Other retailers such as Foot Locker, Guess and Macy’s have begun accepting Google Wallet. On the other end of the spectrum, Walmart has a program that allows customers to buy online and pay in store with cash. This program serves the un-banked and under-banked population, as well as consumers leery of making payments over the Internet.
Radio-frequency identification (RFID) We believe RFID will be an important inventory management tool that may help retailers “save the sale” for customers who cannot find a specific size, color, or style in the store. While standing with a customer in a store, a sales clerk could find the needle in the haystack of company-wide inventory (“We’ve got your purple sweater, size 8. There are five in our warehouse and four in our New Jersey store… We can ship it to your address.”) RFID inventory systems attach a small chip to each piece of merchandise in order to make tracking and identification of products easier. By providing accurate knowledge of current inventory, RFID allows retailers to more efficiently manage their products, reduce out-of-stocks,
reduce labor costs, and enable easier integration of eCommerce / DC channels.
Price Comparison Still the Current Focus in the Online vs. Bricks-and-Mortar Battle We believe Internet retailing’s rise has been fueled largely by a price advantage. In our AlphaWise survey, lower online pricing was the most frequently cited reason for shopping online (41% of respondents placed it in their top three). Depending on the category, online retailers offer pricing that can be 5-20% below the all-in traditional retail price. Often online retailers will offer a lower product price, but the bottom line cost savings can also come from a combination of free shipping offers and a lack of state taxes.
Lower product prices Economies of scale in purchasing and a lack of physical stores help online retailers keep their cost structure and product prices low. In some products, manufacturers have recommended prices that Internet retailers will adhere to, but in cases where suppliers exert little influence over pricing, online retailers may set pricing below the prices of bricks and mortar retailers.
Tax advantage for eCommerce While 45 of 50 US states have a state sales tax, most states do not charge sales tax for online transactions if the online retailer has no physical presence in the state. This is a significant disadvantage for traditional retailers. So even for products where the Internet product price matches that of the traditional retailer, a combination of zero state taxes and free shipping can net a consumer 5-7% savings. It is important to note that consumers may not fully understand or isolate the tax advantage and instead focus on overall price difference.
Exhibit 29
Sales tax not so black and white for consumers
54%
10%
37%
19%
39%
42%
Yes
No
Don't know/not sure
States with sales tax States without sales tax Source: AlphaWise, Morgan Stanley Research
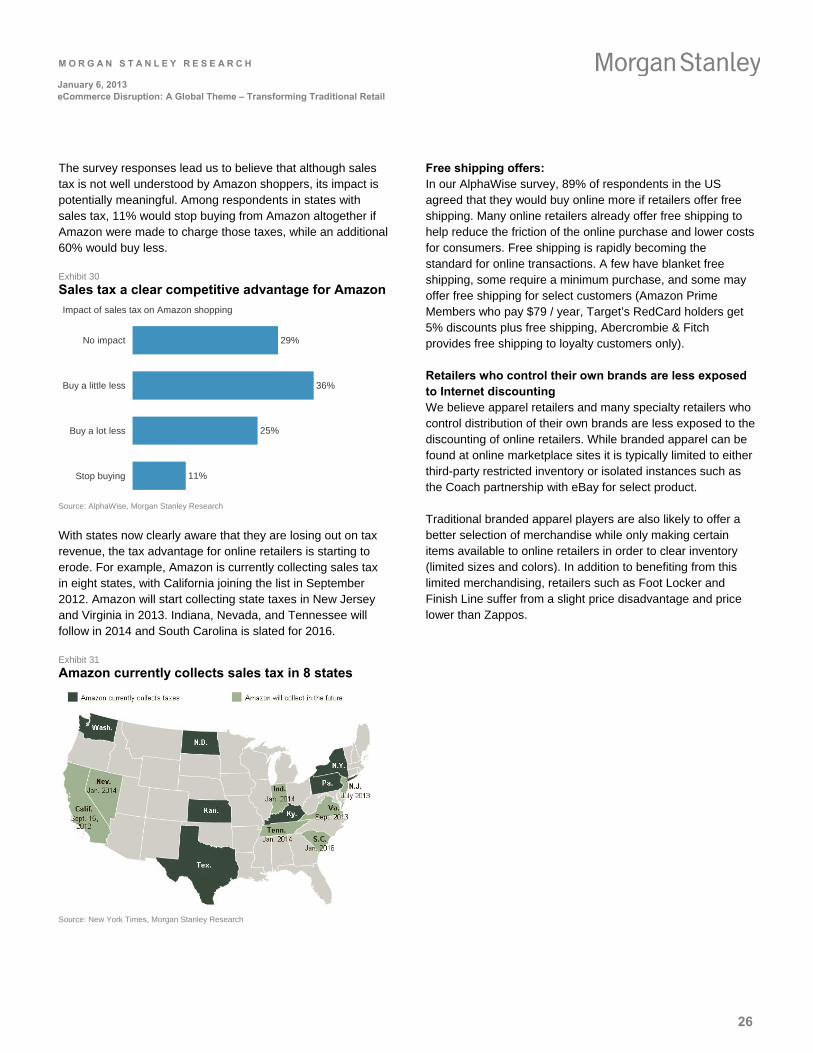
M O R G A N S T A N L E Y R E S E A R C H
26
January 6, 2013 eCommerce Disruption: A Global Theme – Transforming Traditional Retail
The survey responses lead us to believe that although sales tax is not well understood by Amazon shoppers, its impact is potentially meaningful. Among respondents in states with sales tax, 11% would stop buying from Amazon altogether if Amazon were made to charge those taxes, while an additional 60% would buy less.
Exhibit 30
Sales tax a clear competitive advantage for Amazon
Impact of sales tax on Amazon shopping
29%
36%
25%
11%
No impact
Buy a little less
Buy a lot less
Stop buying
Source: AlphaWise, Morgan Stanley Research
With states now clearly aware that they are losing out on tax revenue, the tax advantage for online retailers is starting to erode. For example, Amazon is currently collecting sales tax in eight states, with California joining the list in September 2012. Amazon will start collecting state taxes in New Jersey and Virginia in 2013. Indiana, Nevada, and Tennessee will follow in 2014 and South Carolina is slated for 2016.
Exhibit 31
Amazon currently collects sales tax in 8 states
Source: New York Times, Morgan Stanley Research
Free shipping offers: In our AlphaWise survey, 89% of respondents in the US agreed that they would buy online more if retailers offer free shipping. Many online retailers already offer free shipping to help reduce the friction of the online purchase and lower costs for consumers. Free shipping is rapidly becoming the standard for online transactions. A few have blanket free shipping, some require a minimum purchase, and some may offer free shipping for select customers (Amazon Prime Members who pay $79 / year, Target’s RedCard holders get 5% discounts plus free shipping, Abercrombie & Fitch provides free shipping to loyalty customers only).
Retailers who control their own brands are less exposed to Internet discounting We believe apparel retailers and many specialty retailers who control distribution of their own brands are less exposed to the discounting of online retailers. While branded apparel can be found at online marketplace sites it is typically limited to either third-party restricted inventory or isolated instances such as the Coach partnership with eBay for select product.
Traditional branded apparel players are also likely to offer a better selection of merchandise while only making certain items available to online retailers in order to clear inventory (limited sizes and colors). In addition to benefiting from this limited merchandising, retailers such as Foot Locker and Finish Line suffer from a slight price disadvantage and price lower than Zappos.
M O R G A N S T A N L E Y R E S E A R C H
27
January 6, 2013 eCommerce Disruption: A Global Theme – Transforming Traditional Retail
Food, Drug and Discounters
Discounters, among the more heavily impacted, are starting to react; Walmart is poised for prominence Large discounters Target and Walmart face the greatest near-term threat from eCommerce. Target is more exposed because 78% of its sales come from non-grocery compared to only 45% for Walmart. However, well aware of the eCommerce threat, both retailers have been investing more in this area, and as outlined below, we believe over the longer-term Walmart could emerge as a major player in eCommerce.
Walmart: We believe Walmart’s low price model will continue to thrive even as eCommerce trends continue to grow. Further, we believe Walmart could be the one traditional retailer with the potential to become a global leader in eCommerce sales. As the world’s largest retailer, Walmart can use its buying power to ensure it will not be beaten on price, and we believe the company will either buy or build its way into a stronger competitive position in eCommerce.
Walmart CEO Mike Duke has set a goal for Walmart to be a global leader in eCommerce. This seems like a tall order, but the market should not underestimate the power of Walmart. At its analyst day in October 2012, Walmart outlined several initiatives that show that it is investing in this area, and we sense that a strategy is starting to emerge. The company guided to about $9B in eCommerce sales worldwide in 2013, or about 2% of overall sales. Programs such as same-day delivery, order online / pay with cash, and its new search engine were highlighted. We expect the company to continue to invest in both technology and talent in the eCommerce arena. The company has been investing in eCommerce-focused personnel at @Walmartlabs (including the 2011 acquisition of social media company Kozmix).
Target: Target ended its partnership with Amazon and relaunched its own website in mid-2011. So far, the website has had latency problems and required three major version updates. However, it was expected to finally be additive to comps by 4Q2012. While we estimate that eCommerce accounts for only 2% of sales as of late 2012 and has lower margins, we expect Target to focus on increasing sales through this channel.
Target is working to thwart online price challenges through a holiday online price match program, it is challenging its merchants to source more exclusive products, product launch opportunities and unique limited time offers (Target / Neiman Marcus Holiday Collection designer gifts, Missoni for Target, Harajuku Mini for Target, etc).
Club stores can still win due to their low prices and focus on food / consumables We believe Costco and the club store industry will continue to win in an Internet focused marketplace. Bottom line, low prices will always resonate with consumers. Despite being admittedly behind on its own eCommerce efforts, Costco continues to gain share and draw in consumers with its low prices, high quality private label products, discount gasoline and treasure hunt atmosphere.
The company’s narrow SKU base (about 4,000 items) enables it to concentrate its buying power and pass on the savings to its members. The company has a policy of limiting its markup on branded products to 14% and 15% on private label. Across all of its sales, the company only earns a 10-11% gross margin and a retail operating margin of under 1%. This in turn drives extreme loyalty from its members (membership renewal rates of about 90%). Its membership fee base is perhaps the company’s greatest investment attribute; 80% of the company’s earnings come from membership fees and with fees increasing every 5 years and membership ranks growing with each new store.
We believe Costco enjoys some protection from online threats because of the nature of its products. Its large package sizes, food / perishables focus (55% of sales are consumer staples), and lower dollar value per pound makes these products a shipping challenge for online operators. We believe the club store may still be the most efficient venue for consumers to stock up on paper towels, toilet paper, bottled water, gallons of cooking oil and 40 lb bags of rice.
Grocery: perishables focus limits exposure to online Out of all of the retail-industries, grocery is the least exposed to risk from eCommerce. While some incursions have clearly occurred in the center of the store (Diapers.com’s share in the diaper category now exceeds that of some of the largest grocers), most of the grocery store has low value items or perishable items that are difficult to distribute through online fulfillment. Amazon is testing grocery delivery in the Seattle market but has yet to roll it out broadly. From observing the few online grocery models that are successful (FreshDirect in the NY metro area and Philadelphia, Tesco, Sainsbury in the UK), we believe retailers need a concentrated population to make grocery delivery economics work. Some grocers have a delivery model in place that leverages local store labor and in-store inventory (Ahold’s Peapod and Safeway), but we do not believe these are very profitable. We view these as a service for customers, not a business model that management teams are expanding upon.
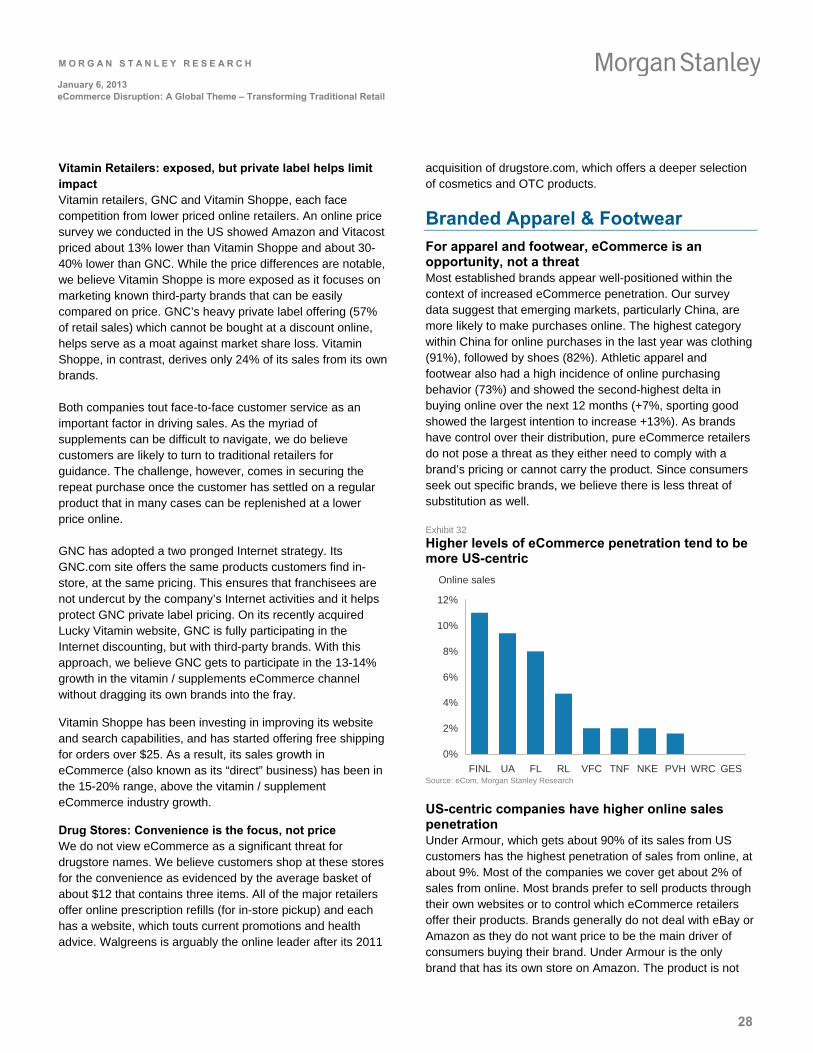
M O R G A N S T A N L E Y R E S E A R C H
28
January 6, 2013 eCommerce Disruption: A Global Theme – Transforming Traditional Retail
Vitamin Retailers: exposed, but private label helps limit impact Vitamin retailers, GNC and Vitamin Shoppe, each face competition from lower priced online retailers. An online price survey we conducted in the US showed Amazon and Vitacost priced about 13% lower than Vitamin Shoppe and about 30-40% lower than GNC. While the price differences are notable, we believe Vitamin Shoppe is more exposed as it focuses on marketing known third-party brands that can be easily compared on price. GNC’s heavy private label offering (57% of retail sales) which cannot be bought at a discount online, helps serve as a moat against market share loss. Vitamin Shoppe, in contrast, derives only 24% of its sales from its own brands.
Both companies tout face-to-face customer service as an important factor in driving sales. As the myriad of supplements can be difficult to navigate, we do believe customers are likely to turn to traditional retailers for guidance. The challenge, however, comes in securing the repeat purchase once the customer has settled on a regular product that in many cases can be replenished at a lower price online.
GNC has adopted a two pronged Internet strategy. Its GNC.com site offers the same products customers find in-store, at the same pricing. This ensures that franchisees are not undercut by the company’s Internet activities and it helps protect GNC private label pricing. On its recently acquired Lucky Vitamin website, GNC is fully participating in the Internet discounting, but with third-party brands. With this approach, we believe GNC gets to participate in the 13-14% growth in the vitamin / supplements eCommerce channel without dragging its own brands into the fray.
Vitamin Shoppe has been investing in improving its website and search capabilities, and has started offering free shipping for orders over $25. As a result, its sales growth in eCommerce (also known as its “direct” business) has been in the 15-20% range, above the vitamin / supplement eCommerce industry growth.
Drug Stores: Convenience is the focus, not price We do not view eCommerce as a significant threat for drugstore names. We believe customers shop at these stores for the convenience as evidenced by the average basket of about $12 that contains three items. All of the major retailers offer online prescription refills (for in-store pickup) and each has a website, which touts current promotions and health advice. Walgreens is arguably the online leader after its 2011
acquisition of drugstore.com, which offers a deeper selection of cosmetics and OTC products.
Branded Apparel & Footwear
For apparel and footwear, eCommerce is an opportunity, not a threat Most established brands appear well-positioned within the context of increased eCommerce penetration. Our survey data suggest that emerging markets, particularly China, are more likely to make purchases online. The highest category within China for online purchases in the last year was clothing (91%), followed by shoes (82%). Athletic apparel and footwear also had a high incidence of online purchasing behavior (73%) and showed the second-highest delta in buying online over the next 12 months (+7%, sporting good showed the largest intention to increase +13%). As brands have control over their distribution, pure eCommerce retailers do not pose a threat as they either need to comply with a brand’s pricing or cannot carry the product. Since consumers seek out specific brands, we believe there is less threat of substitution as well.
Exhibit 32
Higher levels of eCommerce penetration tend to be more US-centric
Online sales
0%
2%
4%
6%
8%
10%
12%
FINL UA FL RL VFC TNF NKE PVH WRC GES Source: eCom, Morgan Stanley Research
US-centric companies have higher online sales penetration Under Armour, which gets about 90% of its sales from US customers has the highest penetration of sales from online, at about 9%. Most of the companies we cover get about 2% of sales from online. Most brands prefer to sell products through their own websites or to control which eCommerce retailers offer their products. Brands generally do not deal with eBay or Amazon as they do not want price to be the main driver of consumers buying their brand. Under Armour is the only brand that has its own store on Amazon. The product is not
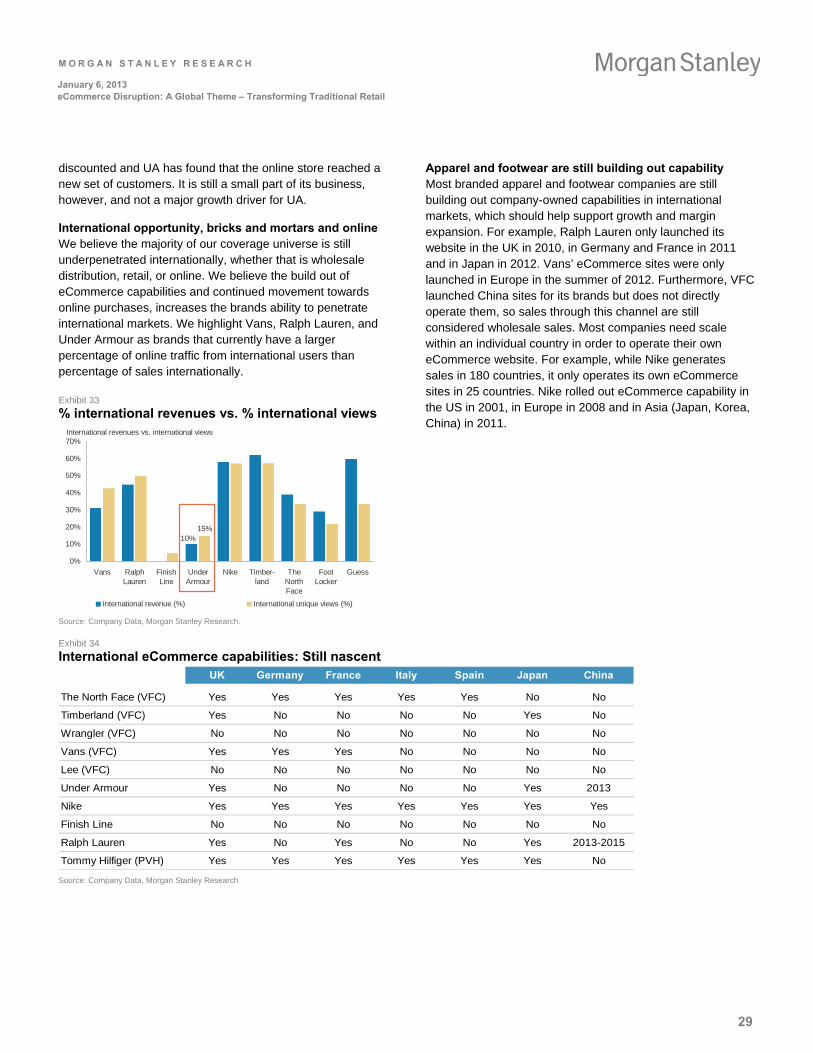
M O R G A N S T A N L E Y R E S E A R C H
29
January 6, 2013 eCommerce Disruption: A Global Theme – Transforming Traditional Retail
discounted and UA has found that the online store reached a new set of customers. It is still a small part of its business, however, and not a major growth driver for UA.
International opportunity, bricks and mortars and online We believe the majority of our coverage universe is still underpenetrated internationally, whether that is wholesale distribution, retail, or online. We believe the build out of eCommerce capabilities and continued movement towards online purchases, increases the brands ability to penetrate international markets. We highlight Vans, Ralph Lauren, and Under Armour as brands that currently have a larger percentage of online traffic from international users than percentage of sales internationally.
Exhibit 33
% international revenues vs. % international views International revenues vs. international views
10%15%
0%
10%
20%
30%
40%
50%
60%
70%
Vans RalphLauren
FinishLine
UnderArmour
Nike Timber-land
TheNorthFace
FootLocker
Guess
International revenue (%) International unique views (%) Source: Company Data, Morgan Stanley Research.
Apparel and footwear are still building out capability Most branded apparel and footwear companies are still building out company-owned capabilities in international markets, which should help support growth and margin expansion. For example, Ralph Lauren only launched its website in the UK in 2010, in Germany and France in 2011 and in Japan in 2012. Vans’ eCommerce sites were only launched in Europe in the summer of 2012. Furthermore, VFC launched China sites for its brands but does not directly operate them, so sales through this channel are still considered wholesale sales. Most companies need scale within an individual country in order to operate their own eCommerce website. For example, while Nike generates sales in 180 countries, it only operates its own eCommerce sites in 25 countries. Nike rolled out eCommerce capability in the US in 2001, in Europe in 2008 and in Asia (Japan, Korea, China) in 2011.
Exhibit 34
International eCommerce capabilities: Still nascent UK Germany France Italy Spain Japan China
The North Face (VFC) Yes Yes Yes Yes Yes No No
Timberland (VFC) Yes No No No No Yes No
Wrangler (VFC) No No No No No No No
Vans (VFC) Yes Yes Yes No No No No
Lee (VFC) No No No No No No No
Under Armour Yes No No No No Yes 2013
Nike Yes Yes Yes Yes Yes Yes Yes
Finish Line No No No No No No No
Ralph Lauren Yes No Yes No No Yes 2013-2015
Tommy Hilfiger (PVH) Yes Yes Yes Yes Yes Yes No Source: Company Data, Morgan Stanley Research
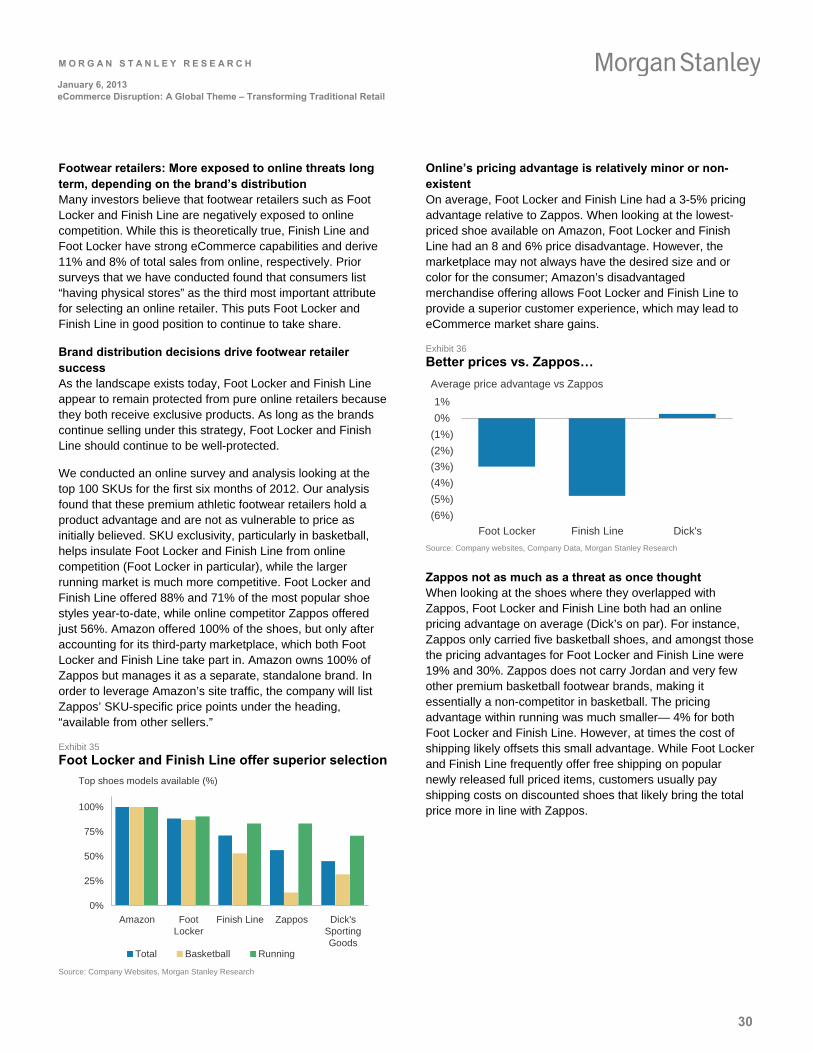
M O R G A N S T A N L E Y R E S E A R C H
30
January 6, 2013 eCommerce Disruption: A Global Theme – Transforming Traditional Retail
Footwear retailers: More exposed to online threats long term, depending on the brand’s distribution Many investors believe that footwear retailers such as Foot Locker and Finish Line are negatively exposed to online competition. While this is theoretically true, Finish Line and Foot Locker have strong eCommerce capabilities and derive 11% and 8% of total sales from online, respectively. Prior surveys that we have conducted found that consumers list “having physical stores” as the third most important attribute for selecting an online retailer. This puts Foot Locker and Finish Line in good position to continue to take share.
Brand distribution decisions drive footwear retailer success As the landscape exists today, Foot Locker and Finish Line appear to remain protected from pure online retailers because they both receive exclusive products. As long as the brands continue selling under this strategy, Foot Locker and Finish Line should continue to be well-protected.
We conducted an online survey and analysis looking at the top 100 SKUs for the first six months of 2012. Our analysis found that these premium athletic footwear retailers hold a product advantage and are not as vulnerable to price as initially believed. SKU exclusivity, particularly in basketball, helps insulate Foot Locker and Finish Line from online competition (Foot Locker in particular), while the larger running market is much more competitive. Foot Locker and Finish Line offered 88% and 71% of the most popular shoe styles year-to-date, while online competitor Zappos offered just 56%. Amazon offered 100% of the shoes, but only after accounting for its third-party marketplace, which both Foot Locker and Finish Line take part in. Amazon owns 100% of Zappos but manages it as a separate, standalone brand. In order to leverage Amazon’s site traffic, the company will list Zappos’ SKU-specific price points under the heading, “available from other sellers.”
Exhibit 35
Foot Locker and Finish Line offer superior selection
Top shoes models available (%)
0%
25%
50%
75%
100%
Amazon FootLocker
Finish Line Zappos Dick'sSportingGoods
Total Basketball Running Source: Company Websites, Morgan Stanley Research
Online’s pricing advantage is relatively minor or non-existent On average, Foot Locker and Finish Line had a 3-5% pricing advantage relative to Zappos. When looking at the lowest-priced shoe available on Amazon, Foot Locker and Finish Line had an 8 and 6% price disadvantage. However, the marketplace may not always have the desired size and or color for the consumer; Amazon’s disadvantaged merchandise offering allows Foot Locker and Finish Line to provide a superior customer experience, which may lead to eCommerce market share gains.
Exhibit 36
Better prices vs. Zappos…
Average price advantage vs Zappos
(6%)
(5%)
(4%)
(3%)
(2%)
(1%)
0%
1%
Foot Locker Finish Line Dick's
Source: Company websites, Company Data, Morgan Stanley Research
Zappos not as much as a threat as once thought When looking at the shoes where they overlapped with Zappos, Foot Locker and Finish Line both had an online pricing advantage on average (Dick’s on par). For instance, Zappos only carried five basketball shoes, and amongst those the pricing advantages for Foot Locker and Finish Line were 19% and 30%. Zappos does not carry Jordan and very few other premium basketball footwear brands, making it essentially a non-competitor in basketball. The pricing advantage within running was much smaller— 4% for both Foot Locker and Finish Line. However, at times the cost of shipping likely offsets this small advantage. While Foot Locker and Finish Line frequently offer free shipping on popular newly released full priced items, customers usually pay shipping costs on discounted shoes that likely bring the total price more in line with Zappos.
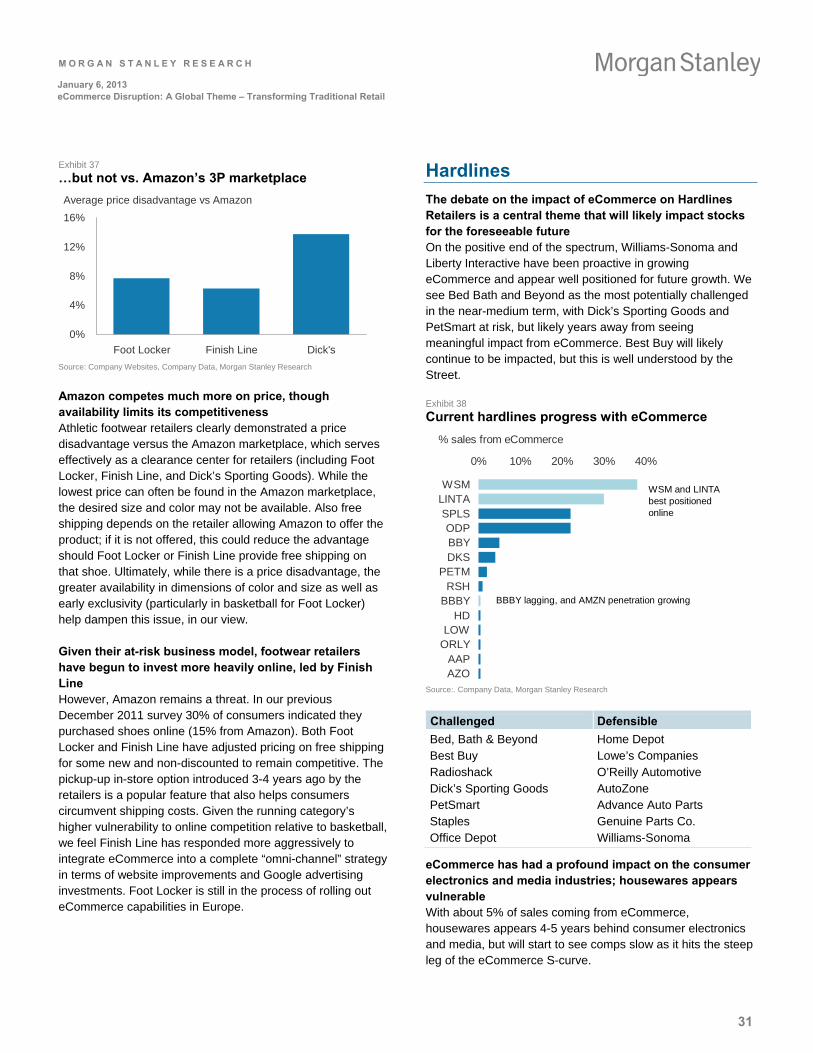
M O R G A N S T A N L E Y R E S E A R C H
31
January 6, 2013 eCommerce Disruption: A Global Theme – Transforming Traditional Retail
Exhibit 37
…but not vs. Amazon’s 3P marketplace
Average price disadvantage vs Amazon
0%
4%
8%
12%
16%
Foot Locker Finish Line Dick's
Source: Company Websites, Company Data, Morgan Stanley Research
Amazon competes much more on price, though availability limits its competitiveness Athletic footwear retailers clearly demonstrated a price disadvantage versus the Amazon marketplace, which serves effectively as a clearance center for retailers (including Foot Locker, Finish Line, and Dick’s Sporting Goods). While the lowest price can often be found in the Amazon marketplace, the desired size and color may not be available. Also free shipping depends on the retailer allowing Amazon to offer the product; if it is not offered, this could reduce the advantage should Foot Locker or Finish Line provide free shipping on that shoe. Ultimately, while there is a price disadvantage, the greater availability in dimensions of color and size as well as early exclusivity (particularly in basketball for Foot Locker) help dampen this issue, in our view.
Given their at-risk business model, footwear retailers have begun to invest more heavily online, led by Finish Line However, Amazon remains a threat. In our previous December 2011 survey 30% of consumers indicated they purchased shoes online (15% from Amazon). Both Foot Locker and Finish Line have adjusted pricing on free shipping for some new and non-discounted to remain competitive. The pickup-up in-store option introduced 3-4 years ago by the retailers is a popular feature that also helps consumers circumvent shipping costs. Given the running category’s higher vulnerability to online competition relative to basketball, we feel Finish Line has responded more aggressively to integrate eCommerce into a complete “omni-channel” strategy in terms of website improvements and Google advertising investments. Foot Locker is still in the process of rolling out eCommerce capabilities in Europe.
Hardlines
The debate on the impact of eCommerce on Hardlines Retailers is a central theme that will likely impact stocks for the foreseeable future On the positive end of the spectrum, Williams-Sonoma and Liberty Interactive have been proactive in growing eCommerce and appear well positioned for future growth. We see Bed Bath and Beyond as the most potentially challenged in the near-medium term, with Dick’s Sporting Goods and PetSmart at risk, but likely years away from seeing meaningful impact from eCommerce. Best Buy will likely continue to be impacted, but this is well understood by the Street.
Exhibit 38
Current hardlines progress with eCommerce
0% 10% 20% 30% 40%
WSMLINTASPLSODPBBYDKS
PETMRSH
BBBYHD
LOWORLY
AAPAZO
% sales from eCommerce
WSM and LINTA best positioned online
BBBY lagging, and AMZN penetration growing
Source:. Company Data, Morgan Stanley Research
Challenged Defensible
Bed, Bath & Beyond Best Buy Radioshack Dick’s Sporting Goods PetSmart Staples Office Depot
Home Depot Lowe’s Companies O’Reilly Automotive AutoZone Advance Auto Parts Genuine Parts Co. Williams-Sonoma
eCommerce has had a profound impact on the consumer electronics and media industries; housewares appears vulnerable With about 5% of sales coming from eCommerce, housewares appears 4-5 years behind consumer electronics and media, but will start to see comps slow as it hits the steep leg of the eCommerce S-curve.
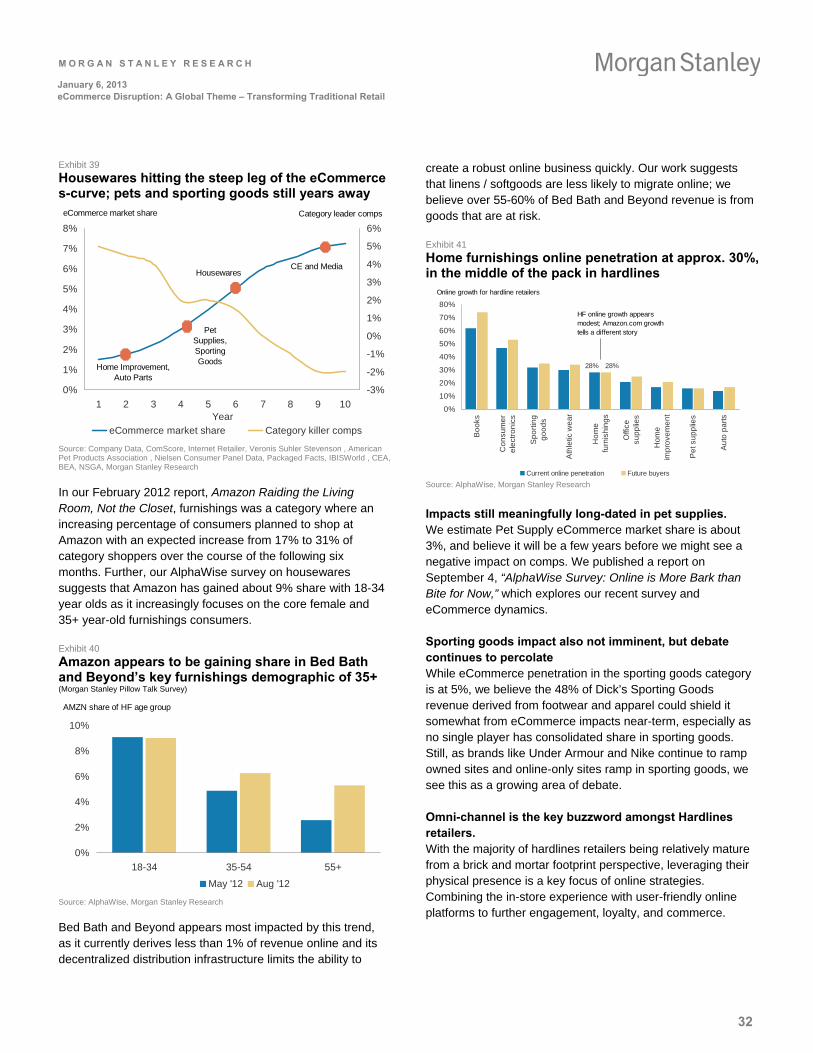
M O R G A N S T A N L E Y R E S E A R C H
32
January 6, 2013 eCommerce Disruption: A Global Theme – Transforming Traditional Retail
Exhibit 39
Housewares hitting the steep leg of the eCommerce s-curve; pets and sporting goods still years away
0%
1%
2%
3%
4%
5%
6%
7%
8%
1 2 3 4 5 6 7 8 9 10Year
-3%
-2%
-1%
0%
1%
2%
3%
4%
5%
6%
eCommerce market share Category killer comps
Pet Supplies, Sporting Goods
HousewaresCE and Media
Home Improvement, Auto Parts
eCommerce market share Category leader comps
Source: Company Data, ComScore, Internet Retailer, Veronis Suhler Stevenson , American Pet Products Association , Nielsen Consumer Panel Data, Packaged Facts, IBISWorld , CEA, BEA, NSGA, Morgan Stanley Research
In our February 2012 report, Amazon Raiding the Living Room, Not the Closet, furnishings was a category where an increasing percentage of consumers planned to shop at Amazon with an expected increase from 17% to 31% of category shoppers over the course of the following six months. Further, our AlphaWise survey on housewares suggests that Amazon has gained about 9% share with 18-34 year olds as it increasingly focuses on the core female and 35+ year-old furnishings consumers.
Exhibit 40
Amazon appears to be gaining share in Bed Bath and Beyond’s key furnishings demographic of 35+ (Morgan Stanley Pillow Talk Survey)
0%
2%
4%
6%
8%
10%
18-34 35-54 55+
May '12 Aug '12
AMZN share of HF age group
Source: AlphaWise, Morgan Stanley Research
Bed Bath and Beyond appears most impacted by this trend, as it currently derives less than 1% of revenue online and its decentralized distribution infrastructure limits the ability to
create a robust online business quickly. Our work suggests that linens / softgoods are less likely to migrate online; we believe over 55-60% of Bed Bath and Beyond revenue is from goods that are at risk.
Exhibit 41
Home furnishings online penetration at approx. 30%, in the middle of the pack in hardlines
28% 28%
0%
10%
20%
30%
40%
50%
60%
70%
80%
Bo
oks
Co
nsu
me
re
lect
ron
ics
Sp
ort
ing
go
od
s
Ath
letic
we
ar
Ho
me
furn
ish
ing
s
Offi
cesu
pp
lies
Ho
me
imp
rove
me
nt
Pe
t su
pp
lies
Au
to p
art
s
Current online penetration Future buyers
HF online growth appears modest; Amazon.com growth tells a different story
Online growth for hardline retailers
Source: AlphaWise, Morgan Stanley Research
Impacts still meaningfully long-dated in pet supplies. We estimate Pet Supply eCommerce market share is about 3%, and believe it will be a few years before we might see a negative impact on comps. We published a report on September 4, “AlphaWise Survey: Online is More Bark than Bite for Now,” which explores our recent survey and eCommerce dynamics.
Sporting goods impact also not imminent, but debate continues to percolate While eCommerce penetration in the sporting goods category is at 5%, we believe the 48% of Dick’s Sporting Goods revenue derived from footwear and apparel could shield it somewhat from eCommerce impacts near-term, especially as no single player has consolidated share in sporting goods. Still, as brands like Under Armour and Nike continue to ramp owned sites and online-only sites ramp in sporting goods, we see this as a growing area of debate.
Omni-channel is the key buzzword amongst Hardlines retailers. With the majority of hardlines retailers being relatively mature from a brick and mortar footprint perspective, leveraging their physical presence is a key focus of online strategies. Combining the in-store experience with user-friendly online platforms to further engagement, loyalty, and commerce.
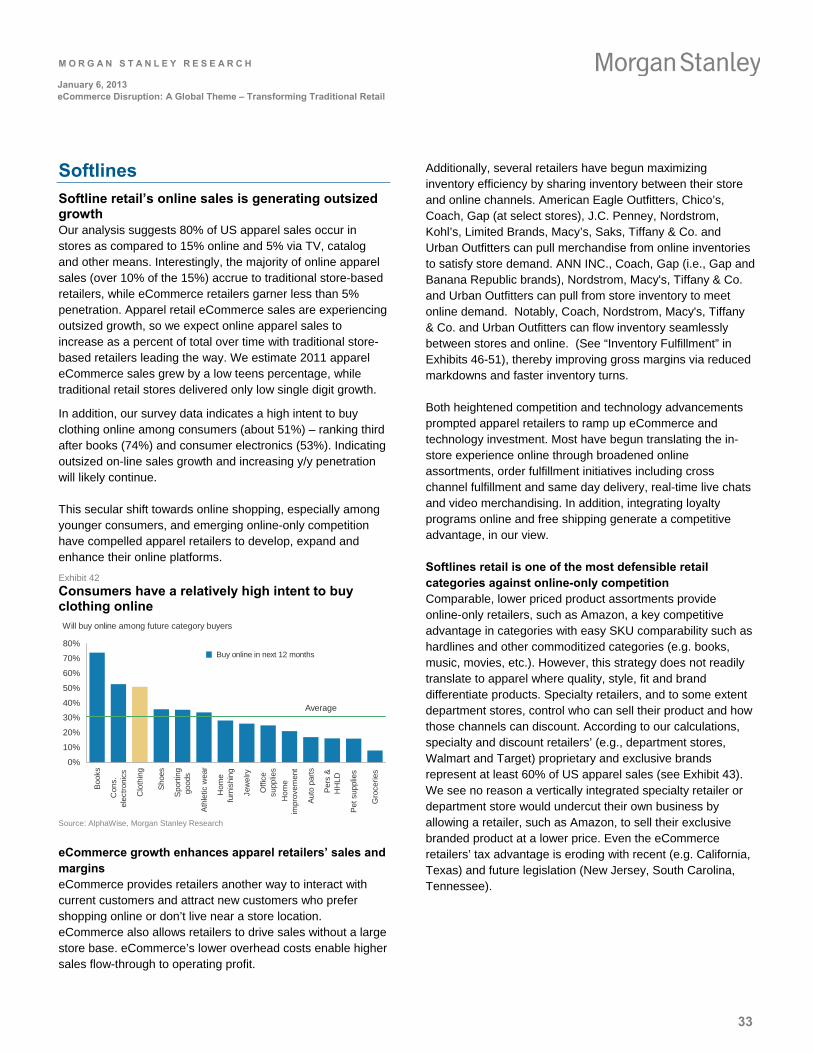
M O R G A N S T A N L E Y R E S E A R C H
33
January 6, 2013 eCommerce Disruption: A Global Theme – Transforming Traditional Retail
Softlines
Softline retail’s online sales is generating outsized growth Our analysis suggests 80% of US apparel sales occur in stores as compared to 15% online and 5% via TV, catalog and other means. Interestingly, the majority of online apparel sales (over 10% of the 15%) accrue to traditional store-based retailers, while eCommerce retailers garner less than 5% penetration. Apparel retail eCommerce sales are experiencing outsized growth, so we expect online apparel sales to increase as a percent of total over time with traditional store-based retailers leading the way. We estimate 2011 apparel eCommerce sales grew by a low teens percentage, while traditional retail stores delivered only low single digit growth.
In addition, our survey data indicates a high intent to buy clothing online among consumers (about 51%) – ranking third after books (74%) and consumer electronics (53%). Indicating outsized on-line sales growth and increasing y/y penetration will likely continue.
This secular shift towards online shopping, especially among younger consumers, and emerging online-only competition have compelled apparel retailers to develop, expand and enhance their online platforms.
Exhibit 42
Consumers have a relatively high intent to buy clothing online Will buy online among future category buyers
Average
0%
10%
20%
30%
40%
50%
60%
70%
80%
Boo
ks
Con
s.el
ectr
onic
s
Clo
thin
g
Sho
es
Spo
rtin
ggo
ods
Ath
letic
wea
r
Hom
efu
rnis
hing
Jew
elry
Offi
cesu
pplie
s
Hom
eim
prov
emen
t
Aut
o pa
rts
Per
s &
HH
LD
Pet
sup
plie
s
Gro
cerie
s
Buy online in next 12 months
Source: AlphaWise, Morgan Stanley Research
eCommerce growth enhances apparel retailers’ sales and margins eCommerce provides retailers another way to interact with current customers and attract new customers who prefer shopping online or don’t live near a store location. eCommerce also allows retailers to drive sales without a large store base. eCommerce’s lower overhead costs enable higher sales flow-through to operating profit.
Additionally, several retailers have begun maximizing inventory efficiency by sharing inventory between their store and online channels. American Eagle Outfitters, Chico’s, Coach, Gap (at select stores), J.C. Penney, Nordstrom, Kohl’s, Limited Brands, Macy’s, Saks, Tiffany & Co. and Urban Outfitters can pull merchandise from online inventories to satisfy store demand. ANN INC., Coach, Gap (i.e., Gap and Banana Republic brands), Nordstrom, Macy's, Tiffany & Co. and Urban Outfitters can pull from store inventory to meet online demand. Notably, Coach, Nordstrom, Macy's, Tiffany & Co. and Urban Outfitters can flow inventory seamlessly between stores and online. (See “Inventory Fulfillment” in Exhibits 46-51), thereby improving gross margins via reduced markdowns and faster inventory turns.
Both heightened competition and technology advancements prompted apparel retailers to ramp up eCommerce and technology investment. Most have begun translating the in-store experience online through broadened online assortments, order fulfillment initiatives including cross channel fulfillment and same day delivery, real-time live chats and video merchandising. In addition, integrating loyalty programs online and free shipping generate a competitive advantage, in our view.
Softlines retail is one of the most defensible retail categories against online-only competition Comparable, lower priced product assortments provide online-only retailers, such as Amazon, a key competitive advantage in categories with easy SKU comparability such as hardlines and other commoditized categories (e.g. books, music, movies, etc.). However, this strategy does not readily translate to apparel where quality, style, fit and brand differentiate products. Specialty retailers, and to some extent department stores, control who can sell their product and how those channels can discount. According to our calculations, specialty and discount retailers’ (e.g., department stores, Walmart and Target) proprietary and exclusive brands represent at least 60% of US apparel sales (see Exhibit 43). We see no reason a vertically integrated specialty retailer or department store would undercut their own business by allowing a retailer, such as Amazon, to sell their exclusive branded product at a lower price. Even the eCommerce retailers’ tax advantage is eroding with recent (e.g. California, Texas) and future legislation (New Jersey, South Carolina, Tennessee).
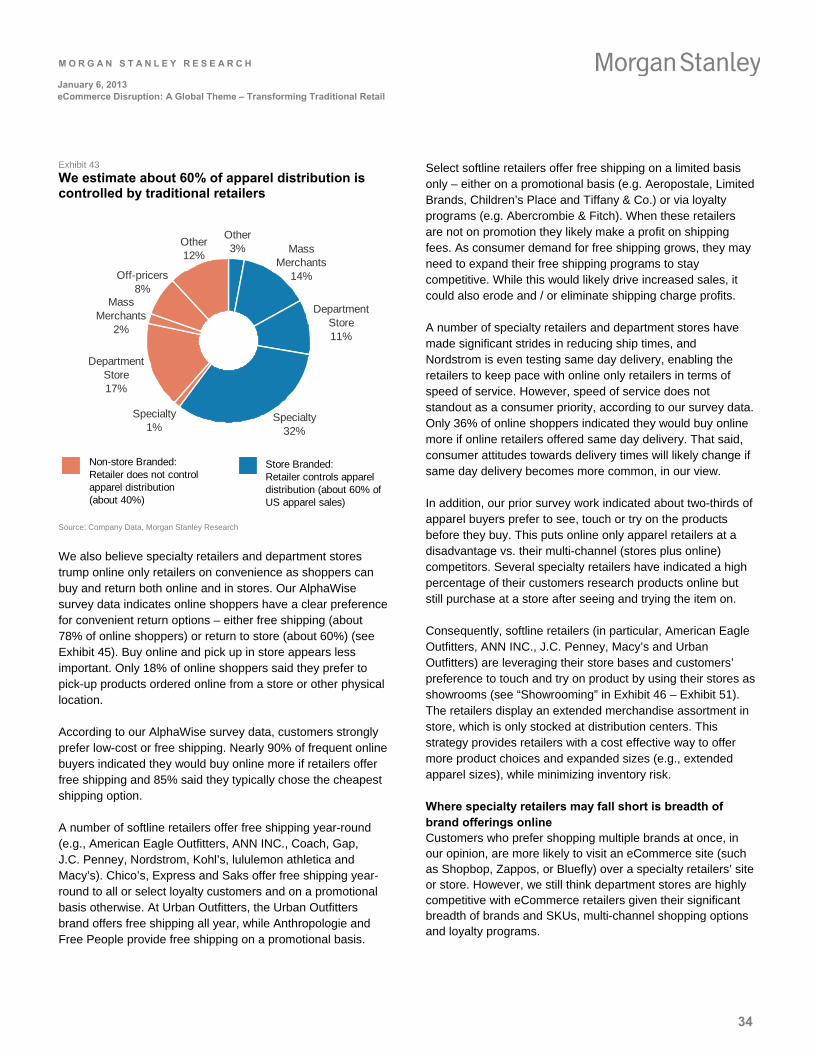
M O R G A N S T A N L E Y R E S E A R C H
34
January 6, 2013 eCommerce Disruption: A Global Theme – Transforming Traditional Retail
Exhibit 43
We estimate about 60% of apparel distribution is controlled by traditional retailers
Other3%
Other12%
Off-pricers8%
Mass Merchants
2%
Department Store17%
Specialty1%
Specialty32%
Department Store11%
Mass Merchants
14%
Store Branded:Retailer controls apparel distribution (about 60% of US apparel sales)
Non-store Branded:Retailer does not control apparel distribution (about 40%)
Source: Company Data, Morgan Stanley Research
We also believe specialty retailers and department stores trump online only retailers on convenience as shoppers can buy and return both online and in stores. Our AlphaWise survey data indicates online shoppers have a clear preference for convenient return options – either free shipping (about 78% of online shoppers) or return to store (about 60%) (see Exhibit 45). Buy online and pick up in store appears less important. Only 18% of online shoppers said they prefer to pick-up products ordered online from a store or other physical location.
According to our AlphaWise survey data, customers strongly prefer low-cost or free shipping. Nearly 90% of frequent online buyers indicated they would buy online more if retailers offer free shipping and 85% said they typically chose the cheapest shipping option.
A number of softline retailers offer free shipping year-round (e.g., American Eagle Outfitters, ANN INC., Coach, Gap, J.C. Penney, Nordstrom, Kohl’s, lululemon athletica and Macy’s). Chico’s, Express and Saks offer free shipping year-round to all or select loyalty customers and on a promotional basis otherwise. At Urban Outfitters, the Urban Outfitters brand offers free shipping all year, while Anthropologie and Free People provide free shipping on a promotional basis.
Select softline retailers offer free shipping on a limited basis only – either on a promotional basis (e.g. Aeropostale, Limited Brands, Children’s Place and Tiffany & Co.) or via loyalty programs (e.g. Abercrombie & Fitch). When these retailers are not on promotion they likely make a profit on shipping fees. As consumer demand for free shipping grows, they may need to expand their free shipping programs to stay competitive. While this would likely drive increased sales, it could also erode and / or eliminate shipping charge profits.
A number of specialty retailers and department stores have made significant strides in reducing ship times, and Nordstrom is even testing same day delivery, enabling the retailers to keep pace with online only retailers in terms of speed of service. However, speed of service does not standout as a consumer priority, according to our survey data. Only 36% of online shoppers indicated they would buy online more if online retailers offered same day delivery. That said, consumer attitudes towards delivery times will likely change if same day delivery becomes more common, in our view.
In addition, our prior survey work indicated about two-thirds of apparel buyers prefer to see, touch or try on the products before they buy. This puts online only apparel retailers at a disadvantage vs. their multi-channel (stores plus online) competitors. Several specialty retailers have indicated a high percentage of their customers research products online but still purchase at a store after seeing and trying the item on.
Consequently, softline retailers (in particular, American Eagle Outfitters, ANN INC., J.C. Penney, Macy’s and Urban Outfitters) are leveraging their store bases and customers’ preference to touch and try on product by using their stores as showrooms (see “Showrooming” in Exhibit 46 – Exhibit 51). The retailers display an extended merchandise assortment in store, which is only stocked at distribution centers. This strategy provides retailers with a cost effective way to offer more product choices and expanded sizes (e.g., extended apparel sizes), while minimizing inventory risk.
Where specialty retailers may fall short is breadth of brand offerings online Customers who prefer shopping multiple brands at once, in our opinion, are more likely to visit an eCommerce site (such as Shopbop, Zappos, or Bluefly) over a specialty retailers’ site or store. However, we still think department stores are highly competitive with eCommerce retailers given their significant breadth of brands and SKUs, multi-channel shopping options and loyalty programs.
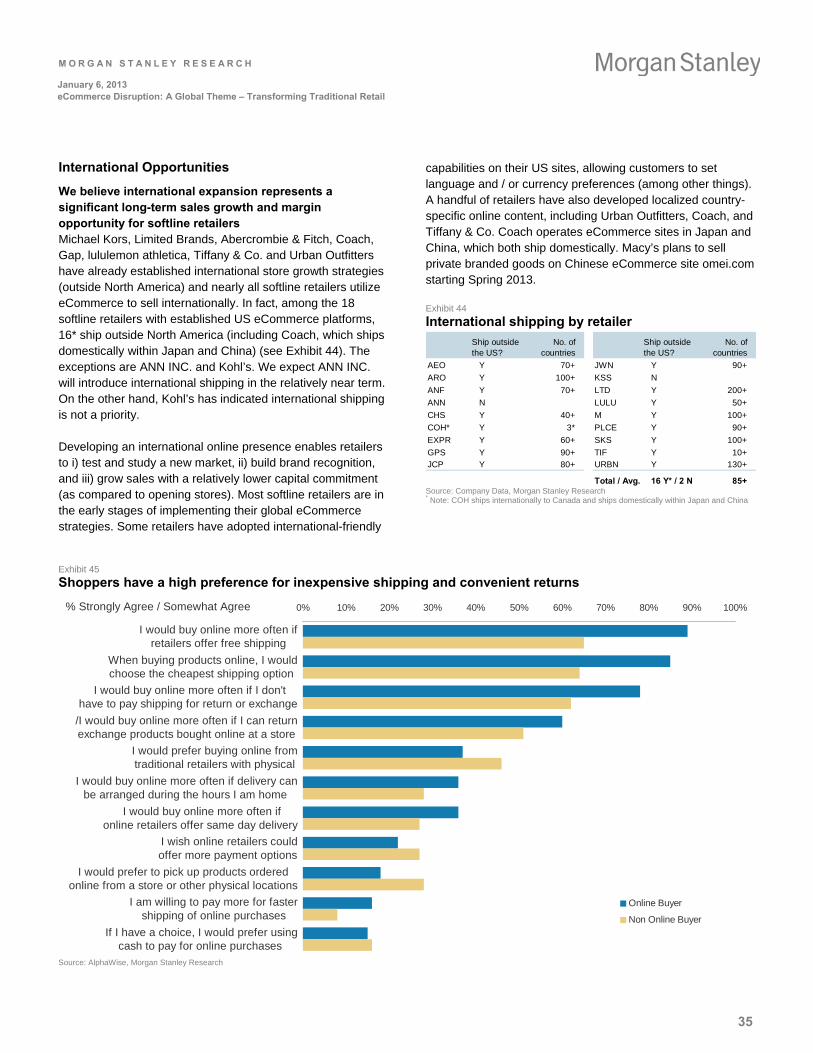
M O R G A N S T A N L E Y R E S E A R C H
35
January 6, 2013 eCommerce Disruption: A Global Theme – Transforming Traditional Retail
International Opportunities
We believe international expansion represents a significant long-term sales growth and margin opportunity for softline retailers Michael Kors, Limited Brands, Abercrombie & Fitch, Coach, Gap, lululemon athletica, Tiffany & Co. and Urban Outfitters have already established international store growth strategies (outside North America) and nearly all softline retailers utilize eCommerce to sell internationally. In fact, among the 18 softline retailers with established US eCommerce platforms, 16* ship outside North America (including Coach, which ships domestically within Japan and China) (see Exhibit 44). The exceptions are ANN INC. and Kohl’s. We expect ANN INC. will introduce international shipping in the relatively near term. On the other hand, Kohl’s has indicated international shipping is not a priority.
Developing an international online presence enables retailers to i) test and study a new market, ii) build brand recognition, and iii) grow sales with a relatively lower capital commitment (as compared to opening stores). Most softline retailers are in the early stages of implementing their global eCommerce strategies. Some retailers have adopted international-friendly
capabilities on their US sites, allowing customers to set language and / or currency preferences (among other things). A handful of retailers have also developed localized country-specific online content, including Urban Outfitters, Coach, and Tiffany & Co. Coach operates eCommerce sites in Japan and China, which both ship domestically. Macy’s plans to sell private branded goods on Chinese eCommerce site omei.com starting Spring 2013.
Exhibit 44
International shipping by retailer
Ship outside the US?
No. of countries
Ship outside the US?
No. of countries
AEO Y 70+ JWN Y 90+
ARO Y 100+ KSS N
ANF Y 70+ LTD Y 200+
ANN N LULU Y 50+
CHS Y 40+ M Y 100+
COH* Y 3* PLCE Y 90+
EXPR Y 60+ SKS Y 100+
GPS Y 90+ TIF Y 10+
JCP Y 80+ URBN Y 130+
Total / Avg. 16 Y* / 2 N 85+ Source: Company Data, Morgan Stanley Research * Note: COH ships internationally to Canada and ships domestically within Japan and China
Exhibit 45
Shoppers have a high preference for inexpensive shipping and convenient returns
% Strongly Agree / Somewhat Agree 0% 10% 20% 30% 40% 50% 60% 70% 80% 90% 100%
I would buy online more often ifretailers offer free shipping
When buying products online, I wouldchoose the cheapest shipping option
I would buy online more often if I don'thave to pay shipping for return or exchange
/I would buy online more often if I can returnexchange products bought online at a store
I would prefer buying online from traditional retailers with physical
I would buy online more often if delivery canbe arranged during the hours I am home
I would buy online more often ifonline retailers offer same day delivery
I wish online retailers couldoffer more payment options
I would prefer to pick up products ordered online from a store or other physical locations
I am willing to pay more for fastershipping of online purchases
If I have a choice, I would prefer usingcash to pay for online purchases
Online Buyer
Non Online Buyer
Source: AlphaWise, Morgan Stanley Research
M O R G A N S T A N L E Y R E S E A R C H
36
January 6, 2013 eCommerce Disruption: A Global Theme – Transforming Traditional Retail
We surveyed 18 companies within our specialty and department store universe on their existing eCommerce strategies and initiatives, focusing on shipping costs and times, inventory fulfillment and overlap, loyalty programs and use of “show-rooming” (i.e., displaying merchandise in-stores but only carrying the inventory at distribution centers). A few key survey findings include:
i) Free online shipping is ubiquitous. All softline retailers, except Abercrombie & Fitch, offer free shipping to all customers either year round or promotionally. Abercrombie & Fitch only offers free shipping through its loyalty programs.
ii) Generally, to receive free shipping, softline retail customers must meet a minimum order threshold. Notably, Nordstrom and lululemon athletica are the only softline retailers that offer free shipping year round without a minimum threshold. Substantially all softline retailers offer free shipping without a threshold on a promotional basis at certain times of the year. In addition, Chico’s offers free shipping without a threshold through its loyalty program.
iii) Free online returns are less common: Only Nordstrom, Urban Outfitter’s Urban Outfitters brand and Gap’s Piperlime brand offer free online returns (i.e., free to ship back to the distributions centers).
iv) Most retailers have implemented cross channel fulfillment to some extent. 12 of the 18 retailers surveyed can pull merchandise from online inventories to satisfy store demand, while 8 can pull from other stores’ inventories. In addition, 7 retailers can pull from store inventories to meet online demand. Leaders in cross channel fulfillment include Coach, Nordstrom, Macy’s, Tiffany & Co. and Urban Outfitters, which have all established seamless inventory integration (i.e., implemented store to store, store to online, and online to store fulfillment).
Interestingly, Abercrombie & Fitch, Aeropostale, Express, lululemon athletica and Children’s Place are not utilizing cross channel fulfillment, although lululemon athletica and Children’s Place have taken steps to do so. We believe channel integration between stores and online provide a significant competitive advantage and margin opportunity.
v) Softline retail order delivery takes 3 to 4 days, on average. Saks and Tiffany & Co. are standouts with 1-2 day and 1-3 day average delivery times. Meanwhile, at least 15 retailers offer a next day delivery option and Nordstrom is currently testing same day delivery. We expect average delivery times will fall as more softline retailers offer next day and / or same day delivery.
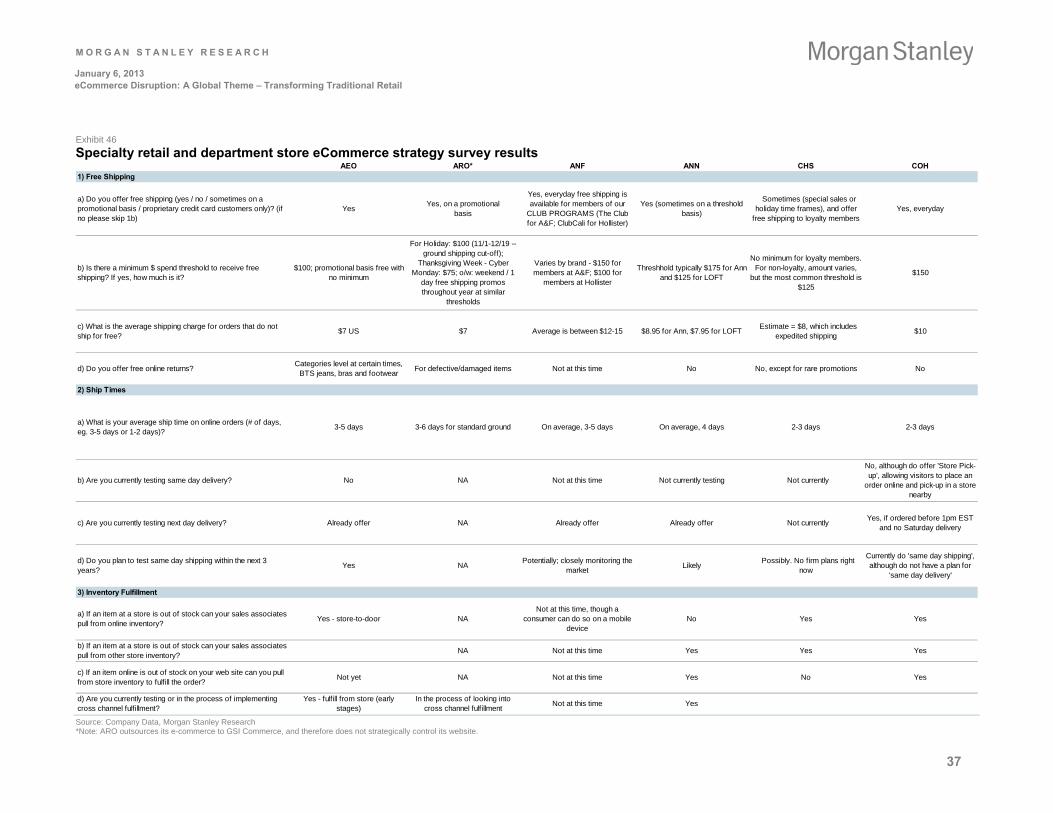
M O R G A N S T A N L E Y R E S E A R C H
37
January 6, 2013 eCommerce Disruption: A Global Theme – Transforming Traditional Retail
Exhibit 46
Specialty retail and department store eCommerce strategy survey results AEO ARO* ANF ANN CHS COH
1) Free Shipping
a) Do you offer free shipping (yes / no / sometimes on a promotional basis / proprietary credit card customers only)? (if no please skip 1b)
YesYes, on a promotional
basis
Yes, everyday free shipping is available for members of our
CLUB PROGRAMS (The Club for A&F; ClubCali for Hollister)
Yes (sometimes on a threshold basis)
Sometimes (special sales or holiday time frames), and offer
free shipping to loyalty membersYes, everyday
b) Is there a minimum $ spend threshold to receive free shipping? If yes, how much is it?
$100; promotional basis free with no minimum
For Holiday: $100 (11/1-12/19 -- ground shipping cut-off);
Thanksgiving Week - Cyber Monday: $75; o/w: weekend / 1
day free shipping promos throughout year at similar
thresholds
Varies by brand - $150 for members at A&F; $100 for
members at Hollister
Threshhold typically $175 for Ann and $125 for LOFT
No minimum for loyalty members. For non-loyalty, amount varies,
but the most common threshold is $125
$150
c) What is the average shipping charge for orders that do not ship for free?
$7 US $7 Average is between $12-15 $8.95 for Ann, $7.95 for LOFT Estimate = $8, which includes
expedited shipping$10
d) Do you offer free online returns?Categories level at certain times,
BTS jeans, bras and footwearFor defective/damaged items Not at this time No No, except for rare promotions No
2) Ship Times
a) What is your average ship time on online orders (# of days, eg. 3-5 days or 1-2 days)?
3-5 days 3-6 days for standard ground On average, 3-5 days On average, 4 days 2-3 days 2-3 days
b) Are you currently testing same day delivery? No NA Not at this time Not currently testing Not currently
No, although do offer 'Store Pick-up', allowing visitors to place an
order online and pick-up in a store nearby
c) Are you currently testing next day delivery? Already offer NA Already offer Already offer Not currentlyYes, if ordered before 1pm EST
and no Saturday delivery
d) Do you plan to test same day shipping within the next 3 years?
Yes NAPotentially; closely monitoring the
marketLikely
Possibly. No firm plans right now
Currently do 'same day shipping', although do not have a plan for
'same day delivery'
3) Inventory Fulfillment
a) If an item at a store is out of stock can your sales associates pull from online inventory?
Yes - store-to-door NANot at this time, though a
consumer can do so on a mobile device
No Yes Yes
b) If an item at a store is out of stock can your sales associates pull from other store inventory?
NA Not at this time Yes Yes Yes
c) If an item online is out of stock on your web site can you pull from store inventory to fulfill the order?
Not yet NA Not at this time Yes No Yes
d) Are you currently testing or in the process of implementing cross channel fulfillment?
Yes - fulfill from store (early stages)
In the process of looking into cross channel fulfillment
Not at this time Yes
Source: Company Data, Morgan Stanley Research *Note: ARO outsources its e-commerce to GSI Commerce, and therefore does not strategically control its website.
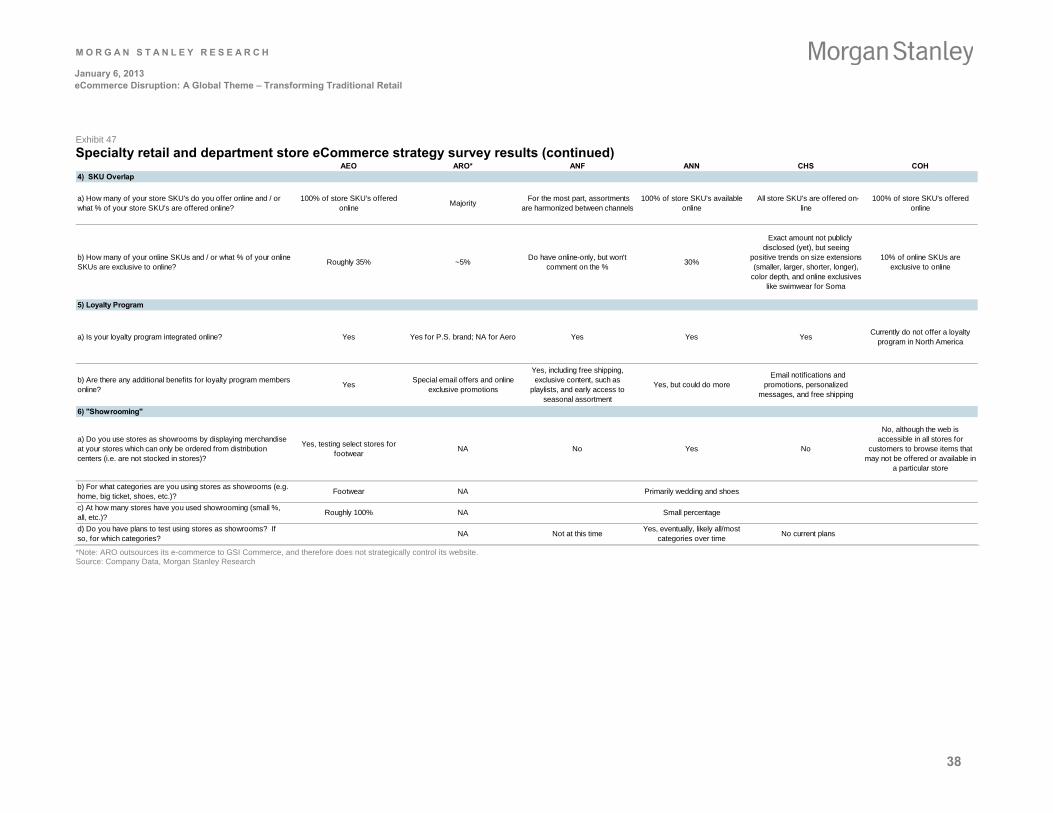
M O R G A N S T A N L E Y R E S E A R C H
38
January 6, 2013 eCommerce Disruption: A Global Theme – Transforming Traditional Retail
Exhibit 47
Specialty retail and department store eCommerce strategy survey results (continued) AEO ARO* ANF ANN CHS COH
4) SKU Overlap
a) How many of your store SKU's do you offer online and / or what % of your store SKU's are offered online?
100% of store SKU's offered online
Majority For the most part, assortments
are harmonized between channels100% of store SKU's available
online All store SKU's are offered on-
line100% of store SKU's offered
online
b) How many of your online SKUs and / or what % of your online SKUs are exclusive to online?
Roughly 35% ~5%Do have online-only, but won't
comment on the %30%
Exact amount not publicly disclosed (yet), but seeing
positive trends on size extensions (smaller, larger, shorter, longer),
color depth, and online exclusives like swimwear for Soma
10% of online SKUs are exclusive to online
5) Loyalty Program
a) Is your loyalty program integrated online? Yes Yes for P.S. brand; NA for Aero Yes Yes YesCurrently do not offer a loyalty
program in North America
b) Are there any additional benefits for loyalty program members online?
YesSpecial email offers and online
exclusive promotions
Yes, including free shipping, exclusive content, such as
playlists, and early access to seasonal assortment
Yes, but could do more Email notifications and
promotions, personalized messages, and free shipping
6) "Showrooming"
a) Do you use stores as showrooms by displaying merchandise at your stores which can only be ordered from distribution centers (i.e. are not stocked in stores)?
Yes, testing select stores for footwear
NA No Yes No
No, although the web is accessible in all stores for
customers to browse items that may not be offered or available in
a particular store
b) For what categories are you using stores as showrooms (e.g. home, big ticket, shoes, etc.)?
Footwear NA Primarily wedding and shoes
c) At how many stores have you used showrooming (small %, all, etc.)?
Roughly 100% NA Small percentage
d) Do you have plans to test using stores as showrooms? If so, for which categories?
NA Not at this timeYes, eventually, likely all/most
categories over time No current plans
*Note: ARO outsources its e-commerce to GSI Commerce, and therefore does not strategically control its website. Source: Company Data, Morgan Stanley Research
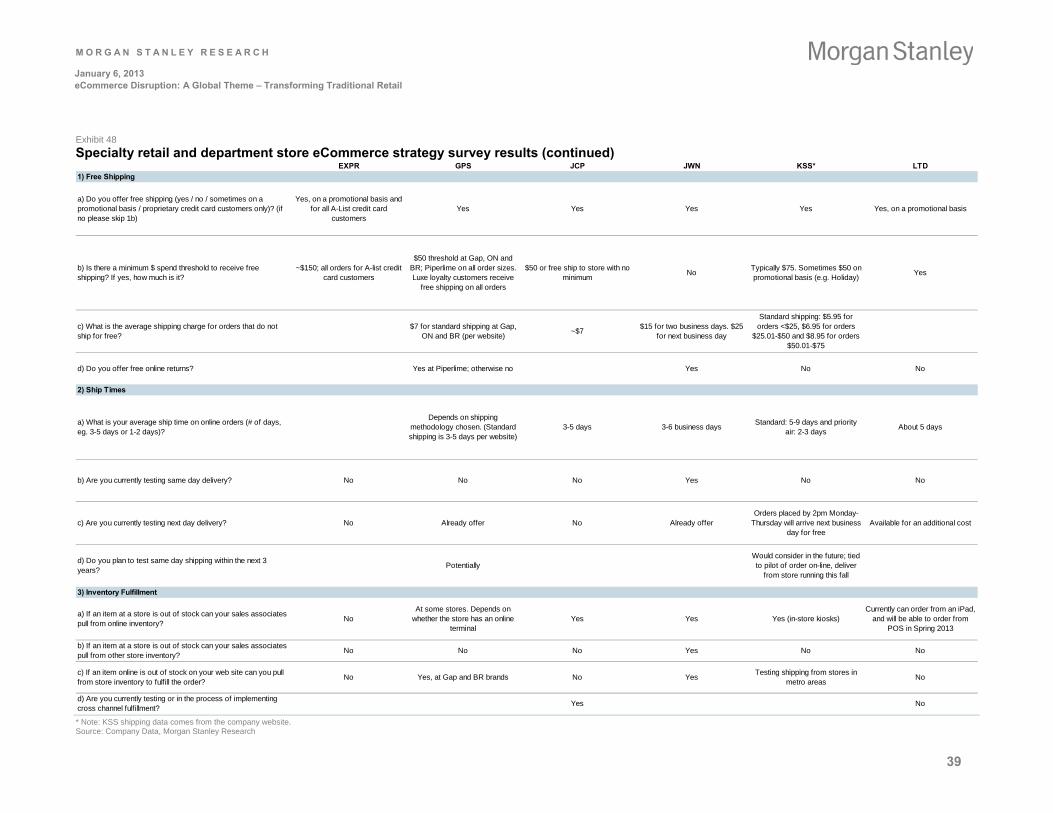
M O R G A N S T A N L E Y R E S E A R C H
39
January 6, 2013 eCommerce Disruption: A Global Theme – Transforming Traditional Retail
Exhibit 48
Specialty retail and department store eCommerce strategy survey results (continued) EXPR GPS JCP JWN KSS* LTD
1) Free Shipping
a) Do you offer free shipping (yes / no / sometimes on a promotional basis / proprietary credit card customers only)? (if no please skip 1b)
Yes, on a promotional basis and for all A-List credit card
customersYes Yes Yes Yes Yes, on a promotional basis
b) Is there a minimum $ spend threshold to receive free shipping? If yes, how much is it?
~$150; all orders for A-list credit card customers
$50 threshold at Gap, ON and BR; Piperlime on all order sizes. Luxe loyalty customers receive
free shipping on all orders
$50 or free ship to store with no minimum
NoTypically $75. Sometimes $50 on promotional basis (e.g. Holiday)
Yes
c) What is the average shipping charge for orders that do not ship for free?
$7 for standard shipping at Gap, ON and BR (per website)
~$7$15 for two business days. $25
for next business day
Standard shipping: $5.95 for orders <$25, $6.95 for orders
$25.01-$50 and $8.95 for orders $50.01-$75
d) Do you offer free online returns? Yes at Piperlime; otherwise no Yes No No
2) Ship Times
a) What is your average ship time on online orders (# of days, eg. 3-5 days or 1-2 days)?
Depends on shipping methodology chosen. (Standard shipping is 3-5 days per website)
3-5 days 3-6 business daysStandard: 5-9 days and priority
air: 2-3 daysAbout 5 days
b) Are you currently testing same day delivery? No No No Yes No No
c) Are you currently testing next day delivery? No Already offer No Already offerOrders placed by 2pm Monday-
Thursday will arrive next business day for free
Available for an additional cost
d) Do you plan to test same day shipping within the next 3 years?
PotentiallyWould consider in the future; tied to pilot of order on-line, deliver
from store running this fall
3) Inventory Fulfillment
a) If an item at a store is out of stock can your sales associates pull from online inventory?
NoAt some stores. Depends on
whether the store has an online terminal
Yes Yes Yes (in-store kiosks)Currently can order from an iPad,
and will be able to order from POS in Spring 2013
b) If an item at a store is out of stock can your sales associates pull from other store inventory?
No No No Yes No No
c) If an item online is out of stock on your web site can you pull from store inventory to fulfill the order?
No Yes, at Gap and BR brands No YesTesting shipping from stores in
metro areasNo
d) Are you currently testing or in the process of implementing cross channel fulfillment?
Yes No
* Note: KSS shipping data comes from the company website. Source: Company Data, Morgan Stanley Research
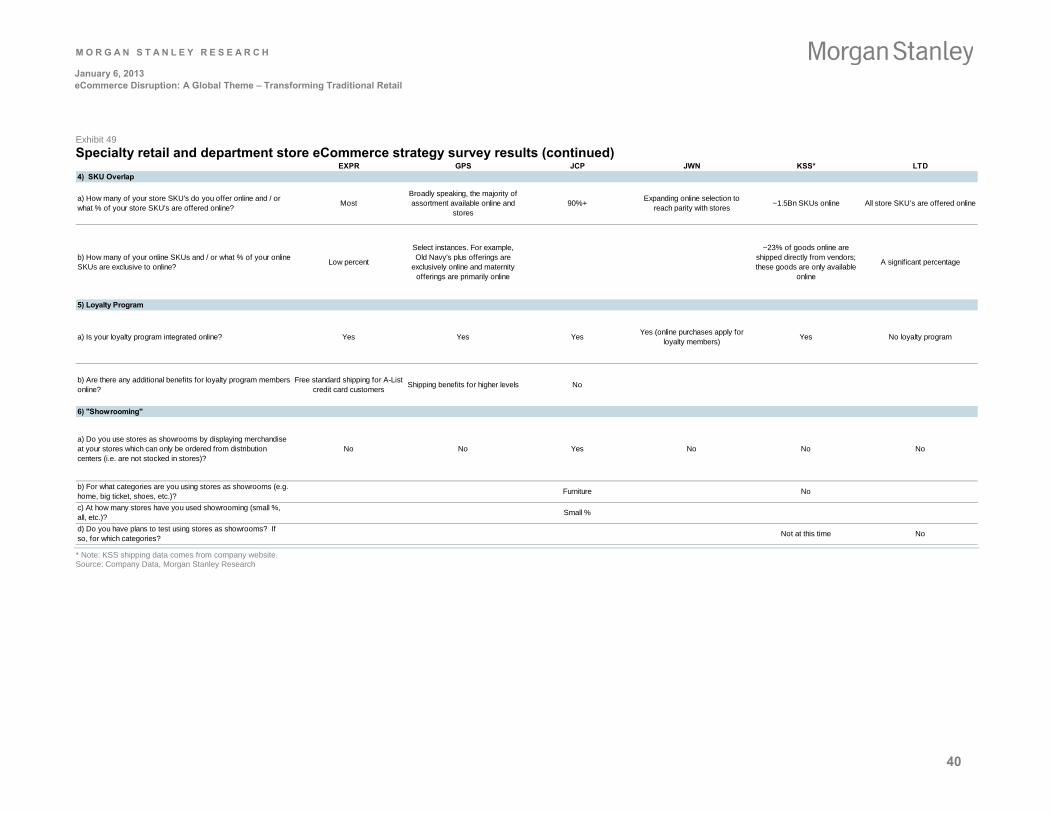
M O R G A N S T A N L E Y R E S E A R C H
40
January 6, 2013 eCommerce Disruption: A Global Theme – Transforming Traditional Retail
Exhibit 49
Specialty retail and department store eCommerce strategy survey results (continued) EXPR GPS JCP JWN KSS* LTD
4) SKU Overlap
a) How many of your store SKU's do you offer online and / or what % of your store SKU's are offered online?
MostBroadly speaking, the majority of assortment available online and
stores90%+
Expanding online selection to reach parity with stores
~1.5Bn SKUs online All store SKU’s are offered online
b) How many of your online SKUs and / or what % of your online SKUs are exclusive to online?
Low percent
Select instances. For example, Old Navy's plus offerings are
exclusively online and maternity offerings are primarily online
~23% of goods online are shipped directly from vendors; these goods are only available
online
A significant percentage
5) Loyalty Program
a) Is your loyalty program integrated online? Yes Yes YesYes (online purchases apply for
loyalty members)Yes No loyalty program
b) Are there any additional benefits for loyalty program members online?
Free standard shipping for A-List credit card customers
Shipping benefits for higher levels No
6) "Showrooming"
a) Do you use stores as showrooms by displaying merchandise at your stores which can only be ordered from distribution centers (i.e. are not stocked in stores)?
No No Yes No No No
b) For what categories are you using stores as showrooms (e.g. home, big ticket, shoes, etc.)?
Furniture No
c) At how many stores have you used showrooming (small %, all, etc.)?
Small %
d) Do you have plans to test using stores as showrooms? If so, for which categories?
Not at this time No
* Note: KSS shipping data comes from company website. Source: Company Data, Morgan Stanley Research
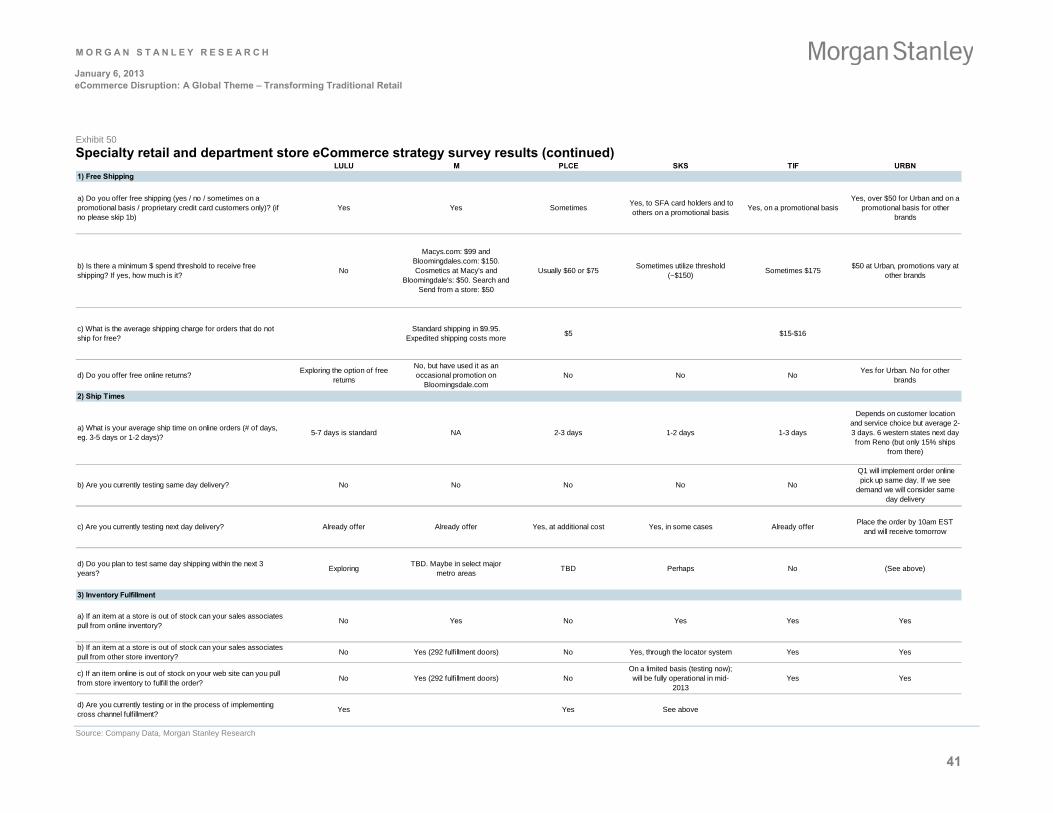
M O R G A N S T A N L E Y R E S E A R C H
41
January 6, 2013 eCommerce Disruption: A Global Theme – Transforming Traditional Retail
Exhibit 50
Specialty retail and department store eCommerce strategy survey results (continued) LULU M PLCE SKS TIF URBN
1) Free Shipping
a) Do you offer free shipping (yes / no / sometimes on a promotional basis / proprietary credit card customers only)? (if no please skip 1b)
Yes Yes Sometimes Yes, to SFA card holders and to
others on a promotional basisYes, on a promotional basis
Yes, over $50 for Urban and on a promotional basis for other
brands
b) Is there a minimum $ spend threshold to receive free shipping? If yes, how much is it?
No
Macys.com: $99 and Bloomingdales.com: $150. Cosmetics at Macy's and
Bloomingdale's: $50. Search and Send from a store: $50
Usually $60 or $75Sometimes utilize threshold
(~$150)Sometimes $175
$50 at Urban, promotions vary at other brands
c) What is the average shipping charge for orders that do not ship for free?
Standard shipping in $9.95. Expedited shipping costs more
$5 $15-$16
d) Do you offer free online returns?Exploring the option of free
returns
No, but have used it as an occasional promotion on
Bloomingsdale.comNo No No
Yes for Urban. No for other brands
2) Ship Times
a) What is your average ship time on online orders (# of days, eg. 3-5 days or 1-2 days)?
5-7 days is standard NA 2-3 days 1-2 days 1-3 days
Depends on customer location and service choice but average 2-3 days. 6 western states next day from Reno (but only 15% ships
from there)
b) Are you currently testing same day delivery? No No No No No
Q1 will implement order online pick up same day. If we see
demand we will consider same day delivery
c) Are you currently testing next day delivery? Already offer Already offer Yes, at additional cost Yes, in some cases Already offerPlace the order by 10am EST
and will receive tomorrow
d) Do you plan to test same day shipping within the next 3 years?
ExploringTBD. Maybe in select major
metro areasTBD Perhaps No (See above)
3) Inventory Fulfillment
a) If an item at a store is out of stock can your sales associates pull from online inventory?
No Yes No Yes Yes Yes
b) If an item at a store is out of stock can your sales associates pull from other store inventory?
No Yes (292 fulfillment doors) No Yes, through the locator system Yes Yes
c) If an item online is out of stock on your web site can you pull from store inventory to fulfill the order?
No Yes (292 fulfillment doors) NoOn a limited basis (testing now); will be fully operational in mid-
2013Yes Yes
d) Are you currently testing or in the process of implementing cross channel fulfillment?
Yes Yes See above
Source: Company Data, Morgan Stanley Research
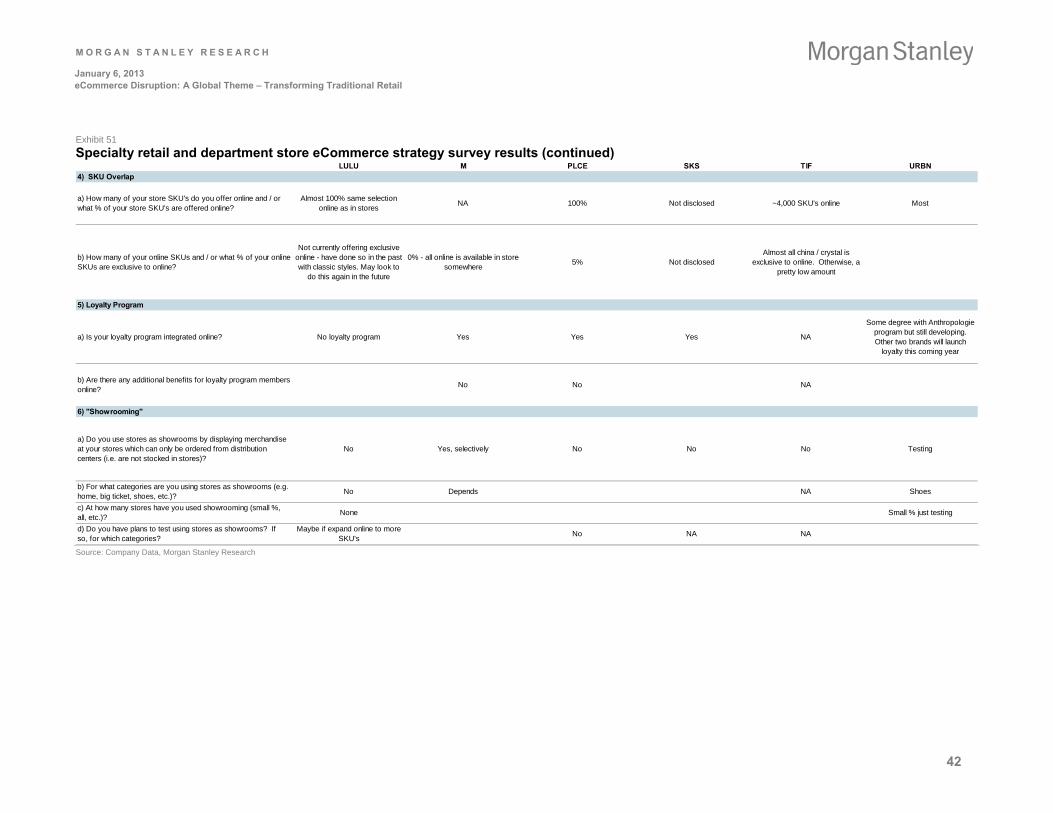
M O R G A N S T A N L E Y R E S E A R C H
42
January 6, 2013 eCommerce Disruption: A Global Theme – Transforming Traditional Retail
Exhibit 51
Specialty retail and department store eCommerce strategy survey results (continued) LULU M PLCE SKS TIF URBN
4) SKU Overlap
a) How many of your store SKU's do you offer online and / or what % of your store SKU's are offered online?
Almost 100% same selection online as in stores
NA 100% Not disclosed ~4,000 SKU's online Most
b) How many of your online SKUs and / or what % of your online SKUs are exclusive to online?
Not currently offering exclusive online - have done so in the past with classic styles. May look to
do this again in the future
0% - all online is available in store somewhere
5% Not disclosedAlmost all china / crystal is
exclusive to online. Otherwise, a pretty low amount
5) Loyalty Program
a) Is your loyalty program integrated online? No loyalty program Yes Yes Yes NA
Some degree with Anthropologie program but still developing. Other two brands will launch
loyalty this coming year
b) Are there any additional benefits for loyalty program members online?
No No NA
6) "Showrooming"
a) Do you use stores as showrooms by displaying merchandise at your stores which can only be ordered from distribution centers (i.e. are not stocked in stores)?
No Yes, selectively No No No Testing
b) For what categories are you using stores as showrooms (e.g. home, big ticket, shoes, etc.)?
No Depends NA Shoes
c) At how many stores have you used showrooming (small %, all, etc.)?
None Small % just testing
d) Do you have plans to test using stores as showrooms? If so, for which categories?
Maybe if expand online to more SKU's
No NA NA
Source: Company Data, Morgan Stanley Research
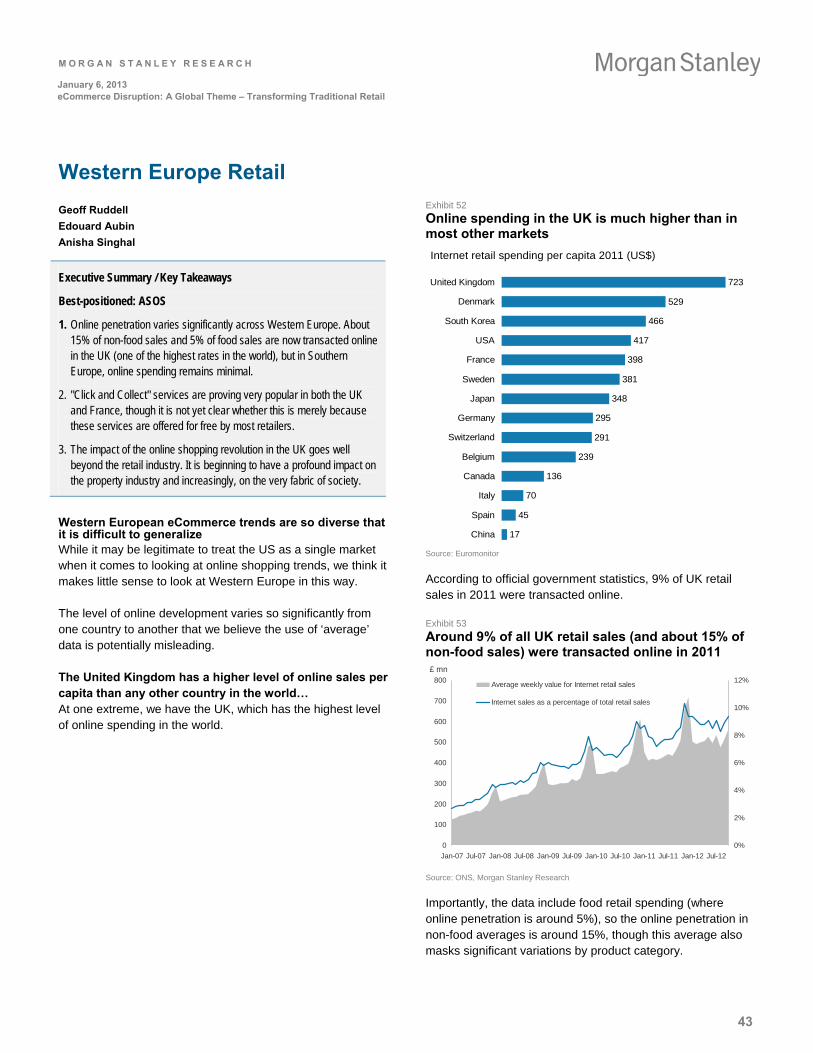
M O R G A N S T A N L E Y R E S E A R C H
43
January 6, 2013 eCommerce Disruption: A Global Theme – Transforming Traditional Retail
Western Europe Retail
Geoff Ruddell
Edouard Aubin
Anisha Singhal
Executive Summary / Key Takeaways
Best-positioned: ASOS
1. Online penetration varies significantly across Western Europe. About 15% of non-food sales and 5% of food sales are now transacted online in the UK (one of the highest rates in the world), but in Southern Europe, online spending remains minimal.
2. "Click and Collect" services are proving very popular in both the UK and France, though it is not yet clear whether this is merely because these services are offered for free by most retailers.
3. The impact of the online shopping revolution in the UK goes well beyond the retail industry. It is beginning to have a profound impact on the property industry and increasingly, on the very fabric of society.
Western European eCommerce trends are so diverse that it is difficult to generalize While it may be legitimate to treat the US as a single market when it comes to looking at online shopping trends, we think it makes little sense to look at Western Europe in this way.
The level of online development varies so significantly from one country to another that we believe the use of ‘average’ data is potentially misleading.
The United Kingdom has a higher level of online sales per capita than any other country in the world… At one extreme, we have the UK, which has the highest level of online spending in the world.
Exhibit 52
Online spending in the UK is much higher than in most other markets
Internet retail spending per capita 2011 (US$)
17
45
70
136
239
291
295
348
381
398
417
466
529
723
China
Spain
Italy
Canada
Belgium
Switzerland
Germany
Japan
Sweden
France
USA
South Korea
Denmark
United Kingdom
Source: Euromonitor
According to official government statistics, 9% of UK retail sales in 2011 were transacted online.
Exhibit 53
Around 9% of all UK retail sales (and about 15% of non-food sales) were transacted online in 2011
0
100
200
300
400
500
600
700
800
Jan-07 Jul-07 Jan-08 Jul-08 Jan-09 Jul-09 Jan-10 Jul-10 Jan-11 Jul-11 Jan-12 Jul-12
0%
2%
4%
6%
8%
10%
12%Average weekly value for Internet retail sales
Internet sales as a percentage of total retail sales
£ mn
Source: ONS, Morgan Stanley Research
Importantly, the data include food retail spending (where online penetration is around 5%), so the online penetration in non-food averages is around 15%, though this average also masks significant variations by product category.
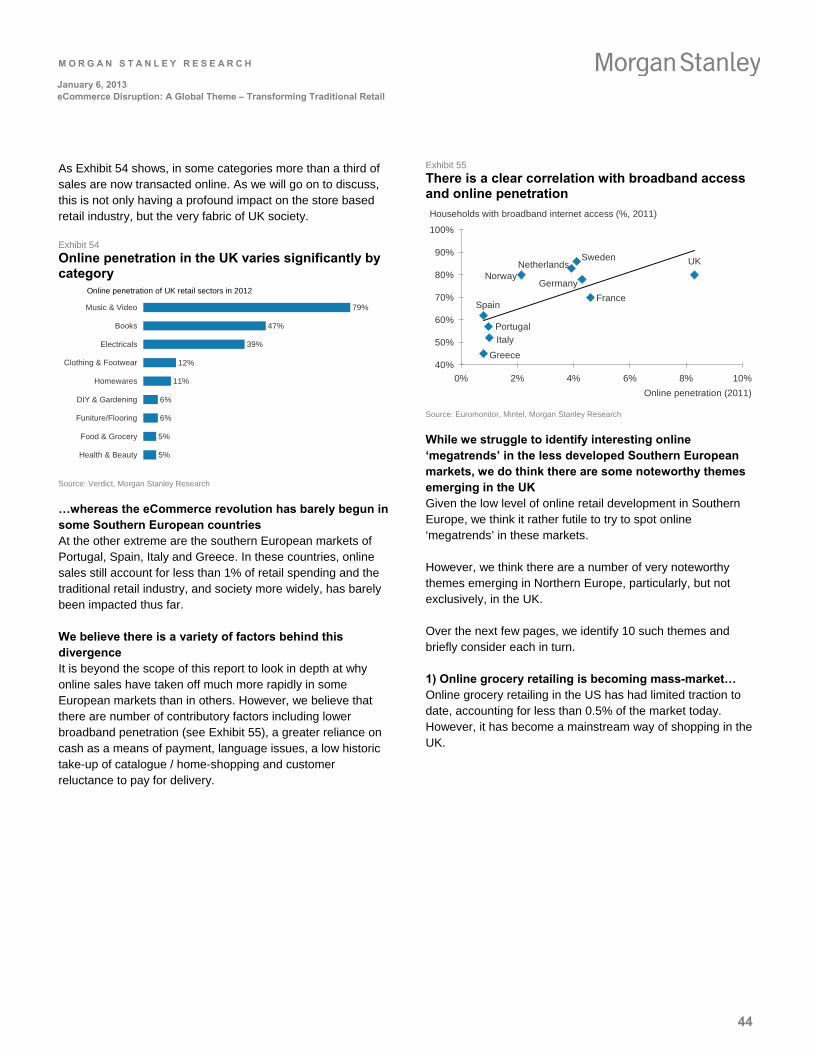
M O R G A N S T A N L E Y R E S E A R C H
44
January 6, 2013 eCommerce Disruption: A Global Theme – Transforming Traditional Retail
As Exhibit 54 shows, in some categories more than a third of sales are now transacted online. As we will go on to discuss, this is not only having a profound impact on the store based retail industry, but the very fabric of UK society.
Exhibit 54
Online penetration in the UK varies significantly by category
5%
5%
6%
6%
11%
12%
39%
47%
79%
Health & Beauty
Food & Grocery
Funiture/Flooring
DIY & Gardening
Homewares
Clothing & Footwear
Electricals
Books
Music & Video
Online penetration of UK retail sectors in 2012
Source: Verdict, Morgan Stanley Research
…whereas the eCommerce revolution has barely begun in some Southern European countries At the other extreme are the southern European markets of Portugal, Spain, Italy and Greece. In these countries, online sales still account for less than 1% of retail spending and the traditional retail industry, and society more widely, has barely been impacted thus far.
We believe there is a variety of factors behind this divergence It is beyond the scope of this report to look in depth at why online sales have taken off much more rapidly in some European markets than in others. However, we believe that there are number of contributory factors including lower broadband penetration (see Exhibit 55), a greater reliance on cash as a means of payment, language issues, a low historic take-up of catalogue / home-shopping and customer reluctance to pay for delivery.
Exhibit 55
There is a clear correlation with broadband access and online penetration
Households with broadband internet access (%, 2011)
UK
France
Germany
SwedenNetherlands
Norway
Italy
Portugal
Spain
Greece40%
50%
60%
70%
80%
90%
100%
0% 2% 4% 6% 8% 10%
Online penetration (2011)
Source: Euromonitor, Mintel, Morgan Stanley Research
While we struggle to identify interesting online ‘megatrends’ in the less developed Southern European markets, we do think there are some noteworthy themes emerging in the UK Given the low level of online retail development in Southern Europe, we think it rather futile to try to spot online ‘megatrends’ in these markets.
However, we think there are a number of very noteworthy themes emerging in Northern Europe, particularly, but not exclusively, in the UK.
Over the next few pages, we identify 10 such themes and briefly consider each in turn.
1) Online grocery retailing is becoming mass-market… Online grocery retailing in the US has had limited traction to date, accounting for less than 0.5% of the market today. However, it has become a mainstream way of shopping in the UK.
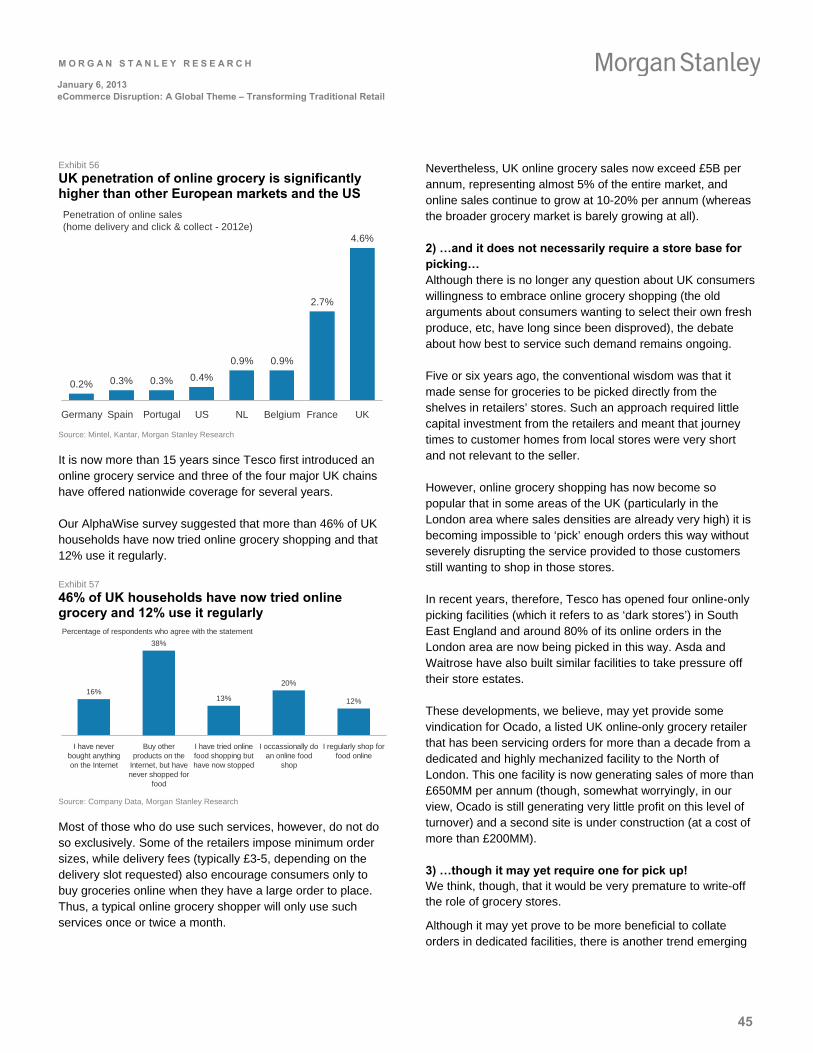
M O R G A N S T A N L E Y R E S E A R C H
45
January 6, 2013 eCommerce Disruption: A Global Theme – Transforming Traditional Retail
Exhibit 56
UK penetration of online grocery is significantly higher than other European markets and the US
Penetration of online sales(home delivery and click & collect - 2012e)
0.2% 0.3% 0.3% 0.4%
0.9% 0.9%
2.7%
4.6%
Germany Spain Portugal US NL Belgium France UK
Source: Mintel, Kantar, Morgan Stanley Research
It is now more than 15 years since Tesco first introduced an online grocery service and three of the four major UK chains have offered nationwide coverage for several years.
Our AlphaWise survey suggested that more than 46% of UK households have now tried online grocery shopping and that 12% use it regularly.
Exhibit 57
46% of UK households have now tried online grocery and 12% use it regularly Percentage of respondents who agree with the statement
16%
38%
13%
20%
12%
I have neverbought anythingon the Internet
Buy otherproducts on the
Internet, but havenever shopped for
food
I have tried onlinefood shopping buthave now stopped
I occassionally doan online food
shop
I regularly shop forfood online
Source: Company Data, Morgan Stanley Research
Most of those who do use such services, however, do not do so exclusively. Some of the retailers impose minimum order sizes, while delivery fees (typically £3-5, depending on the delivery slot requested) also encourage consumers only to buy groceries online when they have a large order to place. Thus, a typical online grocery shopper will only use such services once or twice a month.
Nevertheless, UK online grocery sales now exceed £5B per annum, representing almost 5% of the entire market, and online sales continue to grow at 10-20% per annum (whereas the broader grocery market is barely growing at all).
2) …and it does not necessarily require a store base for picking… Although there is no longer any question about UK consumers willingness to embrace online grocery shopping (the old arguments about consumers wanting to select their own fresh produce, etc, have long since been disproved), the debate about how best to service such demand remains ongoing.
Five or six years ago, the conventional wisdom was that it made sense for groceries to be picked directly from the shelves in retailers’ stores. Such an approach required little capital investment from the retailers and meant that journey times to customer homes from local stores were very short and not relevant to the seller.
However, online grocery shopping has now become so popular that in some areas of the UK (particularly in the London area where sales densities are already very high) it is becoming impossible to ‘pick’ enough orders this way without severely disrupting the service provided to those customers still wanting to shop in those stores.
In recent years, therefore, Tesco has opened four online-only picking facilities (which it refers to as ‘dark stores’) in South East England and around 80% of its online orders in the London area are now being picked in this way. Asda and Waitrose have also built similar facilities to take pressure off their store estates.
These developments, we believe, may yet provide some vindication for Ocado, a listed UK online-only grocery retailer that has been servicing orders for more than a decade from a dedicated and highly mechanized facility to the North of London. This one facility is now generating sales of more than £650MM per annum (though, somewhat worryingly, in our view, Ocado is still generating very little profit on this level of turnover) and a second site is under construction (at a cost of more than £200MM).
3) …though it may yet require one for pick up! We think, though, that it would be very premature to write-off the role of grocery stores.
Although it may yet prove to be more beneficial to collate orders in dedicated facilities, there is another trend emerging
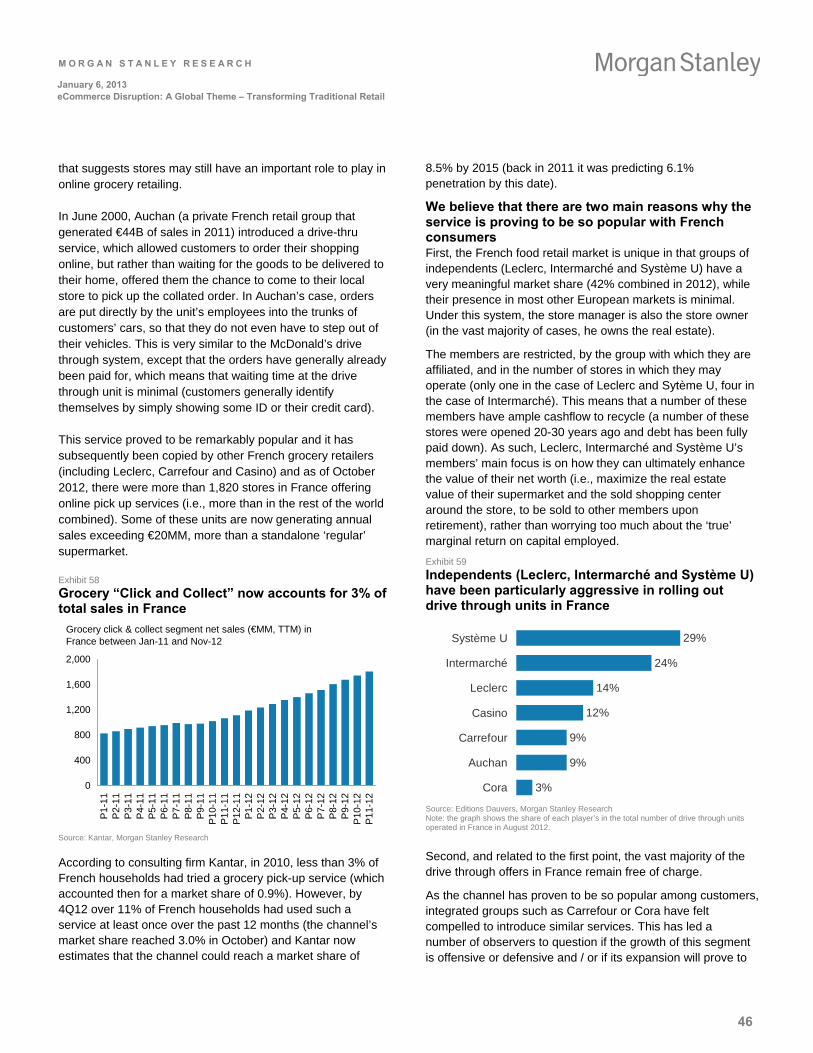
M O R G A N S T A N L E Y R E S E A R C H
46
January 6, 2013 eCommerce Disruption: A Global Theme – Transforming Traditional Retail
that suggests stores may still have an important role to play in online grocery retailing.
In June 2000, Auchan (a private French retail group that generated €44B of sales in 2011) introduced a drive-thru service, which allowed customers to order their shopping online, but rather than waiting for the goods to be delivered to their home, offered them the chance to come to their local store to pick up the collated order. In Auchan’s case, orders are put directly by the unit’s employees into the trunks of customers’ cars, so that they do not even have to step out of their vehicles. This is very similar to the McDonald’s drive through system, except that the orders have generally already been paid for, which means that waiting time at the drive through unit is minimal (customers generally identify themselves by simply showing some ID or their credit card).
This service proved to be remarkably popular and it has subsequently been copied by other French grocery retailers (including Leclerc, Carrefour and Casino) and as of October 2012, there were more than 1,820 stores in France offering online pick up services (i.e., more than in the rest of the world combined). Some of these units are now generating annual sales exceeding €20MM, more than a standalone ‘regular’ supermarket.
Exhibit 58
Grocery “Click and Collect” now accounts for 3% of total sales in France
Grocery click & collect segment net sales (€MM, TTM) in France between Jan-11 and Nov-12
0
400
800
1,200
1,600
2,000
P1-
11P
2-11
P3-
11P
4-11
P5-
11P
6-11
P7-
11P
8-11
P9-
11P
10-1
1P
11-1
1P
12-1
1P
1-12
P2-
12P
3-12
P4-
12P
5-12
P6-
12P
7-12
P8-
12P
9-12
P10
-12
P11
-12
Source: Kantar, Morgan Stanley Research
According to consulting firm Kantar, in 2010, less than 3% of French households had tried a grocery pick-up service (which accounted then for a market share of 0.9%). However, by 4Q12 over 11% of French households had used such a service at least once over the past 12 months (the channel’s market share reached 3.0% in October) and Kantar now estimates that the channel could reach a market share of
8.5% by 2015 (back in 2011 it was predicting 6.1% penetration by this date).
We believe that there are two main reasons why the service is proving to be so popular with French consumers First, the French food retail market is unique in that groups of independents (Leclerc, Intermarché and Système U) have a very meaningful market share (42% combined in 2012), while their presence in most other European markets is minimal. Under this system, the store manager is also the store owner (in the vast majority of cases, he owns the real estate).
The members are restricted, by the group with which they are affiliated, and in the number of stores in which they may operate (only one in the case of Leclerc and Sytème U, four in the case of Intermarché). This means that a number of these members have ample cashflow to recycle (a number of these stores were opened 20-30 years ago and debt has been fully paid down). As such, Leclerc, Intermarché and Système U’s members’ main focus is on how they can ultimately enhance the value of their net worth (i.e., maximize the real estate value of their supermarket and the sold shopping center around the store, to be sold to other members upon retirement), rather than worrying too much about the ‘true’ marginal return on capital employed.
Exhibit 59
Independents (Leclerc, Intermarché and Système U) have been particularly aggressive in rolling out drive through units in France
29%
24%
14%
12%
9%
9%
3%
Système U
Intermarché
Leclerc
Casino
Carrefour
Auchan
Cora
Source: Editions Dauvers, Morgan Stanley Research Note: the graph shows the share of each player’s in the total number of drive through units operated in France in August 2012.
Second, and related to the first point, the vast majority of the drive through offers in France remain free of charge.
As the channel has proven to be so popular among customers, integrated groups such as Carrefour or Cora have felt compelled to introduce similar services. This has led a number of observers to question if the growth of this segment is offensive or defensive and / or if its expansion will prove to
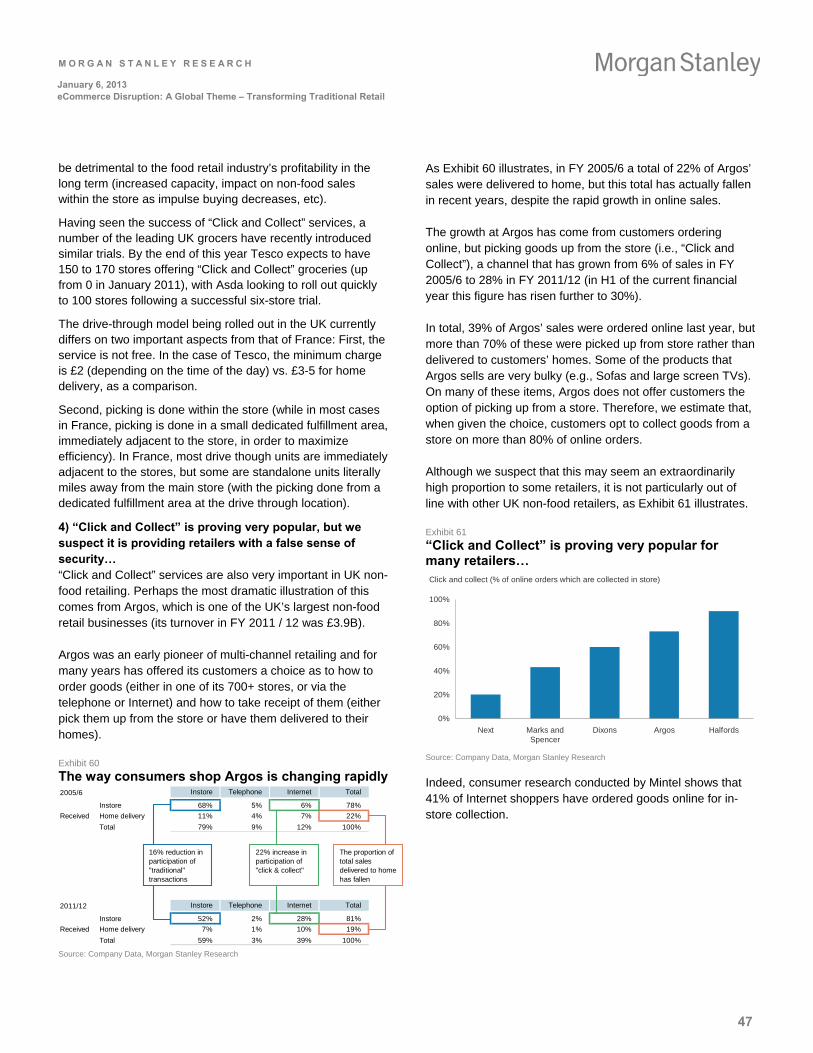
M O R G A N S T A N L E Y R E S E A R C H
47
January 6, 2013 eCommerce Disruption: A Global Theme – Transforming Traditional Retail
be detrimental to the food retail industry’s profitability in the long term (increased capacity, impact on non-food sales within the store as impulse buying decreases, etc).
Having seen the success of “Click and Collect” services, a number of the leading UK grocers have recently introduced similar trials. By the end of this year Tesco expects to have 150 to 170 stores offering “Click and Collect” groceries (up from 0 in January 2011), with Asda looking to roll out quickly to 100 stores following a successful six-store trial.
The drive-through model being rolled out in the UK currently differs on two important aspects from that of France: First, the service is not free. In the case of Tesco, the minimum charge is £2 (depending on the time of the day) vs. £3-5 for home delivery, as a comparison.
Second, picking is done within the store (while in most cases in France, picking is done in a small dedicated fulfillment area, immediately adjacent to the store, in order to maximize efficiency). In France, most drive though units are immediately adjacent to the stores, but some are standalone units literally miles away from the main store (with the picking done from a dedicated fulfillment area at the drive through location).
4) “Click and Collect” is proving very popular, but we suspect it is providing retailers with a false sense of security… “Click and Collect” services are also very important in UK non-food retailing. Perhaps the most dramatic illustration of this comes from Argos, which is one of the UK’s largest non-food retail businesses (its turnover in FY 2011 / 12 was £3.9B).
Argos was an early pioneer of multi-channel retailing and for many years has offered its customers a choice as to how to order goods (either in one of its 700+ stores, or via the telephone or Internet) and how to take receipt of them (either pick them up from the store or have them delivered to their homes).
Exhibit 60
The way consumers shop Argos is changing rapidly 2005/6 Instore Telephone Internet Total
Instore 68% 5% 6% 78%
Received Home delivery 11% 4% 7% 22%
Total 79% 9% 12% 100%
2011/12 Instore Telephone Internet Total
Instore 52% 2% 28% 81%
Received Home delivery 7% 1% 10% 19%
Total 59% 3% 39% 100%
16% reduction in participation of "traditional" transactions
22% increase in participation of "click & collect"
The proportion of total sales delivered to home has fallen
Source: Company Data, Morgan Stanley Research
As Exhibit 60 illustrates, in FY 2005/6 a total of 22% of Argos’ sales were delivered to home, but this total has actually fallen in recent years, despite the rapid growth in online sales.
The growth at Argos has come from customers ordering online, but picking goods up from the store (i.e., “Click and Collect”), a channel that has grown from 6% of sales in FY 2005/6 to 28% in FY 2011/12 (in H1 of the current financial year this figure has risen further to 30%).
In total, 39% of Argos’ sales were ordered online last year, but more than 70% of these were picked up from store rather than delivered to customers’ homes. Some of the products that Argos sells are very bulky (e.g., Sofas and large screen TVs). On many of these items, Argos does not offer customers the option of picking up from a store. Therefore, we estimate that, when given the choice, customers opt to collect goods from a store on more than 80% of online orders.
Although we suspect that this may seem an extraordinarily high proportion to some retailers, it is not particularly out of line with other UK non-food retailers, as Exhibit 61 illustrates.
Exhibit 61
“Click and Collect” is proving very popular for many retailers… Click and collect (% of online orders which are collected in store)
0%
20%
40%
60%
80%
100%
Next Marks andSpencer
Dixons Argos Halfords
Source: Company Data, Morgan Stanley Research
Indeed, consumer research conducted by Mintel shows that 41% of Internet shoppers have ordered goods online for in-store collection.
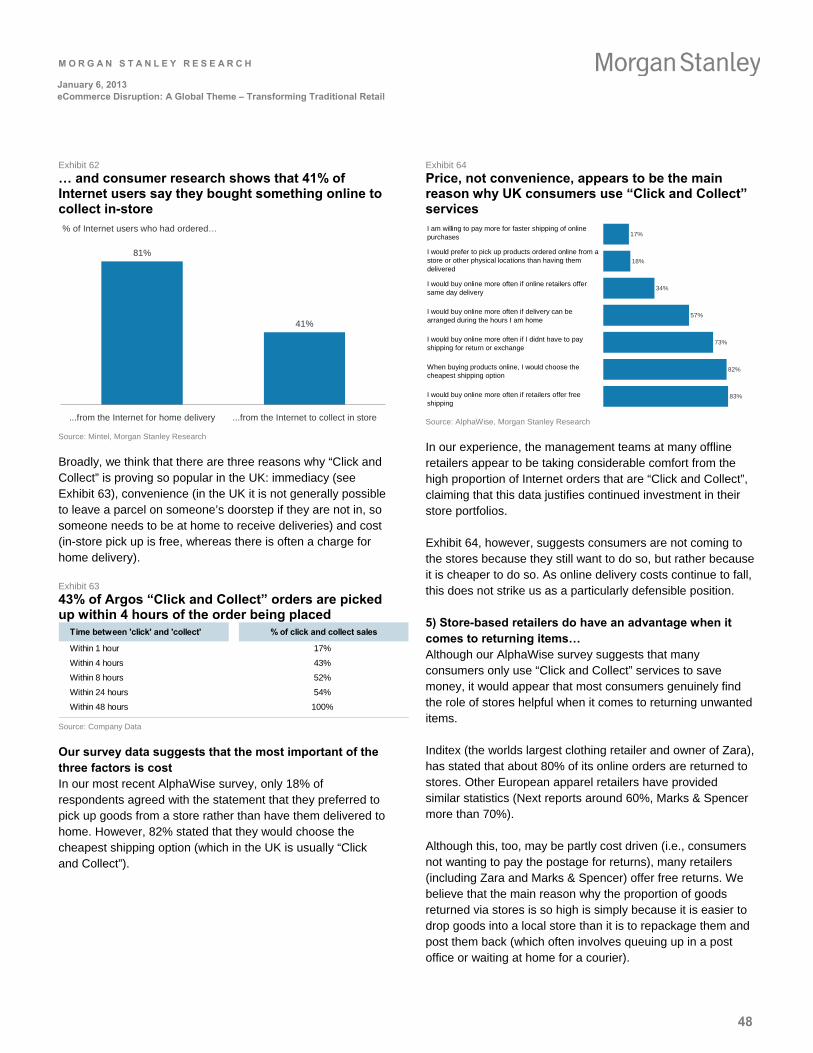
M O R G A N S T A N L E Y R E S E A R C H
48
January 6, 2013 eCommerce Disruption: A Global Theme – Transforming Traditional Retail
Exhibit 62
… and consumer research shows that 41% of Internet users say they bought something online to collect in-store % of Internet users who had ordered…
81%
41%
...from the Internet for home delivery ...from the Internet to collect in store Source: Mintel, Morgan Stanley Research
Broadly, we think that there are three reasons why “Click and Collect” is proving so popular in the UK: immediacy (see Exhibit 63), convenience (in the UK it is not generally possible to leave a parcel on someone’s doorstep if they are not in, so someone needs to be at home to receive deliveries) and cost (in-store pick up is free, whereas there is often a charge for home delivery).
Exhibit 63
43% of Argos “Click and Collect” orders are picked up within 4 hours of the order being placed
Time between 'click' and 'collect' % of click and collect sales
Within 1 hour 17%
Within 4 hours 43%
Within 8 hours 52%
Within 24 hours 54%
Within 48 hours 100%
Source: Company Data
Our survey data suggests that the most important of the three factors is cost In our most recent AlphaWise survey, only 18% of respondents agreed with the statement that they preferred to pick up goods from a store rather than have them delivered to home. However, 82% stated that they would choose the cheapest shipping option (which in the UK is usually “Click and Collect”).
Exhibit 64
Price, not convenience, appears to be the main reason why UK consumers use “Click and Collect” services I am willing to pay more for faster shipping of online purchases
I would prefer to pick up products ordered online from a store or other physical locations than having them delivered
I would buy online more often if online retailers offer same day delivery
I would buy online more often if delivery can be arranged during the hours I am home
I would buy online more often if I didnt have to pay shipping for return or exchange
When buying products online, I would choose the cheapest shipping option
I would buy online more often if retailers offer free shipping
17%
18%
34%
57%
73%
82%
83%
Source: AlphaWise, Morgan Stanley Research
In our experience, the management teams at many offline retailers appear to be taking considerable comfort from the high proportion of Internet orders that are “Click and Collect”, claiming that this data justifies continued investment in their store portfolios.
Exhibit 64, however, suggests consumers are not coming to the stores because they still want to do so, but rather because it is cheaper to do so. As online delivery costs continue to fall, this does not strike us as a particularly defensible position.
5) Store-based retailers do have an advantage when it comes to returning items… Although our AlphaWise survey suggests that many consumers only use “Click and Collect” services to save money, it would appear that most consumers genuinely find the role of stores helpful when it comes to returning unwanted items.
Inditex (the worlds largest clothing retailer and owner of Zara), has stated that about 80% of its online orders are returned to stores. Other European apparel retailers have provided similar statistics (Next reports around 60%, Marks & Spencer more than 70%).
Although this, too, may be partly cost driven (i.e., consumers not wanting to pay the postage for returns), many retailers (including Zara and Marks & Spencer) offer free returns. We believe that the main reason why the proportion of goods returned via stores is so high is simply because it is easier to drop goods into a local store than it is to repackage them and post them back (which often involves queuing up in a post office or waiting at home for a courier).
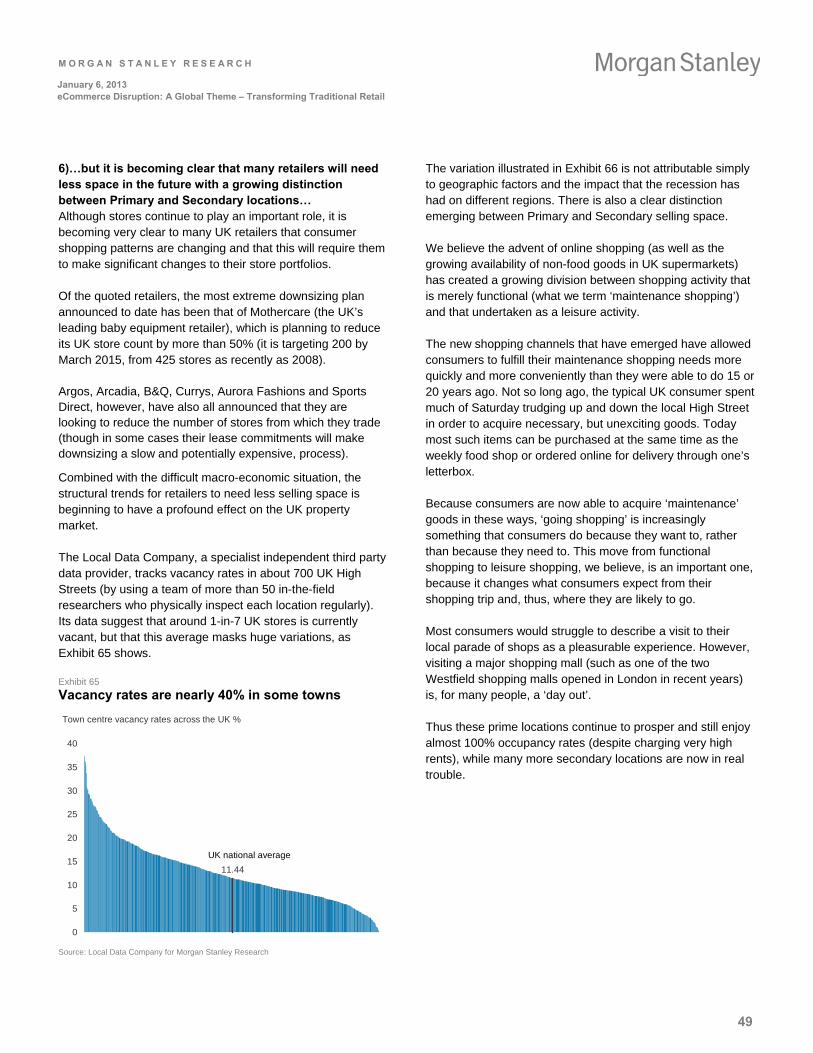
M O R G A N S T A N L E Y R E S E A R C H
49
January 6, 2013 eCommerce Disruption: A Global Theme – Transforming Traditional Retail
6)…but it is becoming clear that many retailers will need less space in the future with a growing distinction between Primary and Secondary locations… Although stores continue to play an important role, it is becoming very clear to many UK retailers that consumer shopping patterns are changing and that this will require them to make significant changes to their store portfolios.
Of the quoted retailers, the most extreme downsizing plan announced to date has been that of Mothercare (the UK’s leading baby equipment retailer), which is planning to reduce its UK store count by more than 50% (it is targeting 200 by March 2015, from 425 stores as recently as 2008).
Argos, Arcadia, B&Q, Currys, Aurora Fashions and Sports Direct, however, have also all announced that they are looking to reduce the number of stores from which they trade (though in some cases their lease commitments will make downsizing a slow and potentially expensive, process).
Combined with the difficult macro-economic situation, the structural trends for retailers to need less selling space is beginning to have a profound effect on the UK property market.
The Local Data Company, a specialist independent third party data provider, tracks vacancy rates in about 700 UK High Streets (by using a team of more than 50 in-the-field researchers who physically inspect each location regularly). Its data suggest that around 1-in-7 UK stores is currently vacant, but that this average masks huge variations, as Exhibit 65 shows.
Exhibit 65
Vacancy rates are nearly 40% in some towns
Town centre vacancy rates across the UK %
11.44
0
5
10
15
20
25
30
35
40
UK national average
Source: Local Data Company for Morgan Stanley Research
The variation illustrated in Exhibit 66 is not attributable simply to geographic factors and the impact that the recession has had on different regions. There is also a clear distinction emerging between Primary and Secondary selling space.
We believe the advent of online shopping (as well as the growing availability of non-food goods in UK supermarkets) has created a growing division between shopping activity that is merely functional (what we term ‘maintenance shopping’) and that undertaken as a leisure activity.
The new shopping channels that have emerged have allowed consumers to fulfill their maintenance shopping needs more quickly and more conveniently than they were able to do 15 or 20 years ago. Not so long ago, the typical UK consumer spent much of Saturday trudging up and down the local High Street in order to acquire necessary, but unexciting goods. Today most such items can be purchased at the same time as the weekly food shop or ordered online for delivery through one’s letterbox.
Because consumers are now able to acquire ‘maintenance’ goods in these ways, ‘going shopping’ is increasingly something that consumers do because they want to, rather than because they need to. This move from functional shopping to leisure shopping, we believe, is an important one, because it changes what consumers expect from their shopping trip and, thus, where they are likely to go.
Most consumers would struggle to describe a visit to their local parade of shops as a pleasurable experience. However, visiting a major shopping mall (such as one of the two Westfield shopping malls opened in London in recent years) is, for many people, a ‘day out’.
Thus these prime locations continue to prosper and still enjoy almost 100% occupancy rates (despite charging very high rents), while many more secondary locations are now in real trouble.
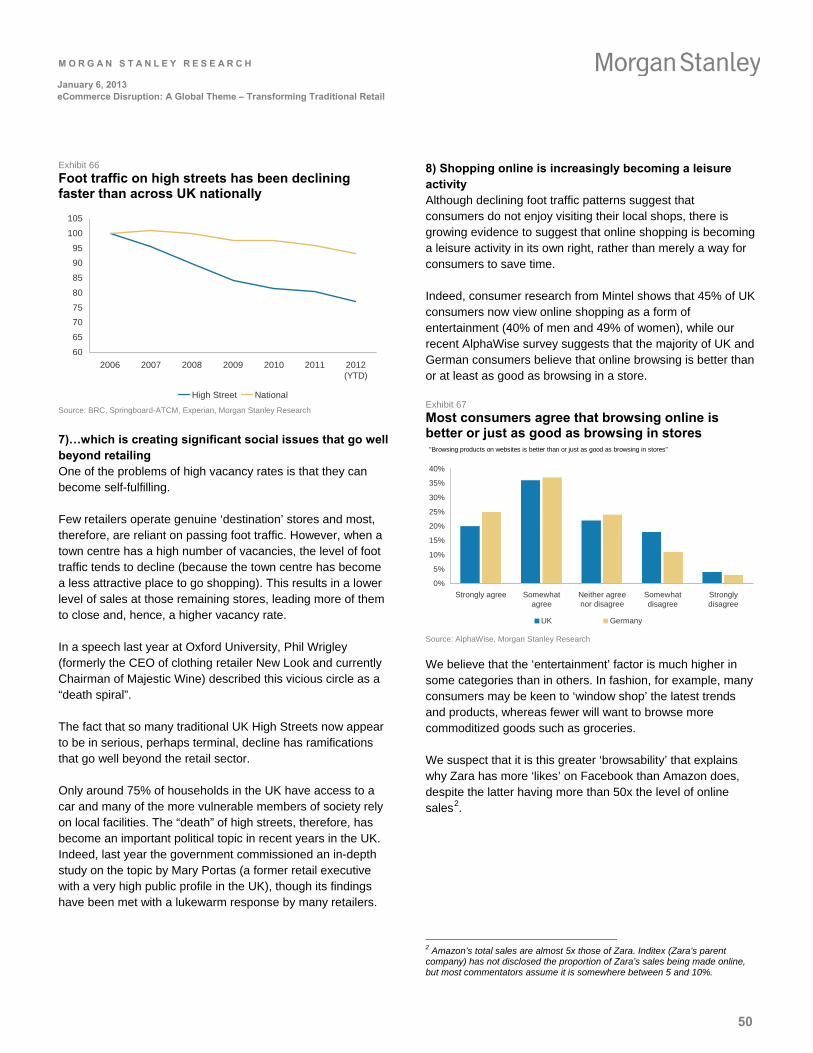
M O R G A N S T A N L E Y R E S E A R C H
50
January 6, 2013 eCommerce Disruption: A Global Theme – Transforming Traditional Retail
Exhibit 66
Foot traffic on high streets has been declining faster than across UK nationally
60
65
70
75
80
85
90
95
100
105
2006 2007 2008 2009 2010 2011 2012(YTD)
High Street National
Source: BRC, Springboard-ATCM, Experian, Morgan Stanley Research
7)…which is creating significant social issues that go well beyond retailing One of the problems of high vacancy rates is that they can become self-fulfilling.
Few retailers operate genuine ‘destination’ stores and most, therefore, are reliant on passing foot traffic. However, when a town centre has a high number of vacancies, the level of foot traffic tends to decline (because the town centre has become a less attractive place to go shopping). This results in a lower level of sales at those remaining stores, leading more of them to close and, hence, a higher vacancy rate.
In a speech last year at Oxford University, Phil Wrigley (formerly the CEO of clothing retailer New Look and currently Chairman of Majestic Wine) described this vicious circle as a “death spiral”.
The fact that so many traditional UK High Streets now appear to be in serious, perhaps terminal, decline has ramifications that go well beyond the retail sector.
Only around 75% of households in the UK have access to a car and many of the more vulnerable members of society rely on local facilities. The “death” of high streets, therefore, has become an important political topic in recent years in the UK. Indeed, last year the government commissioned an in-depth study on the topic by Mary Portas (a former retail executive with a very high public profile in the UK), though its findings have been met with a lukewarm response by many retailers.
8) Shopping online is increasingly becoming a leisure activity Although declining foot traffic patterns suggest that consumers do not enjoy visiting their local shops, there is growing evidence to suggest that online shopping is becoming a leisure activity in its own right, rather than merely a way for consumers to save time.
Indeed, consumer research from Mintel shows that 45% of UK consumers now view online shopping as a form of entertainment (40% of men and 49% of women), while our recent AlphaWise survey suggests that the majority of UK and German consumers believe that online browsing is better than or at least as good as browsing in a store.
Exhibit 67
Most consumers agree that browsing online is better or just as good as browsing in stores
0%
5%
10%
15%
20%
25%
30%
35%
40%
Strongly agree Somewhatagree
Neither agreenor disagree
Somewhatdisagree
Stronglydisagree
UK Germany
"Browsing products on websites is better than or just as good as browsing in stores"
Source: AlphaWise, Morgan Stanley Research
We believe that the ‘entertainment’ factor is much higher in some categories than in others. In fashion, for example, many consumers may be keen to ‘window shop’ the latest trends and products, whereas fewer will want to browse more commoditized goods such as groceries.
We suspect that it is this greater ‘browsability’ that explains why Zara has more ‘likes’ on Facebook than Amazon does, despite the latter having more than 50x the level of online sales2.
2 Amazon’s total sales are almost 5x those of Zara. Inditex (Zara’s parent company) has not disclosed the proportion of Zara’s sales being made online, but most commentators assume it is somewhere between 5 and 10%.
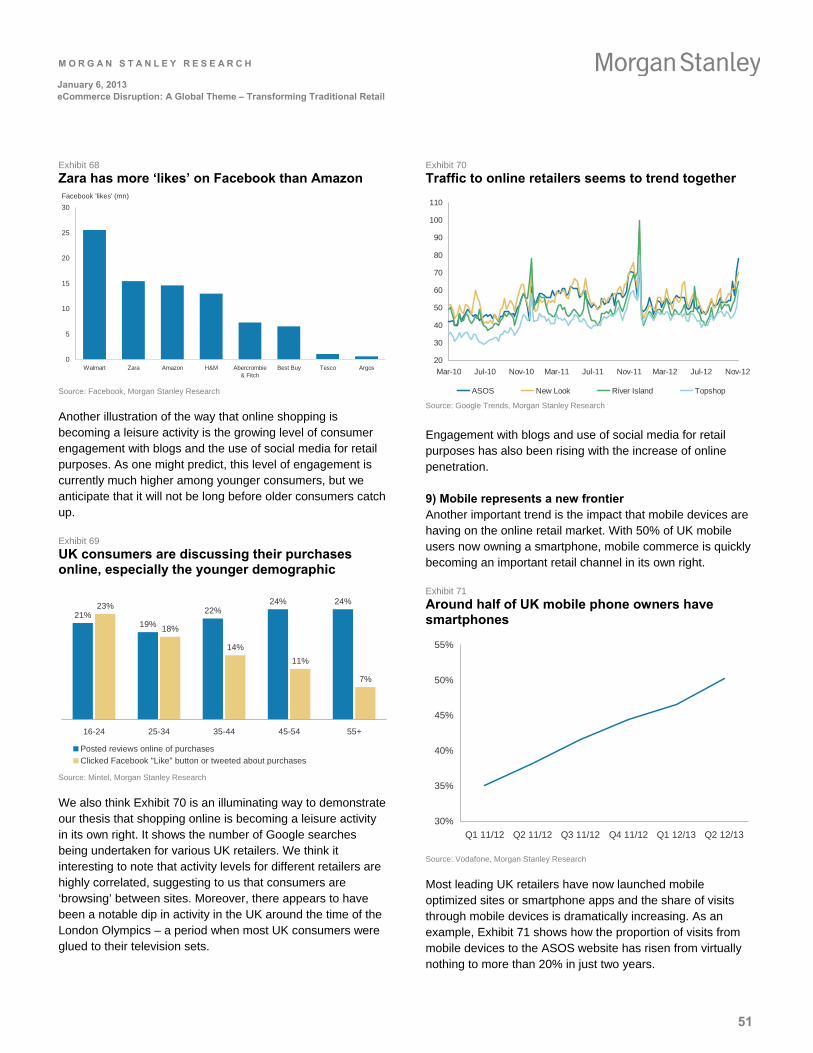
M O R G A N S T A N L E Y R E S E A R C H
51
January 6, 2013 eCommerce Disruption: A Global Theme – Transforming Traditional Retail
Exhibit 68
Zara has more ‘likes’ on Facebook than Amazon Facebook 'likes' (mn)
0
5
10
15
20
25
30
Walmart Zara Amazon H&M Abercrombie& Fitch
Best Buy Tesco Argos
Source: Facebook, Morgan Stanley Research
Another illustration of the way that online shopping is becoming a leisure activity is the growing level of consumer engagement with blogs and the use of social media for retail purposes. As one might predict, this level of engagement is currently much higher among younger consumers, but we anticipate that it will not be long before older consumers catch up.
Exhibit 69
UK consumers are discussing their purchases online, especially the younger demographic
21%19%
22%24% 24%23%
18%
14%
11%
7%
16-24 25-34 35-44 45-54 55+
Posted reviews online of purchases
Clicked Facebook "Like" button or tweeted about purchases Source: Mintel, Morgan Stanley Research
We also think Exhibit 70 is an illuminating way to demonstrate our thesis that shopping online is becoming a leisure activity in its own right. It shows the number of Google searches being undertaken for various UK retailers. We think it interesting to note that activity levels for different retailers are highly correlated, suggesting to us that consumers are ‘browsing’ between sites. Moreover, there appears to have been a notable dip in activity in the UK around the time of the London Olympics – a period when most UK consumers were glued to their television sets.
Exhibit 70
Traffic to online retailers seems to trend together
20
30
40
50
60
70
80
90
100
110
Mar-10 Jul-10 Nov-10 Mar-11 Jul-11 Nov-11 Mar-12 Jul-12 Nov-12
ASOS New Look River Island Topshop Source: Google Trends, Morgan Stanley Research
Engagement with blogs and use of social media for retail purposes has also been rising with the increase of online penetration.
9) Mobile represents a new frontier Another important trend is the impact that mobile devices are having on the online retail market. With 50% of UK mobile users now owning a smartphone, mobile commerce is quickly becoming an important retail channel in its own right.
Exhibit 71
Around half of UK mobile phone owners have smartphones
30%
35%
40%
45%
50%
55%
Q1 11/12 Q2 11/12 Q3 11/12 Q4 11/12 Q1 12/13 Q2 12/13
Source: Vodafone, Morgan Stanley Research
Most leading UK retailers have now launched mobile optimized sites or smartphone apps and the share of visits through mobile devices is dramatically increasing. As an example, Exhibit 71 shows how the proportion of visits from mobile devices to the ASOS website has risen from virtually nothing to more than 20% in just two years.
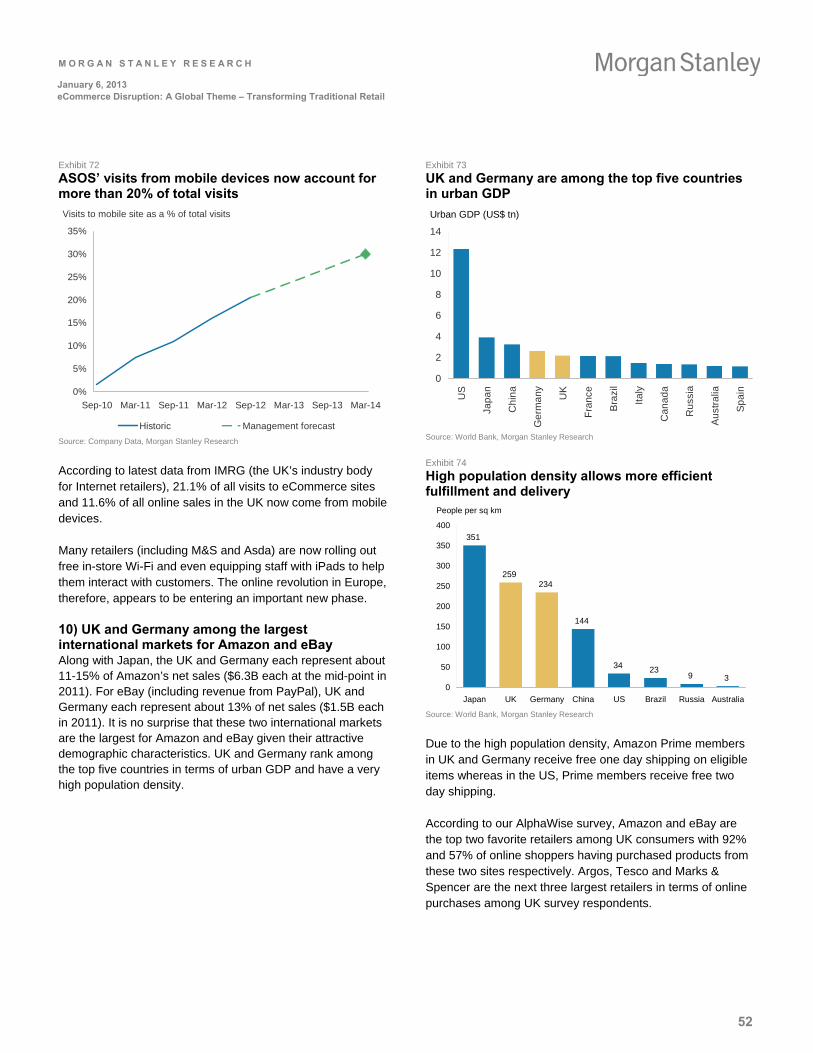
M O R G A N S T A N L E Y R E S E A R C H
52
January 6, 2013 eCommerce Disruption: A Global Theme – Transforming Traditional Retail
Exhibit 72
ASOS’ visits from mobile devices now account for more than 20% of total visits
Visits to mobile site as a % of total visits
0%
5%
10%
15%
20%
25%
30%
35%
Sep-10 Mar-11 Sep-11 Mar-12 Sep-12 Mar-13 Sep-13 Mar-14
Historic Management forecast Source: Company Data, Morgan Stanley Research
According to latest data from IMRG (the UK’s industry body for Internet retailers), 21.1% of all visits to eCommerce sites and 11.6% of all online sales in the UK now come from mobile devices.
Many retailers (including M&S and Asda) are now rolling out free in-store Wi-Fi and even equipping staff with iPads to help them interact with customers. The online revolution in Europe, therefore, appears to be entering an important new phase.
10) UK and Germany among the largest international markets for Amazon and eBay Along with Japan, the UK and Germany each represent about 11-15% of Amazon’s net sales ($6.3B each at the mid-point in 2011). For eBay (including revenue from PayPal), UK and Germany each represent about 13% of net sales ($1.5B each in 2011). It is no surprise that these two international markets are the largest for Amazon and eBay given their attractive demographic characteristics. UK and Germany rank among the top five countries in terms of urban GDP and have a very high population density.
Exhibit 73
UK and Germany are among the top five countries in urban GDP
Urban GDP (US$ tn)
0
2
4
6
8
10
12
14
US
Jap
an
Ch
ina
Ge
rma
ny UK
Fra
nce
Bra
zil
Ital
y
Can
ad
a
Ru
ssia
Au
stra
lia
Sp
ain
Source: World Bank, Morgan Stanley Research
Exhibit 74
High population density allows more efficient fulfillment and delivery
People per sq km
351
259234
144
34 239 3
0
50
100
150
200
250
300
350
400
Japan UK Germany China US Brazil Russia Australia
Source: World Bank, Morgan Stanley Research
Due to the high population density, Amazon Prime members in UK and Germany receive free one day shipping on eligible items whereas in the US, Prime members receive free two day shipping.
According to our AlphaWise survey, Amazon and eBay are the top two favorite retailers among UK consumers with 92% and 57% of online shoppers having purchased products from these two sites respectively. Argos, Tesco and Marks & Spencer are the next three largest retailers in terms of online purchases among UK survey respondents.
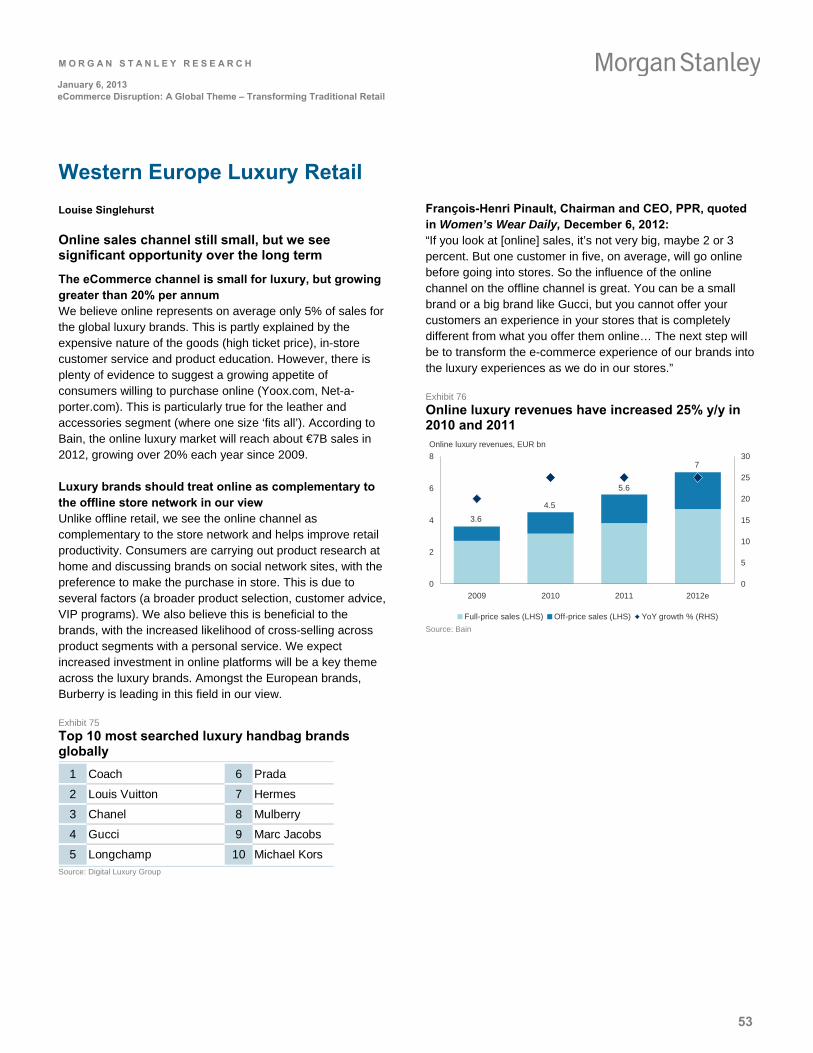
M O R G A N S T A N L E Y R E S E A R C H
53
January 6, 2013 eCommerce Disruption: A Global Theme – Transforming Traditional Retail
Western Europe Luxury Retail
Louise Singlehurst
Online sales channel still small, but we see significant opportunity over the long term
The eCommerce channel is small for luxury, but growing greater than 20% per annum We believe online represents on average only 5% of sales for the global luxury brands. This is partly explained by the expensive nature of the goods (high ticket price), in-store customer service and product education. However, there is plenty of evidence to suggest a growing appetite of consumers willing to purchase online (Yoox.com, Net-a-porter.com). This is particularly true for the leather and accessories segment (where one size ‘fits all’). According to Bain, the online luxury market will reach about €7B sales in 2012, growing over 20% each year since 2009.
Luxury brands should treat online as complementary to the offline store network in our view Unlike offline retail, we see the online channel as complementary to the store network and helps improve retail productivity. Consumers are carrying out product research at home and discussing brands on social network sites, with the preference to make the purchase in store. This is due to several factors (a broader product selection, customer advice, VIP programs). We also believe this is beneficial to the brands, with the increased likelihood of cross-selling across product segments with a personal service. We expect increased investment in online platforms will be a key theme across the luxury brands. Amongst the European brands, Burberry is leading in this field in our view.
Exhibit 75
Top 10 most searched luxury handbag brands globally
1 Coach 6 Prada
2 Louis Vuitton 7 Hermes
3 Chanel 8 Mulberry
4 Gucci 9 Marc Jacobs
5 Longchamp 10 Michael Kors
Source: Digital Luxury Group
François-Henri Pinault, Chairman and CEO, PPR, quoted in Women’s Wear Daily, December 6, 2012: “If you look at [online] sales, it’s not very big, maybe 2 or 3 percent. But one customer in five, on average, will go online before going into stores. So the influence of the online channel on the offline channel is great. You can be a small brand or a big brand like Gucci, but you cannot offer your customers an experience in your stores that is completely different from what you offer them online… The next step will be to transform the e-commerce experience of our brands into the luxury experiences as we do in our stores.”
Exhibit 76
Online luxury revenues have increased 25% y/y in 2010 and 2011 Online luxury revenues, EUR bn
7
3.6
4.5
5.6
0
2
4
6
8
2009 2010 2011 2012e
0
5
10
15
20
25
30
Full-price sales (LHS) Off-price sales (LHS) YoY growth % (RHS) Source: Bain
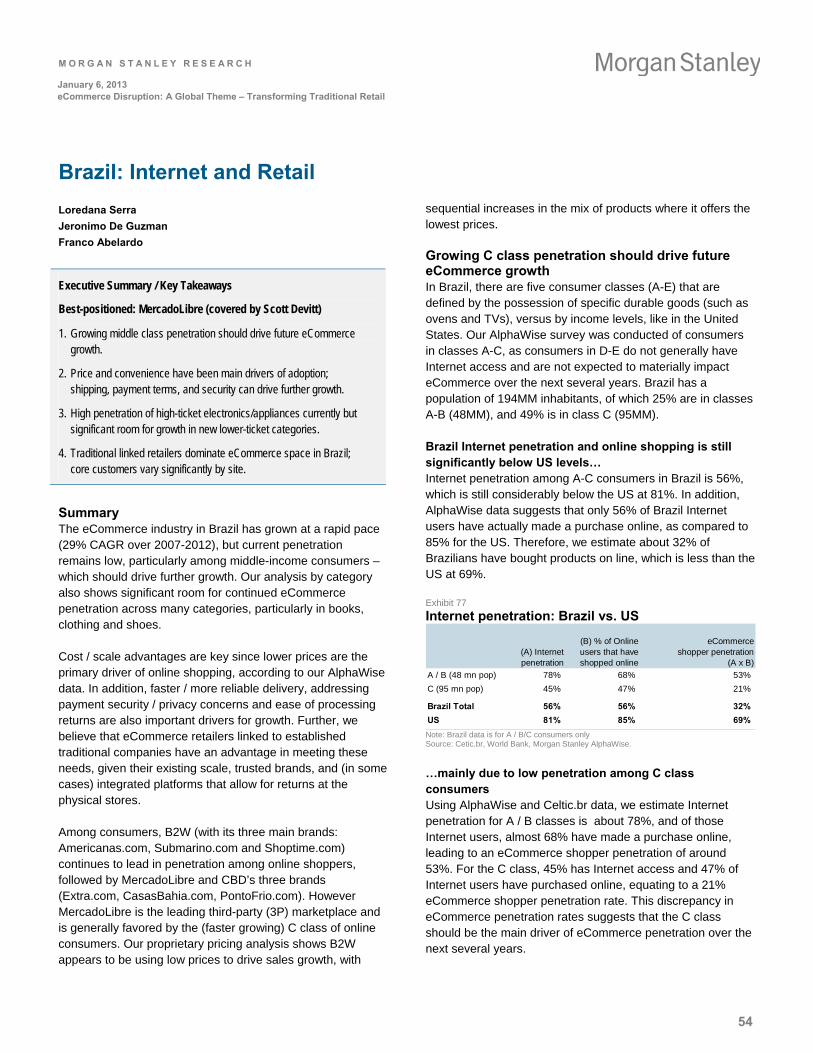
M O R G A N S T A N L E Y R E S E A R C H
54
January 6, 2013 eCommerce Disruption: A Global Theme – Transforming Traditional Retail
Brazil: Internet and Retail
Loredana Serra
Jeronimo De Guzman
Franco Abelardo
Executive Summary / Key Takeaways
Best-positioned: MercadoLibre (covered by Scott Devitt)
1. Growing middle class penetration should drive future eCommerce growth.
2. Price and convenience have been main drivers of adoption; shipping, payment terms, and security can drive further growth.
3. High penetration of high-ticket electronics/appliances currently but significant room for growth in new lower-ticket categories.
4. Traditional linked retailers dominate eCommerce space in Brazil; core customers vary significantly by site.
Summary The eCommerce industry in Brazil has grown at a rapid pace (29% CAGR over 2007-2012), but current penetration remains low, particularly among middle-income consumers – which should drive further growth. Our analysis by category also shows significant room for continued eCommerce penetration across many categories, particularly in books, clothing and shoes.
Cost / scale advantages are key since lower prices are the primary driver of online shopping, according to our AlphaWise data. In addition, faster / more reliable delivery, addressing payment security / privacy concerns and ease of processing returns are also important drivers for growth. Further, we believe that eCommerce retailers linked to established traditional companies have an advantage in meeting these needs, given their existing scale, trusted brands, and (in some cases) integrated platforms that allow for returns at the physical stores.
Among consumers, B2W (with its three main brands: Americanas.com, Submarino.com and Shoptime.com) continues to lead in penetration among online shoppers, followed by MercadoLibre and CBD’s three brands (Extra.com, CasasBahia.com, PontoFrio.com). However MercadoLibre is the leading third-party (3P) marketplace and is generally favored by the (faster growing) C class of online consumers. Our proprietary pricing analysis shows B2W appears to be using low prices to drive sales growth, with
sequential increases in the mix of products where it offers the lowest prices.
Growing C class penetration should drive future eCommerce growth In Brazil, there are five consumer classes (A-E) that are defined by the possession of specific durable goods (such as ovens and TVs), versus by income levels, like in the United States. Our AlphaWise survey was conducted of consumers in classes A-C, as consumers in D-E do not generally have Internet access and are not expected to materially impact eCommerce over the next several years. Brazil has a population of 194MM inhabitants, of which 25% are in classes A-B (48MM), and 49% is in class C (95MM).
Brazil Internet penetration and online shopping is still significantly below US levels…
Internet penetration among A-C consumers in Brazil is 56%, which is still considerably below the US at 81%. In addition, AlphaWise data suggests that only 56% of Brazil Internet users have actually made a purchase online, as compared to 85% for the US. Therefore, we estimate about 32% of Brazilians have bought products on line, which is less than the US at 69%.
Exhibit 77
Internet penetration: Brazil vs. US
(A) Internet penetration
(B) % of Online users that have shopped online
eCommerceshopper penetration
(A x B)
A / B (48 mn pop) 78% 68% 53%
C (95 mn pop) 45% 47% 21%
Brazil Total 56% 56% 32%
US 81% 85% 69%
Note: Brazil data is for A / B/C consumers only Source: Cetic.br, World Bank, Morgan Stanley AlphaWise.
…mainly due to low penetration among C class consumers Using AlphaWise and Celtic.br data, we estimate Internet penetration for A / B classes is about 78%, and of those Internet users, almost 68% have made a purchase online, leading to an eCommerce shopper penetration of around 53%. For the C class, 45% has Internet access and 47% of Internet users have purchased online, equating to a 21% eCommerce shopper penetration rate. This discrepancy in eCommerce penetration rates suggests that the C class should be the main driver of eCommerce penetration over the next several years.
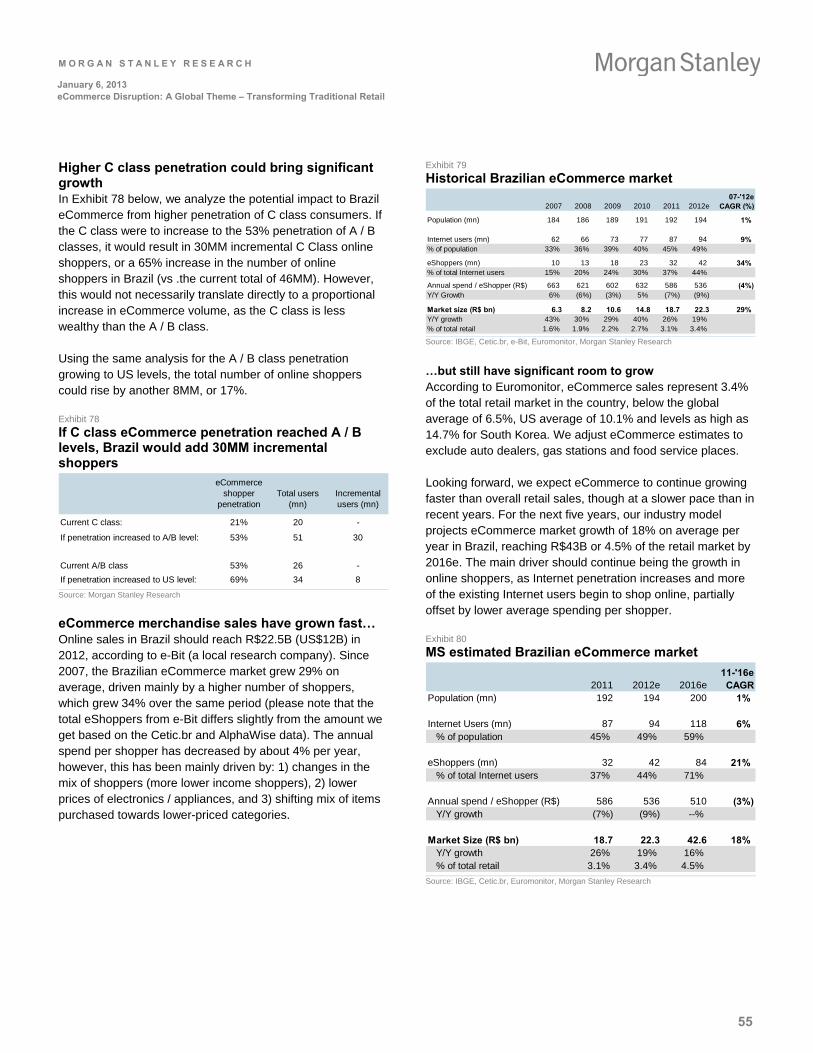
M O R G A N S T A N L E Y R E S E A R C H
55
January 6, 2013 eCommerce Disruption: A Global Theme – Transforming Traditional Retail
Higher C class penetration could bring significant growth In Exhibit 78 below, we analyze the potential impact to Brazil eCommerce from higher penetration of C class consumers. If the C class were to increase to the 53% penetration of A / B classes, it would result in 30MM incremental C Class online shoppers, or a 65% increase in the number of online shoppers in Brazil (vs .the current total of 46MM). However, this would not necessarily translate directly to a proportional increase in eCommerce volume, as the C class is less wealthy than the A / B class.
Using the same analysis for the A / B class penetration growing to US levels, the total number of online shoppers could rise by another 8MM, or 17%.
Exhibit 78
If C class eCommerce penetration reached A / B levels, Brazil would add 30MM incremental shoppers
eCommerce shopper
penetrationTotal users
(mn)Incremental users (mn)
Current C class: 21% 20 -
If penetration increased to A/B level: 53% 51 30
Current A/B class 53% 26 -
If penetration increased to US level: 69% 34 8
Source: Morgan Stanley Research
eCommerce merchandise sales have grown fast… Online sales in Brazil should reach R$22.5B (US$12B) in 2012, according to e-Bit (a local research company). Since 2007, the Brazilian eCommerce market grew 29% on average, driven mainly by a higher number of shoppers, which grew 34% over the same period (please note that the total eShoppers from e-Bit differs slightly from the amount we get based on the Cetic.br and AlphaWise data). The annual spend per shopper has decreased by about 4% per year, however, this has been mainly driven by: 1) changes in the mix of shoppers (more lower income shoppers), 2) lower prices of electronics / appliances, and 3) shifting mix of items purchased towards lower-priced categories.
Exhibit 79
Historical Brazilian eCommerce market
2007 2008 2009 2010 2011 2012e07-'12e
CAGR (%)
Population (mn) 184 186 189 191 192 194 1%
Internet users (mn) 62 66 73 77 87 94 9%% of population 33% 36% 39% 40% 45% 49%
eShoppers (mn) 10 13 18 23 32 42 34%% of total Internet users 15% 20% 24% 30% 37% 44%
Annual spend / eShopper (R$) 663 621 602 632 586 536 (4%)Y/Y Growth 6% (6%) (3%) 5% (7%) (9%)
Market size (R$ bn) 6.3 8.2 10.6 14.8 18.7 22.3 29%Y/Y growth 43% 30% 29% 40% 26% 19%% of total retail 1.6% 1.9% 2.2% 2.7% 3.1% 3.4% Source: IBGE, Cetic.br, e-Bit, Euromonitor, Morgan Stanley Research
…but still have significant room to grow
According to Euromonitor, eCommerce sales represent 3.4% of the total retail market in the country, below the global average of 6.5%, US average of 10.1% and levels as high as 14.7% for South Korea. We adjust eCommerce estimates to exclude auto dealers, gas stations and food service places.
Looking forward, we expect eCommerce to continue growing faster than overall retail sales, though at a slower pace than in recent years. For the next five years, our industry model projects eCommerce market growth of 18% on average per year in Brazil, reaching R$43B or 4.5% of the retail market by 2016e. The main driver should continue being the growth in online shoppers, as Internet penetration increases and more of the existing Internet users begin to shop online, partially offset by lower average spending per shopper.
Exhibit 80
MS estimated Brazilian eCommerce market
2011 2012e 2016e11-'16e CAGR
Population (mn) 192 194 200 1%
Internet Users (mn) 87 94 118 6%% of population 45% 49% 59%
eShoppers (mn) 32 42 84 21%% of total Internet users 37% 44% 71%
Annual spend / eShopper (R$) 586 536 510 (3%)Y/Y growth (7%) (9%) --%
Market Size (R$ bn) 18.7 22.3 42.6 18%Y/Y growth 26% 19% 16%% of total retail 3.1% 3.4% 4.5%
Source: IBGE, Cetic.br, Euromonitor, Morgan Stanley Research
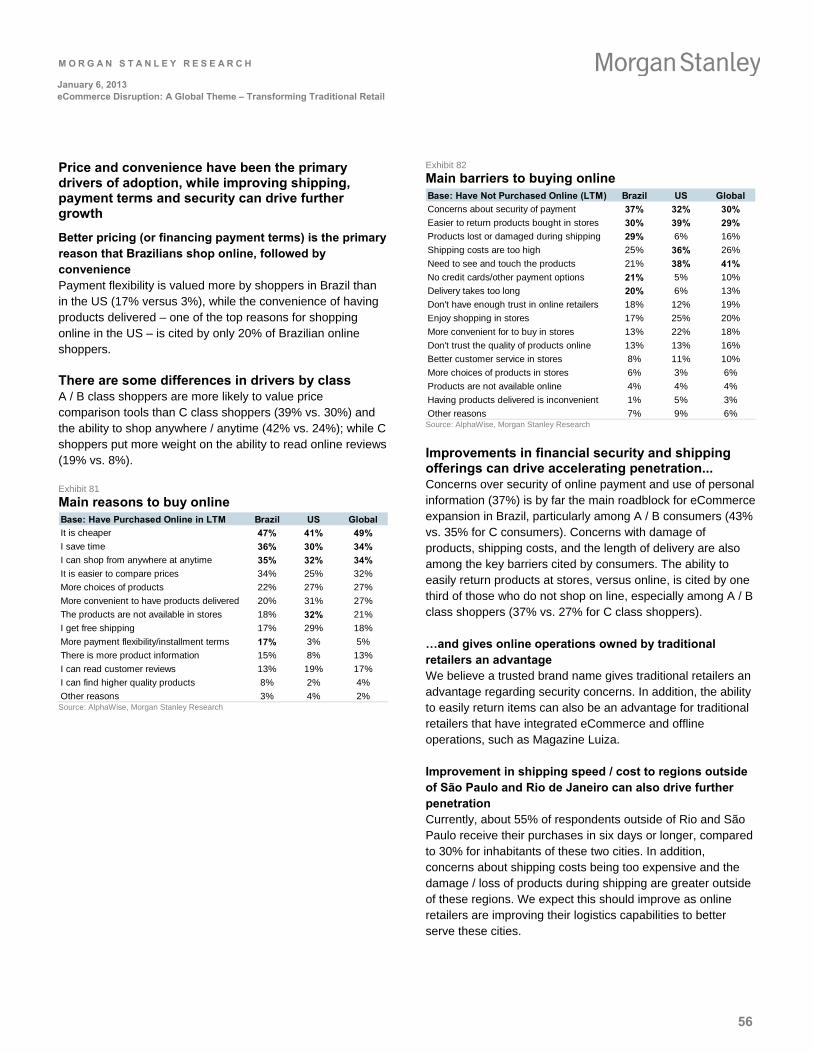
M O R G A N S T A N L E Y R E S E A R C H
56
January 6, 2013 eCommerce Disruption: A Global Theme – Transforming Traditional Retail
Price and convenience have been the primary drivers of adoption, while improving shipping, payment terms and security can drive further growth
Better pricing (or financing payment terms) is the primary reason that Brazilians shop online, followed by convenience Payment flexibility is valued more by shoppers in Brazil than in the US (17% versus 3%), while the convenience of having products delivered – one of the top reasons for shopping online in the US – is cited by only 20% of Brazilian online shoppers.
There are some differences in drivers by class A / B class shoppers are more likely to value price comparison tools than C class shoppers (39% vs. 30%) and the ability to shop anywhere / anytime (42% vs. 24%); while C shoppers put more weight on the ability to read online reviews (19% vs. 8%).
Exhibit 81
Main reasons to buy online Base: Have Purchased Online in LTM Brazil US Global
It is cheaper 47% 41% 49%
I save time 36% 30% 34%
I can shop from anywhere at anytime 35% 32% 34%
It is easier to compare prices 34% 25% 32%
More choices of products 22% 27% 27%
More convenient to have products delivered 20% 31% 27%
The products are not available in stores 18% 32% 21%
I get free shipping 17% 29% 18%
More payment flexibility/installment terms 17% 3% 5%
There is more product information 15% 8% 13%
I can read customer reviews 13% 19% 17%
I can find higher quality products 8% 2% 4%
Other reasons 3% 4% 2% Source: AlphaWise, Morgan Stanley Research
Exhibit 82
Main barriers to buying online Base: Have Not Purchased Online (LTM) Brazil US Global
Concerns about security of payment 37% 32% 30%
Easier to return products bought in stores 30% 39% 29%
Products lost or damaged during shipping 29% 6% 16%
Shipping costs are too high 25% 36% 26%
Need to see and touch the products 21% 38% 41%
No credit cards/other payment options 21% 5% 10%
Delivery takes too long 20% 6% 13%
Don't have enough trust in online retailers 18% 12% 19%
Enjoy shopping in stores 17% 25% 20%
More convenient for to buy in stores 13% 22% 18%
Don't trust the quality of products online 13% 13% 16%
Better customer service in stores 8% 11% 10%
More choices of products in stores 6% 3% 6%
Products are not available online 4% 4% 4%
Having products delivered is inconvenient 1% 5% 3%
Other reasons 7% 9% 6% Source: AlphaWise, Morgan Stanley Research
Improvements in financial security and shipping offerings can drive accelerating penetration... Concerns over security of online payment and use of personal information (37%) is by far the main roadblock for eCommerce expansion in Brazil, particularly among A / B consumers (43% vs. 35% for C consumers). Concerns with damage of products, shipping costs, and the length of delivery are also among the key barriers cited by consumers. The ability to easily return products at stores, versus online, is cited by one third of those who do not shop on line, especially among A / B class shoppers (37% vs. 27% for C class shoppers).
…and gives online operations owned by traditional retailers an advantage We believe a trusted brand name gives traditional retailers an advantage regarding security concerns. In addition, the ability to easily return items can also be an advantage for traditional retailers that have integrated eCommerce and offline operations, such as Magazine Luiza.
Improvement in shipping speed / cost to regions outside of São Paulo and Rio de Janeiro can also drive further penetration Currently, about 55% of respondents outside of Rio and São Paulo receive their purchases in six days or longer, compared to 30% for inhabitants of these two cities. In addition, concerns about shipping costs being too expensive and the damage / loss of products during shipping are greater outside of these regions. We expect this should improve as online retailers are improving their logistics capabilities to better serve these cities.
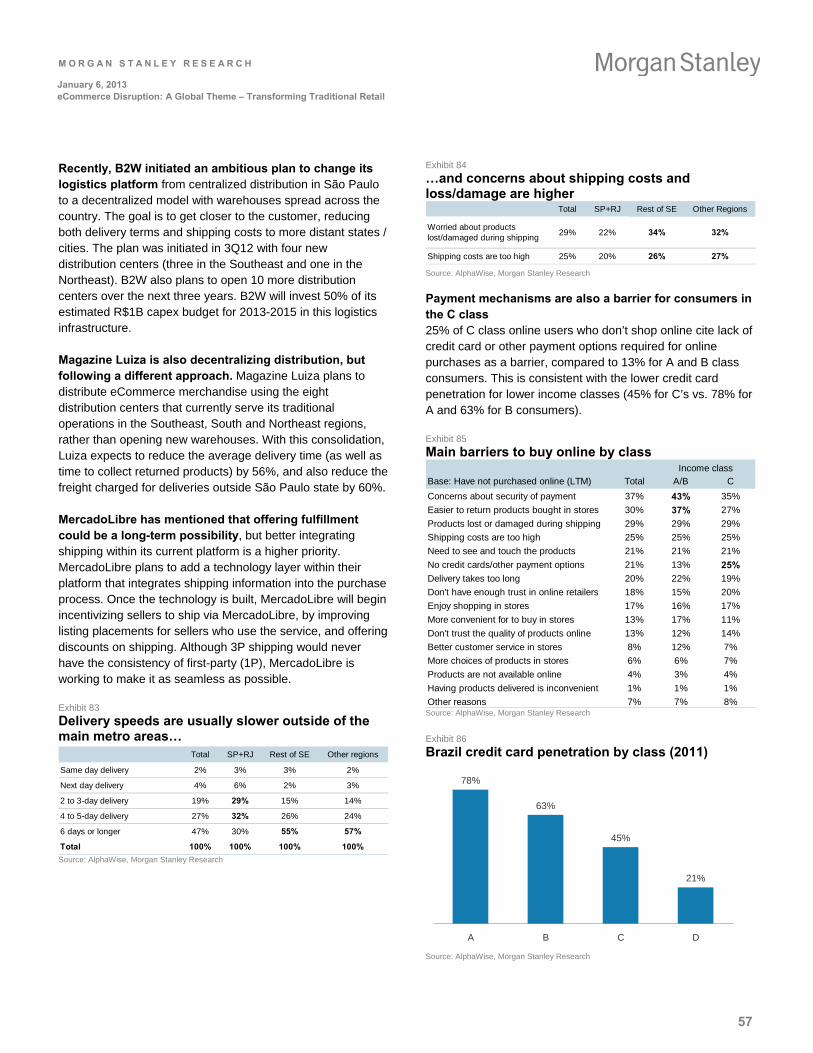
M O R G A N S T A N L E Y R E S E A R C H
57
January 6, 2013 eCommerce Disruption: A Global Theme – Transforming Traditional Retail
Recently, B2W initiated an ambitious plan to change its logistics platform from centralized distribution in São Paulo to a decentralized model with warehouses spread across the country. The goal is to get closer to the customer, reducing both delivery terms and shipping costs to more distant states / cities. The plan was initiated in 3Q12 with four new distribution centers (three in the Southeast and one in the Northeast). B2W also plans to open 10 more distribution centers over the next three years. B2W will invest 50% of its estimated R$1B capex budget for 2013-2015 in this logistics infrastructure.
Magazine Luiza is also decentralizing distribution, but following a different approach. Magazine Luiza plans to distribute eCommerce merchandise using the eight distribution centers that currently serve its traditional operations in the Southeast, South and Northeast regions, rather than opening new warehouses. With this consolidation, Luiza expects to reduce the average delivery time (as well as time to collect returned products) by 56%, and also reduce the freight charged for deliveries outside São Paulo state by 60%.
MercadoLibre has mentioned that offering fulfillment could be a long-term possibility, but better integrating shipping within its current platform is a higher priority. MercadoLibre plans to add a technology layer within their platform that integrates shipping information into the purchase process. Once the technology is built, MercadoLibre will begin incentivizing sellers to ship via MercadoLibre, by improving listing placements for sellers who use the service, and offering discounts on shipping. Although 3P shipping would never have the consistency of first-party (1P), MercadoLibre is working to make it as seamless as possible.
Exhibit 83
Delivery speeds are usually slower outside of the main metro areas…
Total SP+RJ Rest of SE Other regions
Same day delivery 2% 3% 3% 2%
Next day delivery 4% 6% 2% 3%
2 to 3-day delivery 19% 29% 15% 14%
4 to 5-day delivery 27% 32% 26% 24%
6 days or longer 47% 30% 55% 57%
Total 100% 100% 100% 100% Source: AlphaWise, Morgan Stanley Research
Exhibit 84
…and concerns about shipping costs and loss/damage are higher
Total SP+RJ Rest of SE Other Regions
Worried about productslost/damaged during shipping
29% 22% 34% 32%
Shipping costs are too high 25% 20% 26% 27% Source: AlphaWise, Morgan Stanley Research
Payment mechanisms are also a barrier for consumers in the C class 25% of C class online users who don’t shop online cite lack of credit card or other payment options required for online purchases as a barrier, compared to 13% for A and B class consumers. This is consistent with the lower credit card penetration for lower income classes (45% for C’s vs. 78% for A and 63% for B consumers).
Exhibit 85
Main barriers to buy online by class
Base: Have not purchased online (LTM) Total A/B C
Concerns about security of payment 37% 43% 35%
Easier to return products bought in stores 30% 37% 27%
Products lost or damaged during shipping 29% 29% 29%
Shipping costs are too high 25% 25% 25%
Need to see and touch the products 21% 21% 21%
No credit cards/other payment options 21% 13% 25%
Delivery takes too long 20% 22% 19%
Don't have enough trust in online retailers 18% 15% 20%
Enjoy shopping in stores 17% 16% 17%
More convenient for to buy in stores 13% 17% 11%
Don't trust the quality of products online 13% 12% 14%
Better customer service in stores 8% 12% 7%
More choices of products in stores 6% 6% 7%
Products are not available online 4% 3% 4%
Having products delivered is inconvenient 1% 1% 1%
Other reasons 7% 7% 8%
Income class
Source: AlphaWise, Morgan Stanley Research
Exhibit 86
Brazil credit card penetration by class (2011)
78%
63%
45%
21%
A B C D Source: AlphaWise, Morgan Stanley Research
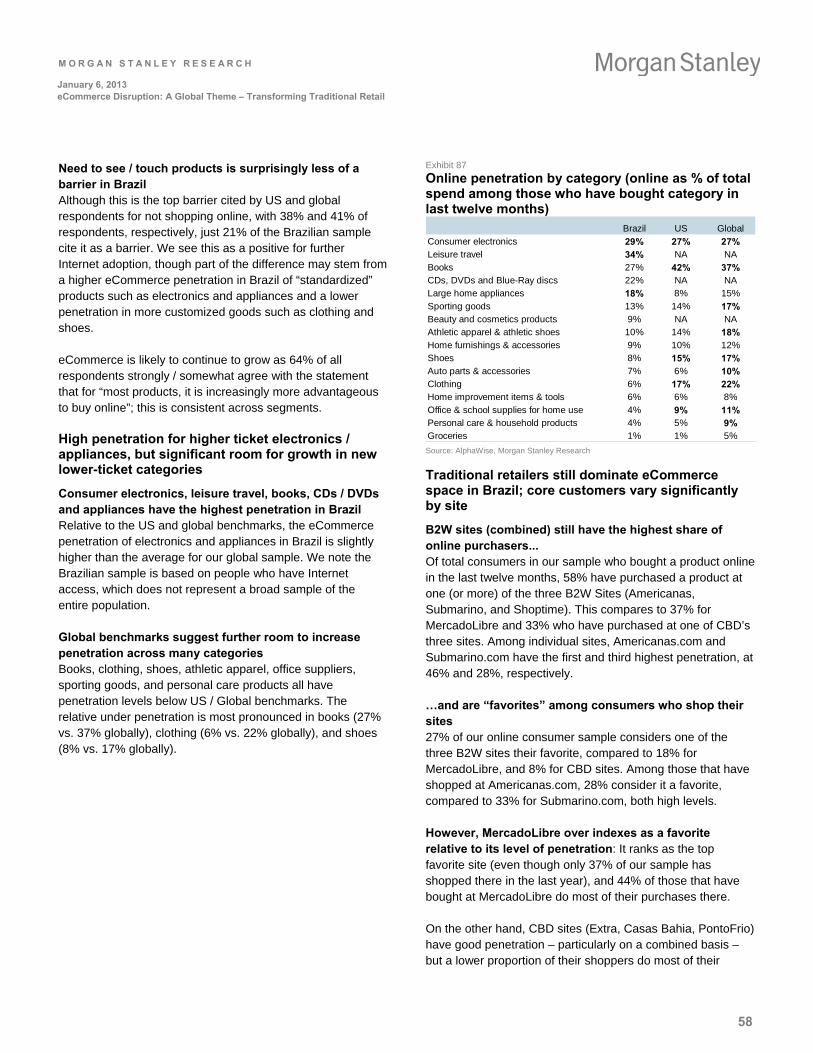
M O R G A N S T A N L E Y R E S E A R C H
58
January 6, 2013 eCommerce Disruption: A Global Theme – Transforming Traditional Retail
Need to see / touch products is surprisingly less of a barrier in Brazil Although this is the top barrier cited by US and global respondents for not shopping online, with 38% and 41% of respondents, respectively, just 21% of the Brazilian sample cite it as a barrier. We see this as a positive for further Internet adoption, though part of the difference may stem from a higher eCommerce penetration in Brazil of “standardized” products such as electronics and appliances and a lower penetration in more customized goods such as clothing and shoes.
eCommerce is likely to continue to grow as 64% of all respondents strongly / somewhat agree with the statement that for “most products, it is increasingly more advantageous to buy online”; this is consistent across segments.
High penetration for higher ticket electronics / appliances, but significant room for growth in new lower-ticket categories
Consumer electronics, leisure travel, books, CDs / DVDs and appliances have the highest penetration in Brazil Relative to the US and global benchmarks, the eCommerce penetration of electronics and appliances in Brazil is slightly higher than the average for our global sample. We note the Brazilian sample is based on people who have Internet access, which does not represent a broad sample of the entire population.
Global benchmarks suggest further room to increase penetration across many categories Books, clothing, shoes, athletic apparel, office suppliers, sporting goods, and personal care products all have penetration levels below US / Global benchmarks. The relative under penetration is most pronounced in books (27% vs. 37% globally), clothing (6% vs. 22% globally), and shoes (8% vs. 17% globally).
Exhibit 87
Online penetration by category (online as % of total spend among those who have bought category in last twelve months)
Brazil US Global
Consumer electronics 29% 27% 27%Leisure travel 34% NA NA
Books 27% 42% 37%CDs, DVDs and Blue-Ray discs 22% NA NALarge home appliances 18% 8% 15%
Sporting goods 13% 14% 17%Beauty and cosmetics products 9% NA NAAthletic apparel & athletic shoes 10% 14% 18%Home furnishings & accessories 9% 10% 12%Shoes 8% 15% 17%Auto parts & accessories 7% 6% 10%Clothing 6% 17% 22%Home improvement items & tools 6% 6% 8%
Office & school supplies for home use 4% 9% 11%Personal care & household products 4% 5% 9%Groceries 1% 1% 5% Source: AlphaWise, Morgan Stanley Research
Traditional retailers still dominate eCommerce space in Brazil; core customers vary significantly by site
B2W sites (combined) still have the highest share of online purchasers... Of total consumers in our sample who bought a product online in the last twelve months, 58% have purchased a product at one (or more) of the three B2W Sites (Americanas, Submarino, and Shoptime). This compares to 37% for MercadoLibre and 33% who have purchased at one of CBD’s three sites. Among individual sites, Americanas.com and Submarino.com have the first and third highest penetration, at 46% and 28%, respectively.
…and are “favorites” among consumers who shop their sites 27% of our online consumer sample considers one of the three B2W sites their favorite, compared to 18% for MercadoLibre, and 8% for CBD sites. Among those that have shopped at Americanas.com, 28% consider it a favorite, compared to 33% for Submarino.com, both high levels.
However, MercadoLibre over indexes as a favorite relative to its level of penetration: It ranks as the top favorite site (even though only 37% of our sample has shopped there in the last year), and 44% of those that have bought at MercadoLibre do most of their purchases there.
On the other hand, CBD sites (Extra, Casas Bahia, PontoFrio) have good penetration – particularly on a combined basis – but a lower proportion of their shoppers do most of their
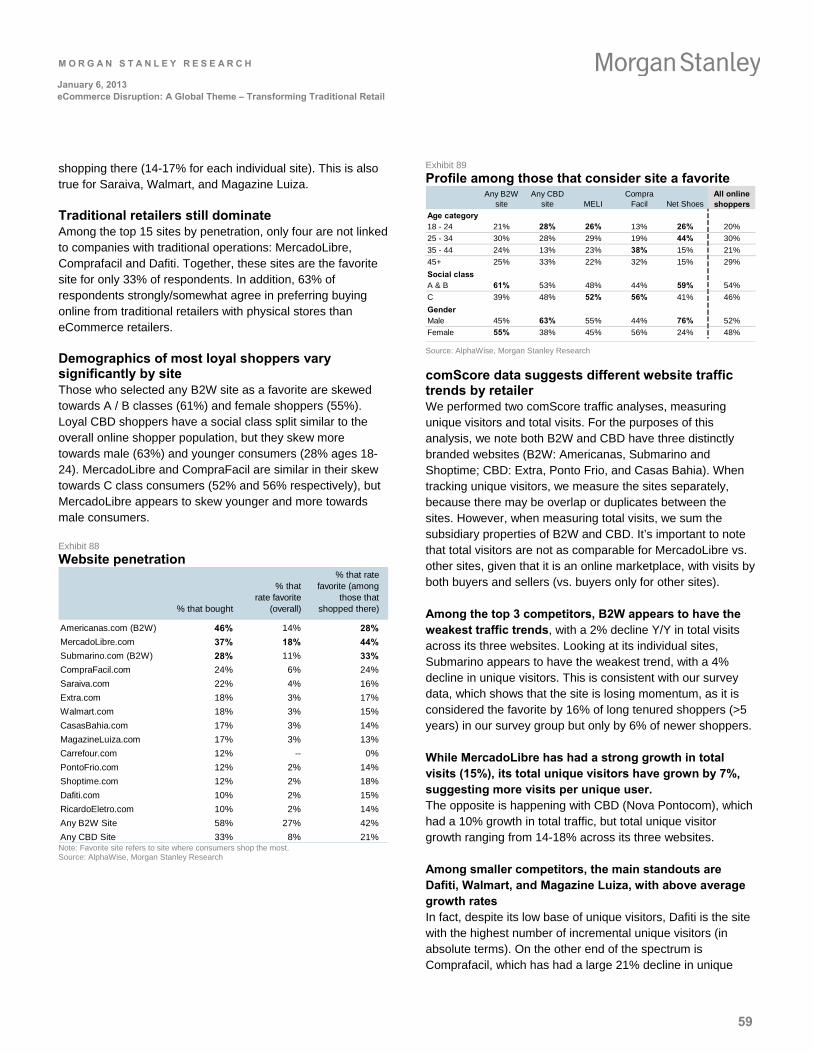
M O R G A N S T A N L E Y R E S E A R C H
59
January 6, 2013 eCommerce Disruption: A Global Theme – Transforming Traditional Retail
shopping there (14-17% for each individual site). This is also true for Saraiva, Walmart, and Magazine Luiza.
Traditional retailers still dominate Among the top 15 sites by penetration, only four are not linked to companies with traditional operations: MercadoLibre, Comprafacil and Dafiti. Together, these sites are the favorite site for only 33% of respondents. In addition, 63% of respondents strongly/somewhat agree in preferring buying online from traditional retailers with physical stores than eCommerce retailers.
Demographics of most loyal shoppers vary significantly by site Those who selected any B2W site as a favorite are skewed towards A / B classes (61%) and female shoppers (55%). Loyal CBD shoppers have a social class split similar to the overall online shopper population, but they skew more towards male (63%) and younger consumers (28% ages 18-24). MercadoLibre and CompraFacil are similar in their skew towards C class consumers (52% and 56% respectively), but MercadoLibre appears to skew younger and more towards male consumers.
Exhibit 88
Website penetration
% that bought
% thatrate favorite
(overall)
% that ratefavorite (among
those that shopped there)
Americanas.com (B2W) 46% 14% 28%
MercadoLibre.com 37% 18% 44%
Submarino.com (B2W) 28% 11% 33%
CompraFacil.com 24% 6% 24%
Saraiva.com 22% 4% 16%
Extra.com 18% 3% 17%
Walmart.com 18% 3% 15%
CasasBahia.com 17% 3% 14%
MagazineLuiza.com 17% 3% 13%
Carrefour.com 12% -- 0%
PontoFrio.com 12% 2% 14%
Shoptime.com 12% 2% 18%
Dafiti.com 10% 2% 15%
RicardoEletro.com 10% 2% 14%
Any B2W Site 58% 27% 42%
Any CBD Site 33% 8% 21% Note: Favorite site refers to site where consumers shop the most. Source: AlphaWise, Morgan Stanley Research
Exhibit 89
Profile among those that consider site a favorite Any B2W
siteAny CBD
site MELICompra
Facil Net ShoesAll online shoppers
18 - 24 21% 28% 26% 13% 26% 20%
25 - 34 30% 28% 29% 19% 44% 30%
35 - 44 24% 13% 23% 38% 15% 21%
45+ 25% 33% 22% 32% 15% 29%
A & B 61% 53% 48% 44% 59% 54%
C 39% 48% 52% 56% 41% 46%
Male 45% 63% 55% 44% 76% 52%
Female 55% 38% 45% 56% 24% 48%
Age category
Social class
Gender
Source: AlphaWise, Morgan Stanley Research
comScore data suggests different website traffic trends by retailer We performed two comScore traffic analyses, measuring unique visitors and total visits. For the purposes of this analysis, we note both B2W and CBD have three distinctly branded websites (B2W: Americanas, Submarino and Shoptime; CBD: Extra, Ponto Frio, and Casas Bahia). When tracking unique visitors, we measure the sites separately, because there may be overlap or duplicates between the sites. However, when measuring total visits, we sum the subsidiary properties of B2W and CBD. It’s important to note that total visitors are not as comparable for MercadoLibre vs. other sites, given that it is an online marketplace, with visits by both buyers and sellers (vs. buyers only for other sites).
Among the top 3 competitors, B2W appears to have the weakest traffic trends, with a 2% decline Y/Y in total visits across its three websites. Looking at its individual sites, Submarino appears to have the weakest trend, with a 4% decline in unique visitors. This is consistent with our survey data, which shows that the site is losing momentum, as it is considered the favorite by 16% of long tenured shoppers (>5 years) in our survey group but only by 6% of newer shoppers.
While MercadoLibre has had a strong growth in total visits (15%), its total unique visitors have grown by 7%, suggesting more visits per unique user. The opposite is happening with CBD (Nova Pontocom), which had a 10% growth in total traffic, but total unique visitor growth ranging from 14-18% across its three websites.
Among smaller competitors, the main standouts are Dafiti, Walmart, and Magazine Luiza, with above average growth rates In fact, despite its low base of unique visitors, Dafiti is the site with the highest number of incremental unique visitors (in absolute terms). On the other end of the spectrum is Comprafacil, which has had a large 21% decline in unique
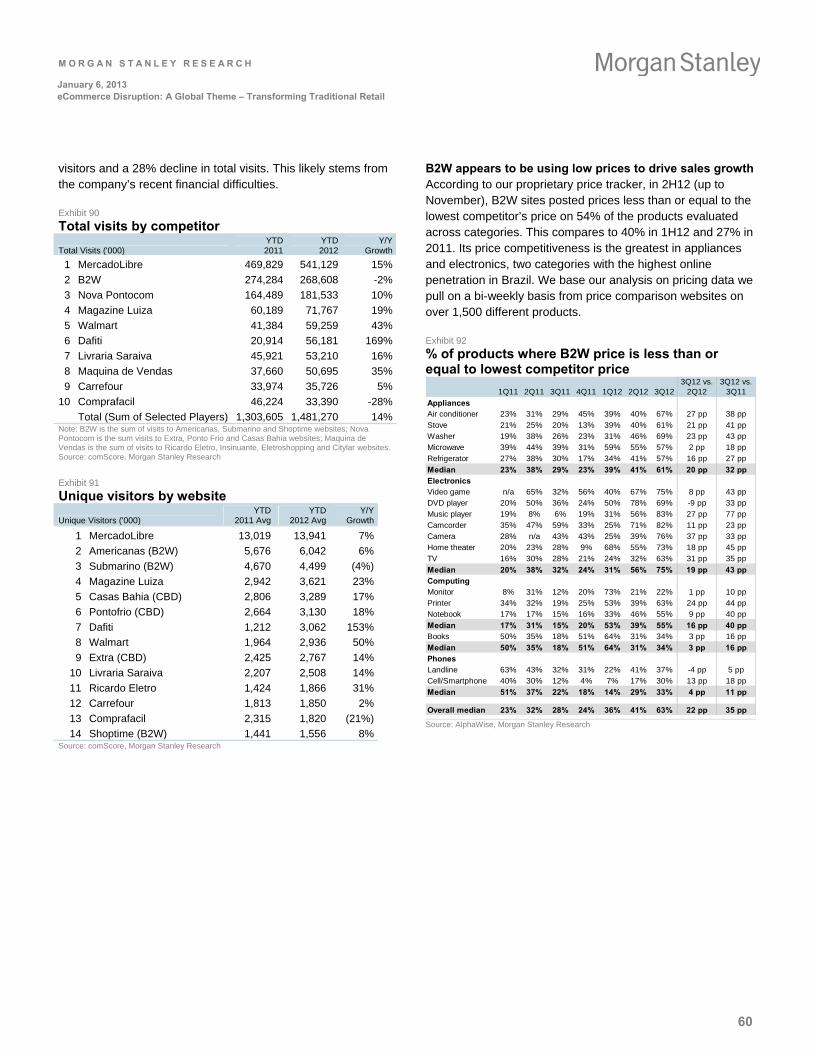
M O R G A N S T A N L E Y R E S E A R C H
60
January 6, 2013 eCommerce Disruption: A Global Theme – Transforming Traditional Retail
visitors and a 28% decline in total visits. This likely stems from the company’s recent financial difficulties.
Exhibit 90
Total visits by competitor
Total Visits ('000) YTD 2011
YTD2012
Y/YGrowth
1 MercadoLibre 469,829 541,129 15%
2 B2W 274,284 268,608 -2%
3 Nova Pontocom 164,489 181,533 10%
4 Magazine Luiza 60,189 71,767 19%
5 Walmart 41,384 59,259 43%
6 Dafiti 20,914 56,181 169%
7 Livraria Saraiva 45,921 53,210 16%
8 Maquina de Vendas 37,660 50,695 35%
9 Carrefour 33,974 35,726 5%
10 Comprafacil 46,224 33,390 -28%
Total (Sum of Selected Players) 1,303,605 1,481,270 14%Note: B2W is the sum of visits to Americanas, Submarino and Shoptime websites; Nova Pontocom is the sum visits to Extra, Ponto Frio and Casas Bahia websites; Maquina de Vendas is the sum of visits to Ricardo Eletro, Insinuante, Eletroshopping and Citylar websites. Source: comScore, Morgan Stanley Research
Exhibit 91
Unique visitors by website
Unique Visitors ('000) YTD
2011 Avg YTD
2012 Avg Y/Y
Growth
1 MercadoLibre 13,019 13,941 7%
2 Americanas (B2W) 5,676 6,042 6%
3 Submarino (B2W) 4,670 4,499 (4%)
4 Magazine Luiza 2,942 3,621 23%
5 Casas Bahia (CBD) 2,806 3,289 17%
6 Pontofrio (CBD) 2,664 3,130 18%
7 Dafiti 1,212 3,062 153%
8 Walmart 1,964 2,936 50%
9 Extra (CBD) 2,425 2,767 14%
10 Livraria Saraiva 2,207 2,508 14%
11 Ricardo Eletro 1,424 1,866 31%
12 Carrefour 1,813 1,850 2%
13 Comprafacil 2,315 1,820 (21%)
14 Shoptime (B2W) 1,441 1,556 8% Source: comScore, Morgan Stanley Research
B2W appears to be using low prices to drive sales growth According to our proprietary price tracker, in 2H12 (up to November), B2W sites posted prices less than or equal to the lowest competitor’s price on 54% of the products evaluated across categories. This compares to 40% in 1H12 and 27% in 2011. Its price competitiveness is the greatest in appliances and electronics, two categories with the highest online penetration in Brazil. We base our analysis on pricing data we pull on a bi-weekly basis from price comparison websites on over 1,500 different products.
Exhibit 92
% of products where B2W price is less than or equal to lowest competitor price
1Q11 2Q11 3Q11 4Q11 1Q12 2Q12 3Q123Q12 vs.
2Q123Q12 vs.
3Q11
AppliancesAir conditioner 23% 31% 29% 45% 39% 40% 67% 27 pp 38 pp
Stove 21% 25% 20% 13% 39% 40% 61% 21 pp 41 ppWasher 19% 38% 26% 23% 31% 46% 69% 23 pp 43 ppMicrowave 39% 44% 39% 31% 59% 55% 57% 2 pp 18 pp
Refrigerator 27% 38% 30% 17% 34% 41% 57% 16 pp 27 pp
Median 23% 38% 29% 23% 39% 41% 61% 20 pp 32 ppElectronicsVideo game n/a 65% 32% 56% 40% 67% 75% 8 pp 43 ppDVD player 20% 50% 36% 24% 50% 78% 69% -9 pp 33 ppMusic player 19% 8% 6% 19% 31% 56% 83% 27 pp 77 pp
Camcorder 35% 47% 59% 33% 25% 71% 82% 11 pp 23 ppCamera 28% n/a 43% 43% 25% 39% 76% 37 pp 33 ppHome theater 20% 23% 28% 9% 68% 55% 73% 18 pp 45 pp
TV 16% 30% 28% 21% 24% 32% 63% 31 pp 35 pp
Median 20% 38% 32% 24% 31% 56% 75% 19 pp 43 ppComputingMonitor 8% 31% 12% 20% 73% 21% 22% 1 pp 10 ppPrinter 34% 32% 19% 25% 53% 39% 63% 24 pp 44 ppNotebook 17% 17% 15% 16% 33% 46% 55% 9 pp 40 pp
Median 17% 31% 15% 20% 53% 39% 55% 16 pp 40 ppBooks 50% 35% 18% 51% 64% 31% 34% 3 pp 16 pp
Median 50% 35% 18% 51% 64% 31% 34% 3 pp 16 ppPhonesLandline 63% 43% 32% 31% 22% 41% 37% -4 pp 5 ppCell/Smartphone 40% 30% 12% 4% 7% 17% 30% 13 pp 18 pp
Median 51% 37% 22% 18% 14% 29% 33% 4 pp 11 pp
Overall median 23% 32% 28% 24% 36% 41% 63% 22 pp 35 pp
Source: AlphaWise, Morgan Stanley Research
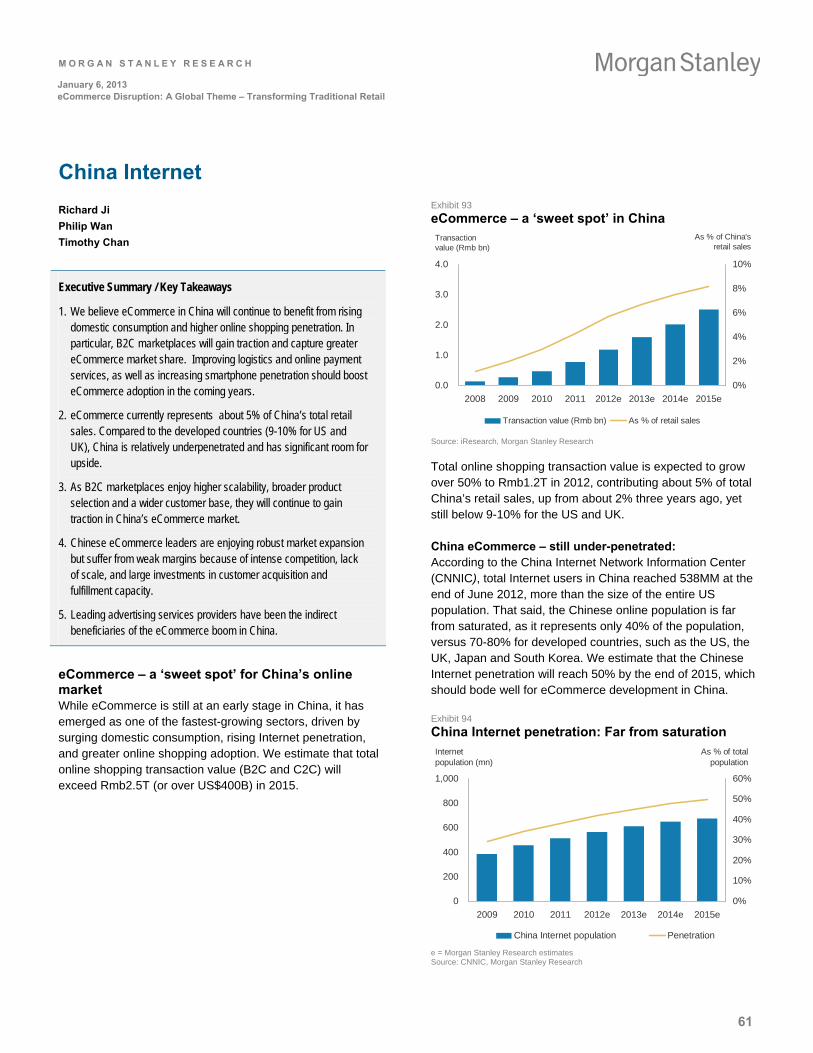
M O R G A N S T A N L E Y R E S E A R C H
61
January 6, 2013 eCommerce Disruption: A Global Theme – Transforming Traditional Retail
China Internet
Richard Ji
Philip Wan
Timothy Chan
Executive Summary / Key Takeaways
1. We believe eCommerce in China will continue to benefit from rising domestic consumption and higher online shopping penetration. In particular, B2C marketplaces will gain traction and capture greater eCommerce market share. Improving logistics and online payment services, as well as increasing smartphone penetration should boost eCommerce adoption in the coming years.
2. eCommerce currently represents about 5% of China’s total retail sales. Compared to the developed countries (9-10% for US and UK), China is relatively underpenetrated and has significant room for upside.
3. As B2C marketplaces enjoy higher scalability, broader product selection and a wider customer base, they will continue to gain traction in China’s eCommerce market.
4. Chinese eCommerce leaders are enjoying robust market expansion but suffer from weak margins because of intense competition, lack of scale, and large investments in customer acquisition and fulfillment capacity.
5. Leading advertising services providers have been the indirect beneficiaries of the eCommerce boom in China.
eCommerce – a ‘sweet spot’ for China’s online market While eCommerce is still at an early stage in China, it has emerged as one of the fastest-growing sectors, driven by surging domestic consumption, rising Internet penetration, and greater online shopping adoption. We estimate that total online shopping transaction value (B2C and C2C) will exceed Rmb2.5T (or over US$400B) in 2015.
Exhibit 93
eCommerce – a ‘sweet spot’ in China
0.0
1.0
2.0
3.0
4.0
2008 2009 2010 2011 2012e 2013e 2014e 2015e
Transaction value (Rmb bn)
0%
2%
4%
6%
8%
10%
Transaction value (Rmb bn) As % of retail sales
As % of China's retail sales
Source: iResearch, Morgan Stanley Research
Total online shopping transaction value is expected to grow over 50% to Rmb1.2T in 2012, contributing about 5% of total China’s retail sales, up from about 2% three years ago, yet still below 9-10% for the US and UK.
China eCommerce – still under-penetrated: According to the China Internet Network Information Center (CNNIC), total Internet users in China reached 538MM at the end of June 2012, more than the size of the entire US population. That said, the Chinese online population is far from saturated, as it represents only 40% of the population, versus 70-80% for developed countries, such as the US, the UK, Japan and South Korea. We estimate that the Chinese Internet penetration will reach 50% by the end of 2015, which should bode well for eCommerce development in China.
Exhibit 94
China Internet penetration: Far from saturation
0
200
400
600
800
1,000
2009 2010 2011 2012e 2013e 2014e 2015e
Internet population (mn)
0%
10%
20%
30%
40%
50%
60%
As % of total population
China Internet population Penetration
e = Morgan Stanley Research estimates Source: CNNIC, Morgan Stanley Research
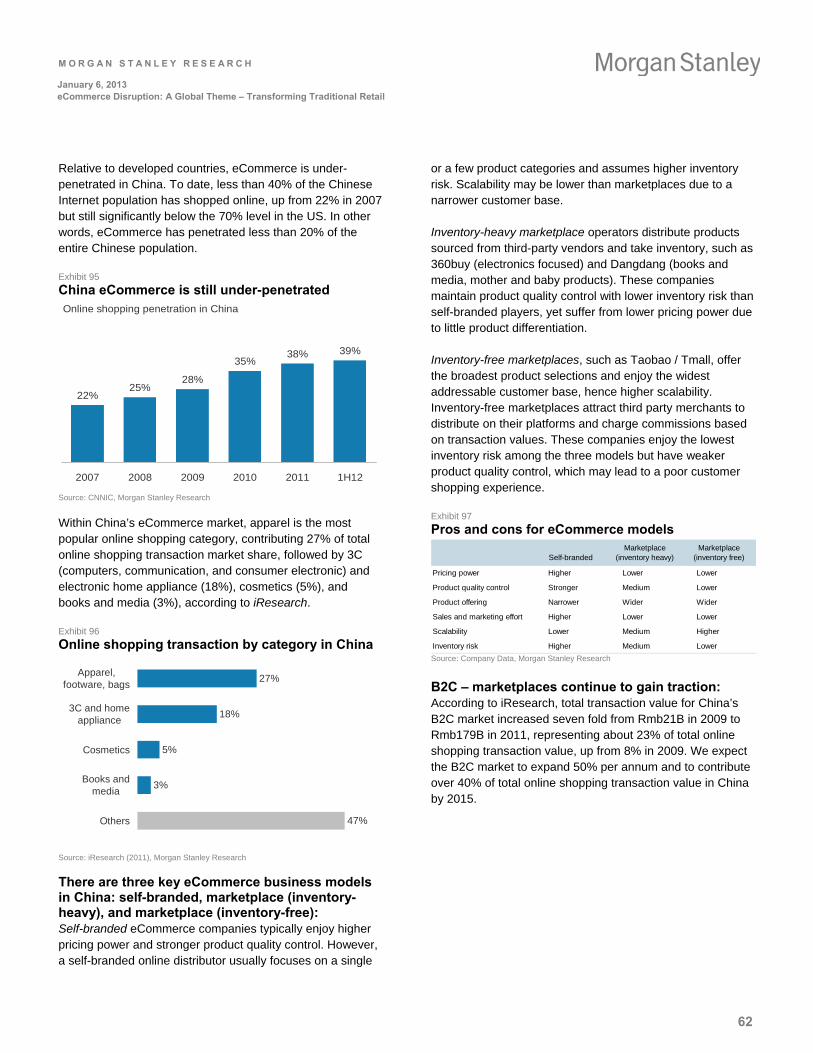
M O R G A N S T A N L E Y R E S E A R C H
62
January 6, 2013 eCommerce Disruption: A Global Theme – Transforming Traditional Retail
Relative to developed countries, eCommerce is under-penetrated in China. To date, less than 40% of the Chinese Internet population has shopped online, up from 22% in 2007 but still significantly below the 70% level in the US. In other words, eCommerce has penetrated less than 20% of the entire Chinese population.
Exhibit 95
China eCommerce is still under-penetrated Online shopping penetration in China
22%25%
28%
35%38% 39%
2007 2008 2009 2010 2011 1H12
Source: CNNIC, Morgan Stanley Research
Within China’s eCommerce market, apparel is the most popular online shopping category, contributing 27% of total online shopping transaction market share, followed by 3C (computers, communication, and consumer electronic) and electronic home appliance (18%), cosmetics (5%), and books and media (3%), according to iResearch.
Exhibit 96
Online shopping transaction by category in China
27%
18%
5%
3%
47%
Apparel,footware, bags
3C and homeappliance
Cosmetics
Books andmedia
Others
Source: iResearch (2011), Morgan Stanley Research
There are three key eCommerce business models in China: self-branded, marketplace (inventory-heavy), and marketplace (inventory-free): Self-branded eCommerce companies typically enjoy higher pricing power and stronger product quality control. However, a self-branded online distributor usually focuses on a single
or a few product categories and assumes higher inventory risk. Scalability may be lower than marketplaces due to a narrower customer base.
Inventory-heavy marketplace operators distribute products sourced from third-party vendors and take inventory, such as 360buy (electronics focused) and Dangdang (books and media, mother and baby products). These companies maintain product quality control with lower inventory risk than self-branded players, yet suffer from lower pricing power due to little product differentiation.
Inventory-free marketplaces, such as Taobao / Tmall, offer the broadest product selections and enjoy the widest addressable customer base, hence higher scalability. Inventory-free marketplaces attract third party merchants to distribute on their platforms and charge commissions based on transaction values. These companies enjoy the lowest inventory risk among the three models but have weaker product quality control, which may lead to a poor customer shopping experience.
Exhibit 97
Pros and cons for eCommerce models
Self-brandedMarketplace
(inventory heavy)Marketplace
(inventory free)
Pricing power Higher Lower Lower
Product quality control Stronger Medium Lower
Product offering Narrower Wider Wider
Sales and marketing effort Higher Lower Lower
Scalability Lower Medium Higher
Inventory risk Higher Medium Lower Source: Company Data, Morgan Stanley Research
B2C – marketplaces continue to gain traction: According to iResearch, total transaction value for China’s B2C market increased seven fold from Rmb21B in 2009 to Rmb179B in 2011, representing about 23% of total online shopping transaction value, up from 8% in 2009. We expect the B2C market to expand 50% per annum and to contribute over 40% of total online shopping transaction value in China by 2015.
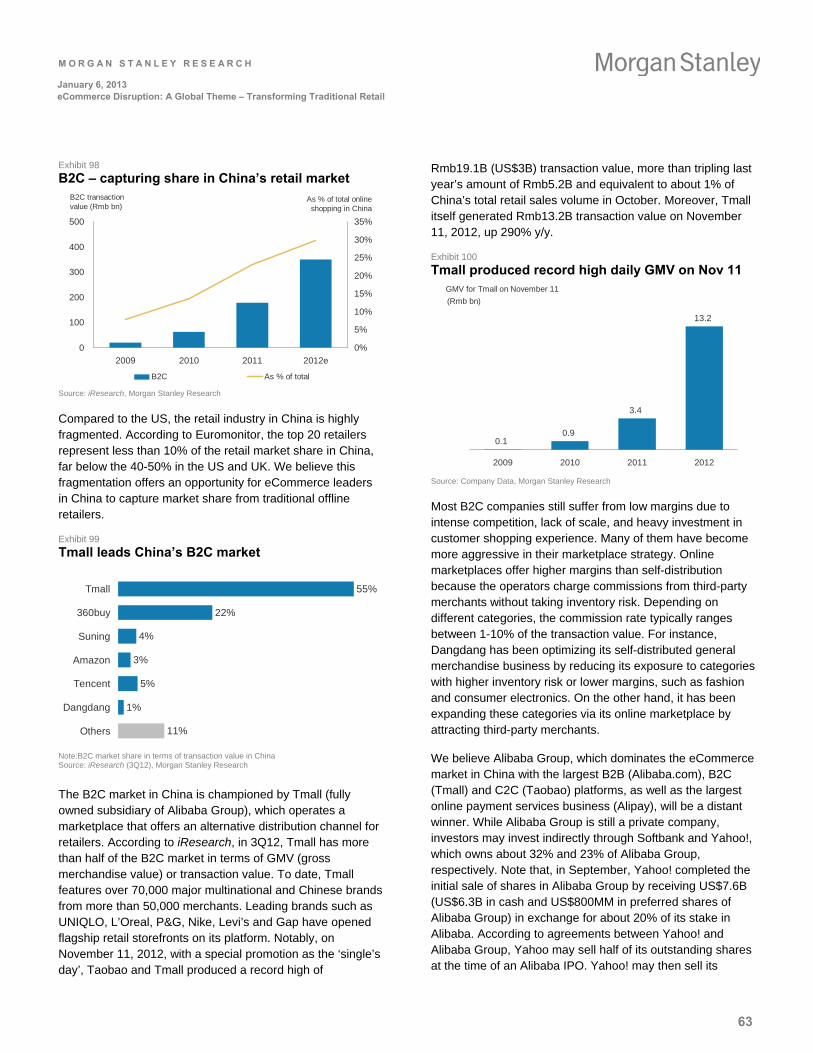
M O R G A N S T A N L E Y R E S E A R C H
63
January 6, 2013 eCommerce Disruption: A Global Theme – Transforming Traditional Retail
Exhibit 98
B2C – capturing share in China’s retail market
0
100
200
300
400
500
2009 2010 2011 2012e
B2C transaction value (Rmb bn)
0%
5%
10%
15%
20%
25%
30%
35%
B2C As % of total
As % of total onlineshopping in China
Source: iResearch, Morgan Stanley Research
Compared to the US, the retail industry in China is highly fragmented. According to Euromonitor, the top 20 retailers represent less than 10% of the retail market share in China, far below the 40-50% in the US and UK. We believe this fragmentation offers an opportunity for eCommerce leaders in China to capture market share from traditional offline retailers.
Exhibit 99
Tmall leads China’s B2C market
55%
22%
4%
3%
5%
1%
11%
Tmall
360buy
Suning
Amazon
Tencent
Dangdang
Others
Note:B2C market share in terms of transaction value in China Source: iResearch (3Q12), Morgan Stanley Research
The B2C market in China is championed by Tmall (fully owned subsidiary of Alibaba Group), which operates a marketplace that offers an alternative distribution channel for retailers. According to iResearch, in 3Q12, Tmall has more than half of the B2C market in terms of GMV (gross merchandise value) or transaction value. To date, Tmall features over 70,000 major multinational and Chinese brands from more than 50,000 merchants. Leading brands such as UNIQLO, L’Oreal, P&G, Nike, Levi’s and Gap have opened flagship retail storefronts on its platform. Notably, on November 11, 2012, with a special promotion as the ‘single’s day’, Taobao and Tmall produced a record high of
Rmb19.1B (US$3B) transaction value, more than tripling last year’s amount of Rmb5.2B and equivalent to about 1% of China’s total retail sales volume in October. Moreover, Tmall itself generated Rmb13.2B transaction value on November 11, 2012, up 290% y/y.
Exhibit 100
Tmall produced record high daily GMV on Nov 11 GMV for Tmall on November 11
0.10.9
3.4
13.2
2009 2010 2011 2012
(Rmb bn)
Source: Company Data, Morgan Stanley Research
Most B2C companies still suffer from low margins due to intense competition, lack of scale, and heavy investment in customer shopping experience. Many of them have become more aggressive in their marketplace strategy. Online marketplaces offer higher margins than self-distribution because the operators charge commissions from third-party merchants without taking inventory risk. Depending on different categories, the commission rate typically ranges between 1-10% of the transaction value. For instance, Dangdang has been optimizing its self-distributed general merchandise business by reducing its exposure to categories with higher inventory risk or lower margins, such as fashion and consumer electronics. On the other hand, it has been expanding these categories via its online marketplace by attracting third-party merchants.
We believe Alibaba Group, which dominates the eCommerce market in China with the largest B2B (Alibaba.com), B2C (Tmall) and C2C (Taobao) platforms, as well as the largest online payment services business (Alipay), will be a distant winner. While Alibaba Group is still a private company, investors may invest indirectly through Softbank and Yahoo!, which owns about 32% and 23% of Alibaba Group, respectively. Note that, in September, Yahoo! completed the initial sale of shares in Alibaba Group by receiving US$7.6B (US$6.3B in cash and US$800MM in preferred shares of Alibaba Group) in exchange for about 20% of its stake in Alibaba. According to agreements between Yahoo! and Alibaba Group, Yahoo may sell half of its outstanding shares at the time of an Alibaba IPO. Yahoo! may then sell its
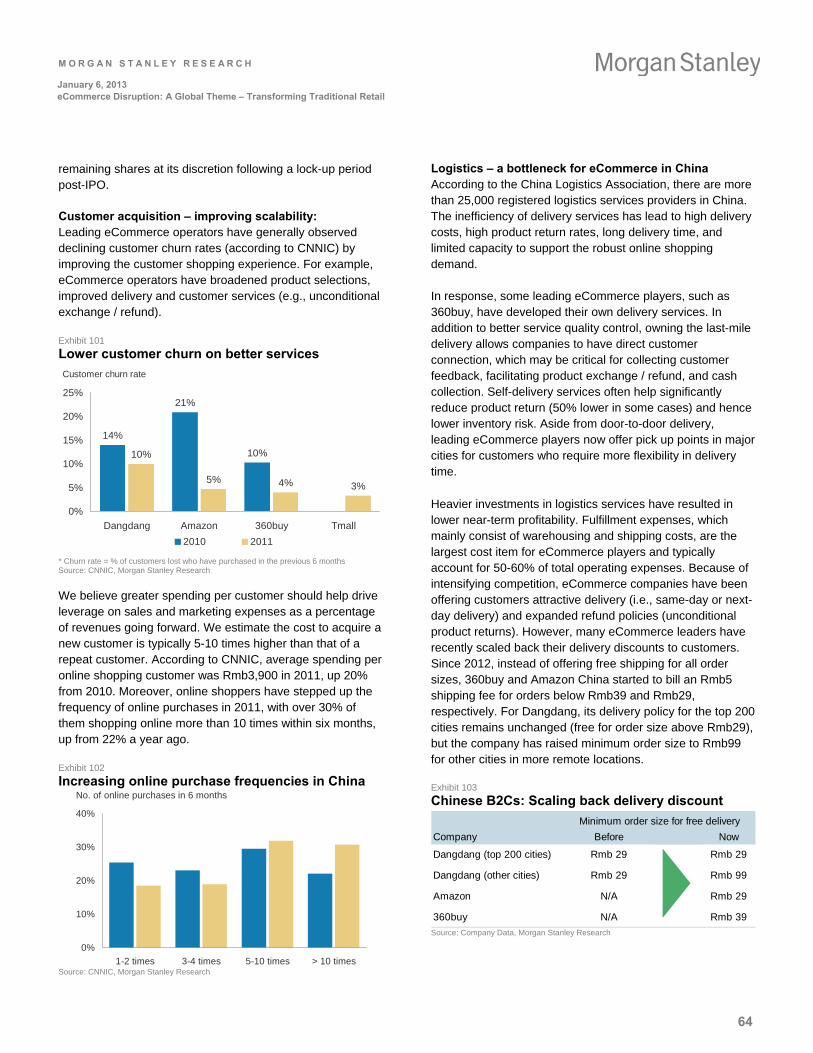
M O R G A N S T A N L E Y R E S E A R C H
64
January 6, 2013 eCommerce Disruption: A Global Theme – Transforming Traditional Retail
remaining shares at its discretion following a lock-up period post-IPO.
Customer acquisition – improving scalability: Leading eCommerce operators have generally observed declining customer churn rates (according to CNNIC) by improving the customer shopping experience. For example, eCommerce operators have broadened product selections, improved delivery and customer services (e.g., unconditional exchange / refund).
Exhibit 101
Lower customer churn on better services
Customer churn rate
14%
21%
10%10%
5% 4% 3%
0%
5%
10%
15%
20%
25%
Dangdang Amazon 360buy Tmall
2010 2011
* Churn rate = % of customers lost who have purchased in the previous 6 months Source: CNNIC, Morgan Stanley Research
We believe greater spending per customer should help drive leverage on sales and marketing expenses as a percentage of revenues going forward. We estimate the cost to acquire a new customer is typically 5-10 times higher than that of a repeat customer. According to CNNIC, average spending per online shopping customer was Rmb3,900 in 2011, up 20% from 2010. Moreover, online shoppers have stepped up the frequency of online purchases in 2011, with over 30% of them shopping online more than 10 times within six months, up from 22% a year ago.
Exhibit 102
Increasing online purchase frequencies in China No. of online purchases in 6 months
0%
10%
20%
30%
40%
1-2 times 3-4 times 5-10 times > 10 times Source: CNNIC, Morgan Stanley Research
Logistics – a bottleneck for eCommerce in China According to the China Logistics Association, there are more than 25,000 registered logistics services providers in China. The inefficiency of delivery services has lead to high delivery costs, high product return rates, long delivery time, and limited capacity to support the robust online shopping demand.
In response, some leading eCommerce players, such as 360buy, have developed their own delivery services. In addition to better service quality control, owning the last-mile delivery allows companies to have direct customer connection, which may be critical for collecting customer feedback, facilitating product exchange / refund, and cash collection. Self-delivery services often help significantly reduce product return (50% lower in some cases) and hence lower inventory risk. Aside from door-to-door delivery, leading eCommerce players now offer pick up points in major cities for customers who require more flexibility in delivery time.
Heavier investments in logistics services have resulted in lower near-term profitability. Fulfillment expenses, which mainly consist of warehousing and shipping costs, are the largest cost item for eCommerce players and typically account for 50-60% of total operating expenses. Because of intensifying competition, eCommerce companies have been offering customers attractive delivery (i.e., same-day or next-day delivery) and expanded refund policies (unconditional product returns). However, many eCommerce leaders have recently scaled back their delivery discounts to customers. Since 2012, instead of offering free shipping for all order sizes, 360buy and Amazon China started to bill an Rmb5 shipping fee for orders below Rmb39 and Rmb29, respectively. For Dangdang, its delivery policy for the top 200 cities remains unchanged (free for order size above Rmb29), but the company has raised minimum order size to Rmb99 for other cities in more remote locations.
Exhibit 103
Chinese B2Cs: Scaling back delivery discount
Company Before Now
Dangdang (top 200 cities) Rmb 29 Rmb 29
Dangdang (other cities) Rmb 29 Rmb 99
Amazon N/A Rmb 29
360buy N/A Rmb 39
Minimum order size for free delivery
Source: Company Data, Morgan Stanley Research
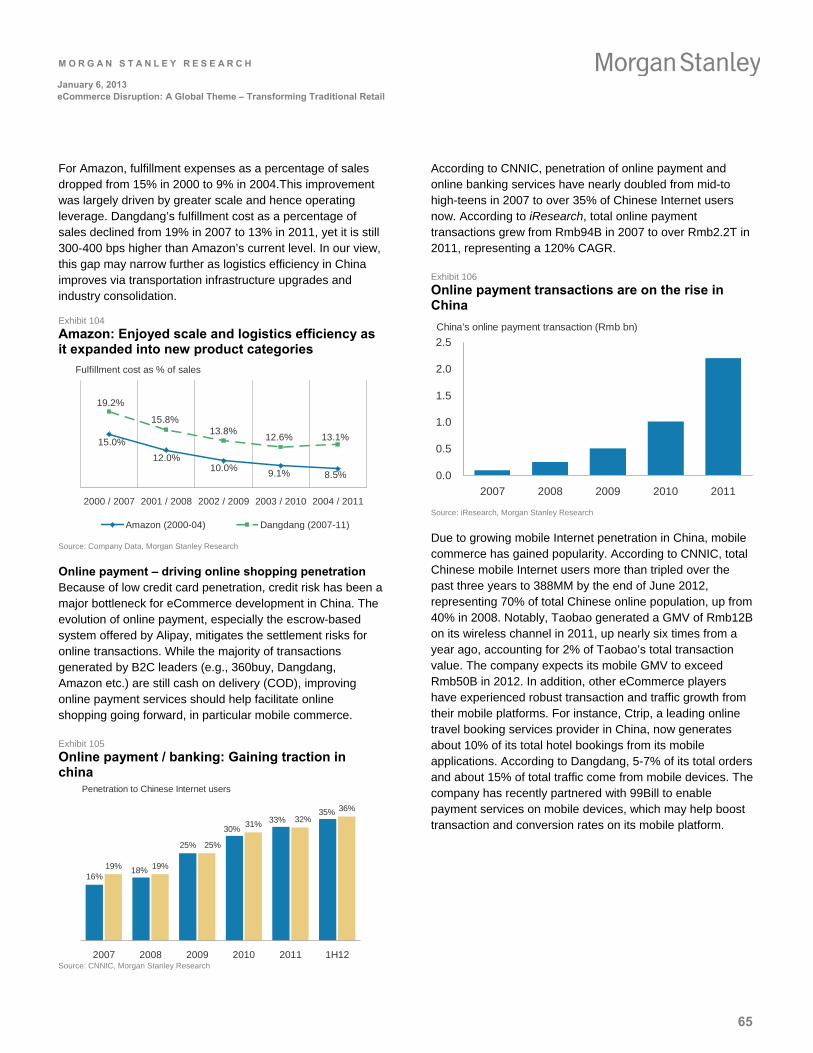
M O R G A N S T A N L E Y R E S E A R C H
65
January 6, 2013 eCommerce Disruption: A Global Theme – Transforming Traditional Retail
For Amazon, fulfillment expenses as a percentage of sales dropped from 15% in 2000 to 9% in 2004.This improvement was largely driven by greater scale and hence operating leverage. Dangdang’s fulfillment cost as a percentage of sales declined from 19% in 2007 to 13% in 2011, yet it is still 300-400 bps higher than Amazon’s current level. In our view, this gap may narrow further as logistics efficiency in China improves via transportation infrastructure upgrades and industry consolidation.
Exhibit 104
Amazon: Enjoyed scale and logistics efficiency as it expanded into new product categories
Fulfillment cost as % of sales
8.5%9.1%10.0%
12.0%
15.0% 13.1%12.6%13.8%
15.8%
19.2%
2000 / 2007 2001 / 2008 2002 / 2009 2003 / 2010 2004 / 2011
Amazon (2000-04) Dangdang (2007-11)
Source: Company Data, Morgan Stanley Research
Online payment – driving online shopping penetration Because of low credit card penetration, credit risk has been a major bottleneck for eCommerce development in China. The evolution of online payment, especially the escrow-based system offered by Alipay, mitigates the settlement risks for online transactions. While the majority of transactions generated by B2C leaders (e.g., 360buy, Dangdang, Amazon etc.) are still cash on delivery (COD), improving online payment services should help facilitate online shopping going forward, in particular mobile commerce.
Exhibit 105
Online payment / banking: Gaining traction in china
Penetration to Chinese Internet users
16%
25%
19% 19%
31%
36%
18%
35%33%
30%32%
25%
2007 2008 2009 2010 2011 1H12 Source: CNNIC, Morgan Stanley Research
According to CNNIC, penetration of online payment and online banking services have nearly doubled from mid-to high-teens in 2007 to over 35% of Chinese Internet users now. According to iResearch, total online payment transactions grew from Rmb94B in 2007 to over Rmb2.2T in 2011, representing a 120% CAGR.
Exhibit 106
Online payment transactions are on the rise in China
China's online payment transaction (Rmb bn)
0.0
0.5
1.0
1.5
2.0
2.5
2007 2008 2009 2010 2011
Source: iResearch, Morgan Stanley Research
Due to growing mobile Internet penetration in China, mobile commerce has gained popularity. According to CNNIC, total Chinese mobile Internet users more than tripled over the past three years to 388MM by the end of June 2012, representing 70% of total Chinese online population, up from 40% in 2008. Notably, Taobao generated a GMV of Rmb12B on its wireless channel in 2011, up nearly six times from a year ago, accounting for 2% of Taobao’s total transaction value. The company expects its mobile GMV to exceed Rmb50B in 2012. In addition, other eCommerce players have experienced robust transaction and traffic growth from their mobile platforms. For instance, Ctrip, a leading online travel booking services provider in China, now generates about 10% of its total hotel bookings from its mobile applications. According to Dangdang, 5-7% of its total orders and about 15% of total traffic come from mobile devices. The company has recently partnered with 99Bill to enable payment services on mobile devices, which may help boost transaction and conversion rates on its mobile platform.
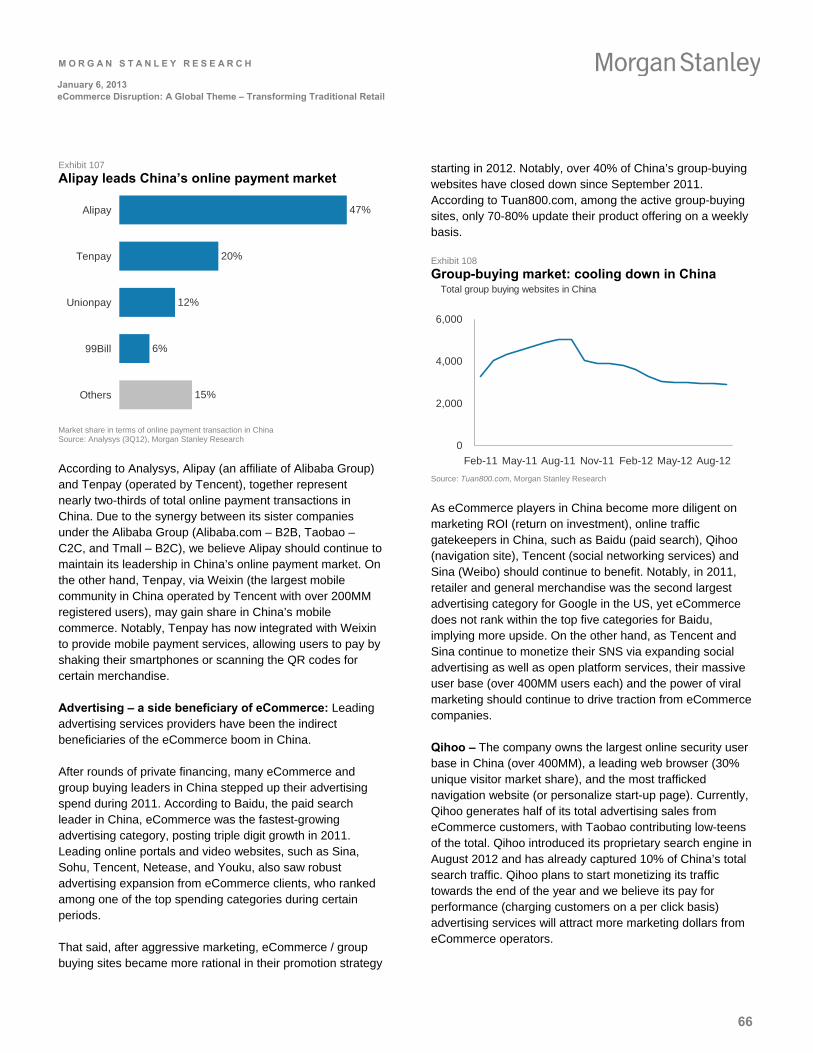
M O R G A N S T A N L E Y R E S E A R C H
66
January 6, 2013 eCommerce Disruption: A Global Theme – Transforming Traditional Retail
Exhibit 107
Alipay leads China’s online payment market
47%
20%
12%
6%
15%
Alipay
Tenpay
Unionpay
99Bill
Others
Market share in terms of online payment transaction in China Source: Analysys (3Q12), Morgan Stanley Research
According to Analysys, Alipay (an affiliate of Alibaba Group) and Tenpay (operated by Tencent), together represent nearly two-thirds of total online payment transactions in China. Due to the synergy between its sister companies under the Alibaba Group (Alibaba.com – B2B, Taobao – C2C, and Tmall – B2C), we believe Alipay should continue to maintain its leadership in China’s online payment market. On the other hand, Tenpay, via Weixin (the largest mobile community in China operated by Tencent with over 200MM registered users), may gain share in China’s mobile commerce. Notably, Tenpay has now integrated with Weixin to provide mobile payment services, allowing users to pay by shaking their smartphones or scanning the QR codes for certain merchandise.
Advertising – a side beneficiary of eCommerce: Leading advertising services providers have been the indirect beneficiaries of the eCommerce boom in China.
After rounds of private financing, many eCommerce and group buying leaders in China stepped up their advertising spend during 2011. According to Baidu, the paid search leader in China, eCommerce was the fastest-growing advertising category, posting triple digit growth in 2011. Leading online portals and video websites, such as Sina, Sohu, Tencent, Netease, and Youku, also saw robust advertising expansion from eCommerce clients, who ranked among one of the top spending categories during certain periods.
That said, after aggressive marketing, eCommerce / group buying sites became more rational in their promotion strategy
starting in 2012. Notably, over 40% of China’s group-buying websites have closed down since September 2011. According to Tuan800.com, among the active group-buying sites, only 70-80% update their product offering on a weekly basis.
Exhibit 108
Group-buying market: cooling down in China Total group buying websites in China
0
2,000
4,000
6,000
Feb-11 May-11 Aug-11 Nov-11 Feb-12 May-12 Aug-12
Source: Tuan800.com, Morgan Stanley Research
As eCommerce players in China become more diligent on marketing ROI (return on investment), online traffic gatekeepers in China, such as Baidu (paid search), Qihoo (navigation site), Tencent (social networking services) and Sina (Weibo) should continue to benefit. Notably, in 2011, retailer and general merchandise was the second largest advertising category for Google in the US, yet eCommerce does not rank within the top five categories for Baidu, implying more upside. On the other hand, as Tencent and Sina continue to monetize their SNS via expanding social advertising as well as open platform services, their massive user base (over 400MM users each) and the power of viral marketing should continue to drive traction from eCommerce companies.
Qihoo – The company owns the largest online security user base in China (over 400MM), a leading web browser (30% unique visitor market share), and the most trafficked navigation website (or personalize start-up page). Currently, Qihoo generates half of its total advertising sales from eCommerce customers, with Taobao contributing low-teens of the total. Qihoo introduced its proprietary search engine in August 2012 and has already captured 10% of China’s total search traffic. Qihoo plans to start monetizing its traffic towards the end of the year and we believe its pay for performance (charging customers on a per click basis) advertising services will attract more marketing dollars from eCommerce operators.
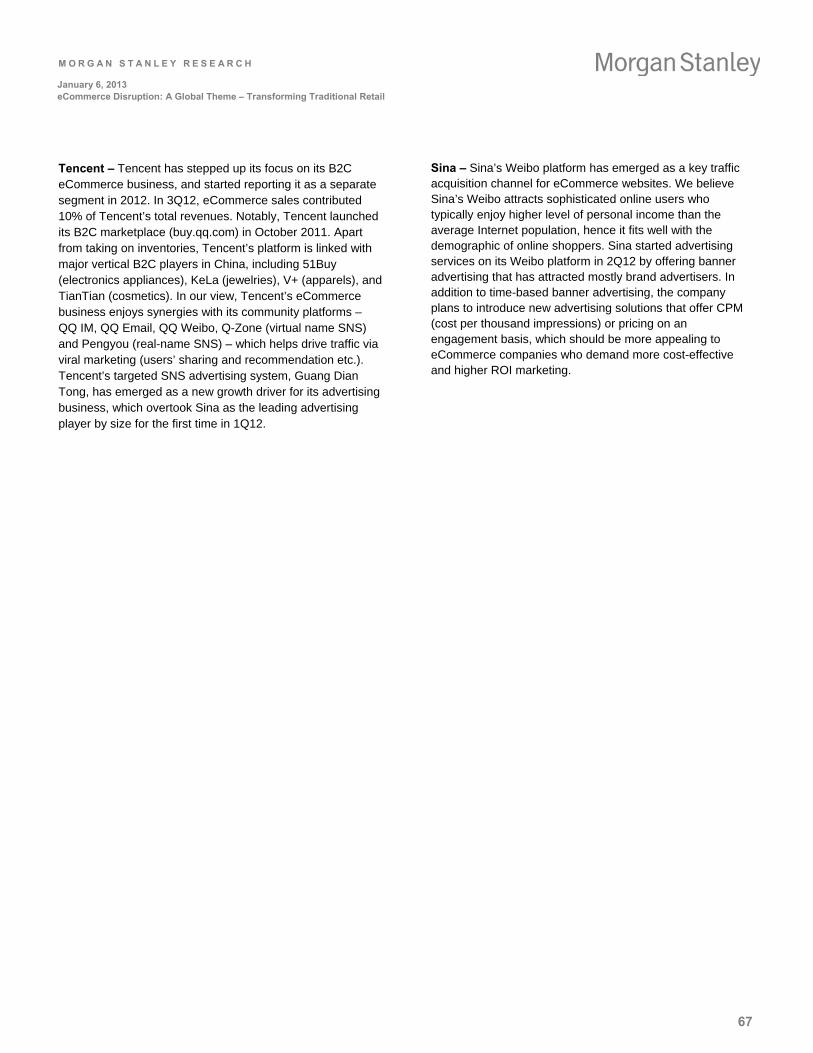
M O R G A N S T A N L E Y R E S E A R C H
67
January 6, 2013 eCommerce Disruption: A Global Theme – Transforming Traditional Retail
Tencent – Tencent has stepped up its focus on its B2C eCommerce business, and started reporting it as a separate segment in 2012. In 3Q12, eCommerce sales contributed 10% of Tencent’s total revenues. Notably, Tencent launched its B2C marketplace (buy.qq.com) in October 2011. Apart from taking on inventories, Tencent’s platform is linked with major vertical B2C players in China, including 51Buy (electronics appliances), KeLa (jewelries), V+ (apparels), and TianTian (cosmetics). In our view, Tencent’s eCommerce business enjoys synergies with its community platforms – QQ IM, QQ Email, QQ Weibo, Q-Zone (virtual name SNS) and Pengyou (real-name SNS) – which helps drive traffic via viral marketing (users’ sharing and recommendation etc.). Tencent’s targeted SNS advertising system, Guang Dian Tong, has emerged as a new growth driver for its advertising business, which overtook Sina as the leading advertising player by size for the first time in 1Q12.
Sina – Sina’s Weibo platform has emerged as a key traffic acquisition channel for eCommerce websites. We believe Sina’s Weibo attracts sophisticated online users who typically enjoy higher level of personal income than the average Internet population, hence it fits well with the demographic of online shoppers. Sina started advertising services on its Weibo platform in 2Q12 by offering banner advertising that has attracted mostly brand advertisers. In addition to time-based banner advertising, the company plans to introduce new advertising solutions that offer CPM (cost per thousand impressions) or pricing on an engagement basis, which should be more appealing to eCommerce companies who demand more cost-effective and higher ROI marketing.
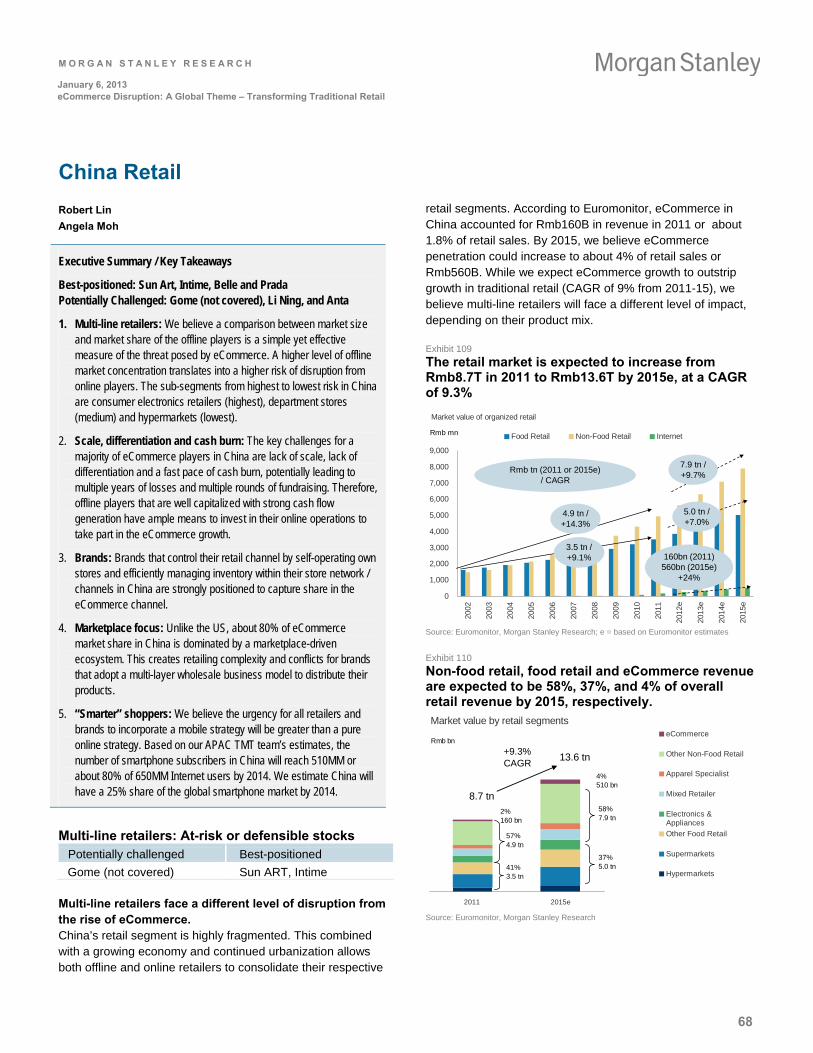
M O R G A N S T A N L E Y R E S E A R C H
68
January 6, 2013 eCommerce Disruption: A Global Theme – Transforming Traditional Retail
China Retail
Robert Lin
Angela Moh
Executive Summary / Key Takeaways
Best-positioned: Sun Art, Intime, Belle and Prada Potentially Challenged: Gome (not covered), Li Ning, and Anta
1. Multi-line retailers: We believe a comparison between market size and market share of the offline players is a simple yet effective measure of the threat posed by eCommerce. A higher level of offline market concentration translates into a higher risk of disruption from online players. The sub-segments from highest to lowest risk in China are consumer electronics retailers (highest), department stores (medium) and hypermarkets (lowest).
2. Scale, differentiation and cash burn: The key challenges for a majority of eCommerce players in China are lack of scale, lack of differentiation and a fast pace of cash burn, potentially leading to multiple years of losses and multiple rounds of fundraising. Therefore, offline players that are well capitalized with strong cash flow generation have ample means to invest in their online operations to take part in the eCommerce growth.
3. Brands: Brands that control their retail channel by self-operating own stores and efficiently managing inventory within their store network / channels in China are strongly positioned to capture share in the eCommerce channel.
4. Marketplace focus: Unlike the US, about 80% of eCommerce market share in China is dominated by a marketplace-driven ecosystem. This creates retailing complexity and conflicts for brands that adopt a multi-layer wholesale business model to distribute their products.
5. “Smarter” shoppers: We believe the urgency for all retailers and brands to incorporate a mobile strategy will be greater than a pure online strategy. Based on our APAC TMT team’s estimates, the number of smartphone subscribers in China will reach 510MM or about 80% of 650MM Internet users by 2014. We estimate China will have a 25% share of the global smartphone market by 2014.
Multi-line retailers: At-risk or defensible stocks Potentially challenged Best-positioned
Gome (not covered) Sun ART, Intime Multi-line retailers face a different level of disruption from the rise of eCommerce. China’s retail segment is highly fragmented. This combined with a growing economy and continued urbanization allows both offline and online retailers to consolidate their respective
retail segments. According to Euromonitor, eCommerce in China accounted for Rmb160B in revenue in 2011 or about 1.8% of retail sales. By 2015, we believe eCommerce penetration could increase to about 4% of retail sales or Rmb560B. While we expect eCommerce growth to outstrip growth in traditional retail (CAGR of 9% from 2011-15), we believe multi-line retailers will face a different level of impact, depending on their product mix.
Exhibit 109
The retail market is expected to increase from Rmb8.7T in 2011 to Rmb13.6T by 2015e, at a CAGR of 9.3%
Market value of organized retail
0
1,000
2,000
3,000
4,000
5,000
6,000
7,000
8,000
9,000
2002
2003
2004
2005
2006
2007
2008
2009
2010
2011
2012
e
2013
e
2014
e
2015
e
Food Retail Non-Food Retail InternetRmb mn
4.9 tn / +14.3%
7.9 tn / +9.7%
3.5 tn / +9.1%
5.0 tn / +7.0%
160bn (2011) 560bn (2015e)
+24%
Rmb tn (2011 or 2015e) / CAGR
Source: Euromonitor, Morgan Stanley Research; e = based on Euromonitor estimates
Exhibit 110
Non-food retail, food retail and eCommerce revenue are expected to be 58%, 37%, and 4% of overall retail revenue by 2015, respectively. Market value by retail segments
2011 2015e
eCommerce
Other Non-Food Retail
Apparel Specialist
Mixed Retailer
Electronics &Appliances
Other Food Retail
Supermarkets
Hypermarkets
Rmb bn
41%3.5 tn
37%5.0 tn
57%4.9 tn
58%7.9 tn
2%160 bn
4%510 bn
8.7 tn
13.6 tn+9.3% CAGR
Source: Euromonitor, Morgan Stanley Research
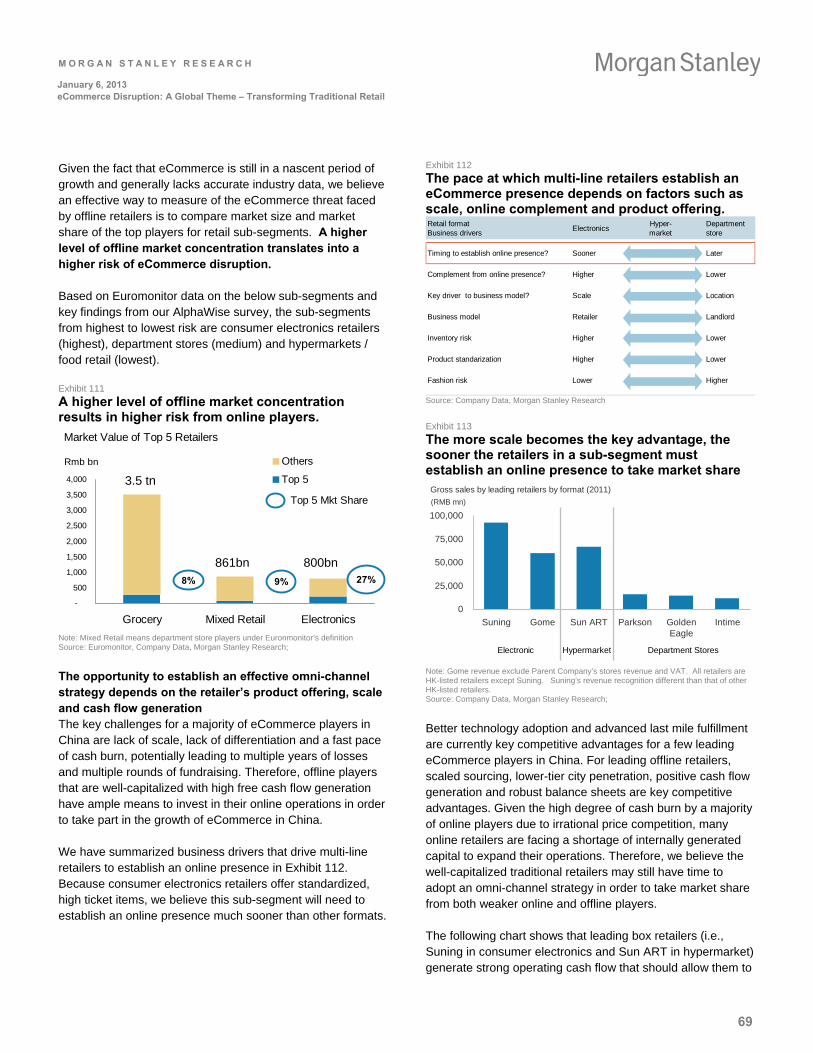
M O R G A N S T A N L E Y R E S E A R C H
69
January 6, 2013 eCommerce Disruption: A Global Theme – Transforming Traditional Retail
Given the fact that eCommerce is still in a nascent period of growth and generally lacks accurate industry data, we believe an effective way to measure of the eCommerce threat faced by offline retailers is to compare market size and market share of the top players for retail sub-segments. A higher level of offline market concentration translates into a higher risk of eCommerce disruption.
Based on Euromonitor data on the below sub-segments and key findings from our AlphaWise survey, the sub-segments from highest to lowest risk are consumer electronics retailers (highest), department stores (medium) and hypermarkets / food retail (lowest).
Exhibit 111
A higher level of offline market concentration results in higher risk from online players.
Market Value of Top 5 Retailers
-
500
1,000
1,500
2,000
2,500
3,000
3,500
4,000
Grocery Mixed Retail Electronics
Others
Top 53.5 tn
861bn 800bn8% 9% 27%
Rmb bn
Top 5 Mkt Share
Note: Mixed Retail means department store players under Euronmonitor’s definition Source: Euromonitor, Company Data, Morgan Stanley Research;
The opportunity to establish an effective omni-channel strategy depends on the retailer’s product offering, scale and cash flow generation The key challenges for a majority of eCommerce players in China are lack of scale, lack of differentiation and a fast pace of cash burn, potentially leading to multiple years of losses and multiple rounds of fundraising. Therefore, offline players that are well-capitalized with high free cash flow generation have ample means to invest in their online operations in order to take part in the growth of eCommerce in China.
We have summarized business drivers that drive multi-line retailers to establish an online presence in Exhibit 112. Because consumer electronics retailers offer standardized, high ticket items, we believe this sub-segment will need to establish an online presence much sooner than other formats.
Exhibit 112
The pace at which multi-line retailers establish an eCommerce presence depends on factors such as scale, online complement and product offering. Retail formatBusiness drivers
ElectronicsHyper-market
Departmentstore
Timing to establish online presence? Sooner Later
Complement from online presence? Higher Lower
Key driver to business model? Scale Location
Business model Retailer Landlord
Inventory risk Higher Lower
Product standarization Higher Lower
Fashion risk Lower Higher
Source: Company Data, Morgan Stanley Research
Exhibit 113
The more scale becomes the key advantage, the sooner the retailers in a sub-segment must establish an online presence to take market share Gross sales by leading retailers by format (2011)
0
25,000
50,000
75,000
100,000
Suning Gome Sun ART Parkson GoldenEagle
Intime
(RMB mn)
Electronic Hypermarket Department Stores
Note: Gome revenue exclude Parent Company’s stores revenue and VAT. All retailers are HK-listed retailers except Suning. Suning’s revenue recognition different than that of other HK-listed retailers. Source: Company Data, Morgan Stanley Research;
Better technology adoption and advanced last mile fulfillment are currently key competitive advantages for a few leading eCommerce players in China. For leading offline retailers, scaled sourcing, lower-tier city penetration, positive cash flow generation and robust balance sheets are key competitive advantages. Given the high degree of cash burn by a majority of online players due to irrational price competition, many online retailers are facing a shortage of internally generated capital to expand their operations. Therefore, we believe the well-capitalized traditional retailers may still have time to adopt an omni-channel strategy in order to take market share from both weaker online and offline players.
The following chart shows that leading box retailers (i.e., Suning in consumer electronics and Sun ART in hypermarket) generate strong operating cash flow that should allow them to
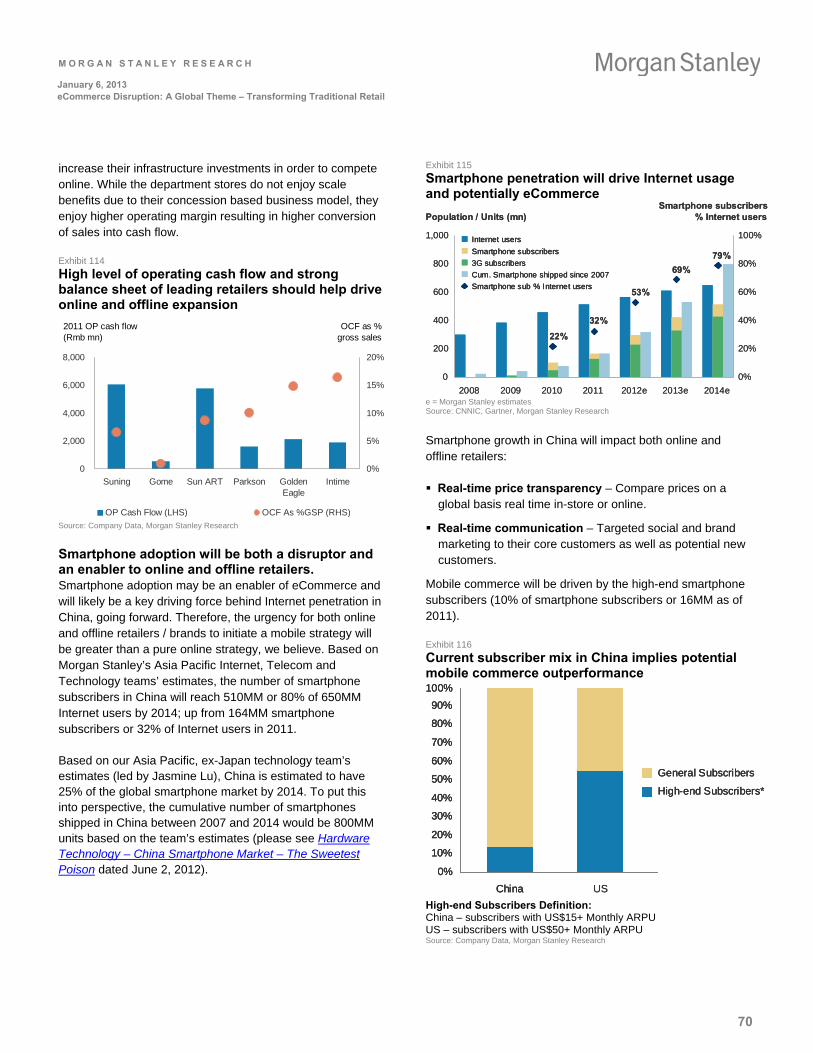
M O R G A N S T A N L E Y R E S E A R C H
70
January 6, 2013 eCommerce Disruption: A Global Theme – Transforming Traditional Retail
increase their infrastructure investments in order to compete online. While the department stores do not enjoy scale benefits due to their concession based business model, they enjoy higher operating margin resulting in higher conversion of sales into cash flow.
Exhibit 114
High level of operating cash flow and strong balance sheet of leading retailers should help drive online and offline expansion
0
2,000
4,000
6,000
8,000
Suning Gome Sun ART Parkson GoldenEagle
Intime
0%
5%
10%
15%
20%
OP Cash Flow (LHS) OCF As %GSP (RHS)
2011 OP cash flow (Rmb mn)
OCF as % gross sales
Source: Company Data, Morgan Stanley Research
Smartphone adoption will be both a disruptor and an enabler to online and offline retailers. Smartphone adoption may be an enabler of eCommerce and will likely be a key driving force behind Internet penetration in China, going forward. Therefore, the urgency for both online and offline retailers / brands to initiate a mobile strategy will be greater than a pure online strategy, we believe. Based on Morgan Stanley’s Asia Pacific Internet, Telecom and Technology teams’ estimates, the number of smartphone subscribers in China will reach 510MM or 80% of 650MM Internet users by 2014; up from 164MM smartphone subscribers or 32% of Internet users in 2011.
Based on our Asia Pacific, ex-Japan technology team’s estimates (led by Jasmine Lu), China is estimated to have 25% of the global smartphone market by 2014. To put this into perspective, the cumulative number of smartphones shipped in China between 2007 and 2014 would be 800MM units based on the team’s estimates (please see Hardware Technology – China Smartphone Market – The Sweetest Poison dated June 2, 2012).
Exhibit 115
Smartphone penetration will drive Internet usage and potentially eCommerce
22%
32%
53%
69%
79%
0
200
400
600
800
1,000
2008 2009 2010 2011 2012e 2013e 2014e
0%
20%
40%
60%
80%
100%Internet users
Smartphone subscribers
3G subscribers
Cum. Smartphone shipped since 2007
Smartphone sub % Internet users
Smartphone subscribers% Internet usersPopulation / Units (mn)
22%
32%
53%
69%
79%
0
200
400
600
800
1,000
2008 2009 2010 2011 2012e 2013e 2014e
0%
20%
40%
60%
80%
100%Internet users
Smartphone subscribers
3G subscribers
Cum. Smartphone shipped since 2007
Smartphone sub % Internet users
Internet users
Smartphone subscribers
3G subscribers
Cum. Smartphone shipped since 2007
Smartphone sub % Internet users
Smartphone subscribers% Internet usersPopulation / Units (mn)
e = Morgan Stanley estimates Source: CNNIC, Gartner, Morgan Stanley Research
Smartphone growth in China will impact both online and offline retailers:
Real-time price transparency – Compare prices on a global basis real time in-store or online.
Real-time communication – Targeted social and brand marketing to their core customers as well as potential new customers.
Mobile commerce will be driven by the high-end smartphone subscribers (10% of smartphone subscribers or 16MM as of 2011).
Exhibit 116
Current subscriber mix in China implies potential mobile commerce outperformance 100%
90%
80%
70%
60%
50%
40%
30%
20%
10%
0%
China US
General Subscribers
High-end Subscribers*
100%
90%
80%
70%
60%
50%
40%
30%
20%
10%
0%
100%
90%
80%
70%
60%
50%
40%
30%
20%
10%
0%
ChinaChina US
General Subscribers
High-end Subscribers*
General Subscribers
High-end Subscribers*
High-end Subscribers Definition: China – subscribers with US$15+ Monthly ARPU US – subscribers with US$50+ Monthly ARPU Source: Company Data, Morgan Stanley Research
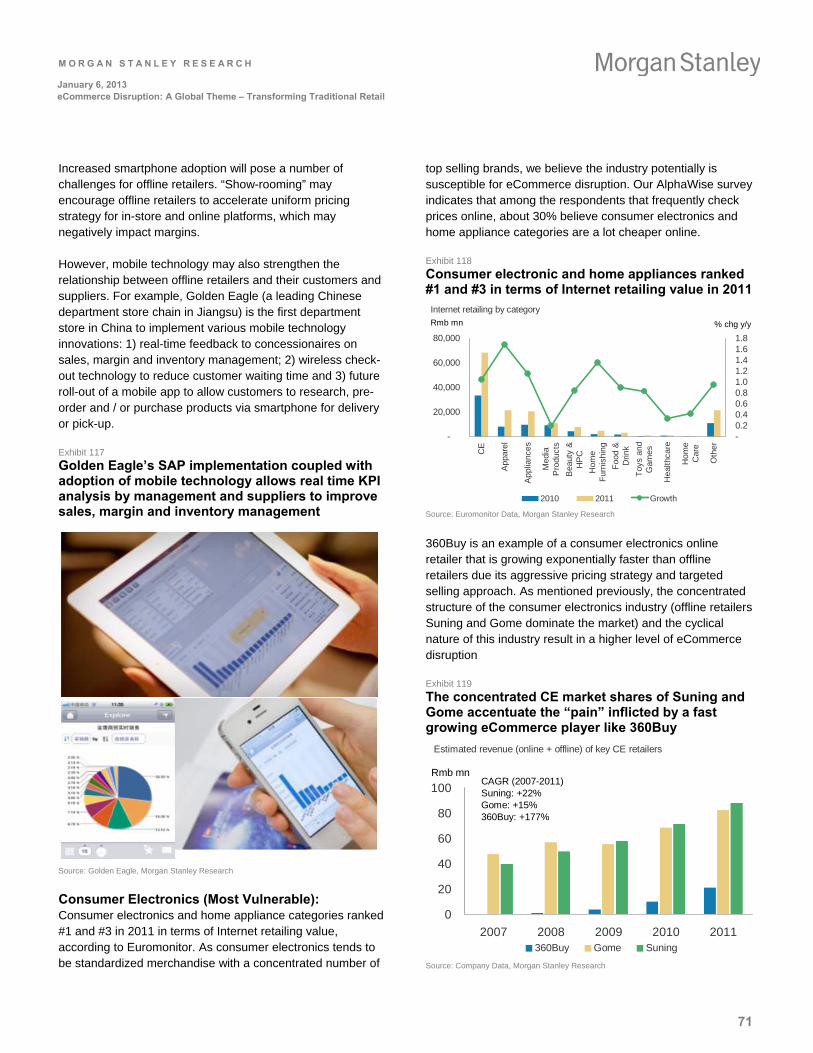
M O R G A N S T A N L E Y R E S E A R C H
71
January 6, 2013 eCommerce Disruption: A Global Theme – Transforming Traditional Retail
Increased smartphone adoption will pose a number of challenges for offline retailers. “Show-rooming” may encourage offline retailers to accelerate uniform pricing strategy for in-store and online platforms, which may negatively impact margins.
However, mobile technology may also strengthen the relationship between offline retailers and their customers and suppliers. For example, Golden Eagle (a leading Chinese department store chain in Jiangsu) is the first department store in China to implement various mobile technology innovations: 1) real-time feedback to concessionaires on sales, margin and inventory management; 2) wireless check- out technology to reduce customer waiting time and 3) future roll-out of a mobile app to allow customers to research, pre-order and / or purchase products via smartphone for delivery or pick-up.
Exhibit 117
Golden Eagle’s SAP implementation coupled with adoption of mobile technology allows real time KPI analysis by management and suppliers to improve sales, margin and inventory management
12
Source: Golden Eagle, Morgan Stanley Research
Consumer Electronics (Most Vulnerable): Consumer electronics and home appliance categories ranked #1 and #3 in 2011 in terms of Internet retailing value, according to Euromonitor. As consumer electronics tends to be standardized merchandise with a concentrated number of
top selling brands, we believe the industry potentially is susceptible for eCommerce disruption. Our AlphaWise survey indicates that among the respondents that frequently check prices online, about 30% believe consumer electronics and home appliance categories are a lot cheaper online.
Exhibit 118
Consumer electronic and home appliances ranked #1 and #3 in terms of Internet retailing value in 2011
Internet retailing by category
-
20,000
40,000
60,000
80,000
CE
App
arel
App
lianc
es
Med
iaP
rodu
cts
Bea
uty
&H
PC
Hom
eF
urni
shin
g
Foo
d &
Drin
k
Toy
s an
dG
ames
Hea
lthca
re
Hom
eC
are
Oth
er
-0.20.40.60.81.01.21.41.61.8
2010 2011 Growth
Rmb mn % chg y/y
Source: Euromonitor Data, Morgan Stanley Research
360Buy is an example of a consumer electronics online retailer that is growing exponentially faster than offline retailers due its aggressive pricing strategy and targeted selling approach. As mentioned previously, the concentrated structure of the consumer electronics industry (offline retailers Suning and Gome dominate the market) and the cyclical nature of this industry result in a higher level of eCommerce disruption
Exhibit 119
The concentrated CE market shares of Suning and Gome accentuate the “pain” inflicted by a fast growing eCommerce player like 360Buy
Estimated revenue (online + offline) of key CE retailers
0
20
40
60
80
100
2007 2008 2009 2010 2011360Buy Gome Suning
Rmb mnCAGR (2007-2011)Suning: +22%Gome: +15%360Buy: +177%
Source: Company Data, Morgan Stanley Research
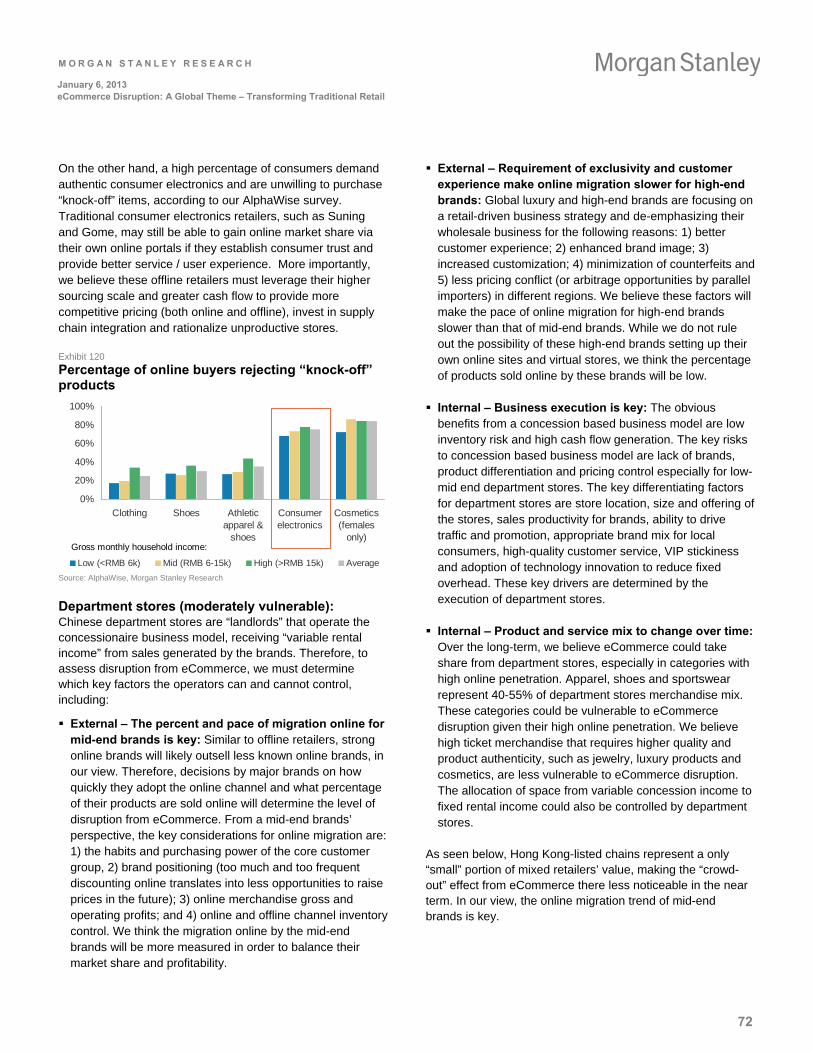
M O R G A N S T A N L E Y R E S E A R C H
72
January 6, 2013 eCommerce Disruption: A Global Theme – Transforming Traditional Retail
On the other hand, a high percentage of consumers demand authentic consumer electronics and are unwilling to purchase “knock-off” items, according to our AlphaWise survey. Traditional consumer electronics retailers, such as Suning and Gome, may still be able to gain online market share via their own online portals if they establish consumer trust and provide better service / user experience. More importantly, we believe these offline retailers must leverage their higher sourcing scale and greater cash flow to provide more competitive pricing (both online and offline), invest in supply chain integration and rationalize unproductive stores.
Exhibit 120
Percentage of online buyers rejecting “knock-off” products
0%
20%
40%
60%
80%
100%
Clothing Shoes Athleticapparel &
shoes
Consumerelectronics
Cosmetics(females
only)
Low (<RMB 6k) Mid (RMB 6-15k) High (>RMB 15k) Average
Gross monthly household income:
Source: AlphaWise, Morgan Stanley Research
Department stores (moderately vulnerable): Chinese department stores are “landlords” that operate the concessionaire business model, receiving “variable rental income” from sales generated by the brands. Therefore, to assess disruption from eCommerce, we must determine which key factors the operators can and cannot control, including:
External – The percent and pace of migration online for mid-end brands is key: Similar to offline retailers, strong online brands will likely outsell less known online brands, in our view. Therefore, decisions by major brands on how quickly they adopt the online channel and what percentage of their products are sold online will determine the level of disruption from eCommerce. From a mid-end brands’ perspective, the key considerations for online migration are: 1) the habits and purchasing power of the core customer group, 2) brand positioning (too much and too frequent discounting online translates into less opportunities to raise prices in the future); 3) online merchandise gross and operating profits; and 4) online and offline channel inventory control. We think the migration online by the mid-end brands will be more measured in order to balance their market share and profitability.
External – Requirement of exclusivity and customer experience make online migration slower for high-end brands: Global luxury and high-end brands are focusing on a retail-driven business strategy and de-emphasizing their wholesale business for the following reasons: 1) better customer experience; 2) enhanced brand image; 3) increased customization; 4) minimization of counterfeits and 5) less pricing conflict (or arbitrage opportunities by parallel importers) in different regions. We believe these factors will make the pace of online migration for high-end brands slower than that of mid-end brands. While we do not rule out the possibility of these high-end brands setting up their own online sites and virtual stores, we think the percentage of products sold online by these brands will be low.
Internal – Business execution is key: The obvious benefits from a concession based business model are low inventory risk and high cash flow generation. The key risks to concession based business model are lack of brands, product differentiation and pricing control especially for low-mid end department stores. The key differentiating factors for department stores are store location, size and offering of the stores, sales productivity for brands, ability to drive traffic and promotion, appropriate brand mix for local consumers, high-quality customer service, VIP stickiness and adoption of technology innovation to reduce fixed overhead. These key drivers are determined by the execution of department stores.
Internal – Product and service mix to change over time: Over the long-term, we believe eCommerce could take share from department stores, especially in categories with high online penetration. Apparel, shoes and sportswear represent 40-55% of department stores merchandise mix. These categories could be vulnerable to eCommerce disruption given their high online penetration. We believe high ticket merchandise that requires higher quality and product authenticity, such as jewelry, luxury products and cosmetics, are less vulnerable to eCommerce disruption. The allocation of space from variable concession income to fixed rental income could also be controlled by department stores.
As seen below, Hong Kong-listed chains represent a only “small” portion of mixed retailers’ value, making the “crowd-out” effect from eCommerce there less noticeable in the near term. In our view, the online migration trend of mid-end brands is key.
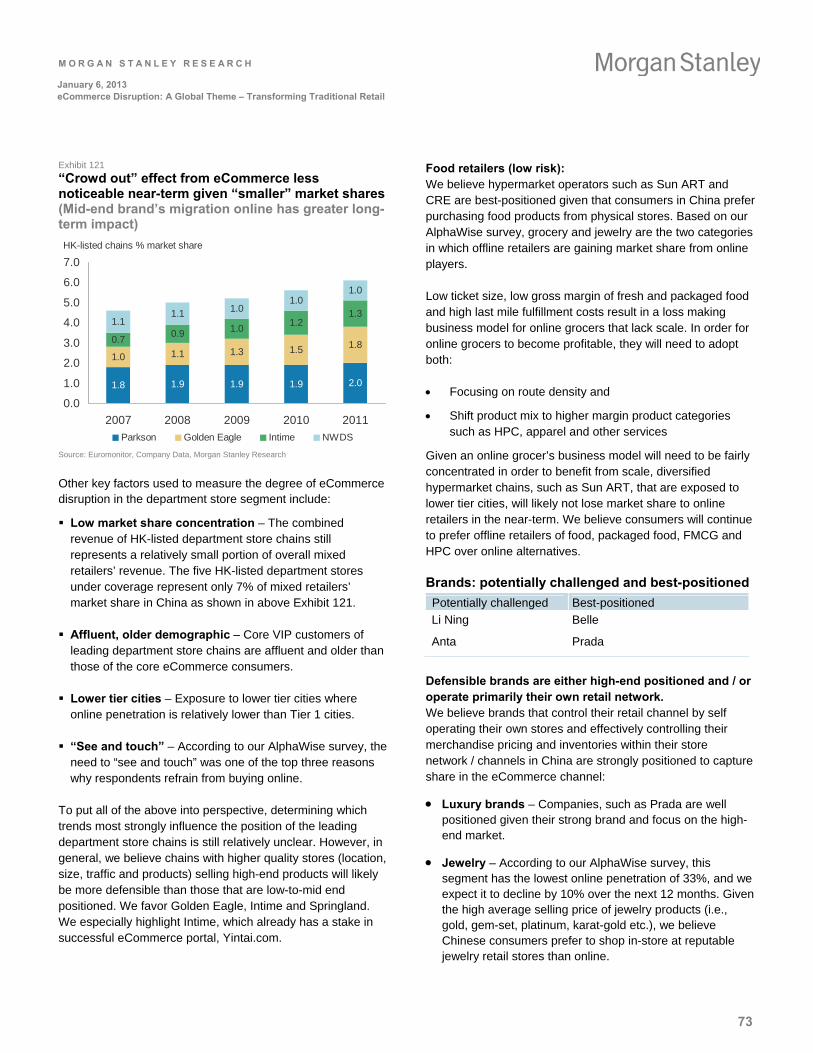
M O R G A N S T A N L E Y R E S E A R C H
73
January 6, 2013 eCommerce Disruption: A Global Theme – Transforming Traditional Retail
Exhibit 121
“Crowd out” effect from eCommerce less noticeable near-term given “smaller” market shares (Mid-end brand’s migration online has greater long-term impact)
HK-listed chains % market share
1.8 1.9 1.9 1.9 2.0
1.0 1.1 1.3 1.5 1.80.70.9 1.0
1.21.3
1.11.1 1.0
1.01.0
0.0
1.0
2.0
3.0
4.0
5.0
6.0
7.0
2007 2008 2009 2010 2011
Parkson Golden Eagle Intime NWDS
Source: Euromonitor, Company Data, Morgan Stanley Research
Other key factors used to measure the degree of eCommerce disruption in the department store segment include:
Low market share concentration – The combined revenue of HK-listed department store chains still represents a relatively small portion of overall mixed retailers’ revenue. The five HK-listed department stores under coverage represent only 7% of mixed retailers’ market share in China as shown in above Exhibit 121.
Affluent, older demographic – Core VIP customers of leading department store chains are affluent and older than those of the core eCommerce consumers.
Lower tier cities – Exposure to lower tier cities where online penetration is relatively lower than Tier 1 cities.
“See and touch” – According to our AlphaWise survey, the need to “see and touch” was one of the top three reasons why respondents refrain from buying online.
To put all of the above into perspective, determining which trends most strongly influence the position of the leading department store chains is still relatively unclear. However, in general, we believe chains with higher quality stores (location, size, traffic and products) selling high-end products will likely be more defensible than those that are low-to-mid end positioned. We favor Golden Eagle, Intime and Springland. We especially highlight Intime, which already has a stake in successful eCommerce portal, Yintai.com.
Food retailers (low risk): We believe hypermarket operators such as Sun ART and CRE are best-positioned given that consumers in China prefer purchasing food products from physical stores. Based on our AlphaWise survey, grocery and jewelry are the two categories in which offline retailers are gaining market share from online players.
Low ticket size, low gross margin of fresh and packaged food and high last mile fulfillment costs result in a loss making business model for online grocers that lack scale. In order for online grocers to become profitable, they will need to adopt both:
Focusing on route density and
Shift product mix to higher margin product categories such as HPC, apparel and other services
Given an online grocer’s business model will need to be fairly concentrated in order to benefit from scale, diversified hypermarket chains, such as Sun ART, that are exposed to lower tier cities, will likely not lose market share to online retailers in the near-term. We believe consumers will continue to prefer offline retailers of food, packaged food, FMCG and HPC over online alternatives.
Brands: potentially challenged and best-positioned
Potentially challenged Best-positioned
Li Ning
Anta
Belle
Prada
Defensible brands are either high-end positioned and / or operate primarily their own retail network. We believe brands that control their retail channel by self operating their own stores and effectively controlling their merchandise pricing and inventories within their store network / channels in China are strongly positioned to capture share in the eCommerce channel:
Luxury brands – Companies, such as Prada are well positioned given their strong brand and focus on the high-end market.
Jewelry – According to our AlphaWise survey, this segment has the lowest online penetration of 33%, and we expect it to decline by 10% over the next 12 months. Given the high average selling price of jewelry products (i.e., gold, gem-set, platinum, karat-gold etc.), we believe Chinese consumers prefer to shop in-store at reputable jewelry retail stores than online.
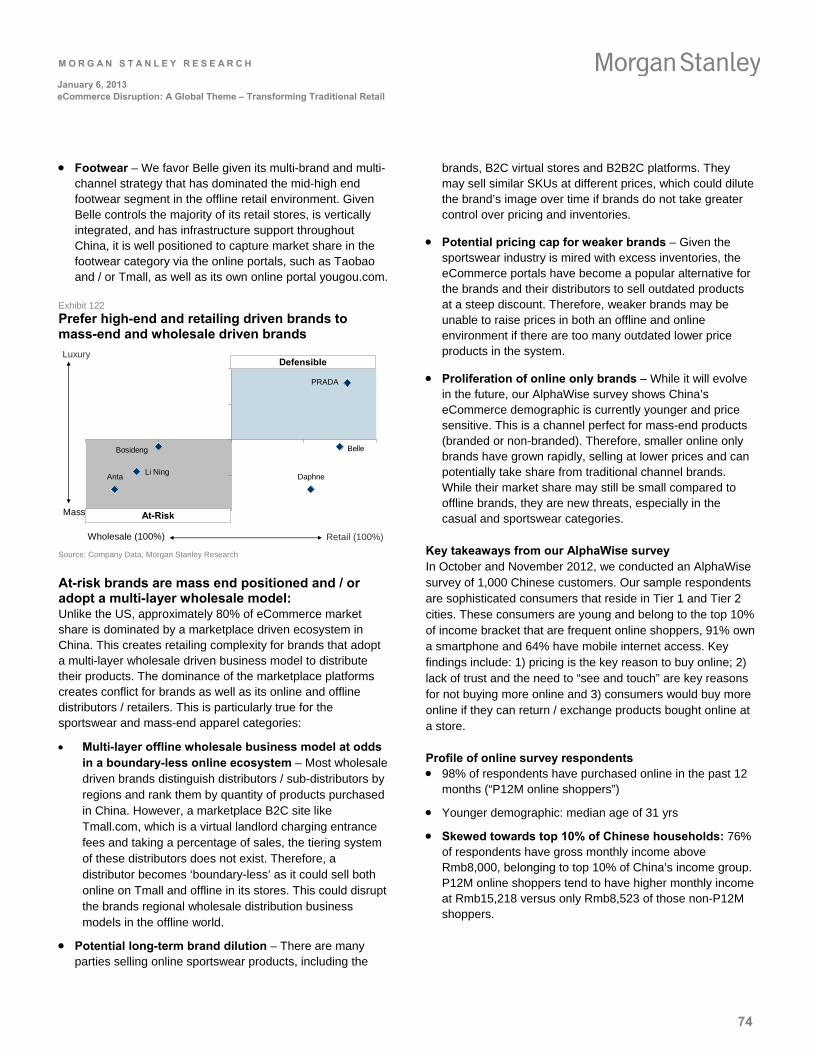
M O R G A N S T A N L E Y R E S E A R C H
74
January 6, 2013 eCommerce Disruption: A Global Theme – Transforming Traditional Retail
Footwear – We favor Belle given its multi-brand and multi-channel strategy that has dominated the mid-high end footwear segment in the offline retail environment. Given Belle controls the majority of its retail stores, is vertically integrated, and has infrastructure support throughout China, it is well positioned to capture market share in the footwear category via the online portals, such as Taobao and / or Tmall, as well as its own online portal yougou.com.
Exhibit 122
Prefer high-end and retailing driven brands to mass-end and wholesale driven brands
Luxury
Belle
Daphne
Bosideng
AntaLi Ning
PRADA
-1
-0.5
0
0.5
1
-1.0 -0.5 0.0 0.5 1.0Retail (100%)
Defensible
At-Risk
Wholesale (100%)
Mass
Source: Company Data, Morgan Stanley Research
At-risk brands are mass end positioned and / or adopt a multi-layer wholesale model: Unlike the US, approximately 80% of eCommerce market share is dominated by a marketplace driven ecosystem in China. This creates retailing complexity for brands that adopt a multi-layer wholesale driven business model to distribute their products. The dominance of the marketplace platforms creates conflict for brands as well as its online and offline distributors / retailers. This is particularly true for the sportswear and mass-end apparel categories:
Multi-layer offline wholesale business model at odds in a boundary-less online ecosystem – Most wholesale driven brands distinguish distributors / sub-distributors by regions and rank them by quantity of products purchased in China. However, a marketplace B2C site like Tmall.com, which is a virtual landlord charging entrance fees and taking a percentage of sales, the tiering system of these distributors does not exist. Therefore, a distributor becomes ‘boundary-less’ as it could sell both online on Tmall and offline in its stores. This could disrupt the brands regional wholesale distribution business models in the offline world.
Potential long-term brand dilution – There are many parties selling online sportswear products, including the
brands, B2C virtual stores and B2B2C platforms. They may sell similar SKUs at different prices, which could dilute the brand’s image over time if brands do not take greater control over pricing and inventories.
Potential pricing cap for weaker brands – Given the sportswear industry is mired with excess inventories, the eCommerce portals have become a popular alternative for the brands and their distributors to sell outdated products at a steep discount. Therefore, weaker brands may be unable to raise prices in both an offline and online environment if there are too many outdated lower price products in the system.
Proliferation of online only brands – While it will evolve in the future, our AlphaWise survey shows China’s eCommerce demographic is currently younger and price sensitive. This is a channel perfect for mass-end products (branded or non-branded). Therefore, smaller online only brands have grown rapidly, selling at lower prices and can potentially take share from traditional channel brands. While their market share may still be small compared to offline brands, they are new threats, especially in the casual and sportswear categories.
Key takeaways from our AlphaWise survey In October and November 2012, we conducted an AlphaWise survey of 1,000 Chinese customers. Our sample respondents are sophisticated consumers that reside in Tier 1 and Tier 2 cities. These consumers are young and belong to the top 10% of income bracket that are frequent online shoppers, 91% own a smartphone and 64% have mobile internet access. Key findings include: 1) pricing is the key reason to buy online; 2) lack of trust and the need to “see and touch” are key reasons for not buying more online and 3) consumers would buy more online if they can return / exchange products bought online at a store.
Profile of online survey respondents 98% of respondents have purchased online in the past 12
months (“P12M online shoppers”)
Younger demographic: median age of 31 yrs
Skewed towards top 10% of Chinese households: 76% of respondents have gross monthly income above Rmb8,000, belonging to top 10% of China’s income group. P12M online shoppers tend to have higher monthly income at Rmb15,218 versus only Rmb8,523 of those non-P12M shoppers.
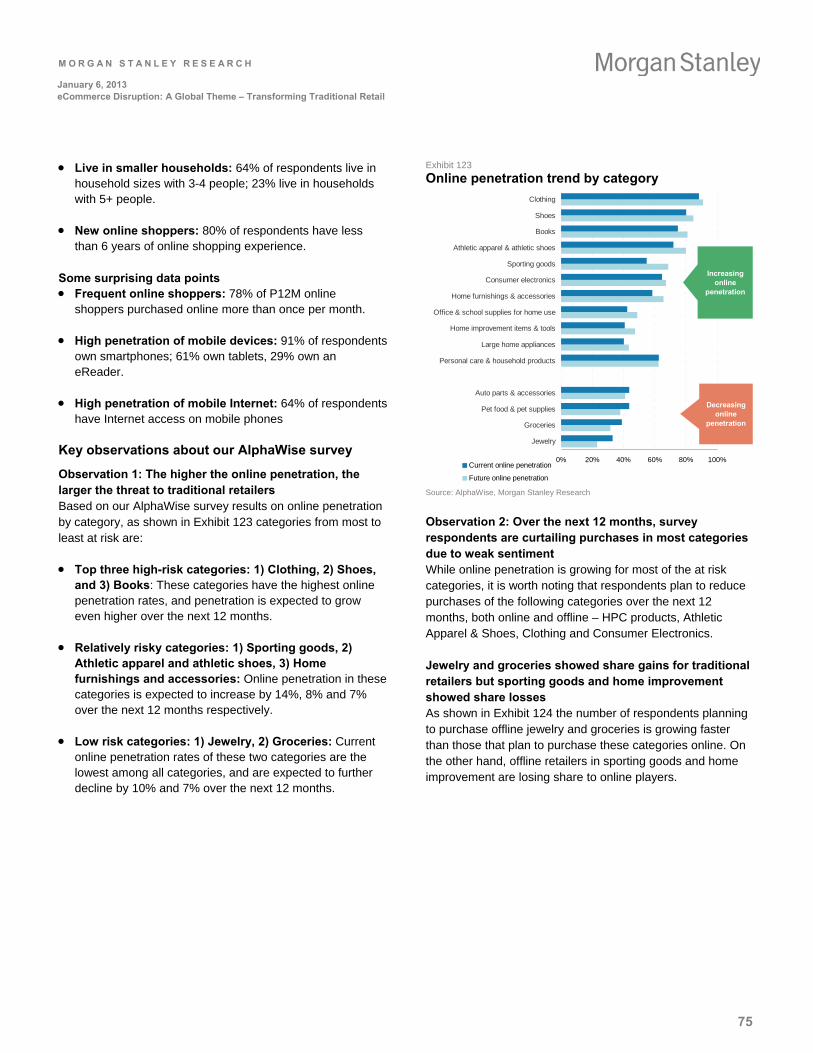
M O R G A N S T A N L E Y R E S E A R C H
75
January 6, 2013 eCommerce Disruption: A Global Theme – Transforming Traditional Retail
Live in smaller households: 64% of respondents live in household sizes with 3-4 people; 23% live in households with 5+ people.
New online shoppers: 80% of respondents have less than 6 years of online shopping experience.
Some surprising data points Frequent online shoppers: 78% of P12M online
shoppers purchased online more than once per month.
High penetration of mobile devices: 91% of respondents own smartphones; 61% own tablets, 29% own an eReader.
High penetration of mobile Internet: 64% of respondents have Internet access on mobile phones
Key observations about our AlphaWise survey
Observation 1: The higher the online penetration, the larger the threat to traditional retailers Based on our AlphaWise survey results on online penetration by category, as shown in Exhibit 123 categories from most to least at risk are:
Top three high-risk categories: 1) Clothing, 2) Shoes, and 3) Books: These categories have the highest online penetration rates, and penetration is expected to grow even higher over the next 12 months.
Relatively risky categories: 1) Sporting goods, 2) Athletic apparel and athletic shoes, 3) Home furnishings and accessories: Online penetration in these categories is expected to increase by 14%, 8% and 7% over the next 12 months respectively.
Low risk categories: 1) Jewelry, 2) Groceries: Current online penetration rates of these two categories are the lowest among all categories, and are expected to further decline by 10% and 7% over the next 12 months.
Exhibit 123
Online penetration trend by category
0% 20% 40% 60% 80% 100%
Jewelry
Groceries
Pet food & pet supplies
Auto parts & accessories
Personal care & household products
Large home appliances
Home improvement items & tools
Office & school supplies for home use
Home furnishings & accessories
Consumer electronics
Sporting goods
Athletic apparel & athletic shoes
Books
Shoes
Clothing
Current online penetration
Future online penetration
Increasing online
penetration
Decreasing online
penetration
Source: AlphaWise, Morgan Stanley Research
Observation 2: Over the next 12 months, survey respondents are curtailing purchases in most categories due to weak sentiment While online penetration is growing for most of the at risk categories, it is worth noting that respondents plan to reduce purchases of the following categories over the next 12 months, both online and offline – HPC products, Athletic Apparel & Shoes, Clothing and Consumer Electronics.
Jewelry and groceries showed share gains for traditional retailers but sporting goods and home improvement showed share losses As shown in Exhibit 124 the number of respondents planning to purchase offline jewelry and groceries is growing faster than those that plan to purchase these categories online. On the other hand, offline retailers in sporting goods and home improvement are losing share to online players.
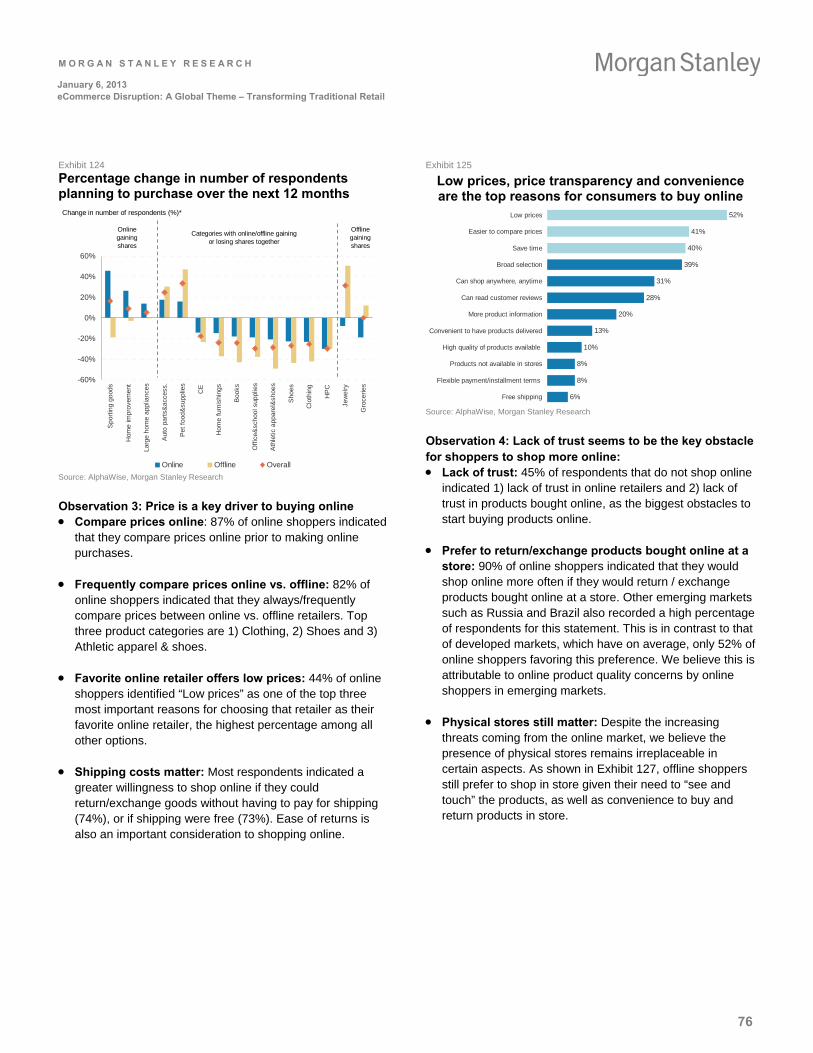
M O R G A N S T A N L E Y R E S E A R C H
76
January 6, 2013 eCommerce Disruption: A Global Theme – Transforming Traditional Retail
Exhibit 124
Percentage change in number of respondents planning to purchase over the next 12 months
-60%
-40%
-20%
0%
20%
40%
60%
Spo
rtin
g go
ods
Hom
e im
prov
emen
t
Larg
e ho
me
appl
ianc
es
Aut
o pa
rts&
acce
ss.
Pet
foo
d&su
pplie
s
CE
Hom
e fu
rnis
hing
s
Boo
ks
Off
ice&
scho
ol s
uppl
ies
Ath
letic
app
arel
&sh
oes
Sho
es
Clo
thin
g
HP
C
Jew
elry
Gro
cerie
s
Online Offline Overall
Online gaining shares
Offline gaining shares
Categories with online/offline gainingor losing shares together
Change in number of respondents (%)*
Source: AlphaWise, Morgan Stanley Research
Observation 3: Price is a key driver to buying online Compare prices online: 87% of online shoppers indicated
that they compare prices online prior to making online purchases.
Frequently compare prices online vs. offline: 82% of online shoppers indicated that they always/frequently compare prices between online vs. offline retailers. Top three product categories are 1) Clothing, 2) Shoes and 3) Athletic apparel & shoes.
Favorite online retailer offers low prices: 44% of online shoppers identified “Low prices” as one of the top three most important reasons for choosing that retailer as their favorite online retailer, the highest percentage among all other options.
Shipping costs matter: Most respondents indicated a greater willingness to shop online if they could return/exchange goods without having to pay for shipping (74%), or if shipping were free (73%). Ease of returns is also an important consideration to shopping online.
Exhibit 125
Low prices, price transparency and convenience are the top reasons for consumers to buy online
52%
41%
40%
39%
31%
28%
20%
13%
10%
8%
8%
6%
Low prices
Easier to compare prices
Save time
Broad selection
Can shop anywhere, anytime
Can read customer reviews
More product information
Convenient to have products delivered
High quality of products available
Products not available in stores
Flexible payment/installment terms
Free shipping
Source: AlphaWise, Morgan Stanley Research
Observation 4: Lack of trust seems to be the key obstacle for shoppers to shop more online: Lack of trust: 45% of respondents that do not shop online
indicated 1) lack of trust in online retailers and 2) lack of trust in products bought online, as the biggest obstacles to start buying products online.
Prefer to return/exchange products bought online at a store: 90% of online shoppers indicated that they would shop online more often if they would return / exchange products bought online at a store. Other emerging markets such as Russia and Brazil also recorded a high percentage of respondents for this statement. This is in contrast to that of developed markets, which have on average, only 52% of online shoppers favoring this preference. We believe this is attributable to online product quality concerns by online shoppers in emerging markets.
Physical stores still matter: Despite the increasing threats coming from the online market, we believe the presence of physical stores remains irreplaceable in certain aspects. As shown in Exhibit 127, offline shoppers still prefer to shop in store given their need to “see and touch” the products, as well as convenience to buy and return products in store.
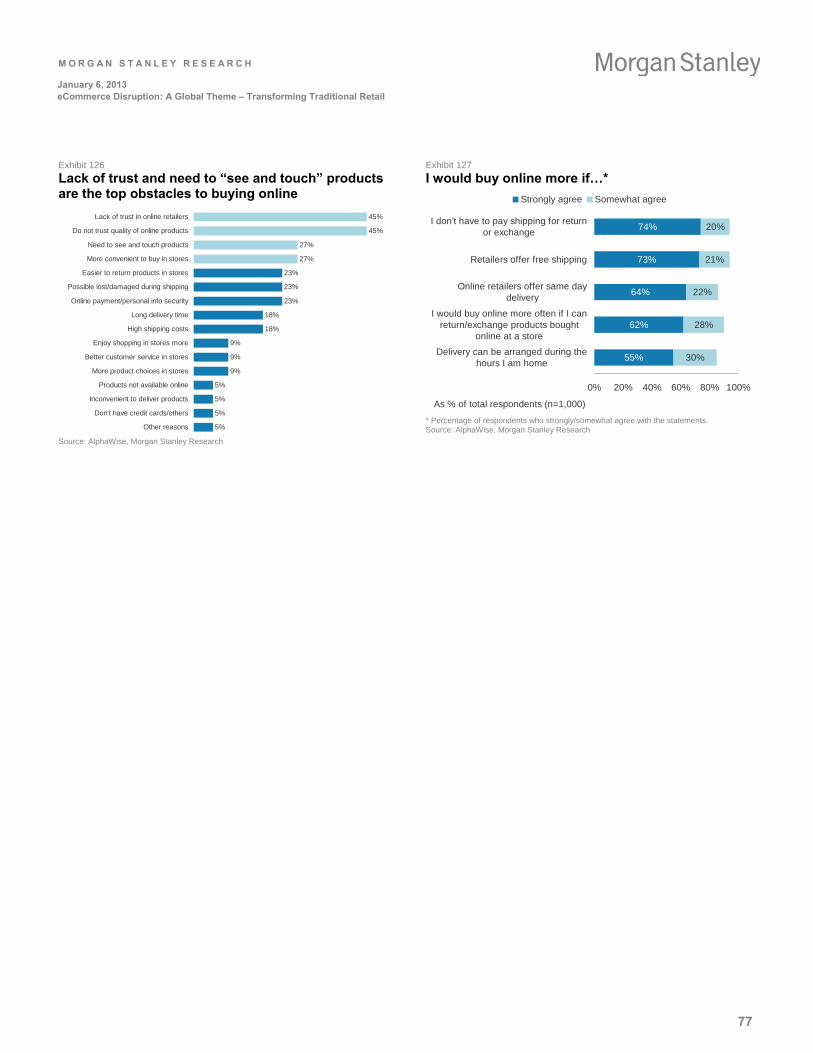
M O R G A N S T A N L E Y R E S E A R C H
77
January 6, 2013 eCommerce Disruption: A Global Theme – Transforming Traditional Retail
Exhibit 126
Lack of trust and need to “see and touch” products are the top obstacles to buying online
45%
45%
27%
27%
23%
23%
23%
18%
18%
9%
9%
9%
5%
5%
5%
5%
Lack of trust in online retailers
Do not trust quality of online products
Need to see and touch products
More convenient to buy in stores
Easier to return products in stores
Possible lost/damaged during shipping
Online payment/personal info security
Long delivery time
High shipping costs
Enjoy shopping in stores more
Better customer service in stores
More product choices in stores
Products not available online
Inconvenient to deliver products
Don't have credit cards/others
Other reasons Source: AlphaWise, Morgan Stanley Research
Exhibit 127
I would buy online more if…*
55%
62%
64%
73%
74%
30%
28%
22%
21%
20%
0% 20% 40% 60% 80% 100%
Delivery can be arranged during thehours I am home
I would buy online more often if I canreturn/exchange products bought
online at a store
Online retailers offer same daydelivery
Retailers offer free shipping
I don't have to pay shipping for returnor exchange
As % of total respondents (n=1,000)
Strongly agree Somewhat agree
* Percentage of respondents who strongly/somewhat agree with the statements. Source: AlphaWise, Morgan Stanley Research
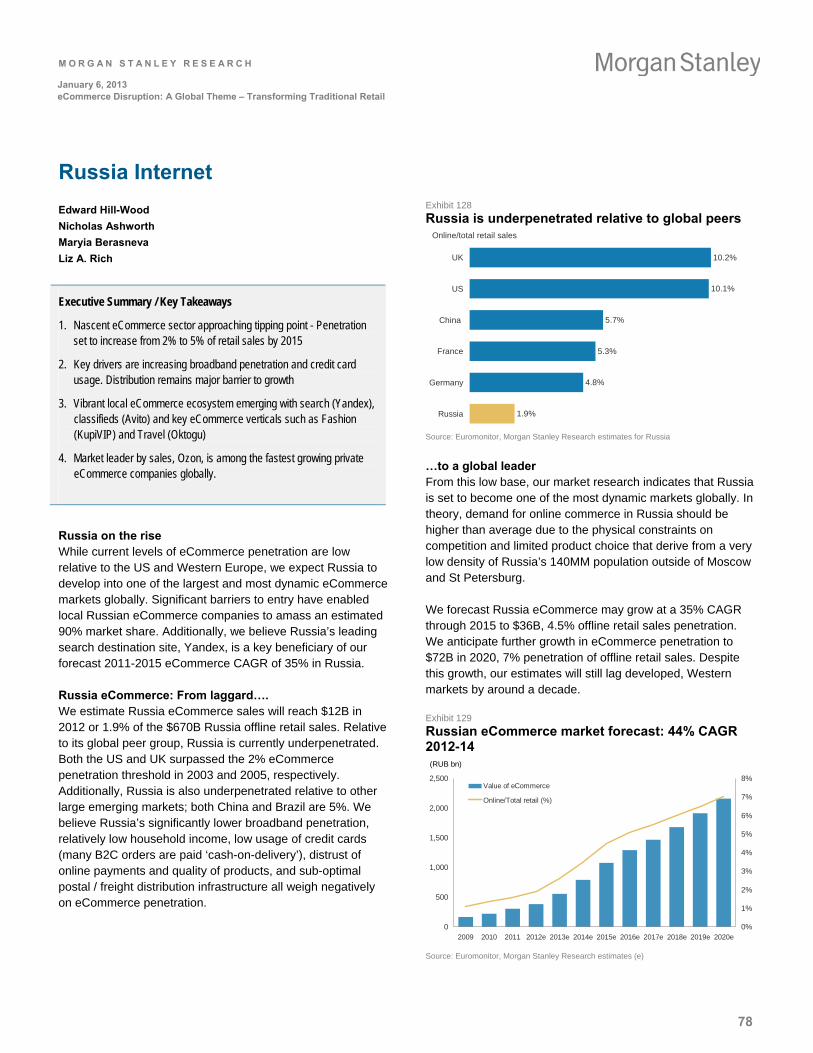
M O R G A N S T A N L E Y R E S E A R C H
78
January 6, 2013 eCommerce Disruption: A Global Theme – Transforming Traditional Retail
Russia Internet
Edward Hill-Wood
Nicholas Ashworth
Maryia Berasneva
Liz A. Rich
Executive Summary / Key Takeaways
1. Nascent eCommerce sector approaching tipping point - Penetration set to increase from 2% to 5% of retail sales by 2015
2. Key drivers are increasing broadband penetration and credit card usage. Distribution remains major barrier to growth
3. Vibrant local eCommerce ecosystem emerging with search (Yandex), classifieds (Avito) and key eCommerce verticals such as Fashion (KupiVIP) and Travel (Oktogu)
4. Market leader by sales, Ozon, is among the fastest growing private eCommerce companies globally.
Russia on the rise While current levels of eCommerce penetration are low relative to the US and Western Europe, we expect Russia to develop into one of the largest and most dynamic eCommerce markets globally. Significant barriers to entry have enabled local Russian eCommerce companies to amass an estimated 90% market share. Additionally, we believe Russia’s leading search destination site, Yandex, is a key beneficiary of our forecast 2011-2015 eCommerce CAGR of 35% in Russia.
Russia eCommerce: From laggard…. We estimate Russia eCommerce sales will reach $12B in 2012 or 1.9% of the $670B Russia offline retail sales. Relative to its global peer group, Russia is currently underpenetrated. Both the US and UK surpassed the 2% eCommerce penetration threshold in 2003 and 2005, respectively. Additionally, Russia is also underpenetrated relative to other large emerging markets; both China and Brazil are 5%. We believe Russia’s significantly lower broadband penetration, relatively low household income, low usage of credit cards (many B2C orders are paid ‘cash-on-delivery’), distrust of online payments and quality of products, and sub-optimal postal / freight distribution infrastructure all weigh negatively on eCommerce penetration.
Exhibit 128
Russia is underpenetrated relative to global peers Online/total retail sales
10.2%
10.1%
5.7%
5.3%
4.8%
1.9%
UK
US
China
France
Germany
Russia
Source: Euromonitor, Morgan Stanley Research estimates for Russia
…to a global leader From this low base, our market research indicates that Russia is set to become one of the most dynamic markets globally. In theory, demand for online commerce in Russia should be higher than average due to the physical constraints on competition and limited product choice that derive from a very low density of Russia’s 140MM population outside of Moscow and St Petersburg.
We forecast Russia eCommerce may grow at a 35% CAGR through 2015 to $36B, 4.5% offline retail sales penetration. We anticipate further growth in eCommerce penetration to $72B in 2020, 7% penetration of offline retail sales. Despite this growth, our estimates will still lag developed, Western markets by around a decade.
Exhibit 129
Russian eCommerce market forecast: 44% CAGR 2012-14
0
500
1,000
1,500
2,000
2,500
2009 2010 2011 2012e 2013e 2014e 2015e 2016e 2017e 2018e 2019e 2020e0%
1%
2%
3%
4%
5%
6%
7%
8%Value of eCommerce
Online/Total retail (%)
(RUB bn)
Source: Euromonitor, Morgan Stanley Research estimates (e)
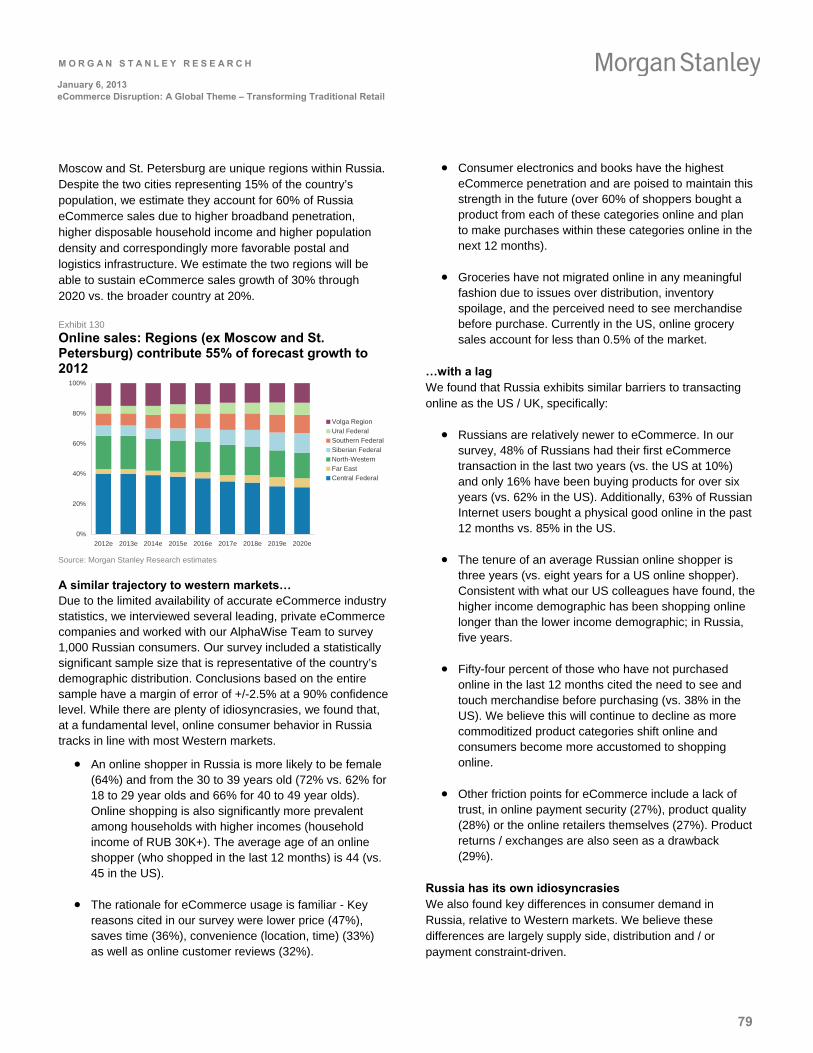
M O R G A N S T A N L E Y R E S E A R C H
79
January 6, 2013 eCommerce Disruption: A Global Theme – Transforming Traditional Retail
Moscow and St. Petersburg are unique regions within Russia. Despite the two cities representing 15% of the country’s population, we estimate they account for 60% of Russia eCommerce sales due to higher broadband penetration, higher disposable household income and higher population density and correspondingly more favorable postal and logistics infrastructure. We estimate the two regions will be able to sustain eCommerce sales growth of 30% through 2020 vs. the broader country at 20%.
Exhibit 130
Online sales: Regions (ex Moscow and St. Petersburg) contribute 55% of forecast growth to 2012
0%
20%
40%
60%
80%
100%
2012e 2013e 2014e 2015e 2016e 2017e 2018e 2019e 2020e
Volga Region
Ural Federal
Southern Federal
Siberian Federal
North-Western
Far East
Central Federal
Source: Morgan Stanley Research estimates
A similar trajectory to western markets… Due to the limited availability of accurate eCommerce industry statistics, we interviewed several leading, private eCommerce companies and worked with our AlphaWise Team to survey 1,000 Russian consumers. Our survey included a statistically significant sample size that is representative of the country’s demographic distribution. Conclusions based on the entire sample have a margin of error of +/-2.5% at a 90% confidence level. While there are plenty of idiosyncrasies, we found that, at a fundamental level, online consumer behavior in Russia tracks in line with most Western markets.
An online shopper in Russia is more likely to be female (64%) and from the 30 to 39 years old (72% vs. 62% for 18 to 29 year olds and 66% for 40 to 49 year olds). Online shopping is also significantly more prevalent among households with higher incomes (household income of RUB 30K+). The average age of an online shopper (who shopped in the last 12 months) is 44 (vs. 45 in the US).
The rationale for eCommerce usage is familiar - Key reasons cited in our survey were lower price (47%), saves time (36%), convenience (location, time) (33%) as well as online customer reviews (32%).
Consumer electronics and books have the highest eCommerce penetration and are poised to maintain this strength in the future (over 60% of shoppers bought a product from each of these categories online and plan to make purchases within these categories online in the next 12 months).
Groceries have not migrated online in any meaningful fashion due to issues over distribution, inventory spoilage, and the perceived need to see merchandise before purchase. Currently in the US, online grocery sales account for less than 0.5% of the market.
…with a lag We found that Russia exhibits similar barriers to transacting online as the US / UK, specifically:
Russians are relatively newer to eCommerce. In our survey, 48% of Russians had their first eCommerce transaction in the last two years (vs. the US at 10%) and only 16% have been buying products for over six years (vs. 62% in the US). Additionally, 63% of Russian Internet users bought a physical good online in the past 12 months vs. 85% in the US.
The tenure of an average Russian online shopper is three years (vs. eight years for a US online shopper). Consistent with what our US colleagues have found, the higher income demographic has been shopping online longer than the lower income demographic; in Russia, five years.
Fifty-four percent of those who have not purchased online in the last 12 months cited the need to see and touch merchandise before purchasing (vs. 38% in the US). We believe this will continue to decline as more commoditized product categories shift online and consumers become more accustomed to shopping online.
Other friction points for eCommerce include a lack of trust, in online payment security (27%), product quality (28%) or the online retailers themselves (27%). Product returns / exchanges are also seen as a drawback (29%).
Russia has its own idiosyncrasies We also found key differences in consumer demand in Russia, relative to Western markets. We believe these differences are largely supply side, distribution and / or payment constraint-driven.
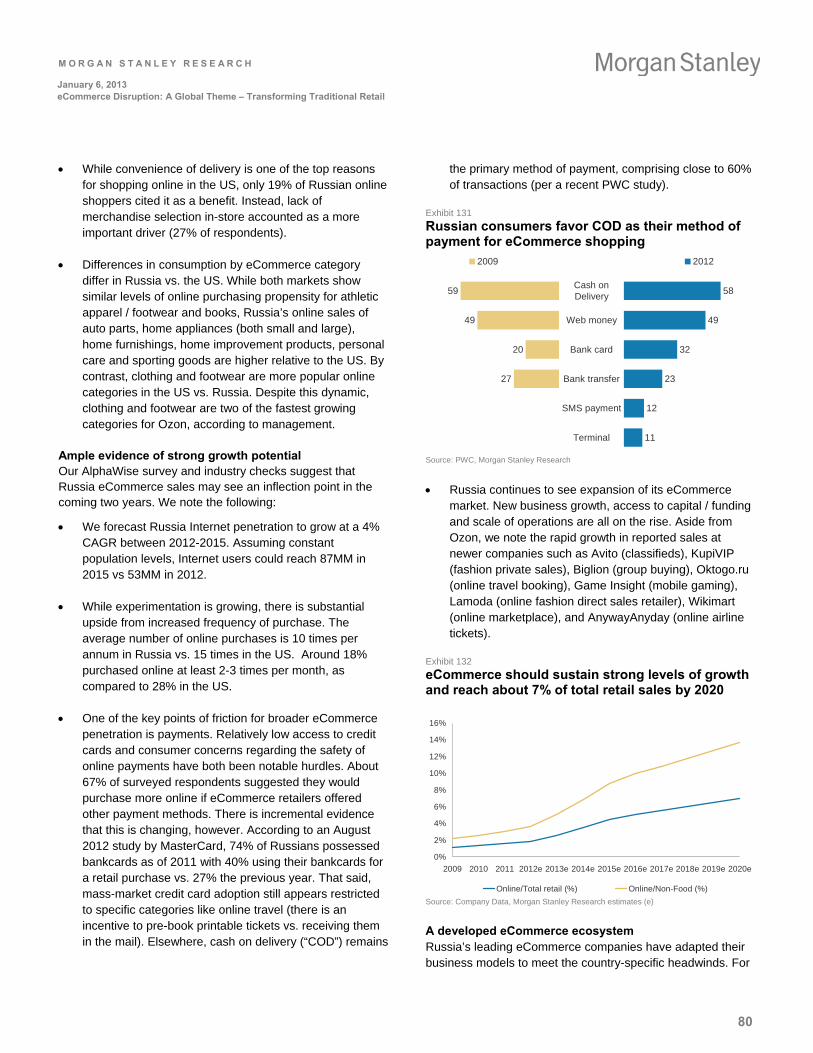
M O R G A N S T A N L E Y R E S E A R C H
80
January 6, 2013 eCommerce Disruption: A Global Theme – Transforming Traditional Retail
While convenience of delivery is one of the top reasons for shopping online in the US, only 19% of Russian online shoppers cited it as a benefit. Instead, lack of merchandise selection in-store accounted as a more important driver (27% of respondents).
Differences in consumption by eCommerce category differ in Russia vs. the US. While both markets show similar levels of online purchasing propensity for athletic apparel / footwear and books, Russia’s online sales of auto parts, home appliances (both small and large), home furnishings, home improvement products, personal care and sporting goods are higher relative to the US. By contrast, clothing and footwear are more popular online categories in the US vs. Russia. Despite this dynamic, clothing and footwear are two of the fastest growing categories for Ozon, according to management.
Ample evidence of strong growth potential Our AlphaWise survey and industry checks suggest that Russia eCommerce sales may see an inflection point in the coming two years. We note the following:
We forecast Russia Internet penetration to grow at a 4% CAGR between 2012-2015. Assuming constant population levels, Internet users could reach 87MM in 2015 vs 53MM in 2012.
While experimentation is growing, there is substantial upside from increased frequency of purchase. The average number of online purchases is 10 times per annum in Russia vs. 15 times in the US. Around 18% purchased online at least 2-3 times per month, as compared to 28% in the US.
One of the key points of friction for broader eCommerce penetration is payments. Relatively low access to credit cards and consumer concerns regarding the safety of online payments have both been notable hurdles. About 67% of surveyed respondents suggested they would purchase more online if eCommerce retailers offered other payment methods. There is incremental evidence that this is changing, however. According to an August 2012 study by MasterCard, 74% of Russians possessed bankcards as of 2011 with 40% using their bankcards for a retail purchase vs. 27% the previous year. That said, mass-market credit card adoption still appears restricted to specific categories like online travel (there is an incentive to pre-book printable tickets vs. receiving them in the mail). Elsewhere, cash on delivery (“COD”) remains
the primary method of payment, comprising close to 60% of transactions (per a recent PWC study).
Exhibit 131
Russian consumers favor COD as their method of payment for eCommerce shopping
0
0
27
20
49
59
Terminal
SMS payment
Bank transfer
Bank card
Web money
Cash on Delivery
11
12
23
32
49
58
2009 2012
Source: PWC, Morgan Stanley Research
Russia continues to see expansion of its eCommerce market. New business growth, access to capital / funding and scale of operations are all on the rise. Aside from Ozon, we note the rapid growth in reported sales at newer companies such as Avito (classifieds), KupiVIP (fashion private sales), Biglion (group buying), Oktogo.ru (online travel booking), Game Insight (mobile gaming), Lamoda (online fashion direct sales retailer), Wikimart (online marketplace), and AnywayAnyday (online airline tickets).
Exhibit 132
eCommerce should sustain strong levels of growth and reach about 7% of total retail sales by 2020
0%
2%
4%
6%
8%
10%
12%
14%
16%
2009 2010 2011 2012e 2013e 2014e 2015e 2016e 2017e 2018e 2019e 2020e
Online/Total retail (%) Online/Non-Food (%) Source: Company Data, Morgan Stanley Research estimates (e)
A developed eCommerce ecosystem Russia’s leading eCommerce companies have adapted their business models to meet the country-specific headwinds. For
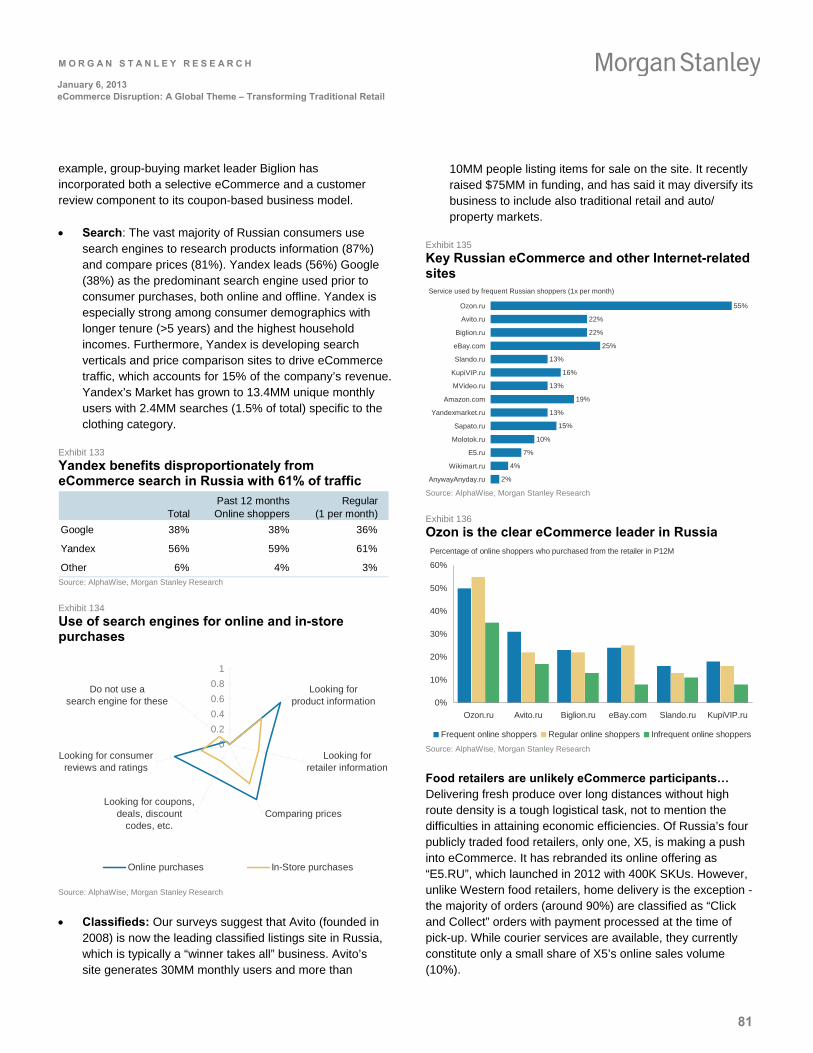
M O R G A N S T A N L E Y R E S E A R C H
81
January 6, 2013 eCommerce Disruption: A Global Theme – Transforming Traditional Retail
example, group-buying market leader Biglion has incorporated both a selective eCommerce and a customer review component to its coupon-based business model.
Search: The vast majority of Russian consumers use search engines to research products information (87%) and compare prices (81%). Yandex leads (56%) Google (38%) as the predominant search engine used prior to consumer purchases, both online and offline. Yandex is especially strong among consumer demographics with longer tenure (>5 years) and the highest household incomes. Furthermore, Yandex is developing search verticals and price comparison sites to drive eCommerce traffic, which accounts for 15% of the company’s revenue. Yandex’s Market has grown to 13.4MM unique monthly users with 2.4MM searches (1.5% of total) specific to the clothing category.
Exhibit 133
Yandex benefits disproportionately from eCommerce search in Russia with 61% of traffic
TotalPast 12 months Online shoppers
Regular(1 per month)
Google 38% 38% 36%
Yandex 56% 59% 61%
Other 6% 4% 3% Source: AlphaWise, Morgan Stanley Research
Exhibit 134
Use of search engines for online and in-store purchases
0
0.2
0.4
0.6
0.8
1
Looking forproduct information
Looking forretailer information
Comparing pricesLooking for coupons,
deals, discountcodes, etc.
Looking for consumerreviews and ratings
Do not use asearch engine for these
Online purchases In-Store purchases
Source: AlphaWise, Morgan Stanley Research
Classifieds: Our surveys suggest that Avito (founded in 2008) is now the leading classified listings site in Russia, which is typically a “winner takes all” business. Avito’s site generates 30MM monthly users and more than
10MM people listing items for sale on the site. It recently raised $75MM in funding, and has said it may diversify its business to include also traditional retail and auto/ property markets.
Exhibit 135
Key Russian eCommerce and other Internet-related sites Service used by frequent Russian shoppers (1x per month)
55%
22%
22%
25%
13%
16%
13%
19%
13%
15%
10%
7%
4%
2%
Ozon.ru
Avito.ru
Biglion.ru
eBay.com
Slando.ru
KupiVIP.ru
MVideo.ru
Amazon.com
Yandexmarket.ru
Sapato.ru
Molotok.ru
E5.ru
Wikimart.ru
AnywayAnyday.ru Source: AlphaWise, Morgan Stanley Research
Exhibit 136
Ozon is the clear eCommerce leader in Russia Percentage of online shoppers who purchased from the retailer in P12M
0%
10%
20%
30%
40%
50%
60%
Ozon.ru Avito.ru Biglion.ru eBay.com Slando.ru KupiVIP.ru
Frequent online shoppers Regular online shoppers Infrequent online shoppers Source: AlphaWise, Morgan Stanley Research
Food retailers are unlikely eCommerce participants… Delivering fresh produce over long distances without high route density is a tough logistical task, not to mention the difficulties in attaining economic efficiencies. Of Russia’s four publicly traded food retailers, only one, X5, is making a push into eCommerce. It has rebranded its online offering as “E5.RU”, which launched in 2012 with 400K SKUs. However, unlike Western food retailers, home delivery is the exception - the majority of orders (around 90%) are classified as “Click and Collect” orders with payment processed at the time of pick-up. While courier services are available, they currently constitute only a small share of X5’s online sales volume (10%).
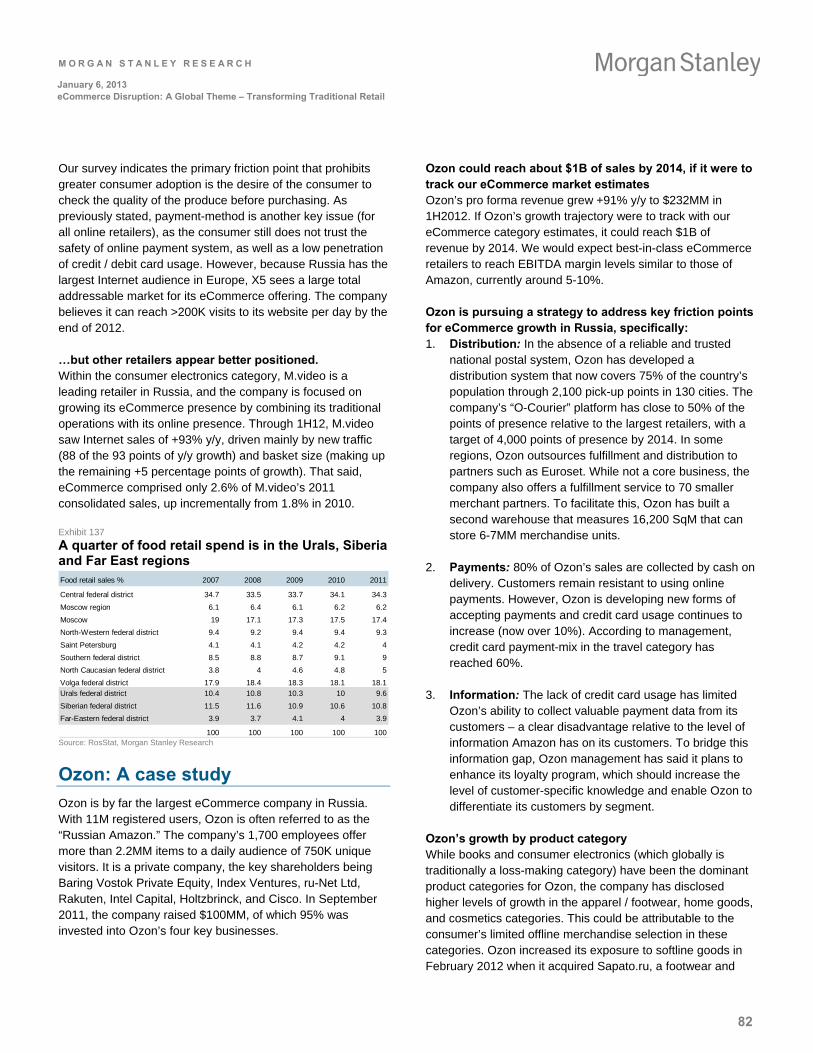
M O R G A N S T A N L E Y R E S E A R C H
82
January 6, 2013 eCommerce Disruption: A Global Theme – Transforming Traditional Retail
Our survey indicates the primary friction point that prohibits greater consumer adoption is the desire of the consumer to check the quality of the produce before purchasing. As previously stated, payment-method is another key issue (for all online retailers), as the consumer still does not trust the safety of online payment system, as well as a low penetration of credit / debit card usage. However, because Russia has the largest Internet audience in Europe, X5 sees a large total addressable market for its eCommerce offering. The company believes it can reach >200K visits to its website per day by the end of 2012.
…but other retailers appear better positioned. Within the consumer electronics category, M.video is a leading retailer in Russia, and the company is focused on growing its eCommerce presence by combining its traditional operations with its online presence. Through 1H12, M.video saw Internet sales of +93% y/y, driven mainly by new traffic (88 of the 93 points of y/y growth) and basket size (making up the remaining +5 percentage points of growth). That said, eCommerce comprised only 2.6% of M.video’s 2011 consolidated sales, up incrementally from 1.8% in 2010.
Exhibit 137
A quarter of food retail spend is in the Urals, Siberia and Far East regions Food retail sales % 2007 2008 2009 2010 2011
Central federal district 34.7 33.5 33.7 34.1 34.3
Moscow region 6.1 6.4 6.1 6.2 6.2
Moscow 19 17.1 17.3 17.5 17.4
North-Western federal district 9.4 9.2 9.4 9.4 9.3
Saint Petersburg 4.1 4.1 4.2 4.2 4
Southern federal district 8.5 8.8 8.7 9.1 9
North Caucasian federal district 3.8 4 4.6 4.8 5
Volga federal district 17.9 18.4 18.3 18.1 18.1Urals federal district 10.4 10.8 10.3 10 9.6
Siberian federal district 11.5 11.6 10.9 10.6 10.8
Far-Eastern federal district 3.9 3.7 4.1 4 3.9
100 100 100 100 100 Source: RosStat, Morgan Stanley Research
Ozon: A case study
Ozon is by far the largest eCommerce company in Russia. With 11M registered users, Ozon is often referred to as the “Russian Amazon.” The company’s 1,700 employees offer more than 2.2MM items to a daily audience of 750K unique visitors. It is a private company, the key shareholders being Baring Vostok Private Equity, Index Ventures, ru-Net Ltd, Rakuten, Intel Capital, Holtzbrinck, and Cisco. In September 2011, the company raised $100MM, of which 95% was invested into Ozon’s four key businesses.
Ozon could reach about $1B of sales by 2014, if it were to track our eCommerce market estimates Ozon’s pro forma revenue grew +91% y/y to $232MM in 1H2012. If Ozon’s growth trajectory were to track with our eCommerce category estimates, it could reach $1B of revenue by 2014. We would expect best-in-class eCommerce retailers to reach EBITDA margin levels similar to those of Amazon, currently around 5-10%.
Ozon is pursuing a strategy to address key friction points for eCommerce growth in Russia, specifically: 1. Distribution: In the absence of a reliable and trusted
national postal system, Ozon has developed a distribution system that now covers 75% of the country’s population through 2,100 pick-up points in 130 cities. The company’s “O-Courier” platform has close to 50% of the points of presence relative to the largest retailers, with a target of 4,000 points of presence by 2014. In some regions, Ozon outsources fulfillment and distribution to partners such as Euroset. While not a core business, the company also offers a fulfillment service to 70 smaller merchant partners. To facilitate this, Ozon has built a second warehouse that measures 16,200 SqM that can store 6-7MM merchandise units.
2. Payments: 80% of Ozon’s sales are collected by cash on delivery. Customers remain resistant to using online payments. However, Ozon is developing new forms of accepting payments and credit card usage continues to increase (now over 10%). According to management, credit card payment-mix in the travel category has reached 60%.
3. Information: The lack of credit card usage has limited Ozon’s ability to collect valuable payment data from its customers – a clear disadvantage relative to the level of information Amazon has on its customers. To bridge this information gap, Ozon management has said it plans to enhance its loyalty program, which should increase the level of customer-specific knowledge and enable Ozon to differentiate its customers by segment.
Ozon’s growth by product category While books and consumer electronics (which globally is traditionally a loss-making category) have been the dominant product categories for Ozon, the company has disclosed higher levels of growth in the apparel / footwear, home goods, and cosmetics categories. This could be attributable to the consumer’s limited offline merchandise selection in these categories. Ozon increased its exposure to softline goods in February 2012 when it acquired Sapato.ru, a footwear and
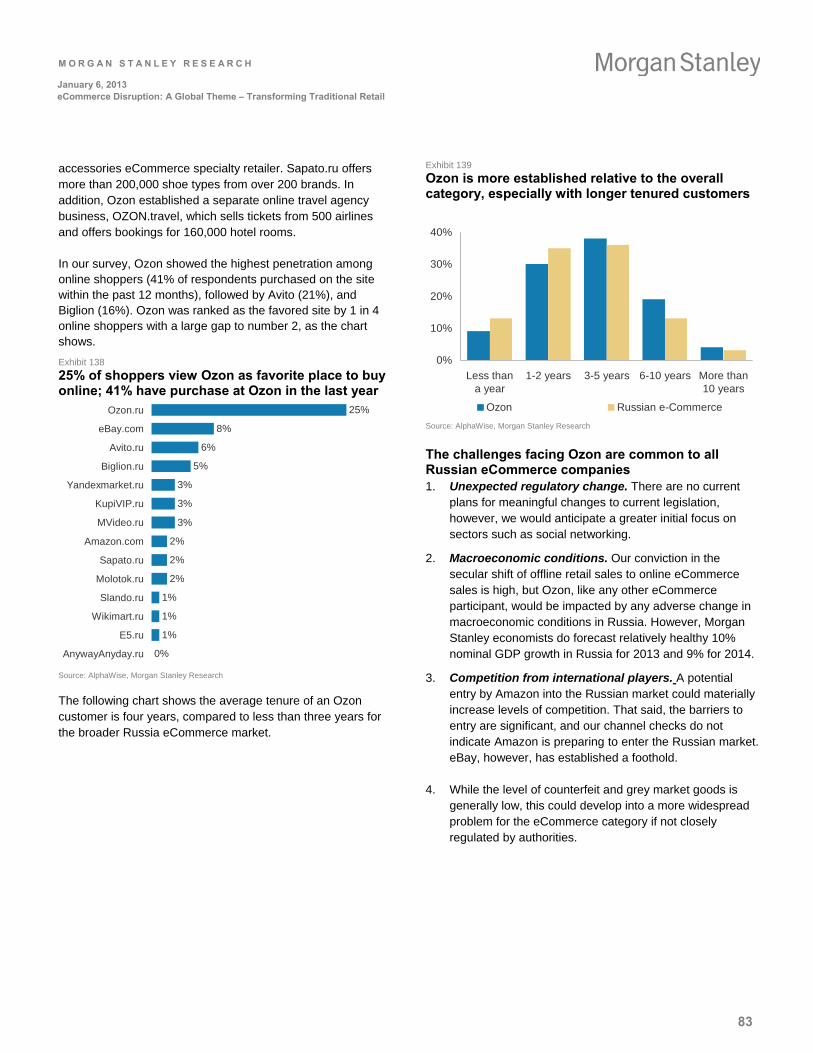
M O R G A N S T A N L E Y R E S E A R C H
83
January 6, 2013 eCommerce Disruption: A Global Theme – Transforming Traditional Retail
accessories eCommerce specialty retailer. Sapato.ru offers more than 200,000 shoe types from over 200 brands. In addition, Ozon established a separate online travel agency business, OZON.travel, which sells tickets from 500 airlines and offers bookings for 160,000 hotel rooms.
In our survey, Ozon showed the highest penetration among online shoppers (41% of respondents purchased on the site within the past 12 months), followed by Avito (21%), and Biglion (16%). Ozon was ranked as the favored site by 1 in 4 online shoppers with a large gap to number 2, as the chart shows.
Exhibit 138
25% of shoppers view Ozon as favorite place to buy online; 41% have purchase at Ozon in the last year
25%
8%
6%
5%
3%
3%
3%
2%
2%
2%
1%
1%
1%
0%
Ozon.ru
eBay.com
Avito.ru
Biglion.ru
Yandexmarket.ru
KupiVIP.ru
MVideo.ru
Amazon.com
Sapato.ru
Molotok.ru
Slando.ru
Wikimart.ru
E5.ru
AnywayAnyday.ru
Source: AlphaWise, Morgan Stanley Research
The following chart shows the average tenure of an Ozon customer is four years, compared to less than three years for the broader Russia eCommerce market.
Exhibit 139
Ozon is more established relative to the overall category, especially with longer tenured customers
0%
10%
20%
30%
40%
Less thana year
1-2 years 3-5 years 6-10 years More than10 years
Ozon Russian e-Commerce Source: AlphaWise, Morgan Stanley Research
The challenges facing Ozon are common to all Russian eCommerce companies 1. Unexpected regulatory change. There are no current
plans for meaningful changes to current legislation, however, we would anticipate a greater initial focus on sectors such as social networking.
2. Macroeconomic conditions. Our conviction in the secular shift of offline retail sales to online eCommerce sales is high, but Ozon, like any other eCommerce participant, would be impacted by any adverse change in macroeconomic conditions in Russia. However, Morgan Stanley economists do forecast relatively healthy 10% nominal GDP growth in Russia for 2013 and 9% for 2014.
3. Competition from international players. A potential entry by Amazon into the Russian market could materially increase levels of competition. That said, the barriers to entry are significant, and our channel checks do not indicate Amazon is preparing to enter the Russian market. eBay, however, has established a foothold.
4. While the level of counterfeit and grey market goods is generally low, this could develop into a more widespread problem for the eCommerce category if not closely regulated by authorities.
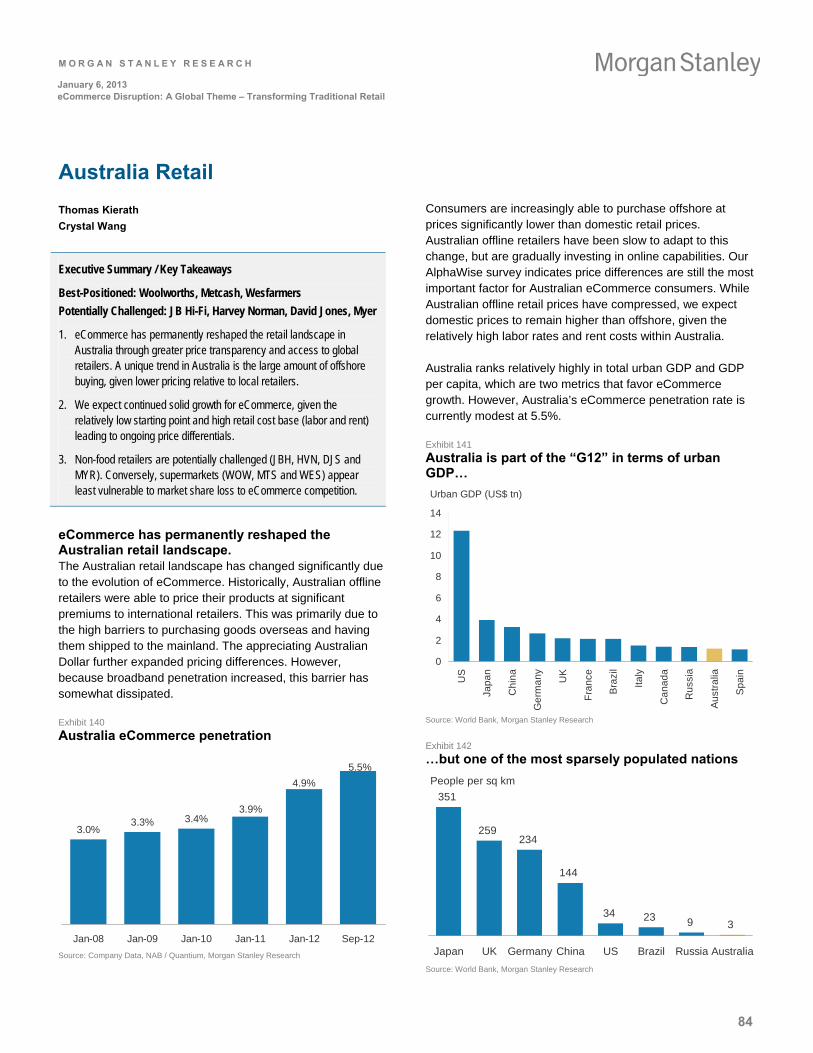
M O R G A N S T A N L E Y R E S E A R C H
84
January 6, 2013 eCommerce Disruption: A Global Theme – Transforming Traditional Retail
Australia Retail
Thomas Kierath
Crystal Wang
Executive Summary / Key Takeaways
Best-Positioned: Woolworths, Metcash, Wesfarmers
Potentially Challenged: JB Hi-Fi, Harvey Norman, David Jones, Myer
1. eCommerce has permanently reshaped the retail landscape in Australia through greater price transparency and access to global retailers. A unique trend in Australia is the large amount of offshore buying, given lower pricing relative to local retailers.
2. We expect continued solid growth for eCommerce, given the relatively low starting point and high retail cost base (labor and rent) leading to ongoing price differentials.
3. Non-food retailers are potentially challenged (JBH, HVN, DJS and MYR). Conversely, supermarkets (WOW, MTS and WES) appear least vulnerable to market share loss to eCommerce competition.
eCommerce has permanently reshaped the Australian retail landscape. The Australian retail landscape has changed significantly due to the evolution of eCommerce. Historically, Australian offline retailers were able to price their products at significant premiums to international retailers. This was primarily due to the high barriers to purchasing goods overseas and having them shipped to the mainland. The appreciating Australian Dollar further expanded pricing differences. However, because broadband penetration increased, this barrier has somewhat dissipated.
Exhibit 140
Australia eCommerce penetration
3.0%3.3% 3.4%
5.5%
3.9%
4.9%
Jan-08 Jan-09 Jan-10 Jan-11 Jan-12 Sep-12
Source: Company Data, NAB / Quantium, Morgan Stanley Research
Consumers are increasingly able to purchase offshore at prices significantly lower than domestic retail prices. Australian offline retailers have been slow to adapt to this change, but are gradually investing in online capabilities. Our AlphaWise survey indicates price differences are still the most important factor for Australian eCommerce consumers. While Australian offline retail prices have compressed, we expect domestic prices to remain higher than offshore, given the relatively high labor rates and rent costs within Australia.
Australia ranks relatively highly in total urban GDP and GDP per capita, which are two metrics that favor eCommerce growth. However, Australia’s eCommerce penetration rate is currently modest at 5.5%.
Exhibit 141
Australia is part of the “G12” in terms of urban GDP…
Urban GDP (US$ tn)
0
2
4
6
8
10
12
14
US
Jap
an
Ch
ina
Ge
rma
ny UK
Fra
nce
Bra
zil
Italy
Ca
na
da
Ru
ssia
Au
stra
lia
Sp
ain
Source: World Bank, Morgan Stanley Research
Exhibit 142
…but one of the most sparsely populated nations
People per sq km
351
259234
144
34 23 9 3
Japan UK Germany China US Brazil Russia Australia
Source: World Bank, Morgan Stanley Research
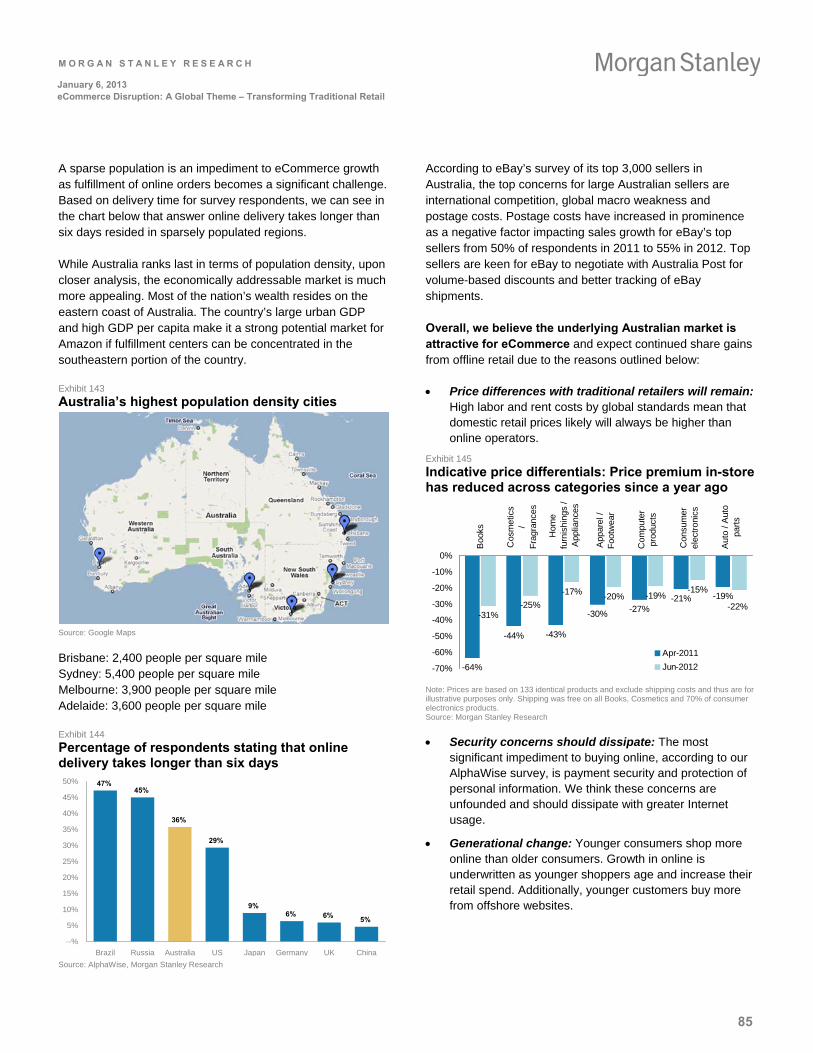
M O R G A N S T A N L E Y R E S E A R C H
85
January 6, 2013 eCommerce Disruption: A Global Theme – Transforming Traditional Retail
A sparse population is an impediment to eCommerce growth as fulfillment of online orders becomes a significant challenge. Based on delivery time for survey respondents, we can see in the chart below that answer online delivery takes longer than six days resided in sparsely populated regions.
While Australia ranks last in terms of population density, upon closer analysis, the economically addressable market is much more appealing. Most of the nation’s wealth resides on the eastern coast of Australia. The country’s large urban GDP and high GDP per capita make it a strong potential market for Amazon if fulfillment centers can be concentrated in the southeastern portion of the country.
Exhibit 143
Australia’s highest population density cities
Source: Google Maps
Brisbane: 2,400 people per square mile Sydney: 5,400 people per square mile Melbourne: 3,900 people per square mile Adelaide: 3,600 people per square mile
Exhibit 144
Percentage of respondents stating that online delivery takes longer than six days
47%45%
36%
29%
9%6% 6%
5%
--%
5%
10%
15%
20%
25%
30%
35%
40%
45%
50%
Brazil Russia Australia US Japan Germany UK China Source: AlphaWise, Morgan Stanley Research
According to eBay’s survey of its top 3,000 sellers in Australia, the top concerns for large Australian sellers are international competition, global macro weakness and postage costs. Postage costs have increased in prominence as a negative factor impacting sales growth for eBay’s top sellers from 50% of respondents in 2011 to 55% in 2012. Top sellers are keen for eBay to negotiate with Australia Post for volume-based discounts and better tracking of eBay shipments.
Overall, we believe the underlying Australian market is attractive for eCommerce and expect continued share gains from offline retail due to the reasons outlined below:
Price differences with traditional retailers will remain: High labor and rent costs by global standards mean that domestic retail prices likely will always be higher than online operators.
Exhibit 145
Indicative price differentials: Price premium in-store has reduced across categories since a year ago
-64%
-44% -43%
-30% -27%-21% -19%
-31%-25%
-17% -20% -19%-15%
-22%
-70%
-60%
-50%
-40%
-30%
-20%
-10%
0%
Boo
ks
Cos
met
ics
/F
ragr
ance
s
Hom
efu
rnis
hing
s /
App
lianc
es
App
arel
/F
ootw
ear
Com
pute
rpr
oduc
ts
Con
sum
erel
ectr
onic
s
Aut
o / A
uto
part
s
Apr-2011
Jun-2012
Note: Prices are based on 133 identical products and exclude shipping costs and thus are for illustrative purposes only. Shipping was free on all Books, Cosmetics and 70% of consumer electronics products. Source: Morgan Stanley Research
Security concerns should dissipate: The most significant impediment to buying online, according to our AlphaWise survey, is payment security and protection of personal information. We think these concerns are unfounded and should dissipate with greater Internet usage.
Generational change: Younger consumers shop more online than older consumers. Growth in online is underwritten as younger shoppers age and increase their retail spend. Additionally, younger customers buy more from offshore websites.
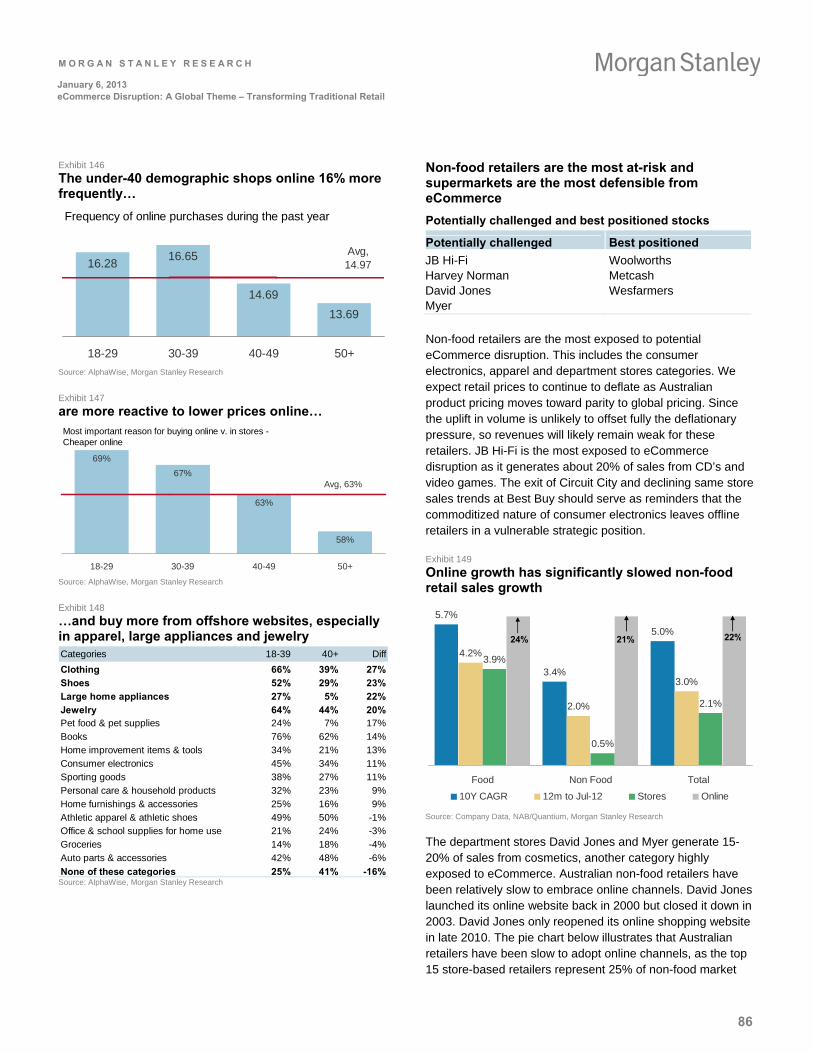
M O R G A N S T A N L E Y R E S E A R C H
86
January 6, 2013 eCommerce Disruption: A Global Theme – Transforming Traditional Retail
Exhibit 146
The under-40 demographic shops online 16% more frequently…
16.2816.65
14.69
13.69
Avg,14.97
18-29 30-39 40-49 50+
Frequency of online purchases during the past year
Source: AlphaWise, Morgan Stanley Research
Exhibit 147
are more reactive to lower prices online…
69%
67%
63%
58%
Avg, 63%
18-29 30-39 40-49 50+
Most important reason for buying online v. in stores - Cheaper online
Source: AlphaWise, Morgan Stanley Research
Exhibit 148
…and buy more from offshore websites, especially in apparel, large appliances and jewelry Categories 18-39 40+ Diff
Clothing 66% 39% 27%Shoes 52% 29% 23%Large home appliances 27% 5% 22%Jewelry 64% 44% 20%Pet food & pet supplies 24% 7% 17%Books 76% 62% 14%Home improvement items & tools 34% 21% 13%Consumer electronics 45% 34% 11%Sporting goods 38% 27% 11%Personal care & household products 32% 23% 9%Home furnishings & accessories 25% 16% 9%Athletic apparel & athletic shoes 49% 50% -1%Office & school supplies for home use 21% 24% -3%Groceries 14% 18% -4%Auto parts & accessories 42% 48% -6%
None of these categories 25% 41% -16% Source: AlphaWise, Morgan Stanley Research
Non-food retailers are the most at-risk and supermarkets are the most defensible from eCommerce
Potentially challenged and best positioned stocks
Potentially challenged Best positioned
JB Hi-Fi Harvey Norman David Jones Myer
Woolworths Metcash Wesfarmers
Non-food retailers are the most exposed to potential eCommerce disruption. This includes the consumer electronics, apparel and department stores categories. We expect retail prices to continue to deflate as Australian product pricing moves toward parity to global pricing. Since the uplift in volume is unlikely to offset fully the deflationary pressure, so revenues will likely remain weak for these retailers. JB Hi-Fi is the most exposed to eCommerce disruption as it generates about 20% of sales from CD’s and video games. The exit of Circuit City and declining same store sales trends at Best Buy should serve as reminders that the commoditized nature of consumer electronics leaves offline retailers in a vulnerable strategic position.
Exhibit 149
Online growth has significantly slowed non-food retail sales growth
5.7%
3.4%
5.0%
4.2%
2.0%
3.0%
3.9%
0.5%
2.1%
Food Non Food Total
10Y CAGR 12m to Jul-12 Stores Online
24% 21% 22%
Source: Company Data, NAB/Quantium, Morgan Stanley Research
The department stores David Jones and Myer generate 15-20% of sales from cosmetics, another category highly exposed to eCommerce. Australian non-food retailers have been relatively slow to embrace online channels. David Jones launched its online website back in 2000 but closed it down in 2003. David Jones only reopened its online shopping website in late 2010. The pie chart below illustrates that Australian retailers have been slow to adopt online channels, as the top 15 store-based retailers represent 25% of non-food market
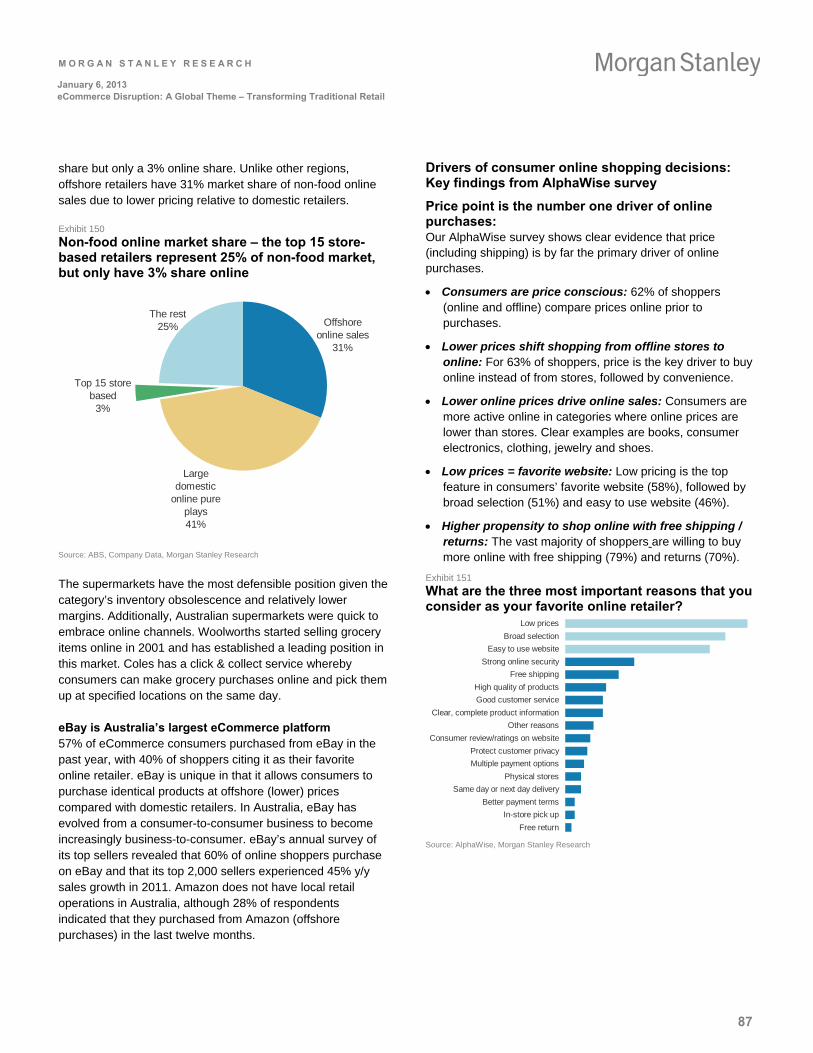
M O R G A N S T A N L E Y R E S E A R C H
87
January 6, 2013 eCommerce Disruption: A Global Theme – Transforming Traditional Retail
share but only a 3% online share. Unlike other regions, offshore retailers have 31% market share of non-food online sales due to lower pricing relative to domestic retailers.
Exhibit 150
Non-food online market share – the top 15 store-based retailers represent 25% of non-food market, but only have 3% share online
Top 15 store based
3%
The rest25% Offshore
online sales31%
Large domestic
online pure plays41%
Source: ABS, Company Data, Morgan Stanley Research
The supermarkets have the most defensible position given the category’s inventory obsolescence and relatively lower margins. Additionally, Australian supermarkets were quick to embrace online channels. Woolworths started selling grocery items online in 2001 and has established a leading position in this market. Coles has a click & collect service whereby consumers can make grocery purchases online and pick them up at specified locations on the same day.
eBay is Australia’s largest eCommerce platform 57% of eCommerce consumers purchased from eBay in the past year, with 40% of shoppers citing it as their favorite online retailer. eBay is unique in that it allows consumers to purchase identical products at offshore (lower) prices compared with domestic retailers. In Australia, eBay has evolved from a consumer-to-consumer business to become increasingly business-to-consumer. eBay’s annual survey of its top sellers revealed that 60% of online shoppers purchase on eBay and that its top 2,000 sellers experienced 45% y/y sales growth in 2011. Amazon does not have local retail operations in Australia, although 28% of respondents indicated that they purchased from Amazon (offshore purchases) in the last twelve months.
Drivers of consumer online shopping decisions: Key findings from AlphaWise survey
Price point is the number one driver of online purchases: Our AlphaWise survey shows clear evidence that price (including shipping) is by far the primary driver of online purchases.
Consumers are price conscious: 62% of shoppers (online and offline) compare prices online prior to purchases.
Lower prices shift shopping from offline stores to online: For 63% of shoppers, price is the key driver to buy online instead of from stores, followed by convenience.
Lower online prices drive online sales: Consumers are more active online in categories where online prices are lower than stores. Clear examples are books, consumer electronics, clothing, jewelry and shoes.
Low prices = favorite website: Low pricing is the top feature in consumers’ favorite website (58%), followed by broad selection (51%) and easy to use website (46%).
Higher propensity to shop online with free shipping / returns: The vast majority of shoppers are willing to buy more online with free shipping (79%) and returns (70%).
Exhibit 151
What are the three most important reasons that you consider as your favorite online retailer?
Free return
In-store pick up
Better payment terms
Same day or next day delivery
Physical stores
Multiple payment options
Protect customer privacy
Consumer review/ratings on website
Other reasons
Clear, complete product information
Good customer service
High quality of products
Free shipping
Strong online security
Easy to use website
Broad selection
Low prices
Source: AlphaWise, Morgan Stanley Research
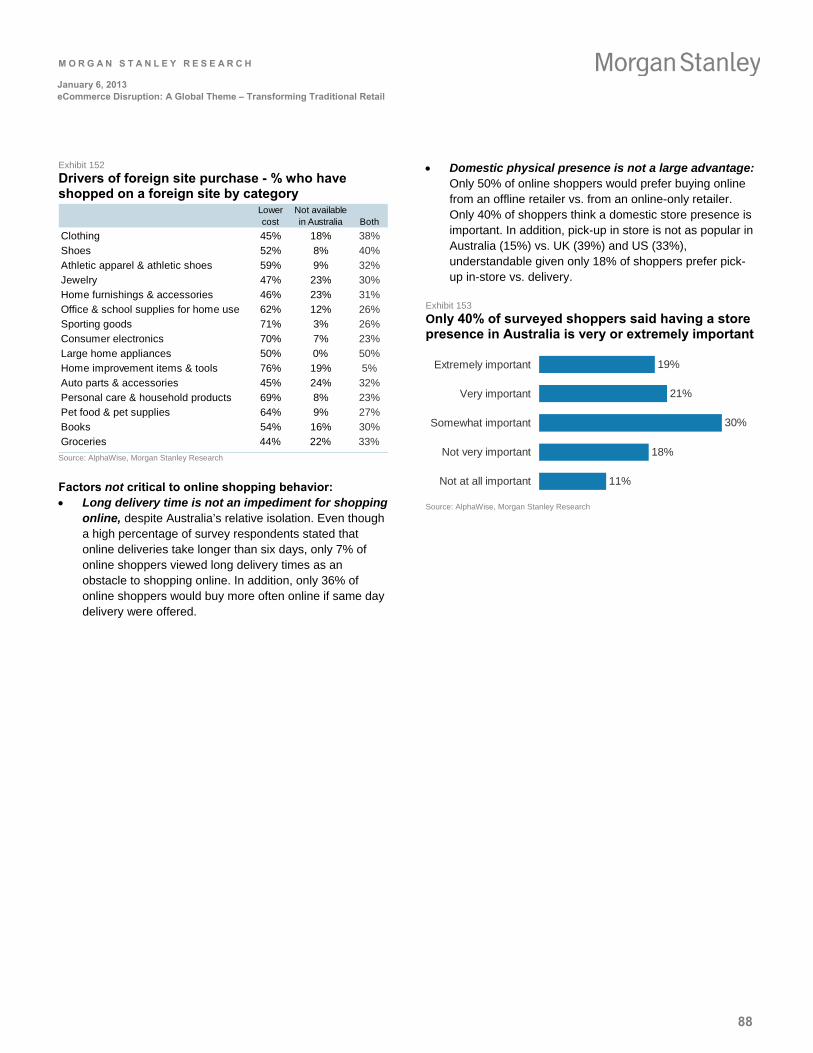
M O R G A N S T A N L E Y R E S E A R C H
88
January 6, 2013 eCommerce Disruption: A Global Theme – Transforming Traditional Retail
Exhibit 152
Drivers of foreign site purchase - % who have shopped on a foreign site by category
Lower cost
Not available in Australia Both
Clothing 45% 18% 38%
Shoes 52% 8% 40%
Athletic apparel & athletic shoes 59% 9% 32%
Jewelry 47% 23% 30%
Home furnishings & accessories 46% 23% 31%
Office & school supplies for home use 62% 12% 26%
Sporting goods 71% 3% 26%
Consumer electronics 70% 7% 23%
Large home appliances 50% 0% 50%
Home improvement items & tools 76% 19% 5%
Auto parts & accessories 45% 24% 32%
Personal care & household products 69% 8% 23%
Pet food & pet supplies 64% 9% 27%
Books 54% 16% 30%
Groceries 44% 22% 33%
Source: AlphaWise, Morgan Stanley Research
Factors not critical to online shopping behavior: Long delivery time is not an impediment for shopping
online, despite Australia’s relative isolation. Even though a high percentage of survey respondents stated that online deliveries take longer than six days, only 7% of online shoppers viewed long delivery times as an obstacle to shopping online. In addition, only 36% of online shoppers would buy more often online if same day delivery were offered.
Domestic physical presence is not a large advantage: Only 50% of online shoppers would prefer buying online from an offline retailer vs. from an online-only retailer. Only 40% of shoppers think a domestic store presence is important. In addition, pick-up in store is not as popular in Australia (15%) vs. UK (39%) and US (33%), understandable given only 18% of shoppers prefer pick-up in-store vs. delivery.
Exhibit 153
Only 40% of surveyed shoppers said having a store presence in Australia is very or extremely important
30%
18%
21%
19%
11%
Extremely important
Very important
Somewhat important
Not very important
Not at all important
Source: AlphaWise, Morgan Stanley Research
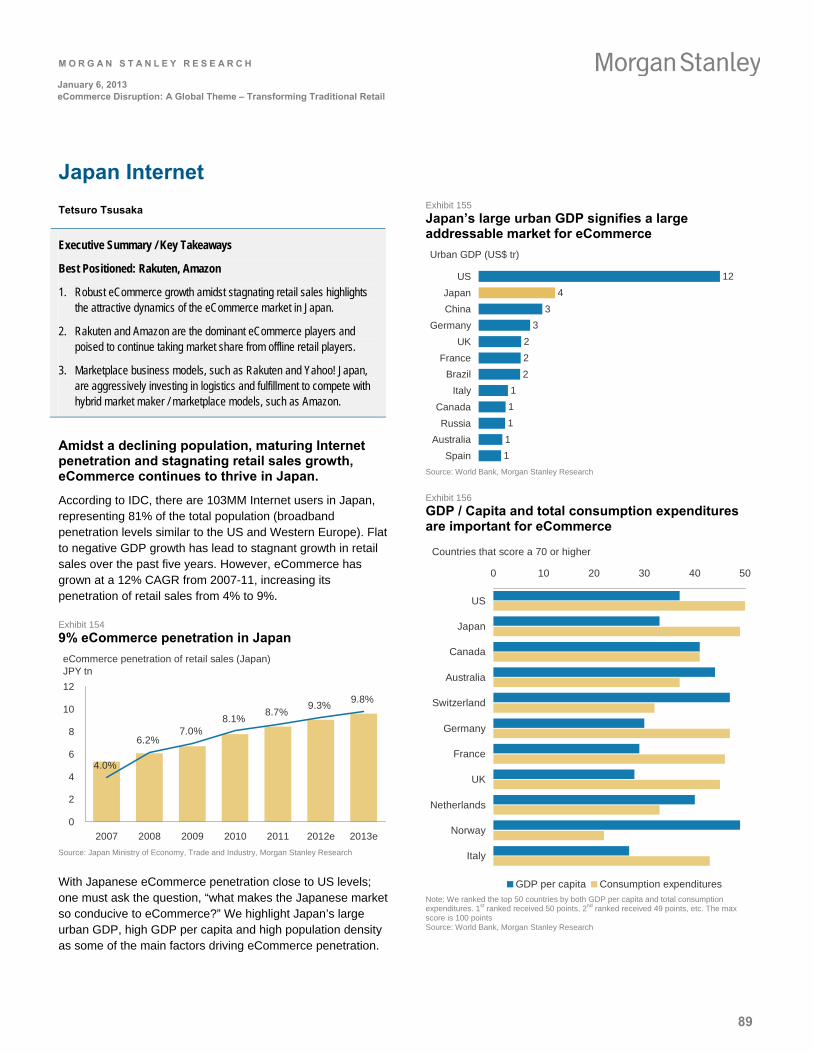
M O R G A N S T A N L E Y R E S E A R C H
89
January 6, 2013 eCommerce Disruption: A Global Theme – Transforming Traditional Retail
Japan Internet
Tetsuro Tsusaka
Executive Summary / Key Takeaways
Best Positioned: Rakuten, Amazon
1. Robust eCommerce growth amidst stagnating retail sales highlights the attractive dynamics of the eCommerce market in Japan.
2. Rakuten and Amazon are the dominant eCommerce players and poised to continue taking market share from offline retail players.
3. Marketplace business models, such as Rakuten and Yahoo! Japan, are aggressively investing in logistics and fulfillment to compete with hybrid market maker / marketplace models, such as Amazon.
Amidst a declining population, maturing Internet penetration and stagnating retail sales growth, eCommerce continues to thrive in Japan.
According to IDC, there are 103MM Internet users in Japan, representing 81% of the total population (broadband penetration levels similar to the US and Western Europe). Flat to negative GDP growth has lead to stagnant growth in retail sales over the past five years. However, eCommerce has grown at a 12% CAGR from 2007-11, increasing its penetration of retail sales from 4% to 9%.
Exhibit 154
9% eCommerce penetration in Japan
eCommerce penetration of retail sales (Japan)
4.0%
6.2%7.0%
8.1%8.7%
9.3%9.8%
0
2
4
6
8
10
12
2007 2008 2009 2010 2011 2012e 2013e
JPY tn
Source: Japan Ministry of Economy, Trade and Industry, Morgan Stanley Research
With Japanese eCommerce penetration close to US levels; one must ask the question, “what makes the Japanese market so conducive to eCommerce?” We highlight Japan’s large urban GDP, high GDP per capita and high population density as some of the main factors driving eCommerce penetration.
Exhibit 155
Japan’s large urban GDP signifies a large addressable market for eCommerce
Urban GDP (US$ tr)
12
4
3
3
2
2
2
1
1
1
1
1
US
Japan
China
Germany
UK
France
Brazil
Italy
Canada
Russia
Australia
Spain
Source: World Bank, Morgan Stanley Research
Exhibit 156
GDP / Capita and total consumption expenditures are important for eCommerce
Countries that score a 70 or higher
0 10 20 30 40 50
US
Japan
Canada
Australia
Switzerland
Germany
France
UK
Netherlands
Norway
Italy
GDP per capita Consumption expenditures Note: We ranked the top 50 countries by both GDP per capita and total consumption expenditures. 1st ranked received 50 points, 2nd ranked received 49 points, etc. The max score is 100 points Source: World Bank, Morgan Stanley Research
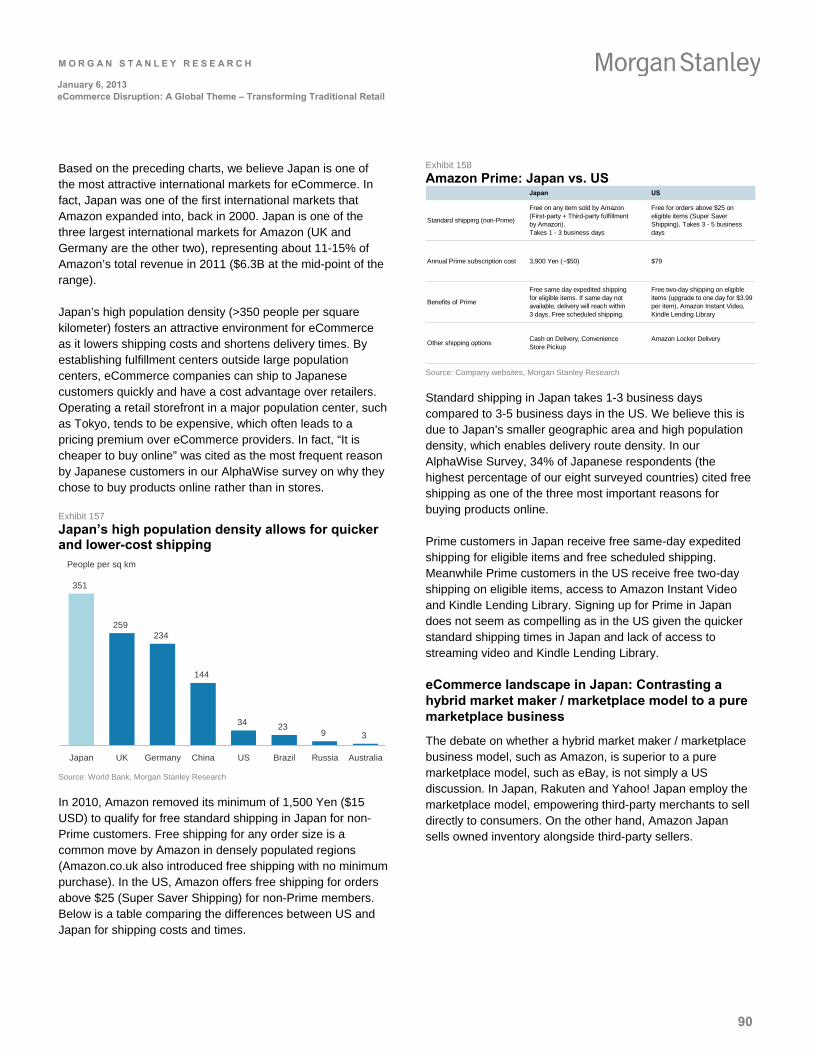
M O R G A N S T A N L E Y R E S E A R C H
90
January 6, 2013 eCommerce Disruption: A Global Theme – Transforming Traditional Retail
Based on the preceding charts, we believe Japan is one of the most attractive international markets for eCommerce. In fact, Japan was one of the first international markets that Amazon expanded into, back in 2000. Japan is one of the three largest international markets for Amazon (UK and Germany are the other two), representing about 11-15% of Amazon’s total revenue in 2011 ($6.3B at the mid-point of the range).
Japan’s high population density (>350 people per square kilometer) fosters an attractive environment for eCommerce as it lowers shipping costs and shortens delivery times. By establishing fulfillment centers outside large population centers, eCommerce companies can ship to Japanese customers quickly and have a cost advantage over retailers. Operating a retail storefront in a major population center, such as Tokyo, tends to be expensive, which often leads to a pricing premium over eCommerce providers. In fact, “It is cheaper to buy online” was cited as the most frequent reason by Japanese customers in our AlphaWise survey on why they chose to buy products online rather than in stores.
Exhibit 157
Japan’s high population density allows for quicker and lower-cost shipping
People per sq km
351
259234
144
34 239 3
Japan UK Germany China US Brazil Russia Australia
Source: World Bank, Morgan Stanley Research
In 2010, Amazon removed its minimum of 1,500 Yen ($15 USD) to qualify for free standard shipping in Japan for non-Prime customers. Free shipping for any order size is a common move by Amazon in densely populated regions (Amazon.co.uk also introduced free shipping with no minimum purchase). In the US, Amazon offers free shipping for orders above $25 (Super Saver Shipping) for non-Prime members. Below is a table comparing the differences between US and Japan for shipping costs and times.
Exhibit 158
Amazon Prime: Japan vs. US Japan US
Standard shipping (non-Prime)
Free on any item sold by Amazon(First-party + Third-party fulfillmentby Amazon).Takes 1 - 3 business days
Free for orders above $25 on eligible items (Super Saver Shipping). Takes 3 - 5 business days
Annual Prime subscription cost 3,900 Yen (~$50) $79
Benefits of Prime
Free same day expedited shippingfor eligible items. If same day notavailable, delivery will reach within3 days. Free scheduled shipping.
Free two-day shipping on eligible items (upgrade to one day for $3.99 per item), Amazon Instant Video, Kindle Lending Library
Other shipping optionsCash on Delivery, ConvenienceStore Pickup
Amazon Locker Delivery
Source: Company websites, Morgan Stanley Research
Standard shipping in Japan takes 1-3 business days compared to 3-5 business days in the US. We believe this is due to Japan’s smaller geographic area and high population density, which enables delivery route density. In our AlphaWise Survey, 34% of Japanese respondents (the highest percentage of our eight surveyed countries) cited free shipping as one of the three most important reasons for buying products online.
Prime customers in Japan receive free same-day expedited shipping for eligible items and free scheduled shipping. Meanwhile Prime customers in the US receive free two-day shipping on eligible items, access to Amazon Instant Video and Kindle Lending Library. Signing up for Prime in Japan does not seem as compelling as in the US given the quicker standard shipping times in Japan and lack of access to streaming video and Kindle Lending Library.
eCommerce landscape in Japan: Contrasting a hybrid market maker / marketplace model to a pure marketplace business
The debate on whether a hybrid market maker / marketplace business model, such as Amazon, is superior to a pure marketplace model, such as eBay, is not simply a US discussion. In Japan, Rakuten and Yahoo! Japan employ the marketplace model, empowering third-party merchants to sell directly to consumers. On the other hand, Amazon Japan sells owned inventory alongside third-party sellers.
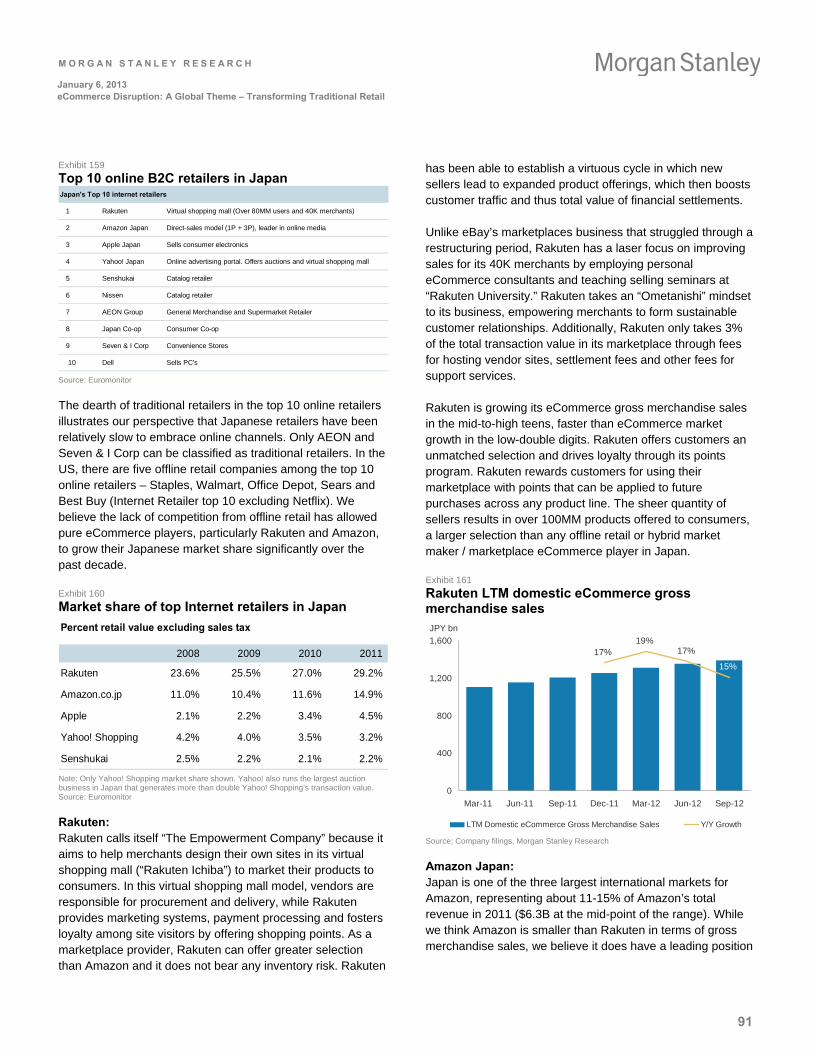
M O R G A N S T A N L E Y R E S E A R C H
91
January 6, 2013 eCommerce Disruption: A Global Theme – Transforming Traditional Retail
Exhibit 159
Top 10 online B2C retailers in Japan Japan's Top 10 internet retailers
1 Rakuten Virtual shopping mall (Over 80MM users and 40K merchants)
2 Amazon Japan Direct-sales model (1P + 3P), leader in online media
3 Apple Japan Sells consumer electronics
4 Yahoo! Japan Online advertising portal. Offers auctions and virtual shopping mall
5 Senshukai Catalog retailer
6 Nissen Catalog retailer
7 AEON Group General Merchandise and Supermarket Retailer
8 Japan Co-op Consumer Co-op
9 Seven & I Corp Convenience Stores
10 Dell Sells PC's Source: Euromonitor
The dearth of traditional retailers in the top 10 online retailers illustrates our perspective that Japanese retailers have been relatively slow to embrace online channels. Only AEON and Seven & I Corp can be classified as traditional retailers. In the US, there are five offline retail companies among the top 10 online retailers – Staples, Walmart, Office Depot, Sears and Best Buy (Internet Retailer top 10 excluding Netflix). We believe the lack of competition from offline retail has allowed pure eCommerce players, particularly Rakuten and Amazon, to grow their Japanese market share significantly over the past decade.
Exhibit 160
Market share of top Internet retailers in Japan
2008 2009 2010 2011
Rakuten 23.6% 25.5% 27.0% 29.2%
Amazon.co.jp 11.0% 10.4% 11.6% 14.9%
Apple 2.1% 2.2% 3.4% 4.5%
Yahoo! Shopping 4.2% 4.0% 3.5% 3.2%
Senshukai 2.5% 2.2% 2.1% 2.2%
Percent retail value excluding sales tax
Note: Only Yahoo! Shopping market share shown. Yahoo! also runs the largest auction business in Japan that generates more than double Yahoo! Shopping’s transaction value. Source: Euromonitor
Rakuten: Rakuten calls itself “The Empowerment Company” because it aims to help merchants design their own sites in its virtual shopping mall (“Rakuten Ichiba”) to market their products to consumers. In this virtual shopping mall model, vendors are responsible for procurement and delivery, while Rakuten provides marketing systems, payment processing and fosters loyalty among site visitors by offering shopping points. As a marketplace provider, Rakuten can offer greater selection than Amazon and it does not bear any inventory risk. Rakuten
has been able to establish a virtuous cycle in which new sellers lead to expanded product offerings, which then boosts customer traffic and thus total value of financial settlements.
Unlike eBay’s marketplaces business that struggled through a restructuring period, Rakuten has a laser focus on improving sales for its 40K merchants by employing personal eCommerce consultants and teaching selling seminars at “Rakuten University.” Rakuten takes an “Ometanishi” mindset to its business, empowering merchants to form sustainable customer relationships. Additionally, Rakuten only takes 3% of the total transaction value in its marketplace through fees for hosting vendor sites, settlement fees and other fees for support services.
Rakuten is growing its eCommerce gross merchandise sales in the mid-to-high teens, faster than eCommerce market growth in the low-double digits. Rakuten offers customers an unmatched selection and drives loyalty through its points program. Rakuten rewards customers for using their marketplace with points that can be applied to future purchases across any product line. The sheer quantity of sellers results in over 100MM products offered to consumers, a larger selection than any offline retail or hybrid market maker / marketplace eCommerce player in Japan.
Exhibit 161
Rakuten LTM domestic eCommerce gross merchandise sales
17% 17%
15%
19%
0
400
800
1,200
1,600
Mar-11 Jun-11 Sep-11 Dec-11 Mar-12 Jun-12 Sep-12
JPY bn
LTM Domestic eCommerce Gross Merchandise Sales Y/Y Growth Source; Company filings, Morgan Stanley Research
Amazon Japan: Japan is one of the three largest international markets for Amazon, representing about 11-15% of Amazon’s total revenue in 2011 ($6.3B at the mid-point of the range). While we think Amazon is smaller than Rakuten in terms of gross merchandise sales, we believe it does have a leading position
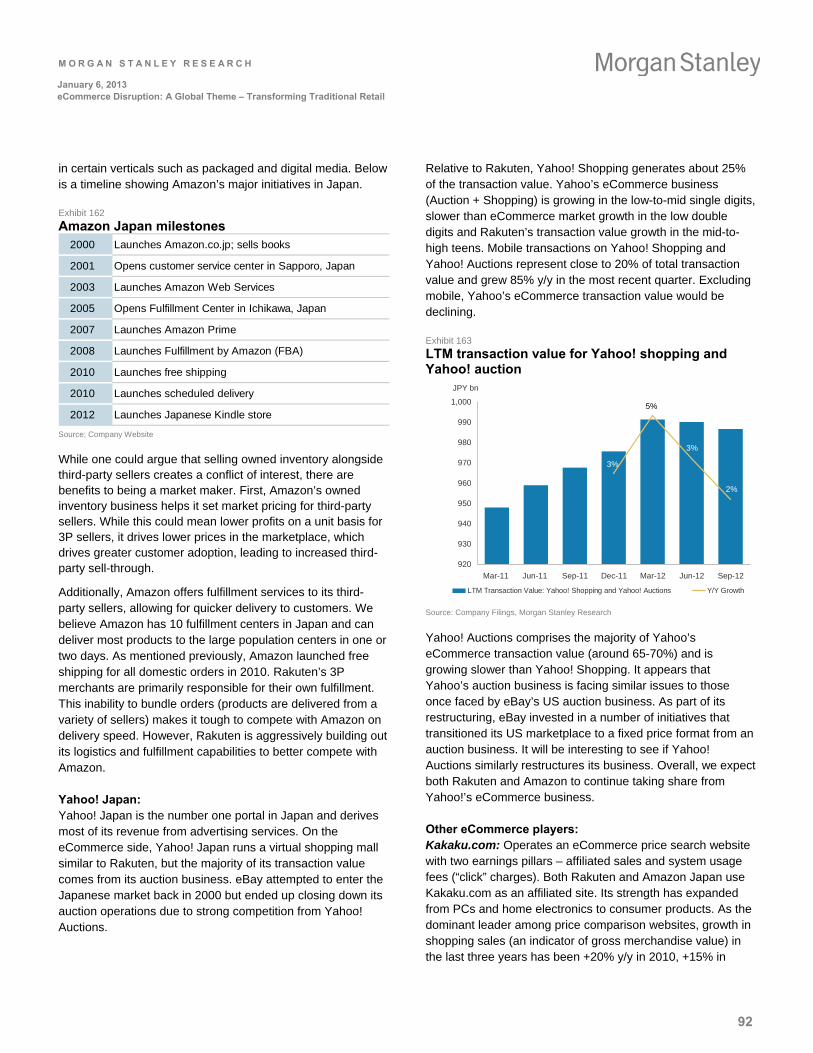
M O R G A N S T A N L E Y R E S E A R C H
92
January 6, 2013 eCommerce Disruption: A Global Theme – Transforming Traditional Retail
in certain verticals such as packaged and digital media. Below is a timeline showing Amazon’s major initiatives in Japan.
Exhibit 162
Amazon Japan milestones 2000 Launches Amazon.co.jp; sells books
2001 Opens customer service center in Sapporo, Japan
2003 Launches Amazon Web Services
2005 Opens Fulfillment Center in Ichikawa, Japan
2007 Launches Amazon Prime
2008 Launches Fulfillment by Amazon (FBA)
2010 Launches free shipping
2010 Launches scheduled delivery
2012 Launches Japanese Kindle store
Source; Company Website
While one could argue that selling owned inventory alongside third-party sellers creates a conflict of interest, there are benefits to being a market maker. First, Amazon’s owned inventory business helps it set market pricing for third-party sellers. While this could mean lower profits on a unit basis for 3P sellers, it drives lower prices in the marketplace, which drives greater customer adoption, leading to increased third-party sell-through.
Additionally, Amazon offers fulfillment services to its third-party sellers, allowing for quicker delivery to customers. We believe Amazon has 10 fulfillment centers in Japan and can deliver most products to the large population centers in one or two days. As mentioned previously, Amazon launched free shipping for all domestic orders in 2010. Rakuten’s 3P merchants are primarily responsible for their own fulfillment. This inability to bundle orders (products are delivered from a variety of sellers) makes it tough to compete with Amazon on delivery speed. However, Rakuten is aggressively building out its logistics and fulfillment capabilities to better compete with Amazon.
Yahoo! Japan: Yahoo! Japan is the number one portal in Japan and derives most of its revenue from advertising services. On the eCommerce side, Yahoo! Japan runs a virtual shopping mall similar to Rakuten, but the majority of its transaction value comes from its auction business. eBay attempted to enter the Japanese market back in 2000 but ended up closing down its auction operations due to strong competition from Yahoo! Auctions.
Relative to Rakuten, Yahoo! Shopping generates about 25% of the transaction value. Yahoo’s eCommerce business (Auction + Shopping) is growing in the low-to-mid single digits, slower than eCommerce market growth in the low double digits and Rakuten’s transaction value growth in the mid-to-high teens. Mobile transactions on Yahoo! Shopping and Yahoo! Auctions represent close to 20% of total transaction value and grew 85% y/y in the most recent quarter. Excluding mobile, Yahoo’s eCommerce transaction value would be declining.
Exhibit 163
LTM transaction value for Yahoo! shopping and Yahoo! auction
3%
3%
2%
5%
920
930
940
950
960
970
980
990
1,000
Mar-11 Jun-11 Sep-11 Dec-11 Mar-12 Jun-12 Sep-12
JPY bn
LTM Transaction Value: Yahoo! Shopping and Yahoo! Auctions Y/Y Growth
Source: Company Filings, Morgan Stanley Research
Yahoo! Auctions comprises the majority of Yahoo’s eCommerce transaction value (around 65-70%) and is growing slower than Yahoo! Shopping. It appears that Yahoo’s auction business is facing similar issues to those once faced by eBay’s US auction business. As part of its restructuring, eBay invested in a number of initiatives that transitioned its US marketplace to a fixed price format from an auction business. It will be interesting to see if Yahoo! Auctions similarly restructures its business. Overall, we expect both Rakuten and Amazon to continue taking share from Yahoo!’s eCommerce business.
Other eCommerce players: Kakaku.com: Operates an eCommerce price search website with two earnings pillars – affiliated sales and system usage fees (“click” charges). Both Rakuten and Amazon Japan use Kakaku.com as an affiliated site. Its strength has expanded from PCs and home electronics to consumer products. As the dominant leader among price comparison websites, growth in shopping sales (an indicator of gross merchandise value) in the last three years has been +20% y/y in 2010, +15% in
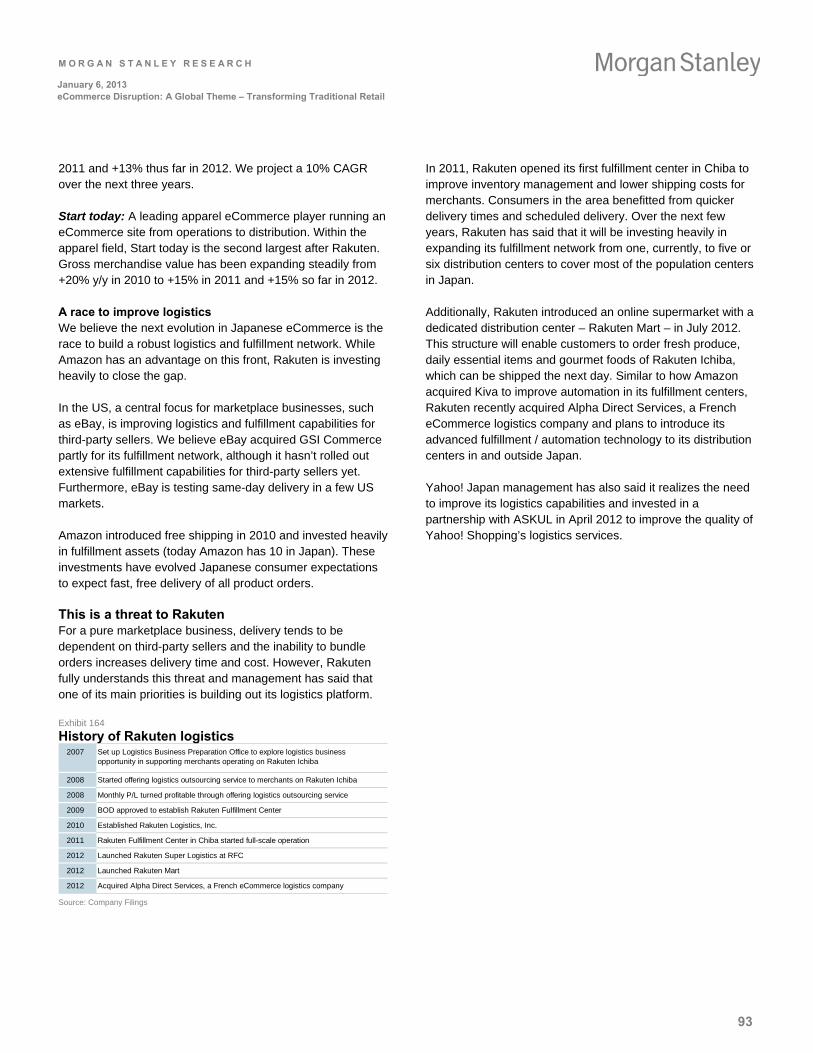
M O R G A N S T A N L E Y R E S E A R C H
93
January 6, 2013 eCommerce Disruption: A Global Theme – Transforming Traditional Retail
2011 and +13% thus far in 2012. We project a 10% CAGR over the next three years.
Start today: A leading apparel eCommerce player running an eCommerce site from operations to distribution. Within the apparel field, Start today is the second largest after Rakuten. Gross merchandise value has been expanding steadily from +20% y/y in 2010 to +15% in 2011 and +15% so far in 2012.
A race to improve logistics We believe the next evolution in Japanese eCommerce is the race to build a robust logistics and fulfillment network. While Amazon has an advantage on this front, Rakuten is investing heavily to close the gap.
In the US, a central focus for marketplace businesses, such as eBay, is improving logistics and fulfillment capabilities for third-party sellers. We believe eBay acquired GSI Commerce partly for its fulfillment network, although it hasn’t rolled out extensive fulfillment capabilities for third-party sellers yet. Furthermore, eBay is testing same-day delivery in a few US markets.
Amazon introduced free shipping in 2010 and invested heavily in fulfillment assets (today Amazon has 10 in Japan). These investments have evolved Japanese consumer expectations to expect fast, free delivery of all product orders.
This is a threat to Rakuten For a pure marketplace business, delivery tends to be dependent on third-party sellers and the inability to bundle orders increases delivery time and cost. However, Rakuten fully understands this threat and management has said that one of its main priorities is building out its logistics platform.
Exhibit 164
History of Rakuten logistics 2007
2008 Started offering logistics outsourcing service to merchants on Rakuten Ichiba
2008 Monthly P/L turned profitable through offering logistics outsourcing service
2009 BOD approved to establish Rakuten Fulfillment Center
2010 Established Rakuten Logistics, Inc.
2011 Rakuten Fulfillment Center in Chiba started full-scale operation
2012 Launched Rakuten Super Logistics at RFC
2012 Launched Rakuten Mart
2012 Acquired Alpha Direct Services, a French eCommerce logistics company
Set up Logistics Business Preparation Office to explore logistics business opportunity in supporting merchants operating on Rakuten Ichiba
Source: Company Filings
In 2011, Rakuten opened its first fulfillment center in Chiba to improve inventory management and lower shipping costs for merchants. Consumers in the area benefitted from quicker delivery times and scheduled delivery. Over the next few years, Rakuten has said that it will be investing heavily in expanding its fulfillment network from one, currently, to five or six distribution centers to cover most of the population centers in Japan.
Additionally, Rakuten introduced an online supermarket with a dedicated distribution center – Rakuten Mart – in July 2012. This structure will enable customers to order fresh produce, daily essential items and gourmet foods of Rakuten Ichiba, which can be shipped the next day. Similar to how Amazon acquired Kiva to improve automation in its fulfillment centers, Rakuten recently acquired Alpha Direct Services, a French eCommerce logistics company and plans to introduce its advanced fulfillment / automation technology to its distribution centers in and outside Japan.
Yahoo! Japan management has also said it realizes the need to improve its logistics capabilities and invested in a partnership with ASKUL in April 2012 to improve the quality of Yahoo! Shopping’s logistics services.

M O R G A N S T A N L E Y R E S E A R C H
94
January 6, 2013 eCommerce Disruption: A Global Theme – Transforming Traditional Retail
M O R G A N S T A N L E Y R E S E A R C H
95
January 6, 2013 eCommerce Disruption: A Global Theme – Transforming Traditional Retail
eCommerce Disruption: A Global Theme
Key Stock Calls by Region
M O R G A N S T A N L E Y B L U E P A P E R
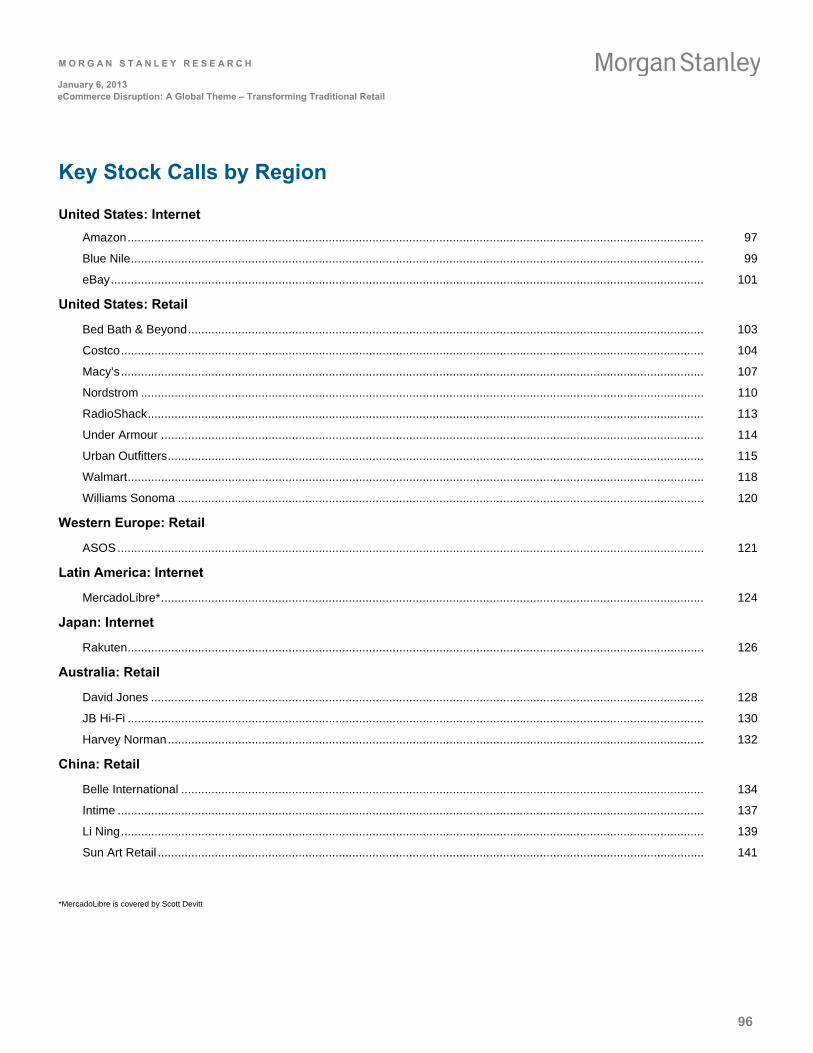
M O R G A N S T A N L E Y R E S E A R C H
96
January 6, 2013 eCommerce Disruption: A Global Theme – Transforming Traditional Retail
Key Stock Calls by Region
United States: Internet
Amazon............................................................................................................................................................................ 97
Blue Nile........................................................................................................................................................................... 99
eBay................................................................................................................................................................................. 101
United States: Retail
Bed Bath & Beyond.......................................................................................................................................................... 103
Costco.............................................................................................................................................................................. 104
Macy’s.............................................................................................................................................................................. 107
Nordstrom ........................................................................................................................................................................ 110
RadioShack...................................................................................................................................................................... 113
Under Armour .................................................................................................................................................................. 114
Urban Outfitters................................................................................................................................................................ 115
Walmart............................................................................................................................................................................ 118
Williams Sonoma ............................................................................................................................................................. 120
Western Europe: Retail
ASOS............................................................................................................................................................................... 121
Latin America: Internet
MercadoLibre*.................................................................................................................................................................. 124
Japan: Internet
Rakuten............................................................................................................................................................................ 126
Australia: Retail
David Jones ..................................................................................................................................................................... 128
JB Hi-Fi ............................................................................................................................................................................ 130
Harvey Norman................................................................................................................................................................ 132
China: Retail
Belle International ............................................................................................................................................................ 134
Intime ............................................................................................................................................................................... 137
Li Ning.............................................................................................................................................................................. 139
Sun Art Retail ................................................................................................................................................................... 141
*MercadoLibre is covered by Scott Devitt
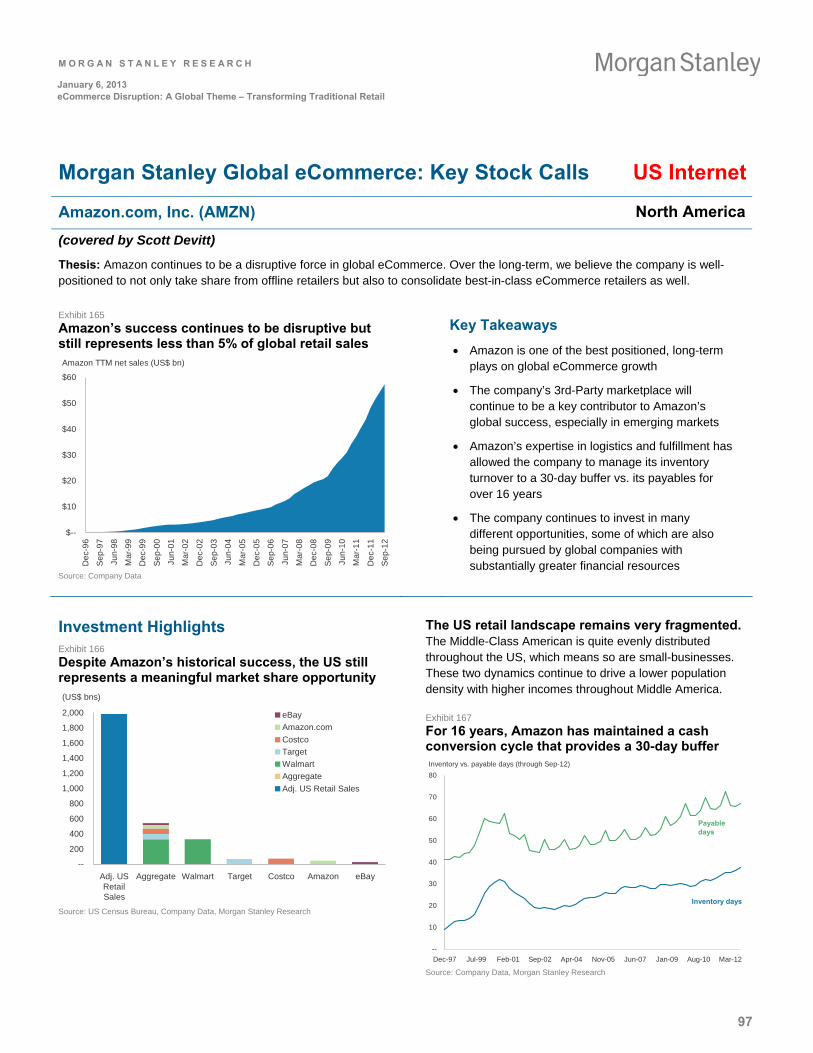
M O R G A N S T A N L E Y R E S E A R C H
97
January 6, 2013 eCommerce Disruption: A Global Theme – Transforming Traditional Retail
Morgan Stanley Global eCommerce: Key Stock Calls US Internet
Amazon.com, Inc. (AMZN) North America
(covered by Scott Devitt)
Thesis: Amazon continues to be a disruptive force in global eCommerce. Over the long-term, we believe the company is well-positioned to not only take share from offline retailers but also to consolidate best-in-class eCommerce retailers as well.
Exhibit 165
Amazon’s success continues to be disruptive but still represents less than 5% of global retail sales Amazon TTM net sales (US$ bn)
$--
$10
$20
$30
$40
$50
$60
Dec
-96
Se
p-9
7
Jun
-98
Ma
r-9
9
Dec
-99
Se
p-0
0
Jun
-01
Ma
r-0
2
Dec
-02
Se
p-0
3
Jun
-04
Ma
r-0
5
Dec
-05
Se
p-0
6
Jun
-07
Ma
r-0
8
Dec
-08
Se
p-0
9
Jun
-10
Ma
r-1
1
Dec
-11
Se
p-1
2
Source: Company Data
Key Takeaways
Amazon is one of the best positioned, long-term plays on global eCommerce growth
The company’s 3rd-Party marketplace will continue to be a key contributor to Amazon’s global success, especially in emerging markets
Amazon’s expertise in logistics and fulfillment has allowed the company to manage its inventory turnover to a 30-day buffer vs. its payables for over 16 years
The company continues to invest in many different opportunities, some of which are also being pursued by global companies with substantially greater financial resources
Investment Highlights Exhibit 166
Despite Amazon’s historical success, the US still represents a meaningful market share opportunity (US$ bns)
--
200
400
600
800
1,000
1,200
1,400
1,600
1,800
2,000
Adj. USRetailSales
Aggregate Walmart Target Costco Amazon eBay
eBay
Amazon.com
Costco
Target
Walmart
Aggregate
Adj. US Retail Sales
Source: US Census Bureau, Company Data, Morgan Stanley Research
The US retail landscape remains very fragmented. The Middle-Class American is quite evenly distributed throughout the US, which means so are small-businesses. These two dynamics continue to drive a lower population density with higher incomes throughout Middle America.
Exhibit 167
For 16 years, Amazon has maintained a cash conversion cycle that provides a 30-day buffer Inventory vs. payable days (through Sep-12)
--
10
20
30
40
50
60
70
80
Dec-97 Jul-99 Feb-01 Sep-02 Apr-04 Nov-05 Jun-07 Jan-09 Aug-10 Mar-12
Payable days
Inventory days
Source: Company Data, Morgan Stanley Research
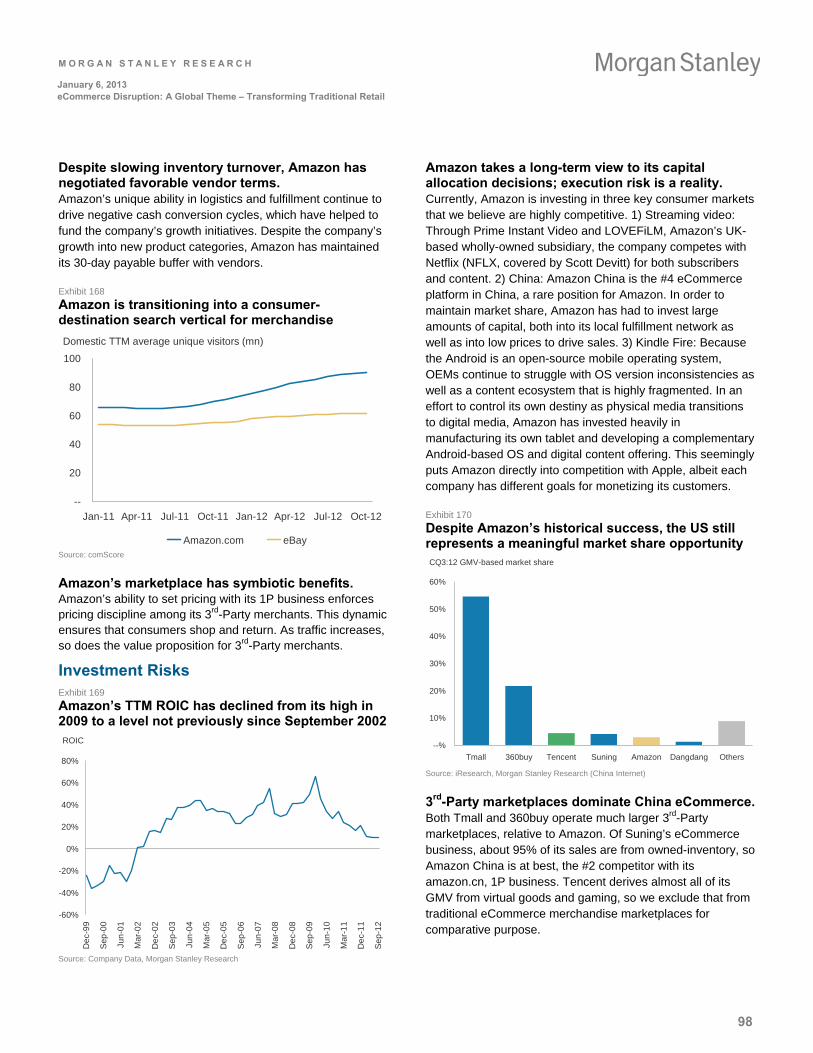
M O R G A N S T A N L E Y R E S E A R C H
98
January 6, 2013 eCommerce Disruption: A Global Theme – Transforming Traditional Retail
Despite slowing inventory turnover, Amazon has negotiated favorable vendor terms. Amazon’s unique ability in logistics and fulfillment continue to drive negative cash conversion cycles, which have helped to fund the company’s growth initiatives. Despite the company’s growth into new product categories, Amazon has maintained its 30-day payable buffer with vendors.
Exhibit 168
Amazon is transitioning into a consumer-destination search vertical for merchandise
Domestic TTM average unique visitors (mn)
--
20
40
60
80
100
Jan-11 Apr-11 Jul-11 Oct-11 Jan-12 Apr-12 Jul-12 Oct-12
Amazon.com eBay Source: comScore
Amazon’s marketplace has symbiotic benefits. Amazon’s ability to set pricing with its 1P business enforces pricing discipline among its 3rd-Party merchants. This dynamic ensures that consumers shop and return. As traffic increases, so does the value proposition for 3rd-Party merchants.
Investment Risks Exhibit 169
Amazon’s TTM ROIC has declined from its high in 2009 to a level not previously since September 2002 ROIC
-60%
-40%
-20%
0%
20%
40%
60%
80%
De
c-9
9
Se
p-0
0
Jun
-01
Ma
r-0
2
De
c-0
2
Se
p-0
3
Jun
-04
Ma
r-0
5
De
c-0
5
Se
p-0
6
Jun
-07
Ma
r-0
8
De
c-0
8
Se
p-0
9
Jun
-10
Ma
r-1
1
De
c-1
1
Se
p-1
2
Source: Company Data, Morgan Stanley Research
Amazon takes a long-term view to its capital allocation decisions; execution risk is a reality. Currently, Amazon is investing in three key consumer markets that we believe are highly competitive. 1) Streaming video: Through Prime Instant Video and LOVEFiLM, Amazon’s UK-based wholly-owned subsidiary, the company competes with Netflix (NFLX, covered by Scott Devitt) for both subscribers and content. 2) China: Amazon China is the #4 eCommerce platform in China, a rare position for Amazon. In order to maintain market share, Amazon has had to invest large amounts of capital, both into its local fulfillment network as well as into low prices to drive sales. 3) Kindle Fire: Because the Android is an open-source mobile operating system, OEMs continue to struggle with OS version inconsistencies as well as a content ecosystem that is highly fragmented. In an effort to control its own destiny as physical media transitions to digital media, Amazon has invested heavily in manufacturing its own tablet and developing a complementary Android-based OS and digital content offering. This seemingly puts Amazon directly into competition with Apple, albeit each company has different goals for monetizing its customers.
Exhibit 170
Despite Amazon’s historical success, the US still represents a meaningful market share opportunity CQ3:12 GMV-based market share
--%
10%
20%
30%
40%
50%
60%
Tmall 360buy Tencent Suning Amazon Dangdang Others
Source: iResearch, Morgan Stanley Research (China Internet)
3rd-Party marketplaces dominate China eCommerce. Both Tmall and 360buy operate much larger 3rd-Party marketplaces, relative to Amazon. Of Suning’s eCommerce business, about 95% of its sales are from owned-inventory, so Amazon China is at best, the #2 competitor with its amazon.cn, 1P business. Tencent derives almost all of its GMV from virtual goods and gaming, so we exclude that from traditional eCommerce merchandise marketplaces for comparative purpose.
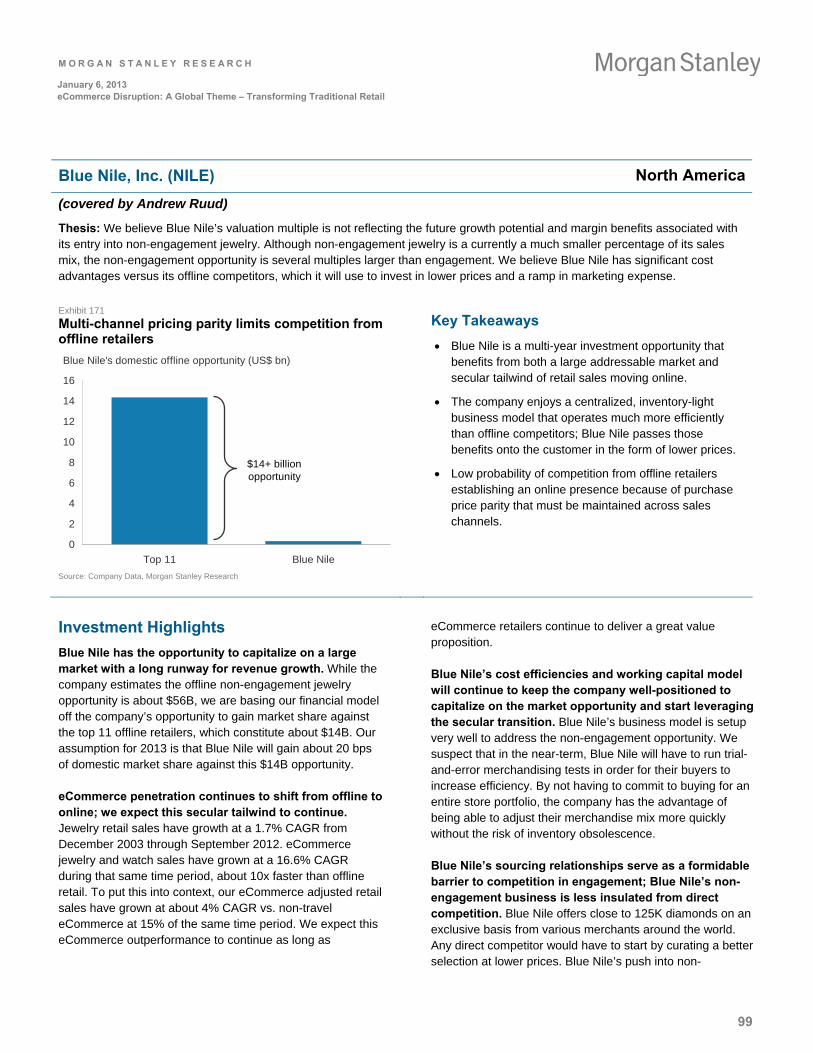
M O R G A N S T A N L E Y R E S E A R C H
99
January 6, 2013 eCommerce Disruption: A Global Theme – Transforming Traditional Retail
Blue Nile, Inc. (NILE) North America
(covered by Andrew Ruud)
Thesis: We believe Blue Nile’s valuation multiple is not reflecting the future growth potential and margin benefits associated with its entry into non-engagement jewelry. Although non-engagement jewelry is a currently a much smaller percentage of its sales mix, the non-engagement opportunity is several multiples larger than engagement. We believe Blue Nile has significant cost advantages versus its offline competitors, which it will use to invest in lower prices and a ramp in marketing expense.
Exhibit 171
Multi-channel pricing parity limits competition from offline retailers
Blue Nile's domestic offline opportunity (US$ bn)
0
2
4
6
8
10
12
14
16
Top 11 Blue Nile
$14+ billionopportunity
Source: Company Data, Morgan Stanley Research
Key Takeaways
Blue Nile is a multi-year investment opportunity that benefits from both a large addressable market and secular tailwind of retail sales moving online.
The company enjoys a centralized, inventory-light business model that operates much more efficiently than offline competitors; Blue Nile passes those benefits onto the customer in the form of lower prices.
Low probability of competition from offline retailers establishing an online presence because of purchase price parity that must be maintained across sales channels.
Investment Highlights
Blue Nile has the opportunity to capitalize on a large market with a long runway for revenue growth. While the company estimates the offline non-engagement jewelry opportunity is about $56B, we are basing our financial model off the company’s opportunity to gain market share against the top 11 offline retailers, which constitute about $14B. Our assumption for 2013 is that Blue Nile will gain about 20 bps of domestic market share against this $14B opportunity.
eCommerce penetration continues to shift from offline to online; we expect this secular tailwind to continue. Jewelry retail sales have growth at a 1.7% CAGR from December 2003 through September 2012. eCommerce jewelry and watch sales have grown at a 16.6% CAGR during that same time period, about 10x faster than offline retail. To put this into context, our eCommerce adjusted retail sales have grown at about 4% CAGR vs. non-travel eCommerce at 15% of the same time period. We expect this eCommerce outperformance to continue as long as
eCommerce retailers continue to deliver a great value proposition.
Blue Nile’s cost efficiencies and working capital model will continue to keep the company well-positioned to capitalize on the market opportunity and start leveraging the secular transition. Blue Nile’s business model is setup very well to address the non-engagement opportunity. We suspect that in the near-term, Blue Nile will have to run trial-and-error merchandising tests in order for their buyers to increase efficiency. By not having to commit to buying for an entire store portfolio, the company has the advantage of being able to adjust their merchandise mix more quickly without the risk of inventory obsolescence.
Blue Nile’s sourcing relationships serve as a formidable barrier to competition in engagement; Blue Nile’s non-engagement business is less insulated from direct competition. Blue Nile offers close to 125K diamonds on an exclusive basis from various merchants around the world. Any direct competitor would have to start by curating a better selection at lower prices. Blue Nile’s push into non-
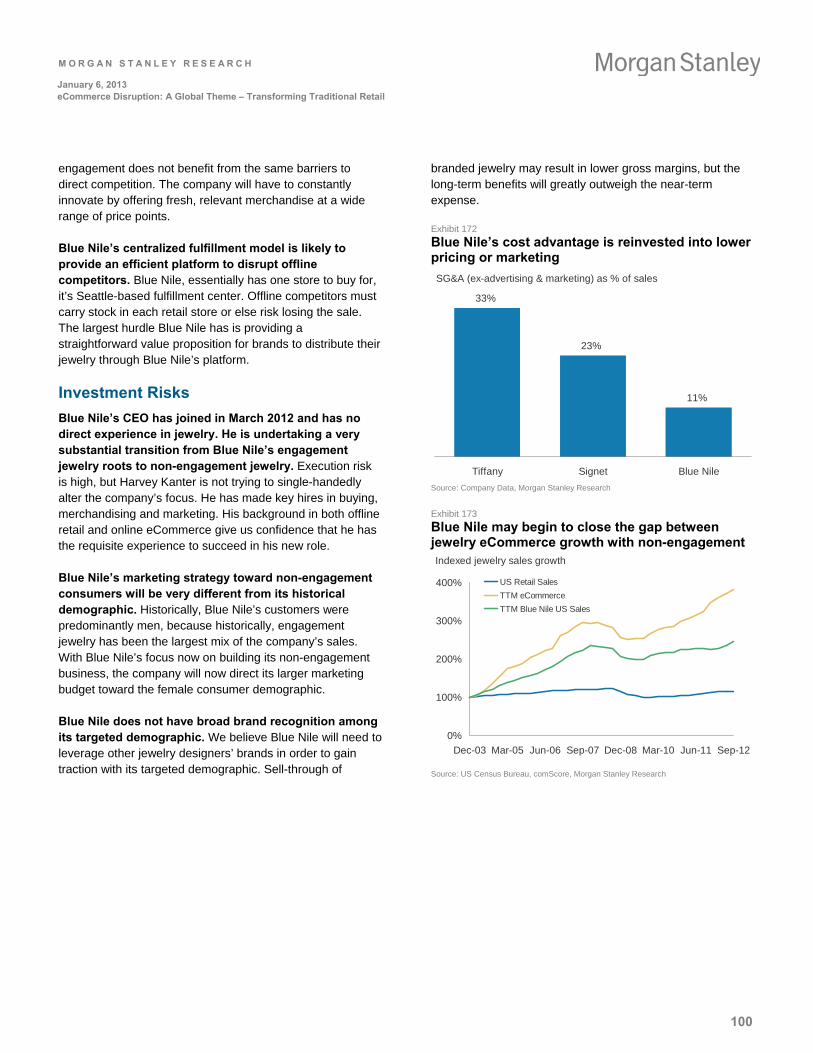
M O R G A N S T A N L E Y R E S E A R C H
100
January 6, 2013 eCommerce Disruption: A Global Theme – Transforming Traditional Retail
engagement does not benefit from the same barriers to direct competition. The company will have to constantly innovate by offering fresh, relevant merchandise at a wide range of price points.
Blue Nile’s centralized fulfillment model is likely to provide an efficient platform to disrupt offline competitors. Blue Nile, essentially has one store to buy for, it’s Seattle-based fulfillment center. Offline competitors must carry stock in each retail store or else risk losing the sale. The largest hurdle Blue Nile has is providing a straightforward value proposition for brands to distribute their jewelry through Blue Nile’s platform.
Investment Risks
Blue Nile’s CEO has joined in March 2012 and has no direct experience in jewelry. He is undertaking a very substantial transition from Blue Nile’s engagement jewelry roots to non-engagement jewelry. Execution risk is high, but Harvey Kanter is not trying to single-handedly alter the company’s focus. He has made key hires in buying, merchandising and marketing. His background in both offline retail and online eCommerce give us confidence that he has the requisite experience to succeed in his new role.
Blue Nile’s marketing strategy toward non-engagement consumers will be very different from its historical demographic. Historically, Blue Nile’s customers were predominantly men, because historically, engagement jewelry has been the largest mix of the company’s sales. With Blue Nile’s focus now on building its non-engagement business, the company will now direct its larger marketing budget toward the female consumer demographic.
Blue Nile does not have broad brand recognition among its targeted demographic. We believe Blue Nile will need to leverage other jewelry designers’ brands in order to gain traction with its targeted demographic. Sell-through of
branded jewelry may result in lower gross margins, but the long-term benefits will greatly outweigh the near-term expense.
Exhibit 172
Blue Nile’s cost advantage is reinvested into lower pricing or marketing
SG&A (ex-advertising & marketing) as % of sales
33%
23%
11%
Tiffany Signet Blue Nile
Source: Company Data, Morgan Stanley Research
Exhibit 173
Blue Nile may begin to close the gap between jewelry eCommerce growth with non-engagement Indexed jewelry sales growth
0%
100%
200%
300%
400%
Dec-03 Mar-05 Jun-06 Sep-07 Dec-08 Mar-10 Jun-11 Sep-12
US Retail Sales
TTM eCommerce
TTM Blue Nile US Sales
Source: US Census Bureau, comScore, Morgan Stanley Research
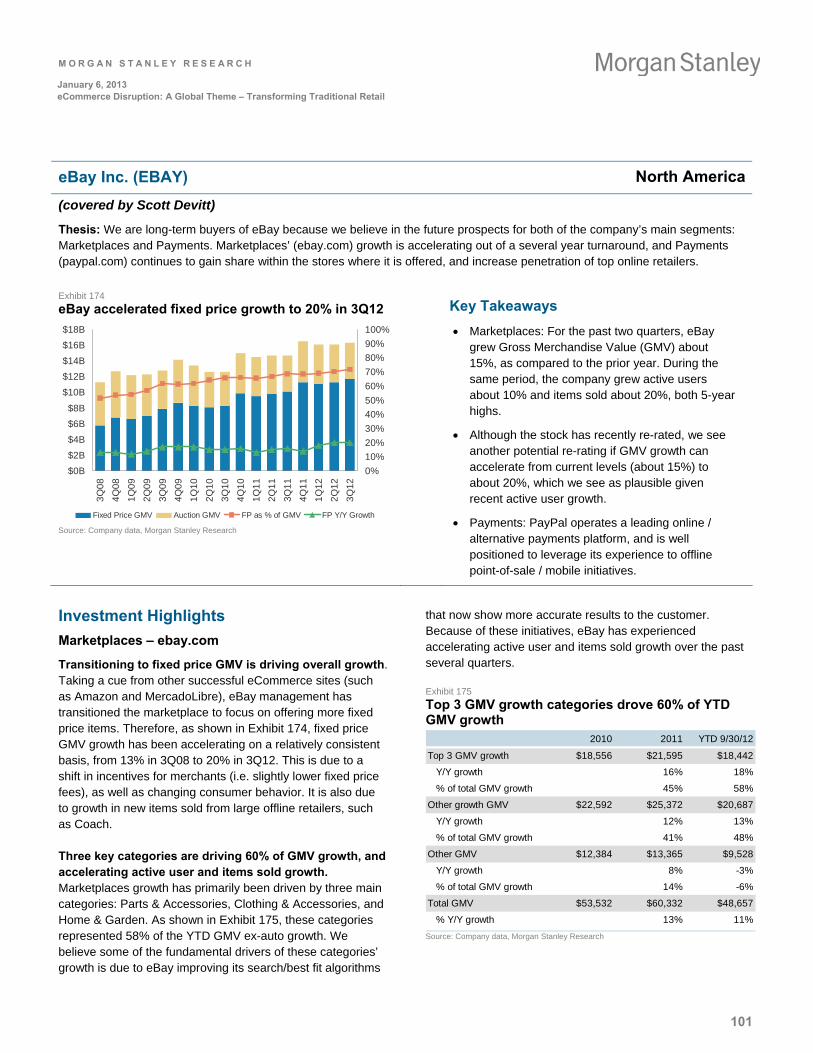
M O R G A N S T A N L E Y R E S E A R C H
101
January 6, 2013 eCommerce Disruption: A Global Theme – Transforming Traditional Retail
eBay Inc. (EBAY) North America
(covered by Scott Devitt)
Thesis: We are long-term buyers of eBay because we believe in the future prospects for both of the company’s main segments: Marketplaces and Payments. Marketplaces’ (ebay.com) growth is accelerating out of a several year turnaround, and Payments (paypal.com) continues to gain share within the stores where it is offered, and increase penetration of top online retailers.
Exhibit 174
eBay accelerated fixed price growth to 20% in 3Q12
$0B
$2B
$4B
$6B
$8B
$10B
$12B
$14B
$16B
$18B
3Q
08
4Q
08
1Q
09
2Q
09
3Q
09
4Q
09
1Q
10
2Q
10
3Q
10
4Q
10
1Q
11
2Q
11
3Q
11
4Q
11
1Q
12
2Q
12
3Q
12
0%
10%
20%
30%
40%
50%
60%
70%
80%
90%
100%
Fixed Price GMV Auction GMV FP as % of GMV FP Y/Y Growth
Source: Company data, Morgan Stanley Research
Key Takeaways
Marketplaces: For the past two quarters, eBay grew Gross Merchandise Value (GMV) about 15%, as compared to the prior year. During the same period, the company grew active users about 10% and items sold about 20%, both 5-year highs.
Although the stock has recently re-rated, we see another potential re-rating if GMV growth can accelerate from current levels (about 15%) to about 20%, which we see as plausible given recent active user growth.
Payments: PayPal operates a leading online / alternative payments platform, and is well positioned to leverage its experience to offline point-of-sale / mobile initiatives.
Investment Highlights
Marketplaces – ebay.com
Transitioning to fixed price GMV is driving overall growth. Taking a cue from other successful eCommerce sites (such as Amazon and MercadoLibre), eBay management has transitioned the marketplace to focus on offering more fixed price items. Therefore, as shown in Exhibit 174, fixed price GMV growth has been accelerating on a relatively consistent basis, from 13% in 3Q08 to 20% in 3Q12. This is due to a shift in incentives for merchants (i.e. slightly lower fixed price fees), as well as changing consumer behavior. It is also due to growth in new items sold from large offline retailers, such as Coach.
Three key categories are driving 60% of GMV growth, and accelerating active user and items sold growth. Marketplaces growth has primarily been driven by three main categories: Parts & Accessories, Clothing & Accessories, and Home & Garden. As shown in Exhibit 175, these categories represented 58% of the YTD GMV ex-auto growth. We believe some of the fundamental drivers of these categories’ growth is due to eBay improving its search/best fit algorithms
that now show more accurate results to the customer. Because of these initiatives, eBay has experienced accelerating active user and items sold growth over the past several quarters.
Exhibit 175
Top 3 GMV growth categories drove 60% of YTD GMV growth
2010 2011 YTD 9/30/12
Top 3 GMV growth $18,556 $21,595 $18,442
Y/Y growth 16% 18%
% of total GMV growth 45% 58%
Other growth GMV $22,592 $25,372 $20,687
Y/Y growth 12% 13%
% of total GMV growth 41% 48%
Other GMV $12,384 $13,365 $9,528
Y/Y growth 8% -3%
% of total GMV growth 14% -6%
Total GMV $53,532 $60,332 $48,657
% Y/Y growth 13% 11%
Source: Company data, Morgan Stanley Research
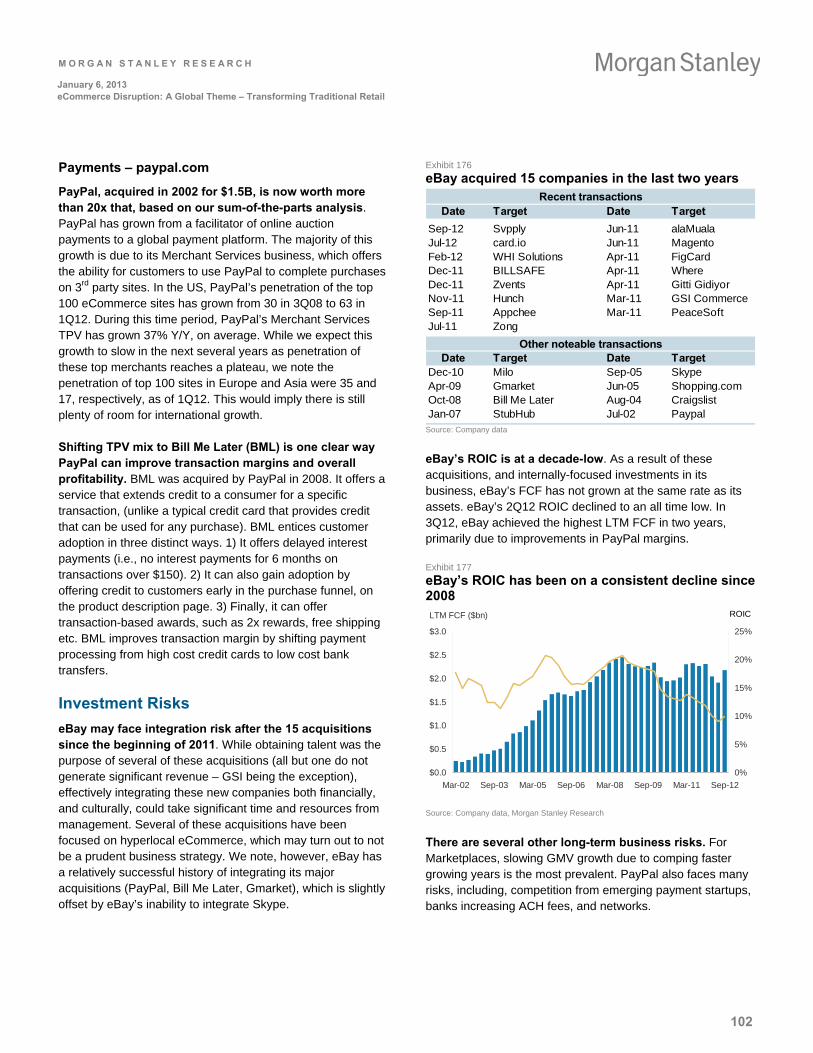
M O R G A N S T A N L E Y R E S E A R C H
102
January 6, 2013 eCommerce Disruption: A Global Theme – Transforming Traditional Retail
Payments – paypal.com
PayPal, acquired in 2002 for $1.5B, is now worth more than 20x that, based on our sum-of-the-parts analysis. PayPal has grown from a facilitator of online auction payments to a global payment platform. The majority of this growth is due to its Merchant Services business, which offers the ability for customers to use PayPal to complete purchases on 3rd party sites. In the US, PayPal’s penetration of the top 100 eCommerce sites has grown from 30 in 3Q08 to 63 in 1Q12. During this time period, PayPal’s Merchant Services TPV has grown 37% Y/Y, on average. While we expect this growth to slow in the next several years as penetration of these top merchants reaches a plateau, we note the penetration of top 100 sites in Europe and Asia were 35 and 17, respectively, as of 1Q12. This would imply there is still plenty of room for international growth.
Shifting TPV mix to Bill Me Later (BML) is one clear way PayPal can improve transaction margins and overall profitability. BML was acquired by PayPal in 2008. It offers a service that extends credit to a consumer for a specific transaction, (unlike a typical credit card that provides credit that can be used for any purchase). BML entices customer adoption in three distinct ways. 1) It offers delayed interest payments (i.e., no interest payments for 6 months on transactions over $150). 2) It can also gain adoption by offering credit to customers early in the purchase funnel, on the product description page. 3) Finally, it can offer transaction-based awards, such as 2x rewards, free shipping etc. BML improves transaction margin by shifting payment processing from high cost credit cards to low cost bank transfers.
Investment Risks
eBay may face integration risk after the 15 acquisitions since the beginning of 2011. While obtaining talent was the purpose of several of these acquisitions (all but one do not generate significant revenue – GSI being the exception), effectively integrating these new companies both financially, and culturally, could take significant time and resources from management. Several of these acquisitions have been focused on hyperlocal eCommerce, which may turn out to not be a prudent business strategy. We note, however, eBay has a relatively successful history of integrating its major acquisitions (PayPal, Bill Me Later, Gmarket), which is slightly offset by eBay’s inability to integrate Skype.
Exhibit 176
eBay acquired 15 companies in the last two years Recent transactions
Date Target Date Target
Sep-12 Svpply Jun-11 alaMualaJul-12 card.io Jun-11 MagentoFeb-12 WHI Solutions Apr-11 FigCardDec-11 BILLSAFE Apr-11 WhereDec-11 Zvents Apr-11 Gitti GidiyorNov-11 Hunch Mar-11 GSI CommerceSep-11 Appchee Mar-11 PeaceSoftJul-11 Zong
Other noteable transactionsDate Target Date Target
Dec-10 Milo Sep-05 SkypeApr-09 Gmarket Jun-05 Shopping.comOct-08 Bill Me Later Aug-04 CraigslistJan-07 StubHub Jul-02 Paypal
Source: Company data
eBay’s ROIC is at a decade-low. As a result of these acquisitions, and internally-focused investments in its business, eBay’s FCF has not grown at the same rate as its assets. eBay’s 2Q12 ROIC declined to an all time low. In 3Q12, eBay achieved the highest LTM FCF in two years, primarily due to improvements in PayPal margins.
Exhibit 177
eBay’s ROIC has been on a consistent decline since 2008 LTM FCF ($bn)
$0.0
$0.5
$1.0
$1.5
$2.0
$2.5
$3.0
Mar-02 Sep-03 Mar-05 Sep-06 Mar-08 Sep-09 Mar-11 Sep-12
0%
5%
10%
15%
20%
25%
ROIC
Source: Company data, Morgan Stanley Research
There are several other long-term business risks. For Marketplaces, slowing GMV growth due to comping faster growing years is the most prevalent. PayPal also faces many risks, including, competition from emerging payment startups, banks increasing ACH fees, and networks.
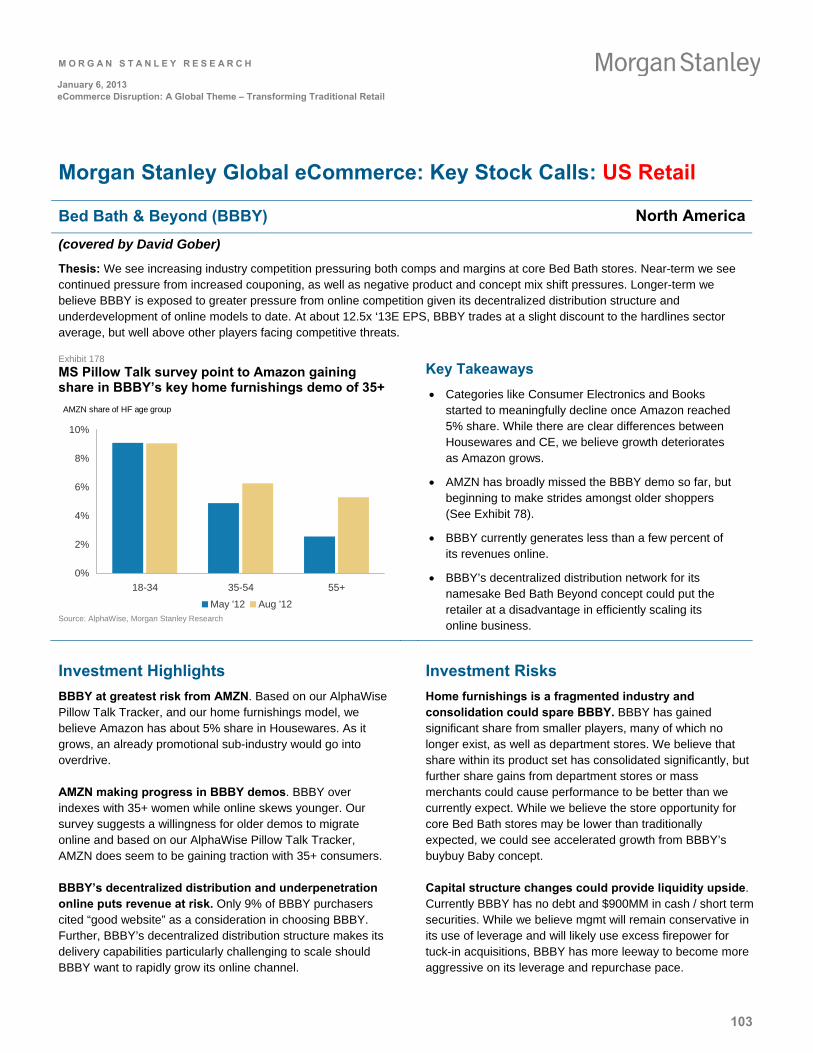
M O R G A N S T A N L E Y R E S E A R C H
103
January 6, 2013 eCommerce Disruption: A Global Theme – Transforming Traditional Retail
Morgan Stanley Global eCommerce: Key Stock Calls: US Retail
Bed Bath & Beyond (BBBY) North America
(covered by David Gober)
Thesis: We see increasing industry competition pressuring both comps and margins at core Bed Bath stores. Near-term we see continued pressure from increased couponing, as well as negative product and concept mix shift pressures. Longer-term we believe BBBY is exposed to greater pressure from online competition given its decentralized distribution structure and underdevelopment of online models to date. At about 12.5x ‘13E EPS, BBBY trades at a slight discount to the hardlines sector average, but well above other players facing competitive threats. Exhibit 178
MS Pillow Talk survey point to Amazon gaining share in BBBY’s key home furnishings demo of 35+
0%
2%
4%
6%
8%
10%
18-34 35-54 55+
May '12 Aug '12
AMZN share of HF age group
Source: AlphaWise, Morgan Stanley Research
Key Takeaways
Categories like Consumer Electronics and Books started to meaningfully decline once Amazon reached 5% share. While there are clear differences between Housewares and CE, we believe growth deteriorates as Amazon grows.
AMZN has broadly missed the BBBY demo so far, but beginning to make strides amongst older shoppers (See Exhibit 78).
BBBY currently generates less than a few percent of its revenues online.
BBBY’s decentralized distribution network for its namesake Bed Bath Beyond concept could put the retailer at a disadvantage in efficiently scaling its online business.
Investment Highlights
BBBY at greatest risk from AMZN. Based on our AlphaWise Pillow Talk Tracker, and our home furnishings model, we believe Amazon has about 5% share in Housewares. As it grows, an already promotional sub-industry would go into overdrive.
AMZN making progress in BBBY demos. BBBY over indexes with 35+ women while online skews younger. Our survey suggests a willingness for older demos to migrate online and based on our AlphaWise Pillow Talk Tracker, AMZN does seem to be gaining traction with 35+ consumers.
BBBY’s decentralized distribution and underpenetration online puts revenue at risk. Only 9% of BBBY purchasers cited “good website” as a consideration in choosing BBBY. Further, BBBY’s decentralized distribution structure makes its delivery capabilities particularly challenging to scale should BBBY want to rapidly grow its online channel.
Investment Risks
Home furnishings is a fragmented industry and consolidation could spare BBBY. BBBY has gained significant share from smaller players, many of which no longer exist, as well as department stores. We believe that share within its product set has consolidated significantly, but further share gains from department stores or mass merchants could cause performance to be better than we currently expect. While we believe the store opportunity for core Bed Bath stores may be lower than traditionally expected, we could see accelerated growth from BBBY’s buybuy Baby concept.
Capital structure changes could provide liquidity upside. Currently BBBY has no debt and $900MM in cash / short term securities. While we believe mgmt will remain conservative in its use of leverage and will likely use excess firepower for tuck-in acquisitions, BBBY has more leeway to become more aggressive on its leverage and repurchase pace.
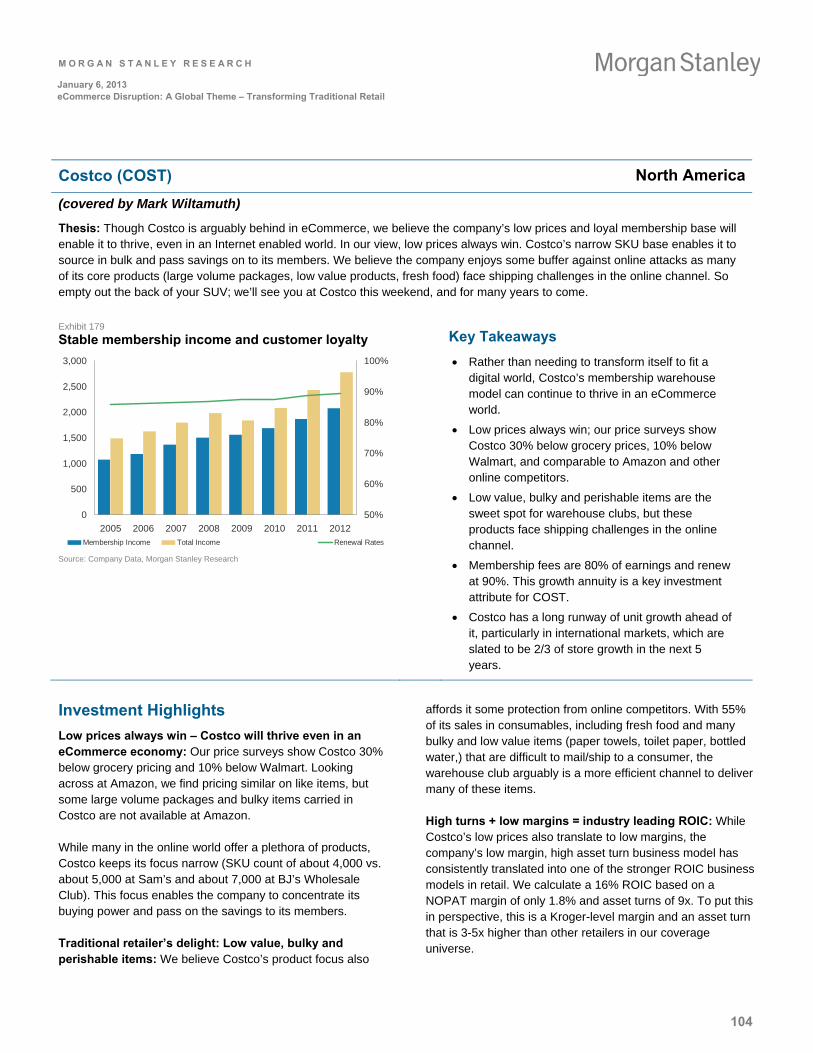
M O R G A N S T A N L E Y R E S E A R C H
104
January 6, 2013 eCommerce Disruption: A Global Theme – Transforming Traditional Retail
Costco (COST) North America
(covered by Mark Wiltamuth)
Thesis: Though Costco is arguably behind in eCommerce, we believe the company’s low prices and loyal membership base will enable it to thrive, even in an Internet enabled world. In our view, low prices always win. Costco’s narrow SKU base enables it to source in bulk and pass savings on to its members. We believe the company enjoys some buffer against online attacks as many of its core products (large volume packages, low value products, fresh food) face shipping challenges in the online channel. So empty out the back of your SUV; we’ll see you at Costco this weekend, and for many years to come.
Exhibit 179
Stable membership income and customer loyalty
0
500
1,000
1,500
2,000
2,500
3,000
2005 2006 2007 2008 2009 2010 2011 2012
50%
60%
70%
80%
90%
100%
Membership Income Total Income Renewal Rates
Source: Company Data, Morgan Stanley Research
Key Takeaways
Rather than needing to transform itself to fit a digital world, Costco’s membership warehouse model can continue to thrive in an eCommerce world.
Low prices always win; our price surveys show Costco 30% below grocery prices, 10% below Walmart, and comparable to Amazon and other online competitors.
Low value, bulky and perishable items are the sweet spot for warehouse clubs, but these products face shipping challenges in the online channel.
Membership fees are 80% of earnings and renew at 90%. This growth annuity is a key investment attribute for COST.
Costco has a long runway of unit growth ahead of it, particularly in international markets, which are slated to be 2/3 of store growth in the next 5 years.
Investment Highlights
Low prices always win – Costco will thrive even in an eCommerce economy: Our price surveys show Costco 30% below grocery pricing and 10% below Walmart. Looking across at Amazon, we find pricing similar on like items, but some large volume packages and bulky items carried in Costco are not available at Amazon.
While many in the online world offer a plethora of products, Costco keeps its focus narrow (SKU count of about 4,000 vs. about 5,000 at Sam’s and about 7,000 at BJ’s Wholesale Club). This focus enables the company to concentrate its buying power and pass on the savings to its members.
Traditional retailer’s delight: Low value, bulky and perishable items: We believe Costco’s product focus also
affords it some protection from online competitors. With 55% of its sales in consumables, including fresh food and many bulky and low value items (paper towels, toilet paper, bottled water,) that are difficult to mail/ship to a consumer, the warehouse club arguably is a more efficient channel to deliver many of these items.
High turns + low margins = industry leading ROIC: While Costco’s low prices also translate to low margins, the company’s low margin, high asset turn business model has consistently translated into one of the stronger ROIC business models in retail. We calculate a 16% ROIC based on a NOPAT margin of only 1.8% and asset turns of 9x. To put this in perspective, this is a Kroger-level margin and an asset turn that is 3-5x higher than other retailers in our coverage universe.
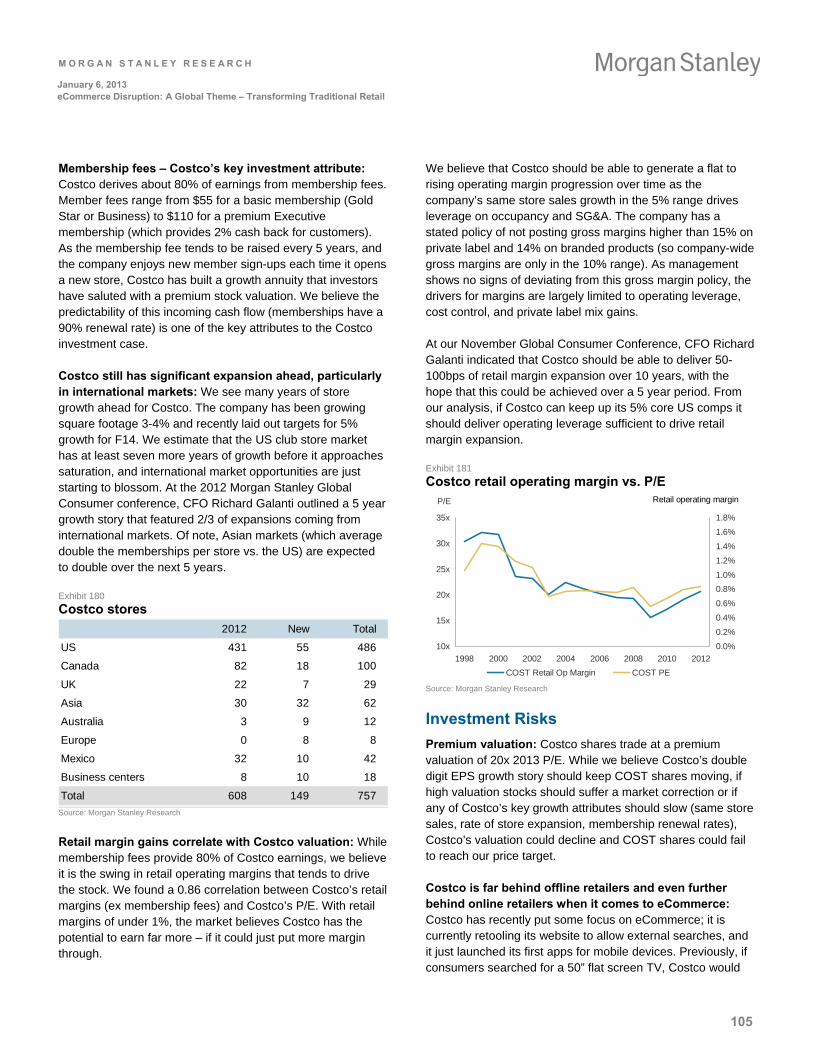
M O R G A N S T A N L E Y R E S E A R C H
105
January 6, 2013 eCommerce Disruption: A Global Theme – Transforming Traditional Retail
Membership fees – Costco’s key investment attribute: Costco derives about 80% of earnings from membership fees. Member fees range from $55 for a basic membership (Gold Star or Business) to $110 for a premium Executive membership (which provides 2% cash back for customers). As the membership fee tends to be raised every 5 years, and the company enjoys new member sign-ups each time it opens a new store, Costco has built a growth annuity that investors have saluted with a premium stock valuation. We believe the predictability of this incoming cash flow (memberships have a 90% renewal rate) is one of the key attributes to the Costco investment case.
Costco still has significant expansion ahead, particularly in international markets: We see many years of store growth ahead for Costco. The company has been growing square footage 3-4% and recently laid out targets for 5% growth for F14. We estimate that the US club store market has at least seven more years of growth before it approaches saturation, and international market opportunities are just starting to blossom. At the 2012 Morgan Stanley Global Consumer conference, CFO Richard Galanti outlined a 5 year growth story that featured 2/3 of expansions coming from international markets. Of note, Asian markets (which average double the memberships per store vs. the US) are expected to double over the next 5 years.
Exhibit 180
Costco stores
2012 New Total
US 431 55 486
Canada 82 18 100
UK 22 7 29
Asia 30 32 62
Australia 3 9 12
Europe 0 8 8
Mexico 32 10 42
Business centers 8 10 18
Total 608 149 757
Source: Morgan Stanley Research
Retail margin gains correlate with Costco valuation: While membership fees provide 80% of Costco earnings, we believe it is the swing in retail operating margins that tends to drive the stock. We found a 0.86 correlation between Costco’s retail margins (ex membership fees) and Costco’s P/E. With retail margins of under 1%, the market believes Costco has the potential to earn far more – if it could just put more margin through.
We believe that Costco should be able to generate a flat to rising operating margin progression over time as the company’s same store sales growth in the 5% range drives leverage on occupancy and SG&A. The company has a stated policy of not posting gross margins higher than 15% on private label and 14% on branded products (so company-wide gross margins are only in the 10% range). As management shows no signs of deviating from this gross margin policy, the drivers for margins are largely limited to operating leverage, cost control, and private label mix gains.
At our November Global Consumer Conference, CFO Richard Galanti indicated that Costco should be able to deliver 50-100bps of retail margin expansion over 10 years, with the hope that this could be achieved over a 5 year period. From our analysis, if Costco can keep up its 5% core US comps it should deliver operating leverage sufficient to drive retail margin expansion.
Exhibit 181
Costco retail operating margin vs. P/E
10x
15x
20x
25x
30x
35x
1998 2000 2002 2004 2006 2008 2010 2012
P/E
0.0%
0.2%
0.4%
0.6%
0.8%
1.0%
1.2%
1.4%
1.6%
1.8%
COST Retail Op Margin COST PE
Retail operating margin
Source: Morgan Stanley Research
Investment Risks
Premium valuation: Costco shares trade at a premium valuation of 20x 2013 P/E. While we believe Costco’s double digit EPS growth story should keep COST shares moving, if high valuation stocks should suffer a market correction or if any of Costco’s key growth attributes should slow (same store sales, rate of store expansion, membership renewal rates), Costco’s valuation could decline and COST shares could fail to reach our price target.
Costco is far behind offline retailers and even further behind online retailers when it comes to eCommerce: Costco has recently put some focus on eCommerce; it is currently retooling its website to allow external searches, and it just launched its first apps for mobile devices. Previously, if consumers searched for a 50” flat screen TV, Costco would
M O R G A N S T A N L E Y R E S E A R C H
106
January 6, 2013 eCommerce Disruption: A Global Theme – Transforming Traditional Retail
not even show up as a retailer of these products. But while this is a step in the right direction, it is only a small step. eCommerce is not the focus at Costco, and we do not see that changing any time soon.
Discretionary sales still vulnerable: While consumables sales are protected from eCommerce incursions by shipping
barriers, inventory shrink challenges and other factors, if discretionary sales (TVs, electronics, home categories, etc) erode significantly due to Internet competition, overall same store sales for Costco could fade, and our thesis of Costco winning in an Internet economy could prove incorrect.
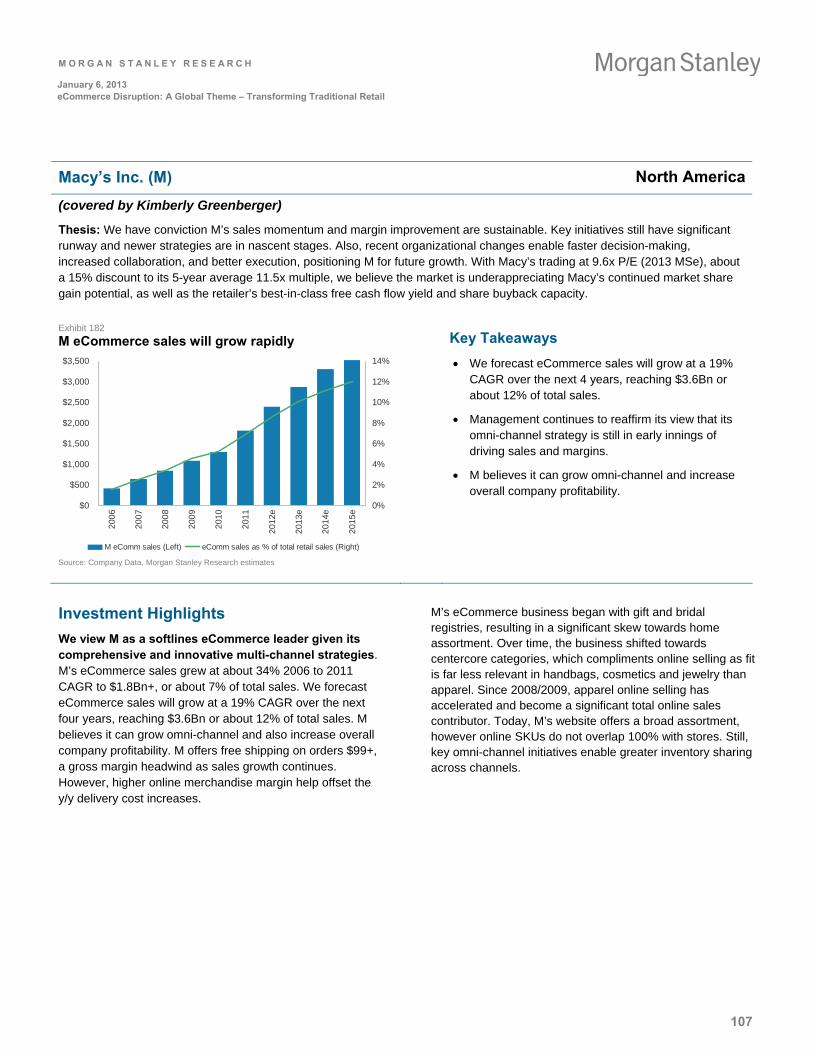
M O R G A N S T A N L E Y R E S E A R C H
107
January 6, 2013 eCommerce Disruption: A Global Theme – Transforming Traditional Retail
Macy’s Inc. (M) North America
(covered by Kimberly Greenberger)
Thesis: We have conviction M’s sales momentum and margin improvement are sustainable. Key initiatives still have significant runway and newer strategies are in nascent stages. Also, recent organizational changes enable faster decision-making, increased collaboration, and better execution, positioning M for future growth. With Macy’s trading at 9.6x P/E (2013 MSe), about a 15% discount to its 5-year average 11.5x multiple, we believe the market is underappreciating Macy’s continued market share gain potential, as well as the retailer’s best-in-class free cash flow yield and share buyback capacity.
Exhibit 182
M eCommerce sales will grow rapidly
$0
$500
$1,000
$1,500
$2,000
$2,500
$3,000
$3,500
200
6
200
7
200
8
200
9
201
0
201
1
2012
e
2013
e
2014
e
2015
e
0%
2%
4%
6%
8%
10%
12%
14%
M eComm sales (Left) eComm sales as % of total retail sales (Right)
Source: Company Data, Morgan Stanley Research estimates
Key Takeaways
We forecast eCommerce sales will grow at a 19% CAGR over the next 4 years, reaching $3.6Bn or about 12% of total sales.
Management continues to reaffirm its view that its omni-channel strategy is still in early innings of driving sales and margins.
M believes it can grow omni-channel and increase overall company profitability.
Investment Highlights
We view M as a softlines eCommerce leader given its comprehensive and innovative multi-channel strategies. M’s eCommerce sales grew at about 34% 2006 to 2011 CAGR to $1.8Bn+, or about 7% of total sales. We forecast eCommerce sales will grow at a 19% CAGR over the next four years, reaching $3.6Bn or about 12% of total sales. M believes it can grow omni-channel and also increase overall company profitability. M offers free shipping on orders $99+, a gross margin headwind as sales growth continues. However, higher online merchandise margin help offset the y/y delivery cost increases.
M’s eCommerce business began with gift and bridal registries, resulting in a significant skew towards home assortment. Over time, the business shifted towards centercore categories, which compliments online selling as fit is far less relevant in handbags, cosmetics and jewelry than apparel. Since 2008/2009, apparel online selling has accelerated and become a significant total online sales contributor. Today, M’s website offers a broad assortment, however online SKUs do not overlap 100% with stores. Still, key omni-channel initiatives enable greater inventory sharing across channels.
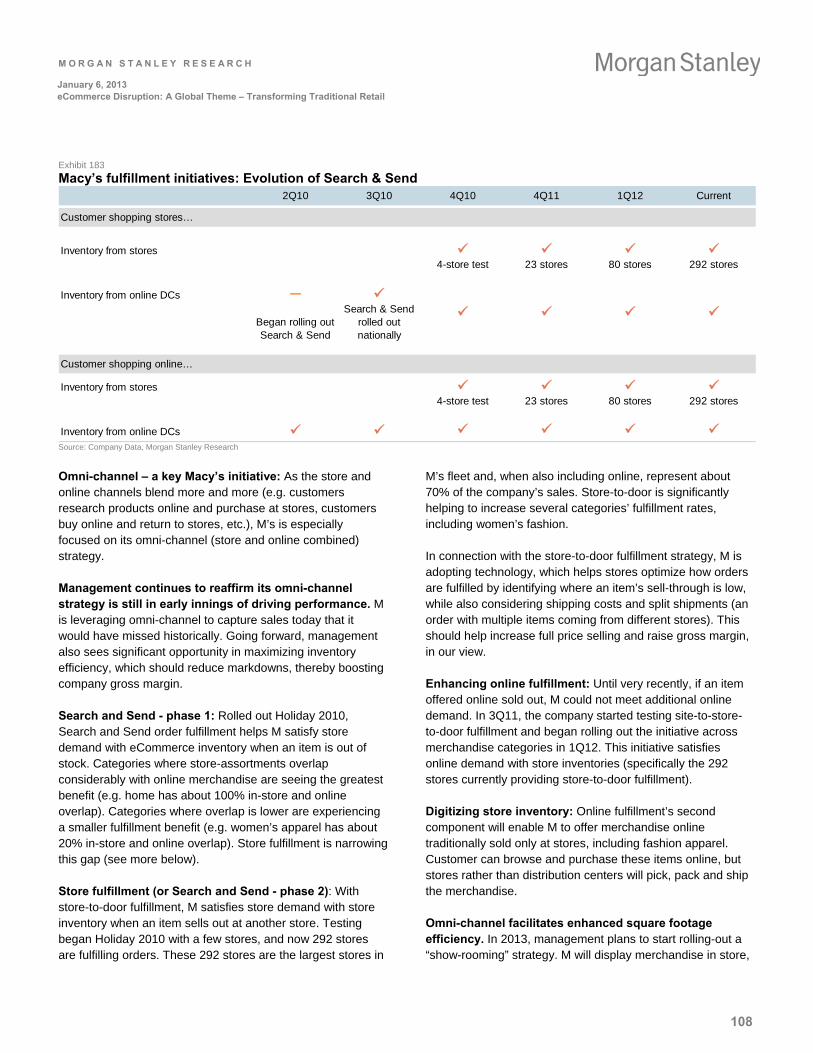
M O R G A N S T A N L E Y R E S E A R C H
108
January 6, 2013 eCommerce Disruption: A Global Theme – Transforming Traditional Retail
Exhibit 183
Macy’s fulfillment initiatives: Evolution of Search & Send 2Q10 3Q10 4Q10 4Q11 1Q12 Current
Customer shopping stores…
Inventory from stores 4-store test 23 stores 80 stores 292 stores
Inventory from online DCs ─
Began rolling out Search & Send
Search & Send rolled out nationally
Customer shopping online…
Inventory from stores 4-store test 23 stores 80 stores 292 stores
Inventory from online DCs
Source: Company Data, Morgan Stanley Research
Omni-channel – a key Macy’s initiative: As the store and online channels blend more and more (e.g. customers research products online and purchase at stores, customers buy online and return to stores, etc.), M’s is especially focused on its omni-channel (store and online combined) strategy.
Management continues to reaffirm its omni-channel strategy is still in early innings of driving performance. M is leveraging omni-channel to capture sales today that it would have missed historically. Going forward, management also sees significant opportunity in maximizing inventory efficiency, which should reduce markdowns, thereby boosting company gross margin.
Search and Send - phase 1: Rolled out Holiday 2010, Search and Send order fulfillment helps M satisfy store demand with eCommerce inventory when an item is out of stock. Categories where store-assortments overlap considerably with online merchandise are seeing the greatest benefit (e.g. home has about 100% in-store and online overlap). Categories where overlap is lower are experiencing a smaller fulfillment benefit (e.g. women’s apparel has about 20% in-store and online overlap). Store fulfillment is narrowing this gap (see more below).
Store fulfillment (or Search and Send - phase 2): With store-to-door fulfillment, M satisfies store demand with store inventory when an item sells out at another store. Testing began Holiday 2010 with a few stores, and now 292 stores are fulfilling orders. These 292 stores are the largest stores in
M’s fleet and, when also including online, represent about 70% of the company’s sales. Store-to-door is significantly helping to increase several categories’ fulfillment rates, including women’s fashion.
In connection with the store-to-door fulfillment strategy, M is adopting technology, which helps stores optimize how orders are fulfilled by identifying where an item’s sell-through is low, while also considering shipping costs and split shipments (an order with multiple items coming from different stores). This should help increase full price selling and raise gross margin, in our view.
Enhancing online fulfillment: Until very recently, if an item offered online sold out, M could not meet additional online demand. In 3Q11, the company started testing site-to-store-to-door fulfillment and began rolling out the initiative across merchandise categories in 1Q12. This initiative satisfies online demand with store inventories (specifically the 292 stores currently providing store-to-door fulfillment).
Digitizing store inventory: Online fulfillment’s second component will enable M to offer merchandise online traditionally sold only at stores, including fashion apparel. Customer can browse and purchase these items online, but stores rather than distribution centers will pick, pack and ship the merchandise.
Omni-channel facilitates enhanced square footage efficiency. In 2013, management plans to start rolling-out a “show-rooming” strategy. M will display merchandise in store,
M O R G A N S T A N L E Y R E S E A R C H
109
January 6, 2013 eCommerce Disruption: A Global Theme – Transforming Traditional Retail
which typically sells well online, but only carry the inventory at its distribution centers. The company is already featuring lamps and window treatment displays in stores. In addition, the company will also roll-out in-store pick-up in 2013. Through strategies like “show-rooming” and in-store pick-up, M’s store base becomes a competitive advantage vs. online only retailers.
Macy’s is making significant investments in expanding online distribution, including building a $150MM, 1.3MM square foot distribution center in Martinsburg, West Virginia, which opened June 2012 to fulfill Eastern US orders. In addition, M announced plans in January 2011 to add 725 new eCommerce positions over two years, expanding its Macys.com and Bloomingdales.com marketing, merchandising and operations organizations as well as Macy’s Systems & Technology organization. Further, the company indicated it would add nearly 3,500 full-time, part-time and seasonal holiday associates to bolster online expansion.
Online selling insights are supporting the My Macy’s strategy: My Macy’s helps the department store grow sales by tailoring in-store merchandise assortments and sizes, marketing, and overall shopping experience to local preferences. Online selling is particularly useful in providing insights to help M re-assort each store’s inventory. For instance, management found that wide-calf, tall boots sold exceptionally well online (representing about 20% of online tall boot sales vs. 3% of stores’ tall boot sales). The company was able to use shipping data to determine where the boots sold best, and added more inventory to stores in those particular markets.
Margin opportunities are ongoing -- RFID could be the next leg: M is currently testing radio-frequency identification (RFID) technology, anticipating a Spring 2013 storewide roll-out. With RFID, Macy’s store associates can count inventory significantly faster, enabling multiple counts throughout the
year. Currently, the associates take physical inventory once a year. On average, testing indicates inventory accuracy can reach a steady 97% or better with RFID. In addition, RFID compliments M’s omni-channel strategy, enabling M to get the right inventory to the right place and find inventory quickly within its channels to satisfy demand.
Using eCommerce to expand internationally: Management stresses that any potential international Macy’s strategy must be in a region where the retailer could have a headquarters presence and scale, making China a logical market. In addition, international tourism and Thanksgiving Day parade broadcasts have familiarized many Chinese customers with the Macy’s brand. However, management believes there is still a “great deal” to learn about Chinese shopping patterns and merchandise preferences.
In May 2012, M announced plans to sell private branded goods (e.g. M’s I.N.C. brand) on Chinese eCommerce site omei.com beginning Spring 2013 and invest $15M in its parent company, VIPStore Co. This agreement provides M an opportunity to “test the waters” in China without putting significant capital at risk. In addition, management indicated eCommerce would likely play key a role in its China strategy longer-term given how quickly the business is growing.
Investment Risks
As a softlines retail eCommerce trailblazer, M faces future ROIC uncertainty. Ongoing technology advancements and quickly changing customer preferences produce a shifting eCommerce competitive landscape. To remain ahead of the curve, M needs to make significant annual eCommerce and IT investments, in our view. However, the eCommerce selling channel is new and recent innovations’ potential returns are relatively unknown (e.g. cross channel fulfillment, RFID implementation, etc.). In addition, we think relative to specialty retailers M’s business complexity and high SKU count make each initiative harder to implement.
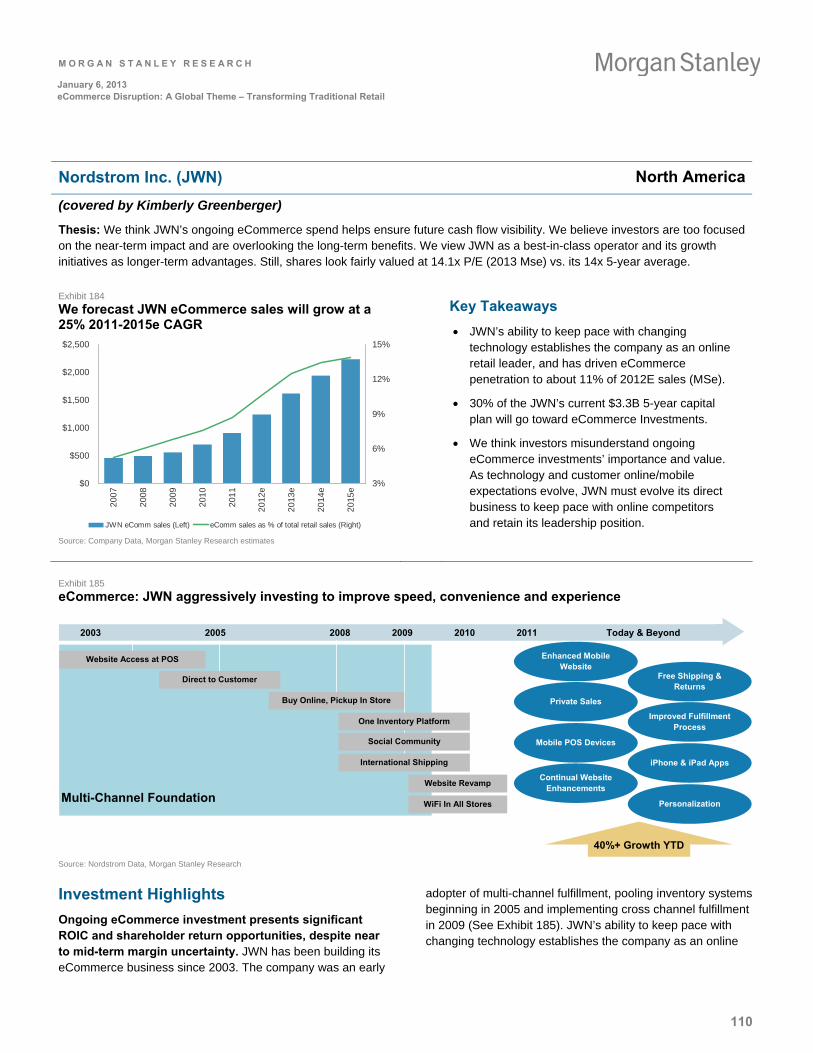
M O R G A N S T A N L E Y R E S E A R C H
110
January 6, 2013 eCommerce Disruption: A Global Theme – Transforming Traditional Retail
Nordstrom Inc. (JWN) North America
(covered by Kimberly Greenberger)
Thesis: We think JWN’s ongoing eCommerce spend helps ensure future cash flow visibility. We believe investors are too focused on the near-term impact and are overlooking the long-term benefits. We view JWN as a best-in-class operator and its growth initiatives as longer-term advantages. Still, shares look fairly valued at 14.1x P/E (2013 Mse) vs. its 14x 5-year average.
Exhibit 184
We forecast JWN eCommerce sales will grow at a 25% 2011-2015e CAGR
$0
$500
$1,000
$1,500
$2,000
$2,500
200
7
200
8
200
9
201
0
201
1
20
12e
20
13e
20
14e
20
15e
3%
6%
9%
12%
15%
JWN eComm sales (Left) eComm sales as % of total retail sales (Right)
Source: Company Data, Morgan Stanley Research estimates
Key Takeaways
JWN’s ability to keep pace with changing technology establishes the company as an online retail leader, and has driven eCommerce penetration to about 11% of 2012E sales (MSe).
30% of the JWN’s current $3.3B 5-year capital plan will go toward eCommerce Investments.
We think investors misunderstand ongoing eCommerce investments’ importance and value. As technology and customer online/mobile expectations evolve, JWN must evolve its direct business to keep pace with online competitors and retain its leadership position.
Exhibit 185
eCommerce: JWN aggressively investing to improve speed, convenience and experience
2003 2005 2008 2009 2010 2011 Today & Beyond
Website Access at POS
Direct to Customer
Buy Online, Pickup In Store
One Inventory Platform
Social Community
International Shipping
Enhanced Mobile Website
Private Sales
Mobile POS Devices
Continual Website Enhancements
Free Shipping & Returns
Improved Fulfillment Process
iPhone & iPad Apps
Personalization
40%+ Growth YTD
Website Revamp
WiFi In All StoresMulti-Channel Foundation
Source: Nordstrom Data, Morgan Stanley Research
Investment Highlights
Ongoing eCommerce investment presents significant ROIC and shareholder return opportunities, despite near to mid-term margin uncertainty. JWN has been building its eCommerce business since 2003. The company was an early
adopter of multi-channel fulfillment, pooling inventory systems beginning in 2005 and implementing cross channel fulfillment in 2009 (See Exhibit 185). JWN’s ability to keep pace with changing technology establishes the company as an online
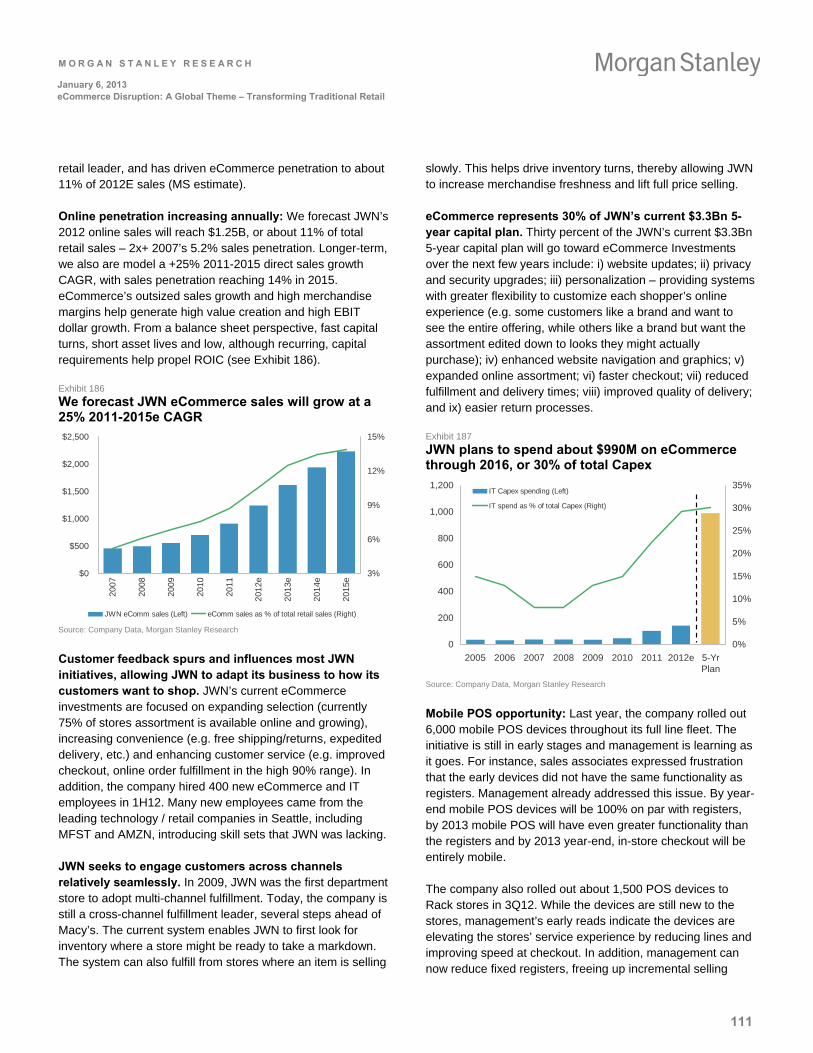
M O R G A N S T A N L E Y R E S E A R C H
111
January 6, 2013 eCommerce Disruption: A Global Theme – Transforming Traditional Retail
retail leader, and has driven eCommerce penetration to about 11% of 2012E sales (MS estimate).
Online penetration increasing annually: We forecast JWN’s 2012 online sales will reach $1.25B, or about 11% of total retail sales – 2x+ 2007’s 5.2% sales penetration. Longer-term, we also are model a +25% 2011-2015 direct sales growth CAGR, with sales penetration reaching 14% in 2015. eCommerce’s outsized sales growth and high merchandise margins help generate high value creation and high EBIT dollar growth. From a balance sheet perspective, fast capital turns, short asset lives and low, although recurring, capital requirements help propel ROIC (see Exhibit 186).
Exhibit 186
We forecast JWN eCommerce sales will grow at a 25% 2011-2015e CAGR
$0
$500
$1,000
$1,500
$2,000
$2,500
2007
2008
2009
2010
2011
201
2e
201
3e
201
4e
201
5e
3%
6%
9%
12%
15%
JWN eComm sales (Left) eComm sales as % of total retail sales (Right)
Source: Company Data, Morgan Stanley Research
Customer feedback spurs and influences most JWN initiatives, allowing JWN to adapt its business to how its customers want to shop. JWN’s current eCommerce investments are focused on expanding selection (currently 75% of stores assortment is available online and growing), increasing convenience (e.g. free shipping/returns, expedited delivery, etc.) and enhancing customer service (e.g. improved checkout, online order fulfillment in the high 90% range). In addition, the company hired 400 new eCommerce and IT employees in 1H12. Many new employees came from the leading technology / retail companies in Seattle, including MFST and AMZN, introducing skill sets that JWN was lacking.
JWN seeks to engage customers across channels relatively seamlessly. In 2009, JWN was the first department store to adopt multi-channel fulfillment. Today, the company is still a cross-channel fulfillment leader, several steps ahead of Macy’s. The current system enables JWN to first look for inventory where a store might be ready to take a markdown. The system can also fulfill from stores where an item is selling
slowly. This helps drive inventory turns, thereby allowing JWN to increase merchandise freshness and lift full price selling.
eCommerce represents 30% of JWN’s current $3.3Bn 5-year capital plan. Thirty percent of the JWN’s current $3.3Bn 5-year capital plan will go toward eCommerce Investments over the next few years include: i) website updates; ii) privacy and security upgrades; iii) personalization – providing systems with greater flexibility to customize each shopper’s online experience (e.g. some customers like a brand and want to see the entire offering, while others like a brand but want the assortment edited down to looks they might actually purchase); iv) enhanced website navigation and graphics; v) expanded online assortment; vi) faster checkout; vii) reduced fulfillment and delivery times; viii) improved quality of delivery; and ix) easier return processes.
Exhibit 187
JWN plans to spend about $990M on eCommerce through 2016, or 30% of total Capex
0
200
400
600
800
1,000
1,200
2005 2006 2007 2008 2009 2010 2011 2012e 5-YrPlan
0%
5%
10%
15%
20%
25%
30%
35%IT Capex spending (Left)
IT spend as % of total Capex (Right)
Source: Company Data, Morgan Stanley Research
Mobile POS opportunity: Last year, the company rolled out 6,000 mobile POS devices throughout its full line fleet. The initiative is still in early stages and management is learning as it goes. For instance, sales associates expressed frustration that the early devices did not have the same functionality as registers. Management already addressed this issue. By year-end mobile POS devices will be 100% on par with registers, by 2013 mobile POS will have even greater functionality than the registers and by 2013 year-end, in-store checkout will be entirely mobile.
The company also rolled out about 1,500 POS devices to Rack stores in 3Q12. While the devices are still new to the stores, management’s early reads indicate the devices are elevating the stores’ service experience by reducing lines and improving speed at checkout. In addition, management can now reduce fixed registers, freeing up incremental selling
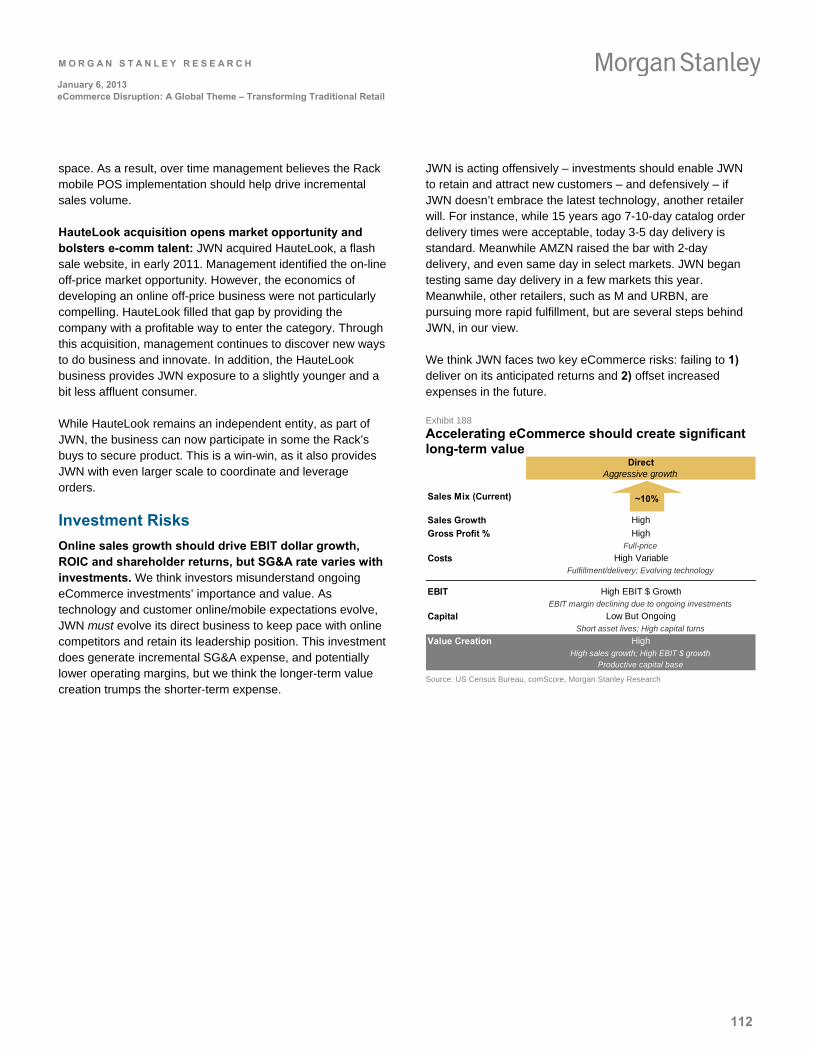
M O R G A N S T A N L E Y R E S E A R C H
112
January 6, 2013 eCommerce Disruption: A Global Theme – Transforming Traditional Retail
space. As a result, over time management believes the Rack mobile POS implementation should help drive incremental sales volume.
HauteLook acquisition opens market opportunity and bolsters e-comm talent: JWN acquired HauteLook, a flash sale website, in early 2011. Management identified the on-line off-price market opportunity. However, the economics of developing an online off-price business were not particularly compelling. HauteLook filled that gap by providing the company with a profitable way to enter the category. Through this acquisition, management continues to discover new ways to do business and innovate. In addition, the HauteLook business provides JWN exposure to a slightly younger and a bit less affluent consumer.
While HauteLook remains an independent entity, as part of JWN, the business can now participate in some the Rack’s buys to secure product. This is a win-win, as it also provides JWN with even larger scale to coordinate and leverage orders.
Investment Risks
Online sales growth should drive EBIT dollar growth, ROIC and shareholder returns, but SG&A rate varies with investments. We think investors misunderstand ongoing eCommerce investments’ importance and value. As technology and customer online/mobile expectations evolve, JWN must evolve its direct business to keep pace with online competitors and retain its leadership position. This investment does generate incremental SG&A expense, and potentially lower operating margins, but we think the longer-term value creation trumps the shorter-term expense.
JWN is acting offensively – investments should enable JWN to retain and attract new customers – and defensively – if JWN doesn’t embrace the latest technology, another retailer will. For instance, while 15 years ago 7-10-day catalog order delivery times were acceptable, today 3-5 day delivery is standard. Meanwhile AMZN raised the bar with 2-day delivery, and even same day in select markets. JWN began testing same day delivery in a few markets this year. Meanwhile, other retailers, such as M and URBN, are pursuing more rapid fulfillment, but are several steps behind JWN, in our view.
We think JWN faces two key eCommerce risks: failing to 1) deliver on its anticipated returns and 2) offset increased expenses in the future.
Exhibit 188
Accelerating eCommerce should create significant long-term value
DirectAggressive growth
Sales Mix (Current)
Sales Growth High
Gross Profit % HighFull-price
Costs High VariableFulfillment/delivery; Evolving technology
EBIT High EBIT $ GrowthEBIT margin declining due to ongoing investments
Capital Low But OngoingShort asset lives; High capital turns
Value Creation HighHigh sales growth; High EBIT $ growth
Productive capital base
~10%
Source: US Census Bureau, comScore, Morgan Stanley Research
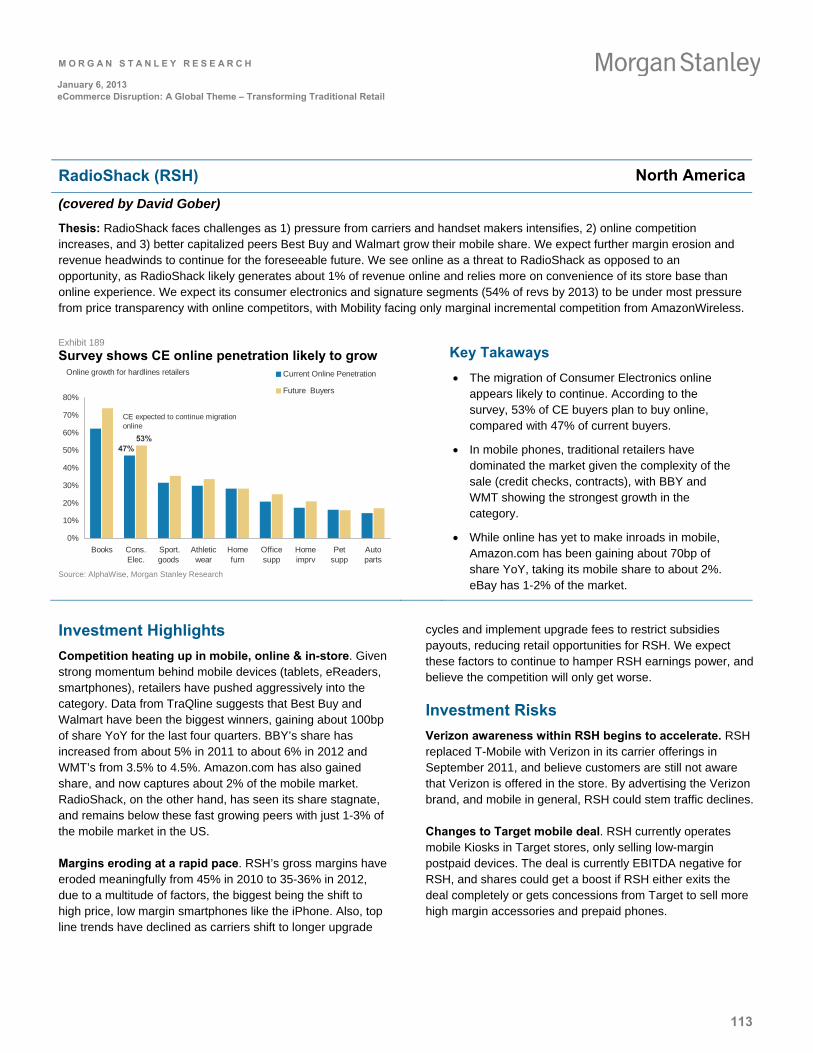
M O R G A N S T A N L E Y R E S E A R C H
113
January 6, 2013 eCommerce Disruption: A Global Theme – Transforming Traditional Retail
RadioShack (RSH) North America
(covered by David Gober)
Thesis: RadioShack faces challenges as 1) pressure from carriers and handset makers intensifies, 2) online competition increases, and 3) better capitalized peers Best Buy and Walmart grow their mobile share. We expect further margin erosion and revenue headwinds to continue for the foreseeable future. We see online as a threat to RadioShack as opposed to an opportunity, as RadioShack likely generates about 1% of revenue online and relies more on convenience of its store base than online experience. We expect its consumer electronics and signature segments (54% of revs by 2013) to be under most pressure from price transparency with online competitors, with Mobility facing only marginal incremental competition from AmazonWireless.
Exhibit 189
Survey shows CE online penetration likely to grow Online growth for hardlines retailers
47%53%
0%
10%
20%
30%
40%
50%
60%
70%
80%
Books Cons.Elec.
Sport.goods
Athleticwear
Homefurn
Officesupp
Homeimprv
Petsupp
Autoparts
Current Online Penetration
Future Buyers
CE expected to continue migration online
Source: AlphaWise, Morgan Stanley Research
Key Takaways
The migration of Consumer Electronics online appears likely to continue. According to the survey, 53% of CE buyers plan to buy online, compared with 47% of current buyers.
In mobile phones, traditional retailers have dominated the market given the complexity of the sale (credit checks, contracts), with BBY and WMT showing the strongest growth in the category.
While online has yet to make inroads in mobile, Amazon.com has been gaining about 70bp of share YoY, taking its mobile share to about 2%. eBay has 1-2% of the market.
Investment Highlights
Competition heating up in mobile, online & in-store. Given strong momentum behind mobile devices (tablets, eReaders, smartphones), retailers have pushed aggressively into the category. Data from TraQline suggests that Best Buy and Walmart have been the biggest winners, gaining about 100bp of share YoY for the last four quarters. BBY’s share has increased from about 5% in 2011 to about 6% in 2012 and WMT’s from 3.5% to 4.5%. Amazon.com has also gained share, and now captures about 2% of the mobile market. RadioShack, on the other hand, has seen its share stagnate, and remains below these fast growing peers with just 1-3% of the mobile market in the US.
Margins eroding at a rapid pace. RSH’s gross margins have eroded meaningfully from 45% in 2010 to 35-36% in 2012, due to a multitude of factors, the biggest being the shift to high price, low margin smartphones like the iPhone. Also, top line trends have declined as carriers shift to longer upgrade
cycles and implement upgrade fees to restrict subsidies payouts, reducing retail opportunities for RSH. We expect these factors to continue to hamper RSH earnings power, and believe the competition will only get worse.
Investment Risks
Verizon awareness within RSH begins to accelerate. RSH replaced T-Mobile with Verizon in its carrier offerings in September 2011, and believe customers are still not aware that Verizon is offered in the store. By advertising the Verizon brand, and mobile in general, RSH could stem traffic declines.
Changes to Target mobile deal. RSH currently operates mobile Kiosks in Target stores, only selling low-margin postpaid devices. The deal is currently EBITDA negative for RSH, and shares could get a boost if RSH either exits the deal completely or gets concessions from Target to sell more high margin accessories and prepaid phones.
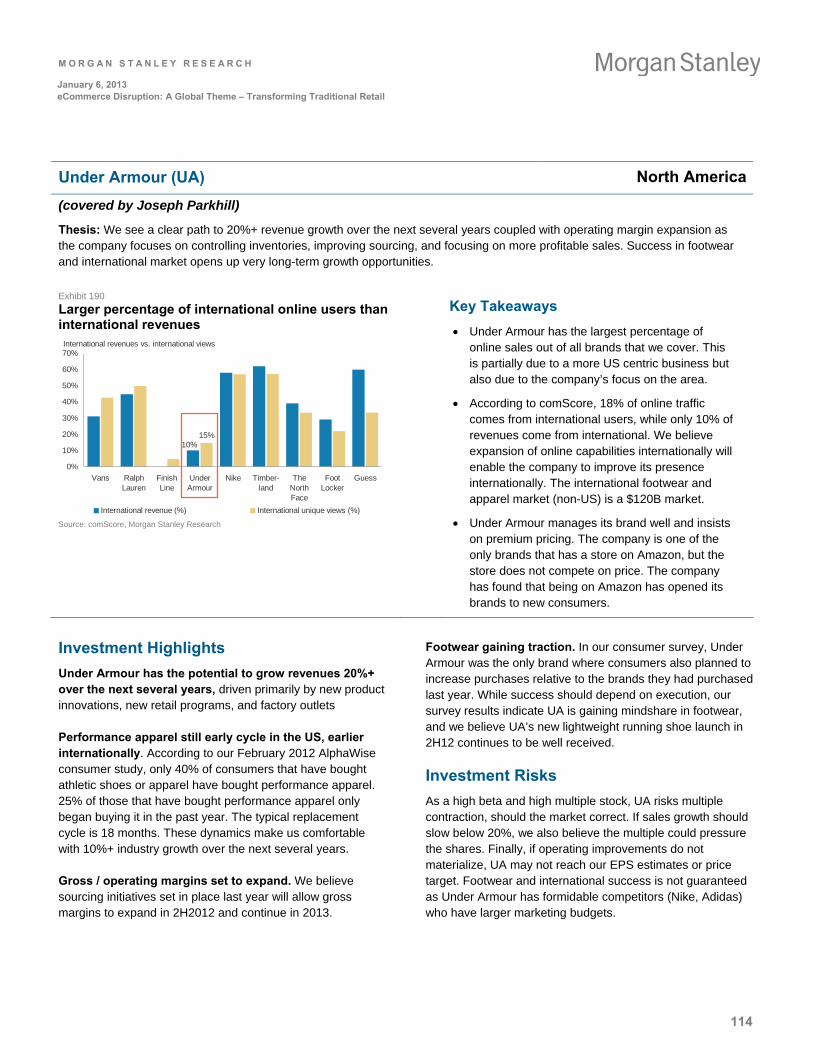
M O R G A N S T A N L E Y R E S E A R C H
114
January 6, 2013 eCommerce Disruption: A Global Theme – Transforming Traditional Retail
Under Armour (UA) North America
(covered by Joseph Parkhill)
Thesis: We see a clear path to 20%+ revenue growth over the next several years coupled with operating margin expansion as the company focuses on controlling inventories, improving sourcing, and focusing on more profitable sales. Success in footwear and international market opens up very long-term growth opportunities.
Exhibit 190
Larger percentage of international online users than international revenues
International revenues vs. international views
10%15%
0%
10%
20%
30%
40%
50%
60%
70%
Vans RalphLauren
FinishLine
UnderArmour
Nike Timber-land
TheNorthFace
FootLocker
Guess
International revenue (%) International unique views (%) Source: comScore, Morgan Stanley Research
Key Takeaways
Under Armour has the largest percentage of online sales out of all brands that we cover. This is partially due to a more US centric business but also due to the company’s focus on the area.
According to comScore, 18% of online traffic comes from international users, while only 10% of revenues come from international. We believe expansion of online capabilities internationally will enable the company to improve its presence internationally. The international footwear and apparel market (non-US) is a $120B market.
Under Armour manages its brand well and insists on premium pricing. The company is one of the only brands that has a store on Amazon, but the store does not compete on price. The company has found that being on Amazon has opened its brands to new consumers.
Investment Highlights
Under Armour has the potential to grow revenues 20%+ over the next several years, driven primarily by new product innovations, new retail programs, and factory outlets
Performance apparel still early cycle in the US, earlier internationally. According to our February 2012 AlphaWise consumer study, only 40% of consumers that have bought athletic shoes or apparel have bought performance apparel. 25% of those that have bought performance apparel only began buying it in the past year. The typical replacement cycle is 18 months. These dynamics make us comfortable with 10%+ industry growth over the next several years.
Gross / operating margins set to expand. We believe sourcing initiatives set in place last year will allow gross margins to expand in 2H2012 and continue in 2013.
Footwear gaining traction. In our consumer survey, Under Armour was the only brand where consumers also planned to increase purchases relative to the brands they had purchased last year. While success should depend on execution, our survey results indicate UA is gaining mindshare in footwear, and we believe UA’s new lightweight running shoe launch in 2H12 continues to be well received.
Investment Risks
As a high beta and high multiple stock, UA risks multiple contraction, should the market correct. If sales growth should slow below 20%, we also believe the multiple could pressure the shares. Finally, if operating improvements do not materialize, UA may not reach our EPS estimates or price target. Footwear and international success is not guaranteed as Under Armour has formidable competitors (Nike, Adidas) who have larger marketing budgets.
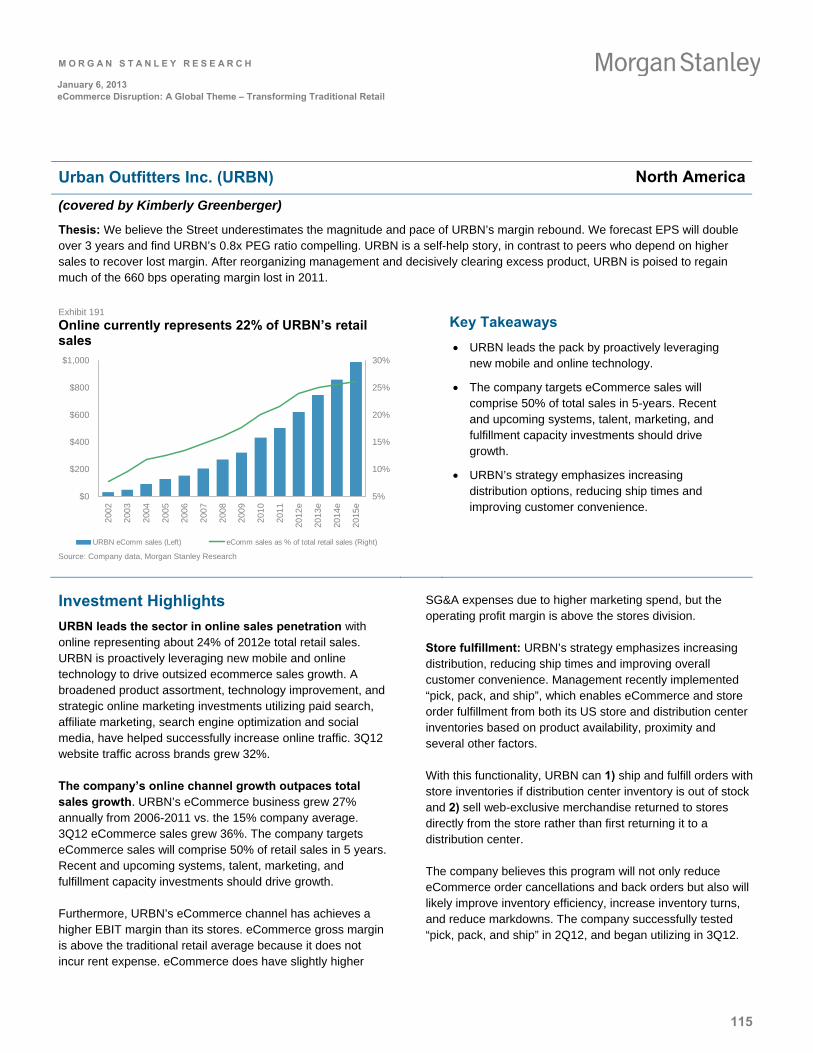
M O R G A N S T A N L E Y R E S E A R C H
115
January 6, 2013 eCommerce Disruption: A Global Theme – Transforming Traditional Retail
Urban Outfitters Inc. (URBN) North America
(covered by Kimberly Greenberger)
Thesis: We believe the Street underestimates the magnitude and pace of URBN’s margin rebound. We forecast EPS will double over 3 years and find URBN’s 0.8x PEG ratio compelling. URBN is a self-help story, in contrast to peers who depend on higher sales to recover lost margin. After reorganizing management and decisively clearing excess product, URBN is poised to regain much of the 660 bps operating margin lost in 2011.
Exhibit 191
Online currently represents 22% of URBN’s retail sales
$0
$200
$400
$600
$800
$1,000
200
2
200
3
200
4
200
5
200
6
200
7
200
8
200
9
201
0
201
1
2012
e
2013
e
2014
e
2015
e
5%
10%
15%
20%
25%
30%
URBN eComm sales (Left) eComm sales as % of total retail sales (Right) Source: Company data, Morgan Stanley Research
Key Takeaways
URBN leads the pack by proactively leveraging new mobile and online technology.
The company targets eCommerce sales will comprise 50% of total sales in 5-years. Recent and upcoming systems, talent, marketing, and fulfillment capacity investments should drive growth.
URBN’s strategy emphasizes increasing distribution options, reducing ship times and improving customer convenience.
Investment Highlights
URBN leads the sector in online sales penetration with online representing about 24% of 2012e total retail sales. URBN is proactively leveraging new mobile and online technology to drive outsized ecommerce sales growth. A broadened product assortment, technology improvement, and strategic online marketing investments utilizing paid search, affiliate marketing, search engine optimization and social media, have helped successfully increase online traffic. 3Q12 website traffic across brands grew 32%.
The company’s online channel growth outpaces total sales growth. URBN’s eCommerce business grew 27% annually from 2006-2011 vs. the 15% company average. 3Q12 eCommerce sales grew 36%. The company targets eCommerce sales will comprise 50% of retail sales in 5 years. Recent and upcoming systems, talent, marketing, and fulfillment capacity investments should drive growth.
Furthermore, URBN’s eCommerce channel has achieves a higher EBIT margin than its stores. eCommerce gross margin is above the traditional retail average because it does not incur rent expense. eCommerce does have slightly higher
SG&A expenses due to higher marketing spend, but the operating profit margin is above the stores division.
Store fulfillment: URBN’s strategy emphasizes increasing distribution, reducing ship times and improving overall customer convenience. Management recently implemented “pick, pack, and ship”, which enables eCommerce and store order fulfillment from both its US store and distribution center inventories based on product availability, proximity and several other factors.
With this functionality, URBN can 1) ship and fulfill orders with store inventories if distribution center inventory is out of stock and 2) sell web-exclusive merchandise returned to stores directly from the store rather than first returning it to a distribution center.
The company believes this program will not only reduce eCommerce order cancellations and back orders but also will likely improve inventory efficiency, increase inventory turns, and reduce markdowns. The company successfully tested “pick, pack, and ship” in 2Q12, and began utilizing in 3Q12.
M O R G A N S T A N L E Y R E S E A R C H
116
January 6, 2013 eCommerce Disruption: A Global Theme – Transforming Traditional Retail
During 3Q12, $23 million of direct-to-consumer initiated demand (14%) was filled from stores. Without “pick, pack, and ship”, URBN estimates half of this demand would have been lost due to out-of-stock inventory positions. In addition, “pick, pack, and ship” helped URBN lower markdowns and enabled its brands to buy less inventory.
URBN believes “pick, pack, and ship’s” 4Q12 impact will be more meaningful Q/Q given recent learnings. 3Q12 staffing level adjustments should allow more accurate, efficient and timely fulfillment.
Expanded online assortment garnering high returns: URBN 2Q12 web-exclusive product offerings grew 75% y/y and almost doubled in 3Q12. Web-exclusive products now represent 37% of URBN’s eCommerce sales mix. For example, management increased its 2Q12 online dress styles 50% y/y to 1,500 and reaped “excellent” returns. Online sales are accelerating faster than inventory growth and web-exclusive product is higher margin than the average.
Enhanced distribution: URBN’s $55M Reno, Nevada eCommerce fulfillment center opened in September. The center contains 500k square feet of capacity and is expandable to 1M square feet, enabling processing of up to about 100k orders per day. The center is currently fulfilling half of West Coast eCommerce orders (30% of total) and management expects to ramp to 100% over the next few months.
In addition, beginning Spring 2012, the company’s South Carolina facility is now expediting shipments overnight to the West Coast.
With the Reno and South Carolina facilities, URBN can now offer 2-day or less delivery to 80% of its customers. Furthermore, since all of URBN’s stores can serve as distribution points, merchandise can now get to West Coast customers in under 2 days 20% of the time.
Management intends to offer 2-day ground shipping across the US within 3 years. Ground shipping is significantly more cost effective than air shipping. Longer-term, the company hopes to roll-out same day delivery. URBN is also deploying same day order online and pick-up at store and expects to implement this company-wide within the next few months.
Developing a global eCommerce strategy: The company is growing its global online presence. Both Urban Outfitters and Anthropologie European eCommerce online sales growth continues to outpace US sales growth. We see an incremental revenue growth opportunity now that Free People has launched its own European website.
In Europe, the company has localized country-specific online content and opened a new fulfillment center last year. This new center should support growing EU demand for at least the next 3-5 years. In Asia, management indicated it might enter the region by first building an eCommerce business followed by stores.
Mobile technology – a strategic cornerstone: iPad tablet technology remains a cornerstone of URBN’s eCommerce / technology strategy. Two years ago URBN rolled-out iPad POS devices in all stores to serve as registers. The iPads reduce expenses, costing $1,000 fully installed instead of $5,000 for a register, and enable greater customer interaction. Beyond utilizing iPads as registers, the company is using the technology to (among other things):
i) download content to the stores, including training videos, product information, gift registry data, etc.;
ii) aid returns and restocking – including an online app which allows associates to deliver items bought online and returned to the stores back into the inventory system; and
iii) enable store associates to “save the sale” by searching the enterprise (e.g. other stores or online) for an item if a store is sold out or does not have the right color or size.
Embracing showrooming: URBN is also piloting a program where it uses traditional retail stores to showcase online-only product (the current push is shoes). Stores display the product but do not stock the merchandise. Instead, an associate checks customers out via a mobile POS device and items purchased are shipped from distribution center inventory. This strategy enables URBN to leverage its store base to boost sales volumes without taking significant inventory risk.
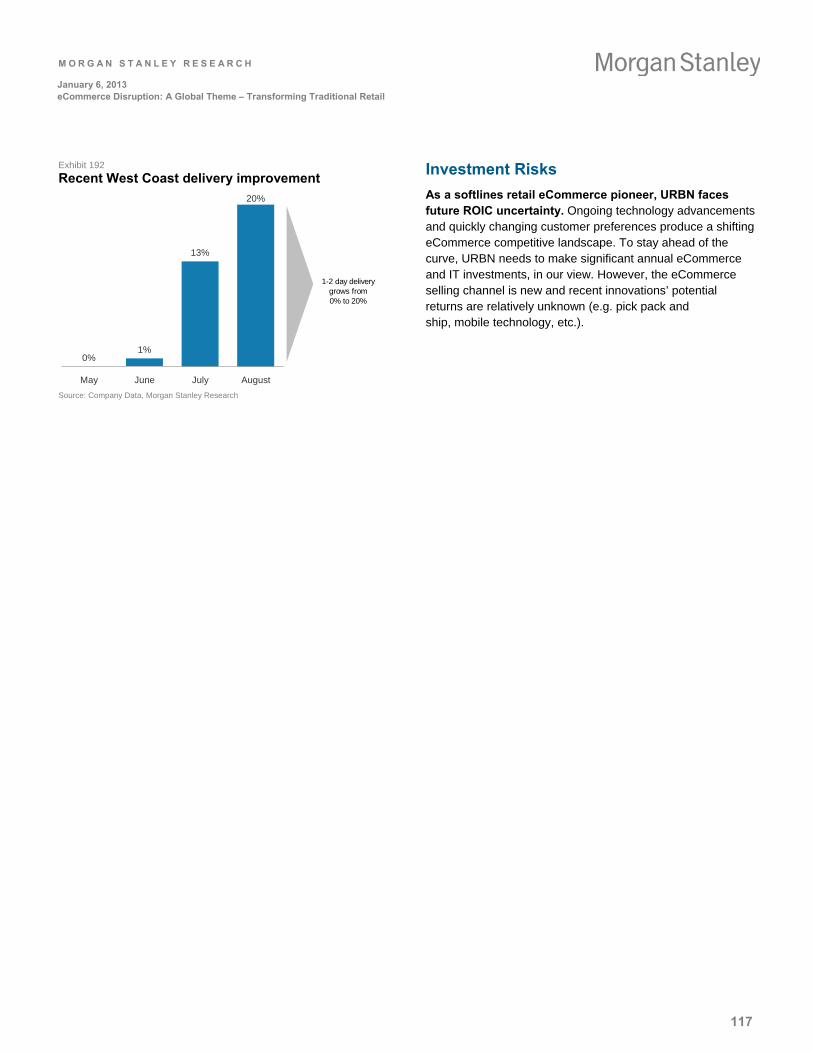
M O R G A N S T A N L E Y R E S E A R C H
117
January 6, 2013 eCommerce Disruption: A Global Theme – Transforming Traditional Retail
Exhibit 192
Recent West Coast delivery improvement
0%1%
13%
20%
May June July August
1-2 day delivery grows from 0% to 20%
Source: Company Data, Morgan Stanley Research
Investment Risks
As a softlines retail eCommerce pioneer, URBN faces future ROIC uncertainty. Ongoing technology advancements and quickly changing customer preferences produce a shifting eCommerce competitive landscape. To stay ahead of the curve, URBN needs to make significant annual eCommerce and IT investments, in our view. However, the eCommerce selling channel is new and recent innovations’ potential returns are relatively unknown (e.g. pick pack and ship, mobile technology, etc.).
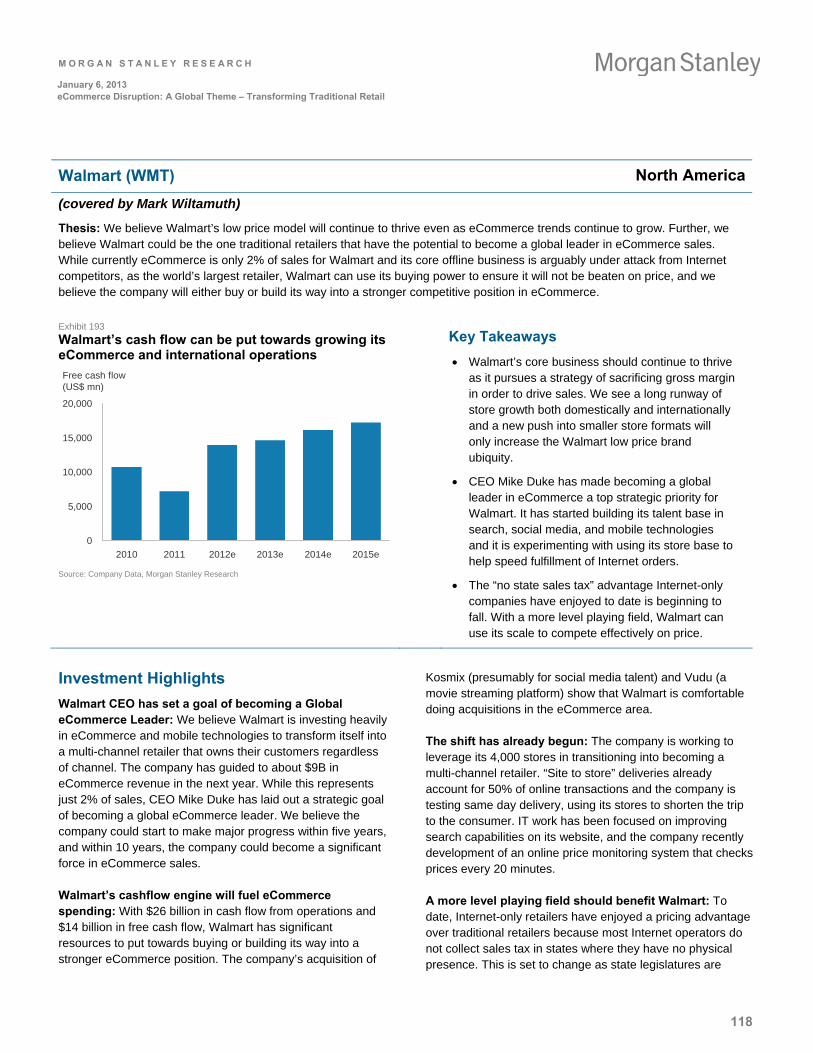
M O R G A N S T A N L E Y R E S E A R C H
118
January 6, 2013 eCommerce Disruption: A Global Theme – Transforming Traditional Retail
Walmart (WMT) North America
(covered by Mark Wiltamuth)
Thesis: We believe Walmart’s low price model will continue to thrive even as eCommerce trends continue to grow. Further, we believe Walmart could be the one traditional retailers that have the potential to become a global leader in eCommerce sales. While currently eCommerce is only 2% of sales for Walmart and its core offline business is arguably under attack from Internet competitors, as the world’s largest retailer, Walmart can use its buying power to ensure it will not be beaten on price, and we believe the company will either buy or build its way into a stronger competitive position in eCommerce.
Exhibit 193
Walmart’s cash flow can be put towards growing its eCommerce and international operations
Free cash flow(US$ mn)
0
5,000
10,000
15,000
20,000
2010 2011 2012e 2013e 2014e 2015e
Source: Company Data, Morgan Stanley Research
Key Takeaways
Walmart’s core business should continue to thrive as it pursues a strategy of sacrificing gross margin in order to drive sales. We see a long runway of store growth both domestically and internationally and a new push into smaller store formats will only increase the Walmart low price brand ubiquity.
CEO Mike Duke has made becoming a global leader in eCommerce a top strategic priority for Walmart. It has started building its talent base in search, social media, and mobile technologies and it is experimenting with using its store base to help speed fulfillment of Internet orders.
The “no state sales tax” advantage Internet-only companies have enjoyed to date is beginning to fall. With a more level playing field, Walmart can use its scale to compete effectively on price.
Investment Highlights
Walmart CEO has set a goal of becoming a Global eCommerce Leader: We believe Walmart is investing heavily in eCommerce and mobile technologies to transform itself into a multi-channel retailer that owns their customers regardless of channel. The company has guided to about $9B in eCommerce revenue in the next year. While this represents just 2% of sales, CEO Mike Duke has laid out a strategic goal of becoming a global eCommerce leader. We believe the company could start to make major progress within five years, and within 10 years, the company could become a significant force in eCommerce sales.
Walmart’s cashflow engine will fuel eCommerce spending: With $26 billion in cash flow from operations and $14 billion in free cash flow, Walmart has significant resources to put towards buying or building its way into a stronger eCommerce position. The company’s acquisition of
Kosmix (presumably for social media talent) and Vudu (a movie streaming platform) show that Walmart is comfortable doing acquisitions in the eCommerce area.
The shift has already begun: The company is working to leverage its 4,000 stores in transitioning into becoming a multi-channel retailer. “Site to store” deliveries already account for 50% of online transactions and the company is testing same day delivery, using its stores to shorten the trip to the consumer. IT work has been focused on improving search capabilities on its website, and the company recently development of an online price monitoring system that checks prices every 20 minutes.
A more level playing field should benefit Walmart: To date, Internet-only retailers have enjoyed a pricing advantage over traditional retailers because most Internet operators do not collect sales tax in states where they have no physical presence. This is set to change as state legislatures are
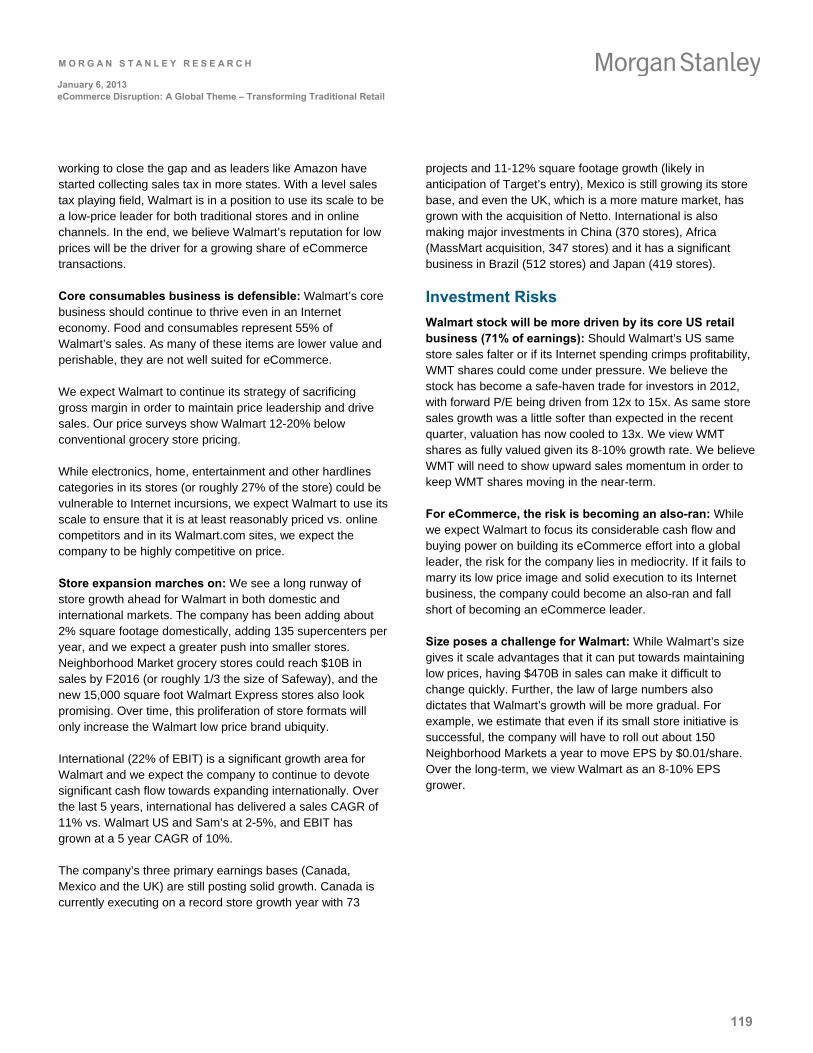
M O R G A N S T A N L E Y R E S E A R C H
119
January 6, 2013 eCommerce Disruption: A Global Theme – Transforming Traditional Retail
working to close the gap and as leaders like Amazon have started collecting sales tax in more states. With a level sales tax playing field, Walmart is in a position to use its scale to be a low-price leader for both traditional stores and in online channels. In the end, we believe Walmart’s reputation for low prices will be the driver for a growing share of eCommerce transactions.
Core consumables business is defensible: Walmart’s core business should continue to thrive even in an Internet economy. Food and consumables represent 55% of Walmart’s sales. As many of these items are lower value and perishable, they are not well suited for eCommerce.
We expect Walmart to continue its strategy of sacrificing gross margin in order to maintain price leadership and drive sales. Our price surveys show Walmart 12-20% below conventional grocery store pricing.
While electronics, home, entertainment and other hardlines categories in its stores (or roughly 27% of the store) could be vulnerable to Internet incursions, we expect Walmart to use its scale to ensure that it is at least reasonably priced vs. online competitors and in its Walmart.com sites, we expect the company to be highly competitive on price.
Store expansion marches on: We see a long runway of store growth ahead for Walmart in both domestic and international markets. The company has been adding about 2% square footage domestically, adding 135 supercenters per year, and we expect a greater push into smaller stores. Neighborhood Market grocery stores could reach $10B in sales by F2016 (or roughly 1/3 the size of Safeway), and the new 15,000 square foot Walmart Express stores also look promising. Over time, this proliferation of store formats will only increase the Walmart low price brand ubiquity.
International (22% of EBIT) is a significant growth area for Walmart and we expect the company to continue to devote significant cash flow towards expanding internationally. Over the last 5 years, international has delivered a sales CAGR of 11% vs. Walmart US and Sam’s at 2-5%, and EBIT has grown at a 5 year CAGR of 10%.
The company’s three primary earnings bases (Canada, Mexico and the UK) are still posting solid growth. Canada is currently executing on a record store growth year with 73
projects and 11-12% square footage growth (likely in anticipation of Target’s entry), Mexico is still growing its store base, and even the UK, which is a more mature market, has grown with the acquisition of Netto. International is also making major investments in China (370 stores), Africa (MassMart acquisition, 347 stores) and it has a significant business in Brazil (512 stores) and Japan (419 stores).
Investment Risks
Walmart stock will be more driven by its core US retail business (71% of earnings): Should Walmart’s US same store sales falter or if its Internet spending crimps profitability, WMT shares could come under pressure. We believe the stock has become a safe-haven trade for investors in 2012, with forward P/E being driven from 12x to 15x. As same store sales growth was a little softer than expected in the recent quarter, valuation has now cooled to 13x. We view WMT shares as fully valued given its 8-10% growth rate. We believe WMT will need to show upward sales momentum in order to keep WMT shares moving in the near-term.
For eCommerce, the risk is becoming an also-ran: While we expect Walmart to focus its considerable cash flow and buying power on building its eCommerce effort into a global leader, the risk for the company lies in mediocrity. If it fails to marry its low price image and solid execution to its Internet business, the company could become an also-ran and fall short of becoming an eCommerce leader.
Size poses a challenge for Walmart: While Walmart’s size gives it scale advantages that it can put towards maintaining low prices, having $470B in sales can make it difficult to change quickly. Further, the law of large numbers also dictates that Walmart’s growth will be more gradual. For example, we estimate that even if its small store initiative is successful, the company will have to roll out about 150 Neighborhood Markets a year to move EPS by $0.01/share. Over the long-term, we view Walmart as an 8-10% EPS grower.
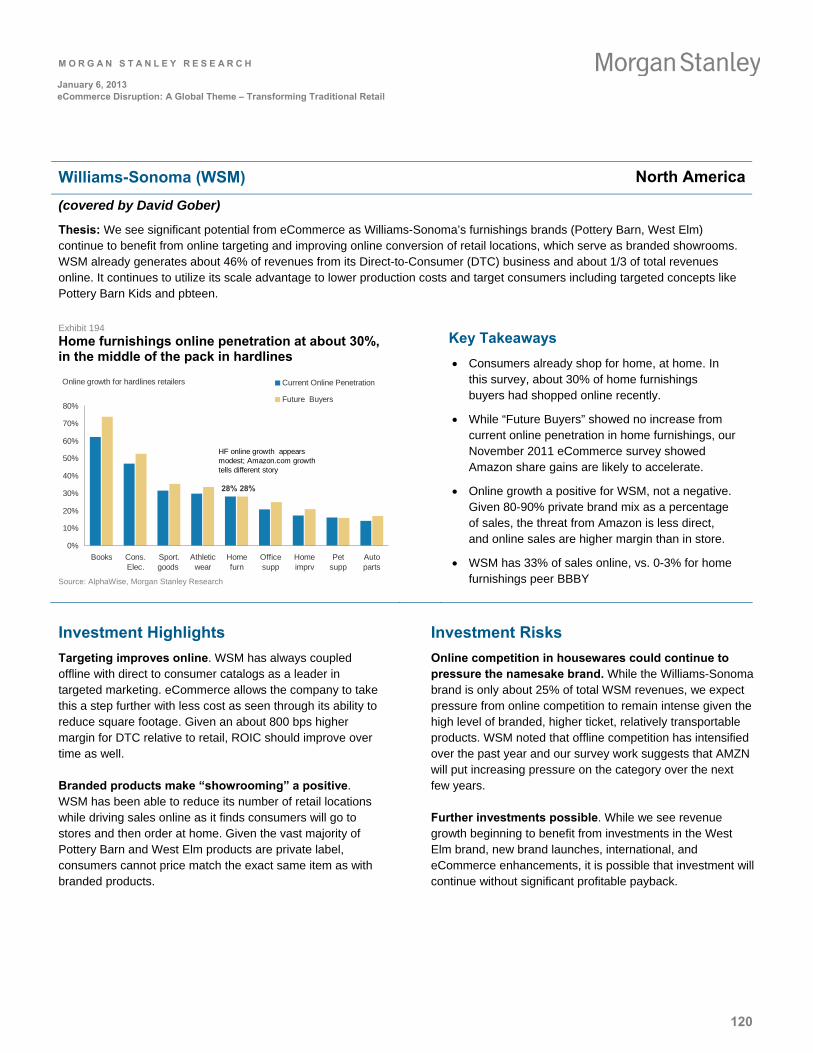
M O R G A N S T A N L E Y R E S E A R C H
120
January 6, 2013 eCommerce Disruption: A Global Theme – Transforming Traditional Retail
Williams-Sonoma (WSM) North America
(covered by David Gober)
Thesis: We see significant potential from eCommerce as Williams-Sonoma’s furnishings brands (Pottery Barn, West Elm) continue to benefit from online targeting and improving online conversion of retail locations, which serve as branded showrooms. WSM already generates about 46% of revenues from its Direct-to-Consumer (DTC) business and about 1/3 of total revenues online. It continues to utilize its scale advantage to lower production costs and target consumers including targeted concepts like Pottery Barn Kids and pbteen.
Exhibit 194
Home furnishings online penetration at about 30%, in the middle of the pack in hardlines
Online growth for hardlines retailers
28% 28%
0%
10%
20%
30%
40%
50%
60%
70%
80%
Books Cons.Elec.
Sport.goods
Athleticwear
Homefurn
Officesupp
Homeimprv
Petsupp
Autoparts
Current Online Penetration
Future Buyers
HF online growth appears modest; Amazon.com growth tells different story
Source: AlphaWise, Morgan Stanley Research
Key Takeaways
Consumers already shop for home, at home. In this survey, about 30% of home furnishings buyers had shopped online recently.
While “Future Buyers” showed no increase from current online penetration in home furnishings, our November 2011 eCommerce survey showed Amazon share gains are likely to accelerate.
Online growth a positive for WSM, not a negative. Given 80-90% private brand mix as a percentage of sales, the threat from Amazon is less direct, and online sales are higher margin than in store.
WSM has 33% of sales online, vs. 0-3% for home furnishings peer BBBY
Investment Highlights
Targeting improves online. WSM has always coupled offline with direct to consumer catalogs as a leader in targeted marketing. eCommerce allows the company to take this a step further with less cost as seen through its ability to reduce square footage. Given an about 800 bps higher margin for DTC relative to retail, ROIC should improve over time as well.
Branded products make “showrooming” a positive. WSM has been able to reduce its number of retail locations while driving sales online as it finds consumers will go to stores and then order at home. Given the vast majority of Pottery Barn and West Elm products are private label, consumers cannot price match the exact same item as with branded products.
Investment Risks
Online competition in housewares could continue to pressure the namesake brand. While the Williams-Sonoma brand is only about 25% of total WSM revenues, we expect pressure from online competition to remain intense given the high level of branded, higher ticket, relatively transportable products. WSM noted that offline competition has intensified over the past year and our survey work suggests that AMZN will put increasing pressure on the category over the next few years.
Further investments possible. While we see revenue growth beginning to benefit from investments in the West Elm brand, new brand launches, international, and eCommerce enhancements, it is possible that investment will continue without significant profitable payback.
M O R G A N S T A N L E Y R E S E A R C H
121
January 6, 2013 eCommerce Disruption: A Global Theme – Transforming Traditional Retail
Morgan Stanley Global eCommerce Key Stock Calls: Western Europe Retail
ASOS PLC (ASOS.L) Western Europe
(covered by Anisha Singhal)
We believe that ASOS is structurally positioned to benefit from the changing trend of how consumers shop. Surveys suggest that more than 20% of UK consumers are now buying more clothing online than in store. The global online apparel market remains very fragmented but we believe ASOS can continue to gain share. Not only is ASOS’ customer base growing very rapidly, but its customers are also making more repeat purchases. We believe that is it ASOS’ superior customer proposition relative to competitors which has been the key to success thus far, and we expect ASOS to remain one step ahead of peers, as store-based retailers make a more aggressive move online.
Exhibit 195
ASOS is now the most visited apparel website in the world
Average daily visitors '000s (August 2012)
275
286
321
334
355
453
465
471
625
360buy.com
MYNTRA.com
Forever 21
Inditex
Moonbasa.com
Nike
HM.com
KOUDAI.com
ASOS
Source: comScore, Company Data, Morgan Stanley Research
Key Takeaways
The global online apparel market is very fragmented, but ASOS is already the most visited apparel website in the world
Launches of local language websites in China and Russia should be usefully helpful in boosting sales in these fast growing markets
Free delivery is extremely important to consumers, who do not want to pay for shipping. ASOS has offered free global shipping since January 2011, but many of its competitors still do not.
Investment Highlights
The global online market remains very fragmented… The global online apparel market is predicted (by Euromonitor) to be worth £45B. However, this market remains extremely fragmented, with even the most visited apparel websites in the world only commanding about 1% market share each. We believe, however, that ASOS is on its way to building itself into a global player, and expect the launch of own-country websites in China and Russia will dramatically boost demand from these key regions.
… but the China and Russian launches should allow ASOS to gain local market share. Russia and China are already ASOS’ 6th and 7th most important markets respectively (by sales) despite no tailored efforts to serve these markets. These are simply customers ordering from the UK website, in English, and waiting up to 11 days for standard delivery. However, the potential for growth in these markets is significant, and as Exhibit 195 shows, the Chinese online apparel is predicted to grow by 43% CAGR over the next 5 years and reach nearly $20B by 2016.
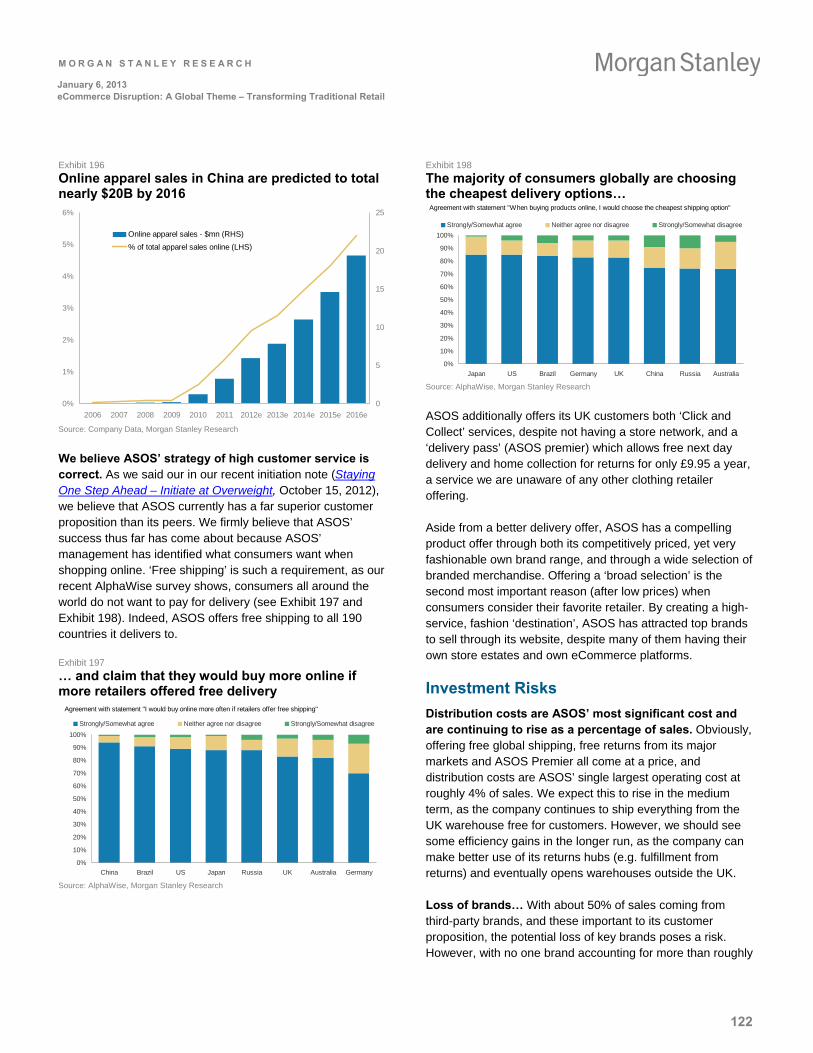
M O R G A N S T A N L E Y R E S E A R C H
122
January 6, 2013 eCommerce Disruption: A Global Theme – Transforming Traditional Retail
Exhibit 196
Online apparel sales in China are predicted to total nearly $20B by 2016
0%
1%
2%
3%
4%
5%
6%
2006 2007 2008 2009 2010 2011 2012e 2013e 2014e 2015e 2016e
0
5
10
15
20
25
Online apparel sales - $mn (RHS)
% of total apparel sales online (LHS)
Source: Company Data, Morgan Stanley Research
We believe ASOS’ strategy of high customer service is correct. As we said our in our recent initiation note (Staying One Step Ahead – Initiate at Overweight, October 15, 2012), we believe that ASOS currently has a far superior customer proposition than its peers. We firmly believe that ASOS’ success thus far has come about because ASOS’ management has identified what consumers want when shopping online. ‘Free shipping’ is such a requirement, as our recent AlphaWise survey shows, consumers all around the world do not want to pay for delivery (see Exhibit 197 and Exhibit 198). Indeed, ASOS offers free shipping to all 190 countries it delivers to.
Exhibit 197
… and claim that they would buy more online if more retailers offered free delivery
0%
10%
20%
30%
40%
50%
60%
70%
80%
90%
100%
China Brazil US Japan Russia UK Australia Germany
Strongly/Somewhat agree Neither agree nor disagree Strongly/Somewhat disagree
Agreement with statement "I would buy online more often if retailers offer free shipping"
Source: AlphaWise, Morgan Stanley Research
Exhibit 198
The majority of consumers globally are choosing the cheapest delivery options…
0%
10%
20%
30%
40%
50%
60%
70%
80%
90%
100%
Japan US Brazil Germany UK China Russia Australia
Strongly/Somewhat agree Neither agree nor disagree Strongly/Somewhat disagree
Agreement with statement "When buying products online, I would choose the cheapest shipping option"
Source: AlphaWise, Morgan Stanley Research
ASOS additionally offers its UK customers both ‘Click and Collect’ services, despite not having a store network, and a ‘delivery pass’ (ASOS premier) which allows free next day delivery and home collection for returns for only £9.95 a year, a service we are unaware of any other clothing retailer offering.
Aside from a better delivery offer, ASOS has a compelling product offer through both its competitively priced, yet very fashionable own brand range, and through a wide selection of branded merchandise. Offering a ‘broad selection’ is the second most important reason (after low prices) when consumers consider their favorite retailer. By creating a high-service, fashion ‘destination’, ASOS has attracted top brands to sell through its website, despite many of them having their own store estates and own eCommerce platforms.
Investment Risks
Distribution costs are ASOS’ most significant cost and are continuing to rise as a percentage of sales. Obviously, offering free global shipping, free returns from its major markets and ASOS Premier all come at a price, and distribution costs are ASOS’ single largest operating cost at roughly 4% of sales. We expect this to rise in the medium term, as the company continues to ship everything from the UK warehouse free for customers. However, we should see some efficiency gains in the longer run, as the company can make better use of its returns hubs (e.g. fulfillment from returns) and eventually opens warehouses outside the UK.
Loss of brands… With about 50% of sales coming from third-party brands, and these important to its customer proposition, the potential loss of key brands poses a risk. However, with no one brand accounting for more than roughly
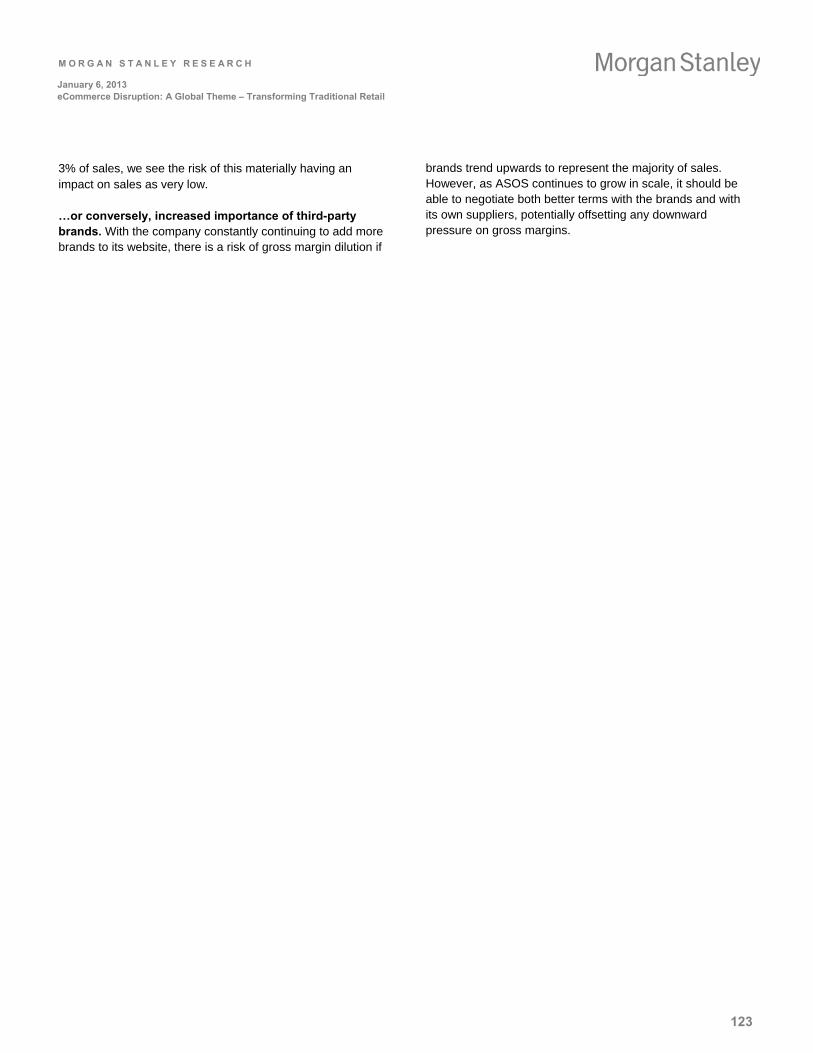
M O R G A N S T A N L E Y R E S E A R C H
123
January 6, 2013 eCommerce Disruption: A Global Theme – Transforming Traditional Retail
3% of sales, we see the risk of this materially having an impact on sales as very low.
…or conversely, increased importance of third-party brands. With the company constantly continuing to add more brands to its website, there is a risk of gross margin dilution if
brands trend upwards to represent the majority of sales. However, as ASOS continues to grow in scale, it should be able to negotiate both better terms with the brands and with its own suppliers, potentially offsetting any downward pressure on gross margins.
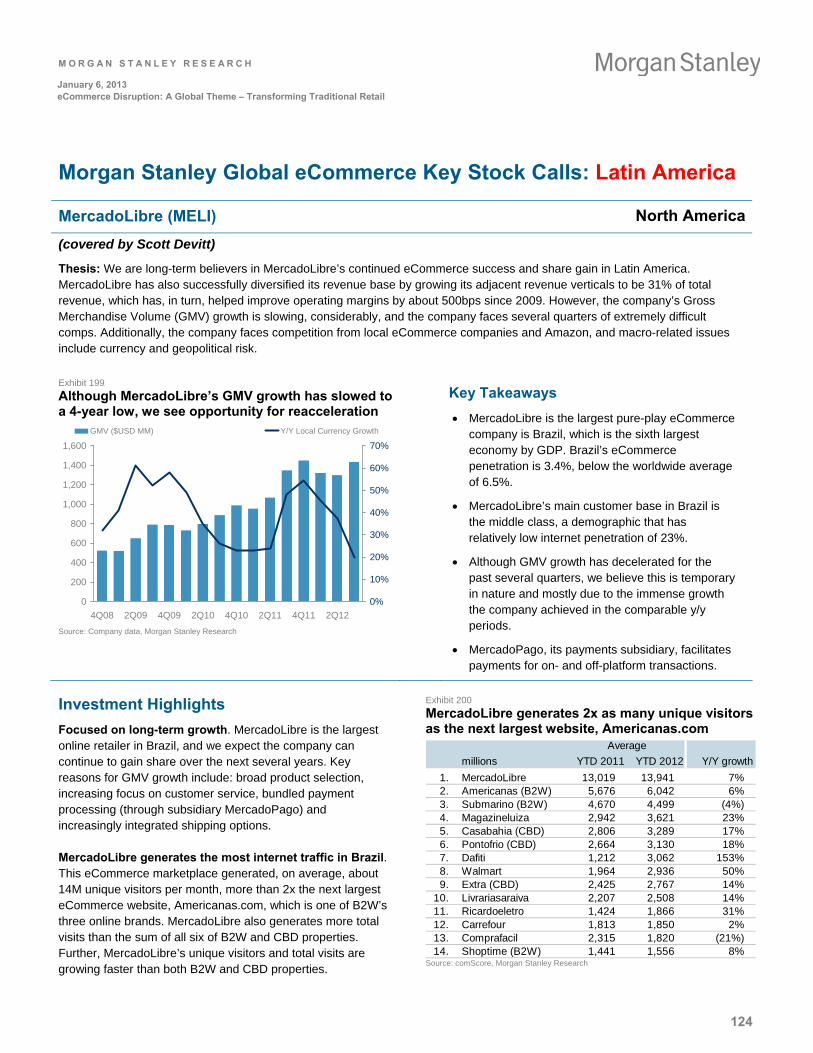
M O R G A N S T A N L E Y R E S E A R C H
124
January 6, 2013 eCommerce Disruption: A Global Theme – Transforming Traditional Retail
Morgan Stanley Global eCommerce Key Stock Calls: Latin America
MercadoLibre (MELI) North America
(covered by Scott Devitt)
Thesis: We are long-term believers in MercadoLibre’s continued eCommerce success and share gain in Latin America. MercadoLibre has also successfully diversified its revenue base by growing its adjacent revenue verticals to be 31% of total revenue, which has, in turn, helped improve operating margins by about 500bps since 2009. However, the company’s Gross Merchandise Volume (GMV) growth is slowing, considerably, and the company faces several quarters of extremely difficult comps. Additionally, the company faces competition from local eCommerce companies and Amazon, and macro-related issues include currency and geopolitical risk.
Exhibit 199
Although MercadoLibre’s GMV growth has slowed to a 4-year low, we see opportunity for reacceleration
0
200
400
600
800
1,000
1,200
1,400
1,600
4Q08 2Q09 4Q09 2Q10 4Q10 2Q11 4Q11 2Q12
0%
10%
20%
30%
40%
50%
60%
70%
GMV ($USD MM) Y/Y Local Currency Growth
Source: Company data, Morgan Stanley Research
Key Takeaways
MercadoLibre is the largest pure-play eCommerce company is Brazil, which is the sixth largest economy by GDP. Brazil’s eCommerce penetration is 3.4%, below the worldwide average of 6.5%.
MercadoLibre’s main customer base in Brazil is the middle class, a demographic that has relatively low internet penetration of 23%.
Although GMV growth has decelerated for the past several quarters, we believe this is temporary in nature and mostly due to the immense growth the company achieved in the comparable y/y periods.
MercadoPago, its payments subsidiary, facilitates payments for on- and off-platform transactions.
Investment Highlights
Focused on long-term growth. MercadoLibre is the largest online retailer in Brazil, and we expect the company can continue to gain share over the next several years. Key reasons for GMV growth include: broad product selection, increasing focus on customer service, bundled payment processing (through subsidiary MercadoPago) and increasingly integrated shipping options.
MercadoLibre generates the most internet traffic in Brazil. This eCommerce marketplace generated, on average, about 14M unique visitors per month, more than 2x the next largest eCommerce website, Americanas.com, which is one of B2W’s three online brands. MercadoLibre also generates more total visits than the sum of all six of B2W and CBD properties. Further, MercadoLibre’s unique visitors and total visits are growing faster than both B2W and CBD properties.
Exhibit 200
MercadoLibre generates 2x as many unique visitors as the next largest website, Americanas.com
millions YTD 2011 YTD 2012 Y/Y growth
1. MercadoLibre 13,019 13,941 7%2. Americanas (B2W) 5,676 6,042 6%3. Submarino (B2W) 4,670 4,499 (4%)4. Magazineluiza 2,942 3,621 23%5. Casabahia (CBD) 2,806 3,289 17%6. Pontofrio (CBD) 2,664 3,130 18%7. Dafiti 1,212 3,062 153%8. Walmart 1,964 2,936 50%9. Extra (CBD) 2,425 2,767 14%
10. Livrariasaraiva 2,207 2,508 14%11. Ricardoeletro 1,424 1,866 31%12. Carrefour 1,813 1,850 2%13. Comprafacil 2,315 1,820 (21%)14. Shoptime (B2W) 1,441 1,556 8%
Average
Source: comScore, Morgan Stanley Research
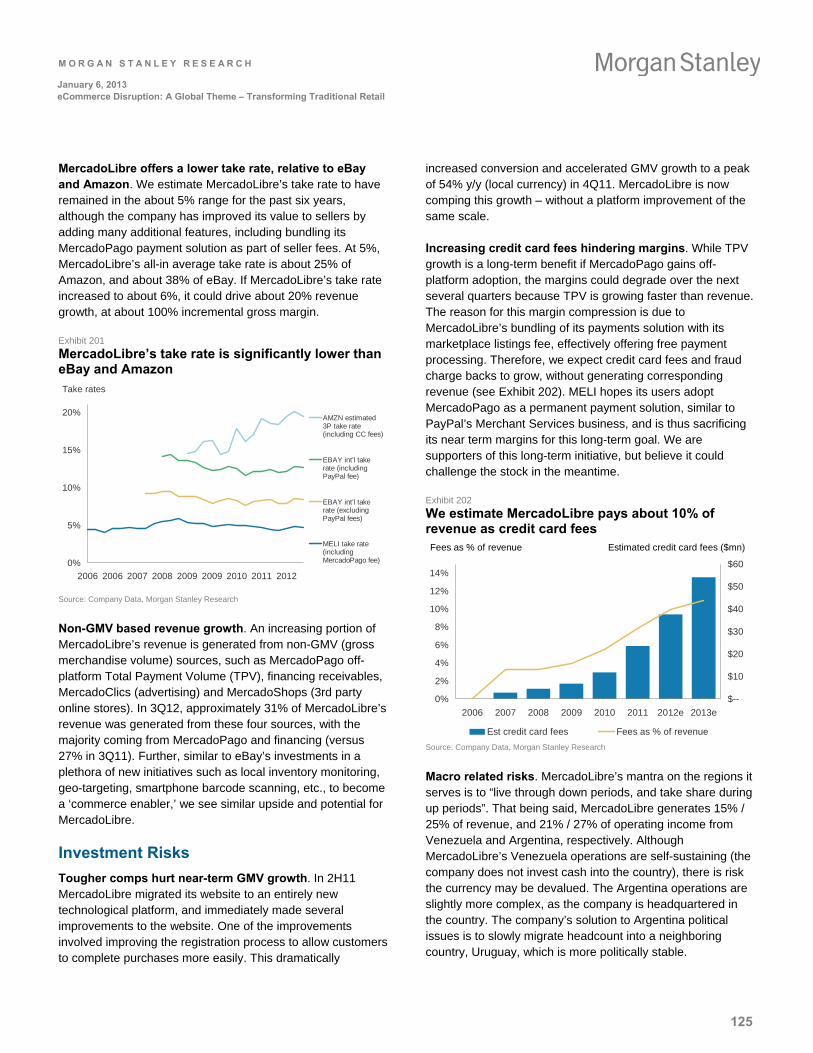
M O R G A N S T A N L E Y R E S E A R C H
125
January 6, 2013 eCommerce Disruption: A Global Theme – Transforming Traditional Retail
MercadoLibre offers a lower take rate, relative to eBay and Amazon. We estimate MercadoLibre’s take rate to have remained in the about 5% range for the past six years, although the company has improved its value to sellers by adding many additional features, including bundling its MercadoPago payment solution as part of seller fees. At 5%, MercadoLibre’s all-in average take rate is about 25% of Amazon, and about 38% of eBay. If MercadoLibre’s take rate increased to about 6%, it could drive about 20% revenue growth, at about 100% incremental gross margin.
Exhibit 201
MercadoLibre’s take rate is significantly lower than eBay and Amazon
Take rates
0%
5%
10%
15%
20%
2006 2006 2007 2008 2009 2009 2010 2011 2012
AMZN estimated3P take rate(including CC fees)
EBAY int'l takerate (includingPayPal fee)
EBAY int'l takerate (excludingPayPal fees)
MELI take rate(includingMercadoPago fee)
Source: Company Data, Morgan Stanley Research
Non-GMV based revenue growth. An increasing portion of MercadoLibre’s revenue is generated from non-GMV (gross merchandise volume) sources, such as MercadoPago off-platform Total Payment Volume (TPV), financing receivables, MercadoClics (advertising) and MercadoShops (3rd party online stores). In 3Q12, approximately 31% of MercadoLibre’s revenue was generated from these four sources, with the majority coming from MercadoPago and financing (versus 27% in 3Q11). Further, similar to eBay’s investments in a plethora of new initiatives such as local inventory monitoring, geo-targeting, smartphone barcode scanning, etc., to become a ‘commerce enabler,’ we see similar upside and potential for MercadoLibre.
Investment Risks
Tougher comps hurt near-term GMV growth. In 2H11 MercadoLibre migrated its website to an entirely new technological platform, and immediately made several improvements to the website. One of the improvements involved improving the registration process to allow customers to complete purchases more easily. This dramatically
increased conversion and accelerated GMV growth to a peak of 54% y/y (local currency) in 4Q11. MercadoLibre is now comping this growth – without a platform improvement of the same scale.
Increasing credit card fees hindering margins. While TPV growth is a long-term benefit if MercadoPago gains off-platform adoption, the margins could degrade over the next several quarters because TPV is growing faster than revenue. The reason for this margin compression is due to MercadoLibre’s bundling of its payments solution with its marketplace listings fee, effectively offering free payment processing. Therefore, we expect credit card fees and fraud charge backs to grow, without generating corresponding revenue (see Exhibit 202). MELI hopes its users adopt MercadoPago as a permanent payment solution, similar to PayPal’s Merchant Services business, and is thus sacrificing its near term margins for this long-term goal. We are supporters of this long-term initiative, but believe it could challenge the stock in the meantime.
Exhibit 202
We estimate MercadoLibre pays about 10% of revenue as credit card fees
0%
2%
4%
6%
8%
10%
12%
14%
2006 2007 2008 2009 2010 2011 2012e 2013e
$--
$10
$20
$30
$40
$50
$60
Est credit card fees Fees as % of revenue
Fees as % of revenue Estimated credit card fees ($mn)
Source: Company Data, Morgan Stanley Research
Macro related risks. MercadoLibre’s mantra on the regions it serves is to “live through down periods, and take share during up periods”. That being said, MercadoLibre generates 15% / 25% of revenue, and 21% / 27% of operating income from Venezuela and Argentina, respectively. Although MercadoLibre’s Venezuela operations are self-sustaining (the company does not invest cash into the country), there is risk the currency may be devalued. The Argentina operations are slightly more complex, as the company is headquartered in the country. The company’s solution to Argentina political issues is to slowly migrate headcount into a neighboring country, Uruguay, which is more politically stable.
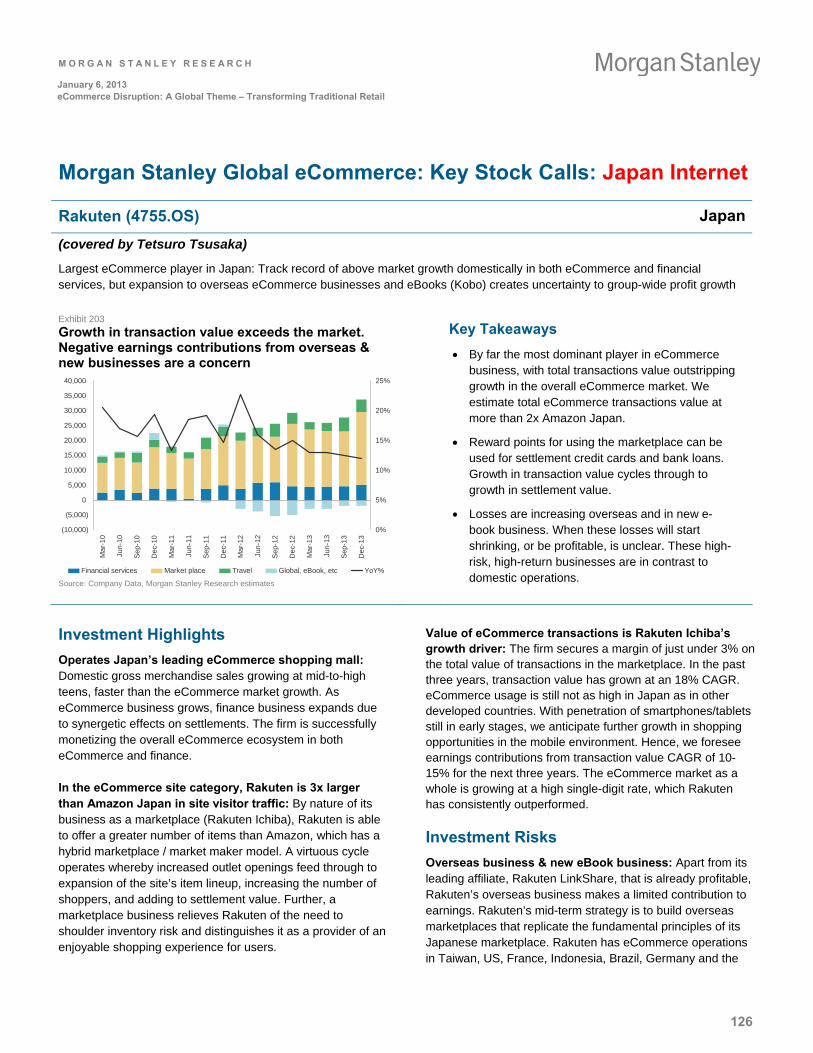
M O R G A N S T A N L E Y R E S E A R C H
126
January 6, 2013 eCommerce Disruption: A Global Theme – Transforming Traditional Retail
Morgan Stanley Global eCommerce: Key Stock Calls: Japan Internet
Rakuten (4755.OS) Japan
(covered by Tetsuro Tsusaka)
Largest eCommerce player in Japan: Track record of above market growth domestically in both eCommerce and financial services, but expansion to overseas eCommerce businesses and eBooks (Kobo) creates uncertainty to group-wide profit growth
Exhibit 203
Growth in transaction value exceeds the market. Negative earnings contributions from overseas & new businesses are a concern
(10,000)
(5,000)
0
5,000
10,000
15,000
20,000
25,000
30,000
35,000
40,000
Ma
r-1
0
Jun-
10
Sep
-10
Dec
-10
Ma
r-1
1
Jun-
11
Sep
-11
Dec
-11
Ma
r-1
2
Jun-
12
Sep
-12
Dec
-12
Ma
r-1
3
Jun-
13
Sep
-13
Dec
-13
0%
5%
10%
15%
20%
25%
Financial services Market place Travel Global, eBook, etc YoY% Source: Company Data, Morgan Stanley Research estimates
Key Takeaways
By far the most dominant player in eCommerce business, with total transactions value outstripping growth in the overall eCommerce market. We estimate total eCommerce transactions value at more than 2x Amazon Japan.
Reward points for using the marketplace can be used for settlement credit cards and bank loans. Growth in transaction value cycles through to growth in settlement value.
Losses are increasing overseas and in new e-book business. When these losses will start shrinking, or be profitable, is unclear. These high-risk, high-return businesses are in contrast to domestic operations.
Investment Highlights
Operates Japan’s leading eCommerce shopping mall: Domestic gross merchandise sales growing at mid-to-high teens, faster than the eCommerce market growth. As eCommerce business grows, finance business expands due to synergetic effects on settlements. The firm is successfully monetizing the overall eCommerce ecosystem in both eCommerce and finance.
In the eCommerce site category, Rakuten is 3x larger than Amazon Japan in site visitor traffic: By nature of its business as a marketplace (Rakuten Ichiba), Rakuten is able to offer a greater number of items than Amazon, which has a hybrid marketplace / market maker model. A virtuous cycle operates whereby increased outlet openings feed through to expansion of the site’s item lineup, increasing the number of shoppers, and adding to settlement value. Further, a marketplace business relieves Rakuten of the need to shoulder inventory risk and distinguishes it as a provider of an enjoyable shopping experience for users.
Value of eCommerce transactions is Rakuten Ichiba’s growth driver: The firm secures a margin of just under 3% on the total value of transactions in the marketplace. In the past three years, transaction value has grown at an 18% CAGR. eCommerce usage is still not as high in Japan as in other developed countries. With penetration of smartphones/tablets still in early stages, we anticipate further growth in shopping opportunities in the mobile environment. Hence, we foresee earnings contributions from transaction value CAGR of 10-15% for the next three years. The eCommerce market as a whole is growing at a high single-digit rate, which Rakuten has consistently outperformed.
Investment Risks
Overseas business & new eBook business: Apart from its leading affiliate, Rakuten LinkShare, that is already profitable, Rakuten’s overseas business makes a limited contribution to earnings. Rakuten’s mid-term strategy is to build overseas marketplaces that replicate the fundamental principles of its Japanese marketplace. Rakuten has eCommerce operations in Taiwan, US, France, Indonesia, Brazil, Germany and the
M O R G A N S T A N L E Y R E S E A R C H
127
January 6, 2013 eCommerce Disruption: A Global Theme – Transforming Traditional Retail
UK. Currently, Rakuten is combining local direct sales with a marketplace, but this model will evolve as it applies the tenets of Rakuten Ichiba to overseas eCommerce operations.
In its eBook business, Rakuten purchased Canadian company Kobo in 2011, which gave it the third largest
presence in North America after Amazon’s Kindle and Barnes & Noble’s Nook. Rakuten is in process of rolling out Kobo globally, including in Japan. Recent earnings results show losses swelling in both overseas operations and the new eBook business, to the detriment of overall earnings.
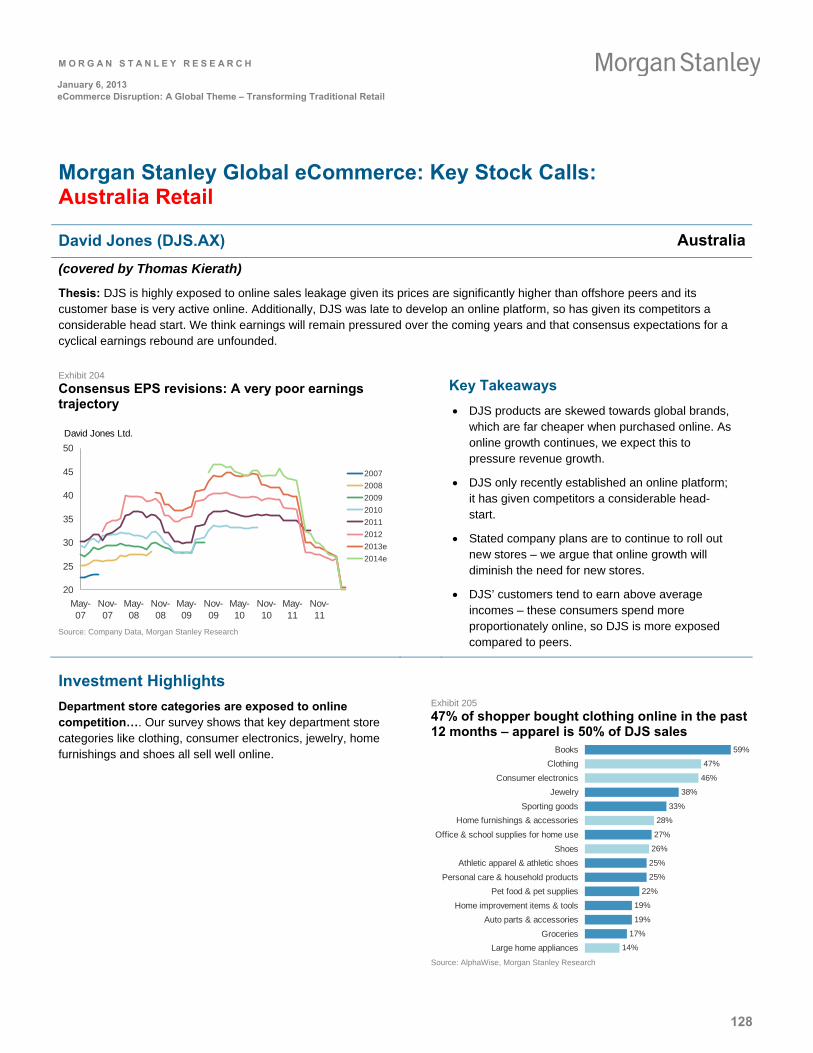
M O R G A N S T A N L E Y R E S E A R C H
128
January 6, 2013 eCommerce Disruption: A Global Theme – Transforming Traditional Retail
Morgan Stanley Global eCommerce: Key Stock Calls: Australia Retail
David Jones (DJS.AX) Australia
(covered by Thomas Kierath)
Thesis: DJS is highly exposed to online sales leakage given its prices are significantly higher than offshore peers and its customer base is very active online. Additionally, DJS was late to develop an online platform, so has given its competitors a considerable head start. We think earnings will remain pressured over the coming years and that consensus expectations for a cyclical earnings rebound are unfounded.
Exhibit 204
Consensus EPS revisions: A very poor earnings trajectory
20
25
30
35
40
45
50
May-07
Nov-07
May-08
Nov-08
May-09
Nov-09
May-10
Nov-10
May-11
Nov-11
2007
2008
2009
2010
2011
2012
2013e
2014e
David Jones Ltd.
Source: Company Data, Morgan Stanley Research
Key Takeaways
DJS products are skewed towards global brands, which are far cheaper when purchased online. As online growth continues, we expect this to pressure revenue growth.
DJS only recently established an online platform; it has given competitors a considerable head-start.
Stated company plans are to continue to roll out new stores – we argue that online growth will diminish the need for new stores.
DJS’ customers tend to earn above average incomes – these consumers spend more proportionately online, so DJS is more exposed compared to peers.
Investment Highlights
Department store categories are exposed to online competition…. Our survey shows that key department store categories like clothing, consumer electronics, jewelry, home furnishings and shoes all sell well online.
Exhibit 205
47% of shopper bought clothing online in the past 12 months – apparel is 50% of DJS sales
59%
47%
46%
38%
33%
28%
27%
26%
25%
25%
22%
19%
19%
17%
14%
Books
Clothing
Consumer electronics
Jewelry
Sporting goods
Home furnishings & accessories
Office & school supplies for home use
Shoes
Athletic apparel & athletic shoes
Personal care & household products
Pet food & pet supplies
Home improvement items & tools
Auto parts & accessories
Groceries
Large home appliances
Source: AlphaWise, Morgan Stanley Research
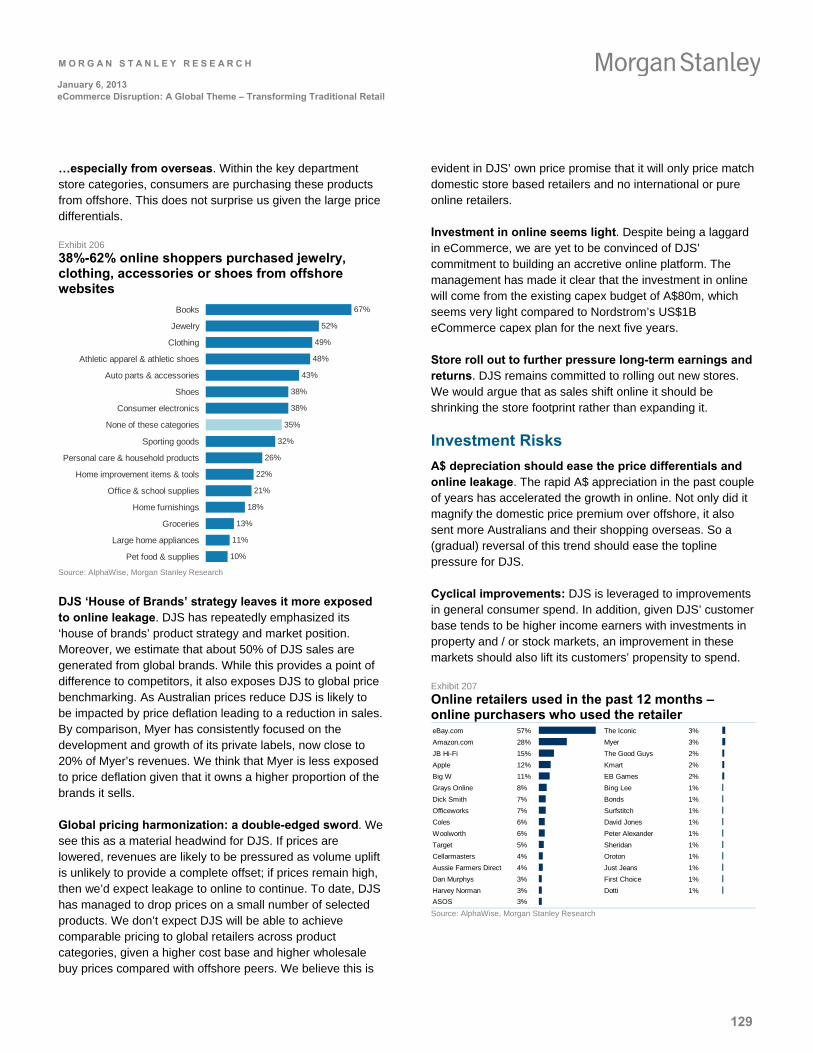
M O R G A N S T A N L E Y R E S E A R C H
129
January 6, 2013 eCommerce Disruption: A Global Theme – Transforming Traditional Retail
…especially from overseas. Within the key department store categories, consumers are purchasing these products from offshore. This does not surprise us given the large price differentials.
Exhibit 206
38%-62% online shoppers purchased jewelry, clothing, accessories or shoes from offshore websites
67%
52%
49%
48%
43%
38%
38%
35%
32%
26%
22%
21%
18%
13%
11%
10%
Books
Jewelry
Clothing
Athletic apparel & athletic shoes
Auto parts & accessories
Shoes
Consumer electronics
None of these categories
Sporting goods
Personal care & household products
Home improvement items & tools
Office & school supplies
Home furnishings
Groceries
Large home appliances
Pet food & supplies
Source: AlphaWise, Morgan Stanley Research
DJS ‘House of Brands’ strategy leaves it more exposed to online leakage. DJS has repeatedly emphasized its ‘house of brands’ product strategy and market position. Moreover, we estimate that about 50% of DJS sales are generated from global brands. While this provides a point of difference to competitors, it also exposes DJS to global price benchmarking. As Australian prices reduce DJS is likely to be impacted by price deflation leading to a reduction in sales. By comparison, Myer has consistently focused on the development and growth of its private labels, now close to 20% of Myer’s revenues. We think that Myer is less exposed to price deflation given that it owns a higher proportion of the brands it sells.
Global pricing harmonization: a double-edged sword. We see this as a material headwind for DJS. If prices are lowered, revenues are likely to be pressured as volume uplift is unlikely to provide a complete offset; if prices remain high, then we’d expect leakage to online to continue. To date, DJS has managed to drop prices on a small number of selected products. We don’t expect DJS will be able to achieve comparable pricing to global retailers across product categories, given a higher cost base and higher wholesale buy prices compared with offshore peers. We believe this is
evident in DJS’ own price promise that it will only price match domestic store based retailers and no international or pure online retailers.
Investment in online seems light. Despite being a laggard in eCommerce, we are yet to be convinced of DJS’ commitment to building an accretive online platform. The management has made it clear that the investment in online will come from the existing capex budget of A$80m, which seems very light compared to Nordstrom’s US$1B eCommerce capex plan for the next five years.
Store roll out to further pressure long-term earnings and returns. DJS remains committed to rolling out new stores. We would argue that as sales shift online it should be shrinking the store footprint rather than expanding it.
Investment Risks
A$ depreciation should ease the price differentials and online leakage. The rapid A$ appreciation in the past couple of years has accelerated the growth in online. Not only did it magnify the domestic price premium over offshore, it also sent more Australians and their shopping overseas. So a (gradual) reversal of this trend should ease the topline pressure for DJS.
Cyclical improvements: DJS is leveraged to improvements in general consumer spend. In addition, given DJS’ customer base tends to be higher income earners with investments in property and / or stock markets, an improvement in these markets should also lift its customers’ propensity to spend.
Exhibit 207
Online retailers used in the past 12 months – online purchasers who used the retailer eBay.com 57% The Iconic 3%
Amazon.com 28% Myer 3%
JB Hi-Fi 15% The Good Guys 2%
Apple 12% Kmart 2%
Big W 11% EB Games 2%
Grays Online 8% Bing Lee 1%
Dick Smith 7% Bonds 1%
Officeworks 7% Surfstitch 1%
Coles 6% David Jones 1%
Woolworth 6% Peter Alexander 1%
Target 5% Sheridan 1%
Cellarmasters 4% Oroton 1%
Aussie Farmers Direct 4% Just Jeans 1%
Dan Murphys 3% First Choice 1%
Harvey Norman 3% Dotti 1%
ASOS 3%
Source: AlphaWise, Morgan Stanley Research
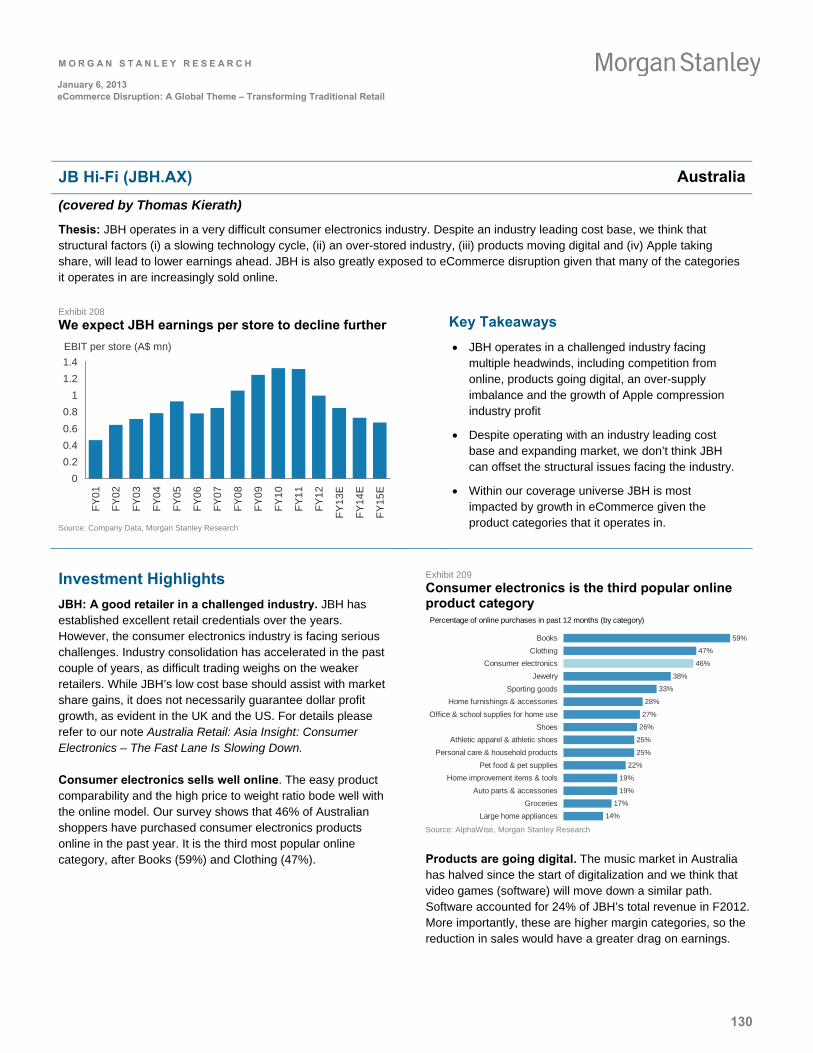
M O R G A N S T A N L E Y R E S E A R C H
130
January 6, 2013 eCommerce Disruption: A Global Theme – Transforming Traditional Retail
JB Hi-Fi (JBH.AX) Australia
(covered by Thomas Kierath)
Thesis: JBH operates in a very difficult consumer electronics industry. Despite an industry leading cost base, we think that structural factors (i) a slowing technology cycle, (ii) an over-stored industry, (iii) products moving digital and (iv) Apple taking share, will lead to lower earnings ahead. JBH is also greatly exposed to eCommerce disruption given that many of the categories it operates in are increasingly sold online.
Exhibit 208
We expect JBH earnings per store to decline further
EBIT per store (A$ mn)
0
0.2
0.4
0.6
0.8
1
1.2
1.4
FY
01
FY
02
FY
03
FY
04
FY
05
FY
06
FY
07
FY
08
FY
09
FY
10
FY
11
FY
12
FY
13
E
FY
14
E
FY
15
E
Source: Company Data, Morgan Stanley Research
Key Takeaways
JBH operates in a challenged industry facing multiple headwinds, including competition from online, products going digital, an over-supply imbalance and the growth of Apple compression industry profit
Despite operating with an industry leading cost base and expanding market, we don’t think JBH can offset the structural issues facing the industry.
Within our coverage universe JBH is most impacted by growth in eCommerce given the product categories that it operates in.
Investment Highlights
JBH: A good retailer in a challenged industry. JBH has established excellent retail credentials over the years. However, the consumer electronics industry is facing serious challenges. Industry consolidation has accelerated in the past couple of years, as difficult trading weighs on the weaker retailers. While JBH’s low cost base should assist with market share gains, it does not necessarily guarantee dollar profit growth, as evident in the UK and the US. For details please refer to our note Australia Retail: Asia Insight: Consumer Electronics – The Fast Lane Is Slowing Down.
Consumer electronics sells well online. The easy product comparability and the high price to weight ratio bode well with the online model. Our survey shows that 46% of Australian shoppers have purchased consumer electronics products online in the past year. It is the third most popular online category, after Books (59%) and Clothing (47%).
Exhibit 209
Consumer electronics is the third popular online product category
59%
47%
46%
38%
33%
28%
27%
26%
25%
25%
22%
19%
19%
17%
14%
Books
Clothing
Consumer electronics
Jewelry
Sporting goods
Home furnishings & accessories
Office & school supplies for home use
Shoes
Athletic apparel & athletic shoes
Personal care & household products
Pet food & pet supplies
Home improvement items & tools
Auto parts & accessories
Groceries
Large home appliances
Percentage of online purchases in past 12 months (by category)
Source: AlphaWise, Morgan Stanley Research
Products are going digital. The music market in Australia has halved since the start of digitalization and we think that video games (software) will move down a similar path. Software accounted for 24% of JBH’s total revenue in F2012. More importantly, these are higher margin categories, so the reduction in sales would have a greater drag on earnings.
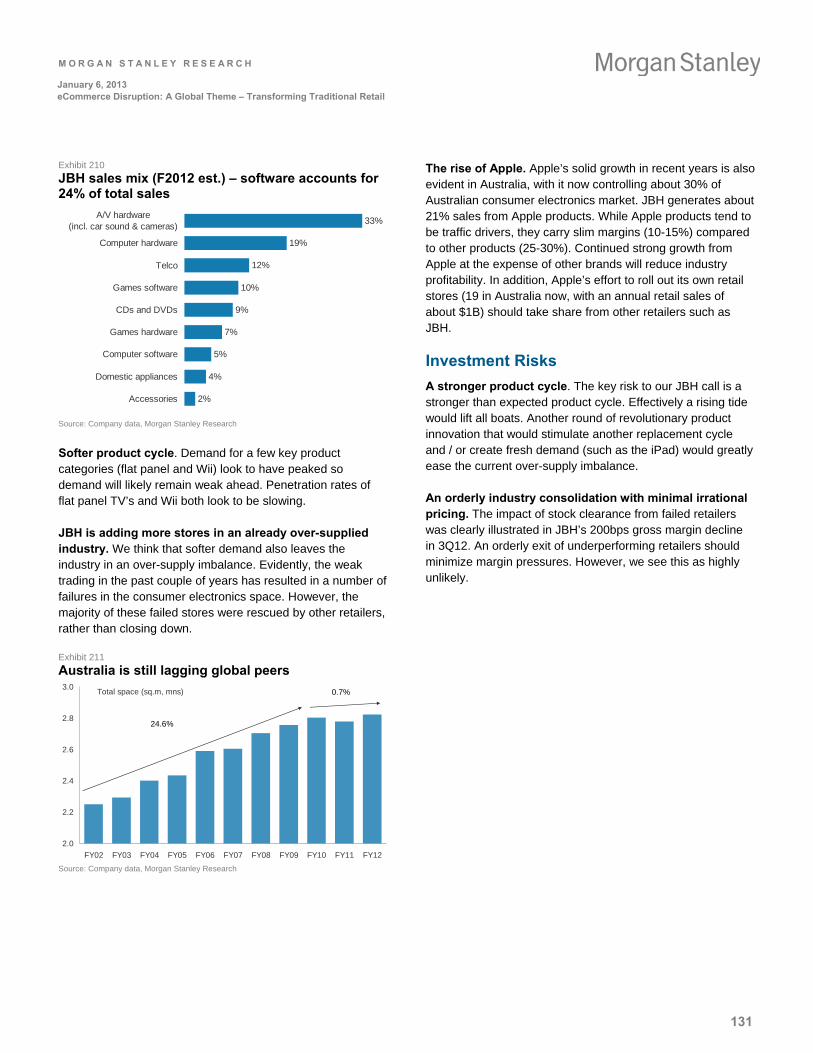
M O R G A N S T A N L E Y R E S E A R C H
131
January 6, 2013 eCommerce Disruption: A Global Theme – Transforming Traditional Retail
Exhibit 210
JBH sales mix (F2012 est.) – software accounts for 24% of total sales
33%
19%
12%
10%
9%
7%
5%
4%
2%
A/V hardware(incl. car sound & cameras)
Computer hardware
Telco
Games software
CDs and DVDs
Games hardware
Computer software
Domestic appliances
Accessories
Source: Company data, Morgan Stanley Research
Softer product cycle. Demand for a few key product categories (flat panel and Wii) look to have peaked so demand will likely remain weak ahead. Penetration rates of flat panel TV’s and Wii both look to be slowing.
JBH is adding more stores in an already over-supplied industry. We think that softer demand also leaves the industry in an over-supply imbalance. Evidently, the weak trading in the past couple of years has resulted in a number of failures in the consumer electronics space. However, the majority of these failed stores were rescued by other retailers, rather than closing down.
Exhibit 211
Australia is still lagging global peers
Total space (sq.m, mns)
2.0
2.2
2.4
2.6
2.8
3.0
FY02 FY03 FY04 FY05 FY06 FY07 FY08 FY09 FY10 FY11 FY12
24.6%
0.7%
Source: Company data, Morgan Stanley Research
The rise of Apple. Apple’s solid growth in recent years is also evident in Australia, with it now controlling about 30% of Australian consumer electronics market. JBH generates about 21% sales from Apple products. While Apple products tend to be traffic drivers, they carry slim margins (10-15%) compared to other products (25-30%). Continued strong growth from Apple at the expense of other brands will reduce industry profitability. In addition, Apple’s effort to roll out its own retail stores (19 in Australia now, with an annual retail sales of about $1B) should take share from other retailers such as JBH.
Investment Risks
A stronger product cycle. The key risk to our JBH call is a stronger than expected product cycle. Effectively a rising tide would lift all boats. Another round of revolutionary product innovation that would stimulate another replacement cycle and / or create fresh demand (such as the iPad) would greatly ease the current over-supply imbalance.
An orderly industry consolidation with minimal irrational pricing. The impact of stock clearance from failed retailers was clearly illustrated in JBH’s 200bps gross margin decline in 3Q12. An orderly exit of underperforming retailers should minimize margin pressures. However, we see this as highly unlikely.
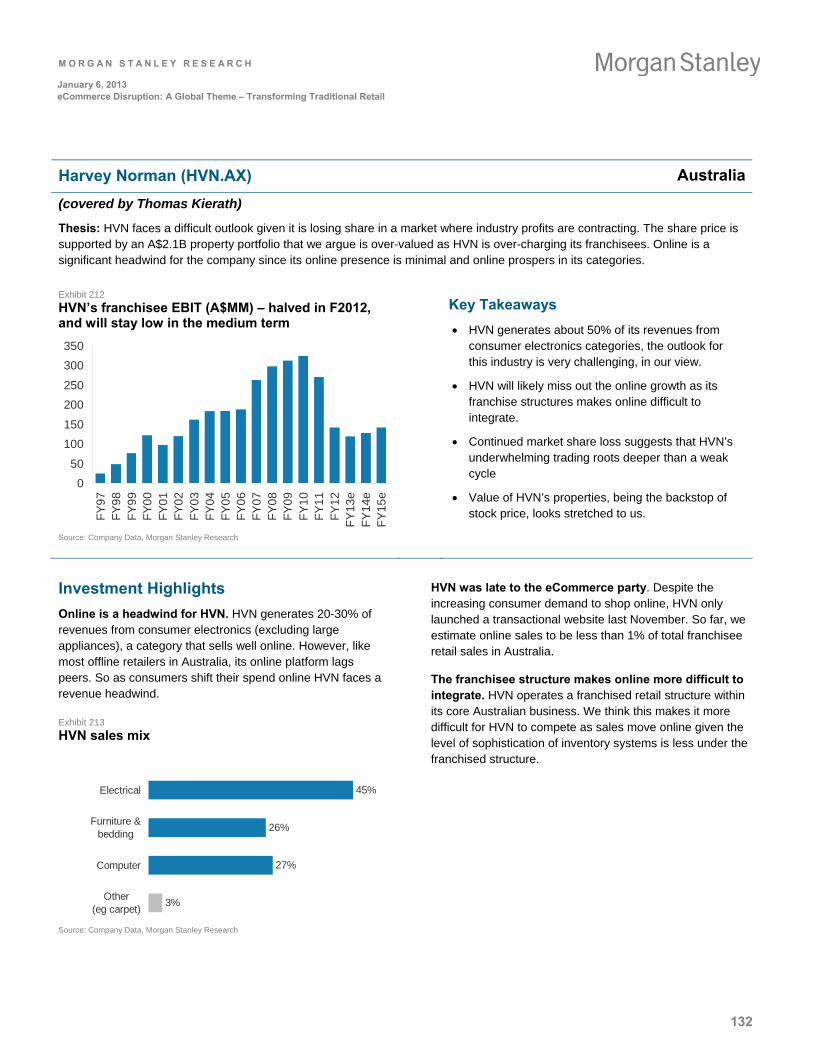
M O R G A N S T A N L E Y R E S E A R C H
132
January 6, 2013 eCommerce Disruption: A Global Theme – Transforming Traditional Retail
Harvey Norman (HVN.AX) Australia
(covered by Thomas Kierath)
Thesis: HVN faces a difficult outlook given it is losing share in a market where industry profits are contracting. The share price is supported by an A$2.1B property portfolio that we argue is over-valued as HVN is over-charging its franchisees. Online is a significant headwind for the company since its online presence is minimal and online prospers in its categories.
Exhibit 212
HVN’s franchisee EBIT (A$MM) – halved in F2012, and will stay low in the medium term
0
50
100
150
200
250
300
350
FY
97
FY
98
FY
99
FY
00
FY
01
FY
02
FY
03
FY
04
FY
05
FY
06
FY
07
FY
08
FY
09
FY
10
FY
11
FY
12
FY
13
eF
Y1
4e
FY
15
e
Source: Company Data, Morgan Stanley Research
Key Takeaways
HVN generates about 50% of its revenues from consumer electronics categories, the outlook for this industry is very challenging, in our view.
HVN will likely miss out the online growth as its franchise structures makes online difficult to integrate.
Continued market share loss suggests that HVN’s underwhelming trading roots deeper than a weak cycle
Value of HVN’s properties, being the backstop of stock price, looks stretched to us.
Investment Highlights
Online is a headwind for HVN. HVN generates 20-30% of revenues from consumer electronics (excluding large appliances), a category that sells well online. However, like most offline retailers in Australia, its online platform lags peers. So as consumers shift their spend online HVN faces a revenue headwind.
Exhibit 213
HVN sales mix
26%
45%
27%
3%
Electrical
Furniture &bedding
Computer
Other(eg carpet)
Source: Company Data, Morgan Stanley Research
HVN was late to the eCommerce party. Despite the increasing consumer demand to shop online, HVN only launched a transactional website last November. So far, we estimate online sales to be less than 1% of total franchisee retail sales in Australia.
The franchisee structure makes online more difficult to integrate. HVN operates a franchised retail structure within its core Australian business. We think this makes it more difficult for HVN to compete as sales move online given the level of sophistication of inventory systems is less under the franchised structure.
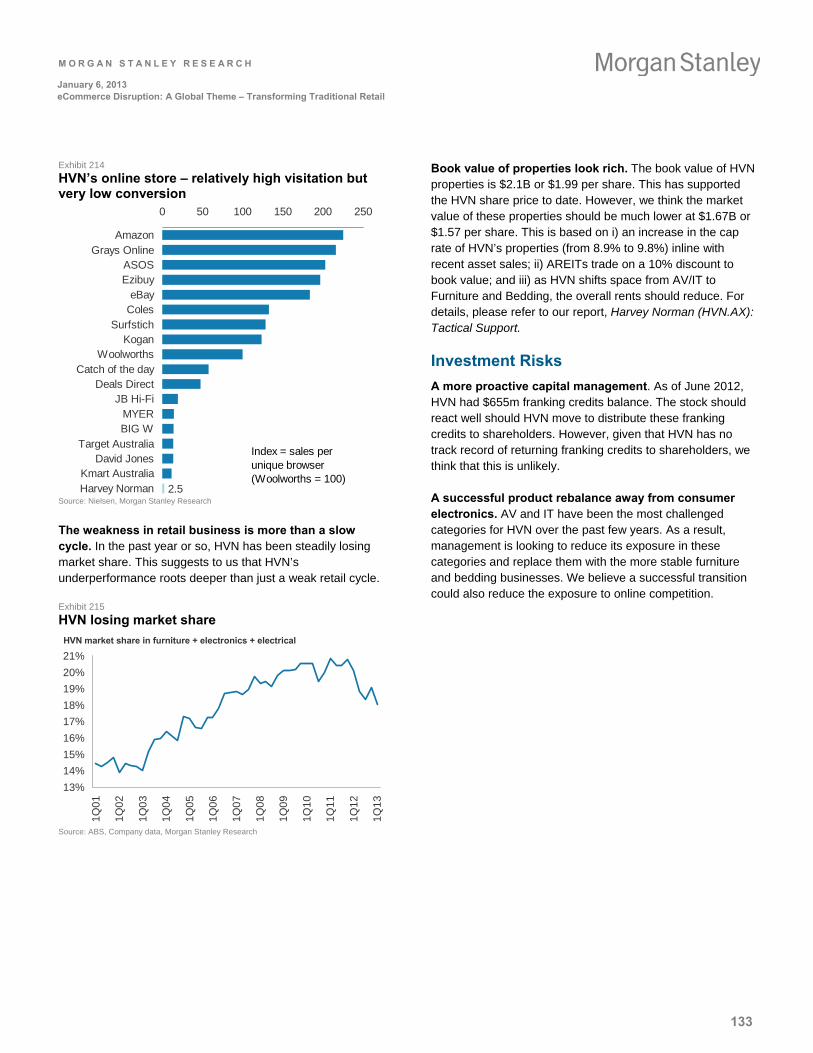
M O R G A N S T A N L E Y R E S E A R C H
133
January 6, 2013 eCommerce Disruption: A Global Theme – Transforming Traditional Retail
Exhibit 214
HVN’s online store – relatively high visitation but very low conversion
2.5
0 50 100 150 200 250
AmazonGrays Online
ASOSEzibuy
eBayColes
SurfstichKogan
WoolworthsCatch of the day
Deals DirectJB Hi-Fi
MYERBIG W
Target AustraliaDavid Jones
Kmart AustraliaHarvey Norman
Index = sales per unique browser(Woolworths = 100)
Source: Nielsen, Morgan Stanley Research
The weakness in retail business is more than a slow cycle. In the past year or so, HVN has been steadily losing market share. This suggests to us that HVN’s underperformance roots deeper than just a weak retail cycle.
Exhibit 215
HVN losing market share
13%
14%
15%
16%
17%
18%
19%
20%
21%
1Q0
1
1Q0
2
1Q0
3
1Q0
4
1Q0
5
1Q0
6
1Q0
7
1Q0
8
1Q0
9
1Q1
0
1Q1
1
1Q1
2
1Q1
3
HVN market share in furniture + electronics + electrical
Source: ABS, Company data, Morgan Stanley Research
Book value of properties look rich. The book value of HVN properties is $2.1B or $1.99 per share. This has supported the HVN share price to date. However, we think the market value of these properties should be much lower at $1.67B or $1.57 per share. This is based on i) an increase in the cap rate of HVN’s properties (from 8.9% to 9.8%) inline with recent asset sales; ii) AREITs trade on a 10% discount to book value; and iii) as HVN shifts space from AV/IT to Furniture and Bedding, the overall rents should reduce. For details, please refer to our report, Harvey Norman (HVN.AX): Tactical Support.
Investment Risks
A more proactive capital management. As of June 2012, HVN had $655m franking credits balance. The stock should react well should HVN move to distribute these franking credits to shareholders. However, given that HVN has no track record of returning franking credits to shareholders, we think that this is unlikely.
A successful product rebalance away from consumer electronics. AV and IT have been the most challenged categories for HVN over the past few years. As a result, management is looking to reduce its exposure in these categories and replace them with the more stable furniture and bedding businesses. We believe a successful transition could also reduce the exposure to online competition.
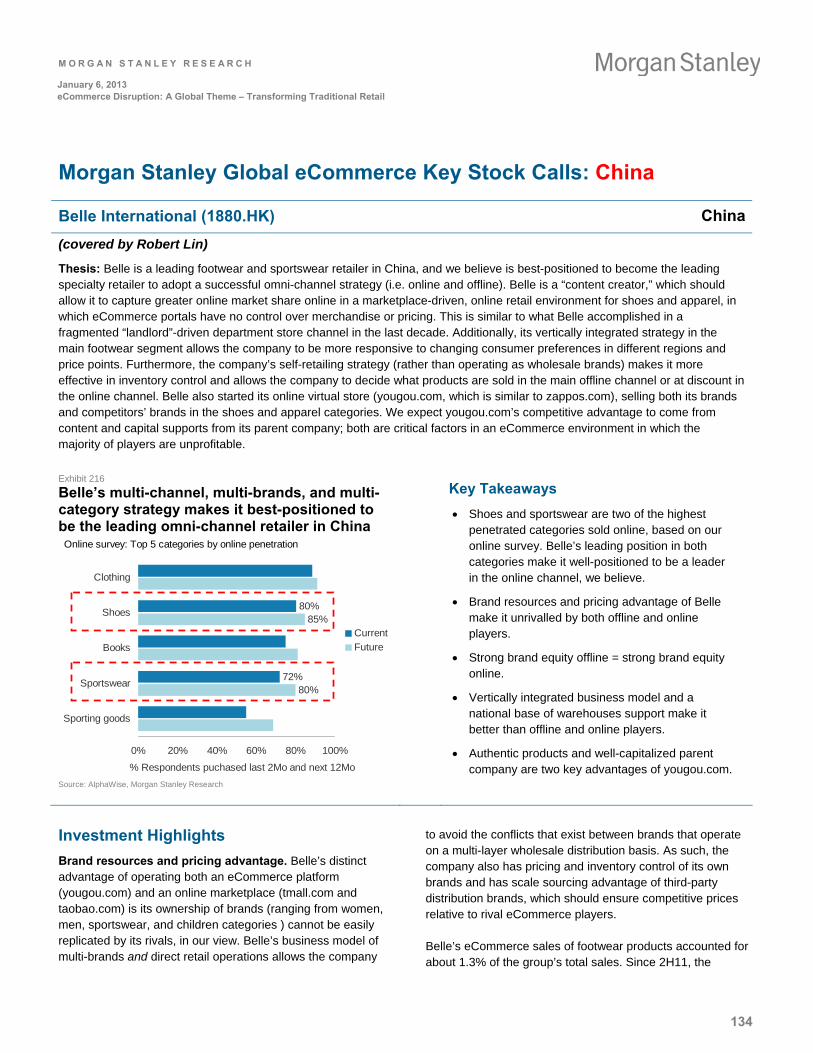
M O R G A N S T A N L E Y R E S E A R C H
134
January 6, 2013 eCommerce Disruption: A Global Theme – Transforming Traditional Retail
Morgan Stanley Global eCommerce Key Stock Calls: China
Belle International (1880.HK) China
(covered by Robert Lin)
Thesis: Belle is a leading footwear and sportswear retailer in China, and we believe is best-positioned to become the leading specialty retailer to adopt a successful omni-channel strategy (i.e. online and offline). Belle is a “content creator,” which should allow it to capture greater online market share online in a marketplace-driven, online retail environment for shoes and apparel, in which eCommerce portals have no control over merchandise or pricing. This is similar to what Belle accomplished in a fragmented “landlord”-driven department store channel in the last decade. Additionally, its vertically integrated strategy in the main footwear segment allows the company to be more responsive to changing consumer preferences in different regions and price points. Furthermore, the company’s self-retailing strategy (rather than operating as wholesale brands) makes it more effective in inventory control and allows the company to decide what products are sold in the main offline channel or at discount in the online channel. Belle also started its online virtual store (yougou.com, which is similar to zappos.com), selling both its brands and competitors’ brands in the shoes and apparel categories. We expect yougou.com’s competitive advantage to come from content and capital supports from its parent company; both are critical factors in an eCommerce environment in which the majority of players are unprofitable.
Exhibit 216 Belle’s multi-channel, multi-brands, and multi-category strategy makes it best-positioned to be the leading omni-channel retailer in China
85%
80%72%
80%
0% 20% 40% 60% 80% 100%
Sporting goods
Sportswear
Books
Shoes
Clothing
% Respondents puchased last 2Mo and next 12Mo
Current
Future
Online survey: Top 5 categories by online penetration
Source: AlphaWise, Morgan Stanley Research
Key Takeaways
Shoes and sportswear are two of the highest penetrated categories sold online, based on our online survey. Belle’s leading position in both categories make it well-positioned to be a leader in the online channel, we believe.
Brand resources and pricing advantage of Belle make it unrivalled by both offline and online players.
Strong brand equity offline = strong brand equity online.
Vertically integrated business model and a national base of warehouses support make it better than offline and online players.
Authentic products and well-capitalized parent company are two key advantages of yougou.com.
Investment Highlights
Brand resources and pricing advantage. Belle’s distinct advantage of operating both an eCommerce platform (yougou.com) and an online marketplace (tmall.com and taobao.com) is its ownership of brands (ranging from women, men, sportswear, and children categories ) cannot be easily replicated by its rivals, in our view. Belle’s business model of multi-brands and direct retail operations allows the company
to avoid the conflicts that exist between brands that operate on a multi-layer wholesale distribution basis. As such, the company also has pricing and inventory control of its own brands and has scale sourcing advantage of third-party distribution brands, which should ensure competitive prices relative to rival eCommerce players.
Belle’s eCommerce sales of footwear products accounted for about 1.3% of the group’s total sales. Since 2H11, the
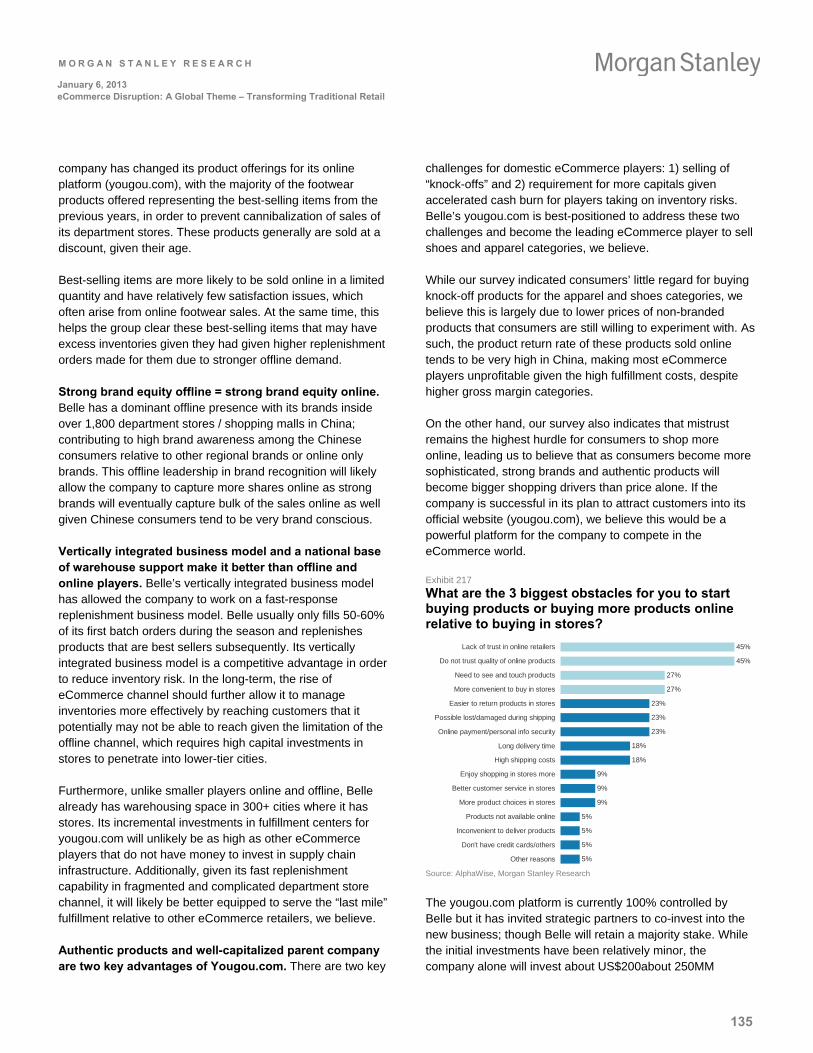
M O R G A N S T A N L E Y R E S E A R C H
135
January 6, 2013 eCommerce Disruption: A Global Theme – Transforming Traditional Retail
company has changed its product offerings for its online platform (yougou.com), with the majority of the footwear products offered representing the best-selling items from the previous years, in order to prevent cannibalization of sales of its department stores. These products generally are sold at a discount, given their age.
Best-selling items are more likely to be sold online in a limited quantity and have relatively few satisfaction issues, which often arise from online footwear sales. At the same time, this helps the group clear these best-selling items that may have excess inventories given they had given higher replenishment orders made for them due to stronger offline demand.
Strong brand equity offline = strong brand equity online. Belle has a dominant offline presence with its brands inside over 1,800 department stores / shopping malls in China; contributing to high brand awareness among the Chinese consumers relative to other regional brands or online only brands. This offline leadership in brand recognition will likely allow the company to capture more shares online as strong brands will eventually capture bulk of the sales online as well given Chinese consumers tend to be very brand conscious.
Vertically integrated business model and a national base of warehouse support make it better than offline and online players. Belle’s vertically integrated business model has allowed the company to work on a fast-response replenishment business model. Belle usually only fills 50-60% of its first batch orders during the season and replenishes products that are best sellers subsequently. Its vertically integrated business model is a competitive advantage in order to reduce inventory risk. In the long-term, the rise of eCommerce channel should further allow it to manage inventories more effectively by reaching customers that it potentially may not be able to reach given the limitation of the offline channel, which requires high capital investments in stores to penetrate into lower-tier cities.
Furthermore, unlike smaller players online and offline, Belle already has warehousing space in 300+ cities where it has stores. Its incremental investments in fulfillment centers for yougou.com will unlikely be as high as other eCommerce players that do not have money to invest in supply chain infrastructure. Additionally, given its fast replenishment capability in fragmented and complicated department store channel, it will likely be better equipped to serve the “last mile” fulfillment relative to other eCommerce retailers, we believe.
Authentic products and well-capitalized parent company are two key advantages of Yougou.com. There are two key
challenges for domestic eCommerce players: 1) selling of “knock-offs” and 2) requirement for more capitals given accelerated cash burn for players taking on inventory risks. Belle’s yougou.com is best-positioned to address these two challenges and become the leading eCommerce player to sell shoes and apparel categories, we believe.
While our survey indicated consumers’ little regard for buying knock-off products for the apparel and shoes categories, we believe this is largely due to lower prices of non-branded products that consumers are still willing to experiment with. As such, the product return rate of these products sold online tends to be very high in China, making most eCommerce players unprofitable given the high fulfillment costs, despite higher gross margin categories.
On the other hand, our survey also indicates that mistrust remains the highest hurdle for consumers to shop more online, leading us to believe that as consumers become more sophisticated, strong brands and authentic products will become bigger shopping drivers than price alone. If the company is successful in its plan to attract customers into its official website (yougou.com), we believe this would be a powerful platform for the company to compete in the eCommerce world.
Exhibit 217 What are the 3 biggest obstacles for you to start buying products or buying more products online relative to buying in stores?
45%
45%
27%
27%
23%
23%
23%
18%
18%
9%
9%
9%
5%
5%
5%
5%
Lack of trust in online retailers
Do not trust quality of online products
Need to see and touch products
More convenient to buy in stores
Easier to return products in stores
Possible lost/damaged during shipping
Online payment/personal info security
Long delivery time
High shipping costs
Enjoy shopping in stores more
Better customer service in stores
More product choices in stores
Products not available online
Inconvenient to deliver products
Don't have credit cards/others
Other reasons Source: AlphaWise, Morgan Stanley Research
The yougou.com platform is currently 100% controlled by Belle but it has invited strategic partners to co-invest into the new business; though Belle will retain a majority stake. While the initial investments have been relatively minor, the company alone will invest about US$200about 250MM
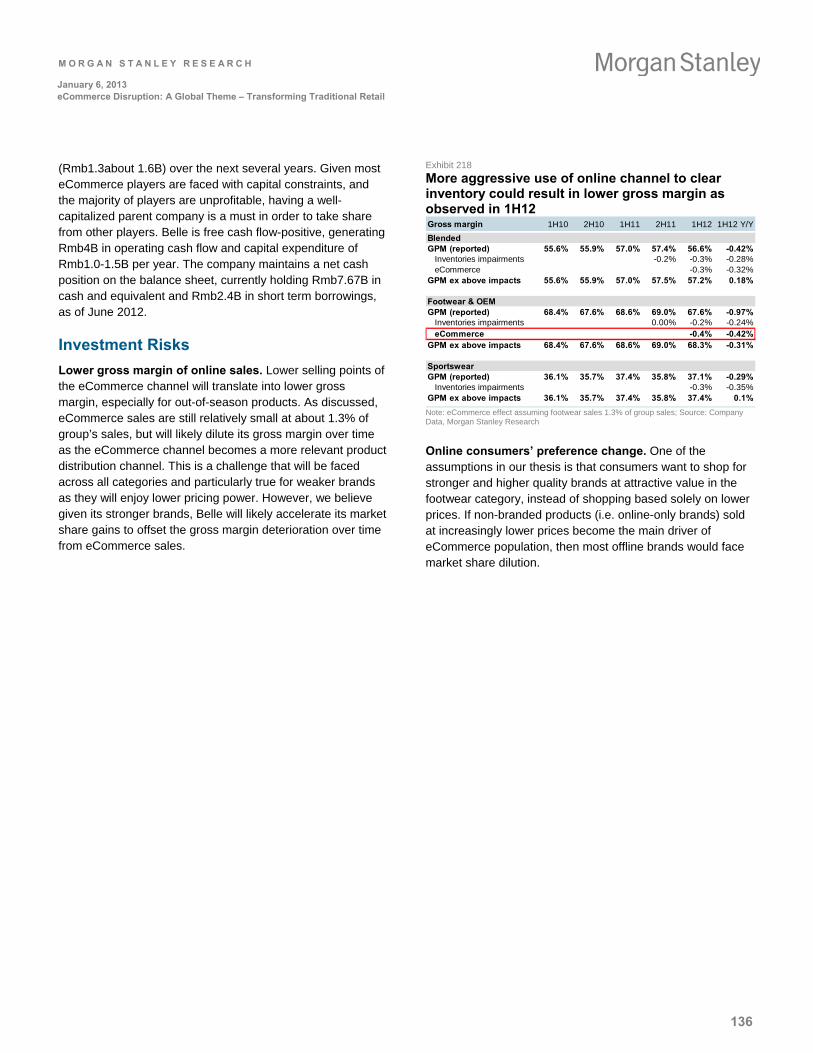
M O R G A N S T A N L E Y R E S E A R C H
136
January 6, 2013 eCommerce Disruption: A Global Theme – Transforming Traditional Retail
(Rmb1.3about 1.6B) over the next several years. Given most eCommerce players are faced with capital constraints, and the majority of players are unprofitable, having a well-capitalized parent company is a must in order to take share from other players. Belle is free cash flow-positive, generating Rmb4B in operating cash flow and capital expenditure of Rmb1.0-1.5B per year. The company maintains a net cash position on the balance sheet, currently holding Rmb7.67B in cash and equivalent and Rmb2.4B in short term borrowings, as of June 2012.
Investment Risks
Lower gross margin of online sales. Lower selling points of the eCommerce channel will translate into lower gross margin, especially for out-of-season products. As discussed, eCommerce sales are still relatively small at about 1.3% of group’s sales, but will likely dilute its gross margin over time as the eCommerce channel becomes a more relevant product distribution channel. This is a challenge that will be faced across all categories and particularly true for weaker brands as they will enjoy lower pricing power. However, we believe given its stronger brands, Belle will likely accelerate its market share gains to offset the gross margin deterioration over time from eCommerce sales.
Exhibit 218 More aggressive use of online channel to clear inventory could result in lower gross margin as observed in 1H12 Gross margin 1H10 2H10 1H11 2H11 1H12 1H12 Y/Y
BlendedGPM (reported) 55.6% 55.9% 57.0% 57.4% 56.6% -0.42%
Inventories impairments -0.2% -0.3% -0.28%eCommerce -0.3% -0.32%
GPM ex above impacts 55.6% 55.9% 57.0% 57.5% 57.2% 0.18%
Footwear & OEMGPM (reported) 68.4% 67.6% 68.6% 69.0% 67.6% -0.97%
Inventories impairments 0.00% -0.2% -0.24%eCommerce -0.4% -0.42%
GPM ex above impacts 68.4% 67.6% 68.6% 69.0% 68.3% -0.31%
SportswearGPM (reported) 36.1% 35.7% 37.4% 35.8% 37.1% -0.29%
Inventories impairments -0.3% -0.35%GPM ex above impacts 36.1% 35.7% 37.4% 35.8% 37.4% 0.1%
Note: eCommerce effect assuming footwear sales 1.3% of group sales; Source: Company Data, Morgan Stanley Research
Online consumers’ preference change. One of the assumptions in our thesis is that consumers want to shop for stronger and higher quality brands at attractive value in the footwear category, instead of shopping based solely on lower prices. If non-branded products (i.e. online-only brands) sold at increasingly lower prices become the main driver of eCommerce population, then most offline brands would face market share dilution.
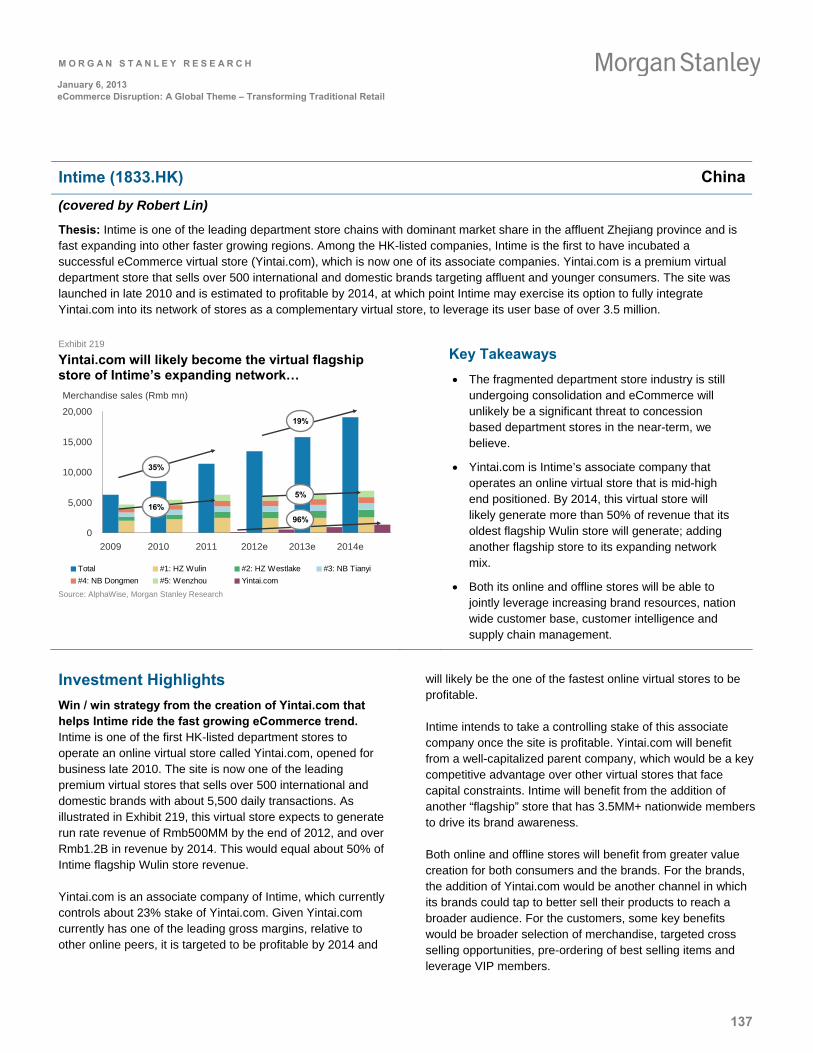
M O R G A N S T A N L E Y R E S E A R C H
137
January 6, 2013 eCommerce Disruption: A Global Theme – Transforming Traditional Retail
Intime (1833.HK) China
(covered by Robert Lin)
Thesis: Intime is one of the leading department store chains with dominant market share in the affluent Zhejiang province and is fast expanding into other faster growing regions. Among the HK-listed companies, Intime is the first to have incubated a successful eCommerce virtual store (Yintai.com), which is now one of its associate companies. Yintai.com is a premium virtual department store that sells over 500 international and domestic brands targeting affluent and younger consumers. The site was launched in late 2010 and is estimated to profitable by 2014, at which point Intime may exercise its option to fully integrate Yintai.com into its network of stores as a complementary virtual store, to leverage its user base of over 3.5 million.
Exhibit 219
Yintai.com will likely become the virtual flagship store of Intime’s expanding network…
Merchandise sales (Rmb mn)
0
5,000
10,000
15,000
20,000
2009 2010 2011 2012e 2013e 2014e
Total #1: HZ Wulin #2: HZ Westlake #3: NB Tianyi
#4: NB Dongmen #5: Wenzhou Yintai.com
35%
16%
19%
5%
96%
Source: AlphaWise, Morgan Stanley Research
Key Takeaways
The fragmented department store industry is still undergoing consolidation and eCommerce will unlikely be a significant threat to concession based department stores in the near-term, we believe.
Yintai.com is Intime’s associate company that operates an online virtual store that is mid-high end positioned. By 2014, this virtual store will likely generate more than 50% of revenue that its oldest flagship Wulin store will generate; adding another flagship store to its expanding network mix.
Both its online and offline stores will be able to jointly leverage increasing brand resources, nation wide customer base, customer intelligence and supply chain management.
Investment Highlights
Win / win strategy from the creation of Yintai.com that helps Intime ride the fast growing eCommerce trend. Intime is one of the first HK-listed department stores to operate an online virtual store called Yintai.com, opened for business late 2010. The site is now one of the leading premium virtual stores that sells over 500 international and domestic brands with about 5,500 daily transactions. As illustrated in Exhibit 219, this virtual store expects to generate run rate revenue of Rmb500MM by the end of 2012, and over Rmb1.2B in revenue by 2014. This would equal about 50% of Intime flagship Wulin store revenue.
Yintai.com is an associate company of Intime, which currently controls about 23% stake of Yintai.com. Given Yintai.com currently has one of the leading gross margins, relative to other online peers, it is targeted to be profitable by 2014 and
will likely be the one of the fastest online virtual stores to be profitable.
Intime intends to take a controlling stake of this associate company once the site is profitable. Yintai.com will benefit from a well-capitalized parent company, which would be a key competitive advantage over other virtual stores that face capital constraints. Intime will benefit from the addition of another “flagship” store that has 3.5MM+ nationwide members to drive its brand awareness.
Both online and offline stores will benefit from greater value creation for both consumers and the brands. For the brands, the addition of Yintai.com would be another channel in which its brands could tap to better sell their products to reach a broader audience. For the customers, some key benefits would be broader selection of merchandise, targeted cross selling opportunities, pre-ordering of best selling items and leverage VIP members.
M O R G A N S T A N L E Y R E S E A R C H
138
January 6, 2013 eCommerce Disruption: A Global Theme – Transforming Traditional Retail
Consolidation and penetration thesis continue to be growth opportunities for chain department stores. As previously discussed, China department stores are channels rather than true retailers. The global trend of brands preferring to be closer to consumers via self retailing strategy, especially in China, will benefit leading concessionaire based department stores and shopping malls, we believe. While these brands may allocate a percentage of revenue to the online channel over time, they will still need high-quality offline locations to display and sell the latest fashion products in order to differentiate their pricing, brands and positioning.
According to our online survey, some of the key observations outlining the rationale as to why respondents do not shop online more are: 1) lack of trust, 2) the need to “see and feel” the products, and 3) preference to make returns and exchanges in a physical store. This makes physical department stores that sell higher ticket and more fashion-oriented products more relevant.
Additionally, chain department stores like Intime are able more quickly to penetrate lower tier cities, which are key growth regions in which these brands want to increase their presence. Leading chain department stores like Intime that are dominant in the affluent Zhejiang province and continue to expand into lower tier cities should be among the key beneficiaries of this global retailing trend.
Affluent VIP customers are still key drivers of growth. We estimate Intime’s core VIP customers (which contribute 40% of its offline sales) belong to the top 25% of the income bracket in China. This demographic is less sensitive to price and may not be the price sensitive online shoppers in the near-term. We believe negative wealth from lower property prices and poor stock market performance were key drivers leading to slower SSSG in 2012.
High level of cash flow and strong balance sheet. Similar to other department stores, Intime enjoys relatively high levels of operating cash flow, benefiting from higher operating margin and a negative working capital cycle. Strong balance sheet and cash flow will be a requirement for all department stores as they invest more in technology innovation in order to
reduce fixed overhead, improve customer relationship management systems in order to enhance VIP customer penetration, and provide a higher level of value-added services to its brands.
Investment Risks
Weaker than expected economic recovery near-term. Per our November 23, 2012 note, China Dept. Stores Asia Insight: Seeking Value in a Moderate 2013 Recovery, we believe that one of the most important drivers to a 2012 SSSG deceleration had been due to negative wealth effect of the affluent consumers that had curtailed these important customers’ propensity to spend. We believe one of the reasons for this is property price weakness and poor performance of domestic stock markets. If property prices and stock market returns remain lackluster, combined with a weaker-than-expected economic recovery, a better 2013 recovery would likely be delayed.
Yintai.com fails to achieve profitability by 2014. Intime has mentioned the potential to increase its stake in the eCommerce associate company once it becomes profitable, which is targeted to be 2014, according to the company. If Yintai.com decides to continue focus on market share gain similar to other eCommerce peers through aggressive customer acquisition strategy, then the potential acquisition of this portal may be delayed.
Mid-high end brands’ revenue shifting online faster than expected. In a rational competitive environment, we think dominant mid-high end department store brands will balance their channel strategy by selling a majority of their in-season products at higher margin in the offline channel and majority of online sales would be outdated or off-season products. However, if the percentage and pace of change between online and offline sales for the brands are greater than expected, it could lead to cannibalized sales from the department store channel. While leading department stores like Intime are better-positioned given their stronger flagship stores, this could create medium-term risks if the brands’ channel balance is uncontrolled.
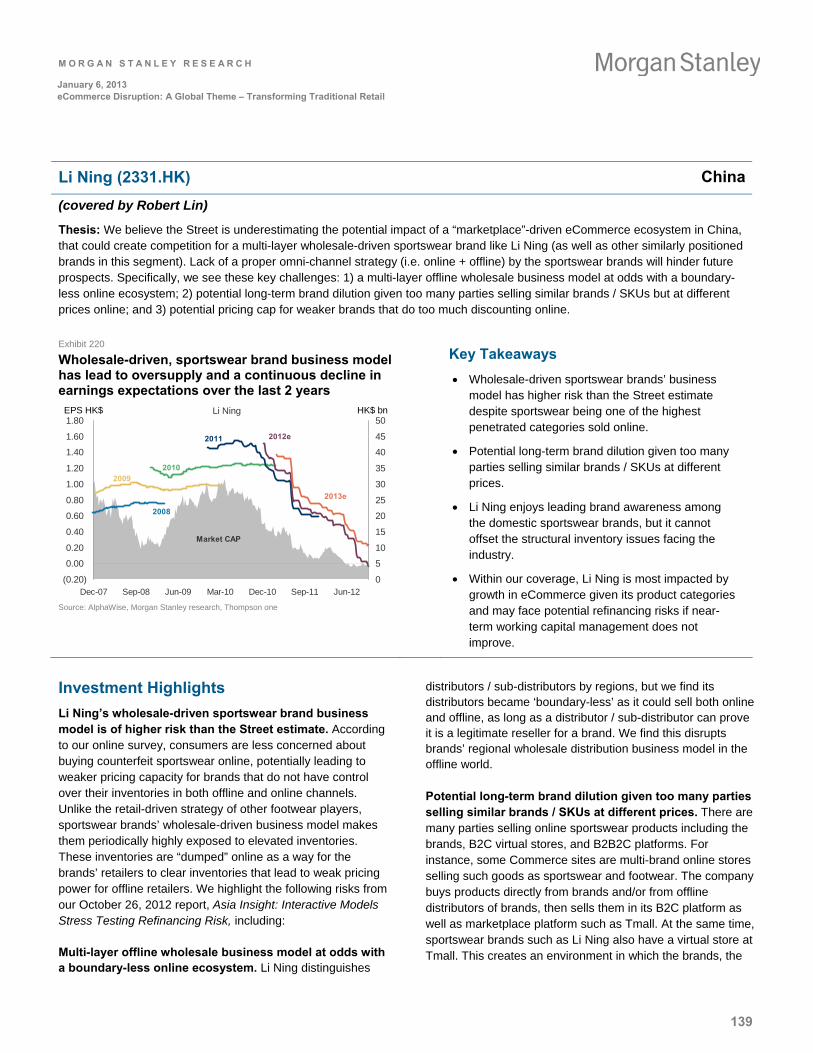
M O R G A N S T A N L E Y R E S E A R C H
139
January 6, 2013 eCommerce Disruption: A Global Theme – Transforming Traditional Retail
Li Ning (2331.HK) China
(covered by Robert Lin)
Thesis: We believe the Street is underestimating the potential impact of a “marketplace”-driven eCommerce ecosystem in China, that could create competition for a multi-layer wholesale-driven sportswear brand like Li Ning (as well as other similarly positioned brands in this segment). Lack of a proper omni-channel strategy (i.e. online + offline) by the sportswear brands will hinder future prospects. Specifically, we see these key challenges: 1) a multi-layer offline wholesale business model at odds with a boundary-less online ecosystem; 2) potential long-term brand dilution given too many parties selling similar brands / SKUs but at different prices online; and 3) potential pricing cap for weaker brands that do too much discounting online.
Exhibit 220
Wholesale-driven, sportswear brand business model has lead to oversupply and a continuous decline in earnings expectations over the last 2 years
Li Ning
(0.20)
0.00
0.20
0.40
0.60
0.80
1.00
1.20
1.40
1.60
1.80
Dec-07 Sep-08 Jun-09 Mar-10 Dec-10 Sep-11 Jun-12
0
5
10
15
20
25
30
35
40
45
50EPS HK$ HK$ bn
2008
20092010
2011 2012e
2013e
Market CAP
Source: AlphaWise, Morgan Stanley research, Thompson one
Key Takeaways
Wholesale-driven sportswear brands’ business model has higher risk than the Street estimate despite sportswear being one of the highest penetrated categories sold online.
Potential long-term brand dilution given too many parties selling similar brands / SKUs at different prices.
Li Ning enjoys leading brand awareness among the domestic sportswear brands, but it cannot offset the structural inventory issues facing the industry.
Within our coverage, Li Ning is most impacted by growth in eCommerce given its product categories and may face potential refinancing risks if near-term working capital management does not improve.
Investment Highlights
Li Ning’s wholesale-driven sportswear brand business model is of higher risk than the Street estimate. According to our online survey, consumers are less concerned about buying counterfeit sportswear online, potentially leading to weaker pricing capacity for brands that do not have control over their inventories in both offline and online channels. Unlike the retail-driven strategy of other footwear players, sportswear brands’ wholesale-driven business model makes them periodically highly exposed to elevated inventories. These inventories are “dumped” online as a way for the brands’ retailers to clear inventories that lead to weak pricing power for offline retailers. We highlight the following risks from our October 26, 2012 report, Asia Insight: Interactive Models Stress Testing Refinancing Risk, including:
Multi-layer offline wholesale business model at odds with a boundary-less online ecosystem. Li Ning distinguishes
distributors / sub-distributors by regions, but we find its distributors became ‘boundary-less’ as it could sell both online and offline, as long as a distributor / sub-distributor can prove it is a legitimate reseller for a brand. We find this disrupts brands’ regional wholesale distribution business model in the offline world.
Potential long-term brand dilution given too many parties selling similar brands / SKUs at different prices. There are many parties selling online sportswear products including the brands, B2C virtual stores, and B2B2C platforms. For instance, some Commerce sites are multi-brand online stores selling such goods as sportswear and footwear. The company buys products directly from brands and/or from offline distributors of brands, then sells them in its B2C platform as well as marketplace platform such as Tmall. At the same time, sportswear brands such as Li Ning also have a virtual store at Tmall. This creates an environment in which the brands, the
M O R G A N S T A N L E Y R E S E A R C H
140
January 6, 2013 eCommerce Disruption: A Global Theme – Transforming Traditional Retail
offline distributors / retailers and the virtual distributors / retailers are competing for the same customers but potentially offer similar SKUs at different prices. An extended practice could lead to a lack of pricing control by the brands over the long term, which undermines their brand-building efforts.
Potential pricing cap for weaker brands that do too much discount online. Given the industry-wide issue of excess inventories, the eCommerce portals have become popular alternatives to sell outdated products. As such, extended period of discounting and increased competition could make raising prices much harder offline (as well as online) in the future, especially for undifferentiated products (e.g. cotton T-shirts), which consumer hardly could differentiate in-season and off-season style.
Furthermore, we think China’s eCommerce demographic is currently younger and more price sensitive. This is an ideal channel for mass-market products (branded or non-branded).
As such, there is a proliferation of online-only brands selling at lower prices that could potentially take share away from traditional channel brands. While their market share may still be small compared to offline brands, they are new threats, especially in the casual and sportswear categories.
Investment Risks
A faster-than-expected industry turnaround from stronger retail recovery. We believe the Chinese sportswear industry won’t turnaround until 2013 at the earliest but if industry inventory clearance is faster than expected then Li Ning could enjoy a faster than expected recovery. With the help of its strategic investor (TPG), the company has been aggressively restructuring its operations by implementing a series of measures to control distributors and broadening pricing and product categories. Its ongoing effort to take more ownership of the retail channel by opening more self-operated stores and introduce fast replenishment to its stores may help it to manage inventories better in the long run.
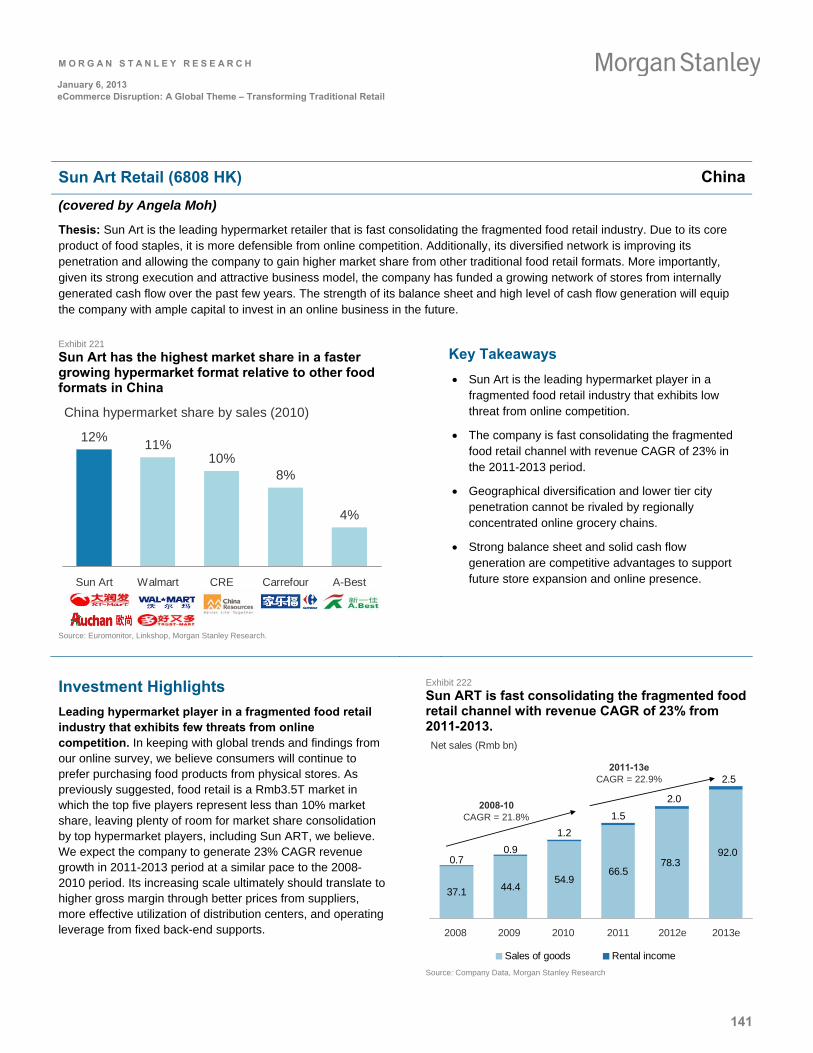
M O R G A N S T A N L E Y R E S E A R C H
141
January 6, 2013 eCommerce Disruption: A Global Theme – Transforming Traditional Retail
Sun Art Retail (6808 HK) China
(covered by Angela Moh)
Thesis: Sun Art is the leading hypermarket retailer that is fast consolidating the fragmented food retail industry. Due to its core product of food staples, it is more defensible from online competition. Additionally, its diversified network is improving its penetration and allowing the company to gain higher market share from other traditional food retail formats. More importantly, given its strong execution and attractive business model, the company has funded a growing network of stores from internally generated cash flow over the past few years. The strength of its balance sheet and high level of cash flow generation will equip the company with ample capital to invest in an online business in the future.
Exhibit 221
Sun Art has the highest market share in a faster growing hypermarket format relative to other food formats in China
China hypermarket share by sales (2010)
12%11%
10%8%
4%
Sun Art Walmart CRE Carrefour A-Best
Source: Euromonitor, Linkshop, Morgan Stanley Research.
Key Takeaways
Sun Art is the leading hypermarket player in a fragmented food retail industry that exhibits low threat from online competition.
The company is fast consolidating the fragmented food retail channel with revenue CAGR of 23% in the 2011-2013 period.
Geographical diversification and lower tier city penetration cannot be rivaled by regionally concentrated online grocery chains.
Strong balance sheet and solid cash flow generation are competitive advantages to support future store expansion and online presence.
Investment Highlights
Leading hypermarket player in a fragmented food retail industry that exhibits few threats from online competition. In keeping with global trends and findings from our online survey, we believe consumers will continue to prefer purchasing food products from physical stores. As previously suggested, food retail is a Rmb3.5T market in which the top five players represent less than 10% market share, leaving plenty of room for market share consolidation by top hypermarket players, including Sun ART, we believe. We expect the company to generate 23% CAGR revenue growth in 2011-2013 period at a similar pace to the 2008-2010 period. Its increasing scale ultimately should translate to higher gross margin through better prices from suppliers, more effective utilization of distribution centers, and operating leverage from fixed back-end supports.
Exhibit 222
Sun ART is fast consolidating the fragmented food retail channel with revenue CAGR of 23% from 2011-2013.
37.1 44.454.9
66.5
92.078.30.7
0.9
1.2
1.5
2.5
2.0
2008 2009 2010 2011 2012e 2013e
Net sales (Rmb bn)
Sales of goods Rental income
2008-10 CAGR = 21.8%
2011-13e CAGR = 22.9%
Source: Company Data, Morgan Stanley Research
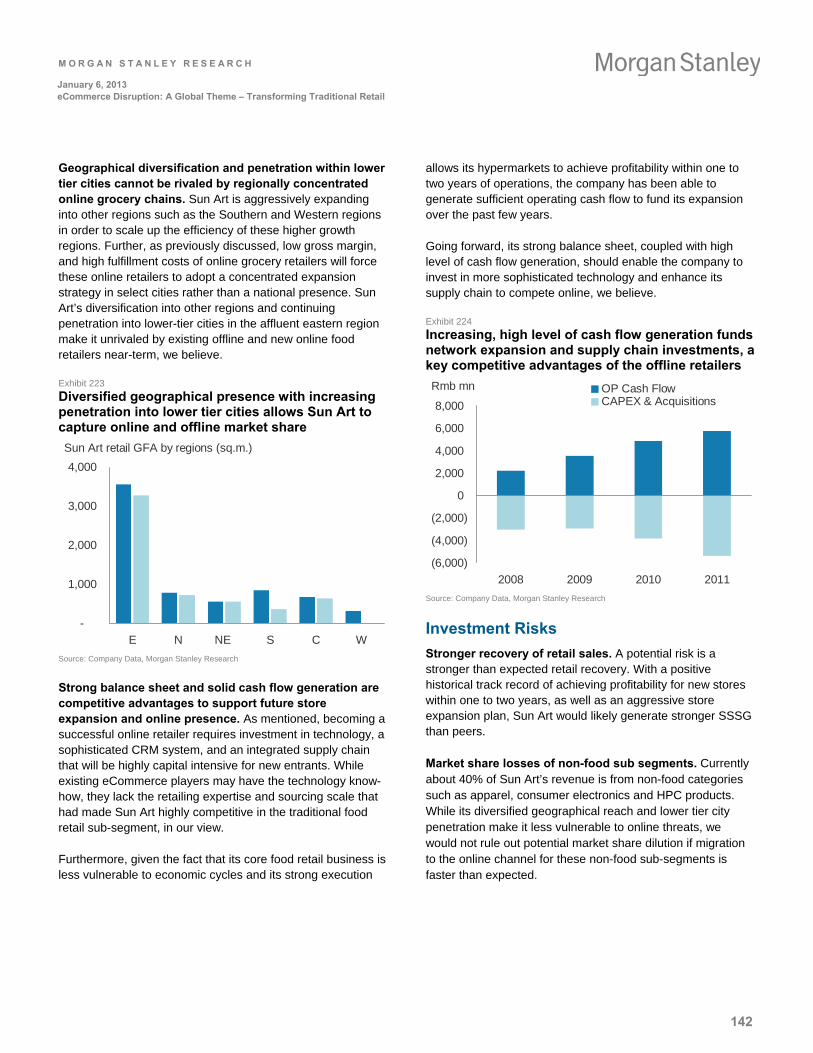
M O R G A N S T A N L E Y R E S E A R C H
142
January 6, 2013 eCommerce Disruption: A Global Theme – Transforming Traditional Retail
Geographical diversification and penetration within lower tier cities cannot be rivaled by regionally concentrated online grocery chains. Sun Art is aggressively expanding into other regions such as the Southern and Western regions in order to scale up the efficiency of these higher growth regions. Further, as previously discussed, low gross margin, and high fulfillment costs of online grocery retailers will force these online retailers to adopt a concentrated expansion strategy in select cities rather than a national presence. Sun Art’s diversification into other regions and continuing penetration into lower-tier cities in the affluent eastern region make it unrivaled by existing offline and new online food retailers near-term, we believe.
Exhibit 223
Diversified geographical presence with increasing penetration into lower tier cities allows Sun Art to capture online and offline market share
Sun Art retail GFA by regions (sq.m.)
-
1,000
2,000
3,000
4,000
E N NE S C W
Source: Company Data, Morgan Stanley Research
Strong balance sheet and solid cash flow generation are competitive advantages to support future store expansion and online presence. As mentioned, becoming a successful online retailer requires investment in technology, a sophisticated CRM system, and an integrated supply chain that will be highly capital intensive for new entrants. While existing eCommerce players may have the technology know-how, they lack the retailing expertise and sourcing scale that had made Sun Art highly competitive in the traditional food retail sub-segment, in our view.
Furthermore, given the fact that its core food retail business is less vulnerable to economic cycles and its strong execution
allows its hypermarkets to achieve profitability within one to two years of operations, the company has been able to generate sufficient operating cash flow to fund its expansion over the past few years.
Going forward, its strong balance sheet, coupled with high level of cash flow generation, should enable the company to invest in more sophisticated technology and enhance its supply chain to compete online, we believe.
Exhibit 224
Increasing, high level of cash flow generation funds network expansion and supply chain investments, a key competitive advantages of the offline retailers
Rmb mn
(6,000)
(4,000)
(2,000)
0
2,000
4,000
6,000
8,000
2008 2009 2010 2011
OP Cash FlowCAPEX & Acquisitions
Source: Company Data, Morgan Stanley Research
Investment Risks
Stronger recovery of retail sales. A potential risk is a stronger than expected retail recovery. With a positive historical track record of achieving profitability for new stores within one to two years, as well as an aggressive store expansion plan, Sun Art would likely generate stronger SSSG than peers.
Market share losses of non-food sub segments. Currently about 40% of Sun Art’s revenue is from non-food categories such as apparel, consumer electronics and HPC products. While its diversified geographical reach and lower tier city penetration make it less vulnerable to online threats, we would not rule out potential market share dilution if migration to the online channel for these non-food sub-segments is faster than expected.
M O R G A N S T A N L E Y R E S E A R C H
143
January 6, 2013 eCommerce Disruption: A Global Theme – Transforming Traditional Retail
eCommerce Disruption: A Global Theme
Morgan Stanley eCommerce Model
M O R G A N S T A N L E Y B L U E P A P E R
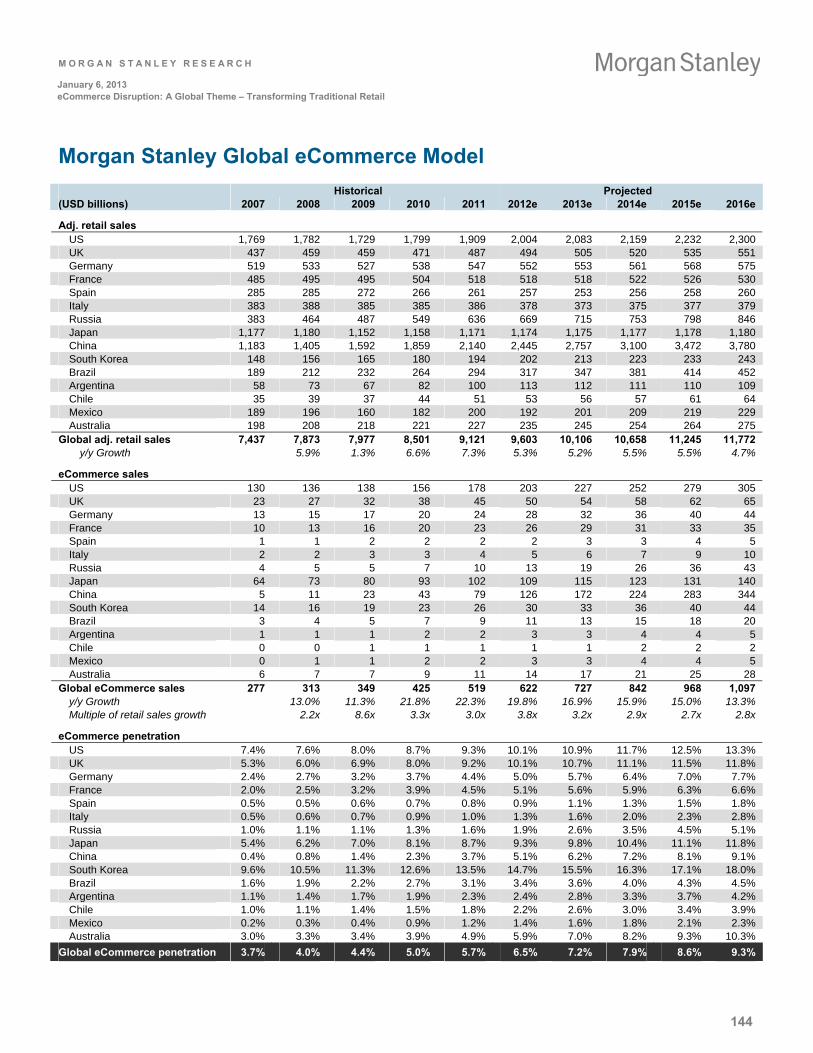
M O R G A N S T A N L E Y R E S E A R C H
144
January 6, 2013 eCommerce Disruption: A Global Theme – Transforming Traditional Retail
Morgan Stanley Global eCommerce Model
Historical Projected (USD billions) 2007 2008 2009 2010 2011 2012e 2013e 2014e 2015e 2016e
Adj. retail sales
US 1,769 1,782 1,729 1,799 1,909 2,004 2,083 2,159 2,232 2,300 UK 437 459 459 471 487 494 505 520 535 551 Germany 519 533 527 538 547 552 553 561 568 575 France 485 495 495 504 518 518 518 522 526 530 Spain 285 285 272 266 261 257 253 256 258 260 Italy 383 388 385 385 386 378 373 375 377 379 Russia 383 464 487 549 636 669 715 753 798 846 Japan 1,177 1,180 1,152 1,158 1,171 1,174 1,175 1,177 1,178 1,180 China 1,183 1,405 1,592 1,859 2,140 2,445 2,757 3,100 3,472 3,780 South Korea 148 156 165 180 194 202 213 223 233 243 Brazil 189 212 232 264 294 317 347 381 414 452 Argentina 58 73 67 82 100 113 112 111 110 109 Chile 35 39 37 44 51 53 56 57 61 64 Mexico 189 196 160 182 200 192 201 209 219 229 Australia 198 208 218 221 227 235 245 254 264 275
Global adj. retail sales 7,437 7,873 7,977 8,501 9,121 9,603 10,106 10,658 11,245 11,772 y/y Growth 5.9% 1.3% 6.6% 7.3% 5.3% 5.2% 5.5% 5.5% 4.7%
eCommerce sales
US 130 136 138 156 178 203 227 252 279 305 UK 23 27 32 38 45 50 54 58 62 65 Germany 13 15 17 20 24 28 32 36 40 44 France 10 13 16 20 23 26 29 31 33 35 Spain 1 1 2 2 2 2 3 3 4 5 Italy 2 2 3 3 4 5 6 7 9 10 Russia 4 5 5 7 10 13 19 26 36 43 Japan 64 73 80 93 102 109 115 123 131 140 China 5 11 23 43 79 126 172 224 283 344 South Korea 14 16 19 23 26 30 33 36 40 44 Brazil 3 4 5 7 9 11 13 15 18 20 Argentina 1 1 1 2 2 3 3 4 4 5 Chile 0 0 1 1 1 1 1 2 2 2 Mexico 0 1 1 2 2 3 3 4 4 5 Australia 6 7 7 9 11 14 17 21 25 28
Global eCommerce sales 277 313 349 425 519 622 727 842 968 1,097 y/y Growth 13.0% 11.3% 21.8% 22.3% 19.8% 16.9% 15.9% 15.0% 13.3% Multiple of retail sales growth 2.2x 8.6x 3.3x 3.0x 3.8x 3.2x 2.9x 2.7x 2.8x
eCommerce penetration
US 7.4% 7.6% 8.0% 8.7% 9.3% 10.1% 10.9% 11.7% 12.5% 13.3% UK 5.3% 6.0% 6.9% 8.0% 9.2% 10.1% 10.7% 11.1% 11.5% 11.8% Germany 2.4% 2.7% 3.2% 3.7% 4.4% 5.0% 5.7% 6.4% 7.0% 7.7% France 2.0% 2.5% 3.2% 3.9% 4.5% 5.1% 5.6% 5.9% 6.3% 6.6% Spain 0.5% 0.5% 0.6% 0.7% 0.8% 0.9% 1.1% 1.3% 1.5% 1.8% Italy 0.5% 0.6% 0.7% 0.9% 1.0% 1.3% 1.6% 2.0% 2.3% 2.8% Russia 1.0% 1.1% 1.1% 1.3% 1.6% 1.9% 2.6% 3.5% 4.5% 5.1% Japan 5.4% 6.2% 7.0% 8.1% 8.7% 9.3% 9.8% 10.4% 11.1% 11.8% China 0.4% 0.8% 1.4% 2.3% 3.7% 5.1% 6.2% 7.2% 8.1% 9.1% South Korea 9.6% 10.5% 11.3% 12.6% 13.5% 14.7% 15.5% 16.3% 17.1% 18.0% Brazil 1.6% 1.9% 2.2% 2.7% 3.1% 3.4% 3.6% 4.0% 4.3% 4.5% Argentina 1.1% 1.4% 1.7% 1.9% 2.3% 2.4% 2.8% 3.3% 3.7% 4.2% Chile 1.0% 1.1% 1.4% 1.5% 1.8% 2.2% 2.6% 3.0% 3.4% 3.9% Mexico 0.2% 0.3% 0.4% 0.9% 1.2% 1.4% 1.6% 1.8% 2.1% 2.3% Australia 3.0% 3.3% 3.4% 3.9% 4.9% 5.9% 7.0% 8.2% 9.3% 10.3%
Global eCommerce penetration 3.7% 4.0% 4.4% 5.0% 5.7% 6.5% 7.2% 7.9% 8.6% 9.3%
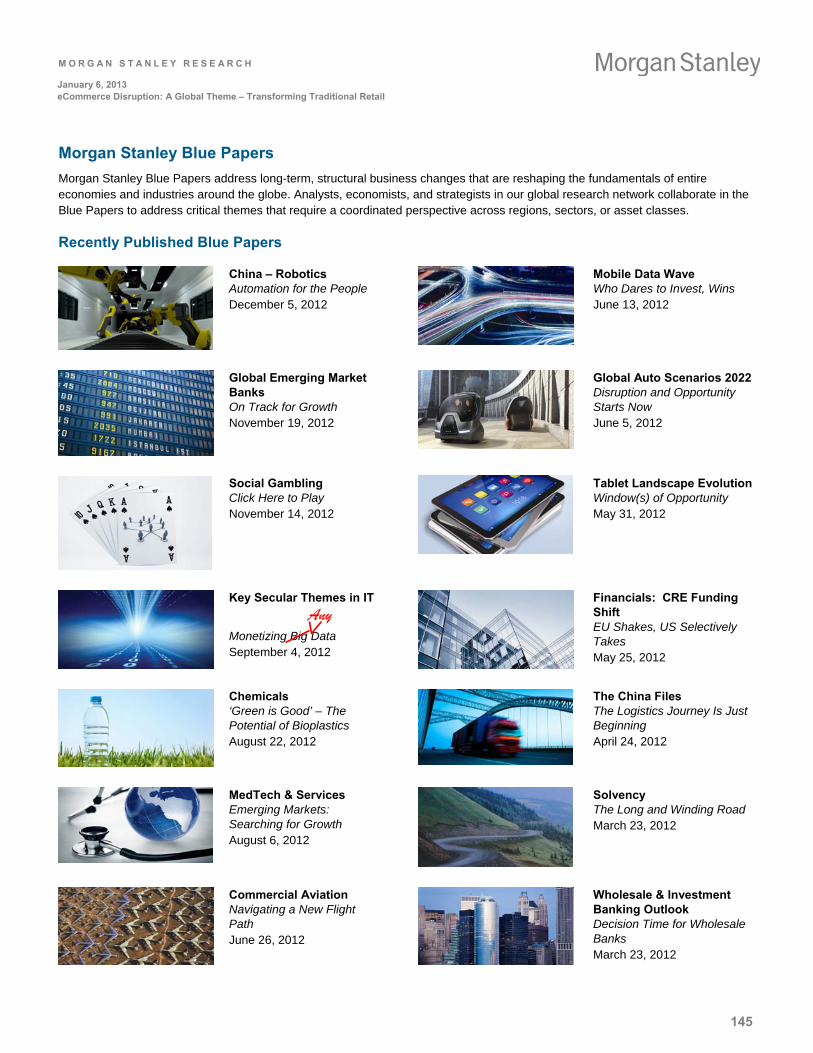
M O R G A N S T A N L E Y R E S E A R C H
145
January 6, 2013 eCommerce Disruption: A Global Theme – Transforming Traditional Retail
Morgan Stanley Blue Papers
Morgan Stanley Blue Papers address long-term, structural business changes that are reshaping the fundamentals of entire economies and industries around the globe. Analysts, economists, and strategists in our global research network collaborate in the Blue Papers to address critical themes that require a coordinated perspective across regions, sectors, or asset classes.
Recently Published Blue Papers
China – Robotics Automation for the People December 5, 2012
Mobile Data Wave Who Dares to Invest, Wins June 13, 2012
Global Emerging Market Banks On Track for Growth November 19, 2012
Global Auto Scenarios 2022 Disruption and Opportunity Starts Now June 5, 2012
Social Gambling Click Here to Play November 14, 2012
Tablet Landscape Evolution Window(s) of Opportunity May 31, 2012
Key Secular Themes in IT
Monetizing Big Data September 4, 2012
Financials: CRE Funding Shift EU Shakes, US Selectively Takes May 25, 2012
Chemicals ‘Green is Good’ – The Potential of Bioplastics August 22, 2012
The China Files The Logistics Journey Is Just Beginning April 24, 2012
MedTech & Services Emerging Markets: Searching for Growth August 6, 2012
Solvency The Long and Winding Road March 23, 2012
Commercial Aviation Navigating a New Flight Path June 26, 2012
Wholesale & Investment Banking Outlook Decision Time for Wholesale Banks March 23, 2012
Any
M O R G A N S T A N L E Y R E S E A R C H
146
January 6, 2013 eCommerce Disruption: A Global Theme – Transforming Traditional Retail
Banks Deleveraging and Real Estate Implication of a €400-700bn Financing Gap March 15, 2012
The China Files China’s Appetite for Protein Turns Global October 25, 2011
The US Healthcare Formula Cost Control and True Innovation June 16, 2011
The China Files Chinese Economy through 2020 November 8, 2010
Cloud Computing Takes Off Market Set to Boom as Migration Accelerates May 23, 2011
The China Files Asian Corporates & China’s Megatransition November 8, 2010
China High-Speed Rail On the Economic Fast Track May 15, 2011
The China Files European Corporates & China’s Megatransition October 29, 2010
Asian Inflation Consumers Adjust As Inflation Worsens March 31, 2011
Petrochemicals Preparing for a Supercycle October 18, 2010
Wholesale & Investment Banking Reshaping the Model March 23, 2011
Solvency 2 Quantitative & Strategic Impact, The Tide is Going Out September 22, 2010
Global Gas A Decade of Two Halves March 14, 2011
The China Files US Corporates and China’s Megatransition September 20, 2010
Tablet Demand and Disruption Mobile Users Come of Age February 14, 2011
Brazil Infrastructure Paving the Way May 5, 2010
M O R G A N S T A N L E Y R E S E A R C H
147
January 6, 2013 eCommerce Disruption: A Global Theme – Transforming Traditional Retail
Morgan Stanley is currently acting as financial advisor to Google Inc. ("Google") with respect to its proposed stock dividend, as announced on April 12, 2012. Certain aspects of the proposal are subject to approval by Google's shareholders. Google has agreed to pay fees to Morgan Stanley for its financial advice. Please refer to the notes at the end of the report.
Morgan Stanley is acting as financial advisor to United Parcel Service Inc. ("UPS") in connection with their proposed all-cash public offer for TNT Express N.V. ("TNT"), as announced on March 19, 2012.
The proposed offer is subject to a minimum acceptance of 80% of the TNT ordinary shares on a fully diluted basis, required regulatory approvals, and other closing conditions. This report and the information provided herein is not intended to (i) provide advice with respect to the offer, (ii) serve as an endorsement of the offer, or (iii) result in the procurement, withholding or revocation of a tender in the offer, or any other action by a security holder.
UPS has agreed to pay fees to Morgan Stanley for its financial services, including transaction fees and financing fees that are subject to the consummation of the proposed transaction. Please refer to the notes at the end of this report.
Morgan Stanley & Co. Limited (“Morgan Stanley”) is acting as financial advisor to Yandex N.V. ("Yandex"), in relation to the proposed formation of a JV between Yandex.Money and Sberbank of Russia, as announced on 19th Dec 2012. Yandex has agreed to pay fees to Morgan Stanley for its financial services. Please refer to the notes at the end of the report.
M O R G A N S T A N L E Y R E S E A R C H
148
January 6, 2013 eCommerce Disruption: A Global Theme – Transforming Traditional Retail
Disclosure Section The information and opinions in Morgan Stanley Research were prepared by Morgan Stanley & Co. LLC, and/or Morgan Stanley C.T.V.M. S.A., and/or Morgan Stanley Mexico, Casa de Bolsa, S.A. de C.V. As used in this disclosure section, "Morgan Stanley" includes Morgan Stanley & Co. LLC, Morgan Stanley C.T.V.M. S.A., Morgan Stanley Mexico, Casa de Bolsa, S.A. de C.V. and their affiliates as necessary. For important disclosures, stock price charts and equity rating histories regarding companies that are the subject of this report, please see the Morgan Stanley Research Disclosure Website at www.morganstanley.com/researchdisclosures, or contact your investment representative or Morgan Stanley Research at 1585 Broadway, (Attention: Research Management), New York, NY, 10036 USA. For valuation methodology and risks associated with any price targets referenced in this research report, please email [email protected] with a request for valuation methodology and risks on a particular stock or contact your investment representative or Morgan Stanley Research at 1585 Broadway, (Attention: Research Management), New York, NY 10036 USA.
Analyst Certification The following analysts hereby certify that their views about the companies and their securities discussed in this report are accurately expressed and that they have not received and will not receive direct or indirect compensation in exchange for expressing specific recommendations or views in this report: Nicholas Ashworth, Edouard Aubin, Timothy Chan, Scott Devitt, David Gober, Kimberly Greenberger, Edward Hill-Wood, Richard Ji, Thomas Kierath, Robert Lin, Angela Moh, Joseph Parkhill, Geoff Ruddell, Andrew Ruud, Lore Serra, Anisha Singhal, Louise Singlehurst, Tetsuro Tsusaka, Philip Wan, Mark Wiltamuth. Unless otherwise stated, the individuals listed on the cover page of this report are research analysts.
Global Research Conflict Management Policy Morgan Stanley Research has been published in accordance with our conflict management policy, which is available at www.morganstanley.com/institutional/research/conflictpolicies.
Important US Regulatory Disclosures on Subject Companies The following analyst or strategist (or a household member) owns securities (or related derivatives) in a company that he or she covers or recommends in Morgan Stanley Research: Lore Serra - Wal-Mart Stores, Inc.(common or preferred stock). Morgan Stanley policy prohibits research analysts, strategists and research associates from investing in securities in their industry as defined by the Global Industry Classification Standard ("GICS," which was developed by and is the exclusive property of MSCI and S&P). Analysts may nevertheless own such securities to the extent acquired under a prior policy or in a merger, fund distribution or other involuntary acquisition. As of November 30, 2012, Morgan Stanley beneficially owned 1% or more of a class of common equity securities of the following companies covered in Morgan Stanley Research: Advance Auto Parts, Amazon.com, Blue Nile Inc, Mercadolibre Inc., Metcash, Office Depot Inc., Qihoo 360 Technology Co Ltd, RadioShack Corporation, Sina Corporation, VF Corp, Yandex NV. Within the last 12 months, Morgan Stanley managed or co-managed a public offering (or 144A offering) of securities of Amazon.com, eBay, Liberty Interactive Group, Office Depot Inc.. Within the last 12 months, Morgan Stanley has received compensation for investment banking services from Amazon.com, eBay, Liberty Interactive Group, Nordstrom, Office Depot Inc., Tencent Holdings Ltd., The Home Depot, Inc., VF Corp, Wal-Mart Stores, Inc., Yandex NV. In the next 3 months, Morgan Stanley expects to receive or intends to seek compensation for investment banking services from Advance Auto Parts, Amazon.com, ANTA Sports Products, ASOS PLC, AutoZone Inc., Bed Bath & Beyond Inc., Belle International, Blue Nile Inc, Costco Wholesale Corp., eBay, Genuine Parts Co., Intime Department Store (Group), JB Hi-Fi, Liberty Interactive Group, Lowe's Companies, Inc., Macy's Inc., Mercadolibre Inc., Nike Inc., Nordstrom, O'Reilly Automotive Inc., Office Depot Inc., Qihoo 360 Technology Co Ltd, Rakuten, Ralph Lauren Corp, Sina Corporation, Staples, Inc., Sun Art Retail Group Limited, Tencent Holdings Ltd., The Home Depot, Inc., VF Corp, Wal-Mart Stores, Inc., Wesfarmers, Woolworths, Yahoo Japan, Yandex NV. Within the last 12 months, Morgan Stanley has received compensation for products and services other than investment banking services from Advance Auto Parts, Amazon.com, ANTA Sports Products, AutoZone Inc., Belle International, eBay, Finish Line Inc, Intime Department Store (Group), Liberty Interactive Group, Lowe's Companies, Inc., Macy's Inc., Nike Inc., Nordstrom, O'Reilly Automotive Inc., Office Depot Inc., PVH Corp., Rakuten, Sina Corporation, Staples, Inc., Tencent Holdings Ltd., The Home Depot, Inc., VF Corp, Wal-Mart Stores, Inc.. Within the last 12 months, Morgan Stanley has provided or is providing investment banking services to, or has an investment banking client relationship with, the following company: Advance Auto Parts, Amazon.com, ANTA Sports Products, ASOS PLC, AutoZone Inc., Bed Bath & Beyond Inc., Belle International, Blue Nile Inc, Costco Wholesale Corp., eBay, Genuine Parts Co., Intime Department Store (Group), JB Hi-Fi, Liberty Interactive Group, Lowe's Companies, Inc., Macy's Inc., Mercadolibre Inc., Nike Inc., Nordstrom, O'Reilly Automotive Inc., Office Depot Inc., Qihoo 360 Technology Co Ltd, Rakuten, Ralph Lauren Corp, Sina Corporation, Staples, Inc., Sun Art Retail Group Limited, Tencent Holdings Ltd., The Home Depot, Inc., VF Corp, Wal-Mart Stores, Inc., Wesfarmers, Woolworths, Yahoo Japan, Yandex NV. Within the last 12 months, Morgan Stanley has either provided or is providing non-investment banking, securities-related services to and/or in the past has entered into an agreement to provide services or has a client relationship with the following company: Advance Auto Parts, Amazon.com, ANTA Sports Products, AutoZone Inc., Belle International, eBay, Finish Line Inc, Intime Department Store (Group), Liberty Interactive Group, Lowe's Companies, Inc., Macy's Inc., Nike Inc., Nordstrom, O'Reilly Automotive Inc., Office Depot Inc., PVH Corp., Rakuten, Sina Corporation, Staples, Inc., Tencent Holdings Ltd., The Home Depot, Inc., VF Corp, Wal-Mart Stores, Inc.. Within the last 12 months, Morgan Stanley has either provided or is providing non-securities related services to and/or in the past has entered into an agreement to provide services or has a client relationship with the following company: VF Corp. An employee, director or consultant of Morgan Stanley is a director of Belle International, Macy's Inc.. This person is not a research analyst or a member of a research analyst's household. Morgan Stanley & Co. LLC makes a market in the securities of Advance Auto Parts, Amazon.com, AutoZone Inc., Bed Bath & Beyond Inc., Blue Nile Inc, Costco Wholesale Corp., Dick's Sporting Goods, eBay, Finish Line Inc, Foot Locker Inc, Genuine Parts Co., Liberty Interactive Group, Lowe's Companies, Inc., Macy's Inc., Mercadolibre Inc., Nike Inc., Nordstrom, O'Reilly Automotive Inc., Office Depot Inc., PetSmart, Inc., PVH Corp., Qihoo 360 Technology Co Ltd, RadioShack Corporation, Ralph Lauren Corp, Sina Corporation, Staples, Inc., Target Corp., Tencent Holdings Ltd., The Home Depot, Inc., Under Armour Inc., Urban Outfitters Inc., VF Corp, Wal-Mart Stores, Inc., Williams-Sonoma Inc., Yandex NV. The equity research analysts or strategists principally responsible for the preparation of Morgan Stanley Research have received compensation based upon various factors, including quality of research, investor client feedback, stock picking, competitive factors, firm revenues and overall investment banking revenues. Morgan Stanley and its affiliates do business that relates to companies/instruments covered in Morgan Stanley Research, including market making, providing liquidity and specialized trading, risk arbitrage and other proprietary trading, fund management, commercial banking, extension of credit, investment services and investment banking. Morgan Stanley sells to and buys from customers the securities/instruments of companies covered in Morgan Stanley Research on a principal basis. Morgan Stanley may have a position in the debt of the Company or instruments discussed in this report. Certain disclosures listed above are also for compliance with applicable regulations in non-US jurisdictions.
STOCK RATINGS Morgan Stanley uses a relative rating system using terms such as Overweight, Equal-weight, Not-Rated or Underweight (see definitions below). Morgan Stanley does not assign ratings of Buy, Hold or Sell to the stocks we cover. Overweight, Equal-weight, Not-Rated and Underweight are not the equivalent of buy, hold and sell. Investors should carefully read the definitions of all ratings used in Morgan Stanley Research. In addition, since Morgan Stanley Research contains more complete information concerning the analyst's views, investors should carefully read Morgan Stanley Research, in its entirety, and not infer the contents from the rating alone. In any case, ratings (or research) should not be used or relied upon as
M O R G A N S T A N L E Y R E S E A R C H
149
January 6, 2013 eCommerce Disruption: A Global Theme – Transforming Traditional Retail
investment advice. An investor's decision to buy or sell a stock should depend on individual circumstances (such as the investor's existing holdings) and other considerations.
Global Stock Ratings Distribution (as of December 31, 2012)
For disclosure purposes only (in accordance with NASD and NYSE requirements), we include the category headings of Buy, Hold, and Sell alongside our ratings of Overweight, Equal-weight, Not-Rated and Underweight. Morgan Stanley does not assign ratings of Buy, Hold or Sell to the stocks we cover. Overweight, Equal-weight, Not-Rated and Underweight are not the equivalent of buy, hold, and sell but represent recommended relative weightings (see definitions below). To satisfy regulatory requirements, we correspond Overweight, our most positive stock rating, with a buy recommendation; we correspond Equal-weight and Not-Rated to hold and Underweight to sell recommendations, respectively. Coverage Universe Investment Banking Clients (IBC)
Stock Rating Category Count % of Total Count
% of Total IBC
% of Rating Category
Overweight/Buy 1103 37% 436 41% 40%Equal-weight/Hold 1301 44% 497 46% 38%Not-Rated/Hold 108 4% 27 3% 25%Underweight/Sell 478 16% 111 10% 23%Total 2,990 1071 Data include common stock and ADRs currently assigned ratings. An investor's decision to buy or sell a stock should depend on individual circumstances (such as the investor's existing holdings) and other considerations. Investment Banking Clients are companies from whom Morgan Stanley received investment banking compensation in the last 12 months.
Analyst Stock Ratings Overweight (O). The stock's total return is expected to exceed the average total return of the analyst's industry (or industry team's) coverage universe, on a risk-adjusted basis, over the next 12-18 months. Equal-weight (E). The stock's total return is expected to be in line with the average total return of the analyst's industry (or industry team's) coverage universe, on a risk-adjusted basis, over the next 12-18 months. Not-Rated (NR). Currently the analyst does not have adequate conviction about the stock's total return relative to the average total return of the analyst's industry (or industry team's) coverage universe, on a risk-adjusted basis, over the next 12-18 months. Underweight (U). The stock's total return is expected to be below the average total return of the analyst's industry (or industry team's) coverage universe, on a risk-adjusted basis, over the next 12-18 months. Unless otherwise specified, the time frame for price targets included in Morgan Stanley Research is 12 to 18 months. For Australian Property stocks, each stock's total return is benchmarked against the average total return of the analyst's industry (or industry team's) coverage universe, instead of the relevant country MSCI Index, on a risk-adjusted basis, over the next 12-18 months.
Analyst Industry Views Attractive (A): The analyst expects the performance of his or her industry coverage universe over the next 12-18 months to be attractive vs. the relevant broad market benchmark, as indicated below. In-Line (I): The analyst expects the performance of his or her industry coverage universe over the next 12-18 months to be in line with the relevant broad market benchmark, as indicated below. Cautious (C): The analyst views the performance of his or her industry coverage universe over the next 12-18 months with caution vs. the relevant broad market benchmark, as indicated below. Benchmarks for each region are as follows: North America - S&P 500; Latin America - relevant MSCI country index or MSCI Latin America Index; Europe - MSCI Europe; Japan - TOPIX; Asia - relevant MSCI country index. .
Important Disclosures for Morgan Stanley Smith Barney LLC Customers Citi Research publications may be available about the companies or topics that are the subject of Morgan Stanley Research. Ask your Financial Advisor or use Research Center to view any available Citi Research publications in addition to Morgan Stanley research reports. Important disclosures regarding the relationship between the companies that are the subject of Morgan Stanley Research and Morgan Stanley Smith Barney LLC, Morgan Stanley and Citigroup Global Markets Inc. or any of their affiliates, are available on the Morgan Stanley Smith Barney disclosure website at www.morganstanleysmithbarney.com/researchdisclosures. For Morgan Stanley and Citigroup Global Markets, Inc. specific disclosures, you may refer to www.morganstanley.com/researchdisclosures and https://www.citigroupgeo.com/geopublic/Disclosures/index_a.html. Each Morgan Stanley Equity Research report is reviewed and approved on behalf of Morgan Stanley Smith Barney LLC. This review and approval is conducted by the same person who reviews the Equity Research report on behalf of Morgan Stanley. This could create a conflict of interest.
Other Important Disclosures Morgan Stanley & Co. International PLC and its affiliates have a significant financial interest in the debt securities of Amazon.com, AutoZone Inc., Costco Wholesale Corp., eBay, Intime Department Store (Group), Lowe's Companies, Inc., Macy's Inc., Nike Inc., Nordstrom, Office Depot Inc., PVH Corp., RadioShack Corporation, Staples, Inc., Target Corp., Tencent Holdings Ltd., The Home Depot, Inc., VF Corp, Wal-Mart Stores, Inc., Wesfarmers, Woolworths. Morgan Stanley is not acting as a municipal advisor and the opinions or views contained herein are not intended to be, and do not constitute, advice within the meaning of Section 975 of the Dodd-Frank Wall Street Reform and Consumer Protection Act. Morgan Stanley produces an equity research product called a "Tactical Idea." Views contained in a "Tactical Idea" on a particular stock may be contrary to the recommendations or views expressed in research on the same stock. This may be the result of differing time horizons, methodologies, market events, or other factors. For all research available on a particular stock, please contact your sales representative or go to Client Link at www.morganstanley.com. Morgan Stanley Research does not provide individually tailored investment advice. Morgan Stanley Research has been prepared without regard to the circumstances and objectives of those who receive it. Morgan Stanley recommends that investors independently evaluate particular investments and strategies, and encourages investors to seek the advice of a financial adviser. The appropriateness of an investment or strategy will depend on an investor's circumstances and objectives. The securities, instruments, or strategies discussed in Morgan Stanley Research may not be suitable for all investors, and certain investors may not be eligible to purchase or participate in some or all of them. Morgan Stanley Research is not an offer to buy or sell any security/instrument or to participate in any trading strategy. The value of and income from your investments may vary because of changes in interest rates, foreign exchange rates, default rates, prepayment rates, securities/instruments prices, market indexes, operational or financial conditions of companies or other factors. There may be time limitations on the exercise of options or other rights in securities/instruments transactions. Past performance is not necessarily a guide to future performance. Estimates of future performance are based on assumptions that may not be realized. If provided, and unless otherwise stated, the closing price on the cover page is that of the primary exchange for the subject company's securities/instruments. The fixed income research analysts, strategists or economists principally responsible for the preparation of Morgan Stanley Research have received compensation based upon various factors, including quality, accuracy and value of research, firm profitability or revenues (which include fixed income trading and capital markets profitability
M O R G A N S T A N L E Y R E S E A R C H
150
January 6, 2013 eCommerce Disruption: A Global Theme – Transforming Traditional Retail
or revenues), client feedback and competitive factors. Fixed Income Research analysts', strategists' or economists' compensation is not linked to investment banking or capital markets transactions performed by Morgan Stanley or the profitability or revenues of particular trading desks. Morgan Stanley Research is not an offer to buy or sell or the solicitation of an offer to buy or sell any security/instrument or to participate in any particular trading strategy. The "Important US Regulatory Disclosures on Subject Companies" section in Morgan Stanley Research lists all companies mentioned where Morgan Stanley owns 1% or more of a class of common equity securities of the companies. For all other companies mentioned in Morgan Stanley Research, Morgan Stanley may have an investment of less than 1% in securities/instruments or derivatives of securities/instruments of companies and may trade them in ways different from those discussed in Morgan Stanley Research. Employees of Morgan Stanley not involved in the preparation of Morgan Stanley Research may have investments in securities/instruments or derivatives of securities/instruments of companies mentioned and may trade them in ways different from those discussed in Morgan Stanley Research. Derivatives may be issued by Morgan Stanley or associated persons. With the exception of information regarding Morgan Stanley, Morgan Stanley Research is based on public information. Morgan Stanley makes every effort to use reliable, comprehensive information, but we make no representation that it is accurate or complete. We have no obligation to tell you when opinions or information in Morgan Stanley Research change apart from when we intend to discontinue equity research coverage of a subject company. Facts and views presented in Morgan Stanley Research have not been reviewed by, and may not reflect information known to, professionals in other Morgan Stanley business areas, including investment banking personnel. Morgan Stanley Research personnel may participate in company events such as site visits and are generally prohibited from accepting payment by the company of associated expenses unless pre-approved by authorized members of Research management. Morgan Stanley may make investment decisions or take proprietary positions that are inconsistent with the recommendations or views in this report. To our readers in Taiwan: Information on securities/instruments that trade in Taiwan is distributed by Morgan Stanley Taiwan Limited ("MSTL"). Such information is for your reference only. Information on any securities/instruments issued by a company owned by the government of or incorporated in the PRC and listed in on the Stock Exchange of Hong Kong ("SEHK"), namely the H-shares, including the component company stocks of the Stock Exchange of Hong Kong ("SEHK")'s Hang Seng China Enterprise Index is distributed only to Taiwan Securities Investment Trust Enterprises ("SITE"). The reader should independently evaluate the investment risks and is solely responsible for their investment decisions. Morgan Stanley Research may not be distributed to the public media or quoted or used by the public media without the express written consent of Morgan Stanley. To our readers in Hong Kong: Information is distributed in Hong Kong by and on behalf of, and is attributable to, Morgan Stanley Asia Limited as part of its regulated activities in Hong Kong. If you have any queries concerning Morgan Stanley Research, please contact our Hong Kong sales representatives. Information on securities/instruments that do not trade in Taiwan is for informational purposes only and is not to be construed as a recommendation or a solicitation to trade in such securities/instruments. MSTL may not execute transactions for clients in these securities/instruments. Morgan Stanley is not incorporated under PRC law and the research in relation to this report is conducted outside the PRC. Morgan Stanley Research does not constitute an offer to sell or the solicitation of an offer to buy any securities in the PRC. PRC investors shall have the relevant qualifications to invest in such securities and shall be responsible for obtaining all relevant approvals, licenses, verifications and/or registrations from the relevant governmental authorities themselves. Morgan Stanley Research is disseminated in Brazil by Morgan Stanley C.T.V.M. S.A.; in Japan by Morgan Stanley MUFG Securities Co., Ltd. and, for Commodities related research reports only, Morgan Stanley Capital Group Japan Co., Ltd; in Hong Kong by Morgan Stanley Asia Limited (which accepts responsibility for its contents); in Singapore by Morgan Stanley Asia (Singapore) Pte. (Registration number 199206298Z) and/or Morgan Stanley Asia (Singapore) Securities Pte Ltd (Registration number 200008434H), regulated by the Monetary Authority of Singapore (which accepts legal responsibility for its contents and should be contacted with respect to any matters arising from, or in connection with, Morgan Stanley Research); in Australia to "wholesale clients" within the meaning of the Australian Corporations Act by Morgan Stanley Australia Limited A.B.N. 67 003 734 576, holder of Australian financial services license No. 233742, which accepts responsibility for its contents; in Australia to "wholesale clients" and "retail clients" within the meaning of the Australian Corporations Act by Morgan Stanley Smith Barney Australia Pty Ltd (A.B.N. 19 009 145 555, holder of Australian financial services license No. 240813, which accepts responsibility for its contents; in Korea by Morgan Stanley & Co International plc, Seoul Branch; in India by Morgan Stanley India Company Private Limited; in Indonesia by PT Morgan Stanley Asia Indonesia; in Canada by Morgan Stanley Canada Limited, which has approved of and takes responsibility for its contents in Canada; in Germany by Morgan Stanley Bank AG, Frankfurt am Main and Morgan Stanley Private Wealth Management Limited, Niederlassung Deutschland, regulated by Bundesanstalt fuer Finanzdienstleistungsaufsicht (BaFin); in Spain by Morgan Stanley, S.V., S.A., a Morgan Stanley group company, which is supervised by the Spanish Securities Markets Commission (CNMV) and states that Morgan Stanley Research has been written and distributed in accordance with the rules of conduct applicable to financial research as established under Spanish regulations; in the US by Morgan Stanley & Co. LLC, which accepts responsibility for its contents. Morgan Stanley & Co. International plc, authorized and regulated by the Financial Services Authority, disseminates in the UK research that it has prepared, and approves solely for the purposes of section 21 of the Financial Services and Markets Act 2000, research which has been prepared by any of its affiliates. Morgan Stanley Private Wealth Management Limited, authorized and regulated by the Financial Services Authority, also disseminates Morgan Stanley Research in the UK. Private UK investors should obtain the advice of their Morgan Stanley & Co. International plc or Morgan Stanley Private Wealth Management representative about the investments concerned. RMB Morgan Stanley (Proprietary) Limited is a member of the JSE Limited and regulated by the Financial Services Board in South Africa. RMB Morgan Stanley (Proprietary) Limited is a joint venture owned equally by Morgan Stanley International Holdings Inc. and RMB Investment Advisory (Proprietary) Limited, which is wholly owned by FirstRand Limited. The information in Morgan Stanley Research is being communicated by Morgan Stanley & Co. International plc (DIFC Branch), regulated by the Dubai Financial Services Authority (the DFSA), and is directed at Professional Clients only, as defined by the DFSA. The financial products or financial services to which this research relates will only be made available to a customer who we are satisfied meets the regulatory criteria to be a Professional Client. The information in Morgan Stanley Research is being communicated by Morgan Stanley & Co. International plc (QFC Branch), regulated by the Qatar Financial Centre Regulatory Authority (the QFCRA), and is directed at business customers and market counterparties only and is not intended for Retail Customers as defined by the QFCRA. As required by the Capital Markets Board of Turkey, investment information, comments and recommendations stated here, are not within the scope of investment advisory activity. Investment advisory service is provided in accordance with a contract of engagement on investment advisory concluded between brokerage houses, portfolio management companies, non-deposit banks and clients. Comments and recommendations stated here rely on the individual opinions of the ones providing these comments and recommendations. These opinions may not fit to your financial status, risk and return preferences. For this reason, to make an investment decision by relying solely to this information stated here may not bring about outcomes that fit your expectations. The trademarks and service marks contained in Morgan Stanley Research are the property of their respective owners. Third-party data providers make no warranties or representations relating to the accuracy, completeness, or timeliness of the data they provide and shall not have liability for any damages relating to such data. The Global Industry Classification Standard (GICS) was developed by and is the exclusive property of MSCI and S&P. Morgan Stanley bases projections, opinions, forecasts and trading strategies regarding the MSCI Country Index Series solely on public information. MSCI has not reviewed, approved or endorsed these projections, opinions, forecasts and trading strategies. Morgan Stanley has no influence on or control over MSCI's index compilation decisions. Morgan Stanley Research or portions of it may not be reprinted, sold or redistributed without the written consent of Morgan Stanley. Morgan Stanley research is disseminated and available primarily electronically, and, in some cases, in printed form. Additional information on recommended securities/instruments is available on request. Morgan Stanley Research, or any portion thereof may not be reprinted, sold or redistributed without the written consent of Morgan Stanley. Morgan Stanley Research is disseminated and available primarily electronically, and, in some cases, in printed form.
Additional information on recommended securities/instruments is available on request.
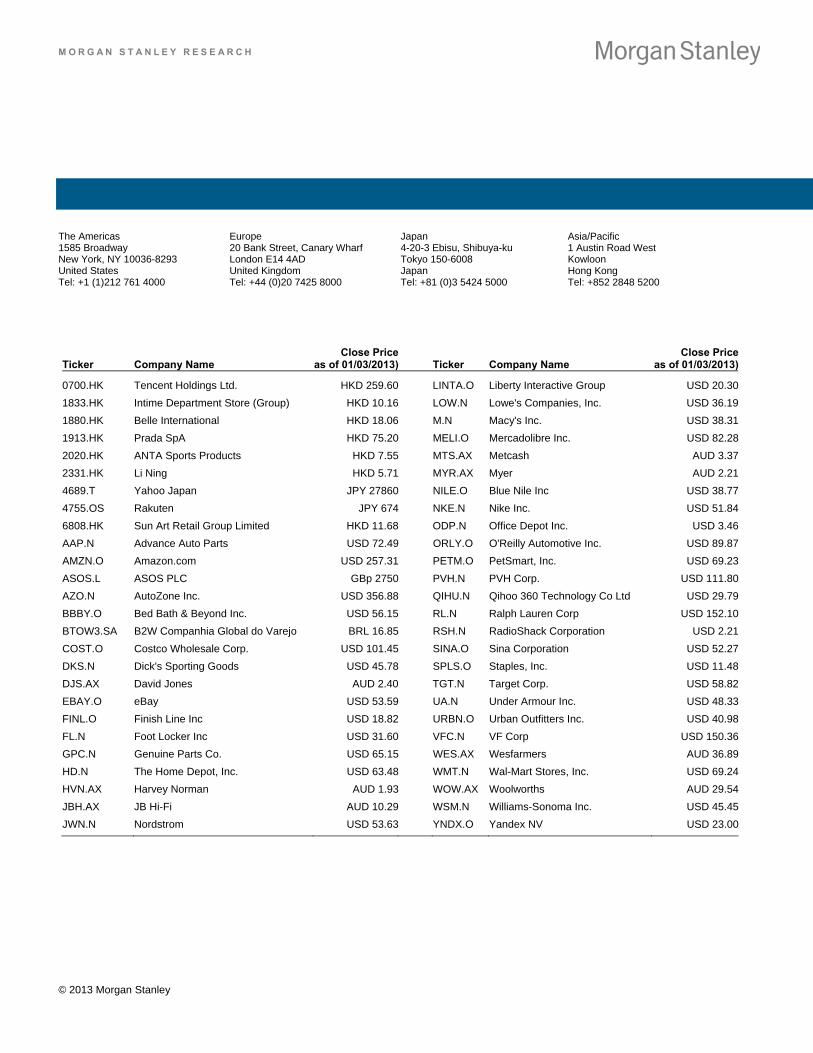
M O R G A N S T A N L E Y R E S E A R C H
The Americas 1585 Broadway New York, NY 10036-8293 United States Tel: +1 (1)212 761 4000
Europe 20 Bank Street, Canary Wharf London E14 4AD United Kingdom Tel: +44 (0)20 7425 8000
Japan 4-20-3 Ebisu, Shibuya-ku Tokyo 150-6008 Japan Tel: +81 (0)3 5424 5000
Asia/Pacific 1 Austin Road West Kowloon Hong Kong Tel: +852 2848 5200
© 2013 Morgan Stanley
M O R G A N S T A N L E Y B L U E P A P E R
Ticker Company Name Close Price
as of 01/03/2013) Ticker Company Name Close Price
as of 01/03/2013)
0700.HK Tencent Holdings Ltd. HKD 259.60 LINTA.O Liberty Interactive Group USD 20.30
1833.HK Intime Department Store (Group) HKD 10.16 LOW.N Lowe's Companies, Inc. USD 36.19
1880.HK Belle International HKD 18.06 M.N Macy's Inc. USD 38.31
1913.HK Prada SpA HKD 75.20 MELI.O Mercadolibre Inc. USD 82.28
2020.HK ANTA Sports Products HKD 7.55 MTS.AX Metcash AUD 3.37
2331.HK Li Ning HKD 5.71 MYR.AX Myer AUD 2.21
4689.T Yahoo Japan JPY 27860 NILE.O Blue Nile Inc USD 38.77
4755.OS Rakuten JPY 674 NKE.N Nike Inc. USD 51.84
6808.HK Sun Art Retail Group Limited HKD 11.68 ODP.N Office Depot Inc. USD 3.46
AAP.N Advance Auto Parts USD 72.49 ORLY.O O'Reilly Automotive Inc. USD 89.87
AMZN.O Amazon.com USD 257.31 PETM.O PetSmart, Inc. USD 69.23
ASOS.L ASOS PLC GBp 2750 PVH.N PVH Corp. USD 111.80
AZO.N AutoZone Inc. USD 356.88 QIHU.N Qihoo 360 Technology Co Ltd USD 29.79
BBBY.O Bed Bath & Beyond Inc. USD 56.15 RL.N Ralph Lauren Corp USD 152.10
BTOW3.SA B2W Companhia Global do Varejo BRL 16.85 RSH.N RadioShack Corporation USD 2.21
COST.O Costco Wholesale Corp. USD 101.45 SINA.O Sina Corporation USD 52.27
DKS.N Dick's Sporting Goods USD 45.78 SPLS.O Staples, Inc. USD 11.48
DJS.AX David Jones AUD 2.40 TGT.N Target Corp. USD 58.82
EBAY.O eBay USD 53.59 UA.N Under Armour Inc. USD 48.33
FINL.O Finish Line Inc USD 18.82 URBN.O Urban Outfitters Inc. USD 40.98
FL.N Foot Locker Inc USD 31.60 VFC.N VF Corp USD 150.36
GPC.N Genuine Parts Co. USD 65.15 WES.AX Wesfarmers AUD 36.89
HD.N The Home Depot, Inc. USD 63.48 WMT.N Wal-Mart Stores, Inc. USD 69.24
HVN.AX Harvey Norman AUD 1.93 WOW.AX Woolworths AUD 29.54
JBH.AX JB Hi-Fi AUD 10.29 WSM.N Williams-Sonoma Inc. USD 45.45
JWN.N Nordstrom USD 53.63 YNDX.O Yandex NV USD 23.00
Related Documents