Soi Soi l l Arthropod Arthropod Population Behavior Population Behavior when Monitored in a when Monitored in a High Nitrogen High Nitrogen Environment Environment Aj Valerama, Chie Sato and Emily Kersting

Ecology Arthropod Project FINAL
Jul 31, 2015
Welcome message from author
This document is posted to help you gain knowledge. Please leave a comment to let me know what you think about it! Share it to your friends and learn new things together.
Transcript

SoiSoi ll Arthropod Arthropod Population Behavior Population Behavior when Monitored in a when Monitored in a
High Nitrogen High Nitrogen EnvironmentEnvironment
Aj Valerama, Chie Sato and Emily Kersting

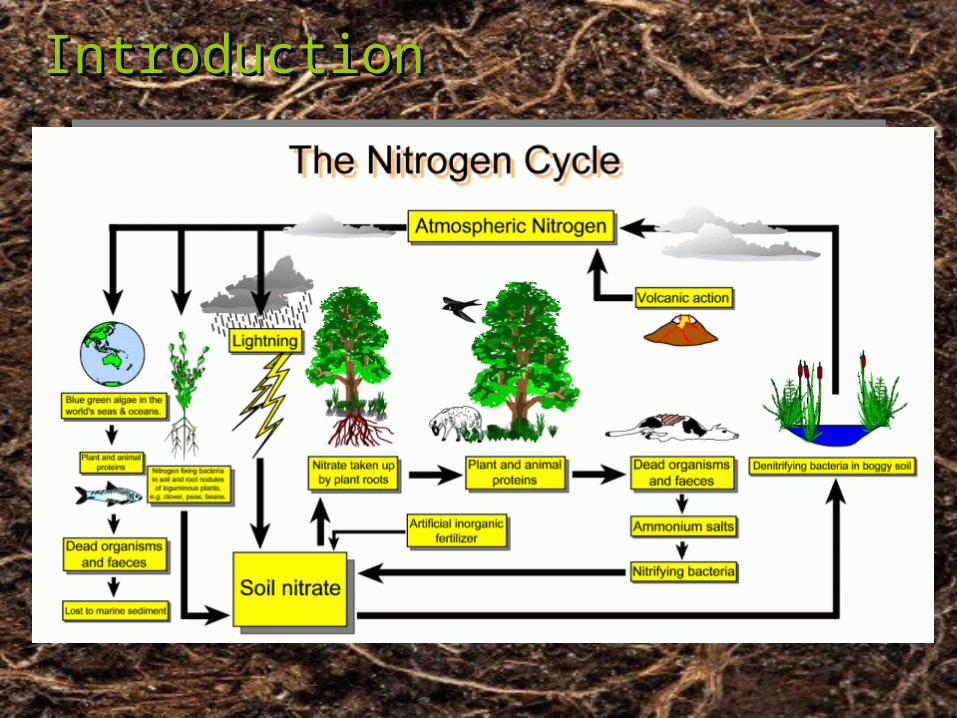
IntroductionIntroduction
Dirt vs. soil

IntroductionIntroductionSOIL NUTRIENTS
IntroductionIntroductionEnter Text Here

IntroductionIntroduction
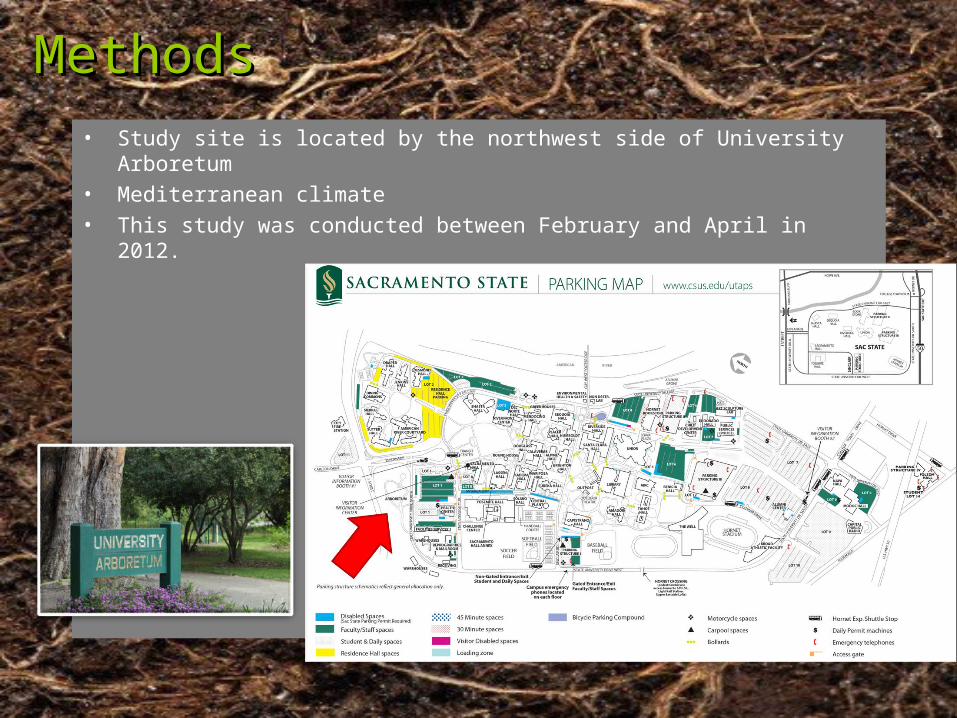
MethodsMethods• Study site is located by the northwest side of University Arboretum• Mediterranean climate• This study was conducted between February and April in 2012.

MethodsMethodsTreatment vs. control• 20 x 10 feet slope
• Treatment site was added ammonium sulfate ;(NH4)2SO4 ,prior to the first sampling.
• Control site was untreated.• A slope is divided into four sections; a top, 1/3 from a top, 2/3 from a top, a
bottom, and our group was
responsible for the 1/3 from a top and
a bottom.

MethodsMethodsVegetation coverage sampling• 2 x 2 feet quadrat • we estimated percentages of vegetation coverage
for each species within a quadrat.• 2 replicas were made from each 1/3 from top and
a bottom of a slope.
Soil sampling • Soil samples were taken at the 1/3 from a top and a bottom of a slope.• 3 replicas were made from each sections.• First sampling was done in end of February and
the second sample was carried out in beginning of April.

MethodsMethodsArthropod species: • Springtail (Collembola)• mite (TetranychidaeI)• ant
Plant species:• soft chess (Bromus hordeaceus)• black medic (Medicago hispida)• grass (Sorghum halepense)

MethodsMethodsTullgren funnel system• Sampled soils were processed in the Tullgren funnel system at a lab for the
extraction of arthropods.• Intense heat from the excess of light on the soils, leads arthropods into a flask
set below a funnel. • For the identification and counting process, we used a microscope.

ResultsResultsMite and Springtail populations were predicted to increase in the presence of
added nitrogen and down the gradient; this was statistically analyzed by a two-way ANOVA. Sample #2 for Mites and #1 for Springtails were statistically insignificant and the null hypotheses were accepted. The following null hypotheses showed significance.

ResultsResultsVariable: Ammonium Sulfate (NH4)2SO4
The chemical equation that converts ammonium to useable nitrite ions is as follows:
NH4+ + 1/2 O2 ↔ NO2
- + 2H+ + H2O (Wright 2004)
Since this reaction is able to go both ways, the chemical equilibrium of the substances takes affect, so that when one reactant is added in excess it shifts to the product side and vice versa. When an excess of ammonium and oxygen are present, the chemical equilibrium then will shift over to the product side producing the beneficial Nitrite ions, Hydrogen ions and Water. The nitrite ion is then changed by bacteria in the following equation:
NO2-+ 1/2 O2 ↔ NO3
- (Wright 2004)
The produced nitrate is then used then for plant growth.

ResultsResultsThe chemical synthesis of the nitrite and nitrate ions inspired a hypothesis. We
predicted that the nitrogen rich plot would contain greater percent moisture than the control plot.
This proved to be accurate however, a greater sample size is needed to draw any solid conclusions from the data.
ResultsResults
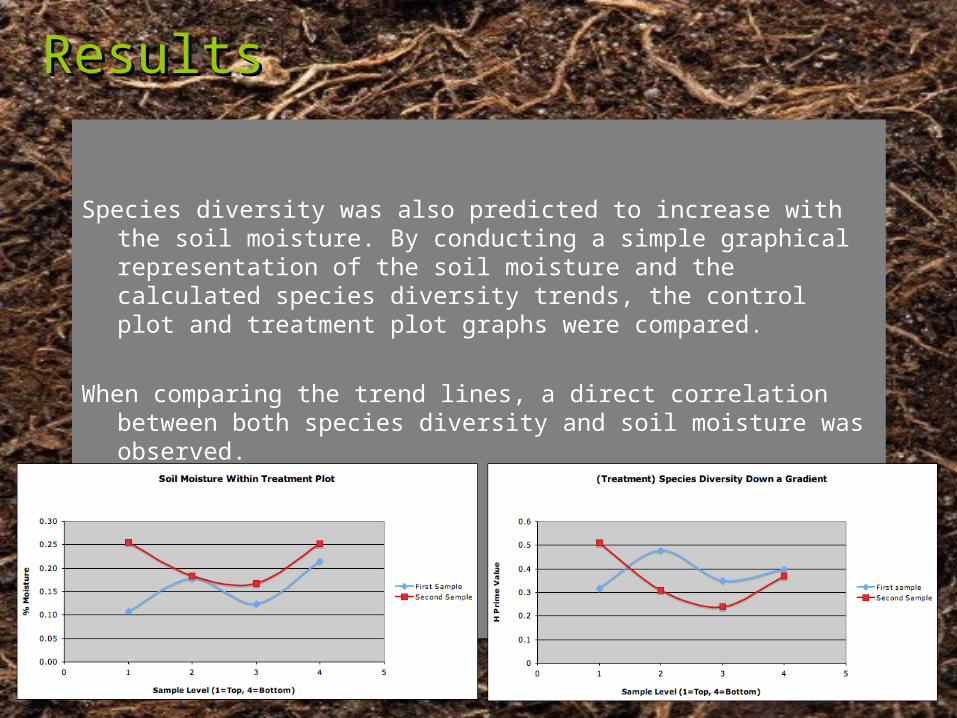
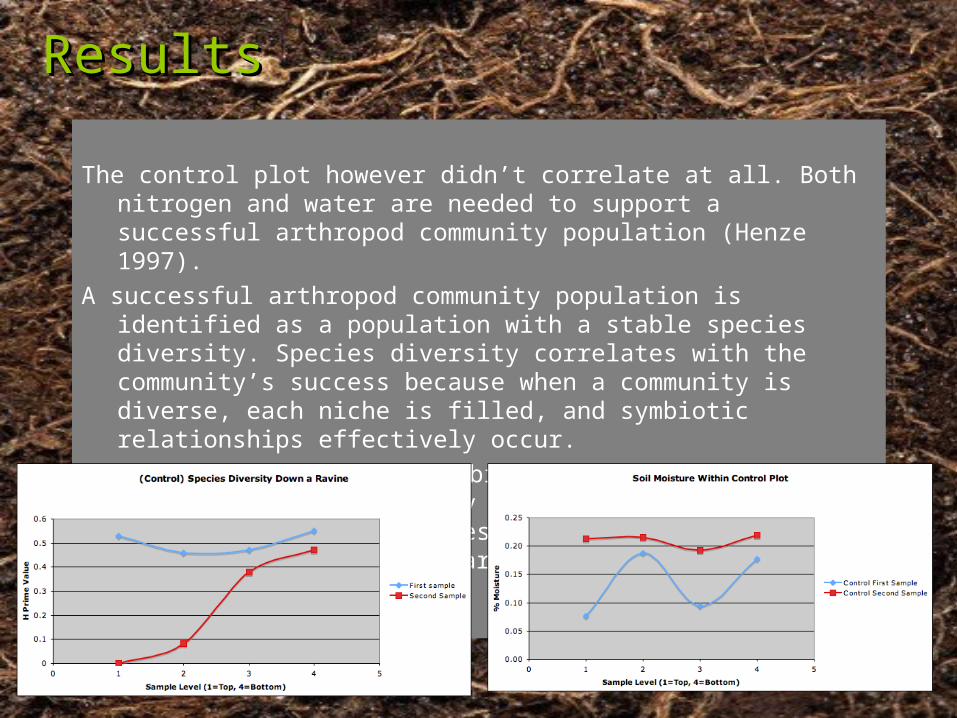
Species diversity was also predicted to increase with the soil moisture. By conducting a simple graphical representation of the soil moisture and the calculated species diversity trends, the control plot and treatment plot graphs were compared.
When comparing the trend lines, a direct correlation between both species diversity and soil moisture was observed.
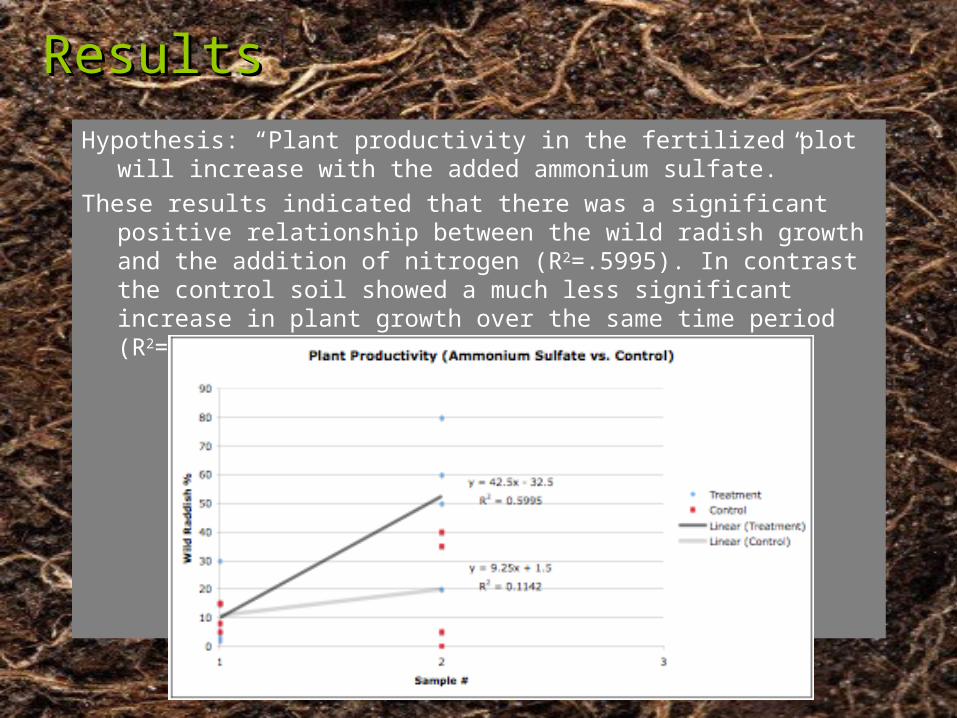
ResultsResultsHypothesis: “Plant productivity in the fertilized plot will increase with the added
ammonium sulfate.” These results indicated that there was a significant positive relationship between
the wild radish growth and the addition of nitrogen (R2=.5995). In contrast the control soil showed a much less significant increase in plant growth over the same time period (R2=.1142).

ResultsResults Control (Right)
Treatment (Bottom)
ResultsResults
The control plot however didn’t correlate at all. Both nitrogen and water are needed to support a successful arthropod community population (Henze 1997).
A successful arthropod community population is identified as a population with a stable species diversity. Species diversity correlates with the community’s success because when a community is diverse, each niche is filled, and symbiotic relationships effectively occur.
Symbiotic relationships stabilize the environment and only occur when diversity is abundant. The control plot lacked stable species diversity because it was lacking in nitrogen compared to the treatment plot.

Possible ErrorPossible Error• Soil moisture didn’t follow an expected trend like it should have. Perhaps
there was more clay content in specific areas of the soil, which prevented the rainfall from draining properly down the gradient. This may have provided some false positive or false negative hypotheses; more samples would need to be taken to solidify the drainage pattern for the treatment plot and the control plot.
• Major source of error was that one half of the experiment was conducted by a group that I had no contact with. This communication wall added much variability to our samples.
– False Arthropod classification– Lack of diligence in correct counting
• The core samples that were taken were also very high in variability. Some samples were very large, while other samples were very small. This would greatly affect the amount of arthropods counted and throw off statistical tests, especially the ANOVA, where replication data was key.

Fixing ErrorFixing Error• There are clear routes for reducing the percent error if this experiment
were to be repeated. – Greatly increasing the amount of samples taken is a necessity for greater
accuracy for the analysis for the data.
– Extracting and counting all the samples in a small communicative group
– Single-handedly extracting data would also increase the accuracy of the results.

Thank you!Thank you!
We would like to mention a special thanks to…
Our dependable slave Dr. Michael Baad and Rockstar Energy Drinks for making this all happen :)

Literature CitedLiterature Cited1. Belser L. 1979. Population Ecology on Nitrifying Bacteria. Annual Review of
Microbiology 33:309-333.
2. Bradford, J. 2004. The Soil Nitrogen Cycle. Anderson Farms Centers. http://www.andersonsfarmcenters.com/PDF/FC_Jeff_Bradford_April06.pdf
3. Henze, Mogens, Paul Harremo ︽ , Jes la Cour Jansen, and Erik Arvin. Wastewater Treatment, Biological and Chemical Processes. Berlin, Germany: Springer, 1997
4. Mihelcic, James R. Fundamentals of Envionromental Engineering. New York: John Wiley & Sons, Inc., 1999.
5. Moiser, A. 2004. Agriculture And The nitrogen Cycle: Assessing the Impacts of Fertilizer Use. Scientific Committee on Problems of the Environment 1:234.
6. Sawyer J. 2008. Surface Waters: Ammonium is not Ammonia. Iowa State University < http://www.extension.iastate.edu/CropNews/2008/0421JohnSawyer.htm>
7. Verhoef, H. 1983. Releaser and primer pheromones in Collembola. Journal of Insect Physiology 30:665-670.
• Wright, S. 2004. Nitrification: the Basics.< http://www.wrights-trainingsite.com/Nitrif1onb.html>
Related Documents