DEMOGRAPHY AND GENETIC DIVERSITY IN TRADESCANTIA OCCIDENTALIS (COMMELINACEAE) A thesis submitted to the College of Graduate Studies and Research in partial fulfillment of the requirements for the degree of Master of Science in the Department of Biology, University of Saskatchewan Saskatoon, Saskatchewan, Canada By Kirsten J. Remarchuk ©Copyright Kirsten J. Remarchuk, June 2006 All rights reserved.

Welcome message from author
This document is posted to help you gain knowledge. Please leave a comment to let me know what you think about it! Share it to your friends and learn new things together.
Transcript

DEMOGRAPHY AND GENETIC DIVERSITY IN TRADESCANTIA OCCIDENTALIS
(COMMELINACEAE)
A thesis submitted to the
College of Graduate Studies and Research
in partial fulfillment of the requirements
for the degree of Master of Science
in the Department of Biology,
University of Saskatchewan
Saskatoon, Saskatchewan, Canada
By
Kirsten J. Remarchuk
©Copyright Kirsten J. Remarchuk, June 2006
All rights reserved.

i
PERMISSION TO USE
In presenting this thesis in partial fulfillment of the requirements for a
Postgraduate degree from the University of Saskatchewan, I agree that the Libraries of
this University may make it freely available for inspection. I further agree that
permission for copying of this thesis in any manner, in whole or in part, for scholarly
purposes may be granted by the professor or professors who supervised my thesis work
or, in their absence, by the Head of the Department or the Dean of the College in which
my thesis work was done. It is understood that any copying, publication, or use of this
thesis or parts thereof for financial gain shall not be allowed without my written
permission. It is also understood that due recognition shall be given to me and to the
University of Saskatchewan in any scholarly use which may be made of any material in
my thesis.
Requests for permission to copy or to make other use of material in this thesis in
whole or in part should be addressed to:
Head of the Department of Biology
University of Saskatchewan
112 Science Place
Saskatoon, Saskatchewan
Canada S7N 5E2

ii
ABSTRACT
Genetic diversity has rarely been the focus of study in species at risk in Canada.
Tradescantia occidentalis is one of 157 species listed by the Committee on the Status of
Endangered Wildlife in Canada (COSEWIC 2005a). This species is nationally
threatened due to the limited number of populations, their geographic isolation from
each other and from the main distribution in the United States of America, and habitat
loss. The National Recovery Team for Plants at Risk in the Prairie Provinces and the
Alberta Western Spiderwort Recovery Team have called for research into the habitat
requirements, demography, and genetic diversity of T. occidentalis in Canada. As a
result, this study was designed to address the following objectives: 1) to conduct an
inventory of the Canadian populations, 2) to investigate intra- and interpopulation
genetic diversity in Tradescantia occidentalis, and 3) to provide recommendations for
the conservation management of this species.
Information on demography and plant communities in Tradescantia occidentalis
habitats indicated that the numbers of individuals in the Saskatchewan and Manitoba
populations were similar to previous surveys; however, the Alberta population was
significantly larger in number than prior estimates, indicating population growth.
Taxonomic lists were prepared for each province in habitats with and without T.
occidentalis. Community types, as separated by RA analysis, differed by province and
not by association with T. occidentalis. Euphorbia esula, an invasive species in Canada,
was observed in the Saskatchewan and Manitoba populations but was absent in Alberta.
Using amplified fragment length polymorphisms (AFLPs), genetic diversity was
assessed at the intra- and interpopulation levels. Relatively low levels of intrapopulation

iii
variation were observed in Saskatchewan and Alberta, while higher levels were found in
Manitoba. Gene flow via pollen or propagule transfer may account for higher genetic
diversity among the closely situated Manitoba populations. The lack of correlation
between dendrogram topology and geographic distribution suggests panmixia in all
populations. Levels of intrapopulation diversity were low to moderate depending on
primer combination used, indicating that populations are isolated within each province.
Information on population demography and genetic diversity are important within
a conservation context. The large number of individuals within each population and the
perceived increase in some populations suggest that the existing populations of
Tradescantia occidentalis are relatively stable. Although levels of genetic diversity are
low in Saskatchewan and Alberta compared to Manitoba, it appears that all populations
are adapted to their local environments based on their apparent size and stability. The
most viable conservation strategy for this species is in situ protection. This should
include controlling invasive plant species, monitoring grazing, and preventing further
habitat fragmentation. Ex situ methods must also be explored. Transplantation of
individuals from one population to the next may not be a successful conservation
strategy due to the moderate level of population differentiation. Alternatively, it is
recommended that a seed bank from each population be implemented in case of a drastic
population decline.

iv
ACKNOWLEDGEMENTS
First and foremost, I wish to thank my supervisor, Dr. J. Hugo Cota-Sánchez for
his patience, support, and for sharing his valuable knowledge and time. I also wish to
thank my supervisory committee: Dr. Arthur Davis and Dr. Vern Harms for the time
they dedicated to progress meetings and manuscript revisions. Thank you as well to my
external examiner, Dr. Diederichsen, for his contribution to my thesis.
A very special thank you to Kumary Ubayasena, Elizabeth Reimer, and Shannon
Croutch of the Cota-Sánchez lab for answering my many questions. Thank you to Drs
Karen Weibe, Dick Neal, John Sheard, and Neil Chilton for their statistical and editorial
advice. Also, thank you to Donna Hay and Peter Eckstein of the Scoles lab for their
assistance with AFLPs and NTSYS.
Thank you to Bob Godwin for sharing his data and expertise on the PFRA pasture.
I also wish to thank Joel Nicholson (Alberta Sustainable Resource Development), Cary
Hamel (Manitoba Conservation Data Centre) and Jason Greenall (Manitoba
Conservation Data Centre) for obtaining permits, landowner contacts, maps, and
locations of Tradescantia occidentalis. Thank you to Ann Gerry, Steven Porter, Kevin
Murphy, Joel Perry, Ross Sigfusson, Chris Nykoluk, and Candace Elchuk for facilitating
research in Saskatchewan.
I would like to acknowledge the various herbaria that sent material for preliminary
studies of Tradescantia occidentalis: ALTA, CAN, DAO, WAT, and WIN. I would
especially like to recognize SASK (Herbarium of the University of Saskatchewan) for
facilitating this study of T. occidentalis.

v
This project was made possible through funding from the Plant Systematics
Laboratory at the University of Saskatchewan and the College of Graduate Studies.
Additional funding was provided by Alberta Sustainable Resource Development for the
population inventory in Alberta.
Last but not least, I must thank my family, Eve, Jason, Travis, and Jesse for
understanding my frustrations and encouraging me every step of the way, and my
significant other, Chris Fomradas for his love and support. I must also thank my father,
Wilf, for my love of nature, my belief in conservation, and for giving me the strength to
keep it all together.

vi
TABLE OF CONTENTS
PERMISSION TO USE ............................................................................................................ i
ABSTRACT.......................................................................................................................... ii
ACKNOWLEDGEMENTS...................................................................................................... iv
TABLE OF CONTENTS ........................................................................................................vi
LIST OF TABLES ................................................................................................................ ix
LIST OF FIGURES ................................................................................................................ x
LIST OF ABBREVIATIONS..................................................................................................xii
1. INTRODUCTION 1 2. LITERATURE REVIEW 3
2.1 The Commelinaceae 3 2.1.1 Root System 6 2.1.2 Cytology 7 2.1.3 Reproductive Biology 8 2.1.4 Interspecific Hybridization 12
2.2. The Genus Tradescantia 13 2.2.1 Morphology, Habitat, and Distribution of Tradescantia occidentalis in Canada 14
2.3 Species at Risk in Canada 17 2.3.1 COSEWIC Status of Tradescantia occidentalis 19
2.4 Measurement of Genetic Diversity as a Conservation Tool 21 2.4.1 Molecular Methods for Estimating Genetic Diversity 21 2.4.2 Statistical Methods to Estimate Genetic Diversity 24
3. RESEARCH OBJECTIVES 27 4. A POPULATION STUDY IN TRADESCANTIA OCCIDENTALIS 28
4.1 Introduction 28 4.2 Materials and Methods 30
4.2.1 Population Estimate 31 4.2.1.1 Population Estimate in Saskatchewan 32 4.2.1.2 Population Estimates in Manitoba 32 4.2.1.3 Population Estimate in Alberta 34
4.2.2 Associated Species 36 4.3 Results 37
4.3.1 Population Estimates 37 4.3.1.1 Population Estimate in Saskatchewan 38

vii
4.3.1.2 Population Estimates in Manitoba 40 4.3.1.3 Population Estimate in Alberta 40
4.3.2 Parameter Comparison Among Populations 41 4.3.3 Associated Plant Species 42
4.4 Discussion 46 4.4.1 Population Estimates 46
4.4.1.1 Saskatchewan Population 47 4.4.1.2 Manitoba Populations 48 4.4.1.3 Alberta Population 49
4.4.2 Population Density 50 4.4.3 Associated Species 51
4.5 Conservation Management of Tradescantia occidentalis 53 4.6 Concluding Remarks 56
5. A STUDY OF GENETIC DIVERSITY IN CANADIAN POPULATIONS OF TRADESCANTIA OCCIDENTALIS 59
5.1 Introduction 59 5.2 Materials and Methods 61
5.2.1 Plant Material 61 5.2.2 DNA Extraction 62 5.2.3 Amplified Fragment Length Polymorphism Analysis 63 5.2.4 Data Analysis 65
5.3 Results 68 5.3.1 Intrapopulation Diversity 68
5.3.1.1 Saskatchewan Population 69 5.3.1.2 Routledge (Manitoba) Population 69 5.3.1.3 MHHC (Manitoba) Population 72 5.3.1.4 Lauder (Manitoba) Population 74 5.3.1.5 Alberta Population 74
5.3.2 Interpopulation Diversity 77 5.4 Discussion 84
5.4.1 Intrapopulation Diversity 84 5.4.2 Interpopulation Genetic Diversity 88 5.4.3 Conservation Genetics and Tradescantia occidentalis 90
5.5 Concluding Remarks 94 6. GENERAL CONCLUSIONS 95 7. LITERATURE CITED 98

viii
LIST OF APPENDICES
Appendix I: Raw and calculated population data for the five populations of Tradescantia occidentalis in Canada, 2005 ................................................115 Table AI.1. Raw and calculated data for the T. occidentalis population
in the PFRA pasture (SK), 2005 ....................................................... 115 Table AI.2. Raw and calculated data for the T. occidentalis
subpopulations, Douglas and Highway 19 (SK), 2005..................... 116 Table AI.3. Raw and calculated data for the T. occidentalis population
in Routledge, MB 2005..................................................................... 117 Table AI.4. Raw and calculated data for the T. occidentalis population
in MHHC, MB 2005. ........................................................................ 118 Table AI.5. Raw and calculated data for the T. occidentalis population
in Lauder, MB 2005.......................................................................... 118 Table AI.6. Raw and calculated data for the T. occidentalis population
in Alberta, 2005 ................................................................................ 119 Table AI.7. Comparison of the 2005 population estimates of
T. occidentalis to previous surveys....................................................120 Appendix II: Taxonomic list for areas with T. occidentalis (Habitat Type A) .. 121 Appendix III: Taxonomic list for areas of suitable habitat without
T. occidentalis (Habitat Type B) ...................................................... 125

ix
LIST OF TABLES
Table 4.1. Summary of the one-way ANOVA for density values of T. occidentalis in Canada ............................................................................................................... 43
Table 4.2. Summary of RA analysis for Habitat Type A, Habitat Type B, and
combined analysis.................................................................................................. 44 Table 4.3. Number of families, genera, and species in Habitat Types A, B, and
combined ............................................................................................................... 46 Table 5.1. Adaptors, pre-selective primers, and selective primer combinations used
to screen genetic diversity in T. occidentalis......................................................... 66 Table 5.2. Number and percentage of polymorphic bands detected with three
primers in T. occidentalis ...................................................................................... 71 Table 5.3. Nei’s genetic distance for primer one............................................................ 83 Table 5.4. Nei’s genetic distance for primer two ........................................................... 83 Table 5.5. Nei’s genetic distance for primer eight ......................................................... 85 Table 5.6. Nei’s genetic distance for combined primers ................................................ 85

x
LIST OF FIGURES
Figure 2.1. Plant, roots, flowering structures, and habitats of T. occidentalis. .............. 15 Figure 4.1. Map of North America showing the approximate locations of
T. occidentalis in Canada ...................................................................................... 30 Figure 4.2. Landsat image showing the T. occidentalis population in Saskatchewan. .. 35 Figure 4.3. Landsat images showing the T. occidentalis populations in Manitoba. ...... 36 Figure 4.4. Landsat image showing the T. occidentalis population in Alberta.............. 38 Figure 4.5. Graphic representation of the average total, flowering, grazed, and pink-
flowered stem density in the five Canadian populations of T. occidentalis .......... 41 Figure 4.6. Graphic representation of the proportion of flowering, grazed, and pink-
flowered stems in the five Canadian populations of T. occidentalis ..................... 41 Figure 4.7. Binary plot of the RA analysis in Habitats A and B.....................................45 Figure 4.8. Binary plot of the RA analysis in Habitat B. ............................................... 45 Figure 4.9. Binary plot the RA analysis in Habitat A. ................................................... 47 Figure 4.10. Graphic representation of species richness in Habitats A and B in the
Canadian prairie provinces. ................................................................................... 47 Figure 5.1. Map of the prairie provinces showing the general locations of T.
occidentalis in Canada........................................................................................... 62 Figure 5.2. Dice’s genetic similarity dendrograms for the Saskatchewan population
of T. occidentalis ................................................................................................... 73 Figure 5.3. Dice’s genetic similarity dendrograms for the Routledge (MB)
population of T. occidentalis ................................................................................. 74 Figure 5.4. Dice’s genetic similarity dendrograms for the MHHC (MB)
population of T. occidentalis ................................................................................. 76 Figure 5.5. Dice’s genetic similarity dendrograms for the Lauder (MB)
population of T. occidentalis ................................................................................. 78 Figure 5.6. Dice’s genetic similarity dendrograms for the Alberta population of T.
occidentalis ............................................................................................................ 79

xi
Figure 5.7. Dice’s genetic similarity dendrogram for primer one in the five Canadian populations of T. occidentalis................................................................ 81
Figure 5.8. Dice’s genetic similarity dendrogram for primer two in the five
Canadian populations of T. occidentalis................................................................ 81 Figure 5.9. Dice’s genetic similarity dendrogram for primer eight in the five
Canadian populations of T. occidentalis................................................................ 82 Figure 5.10. Dice’s genetic similarity dendrogram for combined primers in the
five Canadian populations of T. occidentalis ........................................................ 82 Figure 5.11. SAHN dendrograms using Nei’s genetic distance..................................... 84 Figure 5.12. Neighbour joining trees using Nei’s genetic distance ............................... 86

xii
LIST OF ABBREVIATIONS
ASRD: Alberta Sustainable Resource Development.
bp: Base pair.
CA: Correspondence analysis.
COSEWIC: Committee on the Status of Endangered Wildlife in Canada.
CTAB: 2X hexacetyl trimethylammonium bromide.
dH20: Distilled water.
dNTPs: Deoxynucleotide triphosphates.
MCDC: Manitoba Conservation Data Center.
MHHC: Manitoba Habitat Heritage Corporation.
NJOIN: Neighbour joining method
NTSYS: Numerical Taxonomy System software program.
PC-ORD: PC-ORD Multivariate Analysis of Ecological Data software program.
PCOORDA: Principle coordinate analysis.
PCR: Polymerase chain reaction.
PFRA: Prairie Farm Rehabilitation Association.
RA: Reciprocal averaging.
RAPD: Random amplified polymorphic DNA.
rbcL: Chloroplast gene coding for the large subunit of ribulse-1,5-bisphosphate carboxylase.
RFLP: Restriction fragment length polymorphisms.
SAHN: Sequential, agglomerative, hierarchical, and nested clustering methods. SASK: Herbarium of the University of Saskatchewan. SERM: Saskatchewan Resource and Environment Management.

xiii
SSR: Single sequence repeat. UPGMA: Unweighted pair group method with arithmetic mean.

1
1. INTRODUCTION
There are over 150 species officially designated as at risk in Canada, several of
which are understudied. Despite the growing number of endangered taxa of flora and
fauna, little is known about the biology of most of these vanishing species.
Tradescantia occidentalis (western spiderwort), a member of the Commelinaceae
family, is among these species at risk. Conservation of plants at risk requires a holistic
approach involving numerous areas of study. The Alberta Western Spiderwort
Recovery Team and the National Recovery Team for Plants at Risk in the Prairie
Provinces have called for the investigation of several aspects of the biology of T.
occidentalis, including reproductive biology and habitat requirements. In addition, these
organizations have acknowledged a paucity of information regarding levels of genetic
diversity in this species.
Terrestrial plants are susceptible to changes in habitat because of their sessile
nature. As a result, it is important to investigate macro- and micro-ecological variables
including soil conditions, water and nutrient availability, associated plant communities,
presence of invasive plant species, and effects of grazing. These parameters, along with
consistent methods to estimate population size, must be addressed to preserve habitat to
sustain species at risk.
The integration of ecological and molecular techniques in a conservation context
is becoming popular in studies on rare and endangered species to address issues in a
more holistic manner. Molecular techniques are used to assess levels of genetic

2
variation at the intra- and interpopulation levels and are usually used in conjunction with
ecological data. Issues such as inbreeding depression and the resulting loss of fitness
should be addressed in relation to environmental variables and isolation of populations.
Although it is unclear what levels of intrapopulation diversity are required to prevent a
loss of adaptability through inbreeding depression, these values can be compared among
populations of the same species. The level of interpopulation differentiation is an
important consideration in designing conservation strategies, such as transplantation of
individuals among populations.
To date, genetic variation has not been widely explored in threatened species in
Canada and this project represents one of the first of this kind. This study is comprised
of two main parts: 1) population demography, and 2) genetic diversity. Conducting
population inventories was not initially proposed in the project design, but was required
in some provinces in order to obtain permission to access and collect material from
Tradescantia occidentalis. Thus, though it was not intended to be a complete ecological
study, this research provides fundamental information regarding population size as part
of an annual assessment. The main focus of this research is the estimation of levels of
genetic diversity in Canadian populations of T. occidentalis. Each thesis chapter is
written in the format of a paper to be submitted to a peer reviewed journal; the ecology
chapter to Canadian Field Naturalist and the molecular chapter to Genome. Taxonomic
authorities for plant names are provided in Appendices II and III where they are not
provided in the text. The information gathered in this study will enhance the species
based conservation strategy already in place for T. occidentalis and may play a role in
formulating a large scale conservation plan for sand dune habitats. This study will also
serve as a model for future studies of species at risk in Canada and around the globe.

3
2. LITERATURE REVIEW
2.1 The Commelinaceae
The Commelinaceae is a monocotyledonous plant family that occurs in pantropic
and warm temperate climates. It encompasses 40 to 50 genera and approximately 600
species (Tucker 1989; Evans et al. 2000), some of which are considered invasive (Faden
1993; Standish 2001). Only four species of this family, placed in the genera
Tradescantia L. and Commelina L., are native to Canada. Although there is
disagreement in the taxonomic treatments of the Commelinaceae, it is divided into two
subfamilies, the Cartonematoideae and the Commelinoideae. This separation is based
on the distribution of raphide canals and the presence or absence of glandular microhairs
(Faden and Hunt 1991). Each subfamily is divided into two tribes, the Cartonemateae
and Triceratellae and the Tradescantieae and Commelinae, respectively. This division
of the Commelinoideae is not supported by cladistic analysis of morphological and
anatomical characters (Evans et al. 2000); however the monophyly of these two tribes is
supported by molecular data of the rbcL gene (Evans et al. 2003).
Genera of the tribe Tradescantieae are described as erect to prostrate plants with
monopodial stems (Woodson 1942). The inflorescences consist of sessile, terminal or
axillary, paired cincinni (scorpioid cymes) subtended by conspicuous bracts (Woodson
1942; Brenan 1966). These two-sided cincinni are considered to be derived from the
individual cymes of the Commelinae (Woodson 1942). In the Tradescantieae, the

4
actinomorphic flowers have six fertile stamens and produce seeds with a linear or
punctiform hilum (Brenan 1966). In contrast to the Tradescantieae, members of the
Commelinae have zygomorphic flowers in one-sided, scorpioid cymes (Woodson 1942).
The tribes can be further divided based on morphological characters. For example,
based on root anatomy the Tradescantieae is split into seven subtribes, three of which
occur in the New World (Hofreiter and Tillich 2002).
Several morphological features distinguish the Commelinaceae from the other
commelinoid monocots, including an amoeboid tapetum (Evans et al. 2000), closed leaf
sheaths, and succulent leaf blades (Faden and Hunt 1991). Furthermore, the presence of
cleistogamous flowers is a unifying feature in some species of the Commelinaceae
(Faden 2000). In several species these flowers are subterranean and produced from
nodes of decumbent shoots (Faden 1993). The aerial flowers have green sepals,
coloured petals, and three to six fertile stamens with bearded filaments in many genera.
The tetrasporangiate anthers, with distinctive girdle-type wall thickenings, dehisce
introrsely to release binucleate, monosulcate pollen grains (Tucker 1989). Axillary
placentation and orthotropous ovules are characteristic of the syncarpous, trilocular
ovary in most genera of this family. In the Commelinaceae, seeds with an abundance of
starchy endosperm are produced in capsules, nutlets, or berries (Tucker 1989). Seeds
are light and weigh approximately 0.003 g each (Stevens 1932).
Some particular chemical compounds also characterize the Commelinaceae. In a
number of genera, including Coleotrype C. B. Clarke, Commelina, Gibasis Raf.,
Tradescantia, and Tripogandra Raf., sulfated phenolic acids, quercetin 3-glycoside,
calcium oxalate raphides, and steroidal saponins are present (Tucker 1989). The

5
anthocyanins commelinin (p-coumaroyl-delphinidin 3,5 glucoside) and cyanidin (3,7,3’-
triglucoside) are responsible for the characteristic blue petal colour in this family
(Tucker 1989). Additional anthocyanins known as acylated glucosides have not been
reported in other monocots and appear to be unique to this family (Tucker 1989).
The Commelinaceae have limited commercial use but they are culturally important
for several reasons. Ornamental species, such as Tradescantia, Commelina, and
Palisota Rchb. ex Endl., are cultivated for gardens or as house plants. The ornamental
use of these plants can be problematic because several species are considered invasive,
particularly in areas of the United States of America and New Zealand (Standish 2001).
These invasive species have higher biomass and rates of sexual (Burns 2004) and
vegetative reproduction (Faden 1993), resulting in higher fitness (Burns 2004) compared
to non-invasive species.
In addition to ornamental uses, species in the Commelinaceae can be used for food
or medicine. The starchy tuberous roots of the genus Murdannia Royle and some
Commelina species are edible (Tucker 1989). Yanovsky (1936, reviewed in Tucker
1989) reports that young shoots of Tradescantia occidentalis were eaten by the Great
Plains Indians. Furthermore, certain species have been used for their medicinal
properties. For example, Commelina virginica L. has been reportedly used for clotting
blood in surface wounds, as well as in curing ailments of the stomach (Herrera 1897,
reviewed in Tucker 1989). C. nudiflora L. leaves are crushed and applied to the
forehead to relieve fever by Kadazandusun communities in Malaysia (Ahmed and Ismail
2003), while in Tanzania, C. benghalensis L. is used in the preparation of a vaccine
against blackquarter (Minja 1999). In addition, C. diffusa Burm. f. is used to treat fevers

6
and leucorrhea and in detoxification of the body (Long and Li 2004). There are
numerous other examples of medicinal uses of the Commelinaceae, but in spite of their
therapeutic properties, the chemically active components of the family have not been
characterized.
2.1.1 Root System
Root morphology and anatomy has been widely studied in the Commelinaceae.
Different root types have been observed in the family, for example Tradescantia
hirsuticaulis Small has drop roots with rootlets (Pinkerton 1936), whereas other species
have fibrous roots (Faden 2000). Generally, Commelinaceae roots are fleshy, succulent,
and shallow, enabling these plants to compete with grasses for water and nutrients
through lateral spread (Weaver 1958). The roots commonly reach a depth of 1.5 to 3 ft
and spread horizontally up to 1.5 ft, which provides the greatest competitive advantage
in dry climates with light summer rain (Weaver 1958) or in other climates with limited
moisture. Some members of this family, for example T. virginiana L., are associated
with arbuscular mycorrhizal fungi (DaSilva et al. 2001), which may confer advantages
for resource acquisition.
The root anatomy of the Commelinaceae is quite varied and the characters are not
phylogenetically informative (Hofreiter and Tillich 2002); therefore only the anatomy of
the Tradescantiinae is provided here. In this subtribe, the exodermis consists of one
layer of cells with evenly thickened walls. The pericycle lacks lignified cells and
sclerenchyma (Hofreiter and Tillich 2002). Within this subtribe, the roots of

7
Tradescantia virginiana are unique because they are bistelic (Hofreiter and Tillich
2002).
Two types of secondary root hairs with thickened cell walls, i.e. transitory and
persistent hairs with dead, air-filled cells, have been observed in the Commelinaceae
(Pinkerton 1936). There is a correlation between the persistent hairs and the absence of
secondary growth of roots in this family, which is thought to result in increased
absorptive efficiency and anchorage in shallow root systems (Pinkerton 1936).
Absorption and anchorage are particularly important for species, such as Tradescantia
occidentalis, that are found in sandy, unstable soils. Additional aspects dealing with
root morphology in T. occidentalis are discussed later in this study in relation to
ecological conditions.
2.1.2 Cytology
Knowledge of chromosome numbers is important because it relates to the
reproductive biology of a plant group. The basic chromosome number in the
Commelinaceae ranges from x=6 (2x=2n=12) to as high as x=20 (Jones and Jopling
1972). Generally the New World Commelinaceae are x=6 or x=8, while in Central and
South America, the most common base chromosome numbers are x=17 and x=19 (Jones
and Jopling 1972). Both diploids and polyploids, most commonly in the form of
tetraploids, occur in the Commelinaceae (Anderson and Sax 1936). Tetraploids have a
longer blooming period and higher survival rates than diploids but are generally only
distinguished cytologically (Anderson and Sax 1936). Additional DNA in polyploids
may be related to their ability to withstand several factors including temperature,

8
rainfall, UV intensity, latitude, altitude, and longer life cycle, and is considered adaptive
when it coincides with morphological or ecological diversity (Kenton 1984). In several
species, including Gibasis linearis Rohw. (Kenton 1984) and Tradescantia occidentalis
(Anderson and Sax 1936), DNA content varies within and among populations. In fact,
diploid and tetraploid T. occidentalis have been observed growing within a few feet of
each other in Texas, U.S.A. (Anderson 1954). In the genus Tradescantia, diploid
individuals have six pairs of large chromosomes (2n=2x-12), while tetraploids have 12
(2n=2x=24) (Anderson and Sax 1936).
Pollen fertility is generally high in both diploids and tetraploids. For example, in
diploid Tradescantia occidentalis, 94% of pollen was fertile, while 89% pollen fertility
was observed in tetraploids (Anderson and Sax 1936). High fertility of tetraploid pollen
was also observed in Rhoeo discolor (Sw.) Stear, a close relative of Tradescantia, where
tetraploids produced twice as much fertile pollen as diploids (Walters and Gerstel 1948).
Due to the effect of temperature on chromosome pairing, pollen fertility in some
Tradescantia species may be higher in periods of warm weather than after a series of
cold, wet days (Anderson and Sax 1936).
2.1.3 Reproductive Biology
The reproductive biology of Tradescantia occidentalis has not been studied
specifically; however, there is a plethora of information available on reproductive
biology of the Commelinaceae. Though the pollen is small enough to be transported by
wind (0.036 mm x 0.021 mm in T. occidentalis), it has been demonstrated that wind is
not a major vector for pollen dispersal in this family (Sinclair 1968). Members of the

9
Commelinaceae are entomophilous or autogamous, and the main visitors to flowers are
social and solitary bees and syrphid flies (Faden 1992). The honeybee (Apis mellifera
L.) has been commonly noted to contact anthers and stigmas on Tradescantia flowers
and has been observed to visit up to 73 flowers consecutively (Sinclair 1968). Weak
odours have been reported in Commelinaceae flowers, in particular in Tradescantia, but
these are not thought to be overly important in attracting pollinators (Faden 1992).
Members of the Commelinaceae lack nectar rewards and therefore must attract
pollinators by alternative means (Evans et al. 2003). Thus, flower morphology is
important. The absence of nectar has two major implications: 1) that flowers rarely
attract a wide array of pollinators, and 2) that pollen must function in fertilization in
addition to rewarding the pollinator (Faden 1992). Yellow-tipped trichomes on upper
stamens mimic pollen and lure insects to flowers in the genus Tinantia Scheidw.
(Simpson et al. 1986). In this commelinoid genus, the upper stamen produces only
sterile food pollen and while insects gather this pollen, fertile pollen from the lower
stamens is transferred to their bodies for pollination (Simpson et al. 1986). Anther
dimorphism has also been documented in other species in the Commelinaceae. For
example, three stamen types have been observed in Commelina coelestis Willd.,
including: 1) two cryptically coloured lateral stamens with copious amounts of pollen
for cross pollination, 2) a cryptically coloured central stamen for pollinator reward and
delayed autogamy, and 3) three bright yellow staminodes with small quantities of
inferior pollen for insect attraction (Hrycan and Davis 2005).
Finally, staminal hairs may be important in pollination for several reasons. First,
these showy structures may attract insects to the flower (Faden 1992). Second, filament

10
hairs may influence insect behaviour, i.e. the way an insect moves within the flower and
how it collects pollen. For example, honeybees gather filaments together to collect
pollen, a process that is impeded by filament hairs (Faden 1992). Additional functions
of the filament hairs may be to retain pollen that is dislodged from the anthers or provide
a foothold for small insects that must land to feed (Faden 1992).
The morphology of the stigma is also important in plant reproduction. In the
Commelinaceae, trifid and triangular shaped stigmas are the most common types,
though brush-like and circular stigmas are also found (Owens and Kimmins 1981).
Almost all pollinating surfaces are ‘wet’ in this family (Owens and McGrath 1984),
except in Tradescantia, which has a ‘dry’ stigmatic surface (Owens and Kimmins 1981).
‘Wet’ stigmas are thought to have better pollen attachment, hydration, germination, and
pollen tube growth (Owens and Horsfield 1982). In addition, the papillate nature of the
stigma surface may be involved in pollen germination. Papillae of the stigma
degenerate rapidly in open flowers and at anthesis these structures may collapse (Owens
and Horsfield 1982). The permeability of the papillae is greatest at the mid-region of
the cell and no germination occurs at the tip (Owens and McGrath 1984).
In addition to flower morphology, breeding systems are an important aspect of
reproductive biology, but remain poorly understood in many plant families. Some
species in the Commelinaceae are facultatively autogamous (Hrycan and Davis 2005),
while others are self-incompatible. The general rule in Tradescantia is self sterility
(Sinclair 1968). In self-compatible species, temporal and spatial isolation of the stigma
from the pollen may prevent inbreeding (Owens 1981). In a survey of 110 species in the

11
Commelinaceae, 55 were self-incompatible, 50 were self-compatible, and five had both
breeding systems (Owens 1981).
Self-incompatibility is found primarily in species with actinomorphic flowers,
such as those observed in the Tradescantieae; however self-compatible individuals are
found in the Parasetcreasea and Tradescantia sections of the genus Tradescantia within
this tribe (Owens 1981). In self-compatible species, autogamy is evident by the
presence of large bracts subtending the inflorescence, which makes the flowers
inconspicuous (Owens 1981). Conversely, large showy flowers and long styles
encourage outcrossing even if the species is self-compatible (Owens 1981). Longer
styles and showy flowers are two attributes of Tradescantia occidentalis that promote
outcrossing in this species.
Self-incompatibility is the inability of the plant to produce seeds from the union of
functional male and female gametes when self pollinated (Brewbaker 1957). In
angiosperms, self-incompatibility is controlled by a single S gene locus with multiple
alleles, which results in the inhibition of pollen germination or pollen tube growth
(Brewbaker 1957; Owens and Kimmins 1981). The site of inhibition depends on the
time of the production of incompatibility substances (Pandey 1960). There are two
types of control over self-incompatibility, sporophytic and gametophytic, and no plant
family has both self-incompatibility systems (Pandey 1960). Sporophytic self-
incompatibility is found in plants with trinucleate pollen and the behaviour of the pollen
is determined by the maternal genotype (Brewbaker 1957). In this self-incompatibility
system, the S allele action is before cytokinesis; therefore, the incompatibility reaction is
initiated on contact of the pollens grains to the stigmatic surface (Pandey 1960).

12
In gametophytic self-incompatibility, the inhibition occurs at some stage in pollen
tube growth and is found in species with binucleate pollen (Annerstedt and Lundquist
1967). With this system, the germinating pollen grains are unable to penetrate the
stigma (Pandey 1960). In gametophytic self-incompatibility, the S allele action occurs
after cytokinesis and inhibiting substances are produced within each microspore,
stopping tube growth in germinated pollen (Pandey 1960). In the Commelinaceae, the
gametophytic self-incompatibility system has been observed in several species,
including Tradescantia virginiana (Brewbaker 1957). In tetraploids, S allele
interactions (competition or dominance) occur in the pollen grain (Brewbaker 1957).
However, the lack of breakdown of incompatibility in tetraploids of the Commelinaceae
indicates no allele competition (Annerstedt and Lundquist 1967). Additionally, partial
breakdown in some polyploid Tradescantia species has been observed to have no effect
on the self-incompatibility system (Owens 1981).
2.1.4 Interspecific Hybridization
Interspecific hybridization in the Commelinaceae is a common event (Kenton
1984). Interspecific hybridization often results in an increase in the percentage of sterile
pollen (Anderson and Sax 1936). Although Tradescantia occidentalis (2n=2x=12) and
T. reflexa Raf. (2n=2x=12) are known to hybridize in the American Midwest producing
tetraploid offspring (2n=4x=24) (Anderson and Sax 1936), there are many barriers to
interspecific hybridization, including habitat preference. Species in the Commelinaceae
exploit different niches, for example rock outcrops, sand dunes, and forests, which may
prevent hybridization (Anderson and Sax 1936). Isolation mechanisms that maintain

13
species integrity include the short time that the flowers are open, the carrying in of the
stigmas and styles by deliquescing petals, and time of flowering (Sinclair 1968).
Flowers in Tradescantia species in the United States have been reported to last only one
day, opening around 5 AM and closing around noon (Sinclair 1968; Faden 1992).
2.2. The Genus Tradescantia
The genus Tradescantia includes approximately 70 species distributed in
neotemperate and neotropical regions (Faden 2000). The placement of species within
this genus has been widely debated and it is often divided into sections. For example,
based on root anatomy, Tradescantia is divided into the following six sections:
Tradescantia, Austrotradescantia, Setcreasea, Rhoeo, Campelia, and Zebrina (Hofreiter
and Tillich 2002). These herbaceous, semi-succulent perennials have thin or tuberous
roots that are covered in a piliferous layer (Pinkerton 1936). The linear, sessile leaves
are spirally arranged along the stem (Faden 2000). The flowers are clustered in terminal
or axillary, unilateral scorpioid cymes (cincinni) and are subtended by long, spathaceous
bracts, which often extend beyond the inflorescence (Tucker 1989). The bisexual
flowers are white to pink, blue, or violet with distinct petals and sepals (Faden 2000).
The androecium has six showy stamens with bright yellow anthers and bearded
filaments. The trilocular, syncarpous ovary forms a capsule with two to six seeds
(Faden 2000). Stevens (1932) reported the magnitude of seed production in T.
occidentalis to be in the order of 1,160 seeds in a mature plant; however these results
may have been exaggerated by his estimation methods.

14
Only three Tradescantia species are found in Canada, namely, T. ohiensis Raf. and
T. virginiana in southern Ontario, and T. occidentalis in the prairie provinces, the latter
being the focus of the research presented here. In the United States of America, these
species are much more common and T. occidentalis is actually considered as an invasive
plant in some places (Anderson and Sax 1936; Anderson 1954). This species can
survive in a variety of habitats including sandy terraces, mesquite forests, and grasslands
(Anderson 1954), but in Canada it is restricted to five populations located in sandy
habitats as described in the following section.
2.2.1 Morphology, Habitat, and Distribution of Tradescantia occidentalis in Canada
Tradescantia occidentalis (Fig. 2.1A) is a perennial monocot native to temperate
regions of Canada and the United States of America. Injured stems and leaves produce
a mucilaginous substance that resembles a cobweb when hardened, giving rise to the
common name, western spiderwort. The fleshy, semi-succulent roots are an adaptation
to the dry environment where this plant lives (Fig 2.1B). Flowers are clustered in
cincinni and have three sepals, three pink or blue petals, and an androecium with
bearded filaments and bright yellow anthers (Fig. 2.1C). The fruit is a capsule, each of
which releases two to six seeds that are dispersed down slope of the parent plant by
gravity, rain, snowmelt, or wind (Smith 2002). Methods of long distance seed dispersal
are not known for this species, and local dispersal results in a clumped distribution of
plants within a population. Seed set is very important to T. occidentalis because there
are no methods of vegetative reproduction in this species. Although various insects
have been observed visiting T. occidentalis flowers, sweatbees are the only confirmed

15
Figure 2.1. Plant, roots, flowering structures, and habitats of Tradescantia occidentalis. A. Plant with linear, sheathing leaves. B. Fleshy semi-succulent roots. C. Flowers with bearded filaments. D. General habitat in the PFRA subset of the Saskatchewan population. E. General habitat in the Lauder (Manitoba) population. F. Rolling stabilized dune habitat in Alberta.
a
c D
E F
BA
C

16
pollinators of this species (Smith 2002).
Tradescantia occidentalis was studied in two types of habitat in Canada. First,
this species is locally abundant on sand dunes (Fig. 2.1D, E), excluding areas dominated
by Populus tremuloides or Quercus macrocarpa. Plants in this type of habitat are
primarily located midslope on the southwest face of partially stabilized dunes (Godwin
and Thorpe 2004; MCDC 2005). In Saskatchewan, this species occurs mainly in a
rolling sand dune complex (Fig. 2.1D) with smaller clusters located in relatively flat
sandy areas with moderate vegetation. In Manitoba, T. occidentalis populations are
found on discrete sand hill formations and occasionally in small shaded meadows or
among low growing shrubs (Fig. 2.1E) (Goulet and Kenkel 1997). These sand hill
formations are linear or parabolic in shape with slopes generally greater than 30˚
(MCDC 2005). This plant occasionally grows in dense, shrubby or wooded vegetation
but prefers sunny areas associated with open sand or sparse vegetation in this
environment. Because this species has several adaptations to drought conditions,
including fleshy roots, rubbery leaves, mucilage, and flowers that close in midday heat,
it is better suited to the warm dry conditions of the partially active dunes than the moist
shady environment typical of wooded communities. Second, in contrast to the
Saskatchewan and Manitoba populations, very few individuals of T. occidentalis are
found in active sand dunes in Alberta. The vast majority of this population occurs on
sandy substrate that has been stabilized by vegetation. In this habitat, the dunes are
eroded and only small, undulating stabilized hills remain (Fig. 2.1F).
Though Tradescantia occidentalis is adapted to different environmental conditions
across the prairies, the habitats have shared features, such as sandy soil and several plant

17
species. According to Peters (2003a), T. occidentalis in Alberta is associated with the
following species: Hesperostipa comata subsp. comata, Calamovilfa longifolia,
Koeleria macrantha, Bouteloua gracilis, Rosa L., Lygodesmia, and Rumex venosus. T.
occidentalis has also been observed with Symphoricarpos occidentalis, Prunus
virginiana, Elaeagnus commutata, Selaginella densa, and Artemisia ludoviciana (Smith
2001).
2.3 Species at Risk in Canada
Tradescantia occidentalis is among a large number of plant species in need of
protection. At present, there are 157 vascular plants on Canada’s species at risk list, of
which 74 are listed as endangered, 48 as threatened, and 35 in the special concern
category (COSEWIC 2005a). Several of these species are in danger of extirpation due
to habitat specificity, fragmentation or destruction, and competition with invasive plants.
While threatened species are in less immediate danger of extirpation than
endangered species, research must be conducted to better understand all species at risk.
Phacelia ramosissima Dougl. ex Lehm., Epilobium densiflorum (Lindl.) Hoch & P.H.
Raven, and Meconella oregana Nutt. are examples of species in the endangered
category (COSEWIC 2005a). P. ramosissima is restricted to three populations in
Canada, each with less than 1,000 plants, and is in the endangered category due to
habitat loss as a result of urban expansion and mining activities (COSEWIC 2005b).
Likewise, there has been a decrease in the number of populations of E. densiflorum due
to reduction of the natural habitat for agricultural, urban, and industrial development,
with subsequent spread of exotic species (COSEWIC 2005d). A similar situation has

18
been observed in M. oregana where the 3,500 mature individuals that remain in Canada
are threatened by overgrazing, fire suppression, and the influence of invasive taxa
(COSEWIC 2005f).
Other species, including Tradescantia occidentalis, Castilleja rupicola Piper ex
Fern., and Enemion biternatum Raf., are among the taxa in the threatened category
(COSEWIC 2005a). C. rupicola populations are highly fragmented, geographically
restricted, and are estimated consist of less than 250 individuals (COSEWIC 2005c). E.
biternatum is affected by a reduction in the quality of its remaining habitat caused by
recreational activity, soil compaction, trampling, and erosion, and by the use of
chemicals, such as pesticides and road salt (COSEWIC 2005e). Cypripedium reginae
Walt. and Polygonatum biflorum (Walt.) Ell. are not ranked by COSEWIC, but are
considered provincially endangered in Saskatchewan (Harms 2003); thus, they must be
monitored to preserve provincial biodiversity. These taxa are also affected by loss of
habitat and an increasing number of invasive species.
In spite of the large number of species at risk in Canada and the implications of
human activity on biodiversity, the information regarding the general biology,
population size, and genetic structure and diversity is lacking or outdated for many
species. It is clear that numerous species are in need of investigation because scientific
knowledge is required to implement effective conservation management strategies.
Reproductive biology, response to invasive taxa, habitat requirements, and genetic
diversity are a few examples of understudied areas. An emerging tool in conservation is
the use of molecular techniques to assess genetic diversity and population structure of
species at risk. Studies of genetic variation in species at risk using molecular markers

19
have been increasing due to their fundamental role in conservation and because they
provide an effective and relatively quick assessment of population genetics.
2.3.1 COSEWIC Status of Tradescantia occidentalis
The Committee on the Status of Endangered Wildlife in Canada (COSEWIC) lists
and prioritizes species of flora and fauna according to their degree of risk. Several
issues are taken into account when placing species in a particular category. For
example, a species may be considered endangered when the decline in population
number is greater than 70% of the total population or the number of individuals is less
than 2,500 in Canada (COSEWIC 2005a). Likewise, a species may be considered
threatened if the decrease in the number of individuals is greater than 50% or the total
number of individuals is less than 10,000 (COSEWIC 2005a).
Tradescantia occidentalis is nationally threatened (COSEWIC 2005a). On a
provincial scale, this species has been ranked as endangered in Saskatchewan (Wild
Species at Risk Regulations 2005) and Alberta (AESCC 2005), and as threatened in
Manitoba (MCDC 2005). The COSEWIC designation of this species is based on several
factors, including the limited number of populations and restricted distribution in
Canada. T. occidentalis occurs in only five populations in Canada: one in
Saskatchewan, one in Alberta, and three in Manitoba. These populations are isolated
among the provinces but in the United States of America if forms a continuous
distribution. This species is at the northernmost extent of its range, explaining in part its
inability to expand northward. However, there are several geographically proximal
dune complexes or sandy areas of apparently suitable habitat unoccupied by T.

20
occidentalis to the south, east, and west of current populations, indicating that there may
be other factors preventing a wider distribution of this species. Additional available
habitat is located in other areas of the Douglas Provincial Park, the Great Sand Hills,
and the Webb Sand Hills in Saskatchewan (K. Remarchuk, pers. obs.) and at Pakowki
Lake South, One-Four, Turin, Purple Hills, Lazy H, Hilda and Whiskey Gap in Alberta
(Peters 2003a, b), but T. occidentalis has not been located in these regions. Barriers to
seed dispersal and differences in microhabitat or ecological conditions may limit the
dispersion of T. occidentalis to new areas.
In addition to the limited number of populations, it has been reported that the
number of individuals within a population fluctuates from year to year (Smith 2002),
though discrepancies among studies may be due to different inventory methodologies or
sampling error. For example, in 2003 and 2004, the large portion of the Saskatchewan
population residing on Prairie Farm Rehabilitation Association (PFRA) land was
estimated at approximately 40,000 and 60,000 individuals, respectively (Godwin and
Thorpe 2004, 2005). In 2004, the two small Saskatchewan subpopulations (Douglas and
Highway 19) were estimated at 2,137 and 758 stems, respectively (SERM 2005).
However, in 2001, the total Saskatchewan population was estimated to be a meager 100
individuals (Smith 2002). These discordances are partly due to the discovery of
additional patches of T. occidentalis in the PFRA pasture and in the Douglas Provincial
Park in subsequent years. A similar discrepancy has been observed in the Manitoba and
Alberta populations. In addition to reported demographic fluctuations, habitat
destruction and fragmentation, and competition with invasive plants also pose a threat to

21
this species (Peters 2003a). Furthermore, overgrazing may affect population numbers
and hence the status of Tradescantia occidentalis.
2.4 Measurement of Genetic Diversity as a Conservation Tool
The need for studies to document biodiversity and propose management strategies
for plant species at risk is critical. The use of molecular techniques to infer levels of
genetic diversity is becoming widely used in rare and endangered plants for
conservation management purposes (Godt et al. 1995; Cardoso et al. 1998; Camacho
and Liston 2001). Knowledge of genetic diversity provides insight into speciation,
adaptation, and population structure and dynamics (Bussell 1999). In addition, the
screening of genetic variability in endangered species provides valuable baseline data
for conservation strategies such as new and more efficient sampling strategies,
reintroduction of extirpated or endangered plants, translocations, and the introduction of
new genotypes to increase genetic diversity (Arafeh et al. 2002). Furthermore, the
identification of genetically diverse populations as a source of propagules may be useful
(Godt et al. 1995).
2.4.1 Molecular Methods for Estimating Genetic Diversity
A number of methods have been proposed to estimate levels of genetic diversity.
To date, there is disagreement regarding the best molecular method to determine genetic
variation, and the choice often depends on the organism under study and the methods
available. Molecular fingerprinting provides insight into genetic structure, divergence,
and phylogeny of organisms (Martínez-Ortega et al. 2004) and involves the use of

22
genetic markers, which are heritable polymorphisms that reflect differences in
nucleotide sequences (Schubert et al. 2001). Numerous molecular methods have been
explored to investigate genetic diversity, including amplified fragment length
polymorphisms (AFLPs) (Mace 1999), restriction fragment length polymorphisms
(RFLPs) (Powell et al. 1996), simple sequence repeat (SSR) polymorphisms (Powell et
al. 1996; Mariette et al. 2001), and random amplified polymorphic DNA (RAPD)
(Ayres and Ryan 1999). Each of these methods has advantages and disadvantages. For
example, the SSR technique is ideal for studies among closely related species or within
species because it provides high resolution for detecting heterogeneity and
heterozygosity, but for the same reason is not useful at higher taxonomic levels, such as
among genera (Powell et al. 1996). RFLPs have a high multiplex ratio, meaning that a
large amount of information is generated in each experiment, but do not distinguish
heterozygotes from homozygotes (Powell et al. 1996).
AFLPs are commonly used in studies at the population level. Overall, the amount
of information obtained with AFLPs exceeds that of RAPDs by a factor of ten
(Koopman 2005). AFLPs are useful in calculating genetic distances between genotypes
(Karp et al. 1996) because polymorphisms made visible when DNA from two sources
differ in restriction sites are detected by this technique (Hongtrakul et al. 1997). Also,
there are fewer problems with reproducibility relative to other techniques because longer
primers and higher annealing temperatures can be used, thereby increasing selectivity
through more stringent conditions (Nybom 2004). In general, techniques that involve
restriction enzyme digestion and two polymerase chain reaction (PCR) primers are more
robust and reproducible than other methods (Karp et al. 1996). Two restriction enzymes

23
are used to prevent doublets due to unequal mobility by labeling one strand of PCR
products (Vos et al. 1995). Furthermore, AFLPs span a large region of the genome
without requiring prior sequence knowledge (Russell et al 1999; Deprés et al. 2003).
Finally, small amounts of DNA are required for this technique (Escaravage et al. 1998),
which is particularly advantageous in rare and endangered species. AFLPs are a simple,
quick, and cost effective method of estimating genetic diversity (Mace 1999; Muluvi et
al. 1999) that can be carried out with standard laboratory equipment.
The disadvantages associated with a particular molecular technique must also be
considered in project design. AFLPs are scored dominantly; therefore codominant
markers are ignored (Koopman et al. 2001; Nybom 2004). In addition, AFLPs provide
fewer polymorphisms when compared to other marker systems (Powell et al. 1996).
Finally, this technique targets unknown regions of DNA and the results may represent
more than one fragment of equal size from different regions of the genome (Vos et al.
1995).
At present, little research on genetic diversity has been conducted in the
Commelinaceae from the molecular or the phenotypic viewpoint. In fact, the only other
genetic diversity study in the Commelinaceae is an allozyme study measuring genetic
diversity in Tradescantia hirsuticaulis (Godt and Hamrick 1993). Allozyme studies
have been widely used to study genetic diversity in plants because they are reproducible
(Jenczewski et al. 1999), relatively fast and inexpensive (Liu and Furnier 1993) neutral
markers (Cruzan 1998). The main disadvantages of this technique are that is does not
produce high enough levels of polymorphisms to identify a large number of genotypes
present in a population (Cruzan 1998) because the requirement for enzyme activity

24
limits the range of loci that can be studied (Beebee and Rowe 2004). DNA based
techniques often replace or are used in conjunction with allozymes to generate more
polymorphisms.
Nowadays, AFLPs are widely used to study intra- and interpopulation genetic
variation of endangered and threatened species because of their many advantages
(Muluvi et al. 1999; Ribeiro et al. 2002). Genetic variation obtained from AFLP
analysis has been used to determine population structure in endangered members of the
Fabaceae (Travis et al. 1996), Apiaceae (Gaudeul et al. 2000), and Ericaceae
(Escaravage et al. 1998). AFLPs have also been used to study economically important
genera of the Rubiaceae (Russell et al. 1999) and Theaceae (Paul et al. 1997). Based on
the versatility and advantages listed above, and their ability to detect levels of genetic
variation within and among populations in other studies of endangered species
worldwide, AFLPs have been chosen to study genetic diversity in Tradescantia
occidentalis.
2.4.2 Statistical Methods to Estimate Genetic Diversity
Several statistical methods have been proposed for the analysis of different types
of molecular data, some of which will be applied to this project. In general, the use of
statistical methods involves some assumptions about the data set. For instance, the
following points are assumed in the estimation of genetic diversity using AFLP data: 1)
point mutations at selective bases cause absence of bands, 2) each peak corresponds to
only one locus, 3) Mendelian inheritance is in effect, and 4) each locus has two allelic
states, resulting in the presence or absence of a band (Gaudeul et al. 2000).

25
Genetic diversity can be assessed at the intra- and interpopulation levels (Nybom
2004). Among the methods to investigate intrapopulation genetic diversity, Nei’s
expected heterozygosity, which is the probability that two random alleles in a population
can be distinguished with the genetic marker used (Nei and Li 1979), is widely accepted
(Muluvi et al. 1999; Gaudeul et al. 2000). Other estimates of intrapopulation variation
are Dice’s similarity coefficient, Shannon’s index of phenotypic diversity and the
percentage of polymorphic bands. Dice’s coefficient is a pairwise comparison of the
data and is similar to Nei’s heterozygosity. Shannon’s index quantifies and partitions
genetic diversity in small sample sizes, and does not require estimates of heterozygosity
(Bussell 1999).
Genetic divergence may be assessed at the interpopulation level using Nei’s GST,
which is the proportion of diversity calculated from the total genetic diversity in all
populations (Culley et al. 2002). GST values range from zero to one, with low values
indicating little variation among populations (Culley et al. 2002). Another method is the
F-statistic (FST), which is based on the presence or absence of bands and is operated
under the assumption of random mating (Gaudeul et al. 2000). F-statistics involve three
parameters that are not affected by sampling methods, size, number of alleles per locus
or number of populations sampled, including the associations of: 1) genes within
individuals, 2) genes of different individuals at the intrapopulation level, and 3) genes
within individuals within a population (Weir and Cockerham 1984). FST is used to
estimate interpopulation diversity (Gaudeul et al. 2000) and population structure (Weir
and Cockerham 1984) of polymorphic systems (Excoffier et al. 1992). The values for
FST also range from zero to one, with higher values indicating greater genetic

26
differentiation among populations (Cardoso et al. 1998). Finally, the Mantel test may be
used to investigate correlations between the genetic diversity matrix (F-statistic or G-
statistic) and spatial distance (Camacho and Liston 2001). In addition, several statistical
packages perform the analysis of molecular variance (AMOVA) (Excoffier et al. 1992),
which are used to perform a hierarchical analysis of genetic distance (Muluvi et al.
1999). AMOVA incorporates information regarding DNA haplotype divergence into
analysis with fewer assumptions about the statistical properties of the data, making
AMOVA a popular program in the biological sciences (Excoffier et al. 1992).
In this study, Dice’s coefficient will be used to assess the intrapopulation diversity
and Nei’s coefficient of genetic distance will be calculated to evaluate interpopulation
differentiation in Tradescantia occidentalis. Both of these statistics have been applied
to AFLP data in other plant species and will allow comparison of the data collected on
T. occidentalis to other species at risk. In addition, Nei’s genetic distance has been used
in the genetic diversity study in T. hirsuticaulis (Godt and Hamrick 1993).
This study primarily focuses on estimating population size and genetic diversity of
Tradescantia occidentalis. The incorporation of molecular tools to investigate the levels
of genetic diversity in T. occidentalis will be particularly useful to implement future
conservation strategies. This research will provide insight into the breeding system and
degree of reproductive isolation of the Canadian populations of this species as well as
valuable ecological information that can serve as a model study for other species at risk
in Canada.

27
3. RESEARCH OBJECTIVES
To date, little is known about the ecological requirements and genetic structure of
the five Canadian populations of Tradescantia occidentalis, and in general the
evolutionary history of this and other species at risk This study was undertaken in
response to the lack of understanding of the genetic diversity and general biology of T.
occidentalis, a threatened species in Canada. The project was designed to investigate
the levels of intra- and interpopulation genetic diversity, as well as to document current
population sizes. It involves a combination of ecological and molecular methods of
investigation to address the following main objectives:
1. To conduct a population inventory.
2. To screen levels of genetic diversity at the intra- and interpopulation level of
Canadian populations of T. occidentalis.
3. To provide guidelines and recommendations for the effective conservation of T.
occidentalis.

28
4. A POPULATION STUDY IN TRADESCANTIA OCCIDENTALIS 4.1 Introduction
Tradescantia occidentalis, a perennial monocot native to temperate regions of
Canada and the United States of America, is nationally threatened (COSEWIC 2005a).
Considering that a population is defined as a group of individuals separated by at least
one kilometre of unsuitable habitat acting as a barrier to propagule distribution
(Lancaster 2000), there are five populations of Tradescantia occidentalis in Canada
(Fig. 4.1). The largest Canadian population of this species is found in the Elbow Sand
Hills in south-central Saskatchewan. It is divided into northern and southern polygons
on Prairie Farm Rehabilitation Association (PFRA) land and two smaller polygons in
the Douglas Provincial Park, henceforth referred to as PFRA (north and south), Douglas,
and Highway 19, respectively. Because these areas are separated by less than one
kilometer of suitable habitat, they are considered to be a single population. Three
additional populations are located in the southwestern corner of Manitoba; one in the
Routledge Sand Hills and two in the Lauder Sand Hills. Two of these populations occur
on private land, while the third is situated on property owned by the Manitoba Habitat
Heritage Corporation (MHHC). The Manitoba populations are henceforth referred to as
Routledge, Lauder, and MHHC. The fifth and westernmost population is found on
leased and deeded land (Peters 2003a) in the dry mixed grass subregion of southeastern
Alberta (ANHIC 2004).

29
Figure 4.1. Map of North America showing the distribution of Tradescantia occidentalis in Canada and the United States. 1. Alberta population. 2. Saskatchewan population. 3. Routledge (Manitoba) population. 4. MHHC (Manitoba) population. 5. Lauder (Manitoba) population. (modified from Smith 2001).
Although Tradescantia occidentalis grows in different habitats across the prairie
provinces, it is generally limited to partially stabilized sand dunes or sandy prairies.
This species occurs primarily on southwest facing semi-stabilized slopes or active dunes
(Godwin and Thorpe 2004) in a rolling sand dune complex in the PFRA subset of the
Saskatchewan population and in sandy prairie in the Douglas and Highway 19 polygons.
Alternatively, in Manitoba, T. occidentalis is found on discrete sand hill formations

30
(MCDC 2005) and occasionally in small shaded meadows or among low growing
shrubs at the base of linear or parabolic sand dunes (Goulet and Kenkel 1997). In
Alberta, a few individuals are found on small dunes, but the vast majority of the
population grows in gently undulating sandy prairie.
At present, relatively little is known about the ecology, habitat requirements, and
associated plant communities of Tradescantia occidentalis in Canada, thus these aspects
require further study. Furthermore, the effects of grazing and invasive plant species on
T. occidentalis remain uninvestigated. In addition, an annual assessment of T.
occidentalis population size is required because of the threatened status of this species.
In order to address the above issues, this study has been designed to contribute to the
ecological and biological knowledge of this species. The objectives are: 1) to conduct a
population inventory to update the estimates of Canadian populations of T. occidentalis,
and 2) to determine the taxonomic composition of the plant communities within the
specified habitat.
4.2 Materials and Methods
Field-based population estimates were conducted in each province during the
summer of 2005, during which time information on population size and general
characteristics (grazed, flowering, and pink-flowered individuals) and associated plant
species was collected. Due to differences in landscape features, survey methodologies
varied by province as indicated below. Prior to conducting the surveys, it was necessary
to establish the definition of a Tradescantia occidentalis individual because of
disagreement in the use of this term among previous studies. For example, PFRA

31
researchers consider this species to be rhizomatous; therefore only stems greater than 20
cm apart have been enumerated in their studies. The fleshy fibrous root system of T.
occidentalis lacks rhizomes (Fig. 2.1B) (K. Remarchuk, pers. obs.; Faden 2000). In
some cases, horizontal root growth may be mistaken for rhizomes, but T. occidentalis
lacks the associated scales and adventitious roots. Consequently, in this study an
individual is considered as a multi-stemmed shoot with all stems originating from the
same point above ground.
4.2.1 Population Estimate
The average density of stems or plants in each population was calculated as the
mean number of stems or plants per square metre in each counted polygon or transect.
In this study, a polygon is defined as an area that is delineated by GPS coordinates and
used to determine the area of occupancy, which is in turn used in the calculation of the
average density of this plant. A one-way analysis of variance (ANOVA) was used to
determine the variance among the densities and stem to individual ratios in the five
populations.
Prior to the study, permission to remove voucher specimens for the Herbarium of
the University of Saskatchewan (SASK) and leaf tissue from up to 100 individuals was
requested from Saskatchewan Environment and Resource Management (SERM), the
Wildlife and Ecosystem Protection Branch of Manitoba Conservation, and Alberta
Sustainable Resource Development (ASRD) for the Saskatchewan, Manitoba, and
Alberta populations, respectively, to comply with environmental laws and botanical
ethics. Permission was granted to remove tissue from only 30 individuals in each

32
population. In Saskatchewan, the PFRA and Douglas Provincial Park granted
permission to access, monitor, and collect plant tissue. In Manitoba and Alberta,
landowners and leaseholders were contacted prior to the field season by the Manitoba
Conservation Data Center (MCDC) and ASRD, respectively.
4.2.1.1 Population Estimate in Saskatchewan
The Saskatchewan population was surveyed at the end of June, 2005. A
collaboration to determine the population number and total number of flowering and
grazed plants was established with PFRA researchers to study the large subset of the
Saskatchewan population. Their sampling strategy involved constructing 400 m x 3 m
transects perpendicular to the dominant landscape features. Nine sites were randomly
chosen in the northern polygon and four in the southern polygon (Godwin and Sumners,
unpubl.). The average plant density estimated from these transects was applied to the
area delineating the polygons to evaluate the total population. Due to the small size of
the Douglas and Highway 19 polygons, the total number of stems and individuals in
these polygons was counted. The distribution of Tradescantia occidentalis on the
landscape is seen in Figure 4.2. Global Positioning System (GPS) coordinates were
recorded around the perimeter of these polygons using a Garmin eTrex GPS unit
(accuracy <3 m).
4.2.1.2 Population Estimates in Manitoba
These population estimates were conducted from July 4-9, 2005. In general,
fieldwork was carried out between 5 AM and 1 PM while the flowers were open;

33
Figure 4.2. Landsat image showing the location of the Tradescantia occidentalis population in Saskatchewan. Solid gray lines represent quarter sections; light gray and white areas represent exposed sand of partially stabilized sand dunes. however, due to time constraints, some transect counts were done in the late afternoon.
A transect method was chosen to maintain consistency among the Manitoba and
Saskatchewan populations but the dimensions differed due of the nature of the sand hill
formations. In Manitoba, a 30 m x 6 m wide transect was selected to cover all suitable
habitat. In areas where a width of only 15 to 20 m of suitable habitat was present,
transects expanded into wooded areas. Transects started at the base of the slope, usually
Douglas
PFRA North
PFRA South
Highway 19

34
at the tree line, and were constructed perpendicular to the dune. Numbers between zero
and the length of the dune were chosen with a random number generator. Transects
were placed “x” metres north of the southernmost point of the dune and recorded with a
GPS unit to facilitate the future reassessment of each population.
Tradescantia occidentalis was counted in 38 transects in Manitoba. The two
ridges in the Routledge population span approximately 3.2 km. Plants were counted in
12 transects on each ridge, for a total of 24 transects. Four transects were enumerated
on the 300 m long dune of the MHHC population, while plants in ten transects were
counted on the 1.3 km long ridge in the Lauder population. The distribution of plants
within each population is illustrated in Figure 4.3. To estimate the total population by
extrapolation, the average density in each population was applied to the area of available
suitable habitat on each sand hill formation.
4.2.1.3 Population Estimate in Alberta
The Alberta survey was conducted from July 14-18, 2005 as a project funded by
ASRD. At the request of ASRD, the methodology was based on previous studies
(Peters 2003a). This resulted in consistency in the data collected and in an inventory
method that suited the local distribution pattern of Tradescantia occidentalis.
Population estimates were obtained by counting the number of individuals within a
polygon, delineating the area with a GPS unit, and calculating average density to be
applied to the area known to contain T. occidentalis (Remarchuk 2005) shown in Figure
4.4. The number of individuals in each polygon could not be enumerated because of the

35
Figure 4.3. Landsat images showing the location of the Tradescantia occidentalis populations in Manitoba. A. The Routledge population. B. The MHHC population. C. The Lauder population. Solid gray lines represent quarter sections; light gray and white areas represent exposed sand or more commonly, crops.
large population size and time constraints. The average density was extrapolated to the
area calculated using ArcView 3.2 (ESRI) of the uncounted polygons. The total
population estimate was obtained by adding the counted and extrapolated polygons.
Searches for additional patches of this species were conducted by walking through the
study area, which was inclusive of, but not limited to, the sand dune complex.
a
B
CA

36
Figure 4.4. Landsat image showing the Tradescantia occidentalis population in Alberta. Solid gray lines represent quarter sections; light gray and white areas represent exposed sand or crops.
4.2.2 Associated Species
In order to characterize the taxonomic composition of the community types,
species found in areas with and without Tradescantia occidentalis were recorded. For
ease of reference, areas with T. occidentalis are henceforth referred to as Habitat Type A
and areas without T. occidentalis as Habitat Type B. A 1 m2 plot was established every
5 m along 25 m transects in Habitat Type A to document the plant species. In
Saskatchewan, five transect locations were chosen using a random number generator
within the coordinates delineating the population (Godwin and Thorpe 2004). Species
in selected polygons or transects in Habitat Type A were recorded in a total of 18
transects in Manitoba and seven in Alberta. Locations in Habitat Type B were targeted

37
within the study area for comparative purposes between the two habitat types. For
Habitat Type B, species in five transects were recorded in Saskatchewan and Manitoba,
and two in Alberta. Using the statistical program PC-ORD v.4 (McCune and Mefford
1999; McCune and Grace 2002), a correspondence analysis (CA), also known as
reciprocal averaging (RA) analysis, was performed on the combined transects and
separately on transects in Habitat Types A and B. Downweighting of rare species was
selected for all analyses.
4.3 Results
4.3.1 Population Estimates
Due to the sensitivity of rare plant location information, polygon and transect
coordinates are not provided here but are available through SERM, MCDC, or Alberta
Natural Heritage Information Centre (ANHIC) for Saskatchewan, Manitoba, and
Alberta, respectively.
With the exception of the PFRA polygons, the density values given below are in
terms of stems instead of plants because of the consistent stem definition in the
literature. The density values of flowering, grazed, and pink-flowered plants are
provided in Appendix I and represented graphically (Fig. 4.5) but are not reported in the
results because only general trends are discussed. The raw and calculated data for stems
and plants collected in each province is provided in Appendix I, including data for:
Saskatchewan (PFRA) (Table AI.1), Saskatchewan (Highway 19 and Douglas) (Table
AI.2), Routledge (Table AI.3), MHHC (Table AI.4), Lauder (Table AI.5), and Alberta

38
(Table AI.6). A comparison of the population data from 2005 with previous estimates is
found in Table AI.7 of Appendix I.
4.3.1.1 Population Estimate in Saskatchewan
The raw data presented here for the PFRA polygons is based on personal
communication with PFRA researchers. The north polygon covers approximately
485,770 m2, where a total of 1,269 plants were counted in nine transects. This subset of
the population is estimated at 56,359 ± 38,635 individuals (95% confidence level) with
an average density in the north polygon of 0.1175 plants/m2. Approximately 63% of
plants were flowering and 47% showed evidence of grazing at the time of the survey. In
the south polygon, which covers an area of approximately 107,666 m2, 59 plants were
observed in four transects, yielding a population estimate of 1,340 ± 4,261 individuals
(95% confidence level). The average density in this polygon was 0.0491 plants/m2
(Table AI.1).
The Douglas and Highway 19 polygons of the Saskatchewan population
encompassed areas of 11,887 m2 and 5,895 m2, respectively. A total of 696 stems (430
plants) in Douglas and 481 stems (260 plants) in Highway 19 were counted (Table
AI.2). The average stem density of these two polygons is 0.0700 stems/m2. The mean
proportion of flowering and grazed stems is 81.6 % and 3.3%, respectively. Searches in
suitable habitat adjacent to the known polygons of Tradescantia occidentalis were
unsuccessful in the discovery of additional individuals. The density and proportion of
flowering, grazed, and pink-flowered stems from PFRA north and south, Douglas and
Highway 19 have been combined for analytical purposes (Figs. 4.5 and 4.6).
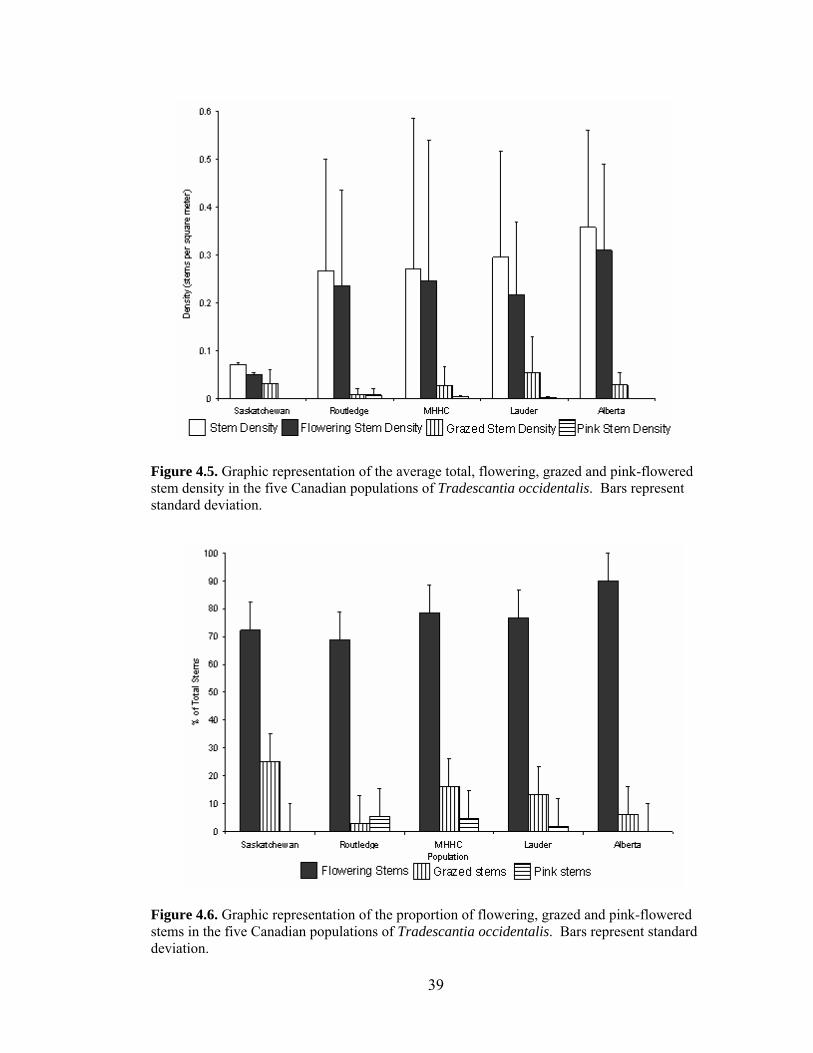
39
Figure 4.5. Graphic representation of the average total, flowering, grazed and pink-flowered stem density in the five Canadian populations of Tradescantia occidentalis. Bars represent standard deviation.
Figure 4.6. Graphic representation of the proportion of flowering, grazed and pink-flowered stems in the five Canadian populations of Tradescantia occidentalis. Bars represent standard deviation.

40
4.3.1.2 Population Estimates in Manitoba
In this 2005 survey, a total of 1,148 stems (701 plants) were counted along 24
transects in the Routledge population, which is estimated at 21,948 ± 8,344 stems
(13,402 ± 4,170 plants) with a 95% confidence level (Table AI.3). The average density
is 0.2657 stems/m2 (Fig. 4.5). An estimated 68.7 % stems have reproductive structures,
3.0% are browsed, and 5.5% have pink flowers (Table AI.3; Fig. 4.6).
In the smallest Canadian population of Tradescantia occidentalis, located on
MHHC property, a total of 194 stems (62 plants) were counted in four transects (Table
A1.4). The total population is estimated at 2,425 ± 7,261 stems (775 ± 3,511
individuals) with a 95% confidence level (Table A1.4) from an average density of
0.2694 stems/m2 (Fig. 4.5). An estimated 78.6% of stems have reproductive structures
and 16.2% are browsed, while approximately 4.7% bear pink flowers (Table AI.4; Fig.
4.6).
In the Lauder population, 530 stems (179 plants) were counted in ten transects.
This population is estimated at 11,916 ± 6,796 stems (4,024 ± 1,530 individuals) with
95% confidence (Table A1.5). The average density is 0.2944 stems/m2 (Fig. 4.5) and an
estimated 76.8% of stems have reproductive structures, 13.2% are grazed, and 1.9% are
pink flowered (Table AI.5; Fig. 4.6).
4.3.1.3 Population Estimate in Alberta
As previously mentioned, the Alberta population survey was funded by ASRD and
the population numbers reported here are the outcome of that inventory (Remarchuk
2005). A total of 3,627 stems (1,861 plants) were counted in 11 polygons during the

41
2005 field season. The total population was estimated at 56,834 ± 19,188 stems (28,430
± 11,682 individuals) with a 95% confidence level (Table AI.6). The average density is
0.3254 stems/m2 (Fig. 4.5). An estimated 90% of stems have reproductive structures,
while only 6.1% are browsed (Fig. 4.6).
4.3.2 Parameter Comparison Among Populations
In general, the Alberta population of Tradescantia occidentalis has the highest
total (0.3254 stems/m2) and flowering stem (0.3088 stems/m2) densities. In turn, the
Saskatchewan population has the lowest estimates in nearly all categories, while the
density values among the Manitoba populations are relatively similar (Fig. 4.5). The
proportion of flowering stems is comparable in the five populations; however, the
highest proportion of grazed stems occurs in Saskatchewan (81.6%) (Fig. 4.6). The
highest proportion of pink-flowered stems is observed in Routledge (5.5%) (Fig. 4.6).
For exact values of parameters estimated in Figs. 4.5 and 4.6, refer to Appendix I.
One-way ANOVAs were conducted on stem densities calculated in the five
populations to infer the relationships among the parameters investigated. For all
parameters, the null hypothesis is that the densities are the same among the populations.
The null hypothesis is rejected for grazed stem density, which indicates that grazing
differs among the populations. This is expected due to the implementation of different
management strategies. For all other parameters the null hypothesis cannot be rejected
(Table 4.1) because the calculated F value is less than the critical F value obtained from
statistical tables (Campbell 1989). The probability values are high (p>0.1), indicating

42
that the decision to fail to reject the null hypothesis is not strongly supported (Table
4.1).
Table 4.1. Statistical summary of the one-way ANOVA for plant and stem densities at five populations of Tradescantia occidentalis in Canada.
Stem
Density Individual
Density Flowering
Stem Density
Flowering Individual
Density
Grazed Stem
Density
Grazed Individual
Density
Pink Density
(MB only) Variance among
populations
0.0400
0.0166
0.0329
0.0201
0.0042
0.0005
0.0001 Variance within
populations
0.0579
0.0107
0.0411
0.0109
0.0015
0.0014
0.0001 F value
0.6901 1.5404 0.8022 1.8512 2.7049 0.3707 1.2053
p value 0.60
0.21 0.53 0.14 0.04 0.83 0.31
Accept or reject null hypothesis*
Fail to Reject
Fail to Reject
Fail to Reject
Fail to Reject
Reject
Fail to Reject
Fail to Reject
* The F value with df(4,40) is 2.61, at p=0.05
4.3.3 Associated Plant Species
Several plant species associated with Tradescantia occidentalis populations are
common across the prairie provinces. Plots of RA analysis show clustering of transects
on two axes based on the similarity and abundance of the plant species documented,
which theoretically should reflect species composition in each habitat type and province.
The variables represented by axes one and two are unknown. Relatively little of the
variance seen on two axes is explained in the RA analysis (Table 4.2), with the highest
proportion of the variance explained in Habitat Type B (Table 4.2). The proportion of
the distance explained, which is a measure of how well the distances in the ordination
represent the data in the original matrix, is also low (Table 4.2).

43
Table 4.2. Summary of RA analysis with downweighting selected for Habitat Type A, Habitat Type B, and combined analysis (Habitat Types A and B). The variance is the amount of variation in the original data matrix that can be partitioned between the three provinces.
Habitat A Habitat B Habitats A and B # Non-zero items 576 210 651 Total variance (inertia) 2.2179 1.3172 3.1231 Variance on Axis 1 (%) 15.3 33.0 11.0 Variance on Axis 2 (%) 11.8 17.8 10.6 Total Variance (%) 27.1 50.8 21.6 Total Distance 0.296 0.673 0.441 Distance on Axis 1 (%) 9.4 13.5 3.6 Distance on Axis 2 (%) 20.9 46.0 33.4 Total % Distance 29.6 59.5 37.0
The community types in the three provinces differ slightly, as seen in the
combined RA analysis (Fig. 4.7) because of the abundance of some taxa in each
population. The RA analysis of Habitat Type B also shows a differentiation in habitat
type among the provinces (Fig. 4.8) based on the presence of the following species:
Thermopsis rhombifolia, Koeleria macrantha, Populus tremuloides, Arctostaphylos uva-
ursi, Selaginella densa, Prunus virginiana, Opuntia fragilis, O. polyacantha, Artemisia
campestris (Saskatchewan), Andropogon hallii, Cyperus schweinitzii (Manitoba),
Artemisia ludoviciana, and A. frigida (Alberta). However, Habitat Type A shows less
distinction in plant communities (Fig. 4.9), which are influenced by Galium boreale,
Vicia americana, Maianthemum stellatum, and Symphoricarpos occidentalis. Based on
an inventory of the plant species in Habitats A and B, no major floristic differences were
found among the populations. Several common species not associated with
Tradescantia occidentalis in one province, such as Asclepias viridiflora and
Heterotheca villosa, were found in association with T. occidentalis in other provinces
(Appendices II and III). In general, Habitat Type A is taxonomically richer than Habitat
Type B in each province (Fig. 4.10), and as expected, the compilation of the floristic

44
Figure 4.7. Binary plot of the RA analysis of transects evaluated in Habitat A and Habitat B. The cutoff value for species is 0.50.
Figure 4.8. Binary plot of the RA analysis of transects evaluated in Habitat B. The cutoff value for species is 0.50.

45
Figure 4.9. Binary plot of the RA analysis of transects in Habitat A. The cutoff value for species is 0.50.
Figure 4.10. Graphic representation of species richness in Habitat Type A and Habitat Type B in the Canadian prairie provinces.

46
elements in the two habitats surpasses that of Habitat Type A with a total of 123 species
(93 genera in 35 families) (Table 4.3). A breakdown of the number of families, genera,
and species by province is provided in Table 4.3.
Table 4.3. Number of families, genera, and species in Habitat Types A, B, and Combined Habitats for Saskatchewan, Manitoba, and Alberta.
Habitat Type A Habitat Type B Combined Habitat Types A & B
SK MB AB Total SK MB AB Total SK MB AB Total # Families 28 28 19 34 21 21 18 31 28 29 19 35 # Genera 62 64 41 86 48 50 45 67 65 66 47 93 # Species 80 70 47 114 61 57 52 96 82 73 51 123
Other taxa observed on the PFRA pasture in Saskatchewan include provincially
ranked species at risk such as Cyperus schweinitzii and Elymus lanceolatus subsp.
psammophilus. In the MHHC population in Manitoba, Tradescantia occidentalis was
observed growing in association with Campanula rotundifolia, a finding that is in
disagreement with previous reports (C. Hamel, MCDC, pers. comm.). Euphorbia esula,
a noxious species, is abundant in the Saskatchewan and Manitoba populations, but is
absent in Alberta. A taxonomic list of species recorded during the surveys is provided
in Appendices II and III for Habitat Types A and B, respectively.
4.4 Discussion
4.4.1 Population Estimates
Based on the 2005 estimates, there is a perceived increase in the number of
individuals in several populations of Tradescantia occidentalis (Table AI.7). Previous
studies of this species in Alberta indicate that high levels of precipitation are correlated
with increases in population number (Smith 2002; Peters 2003a; Peters 2003b). In this

47
study, data collected from the Alberta population supports this theory. However, this
observation is not consistent among provinces. The 2005 PFRA inventory in
Saskatchewan indicates a relatively stable population number (Godwin and Sumners,
unpubl. data; Godwin and Thorpe 2005), suggesting that size is not directly related to
precipitation. Slight differences in population size can be expected due to sampling
error or environmental variability (Lande 1999), for example, there may be fewer
individuals in drier years. The use of different sampling methods among studies may
have implications in the accuracy of the estimation of previous and current population
size (Table AI.7); therefore, possible correlations between precipitation and population
fluctuations should be interpreted with caution.
4.4.1.1 Saskatchewan Population
As indicated earlier in this chapter, population estimates for the Saskatchewan
population (PFRA land) were conducted by PFRA researchers in 2005. The
Saskatchewan population estimates for the north (56,359 plants) and south (1,340
plants) polygons on the PFRA land in 2005 (Godwin and Sumners, unpubl.) are
relatively similar to the 2004 estimates of 56,583 and 4,951 plants reported by Godwin
and Thorpe (2005) in the north and south polygons, respectively (Tables AI.1, AI.7). In
2003, the north and south polygons were estimated at 38,376 individuals and 2,907
individuals, in that order (Godwin and Thorpe 2004). The population estimates in 2005
and 2003 are 99% and 68% of the 2004 estimate, respectively (Table AI.7) for PFRA
north. In the south polygon, the 2005 and 2003 estimates are 27% and 58% of the 2004
estimate (Table AI.7). According to Godwin and Thorpe (2004), in spite of the

48
substantial variation in population number, the estimates are not statistically different
due to large error margins associated with the sampling method used in this study.
Unlike the PFRA population, the 2005 estimates obtained in this study for the
Douglas and Highway 19 polygons are lower compared to the 2004 estimates. In this
survey, the Douglas polygon is estimated at 696 stems versus 2,137 in 2004 (SERM
2005), which represents a 67% decrease (Table AI.7). In the Highway 19
subpopulation, the number of stems is also lower and estimated at 481 compared to 758
in 2004 (SERM 2005). The 2005 estimate represents 63% of the individuals of the 2004
estimate (Table AI.7). The 2005 estimates are considerably lower, suggesting that these
populations have declined. This decrease may be explained by the fact that fewer
individuals were found because the Saskatchewan inventory was conducted earlier in
the season and some plants without flowers may have been overlooked.
4.4.1.2 Manitoba Populations
The 2005 estimates of the Manitoba populations are comparable to previous
inventories. In this study, the Routledge population is projected to be 13,402 individuals
compared to 9,422 individuals in 2001 (MCDC 2005). The 2005 estimate represents
142% of the 2001 survey (Table AI.7). In contrast, the MHHC population has remained
stable with an estimated 775 plants in 2005 and 787 individuals in 2001 (MCDC 2005).
This represents a 2% decrease from 2001 (Table AI.7). Statistically, the error margin is
high (775 ± 3,511 plants) because of the few of transects sampled, but considering the
small population size and the proportion of individuals counted, the above calculation is
regarded as accurate. On the other hand, the Lauder population shows a minor decline

49
in number of individuals relative to previous estimates. The population was estimated at
4,024 plants in 2005, which is a 7% decline (Table AI.7) compared to 4,321 plants in
2001 (MCDC 2005). However, this data is in disagreement with the observations of the
landowner (pers. comm.) of the Lauder population, who indicated the presence of more
Tradescantia occidentalis in 2005 than in previous years. This further suggests that the
observed decline is in part due to sampling error, but plant phenology and environmental
fluctuations should also be taken into consideration.
4.4.1.3 Alberta Population
The Alberta population was originally located in the mid 1980s (Smith 2001), but
until 2002 inventories focused solely on areas of the semi-active sandy environments in
the dune complexes. In 1990, the population was estimated at 210 individuals (Smith
2002) (1% of 2005 estimate, Table AI.7) but only seven individuals were located in
2001 (Smith 2001). The 2002 survey reported a population of 7,450 individuals (Peters
2003a) (26% of 2005, Table AI.7), while the 2003 estimate was 7,700 plants (73% less
than 2005, Table AI.7) (Peters 2003b). The 2005 estimate of 28,430 plants (Remarchuk
2005) exceeds previous reports by a factor of approximately four.
Several factors may account for the discrepancies among these estimates. Since
the majority of the population is found in sandy prairie, it is possible that a large
proportion of individuals were missed in early studies. Although the 2002 and 2003
inventories included a wider study area on partially active dunes and the surrounding
prairie, several new patches of Tradescantia occidentalis were located in this study. It is
evident that the perceived population increase in 2005 is due to the discovery of new

50
patches. In addition, the polygons from this study were larger in size and number than
those in previous studies (ANHIC 2005), which is putatively indicative of the wider
distribution of this species. Another possible factor is that T. occidentalis is difficult to
locate among other prairie plant species in its grass-like vegetative stage. However,
some plants were beginning to senesce at the time of the Alberta inventory, which
facilitated the field identification of this species.
4.4.2 Population Density
Total stem density was recorded primarily for the purpose of estimating
population size. This value can also be used as an indicator of ideal growing conditions
because plants develop and proliferate better in optimum environments. Among the
Canadian populations, the Saskatchewan population has the lowest average stem
density, while Alberta has the highest (Tables AI.1, AI.2, AI.6; Fig. 4.5). The habitats
differ between these two provinces, thus higher density values may indicate that
Tradescantia occidentalis is better suited to the prairie conditions in Alberta. Higher
plant density may also reflect differences in carrying capacities and levels of species
competition in the different environments (Lande 1999). It must be noted that resource
overlap among species does not measure competition and when resources are not
limited, resource use of different species may coincide significantly (Sale 1974). Thus,
the higher density values observed in Alberta are not necessarily correlated with lower
intra- or interspecific competition rates.
It has been hypothesized that pollinator visitation rates increase in dense
populations because pollinator energy intake increases with high flowering density
51
(Schmitt 1983). However, studies have shown that there is no difference in the
pollinator visitation rates per flower among populations with high and low densities in
the Ranunculaceae (Bosch and Waser 1999) and Boraginaceae (Klinkhamer and de Jong
1990). Although no direct measurements on the number of pollinators were recorded in
the Canadian populations of Tradescantia occidentalis, more pollinators were observed
in the more dense Alberta population (K. Remarchuk, pers. obs.); however, this could
have been due to the presence of more flowers and may not reflect pollinator visitation
rates.
In Tradescantia occidentalis, pink-flowered stems, which are found in low
frequency in Manitoba, occur in very close proximity to blue-flowered stems with no
apparent difference in macroenvironment. The Routledge population has the highest
proportion of pink flowers, followed by MHHC and Lauder (Fig. 4.5). No difference in
the frequency of pollinator visitation was observed for the pink-flowered plants (K.
Remarchuk, pers. obs.); however, this parameter was not measured. The specifics of
flower colour variation and its relationship to pollinator attraction in T. occidentalis are
obscure and the genetic basis of flower colour polymorphism in this species requires
further investigation.
4.4.3 Associated Species
Although plant species associated with Tradescantia occidentalis have been
previously recorded, no community analysis has been completed prior to this study. An
analysis of the plant communities that occur in T. occidentalis habitat was conducted to
determine if this plant is associated with particular species, for which more of the

52
ecological requirements are known. The separation of provinces along each axis of the
RA analyses is difficult to explain in terms of environment, though there are several
hypotheses. Transects in Habitat Types A and B were very similar except that Habitat
Type B lacked T. occidentalis; therefore, the following ideas can be applied to both
habitat types. One possible explanation is the nature of the dune formations. The
Manitoba populations of T. occidentalis occur on discrete dunes whereas in
Saskatchewan and Alberta, plants are dispersed throughout an area of suitable habitat.
In addition, the successional stage of the dunes varies in each province. The most active
dune complexes occur in Saskatchewan and Manitoba and the most stabilized dunes are
found in Alberta. Also, slope size may be influential because T. occidentalis occurs on
large, moderate, and gently rolling dunes in Saskatchewan, Manitoba, and Alberta,
respectively. The individual or combined effect of these factors may contribute to the
clustering patterns of transects by province in the RA analysis (Figs. 4.7-4.9).
According to the RA analysis in Habitat Type A (Fig. 4.9), species influencing the
separation of the Manitoba transects are Maianthemum stellatum and Symphoricarpos
occidentalis. Interestingly, these species are infrequent on dunes in Manitoba but are
common in Saskatchewan or Alberta. This indicates the need for more transects in
Habitat Type A because theoretically, species influencing the separation of populations
at the provincial level should be locally common or unique to that province. Another
species, Thermopsis rhombifolia, influences the separation of the Saskatchewan
transects because it is associated with stabilized areas at the edges of Populus
tremuloides forest in the study area where occasional individuals of Tradescantia
occidentalis are found. In turn, in Habitat Type B, Artemisia ludoviciana and A. frigida

53
influence the clustering of the Alberta transects, Andropogon hallii and Cyperus
schweinitzii influence the distinction of Manitoba, and species such as T. rhombifolia,
Selaginella densa, and Opuntia fragilis influence Saskatchewan (Fig. 4.8). These
results are more realistic because some of these species are common in their respective
provinces but are not frequently observed elsewhere. In addition, A. hallii is native to
Manitoba but is not known to occur naturally in Saskatchewan or Alberta.
Taxonomically, the species diversity in Habitats A and B is not significantly
different but in general, the former has a higher number of species than the latter. Some
taxa, such as Toxicodendron radicans in Saskatchewan, were not recorded outside the
Habitat A transects, but were evident on the landscape. Furthermore, some species do
not occur in certain provinces, such as Asclepias viridiflora var. linearis in Alberta and
Andropogon hallii in Alberta or Saskatchewan. In Habitat A and the combined analysis,
the provinces separate indistinctly, indicating that the communities in which
Tradescantia occidentalis occurs do not differ because of the association with T.
occidentalis but because of taxonomic differences in species among provinces which
may vary due to the amount of stabilization of the dunes. For example in Alberta, the
dunes are much more stabilized than in Manitoba and Saskatchewan and thus plants
associated with active sand are not abundant in Alberta. A taxonomic list of plants in
Habitat Types A and B is included in Appendices II and III, respectively.
4.5 Conservation Management of Tradescantia occidentalis
Coordinated research is needed to facilitate preservation of local, national, and
global biodiversity. In Saskatchewan, a National Recovery Team for Plants at Risk in

54
the Prairie Provinces has been established. Its goal is to survey and inventory species at
risk, but to date has not formulated an action plan regarding Tradescantia occidentalis.
However, in early 2005, a maintenance and recovery plan for this species was drafted by
the Alberta Western Spiderwort Recovery Team (2004), which includes members of the
Alberta government, a conservation agency, and members of the general public. The
action plan involves population and habitat conservation and management, public
information and education, and research into knowledge gaps. Resource acquisition,
legislation and plan management, and administration are also considered.
Conservation management includes annual population surveys with standardized
estimation protocols and surveys for invasive species. These protocols should be
consistent to increase the accuracy of population fluctuations from year to year. The
polygon extrapolation method designed by Peters (2003a) and employed in the 2005
survey of Tradescantia occidentalis worked well for the spatial distribution of the
Alberta population; however, the method is not strongly supported statistically. The
statistical support may be strengthened by increasing the number of polygons counted.
The same premise holds for the sampling strategies employed in the Manitoba and
Saskatchewan populations of T. occidentalis. Therefore, it is recommended that
consistent sampling methods are used in future surveys and that polygons counted in
this study be enumerated in subsequent surveys. Additional patches of T. occidentalis
may be identified in future studies, thereby changing the overall population estimations.
Monitoring changes in numbers by counting known polygons is more valuable to the
understanding of this species because it reduces the error due to inconsistent sampling

55
techniques. This will allow meaningful correlations between environmental conditions,
grazing, and other factors in relation to population size.
Though Tradescantia occidentalis does not appear to be severely affected by the
invasion of Euphorbia esula at this time, further investigation into new methods of
biological control should be explored as a conservation management strategy. The long
term effect of invasive species on native plants is sometimes unpredictable but can be
very serious. If E. esula is not controlled, the Saskatchewan and Manitoba populations
may decline because of dune stabilization and the allelopathic effect of decaying E.
esula litter (Steenhagen and Zimdahl 1979). At present, there is no method of
eradicating this species from the plant community. However, in the MMHC population
in Manitoba, methods of biological control, such as Hyles euphorbia L. (spurge
hawkmoth) and Aphthona lacertosa Rosenheim (leafy spurge beetle), have been
implemented in an effort to prevent the spread of E. esula (MCDC, pers. comm.;
Pachkowksi 2002). In addition to biological control, it is recommended that other
methods of extirpation of this invasive species, such as grazing by sheep or herbicide
application, be investigated. The implementation of new methods should be used with
caution as they may be detrimental to T. occidentalis and other native plants.
Grazing by native ungulates is another factor affecting Tradescantia occidentalis
because it removes the reproductive structures. Grazing may lead to the increase in the
number of vegetative stems and involves the removal of flowers or capsules with the
consequent inability of plants to produce offspring by sexual reproduction. Since T.
occidentalis does not spread through rhizomes, the production of viable seeds is
important to propagate the species. If grazing is early in the season, the stems often

56
regenerate and produce flowers, which may actually be beneficial to the propagation of
this species; however, it was observed that grazing tends to produce many non-
reproductive stems that had not flowered at the time of the study (K. Remarchuk, pers.
obs.). It should be noted that historically, T. occidentalis has been subjected to natural
grazing cycles by bison, deer, and possibly moose, and thus is adapted to some level of
grazing. Based on the status of the populations, current grazing regimes do not appear
to have a negative impact on the populations. However, in the future, overgrazing may
be a potential threat to T. occidentalis and may also favour the establishment of invasive
species, particularly if bales containing seeds of invasive taxa are used as a
supplementary food source for cattle.
No requests for oil and gas exploration have been reported for these areas in
Saskatchewan and Manitoba. In Alberta, there is currently no petroleum exploration in
the area of the T. occidentalis population, though this practice has been considered in the
past and is likely to continue to be an issue in the future. Despite the relatively stable or
increasing population numbers, it is important to consider the threats surrounding the
populations of T. occidentalis and enforce environmental laws in this and other
Canadian species at risk.
4.6 Concluding Remarks
Several conclusions regarding the demography, association of Tradescantia
occidentalis with other plant species including invasive taxa, and effects of grazing in
the Canadian populations can be made from this study. In Saskatchewan and Manitoba,
the population estimates were relatively similar to the previous survey and in Alberta the

57
estimated population size in 2005 greatly exceeded previous estimates. The nationally
and provincially threatened status of T. occidentalis is supported even though the
population data from this study suggests that T. occidentalis is not critically endangered
or in danger of extinction. Generally, demographic stochasticity in populations greater
than 100 individuals is of relatively little importance (Lande 1999) and is unlikely to be
a problem despite the large discrepancies in population estimates among this study and
previous estimates in the Alberta and Saskatchewan populations. The International
Union for the Conservation of Nature (IUCN) ranking is based on the number of
populations in each province, an area of occupancy less than 20 km2, and an overall
extent of occurrence less than 5,000 km2 (IUCN 2005); therefore the large size of each
population does not warrant a change in status.
The association of Tradescantia occidentalis with other plants within each
province revealed that this species is not associated with any particular taxa. The plant
communities differ by species composition by province and not by association with T.
occidentalis. The invasive Euphorbia esula was found extensively throughout the
Saskatchewan and Manitoba populations but T. occidentalis appears to be capable of co-
existing with this species at present. Further research and monitoring of E. esula is
recommended. Grazing in all Canadian populations is limited and does not appear to be
detrimental to the survival of T. occidentalis in Canada. However, upon further
fragmentation of the habitat, increases in density of E. esula, or increased grazing
pressure, current populations of this species could rapidly decline. In brief, T.
occidentalis should remain protected because of the small number of Canadian
populations and their reproductive isolation. The protection of T. occidentalis will also

58
prevent further fragmentation of the delicate sand dune environment and other species at
risk. Since various fundamental aspects regarding the biology and natural history of this
species require further investigation, it is recommended that subsequent studies focus on
key issues outlined in this study, including response to grazing and invasive plant
species.

59
5. A STUDY OF GENETIC DIVERSITY IN CANADIAN POPULATIONS OF TRADESCANTIA OCCIDENTALIS 5.1 Introduction
Tradescantia occidentalis (Commelinaceae) is a perennial monocot native to
Canada and the United States of America. In areas of the United States larger
populations of this species are found in a continuous distribution pattern; however, only
five populations exist in Canada (Fig. 5.1). The distribution has been discussed in
Chapter 4, but it is important to briefly revisit this topic to remind the reader of the
locations of the Canadian populations. The northernmost population is located in the
Elbow Sand Hills of central Saskatchewan (Fig. 5.1). Three populations are situated in
southwest Manitoba, two in the Lauder Sand Hills (MHHC and Lauder) and one in the
Routledge Sand Hills (Fig. 5.1). The fifth and westernmost population of T.
occidentalis is located in the Pakowki Sand Hills of southeastern Alberta (Fig. 5.1).
To date, most research on Canadian populations of T. occidentalis has dealt with
population numbers, its association with other plant species within the community, and
to a limited extent, reproductive strategies. Although recent estimates regarding the size
of these populations exist, the issue of genetic variation within and among populations
of T. occidentalis remains largely unexplored.

60
Figure 5.1. Map of the prairie provinces of Canada showing the general locations of the populations of Tradescantia occidentalis.
Since the investigation of genetic diversity provides an indication of the variability
of genotypes in wild populations, such estimates are valuable in conservation biology.
Several molecular methods have been used to obtain genetic diversity estimates,
including AFLPs, a method that has gained popularity in studies of species at risk.
AFLPs use the selective PCR amplification of restriction fragments, which involves the
digestion of genomic DNA with two enzymes, followed by ligation to double stranded
adapters, subsequent pre-selective and selective PCRs, and visualization on a
polyacrylamide gel (Martínez-Ortega et al. 2004). The restriction endonucleases include
a frequent cutter and a rare cutter. The frequent cutter has many restriction sites
throughout the genome and generates small DNA fragments ideal for amplification.
The rare cutter recognizes fewer restriction sites, resulting in larger fragments. Using
two enzymes increases selectivity because only segments cut by both endonucleases are
Scale in Kilometres

61
amplified (Vos et al. 1995). Since the advantages and disadvantages of AFLPs have
been discussed in section 2.4.1, the reader is referred to this section.
As a consequence of habitat fragmentation, global warming, and increased
numbers of rare species, conservation programs are becoming more prevalent in
Canada. The current nationally threatened and provincially endangered rankings of
Tradescantia occidentalis, the small number of populations, and the minimal
information regarding genetic variation, make this species an ideal candidate for this
type of investigation. The primary goal of this research is to investigate levels of
genetic diversity in T. occidentalis at the intra- and interpopulation levels in Canada. It
is hypothesized that higher levels of variation exist at an interpopulation level than at the
intrapopulation level due to the geographic and putative reproductive isolation among
the populations.
5.2 Materials and Methods
5.2.1 Plant Material
Plant material was collected in situ between June and July of 2005. Leaf tissue
was removed from a total of 30 individuals in each population, the maximum number
granted by SERM, MCDC, and ASRD. Plants were randomly selected in the
Saskatchewan population, but in the Manitoba and Alberta populations, individuals were
selected within the random transects designed for the population inventory (see section
4.3.1). A distance of at least one metre between individuals was maintained in all
populations. Some samples deteriorated due to warm temperatures in the field;

62
consequently, 20 plants per population were used for AFLP analysis in order to maintain
a consistent sample size. Similar studies involving AFLP techniques have used sample
sizes ranging from 20 to 75 individuals per population (Bayer 1991; Muluvi et al. 1999).
Lower sample sizes are often observed in studies of wild and threatened species, while
larger sample sizes are seen in agricultural studies where ample material is readily
available.
Leaf samples were wrapped in damp paper towel and placed in a cooler or dried in
silica gel to preserve tissue for DNA extraction. The preservation protocol followed the
recommendations of Chase and Hill (1991), who state that plant tissue should be placed
in silica gel in a ten to one ratio. This allows tissue to dry within 12 hours, thus
preventing DNA degradation. One voucher specimen from each province was prepared
for the collection of the University of Saskatchewan (SASK) herbarium.
5.2.2 DNA Extraction
DNA extraction followed a Mini-Prep CTAB DNA extraction protocol (Cota-
Sánchez et al., in review) modified from Murray and Thompson (1980) and Saghai-
Maroof et al. (1986) for mucilaginous species. Leaf tissue from live or dried tissue was
frozen in liquid nitrogen and powdered with a mortar and pestle. Tissue was added to
an Eppendorf tube containing hexacetyl trimethylammonium bromide (CTAB) and 2-
mercaptoethanol, heated to 55-60˚C for one hour, and mixed periodically. Then,
repeated organic extractions with chloroform:isoamyl alcohol (24:1) were conducted to
separate cellular debris and excess mucopolysaccharides, followed by isopropanol
precipitation of the supernatant at -20˚C overnight. The precipitated DNA was

63
centrifuged to form a pellet, which was dried and resuspended in tris ethylene
diaminetetra-acetic acid (TE). The samples were incubated at 37˚C for 30 minutes with
RNAase, followed by the addition of 2.5 M NaOAc and 95% ethanol for overnight
precipitation at -20˚C. The resulting pellet was centrifuged, dried, and washed with
70% ethanol before resuspension in TE and storage at -20˚C. Following extraction, the
total DNA was quantified using a Biophotometer UV Spectrophotometer (Eppendorf
AG), stained with ethidium bromide, and electrophoresed on a 1% agarose gel against a
marker of known molecular weight for visualization of the extracted product.
5.2.3 Amplified Fragment Length Polymorphism Analysis
DNA from 20 individuals was initially tested to select the primer combinations
that yielded the highest number of polymorphisms, which are bands present in some
samples but absent in others. Three of nine screened combinations were selected (Table
5.1), which is comparable with other AFLP studies using three (Gaudeul et al. 2000) or
four (Muluvi et al. 1999) primer sets. Primers were tested several times on the same set
of DNA samples to ensure reproducibility.
The AFLP protocol was modified from methods outlined by the genetics
laboratory in the Department of Plant Sciences at the University of Saskatchewan (G.
Scoles, unpubl.) and Gaudeul et al. (2000). Foremost, all DNA samples were brought to
100 ng/μl and subjected to a restriction reaction with the following components: 5.0 μl
DNA, 2.5 μl One-Phor-All Buffer (10X) (Amersham Biosciences), 17.0 μl dH2O, 0.25
μl MseI (10 units/μl) (Fermentas), and 0.25 μl EcoRI (10 units/μl) (Invitrogen). The
reaction was incubated at 37˚C for three hours, then cooled on ice. Next, the samples

64
Table 5.1. Adapters, pre-selective primers, and selective primer combinations used to screen genetic diversity in Tradescantia occidentalis. EcoRI primers are fluorescent labeled, E-ACT and E-ACA with FAM (blue), and E-ACC with NED (yellow).
Primer Type Primer Name Oligonucleotide Sequence
EcoRI-F CTC GTA GAC TGC GTA CC EcoRI Adapter EcoRI-R AAT TGG TAC GCA GTC MseI-F TAC TCA GGA CTC AT MseI Adapter MseI-R CAG GAT GAG TCC TGA G EcoRI GAC TCG GTA CCA ATT CA Pre-selective Primers MseI GAT GAG TCC TGA GTA AC
Selective Primers – 1 E-ACT/M-CTG E-GAC TGC GTA CCA ATT CAC T/ M-GAT GAG TCC TGA GTA ACT G
Selective Primers – 2 E-ACA/M-CAG E-GAC TGC GTA CCA ATT CAC A/ M-GAT GAG TCC TGA GTA ACA G
Selective Primers – 8 E-ACC/M-CTA E-GAC TGC GTA CCA ATT CAC C/ M-GAT GAG TCC TGA GTA ACT A
were heated at 70˚C for 15 minutes and cooled prior to the ligation reaction. Ligation
included 25.0 μl restriction enzyme digest, 24.0 μl adapter-ligation solution, and 1.0 μl
T4 DNA ligase (Invitrogen). The adapter-ligation solution contained the following
ingredients: 1.0 μl MseI adapter (20 μM) (Invitrogen), 1.0 μl EcoRI adapter (2 μM)
(Invitrogen), 0.96 μl ATP (10 mM) (Fermentas), 2.4 μl One-Phor-All Buffer, and 18.64
μl dH20. The ligation reaction was conducted at 20˚C for two hours then placed on ice.
Samples were diluted ten times in T0.1E buffer and stored at -20˚C. The T0.1E buffer
was made of 1 mL 1.0 M Tris pH 8.0, 20 μl 0.5 M EDTA pH 8.0, and 98.9 mL dH20.
The pre-selective PCR was performed with the following components: 2.5 μl
diluted ligation template, 40 μl pre-selective primer mix, 5 μl 10X Taq buffer, 1.5 μl 50
mM MgCl2, 0.2 μl Taq, and 0.8 μl dH2O. The pre-selective primer mix included 10 μl
MseI pre-selective primer (300 ng/μl) (Invitrogen), 10 μl EcoRI pre-selective primer
(300 ng/μl) (Invitrogen), 800 μl dNTP (1.25 mM each) (Invitrogen), and 3180 μl dH2O.
Sequences of the pre-selective primers are provided in Table 5.1. The conditions of the
pre-selective PCR were as follows: denaturing for 30s at 94˚C, annealing for 60s at

65
56˚C, and extension for 60s at 72˚C for 20 cycles. The reactions were held at 4˚C upon
completion. Products of the pre-selective PCR were diluted 50 times in T0.1E Buffer
and stored at -20˚C until use in the selective PCR.
The selective PCR mixture included the following components: 2.5 μl diluted pre-
selective product, 2.0 μl 10X Taq buffer, 0.6 μl 50 mM MgCl2, 1.0 μl fluorescent-
labeled EcoRI primer (Applied Biosystems), 1.0 μl MseI primer (Applied Biosystems),
3.5 μl dNTP, 0.2 μl Taq, and 9.2 μl dH2O. The sequences of the selective primers are
provided in Table 5.1. Reaction conditions for the selective PCR were as follows:
denaturing for 60s at 94˚C, annealing for 60s at 65˚C, and extension for 90s at 72˚C,
repeated for ten cycles, decreasing the annealing temperature by 1˚C per cycle, followed
by 23 cycles of denaturing for 30s at 94˚C, annealing for 30s at 56˚C, and elongation for
60s at 72˚C. Reactions were held at 4˚C upon completion.
Products of the selective PCR were visualized in an automated ABI Prism 377
DNA Sequencer (Applied Biosystems) using GeneScan software v.3.1. A
polyacrylamide gel composed of 13.5 g urea, 19.5 mL dH20, 3.75 mL Long Ranger
(50%) (Cambrex Biosciences), and 3.75 mL 10X TBE was prepared to visualize the
AFLP products. A proportion (0.7 μl) of selective PCR product was added to 1.7 μl
loading buffer. A total of 2.0 μl was loaded into a polyacrylamide gel and
electrophoresed in the automated sequencer for 2.5 h with the GeneScan software.
5.2.4 Data Analysis
The raw data generated by GeneScan included chromatograms and tables
summarizing the peak size, height, and area. Chromatograms were chosen over band

66
images as a scoring system because of the time and computer programs required to
convert GeneScan results to images. In addition, it was decided that the ratio of signal
to interference associated with chromatograms would be equal in the band images. The
peaks were analyzed, scored as present or absent, and entered into a Microsoft Excel
matrix. For consistency, band patterns from several gels were compared and peaks were
numbered according to their relative position and pattern. The size, height, and area of
peaks on the chromatograms could not be used to score the bands because these
characters vary with gel conditions. Ambiguous bands, i.e. those that were very large or
only observed a few times, were not scored because their presence or absence was
attributed to lack of template or interference on the gel. The minimum height of bands
scored varied according to the amount of signal and height of known peaks, but
generally peaks with a height less than 200 units were not scored. Because all samples
could not be accommodated on the same gel and some had to be electrophoresed more
than once to obtain comparable results, several gels were prepared for each primer.
Statistical analysis was performed to compare intra- and interpopulation diversity.
Based on presence or absence of bands, genetic similarity dendrograms were created
using sequential, agglomerative, hierarchical, and nested (SAHN) clustering methods in
NTSYS-pc version 1.80 (Rohlf 1992). Dendrograms were constructed for each
population and primer using the Dice similarity coefficient and the complete and
unweighted pair group method with arithmetic mean (UPGMA) clustering methods.
The UPGMA method creates a distance matrix for the smallest distance element and
joins operational taxomonic units (OTUs) at an internal node assuming equal rates of
evolution along all dendrogram branches (Avise 1994). Both the UPGMA and NJOIN

67
methods assume that characters are homologous and independent (Avise 1994). The
dissimilarity matrices were also used for principal coordinate analysis (PCOORDA),
which was carried out using the DCENTER and EIGEN programs of NTSYS.
Dendrograms were created for each population and the combination of the five
populations using the three individual primers as well as for combined primers and
populations.
In the remaining statistical analysis involving NTSYS, band frequency data was
calculated as the occurrence of a particular band in a population. This data was used to
create genetic distance matrices in SIGMEND, which computes matrices of genetic
distance coefficients, for each primer and for the combination of primers using the
NEI172 coefficient, a measure of Nei’s genetic distance. Dendrograms and neighbour
joining trees were created in SAHN and NJOIN, respectively. The NJOIN method
produces estimated phylogenetic trees based on Saitou and Nei’s neighbour joining
method and allows for unequal rates of evolution among branches by constructing a
transformed distance matrix at each step of the analysis (Avise 1994). For primers one,
two, and the combined primers, the trees were weighted using the midpoint joining
method; however, this method resulted in error messages for primer eight. As a result,
these trees were unweighted and the Alberta population was chosen as the outgroup
because it is the most geographically distant from the other Canadian and American
populations of Tradescantia occidentalis. It is recognized that this choice may have
some effect on the placement of the Alberta population relative to the other Canadian
populations and that accessions from the United States of America would have been a
better alternative for rooting purposes. However, representative samples from the

68
United States were not available for study. As a result, the interpretation of the
interpopulation results largely excludes primer eight. ArcGIS based plots created in
ArcGIS v.9.1 were obtained through GIS Services of the University of Saskatchewan for
comparison of dendrogram topology and geographic distribution within populations.
5.3 Results
A total of 62 of 83 (75%) reliable bands detected with the three primer sets were
polymorphic. The highest numbers of polymorphic bands were observed in the three
Manitoba populations, while lower values prevailed in Saskatchewan and Alberta (Table
5.2).
Table 5.2. Number and percentage of polymorphic bands detected with three primers in the five populations of Tradescantia occidentalis.
Manitoba Population Saskatchewan Routledge MHHC Lauder
Alberta All Populations
# Bands 28 (33%) 49 (59%) 59 (71%) 43 (52%) 34 (41%) 62 (75%)
5.3.1 Intrapopulation Diversity
The dendrograms obtained in the SAHN analysis show different relationships
among samples for each primer. Only SAHN dendrograms using the complete
clustering method and Dice’s coefficient are considered here because the relationships
depicted in the trees obtained using the UPGMA method were unresolved. The number
of boxes on the terminal dendrogram branches is equal to the number of geographical
subpopulations within a population. For example, in Saskatchewan, there are four
subpopulations (PFRA north, PFRA south, Highway 19, and Douglas) (Fig. 5.2E);

69
therefore the dendrograms were arbitrarily grouped into four clusters (Fig. 5.2A-D).
This was purposely done in each population to test whether the individuals form clusters
as part of the dendrogram topology matched the geographic distribution of individuals in
the ArcGIS plots.
5.3.1.1 Saskatchewan Population
Based on three primers, the levels of genetic similarity in the Saskatchewan
population range from 0.64 to 1.00 (Fig. 5.2A-D). Primer two shows the lowest
similarity level (0.64) (Fig. 5.2B), while primer one and the combined primers provide
the greatest distinction among individuals with similarity coefficients of 0.84 and 0.85,
respectively (Fig. 5.2A, D). The highest number (17) of genetically identical individuals
is observed with primer eight (Fig. 5.2C), but several accessions also exhibit genetic
similarity of 1.00 with each primer. The hypothesis that the four subpopulations in the
Saskatchewan population are genetically different can be tested based on dendrogram
topology. The clusters obtained with the AFLP data do not support the geographic plot
of the accessions of Tradescantia occidentalis (Fig. 5.2E); thus indicating that at the
genetic level, the four spatially separated subpopulations form a single, relatively
uniform entity.
5.3.1.2 Routledge (Manitoba) Population
The genetic similarity coefficients in the Routledge population range from 0.48
(primer eight) to 0.63 (primer two) to 0.72 (combined primers) to 0.87 (primer one)

70
Figure 5.2. Dendrograms showing genetic similarity in SAHN using complete clustering and an ArcGIS based plot for the Saskatchewan population of Tradescantia occidentalis. A. Primer one. B. Primer two. C. Primer eight. D. Combined primer sets one, two and eight. E. ArcGIS based plot showing the four subpopulations and geographic distribution of individuals.
A B
C D
E
Douglas
PFRA North
PFRA South
Highway 19
4142 54 56 58 44 43 55 45 50 59 47 46 48 51 60 49 52 53 57
0.84 0.88 0.92 0.96 1.00 Coefficient
41 42 43 45 58 56 57 46 47 49 51 44 50 53 55 48 54 52 60 59
0.64 0.73 0.82 0.91 1.00 Coefficient
41 42 43 60 44 46 54 55 52 51 50 47 48 58 45 53 56 59 57 49
0.89 0.92 0.94 0.97 1.00 Coefficient
41 43 56 58 55 42 54 44 45 50 46 47 48 51 49 53 57 52 59 60
0.85 0.88 0.92 0.95 1.00 Coefficient

71
Figure 5.3. Dendrograms showing genetic similarity in SAHN using complete clustering and ArcGIS based plot for the Routledge (Manitoba) population of Tradescantia occidentalis. A. Primer one. B. Primer two. C. Primer eight. D. Combined primer sets one, two, and eight. E. ArcGIS based plot showing the geographic distribution of individuals.
6163 65 83 62 82 64 68 78 66 67 85 79 70 69 80 86 77 81 87
0.87 0.90 0.94 0.97 1.00 Coefficient
6162 63 68 65 77 64 69 66 78 67 79 82 80 81 83 70 85 86 87
0.63 0.71 0.80 0.89 0.97 Coefficient
61 69 85 86 87 78 81 80 63 77 79 64 82 68 65 66 70 67 62 83
0.48 0.60 0.71 0.83 0.94 Coefficient
61 63 65 62 68 82 66 79 67 70 64 69 77 86 87 78 80 81 83 85
0.72 0.76 0.81 0.86 0.91 Coefficient
A B
C D
E

72
(Fig. 5.3A-D). The maximum number of individuals with a genetic similarity index of
1.00 is three with primer one, which is lower than the Saskatchewan population. The
hypothesis that the individuals on the two sand hill formations are genetically distinct
can be tested in this population. Indeed, clustering of individuals within the
dendrograms is in two major groups (Fig. 5.3A-D); however, the ArcGIS plot of the
accessions of Tradescantia occidentalis (Fig. 5.3E) are not congruent with the clades
based on genetic similarity. Thus, it can be said that the Routledge population,
distributed over the two sand ridges, is one population in terms of genetic similarity,
even though a relatively large number of polymorphic sites and high levels of genetic
diversity are detected.
5.3.1.3 MHHC (Manitoba) Population
The levels of genetic similarity in the MHHC population are the lowest among all
of the Canadian populations, ranging from 0.40 (primer eight) to 0.67 (primer one) to
0.69 (primer two and combined) (Fig. 5.4A-D). The highest number (13) of genetically
identical individuals is seen with primer two (Fig. 5.4B). It is difficult to propose a
hypothesis regarding the genetic distinctness of clusters in this population because of the
small number of individuals and the area to which this population is restricted. Both the
dendrogram and the ArcGIS based plot show individuals divided into two broad groups;
however, these clusters are not congruent with each other (Fig. 5.4A-E). The highest
levels of polymorphisms are found in the MHHC population, which is an unexpected
result because of the small size of this population. Generally, smaller populations are
expected to have lower levels of polymorphisms due to inbreeding and genetic drift.

73
Figure 5.4. Dendrograms showing genetic similarity in SAHN using complete clustering for the MHHC (Manitoba) population of Tradescantia occidentalis. A. Primer one. B. Primer two. C. Primer eight. D. Combined primer sets one, two and eight. E. ArcGIS based plot showing the geographic distribution of individuals in the MHHC population.
91 94 97 98 101 95 102 103 107 92 109 110 99 93 106 104 105 96 108 100
A
C D
91 92 93 94 97 95 96 98 99 100 101 107 104 105 108 109 102 103 106 110 0.67 0.75 0.83 0.92 1.00
Coefficient
91 93 94 92 95 96 99 100 103 107 105 97 98 101 108 102 104 106 109 110
0.69 0.77 0.85 0.92 1.00 Coefficient
91 94 97 98 101 95 102 103 107 92 109 110 99 93 106 104 105 96 108 100
91 94 97 95 98 92 93 96 99 100 109 104 108 105 106 101 102 103 107 110
0.69 0.76 0.83 0.90 0.97 Coefficient
A B
C D
E
0.40 0.55 0.70 0.85 1.00 Coefficient

74
5.3.1.4 Lauder (Manitoba) Population
Relatively high levels of genetic diversity were also observed in the Lauder
population. The values of genetic similarity range from 0.48 (primer eight) to 0.62
(primer one) to 0.68 (combined) to 0.74 (primer two) (Fig. 5.5A-D). The highest
number (11) of genetically identical samples is seen with primer two (Fig. 5.5B). It can
be hypothesized that individuals on opposite ends of the dune are less genetically similar
than individuals that are physically closer. In spite of the small population size, a high
number of polymorphisms are present and the dendrograms obtained from the analyses
of this population separate individuals into two main clusters. Nonetheless, the
geographic distribution of accessions of Tradescantia occidentalis plotted in ArcGIS
based maps follows the shape of the dune formation. This is incongruent with the
dendrogram clades (Fig. 5.5A-D), which show no evident separation of the population
into subgroups (Fig. 5.5E).
5.3.1.5 Alberta Population
Analyses of the AFLP data show that Alberta population has the lowest genetic
variation among the five Canadian populations. This is a reflection of the lower number
of polymorphic sites. The indices range from 0.73 (primers two and eight) to 0.84
(combined) to 0.85 (primer one) (Fig. 5.6A-D). The highest number (11) of individuals
with 100% genetic similarity is observed with primer two (Fig 5.6B). Like in the
Lauder (Manitoba) population, based on the local distribution of the Alberta population,
it can be hypothesized that individuals located at opposite ends of the population will be
less similar genetically than closely situated plants. An ArcGIS plot of the accessions of

75
Figure 5.5. Dendrograms showing genetic similarity in SAHN using complete clustering and an ArcGIS based plot for the Lauder (Manitoba) population of Tradescantia occidentalis. A. Primer one. B. Primer two. C. Primer eight. D. Combined primer sets one, two, and eight. E. ArcGIS based plot showing the geographic distribution of individuals.
111 112 113 119 128 120 114 118 127 116 117 124 115 133 122 123 125 130 129 131
0.62 0.72 0.81 0.91 1.00 Coefficient
A 111 113 127 114 116 123 128 121 112 115 118 120 125 117 124 119 133 129 130 131
0.74 0.81 0.87 0.94 1.00 Coefficient
111 115 127 120 118 112 113 114 116 117 119 122 123 124 125 128 129 131 133 130
0.48 0.61 0.74 0.87 1.00 Coefficient
B
C 111 115 118 127 120 112 113 119 128 114 116 117 122 123 124 125 129 131 130 133
0.68 0.76 0.83 0.91 0.98 Coefficient
D
E

76
Figure 5.6. Dendrograms showing genetic similarity in SAHN using complete clustering and an ArcGIS based plot of the Alberta population of Tradescantia occidentalis. A. Primer one. B. Primer two. C. Primer eight. D. Combined primer sets one, two, and eight. E. ArcGIS based plot showing the geographic distribution of individuals.
141 143 142 157 154 156 158 147 146 152 148 150 144 149 151 145 159 160 161 162
0.73 0.80 0.87 0.93 1.00 Coefficient
141142 154 147 150 144 145 149 159 162 161 160 143 151 156 157 146 148 152 158
0.84 0.87 0.91 0.95 0.98 Coefficient
D
A
C
E
B
0.85 0.88 0.92 0.96 1.00 Coefficient
141 161 159 162 142 144 154 147 143 146 145 149 150 158 151 152 156 157 160 148
0.73 0.80 0.87 0.93 1.00 Coefficient
141 142 144 147 154 145 149 150 157 146 159 162 161 148 160 143 151 156 152 158

77
Tradescantia occidentalis in the Alberta population shows a scattered distribution (Fig.
5.6E), which is discordant with the dendrogram topologies (Fig. 5.6A-D).
5.3.2 Interpopulation Diversity
Interpopulation diversity is important in conservation genetics because it shows
the extent to which populations have differentiated. Based on the combined analyses
including the data set from the individual and combined primers of the five populations,
the following inferences can be made. First, although the individual primers do not
provide enough information to separate all of the Canadian populations from each other,
primers one and two group 35% and 55% of the individuals within the MHHC (Fig. 5.7)
and Lauder (Fig. 5.8) populations, respectively. Likewise, the polymorphisms generated
with primers one (Fig. 5.7) and two (Fig. 5.8) distinguish 45% and 85% of the
individuals in the Routledge population. Similarly, even though primer eight does not
clearly differentiate among all populations, it distinguishes 70%, 40%, and 35% of
individuals from the Saskatchewan, Alberta, and MHHC populations (Fig. 5.9), in that
order.
On the other hand, the additive effect of the number of polymorphic sites is
evident in the combined analysis, in which 100%, 90%, and 85% of the Alberta,
Routledge, and Saskatchewan populations form separate clusters. This indicates their
genetic distinctness (Fig. 5.10), which can be explained due to the higher levels of
genetic diversity. However in this analysis, only 62.5% of MHHC and Lauder samples
cluster together (Fig. 5.10). Overall, the combined analysis integrates the highest

78
Figure 5.7. Dendrogram showing genetic similarity in SAHN using complete clustering for primer one. The analysis includes accessions from the five Canadian populations of Tradescantia occidentalis. Red = Saskatchewan (SK), Pink = Routledge (RT), Dark Blue = MHHC (MH), Light Blue = Lauder (LD), Green = Alberta (AB).
Figure 5.8. Dendrogram showing genetic similarity in SAHN using complete clustering for primer two. The analysis includes accessions from the five populations of Tradescantia occidentalis. Red = Saskatchewan (SK), Pink = Routledge (RT), Dark Blue = MHHC (MH), Light Blue = Lauder (LD), Green = Alberta (AB).
0.52 0.64 0.76 0.88 1.00 Coefficient
RT
LD
AB
0.59 0.69 0.80 0.90 1.00 Coefficient
RT
AB

79
Figure 5.9. Dendrogram showing genetic similarity in SAHN using complete clustering for primer eight. The analysis includes accessions from all the five Canadian populations of Tradescantia occidentalis. Red = Saskatchewan, Pink = Routledge, Dark Blue = MHHC, Light Blue = Lauder, Green = Alberta.
Figure 5.10. Dendrogram showing genetic similarity in SAHN using complete clustering for combined primers. The analysis includes the accessions from the five Canadian populations of Tradescantia occidentalis. Red = Saskatchewan, Pink = Routledge, Dark Blue = MHHC, Light Blue = Lauder, Green = Alberta.
MH
0.35 0.51 0.67 0.84 1.00 Coefficient
MH
SK
AB
0.64 0.72 0.81 0.90 0.99 Coefficient
RT
LD
AB
SK
LD
LD
MH
MH

80
number of polymorphisms, which provides the most informative clustering of individual
populations to infer their degree of genetic relationship.
Based on the dendrograms obtained from the SAHN analysis, primer one suggests
that the three Manitoba populations are the most genetically similar, forming a separate
cluster from that of the Saskatchewan and Alberta populations (Fig. 5.11A). In the same
way, the analyses of primer two and combined primers indicate that the Saskatchewan
and Alberta populations are more closely related to the Lauder and MHHC populations
than to the Routledge population (Figs. 5.11B, D). Further, the small genetic distances
indicate the proximity of the Manitoba populations to each other relative to the
Saskatchewan and Alberta populations (Table 5.3). The genetic distance matrices
obtained for primers one, two, eight, and the combined primers are provided in Tables
5.3, 5.4, 5.5, and 5.6, respectively, and suggest that the Manitoba populations are more
closely related.
Table 5.3. Nei’s genetic distance for primer one calculated in SIGMEND below the diagonal and approximate geographic distance (km) between Canadian populations of Tradescantia occidentalis above the diagonal.
Population Routledge MHHC Lauder Alberta Saskatchewan Routledge 83 81 804 524
MHHC 0.04030 2.5 868 460 Lauder 0.02983 0.02050 868 460 Alberta 0.06814 0.04662 0.03565 519
Saskatchewan 0.05478 0.02817 0.02323 0.01224 Table 5.4. Nei’s genetic distance calculated in SIGMEND for primer two among Canadian populations of Tradescantia occidentalis.
Population Routledge MHHC Lauder Alberta Saskatchewan Routledge 0.00000
MHHC 0.15019 0.00000 Lauder 0.19921 0.044241 0.00000 Alberta 0.16608 0.044189 0.05144 0.00000
Saskatchewan 0.15547 0.003388 0.04411 0.04452 0.00000

81
Figure 5.11. SAHN dendrograms using Nei’s genetic distance and complete clustering for the five Canadian populations of Tradescantia occidentalis. A. Primer one. B. Primer two. C. Primer eight. D. Combined primer sets one, two and eight.
Routledge
MHHC
Lauder
Alberta
Sask
0.01 0.03 0.04 0.05 0.07 Coefficient
A Routledge
MHHC
Sask
Lauder
Alberta
0.00 0.05 0.10 0.15 0.20 Coefficient
B
Routledge
Lauder
Alberta
MHHC
Sask
0.03 0.10 0.16 0.22 0.29 Coefficient
C Routledge
MHHC
Lauder
Alberta
Sask
0.04 0.06 0.08 0.10 0.12 Coefficient
D

82
Table 5.5. Nei’s genetic distance calculated in SIGMEND for primer eight among Canadian populations of Tradescantia occidentalis.
Population Routledge MHHC Lauder Alberta Saskatchewan Routledge 0.00000
MHHC 0.07506 0.00000 Lauder 0.06612 0.13779 0.00000 Alberta 0.06822 0.16118 0.03258 0.00000
Saskatchewan 0.24867 0.28674 0.18244 0.21746 0.00000 Table 5.6. Nei’s genetic distance calculated in SIGMEND for combined primers among Canadian populations of Tradescantia occidentalis.
Population Routledge MHHC Lauder Alberta Saskatchewan Routledge 0.00000
MHHC 0.07185 0.00000 Lauder 0.08168 0.05280 0.00000
Alberta 0.09340 0.07220 0.03922 0.00000
Saskatchewan 0.12415 0.07906 0.06452 0.06272 0.00000
The neighbour joining trees also support the relationships obtained using the
SAHN method. Primer one provides the most logical assessment of the putative genetic
relationships among the populations. For example, the Manitoba populations form a
single cluster separated from the Alberta and Saskatchewan entities (Figs. 5.11A,
5.12A). Primers two and the combined primers show the Lauder population to be more
closely related to those of Alberta and Saskatchewan, followed by MHHC and
Routledge (Fig. 5.12B-D). This is comparable with the relationships obtained from the
SAHN dendrograms based on Nei’s genetic distance (Fig. 5.10). The apparently close
relationship between the Alberta and Saskatchewan populations is also supported by
both analyses (Fig. 5.10). Finally, a principal coordinate analysis (PCOORDA) of the
Tradescantia occidentalis AFLP data was performed to compare genetic relationships.
However, the results from this analysis are excluded because they were not informative.

83
Figure 5.12. Neighbour joining trees using Nei’s genetic distance for the five Canadian populations of Tradescantia occidentalis. A. Primer one. B. Primer two. C. Primer eight. D. Combined primer sets one, two and eight.
Routledge
Lauder
MHHC
Sask
Alberta
0.00 0.01 0.03 0.04 0.06 Coeffiicient
A Routledge
MHHC
Sask
Lauder
Alberta
0.00 0.02 0.05 0.07 0.09 Coefficient
B
Routledge
MHHC
Lauder
Sask
Alberta
0.00 0.05 0.09 0.14 0.19 Coefficient
C Routledge
MHHC
Lauder
Alberta
Sask
0.00 0.01 0.03 0.04 0.06 Coefficient
D

84
5.4 Discussion
In plants there appears to be a wide range in the proportion of polymorphic AFLP
loci per population, from a low of 4.2% in Helianthus annuus L. (Asteraceae)
(Hongtrakul et al. 1997) up to 85% in Poa arachnifera Torr. (Poaceae) (Renganayaki et
al. 2001). For Tradescantia occidentalis, the percentage of polymorphism within a
population ranges from 33% in Saskatchewan to 71% in the MHHC population (Table
5.2). This illustrates that the level of polymorphisms detected in this study is analogous
to other AFLP data in plants. Similarly, the total number of polymorphic bands among
the five populations of T. occidentalis is 62 (75%) (Table 5.2), an estimate that is
comparable to other AFLP studies of genetic diversity showing polymorphism rates
between 56% in the Salicaceae (Winfield et al. 1998) and 91% in the Apiaceae (Gaudeul
et al. 2000).
5.4.1 Intrapopulation Diversity
The levels of intrapopulation genetic diversity obtained with Dice’s similarity
coefficient in all populations of Tradescantia occidentalis ranged from 0.40-1.00.
Although this type of data is not available in the literature for Tradescantia or other
commelinoid taxa, comparable levels have been reported in wild plants in the Fabaceae
(Travis et al. 1996) and Palmaceae (Perera et al. 1998). Only two individuals belonging
to the Saskatchewan population appeared to be genetically identical based on data of the
combined primers. This finding is relevant because it demonstrates that AFLPs have
sufficient resolution to distinguish individuals in the same population and that low levels
of diversity observed are not due to the inability of the combined primers to detect
variation.

85
Levels of genetic similarity in the Saskatchewan and Alberta populations are
relatively high and range from 0.64-1.00 (Fig. 5.2A-D) and 0.73-1.00 (Fig. 5.6A-D),
respectively. Similarly, low levels of genetic diversity have been reported in the
Theaceae (Paul et al. 1997). The null hypothesis that individuals in the four
subpopulations of Tradescantia occidentalis in Saskatchewan are genetically distinct is
rejected based on analysis of the AFLP data (Fig. 5.2A-E). Likewise, the null
hypothesis that individuals in the Alberta population isolated by distance are more
genetically distinct is also rejected based on the analysis of AFLP data. In the Alberta
population, the clusters do not show a relationship with the distribution of individuals on
the landscape (Fig. 5.6A-E). Individuals separated by over a kilometre (i.e. accessions
142 and 154) appear to be more genetically similar to each other than individuals less
than 200 m apart (i.e. 146 and 148) based on data from primer one and the combined
analysis (Fig. 5.6A, D).
Neither population appears to be well structured, but rather each reflects panmixia,
the free exchange of genetic material through outcrossing of individuals within a
population. In Saskatchewan, the area separating Douglas, PFRA north and south, and
Highway 19 contains suitable habitat for Tradescantia occidentalis (K. Remarchuk,
pers. obs.), which may mean that subpopulations of this species remain undiscovered. In
both Saskatchewan and Alberta, this means that although there is relatively little
intrapopulation genetic diversity, pollen or propagule transfer occurs, even in the most
distantly separated areas. Alternatively, in Saskatchewan the separation could have been
too recent to detect any differentiation among subpopulations.
The values of Dice’s similarity coefficients indicate relatively low levels of
genetic diversity among individuals of the same population. It is plausible that these

86
populations have been separated from a larger continuous distribution, in the United
States for example, for a longer period of time than the Manitoba populations, and the
low levels of genetic diversity are perhaps a consequence of inbreeding and genetic drift.
In fact, it has been hypothesized that a species isolated in small patches that are
distributed over a wide geographic range will experience genetic drift and differentiation
(Godt and Hamrick 1993).
Genetic drift, the random change in allelic frequency over time as a result of
chance (Beebee and Rowe 2004), causes a decrease in intrapopulation variability and an
increase in interpopulation differentiation (Ellstrand and Elam 1993). However, through
gradual inbreeding, natural selection tends to remove recessive lethal alleles expressed
as homozygotes without compromising the viability of a population (Lande 1999). Both
inbreeding and genetic drift are natural processes affecting isolated and particularly
small populations and may lead to a loss of adaptability under extreme circumstances.
The majority of the Canadian populations of Tradescantia occidentalis are isolated from
each other, and the low levels of genetic diversity observed in Saskatchewan and Alberta
indicate that genetic drift and inbreeding may be acting upon these populations. It is
important to note that low levels of genetic variability do not necessarily imply that there
is a lack of adaptive capability (Milligan et al. 1994).
Other factors, such as reproductive strategies like selfing or cleistogamy, may
explain the low levels of genetic variation in the Saskatchewan and Alberta populations
of Tradescantia occidentalis. It is plausible that rates of selfing may differ among the
populations. Although there is no record of autogamy in this species, several members
of the Commelinaceae reproduce with cleistogamous flowers (Faden 2000) or are known
to be self-compatible (Hrycan and Davis 2005). Some studies suggest that members of

87
the genus Tradescantia produce sterile offspring when selfed (Sinclair 1968) and many
members of the Tradescantieae tribe are self-incompatible (Owens 1981). Thus, the
likelihood of autogamy in T. occidentalis exists, but the rates may be low and resulting
offspring have the potential to be sterile.
An alternative hypothesis to explain the low levels of genetic diversity is the
founder effect. If Tradescantia occidentalis seeds were transported by humans,
intentionally or otherwise, the subsequent establishment and expansion from a few
founders may account for low levels of diversity in Alberta and Saskatchewan. This
idea has been used to account for low levels of diversity in other species (Husband and
Barrett 1991). Founder effects, particularly in unstable or changing environments, have
been reported to reduce genetic variation (Baskauf et al. 1994). However, this scenario
seems unlikely as there are no records of intentional introduction of this species to these
locations.
The Manitoba populations have the lowest similarity indices among the three
provinces. The intrapopulation genetic similarity ranges from 0.48-1.00 in the
Routledge (Fig. 5.3A-D) and Lauder populations (Fig. 5.5A-D), and 0.40-1.00 in the
MHHC population (Fig. 5.4A-D). These values concur with those observed in the
Meliaceae (Singh et al. 1999) and Fabaceae (Travis et al. 1996). A previous genetic
diversity study on Tradescantia hirsuticaulis involving different molecular markers and
analytical methods also reports high levels of variation (Godt and Hamrick 1993). For
the Manitoba populations, it was hypothesized that individuals form genetic groups
based on their geographic location. However, the dendrogram topologies (Figs. 5.3-
5.6A-D) do not support this hypothesis in any of the populations, suggesting that there is
a panmictic system operating in Manitoba as well.

88
The results of the MHHC population analysis are somewhat unusual because this
population is the smallest of the five Canadian populations, and has higher genetic
diversity compared to larger populations, such as those of Alberta and Saskatchewan.
This disagrees with studies in the Ranunculaceae, which state that smaller populations
do not maintain genetic diversity values of larger populations (Hensen et al. 2005).
However, other studies involving endangered plants in the Ericaceae have shown high
levels of intrapopulation variability despite small population size (Zawko et al. 2001).
5.4.2 Interpopulation Genetic Diversity
The majority of individuals from the Routledge, Saskatchewan, and Alberta
populations form discrete clusters in the combined analysis (Fig. 5.10). The intermixing
of individuals from the MHHC and Lauder populations is likely due to the ongoing
process of gene flow between these populations and shared polymorphic sites that are
similar in size but not necessarily homologous. According to SAHN analysis, the level
of genetic similarity among the five populations is relatively high (64%) indicating that
the populations have experienced low to moderate genetic differentiation. The
hypothesis regarding the lack of gene flow among the populations in Alberta, Manitoba,
and Saskatchewan is supported by the genetic similarity values and dendrogram
topology in SAHN (Fig. 5.10), in which the majority of individuals in the populations
form separate clusters. The same relationship is supported by the NJOIN analysis (Fig.
5.12 B, D).
Nei (1978) classified levels of genetic distance <0.05 as low, between 0.05 and
0.15 as medium, and >0.15 as high. According to this definition, the distances
calculated from primers two and eight in SAHN (Fig. 5.11B, D) are high. As indicated,

89
the primer with the most expected and reasonable results is primer one, from which it
can be concluded that there is some level of gene flow between MHHC and Lauder, but
not among the provinces (Figs. 5.11A, 5.12A).
The relatively low levels of genetic distance between Saskatchewan and Alberta
may be indicative of the historical distribution of this species and may be reflective of
one or a combination of the following scenarios: 1) the Canadian populations have not
been separated from the continuous distribution in the United States of America for a
period long enough for a significant amount of differentiation to occur, 2) that the AFLP
primers did not target sufficiently variable genomic regions to observe population
differentiation, or 3) that genetic similarity is inherently high in Tradescantia
occidentalis. It is also hypothesized based on these results that the populations of T.
occidentalis from Alberta and Saskatchewan separated from each other more recently
compared to the populations from Saskatchewan and Manitoba. Further investigation of
genetic variation in this species, including specimens from populations in the United
States, is required to test these hypotheses. This is especially important because it has
been shown that genetic variation does not always exist between geographically
restricted and widespread members of the same species (Karron et al. 1988), a
geographic pattern well-suited for T. occidentalis.
In the Commelinaceae, a genetic diversity study of Tradescantia hirsuticaulis
showed values of Nei’s genetic distance similar to the results of this study (Godt and
Hamrick 1993). As in T. hirsuticaulis, the lack of gene flow among T. occidentalis
populations can be attributed to the disjunct nature of the habitat and lack of specialized
pollinators. Genetic diversity studies in the Rubiaceae (Russell et al. 1999) and
Cupressaceae (Wang et al. 2004) report similar values of interpopulation genetic

90
distance. In addition, studies in other monocots, for example the Iridaceae, found
similar values of genetic distance among populations separated by large geographic
distances (Arafeh et al. 2002).
5.4.3 Conservation Genetics and Tradescantia occidentalis
Even if no immediate conservation action is required, understanding the genetic
structure of a population provides insight into the history of the species (Lacy 1988), and
the processes of speciation and adaptation, and population dynamics (Bussell 1999).
Genetic variability within populations may affect the evolutionary potential of a species
(Gaudeul et al. 2000), though the extent to which low genetic variability decreases the
potential of a species to adapt to environmental change has been debated (Milligan
1994). According to the results presented in this study, the low levels of genetic
diversity within the Canadian populations of Tradescantia occidentalis, especially
Saskatchewan and Alberta, are of future concern because of the potential implications
regarding high genetic similarity and a potential reduced ability to adapt to
environmental change. However, other estimates of genetic diversity are necessary to
confirm these findings with other primers or techniques because a single type of
molecular marker does not provide the best estimates of genome-wide variability in
organisms (Avise 1994).
The low levels of genetic variability observed in this study may also be related to
the AFLP technique, which yields fragments of the same size and are interpreted as
equal, even though they may be from a different genomic regions. Thus the issue of
analogy versus homology is in place (Deprés et al. 2003; Crawford and Mort 2004).
Because of this, the results provided here are preliminary and should be interpreted with

91
some caution until additional markers are explored. It is clear, however, that each
population has genetic distinctness as shown by the number of polymorphic sites. Thus,
some portions of the genome are unique to each population.
Canadian populations of Tradescantia occidentalis are isolated from each other
which means that there is no gene flow among populations across the prairie provinces.
In the genetic diversity study in T. hirsuticaulis, gene flow estimates within each
population are higher than among populations (Godt and Hamrick 1993). Though the
effective population size (Ne) in T. occidentalis is unknown, it can be assumed that Ne is
sufficient to prevent inbreeding depression because this value is generally much smaller
than the population size. This is a relevant issue because inbreeding depression can be
prevented in populations with effective population sizes greater than 50 unless severe
stress is applied (Lande 1999). At present, T. occidentalis does not appear to be at risk
of inbreeding depression; however, it would be a future concern because of the relatively
low levels of genetic diversity especially in the event of a dramatic decline in population
number.
High genetic differentiation among populations usually indicates a lack of gene
flow (Ellstrand and Elam 1993; Gaudeul et al. 2000) or a limited genetic pool due to
founder effects (Husband and Barrett 1991). Given the geographic distance among the
populations in Alberta, Saskatchewan and Manitoba, it is unlikely that gene flow is
operating among populations in different provinces though it is possible that pollinators,
for example bumble bees (Bombus sp. L.), may facilitate pollen transfer between the
Lauder and MHHC populations within Manitoba. Correlations between genetic distance
and geographic distance with gene flow have been found in the study on T. hirsuticaulis
(Godt and Hamrick 1993). In addition, studies in the Asteraceae have indicated that

92
there is an increased level of divergence in range edge populations (Jump et al. 2003),
which is a similar situation to the Canadian populations of T. occidentalis.
While Tradescantia occidentalis is not in immediate danger of extirpation, the
understanding of the genetic structure of populations is relevant in the event that one
population is eradicated. Restricted gene flow among populations may impair the future
survival capability of these populations because deleterious mutations may accumulate,
decreasing individual viability (Couvet 2002). According to the results of this study, in
the event of population decline, transplantations of individuals from other populations
should be implemented with caution because of the low to moderate level of
differentiation among populations. Outbreeding depression, the mating of individuals
from genetically differentiated populations, must be avoided because it results in the
break up of co-adapted gene complexes or the additive effects of alleles conferring
advantages under different environmental conditions (Beebee and Rowe 2004). The
MHHC population is very small relative to the other populations and because they are
closely related, individuals from Lauder may be used to augment the MHHC population
in case it is necessary.
The in situ protection of the current Tradescantia occidentalis populations in their
natural habitat remains the most viable conservation management strategy of this
threatened species. This includes control of invasive plant species, monitoring grazing,
and prevention of further fragmentation. It is important to consider, however, that
peripheral populations like T. occidentalis in Canada, are small, isolated, and occur in
ecologically marginal habitats and that these types of populations are subjected to more
stressful conditions (Lammi et al. 1999). Habitat fragmentation in plants is further
complicated because of the sessile habit of these plants and the dependence on vectors of

93
pollen and propagules for dispersal (Young et al. 1996). Fortunately, some of the
Canadian populations are already situated in protected areas. For example, Highway 19
and Douglas are protected in the Douglas Provincial Park, and in Manitoba, MHHC is
situated on Manitoba Habitat Heritage Corporation land. The populations that occur on
private land are respected by the landowners and thus, at the present time, are secure.
In addition to habitat protection, ex situ methods of conservation management of
Tradescantia occidentalis are recommended. Fitness components that are under
selection, including germination rate, seedling growth, and rate of seed production, are
important for the persistence of threatened species and therefore should be used as a
priority in setting conservation management goals (Lammi et al. 1999). For example,
creating a seed bank may be considered to store seeds of different genotypes in the event
of a drastic population decline. Seeds should be collected from each population to
maintain the genetic properties of each population. These seeds could then be grown in
a greenhouse and used to augment populations. Similar management strategies have
been implemented in various species (Liu et al. 2006) but its success is yet to be
determined. In Saskatchewan, the Plant Gene Resources of Canada (PGRC) project has
been created with the following objectives: 1) to collect seeds, including those from wild
plants, to maintain genetic diversity, 2) to develop protocols for ex situ regeneration of
wild plant species, 3) to determine seed germination and pollination requirements, and
4) to study seed longevity (PGRC 2006). A collaborative study with the PGRC would
be greatly beneficial to the ex situ conservation of T. occidentalis. In all, the
implementation of a seed bank will promote more research into seed viability, longevity,
and germination requirements of this species, which will lead to a more comprehensive
understanding of the ecological requirements of this species in Canada.

94
5.5 Concluding Remarks
Several final conclusions can be made from this research. In general, the
Tradescantia occidentalis populations in Saskatchewan and Alberta have lower levels of
intrapopulation genetic diversity than the three Manitoba populations. In addition, levels
of divergence were greater across the prairie provinces than among the closely situated
Manitoba populations. Overall, it can be concluded that there is no gene flow among the
provinces due to geographical isolation. This is a concern for the conservation of T.
occidentalis because it limits management strategies such as transplantation. Habitat
protection is the most viable strategy for maintaining T. occidentalis in Canada.
Along with studies dealing with the biological aspects of this species, future
molecular studies with additional markers should be undertaken to compare to the
results presented here. Likewise, a comparative study of the Canadian populations in
relation to populations in the United States of America is desirable to provide a better
indication of the expected levels of genetic diversity in Tradescantia occidentalis. This
study provides relevant information on the levels of genetic diversity in and among
Canadian populations of T. occidentalis and can be used as a model for further
investigation of this and other species at risk in Canada. Significant progress has been
made in this study, nevertheless, more information on the pollination and reproductive
biology of this species is required to fully understand pollen dispersal and viability,
breeding systems, and compatibility systems leading to a more comprehensive
understanding of T. occidentalis.

95
6. GENERAL CONCLUSIONS
This study of threatened populations of Tradescantia occidentalis can be used as a
model for future studies on species at risk in Canada. It encompassed demographic,
habitat, and plant community aspects associated with T. occidentalis. In addition, this
research explored the application of molecular techniques to investigate levels of genetic
variation and propose conservation management strategies. The main objectives were
fulfilled; however, additional questions arose that need to be addressed in the future.
Population size in Tradescantia occidentalis has been underestimated in previous
years. This is especially true in Saskatchewan and Alberta, where portions of these
populations remained undiscovered until a few years ago. In Manitoba, the population
sizes have remained relatively stable. It was previously thought that T. occidentalis
populations experienced dramatic fluctuations in size from year to year. However, our
results and research conducted by MCDC and PFRA illustrated that consistent sampling
methods show relatively small population fluctuations. Yearly monitoring is needed to
support this hypothesis; thus, long term monitoring of populations is necessary because
the habitat is relatively small and restricted to fragile environments with sandy substrate.
From the molecular results, it can be concluded that the Canadian populations of
Tradescantia occidentalis have naturally high levels of intrapopulation genetic
similarity, especially in Saskatchewan and Alberta. In contrast, it appears that there may
be gene flow among the Manitoba populations, in particular MHHC and Lauder, due to
higher levels of genetic diversity. The Saskatchewan and Alberta populations are the

96
greatest in size and therefore it is unlikely that either population is seriously threatened
by inbreeding depression. Based on the degree of differentiation obtained with these
results, it is hypothesized that the Canadian populations of Tradescantia occidentalis are
remnant of a larger continuous distribution and the Alberta and Saskatchewan
populations appear to have been separated from the main distribution for a longer period
than the Manitoba populations.
Despite the apparent stability of the populations, several factors must be
considered in future conservation and biodiversity programs. Foremost, the most
predominant threat to Tradescantia occidentalis is the presence of Euphorbia esula in
Saskatchewan and Manitoba. As encroachment of E. esula continues, dune stabilization
may cause a decline in T. occidentalis in Saskatchewan and Manitoba. However, in
Alberta, T. occidentalis grows primarily in sandy prairie with dense vegetation, so the
possibility exists that it may be able to adapt to those conditions in Saskatchewan and
Manitoba. Grazing is a concern in Saskatchewan and Alberta, though current grazing
regimes do not appear to have a negative impact on the Canadian populations.
Petroleum exploration is a concern in Alberta because it results in loss of T. occidentalis
habitat and has been proposed for the area containing this species.
Although all of the above factors must be considered in the conservation of
Tradescantia occidentalis, the primary conservation strategy should be to protect its
natural habitats. The significant levels of interpopulation genetic diversity suggest that
efforts should be made to conserve all of the Canadian populations and habitats across
the species’ range. Further exploration of genetic diversity using another technique, for
example microsatellites, will be instrumental in providing additional information on

97
genetic diversity of the Canadian populations and comparison with the genetic structure
of the American populations. Transplantation of individuals to augment populations is
unlikely to be successful because of population differentiation and could lead to
outbreeding depression. For transplantation to be a viable option, populations would
have to be genetically similar yet heterogeneous as to introduce more genetic variability.
Ex situ methods of conservation, such as the creation of a seed bank, should be
implemented prior to the event of a drastic population decline. Though the populations
are of considerable size, it is not recommended to change the national or provincial
rankings to vulnerable because of the limited number and isolation of the populations in
this country. Decreasing its conservation priority may lead to the decline of T.
occidentalis by promoting land use that is detrimental to this species. For example, oil
and gas exploration has been considered in the location of the Alberta population, but T.
occidentalis has been protected under Species at Risk legislation. Further research in
several areas, including reproductive biology, habitat and comparison of levels of
genetic diversity among populations in Canada and the United States of America is
required to better understand T. occidentalis.

98
7. LITERATURE CITED AESCC (Alberta’s Endangered Species Conservation Committee). 2005. List of
Species Currently Listed under the Wildlife Act [online]. Available from http://www3.gov.ab.ca/srd/fw/escc/aelist.html [cited 09 August 2005].
Ahmed, F.B, and Ismail, G. 2003. Medicinal plants used by Kadazandusun
communities around Crocker Rang. In ASEAN Review of Biodiversity and Environmental Conservation (ARBEC). Available from http://www.arbec.com.my/pdf/artljanmar03.pdf [cited 15 March 2006].
Alberta Western Spiderwort Recovery Team. 2004. Draft. Maintenance and recovery
plan for western spiderwort in Alberta 2005-2010. Alberta Sustainable Resource Development, Fish and Wildlife Division, Alberta Species at Risk Recovery Plan No. X. Edmonton, AB. pp 1-18.
Anderson, E. 1954. A field survey of chromosome numbers in the species of Tradescantia closely allied to Tradescantia virginiana. Ann. Missouri Bot. Gard. 41: 305-327.
—, and Sax, K. 1936. Cytological monograph of North American species of
Tradescantia. Bot. Gaz. 97: 433-476. ANHIC (Alberta Natural Heritage Information Center). 2004. Dry Mixed Grass
Subregion [online]. Available from http:/www.cd.gov.ab.ca/preserving/parks/anhic/drymixed grass.asp [cited 10 May 2005].
—. 2005. Element Occurrence Records for Tradescantia occidentalis [online]. Parks
and Protected Areas Division, Alberta Community Development, Edmonton, AB. [cited 05 July 2005].
Annerstedt, I., and Lundquist, A. 1967. Genetics and self-incompatibility in Tradescantia paludosa (Commelinaceae). Hereditas, 58: 13-30.
Arafeh, R.M., Sapir, Y., Shmida, A., Iraki, N., Fragman, O., and Comes, H.P. 2002. Patterns of genetic and phenotypic variation in Iris haynei and I. atrofusca (Iris sect. Oncocyclus= the royal irises) along an ecogeographical gradient in Israel and West Bank. Mol. Ecol. 11: 39-53.

99
Avise, J.C. 1994. Molecular Markers, Natural History and Evolution. Chapman and Hall, Inc. New York, NY.
Ayres, D.R., and Ryan, F.J. 1999. Genetic diversity and structure of the narrow endemic Wyethia reticulata and its congener W. bolanderi (Asteraceae) using RAPD and allozyme techniques. Am. J. Bot. 86: 344-353.
Baskauf, C.J., McCauley, D.E., and Eikmeier, W.G. 1994. Genetic analysis of a rare and widespread species of Echinacea (Asteraceae). Evolution, 48: 180-188.
Bayer, R.J. 1991. Patterns of clonal diversity in geographically marginal populations of Antennaria rosea (Asteraceae: Inlueae) from subarctic Alaska and Yukon Territory. Bot. Gaz. 152: 486-493.
Beebee, T.J.C., and Rowe, G. 2004. An Introduction to Molecular Ecology. Oxford University Press. Toronto, ON.
Bosch, M., and Waser, N.M. 1999. Effects of local density on pollination and reproduction in Delphinium nuttalianum and Acontinum columbianum (Ranunculaceae). Am. J. Bot. 86: 871-879.
Brenan, J.P.M. 1966. The classification of the Commelinaceae. Bot. J. Linn. Soc. 59: 349-370.
Brewbaker, J. 1957. Pollen cytology and self-incompatibility systems in plants. J. Hered. 48: 271-277.
Burns, J.H. 2004. A comparison of invasive and non-invasive dayflowers (Commelinaceae) across experimental nutrient and water gradients. Divers. Distrib. 10: 387-397.
Bussell, J.D. 1999. The distribution of random amplified polymorphic DNA (RAPD) diversity amongst populations of Isotoma petraea (Lobeliaceae). Mol. Ecol. 8: 775-789.
Camacho, F.J., and Liston, A. 2001. Population structure and genetic diversity of Botrychium pumicola (Ophioglossaceae) based on inter-simple sequence repeats (ISSR). Am. J. Bot. 88: 1065-1070.
Campbell, R.C. 1989. Statistics for biologists. Cambridge University Press, New York.
Cardoso, M.A., Provon, J., Powell, W., Ferreiras, P.C.G, deOliviera, D.E. 1998. High genetic differentiation among remnant populations of the endangered Caesalpinia echinata Lam. (Leguminosae-Caesalpinioideae). Mol. Ecol. 7: 601-608.

100
Chase, M.W. and Hill, H.H. 1991. Silica gel: An ideal material for field preservation of leaf samples for DNA studies. Taxon, 40: 215-220.
COSEWIC. 2005a. Species assessment. Committee on the Status of Endangered Wildlife in Canada [online]. Available from http://www.cosewic.gc.ca/eng/sct1/index_c.cfm [cited 05 January 2006].
—. 2005b. COSEWIC assessment and update status report on the branched phacelia Phacelia ramosissima in Canada. Committee on the Status of Endangered Wildlife in Canada. Ottawa. vi + 18 pp.
—. 2005c. COSEWIC assessment and update status report on the cliff paintbrush Castilleja rupicola in Canada. Committee on the Status of Endangered Wildlife in Canada. Ottawa. vi + 18 pp.
—. 2005d. COSEWIC assessment and update status report on the dense spike-primrose Epilobium densiflorum in Canada. Committee on the Status of Endangered Wildlife in Canada. Ottawa. vi + 26 pp.
—. 2005e. COSEWIC assessment and update status report on the false rue-anemone Enemion biternatum in Canada. Committee on the Status of Endangered Wildlife in Canada. Ottawa. vi + 19 pp.
—. 2005f. COSEWIC assessment and update status report on the white meconella Meconella oregana in Canada. Committee on the Status of Endangered Wildlife in Canada. Ottawa. vi + 25 pp.
Couvet, D. 2002. Deleterious effects of restricted gene flow in fragmented populations. Cons. Biol. 16: 369-376.
Crawford, D.J., and Mort, M.E. 2004. Single-locus molecular markers for inferring relationships at lower taxonomic levels: observations and comments. Taxon, 53: 631-635.
Cruzan, M. 1998. Genetic markers in plant evolutionary ecology. Ecology, 79: 400-412.
Culley, T.M., Wallace, L.E., Gengler-Nowak, K.M., and Crawford, D.J. 2002. A comparison of two methods of calculating GST, a genetic measure of population differentiation. Am. J. Bot. 89: 460-465.
DaSilva, G.A., DosSantos, B. A., Alves, M.V., and Maia, L.C. 2001. Arbuscular mycorrhiza in species of Commelinidae (Liliopsida) in the State of Pernambuco (Brazil). Acta Bot. Bras. 15: 155-165.
Deprés, L., Gielly, L., Redoutet, B., and Taberlet, P. 2003. Using AFLP to resolve phylogenetic relationships in a morphologically diversified plant species complex

101
when nuclear and chloroplast sequences fail to reveal variability. Mol. Phylogenet. Evol. 27: 185-196.
Ellstrand, N.C., and Elam, D.R. 1993. Population genetic consequences of small population size: Implications for plant conservation. Annu. Rev. Ecol. Syst. 24: 217-242.
Escaravage, N., Questiau, S., Pornon, A., Doche, B., and Taberlet, P. 1998. Clonal diversity in a Rhododendron ferrugineum L. (Ericaceae) population inferred from AFLP markers. Mol. Ecol. 7: 975-982.
Evans, T.M., Faden, R.B, Simpson, M.G., and Sytsma, K.J. 2000. Phylogenetic relationships in the Commelinaceae: I. A cladistic analysis of morphological data. Syst. Bot. 25: 668-691.
—, Sytsma, K.J., Faden, R.B., and Givnish, T.J. 2003. Phylogenetic relationships in the Commelinaceae: II. A cladistic analysis of rbcL sequences and morphology. Syst. Bot. 28: 270-292.
Excoffier, L., Smouse, P.E., and Quattro, J.M. 1992. Analysis of molecular variance inferred from metric distances among DNA haplotypes: Application to human mitochondrial DNA restriction data. Genetics, 131: 479-491.
Faden, R. 1992. Floral attraction and floral hairs in the Commelinaceae. Ann. Missouri Bot. Gard. 79: 46-52.
—. 1993. The misconstrued and rare species of Commelina (Commelinaceae) in the Eastern United States. Ann. Missouri Bot. Gard. 80: 208-218.
—. 2000. 207. Commelinaceae R. Brown – Spiderwort family. In Flora of North America: North of Mexico Edited by Flora of North America Editorial Committee. Oxford University Press, Oxford, NY. pp. 170-197.
—, and Hunt, D.R. 1991. The classification of the Commelinaceae. Taxon, 40: 19-31.
Gaudeul, M., Taberlet, P., and Till-Bottraud, I. 2000. Genetic diversity in an endangered alpine plant, Eryngium alpinum L. (Apiaceae), inferred from amplified fragment length polymorphisms. Mol. Ecol. 9: 1625-1637.
Godt, M.W., and Hamrick, J.L. 1993. Genetic diversity and population structure in Tradescantia hirsuticaulis (Commelinaceae). Am. J. Bot. 80: 959-966.
Godt, M.W., Hamrick, J.L. and Bratton, S. 1995. Genetic diversity in a threatened wetland species, Helonias bullata (Liliaceae). Cons. Biol. 9: 596-604.
Godwin, B. and Thorpe, J. 2004. Limited Report: PFRA Rare Plant Inventory Pilot Project. Saskatchewan Research Council. pp 1-56.

102
—, and —. 2005. Limited Report: Plant species at risk of four PFRA pastures, 2004. Saskatchewan Research Council. pp 1-52.
Goulet, S., and Kenkel, N. 1997. Habitat survey and management proposal for Manitoba populations of western spiderwort (Tradescantia occidentalis). Department of Botany, University of Manitoba, Winnipeg, MB.
Harms, V. L. 2003. Checklist of the Vascular Plants of Saskatchewan and the Provincially and Nationally Rare Native Plants in Saskatchewan. University Extension Press, University of Saskatchewan, Saskatoon. pp. 1-328.
Hensen, I., Oberprieler, C., and Wesche, K. 2005. Genetic structure, population size and seed production of Pulsatilla vulgaris Mill. (Ranunculaceae) in Central Germany. Flora, 200: 3-14.
Herrera, A. 1897. Yerba de pollo. Am. Jour. Pharm. 69: 290-294. Reviewed in Tucker, G.C. 1989. The genera of Commelinaceae in the Southeastern United States. J. Arnold Arbor. Harv. Univ. 70: 97-130.
Hofreiter, A., and Tillich, H.J. 2002. Root anatomy of the Commelinaceae (Monocotyledoneae). Feddes Repertorium, 113: 231-255.
Hongtrakul, V., Huestis, G.M., and Knapp, S.J. 1997. Amplified fragment length polymorphisms as a tool for DNA fingerprinting sunflower germplasm: Genetic diversity among oilseed in bred lines. Theor. Appl. Genet. 95: 400-407.
Hrycan, W.C., and Davis, A.R. 2005. Comparative structure and pollen production of the stamens and pollinator-deceptive staminodes of Commelina coelestis and C. dianthifolia (Commelinaceae). Ann. Botany, 95: 1113-1130.
Husband, B.C., and Barrett, S.C.H. 1991. Colonization history and population genetic structure of Eichornia paniculata in Jamaica. Heredity, 66: 287-296.
Jenczewski, E., Properi, J.M., and Ronfort, J. 1999. Differentiation between natural and cultivated populations of Medicago sativa (Leguminosae) from Spain: Analysis with random amplified polymorphic DNA (RAPD) markers and comparison to allozymes. Mol. Ecol. 8: 1317-1330.
Jones, K., and Jopling, C. 1972. Chromosomes and the classification of the Commelinaceae. Bot. J. Linn. Soc. 65:129-162.
Jump, A.S., Woodward, F.I., Burke, T. 2003. Cirsium species show disparity in patterns of genetic variation at their range-edge, despite similar patterns of reproduction and isolation. New Phytol. 160: 359-370.
Karp, A., Seberg, O., and Buiatti, M. 1996. Molecular techniques in the assessment of botanical diversity. Ann. Bot. 78: 143-149.

103
Karron, J.D., Linhart, Y.B., Chaulk, C.A., and Roberston, C.A. 1988. Genetic structure of populations of geographically restricted and widespread species of Astragalus (Fabaceae). Am. J. Bot. 65: 1114-1119.
Kenton, A. 1984. Chromosome evolution in the Gibasis linearis group (Commelinaceae) III. DNA variation, chromosome evolution, and speciation of G. venustula and G. heterophylla. Chromosoma, 90: 303-310.
Klinkhamer, P.G.L., and deJong, T.J. 1990. Effects of plant size, plant density and sex differential nectar reward on pollinator visitation in the protandrous Echium vulgare (Boraginaceae). Oikos, 57: 399-405.
Koopman, W.J. 2005. Phylogenetic signal in AFLP data sets. Syst. Bot. 54: 197-217.
—, Zevenbergen, M.M.J., and Van Den Berg, R.G. 2001. Species relationships in Lactuca s.l. (Lactucaceae, Asteraceae) inferred from AFLP fingerprints. Amer. J. Bot. 88: 1881-1887.
Lacy, R.C. 1988. A report on population genetics in conservation. Cons. Biol. 2: 245-247.
Lammi, A., Siikamäki, P., and Mustajärvi, K. 1999. Genetic diversity, population size, and fitness in central and peripheral populations of a rare plant Lychnis viscaria. Cons. Biol. 13: 1069-1078.
Lancaster, J. ed. 2000. Information Bulletin: ANPC Guidelines for Rare Plant Surveys in Alberta. Alberta Native Plant Council [online]. Available from http://www.anpc.ab.ca/ [cited 15 May 2005].
Lande, R. 1999. Extinction Risks. In Genetics and the extinction of species. Edited by L.F. Lancaster, and A.P. Dobson. Princeton University Press, Chichester, U.K. pp. 1-22.
Liu, Z., and Furnier, G.R. 1993. Comparison of allozyme, RFLP, and RAPD markers for revealing genetic variation within and between trembling aspen and big tooth aspen. Theor. Appl. Genet. 87: 97-105.
Liu, Y., Wang, Y., and Huang, H. 2006. High interpopulation genetic differentiation and unidirectional linear migration patterns in Myricaria laxiflora (Tamaricaceae), an endemic riparian plant in the Three Gorges Valley of the Yangtze River. Am. Jour. Bot. 93: 206-215.
Long, C., and Li, R. 2004. Ethnobotanical studies of medicinal plants used by the Red-headed Yao people in Jinping, Yunnan Province, China. J. Ethnopharmacol. 90: 389-395.

104
Mace, E.S., Lester, R.N., and Gebhardt, C.B. 1999. AFLP analysis of genetic relationships among the cultivated eggplant, Solanum melongena L., and wild relatives (Solanaceae). Theor. App. Genet. 99: 626-633.
Mariette, S., Chagné, D., Lézier, C., Pastuszka, P., Raffin, A., Plomion, C., and Kremer, A. 2001. Genetic diversity within and among Pinus pinaster populations: Comparison between AFLP and microsatellite markers. Heredity, 86: 469-479.
Martínez-Ortega, M.M., Delgado, L., Albach, D.C., Elena-Rosselló, J.A., and Rico, E. 2004. Species boundaries and phylogeographic patterns in cryptic taxa inferred from AFLP markers: Veronica subgen. Pentsepalae (Scrophulariaceae) in the Western Mediterranean. Syst. Bot. 29: 965-985.
McCune, B., and Grace, J.B. 2002. Analysis of ecological communities. MjM Software Design. Oregon, USA.
—, and Mefford, M.J. 1999. PC-ORD: Multivariate analysis of ecological data, Version 4. MjM Software Design. Oregon, USA.
MCDC (Manitoba Conservation Data Centre). 2005. Manitoba Endangered Species
Act [online]. Available from http://web2.gov.mb.ca/sonservation/cdc/species/ species.php?search_typeplant%search_text=western+spiderwort&action=Submit [cited 09 September 2005].
Milligan, B.G., Leebens-Mack, J., and Strand, A.E. 1994. Conservation genetics: Beyond the maintenance of marker diversity. Mol. Ecol. 3: 423-435.
Minja, M.M.J. 1999. The Masai wonder plants. In People and Plants: Training workshop at the Tropical Research Institute, Arusha Tanzania. 15-19 March 1999. Available from http://www.metafro.be/Members/jeanlehmann/Minja_W_Grey_Literature_PRELUDE.pdf [cited 15 March 2006].
Muluvi, G.M., Sprent, J.I., Soranzo, N., Provan, J., Odee, D., Folkard, S., McNicol, J.W., and Powell, W. 1999. Amplified fragment length polymorphism (AFLP) analysis of genetic variation in Moringa oleifera Lam. Mol. Ecol. 8: 463-470.
Murray, M.G., and Thompson, W.F. 1980. Rapid isolation of high molecular weight plant DNA. Nucleic Acids Res. 8: 4321-4325.
Nei, M. 1978. Estimation of average heterozygosity and genetic distance from a small number of individuals. Genetics, 89: 583-590.
—, and Li, W.H. 1979. Mathematical model for studying genetic variation in terms of restriction endonucleases. Proc. Natl. Acad. Sci. 76: 5269-5273.
Nybom, H. 2004. Comparison of different nuclear DNA markers for estimating intraspecific genetic diversity in plants. Mol. Ecol. 13: 1143-1155.

105
Owens, S.J. 1981. Self-incompatibility in the Commelinaceae. Ann. Botany, 47: 567-
581. —, and Horsfield, N.J. 1982. A light and electron microscopic study of stigmas in
Aneilema and Commelina species (Commelinaceae). Protoplasma, 112: 26-36. —, and Kimmins, F.M. 1981. Stigma morphology in the Commelinaceae. Ann.
Botany, 47: 771-783. —, and McGrath, S. 1984. Self-incompatibility and the pollen-stigma interaction in
Tradescantia ohiensis Rafin. Protoplasma, 121: 209-213. Pachkowski, J. 2002. Bio-control of leafy spurge in support of recovery of species at
risk, year II. Rural Development Institute, Brandon University, Brandon, MB. pp. 1-36.
Pandey, K.K. 1960. Evolution of gametophytic and sporophytic systems of self-
incompatibility in angiosperms. Evolution, 14: 98-115.
Paul, S., Wachira, F.N., Powell, W., and Waugh, R. 1997. Diversity and genetic differentiation among populations of Indian and Kenyan tea (Camellia sinensis (L.) O. Kuntze) revealed by AFLP markers. Theor. Appl. Genet. 94: 255-263.
Perera, L., Russell, J.R., Provan, J., McNicol, J.W., and Powell, W. 1998. Evaluating
genetic relationships between indigenous coconut (Cocos nucifera L.) accessions from Sri Lanka by means of AFLP profiling. Theor. Appl. Genet. 96: 545-550.
Peters, S. 2003a. Inventory of Western Spiderwort (Tradescantia occidentalis) in
Alberta, 2002. Alberta Sustainable Resource Development, Fish and Wildlife Division, Alberta Species at Risk Report No. 61. Edmonton, AB. pp 1-16.
—. 2003b. Inventory of Western Spiderwort (Tradescantia occidentalis) in Alberta,
2003. Alberta Sustainable Resource Development, Fish and Wildlife Division, Addendum to Species at Risk Report No. 61. Edmonton, AB. pp 1-12.
PGRC (Plant Gene Resources of Canada). Ex situ Conservation of Wild Plant Species at Plant Gene Resources of Canada, Agriculture and Agri-Food Canada. Available from http://www.agr.gc.ca/pgrc.rpc [cited 1 April 2006].
Pinkerton, E. 1936. Secondary root hairs. Bot. Gaz. 98: 147-158.
Powell, W., Morgante, M., Andre, C., Hanafey, M., Vogel, J., Tingey, S., and Rafalski, A. 1996. The comparison of RFLP, RAPD, AFLP, and SSR (microsatellite) markers for germplasm analysis. Mol. Breed. 2: 225-238.

106
Remarchuk, K.J. 2005. Western Spiderwort (Tradescantia occidentalis) Inventory in Alberta, 2005. Alberta Sustainable Resource Development, Fish and Wildlife Division, Alberta Species at Risk Report No. 102. Edmonton, AB.
Renganayaki, K., Read, J.C., and Fritz, A.K. 2001. Genetic diversity among Texas bluegrass genotypes (Poa arachnifera Torr.) revealed by AFLP and RAPD markers. Theor. Appl. Genet. 102: 1037-1045.
Ribeiro, M.M., Mariette, S., Vendramin, G.G, Szmidt, A.E., Plomion, C., and Kremer, A. 2002. Comparison of genetic diversity estimates within and among populations of maritime pine using chloroplast simple-sequence repeat and amplified fragment length polymorphism data. Mol. Ecol. 11: 869-877.
Rohlf, F.J. 1992. NTSYS-PC: Numerical Taxonomy and Multivariate Analysis System. Exeter Software, New York.
Russell, J.R., Weber, J.C., Booth, A., Powell, W., Sotelo-Mones, C., and Dawson, I.K. 1999. Genetic variation of Calycophyllum spruceanum in the Peruvian Amazon Basin, revealed by amplified fragment length polymorphism (AFLP) analysis. Mol. Ecol. 8: 199-204.
Saghai-Maroof, M.A., Soliman, K.M., Jorgensen, R.A, and Allard, R.W. 1986. Ribosomal DNA spacer-length polymorphisms in barley: Mendelian inheritance, chromosomal location, and population dynamics. Proc. Natl. Acad. Sci. 81: 8014-8018.
Sale, P.F. 1974. Overlap in resource use, and Interspecific competition. Oecologia, 17: 245-256.
Schubert, R., Mueller-Starck, G., and Riegel, R. 2001. Development of EST-PCR markers and monitoring their intrapopulation genetic variation in Picea abies (L.) Karst. Theor. Appl. Genet. 103: 1223-1231.
Schmitt, J. 1983. Flowering plant density and pollinator visitation in Senecio. Oecologia, 60: 9-102.
SERM (Saskatchewan Environment and Resource Management). 2005. Element
occurrence and observation summary report for Tradescantia occidentalis. [cited 11 May 2005].
Simpson, B.B., Neff, J.L., and Dieringer, G. 1986. Reproductive biology of Tinantia anomala (Commelinaceae). B. Torr. Bot. Club, 113: 149-158.
Sinclair, C.B. 1968. Pollination, hybridization, and isolation factors in the erect Tradescantias. B. Torr. Bot. Club, 95: 232-240.

107
Singh, A. Negi, M.S., Rajagopal, J., Bhatia, S., Tomar, U.K., Srivastava, P.S., and Lakshmikumaran, M. 1999. Assessment of genetic diversity in Azadirachta indica using AFLP markers. Theor. Appl. Genet. 99: 272-279.
Smith, B. 2001. Status of the Western Spiderwort (Tradescantia occidentalis) in Alberta. Alberta Environmental Protection, Fisheries and Wildlife Management Division, and Alberta Conservation Association. Alberta Wildlife Status Report No. 31. Edmonton, AB. pp.1-12.
—. 2002. Update COSEWIC status report on the western spiderwort Tradescantia occidentalis in COSEWIC assessment and update status report on the western spiderwort Tradescantia occidentalis in Canada. Committee on the Status of Endangered Wildlife in Canada. Ottawa, ON. pp. 1-25.
Standish, R.J. 2001. Prospects for biological control of Tradescantia fluminensis Vell. (Commelinaceae). Department of Conservation, Wellington, New Zealand. pp. 1-25.
Steenhagen, D.A., and Zimdahl, R.L. 1979. Allelopathy of leafy spurge (Euphorbia esula). Weed Science, 27: 1-3.
Stevens, O.A. 1932. The number and weight of seeds produced by weeds. Am. J. Bot. 19: 784-794.
Travis, S.E., Maschinski, J., and Keim, P. 1996. An analysis of genetic variation in Astragalus cremnophylax var. cremnophylax, a critically endangered plant, using AFLP markers. Mol. Ecol. 5: 735-745.
Tucker, G.C. 1989. The genera of Commelinaceae in the southeastern United States. J. Arnold Arbor. Harv. Univ. 70: 97-130.
Vos, P., Hogers, R., Bleeker, M., Reijans, M., van de Lee, T., Hornes, M., Frijters, A., Pot, J., Peleman, J., Kuiper, M., and Zabeau, M. 1995. AFLP: a new technique for DNA fingerprinting. Nucleic Acids Res. 23: 4407-4414.
Wang, L., Li, Z.C., Chiang, T., and Ge, X. 2004. Genetic diversity of Calocedrus macrolepis (Cupressaceae) in southwestern China. Bioch. Sys. Ecol. 32: 797-807.
Walters, M.S., and Gerstel, D.U. 1948. A cytological investigation of a tetraploid Rhoeo discolor. Am. J. Bot. 26: 141-150.
Weaver, J.E. 1958. Classification of root systems of forbs of grassland and a consideration of their significance. Ecology, 39: 393-401.
Weir, B.S. and Cockerham, C.C. 1984. Estimating F-statistics for the analysis of population structure. Evolution, 38:1358-1370.

108
Wild Species at Risk Regulations, R. R. S. c. w-13.11 Reg. 1. [Online. Last update on CanLII: 2005-08-01]. Available from http://www.canlii.org/sk/laws/regu/w13.11r.1/20050801/ whole.html [cited 08 August 2005].
Winfield, M.O., Arnold, G.M., Cooper, F., LeRay, M., White, J., Karp, A., and
Edwards, K.J. 1998. A study of genetic diversity in Populus nigra subsp. betulifolia in the Upper Severn area of the UK using AFLP markers. Mol. Ecol. 7: 3-8.
Woodson, R.E. Jr. 1942. Commentary on the North American genera of Commelinaceae. Ann. Missouri Bot. Gard. 29: 141-154.
Yanovsky, E. 1936. Food plants of the North American Indians. Washington D.C. 87p. Reviewed in Tucker, G.C. 1989. The genera of Commelinaceae in the southeastern United States. J. Arnold Arbor. Harv. Univ. 70: 97-130.
Young, A., Boyle, T., and Brown, T. 1996. The population genetic consequences of habitat fragmentation for plants. TREE 11: 413-418.
Zawko, G. Krauss, S.L., Dixon, K.W., and Sivasithamparam, K. 2001. Conservation
genetics of the rare and endangered Leucopogon obtectus (Ericaceae). Mol. Ecol. 10: 2389-2396.

109
Appendix I: Raw and calculated population data for the five populations of Tradescantia occidentalis in Canada, 2005 and comparison to previous estimates. Table AI.1. Raw and calculated data for T. occidentalis in the PFRA pasture in Saskatchewan, 2005 (Raw data from Godwin and Sumners, unpubl.). Table AI.2. Raw and calculated data for the T. occidentalis subpopulations, Douglas and Highway 19 (SK), 2005. Table AI.3. Raw and calculated data for the T. occidentalis population in Routledge, MB 2005. Table AI.4. Raw and calculated data for the T. occidentalis population in MHHC, MB 2005. Table AI.5. Raw and calculated data for the T. occidentalis population in Lauder, MB 2005. Table AI.6. Raw and calculated data for the T. occidentalis population in Alberta, 2005 (Data from Remarchuk 2005). Table AI.7 Comparison of the 2005 population estimates of T. occidentalis to previous estimates. Percentages represent the proportion of the maximum estimated number. Table AI.1. Raw and calculated data for the T. occidentalis population in the PFRA pasture in Saskatchewan, 2005 (Raw data from Godwin and Sumners, unpubl.). Density values are provided in plants/m2. The numbers of flowering and grazed plants and stems are not mutually exclusive.
Polygon Transect No. Plants
No. Flowering Plants
No. Grazed Plants
Plant Density Flowering Plant Density
Grazed Plant Density
North 103N 0 0 0 0 0 0 103S 210 112 124 0.1750 0.0933 0.1033 115 397 290 177 0.3308 0.2416 0.1475 116 63 43 29 0.0525 0.0358 0.0241 200 251 143 91 0.2091 0.1191 0.0758 201 62 n/a n/a 0.0516 n/a n/a 202 157 n/a n/a 0.1308 n/a n/a 203S 66 n/a n/a 0.0550 n/a n/a 203N 63 n/a n/a 0.0525 n/a n/a
Total North 9 1,269 588 421 n/a n/a n/a Avg. and
S.D. n/a 141 147 84 0.1175 ± 0.0951 0.0979 ± 0.0751 0.0701 ±0.0447
South 101 59 n/a n/a 0.0491 n/a n/a 101B 0 n/a n/a n/a n/a n/a 101C 0 n/a n/a n/a n/a n/a 101D 0 n/a n/a n/a n/a n/a
Total South 4 59 n/a n/a n/a n/a n/a Avg. n/a 15 n/a n/a 0.0491 n/a n/a
Area of Occupancy Total Population Estimate 479,651 m2 (North) 27,291 m2 (South) 56,359 ± 38,635 (North) 1,340 ± 4,261 (South)

110
Table AI.2. Raw and calculated data for the T. occidentalis subpopulations Douglas and Highway 19 (SK), 2005. Density values are provided in stems or plants/m2. The number of grazed and flowering stems and plants are not mutually exclusive.
Number No. Flowering No. Grazed Density Flowering Density Grazed Density Polygon Area (m2) Stems Plants Stems Plants Stems Plants Stems Plants Stems Plants Stems Plants
Douglas 11,887 696 430 634 422 17 9 0.0585 0.0361 0.0533 0.0355 0.0014 0.0007 Hwy 19 5,895 481 260 347 216 20 12 0.0815 0.0366 0.0441 0.0033 0.0588 0.0020 Total 17,782 1,177 690 981 638 37 21 n/a n/a n/a n/a n/a n/a Avg. 8,891 589 345 491 319 19 11 0.0700 0.0364 0.0487 0.0194 0.0301 0.0013
Total Stem Estimate* Total Plant Estimate* Standard Deviation 1,177 690 0.0046 0.0002 0.0046 0.0160 0.0287 0.0006
* No standard deviation is provided because the total number of stems and plants was counted instead of extrapolated.

111
Table AI.3. Raw and calculated data the for T. occidentalis population in Routledge, MB 2005. Density values are provided in stems or plants/m2. The number of grazed stems and plants is not mutually exclusive.
Number No. Flowering No. Grazed No. Pink
Density Flowering Density Grazed Density Pink Density
Transect
Stems Plants Stems Plants Stems Plants Stems Stems Plants Stems Plants Stems Plants Plants 1 4 4 4 4 0 0 0 0.0222 0.0222 0.0222 0.0222 0 0 0 2 21 17 16 16 2 2 0 0.1166 0.0944 0.0944 0.0888 0.0111 0.0111 0 3 23 18 18 18 0 0 0 0.1277 0.1000 0.1000 0.1000 0 0 0 4 33 29 33 29 0 0 0 0.1833 0.1611 0.1833 0.1611 0 0 0 5 16 11 14 11 0 0 0 0.0888 0.0611 0.0777 0.0611 0 0 0 6 38 30 35 30 0 0 0 0.2111 0.1666 0.1944 0.1666 0 0 0 7 40 27 37 27 0 0 0 0.2222 0.1500 0.2055 0.1500 0 0 0 8 115 65 101 65 1 1 0 0.6388 0.3611 0.5611 0.3611 0.0055 0.0055 0 9 136 66 105 64 5 3 0 0.7555 0.3666 0.5833 0.3555 0.0277 0.0166 0
10 154 75 124 75 6 4 0 0.8555 0.4166 0.6888 0.4111 0.0333 0.0222 0 11 77 44 72 44 2 2 0 0.4277 0.2444 0.4000 0.2444 0.0111 0.0111 0 12 45 27 41 27 1 1 0 0.2500 0.1500 0.2277 0.1500 0.0055 0.0055 0 13 19 13 19 13 0 0 3 0.1055 0.0722 0.1055 0.0722 0 0 0.0166 14 129 75 127 74 0 0 7 0.7166 0.4166 0.7055 0.4166 0 0 0.0388 15 13 12 13 12 0 0 3 0.0722 0.0666 0.0722 0.0666 0 0 0.0166 16 32 21 30 21 0 0 8 0.1777 0.1166 0.1666 0.1166 0 0 0.0444 17 25 19 23 19 1 1 3 0.1388 0.1055 0.1277 0.1055 0.0055 0.0055 0.0166 18 68 45 60 43 7 6 4 0.3777 0.2500 0.3333 0.2388 0.0388 0.0333 0.0222 19 33 24 33 24 1 1 0 0.1833 0.1333 0.1833 0.1333 0.0055 0.0055 0 20 43 29 34 29 6 4 1 0.2388 0.1611 0.1888 0.1611 0.0333 0.0222 0.0055 21 32 20 30 20 0 0 1 0.1777 0.1111 0.1666 0.1111 0 0 0.0055 22 22 13 19 13 2 2 0 0.1222 0.0722 0.1055 0.0722 0.0111 0.0111 0 23 30 17 23 16 2 2 0 0.1666 0.0944 0.1277 0.0888 0.0111 0.0111 0 24 0 0 0 0 0 0 0 0 0 0 0 0 0 0
Total 1,148 701 1,011 684 36 61 30 n/a n/a n/a n/a n/a n/a n/a Avg. 48 29 42 29 1.5 2.5 1.3 0.2657 0.1622 0.2342 0.1606 0.0083 0.0073 0.0069
Total Stem Estimate Total Plant Estimate Area of Occupancy Standard Deviation 21,948 ± 8,344 13,402 ± 4,170 82,590 m2 0.2341 0.1170 0.1997 0.1157 0.0120 0.0089 0.0124

112
Table AI.4. Raw and calculated data for the T. occidentalis population in MHHC, MB 2005. Density values are provided in stems or plants/m2. The number of grazed stems and plants are not mutually exclusive.
Number No. Flowering No. Grazed No. Pink
Density Flowering Density Grazed Density Pink Density
Transect
Stems Plants Stems Plants Stems Plants Stems Stems Plants Stems Plants Stems Plants Stems 1 1 1 1 1 0 0 0 0.0055 0.0055 0.0055 0.0055 0 0 0 2 145 48 134 48 0 0 1 0.8055 0.2666 0.7444 0.2666 0 0 0.0055 3 15 7 11 7 2 2 0 0.0833 0.0388 0.0611 0.0388 0.0111 0.0111 0 4 33 6 16 4 17 3 1 0.1833 0.0333 0.1722 0.0222 0.0944 0.0166 0.0055
Total 194 62 162 60 19 5 2 n/a n/a n/a n/a n/a n/a n/a Avg. 49 16 41 15 5 1 0.5 0.2694 0.0861 0.2458 0.0833 0.0263 0.0069 0.0027
Total Stem Estimate Total Plant Estimate Area of Occupancy Standard Deviation 2,425 ± 7,261 775 ± 3,511 9,000 m2 0.3158 0.1050 0.2940 0.1065 0.0395 0.0072 0.0027
Table AI.5. Raw and calculated data for T. occidentalis in Lauder, MB 2005. Density values are provided in stems or plants/m2. The number of grazed stems and plants are not mutually exclusive.
Number No. Flowering No. Grazed No. Pink
Density Flowering Density Grazed Density Pink Density
Transect
Stems Plants Stems Plants Stems Plants Stems Stems Plants Stems Plants Stems Plants Stems 1 12 7 11 7 1 1 0 0.0666 0.0388 0.0611 0.0388 0.0055 0.0055 0 2 108 31 75 31 38 23 0 0.6000 0.1722 0.4166 0.1666 0.2111 0.1277 0 3 31 13 31 13 0 0 0 0.1722 0.0722 0.1722 0.0722 0 0 0 4 22 8 9 6 5 3 1 0.1222 0.0444 0.0500 0.0333 0.0277 0.0166 0.0055 5 38 15 31 15 6 4 1 0.2111 0.0833 0.1722 0.0833 0.0333 0.0222 0.0055 6 29 16 29 16 1 1 0 0.1611 0.0888 0.1611 0.0888 0.0055 0.0055 0 7 68 29 43 29 5 3 0 0.3777 0.1611 0.2388 0.1611 0.0277 0.0166 0 8 37 14 27 14 5 2 0 0.2055 0.0777 0.1500 0.0777 0.0277 0.0111 0 9 145 33 102 32 34 11 0 0.8055 0.1833 0.5666 0.1777 0.1888 0.0611 0
10 40 13 31 13 1 1 0 0.2222 0.0722 0.1722 0.0722 0.0055 0.0272 0 Total 530 179 389 176 96 49 2 n/a n/a n/a n/a n/a n/a n/a Avg. 53 18 39 18 10 5 0.2 0.2944 0.0994 0.2161 0.0972 0.0533 0.0373 0.0011
Total Stem Estimate Total Plant Estimate Area of Occupancy Standard Deviation 11,916 ± 6,796 4,024 ± 1,530 40,470 m2 0.2226 0.0501 0.1511 0.0497 0.0743 0.0178 0.0022

113
Table AI.6. Raw and calculated data for the T. occidentalis population in Alberta, 2005. C= Counted, E= Extrapolated. Density values are provided in stems or plants/m2. The number of grazed stems and plants are not mutually exclusive. (Data from Remarchuk 2005.)
Number No. Flowering No. Grazed Density Flowering Density Grazed Density Polygon Area (m2) C/E Stems Plants Stems Plants Stems Plants Stems Plants Stems Plants Stems Plants
1 271.3 C 92 39 84 39 1 1 0.3390 0.1437 0.3095 0.1437 0.0036 0.0036 2 384.5 C 1077 622 1035 622 5 5 0.2808 0.1622 0.2699 0.1622 0.0013 0.0013 3 483.7 E 157 78 149 78 13 13 n/a n/a n/a n/a n/a n/a 4 323.5 C 68 38 67 38 2 2 0.2101 0.1174 0.2070 0.1174 0.0061 0.0061 5 39.6 E 13 6 12 6 1 1 n/a n/a n/a n/a n/a n/a 6 487.2 C 144 38 124 37 10 4 0.2955 0.0779 0.2544 0.0759 0.0205 0.0082 7 124.4 E 40 20 38 20 3 2 n/a n/a n/a n/a n/a n/a 8 170.8 C 83 24 70 24 5 3 0.4858 0.1404 0.4097 0.1404 0.0292 0.0175 9 10006.3 E 3255 1615 3089 1615 275 191 n/a n/a n/a n/a n/a n/a 10 10925.1 E* 2126 1171 1963 1168 94 54 0.1955 0.1096 0.1796 0.1093 0.0085 0.0049 11 484.7 C 165 75 147 75 18 7 0.3403 0.1547 0.3032 0.1547 0.0371 0.0144 12 162.0 C 151 53 132 53 15 9 0.8644 0.3270 0.8034 0.3270 0.0925 0.0555 13 3966.1 E 1291 640 1224 640 109 76 n/a n/a n/a n/a n/a n/a 14 140.9 C 78 52 69 52 8 8 0.5453 0.3688 0.3635 0.3688 0.0567 0.0567 15 1843.3 C 560 239 450 236 33 33 0.3037 0.1286 0.2440 0.1280 0.0179 0.0179 16 368.5 E 120 59 114 59 11 7 n/a n/a n/a n/a n/a n/a 17 670.0 E 218 108 207 108 18 13 n/a n/a n/a n/a n/a n/a 18 3617.5 E 1177 584 1117 584 99 69 n/a n/a n/a n/a n/a n/a 19 13137.2 E 4275 2120 4056 2120 361 251 n/a n/a n/a n/a n/a n/a 20 380.7 C 25 17 20 16 11 9 0.0656 0.0446 0.0525 0.0420 0.0288 0.0236 21 5471.0 E 1780 883 1689 883 150 104 n/a n/a n/a n/a n/a n/a 22 2449.5 E 797 395 756 395 67 47 n/a n/a n/a n/a n/a n/a 23 20210.3 E 6576 3262 6240 3262 432 386 n/a n/a n/a n/a n/a n/a 24 43817.1 E 14258 7072 13531 7072 1204 837 n/a n/a n/a n/a n/a n/a 25 5239.5 E 1704 846 1618 846 144 100 n/a n/a n/a n/a n/a n/a 26 51027.9 E 16604 8235 15757 8235 1403 975 n/a n/a n/a n/a n/a n/a
Total 7,676.8 n/a 3,627 1,861 2,742 1,523 203 135 n/a n/a n/a n/a n/a n/a Avg. 698 n/a 297 169 249 138 18 12 0.3254 0.1614 0.3088 0.1608 0.0275 0.0191
Estimated Total Area Estimated Total Stems Estimate Total Plants Standard Deviation 176,204 56,834 ± 19,188 28,430 ± 11,682 0.2034 0.0941 0.1807 0.0946 0.0259 0.0186
* In an area of 3027.9 m2, 592 stems (332 plants) were counted. 544 stems (331 plants) were flowering and 94 stems (54 plants) were grazed. The density calculated for that polygon versus the average density was used for extrapolation.

114
Table AI.7. Comparison of the 2005 population estimates of T. occidentalis to previous estimates. Percentages represent the proportion of the maximum estimated number.
Population Subset 2005 2004 2003 2002 2001 1990 Saskatchewan PFRA North* 56,359 (99%) 56,583 38,376 (68%) n/a n/a n/a
PFRA South* 1,340 (27%) 4,951 2,907 (58%) n/a n/a n/a Douglas** 696 (33%) 2,137 n/a n/a n/a n/a Highway 19** 481 (63%) 758 n/a n/a n/a n/a
Routledge*** n/a 13,402 n/a n/a n/a 9,422 (70%) n/a MHHC*** n/a 775 (98%) n/a n/a n/a 787 n/a Lauder*** n/a 4,024 (93%) n/a n/a n/a 4,321 n/a
Alberta**** n/a 28,430 n/a 7,700 7,450 7 210 * Estimates of population size are from Godwin and Sumners (unpubl.) for 2005, and from Godwin and Thorpe (2004) for 2003 and 2004. ** Estimates of population size are provided in number of stems because 2004 estimates (SERM 2005) are in stems. *** Estimates from 2001 are from MCDC (2005). ****Estimates from 2003, 2002, 2001, and 1990 from Smith (2002).

115
Appendix II: Taxonomic list for areas with T. occidentalis (Habitat Type A) arranged by family, genus and species. Species indicated by (*) have been reported in previous studies but were not found in this study.
Taxon Common Name Province
Anacardiaceae Toxicodendron radicans (L.) Kuntze Poison ivy SK MB Asclepiadaceae Asclepias viridiflora Raf. var. viridiflora Green milkweed SK A. viridiflora Raf. MB var. linearis (Gray) Fern. Asteraceae Ambrosia psilostachya DC. Perennial ragweed MB var. coronopifolia (T. & G.) Farw. Artemisia campestris L. Sagewort wormwood SK MB AB A. cana Pursh Prairie sagebrush MB* A. frigida Willd. Pasture sagewort SK MB AB A. ludoviciana Nutt. Prairie sagewort SK MB AB Crepis tectorum L. Annual hawksbeard SK Erigeron sp. Fleabane SK Helianthus pauciflorus Nutt. Rhombic leaved sunflower SK MB AB subsp. subrhomboideus (Rydb.) O. Spring & E. E. Schill. Heterotheca villosa (Pursh) Shinners Golden aster MB AB Lactuca biennis (Moench) Fernald Tall blue lettuce SK* Liatris punctata Hook. Blazing star SK MB AB Lygodesmia juncea (Pursh) D.Don Annual skeleton-weed SK MB AB Packera paupercula (Michx.) A. & D. Löve Groundsel MB Solidago missouriensis Nutt. Missouri goldenrod SK MB AB S. rigida L. Stiff goldenrod MB AB Symphyotrichum sp. Aster SK MB S. laeve (L.) Á. & D. Löve var. laeve Smooth aster AB Tragopogon dubius Scop. Goat’s beard SK MB AB Betulaceae Alnus viridis (Chaix) DC. subsp. crispa (Aiton) Turrill Green alder MB Boraginaceae Cryptantha fendleri (Gray) Greene Fendler’s cryptanthe AB Lappula squarrosa (Retz) Dumort Blue-bur SK MB Lithospermum incisum Lehm. Puccoon SK MB AB Brassicaceae Boechera holboellii (Hornem.) A. & D. Löve Rock cress MB Descurainia pinnata (Walter) Britton Pinnate tansy mustard SK* D. sophia (L.) Webb ex Prantl Flixweed MB Erysimum asperum (Nutt.) DC. Prairie rocket SK E. inconspicuum (S. Watson) MacMill. Small-flowered rocket SK MB AB Lepidium densiflorum Schrad. Common peppergrass SK MB AB Lesquerella arenosa (Richarson) Rydb. Great plains bladderpod SK*

116
Appendix II Continued.
Taxon Common Name Province
Cactaceae Escobaria vivipara (Nutt.) Buxbaum Cushion cactus SK MB AB var. vivipara Opuntia fragilis (Nutt.) Haw. Brittle prickly pear SK MB AB O. polyacantha Haw. Prickly pear SK MB AB Campanulaceae Campanula rotundifolia L. Bluebell MB Caprifoliaceae Symphoricarpos occidentalis Hook. Western snowberry SK MB AB Caryophyllaceae Cerastium arvense L. Field chickweed SK MB Moehringia lateriflora (L.) Fenzl. Grove sandwort SK* Silene drummondii Hook. Campion AB Chenopodiaceae Chenopodium fremontii S.Watson Fremont’s goosefoot SK* C. leptophyllum (Moq.) Nutt. ex S.Watson Narrow-leaf goosefoot SK* C. subglabrum (S. Wats.) A. Nels. Smooth goosefoot SK MB AB Commelinaceae Tradescantia occidentalis (Britt.) Smyth Western spiderwort SK MB AB Cupressaceae Juniperus horizontalis Moench Creeping juniper SK MB Cyperaceae Carex sp. Sedge MB C. douglassii Boott. Douglas sedge SK* C. duriuscula C.A. Mey. Spike-rush sedge SK C. foenea Willd. SK* C. inops Bailey Sun sedge SK AB subsp. heliophila (Mackenzie) Crins C. obtusata Lilj. Obtuse sedge SK* C. scoparia Schkuhr. ex Willd. Broom sedge SK* Cyperus schweinitzii Torr. Schweinitz’s sedge SK MB Elaeagneaceae Elaeagnus commutata Bernh ex. Rydb. Silverberry SK MB AB Equisetaceae Equisetum laevigatum A. Braun Smooth scouring rush MB AB Ericaceae Arctostaphylos uva-ursi (L.) Spreng. Common bearberry SK MB

117
Appendix II Continued.
Taxon Common Name Province
Euphorbiaceae Chamaesyce serpyllifolia (Pers.) Small Thyme-leaf spurge MB subsp. serpyllifolia Euphorbia esula L. Leafy spurge SK MB Fabaceae Astragalus sp. Milk vetch SK Dalea candida Michx. ex Willd. White prairie clover SK* D. purpurea Vent. Purple prairie clover SK MB AB D. villosa (Nutt.) Spreng. Hairy prairie clover SK* MB Glycyrrhiza lepidota Pursh Wild Licorice SK AB Lathyrus ochroleucus Hook. Yellow vetchling SK L. venosus Muhl. ex Willd. Forest pea MB Melilotus officinalis (L.) Lam. Yellow sweet clover MB Oxytropis sericea Nutt. Early yellow locoweed MB Psoralidium lanceolatum (Pursh) Rydb. Scurf pea SK Thermopsis rhombifolia (Pursh) Richardson Golden bean SK AB Vicia americana Muhl. ex Willd. Wild vetch SK MB Fagaceae Quercus macrocarpa Michx. Bur oak MB Liliaceae Maianthemum stellatum (L.) Link Star-flowered Solomon’s Seal SK MB AB Nyctaginaceae Mirabilis hirsuta (Pursh) MacM. Umbrellawort SK Onagraceae Oenothera nuttallii Sweet White evening primrose SK AB Poaceae Andropogon hallii Hack. Sand blue stem MB Bouteloua gracilis (Kunth) Lag. ex Griffiths Blue grama grass MB AB Bromus inermis Leyss. Awnless brome MB Calamovilfa longifolia (Hook.) Scribn. Sand grass SK AB Elymus canadensis L. Canada wild rye SK MB AB E. lanceolatus (Scribn. & J.G.Sm.) Gould Northern wheatgrass AB subsp. lanceolatus E. lanceolatus (Scribn. & J.G.Sm.) Gould Sand dune wheatgrass SK subsp. psammophilus (J.M. Gillett & H. Senn) Á. Löve E. trachycaulus (Link) Gould ex Shinners Wheatgrass SK* subsp. subsecundus (Link) Á. & D. Löve Festuca saximontata Rydb. Mountain fescue SK MB AB Hesperostipa comata (Trin. & Rupr.) Barkworth subsp. comata Needle and thread grass SK MB AB

118
Appendix II Continued.
Taxon Common Name Province
Koeleria macrantha (Ledeb) Schult. June grass SK MB AB Nassella viridula (Trin.) Barkworth Speargrass MB* Pascopyrum smithii (Rydb.) Á. Löve Western wheat grass SK MB AB Piptatherum micranthum (Trin. & Rupr.) Barkworth SK* Poa pratensis L. Kentucky bluegrass SK MB AB P. secunda J. Presl. Big bluegrass SK* Sporobolus cryptandrus (Torr.) A. Gray Sand dropseed SK MB AB S. heterolepis (A. Gray) A. Gray Prairie dropseed SK* Polygonaceae Polygonum aviculare L. Knotweed SK* Rumex venosus Pursh Wild begonia AB Primulaceae Androsace septentrionalis L. Fairy candelabra SK Ranunculaceae Anemone cylindrica A. Gray Long-fruited anemone MB Rosaceae Amelanchier alnifolia (Nutt.) Nutt. ex M. Roem Saskatoon MB Chamaerhodos erecta (L.) Bunge Little rose SK MB AB Fragaria vesca L. Woodland strawberry MB Geum triflorum Pursh Three-flowered avens SK* Potentilla pensylvanica L. Prairie cinquefoil MB Prunus virginiana L. Chokecherry SK MB AB Rosa acicularis Lindl. Prickly rose AB* R. arkansana Porter Prairie rose SK MB AB R. woodsii Lindl. Wood’s rose SK* MB* Rubiaceae Galium boreale L. Northern bedstraw SK MB Salicaceae Populus tremuloides Michx. Trembling Aspen SK Salix sp. Willow MB S. planifolia Pursh Mountain willow AB Santalaceae Comandra umbellata (L.) Nutt. Bastard toad-flax SK MB Scrophulariaceae Penstemon nitidus Douglas ex Benth. Waxleaf penstemon SK* Selaginellaceae Selaginella densa Rydb. Little club moss SK AB Violaceae Viola adunca Sm. Early blue violet MB

119
Appendix III: Taxonomic list for areas of suitable habitat without T. occidentalis (Habitat Type B) arranged by family, genus and species. Species indicated by (*) have been reported in previous studies but were not found in this study.
Taxon Common Name Province
Anacardiaceae Toxicodendron radicans (L.) Kuntze Poison ivy MB Asclepiadaceae Asclepias viridiflora Raf. var. viridiflora Green milkweed SK MB A. viridiflora Raf. var. linearis (Gray) Fern. MB Asteraceae Antennaria parvifolia Nutt. Small-leaf pussytoes SK Artemisia campestris L. Sagewort wormwood SK MB AB A. cana Pursh Prairie sagebrush MB* A. frigida Willd. Pasture sagewort MB AB A. ludoviciana Nutt. Prairie sagewort SK MB AB Helianthus pauciflorus Nutt. Rhombic leaved sunflower AB subsp. subrhomboideus (Rydb.) O. Spring & E. E. Schill. Heterotheca villosa (Pursh) Shinners Golden aster SK MB AB Liatris punctata Hook. Blazing star SK MB AB Lygodesmia juncea (Pursh) D.Don Annual skeleton-weed SK MB AB Packera cana (Hook.) W.A. Weber & A. Löve Prairie groundsel SK P. paupercula (Michx.) A. & D. Löve Groundsel MB Solidago missouriensis Nutt. Missouri goldenrod SK MB AB S. rigida L. Stiff goldenrod MB AB Symphyotrichum sp. Aster SK S. laeve (L.) Á. & D. Löve var. leave Smooth aster AB Taraxacum officinale F.H.Wigg. aggr. Common dandelion SK Townsendia exscapa (Richardson) Porter Stemless townsendia MB* Tragopogon dubius Scop. Goat’s beard MB AB Boraginaceae Cryptantha fendleri (Gray) Greene Fendler’s cryptanthe AB Lappula squarrosa (Retz.) Dumort Blue-bur SK MB Lithospermum incisum Lehm. Puccoon SK MB AB Brassicaceae Boechera holboellii (Hornem.) A. & D. Löve Rock cress SK MB Descurainia pinnata (Walter) Britton Pinnate tansy mustard SK* D. sophia (L.) Webb ex Prantl Flixweed MB Erysimum asperum (Nutt.) DC. Prairie rocket SK MB E. inconspicuum (S. Watson) MacMill. Small-flowered rocket MB AB Lepidium densiflorum Schrad. Common peppergrass SK MB AB Lesquerella arenosa (Richarson) Rydb. Great plains baldderpod SK* Cactaceae Escobaria vivipara (Nutt.) Buxbaum Cushion cactus SK MB AB var. vivipara Opuntia fragilis (Nutt.) Haw. Brittle prickly pear SK MB AB

120
Appendix III Continued.
Taxon Common Name Province
O. polyacantha Haw. Prickly pear SK AB Campanulaceae Campanula rotundifolia L. Bluebell SK MB Caprifoliaceae Symphoricarpos occidentalis Hook. Western snowberry SK AB Caryophyllaceae Cerastium arvense L. Field chickweed SK MB Moehringia lateriflora (L.) Fenzl. Grove sandwort SK* Silene drummondii Hook. Campion MB AB Chenopodiaceae Chenopodium fremontii S.Watson Fremont’s goosefoot SK* C. leptophyllum (Moq.) Nutt. ex S.Watson Narrow-leaf goosefoot SK* C. subglabrum (S. Wats.) A. Nels. Smooth goosefoor MB AB Salsola kali L. Russian thistle AB Cupressaceae Juniperus horizontalis Moench Creeping juniper SK MB Cyperaceae Carex sp. Sedge MB C. douglassii Boott. Douglas sedge SK* C. duriuscula C.A. Mey. Spike-rush sedge SK C. filifolia Nutt. Threadleaf sedge MB C. foenea Willd. SK* C. inops Bailey Sun sedge SK AB subsp. heliophila (Mackenzie) Crins C. obtusata Lilj. Obtuse sedge SK* C. scoparia Schkuhr. ex Willd. Broom sedge SK* Cyperus schweinitzii Torr. Schweinitz’s sedge SK MB Elaeagneaceae Elaeagnus commutata Bernh ex. Rydb. Silverberry AB Equisetaceae Equisetum laevigatum A. Braun Smooth scouring rush MB AB Ericaceae Arctostaphylos uva-ursi (L.) Spreng. Common bearberry SK Euphorbiaceae Chamaesyce serpyllifolia (Pers.) Small Thyme-leaf spurge MB subsp. serpyllifolia Euphorbia esula L. Leafy spurge SK MB Fabaceae Astragalus sp. Milk vetch SK

121
Appendix III Continued.
Taxon Common Name Province
Dalea candida Michx. ex Willd. White prairie clover SK* D. purpurea Vent. Purple prairie clover SK MB AB D. villosa (Nutt.) Spreng. Hairy prairie clover MB Glycyrrhiza lepidota Pursh Wild Licorice AB Lathyrus ochroleucus Hook. Yellow vetchling SK MB Thermopsis rhombifolia (Pursh) Richardson Golden bean SK MB AB Vicia americana Muhl. ex Willd. Wild vetch SK Juncaceae Juncus balticus Willd. Wire rush AB Liliaceae Maianthemum stellatum (L.) Link Star-flowered Solomon’s Seal SK MB AB Linaceae Linum rigidum Pursh Yellow flax MB Nyctaginaceae Mirabilis hirsuta (Pursh) MacM. Umbrellawort SK Onagraceae Oenothera nuttallii Sweet White evening primrose AB Poaceae Achnatherum hymenoides (Roem. & Schult.) Barkworth Indian rice grass AB Andropogon hallii Hack. Sand blue stem MB Bouteloua gracilis (Kunth) Lag. ex Griffiths Blue grama grass MB AB Bromus inermis Leyss. Awnless brome AB Calamovilfa longifolia (Hook.) Scribn. Sand grass SK AB Elymus canadensis L. Canada wild rye SK MB AB E. lanceolatus (Scribn. & J.G.Sm.) Gould Northern wheatgrass AB subsp. lanceolatus E. trachycaulus (Link) Gould ex Shinners Wheatgrass SK* subsp. subsecundus (Link) Á. & D. Löve Festuca saximontata Rydb. Mountain fescue MB AB Hesperostipa comata (Trin. & Rupr.) Barkworth subsp. comata Needle and thread grass SK MB AB Koeleria macrantha (Ledeb) Schult. June grass SK MB AB Pascopyrum smithii (Rydb.) Á. Löve Western wheat grass AB Poa pratensis L. Kentucky bluegrass SK MB AB P. secunda J. Presl. Big bluegrass SK* Sporobolus cryptandrus (Torr.) A. Gray Sand dropseed SK MB AB S. heterolepis (A. Gray) A. Gray Prairie dropseed SK* Polygonaceae Polygonum aviculare L. Knotweed SK* Rumex venosus Pursh Wild begonia AB

122
Appendix III continued.
Taxon Common Name Province
Primulaceae Androsace septentrionalis L. Fairy candelabra SK Ranunculaceae Anemone cylindrica A. Gray Long-fruited anemone MB Rosaceae Amelanchier alnifolia (Nutt.) Nutt. ex M. Roem Saskatoon MB Chamaerhodos erecta (L.) Bunge Little rose AB Geum triflorum Pursh Three-flowered avens SK* Potentilla pensylvanica L. Prairie cinquefoil MB Prunus virginiana L. Chokecherry SK MB AB Rosa acicularis Lindl. Prickly rose AB* R. arkansana Porter Prairie rose SK MB AB R. woodsii Lindl. Wood’s rose SK* MB* Salicaceae Populus deltoides W. Bartram ex Marshall Cottonwood AB P. tremuloides Michx. Trembling Aspen AB Salix planifolia Pursh Mountain willow AB Santalaceae Comandra umbellata (L.) Nutt. Bastard toad-flax MB Scrophulariaceae Penstemon nitidus Douglas ex Benth. Waxleaf penstemon SK* Selaginellaceae Selaginella densa Rydb. Little club moss MB AB
Related Documents