Ecology and evolu.on of the Cys.c Fibrosis lung microbiome Heather Maughan 1 , Yunchen Gong 2 , Pauline Fung 2 , Pauline Wang 2 , David M. Hwang 3 , David S. Gu<man 1,2 1 Cell & Systems Biology 2 Centre for Analysis of Genome EvoluIon and FuncIon 3 University Health Network University of Toronto

Welcome message from author
This document is posted to help you gain knowledge. Please leave a comment to let me know what you think about it! Share it to your friends and learn new things together.
Transcript
Ecology and evolu.on of the Cys.c Fibrosis lung microbiome
Heather Maughan1, Yunchen Gong2, Pauline Fung2, Pauline Wang2, David M. Hwang3, David S. Gu<man1,2
1Cell & Systems Biology 2Centre for Analysis of Genome EvoluIon and FuncIon
3University Health Network University of Toronto

CysIc Fibrosis and lung airways
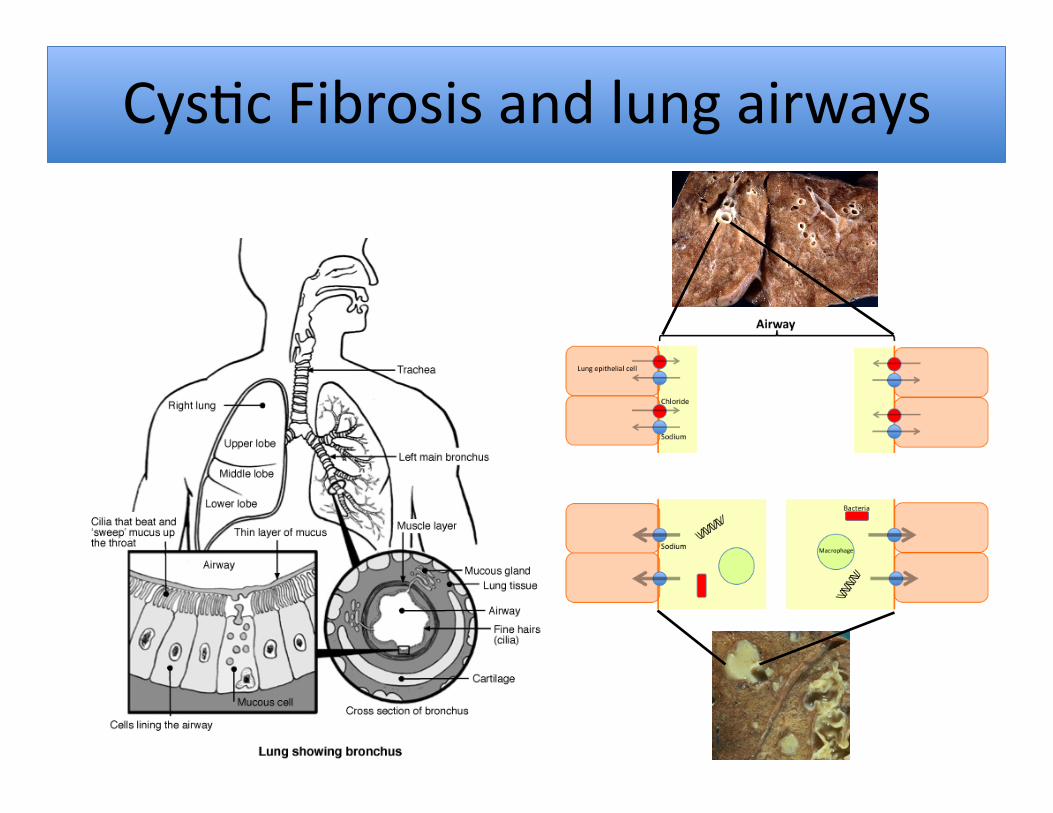
CysIc Fibrosis and lung airways

MulIple microbes inhabit CF lungs
Pseudomonas aeruginosa Burkholderia spp. Staphylococcus aureus
Stenotrophomonas maltophilia
Haemophilus influenzae
?
http://medicalsciences.wordpress.com/2009/09/07/infectious-disease-nosocomial-pathogens/
http://www.gefor.4t.com/concurso/bacteriologia/burkholderiacepacia1.jpg http://www.healthhype.com/staphylococcus-aureus.html
http://www.microbelibrary.org/microbelibrary/files/ccImages/Articleimages/Atlas-Mac/Stenotrophomonas%20maltophilia%20fig20.jpg
http://www.nhs.uk/conditions/Hib/Pages/Introduction.aspx
Known from culturing and some molecular characteriza.on
Aspergillus
0
10
20
30
40
50
60
70
<1 2 to 5 6 to 10 11 to 17 18 to 24 25 to 34 35 to 44 45+
Percen
t prevalence
Age
P. aeruginosa
S. aureus
H. influenzae
BCC
S. maltophilia
Aspergillus
P. aeruginosa
S. aureus
Aspergillus
S. maltophilia
H. influenzae
BCC
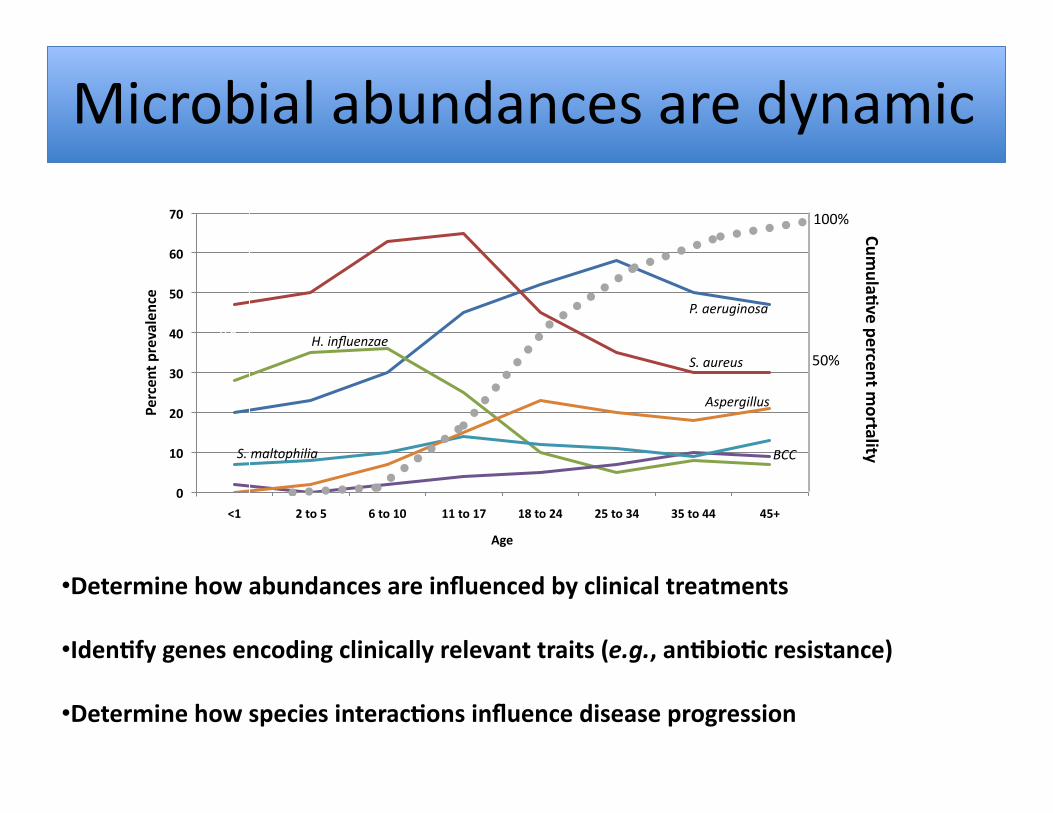
• Determine how abundances are influenced by clinical treatments
• Iden.fy genes encoding clinically relevant traits (e.g., an.bio.c resistance)
• Determine how species interac.ons influence disease progression
0
0.2
0.4
0.6
0.8
1
1.2 Cum
ula.ve percent m
ortality
50%
100%
Microbial abundances are dynamic
Study
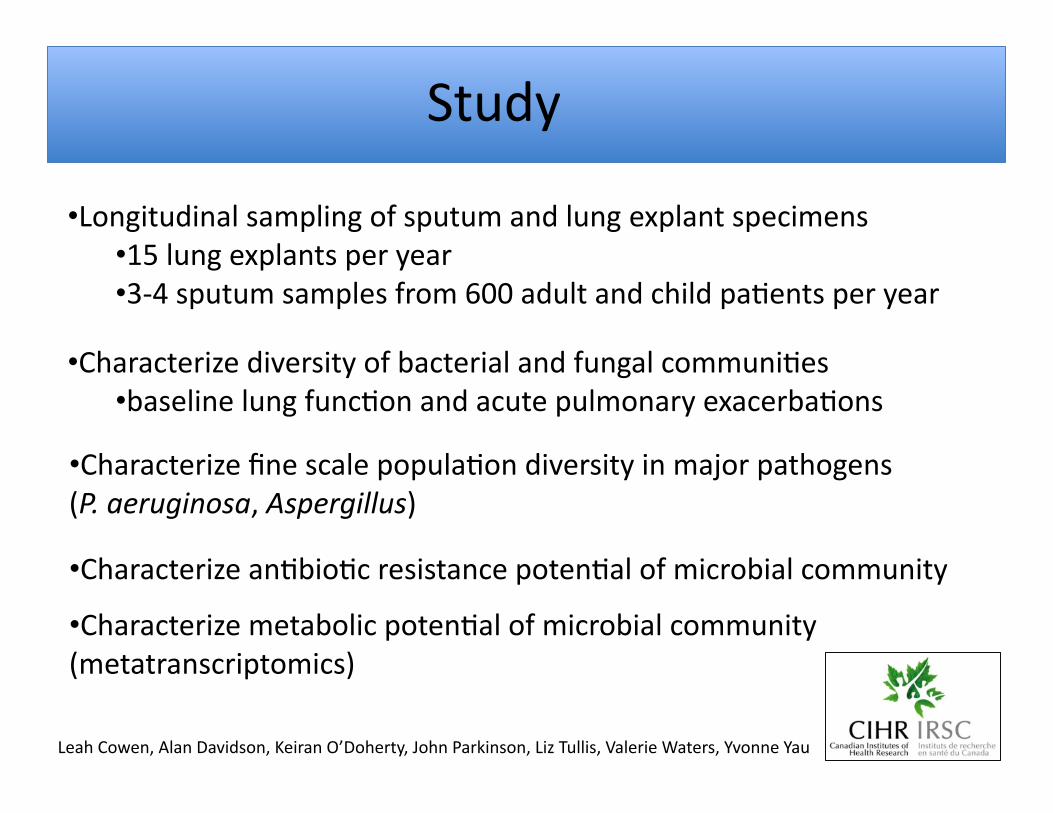
• Longitudinal sampling of sputum and lung explant specimens • 15 lung explants per year • 3‐4 sputum samples from 600 adult and child paIents per year
• Characterize diversity of bacterial and fungal communiIes • baseline lung funcIon and acute pulmonary exacerbaIons
• Characterize fine scale populaIon diversity in major pathogens (P. aeruginosa, Aspergillus)
• Characterize anIbioIc resistance potenIal of microbial community
• Characterize metabolic potenIal of microbial community (metatranscriptomics)
Leah Cowen, Alan Davidson, Keiran O’Doherty, John Parkinson, Liz Tullis, Valerie Waters, Yvonne Yau

Study
• Longitudinal sampling of sputum and lung explant specimens • 15 lung explants per year • 3‐4 sputum samples from 600 adult and child paIents per year
• Characterize diversity of bacterial and fungal communiIes • baseline lung funcIon and acute pulmonary exacerbaIons
• Characterize fine scale populaIon diversity in major pathogens (P. aeruginosa, Aspergillus)
• Characterize anIbioIc resistance potenIal of microbial community
• Characterize metabolic potenIal of microbial community (metatranscriptomics)
Leah Cowen, Alan Davidson, Keiran O’Doherty, John Parkinson, Liz Tullis, Valerie Waters, Yvonne Yau
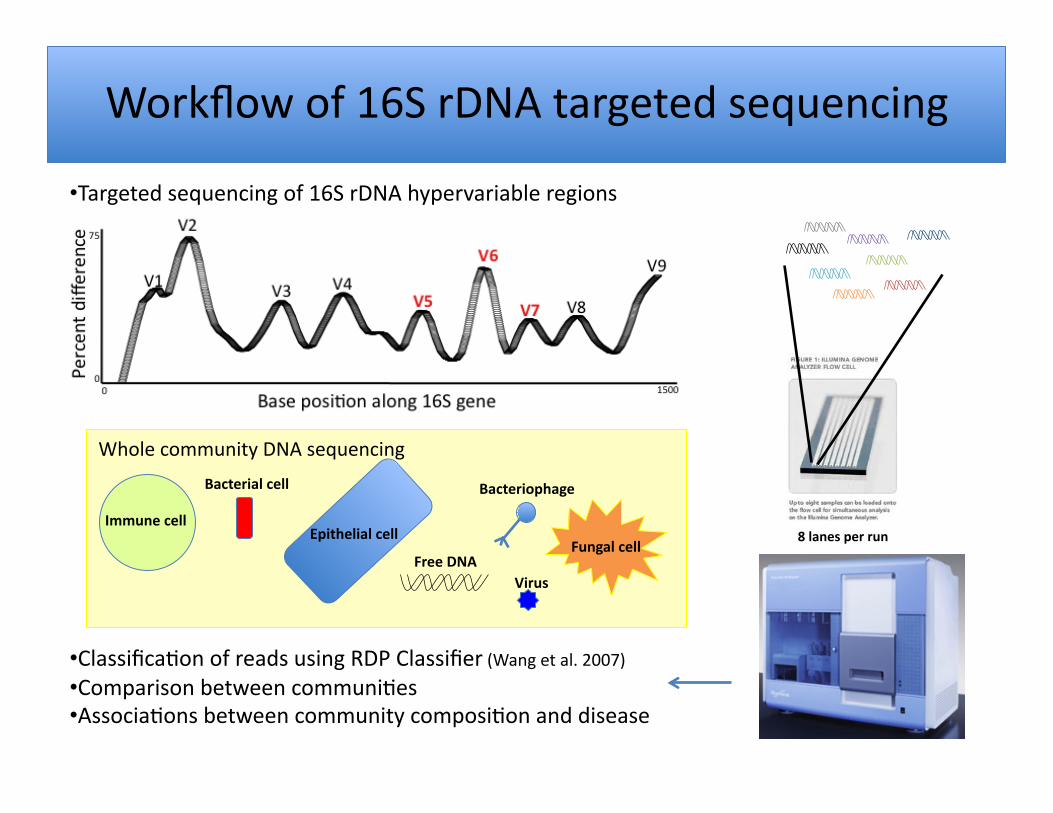
Workflow of 16S rDNA targeted sequencing
8 lanes per run
• ClassificaIon of reads using RDP Classifier (Wang et al. 2007) • Comparison between communiIes • AssociaIons between community composiIon and disease
• Targeted sequencing of 16S rDNA hypervariable regions
Immune cell Epithelial cell
Fungal cell
Bacterial cell Bacteriophage
Virus Free DNA
Whole community DNA sequencing
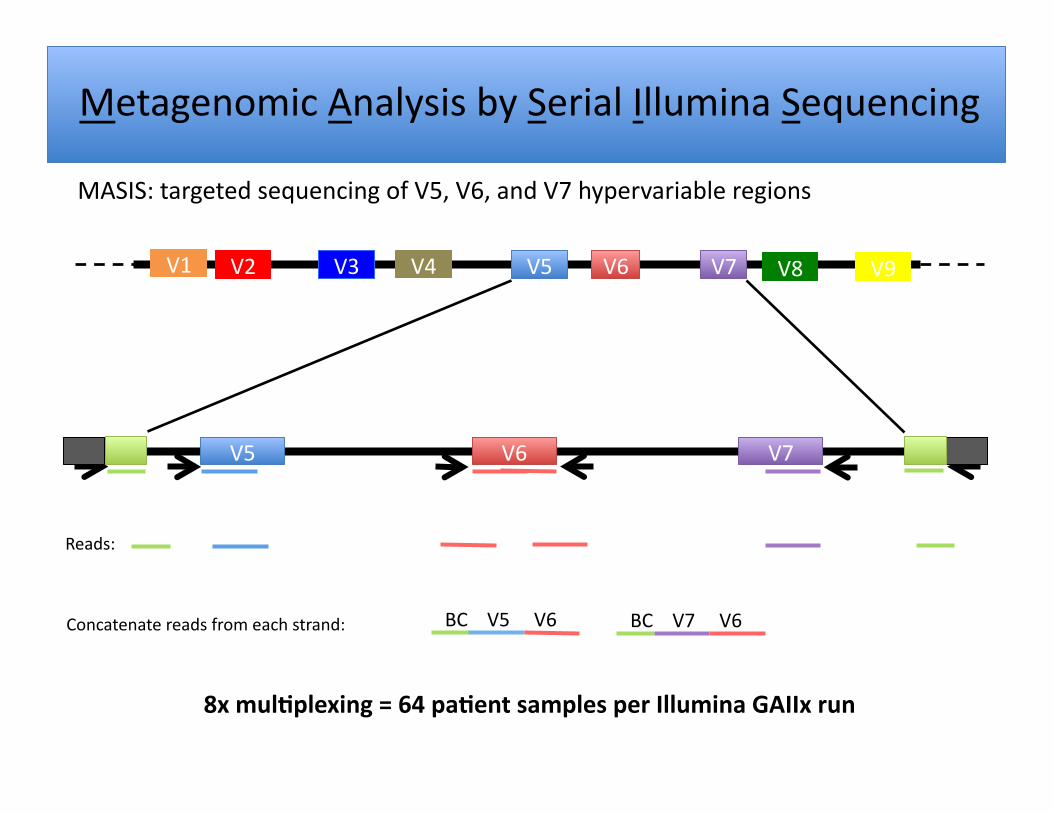
MASIS: targeted sequencing of V5, V6, and V7 hypervariable regions
Metagenomic Analysis by Serial Illumina Sequencing
8x mul.plexing = 64 pa.ent samples per Illumina GAIIx run
V5 V6 V7
V5 V6 V7 V8 V9 V4 V3 V2 V1
Reads:
Concatenate reads from each strand: BC V7 V6 BC V5 V6
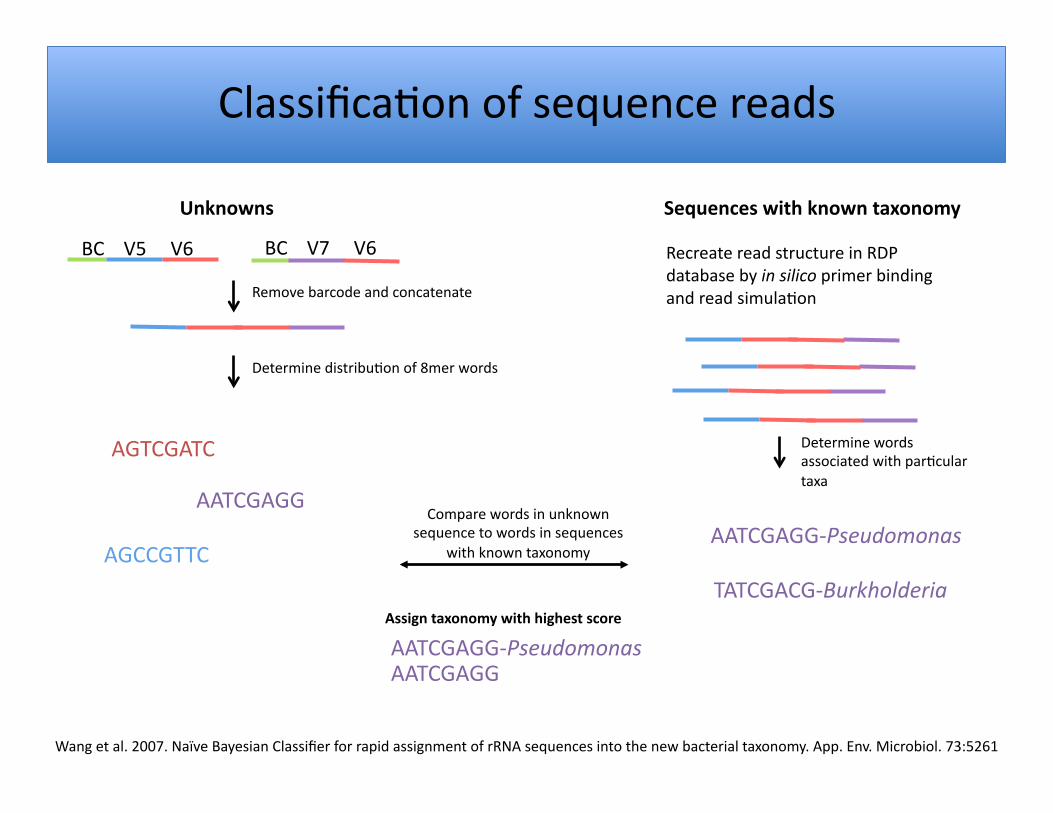
ClassificaIon of sequence reads
BC V5 V6 BC V7 V6
Remove barcode and concatenate
Recreate read structure in RDP database by in silico primer binding and read simulaIon
Determine distribuIon of 8mer words
AGTCGATC
AATCGAGG
AGCCGTTC
Determine words associated with parIcular taxa
AATCGAGG‐Pseudomonas
TATCGACG‐Burkholderia
Compare words in unknown sequence to words in sequences
with known taxonomy
AATCGAGG AATCGAGG‐Pseudomonas Assign taxonomy with highest score
Wang et al. 2007. Naïve Bayesian Classifier for rapid assignment of rRNA sequences into the new bacterial taxonomy. App. Env. Microbiol. 73:5261
Unknowns Sequences with known taxonomy

InformaIon content provided by MASIS
454 Illumina PE Illumina MASIS
millions of reads/run billions of reads/run
V5 V6 V7 V8 V9 V4 V3 V2 V1
~2¢ per read ~0.01¢ per read
Inform
aIon
con
tent
0.6
0.65
0.7
0.75
0.8
0.85
0.9
0.95
1
V3_454_300bp V6_454_300bp V5V7_72PE V5V7_108PE MASIS_36bp MASIS_72bp Full Length
Prop
or.on
of u
niqu
e read
s
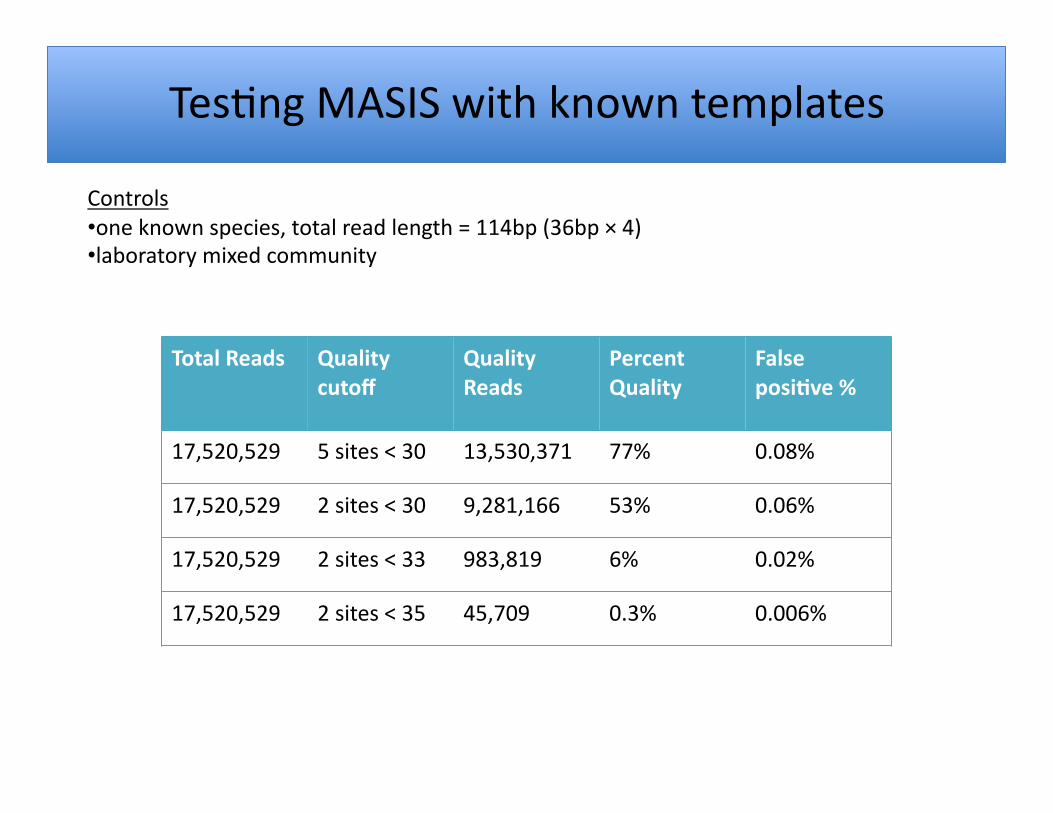
TesIng MASIS with known templates
Controls • one known species, total read length = 114bp (36bp × 4) • laboratory mixed community
Total Reads Quality cutoff
Quality Reads
Percent Quality
False posi.ve %
17,520,529 5 sites < 30 13,530,371 77% 0.08%
17,520,529 2 sites < 30 9,281,166 53% 0.06%
17,520,529 2 sites < 33 983,819 6% 0.02%
17,520,529 2 sites < 35 45,709 0.3% 0.006%
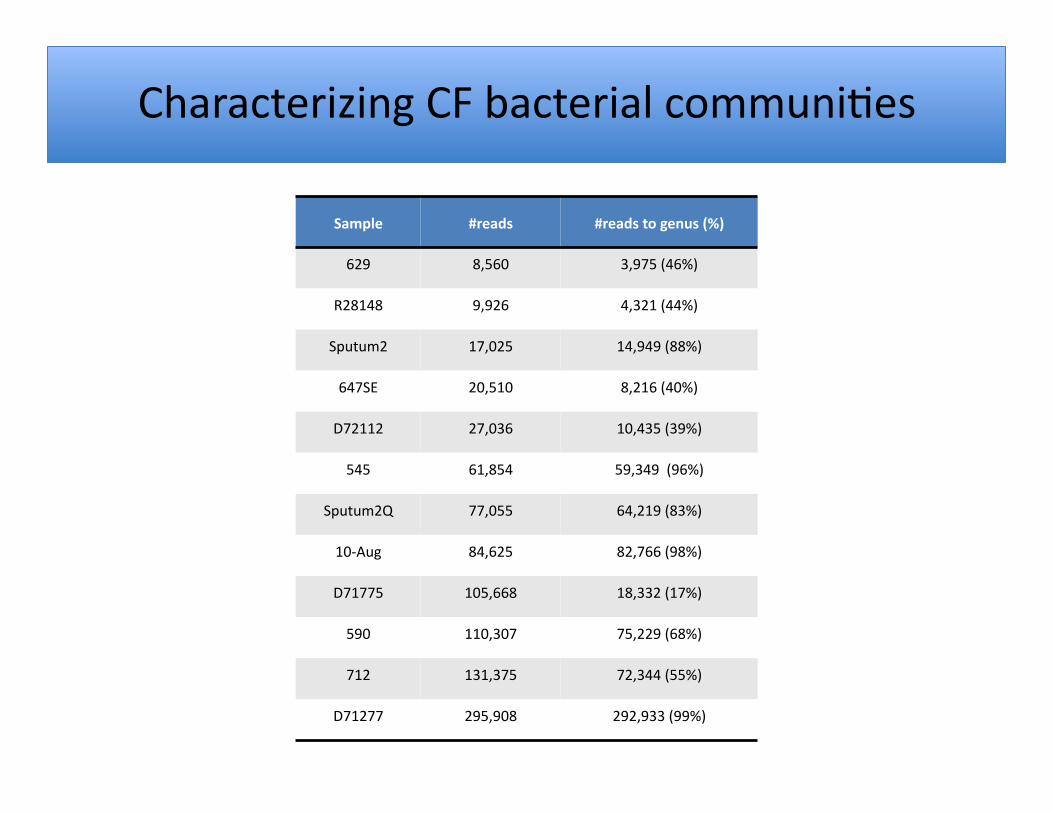
Characterizing CF bacterial communiIes
Sample #reads #reads to genus (%)
629 8,560 3,975 (46%)
R28148 9,926 4,321 (44%)
Sputum2 17,025 14,949 (88%)
647SE 20,510 8,216 (40%)
D72112 27,036 10,435 (39%)
545 61,854 59,349 (96%)
Sputum2Q 77,055 64,219 (83%)
10‐Aug 84,625 82,766 (98%)
D71775 105,668 18,332 (17%)
590 110,307 75,229 (68%)
712 131,375 72,344 (55%)
D71277 295,908 292,933 (99%)
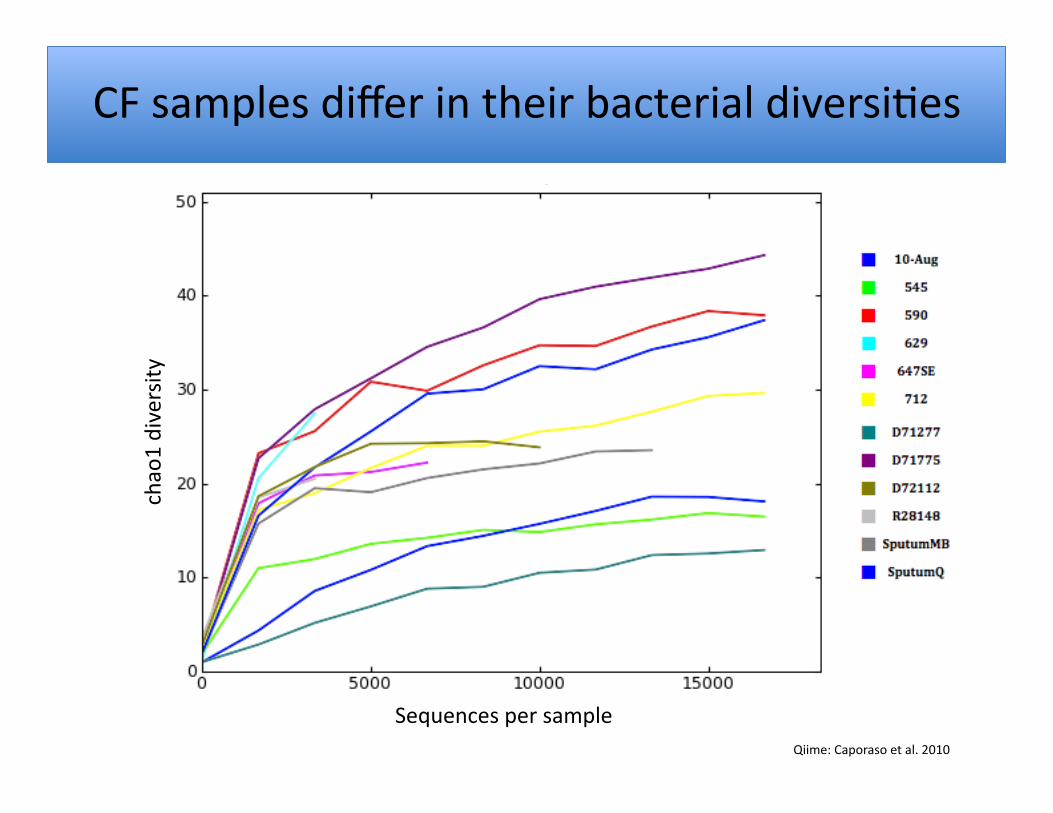
CF samples differ in their bacterial diversiIes chao1 diversity
Sequences per sample Qiime: Caporaso et al. 2010

Known and novel genera detected Achromobacter
AcidovoraxAcinetobacterActinomycesAnaeroglobusAnoxybacillusArenimonas
BacillusBifidobacteriumBlastococcusBordetella
BrevibacteriumBrevundimonasBurkholderia
CampylobacterCatonella
CaulobacterCedecea
ComamonasCurvibacter
DialisterDiaphorobacterEnhydrobacterEnterobacter
ErwiniaEscherichia.Shigella
EubacteriumFacklamia
FlavobacteriumFusobacterium
GemellaGp3
GranulicatellaHaemophilusHelicobacter
HydrogenophilusKineococcusKlebsiellaKocuria
LactobacillusLeminorellaMannheimia
MassiliaMegasphaera
MethyloversatilisMicrobacteriumMogibacteriumMycobacterium
NeisseriaNeptuniibacterNocardioides
OD1_genera_incertae_sedisOribacteriumParacoccusParvimonasPelomonas
PeptostreptococcusPetrobacterPlesiomonasPolaromonas
PorphyromonasPropionibacterium
ProteusPseudoalteromonas
PseudomonasRahnellaRaoultella
RhodanobacterRoseburia
RothiaSalmonellaSchlegelellaSelenomonas
SerratiaShuttleworthia
SimiduiaSimonsiella
SporobacteriumStaphylococcus
StenotrophomonasStreptococcusStreptomycesStreptophytaTepidimonasThermomonas
TrueperaVariovoraxVeillonellaWeissellaXylophilus S
putumQ
545
647SE
590
712
D72112
D71775
629
10-Aug
R28148
D71277
Sputum
MB
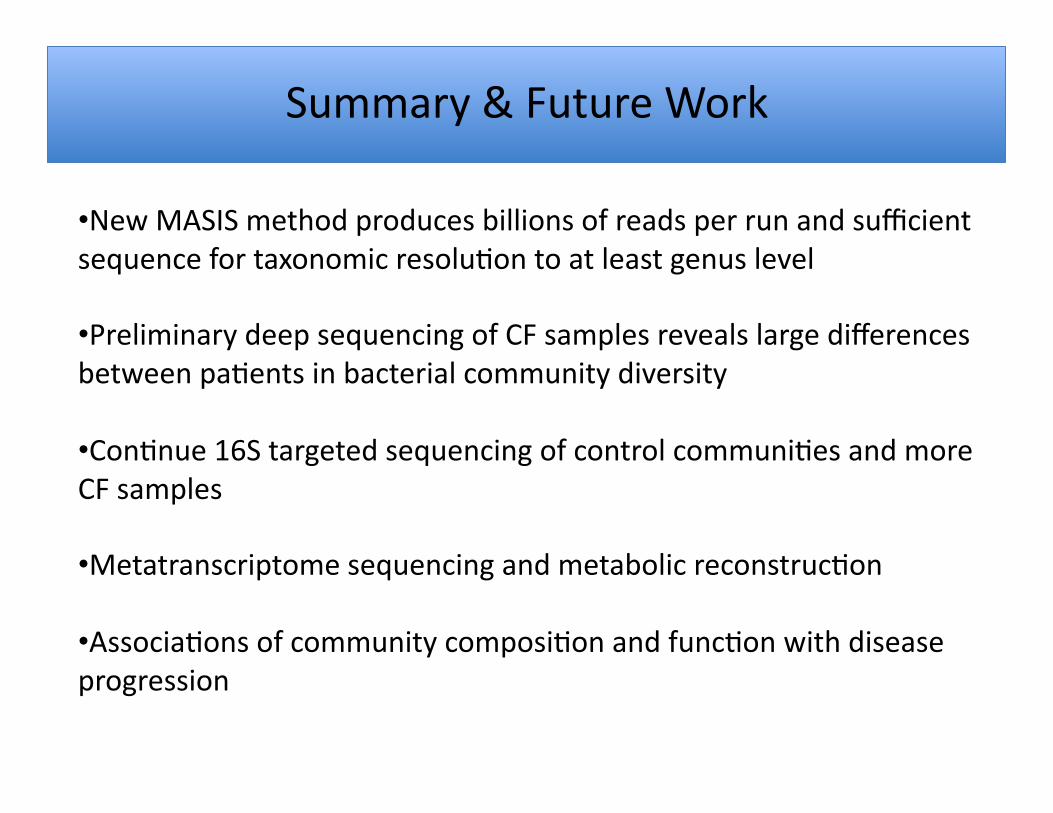
Summary & Future Work
• New MASIS method produces billions of reads per run and sufficient sequence for taxonomic resoluIon to at least genus level
• Preliminary deep sequencing of CF samples reveals large differences between paIents in bacterial community diversity
• ConInue 16S targeted sequencing of control communiIes and more CF samples
• Metatranscriptome sequencing and metabolic reconstrucIon
• AssociaIons of community composiIon and funcIon with disease progression
Acknowledgements
National Sanitarium Association
Lijie Yuan Jianfeng Zhang Joan Ouelle<e
Related Documents