Ecology and Development Series No. 3, 2002 Editor-in-Chief: Paul L.G.Vlek Editors: Manfred Denich Christopher Martius Nick van de Giesen Rahayu Widyastuti Soil fauna in rainfed paddy field ecosystems: their role in organic matter decomposition and nitrogen mineralization Cuvillier Verlag Göttingen

Welcome message from author
This document is posted to help you gain knowledge. Please leave a comment to let me know what you think about it! Share it to your friends and learn new things together.
Transcript

Ecology and Development Series No. 3, 2002
Editor-in-Chief: Paul L.G.Vlek
Editors:
Manfred Denich Christopher Martius Nick van de Giesen
Rahayu Widyastuti
Soil fauna in rainfed paddy field ecosystems: their role in organic matter decomposition and
nitrogen mineralization
Cuvillier Verlag Göttingen
Abstract The increase in food crop production, such as rice, to compensate for population growth in Indonesia should be sustainable in order to maintain environmental quality and conserve natural resources for future generations. In this study, the biological enhancement of soil organism populations and their ecological services, such as organic matter decomposition and nitrogen mineralization has been studied in a rainfed paddy field ecosystem in Pati, Indonesia. The cropping system used by local farmers is (1) two rice seasons, consisting of dry-seeded rice, planted at the beginning of the rainy season and transplanted rice, planted at the end of the rainy season, and (2) a short fallow (dry phase) during the dry season.
In the rice seasons, the soil fauna abundance, biomass and diversity, and the role of soil fauna in litter decomposition and nitrogen mineralization were evaluated in treatment plots with two different bund distances (4m and 8m) and crops cultivated on the bund (control, cassava and mungbean). The short bund distance (4m) would facilitate the movement of the soil fauna from the field (during the flooding) to the bunds, and cultivation of crops on the bunds would increase the soil surface cover thus protecting the soil fauna on the bund from direct sunshine. This was, therefore, expected to enhance the soil fauna population and its ecological services. The soil fauna population was studied using the Berlese funnel extractor method, and litter decomposition using three different mesh-sized (coarse, medium and fine) litterbags. Nitrogen mineralization was studied using undisturbed soil confined within PVC tubes containing ion-exchanged resins.
Generally, abundance, biomass and diversity of soil fauna were lower during the rice field phases than in the dry phase. The most numerous taxa in the dry phase were Oribatida (oribatid mites), whereas Sminthuridae (Collembola) dominated during the rice phases. In terms of biomass, Coleoptera was the most dominant taxon in the dry fallow phase, while their larvae along with the larvae of Diptera were the most dominant taxa under (flooded) rice phases. Earthworms sporadically occurred both in the fallow and in the rice seasons, without any particular pattern. Once they occurred in the soil samples, their biomass could make up for more than 60% of the total.
Though the soil fauna population was suppressed in the field during the (flooded) rice seasons, the physical environmental conditions, such as warm air temperature and high soil moisture may adequately support their activities to play their role in litter decomposition and N-mineralization. In the rice seasons, the short bund distance (4m) tended to increase soil fauna abundance, biomass and diversity. This effect was more pronounced when the bund was cultivated with crops, in which they enhanced macrofauna biomass during the dry-seeded rice. A combined effect of short bund distance and crop-planted bund was also shown in litter decomposition and N-mineralization in the field. Mungbean on the bund increased the litter decomposition, whereas cassava increased N-mineralization, suggesting that both mungbean and cassava are appropriate for bund crops. Thus, the short-bund distance with crops planted on the bund seemed to be favorable habitat for soil fauna population, so that they can enhance their role in soil processes and help in the management of crop residues.

Kurzfassung In Indonesien ist eine Steigerung der Produktion von Grundnahrungsmitteln wie z.B. Reis erforderlich, um das Bevölkerungswachstum zu kompensieren. Um die Umwelt zu erhalten und die natürlichen Ressourcen für zukünftige Generationen zu schützen, sollte diese Produktionserhöhung nachhaltig sein. Die vorliegende Studie wurde in einem Nassreissystem in Pati auf Java in Indonesien durchgeführt. Das Anbausystem der dortigen Reisbauern besteht aus (1.) einer Anbauphase mit trocken ausgesätem Reis zu Beginn der Regenzeit bzw. ausgepflanztem Reis in überschwemmten Reisfeldern am Ende der Regenzeit, und (2.) einer kurzen Brachephase während der Trockenzeit.
In der Studie wurde die biologische Bewirtschaftung des Nassreissystems zur Förderung der Bodenfaunapopulationen untersucht. Eine mögliche hiervon ausgehende Intensivierung der ökologischen Funktionen der Bodenorganismen wie die Zersetzung von organischem Material und die Mineralisation von Nährstoffen wurde ebenfalls erforscht. Untersuchte Maßnahmen waren eine Verringerung des Abstandes zwischen den Dämmen, die die Reisfelder begrenzen, von 8 auf 4 m und die Bepflanzung der Dämme mit verschiedenen Anbaupflanzen (Maniok und Mungbohne). Es wurde erwartet, dass (1.) ein geringerer Dammabstand (4 m), d.h. eine verringerte Breite der überschwemmten Fläche, es der Bodenfauna in den Feldern erleichtern würde, die Dämme während der Überschwemmung zu erreichen und so die Nassphase zu überleben, und dass (2.) der Anbau von Nutzpflanzen auf den Dämmen die Bodenfauna durch eine Bodenbedeckung vor direktem Sonnenlicht schützen könne. Die Bodenfauna wurde mit Hilfe einer Berlese-Tullgren-Apparatur aus Bodenproben ausgetrieben, sortiert und analysiert. Der Streuabbau wurde durch Einschluss von Reisstroh in Streubeutel unterschiedlicher Lochgrößen (grob, mittel, fein) untersucht. Die N-Mineralisation wurde an ungestörten Bodensäulen in PVC-Rohren mit Anionenaustauschharzen bestimmt.
Im Allgemeinen waren Abundanz, Biomasse und Vielfalt der Bodenfauna während der Anbauphase niedriger als während der Brache. Die häufigsten Taxa während der Brache waren Oribatiden, während in den überschwemmten Reisfeldern Sminthuridae (Collembola) dominierten. Die höchste Biomasse wurde während der trockenen Brachephase durch adulte Coleoptera gebildet, während in den überschwemmten Reisfeldern die Larven von Coleoptera und Dipteralarven dominierten. Regenwürmer kamen sporadisch sowohl während der Brache als auch während der Anbauphasen vor, ohne ein bestimmtes Muster aufzuweisen. Sobald sie in den Bodenproben enthalten waren, betrug ihr Anteil an der Gesamtbiomasse mehr als 60%.
Obwohl die Bodenfaunapopulationen in den (überschwemmten) Anbauphasen reduziert waren, führen möglicherweise die physikalischen Umweltbedingungen wie höhere Temperaturen und hohe Bodenfeuchtigkeit zur erhöhten Aktivität der Bodenfauna hinsichtlich Streuabbau und N-Mineralisation. In den Anbauphasen führte der geringere Dammabstand (4m) meist zur erhöhten Abundanz, Biomasse und Diversität der Bodenfauna. Diese Wirkung wurde durch die Bepflanzung der Dämme, die zu einer Zunahme der Biomasse während der Trockenreisphase führte, verstärkt. Eine kombinierte Wirkung von geringerem Dammabstand mit bepflanztem Damm wurde auch beim Streuabbau und bei der N-Mineralisation im Reisfeld beobachtet. Die Mungbohnenbepflanzung auf dem Damm führte zu erhöhtem Streuabbau, die Maniokbepflanzung wiederum zur erhöhter N-Mineralisation. Diese Tatsache lässt vermuten, dass sowohl Mungbohne als auch Maniok zum Anbau auf den Dämmen geeignet sind. Folglich scheinen der geringere Dammabstand als auch die Bepflanzung der Dämme der Bodenfauna günstige Lebensbedingungen zu bieten, wodurch ihre Rolle in den Bodenprozessen verstärkt und die Bewirtschaftung von Ernteresten unterstützt wird.

Table of Contents 1 INTRODUCTION.................................................................................................... 1
1.1 Rainfed lowland paddy field ............................................................................ 1 1.2 Soil fauna as a community ............................................................................... 2 1.3 The role of soil fauna in ecosystem processes.................................................. 4
1.3.1 Soil fauna in terrestrial ecosystems .......................................................... 5 1.3.2 Soil fauna in rice field ecosystems ........................................................... 6
1.4 Objectives ......................................................................................................... 7 1.5 Hypotheses ....................................................................................................... 8
2 MATERIALS AND METHODS ........................................................................... 10 2.1 Study site description ..................................................................................... 10
2.1.1 Location.................................................................................................. 10 2.1.2 Climate ................................................................................................... 10
2.2 Cropping system............................................................................................. 12 2.3 Outline of the experiments ............................................................................. 13 2.4 Study of soil fauna in rainfed paddy field and surrounding ecosystems ........ 16
2.4.1 Screening of soil fauna in different ecosystems in the region................ 16 2.4.2 Bait-lamina feeding activity ................................................................... 17 2.4.3 Study of soil fauna dynamics ................................................................. 19
Calculation of animal abundances and biomass ................................................. 19 Calculation of soil animal diversity.................................................................... 21 Grouping and identification................................................................................ 22
2.5 Study of organic matter decomposition.......................................................... 22 2.6 Study of nitrogen mineralization .................................................................... 24
2.6.1 Nitrogen mineralization.......................................................................... 24 Determination of ammonium and nitrate............................................................ 25 Calculation of nitrogen mineralization ............................................................... 25
2.6.2 Nitrifiers and denitrifiers ........................................................................ 26 2.7 Statistical analysis .......................................................................................... 26
3 RESULTS AND DISCUSSION............................................................................. 28 3.1 Screening of soil fauna in different ecosystems of the region........................ 28
3.1.1 Abundance and biomass ......................................................................... 28 3.1.2 Diversity ................................................................................................. 30 3.1.3 Bait-lamina feeding activity ................................................................... 33
Feeding activity .................................................................................................. 34 Feeding stratification .......................................................................................... 36 Resume ............................................................................................................... 36
3.2 Soil fauna dynamics in rainfed paddy field .................................................... 37 3.2.1 Soil fauna dynamics in fallow and rice field phases .............................. 37
Soil fauna abundance.......................................................................................... 37 Soil fauna biomass.............................................................................................. 41 Soil fauna diversity............................................................................................. 42 Dynamics of oribatid mites ................................................................................ 46 Dynamics of Collembola .................................................................................... 47 Resume ............................................................................................................... 48
3.2.2 The effect of bund distance and crop-planted bunds on soil fauna abundance, biomass and diversity .......................................................................... 49
Bund distance ..................................................................................................... 49 Crop-planted bund .............................................................................................. 55 Resume ............................................................................................................... 64
3.3 Litter decomposition in the fallow and rice seasons ...................................... 67 3.3.1 Effects of mesh size on litter decomposition.......................................... 67 3.3.2 Effects of different bund distances and crop-planted bunds in litter decomposition......................................................................................................... 69
Resume ............................................................................................................... 75 3.4 Nitrogen mineralization in rainfed paddy fields: relationship with soil fauna76
3.4.1 Nitrogen mineralization in fallow and rice fields................................... 76 3.4.2 The effect of bund distance and crop-planted bund on net nitrogen mineralization ......................................................................................................... 78 3.4.3 Nitrifiers and denitrifiers ........................................................................ 80
Resume ............................................................................................................... 82 4 GENERAL DISCUSSION AND CONCLUSIONS .............................................. 83
4.1 Screening of soil fauna in different ecosystems in the study area.................. 83 4.2 Soil fauna population dynamics in rainfed paddy ecosystem......................... 84 4.3 Effect of bund distance and crop-planted bund on soil fauna, litter decomposition and nitrogen mineralization ............................................................... 86
4.3.1 Soil fauna population.............................................................................. 86 4.3.2 Litter decomposition and nitrogen mineralization.................................. 87
4.4 Concluding remarks........................................................................................ 89 5 SUMMARY ........................................................................................................... 91 6 REFERENCES ....................................................................................................... 94 7 APPENDICES...................................................................................................... 102 Acknowledgments ........................................................................................................ 116

Introduction
1
1 INTRODUCTION
The increase in staple food crop production, such as rice and maize, to compensate for
population growth has become a major challenge for many developing countries such as
Indonesia. To increase food-crop production, farmers are usually driven not by
environmental concerns, but by economic issues, such as how to maximize production
through use of chemical fertilizers. The continuous use of chemical fertilizers without
returning plant residue or manure to the soil will result in soil degradation, groundwater
contamination and rising production costs (Feenstra 1997). Soil degradation is reflected
in declining agricultural productivity and utility (Katyal and Vlek 2000). Food-crop
production, therefore, should be sustainably enhanced in order to maintain
environmental quality and conserve natural resources for future generations (UNEP
2001). Sustainable agriculture can be improved through management of cropping
systems based on the enhancement of the soil organism population and their ecological
services, such as organic matter decomposition and nutrient mineralization (Lavelle et
al. 2001).
The rainfed lowland paddy ecosystem that is widespread in Indonesia has
great potential regarding an increase in the productive area, which has become limited
in Indonesia, especially in Java (Syamsiah 1994). However, due to the lack of
infrastructure and water resources, and low soil fertility, the productivity of rainfed
paddy fields has become lower compared to that of the irrigated rice field system.
1.1 Rainfed lowland paddy field
The rainfed lowland paddy ecosystem covers about 2.6 million ha, of which the largest
areas are found in Java (0.8 million ha), South Sulawesi (0.3 million ha), and North
Sumatera (0.2 million ha) (Amien and Las 1999). This system is not irrigated and,
therefore, totally depends on rainfall. The rainwater is impounded by bunds, and water
depth may exceed 50 cm. In Pati District, where the largest area of rainfed paddy fields
in Central Java is to be found, local farmers grow two rice crops during the wet season,
i.e., dry-seeded rice (gogorancah) at the beginning of the rainy season, and transplanted
rice with minimum tillage (walik jerami) at the end of the rainy season. After the
harvest of the second crop, the field is usually fallow during the dry season. A few

Introduction
2
farmers build on-farm reservoirs (OFRs) to collect excess water during the rainy season
and use the water in the dry season to grow the secondary crops, such as mungbean,
corn, soybean, peanut, cucumber, etc.
The rainfed paddy field system is characterized by lack of water control, with
floods and drought being potential problems. Despite the increase in the area planted
with rainfed lowland rice, the yields remain low. According to Amien and Las (1999),
rice yields in rainfed areas were 10% to 25% less than the average yield in Java, and
15% to 20% less than the average yield in South Sulawesi. Improvement of rainfed
lowland management is, therefore, needed in order to increase yields.
In this study, the biological management of the cropping system to improve
the soil fauna population and its function in ecosystem processes was studied in rainfed
paddy fields through modification of the bund distance (4m and 8m) and cultivation of
crops on the bunds. It was expected that (1) a short bund distance (4m) would facilitate
the movement of the soil fauna from fields (during flooding) to bunds and that (2) crops
on bunds would increase the soil surface cover thus protecting the soil fauna on the
bund from direct sunshine. The short-bund distance and bund cultivation were,
therefore, expected to enhance the soil fauna population and its ecological services. In
order to benefit from soil fauna activity for sustainable and productive agriculture a
better understanding of soil fauna as a soil community and their functions in the
regulation of soil fertility is needed.
1.2 Soil fauna as a community
Soil fauna as a component of soil communities may be classified into different
categories, depending on the purpose of the study. Soil fauna are often categorized
according to the feeding habits, i.e., saprophagous (decomposers) that consume a wide
variety of dead higher-plant material as well as microflora, and predators, which feed on
micro-, meso- and macrofauna (Petersen and Luxton, 1982). Soil fauna are also
classified into three groups according to body size, i.e., microfauna (body width less
than 0.2 mm), which include nematodes and protozoa; mesofauna (0.2 mm to 2 mm),
including microarthropods (mainly collembolans and mites) and enchytraeids; and
macrofauna (2.0 mm to 20.0 mm) with termites, earthworms, ants, beetles, myriapoda
and other macroarthropods (Lavelle and Spain 2001).
Introduction
3
Collembola and Acari (mites) are dominant animals among microarthropods,
both numerically and in terms of biomass (Lavelle and Spain 2001). Collembola
comprises seven families, namely Poduridae, Hypogastruridae, Onychiuridae,
Isotomidae, Entomobryidae, Neelidae and Sminthuridae, with most of them living in the
soil or in such habitats as leaf litter, under bark, in decaying logs, and in fungi. Some
species are also found on the surface of fresh water pools or along the seashores. Most
soil-inhabiting springtails feed on decaying material, fungi and bacteria, and others feed
on arthropod feces, pollen, algae, and other materials (Borror et al. 1989).
Acari comprises a very large group of small to minute animals and is divided
into six suborders, namely: Holothyrina, Mesostigmata, Ixodida, Prostigmata,
Astigmata and Oribatida. They occur in all habitats, both aquatic (fresh and salt water)
and terrestrial (Borror et al. 1989). The orders that are relevant to soil biology, for
instance spider mites (Tetranychidae, member of Prostigmata), are plant feeders, and
some other species can cause serious damage to orchard trees, field crops, and
greenhouse plants. The most important Acari in relation to the soil fertility are Oribatida
or Cryptostigmata. Oribatid mites are found in leaf litter, under bark and stones, and in
the soil. They are mainly scavengers and are important in breaking down organic matter
and promoting soil fertility (Borror et al. 1989).
The other important mesofauna group comprises enchytraeids, which are small
white-colored Oligochaeta. Anatomically, they form a relatively simple and uniform
group, with body length varying from less than 1 mm for the smallest species to 5 cm
for the largest species. They live particularly in terrestrial environments but also in
aquatic environments (O’Connor 1967). Although Acari and Collembola are the major
animal groups in mesofauna communities, the other minor groups, Protura, Diplura,
Pauropoda and Symphyla may be locally important. Protura and Diplura may be
panphytophages or predators of other microarthropods. Symphyla may be a serious pest
for a wide range of plants (Lavelle and Spain 2001).
In terms of their biomass, abundances and function in ecosystem processes,
earthworms, termites and ants are the most important soil fauna in terrestrial ecosystems
(Fragoso and Lavelle, 1995; Lavelle et al. 1997; Lavelle and Spain 2001). In some
tropical rainforests, earthworms accounted for 51% of the total biomass, while termites

Introduction
4
composed 13%. When it comes to abundance, termites dominated with 37%, followed
by ants (23%) and earthworms (9%).
Earthworms are distributed widely in forests, grasslands, farmlands, lakes,
marshes, and in the ocean. The earthworm body length varies from a few centimeters to
2-3 meters (Edwards and Bohlen 1996), with the live biomass commonly ranging from
30 to 100 g m-2 (Lavelle and Spain 2001). The social insect group termites (Isoptera)
consists of approximately 2600 species worldwide. Termites differ greatly in their
feeding habits and the type of nest they construct (Martius 2001); some wood-feeding
species live entirely in galleries excavated within decaying logs or wood, others
construct earth mounds of varying size and complexity. Their importance for soil
biology lies in their contribution to soil structure (they move and mix soil and organic
matter from different horizons), and to soil chemistry as they play an important role in
organic matter decomposition (Amelung et al. 2001). Other important insect groups are
ants (Formicidae). Ants occur practically everywhere in terrestrial habitats and
outnumber in individuals most other terrestrial animals. Most of the species are
predators, herbivores or seed feeders, and not decomposers.
The other macroarthropods, such as Coleoptera, Diptera larvae, Myriapoda, etc.,
may locally be important. Coleoptera are a very important soil animal group in Mexican
forests (Fragoso and Lavelle 1995). The Coleoptera, which is the largest order of
insects, colonize most of the habitats where insects occur. Some Coleoptera families,
such as the Carabidae, Staphylinidae, Scidmaenidae and Pselaphidae, are predators and
prey on many other species, whereas Scarabidae, Tenebrionidae, Ptiliidae, Scolytidae,
etc., are decomposers (Raw 1967; Hanagarth and Brändle 2001). Diptera larvae occur
predominantly in moist or sub-aquatic situations. They are predominantly saprophagous
and a relatively small number of them attack living plants, as miners or borers in
different parts of the plant. Other soil macroarthropods, such as Isopoda, Aranae,
Homoptera, Heteroptera, Hemiptera, Thysanura, and Blattoidea may occasionally be
important (Daly et al. 1998; Lavelle and Spain 2001).
1.3 The role of soil fauna in ecosystem processes
The important ecosystem processes such as decomposition of organic matter and
nitrogen mineralization are influenced by factors such as resource quality, physical

Introduction
5
environmental conditions (mainly temperature and humidity), and interactions within
and between the fungi, bacteria and soil fauna (Sharma et al. 1995; Swift 1995). The
abundance and diversity of soil organisms may also influence the rate of decomposition
and nutrient availability for uptake by plants (Anderson 1998).
In paddy soils, the mineralization of organic N, P, and S play an important part
in the transformation of nutrients. Since N is the principal constraint in rice production,
more studies are available on N mineralization than on the mineralization of P and S in
paddy soils. Zhu et al. (1984) reported that N uptake by rice plants grown on no-N plots
in intensive cropping systems was derived from the mineralization of soil N, and ranged
from 35 to 139 kg N/ha. Furthermore, they reported that most of the mineralizable N of
organic manures, except straw, was released within one month after incorporation and
submergence. According to Bucher et al. (2002), incorporating rice straw shortly after
harvest, before a two-month unflooded fallow period, can improve N and P nutrition of
the subsequent rice crop. The application of legume mulch appears to increase the
Oligochaeta populations, which are likely to participate in decomposition of legume
residues in paddy soils (Yokota and Kaneko 2002).
1.3.1 Soil fauna in terrestrial ecosystems
Soil fauna contribute up to about 30% of the total net nitrogen mineralization in forest
and grassland ecosystems (Verhoef and Brussaard 1990). Earthworms participate in the
nitrogen cycle through their production of casting and mucus and decomposition of
dead tissue. Earthworm activity can increase the nitrogen availability for uptake by
plants in shifting agriculture systems in India (Bhadauria and Ramakrishnan 1996). As
ecosystem engineers, earthworms, termites and ants can directly or indirectly affect the
availability of resources to other organisms through modification of the physical
environment (Lavelle et al. 1997). For instance, the nest mounds constructed by ants
can increase the incidence and abundance of a plant community due to nutrient
enrichment of the nest soils (Wilby et al. 2001). The increase in plant biomass and total
plant nitrogen content due to soil animals, particularly protozoa, is also reported by
Bonkowski et al. (2001).
Maintaining soil animal diversity is important in order to sustain the ecosystem
processes. Naeem et al. (1995), in their mesocosm experiment with direct manipulation

Introduction
6
of diversity under controlled environmental conditions, provided the evidence that
ecosystem processes like community respiration, productivity, decomposition, etc., may
be negatively affected by the decline of animal species diversity. A laboratory
experiment to estimate the decomposition rate using three species of Plecoptera as
detritivores indicated that a number of species have significant effects on the leaf litter
decomposition rate, which increases with the increase in animal species richness
(Jonsson and Malmqvist 2000).
Vreeken-Buijs and Brussaard (1996) indicated the important role of soil
microarthropods like Acari (mites) and Collembola, and enchytraeids in increasing the
decomposition rates of wheat straw. Adejuyigbe et al. (1999) reported that the dynamics
of soil microarthropod populations are strongly affected by climatic fluctuation. The
population of soil microarthropods is higher in the rainy seasons than in the dry seasons,
and their population is greater under natural fallow than under continuous cropping with
maize and cassava. Under continuous cropping, they are not subject to unfavorable
microclimatic factors such as low soil water content, high soil temperature, and high
incident radiation due to reduced cover.
1.3.2 Soil fauna in rice field ecosystems
Population and diversity of soil fauna in flooded systems are different compared to
those in non-flooded conditions. Oligochaeta, such as Tubificidae, Naididae and
Enchytraeidae, are a major component of soil fauna in wetland rice field conditions
(Lavelle et al. 1997; Yokota and Kaneko 2002), where they can accelerate nutrient
mineralization (Simpson et al. 1993a). Larvae of Diptera (Chironomidae and Culicidae),
ephydrid flies and collembolans are also abundant in flooded conditions (Settle et al.
1996), where they act as decomposers. Lavelle et al. (1997) reported that Tubificidae
play an important role with regard to soil fertility, because they transport the
components of photosynthetic aquatic biomass (cyano-bacteria, micro-algae and aquatic
macro-phytes) and their breakdown products from the surface to the deeper soil layer
thus providing nutrients to the rice plant.
Besides the positive effects of soil animals in flooded conditions, some soil
animals can also cause serious damage to rice plants. Chironomid midge larvae are
reported as being the most widespread and serious rice pests in New South Wales

Introduction
7
(Stevens 2000). Stem borers are the main insect pest threatening rice plants in many
countries, causing severe yield losses. The yellow stem borer Scirpophaga incertulas is
the most commonly found stem borer in the Philippines (Rubia et al. 1996), while the
white stem borer Scirpophaga innotata causes whiteheads in rice plants in West Java,
Indonesia (Rubia et al. 1997). The most abundant rice arthropods found in irrigated
lowland rice fields in West Africa that cause rice plant damage are diopsid flies,
leafhoppers, spiders, Odonata, and stem borers (Oyediran and Heinrichs 2001).
Several collembolan species are important in rice field ecosystems. Along with
chironomids and ephydrid flies, collembolans represent 28% of the total abundance of
arthropods collected from 12 locations in Javanese rice fields (Settle and Whitten 2000).
Approximately 41 collembolan species were found in Java, whereas approx. 96, 502,
128, 118, and 150 species of caddisfly (Trichoptera), ground beetles (Carabidae), water
beetles, earwigs (Dermaptera), and Odonata, respectively, had been recorded from Java
and Bali (Whitten et al. 1997). Up to now, little work has been conducted on soil fauna
in rice fields and other ecosystems in Java, Indonesia. Therefore, in this study, a basic
assessment of soil fauna in different ecosystems of the region was undertaken.
Because of the different cropping patterns during the wet and dry seasons, the
rainfed paddy field system is subject to two contrasting ecological conditions, i.e., a
flooded and a dry system. Consequently, the population and diversity of soil fauna,
organic matter, and nitrogen mineralization are also different in those systems. Little is
known about the influence of the dynamics of the soil fauna on organic matter
decomposition in rainfed paddy field systems. Therefore, the study of environmental
changes is important to optimize organic matter decomposition and nitrogen
mineralization of the cropping sequence.
1.4 Objectives
The study consisted of three main experiments:
1. The study of soil fauna in a rainfed paddy field ecosystem to evaluate the dynamics
of soil fauna in dry and flooded phases of the rainfed paddy ecosystem. This study
also included a screening of soil fauna in different natural ecosystems of the region,
to obtain a general overview of the soil fauna and to assess the potential group
diversity in natural ecosystems as a standard against which to compare the

Introduction
8
agricultural site. In addition to the soil fauna population, the feeding activity of the
soil fauna in different natural ecosystems was evaluated using the bait-lamina
method.
2. The study of soil organic matter decomposition to evaluate the role of soil fauna in
litter decomposition during the dry and flooded phases of a rainfed paddy field.
3. The study of N mineralization to evaluate the contribution of soil fauna to nitrogen
mineralization in the dry and flooded phases of a rainfed paddy field.
The specific objectives of this research were:
1. To study the abundance, biomass and diversity of the soil fauna in the two phases of
a rainfed paddy field, namely the dry short fallow period and the flooded phases
(dry-seeded rice and transplanted rice) during the rice field subsystem.
2. To study the influence of crops (legumes and cassava) cultivated on the bunds on
abundance, biomass and diversity of soil fauna in the fields and on the bunds during
the dry and flooded rice-field phase.
3. To study the influence of different bund distances of 4m and 8m on the abundance,
biomass and diversity of soil fauna in the fields and on the bunds of the above
systems.
4. To study the influence of different bund distances (4m and 8m) and crops (legumes
and cassava) cultivated on the bunds on the role of soil fauna in organic matter
decomposition and nitrogen mineralization.
1.5 Hypotheses
1. Soil fauna and their ecological services (organic matter decomposition and N
mineralization) can be manipulated to the benefit of the farmer through the
management of the cropping system.
2. The diversity, biomass and density of the soil fauna in crop-planted bunds are higher
than that in bunds without plants.
3. The increase in the soil fauna population in the dry phase (fallow) after the flooded
period is faster in plots with crop-planted bunds than in plots without plants on the
bunds.

Introduction
9
4. The increase in soil fauna population during the dry phase after the flooded period is
faster in plots with a short bund distance (4m) than in plots with a long bund
distance (8m).
5. Organic matter decomposition and nitrogen mineralization predominantly take place
during the dry phase of the rainfed paddy-field ecosystem.

Materials and Methods
10
2 MATERIALS AND METHODS
2.1 Study site description
2.1.1 Location
The field study was conducted at the Jakenan Experimental Station of the Central
Research Institute for Food Crops in District of Pati, Central Java, Indonesia, situated at
6.75o South Latitude and 111.04o East Longitude (Figure 2.1). The experimental station
is located in the center of farm fields. The largest area of rainfed lowland paddy fields is
to be found in the District of Pati, covering about 11 percent of the total areas of Central
Java.
#
#
#
##
#
#
#
#
#·
#·
Pati
semarang
Yogyakarta
Field SiteCentral Java
BoundaryProvincial boundaryRoadFieldsite
# Town#· City
((
(
#S#
Field SiteJakarta Java
N
Java
Figure 2.1: Map of Pati, Central Java, Indonesia
2.1.2 Climate
Amount and distribution of annual rainfall in the Pati District are highly variable.
Rainfall data from 1991 to 2000 indicate that the average annual rainfall in the region is
approximately 1500 mm, with 4 out of 10 years being dry (< 1500 mm) (Figure 2.2).

Materials and Methods
11
Figure 2.2: Annual rainfall in Pati District, for the period of 1991 to 2000. Source: Jakenan Experimental Station, Central Research Institute for Food Crops, Pati, Indonesia.
The amount and distribution of monthly rainfall in the region during the study period
was also variable. In the dry season from June to September, monthly rainfall ranged
between 0 and 79 mm, whereas in the wet season from October to May, it ranged
between 74 and 325 mm, with the highest rainfall in November and December (Figure
2.3).
Jun Sep Dec Mar Jun Sep
Rai
nfal
l, m
m
0
10
20
30
40
50
60
70Fallow
Rice RiceFallow
Figure 2.3: Daily rainfall at Jakenan Research Station, Pati, Indonesia, during the study
period, from June 2000 to June 2001. Source: Jakenan Experimental Station, Central Research Institute for Food Crops, Pati, Indonesia.
Years90 91 92 93 94 95 96 97 98 99 00 01
Ann
ual R
ainf
all,
mm
0
500
1000
1500
2000

Materials and Methods
12
During the study period, daily variations in the minimum temperature ranged between
18.0oC and 25.0oC; the maximum temperature ranged between 27.0oC and 36.5oC
(Figure 2.4).
Jun Sep Dec Mar Jun Sep
Tem
pera
ture
, o C
15
20
25
30
35
40
Minimum
Maximum
Figure 2.4: Daily minimum and maximum air temperatures at Jakenan Research Station,
Pati, Indonesia, during the study period from June 2000 to June 2001. Source: Jakenan Experimental Station, Central Research Institute for Food Crops, Pati, Indonesia.
2.2 Cropping system
The experimental design was based on the cropping systems used by local farmers as
described in the introduction, namely:
Dry-seeded rice (October to January). In dry-seeded rice, five to seven seeds of rice
IR64 variety were dibbled into the holes of a well-pulverized dry soil at 3-4 cm deep at
the beginning of the rainy season, spaced at 20 cm x 20 cm. The fertilization treatments
were (1) nitrogen at 120 kg ha-1, (2) phosphorus at 60 kg ha-1, (3) potassium at 90 kg
ha-1 as urea, SP36 (super phosphate) and potassium chloride, respectively. Phosphorus
and potassium were broadcast at 7 days after planting, whereas nitrogen was applied in
three equal applications (7, 25 and 45 days after planting). Herbicide at 2-4 l ha-1 was

Materials and Methods
13
also applied at 7 days after planting. The soils were then naturally flooded by rainwater,
causing a change from oxidized to reduced conditions.
Transplanted rice (March to May). After the rice harvest, the land was prepared for the
transplanted rice. All the remaining rice straw was turned over with a hoe, incorporated
into the soil and used as organic matter input. The rainwater was then collected in
impounded plots, creating flooded conditions in the field. In a separate plot of approx. 5
m x 5 m, rice seedlings were prepared in a nursery using the same procedure as for the
dry-seeded rice 25 days prior to planting, but with a tight spacing. The 25-day-old rice
seedlings were then transplanted into the flooded soil by hand spaced at 20 cm x 20 cm.
Fertilization and herbicide application corresponded to that of the dry-seeded rice.
Short fallow period (June to September). During the dry season, the fields lay fallow
as they were completely dry. This was especially the case at the peak of the dry season
around August and September, when the monthly rainfall ranged between 0 to 79 mm
(Figure 2.3). The field was covered only with grasses and weeds, as crops need a
minimum monthly rainfall of 100 mm for normal growth.
2.3 Outline of the experiments
The study focused on three aspects of soil biota: (1) study of soil fauna dynamics in
rainfed paddy field and surrounding ecosystems (Section 2.4), (2) study of organic
matter decomposition (Section 2.5) and (3) study of nitrogen mineralization in a rainfed
paddy-field experiment (Section 2.6).
The soil fauna of different natural ecosystems in the region was screened to
obtain a general overview of soil fauna in the surrounding areas. In addition to the soil
fauna population, the activity of soil fauna in the different natural ecosystems was
evaluated using the bait-lamina method.
Soil fauna dynamics were studied in more detail along with the decomposition
of organic matter and N mineralization in a rainfed paddy-field experiment. This
experiment was conducted beginning in the fallow period during the dry season,
followed by the planting seasons, i.e., dry-seeded rice and transplanted rice during the

Materials and Methods
14
rainy season. In order to assess the effect of bund distance and bund planting on soil
fauna, experiments were laid out in a 2 x 3 factorial design (Figure 2.5).
The three treatments with ‘crop-planted bunds’ factor were as follows:
1. Plot without plants on the bunds (control),
2. Plot with cassava (Manihot esculenta) on the bunds,
3. Plot with mungbean (Vigna radiata) on the bunds.
The two treatments of the bund-distance factor were:
1. Plot with bund distance of 4m,
2. Plot with bund distance of 8m.
Cassava and mungbean were selected for this experiment, because these crops are
abundant in this area and often cultivated by local farmers. The bund distance was based
on that commonly used by farmers, i.e., 8m (control) and the shorter bund distance of
4m was used as treatment. Experimental plots of 12m x 16m each were used in each
season, and all sampling was done simultaneously on all treatment plots with four
replications.
Organic matter decomposition in various locations of the experimental field was
studied using the litterbag method. The contribution of soil fauna to nitrogen
mineralization was assessed in undisturbed soil confined in PVC tubes at different
locations of the experimental field, retrieved regularly for analysis.

Materials and Methods
15
Figure 2.5: Field experimental design. All lines are the bunds, and the rice fields are in between.
No plants Control, 4m Control, 8m 4m 8m 4m
8m
Cassava, 4m Cassava Cassava, 4m Cassava, 8m Mungbean Mungbean, 4m Mungbean, 8m
6m 6m Rice Rice Rice Rice Rice Rice
Rice Rice Rice Rice
Rice Rice Rice Rice
6m 6m Rice Rice Rice Rice
Rice Rice Rice Rice Rice Rice Rice Rice
Rice Rice Rice Rice Rice Rice Rice Rice
Materials and Methods
16
2.4 Study of soil fauna in rainfed paddy field and surrounding ecosystems
The study consisted of three steps: (1) screening of soil animals in the different
ecosystems in the region, (2) evaluation of soil animal feeding activity using bait strips
in the same systems, and (3) study of soil fauna dynamics in rainfed paddy-field
experiments.
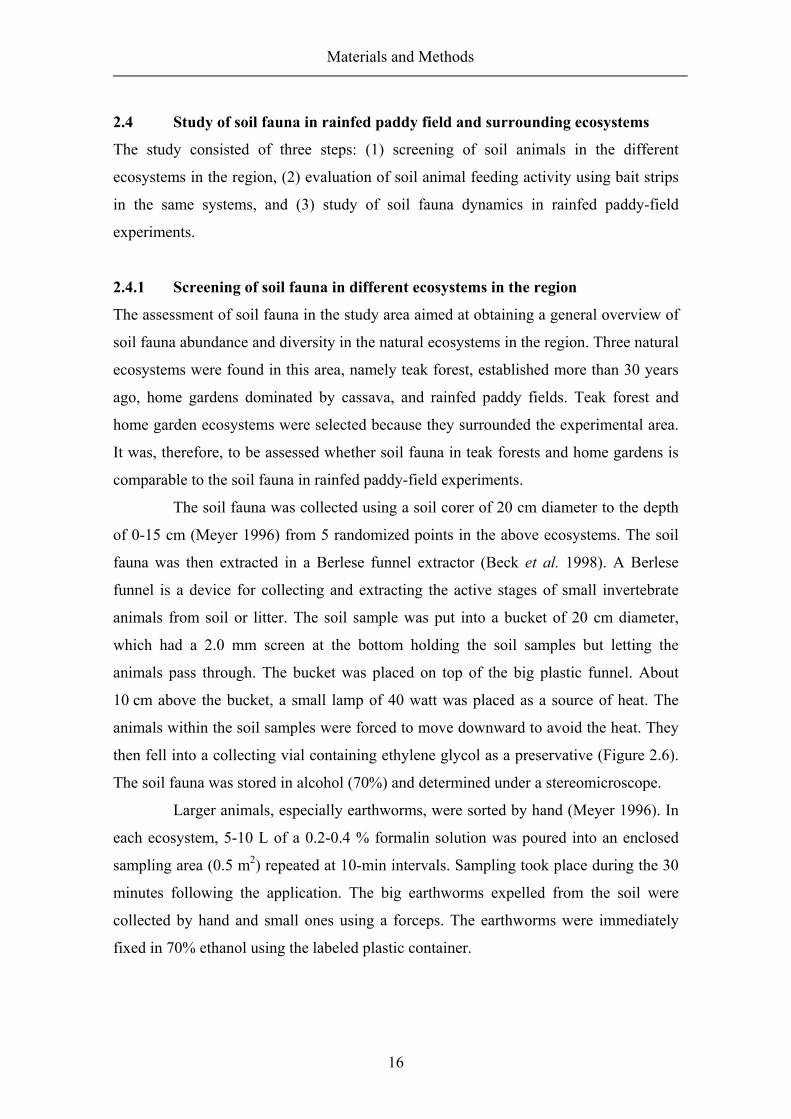
2.4.1 Screening of soil fauna in different ecosystems in the region
The assessment of soil fauna in the study area aimed at obtaining a general overview of
soil fauna abundance and diversity in the natural ecosystems in the region. Three natural
ecosystems were found in this area, namely teak forest, established more than 30 years
ago, home gardens dominated by cassava, and rainfed paddy fields. Teak forest and
home garden ecosystems were selected because they surrounded the experimental area.
It was, therefore, to be assessed whether soil fauna in teak forests and home gardens is
comparable to the soil fauna in rainfed paddy-field experiments.
The soil fauna was collected using a soil corer of 20 cm diameter to the depth
of 0-15 cm (Meyer 1996) from 5 randomized points in the above ecosystems. The soil
fauna was then extracted in a Berlese funnel extractor (Beck et al. 1998). A Berlese
funnel is a device for collecting and extracting the active stages of small invertebrate
animals from soil or litter. The soil sample was put into a bucket of 20 cm diameter,
which had a 2.0 mm screen at the bottom holding the soil samples but letting the
animals pass through. The bucket was placed on top of the big plastic funnel. About
10 cm above the bucket, a small lamp of 40 watt was placed as a source of heat. The
animals within the soil samples were forced to move downward to avoid the heat. They
then fell into a collecting vial containing ethylene glycol as a preservative (Figure 2.6).
The soil fauna was stored in alcohol (70%) and determined under a stereomicroscope.
Larger animals, especially earthworms, were sorted by hand (Meyer 1996). In
each ecosystem, 5-10 L of a 0.2-0.4 % formalin solution was poured into an enclosed
sampling area (0.5 m2) repeated at 10-min intervals. Sampling took place during the 30
minutes following the application. The big earthworms expelled from the soil were
collected by hand and small ones using a forceps. The earthworms were immediately
fixed in 70% ethanol using the labeled plastic container.

Materials and Methods
17
Light source
Bucket
Soil Screen
Funnel
Collecting vial
Preservative
Figure 2.6: Berlese funnel extractor
2.4.2 Bait-lamina feeding activity
In addition to soil-animal abundance, biomass and diversity, the activity of the soil
fauna in the teak forest, home garden and rainfed paddy-field ecosystems was also
evaluated using the bait-lamina method (Törne 1990a). This took place during the rainy
season in November 2000. Three randomized locations in the teak forest, two locations
in the home garden and four locations in rainfed rice fields (two locations in the rice
field and one each on the old bund and the new bund, respectively) were selected for the
bait lamina. Three blocks of bait-lamina sticks (each block consisting of 16 individual
sticks) were exposed at each location for two days (Figure 2.7).
Bait lamina consist of plastic strips 120 x 6 x 1 mm in size, which have a pointed
tip at the lower end. In the lower part (85 mm) of each strip, 16 holes of 1.5 mm
diameter are drilled with a 5-mm spacing. The holes are filled with bait material, a
mixture of cellulose, agar-agar, bentonite, bran and a small amount of activated carbon
(Figure 2.8A). Bait lamina were inserted into the soil in small slits made with a knife in
25x25 cm blocks, each block containing 16 bait lamina (Figure 2.8B). They were
exposed for two days. At the end of the exposure time, the bait lamina were retrieved
from the soil and visually assessed (strips held against the light). Each hole is
designated as “fed” (perforated) or “non-fed” hole. The feeding rate is measured as the
absolute number of “fed” holes.

Materials and Methods
18
Figure 2.7: Bait-lamina exposition at three small blocks and three randomized locations (teak forest ecosystem). Each block consisted of 16 strips.
Figure 2.8: Bait lamina (A) and bait-lamina exposition in the field (B)
Teak forest ecosystem Location Block Individual strip
'''''''''''' ''''''''''''
'''''''''' ''''''''''
'''''''''' ''''''''''
'''''''''' ''''''''''
'''''''''' ''''''''''
'''''''''' ''''''''''
'''''''''' ''''''''''
'''''''''' ''''''''''
'''''''''' ''''''''''
A B

Materials and Methods
19
2.4.3 Study of soil fauna dynamics
The density and diversity of soil meso- and macrofauna of an experimental were studied
during the whole study period. To evaluate the effect of crop-planted bunds on meso-
and macrofauna density and diversity, the soil fauna was collected both in the fields and
in the bunds for the treatment plots with crop-planted bunds (no plants, cassava and
mungbean). To assess the effect of bund distance on soil fauna density and diversity, the
soil fauna was collected both in the fields and in the bunds where these treatments were
included (4m and 8m). The soil fauna was sampled using a soil corer of 20 cm diameter
to a depth of 0-15 cm (Meyer 1996) from 4 randomized points in the fields and the
bunds, respectively, per plot at 30, 60 and 90 days after planting. Soil meso- and
macrofauna in each season were then extracted in a Berlese funnel extractor (Beck et al.
1998) (Figure 2.6) and the collected animals stored in ethanol (70%) and determined
under a stereomicroscope.
Calculation of animal abundances and biomass
The number of individuals (abundance or density) of the extracted animals was
calculated as follows (Meyer 1996):
IS = I.cm-2 A
IS mean number of individuals per sample A surface area of the corer (cm2) *) I number of individuals *) Area of the corer = r2.π = (10 cm)2 x 3.14= 314 cm2.
Biomass of the soil fauna was calculated based on their individual dry weight using
different regression equations of body length-body weight (Table 1.1). These
relationships are generally well established for temperate and tropical organisms
(Hanagarth et al. 1999).

Materials and Methods
20
Table 2.1: Body length and dry weight of individual animals. No. Taxon Average Body a)
Length (mm) Individual
Dry Weight (mg) References
1 Acari : Oribatida 0.50 0.0011 Edwards (1967) Others 0.64 0.0045 Edwards (1967) 2 Collembola : Hypogastruridae 0.50 0.0056 Edwards (1967) Onychiuridae 0.50 0.0114 Edwards (1967) Isotomidae 0.50 0.0044 Edwards (1967) Entomobryidae 0.50 0.0084 Edwards (1967) Sminthuridae 0.50 0.0023 Edwards (1967) Poduridae 0.50 0.0023 Edwards (1967) Neelidae 0.50 0.0023 Edwards (1967) 3 Protura 2.50 0.0004 Hanagarth, et al. (1999) 4 Symphyla 2.88 0.0800 Hanagarth, et al. (1999) 5 Aranae (Spiders) 2.96 0.5724 Hanagarth, et al. (1999) 6 Coleoptera : Carabidae 3.88 0.9128 Hanagarth, et al. (1999) Staphylinidae 3.28 0.3160 Hanagarth, et al. (1999) Others 3.81 0.8689 Hanagarth, et al. (1999) Coleoptera (larvae) 5.52 0.9894 Hanagarth, et al. (1999) 7 Diptera 1.9 0.4490 Edwards (1967) Diptera (larvae) 3.71 0.8000 Hanagarth, et al. (1999) 8 Chilopoda 4.13 0.0521 Hanagarth, et al. (1999) 9 Diplopoda 5.41 0.9405 Hanagarth, et al. (1999) 10 Diplura 2.51 0.0200 Hanagarth, et al. (1999) 11 Hemiptera 2.86 0.3360 Hanagarth, et al. (1999) 12 Homoptera 1.32 0.9010 Hanagarth, et al. (1999) 13 Hymenoptera : Formicidae 2.56 0.5000 Petersen and Luxton (1982) Others 2.03 0.5000 Petersen and Luxton (1982) 14 Isopoda 2.30 0.1130 Hanagarth, et al. (1999) 15 Isoptera 1.50 0.6000 Petersen and Luxton (1982) 16 Lepidoptera (larvae) 6.21 1.9800 Hanagarth, et al. (1999) 17 Oligochaeta : Earthworms 48.13 21.000 Petersen and Luxton (1982) Enchytraeids 4.09 0.0320 Petersen and Luxton (1982) 18 Orthoptera 4.64 0.0100 Hanagarth, et al. (1999) 20 Pseudoscorpiones 1.50 0.1587 Hanagarth, et al. (1999) 21 Psocoptera 1.07 0.2777 Edwards (1967) 22 Thysanoptera 1.50 0.0200 Hanagarth, et al. (1999) 23 Trichoptera 2.68 0.2200 Hanagarth, et al. (1999)
a) Average body length measured in samples

Materials and Methods
21
Calculation of soil animal diversity
Diversity indices were calculated according to Shannon’s diversity index (Ludwig and
Reynolds 1988). The equation for the Shannon function is
s
H' = - ∑ [(ni /n) ln (ni /n)] i=1
Where ni is the number of individuals belonging to the ith of S species (or animal
groups) in the sample and n is the total number of individuals in the sample. The
diversity index was calculated for both, number of soil animal groups and their biomass.
The number of abundant and very abundant taxa was also calculated using the
Hill’s diversity number (Ludwig and Reynolds 1988). The equations of Hill’s number
are:
N1 = ℮ H′
N1 = number of abundant taxa in the samples
H′ =Shannon’s diversity index
N2 = 1/λ
N2 = number of very abundant taxa in the samples
λ = Simpson’s diversity index
λ = Simpson’s diversity index ni = number of individuals belonging to the ith n = total number of individuals in the sample
The third Hill’s number (N3) is the total number of taxa found in the samples
N3 = S
s λ = ∑ (ni /n)
i=1

Materials and Methods
22
Although Hill’s numbers are rarely used, they have the advantage of providing figures,
which actually have a biological meaning (number of abundant and very abundant taxa,
and total number of taxa), instead of indices, which do not have units (Ludwig and
Reynolds 1988).
Grouping and identification
All samples were sorted and counted in the laboratory using a stereomicroscope. All
animals were classified into taxonomic orders except for springtails, beetles, millipedes,
centipedes, and Oligochaeta. Springtails and beetles were classified into families. The
individuals of the classes of millipedes, centipedes and Oligochaeta were not classified
further. Identification was based on Borror et al. (1989) and Chu (1949). After the
animals had been placed into orders, they were classified based on their body length
according to the classification system of Van der Drift (1951) (Table 2.2).
Table 2.2: Classification system of soil fauna categories based on body length Categories Body Length (mm) Microfauna <0.2 Mesofauna 0.2 – 2.0 Macrofauna 2.0 – 20.0 Megafauna >20.0
2.5 Study of organic matter decomposition
The organic matter decomposition was studied in the field only using stainless-steel
litterbags 20 x 20 cm in size with the following mesh sizes 0.038, 0.25 and 10 mm
(Figure 2.9). A mesh size of 10 mm allows access to all meso- and macrofauna; a mesh
size of 0.25 mm excludes the soil macrofauna; and a mesh size of 0.038 mm excludes
meso- and macrofauna, respectively. Study of litter decomposition was conducted
during the whole study period beginning with the fallow, followed by the dry-seeded
rice and finally the transplanted rice season. Organic matter decomposition in the bunds
was not studied.
The decomposition rate of rice straw was studied in the treatment plots of crop-
planted bunds (no plants, cassava and mungbean) with bund distances of 4m and 8m.
Seven grams of air-dried rice straw litter were filled into each mesh size of the

Materials and Methods
23
litterbags. Two sides of the bags were then closed up by waterproof glue. The fine- and
medium-meshed bags were marked with individual numbers using a water-proof pen,
while the coarse bags were marked using a metal plate with numbers.
Figure 2.9: Litter bags with coarse-, medium- and fine-mesh sizes.
All litterbags were buried in sets of three (fine, medium and coarse). Seventy-
two bags were buried at approximately 5 to 7 cm depth in the field only of each
treatment plot at the onset of the fallow, dry-seeded rice and transplanted rice season,
respectively, giving a total of 216 bags per season (6 treatment plots x 3 mesh sizes x 4
reps x 3 dates). Twenty-four sets were randomly sampled from each plot at each
sampling time, i.e., 30, 60, and 90 days of exposure time. No litterbags were exposed in
the bunds.
Initial average weights of the exposed material were determined in 12 samples
collected on the day the material was exposed to the field. After the litterbags had been
harvested, they were emptied over a sieve (0.35 mm), and the litter was rinsed with tap
water to remove the soil. The litter content of each bag was dried in paper sheets, then
oven-dried (80oC, 48 h) and weighed. The decomposition rate was calculated from the
loss of weight after exposition, using the formula for negative exponential regression. In
order to assess the mineral content (soil) present in the samples, the litter of selected
samples was milled (<0.2 mm) and burned in a muffle furnace (700oC, 4h) to obtain the

Materials and Methods
24
residue weight. The calculated decomposition rate was corrected for the percentage of
the mineral content (residue) in the samples.
2.6 Study of nitrogen mineralization
Nitrogen (N) mineralization was studied by measuring the net nitrogen mineralization in
the field and the microbial activity (nitrifiers and denitrifiers) involved in the
nitrification and denitrification processes. Both were evaluated in the fields of all
treatment combinations with crop-planted bund (no plant, cassava and mungbean) and
bund distance (4m and 8m) in the fallow, dry-seeded rice and transplanted rice seasons,
respectively. No such samples were taken in the bunds.
2.6.1 Nitrogen mineralization
Net nitrogen mineralization was studied based on the method developed by Raison et al.
(1987) and Hübner et al. (1991), which uses undisturbed soil columns confined within
PVC tubes (25 cm depth and 8 cm diameter) containing ion-exchange resins in fine-
mesh nylon bags at the bottom of the intact soil core to account for nitrate leaching. A
polyurethane-foam disk at the bottom of the tubes was used to fix the fine-mesh nylon
bags (Figure 2.10). 8 cm 3 cm Hole Soil 25 cm PVC tube Anion-exchange resin Polyurethane-foam disk Figure 2.10: Equipment for in situ studies of N-mineralization
To obtain intact soil cores, twelve PVC tubes were randomly inserted into the
soil at each treatment plot and then carefully withdrawn. A soil layer of about 2-3 cm
was removed from the bottom of each core and the fine-mesh nylon bag containing 15 g
Materials and Methods
25
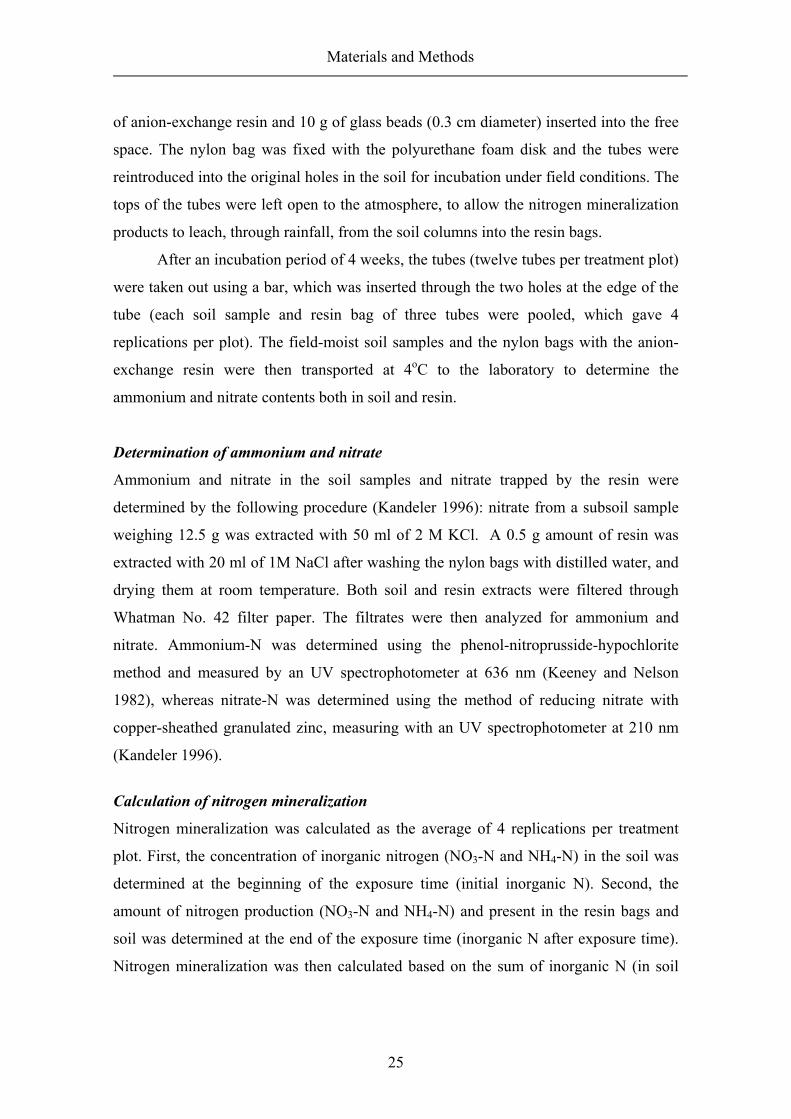
of anion-exchange resin and 10 g of glass beads (0.3 cm diameter) inserted into the free
space. The nylon bag was fixed with the polyurethane foam disk and the tubes were
reintroduced into the original holes in the soil for incubation under field conditions. The
tops of the tubes were left open to the atmosphere, to allow the nitrogen mineralization
products to leach, through rainfall, from the soil columns into the resin bags.
After an incubation period of 4 weeks, the tubes (twelve tubes per treatment plot)
were taken out using a bar, which was inserted through the two holes at the edge of the
tube (each soil sample and resin bag of three tubes were pooled, which gave 4
replications per plot). The field-moist soil samples and the nylon bags with the anion-
exchange resin were then transported at 4oC to the laboratory to determine the
ammonium and nitrate contents both in soil and resin.
Determination of ammonium and nitrate
Ammonium and nitrate in the soil samples and nitrate trapped by the resin were
determined by the following procedure (Kandeler 1996): nitrate from a subsoil sample
weighing 12.5 g was extracted with 50 ml of 2 M KCl. A 0.5 g amount of resin was
extracted with 20 ml of 1M NaCl after washing the nylon bags with distilled water, and
drying them at room temperature. Both soil and resin extracts were filtered through
Whatman No. 42 filter paper. The filtrates were then analyzed for ammonium and
nitrate. Ammonium-N was determined using the phenol-nitroprusside-hypochlorite
method and measured by an UV spectrophotometer at 636 nm (Keeney and Nelson
1982), whereas nitrate-N was determined using the method of reducing nitrate with
copper-sheathed granulated zinc, measuring with an UV spectrophotometer at 210 nm
(Kandeler 1996).
Calculation of nitrogen mineralization
Nitrogen mineralization was calculated as the average of 4 replications per treatment
plot. First, the concentration of inorganic nitrogen (NO3-N and NH4-N) in the soil was
determined at the beginning of the exposure time (initial inorganic N). Second, the
amount of nitrogen production (NO3-N and NH4-N) and present in the resin bags and
soil was determined at the end of the exposure time (inorganic N after exposure time).
Nitrogen mineralization was then calculated based on the sum of inorganic N (in soil

Materials and Methods
26
and resin) after the exposure time minus the initial inorganic nitrogen in the soil
(Kandeler 1996), as presented in the equation below:
[(NH4+-N + NO3
¯-N)A + (NO3¯-N)B] - [(NH4
+-N + NO3¯-N)C] = kg N.ha- 1
A Nmin content of the soil after the exposure time (kg N.ha-1) B nitrate adsorbed to the resin (kg N.ha-1) C initial Nmin content of the soil (kg N.ha-1)
2.6.2 Nitrifiers and denitrifiers
Nitrification and denitrification processes are primarily mediated by a group of
microorganisms. Therefore, the nitrification and denitrification potential was studied by
determining the activity of microorganisms involved in those processes using the most
probable number (MPN) method (Trolldenier 1996).
Nitrifiers were evaluated by calculating the population of Nitrosomonas, one of
the nitrifiers oxidizing ammonia to nitrite, and usually the most numerous nitrifiers in
soil (Biogeochemical Cycles 1998). The number of Nitrosomonas was calculated using
the nutrient medium developed by Verstraete (Anas 1989). Culture tubes were
inoculated with serially diluted soil suspensions. After a 4-week incubation period,
acidification of the medium was recorded by taking color change (red to orange or
yellow) as an indication for growth of ammonia oxidizers, and the most probable
number of Nitrosomonas was then calculated by referring to the MPN table (Trolldenier
1996).
Denitrifiers were also calculated using a medium of nutrient broth supplemented
with nitrate; this was a modified medium of Tiedje (1982). From a decimal diluted soil
suspension, aliquots were transferred into culture tubes containing inverted Durham
tubes. After 2 weeks of incubation, tubes showing gas formation in Durham tubes were
recorded, and the most probable number of denitrifiers was calculated by referring to
the MPN table (Trolldenier 1996).
2.7 Statistical analysis
Statistical analyses of the data on soil fauna, litter decomposition and nitrogen
mineralization were done using analysis of variance using the IRRISTAT Program. The
data were analyzed statistically as a factorial randomized block design with three levels

Materials and Methods
27
of treatments, i.e., the planting seasons (fallow, dry-seeded rice and transplanted rice),
crop-planted bund (control, cassava and mungbean) and two bund distance (4m and
8m), with four replications. To evaluate the differences in the treatments, the Least
Significant Difference (LSD) test was applied. Data on litter decomposition were also
calculated using the exponential decay regression from Sigma plot version 7.0.
To compare the mean value of the data of soil animal population and biomass,
the data were also analyzed using the Student’s T-test. Before being analyzed, all fauna
data were log-transformed to obtain approximately homogenous variances.

Results and Discussion
28
3 RESULTS AND DISCUSSION
3.1 Screening of soil fauna in different ecosystems of the region
In the screening test that was conducted during the fallow period, the total soil fauna
abundance determined using the Berlese funnel and hand-sorting method was high in
the teak forest (2340 individuals m-2) and home garden (2940 individuals m-2) and low
in the fallow paddy field (1790 individuals m-2) (Table 3.1). The teak forest also showed
the highest total soil fauna biomass (961 mg m-2), followed by home garden (368 mg
m-2) and fallow paddy field (309 mg m-2), respectively (Table 3.2). Nevertheless, due to
the high variance of the data, the Student’s t-test analysis on the log-transformed fauna
data showed that the differences in total soil fauna abundance and biomass were not
significant in the teak forest, home garden and fallow paddy field ecosystems.
3.1.1 Abundance and biomass
The mesofauna abundance was higher compared to that of the macrofauna, especially in
the home garden and fallow paddy field. Mesofauna numbers in the home garden and
paddy field were 2130 and 1450 individuals m-2 or 73% and 81% of the total number of
soil animals, respectively. Mesofauna numbers were significantly higher in the home
garden than in the fallow paddy field and teak forest (Student’s t-test, P<0.05). In
general, the mesofauna abundance was dominated by Acari (mites) and Collembola
(springtails). Their populations ranged between 20%-35% (mites) and 60%-80%
(springtails) of the total mesofauna. According to Lavelle and Spain (2001), Collembola
and Acari are generally dominant among mesofauna, both numerically and in terms of
biomass. Although mesofauna numbers were high, their biomass was low, as they are
small animals with body width ranging between 0.2 – 2 mm. Their biomass in the teak
forest, home garden and paddy field accounted for only 5.3 mg, 9.0 mg and 10.5 mg m-2
or 0.6%, 2.4% and 3.4% of the total animal biomass, respectively (Figure 3.1B).

Results and Discussion
29
Teak Forest Home Garden Fallow Paddy
Abun
danc
e (In
divi
dual
/m2 )
0
500
1000
1500
2000
2500
3000
3500MesofaunaMacrofaunaOligochaeta
A
Teak Forest Home Garden Fallow Paddy
Bio
mas
s (m
g/m
2 )
0
300
600
900
1200
1500
1800MesofaunaMacrofaunaOligochaeta
B
Figure 3.1: The abundance (A) and biomass (B) of soil fauna in ecosystem of teak
forest, home garden, and fallow paddy field.
In general, the individual macrofauna numbers were lower than those of the
mesofauna, except in the teak forest, accounting for less than 30% of the total number
of soil fauna. Nevertheless, their biomass was very high and reached more than 90% of
the total biomass (Table 3.2). Although the macrofauna abundance was higher in the
teak forest than in the home garden and fallow paddy field, the Student’s t-test analysis

Results and Discussion
30
showed no significant difference between macrofauna in those ecosystems. The
macrofauna abundance, however, was significantly higher in the home garden than in
the rainfed paddy field (Table 3.1). The most numerous macrofauna groups found in the
teak forest ecosystem were Formicidae (ants) and Isoptera (termites), while Diplura and
Coleoptera (beetles) dominated in the home garden and fallow paddy field, respectively.
Oligochaeta occurred only in the home garden and teak forest, and their abundance was
very low, attaining less than 1.0% of the total number of soil animals. In the teak forest,
however, the biomass of Oligochaeta was high, attaining 134 mg per m2 or 14.0% of the
total biomass.
3.1.2 Diversity
In the teak-forest and home-garden ecosystem, there were more taxa than in the fallow
paddy field. The teak forest and home garden had 21 taxa, whereas in the paddy field
only 13 taxa were found. Although the teak forest and the home garden contained the
same number of taxa, the diversity, calculated according to Shannon’s diversity index
(Ludwig and Reynolds 1988), was higher in the home garden (2.06) than in the teak
forest (1.82), while the fallow paddy field had the lowest animal diversity (1.67). In the
teak forest, Hill’s number (Ludwig and Reynolds 1988), a number indicating an
abundant taxa (N1) was 6.2, while the number of very abundant taxa (N2) was 3.7. In
fact, four taxa, namely Formicidae (Hymenoptera), Isoptera, Onychiuridae (Collembola)
and Oribatida (Acari) accounted for 79% of the total abundance. The number of
abundant taxa in the home garden was higher (8 taxa) than in the other ecosystems, with
five of them very abundant (N2) and accounting for 80% of the total abundance, namely
Isotomidae and Poduridae (Collembola), Tetranychidae (Acari), Japygidae (Diplura),
and Formicidae (Hymenoptera). Meanwhile, in the fallow paddy field five taxa were
found to be abundant, with four of them most numerous (88% of the total abundance),
i.e., Onychiuridae and Isotomidae (Collembola), Oribatida (Acari), and Coleoptera
(Table 3.1).

Results and Discussion
31
Table 3.1: Abundances (Individual/m2) of soil fauna in different ecosystems of the region (soil depth 0-15 cm; averages over five replications)
No. Taxa Teak Forest Home Garden Fallow Paddy Mean SD Mean SD Mean SD
Mesofauna 1 Acari: Oribatida (Oribatid mites) 166 a 233 134 a 82 229 a 114 Tetranychidae (Spider mites) 38 52 166 198 0 0 Others 57 65 140 80 57 128 Total Acari 261 a 250 440 a 188 287 a 1542 Collembola: Isotomidae 140 129 1100 590 446 449 Poduridae 83 77 471 476 0 0 Hypogastruridae 0 0 32 39 0 0 Entomobryidae 26 42 19 17 6 14 Neelidae 13 29 38 35 14 Onychiuridae 229 289 6 14 701 1160 Sminthuridae 0 0 6 14 0 0 Total Collembola 490 a 440 1680 a 514 1160 a 1470
3 Protura 6 14 0 0 0 0 4 Symphyla 13 17 13 17 0 Total Mesofauna 771 a 609 2130 b 572 1450 ab 1500 Macrofauna 5 Aranae (Spiders) 32 39 32 39 0 0 6 Coleoptera: Carabidae 13 17 0 0 38 86 Others ad. 6 a 14 32 a 55 198 b 184 Others la. 0 0 13 17 83 58
7 Chilopoda (Centipedes) 13 17 0 0 6 14 8 Diplopoda (Millipedes) juvenile 19 29 57 79 0 0 9 Diplura: Japygidae 0 0 217 120 0 0 Anajapygidae 0 0 6 14 0 0
10 Diptera 0 0 0 0 6 14 11 Hymenoptera: Formicidae (Ants) 1190 ab 1670 414 b 717 6 ac 14 Others 0 0 19 43 6 14
12 Isopoda 6 14 0 0 0 0 13 Isoptera (Termites) 268 581 0 0 0 0 14 Lepidoptera (larvae) 6 14 13 17 0 0 15 Pseudoscorpiones 13 17 0 0 0 0
Total Macrofauna 1560 ab 1580 803 b 604 344 ac 277 Oligochaeta:
16 Earthworms 6 14 0 0 0 0 17 Enchytraeids 0 0 13 29 0 0
Total Oligochaeta 6 14 13 29 0 0 Number of Individual/m2 2340 a 1830 2940 a 1050 1790 a 1460
Number of Taxa/m2 21 21 13 Shannon's Diversity Index 1.82 2.06 1.67 N1 (no. of abundant taxa) 6.2 7.8 5.3
N2(no. of very abundant taxa) 3.7 5.0 4.0 In a row, means followed by a common letter are not significantly different at the 5% level (Student’s t- test on log-transformed fauna data)

Results and Discussion
32
For the three ecosystems, namely teak forest, home garden and fallow paddy
field, two groups of animals, i.e., Collembola and Acari, were the dominant taxa in
terms of individual numbers. They were not only the most numerous animal groups,
especially in the home garden and paddy field, but also always occurred in those
ecosystems. Actually, ants were the most abundant animal group in the teak forest;
however, they were not dominant in the other two ecosystems, and were rare in the
fallow paddy field. Due to the high variance of the data, the high number of ants in the
teak forest did not significantly differ from the number of ants in the home garden and
paddy field.
The diversity index calculated from soil fauna biomass was higher in the home
garden (1.53) than that in the teak forest (1.22) and fallow paddy field (1.21). Three
groups of animals dominated the soil fauna biomass in the teak forest, namely
Formicidae (ants), Isoptera (termites), and earthworms, making up for more than 90%
of the total soil fauna biomass. Ant biomass was high in the teak forest and low in the
paddy field. Ants also dominated soil fauna biomass in the home garden, along with
Diplopoda and Coleoptera, accounting for 78% of the total soil fauna biomass. Their
biomass was significantly higher in the home garden than in the paddy field and did not
differ from that in the teak forest. In the fallow paddy field, Coleoptera, both larvae and
adults, dominated the soil fauna biomass, accounting for more than 90% of the total in
this ecosystem. The number of adults was significantly higher here than in the teak
forest and home garden (Table 3.2).

Results and Discussion
33
Table 3.2: Biomass (mg/m2) of soil fauna in different ecosystem of the region (averages over five replications)
No. Taxa Teak Forest Home Garden Fallow Paddy
Mean SD Mean SD Mean SD Mesofauna
1 Acari: Oribatida (Oribatid mites) 0.18 a 0.26 0.15 a 0.09 0.25 a 0.12 Tetranychidae (Spider mites) 0.17 0.24 0.75 0.89 0.00 0.00 Others 0.26 0.29 0.63 0.36 0.26 0.58 Total Acari 0.61 a 0.48 1.52 bc 0.77 0.51 ac 0.57 2 Collembola : Isotomidae 0.62 0.57 4.85 2.60 1.96 1.97 Poduridae 0.19 0.18 1.08 1.10 0.00 0.00 Hypogastruridae 0.00 0.00 0.18 0.22 0.00 0.00 Entomobryidae 0.21 0.35 0.16 0.15 0.05 0.12 Neelidae 0.03 0.07 0.09 0.08 0.01 0.03 Onychiuridae 2.61 3.29 0.07 0.16 7.99 13.27 Sminthuridae 0.00 0.00 0.01 0.03 0.00 0.00 Total Collembola 3.66 a 3.66 6.45 a 2.27 10.00 a 14.503 Protura 0.01 0.01 0.00 0.00 0.00 0.00 4 Symphyla 1.02 1.40 1.02 1.40 0.00 0.00 Total Mesofauna 5.30 a 5.07 8.99 a 3.08 10.50 a 14.40 Macrofauna 5 Aranae (Spiders) 18.20 22.30 18.20 22.30 0.00 0.00 6 Coleoptera: Carabidae 11.66 15.90 0.00 0.00 34.90 78.00 Others ad. 5.53 a 12.40 27.70 a 47.90 172.00 b 159.00 Others la. 0.00 0.00 12.60 17.30 81.90 57.007 Chilopoda (Centipedes) 0.66 0.91 0.00 0.00 0.33 0.74 8 Diplopoda (Millipedes) juvenile 17.00 26.80 53.90 74.60 0.00 0.00 9 Diplura: Japygidae 0.00 0.00 4.33 2.40 0.00 0.00 Anajapygidae 0.00 0.00 0.13 0.28 0.00 0.00
10 Diptera 0.00 0.00 0.00 0.00 2.86 6.39 11 Hymenoptera: Formicidae (Ants) 592.00 ab 836.00 207.00 b 359.00 3.19 ac 7.12 Others 0.00 0.00 9.55 21.40 3.19 7.12
12 Isopoda 0.72 1.61 0.00 0.00 0.00 0.00 13 Isoptera (Termites) 161.00 348.00 0.00 0.00 0.00 0.00 14 Lepidoptera (larvae) 12.60 28.20 25.22 34.50 0.00 0.00 15 Pseudoscorpiones 2.02 2.77 0.00 0.00 0.00 0.00
Total Macrofauna 822.00 a 781.00 359.00 a 322.00 298.00 a 238.00 Oligochaeta:
16 Earthworms 134.00 299.00 0.00 0.00 0.00 0.00 17 Enchytraeids 0.00 0.00 0.41 0.91 0.00 0.00
Total Oligochaeta 134.00 299.00 0.41 0.91 0.00 0.00 Biomass Total/m2 961.00 a 933.00 368.00 a 289.00 309.00 a 235.00
Shannon's Diversity Index 1.22 1.53 1.21 In a row, means followed by a common letter are not significantly different at the 5% level (Student’s t- test on log-transformed animal data)
3.1.3 Bait-lamina feeding activity
Feeding activity was assessed during the rainy season in the teak forest, home garden
and the rainfed paddy field experiments. The bait-lamina test was used, an easy and
Results and Discussion
34
quick method for monitoring the feeding activity of soil-living animals. However, this
method does not allow differentiation of the animal groups that are involved in the
feeding process. The feeding stratification, indicating soil animal activity in various soil
depths was also assessed.
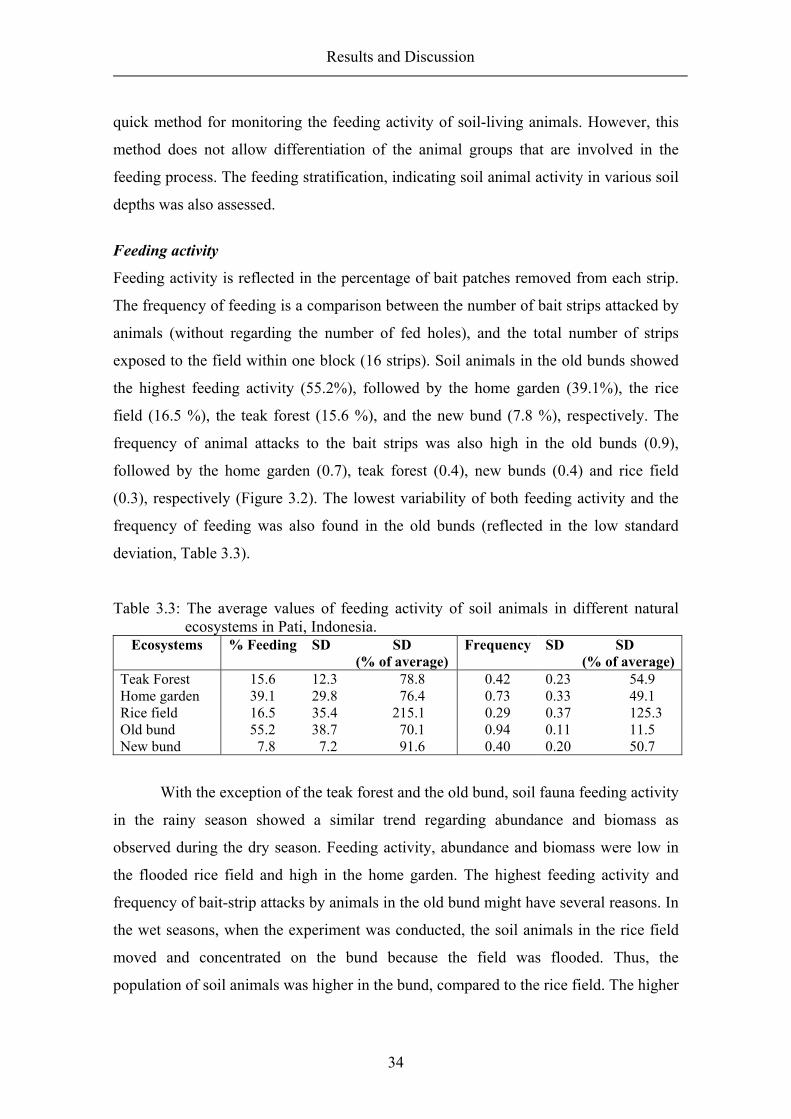
Feeding activity
Feeding activity is reflected in the percentage of bait patches removed from each strip.
The frequency of feeding is a comparison between the number of bait strips attacked by
animals (without regarding the number of fed holes), and the total number of strips
exposed to the field within one block (16 strips). Soil animals in the old bunds showed
the highest feeding activity (55.2%), followed by the home garden (39.1%), the rice
field (16.5 %), the teak forest (15.6 %), and the new bund (7.8 %), respectively. The
frequency of animal attacks to the bait strips was also high in the old bunds (0.9),
followed by the home garden (0.7), teak forest (0.4), new bunds (0.4) and rice field
(0.3), respectively (Figure 3.2). The lowest variability of both feeding activity and the
frequency of feeding was also found in the old bunds (reflected in the low standard
deviation, Table 3.3).
Table 3.3: The average values of feeding activity of soil animals in different natural ecosystems in Pati, Indonesia.
Ecosystems % Feeding SD SD (% of average)
Frequency SD SD (% of average)
Teak Forest 15.6 12.3 78.8 0.42 0.23 54.9 Home garden 39.1 29.8 76.4 0.73 0.33 49.1 Rice field 16.5 35.4 215.1 0.29 0.37 125.3 Old bund 55.2 38.7 70.1 0.94 0.11 11.5 New bund 7.8 7.2 91.6 0.40 0.20 50.7
With the exception of the teak forest and the old bund, soil fauna feeding activity
in the rainy season showed a similar trend regarding abundance and biomass as
observed during the dry season. Feeding activity, abundance and biomass were low in
the flooded rice field and high in the home garden. The highest feeding activity and
frequency of bait-strip attacks by animals in the old bund might have several reasons. In
the wet seasons, when the experiment was conducted, the soil animals in the rice field
moved and concentrated on the bund because the field was flooded. Thus, the
population of soil animals was higher in the bund, compared to the rice field. The higher

Results and Discussion
35
population density led to the increase in feeding activity of soil animals in the bund. In
contrast, the feeding activity declined in the rice field. In their laboratory experiments,
Helling et al. (1998) demonstrated that feeding activity of collembolans and
enchytraeids was strongly correlated with the number of individuals. The limited
resource of feed in the bund may also have caused the soil animals to feed only on bait
materials, and this would then have been reflected in high bait-lamina feeding activity in
the old bund. The lowest feeding activity of soil animals in the new bund was certainly
related to the low population density. The abundance of soil fauna in the new bund is
low because the soil structures that provide a habitat for soil fauna have not yet been
established.
The high feeding activity and frequency in the home garden correspond with the
high abundance and biomass. However, in the teak forest, although soil fauna
abundance and biomass were high, their feeding activity and frequency were low. Some
field experiments using bait-lamina showed similar results (Federschmidt and Römbke
1994; Heisler 1994); here the high population density was not always followed by high
feeding activity. Litter as a source of feed for soil animals is abundant on the forest floor
and may be the reason for the low bait-lamina feeding activity.
TF HG RF BO BN
Ecosystem
% F
eedi
ng
0
0.2
0.4
0.6
0.8
1
Freq
uenc
y
Bars = Feeding activity (%) Lines = Frequency Figure 3.2: Percentage and frequency of animal feeding in different natural ecosystems
in Pati, Indonesia (TF = teak forest, HG = home garden, RF = rice field, BO = old bund and BN = new bund)

Results and Discussion
36
Feeding stratification
The average values of feeding activity depth indicate that, in general, the soil animals
fed in the upper part (0-4 cm) of the bait-lamina rather than in the lower part
(Table 3.4). In the rice field, although the difference was not obvious, there was a
tendency for the animals to feed more in the upper part of the bait strips. In almost all
locations, the soil animals fed from the upper part (0-4 cm), particularly in the old bund,
although the reduction from the 1st hole to the 16th hole of the bait-lamina was higher in
the teak forest (60%) than in the old bund (45%) (Figure 3.3). This was presumably due
to the fact that almost all soil organisms live in the top soil layer, because they feed on
litter or organic matter, which is abundant there.
Holes (Soil Depth) *
Freq
uenc
y
0.0
0.2
0.4
0.6
0.8
1.0Teak ForestHome GardenRainfed PaddyOld BundNew Bund
1 2 3 4 5 6 7 8 9 10 11 12 1513 14 16
Figure 3.3: The frequency of bait lamina attacked by animals in various depth of soil in
different natural ecosystems in Pati, Indonesia (* : between hole, # = 0.55 cm)
Resume
In the fauna survey during the dry season, soil fauna in the teak forest and home garden
showed a higher abundance compared to the fallow paddy field, and their biomass was
higher in the teak forest than in the home garden and paddy field. In these three

Results and Discussion
37
ecosystems, two groups of animals, i.e. Collembola and Acari, were the dominant
animals in terms of individual numbers. They were not only the most numerous groups,
but also always occurred in those ecosystems. Three groups of animals dominated soil
animal biomass in the teak forest, namely Formicidae (ants), Isoptera (termites), and
earthworms. Formicidae also dominated soil animal biomass in the home garden, along
with Diplopoda and Coleoptera, whereas in the fallow paddy field, both larvae and
adults of Coleoptera dominated soil animal biomass.
The activity of soil fauna in these ecosystems during the rainy season (teak
forest, home garden and rainfed paddy field) was also evaluated by measuring their
feeding activity using the bait-lamina test. Soil fauna feeding activity was high in the
home garden and low in the rainfed paddy field, as expected from soil fauna abundance
and biomass. However, although soil fauna abundance and biomass were high in the
teak forest, their feeding activity was low at this site. In addition, feeding activity was
determined in the old bunds (permanently established bund around rice fields). Here,
animal-feeding activity was the highest.
3.2 Soil fauna dynamics in rainfed paddy field
3.2.1 Soil fauna dynamics in fallow and rice field phases
In a rainfed paddy field, which undergoes two different conditions, i.e., a terrestrial
phase during the fallow periods and a flooded phase during the periods of dry-seeded
rice and transplanted rice, the soil fauna population changed dynamically following the
seasonal changes. On average, the abundance of the soil fauna during the rice-field
phases was lower than that in the fallow phase, while the soil fauna biomass was higher
in the rice field, especially in the bund (Table 3.4 and 3.6).
Soil fauna abundance
The evaluation of soil fauna abundance was started in the fallow phase (August to
October), continued into the rice phases, i.e., dry-seeded rice (November to January)
and transplanted rice (March to May), and ended in the early fallow (June). In the
fallow phase, soil fauna was extracted from soil samples taken at six randomized points
at each sampling time. The total number of soil fauna decreased from August (3340
individuals m-2/ ind. m-2) to September (1230 ind. m-2) and October (228 ind. m-2). The
Results and Discussion
38
decline of the soil fauna abundance during the fallow period is presumably due to the
fact that the soils underwent desiccation, especially in the peak of the dry season around
September and October.
In the rice phase, the soil samples were taken from four randomized points in
both the field and the bund of the six treatments (see Section 2.3). The soil fauna was
then extracted from the soil samples using the Berlese funnel method and evaluated at
each sampling time during the dry-seeded rice and transplanted rice seasons,
respectively. In the early fallow, shortly after the final harvesting, the bunds were
destroyed and soil samples were taken from four randomized points in each treatment
plot.

Results and Discussion
39
Table 3.4: Average soil fauna abundance (Individual/m2) and diversity in fallow, dry-seeded rice and transplanted rice (soil depth 0-15 cm).
1 Fallow a) August September October Field Bund Field Bund Field Bund Mean SD Mean SD Mean SD Mean SD Mean SD Mean SD
Mesofauna 3140 2220 1120 424 181 89 Macrofauna 196 98 101 86 37 37 Oligochaeta 11 26 11 16 11 16 Total 3340 2300 1230 446 228 136 Diversity 1.7 0.2 0.7 0.3 1.6 0.7 2 Dry-Seeded Rice November December January
Mesofauna 1010 1550 882 382 179 145 246 243 139 89 199 91 Macrofauna 96 158 55 48 15 13 21 16 29 56 31 26 Oligochaeta 56 133 5 6 9 15 7 6 0 0 3 6 Total 1160 1530 942 424 203 134 273 228 169 111 233 86 Diversity 1.0 0.4 1.5 0.2 1.6 0.6 1.8 0.5 1.5 0.2 1.8 0.3 3 Transplanted Rice March April May
Mesofauna 608 835 1160 1070 186 182 602 241 1050 473 1340 688 Macrofauna 44 48 130 128 36 27 102 52 188 261 96 74 Oligochaeta 1 3 3 6 0 0 41 26 3 4 0 0 Total 653 882 1290 1200 222 183 746 267 1240 547 1600 719 Diversity 1.7 0.4 1.7 0.5 2.0 0.2 2.1 0.3 2.2 0.3 2.4 0.4 4 Fallow a) June
Mesofauna 2280 1630 Macrofauna 556 825 Oligochaeta 10 4 Total 2850 1670 Diversity 1.9 0.2 a)In fallow periods, the bunds were destroyed

Results and Discussion
40
Table 3.4 shows that at the beginning of the dry-seeded rice (November), the soil
fauna occurred in much higher numbers compared to those observed in October. Their
numbers recovered somewhat during field preparation, but declined both in the field and
in the bund from November to December, and stayed low in January. At the onset of
transplanted rice, the abundance of soil fauna again reached higher numbers, both in the
field and in the bund. They were lower in the subsequent sampling (April) but rose at
the end of the transplanted rice (May). In early fallow, one month after the rice had been
harvested and the field drained, soil fauna abundance increased to higher numbers than
those observed in May (Figure 3.4).
Mesofauna abundance exhibited a pattern similar to that of the macrofauna.
Abundance was high at the onset of the new cropping system, i.e., at the beginning of
the dry-seeded rice (November), transplanted rice (March) and early fallow (June)
periods (Figure 3.4A and 3.4B). Nevertheless, in general, their numbers indicated
distinct seasonal changes, decreasing during the flooded periods, then starting to
increase during the transplanted rice season and reaching the high numbers in the early
fallow phase, shortly after the field had been drained (Table 3.4).
During the dry-seeded rice and transplanted rice phases, soil fauna abundance in
the bund was significantly higher than that in the field (Table 3.5). This was particularly
observed in the case of the meso- and macrofauna (Figure 3.4A and 3.4B) and is
presumably due to the fact that conditions in the bund are more aerobic than in the field,
which may be more favorable for most soil fauna.
Table 3.5: ANOVA test on soil fauna abundance and biomass at two different sampling sites (field and bund) and sampling times (F mean of field, B mean of bund).
Sampling Times P
Sampling Sites P
Dry Seeded Rice: Abundance <0.01 <0.05 (B>F) Biomass <0.05 ns Transplanted Rice: Abundance <0.01 <0.01 (B>F) Biomass <0.01 <0.01 (B>F)
Oligochaeta (enchytraeids and earthworms) abundance did not show any
particular pattern, i.e., they occurred both in the fallow and the rice field periods. In the
fallow period, Oligochaeta occurred in equal numbers at each sampling time, whereas in
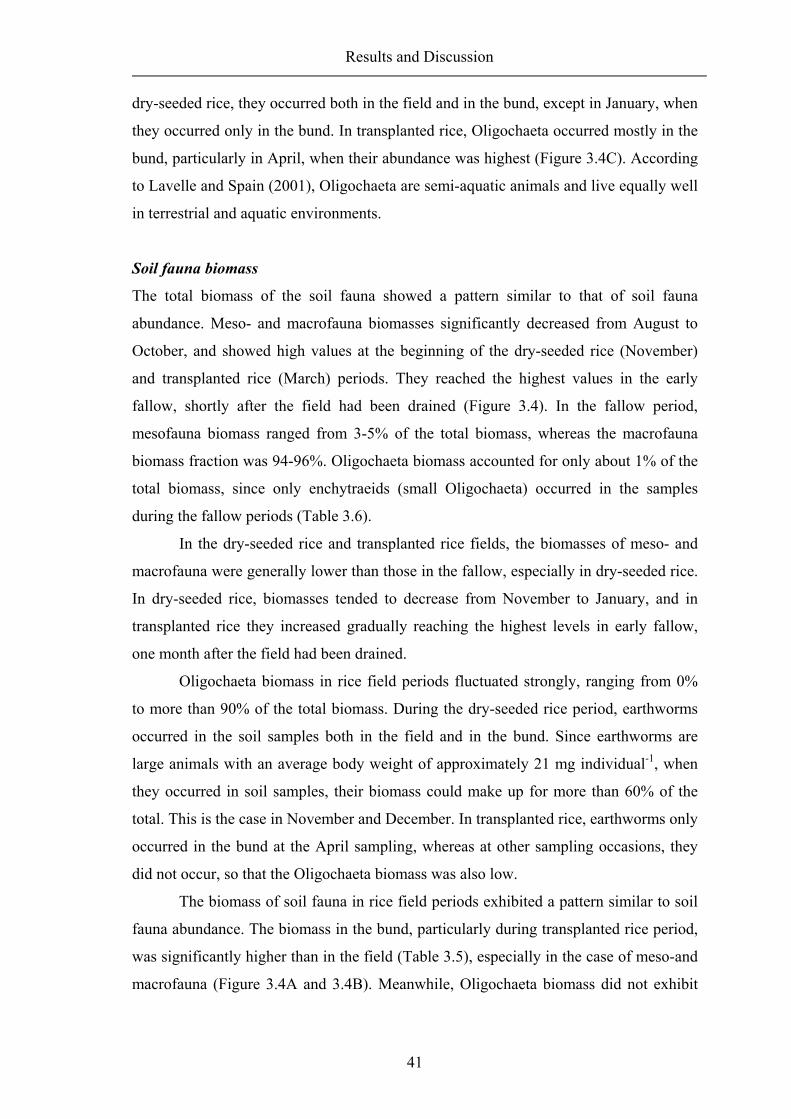
Results and Discussion
41
dry-seeded rice, they occurred both in the field and in the bund, except in January, when
they occurred only in the bund. In transplanted rice, Oligochaeta occurred mostly in the
bund, particularly in April, when their abundance was highest (Figure 3.4C). According
to Lavelle and Spain (2001), Oligochaeta are semi-aquatic animals and live equally well
in terrestrial and aquatic environments.
Soil fauna biomass
The total biomass of the soil fauna showed a pattern similar to that of soil fauna
abundance. Meso- and macrofauna biomasses significantly decreased from August to
October, and showed high values at the beginning of the dry-seeded rice (November)
and transplanted rice (March) periods. They reached the highest values in the early
fallow, shortly after the field had been drained (Figure 3.4). In the fallow period,
mesofauna biomass ranged from 3-5% of the total biomass, whereas the macrofauna
biomass fraction was 94-96%. Oligochaeta biomass accounted for only about 1% of the
total biomass, since only enchytraeids (small Oligochaeta) occurred in the samples
during the fallow periods (Table 3.6).
In the dry-seeded rice and transplanted rice fields, the biomasses of meso- and
macrofauna were generally lower than those in the fallow, especially in dry-seeded rice.
In dry-seeded rice, biomasses tended to decrease from November to January, and in
transplanted rice they increased gradually reaching the highest levels in early fallow,
one month after the field had been drained.
Oligochaeta biomass in rice field periods fluctuated strongly, ranging from 0%
to more than 90% of the total biomass. During the dry-seeded rice period, earthworms
occurred in the soil samples both in the field and in the bund. Since earthworms are
large animals with an average body weight of approximately 21 mg individual-1, when
they occurred in soil samples, their biomass could make up for more than 60% of the
total. This is the case in November and December. In transplanted rice, earthworms only
occurred in the bund at the April sampling, whereas at other sampling occasions, they
did not occur, so that the Oligochaeta biomass was also low.
The biomass of soil fauna in rice field periods exhibited a pattern similar to soil
fauna abundance. The biomass in the bund, particularly during transplanted rice period,
was significantly higher than in the field (Table 3.5), especially in the case of meso-and
macrofauna (Figure 3.4A and 3.4B). Meanwhile, Oligochaeta biomass did not exhibit
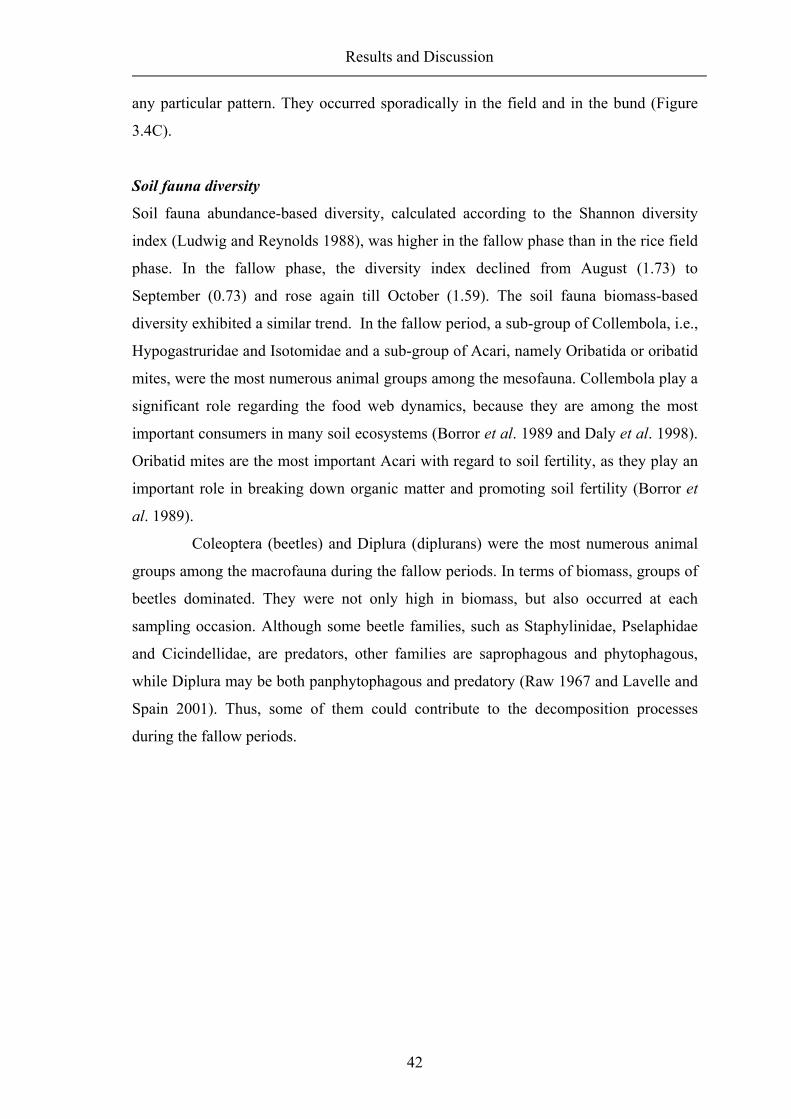
Results and Discussion
42
any particular pattern. They occurred sporadically in the field and in the bund (Figure
3.4C).
Soil fauna diversity
Soil fauna abundance-based diversity, calculated according to the Shannon diversity
index (Ludwig and Reynolds 1988), was higher in the fallow phase than in the rice field
phase. In the fallow phase, the diversity index declined from August (1.73) to
September (0.73) and rose again till October (1.59). The soil fauna biomass-based
diversity exhibited a similar trend. In the fallow period, a sub-group of Collembola, i.e.,
Hypogastruridae and Isotomidae and a sub-group of Acari, namely Oribatida or oribatid
mites, were the most numerous animal groups among the mesofauna. Collembola play a
significant role regarding the food web dynamics, because they are among the most
important consumers in many soil ecosystems (Borror et al. 1989 and Daly et al. 1998).
Oribatid mites are the most important Acari with regard to soil fertility, as they play an
important role in breaking down organic matter and promoting soil fertility (Borror et
al. 1989).
Coleoptera (beetles) and Diplura (diplurans) were the most numerous animal
groups among the macrofauna during the fallow periods. In terms of biomass, groups of
beetles dominated. They were not only high in biomass, but also occurred at each
sampling occasion. Although some beetle families, such as Staphylinidae, Pselaphidae
and Cicindellidae, are predators, other families are saprophagous and phytophagous,
while Diplura may be both panphytophagous and predatory (Raw 1967 and Lavelle and
Spain 2001). Thus, some of them could contribute to the decomposition processes
during the fallow periods.

Results and Discussion
43
Table 3.6: Average soil fauna biomass (mg/m2) and diversity in fallow, dry-seeded rice and transplanted rice (soil depth 0-15 cm).
1. Fallow a) August September October
Field Bund Field Bund Field Bund Mean SD Mean SD Mean SD Mean SD Mean SD Mean SD
Mesofauna 9.1 5.2 2.1 0.8 1.1 0.8 Macrofauna 160.0 80.4 68.2 54.4 23.4 32.2 Oligochaeta 0.3 0.8 0.3 0.5 0.3 0.5 Total 169.0 83.1 70.6 55.1 24.9 33.3 Diversity 1.63 0.14 1.04 0.32 1.15 0.23 2. Dry Seeded Rice November December January
Mesofauna 2.6 4.0 2.7 1.2 0.5 0.3 0.8 0.7 0.6 0.5 0.8 0.4 Macrofauna 67.4 129.0 37.9 32.9 9.2 9.4 13.8 9.9 20.7 18.8 44.7 13.9 Oligochaeta 419.0 1030.0 55.8 137.0 167.0 259.0 139.0 126.0 0.0 0.0 0.1 0.2 Total 489.0 1010.0 96.5 160.0 177.0 266.0 154.0 132.0 21.3 44.8 45.6 13.7 Diversity 0.67 0.43 1.32 0.39 0.42 0.31 0.47 0.22 0.70 0.47 0.96 0.32 3. Transplanted Rice March April May
Mesofauna 2.3 3.2 3.9 3.0 3.0 5.5 3.8 1.9 6.7 5.5 8.6 5.0 Macrofauna 20.3 25.8 69.0 67.2 20.2 12.3 52.1 42.0 89.2 49.5 151.0 43.6 Oligochaeta 0.0 0.0 55.7 137.0 0.0 0.0 929.0 607.0 55.7 86.3 0.0 0.0 Total 22.7 24.4 129.0 193.0 23.2 15.5 985.0 587.0 152.0 73.7 160.0 45.3 Diversity 1.31 0.35 1.55 0.43 1.10 0.54 0.38 0.27 1.74 0.64 2.14 0.26 4. Fallow a) June
Mesofauna 11.0 7.4 Macrofauna 306.0 409.0 Oligochaeta 18.9 45.5 Total 336.0 399.0 Diversity 1.68 0.60 a) In fallow periods, the bunds were destroyed

Results and Discussion
44
During the flooded periods or rice field phases, the higher abundance and
biomass of soil fauna in the bund were accompanied by a higher diversity of soil fauna
abundance and biomass. The soil animal group that still remained in the field during the
dry-seeded rice comprised mostly Collembola and larvae of Coleoptera and Diptera.
Earthworms and enchytraeids were only occasionally found, although they have a
higher biomass than macrofauna. In the bund, the soil fauna was found to be more
diverse, e.g., it contained Collembola, Acari, Diptera, Oligochaeta, Coleoptera, and
Hymenoptera (Formicidae or ants).
At the beginning of the transplanted rice period, the rainfall started to decline
(Table 3.1), and the water in the field gradually receded; soil fauna was, therefore, more
diverse both in the field and in the bund. Soil fauna in the field was still dominated by
Collembola, followed by Acari (particularly oribatid mites), Coleoptera (Staphylinidae)
and Plecoptera, whereas the soil animal groups that occurred in the bund were mainly
Collembola, Acari, Diptera, earthworms, and Orthoptera. In general, Collembola,
namely Sminthuridae, were the most numerous in the field during the flooded periods
(Figure 3.6A), followed by oribatid mites (Figure 3.5).
In early fallow, one month after the field had been drained, the most numerous
animal groups were still Collembola; however different families occurred, i.e.,
Hypogastruridae and Entomobryidae, followed by oribatid mites. In terms of biomass,
Coleoptera and Hymenoptera (Formicidae) dominated. The presence of Collembola,
Acari, and larvae and adults of Coleoptera during both the dry and the flooded periods
was important for maintaining the soil fertility, since most of them act as decomposers.

Results and Discussion
45
AugSep Oct NovDec Jan Mar AprMay jun
Abun
danc
e (In
divi
dual
/m2)
0
1000
2000
3000
4000
5000
6000
FieldBund
**
Aug Sep Oct Nov Dec Jan Mar Apr May jun0
200
400
600
800
1000
1500
Aug Sep Oct Nov Dec Jan Mar Apr May jun0
20
40
60
80
AugSep Oct NovDec Jan Mar Apr May jun
Bio
mas
s (m
g/m
2)
0
5
10
15
20
AugSep Oct NovDec Jan Mar Apr May jun0
200
400
600
800
AugSep Oct NovDec Jan Mar Apr May jun0
200
400
600
800
1000
1200
1400
1600
1800
A. MesofaunaAb
unda
nce
(Indi
vidu
al/m
2)Ab
unda
nce
(Indi
vidu
al/m
2)
Bio
mas
s (m
g/m
2)B
iom
ass
(mg/
m2)
B. Macrofauna
C. Oligochaeta
Fallow *)DS Rice TRP Rice
*) In fallow periods, the bunds were destroyed
**
*
Fallow *)
Fallow *)DS Rice
DS RiceTRP Rice
TRP RiceEarly Fallow
Early Fallow
Early Fallow
**
*
**
*
**
**
FieldBund
Figure 3.4: Soil animal abundance and biomass in fallow, dry-seeded rice (DS rice) and transplanted rice (TRP rice)(soil depth 0-15 cm; ANOVA on log-transformed fauna data, **: P<0.01; *:P<0.05)
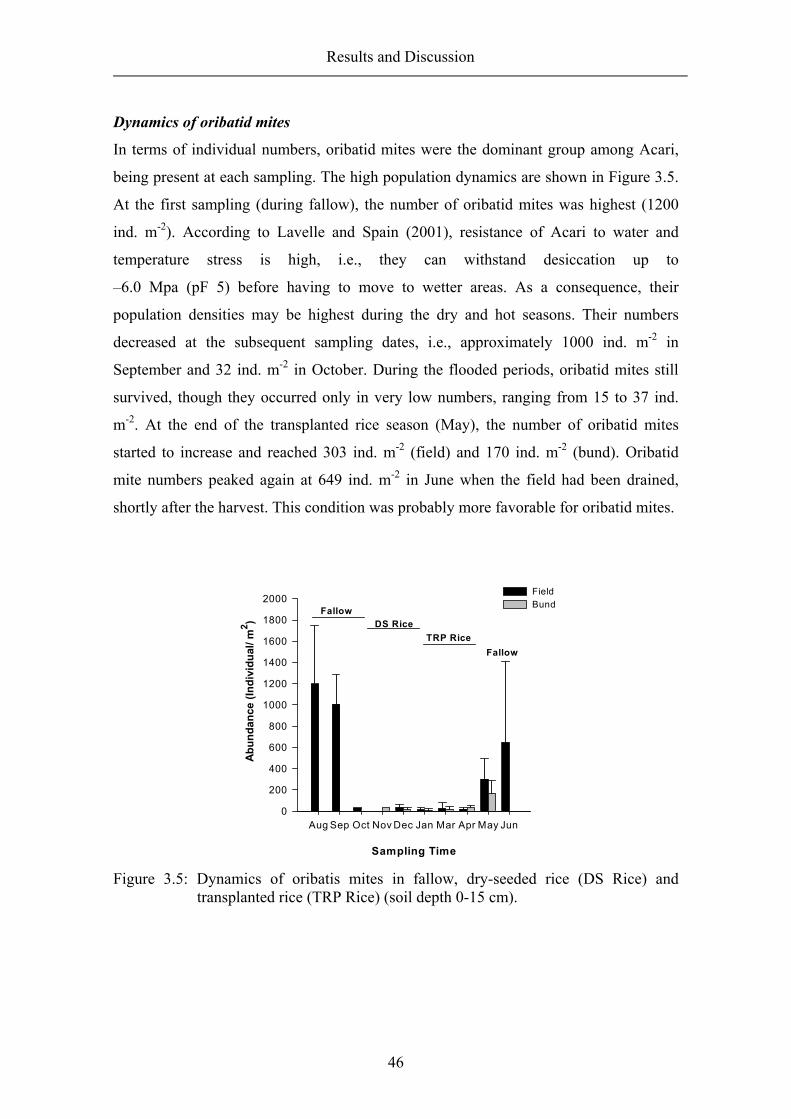
Results and Discussion
46
Dynamics of oribatid mites
In terms of individual numbers, oribatid mites were the dominant group among Acari,
being present at each sampling. The high population dynamics are shown in Figure 3.5.
At the first sampling (during fallow), the number of oribatid mites was highest (1200
ind. m-2). According to Lavelle and Spain (2001), resistance of Acari to water and
temperature stress is high, i.e., they can withstand desiccation up to
–6.0 Mpa (pF 5) before having to move to wetter areas. As a consequence, their
population densities may be highest during the dry and hot seasons. Their numbers
decreased at the subsequent sampling dates, i.e., approximately 1000 ind. m-2 in
September and 32 ind. m-2 in October. During the flooded periods, oribatid mites still
survived, though they occurred only in very low numbers, ranging from 15 to 37 ind.
m-2. At the end of the transplanted rice season (May), the number of oribatid mites
started to increase and reached 303 ind. m-2 (field) and 170 ind. m-2 (bund). Oribatid
mite numbers peaked again at 649 ind. m-2 in June when the field had been drained,
shortly after the harvest. This condition was probably more favorable for oribatid mites.
Sampling Time
Aug Sep Oct Nov Dec Jan Mar Apr May Jun
Abu
ndan
ce (I
ndiv
idua
l/ m
2 )
0
200
400
600
800
1000
1200
1400
1600
1800
2000FieldBund
FallowDS Rice
TRP RiceFallow
Figure 3.5: Dynamics of oribatis mites in fallow, dry-seeded rice (DS Rice) and
transplanted rice (TRP Rice) (soil depth 0-15 cm).
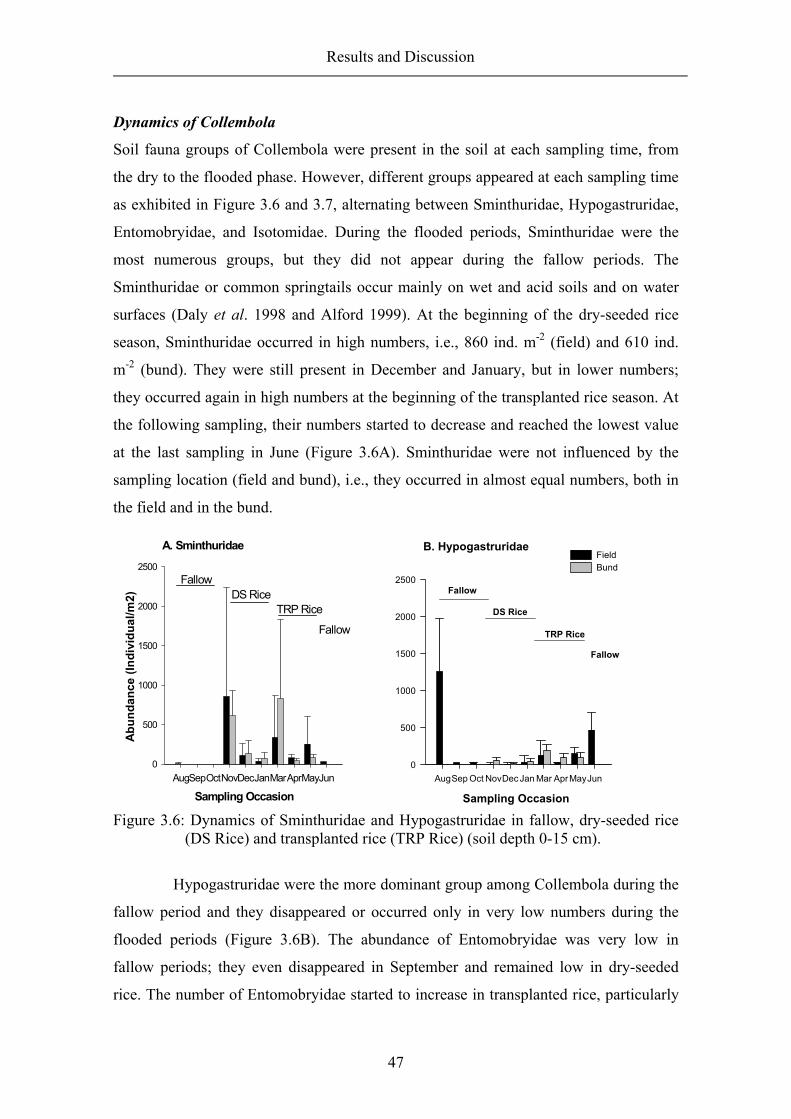
Results and Discussion
47
Dynamics of Collembola
Soil fauna groups of Collembola were present in the soil at each sampling time, from
the dry to the flooded phase. However, different groups appeared at each sampling time
as exhibited in Figure 3.6 and 3.7, alternating between Sminthuridae, Hypogastruridae,
Entomobryidae, and Isotomidae. During the flooded periods, Sminthuridae were the
most numerous groups, but they did not appear during the fallow periods. The
Sminthuridae or common springtails occur mainly on wet and acid soils and on water
surfaces (Daly et al. 1998 and Alford 1999). At the beginning of the dry-seeded rice
season, Sminthuridae occurred in high numbers, i.e., 860 ind. m-2 (field) and 610 ind.
m-2 (bund). They were still present in December and January, but in lower numbers;
they occurred again in high numbers at the beginning of the transplanted rice season. At
the following sampling, their numbers started to decrease and reached the lowest value
at the last sampling in June (Figure 3.6A). Sminthuridae were not influenced by the
sampling location (field and bund), i.e., they occurred in almost equal numbers, both in
the field and in the bund.
A. Sminthuridae
Sampling OccasionAugSepOctNovDecJanMarAprMayJun
Abu
ndan
ce (I
ndiv
idua
l/m2)
0
500
1000
1500
2000
2500Fallow
DS RiceTRP Rice
Fallow
B. Hypogastruridae
Sampling Occasion
AugSep Oct NovDec Jan Mar AprMayJun0
500
1000
1500
2000
2500
Field Bund
Fallow
DS Rice
TRP Rice
Fallow
Figure 3.6: Dynamics of Sminthuridae and Hypogastruridae in fallow, dry-seeded rice
(DS Rice) and transplanted rice (TRP Rice) (soil depth 0-15 cm).
Hypogastruridae were the more dominant group among Collembola during the
fallow period and they disappeared or occurred only in very low numbers during the
flooded periods (Figure 3.6B). The abundance of Entomobryidae was very low in
fallow periods; they even disappeared in September and remained low in dry-seeded
rice. The number of Entomobryidae started to increase in transplanted rice, particularly

Results and Discussion
48
in the bunds, where their numbers were higher than in the fields. They reached their
highest number at the subsequent sampling time, i.e., in the early fallow period (Figure
3.7A). Isotomidae were also found abundantly during the fallow (Figure 3.7B). The
highest numbers were observed in August. Numbers started to decrease in September
and October, staying low during the rice field periods, especially in transplanted rice,
but re-appearing in high numbers in the early fallow.
A. E n to m o b ry id ae
S am p lin g O ccas io nA u g S e p O c t N o v D e c Jan M a r A p r M a y Jun
Abun
danc
e (In
divi
dual
/m2)
0
2 0 0
4 0 0
6 0 0
8 0 0
1 0 0 0
F ie ldB u n d
F a llo wD S R ic e
TR P R ic e
F a llo w
B. Isotom idae
Sam pling OccasionAug Sep Oct Nov Dec Jan Mar Apr May Jun
0
200
400
600
800
1000
FallowDS Rice
TRP Rice
Fallow
Figure 3.7: Dynamics of Entomobryidae and Isotomidae in fallow, dry-seeded rice (DS
Rice) and transplanted rice (TRP Rice) (soil depth 0-15 cm).
Resume
In the rice field phase (during the flooded periods), soil fauna abundance and biomass,
with the exception of Oligochaeta, were generally lower than in the fallow (non-
flooded), especially in the early fallow period. Soil fauna abundance and biomass were
consistently high at the onset of each cropping system. During the flooded periods,
meso- and macrofauna abundance and biomass in the bunds were significantly higher
than those in the field. Oligochaeta occurred both in the fallow and the rice seasons,
without any particular trend.
The diversity indices of soil fauna (based both on abundance and biomass) were
higher in the fallow phase than in the flooded phase, and higher in the bunds than in the
fields. During the fallow phase, Oribatida of the Acari and some groups of Collembola,
namely Hypogastruridae, Entomobryidae and Isotomidae, were the most numerous. In
terms of biomass, Coleoptera (beetles) were a dominant group among the soil fauna. In
the rice season, Sminthuridae of the Collembola was the most abundant fauna group.

Results and Discussion
49
Coleoptera and Diptera larvae were dominant fauna groups among the soil fauna with
regard to biomass.
3.2.2 The effect of bund distance and crop-planted bunds on soil fauna abundance, biomass and diversity
Bund distance
To evaluate the effect of two different bund distances of 4m and 8m on soil fauna
abundance, biomass and diversity, the soil fauna was extracted from soil samples taken
from four randomized points in the six treatment plots (see Section 2.3). Samples were
taken from the field and the bund every 30 days during the dry-seeded rice, transplanted
rice and early fallow periods.
Dry-seeded rice. During the dry-seeded rice season, mesofauna abundance and biomass
in the plots with short bund distance (4m) did not significantly differ from that in the
plots with long bund distance (8m) (Anova test on log-transformed fauna data).
However, approximately 50% of the individual results (for different months) showed
that mesofauna abundance tended to be higher in the 4-m plots than in the 8-m plots,
biomass showing an even greater increase in the 4-m plots (67%). Irrespective of bund
distance, both in the fields and in the bunds, mesofauna abundance and biomass were
mostly dominated by Collembola, particularly animals from the Sminthuridae group.
Although the mesofauna groups in the fields were similar to those in the bunds, their
number and biomass were higher in the bund than in the field (Tables 3.7 and 3.8).
The macrofauna abundance and biomass exhibited the same trend as the
mesofauna, numbers and biomass being higher in the 4-m plots than in the 8-m plots,
both in the field and in the bund (Figure 3.8 B). Approximately 75% of the individual
results (for different months) indicated that macrofauna abundance and biomass were
higher in 4-m plots. In November, macrofauna abundance and biomass in 4-m plots
were even significantly higher than in the 8-m plots, both in the fields and in the bunds
(Tables 3.7 and 3.8). The most numerous taxa of macrofauna in 4-m plots were larvae
of Diptera and Coleoptera. The short bund distance (4 m) may facilitate the movement
of the macrofauna from the fields to the bunds when the field is flooded and conditions
are unfavorable.
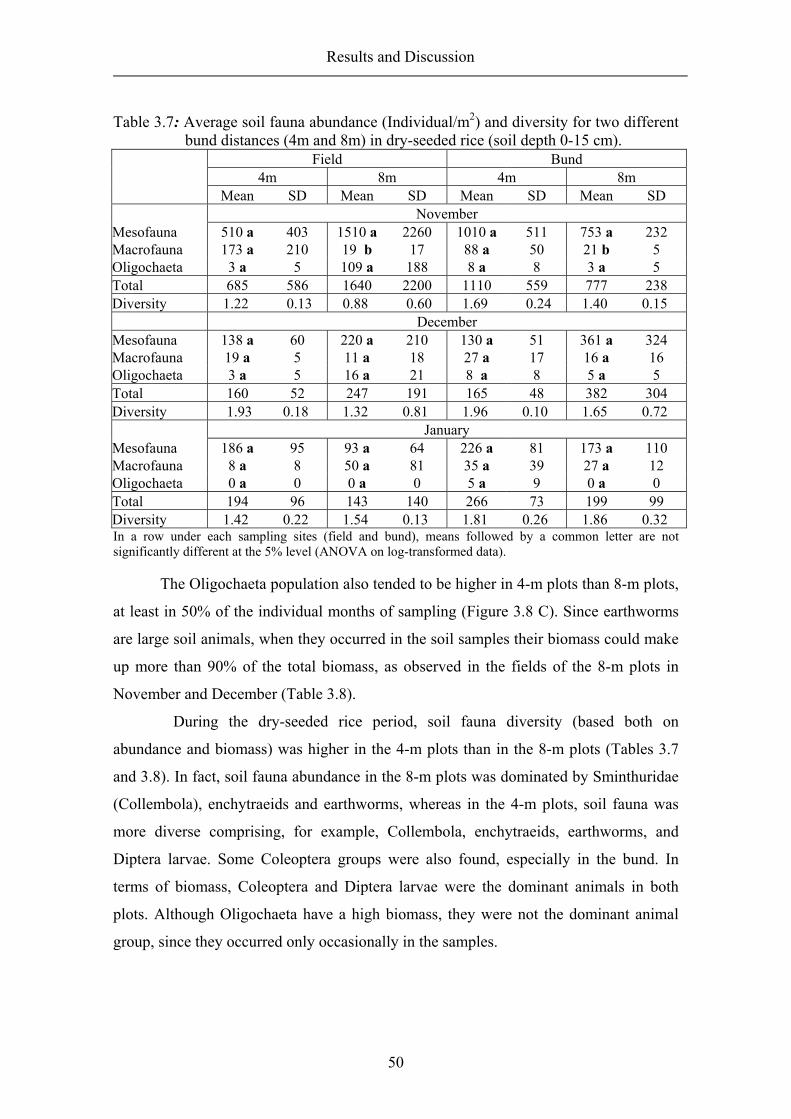
Results and Discussion
50
Table 3.7: Average soil fauna abundance (Individual/m2) and diversity for two different bund distances (4m and 8m) in dry-seeded rice (soil depth 0-15 cm).
Field Bund 4m 8m 4m 8m Mean SD Mean SD Mean SD Mean SD November Mesofauna 510 a 403 1510 a 2260 1010 a 511 753 a 232 Macrofauna 173 a 210 19 b 17 88 a 50 21 b 5 Oligochaeta 3 a 5 109 a 188 8 a 8 3 a 5 Total 685 586 1640 2200 1110 559 777 238 Diversity 1.22 0.13 0.88 0.60 1.69 0.24 1.40 0.15 December Mesofauna 138 a 60 220 a 210 130 a 51 361 a 324 Macrofauna 19 a 5 11 a 18 27 a 17 16 a 16 Oligochaeta 3 a 5 16 a 21 8 a 8 5 a 5 Total 160 52 247 191 165 48 382 304 Diversity 1.93 0.18 1.32 0.81 1.96 0.10 1.65 0.72 January Mesofauna 186 a 95 93 a 64 226 a 81 173 a 110 Macrofauna 8 a 8 50 a 81 35 a 39 27 a 12 Oligochaeta 0 a 0 0 a 0 5 a 9 0 a 0 Total 194 96 143 140 266 73 199 99 Diversity 1.42 0.22 1.54 0.13 1.81 0.26 1.86 0.32 In a row under each sampling sites (field and bund), means followed by a common letter are not significantly different at the 5% level (ANOVA on log-transformed data).
The Oligochaeta population also tended to be higher in 4-m plots than 8-m plots,
at least in 50% of the individual months of sampling (Figure 3.8 C). Since earthworms
are large soil animals, when they occurred in the soil samples their biomass could make
up more than 90% of the total biomass, as observed in the fields of the 8-m plots in
November and December (Table 3.8).
During the dry-seeded rice period, soil fauna diversity (based both on
abundance and biomass) was higher in the 4-m plots than in the 8-m plots (Tables 3.7
and 3.8). In fact, soil fauna abundance in the 8-m plots was dominated by Sminthuridae
(Collembola), enchytraeids and earthworms, whereas in the 4-m plots, soil fauna was
more diverse comprising, for example, Collembola, enchytraeids, earthworms, and
Diptera larvae. Some Coleoptera groups were also found, especially in the bund. In
terms of biomass, Coleoptera and Diptera larvae were the dominant animals in both
plots. Although Oligochaeta have a high biomass, they were not the dominant animal
group, since they occurred only occasionally in the samples.

Results and Discussion
51
Table 3.8: Average soil fauna biomass (mg/m2) and diversity for two different bund distances (4m and 8m) during dry-seeded rice (soil depth 0-15 cm).
Field Bund 4m 8m 4m 8m Mean SD Mean SD Mean SD Mean SD November Mesofauna 7.4 a 0.9 3.9 a 5.8 3.0 a 1.5 2.5 a 0.9 Macrofauna 128.0 a 174.0 6.8 b 11.2 62.1 a 30.5 13.8 b 5.9 Oligochaeta 0.1 a 0.1 838.0 a 1450.0 112.0 a 193.0 0.1 a 0.1 Total 136.0 175.0 849.0 1460.0 177.0 210.0 16.3 6.8 Diversity 0.85 0.50 0.49 0.36 1.38 0.44 1.25 0.43 December Mesofauna 0.5 a 0.2 0.5 a 0.5 0.5 a 0.1 1.2 a 1.0 Macrofauna 10.3 a 4.5 8.1 a 14.0 15.9 a 9.6 11.7 a 11.8 Oligochaeta 55.7 a 96.5 279.0 b 348.0 167.0 a 167.0 112.0 a 96.5 Total 66.5 101.0 287.0 361.0 184.0 172.0 124.0 106.0 Diversity 0.59 0.28 0.25 0.26 0.40 0.20 0.54 0.25 January Mesofauna 0.8 a 0.6 0.4 a 0.3 1.0 a 0.4 0.6 a 0.3 Macrofauna 2.8 a 2.5 38.6 a 63.5 16.4 a 16.7 21.3 a 13.6 Oligochaeta 0.0 a 0.0 0.0 a 0.0 0.2 a 0.3 0.0 a 0.0 Total 3.6 2.7 39.0 63.7 17.6 16.6 21.9 13.3 Diversity 0.85 0.06 0.56 0.69 0.91 0.11 1.00 0.49 In a row under each sampling sites (field and bund), means followed by a common letter are not significantly different at the 5% level (ANOVA on log-transformed data).
Transplanted rice. The trend of meso- and macrofauna abundance and biomass
exhibited during the dry seeded rice was also shown during the transplanted rice period,
where abundance and biomass were higher in the 4-m plots than in the 8-m plots. Here,
more than 50% of the results for the different months indicated that meso- and
macrofauna were higher in 4-m plots than in 8-m plots. Macrofauna abundance in
March and May and biomass (only May) in the 4-m plots were significantly higher than
in the 8-m plots.
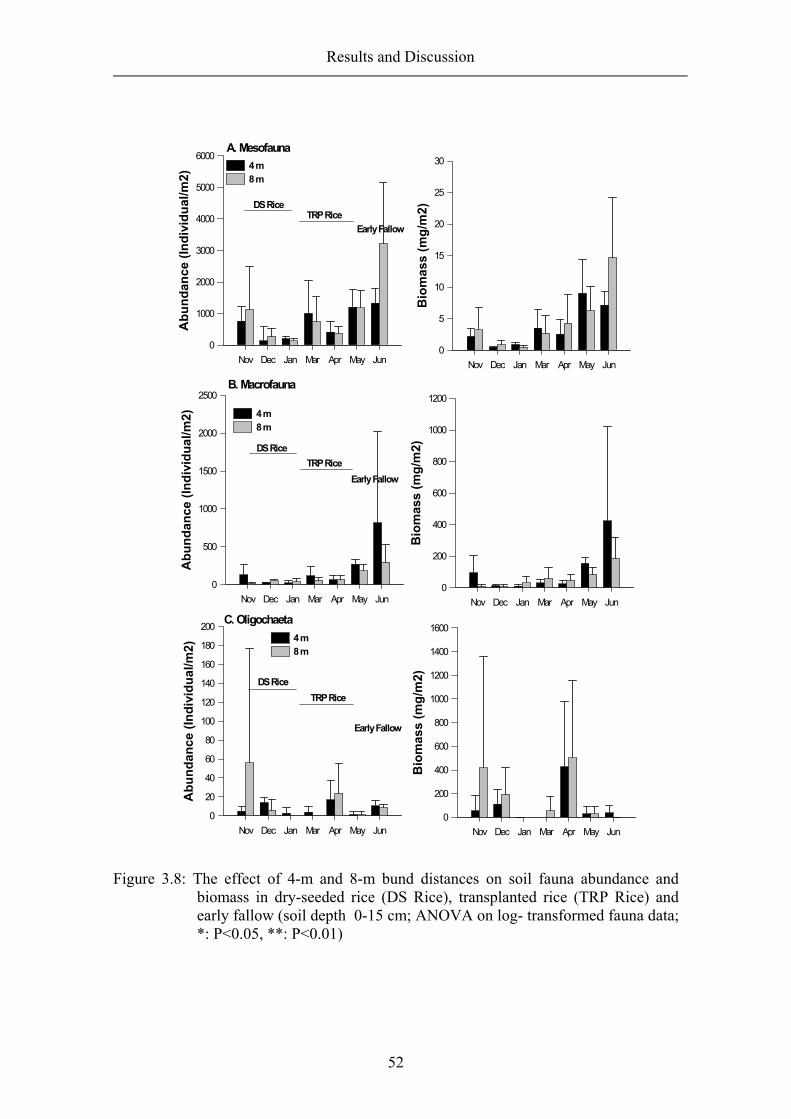
Results and Discussion
52
Nov Dec Jan Mar Apr May Jun
Abu
ndan
ce (I
ndiv
idua
l/m2)
0
1000
2000
3000
4000
5000
60004 m8 m
Nov Dec Jan Mar Apr May Jun
Abu
ndan
ce (I
ndiv
idua
l/m2)
0
500
1000
1500
2000
2500
4 m8 m
Nov Dec Jan Mar Apr May Jun
Abu
ndan
ce (I
ndiv
idua
l/m2)
0
20
40
60
80
100
120
140
160
180
2004 m8 m
Nov Dec Jan Mar Apr May Jun
Bio
mas
s (m
g/m
2)
0
5
10
15
20
25
30
Nov Dec Jan Mar Apr May Jun
Bio
mas
s (m
g/m
2)
0
200
400
600
800
1000
1200
Nov Dec Jan Mar Apr May Jun
Bio
mas
s (m
g/m
2)
0
200
400
600
800
1000
1200
1400
1600
A. Mesofauna
B. Macrofauna
C. Oligochaeta
DS RiceTRP Rice
Early Fallow
DS RiceTRP Rice
Early Fallow
DS RiceTRP Rice
Early Fallow
Figure 3.8: The effect of 4-m and 8-m bund distances on soil fauna abundance and biomass in dry-seeded rice (DS Rice), transplanted rice (TRP Rice) and early fallow (soil depth 0-15 cm; ANOVA on log- transformed fauna data; *: P<0.05, **: P<0.01)

Results and Discussion
53
The Anova test on log-transformed fauna data did not show any significant differences
in soil fauna abundance and biomass between the 4-m and 8-m plots (Tables 3.9 and
3.10). This is presumably due to the high variance of the fauna data. The mesofauna,
both in the 4-m plots and 8-m plots, was still dominated by Collembola (Sminthuridae
and Hypogastruridae), and Acari (oribatid mites). In the bund, animal groups of Acari
were more diverse, e.g. oribatid mites, spotted acari and spider mites.
Table 3.9: Average soil fauna abundance (Individual/m2) and diversity for two different bund distances (4m and 8m) in transplanted rice (soil depth 0-15 cm).
Field Bund 4m 8m 4m 8m Mean SD Mean SD Mean SD Mean SD March Mesofauna 345 a 231 871 a 1220 1670 a 1360 645 a 503 Macrofauna 24 a 24 64 a 63 210 a 148 50 b 17 Oligochaeta 3 a 5 0 a 0 5 a 9 0 a 0 Total 372 259 934 1280 1880 1517 695 517 Diversity 1.55 0.55 1.76 0.36 1.66 0.57 1.67 0.48 April Mesofauna 88 a 8 284 b 232 740 a 187 464 a 231 Macrofauna 19 a 12 53 a 28 112 a 35 93 a 72 Oligochaeta 0 a 0 0 a 0 35 a 18 48 a 35 Total 106 18 337 209 886 213 605 271 Diversity 1.93 0.15 2.06 0.17 2.04 0.45 2.13 0.14 May Mesofauna 1150 a 694 945 a 216 1260 a 701 1410 a 822 Macrofauna 236 a 83 141 b 97 300 a 49 223 a 84 Oligochaeta 3 a 5 3 a 5 0 a 0 0 a 0 Total 1390 766 1090 308 1560 750 1640 852 Diversity 2.35 0.31 1.43 0.57 2.47 0.42 2.22 0.43 In a row under each sampling sites (field and bund), means followed by a common letter are not significantly different at the 5% level (ANOVA on log-transformed data).
In 4-m plots, larvae and adults of Coleoptera and Diptera (the adult occurred
mainly in the bund), Hymenoptera, Homoptera and Aranae were the dominant taxa of
the macro fauna. Coleoptera and Diptera also occurred in the 8-m plots, but their
numbers were lower. During the transplanted rice period, the different bund distance did
not generally influence Oligochaeta abundance and biomass. Earthworms mainly
occurred in the bund, so that Oligochaeta biomass was higher in the bunds than in the
fields. Enchytraeids mostly occurred in the field (Table 3.10).

Results and Discussion
54
Table 3.10: Average soil fauna biomass (mg/m2) and diversity for two different bund distances (4m and 8m) in transplanted rice (soil depth 0-15 cm).
Field Bund 4m 8m 4m 8m Mean SD Mean SD Mean SD Mean SD March Mesofauna 1.3 a 1.1 3.4 a 4.5 5.7 a 3.3 2.1 a 1.2 Macrofauna 31.8 a 34.8 8.8 a 7.7 28.2 a 13.5 110.0 a 78.2 Oligochaeta 0.0 a 0.0 0.1 a 0.1 0.0 a 0.0 112.0 a 193.0Total 33.1 34.0 12.2 3.4 33.9 11.0 223.0 256.0Diversity 1.23 0.32 1.39 0.43 1.69 0.60 1.42 0.21 April Mesofauna 0.4 a 0.1 5.6 b 7.5 4.7 a 1.9 2.9 a 1.7 Macrofauna 11.8 a 6.5 28.6 a 11.0 37.9 a 23.9 66.2 a 56.9 Oligochaeta 0.0 a 0.0 0.0 a 0.0 855.0 a 611.0 1000.0 a 730.0Total 12.2 6.5 34.2 14.0 891.0 594.0 1070.0 698.0Diversity 0.72 0.37 1.48 0.40 0.37 0.22 0.40 0.36 May Mesofauna 9.3 a 7.5 4.2 a 0.9 8.7 a 5.7 8.4 a 5.5 Macrofauna 126.0 a 39.0 52.0 b 21.5 183.0 a 22.8 120.0 a 36.0 Oligochaeta 55.7 a 96.5 55.7 a 96.5 0.0 a 0.0 0.0 a 0.0 Total 191.0 52.5 112.0 78.1 191.0 28.5 128.0 37.0 Diversity 2.06 0.63 1.43 0.57 2.21 0.11 2.06 0.37 In a row under each sampling sites (field and bund), means followed by a common letter are not significantly different at the 5% level (ANOVA on log-transformed fauna data).
Early fallow. In the early fallow (one month after the field had been drained), soil fauna
abundance and biomass tended to be higher in 4-m plots than in 8-m plots. In contrast,
mesofauna abundance and biomass in the 8-m plots were more than double that in the
4-m plots, i.e., 3230 ind. m-2 (abundance) and 15.0 mg m-2 (biomass) in 8-m plots and
1330 ind. m-2 and 7.0 mg m-2 in 4-m plots (Table 3.11). Mesofauna reached the highest
abundance and biomass in this phase, especially in the 8-m plots. On average, their
abundance and biomass was more than four times that of the flooded phases (dry-seeded
rice and transplanted rice) (Figure 3.7A). The most numerous taxa were Collembola
(Isotomidae and Entomobryidae), and Acari, namely oribatid and spider mites,
irrespective of bund distance.
After the macrofauna population had been suppressed during the rice field
phases, they reached the highest number and biomass in the early fallow phase.
Numbers and biomass were more than four times those observed during the rice field
phases (Figure 3.8 B). Macrofauna numbers in 4-m plots were almost three times higher
than those in 8-m plots, and their biomass was almost doubled (Table 3.11). Formicidae

Results and Discussion
55
(ants) and Coleoptera were the most numerous taxa among the macrofauna in the 4-m
plots. In the 8-m plots, Formicidae and Coleoptera also occurred, but their numbers
were not as high as in the 4-m plots.
Table 3.11:. Average soil fauna abundance, biomass and diversity for two different bund distances (4m and 8m) in early fallow (soil depth of 0-15 cm).
Abundance (Individual/m2) Biomass (mg/m2) 4m 8m 4m 8m Mean SD Mean SD Mean SD Mean SD June Mesofauna 1330 a 453 3230 a 1943 7.1 a 2.2 14.8 a 9.4 Macrofauna 816 a 1200 296 a 229 424.0 a 601.0 188.0 a 126.0Oligochaeta 11 a 5 9 a 3 37.4 a 64.4 0.3 a 0.1 Total 2160 920 3530 2170 469.0 572.0 203.0 135.0Diversity 1.90 0.42 1.95 0.20 1.66 0.28 1.95 0.39 In a row under each abundance and biomass, means followed by a common letter are not significantly different at the 5% level (ANOVA on log-transformed data).
As in the rice field periods, the Oligochaeta population in the dry phase did not
exhibit any special pattern; however, their numbers and biomass in 4-m plots tended to
be higher than in 8-m plots. During the early fallow, only enchytraeids occurred in the
soil samples, whereas earthworms did not. Since enchytraeids are the small Oligochaeta
with an average individual body weight approx. 0.03 mg, the biomass of the
Oligochaeta was also low in this phase (Table 3.11).
Although the differences in soil fauna abundance and biomass between 4-m
and 8-m plots were high in the early fallow, the Anova test on log-transformed fauna
data showed no overall significant difference between these plots. The non-significant
results may be caused by the high variance of the fauna data. Soil fauna abundance-
based diversity in the early fallow period did not show any differences between 4-m
plots and 8-m plots, but their biomass-based diversity was higher in 8-m plots (1.95)
than in 4-m plots (1.66) (Table 3.11).
Crop-planted bund
During the rice phases, both in dry-seeded and transplanted rice, soil fauna abundance
and biomass were significantly higher in the bunds than in the fields (Table 3.12). The
higher number of soil fauna populations in the bunds was attributed to the aerobic soil
condition in the bund, which is more appropriate for soil fauna than the anaerobic soil

Results and Discussion
56
condition in the field. This section discusses whether crops planted on the bunds would
affect the soil fauna population, and whether different crops would have different
effects on soil fauna abundance and biomass. The study was conducted during the rice
seasons (dry-seeded rice and transplanted rice) and early fallow, shortly after the field
had been drained.
Dry-seeded rice. The average soil fauna abundance and biomass in plots without crops
on the bund (control plots), plots with cassava planted on the bund (cassava plots) and
plots with mungbean planted on the bund (mungbean plots) during the dry-seeded rice
season is presented in Tables 3.13 and 3.14. The Anova test on log-transformed fauna
data showed that the total soil fauna abundance and biomass was significantly higher in
the bunds than in the fields (Table 3.12).
Table 3.12: Soil fauna abundance and biomass at two different sampling sites (field and
bund) with different crop-planted bunds (ANOVA on log-transformed fauna data; F mean of field, B mean of bund, ns= non significant).
Sampling Crop-planted Site (S) Bund (C) Dry-Seeded Rice Abundance <0.01 B>F ns Biomass <0.01 B>F ns Transplanted Rice Abundance <0.01 B>F ns Biomass <0.01 B>F ns
Although crops (cassava and mungbean) cultivated on the bund did not
significantly influence soil fauna abundance and biomass, in most months soil fauna
abundance and biomass tended to be higher in plots with crops planted on the bund than
in plots without (Tables 3.13 and 3.14).
Macrofauna and Oligochaeta dynamics did not exhibit a particular pattern; at
some sampling dates macrofauna abundance and biomass were higher in control plots
than in plots with crops on the bund. This is presumably due to the Coleoptera and
Diptera larvae, which dominated the macrofauna population during the rice seasons and
appeared to live equally well both in the field and in the bunds with and without crops.
Oligochaeta occasionally occurred in the control, cassava and mungbean plots.
However, when earthworms occurred in the samples, the Oligochaeta biomass made up

Results and Discussion
57
approx. 90% of the total biomass as observed in November and December. In January,
Oligochaeta only appeared in the mungbean plots with a very low number and biomass
(Table 3.14).
The higher number and biomass of soil fauna on the crop-planted bund were
accompanied by a higher soil fauna diversity on the bund compared to the field. The
abundance-based diversity was higher in the control bund (1.83) than in the cassava
bund (1.77) and the mungbean bund (1.57), whereas the biomass-based diversity indices
were 0.91 (control bund), 1.02 (cassava bund), and 0.82 (mungbean bund). The most
numerous taxa in the control bund were groups of collembolans, i.e., Sminthuridae and
Isotomidae, whereas in the cassava bund, Sminthuridae and Hypogastruridae
(Collembola) and a group of Acari, i.e., spider mites (Tetranychidae), dominated. In
mungbean bunds, the most numerous animal groups were Collembola, i.e.,
Sminthuridae and Isotomidae. In terms of biomass, the dominant animals in the control
bund were earthworms and ants, in the cassava bund earthworms, Coleoptera (adults
and larvae) and ants, and in the mungbean bund adults and larvae of Diptera and
Coleoptera.
Transplanted rice. Tables 3.15 and 3.16 show the average soil fauna abundance and
biomass in plots without crop on the bund (control plots), plots with cassava planted on
the bund (cassava plots) and plots with mungbean planted on the bund (mungbean plots)
during the transplanted rice season. The soil fauna population in this subsystem
indicated a pattern similar to the dry-seeded rice season, with total soil fauna abundance
and biomass being significantly higher in the bunds than in the fields. Although the
crops planted on the bund did not significantly influence the soil fauna population, there
was a tendency of meso- and macrofauna abundance and biomass in cassava and
mungbean bunds to be higher than that in the control bund, especially in April and May.
This may indicate that bunds with cassava and mungbean are more favorable for soil
fauna during the flooding of the field. As with dry-seeded rice, the Oligochaeta
population did not indicate a particular pattern; they occurred occasionally in control,
cassava and mungbean plots.
Soil fauna abundance-based diversity in all treatment plots was higher in the
bund than in the field. Except for mungbean plots, animal biomass-based diversity was

Results and Discussion
58
also higher in the bund than in the field. In the control bund, the most numerous soil
fauna group were Collembola (Sminthuridae, Entomobryidae and Hypogastruridae). In
bunds with crops, the dominant animal groups were found to be more diverse, i.e.,
Collembola (Sminthuridae, Entomobryidae and Hypogastruridae) and Acari (oribatid
mites and spotted acari) in cassava bunds, and Collembola (Sminthuridae,
Entomobryidae and Hypogastruridae), Acari, and Orthoptera in mungbean bunds. In
terms of biomass, the dominant soil fauna groups in control bunds were earthworms,
adults and larvae of Coleoptera and Diptera; in cassava bunds they were earthworms
and larvae and adults of Coleoptera ; and in mungbean bunds they were Coleoptera and
Formicidae.
Early fallow. Crops planted on the bund tended to influence the population of meso-
and macrofauna in the early fallow (Table 3.17), an effect not observed during the rice
field phases. The abundance and biomass of the mesofauna were higher in plots with
crops planted on the bund than in the control plot. In mungbean plots, their abundance
and biomass were approx. twice as high as in control plots (Figure 3.9A). Macrofauna
abundance and biomass were also higher in plots with crops on the bund, especially in
cassava plots (Figure 3.9B). However, due to the high standard deviation of the data, the
Anova test on log-transformed fauna data showed no significant differences between the
soil fauna population in the control plot and plots with cassava and mungbean on the
bund.
As in the rice seasons, the Oligochaeta population dynamics did not exhibit
any particular pattern. They occurred in all treatment plots of crop-planted bunds, but
with a very low number and biomass. During the early fallow, only enchytraeids
occurred in the soil samples, while earthworms did not. Since enchytraeids are small
animals with a low body weight, the Oligochaeta biomass in this phase was also low
(Figure 3.9C).
The soil animal taxa richness was higher in plots with crops on the bunds than in
plots without crops. In control plots, the most numerous taxa were Collembola
(Hypogastruridae and Entomobryidae), and Acari (Oribatid and spider mites). Plots
with cassava on the bund were dominated by Collembola (Hypogastruridae and
Entomobryidae), Acari (Oribatid and spider mites), and Formicidae (ants). Mungbean

Results and Discussion
59
plots were dominated by Collembola (Hypogastruridae and Entomobryidae), Acari
(Oribatid and spider mites), ants and Coleoptera.
The results indicate that although no significant differences existed between the
soil fauna population in the control plots and in the plots with cassava and mungbean on
the bunds, the increase in the mesofauna and macrofauna population after the flooding
period was faster in plots with crop-planted bunds. The increase of soil fauna abundance
and diversity in the terrestrial phase after the flooding period is important, because soil
animals may intensify organic matter decomposition and nitrogen mineralization. The
fallow period is therefore expected to be better able to enhance the productivity of the
entire rainfed paddy production phase.

Results and Discussion
60
Table 3.13: The effect of crop-planted bunds on soil fauna abundance (Individual/m2) and diversity in dry-seeded rice (soil depth 0-15 cm).
Control Cassava Mungbean Field Bund Field Bund Field Bund Mean SD Mean SD Mean SD Mean SD Mean SD Mean SD November Mesofauna 494 574 1090 261 207 158 1100 332 2330 2530 454 45 Macrofauna 207 293 76 73 48 34 64 56 32 1 24 11 Oligochaeta 4 6 8 11 163 231 4 6 0 0 4 6 Total 705 873 1170 346 418 355 1170 383 2360 2530 482 28 Diversity 0.85 0.31 1.58 0.25 1.42 0.20 1.34 0.12 0.87 0.62 1.72 0.25 December Mesofauna 96 23 203 73 143 79 88 23 299 231 446 394 Macrofauna 28 6 12 6 8 11 32 0 8 11 20 28 Oligochaeta 24 23 4 6 4 6 12 6 0 0 4 6 Total 147 51 219 84 155 84 131 17 307 220 470 360 Diversity 2.09 0.01 1.94 0.04 1.68 0.41 2.12 0.06 1.11 0.88 1.35 0.76 January Mesofauna 88 79 124 63 191 146 231 124 139 28 243 73 Macrofauna 12 6 28 17 4 6 16 11 72 101 48 45 Oligochaeta 0 0 0 0 0 0 0 0 0 0 8 11 Total 100 84 152 46 195 152 247 113 211 130 299 17 Diversity 1.53 0.20 2.0 0.12 1.48 0.18 1.86 0.42 1.43 0.26 1.66 0.19

Results and Discussion
61
Table 3.14: The effect of crop-planted bunds on soil fauna biomass (mg/m2) and diversity in dry-seeded rice (soil depth 0-15 cm). Control Cassava Mungbean Field Bund Field Bund Field Bund Mean SD Mean SD Mean SD Mean SD Mean SD Mean SD
November Mesofauna 1.2 1.3 3.7 0.4 0.6 0.3 3.1 1.0 6.1 6.3 1.4 0.2 Macrofauna 164.0 232.0 48.7 42.9 28.0 11.9 48.0 45.5 9.8 13.0 17.1 14.2 Oligochaeta 0.1 0.2 167.0 237.0 1260.0 1780.0 0.1 0.2 0.0 0.0 0.1 0.2 Total 166.0 234 220.0 280.0 1290.0 1770.0 51.2 46.3 16.0 6.7 18.7 14.2 Diversity 0.51 0.25 1.20 0.45 0.49 0.57 1.60 0.15 1.02 0.42 1.16 0.56 December Mesofauna 0.3 0.0 0.7 0.2 0.5 0.3 0.4 0.1 0.8 0.5 1.4 1.3 Macrofauna 19.8 6.2 8.9 3.6 3.5 4.9 19.8 5.5 4.3 6.0 12.8 18.0 Oligochaeta 418.0 355.0 83.6 118.0 83.6 118.0 251.0 118.0 0.0 0.0 83.6 118.0 Total 438.0 361.0 93.3 122.0 87.6 113.0 271.0 113.0 5.1 5.6 97.7 135.0 Diversity 0.30 0.13 0.37 0.08 0.24 0.33 0.35 0.23 0.72 0.27 0.70 0.16 January Mesofauna 0.3 0.2 0.5 0.4 0.9 0.8 1.1 0.6 0.6 0.2 0.8 0.1 Macrofauna 4.4 0.6 22.7 17.5 1.8 2.5 12.2 12.1 55.9 79.1 21.6 19.3 Oligochaeta 0.0 0.0 0.0 0.0 0.0 0.0 0.0 0.0 0.0 0.0 0.3 0.4 Total 4.7 4.8 23.3 17.1 2.7 3.3 13.3 11.5 56.5 79.2 22.7 19.6 Diversity 0.52 0.54 1.16 0.23 1.11 0.36 1.10 0.21 0.49 0.42 0.61 0.24
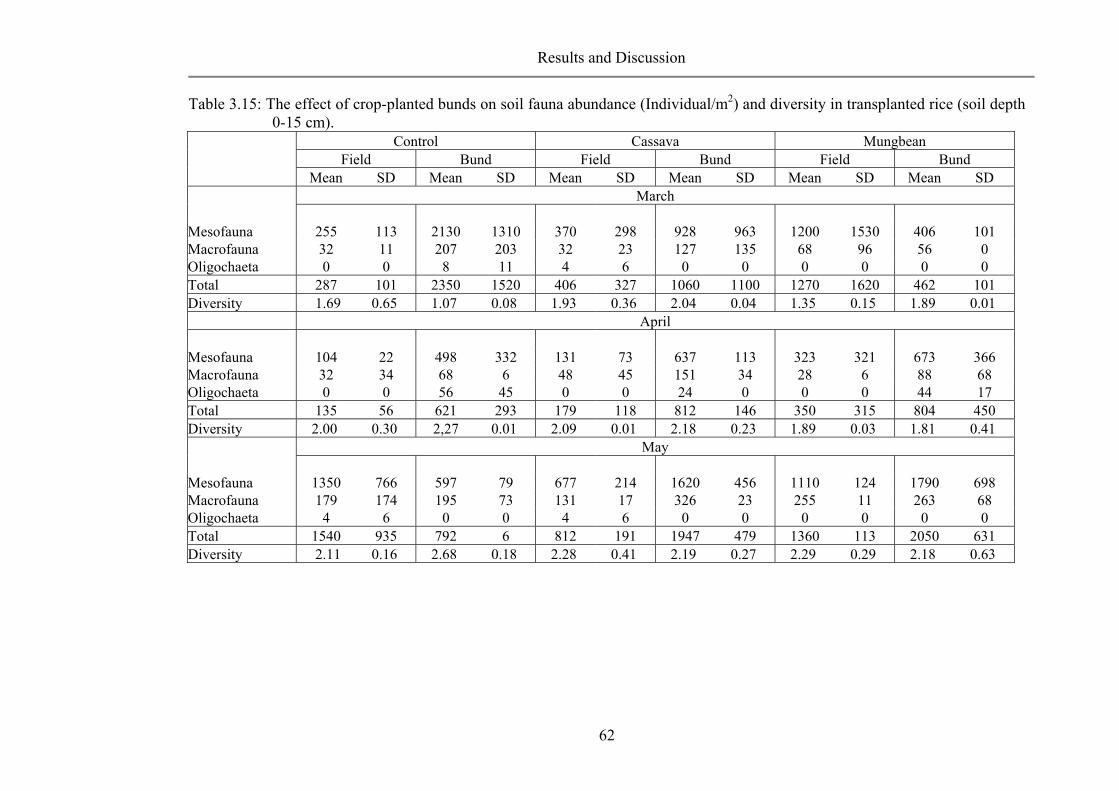
Results and Discussion
62
Table 3.15: The effect of crop-planted bunds on soil fauna abundance (Individual/m2) and diversity in transplanted rice (soil depth 0-15 cm).
Control Cassava Mungbean Field Bund Field Bund Field Bund Mean SD Mean SD Mean SD Mean SD Mean SD Mean SD March Mesofauna 255 113 2130 1310 370 298 928 963 1200 1530 406 101 Macrofauna 32 11 207 203 32 23 127 135 68 96 56 0 Oligochaeta 0 0 8 11 4 6 0 0 0 0 0 0 Total 287 101 2350 1520 406 327 1060 1100 1270 1620 462 101 Diversity 1.69 0.65 1.07 0.08 1.93 0.36 2.04 0.04 1.35 0.15 1.89 0.01 April Mesofauna 104 22 498 332 131 73 637 113 323 321 673 366 Macrofauna 32 34 68 6 48 45 151 34 28 6 88 68 Oligochaeta 0 0 56 45 0 0 24 0 0 0 44 17 Total 135 56 621 293 179 118 812 146 350 315 804 450 Diversity 2.00 0.30 2,27 0.01 2.09 0.01 2.18 0.23 1.89 0.03 1.81 0.41 May Mesofauna 1350 766 597 79 677 214 1620 456 1110 124 1790 698 Macrofauna 179 174 195 73 131 17 326 23 255 11 263 68 Oligochaeta 4 6 0 0 4 6 0 0 0 0 0 0 Total 1540 935 792 6 812 191 1947 479 1360 113 2050 631 Diversity 2.11 0.16 2.68 0.18 2.28 0.41 2.19 0.27 2.29 0.29 2.18 0.63

Results and Discussion
63
Table 3.16: The effect of crop-planted bunds on soil fauna biomass (mg/m2) and diversity in transplanted rice (soil depth 0-15 cm). Control Cassava Mungbean Field Bund Field Bund Field Bund Mean SD Mean SD Mean SD Mean SD Mean SD Mean SD March Mesofauna 0.9 0.0 5.8 3.4 1.6 1.4 4.0 4.1 4.5 5.8 1.8 0.2 Macrofauna 12.6 1.3 101.0 105.0 12.3 3.3 73.7 81.8 35.9 50.8 32.8 13.9 Oligochaeta 0.0 0.0 167.0 237.0 0.1 0.2 0.0 0.0 0.0 0.0 0.0 0.0 Total 13.6 1.3 274.0 338.0 14.0 2.0 77.6 77.7 40.5 45.0 34.7 14.1 Diversity 1.28 0.47 1.40 0.33 1.24 0.48 1.79 0.80 1.42 0.35 1.48 0.11 April Mesofauna 0.5 0.1 2.6 1.9 7.2 9.7 3.9 1.0 1.3 1.3 4.9 2.8 Macrofauna 22.3 21.8 35.9 1.1 20.4 15.9 97.4 48.7 17.8 2.0 22.9 10.4 Oligochaeta 0.0 0.0 1170.0 946.0 0.0 0.0 502.0 0.0 0.0 0.0 1120.0 631.0 Total 22.8 21.7 1210.0 945.0 27.6 25.7 603.0 49.7 19.1 0.7 1140.0 623.0 Diversity 1.13 1.11 0.28 0.21 0.93 0.25 0.68 0.18 1.25 0.25 0.19 0.10 May Mesofauna 10.0 9.3 2.9 0.9 3.5 2.5 10.1 4.1 6.7 4.1 12.6 2.4 Macrofauna 84.7 76.4 124.0 46.5 67.2 22.0 180.0 27.8 116.0 59.3 15.0 58.4 Oligochaeta 83.6 118.0 0.0 0.0 83.6 118.0 0.0 0.0 0.0 0.0 0.0 0.0 Total 178.0 32.5 127.0 45.6 154.0 138.0 190.0 31.9 122.0 63.4 163 56.0 Diversity 1.51 1.04 2.68 0.18 1.59 0.33 2.19 0.27 2.13 0.62 2.18 0.63
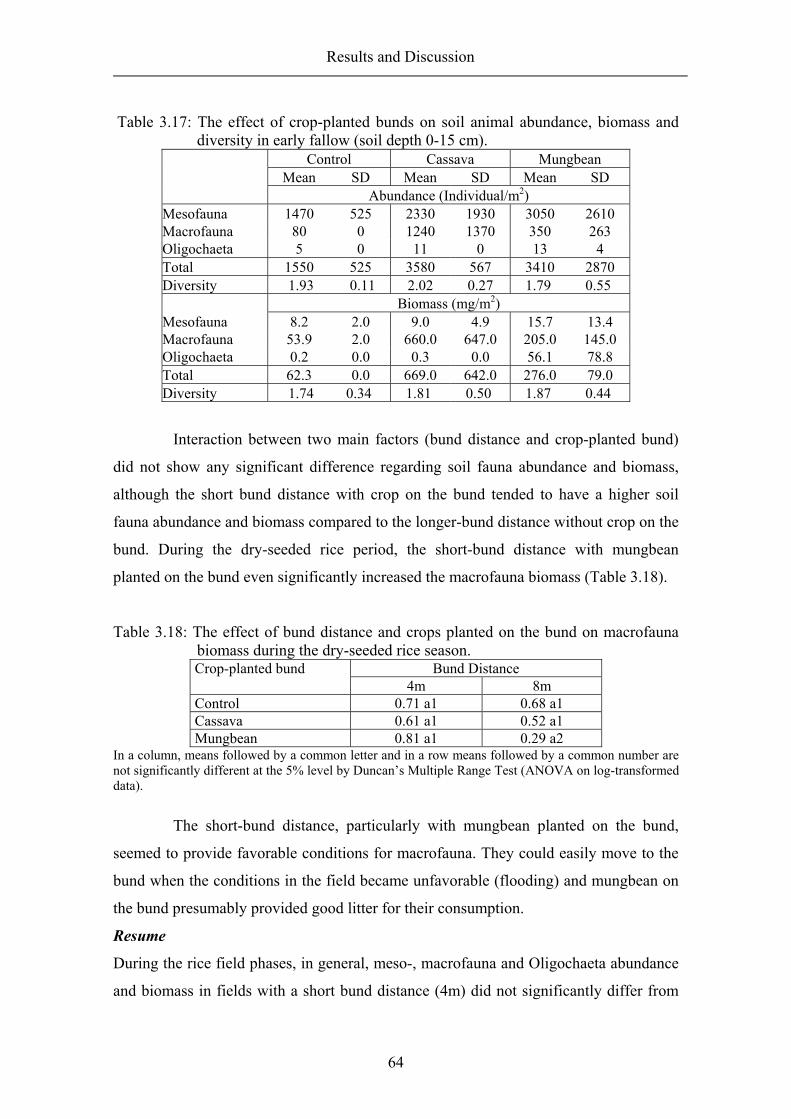
Results and Discussion
64
Table 3.17: The effect of crop-planted bunds on soil animal abundance, biomass and diversity in early fallow (soil depth 0-15 cm).
Control Cassava Mungbean Mean SD Mean SD Mean SD Abundance (Individual/m2) Mesofauna 1470 525 2330 1930 3050 2610 Macrofauna 80 0 1240 1370 350 263 Oligochaeta 5 0 11 0 13 4 Total 1550 525 3580 567 3410 2870 Diversity 1.93 0.11 2.02 0.27 1.79 0.55 Biomass (mg/m2) Mesofauna 8.2 2.0 9.0 4.9 15.7 13.4 Macrofauna 53.9 2.0 660.0 647.0 205.0 145.0 Oligochaeta 0.2 0.0 0.3 0.0 56.1 78.8 Total 62.3 0.0 669.0 642.0 276.0 79.0 Diversity 1.74 0.34 1.81 0.50 1.87 0.44
Interaction between two main factors (bund distance and crop-planted bund)
did not show any significant difference regarding soil fauna abundance and biomass,
although the short bund distance with crop on the bund tended to have a higher soil
fauna abundance and biomass compared to the longer-bund distance without crop on the
bund. During the dry-seeded rice period, the short-bund distance with mungbean
planted on the bund even significantly increased the macrofauna biomass (Table 3.18).
Table 3.18: The effect of bund distance and crops planted on the bund on macrofauna biomass during the dry-seeded rice season.
Bund Distance Crop-planted bund 4m 8m
Control 0.71 a1 0.68 a1 Cassava 0.61 a1 0.52 a1 Mungbean 0.81 a1 0.29 a2
In a column, means followed by a common letter and in a row means followed by a common number are not significantly different at the 5% level by Duncan’s Multiple Range Test (ANOVA on log-transformed data).
The short-bund distance, particularly with mungbean planted on the bund,
seemed to provide favorable conditions for macrofauna. They could easily move to the
bund when the conditions in the field became unfavorable (flooding) and mungbean on
the bund presumably provided good litter for their consumption.
Resume
During the rice field phases, in general, meso-, macrofauna and Oligochaeta abundance
and biomass in fields with a short bund distance (4m) did not significantly differ from

Results and Discussion
65
those with a long bund distance (8m). Nevertheless, data indicate that their abundance
and biomass tended to be higher in 4-m plots than 8-m plots. Approximately 60% of the
individual results for the different months indicate that soil fauna abundance and
biomass was higher in 4-m plots than 8-m plots. In November, macrofauna abundance
and biomass in 4-m plots were even significantly higher, both in the field and in the
bund. This is also supported by the results from March and May, when macrofauna
abundance and biomass (only May) in the 4-m plots were significantly higher. In early
fallow, with the exception of mesofauna, soil fauna abundance and biomass tended to be
higher in 4-m than in 8-m plots.
In the dry-seeded rice period, soil fauna was more diverse in 4-m plots than in
8-m plots. In 4-m plots, Collembola, Diptera, Coleoptera, Enchytraeidea, and
earthworms were dominant, whereas 8-m plots were mainly occupied by mesofauna,
particularly Collembola. In transplanted rice fields, the soil fauna diversity in 4-m plots
was equal to that of the 8-m plots and mainly contained Sminthuridae (Collembola) and
oribatid mites. In terms of biomass, the larvae of Coleoptera and Diptera were the
dominant groups both in 4-m and 8-m plots.
Although crops (cassava and mungbean) cultivated on the bund did not
significantly influence soil fauna abundance and biomass, this tended to be higher in
plots with crops planted on the bund than in plots without. In the dry-seeded rice period,
in more than 60% of the sampled months, the mean soil fauna abundance and biomass
were higher in plots with crops on the bund than in plots without. During the
transplanted rice period, this was less frequently the case. The diversity of soil fauna
taxa during the rice field phases was higher in bunds than in fields. Sminthuridae was
the most numerous animal group in the bund, while in terms of biomass, larvae and
adults of Coleoptera and Diptera were the dominant animal taxa. Interaction between
bund distance and crop-planted bund only influenced the macrofauna. Here, biomass in
the 4-m plots with mungbean planted on the bund was significantly increased.

Results and Discussion
66
Nov Dec Jan Mar Apr May Jun
Abu
ndan
ce (I
ndiv
idua
l/m2)
0
1000
2000
3000
4000
5000
6000 ControlCassavaMungbean
Nov Dec Jan Mar Apr May Jun
Abu
ndan
ce (I
ndiv
idua
l/m2)
0
500
1000
1500
2000
2500
3000
Nov Dec Jan Mar Apr May Jun
Abun
danc
e (In
divi
dual
/m2)
0
50
100
150
200
250
300
Nov Dec Jan Mar Apr May Jun
Bio
mas
s (m
g/m
2)
0
5
10
15
20
25
30
35
Nov Dec Jan Mar Apr May Jun
Bio
mas
s (m
g/m
2)
0
200
400
600
800
1000
1200
1400
Nov Dec Jan Mar Apr May Jun
Bio
mas
s (m
g/m
2)
0
500
1000
1500
2000
A. Mesofauna
B. Macrofauna
C. Oligochaeta
DS rice
TRP rice
DS rice
Early Fallow
Early Fallow
TRP rice
DS RiceTRP Rice
Early Fallow
Figure 3.9: The effect of crop-planted bunds on soil animal abundance and biomass in dry-seeded rice (DS rice), transplanted rice (TRP rice) and early fallow (soil depth 0-15 cm)

Results and Discussion
67
3.3 Litter decomposition in the fallow and rice seasons
The role of soil fauna in rice straw litter decomposition was evaluated using different
mesh-sized litterbags, i.e. coarse mesh (10 mm) permitting access of all organisms,
medium mesh (0.25 mm) excluding macro-organisms, and fine mesh (0.038 mm)
permitting access only of microorganisms. The enclosed rice-straw litter (7 g per bag) in
the different litterbags was then buried at approximately 5 to 7 cm depth in the field of
each treatment plot and retrieved after 30, 60 and 90 days of exposure, during the fallow
and rice (dry-seeded rice and transplanted rice) periods, respectively.
3.3.1 Effects of mesh size on litter decomposition
On average, the rice straw litter-weight loss during the dry season (fallow) was low,
especially in the medium-mesh litterbags. After 90 days of exposure in the field, the rice
straw had lost 34%, 18% and 46% of the original weight from the coarse-, medium- and
fine-mesh bags, respectively. The litter weight loss was significantly higher in the fine-
mesh bags than in the medium- and coarse-mesh bags (Table 3.19). The higher litter-
weight loss in fine-mesh bags, where only microorganisms were involved in the
decomposition process was probably due to the more humid conditions in the bag. We
suppose that enclosing litter in these bags created a condition more favorable for
microorganisms than outside (however, moisture data are not available to confirm this
idea). Also, during the dry season, the activity of microorganisms was presumably
hampered by the hot and dry soil conditions in the better-aerated medium- and coarse-
mesh bags, or the soil fauna may have moved to a deeper soil layer to avoid the heat, so
that they could not play their role in the decomposition process on the soil surface.
During the rice seasons, the weight loss of rice-straw litter was faster than that
during the fallow, especially in the coarse-mesh bags. In dry-seeded rice, after 90 days,
approximately 65% of the original material had disappeared from the coarse-mesh bags,
i.e. more than double that lost in the fallow. In the transplanted rice, the rice-straw litter-
weight loss from all mesh sizes was faster by approx. 25% than that in the dry-seeded
rice. Both in the dry-seeded rice and transplanted rice, the litter-weight losses from
coarse-mesh litterbags were significantly higher than those from medium- and fine-
mesh litterbags, particularly after 90 days (Table 3.19). The higher litter-weight loss in
coarse-mesh bags indicates the importance of macrofauna in the decomposition process.

Results and Discussion
68
Thus, the macrofauna seemed to enhance litter decomposition during the rice seasons.
After the fallow, when the meso- and macrofauna presumably stayed deeper
underground, they may have moved up in the rainy season when environmental factors
such as temperature and moisture became favorable.
Table 3.19: Remaining weight of rice-straw litter (% of initial weight) with litterbags of different mesh sizes after 30, 60 and 90 days of exposure time during the fallow, dry-seeded rice and transplanted rice.
Exposure Times (Day) Mesh size 30 60 90
Fallow Coarse 97.5 b1 85.7 ab2 66.0 b3 Medium 105.9 a1 93.0 a2 81.5 a3 Fine 89.8 b1 79.1 b2 53.5 c3 Dry-Seeded Rice Coarse 57.6 c1 37.2 c2 35.6 c2 Medium 69.0 b1 50.5 b2 46.2 b3 Fine 73.3 a1 56.6 a2 52.2 a3 Transplanted Rice Coarse 52.4 a1 34.6 b2 25.9 b3 Medium 54.9 a1 43.9 a2 39.2 a3 Fine 54.2 a1 43.2 a2 38.4 a3
For each season in a column, means followed by a common letter and in a row, and means followed by a common number are not significantly different at the 5% level by Duncan’s Multiple Range Test.
During the fallow, the decomposition rate was faster in fine-mesh bags than in
medium- and coarse-mesh bags (Figure 3.10). In fine-mesh bags, the time needed for
50% loss of the initial litter dry weight (t50) was 167 days, less than half the time needed
in medium mesh-bags (435 days). The t50 in coarse-mesh bags was intermediate (238
days) between fine-mesh and medium-mesh bags. In contrast, the decomposition rates
(calculated by a negative exponential regression, Anderson and Ingram 1993) in the rice
seasons were faster in coarse-mesh bags than in medium- and fine-mesh bags. The t50 in
coarse-mesh litterbags ranged between 54 days and 83 days, while t50 in medium-mesh
litterbags ranged from 88 days to 124 days and from 69 days to 135 days in fine-mesh
litterbags. In all treatment plots, decomposition rates in coarse-mesh litterbags were
about 50% higher than the rates in fine-mesh litterbags. Decomposition rates in
medium-mesh bags were intermediate. The high decomposition rates in the coarse-mesh
litterbags and the lower rates in medium- and fine-mesh litterbags indicate that
macrofauna played an important role in the decomposition process.

Results and Discussion
69
0 20 40 60 80 100
Rem
aini
ng W
eigh
t in
% o
f Orig
inal
0
20
40
60
80
100
120
CoarseM ediumFine
Tim e (days)
Figure 3.10: Pattern of weight loss of rice straw from three different mesh-sized
litterbags calculated as percentage of remaining ash-free dry weight during the fallow period.
In the rice seasons, the litter weight loss was generally more pronounced during
the first 30 days, particularly in coarse-mesh litterbags, with about 40% to 45% of the
original material disappearing from the litterbags. In medium- and fine-mesh litterbags,
the initial weight loss was lower than in coarse mesh bags, i.e. about 30% of the original
weight. After 60 and 90 days exposure in the field, the weight loss became slower
(Figure 3.11 and 3.12). The rapid initial litter-weight loss in the coarse-mesh litterbags
was presumably due to the fragmentation of the litter into small particles by the soil
fauna, and by leaching of water-soluble component through rainfall. Also, small
fragments of litter may have been lost from the bags.
3.3.2 Effects of different bund distances and crop-planted bunds in litter decomposition
In the rice seasons, the effect of different bund distances (4m and 8m) and crop-planted
bund (control, cassava and mungbean) on the rice-straw litter decomposition in the field
was evaluated using different mesh-sized litterbags. Both in the 4m- and 8-m plots, the

Results and Discussion
70
litter-weight loss from coarse-mesh bags was significantly higher than that from
medium- and fine-mesh litterbags (Table 3.20). This indicates the important role of
macrofauna in litter decomposition. During dry-seeded rice, on average, the different
bund distances did not influence soil fauna; their activity was equally high both in the 4-
m and 8-m plots. In contrast, when the macrofauna activity was restricted in fine-mesh
bags, the litter-weight loss was significantly higher in the 4-m plots than in the 8-m
plots (Table 3.20). In other words, microbial decay of the rice straw was positively
affected by the 4-m bund distance treatment.
During the transplanted rice, the effect of different bund distances on litter
decomposition was particularly clear in medium- and fine-mesh bags, when the litter-
weight loss in the 4-m plots was significantly higher than in the 8-m plots. In coarse-
mesh bags the difference was insignificant (Table 3.20). The higher litter-weight loss in
4-m plots indicates that these plots might have a better soil fauna population than the
8-m plots during the transplanted rice phase. In fact, the soil fauna population tended to
be higher in 4-m plots than in 8-m plots, both in the field and in the bund during this
phase (see Section 3.2.2).

Results and Discussion
71
Cassava, 4m
Days
0 20 40 60 80 100
Rem
aini
ng W
eigh
t in
% o
f Orig
inal
0
20
40
60
80
100
120
CoarseMediumFine
Cassava, 8m
Days
0 20 40 60 80 100
Rem
aini
ng W
eigh
t in
% o
f Orig
inal
0
20
40
60
80
100
120
CoarseMediumFine
Control, 4m
0 20 40 60 80 1000
20
40
60
80
100
120
Control, 8m
0 20 40 60 80 1000
20
40
60
80
100
120
Mungbean, 4m
0 20 40 60 80 100
Rem
aini
ng W
eigh
t in
% o
f Orig
inal
0
20
40
60
80
100
120
CoarseMediumFine
Mungbean, 8m
0 20 40 60 80 100
0
20
40
60
80
100
120
CoarseMediumFine
Figure 3.11: Patterns of weight loss of rice-straw litter from litterbags of different mesh- sizes exposed to different treatment plots in the dry-seeded rice season.

Results and Discussion
72
Table 3.20: Anova of the litter-weight loss calculated as percentage remaining ash-free dry weight in the treatment plots of 4-m and 8-m bund distance in the dry-seeded rice and transplanted rice.
Bund Distance Mesh Sizes 4m 8m
Dry-Seeded Rice Coarse 44.8 c1 42.1 c1 Medium 54.8 b1 55.6 b1 Fine 59.0 a1 62.4 a2 Transplanted Rice Coarse 36.5 b1 38.8 b1 Medium 43.8 a1 48.3 a2 Fine 43.7 a1 46.7 a2
For each season, in a column, means followed by a common letter and in a row, means followed by a common number are not significantly different at the 5% level by Duncan’s Multiple Range Test.
Crops cultivated on the bunds enhanced the soil-fauna activity and thus the litter
decomposition in the field during the dry-seeded rice seasons. When the whole
decomposer community participated in the decomposition process (coarse-mesh bags),
the litter-weight loss in plots with mungbean planted on the bunds was significantly
higher than in control and cassava plots (Table 3.21). This corresponds with the soil
fauna population, which had a tendency to be higher in plots with crops (cassava and
mungbean) on the bund, both in the field and the bund than in control plots (see Section
3.2.3). Mungbean-cultivated bunds presumably offered a better protection for soil fauna
living on the bunds through their leaves, which shaded the soil surface from direct
sunshine. Maybe the mungbeans also provided the better litter for soil fauna
consumption. In the transplanted rice, in general, crops cultivated on the bund did not
influence the litter decomposition in coarse- and fine-mesh bags, whereas in the
medium-mesh bags, the litter-weight loss in the mungbean plots was significantly
slower than in the cassava or control plots (Table 3.21).

Results and Discussion
73
Cassava, 4m
0 20 40 60 80 100
Rem
aini
ng W
eigh
t in
% o
f Orig
inal
0
20
40
60
80
100
120
CoarseMediumFine
Cassava, 8m
0 20 40 60 80 1000
20
40
60
80
100
120
Control, 4m
0 20 40 60 80 100
Rem
aini
ng W
eigh
t in
% o
f Orig
inal
0
20
40
60
80
100
120
CoarseMediumFine
Control, 8m
0 20 40 60 80 1000
20
40
60
80
100
120
Mungbean, 4m
Days0 20 40 60 80 100
Rem
aini
ng W
eigh
t in
% o
f Orig
inal
0
20
40
60
80
100
120
CoarseMediumFine
Mungbean, 8m
Days0 20 40 60 80 100
0
20
40
60
80
100
120
Figure 3.12: Patterns of weight loss of rice straw litter from litterbags of different mesh-
sizes exposed to different treatment plots in transplanted rice season.

Results and Discussion
74
Table 3.21: Anova of the litter-weight loss calculated as percentage remaining ash-free dry weight in the treatment plots of control, cassava- and mungbean-planted bunds, during the dry-seeded rice.
Mesh Sizes Crop-planted bund Control Cassava Mungbean
Dry-Seeded Rice Coarse 44.1 c2 45.3 c2 41.0 c1 Medium 56.8 b1 55.4 b1 53.4 b1 Fine 60.7 a1 61.5 a1 59.8 a1 Transplanted Rice Coarse 37.8 b1 37.1 b1 37.9 b1 Medium 44.2 a1 45.0 a1 48.9 a2 Fine 45.5 a1 43.6 a1 46.5 a1
For each season, in a column, means followed by a common letter and in a row, means followed by a common number are not significantly different at the 5% level by Duncan’s Multiple Range Test.
In the dry-seeded rice, the different bund distances did not influence the litter
decomposition in the plots with cassava on the bund or in the control plots (Table 3.22).
However, litter decomposition (litter weight loss) in the short-bund distance (4m) was
most marked when the bunds were cultivated with mungbean. This coincides with the
macrofauna population, whose biomass was significantly higher in the 4-m plots with
mungbean on the bund than in control and cassava plots (Table 3.18).
During the transplanted rice, the litter-weight loss did not differ among control,
cassava and mungbean plots in the 4-m plots, whereas in the 8-m plots, the litter-weight
loss in the mungbean plots was slower than in the control- and cassava-plots. The effect
of the 4-m bund distance was more clearly shown in plots with mungbean on the bund
and in control plots (Table 3.22). With the exception of the control plots, the higher
litter decomposition in the 4-m plots with mungbean on the bund corresponds with the
litter-decomposition results during the dry-seeded rice, again indicating that the short
bund distance, particularly with mungbean planted on the bund, was able to enhance the
soil fauna population living both in the field and in the bund and thus their role in the
decomposition process.

Results and Discussion
75
Table 3.22:. Anova of the litter-weight loss calculated as percentage remaining ash-free dry weight in the different bund distance and crop-planted bund during the dry-seeded rice and transplanted rice.
Bund Distance Crop-planted bund 4m 8m
Dry-Seeded Rice Control 54.8 a1 52.9 a1 Cassava 54.1 a1 54.1 a1 Mungbean 49.7 b1 53.1 a2 Transplanted Rice Control 40.9 a1 44.1 b2 Cassava 41.2 a1 42.7 b1 Mungbean 42.0 a1 47.0 a2
For each season, in a column, means followed by a common letter and in a row, means followed by a common number are not significantly different at the 5% level by Duncan’s Multiple Range Test.
Resume
In general, the rice-straw litter-weight loss during the dry season was lower compared to
that in the flooded rice period (dry-seeded rice and transplanted rice). After 90 days of
fallow, approx. 34%, 18% and 46% of the original weight had disappeared from coarse-
, medium- and fine-mesh bags, respectively. In dry-seeded rice, the litter-weight losses
from coarse-, medium- and fine-mesh bags were 65%, 54%, 48% of the original weight,
respectively. Only for the coarse and medium mesh-size was this two- and three-fold
higher compared to that in the dry season. The litter-weight losses from coarse-,
medium- and fine-mesh bags in the transplanted rice were 74%, 61% and 62% of the
original material, respectively, or higher compared to that in the dry season for all
litterbags.
In dry-seeded rice, the synergistic effect of short bund distance and crops
cultivated on the bund was clearly shown. In the 4-m plots with mungbean planted on
the bund, the litter decomposition was highest, coinciding with the macrofauna biomass,
which was highest in the 4-m plots with mungbean on the bund. Similar results were
obtained during the transplanted rice season, in which the litter decomposition was
significantly higher in the 4-m plots, particularly with mungbean planted on the bund.
This result corresponds with the soil fauna, with abundance and biomass higher in the
4-m plots with crops on the bunds than in the 8-m plots without crops on the bund.

Results and Discussion
76
3.4 Nitrogen mineralization in rainfed paddy fields: relationship with soil fauna
3.4.1 Nitrogen mineralization in fallow and rice fields
In general, net nitrogen (N) mineralization during the fallow period was slower than
during the rice field period (Table 3.23). The average nitrogen mineralization during the
fallow (the soil samples were taken from 8 randomized points) was 76 kg N/ha. The
lower N mineralization was presumably due to the dry soil condition and suppressed
soil fauna (see Section 3.2). Verhoef and Brussaard (1990) reported on the importance
of soil fauna, which they held responsible for about 30% of total net nitrogen
mineralization in forest and grassland ecosystems. During the fallow period, the
monthly rainfall ranged between 0 to 79 mm (Figure 3.1), while the temperature
reached the highest level, ranging from 32.0 to 36.6 oC (Figure 3.2). Crops cannot grow
under this condition, and soil processes, such as mineralization are also inhibited.
Table 3.23: Mean nitrogen mineralization (n=4) in kg per hectare in the different treatment plots during fallow and rice seasons.
Fallow a) Dry-Seeded Rice
Transplanted Rice
Early Fallow Treatment Plots
Mean SD Mean SD Mean SD Mean SD Control, 4m 76 10 141 16 106 25 79 13
Cassava, 4m 192 19 101 26 65 13
Mungbean, 4m 87 18 100 8 76 27
Control, 8m 76 19 96 7 57 11
Cassava, 8m 86 9 74 12 49 20
Mungbean, 8m 65 24 79 12 60 24 a) No treatment plots during fallow period; soil samples were taken from 8 randomized points.
When the field was flooded in the rice seasons (dry-seeded rice and transplanted
rice), N mineralization was stimulated. In dry-seeded rice, particularly in plots with 4-m
bund distance, N mineralization was almost double that observed in the fallow period
(140 kg N/ha). This mineralization rate is relatively high compared to other studies. The
N mineralization capacity of some paddy soils in China, for example, ranges between
8-160 kg N/ha and averages 80 kg N/ha (Zhu et al. 1984). In transplanted rice, the
nitrogen mineralization was still high, especially in plots with 4-m bund distance (Table
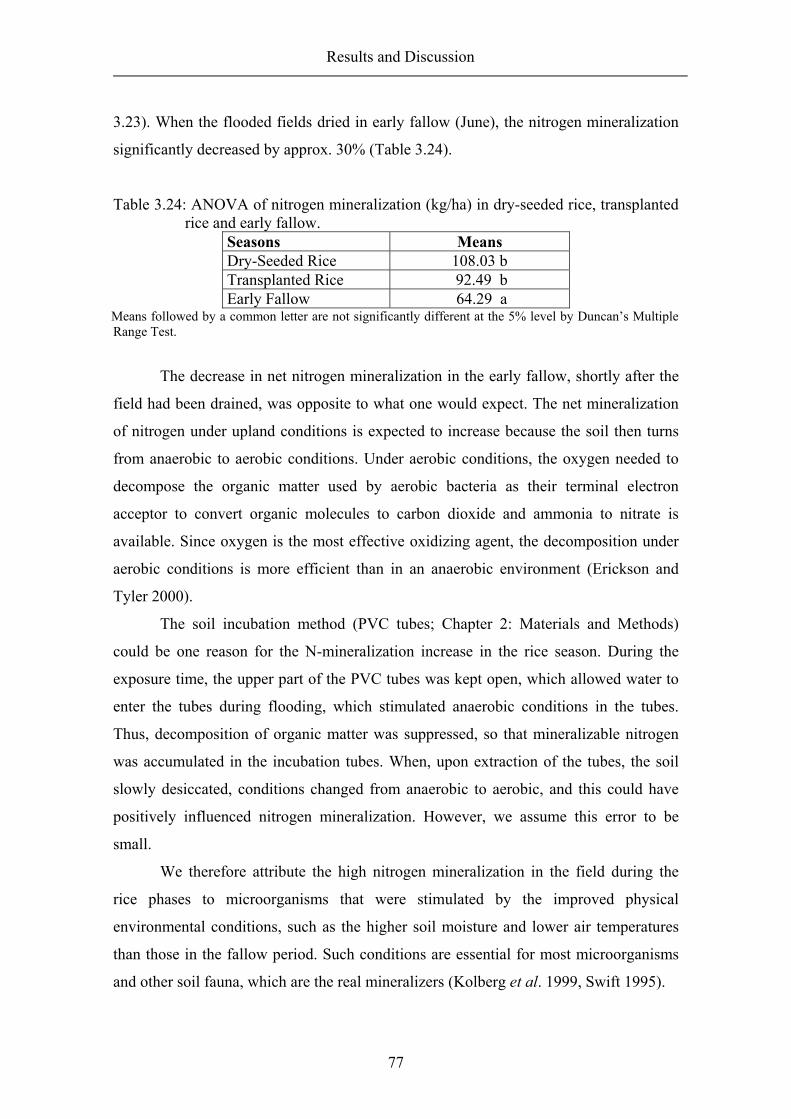
Results and Discussion
77
3.23). When the flooded fields dried in early fallow (June), the nitrogen mineralization
significantly decreased by approx. 30% (Table 3.24).
Table 3.24: ANOVA of nitrogen mineralization (kg/ha) in dry-seeded rice, transplanted rice and early fallow.
Seasons Means Dry-Seeded Rice 108.03 b Transplanted Rice 92.49 b Early Fallow 64.29 a
Means followed by a common letter are not significantly different at the 5% level by Duncan’s Multiple Range Test.
The decrease in net nitrogen mineralization in the early fallow, shortly after the
field had been drained, was opposite to what one would expect. The net mineralization
of nitrogen under upland conditions is expected to increase because the soil then turns
from anaerobic to aerobic conditions. Under aerobic conditions, the oxygen needed to
decompose the organic matter used by aerobic bacteria as their terminal electron
acceptor to convert organic molecules to carbon dioxide and ammonia to nitrate is
available. Since oxygen is the most effective oxidizing agent, the decomposition under
aerobic conditions is more efficient than in an anaerobic environment (Erickson and
Tyler 2000).
The soil incubation method (PVC tubes; Chapter 2: Materials and Methods)
could be one reason for the N-mineralization increase in the rice season. During the
exposure time, the upper part of the PVC tubes was kept open, which allowed water to
enter the tubes during flooding, which stimulated anaerobic conditions in the tubes.
Thus, decomposition of organic matter was suppressed, so that mineralizable nitrogen
was accumulated in the incubation tubes. When, upon extraction of the tubes, the soil
slowly desiccated, conditions changed from anaerobic to aerobic, and this could have
positively influenced nitrogen mineralization. However, we assume this error to be
small.
We therefore attribute the high nitrogen mineralization in the field during the
rice phases to microorganisms that were stimulated by the improved physical
environmental conditions, such as the higher soil moisture and lower air temperatures
than those in the fallow period. Such conditions are essential for most microorganisms
and other soil fauna, which are the real mineralizers (Kolberg et al. 1999, Swift 1995).

Results and Discussion
78
3.4.2 The effect of bund distance and crop-planted bund on net nitrogen mineralization
In all seasons, the 4-m bund distance seemed to exert a positive effect on nitrogen
mineralization. In dry-seeded rice, the 4-m bund distance significantly increased the
nitrogen mineralization in the field compared to the 8-m bund distance. In transplanted
rice and early fallow, the higher N-mineralization in the 4-m plots was not significantly
different (Figure 3.13). The higher net nitrogen mineralization with 4-m bund distance,
especially in dry-seeded rice, corresponds to the higher soil fauna population,
particularly of macrofauna in the 4-m plots (see Section 3.2.2). Since interactions of soil
fauna with microorganisms may influence the mineralization processes (Lavelle and
Spain 2001), the density of soil fauna will also determine the rate of mineralization.
Figure 3.13: Nitrogen mineralization in plots with bund distance of 4m and 8m, during
dry-seeded rice (DS Rice), transplanted rice (TRP Rice) and early fallow. Under each season, bars marked ** mean significant at the 5% level by LSD.
Crops planted on the bund significantly enhanced the N-mineralization only in
dry-seeded rice. Here, cassava planted on the bund significantly increased the net
nitrogen mineralization. In transplanted rice and early fallow, the nitrogen
mineralization was not significantly influenced by different crops cultivated on the
bunds (Figure 3.14).
Net
Nitr
ogen
Min
eral
izat
ion
(kg/
ha)
0
50
100
150
200
4m8m
**
DS Rice TRP Rice Early Fallow
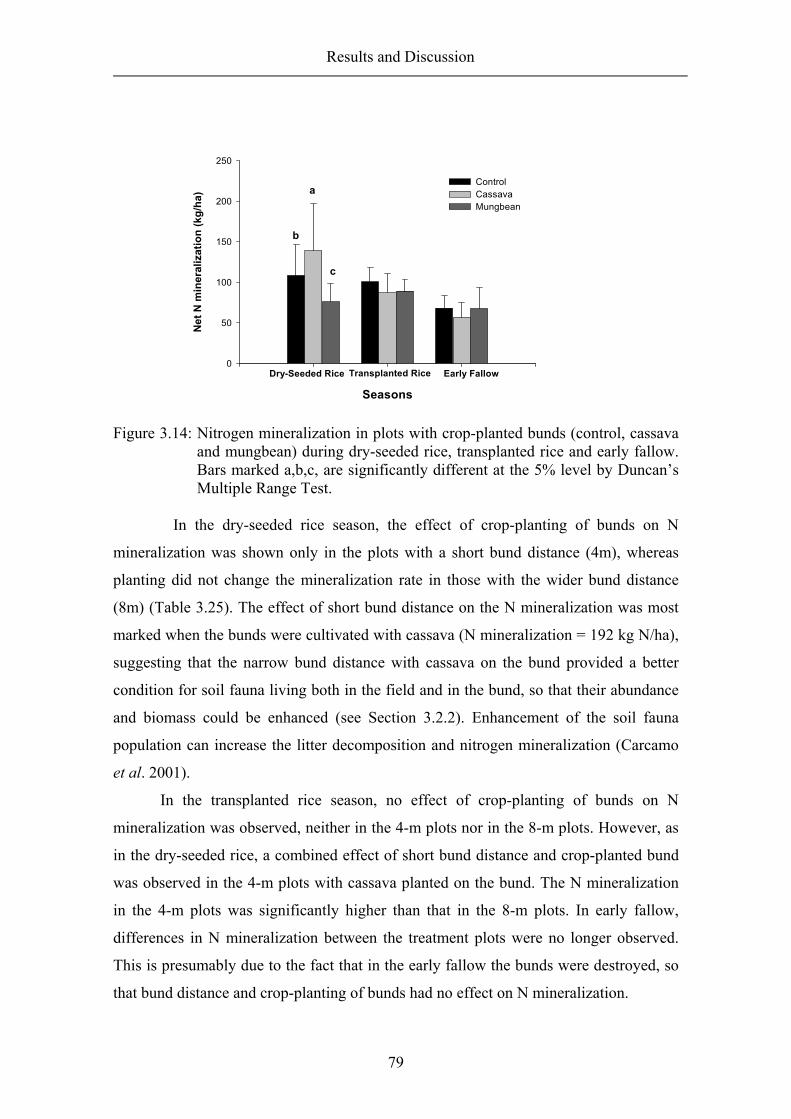
Results and Discussion
79
Figure 3.14: Nitrogen mineralization in plots with crop-planted bunds (control, cassava
and mungbean) during dry-seeded rice, transplanted rice and early fallow. Bars marked a,b,c, are significantly different at the 5% level by Duncan’s Multiple Range Test.
In the dry-seeded rice season, the effect of crop-planting of bunds on N
mineralization was shown only in the plots with a short bund distance (4m), whereas
planting did not change the mineralization rate in those with the wider bund distance
(8m) (Table 3.25). The effect of short bund distance on the N mineralization was most
marked when the bunds were cultivated with cassava (N mineralization = 192 kg N/ha),
suggesting that the narrow bund distance with cassava on the bund provided a better
condition for soil fauna living both in the field and in the bund, so that their abundance
and biomass could be enhanced (see Section 3.2.2). Enhancement of the soil fauna
population can increase the litter decomposition and nitrogen mineralization (Carcamo
et al. 2001).
In the transplanted rice season, no effect of crop-planting of bunds on N
mineralization was observed, neither in the 4-m plots nor in the 8-m plots. However, as
in the dry-seeded rice, a combined effect of short bund distance and crop-planted bund
was observed in the 4-m plots with cassava planted on the bund. The N mineralization
in the 4-m plots was significantly higher than that in the 8-m plots. In early fallow,
differences in N mineralization between the treatment plots were no longer observed.
This is presumably due to the fact that in the early fallow the bunds were destroyed, so
that bund distance and crop-planting of bunds had no effect on N mineralization.
Seasons
Net
N m
iner
aliz
atio
n (k
g/ha
)
0
50
100
150
200
250
ControlCassavaMungbean
Dry-Seeded Rice Transplanted Rice Early Fallow
b
a
c

Results and Discussion
80
Table 3.25: ANOVA of nitrogen mineralization (kg/ha) in treatment plots of crop-planted bund and bund distances during dry-seeded rice, transplanted rice and early fallow.
Bund Distances Crops 4m 8m
Dry-Seeded Rice Control 141 b1 76 a2 Cassava 192 a1 86 a2 Mungbean 87 c1 65 a1 Transplanted Rice Control 106 a1 96 a1 Cassava 101 a1 74 a2 Mungbean 100 a1 79 a1 Early Fallow Control 79 a1 57 a1 Cassava 65 a1 49 a1 Mungbean 76 a1 60 a1
For each season, in a column, means followed by a common letter and in a row means followed by a common number are not significantly different at the 5% level by Duncan’s Multiple Range Test.
3.4.3 Nitrifiers and denitrifiers
In general, the nitrifier population during the fallow period was high, reflecting the high
rate of nitrification that occurred under the aerobic conditions (Table 3.26). Although
the field was flooded during the dry-seeded rice season, and the soil conditions changed
from aerobic to anaerobic, the nitrifier population remained high, consistent with the N
mineralization observed. However, during the transplanted rice season, the nitrifier
population drastically decreased to approx. 1.3 x 10⁵ cfu/g soil, whereas N
mineralization remained high (Table 3.24). Possibly, an aerobic soil surface layer or
rhizosphere-fed oxygen through the rice aerenchym provided sites where nitrification
continued to take place.

Results and Discussion
81
Table 3.26: Population of nitrifiers and denitrifiers as most probable number (MPN) in different treatment plots during fallow, dry-seeded rice (DS Rice), transplanted rice (TRP Rice) and early fallow.
Treatment Plots Fallowa) DS Rice TRP. Rice Early Fallow
Nitrifiers (105 cfu /g soil) Control, 4m 98 136.4 1.0 6.9 Cassava, 4m 143.1 1.0 3.3 Mungbean, 4m 135.3 1.6 12.6 Control, 8m 71.7 1.8 13.8 Cassava, 8m 37.9 1.5 7.5 Mungbean, 8m 76.2 0.7 3.0
Denitrifiers (105 cfu /g soil) Control, 4m 1.8 0.5 0.7 0.1 Cassava, 4m 0.2 0.2 0.1 Mungbean, 4m 0.3 7.9 0.2 Control, 8m 0.3 8.2 1.4 Cassava, 8m 0.3 5.7 0.7 Mungbean, 8m 0.5 7.4 0.4
a) No treatment plots during fallow subsystem; soil samples were taken from 6 randomized points.
The population of denitrifiers stayed low in the dry-seeded season, suggesting a
slow reduction of the soil despite flooding. The effect of flooding on the denitrifier
population was evident in the transplanted rice season, when their population clearly
increased. The increase in denitrifiers is presumably because they are the group of
facultative anaerobic microorganisms that are engaged in reduction of nitrate (NO3-) to
nitrogen gas or to organic nitrogen compounds when O2 is limited under anaerobic
conditions (Geng 2000; Schimel and Gulledge 1998). The high amount of nitrate
produced by nitrifiers during the dry-seeded rice could also stimulate the denitrifier
population in transplanted rice, since denitrifiers utilize nitrate as the terminal electron
acceptor in converting nitrate to nitrogen gas or to organic compounds (Potter 2001).
After the field desiccated in early fallow, the population of nitrifiers slightly
increased, conversely, the population of denitrifiers declined and as a consequence the
rate of denitrification was low (Aulakh et al. 2000). This was probably due to the soil
then returning from anaerobic to aerobic conditions. In general, the bund distance (4m
and 8m) and crop planting on the bund (control, cassava and mungbean) did not
influence the population of nitrifiers and denitrifiers. Their populations in the field plots
were almost always the same, except for the nitrifier population in dry-seeded rice.
Results and Discussion
82
Here, their population in 4-m plots was higher than in 8-m plots, as expected from the N
mineralization in 4-m plots.
Resume
Nitrogen mineralization during the fallow period was lower than that during rice
growth, both in dry-seeded rice and transplanted rice. After the field had been drained,
in early fallow the nitrogen mineralization again was significantly lower than in the rice
field seasons. The plot with 4-m bund distance showed a positive effect on nitrogen
mineralization, particularly in dry-seeded rice. Crops planted on the bund influenced
nitrogen mineralization only in dry-seeded rice, with the N mineralization in the cassava
plot significantly higher than that in control and mungbean plots.
In the dry-seeded rice season, the combined effect of bund distance and crop-
planted bund on N mineralization was very marked in the 4-m plots with cassava
planted on the bund. Here, nitrogen mineralization was significantly higher than in other
treatments. In transplanted rice, the higher N-mineralization in 4-m plots also was
particularly pronounced in the cassava plots. In general, the nitrifier population was
high in dry-seeded rice, in accordance with the N mineralization. However, the nitrifier
population drastically declined in transplanted rice, which was not in line with N
mineralization.

General Discussion and Conclusions
83
4 GENERAL DISCUSSION AND CONCLUSIONS
4.1 Screening of soil fauna in different ecosystems in the study area
Land use can alter soil conditions and the soil community of meso- and macro-
organisms (Lavelle et al. 1997; UNEP 2001). For example, in the ecosystem
comparison, the teak forest and home garden had a higher soil fauna abundance and
biomass than the fallow paddy field. The teak forest and home garden had also a greater
soil fauna variety, with at least three taxa dominating the soil fauna biomass in the teak
forest, namely ants, termites and earthworms. Ants were also a dominant group in the
home garden, whereas termites and earthworms did not occur in the soil samples of the
fallow paddy field.
Poor vegetation cover and lack of plant litter covering the soil surface tend to
reduce the abundance of soil fauna in the fallow paddy field, whereas some crops, like
cassava, papaya and sweet potatoes, still found in the home garden during the dry
season, protected the soil surface from direct sunshine. Likewise, in the teak forest, teak
trees, shrubs and grasses as well as litter on the forest floor shaded the soil surface from
direct sun and maintained soil moisture. This condition presumably provided a more
favorable habitat for soil fauna (Saetre et al. 1999), and accounted for the higher
numbers of their population and diversity in the home garden and teak forest than in the
fallow paddy field. Thus, vegetation cover appears important to maintain soil moisture
and soil living-organisms.
The screening confirmed the data from soil fauna studies in other regions:
management of the rainfed paddy field should mimic the structure of the teak forest and
home garden, possibly through cultivation of the bunds with crops to provide a safe
haven for the soil fauna population and promote their activity, as rice fields are
inhospitable for soil fauna. Besides providing a good litter for soil fauna consumption,
planting crops such as legumes along the bund could conserve soil moisture. These
plants not only do not compete with the rice crop (Eagleton et al. 1991), but they also
provide additional food (or income) to the farmers.

General Discussion and Conclusions
84
4.2 Soil fauna population dynamics in rainfed paddy ecosystem
The dynamics of soil fauna in the rainfed paddy field appeared to fluctuate following
the seasonal changes. During the dry season or fallow period, the soil fauna population
decreased from August to October and stayed low during the flooded periods, when the
rainfall was high at around 200-300 mm per month. In May, when rainfall started to
decrease, the soil fauna abundance increased and reached its peak in June, one month
after the field had been drained (Figure 4.1).
Figure 4.1: Soil Fauna abundance and rainfall pattern during fallow, dry-seeded rice (DSR), transplanted rice (TPR) and early fallow (Jun) (Lines = Abundance; Bars = Rainfall).
The soil fauna biomass exhibited a pattern similar to that of the abundance,
except in April, when the soil fauna biomass reached the highest value due to
earthworms in the samples (Figure 4.2). The results also indicate that the temporary
drainage of rice fields and land preparation prior to the new cropping season are
important, since the soil fauna population consistently increased at the onset of each
new cropping season, i.e. in November and March (Figure 4.1). This boost in soil fauna
population may in part be due to the effect of land preparation, as the land was drained,
hoed and turned over before planting, thus aerating the soil. In addition, in transplanted
rice, the remaining rice straw from the previous cropping was used as an organic input.
Both, better soil aeration and organic input, probably accounted for the increase in the
0
50
100
150
200
250
300
350
Aug Sep Oct Nov Dec Jan Mar Apr May JunMonths
Rai
nfal
l (m
m)
0
500
1000
1500
2000
2500
3000
3500
4000
Abu
ndan
ce (I
nd./m
2)
Fallow DSR TPR

General Discussion and Conclusions
85
soil fauna population at the beginning of each cropping system. Incorporating remaining
rice straw into the soil is also important since it returns most of the nutrients and helps
to conserve soil nutrient reserves in the long-term (Dobermann and Fairhurst 2002).
Additionally, the temporary drainage of rice fields has an additional benefit, since it can
reduce water consumption and methane emissions (Wassmann 2002).
0
50
100
150
200
250
300
350
Aug Sep Oct Nov Dec Jan Mar Apr May Jun
Months
Rai
nfal
l (m
m)
0
100
200
300
400
500
600
Bio
mas
s (m
g/m
2)
Rainfall Biomass
Fallow DSR TPR
Figure 4.2: Soil fauna biomass and rainfall pattern during fallow, dry-seeded rice
(DSR), transplanted rice (TPR) and early fallow (Jun).
Collembola and Acari were the most numerous taxa in the rainfed paddy field,
as they always occurred under both fallow and flooded conditions. However, Acari
seem to be more tolerant of the dry conditions than Collembola, as they occurred in
high numbers during the fallow period. According to Lavelle and Spain (2001), the
resistance of Acari to water and temperature stress is high; they can withstand
desiccation up to –6.0 Mpa (pF 5). This may have influenced their population densities
during the dry and hot seasons. In terms of biomass, Coleoptera was the most dominant
taxa group in the dry fallow phase. However, their larvae together with Diptera larvae
were the most dominant taxa under flooded conditions. These results corroborate the
findings of the ecosystem screening, in which Coleoptera was found to be the dominant
soil fauna biomass in the fallow paddy field. The presence of Acari, Collembola,
Coleoptera and the larvae of Coleoptera and Diptera, both under flooded and non-

General Discussion and Conclusions
86
flooded conditions was important, since most of them are important decomposers (Raw
1967; Borror et al. 1989; Daly et al. 1998 and Lavelle and Spain 2001). In Amazon
forest ecosystems, the decomposers dominated the Coleoptera population, attaining
62% of the total number of families, followed by predators (13%) and herbivores (2%)
(Hanagarth and Brändle 2001). Thus, it is expected that they can play an important role
in the soil processes in rainfed paddy fields, as their activity is critical to the
maintenance of a favorable soil structure and mineral cycling (Lal 1995).
4.3 Effect of bund distance and crop-planted bund on soil fauna, litter decomposition and nitrogen mineralization
4.3.1 Soil fauna population
During the rice phases (dry-seeded rice and transplanted rice), plots with a short bund
distance (4m) tended to have a higher soil fauna abundance, biomass and diversity, both
in the field and in the bund, than the 8-m plots. The larger soil fauna population in the
4-m plots was more pronounced when the bunds were cultivated with crops, such as
mungbean. In the 4-m mungbean-plot, the macrofauna biomass showed the greatest
increase during the dry-seeded rice period. Coleoptera larvae and the bigger animals,
such as earthworms, occurred in the field and in the bund of this plot, contributing to the
high macrofauna biomass. In the 4-m plots, the soil fauna, particularly macrofauna,
could presumably easily escape to the bunds when the conditions in the field became
unfavorable (flooding), and mungbean on the bund provided good litter for their
consumption. Thus, the 4-m plots with mungbean on the bund seemed to be more
favorable for soil fauna, especially macrofauna, than the plots with a longer bund
distance (8m) without crops on the bunds.
This study also revealed that the soil fauna on the bund was found to be more
abundant and diverse than in the field. Way et al. (1998) also found that ant
communities were more abundant and sometimes very diverse on the bunds around
tropical irrigated rice fields. The abundance of soil fauna on the bunds was particularly
high when these were cultivated with crops, because the crops on the bunds could
maintain the soil moisture (Eagleton et al. 1991), providing favorable conditions for soil
fauna. The higher soil fauna abundance and diversity on the bund is important because
soil fauna can easily move from the bund to the field and participate in the soil

General Discussion and Conclusions
87
processes in the field, such as litter decomposition and nitrogen mineralization,
particularly if the bund distances are shorter.
Farmers can also benefit from the crops planted on the bund, since the crops on
the bund did not negatively influence the rice (Eagleton et al. 1991). The soil fauna
abundance was lower on the new bunds, which are regularly constructed before the new
cropping period. The new bunds provided an unstable habitat for soil fauna and
decreased their population as compared to the undisturbed bund. Widyastuti and
Martius (unpublished work) found that the soil fauna population, especially ants, was
more abundant in the old than in the new bunds of a rainfed paddy field in Pati. Thus, it
is proposed to maintain the bunds after the final rice harvest.
4.3.2 Litter decomposition and nitrogen mineralization
The decomposition rate under rice field conditions was generally higher than that in the
dry season. When the activity of macrofauna was not restricted (coarse bags), the litter-
weight loss was more than twice that in dry season. The role of macrofauna in litter
decomposition was clearly exhibited during the rice seasons. In the coarse-mesh bags,
which permitted access to the whole decomposer community, the litter-weight loss was
significantly higher than in fine- and medium-mesh bags, where macrofauna activity
was restricted (Table 3.19). This result corresponds with the findings of Höfer and
Luizäo (1999) in different areas of primary and secondary forest and polyculture
systems in Amazonia. When the activity of macrofauna was restricted in medium- and
fine-mesh bags, they found the decomposition rates also to decrease to about 50% of the
rates in the coarse-mesh bags. They also reported that the role of macrofauna was more
pronounced during the rainy season, when the macrofauna enhanced decomposition.
In the dry season or fallow phase, the role of meso- and macrofauna in litter
decomposition was not readily explained. This is presumably due to the reduction of the
soil fauna population by the hot and dry conditions in the coarser-meshed bags during
the dry season (Section 3.2). In the fine-mesh bags, which permit access only to
microorganisms, the rate of decomposition was faster than that in medium- and coarse-
mesh bags. The enclosure of the litter in a fine-mesh bag presumably created hotter and
more humid conditions in the bag, making it more favorable for microorganisms.
Unfortunately, no moisture measurements were taken. It can thus be concluded that the
General Discussion and Conclusions
88
litterbag experiments show that the soil fauna activity in the fallow season is strongly
reduced.
Although the soil-fauna population was suppressed in the field during the
(flooded) rice season (Section 3.2), the environmental conditions like warm air
temperature and high soil moisture seemed to promote the activity of soil fauna in their
role in organic matter decomposition. This has also been reported by others (Swift
1995; Seneviratne et al. 1998; Lavelle and Spain 2001). In contrast, the low temperature
and extreme desiccation prevalent in cold desert soil severely limit decomposition
processes and the activity and abundance of soil organisms (Treonis et al. 2002). Water
content of decomposing materials can also influence the decay rate. Martius (1997)
reported that the woody material of two varzea tree species decomposed faster if it was
previously submersed in river water for periods of 1-4 weeks. In our study, during the
rice seasons, the high water content of rice-straw litter also contributed to the litter
decomposition rate.
Litter decomposition in the rice season was fastest in plots with short-bund
distance (4m), particularly when the bund was cultivated with mungbean, indicating the
importance of bund distance to facilitate soil fauna movement across the bunds and the
importance of vegetation on the bunds to maintain soil moisture and provide favorable
conditions for soil fauna. This result coincides with the macrofauna biomass that
significantly increased in these plots during the dry-seeded rice period (Table 3.19). The
occurrence of earthworms and some families of beetle larvae, such as Scarabidae and
Erotylidae that are known as decomposers (Alford 1999; Borror et al. 1989; Daly et al.
1998), both in the field and the bund of the 4-m plots with mungbean on the bund
explain the higher litter decomposition rate in this plot.
The short bund distance (4m) also had a positive effect on nitrogen
mineralization, particularly in the dry-seeded rice. The nitrogen mineralization in the
field significantly increased, coinciding with the higher soil fauna population both in the
field and in the bund of the 4-m plots. In the dry-seeded rice, the increase of N
mineralization in the 4-m plots was more clearly exhibited when the bund was planted
with cassava. This result again indicates the importance of vegetation planted on the
bund to conserve the soil moisture and provide a good litter for the soil fauna living on
it. The higher numbers of soil fauna in the 4-m plots with cassava on the bund suggest a

General Discussion and Conclusions
89
close positive relationship between the soil fauna population and nitrogen
mineralization. The role of soil fauna in litter decomposition and nitrogen
mineralization has been reported by some researchers, for example, Verhoef and
Brussaard (1990) reported that soil fauna contributed about 30% of the total net nitrogen
mineralization in forest and grassland ecosystems.
4.4 Concluding remarks
1. The soil fauna studies in other regions (ecosystem screening) confirmed the
important of vegetation cover to maintain soil moisture and soil-living organisms.
Since rainfed paddy field has less vegetation cover and thus a lower soil fauna
population, its management should, therefore, mimic the structure of the teak forest
and home garden, possibly through cultivation of the bunds with crops. These plants
not only do not compete with the staple (rice) crop, but they also provide additional
food (or income) to the farmers.
2. It is suggested to maintain the bunds after the final rice harvest, as the soil fauna
abundance was lower on the new bunds, which are regularly constructed before the
new cropping period. The new bunds provided an unstable habitat for soil fauna and
decreased their population, as compared to the undisturbed bund.
3. The temporary drainage of rice fields and land preparation before the new cropping
season are important, since the soil fauna population consistently increased at the
beginning of each new cropping season.
4. Collembola and Acari were the most numerous taxa in the rainfed paddy field, as
they always occurred under both fallow and flooded conditions. Acari seem to be
more tolerant of the dry conditions than Collembola, as they occurred in high
numbers during the fallow period. In terms of biomass, Coleoptera was the most
dominant taxon in the dry fallow phase. However, their larvae along with the
Diptera larvae were the most dominant taxa under flooded conditions. Earthworms
sporadically occurred both in the fallow and the rice seasons, without any particular
pattern. Once they occurred in the soil samples, their biomass could make up for
more than 60% of the total.
5. In the dry season or fallow phase, the role of meso- and macrofauna in litter
decomposition was not clearly shown. This is presumably due to the reduction of

General Discussion and Conclusions
90
the soil fauna population and to their activities being hampered by the hot and dry
conditions in the coarser-meshed bags.
6. Although the soil-fauna population was suppressed in the field during the (flooded)
rice season, the environmental conditions like warm air temperature and high soil
moisture seemed to promote the activity of soil fauna to play their role in organic
matter decomposition and nitrogen mineralization.
7. In the rice seasons, the short bund distance (4m) tended to increase soil fauna
abundance, biomass and diversity both in the field and the bund. The effect of the
short bund distance was more pronounced when crops were cultivated on the bund.
Here, the crops enhanced macrofauna biomass (only in dry-seeded rice), litter
decomposition and nitrogen mineralization in the field. Mungbean on the bund
increased the litter decomposition, whereas cassava increased nitrogen
mineralization, suggesting that both mungbean and cassava are appropriate for bund
crops. Nevertheless, similar studies with other crops planted on the bund should be
done to achieve a better understanding of bund crops and how they influence soil
fauna population and their role in the soil processes. Thus, fields with the short-bund
distance with crops planted on the bund seem to be a favorable habitat for the soil
fauna population, enhancing their role in soil processes and supporting the
management of crop residues.
8. An additional aspect is that crop residues are sometimes a burden in intensive
farming by small-scale farmers, particularly in wetland rice. Farmers lack the
equipment to incorporate large amounts of straw, which often leads to burning of
this valuable material. Large quantities of CO2 and nutrients may end up being lost
from the system into the atmosphere (Dobermann and Fairhurst 2002). Not only
does this negatively affect soil productivity, but it also adds to the build-up of
greenhouse gasses (GHG) into the atmosphere. Proper management of residues was
identified as one of the most important means of mitigating GHG emissions and
restoring soil productivity (Wassmann et al. 2000). Finding management options
that will help the breaking down residues and mineralizing the stored nutrients by
promoting soil biological activity might help farmers. With regard to this aspect, the
present study can contribute by showing that an improvement of soil biological
activity in rice fields can accelerate organic matter decomposition on the spot.
Summary
91
5 SUMMARY
Sustainable agriculture can be improved through soil-biological management of
cropping systems that favor an enhancement of soil-organism populations and their
ecological services, such as organic matter decomposition and nutrient mineralization
(Lavelle et al 2002). The rainfed lowland paddy fields found widespread in Indonesia
have great potential to be used to increase the productive area, which has become
limited in Indonesia, especially in Java. Rainfed paddy fields are not irrigated and
depend, therefore, totally on rainfall. Due to the lack of irrigation infrastructure, water
resources and low soil fertility, the productivity of rainfed paddy fields is lower
compared to that of irrigated rice-field systems. The low productivity of rainfed paddy
fields calls for alternative management options to increase rice yields.
In this study, crop management systems to improve the soil fauna population and
its role in ecosystem processes has been studied in a rainfed paddy field in Pati,
Indonesia, by modifying the bund distance (4m and 8m) and by cultivating the bund
with crops (cassava or mungbean). The short bund distance (4m) might facilitate the
movement of the soil fauna from the field (during flooding) to the bund. Cultivation of
crops on the bund would increase the soil-surface cover, thus protecting the soil fauna
living on the bund from direct sunshine. It was expected that this would enhance the soil
fauna population and its ecological services. The cropping systems used by local
farmers are (1) dry-seeded rice planted at the beginning of the rainy season, and (2)
transplanted rice planted at the end of rainy season, followed by (3) a short fallow
during the dry season. The objective of this study was to evaluate the dynamics of the
soil fauna population and the function of soil fauna in soil processes during the fallow
and rice phases, and to evaluate the influence of two different bund distances (4m and
8m) and crop-planted bunds (control, cassava and mungbean) on the soil fauna
population, and on the function of soil fauna in litter decomposition and N-
mineralization.
First, a screening of the different ecosystems in the region (teak forest, home
garden and rainfed paddy field) was conducted to obtain a general overview of the soil
fauna. The main study was then conducted in a rainfed paddy field. The experiment was
carried out in plots of 12 x 16 m each, with factorial treatments of bund distance (4m
and 8m) and crops cultivated on the bund (control, cassava and mungbean). The soil

Summary
92
fauna population was sampled using a soil corer of 20 cm diameter at a depth of 0-
15 cm, and extracted in a Berlese funnel extractor. The collected animals were stored in
ethanol 70% and determined under a stereomicroscope. The soil fauna population was
evaluated in all treatment plots during each season after 30, 60 and 90 days. The litter
decomposition was studied using stainless steel litterbags measuring 20 x 20 cm with
the three different mesh sizes 0.038, 0.25, and 10 mm. Rice straw was used as standard
litter, and the litter decomposition was evaluated in all treatment plots during each
season 30, 60 and 90 days after onset. Nitrogen mineralization was also assessed each
season in all treatment plots at the peak of the season using undisturbed soil confined in
PVC tubes containing anion exchanged resins.
In the ecosystem comparison, the fallow paddy field had the lowest soil fauna
abundance, biomass and diversity compared to its surrounding ecosystems, e.g. the
vegetation-covered home garden and the teak forest, suggesting the importance of
vegetation to maintain soil moisture and soil-living organisms. Soil-fauna feeding
activity was also low in the rainfed paddy field and high in the home garden. However,
although soil fauna abundance and biomass were high in the teak forest, their feeding
activity was low at this site, due possibly to the abundance of alternative feed sources.
The soil fauna dynamics in the rainfed paddy field fluctuated following seasonal
changes. Soil fauna abundance, biomass and diversity decreased at the peak of the dry
season and stayed low during the rice seasons (dry-seeded rice and transplanted rice). It
again increased at the end of the transplanted rice season when the rainfall started to
decrease, and reached the high numbers in early fallow, shortly after the field had been
drained. Acari and Collembola were the most numerous taxa in the paddy field, both in
the fallow and rice seasons. However, they were dominated by different groups; oribatid
mites (Acari) in the fallow period, and Sminthuridae (Collembola) during the rice
seasons. In terms of biomass, Coleoptera was the dominant taxon, both in the fallow and
rice seasons. In the rice seasons, Coleoptera larvae, along with Diptera larvae, were
more dominant than the adults. Actually, Oligochaeta occasionally had a high biomass
in all seasons, but not with any special pattern.
Although the soil-fauna population was suppressed in the field during the
(flooded) rice seasons, the environmental conditions like warm air temperature and high
soil moisture seemed to promote the activity of soil fauna to play their role in organic

Summary
93
matter decomposition and nitrogen mineralization. During the rice seasons, the short
bund distance (4m) tended to increase soil fauna abundance, biomass and diversity in
the field and in the bund as well. The higher soil fauna population in the 4-m plots was
most strongly shown when the bunds were cultivated with mungbean. Here, the
macrofauna biomass significantly increased during the dry-seeded rice.
The combined effect of short bund distance (4m) and crops on the bund also
seemed to stimulate the soil fauna in promoting litter decomposition and N
mineralization in the field during the rice seasons. In dry-seeded rice, litter-weight loss
was most strongly shown in the 4-m plots with mungbean planted on the bund, whereas
in transplanted rice, the higher litter-weight loss in the 4-m bund distance was more
pronounced in the control plots and the plots with mungbean on the bund. Nitrogen
mineralization was also strongly marked in 4-m plots, particularly during the dry-seeded
rice season in the plots with cassava planted on the bund. In transplanted rice, the higher
N mineralization in the 4-m bund distance was only observed when the bund was
cultivated with cassava, whereas in early fallow, differences in the N mineralization
between the treatment plots were no longer observed. Thus, mungbean on the bund
increased the litter decomposition, whereas cassava increased N-mineralization,
suggesting that both mungbean and cassava are appropriate for bund crops. In
conclusions, the short bund distance with crops planted on the bund seemed to be
favorable habitat for soil fauna population, so that they can enhance their role in soil
processes and help in the management of crop residues.
References
94
6 REFERENCES
Adejuyigbe CO, Tian G and Adeoye GO (1999) Soil microarthropod populations under
natural and planted fallows in southwestern Nigeria. Agroforest Syst 47: 263-
272
Alford DV (1999) A Textbook of Agricultural Entomology, UK: Blackwell Sciences Amelung W, Martius C, Bandeira AG, Garcia MVB and Zech W (2001) Lignin
characteristics and density fractions of termite nests in an Amazonian rain
forest- indicators of termite feeding guilds ? Soil Biol Biochem 34:367-372
Amien I and Las I (1999) Biophysical characterization of rainfed systems in Java and
South Sulawesi and implications for research. Available at
http://www.irri.org/Abstracts-Indo
Anas I (1989) Biologi Tanah dalam Praktek. Departemen Pendidikan dan Kebudayaan,
Dirjen Pendidikan Tinggi, Pusat Antar Universitas-Bioteknologi, IPB, Bogor.
Anderson JM (1998) Spatiotemporal effects of invertebrates on soil processes. Biol Fert
Soils 6:216-227
Anderson JM and Ingram JSI (1993) Tropical Soil Biology and Fertility. A Handbook
of Methods, Second Edition, UK: CAB International
Aulakh MS, Khera TS, and Doran JW (2000) Mineralization and denitrification in
upland, nearly saturated and flooded subtropical soil. I. Effect of nitrate and
ammoniacal nitrogen. Biol Fert Soils 31:162-167
Bardgett DR and Cook R (1998) Functional aspects of soil animal diversity in
agricultural grasslands. Appl Soil Ecol 10(3): 263-276
Beck L, Höfer H, Martius C, Garcia MB, Franklin E and Römbke J (1998) Soil Fauna
and litter decomposition in primary and secondary forests and a polyculture
system in Amazonia- study design and methodology. Proceeding of the Third
SHIFT-Workshop Manaus, BMBF, Bonn
Bhadauria T and Ramakrishnan PS (1996) Role of earthworms in nitrogen cycling
during the cropping phase of shifting agriculture (Jhum) in northeast India.
Biol Fert Soils 22: 350-354

References
95
Bhadauria T, Ramakrishnan PS, Srivastava KN (1997) Population dynamics of
earthworms during crop rotation under rainfed agriculture in central
Himalayas, India. Appl Soil Ecol 6: 205-215
Biochemical Cycles (1998) The Nitrogen Cycle: Nitrification. Available at
http://www.bsi.vt.edu/chagedor
Bonkowski M, Geoghegan IE, Birch ANE and Griffiths BS (2001) Effects of soil
decomposer invertebrates (protozoa and earthworms) on an above-ground
phytophagous insect (cereal aphid) mediated through changes in the host
plants. OIKOS 95: 441-450
Borror DJ, Triplehorn CA and Johnson NF (1989) An Introduction to the Study of
Insects, Sixth Edition, New York: Saunders College Publishing
Bucher SB, Dobermann A, Wenceslao L, Larazo L, Sticher H and Frossard E (2002)
Nitrogen and phosphorus availability in irrigated rice as influenced by straw
incorporation, tillage and fallow period. Available at
http://www.sfiar.infoagrar.ch/documents/posters/bucher.htm
Carcamo HA, Prescott CE, Chanway CP and Abe TA (2001) Do soil fauna increase
rates of litter breakdown and nitrogen release in forests of British Columbia,
Canada ? Can J Forest Res 31(7): 1195-1204
Chu HF (1949) How to Know The Immature Insects. The Pictured-Key Nature Series,
USA
Daly HV, Doyen JT, and Purcell AH (1998) Introduction to Insect Biology and
Diversity, New York: Oxford University Press, Inc.
Dobermann A and Fairhurst TH (2002) Rice Straw Management. Better Crops
International Vol. 16, Special Supplement
Eagleton EG, Mohamed AA, Odowa AA and Muse HA (1991) A comparison of
moisture-conserving practices for the traditional sorghum-based cropping
system of the Bay Region, in Somalia. Agr Ecosyst Environ 36: 87-89
Edwards CA (1967) Relationships between weights, volumes and numbers of soil
animals. In: Graff O and JE Satchell (Eds) Progress in Soil Biology,
Amsterdam: North-Holland Publishing Company
Edwards CA and Bohlen PJ (1996) Biology and Ecology of Earthworms, Third Edition,
London: Chapman and Hall

References
96
Erickson J and Tyler EJ (2000) Soil Oxygen Delivery to Wastewater Infiltration
Surfaces. Available at http://www.wisc.edu/sswmp.
Federschmidt A and Römbke J (1994) Erfahrungen mit dem Kderstreifen-Test auf zwei
fungizdidbelasteten Standorten. Braunschw. Naturkundl.Schr. 4:674-680
Feenstra G (1997) What is Sustainable Agriculture? Available at
http://www.sarep.ucdavis.edu/concept.htm
Fragoso C and Lavelle P (1995) Are Earthworms Important in the Decomposition of
Tropical Litter ? In: Reddy MV (Ed.) Soil Organisms and Litter
Decomposition in the Tropics. Oxford: West view Press
Geng S (2000) The impact of greenhouse effects on rice: a review. Agronomy Arogress
Report No.127. Available at http://agronomy.ucdavis.edu/agronomy
Hanagarth W, Höfer H, Franklin E, Garcia M, Martius C, Römbke J, Föster B and
Moraes W (1999) Report: Soil Fauna. In: Höfer H, Martius C, Hanagarth W,
Garcia M, Franklin E, Beck L (Eds) Soil Fauna and litter decomposition in
primary and secondary forests and a mixed culture system in Amazonia- Final
Report 1996-1999, SHIFT Project ENV 52, BMBF, Bonn.
Hanagarth W and Brändle M (2001) Soil beetles (Coleoptera) of a primary forest,
secondary forest and two mixed polyculture systems in central Amazonia.
Andrias 15:155-162
Heisler C (1994) Vergleich zwischen biotischer Aktivität nach von Törne und der
Collembolen-Zahl verdichteter Ackerböden.Zool. Beitr. 35: 19-26
Helling B, Pfeiff G and Larink O (1998) A comparison of feeding activity of
collembolan and enchytraeid in laboratory studies using bait-lamina test. Appl
Soil Ecol 7: 207-212
Höfer H and Luizäo F (1999) Report: Decomposition in litterbags and mini-containers.
In: Höfer H, Martius C, Hanagarth W, Garcia M, Franklin E, and Beck L (Eds)
Soil Fauna and litter decomposition in primary and secondary forests and a
mixed culture system in Amazonia- Final Report 1996-1999, SHIFT Project
ENV 52, BMBF, Bonn.
Hübner C, Redl G and Wurst F (1991) In situ methodology for studying N-
mineralization in soils using anion exchange resins. Soil Biol Biochem
23:701-702
References
97
Jonsson M and Malmqvist B (2000) Ecosystem process rate increases with animal
species richness: evidence from leaf-eating, aquatic insects. OIKOS 89: 519-
523
Kachaka SK (1993) Decomposition and N-Mineralization of Prunings of Various
Quality and Age. Dissertationes De Agricultura. K.U. Leuven.
Kandeler E (1996) Nitrate. In: Schinner F, Öhlinger R, Kandeler E and Margesin R
(Eds.) Methods in Soil Biology, Berlin-Heidelberg: Springer-Verlag
Katyal JC. and Vlek PLG (2000) Desertification-Concept, Causes and Amelioration.
ZEF Discussion Papers on Development Policy 33, Center for Development
Research, Bonn
Keeney DR and Nelson DW (1982) Nitrogen-Inorganic forms. In:
Page AL, Miller RH and Keeney DR (Eds.) Methods of Soil Analysis. Part 2:
Chemical and Microbiological Properties, Amer. Soc. Agron. Inc., Publ.
Madison, Wisconsin
Kolberg RL, Westfall DG and Peterson GA (1999) Influence of cropping intensity and
nitrogen fertilizer rates on in situ nitrogen mineralization. Soil Sci Soc Amer J
63:129-134.
Lal R (1995) Sustainable management of soil resources in the humid tropic, Tokyo:
United Nations University Press
Lavelle P, Bignell D, Lepage M, Wolters V, Ineson P, Heal OW and Dhillion S (1997)
Soil function in a changing world: the role of invertebrate ecosystem
engineers. Eur J Soil Biol 33(4): 159-193
Lavelle P and Spain AV (2001) Soil Ecology, Dordrecht: Kluwer Academic Publishers
Lavelle P, Barros E, Blanchart E, Brown G, Desjardins T, Mariani L and Rossi JP
(2001) SOM management in the tropics: Why feeding the soil macrofauna? In:
Martius C, Tiessen H and Vlek PLG (Eds.) Managing Organic Matter in
Tropical Soils: Scope and Limitations, Dordrecht: Kluwer Academic
Publishers
Ludwig AJ and Reynolds FJ (1998) Statistical Ecology: A Primer on Methods and
Computing, New York: John Wiley and Sons, Inc.
Magurran AE (1987) Ecological Diversity and Its Measurement, London: Chapman and
Hall

References
98
Martius C (1997) Decomposition of Wood. In: Junk W (Ed.) The Central Amazon
floodplain. Ecological Study, Vol. 126, Berlin: Springer-Verlag
Martius C (2001) Nest architecture of Nasutitermes termites in a white water floodplain
forest in central Amazonia, and a field key to species (Isoptera, Termitidae).
Andrias 15: 163-170
Meyer E (1996) Mesofauna. In: Schinner F, Öhlinger R, Kandeler E and Margesin R
(Eds.) Methods in Soil Biology, Berlin: Springer-Verlag
Meyer E (1996) Endogeic Macrofauna In: Schinner F, Ohlinger R, Kandeler E,
Margesin R (Eds.) Methods in Soil Biology, Berlin: Springer-Verlag
Naeem S, Thompson LJ, Lawler SP, Lawton JH and Woodfin RM (1995) Empirical
evidence that declining species diversity may alter the performance of
terrestrial ecosystems. Phil Trans Roy Soc London B (347): 249-262
O’Connor FB (1967) The Enchytraeidae. In: Burges A and Raw F (Eds.) Soil Biology,
London: Academic Press
Oyediran IO and Heinrichs EA (2001) Arthropod populations and rice yields in direct-
seeded and transplanted lowland rice in West Africa. Int J Pest Manage 47(3):
195-200
Petersen H and Luxton M (1982) A comparative analysis of soil fauna populations and
their role in decomposition processes. OIKOS 39: 287-388
Potter R (2001) Nitrogen Cycles – Nitrogen transformation in soil, water and air.
Available at http://ltpwww.gsfc.nasa.gov/globe/NFTG/Nitrocyc.
Raison RJ, Conell MJ and Khanna PK (1987) Methodology for studying fluxes of soil
mineral-N in situ. Soil Biol Biochem 19:521-530
Raw F (1967) Arthropoda (except Acari and Collembola) In: Burges A and Raw F
(Eds.) Soil Biology, London: Academic Press
Rubia EG, Heong KL, Zalucki M, Gonzales B and Norton GA (1996) Mechanisms of
compensation of rice plants to yellow stem borer Scirpophaga incertulas
(Walker) injury. Crop Prot 15(4): 335-340
Rubia EG, Diah N, Heong KL, Zalucki M and Norton GA (1997) White stem borer
damage and grain yield in irrigated rice in West Java, Indonesia. Crop Prot
16(7): 665-671

References
99
Saetre P, Brandtberg PO, and Lundkvist H (1999) Soil organisms and carbon, nitrogen
and phosphorus mineralisation in Norway spruce and mixed Norway spruce-
Birch stands. Biol Fert Soils 28:382-388
Schimel JP and Gulledge J (1998) Microbial community structure and global trace
gases. Glob Change Biol 4: 745-758.
Schinner F, Öhlinger R, Kandeler E and Margesin R (Eds.) (1996) Methods in Soil
Biology, Berlin: Springer-Verlag
Seneviratne G, Van Holm LHJ and Kulasooriya SA (1998) Quality of different mulch
materials and their decomposition and N release under low moisture regimes.
Biol Fert Soils 26: 136-140
Settle WH, Ariawan H, Astuti ET, Cahyana W, Hakim AL, Hindayana D, Lestari AS,
Pajarningsih and Sartanto (1996) Managing tropical rice pests through
conservation of generalist natural enemies and alternative prey. Ecology 77
(7): 1975- 1988
Settle WH and Whitten MJ (2000) The role of small-scale farmers in strengthening
linkages between biodiversity and sustainable agriculture. Plenary Lectures.
XXI-International Congress of Entomology, Brazil
Sharma GD, Mishra RR and Kshattriya S (1995) Fungi and Litter Decomposition in the
Tropics. In: Reddy MV (Ed.) Soil Organisms and Litter Decomposition in the
Tropics, Oxford: West view Press
Simpson IC, Roger PA, Oficial R and Grant IF (1993a) Impacts of agricultural practices
on aquatic oligochaete populations in rice fields. Biol Fertil Soils 16:27-33
Stevens MM (2000) Bloodworm and earthworm control in rice. Rural Industries
Research and Development Corporation, New South Wales
Swift MJ, Heal OW, and Anderson JM (1979) Decomposition in Terrestrial
Ecosystems, Oxford: Blackwell Scientific Publications
Swift MJ (1995) Introduction: Soil Biology and Soil Fertility in the Tropics. In: Reddy
MV (Ed.). 1995. Soil Organisms and Litter Decomposition in the Tropics,
Oxford: Westview Press

References
100
Syamsiah I, Suprapto, Fagi AM and Bhuiyan SI (1994) Collecting and conserving rain
water to alleviate drought in rainfed rice lands of Indonesia. In: Bhuiyan, SI
(Ed.) On-Farm Reservoir Systems for Rainfed Ricelands. International Rice
Research Institute, Los Banos, Philippines
Tian GL (1992) Biological effects of plant residues with contrasting chemical
compositions on plant and soil under humid tropical conditions. Ph.D. thesis,
Wageningen Agricultural University, The Netherlands
Tiedje JM (1982) Denitrification. In: Page AL, Miller RH, Keeney DR (Eds). Methods
of soil analyses, part 2. Am. Soc. Agron, Madison, Wisconsin
Törne EV (1990a) Assessing feeding activities of soil living animals. I. Bait-lamina-
test. Pedobiologia 34: 89-101
Treonis AM, Wall DH, Virginia RA (2002) Field and microcosm studies of
decomposition and soil biota in cold desert soil. Ecosystems 5: 159-170
Trolldenier G (1996) Denitrifiers by MPN Methods. In: Schinner F, Öhlinger R,
Kandeler E and Margesin R (Eds.) Methods in Soil Biology, Berlin: Springer-
Verlag
Trolldenier G (1996) Nitrifiers by MPN Methods. In: Schinner F, Öhlinger R, Kandeler
E and Margesin R (Eds.) Methods in Soil Biology, Berlin: Springer-Verlag
UNEP (2001) Agricultural Biological Diversity. Convention on Biological Diversity,
Seventh Meeting, Montreal
Van der Drift J (1951) Analysis of the animal community in a beech forest floor.
Tijdschr.Ent. 94: 1-68
Verhoef HA and Brussaard L (1990) Decomposition and nitrogen mineralization in
natural and agroecosystems : the contribution of soil animals. Biogeochemistry
11:175-211.
Vreeken-Buijs MJ and Brussaard L (1996) Soil mesofauna dynamics, wheat residue
decomposition and nitrogen mineralization in buried litterbags. Biol Fert Soils
23: 374-381
Wassmann R, Lantin RS, Neue HU, Buendia LV, Corton TM and Lu Y (2000)
Characterization of methane emissions from rice fields in Asia. III. Mitigation
options and future research needs. Nutr Cycl Agroecosyst 58: 23-36

References
101
Wassmann R (2002) Mitigating greenhouse gas emissions. ZEF News No. 10, Center
for Development Research, Bonn University
Watanabe I (1984) Anaerobic Decomposition of Organic Matter in Flooded Rice Soils.
In: International Rice Research Institute. Decomposition of Organic Matter In
Wetland Rice Soils. Los Banos, Laguna, Philippines
Watanabe I and Roger PA (1985) Ecology of flooded rice fields. Proceedings of
Wetland Soils: Characterization, classification and utilization. International
Rice Research Institute, Los Banos, Philippines
Way MJ, Islam Z, Heong KL and Joshi RC (1998) Ants in tropical irrigated rice:
distribution and abundance, especially of Solenopsis geminata (Hymenoptera:
Formicidae). Bull Entomol Res 88: 467-476
Whitten T, Soeriaatmadja RE and Afiff SA (1997) The Ecology of Java and Bali,
Oxford University Press
Wilby A, Shachack M and Boeken B (2001) Integration of ecosystem engineering and
thropic effects of herbivores. OIKOS 92: 436-444
Yokota H and Kaneko N (2002) Naidid worms (Oligochaeta, Naididae) in paddy soils
as affected by the application of legume mulch and/or tillage practice. Biol
Fert Soils 35: 122-127
Zeller V, Bahn M, Aichner M and Tappeiner U (2000) Impact of land-use change on
nitrogen mineralization in subalpine grasslands in the Southern Alps. Biol Fert
Soils 31: 441-448.
Zhu Z, Liu C and Jiang B (1984) Mineralization of Organic Nitrogen, Phosphorus, and
Sulfur in Some Paddy Soils of China. In: International Rice Research Institute.
Decomposition of Organic Matter in Wetland Rice Soils. Los Banos, Laguna,
Philippines

Appendices
102
7 APPENDICES
Appendix 1: Soil fauna in the field during the fallow (averages over 3 months). No. Taxa Number of individuals m-2
Mesofauna 1 Acari/Oribatida (Oribatid mites) 1270 2 Acari/Tetranychidae (Spider mites) 171 3 Acari/others 50 4 Collembola/Hypogastruridae 297 5 Collembola/Onychiuridae 21 6 Collembola/Isotomidae 213 7 Collembola/Poduridae 10 8 Collembola/Neelidae 5 9 Collembola/Entomobryidae 12
10 Collembola/Sminthuridae 1 11 Copepoda 2
Macrofauna 12 Aranae (Spiders) 5 13 Coleoptera/Pselaphidae (Short-winged mold beetles) 32 14 Coleoptera/Erotylidae la. 15 15 Coleoptera/Tenebrionidae 2 16 Coleoptera/Salpingidae (Narrow-waisted bark beetles) 3 17 Coleoptera/Dermestida (Dermestid beetles) la. 1 18 Coleoptera/Lathridiidae (Minute Scavenger beetles) 2 19 Coleoptera/Scydmaenidae (Antlike stone beetles) 16 20 Coleoptera/Staphylinidae (Rove beetles) 1 21 Coleoptera/Ptiliidae 1 22 Coleoptera/Carabidae (Ground beetles) 3 23 Coleoptera/others 27 24 Diplopoda (Millipedes) ad 3 25 Diplura/Anajapygidae 1 26 Diplura/Japygidae 16 27 Diptera/Ceratopogonidae (Punkies) la. 1 28 Diptera/Mydaidae la. 2 29 Diptera/ others ad. 6 30 Hemiptera/Cydnidae (Burrower bugs) 4 31 Hemiptera/ Pentatomidae (Stink bugs) 1 32 Hemiptera/others 4 33 Homoptera/ others 1 34 Hymenoptera/Formicidae (Ants) 12 35 Hymenoptera/others 5 36 Isopoda 3 37 Orthoptera/Phaneropterinae (Katydids) 1
Oligochaeta 38 Oligochaeta/Enchytraeids 20 39 Oligochaeta/Earthworms 6
Total 2240

Appendices
103
Appendix 2: Soil fauna in the field with two different bund distances (4m and 8m) in dry-seeded rice season.
No. Taxa Number of individuals m-2 4 m 8 m Field Bund Field Bund
Mesofauna 1 Acari/Oribatida (Oribatid mites) 25 14 11 25 2 Acari/Tetranychidae (Spider mites) 11 32 4 53 3 Acari/others la. 4 11 11 7 4 Collembola/Isotomidae 71 106 88 103 5 Collembola/Sminthuridae 163 265 510 276 6 Collembola/Hypogastruridae 40 60 0 28 7 Collembola/Entomobryidae 7 7 7 11 8 Collembola/Poduridae 0 4 0 0 9 Collembola/Onychiuridae 0 4 0 0
10 Copepoda 4 4 4 0 11 Pseudoscorpiones Immature 4 0 0 0
Macrofauna 12 Aranae (Spiders) 11 4 0 7 13 Coleoptera/Platypsyllidae 0 7 0 0 14 Coleoptera/Scarabidae la 0 7 0 0 15 Coleoptera/Erotylidae la. 0 4 0 0 16 Coleoptera/Scydmaenidae (Antlike stone beetles) la. 4 0 4 4 17 Coleoptera/Scydmaenidae (Antlike stone beetles) ad. 0 0 0 7 18 Coleoptera/Hylobiinae 3 0 0 0 19 Coleoptera/Pselaphidae (Short-winged mold beetles) 0 4 4 4 20 Coleoptera/Carabidae (Ground beetles) ad. 0 4 0 0 21 Coleoptera/Carabidae (Ground beetles) la. 0 4 0 7 22 Coleoptera/Monommidae (Monommids) 0 4 0 4 23 Coleoptera/Platypodidae 0 0 0 4 24 Coleoptera/others la. 4 7 0 7 25 Coleoptera/ others ad. 4 4 0 11 26 Diplura/Japygidae 0 4 4 4 27 Diptera/Culicidae (Mosquitoes) Immature 7 18 0 4 28 Diptera/Sciaridae (Dark-winged fungus gnat) 4 4 0 4 29 Diptera/Mydaidae la. 4 0 7 0 30 Diptera/Ceratopogonidae la. 0 0 4 0 31 Diptera/Tephritidae (Apple maggot) 0 0 0 4 32 Diptera/Sepsidae (Black scavenger flies) 0 0 4 0 33 Diptera/others la. 50 18 7 4 34 Hymenoptera/Formicidae (Ants) 14 18 14 7
35 Hymenoptera/Chalcidoidea 0 0 4 0 36 Hymenoptera/others 0 4 0 0 37 Hemiptera/Miridae 0 7 0 0 38 Orthoptera/Acrididae (Grasshoppers) Immature 4 4 0 0
Oligochaeta 39 Oligochaeta/Enchytraeids 4 7 28 4 40 Oligochaeta/Earthworms 4 11 21 7
Total 439 644 732 591

Appendices
104
Appendix 3: Soil fauna in the field with two different bund distances (4m and 8m) in
transplanted rice season. No. Taxa Number of individuals m-2 4m 8m Field Bund Field Bund
Mesofauna 1 Acari/Oribatida (Oribatid mites) 131 71 103 74 2 Acari/Tetranychidae (Spider mites) 32 81 67 135 3 Acari/others la. 14 60 50 21 4 Acari (spotted acari) 7 184 0.0 11 5 Collembola/Sminthuridae 195 439 255 195 6 Collembola/Hypogastruridae 71 170 134 92 7 Collembola/Entomobryidae 113 227 124 326 8 Collembola/Isotomidae 11 35 11 32 9 Collembola/Poduridae 4 0 0 4
10 Psocoptera (Psocids) ad. 4 0 0 0 11 Psocoptera (Psocids) Instar 14 11 4 4 12 Thysanoptera/Thripidae (Thrips) la. 0 0 0 4
Macrofauna 13 Aranae (Spiders) 7 14 4 0 14 Coleoptera/Alleculidae (Comb-claw beetles) 11 11 7 7 15 Coleoptera/Staphylinidae (Rove beetles) 18 18 35 28 16 Coleoptera/Staphylinidae (Rove beetles) la. 7 3.5 3.5 11 17 Coleoptera/Lathridiidae (Minute scavenger beetles) 11 28 11 32 18 Coleoptera/Carabidae (Ground beetles) ad. 11 12 0 4 19 Coleoptera/Carabidae (Ground beetles) la. 0 4 4 7 20 Coleoptera/Heteroceridae (Variegated mud-loving b.) 7 11 7 0 21 Coleoptera/Heteroceridae (Variegated mud-loving b.) la. 0 0 0 4 22 Coleoptera/Dytiscidae la. 4 4 4 0 23 Coleoptera/Cucujidae (Flat bark beetles) 0 4 0 0 24 Coleoptera/Mycetophagidae 4 4 0 0 25 Coleoptera/Scydmaenidae (Antlike stone beetles) 0 4 4 0 26 Coleoptera/Pselaphidae (Short-winged mold beetles) 0 7 7 7 27 Coleoptera/Tenebrionidae (Darkling beetles) 4 0 4 0 28 Coleoptera/Rhysodidae (Wrinkled bark beetles) 0 4 0 4 29 Coleoptera/others la. 7 4 0 4 30 Coleoptera/others ad. 4 0 4 0 31 Diptera/Tipulidae la. 0 4 4 0 32 Diptera/Cecidomyiidae (Gall midges) ad. 0 7 0.0 3.5 33 Diptera/Otitidae 0 4 0 0 34 Diptera/Culicidae (Mosquitoes) la. 0 4 0 7 35 Diptera/Ceratopogonidae (Little gray punkie) la. 0 4 0 4 36 Diptera/Mydaidae la. 0 4 0 0 37 Diptera/Asilidae la. 0 4 0 0 38 Diptera/Chironomidae (Midges) la. 0 0 4 0 39 Diptera/Bombyliidae 0 0 0 4 40 Diptera/others la. 0 0 4 0 41 Diptera/others ad. 14 57 14 21 42 Grylloblattaria (Rock crawlers) 0 0 0 4

Appendices
105
Continued
No. Taxa Number of individuals m-2 4m 8m Field Bund Field Bund
43 Hemiptera/Miridae (Immature) 4 0 0 0 44 Hemiptera/Cydnidae (Burrower bugs) 0 4 0 0 45 Hemiptera/Pyrrhocoridae 0 4 0 0 46 Hemiptera/others 8 0 0 0 47 Homoptera/Aphididae (Instar) 7 14 4 4 48 Homoptera/Deltocephalinae (Leafhoppers) 4 0 0 0 49 Homoptera/others ad. 4 25 0 0 50 Hymenoptera/Formicidae (Ants) 11 25 4 18 51 Hymenoptera/Tiphiinae (Tiphiid wasps) 0 0 4 0 52 Hymenoptera/others ad. 0 7 0 0 53 Lepidoptera ad. 0 0 0 7 54 Orthoptera/Tettigoniidae (Grasshoppers) 0 4 0 0 55 Orthoptera/Conocephalinae (Meadow grasshopp.) 0 7 0 0 56 Orthoptera/Gryllidae (Mole crickets) Immature 0 14 0 7 57 Orthoptera/ Phaneropterinae (Bush Katydids) 4 0 0 0 58 Orthoptera/Others 0 0 0 4 59 Plecoptera (Stoneflies) Nymphs 0 0 18 4 60 Trichoptera (Caddisflies) la. 28 25 21 35
Oligochaeta 61 Oligochaeta/Earthworms 0 18 4 18 62 Oligochaeta/Enchytraeids 7 0 0 0
Total 775 1634 916 1139

Appendices
106
Appendix 4: Soil fauna in the field with two different bund distances (4m and 8m) in the early fallow.
No. Taxa Number of individuals m-2 4m 8m Field Bund Field Bund
Mesofauna 1 Acari/Oribatida (Oribatid mites) 64 159 372 1465 2 Acari/Tetranychidae (Spider mites) 127 191 149 531 3 Acari/Others la. 11 0 96 21 4 Acari (Spotted acari) 85 21 0 21 5 Collembola/Sminthuridae 0 11 510 32 6 Collembola/Hypogastruridae 435 96 754 403 7 Collembola/Entomobryidae 234 425 478 1221 8 Collembola/Isotomidae 234 595 202 202 9 Collembola/Poduridae 0 0 0 11 Macrofauna
10 Aranae (Spiders) 0 0 0 11 11 Coleoptera/Pselaphidae (Short-winged mold beetles) 21 0 32 21 12 Coleoptera/Pselaphidae (Short-winged mold beetles) la. 0 0 21 0 13 Coleoptera/ Cucujidae la. 11 0 0 0 14 Coleoptera/Lathridiidae (Minute scavenger beetles) 21 21 32 85 15 Coleoptera/Lathridiidae (Minute scavenger beetles) la. 0 0 11 0 16 Coleoptera/Staphylinidae (Rove beetles) ad. 11 11 74 21 17 Coleoptera/Staphylinidae (Rove beetles) la. 11 11 11 2 18 Coleoptera/Scydmaenidae (Antlike stone beetles) 0 11 21 21 19 Coleoptera /Elateridae (Click beetles) 0 0 0 11 20 Coleoptera/Phalacridae (Shining flower beetles) 0 0 11 0 21 Coleoptera/Salpingidae (Narrow-waisted bark beetles) 0 0 11 0 22 Coleoptera/Erotylidae la. 0 0 0 43 23 Coleoptera/Alleculidae (Comb-clawed beetles) la. 0 0 0 11 24 Coleoptera/ others la. 11 11 11 21 25 Diplura/ Japygidae 0 0 11 0 26 Diptera/ Asilidae la. 0 0 0 11 27 Diptera/ Cecidomydae la. 0 0 0 11 28 Diptera/ others ad. 0 0 21 21 29 Hemiptera/others 0 0 0 11 30 Homoptera/Aphididae (Aphids) Instar 11 11 11 11 31 Homoptera/Deltocephalinae (Leafhoppers) Immature 0 0 11 0 32 Hymenoptera/Formicidae (Ants) 21 1507 0 96 33 Hymenoptera/others 0 11 0 0
Oligochaeta 34 Oligochaeta/Enchytraeids 21 11 74 21 35 Oligochaeta/Earthworms 0 11 21 43
Total 1327 3110 2941 4406
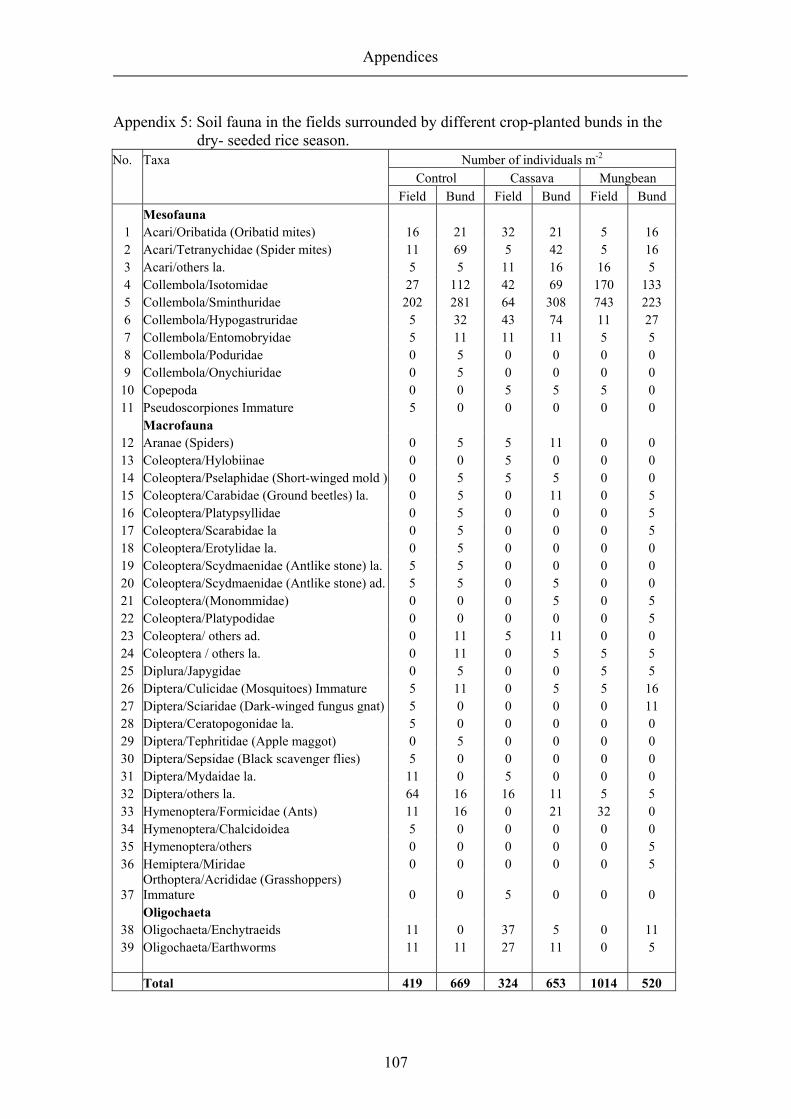
Appendices
107
Appendix 5: Soil fauna in the fields surrounded by different crop-planted bunds in the dry- seeded rice season.
No. Taxa Number of individuals m-2 Control Cassava Mungbean Field Bund Field Bund Field Bund
Mesofauna 1 Acari/Oribatida (Oribatid mites) 16 21 32 21 5 16 2 Acari/Tetranychidae (Spider mites) 11 69 5 42 5 16 3 Acari/others la. 5 5 11 16 16 5 4 Collembola/Isotomidae 27 112 42 69 170 133 5 Collembola/Sminthuridae 202 281 64 308 743 223 6 Collembola/Hypogastruridae 5 32 43 74 11 27 7 Collembola/Entomobryidae 5 11 11 11 5 5 8 Collembola/Poduridae 0 5 0 0 0 0 9 Collembola/Onychiuridae 0 5 0 0 0 0
10 Copepoda 0 0 5 5 5 0 11 Pseudoscorpiones Immature 5 0 0 0 0 0
Macrofauna 12 Aranae (Spiders) 0 5 5 11 0 0 13 Coleoptera/Hylobiinae 0 0 5 0 0 0 14 Coleoptera/Pselaphidae (Short-winged mold ) 0 5 5 5 0 0 15 Coleoptera/Carabidae (Ground beetles) la. 0 5 0 11 0 5 16 Coleoptera/Platypsyllidae 0 5 0 0 0 5 17 Coleoptera/Scarabidae la 0 5 0 0 0 5 18 Coleoptera/Erotylidae la. 0 5 0 0 0 0 19 Coleoptera/Scydmaenidae (Antlike stone) la. 5 5 0 0 0 0 20 Coleoptera/Scydmaenidae (Antlike stone) ad. 5 5 0 5 0 0 21 Coleoptera/(Monommidae) 0 0 0 5 0 5 22 Coleoptera/Platypodidae 0 0 0 0 0 5 23 Coleoptera/ others ad. 0 11 5 11 0 0 24 Coleoptera / others la. 0 11 0 5 5 5 25 Diplura/Japygidae 0 5 0 0 5 5 26 Diptera/Culicidae (Mosquitoes) Immature 5 11 0 5 5 16 27 Diptera/Sciaridae (Dark-winged fungus gnat) 5 0 0 0 0 11 28 Diptera/Ceratopogonidae la. 5 0 0 0 0 0 29 Diptera/Tephritidae (Apple maggot) 0 5 0 0 0 0 30 Diptera/Sepsidae (Black scavenger flies) 5 0 0 0 0 0 31 Diptera/Mydaidae la. 11 0 5 0 0 0 32 Diptera/others la. 64 16 16 11 5 5 33 Hymenoptera/Formicidae (Ants) 11 16 0 21 32 0 34 Hymenoptera/Chalcidoidea 5 0 0 0 0 0 35 Hymenoptera/others 0 0 0 0 0 5 36 Hemiptera/Miridae 0 0 0 0 0 5
37 Orthoptera/Acrididae (Grasshoppers) Immature 0 0 5 0 0 0
Oligochaeta 38 Oligochaeta/Enchytraeids 11 0 37 5 0 11 39 Oligochaeta/Earthworms 11 11 27 11 0 5
Total 419 669 324 653 1014 520

Appendices
108
Appendix 6: Soil fauna in fields surrounded by different crop-planted bunds during
transplanted rice No. Taxa Number of individuals m-2 Control Cassava Mungbean Field Bund Field Bund Field Bund
Mesofauna 1 Acari/Oribatida (Oribatid mites) 106 42 90 90 154 85 2 Acari/Tetranychidae (Spider mites) 27 90 42 117 80 117 3 Acari/others la. 27 69 27 37 43 16 4 Acari (Spotted acari) 0 0 5 212 5 80 5 Collembola/Sminthuridae 265 669 85 202 324 80 6 Collembola/Hypogastruridae 106 117 53 138 149 138 7 Collembola/Entomobryidae 64 106 138 287 154 435 8 Collembola/Isotomidae 11 11 5 32 16 59 9 Collembola/Poduridae 0 5 5 0 0 0
10 Psocoptera (Psocids) ad. 5 0 0 0 0 0 11 Psocoptera (Psocids) Instar 5 5 11 5 11 11 12 Thysanoptera/Thripidae (Thrips) la. 0 5 0 0 0 0
Macrofauna 13 Aranae (Spiders) 5 5 0 11 11 5 14 Coleoptera/Alleculidae (Comb-claw beetles) 5 11 0 5 16 5 15 Coleoptera/Staphylinidae (Rove beetles) ad. 24 21 21 16 27 27 16 Coleoptera/Staphylinidae (Rove beetles) la. 0 11 5 11 5 0 17 Coleoptera/Lathridiidae (Minute scavenger ) 11 27 11 42 11 21 18 Coleoptera/Carabidae (Ground beetles) ad. 5 5 5 5 5 11 19 Coleoptera/Carabidae (Ground beetles) la. 5 11 0 0 0 5 20 Coleoptera/Rhysodidae (Wrinkled bark ) 0 5 0 0 0 5 21 Coleoptera/Pselaphidae (Short-winged mold ) 5 0 0 11 5 11 22 Coleoptera/Heteroceridae 11 5 0 11 11 5 23 Coleoptera/Dytiscidae la. 5 5 0 0 5 0 24 Coleoptera/Cucujidae (Flat bark beetles) 0 5 0 0 0 0 25 Coleoptera/Mycetophagidae 5 0 0 5 0 0 26 Coleoptera/Scydmaenidae (Antlike stone b.) 0 0 5 5 0 0 27 Coleoptera/Tenebrionidae (Darkling beetles) 0 0 11 0 0 0 28 Coleoptera/others la. 0 5 5 0 5 5 29 Coleoptera/others ad. 0 0 0 0 11 0 30 Diptera/Tipulidae la. 0 5 5 0 0 0 31 Diptera/Cecidomyiidae (Gall midges) ad. 0 11 0 5 0 0 32 Diptera/Otitidae 0 5 0 0 0 0 33 Diptera/Chironomidae (Midges) la. 5 0 0 0 0 0 34 Diptera/Bombyliidae 0 5 0 0 0 0 35 Diptera/ Culicidae (Mosquitoes) la. 0 5 0 10 0 0 36 Diptera/Ceratopogonidae la. 0 0 0 5 0 5 37 Diptera/Mydaidae la. 0 0 0 5 0 0 38 Diptera/Asilidae la. 0 0 0 0 0 5 39 Diptera/others la. 5 0 0 0 0 0 40 Diptera/others ad. 11 64 21 37 11 16 41 Grylloblattaria (Rock crawlers) 0 0 0 0 0 5 42 Hemiptera/Pyrrhocoridae (Red bugs) 0 0 0 0 0 5

Appendices
109
Continued No. Taxa Number of individuals m-2 Control Cassava Mungbean Field Bund Field Bund Field Bund
43 Hemiptera/Miridae (Immature) 5 0 0 0 0 0 44 Hemiptera/Cydnidae (Burrower bugs) 0 0 0 5 0 0 45 Hemiptera/others 0 0 5 0 5 0 46 Homoptera/Aphididae (Instar) 5 5 5 11 5 11 47 Homoptera/Deltocephalinae (Leafhoppers) 0 0 0 0 5 0 48 Homoptera/others ad. 0 5 0 0 0 0 49 Hymenoptera/Formicidae (Ants) 11 16 5 43 5 32 50 Hymenoptera/Tiphiinae (Tiphiid wasps) 0 0 5 0 0 0 51 Hymenoptera/others ad. 0 5 5 5 0 5 52 Lepidoptera ad. 0 5 0 0 0 5 53 Orthoptera/Gryllidae (Crickets) Immature 0 5 0 0 0 27 54 Orthoptera/ Phaneropterinae (Bush Katydids) 5 0 0 0 0 0 55 Orthoptera/Tettigoniidae (Grasshoppers) 0 0 0 5 0 0 56 Orthoptera/Conocephalinae Imm. 0 0 0 5 0 5 57 Orthoptera/Others 0 0 0 0 0 5 58 Plecoptera (Stoneflies) Nymphs 0 0 5 5 21 0 59 Trichoptera (Caddisflies) la. 27 21 16 37 32 32
Oligochaeta 60 Oligochaeta/Enchytraeids 0 0 11 0 0 0 61 Oligochaeta/Earthworms 5 27 0 11 0 16
Total 777 1422 610 1433 1130 1295

Appendices
110
Appendix 7: Soil fauna in fields surrounded by different crop-planted bunds in the early fallow.
No. Taxa Number of individuals m-2 Control Cassava Mungbean Field Bund Field Bund Field Bund
Mesofauna 1 Acari/Oribatida (Oribatid mites) 64 175 239 1147 350 1115 2 Acari/Tetranychidae (Spider mites) 159 96 127 637 127 350 3 Acari/Others la. 0 0 16 16 143 16 4 Acari (Spotted acari) 16 0 64 48 48 16 5 Collembola/Sminthuridae 16 32 733 16 16 16 6 Collembola/Hypogastruridae 382 255 446 255 955 239 7 Collembola/Entomobryidae 398 478 287 398 382 1592 8 Collembola/Isotomidae 207 637 111 143 334 414 9 Collembola/Poduridae 0 0 0 0 0 16
Macrofauna 10 Aranae (Spiders) 0 0 0 0 0 16 11 Coleoptera/Pselaphidae (Short-winged mold ) 32 16 16 0 32 16 12 Coleoptera/Pselaphidae la. 0 0 32 0 0 0 13 Coleoptera/ Cucujidae la. 16 0 0 0 0 0 14 Coleoptera/Lathridiidae (Minute scavenger ) 32 16 32 48 16 96 15 Coleoptera/Lathridiidae la. 0 0 0 0 16 0 16 Coleoptera/Staphylinidae (Rove beetles) ad. 16 0 32 16 80 32 17 Coleoptera/Staphylinidae (Rove beetles) la. 16 16 0 16 16 32 18 Coleoptera/Scydmaenidae (Antlike stone ) 0 0 16 16 16 32 19 Coleoptera/Phalacridae (Shining flower ) 0 0 16 0 0 0 20 Coleoptera/Salpingidae (Narrow-waisted) 0 0 16 0 0 0 21 Coleoptera/Erotylidae la. 0 0 0 16 0 48 22 Coleoptera/Alleculidae (Comb-clawed ) la. 0 0 0 16 0 0 23 Coleoptera /Elateridae (Click beetles) 0 0 0 0 0 16 24 Coleoptera/ others la. 16 16 0 16 16 16 25 Diplura/ Japygidae 0 0 0 0 16 0 26 Diptera/ Asilidae la. 0 0 0 0 0 16 27 Diptera/ Cecidomydae la. 0 0 0 0 0 16 28 Diptera/others ad. 0 0 16 0 32 16 29 Diptera/others la. 0 0 16 16 0 0 30 Hemiptera/others 0 16 0 0 0 0 31 Homoptera/Aphididae (Aphids) Instar 0 0 16 16 16 16 32 Homoptera/Deltocephalinae (Leafhoppers) 0 0 16 0 0 0 33 Hymenoptera/Formicidae (Ants) 16 32 16 2166 0 207 34 Hymenoptera/others 0 16 0 0 0 0 35 Trichoptera (Caddisflies) 32 32 0 0 16 48
Oligochaeta 36 Oligochaeta/Enchytraeids 32 16 16 16 96 16 37 Oligochaeta/Earthworms 0 0 0 0 0 16
Total 1449 1847 2277 5016 2723 4427

Appendices
111
Appendix 8: The average values of feeding activity of the soil animals in various depth of soil in ecosystem of teak forest, home garden and rainfed paddy field.
Depth % holes fed per depth
Holes cm Teak Forest Home Garden Rice Field Old Bund New Bund
1 0.00 0.26 0.44 0.21 0.77 0.17 2 0.55 0.24 0.45 0.17 0.83 0.15 3 1.10 0.24 0.44 0.15 0.75 0.10 4 1.65 0.20 0.39 0.17 0.60 0.13 5 2.20 0.17 0.38 0.18 0.54 0.06 6 2.75 0.18 0.38 0.17 0.56 0.06 7 3.30 0.14 0.38 0.18 0.54 0.08 8 3.85 0.15 0.40 0.19 0.54 0.02 9 4.40 0.14 0.39 0.18 0.48 0.04 10 4.95 0.12 0.36 0.18 0.52 0.06 11 5.50 0.10 0.39 0.16 0.48 0.06 12 6.05 0.10 0.38 0.16 0.48 0.04 13 6.60 0.13 0.40 0.16 0.50 0.04 14 7.15 0.12 0.39 0.15 0.40 0.10 15 7.70 0.11 0.38 0.15 0.42 0.04 16 8.25 0.11 0.35 0.13 0.42 0.08
Appendix 9: The decomposition rates of litter in bags with different mesh sizes
calculated with a negative exponential regression in the fallow phase. Mesh Sizes k/day R2 k/year t50 (days) Coarse 0.0042 0.8602 1.5330 238 Medium 0.0023 0.6826 0.8365 435 Fine 0.0060 0.9022 2.1900 167

Appendices
112
Appendix 10: Some soil animals found in rainfed paddy in Jakenan, Pati.
Beetle Larva (Scarabidae)
Beetle (Heteroceridae) Beetle (Staphylinidae)
Beetles (Pselaphidae)
Isopod Diplopoda Larva
Oribatid Mites Ant (Formicidae) Collembola (Sminthuridae)
Beetle Larva

Appendices
113
Appendix 11: The decomposition rates of litter in different mesh-sized litterbags during the dry-seeded rice season calculated with a negative exponential regression.
Treatment Plots Mesh Sizes k/day R2 k/year t50 (days)
Control, 4m Coarse 0.0133 0.9461 4.8545 75 Medium 0.0081 0.8895 2.9565 124 Fine 0.0080 0.9359 2.9200 125
Control, 8m Coarse 0.0148 0.9487 5.4020 68 Medium 0.0098 0.9294 3.5770 102 Fine 0.0074 0.9076 2.7010 135
Cassava, 4m Coarse 0.0121 0.9132 4.4165 83 Medium 0.0102 0.9638 3.7230 98 Fine 0.0080 0.9818 2.9200 125
Cassava, 8m Coarse 0.0149 0.9875 5.4385 67 Medium 0.0089 0.9469 3.2485 112 Fine 0.0073 0.9075 2.6645 137
Mungbean, 4m Coarse 0.0147 0.9017 5.3655 68 Medium 0.0114 0.9837 4.1610 88 Fine 0.0099 0.9880 3.6135 101
Mungbean, 8m Coarse 0.0157 0.9597 5.7305 64 Medium 0.0102 0.9939 3.7230 98 Fine 0.0077 0.9766 2.8105 130
Appendix 12: The decomposition rates of rice straw in different mesh-sized litterbags during the transplanted rice season calculated with a negative exponential regression.
Treatment Plots Mesh Sizes k/day R2 k/year t50 (days)
Coarse 0.0173 0.9626 6.3145 57.8 Medium 0.0147 0.9473 5.3655 68.0
Control, 4m
Fine 0.0138 0.9361 5.0370 72.5 Coarse 0.0168 0.9711 6.1320 59.5
Medium 0.0122 0.8999 4.4530 82.0 Control, 8m
Fine 0.0113 0.8296 4.1245 88.5 Coarse 0.0182 0.9880 6.6430 54.9
Medium 0.0136 0.9520 4.9640 73.5 Cassava, 4m
Fine 0.0147 0.9775 5.3655 68.8 Coarse 0.0170 0.9691 6.2050 58.8
Medium 0.0131 0.9623 4.7815 76.3 Cassava, 8m
Fine 0.0134 0.9356 4.8910 74.6 Coarse 0.0185 0.9753 6.7525 54.1
Medium 0.0126 0.8866 4.5990 79.4 Mungbean, 4m
Fine 0.0126 0.8774 4.5990 79.4 Coarse 0.0163 0.9931 5.9495 61.3
Medium 0.0089 0.7037 3.2485 112.4 Mungbean, 8m
Fine 0.0112 0.8646 4.0880 89.3
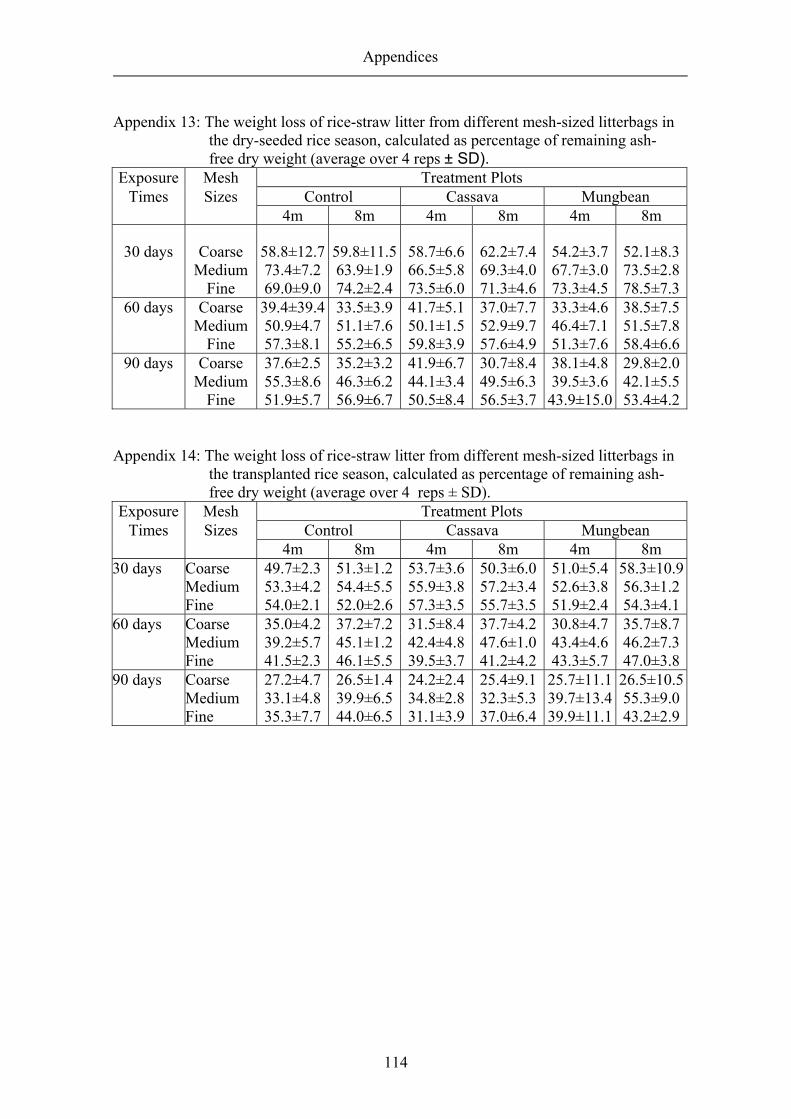
Appendices
114
Appendix 13: The weight loss of rice-straw litter from different mesh-sized litterbags in the dry-seeded rice season, calculated as percentage of remaining ash-free dry weight (average over 4 reps ± SD).
Exposure Mesh Treatment Plots Times Sizes Control Cassava Mungbean
4m 8m 4m 8m 4m 8m
30 days Coarse 58.8±12.7 59.8±11.5 58.7±6.6 62.2±7.4 54.2±3.7 52.1±8.3 Medium 73.4±7.2 63.9±1.9 66.5±5.8 69.3±4.0 67.7±3.0 73.5±2.8 Fine 69.0±9.0 74.2±2.4 73.5±6.0 71.3±4.6 73.3±4.5 78.5±7.3
60 days Coarse 39.4±39.4 33.5±3.9 41.7±5.1 37.0±7.7 33.3±4.6 38.5±7.5 Medium 50.9±4.7 51.1±7.6 50.1±1.5 52.9±9.7 46.4±7.1 51.5±7.8 Fine 57.3±8.1 55.2±6.5 59.8±3.9 57.6±4.9 51.3±7.6 58.4±6.6
90 days Coarse 37.6±2.5 35.2±3.2 41.9±6.7 30.7±8.4 38.1±4.8 29.8±2.0 Medium 55.3±8.6 46.3±6.2 44.1±3.4 49.5±6.3 39.5±3.6 42.1±5.5 Fine 51.9±5.7 56.9±6.7 50.5±8.4 56.5±3.7 43.9±15.0 53.4±4.2
Appendix 14: The weight loss of rice-straw litter from different mesh-sized litterbags in
the transplanted rice season, calculated as percentage of remaining ash-free dry weight (average over 4 reps ± SD).
Exposure Mesh Treatment Plots Times Sizes Control Cassava Mungbean
4m 8m 4m 8m 4m 8m 30 days Coarse 49.7±2.3 51.3±1.2 53.7±3.6 50.3±6.0 51.0±5.4 58.3±10.9 Medium 53.3±4.2 54.4±5.5 55.9±3.8 57.2±3.4 52.6±3.8 56.3±1.2 Fine 54.0±2.1 52.0±2.6 57.3±3.5 55.7±3.5 51.9±2.4 54.3±4.160 days Coarse 35.0±4.2 37.2±7.2 31.5±8.4 37.7±4.2 30.8±4.7 35.7±8.7 Medium 39.2±5.7 45.1±1.2 42.4±4.8 47.6±1.0 43.4±4.6 46.2±7.3 Fine 41.5±2.3 46.1±5.5 39.5±3.7 41.2±4.2 43.3±5.7 47.0±3.890 days Coarse 27.2±4.7 26.5±1.4 24.2±2.4 25.4±9.1 25.7±11.1 26.5±10.5 Medium 33.1±4.8 39.9±6.5 34.8±2.8 32.3±5.3 39.7±13.4 55.3±9.0 Fine 35.3±7.7 44.0±6.5 31.1±3.9 37.0±6.4 39.9±11.1 43.2±2.9

Appendices
115
Appendix 15: ANOVA of nitrogen mineralization (kg N/ha) in treatment plots of crop-
planted bund during dry-seeded rice, transplanted rice and early fallow. Seasons Crops
Dry Seeded Rice Transplanted Rice Early Fallow Control 108.71 b 100.96 a 68.16 a Cassava 139.15 a 87.21 a 56.91 a Mungbean 76.22 c 89.29 a 67.79 a In a column, means followed by a common letter are not significantly different at the 5% level by Duncan’s Multiple Range Test. Appendix 16: ANOVA of nitrogen mineralization (kg N/ha) for two different bund
distances during dry-seeded rice, transplanted rice and early fallow. Seasons Bund Distance 4m 8m Dry-Seeded Rice 140.12 a1 75.94 ab2 Transplanted Rice 102.04 b1 82.94 a1 Early Fallow 73.32 c1 55.25 b1 In a column, means followed by a common letter and in a row means followed by a common number are not significantly different at the 5% level by Duncan’s Multiple Range Test. Appendix 17: Chemical and physical properties of Pati’s Soil. Soil Properties Soil Properties pH H2O 5.60 H (me 100 g-1) 0.16 KCl 4.20 Fe (µ g-1) 50.1 C organic (%) 0.58 Cu (µ g-1) 0.88 N total (%) 0.05 Zn (µ g-1) 0.48 Available P Bray-1 (µg P g-1) 3.30 Mn (µ g-1) 8.32 Ca (me 100 g-1) 2.64 Mg (me 100 g-1) 0.38 Physical properties K (me 100 g-1) 0.08 Sand (%) 46.0 Na (me 100 g-1) 0.16 Silt (%) 49.5 CEC (me 100 g-1) 5.06 Clay (%) 4.5
116
Acknowledgments
My study was made possible through the financial support of the Center for Wetland
Studies (CWS), Bogor Agricultural University (IPB).
I would like to express my deepest thanks to Prof. Paul L.G. Vlek, my first supervisor,
for his guidance, support and encouragement during my study, particularly his critical
and valuable comments on the manuscript. I could not have completed this thesis
without the generous help of Dr. Christopher Martius, who provided guidance during
my field research in Indonesia and support, suggestions and constructive comments on
the manuscript. For this, I will be forever grateful. I would also like to thank Prof.
Matthias Schaefer and Prof. Dr. D. Wittmann, my second and third supervisors for their
evaluation.
My thanks also go to Dr. Astiana Sastiono, Head of the Soil Science Department and
Dr. Iswandi Anas, Head of the Soil Biology Laboratory, IPB, who allowed me to pursue
my study. I am grateful to the Central Research Institute for Food Crops, Jakenan, Pati,
who allowed me to conduct my field research in their experimental station.
I thank Dr. Günther Manske, Ms. Hanna Peters, Ms. Sabine Aengenendt-Baer, and Ms.
Sina Bremer of the Center for Development Research (ZEF), Bonn University, for their
support and help. I also thank Mrs. Margaret Jend for proofreading the manuscript.
I thank my colleagues Dr. Abay Asfaw, Mr. Arief Sabdo Yuwono, Dr. Dougbedji
Fatonji, Mr. Li Zhaohua, Dr. Maria Andrea de Macale, Ms. Mercy Gichora, Mr. Mohsin
Hafeez, Ms. Nermin El-Halawany, Mr. Tadesse Gole who created a great atmosphere
during my studies at ZEF. To a number of people and institutions, who contributed to
my study and who cannot all be named here, I express my thanks.
My special thanks to Dr. M. Edi Premono for his company during my hard time, his
encouragement and help. Finally, my sincerely thanks to all my family, especially my
parents, Mr. and Mrs. Soedaryadi, for their moral support and prayers. I dedicate this
thesis to them.
Related Documents