MARINE ECOLOGY PROGRESS SERIES Mar Ecol Prog Ser Vol. 461: 151–163, 2012 doi: 10.3354/meps09788 Published August 8 INTRODUCTION The range of resources used by organisms has im- portant implications for ecological patterns at both population and community levels (Ross 1986). The different abilities of species to exploit resources and perform in various environments are often important in limiting their abundance and distribution (Schoener 1974, Brown 1984, Hanski et al. 1993, McPeek 1996, Hughes 2000). Knowledge of species resource re- quirements can provide insights into how populations are regulated and how ecological communities are structured. Ecological versatility has been defined as ‘the degree to which organisms can fully exploit the available resources in their local environment’ (Mac- Nally 1995, p. 19). Versatile species are those that exploit a large number of resources and are usually referred to as generalists (Pianka 1974, Futuyma & Moreno 1988, MacNally 1995), while specialists ex- ploit only a narrow range of resources (Futuyma & Moreno 1988, MacNally 1995, Timms & Read 1999). As extreme specialists and generalists are likely to represent opposite ends of a resource-use continuum (Rachlin et al. 1989, Morris 1996), the term versatility was coined to encompass the whole spectrum (Mac- Nally 1995). The consequences of ecological versatility © Inter-Research 2012 · www.int-res.com *Email: [email protected] Ecological versatility and its importance for the distribution and abundance of coral reef wrasses Charlotte Berkström 1,2, *, Geoffrey P. Jones 1 , Mark I. McCormick 1 , Maya Srinivasan 1 1 ARC Centre of Excellence for Coral Reef Studies, and School of Marine and Tropical Biology, James Cook University, Townsville, Queensland 4811, Australia 2 Present address: Department of Systems Ecology, Stockholm University, 106 91 Stockholm, Sweden ABSTRACT: Ecological versatility, the degree to which organisms fully exploit the available resources, is an important component of ecological and evolutionary theory. However, patterns and consequences of versatility in coral reef fish have received little attention. Using a compara- tive approach, this study tested the consequences of ecological versatility on the distribution and abundance of juvenile wrasses (family: Labridae) in Kimbe Bay, Papua New Guinea. Resource use was examined along 4 different resource axes (horizontal distribution or reef zone, vertical distri- bution or depth, microhabitat and diet). Stepwise multiple regressions were used to test for rela- tionships between niche breadth and patterns of abundance and distribution. Most exhibited a degree of apparent specialisation on at least one resource, but none were specialised along all resource axes. In terms of juvenile diet, the majority of species exhibited a high reliance on harpacticoid copepods. Microhabitat specialisation was associated with low local abundance and narrow distribution among depth zones. However, diet and macrohabitat specialisation were poor predictors of local abundance, and no relationships between local abundance, and local and regional distribution were observed. We conclude that the relationship between versatility and abundance/distribution is dependent on the resource in question. A greater understanding of the degree of ecological versatility in relation to different resources is necessary to predict how reef fishes will respond to escalating human impacts on coral reefs. KEY WORDS: Coral reef fish · Depth distribution · Diet · Habitat use · Harpacticoid copepods · Specialisation · Labridae Resale or republication not permitted without written consent of the publisher

Welcome message from author
This document is posted to help you gain knowledge. Please leave a comment to let me know what you think about it! Share it to your friends and learn new things together.
Transcript

MARINE ECOLOGY PROGRESS SERIESMar Ecol Prog Ser
Vol. 461: 151–163, 2012doi: 10.3354/meps09788
Published August 8
INTRODUCTION
The range of resources used by organisms has im-portant implications for ecological patterns at bothpopulation and community levels (Ross 1986). Thedifferent abilities of species to exploit resources andperform in various environments are often importantin limiting their abundance and distribution (Schoener1974, Brown 1984, Hanski et al. 1993, McPeek 1996,Hughes 2000). Knowledge of species resource re-quirements can provide insights into how populationsare regulated and how ecological communities arestructured. Ecological versatility has been defined as
‘the degree to which organisms can fully exploit theavailable resources in their local environment’ (Mac-Nally 1995, p. 19). Versatile species are those that exploit a large number of resources and are usuallyreferred to as generalists (Pianka 1974, Futuyma &Moreno 1988, MacNally 1995), while specialists ex-ploit only a narrow range of resources (Futuyma &Moreno 1988, MacNally 1995, Timms & Read 1999).As extreme specialists and generalists are likely torepresent opposite ends of a resource-use continuum(Rachlin et al. 1989, Morris 1996), the term versatilitywas coined to encompass the whole spectrum (Mac-Nally 1995). The consequences of ecological versatility
© Inter-Research 2012 · www.int-res.com*Email: [email protected]
Ecological versatility and its importance for the distribution and abundance of coral reef wrasses
Charlotte Berkström1,2,*, Geoffrey P. Jones1, Mark I. McCormick1, Maya Srinivasan1
1ARC Centre of Excellence for Coral Reef Studies, and School of Marine and Tropical Biology, James Cook University, Townsville, Queensland 4811, Australia
2Present address: Department of Systems Ecology, Stockholm University, 106 91 Stockholm, Sweden
ABSTRACT: Ecological versatility, the degree to which organisms fully exploit the availableresources, is an important component of ecological and evolutionary theory. However, patternsand consequences of versatility in coral reef fish have received little attention. Using a compara-tive approach, this study tested the consequences of ecological versatility on the distribution andabundance of juvenile wrasses (family: Labridae) in Kimbe Bay, Papua New Guinea. Resource usewas examined along 4 different resource axes (horizontal distribution or reef zone, vertical distri-bution or depth, microhabitat and diet). Stepwise multiple regressions were used to test for rela-tionships between niche breadth and patterns of abundance and distribution. Most exhibited adegree of apparent specialisation on at least one resource, but none were specialised along allresource axes. In terms of juvenile diet, the majority of species exhibited a high reliance onharpacticoid copepods. Microhabitat specialisation was associated with low local abundance andnarrow distribution among depth zones. However, diet and macrohabitat specialisation were poorpredictors of local abundance, and no relationships between local abundance, and local andregional distribution were observed. We conclude that the relationship between versatility andabundance/distribution is dependent on the resource in question. A greater understanding of thedegree of ecological versatility in relation to different resources is necessary to predict how reeffishes will respond to escalating human impacts on coral reefs.
KEY WORDS: Coral reef fish · Depth distribution · Diet · Habitat use · Harpacticoid copepods ·Specialisation · Labridae
Resale or republication not permitted without written consent of the publisher
Mar Ecol Prog Ser 461: 151–163, 2012152
are re ceiving increasing attention due to the high ex-tinction risk associated with ecological specialisationin a changing environment (Hawkins et al. 2000, Har-court et al. 2002, Davies et al. 2004, Hobbs et al. 2011).
Ecological versatility has been suggested to play amajor role in determining local patterns of distribu-tion and abundance. This was formalised by Brown(1984), who proposed that species with broad envi-ronmental tolerances and resource generalists willhave the capacity to achieve high local densities andbe able to survive in more places and hence overlarger areas. In contrast, species that have narrowenvironmental tolerances, which are able to useonly a narrow range of resources (specialists), willbe unable to attain either high local densities or extensive distributions (Brown 1984). In a similarvein, there may be a relationship between ecologicalversatility, and regional and geographic abundanceand distribution. Species with wide geographicranges have been shown to be more abundant thanspecies with narrow distributions (Hanski 1982, Bock& Ricklefs 1983, Gaston 1990, Gaston 1994, Hanski &Gyllenberg 1997). These general ecological patternshave been documented over a broad diversity oftaxa, in different biogeographic regions and in a variety of habitats (Gaston & Blackburn 1996).
While many studies provide support for Brown’secological specialisation hypothesis (e.g. Gaston 1988,Inkinen 1994, Pyron 1999, Hughes 2000, Bean et al.2002), support is not universal (Fowler & Lawton1982, e.g. Hanski et al. 1993, Gregory & Gaston 2000,Gaston & Spicer 2001). Few explicit tests have beencarried out and the vast majority have focused on terrestrial organisms (Gaston et al. 1997, Gaston &Spicer 2001). In addition, as animals use a range ofresources, it is critical to know the level of specialisa-tion on different resources. Resource utilisation inanimals can be viewed in a hierarchical framework,from the use of ‘macrohabitats’ in which an indi -vidual spends most of its time, to the use of ‘micro-habitats’ within an individual’s home range, to theselection of particular elements (food items) from different microhabitats (Manly et al. 1993). A fullevaluation of the effects of specialisation on distribu-tion and abundance requires niche breadth to bequantified along different resource axes.
For coral reef fishes, patterns of ecological versatil-ity and their consequences for distribution and abun-dance have received relatively little attention (but seeMunday & Jones 1998, Bean et al. 2002, Jones et al.2002, Pratchett et al. 2008, Hobbs et al. 2010). Accord-ing to Ross (1986), many fishes seem to be highly versatile and opportunistic, displaying high overlap
in resource use. They have an extraordinary potentialfor trophic niche expansion, exploitation of highlyfluctuating and diverse trophic resources, and for being facultative rather than ob ligate specialists(Liem 1984, 1990). However, a large number of coralreef fishes show high degrees of apparent specialisa-tion, being associated with either 1 biotic micro -habitat, 1 prey group or 1 symbiotic partner (Fautin &Allen 1992, Munday 2004, Pratchett 2005). This sug-gests that for coral reef fishes, specialisation might bemore pronounced and important for abundance anddistribution than previously thought. Furthermore,studies have shown that specialised coral reef fishspecies display low local abundances, in accordancewith Brown’s theory (Munday 2000, Bean et al. 2002,Gardiner & Jones 2005). However, recent evidencesuggests that coral reef fish species with small geo-graphic ranges around isolated islands can have highlocal abundances (De Martini & Friedlander 2004,Hobbs et al. 2011).
Recent studies have shown declines in fish commu-nities associated with degrading coral reef habitats(Jones et al. 2004, Wilson et al. 2006, Wilson et al.2009), especially species specialised on live coral(Pratchett et al. 2006, Graham 2007). The commu-nity-wide response to degradation and variation inresource availability will fundamentally depend onthe versatility of the constituent species. Gardiner &Jones (2005) suggested that communities composedof a high proportion of resource specialists that arespecialised on a particular habitat type that is under-going degradation will be particularly vulnerable.However, species are not necessarily specialised onall resources, and not all resources are necessarily indecline. Determination of the degree of versatility ofreef fishes in relation to different resources is neededto understand the effect of coral reef degradation ontheir abundance and distribution.
The overall aim of this study was to examine theeffects of ecological versatility on the abundance anddistribution of a group of coral reef wrasses from thefamily Labridae. The family Labridae encompassesspecies that range from those with highly specialiseddiets to highly opportunistic carnivores. They utilisea number of different habitats and are found at avariety of different depths (Green 1996, Myers 1999,Allen et al. 2003). They are also an important compo-nent of the ichthyofauna on coral reefs throughoutthe world, being the second most species-rich familyon the Great Barrier Reef, Australia (Thresher 1991,Randall et al. 1997). To avoid the complication ofontogenetic shifts in ecology, the present studyfocuses on the juvenile life stage.
The specific goals were to (1) examine patterns ofapparent specialisation or niche breadth along 4 dif-ferent resource axes (horizontal distribution or reefzone, vertical distribution or depth, microhabitat anddiet); (2) test the hypotheses derived from Brown’s(1984) theory that greater niche breadth for any oneresource is associated with (i) a greater local abun-dance, (ii) a greater local distribution among habitatsand (iii) a greater geographic range; and (3) test ifthere is a relationship between local abundance andgeographic range, i.e. species with wide geographicranges have high local abundances.
MATERIALS AND METHODS
Study site and species
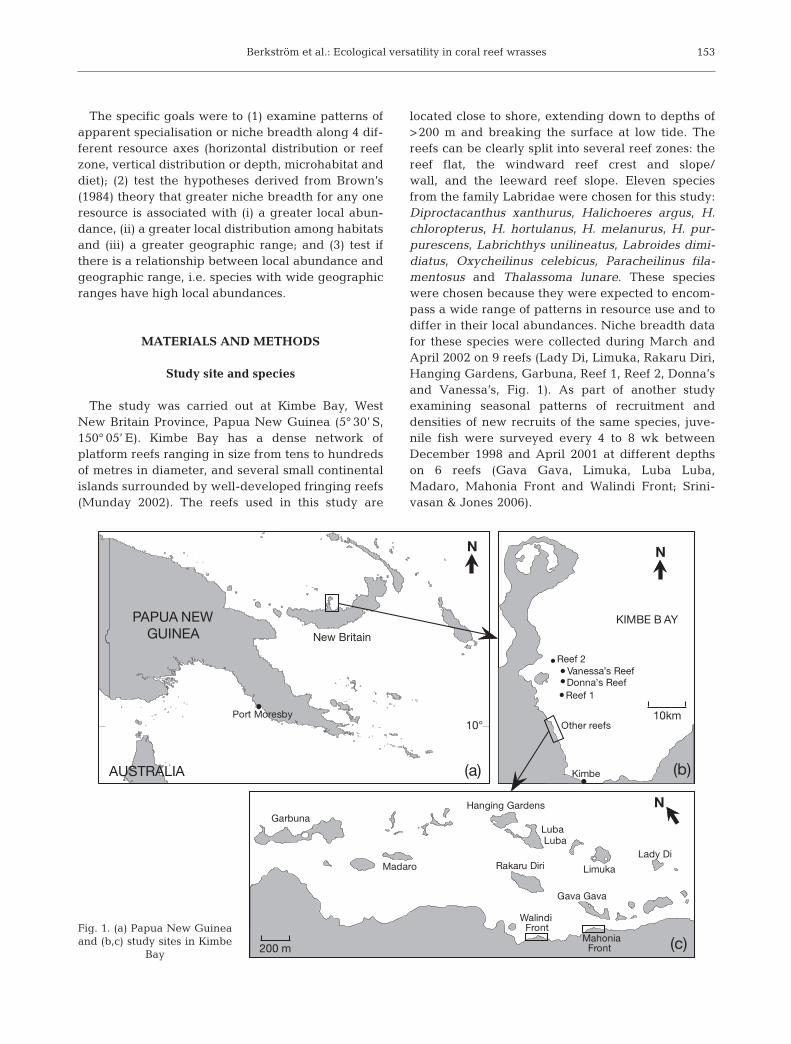
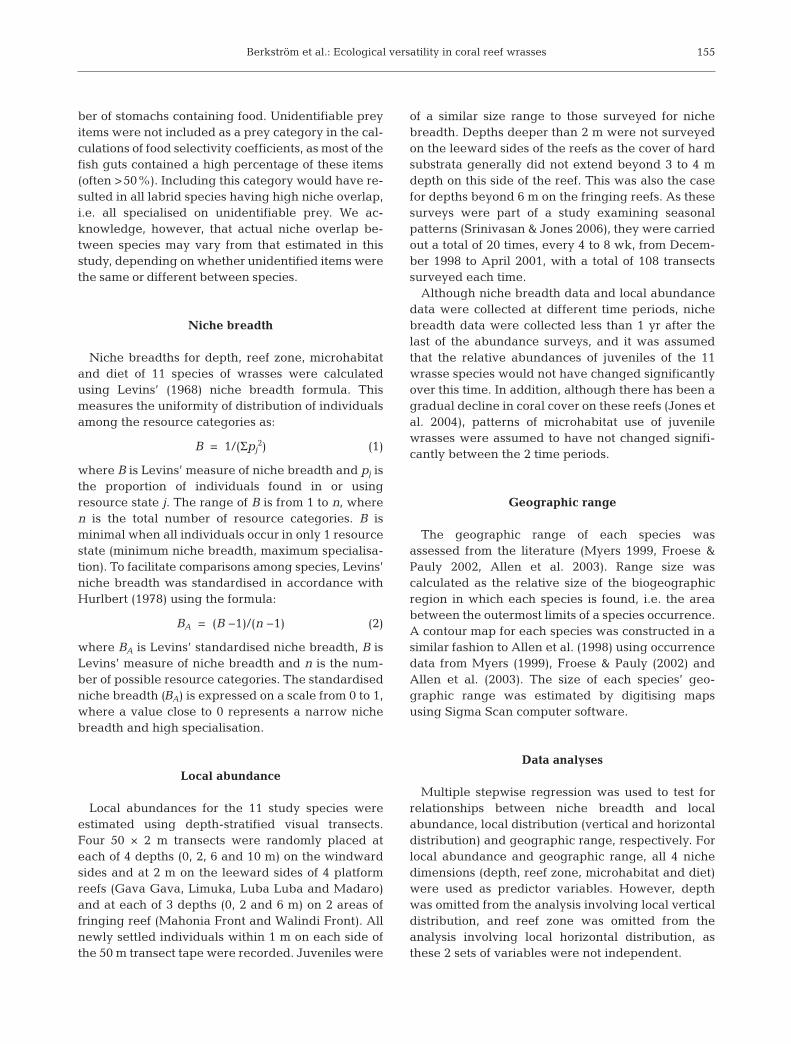
The study was carried out at Kimbe Bay, WestNew Britain Province, Papua New Guinea (5° 30’ S,150° 05’ E). Kimbe Bay has a dense network of platform reefs ranging in size from tens to hundredsof metres in diameter, and several small continentalislands surrounded by well-developed fringing reefs(Munday 2002). The reefs used in this study are
located close to shore, extending down to depths of>200 m and breaking the surface at low tide. Thereefs can be clearly split into several reef zones: thereef flat, the windward reef crest and slope/wall, and the leeward reef slope. Eleven speciesfrom the family Labridae were chosen for this study:Diproctacanthus xanthurus, Halichoeres argus, H.chloropterus, H. hortulanus, H. melanurus, H. pur-purescens, Labrichthys unilineatus, Labroides dimi -diatus, Oxycheilinus celebicus, Paracheilinus fila-mentosus and Thalassoma lunare. These specieswere chosen because they were expected to encom-pass a wide range of patterns in resource use and todiffer in their local abundances. Niche breadth datafor these species were collected during March andApril 2002 on 9 reefs (Lady Di, Limuka, Rakaru Diri,Hanging Gardens, Garbuna, Reef 1, Reef 2, Donna’sand Vanessa’s, Fig. 1). As part of another studyexamining seasonal patterns of recruitment anddensities of new recruits of the same species, juve-nile fish were surveyed every 4 to 8 wk betweenDecember 1998 and April 2001 at different depthson 6 reefs (Gava Gava, Limuka, Luba Luba,Madaro, Mahonia Front and Walindi Front; Srini-vasan & Jones 2006).
Berkström et al.: Ecological versatility in coral reef wrasses 153
KIMBE B AYPAPUA NEWGUINEA
10°
AUSTRALIA
Other reefs
Reef 2
Vanessa’s ReefDonna’s Reef
Reef 1
Garbuna
LimukaMadaro
Hanging Gardens
Lady Di
Gava Gava
Luba Luba
Mahonia Front
Walindi Front
Rakaru Diri
200 m
(a) (b)
(c)
NN
N
10km
Kimbe
New Britain
Port Moresby
Fig. 1. (a) Papua New Guineaand (b,c) study sites in Kimbe
Bay

Mar Ecol Prog Ser 461: 151–163, 2012
Local distribution among depth zones, reef zonesand microhabitats
Niche breadth can be measured by observing thedistribution of individual organisms within a set ofresource states or resource categories (Krebs 1999).The specialist’s resource range should be included inthat of the generalist’s as this makes the judgmentof the relative degree of specialisation more reliable(McNaughton & Wolf 1970, Futuyma & Moreno1988). To observe the distribution of individualwrasses within large- and small-scale habitat cate-gories, transects were randomly placed on the wind-ward (2 transects) and leeward (2 transects) sides of 9different reefs in Kimbe Bay, a total of 36 transects.Depth, reef zone and microhabitat were recorded foreach juvenile found within the 20 m wide transect. Tocover a large depth and habitat range, transects wereplaced at 20 m depth and run up the slope or wall,over the crest and across the reef flat of each reefsampled. Transects ended where the reef broke thesurface and varied in length, from 18 to 48.5 m long.Transects were simply a way of making sure thatsimilar amounts of effort were allocated to the wholedepth range available for the study. Each transect
was divided into 8 depth categories and 8 reef zonecategories (Table 1). The local distribution of a species was described as the distribution across reefand depth zones on a single reef. Occurrence in alarge number of reef zones denotes a broad horizon-tal distribution, while occurrence in a large numberof depth zones denotes a broad vertical distribution.Microhabitats were divided into 19 microhabitat categories (Table 1), based on major non-living andliving substrates. Live coral was divided according togrowth form, as reef fishes are known to exhibit preferences for particular growth forms of coral (Gardiner & Jones 2005, Bonin et al. 2011).
Diet
In order to estimate selectivity of food resources, 20or more random juveniles of each species were collected from reefs around Kimbe Bay for gut content analyses. Juveniles were caught with a handnet after being anaesthetised with a 1:10 clove oil/alcohol solution administered from a hand-held spraybottle. Following capture, fish were held on ice tostop any breakdown of tissue until placed in sepa-
rate vials of 10% buffered seawater/formalin solution. In the laboratory,guts were removed from the speci-mens under a stereomicroscope andtheir contents were sorted. Prey itemswere temporarily mounted on a slidewith Grey and Wess mountant andwere taxonomically identified toclass and, if possible, order underhigh magnification. Prey items weredivided into 23 categories, based onmajor prey groups from similar en -vironments (e.g. pelagic, benthic orparasitic, Table 1). The number of different prey categories per gut andthe percentage each prey categoryconstituted per gut was recorded. Twocoefficients (mean volumetric percent-age, MVP, and percentage frequencyof occurrence, PFO) were calculatedto determine the relative importanceof prey items in the diet. The MVP ofa prey is the sum of individual volu-metric percentages for the food items divided by the number of specimensexamined. The PFO is the number ofstomachs containing a particular preyitem as a percentage of the total num-
154
Depth Reef zones Microhabitats Food itemszones (m)
0.0−2.5 Back patch Bare rock Harpacticoid copepods2.5−5.0 Back wall Dead coral Calanoid copepods5.0−7.5 Back slope Rubble Cyclopoid copepods7.5−10.0 Back crest Sand Parasitic copepods10.0−12.5 Reef flat Turf Cirripedi (barnacle) larvae12.5−15.0 Front crest Macroalgae Amphipods15.0−17.5 Front slope Sponge Gnathid amphipod larvae (par.)17.5−20.0 Front wall Soft coral Isopods
Fire coral OstracodsBlack coral TanaeidsBranching coral Crabs (megalopa-stage)Bushy coral NaupliiCorymbose coral Bivalves (juv.)Digitate coral Gastropods (juv.)Columnar coral PolychaetesTabular coral InsectsEncrusting coral Diatoms (Coscinodiscus)Massive coral Dinoflagelattes (Paradinium)Solitary coral Forams (Globigerinida)
ProtozoansCoral polypsEggs/egg massFish scales
Table 1. Depth and reef zones, microhabitats and food items used for studyingresource use in juveniles (juv.) from 11 wrasse species in Kimbe Bay, PapuaNew Guinea. All corals are hard corals except ‘black coral’ and ‘soft coral’.
par.: parasitic
Berkström et al.: Ecological versatility in coral reef wrasses
ber of stomachs containing food. Unidentifiable preyitems were not included as a prey category in the cal-culations of food selectivity coefficients, as most of thefish guts contained a high percentage of these items(often >50%). Including this category would have re-sulted in all labrid species having high niche overlap,i.e. all specialised on unidentifiable prey. We ac-knowledge, however, that actual niche overlap be-tween species may vary from that estimated in thisstudy, depending on whether unidentified items werethe same or different between species.
Niche breadth
Niche breadths for depth, reef zone, microhabitatand diet of 11 species of wrasses were calculatedusing Levins’ (1968) niche breadth formula. Thismeasures the uniformity of distribution of individualsamong the resource categories as:
B = 1/(Σpj2) (1)
where B is Levins’ measure of niche breadth and pj isthe proportion of individuals found in or usingresource state j. The range of B is from 1 to n, wheren is the total number of resource categories. B is minimal when all individuals occur in only 1 resourcestate (minimum niche breadth, maximum specialisa-tion). To facilitate comparisons among species, Levins’niche breadth was standardised in accordance withHurlbert (1978) using the formula:
BA = (B −1)/(n −1) (2)
where BA is Levins’ standardised niche breadth, B isLevins’ measure of niche breadth and n is the num-ber of possible resource categories. The standardisedniche breadth (BA) is expressed on a scale from 0 to 1,where a value close to 0 represents a narrow nichebreadth and high specialisation.
Local abundance
Local abundances for the 11 study species wereestimated using depth-stratified visual transects.Four 50 × 2 m transects were randomly placed ateach of 4 depths (0, 2, 6 and 10 m) on the windwardsides and at 2 m on the leeward sides of 4 platformreefs (Gava Gava, Limuka, Luba Luba and Madaro)and at each of 3 depths (0, 2 and 6 m) on 2 areas offringing reef (Mahonia Front and Walindi Front). Allnewly settled individuals within 1 m on each side ofthe 50 m transect tape were recorded. Juveniles were
of a similar size range to those surveyed for nichebreadth. Depths deeper than 2 m were not surveyedon the leeward sides of the reefs as the cover of hardsubstrata generally did not extend beyond 3 to 4 mdepth on this side of the reef. This was also the casefor depths beyond 6 m on the fringing reefs. As thesesurveys were part of a study examining seasonal patterns (Srinivasan & Jones 2006), they were carriedout a total of 20 times, every 4 to 8 wk, from Decem-ber 1998 to April 2001, with a total of 108 transectssurveyed each time.
Although niche breadth data and local abundancedata were collected at different time periods, nichebreadth data were collected less than 1 yr after thelast of the abundance surveys, and it was assumedthat the relative abundances of juveniles of the 11wrasse species would not have changed significantlyover this time. In addition, although there has been agradual decline in coral cover on these reefs (Jones etal. 2004), patterns of microhabitat use of juvenilewrasses were assumed to have not changed signifi-cantly between the 2 time periods.
Geographic range
The geographic range of each species wasassessed from the literature (Myers 1999, Froese &Pauly 2002, Allen et al. 2003). Range size was calculated as the relative size of the biogeographicregion in which each species is found, i.e. the areabetween the outermost limits of a species occurrence.A contour map for each species was constructed in asimilar fashion to Allen et al. (1998) using occurrencedata from Myers (1999), Froese & Pauly (2002) andAllen et al. (2003). The size of each species’ geo-graphic range was estimated by digitising mapsusing Sigma Scan computer software.
Data analyses
Multiple stepwise regression was used to test forrelationships between niche breadth and local abundance, local distribution (vertical and horizontaldistribution) and geographic range, respectively. Forlocal abundance and geographic range, all 4 nichedimensions (depth, reef zone, microhabitat and diet)were used as predictor variables. However, depthwas omitted from the analysis involving local verticaldistribution, and reef zone was omitted from theanalysis involving local horizontal distribution, asthese 2 sets of variables were not independent.
155

Mar Ecol Prog Ser 461: 151–163, 2012
RESULTS
Local distribution among depth zones, reef zonesand microhabitats
Halichoeres argus displayed the narrowest depthrange (0 to 2.5 m), followed by H. hortulanus (0 to5 m, Fig. 2). H. chloropterus, Labrichthys unilineatusand Thalassoma lunare were found between 0 and15 m, but were most abundant between 0 and 5 m.Labroides dimidiatus and H. melanurus were foundthroughout the 20 m depth range, but were most fre-quently observed between 0 and 10 m. Diproctacan-thus xanthurus, H. purpurescens and Oxycheilinuscelebicus were evenly spread throughout most depthzones. However, O. celebicus was rarely found indepths less than 5 m. Paracheilinus filamentosus wasfound between 5 and 20 m, displaying highest per-cent occurrence between 15 and 20 m (Fig. 2).
Substantial differences among species were foundin the number of broad reef zones occupied. Twospecies (Halichoeres argus and H. hortulanus) werepredominantly found on the reef flat (Fig. 3). H.chloropterus and Labrichthys unilineatus were foundon reef flats and crests or shallow parts of the reefslope on both sides of the reef. Diproctacanthus xanthurus, H. purpurescens, Oxycheilinus celebicusand Paracheilinus filamentosus were only found onreef slopes and walls, both on the front and backof reefs. The remaining 3 species (H. melanurus,Labroides dimidiatus and Thalassoma lunare) wereapparent reef zone generalists, occupying most of theavailable reef zones (Fig. 3).
Halichoeres melanurus, H. purpur escens and Oxy-cheilinus celebicus were very general in their use ofmicrohabitats, utilising most of the microhabitat cat-egories in this study (Table 2). Thalassoma lunareand Labroides dimidiatus were found in most micro-
156
0.0–
2.5
15.0
–17.
5
12.5
–15.
0
10.0
–12.
5
7.5–
10.0
5.0–
7.5
2.5–
5.0
0.0–
2.5
5.0–
7.5
2.5–
5.0
17.5
–20.
0
15.0
–17.
5
12.5
–15.
0
10.0
–12.
5
7.5–
10.0
17.5
–20.
0
0
6080
100
2040
0
6080
100
2040
0
6080
100
2040
0
6080
100
2040
0
6080
100
2040
0
6080
100
2040
Halichoeres argus
Halichoeres melanurus
Labrichthys unilineatus
Halichoeres purpurescens
Diproctacanthus xanthurus
Halichoeres chloropterus Halichoeres hortulanus
Thalassoma lunare
Oxycheilinus celebicus Paracheilinus filamentosus
Labroides dimidiatus
Perc
ent
occurr
ence
n = 62
n = 43
n= 267
n = 82
n = 48
n = 117
n = 212
n = 93
n = 166
n = 106
n = 379
Depth (m)
Depth (m)
Fig. 2. Local vertical distributions of 11 species of juvenilewrasses on coral reefs in Kimbe Bay, Papua New Guinea,shown as the percent occurrence of individuals in each of
the 8 depth zones
Bac
k pa
tch
Fron
t slo
pe
Fron
t cre
st
Ree
f fla
t
Bac
k cr
est
Bac
k slop
e
Bac
k w
all
Fron
t wal
lBac
k pa
tch
Fron
t slo
pe
Fron
t cre
st
Ree
f fla
t
Bac
k cr
est
Bac
k slop
e
Bac
k w
all
Fron
t wal
l
Halichoeres argus
Halichoeres melanurus
Labrichthys unilineatus
Halichoeres purpurescens
Diproctacanthus xanthurus
Halichoeres chloropterus Halichoeres hortulanus
Thalassoma lunare
Oxycheilinus celebicus Paracheilinus filamentosus
Labroides dimidiatus
n = 62
n = 43
n = 267
n = 82
n = 48
n = 117
n = 212
n = 93
n = 166
n = 106
n = 379
0
6080
100
2040
0
6080
100
2040
0
6080
100
2040
0
6080
100
2040
0
6080
100
2040
0
6080
100
2040
Perc
ent
occurr
ence
Fig. 3. Local horizontal distributions of 11 species of juvenilewrasses on coral reefs in Kimbe Bay, Papua New Guinea,shown as the percent occurrence of individuals in each of
the 8 reef zones

Berkström et al.: Ecological versatility in coral reef wrasses
habitats but more than 70% of the individ-uals were associated with live hard corals.Diproctacanthus xanthurus andLabrichthys uni lineatus were found almostexclusively on live hard coral (over 95%).Paracheilinus filamentosus was most com-monly found associated with rubble onreef slopes and walls. H. chloropterus wasmainly found on dead substrata, mostlyrubble (and turf). H. argus was associatedwith turf-covered dead coral/rubble, whileH. hortulanus was found in sand, rubblegutters along the reef crest, shallow slopeor reef flat (Table 2). For 7 species (O.celebicus, D. xanthurus, H. melanurus,H. purpur escens, Labroides dimidiatus,Labrichthys unilineatus, T. lunare), over55% of the individuals occupied live coral.All of these species, except Labrichthysunilineatus, were very general in their useof live corals. Labrichthys unilineatus wasmostly associated with bushy or branchingcorals from the families Acroporidae andPocilloporidae (Table 2).
Diet
Most juvenile wrasses showed a highselectivity for harpacticoid copepods;however, the importance of harpacticoidsin the diet differed among species.Calanoid copepods were the dominantprey items of Halichoeres purpurescensand Paracheilinus filamentosus, constitut-ing 32 and 23% of their diet content,respectively (Table 3). Labrichthys uni -lineatus fed exclusively on live coral.Labroides dimidiatus showed high selec-tivity for parasitic gnathid isopod larvae,which constituted over 90% of theirdiet. Diproctacanthus xanthurus was alsohighly selective on parasites, gnathid isopod larvae as well as copepods, whichconstituted 59 and 24% of the diet content,respectively (Table 3).
Niche breadths
In general, niche values covered thewhole spectrum from highly specialiseddiets and microhabitat use to quite gener-
157
Mic
ro-
Dip
roct
acan
thu
s H
alic
hoe
res
Hal
ich
oere
sH
alic
hoe
res
Hal
ich
oere
sH
alic
hoe
res
Lab
roid
esL
abri
chth
ysO
xych
eili
nu
sP
arac
hei
lin
us
Th
alas
som
ah
abit
atxa
nth
uru
sar
gu
sch
loro
pte
rus
hor
tula
nu
sm
elan
uru
sp
urp
ure
scen
sd
imid
iatu
su
nil
inea
tus
cele
bic
us
fila
men
tosu
slu
nar
e
Bar
e ro
ck–
0.9
––
0.7
0.6
4.7
––
–5.
1D
ead
cor
al–
0.5
11.6
–0.
44.
8–
–10
.40.
3–
Ru
bb
le–
6.1
37.2
19.4
12.7
5.4
8.5
–8.
384
.2–
San
d–
9.4
9.3
75.3
3.0
0.6
0.9
––
––
Tu
rf–
61.8
32.6
5.4
21.3
10.2
11.3
4.9
8.3
1.1
6.0
Mac
roal
gae
––
2.3
–1.
5–
––
2.1
––
Sp
ong
e1.
6–
––
4.9
7.2
1.9
–8.
32.
42.
6L
ive
cora
lS
oft
cora
l–
0.5
––
12.4
16.9
7.5
–18
.86.
315
.4F
ire
cora
l4.
8–
––
1.1
2.4
––
––
1.7
Bla
ck c
oral
––
––
––
––
2.1
––
Bra
nch
ing
cor
al50
.02.
47.
0–
15.7
12.7
34.9
41.5
29.2
1.6
9.4
Bu
shy
cora
l8.
12.
8–
–8.
21.
86.
642
.7–
–21
.4C
orym
bos
e co
ral
9.7
1.4
––
2.2
2.4
3.8
9.8
–1.
817
.9D
igit
ate
cora
l16
.113
.2–
–1.
59.
06.
61.
22.
1–
2.6
Col
um
nar
cor
al–
––
–1.
9–
1.9
––
––
Tab
ula
r co
ral
8.1
––
–2.
23.
64.
7–
2.1
2.4
6.0
En
cru
stin
g c
oral
–0.
5–
–3.
46.
00.
9–
4.2
––
Mas
sive
cor
al1.
60.
5–
–6.
016
.35.
7–
4.2
–12
.0S
olit
ary
cora
l–
––
–0.
7–
––
––
–
n62
212
4393
267
166
106
8248
379
117
Tab
le 2
.R
elat
ive
pro
por
tion
s (%
) of
ju
ven
iles
fro
m 1
1 w
rass
e sp
ecie
s as
soci
ated
wit
h d
iffe
ren
t m
icro
hab
itat
s, i
ncl
ud
ing
liv
ing
an
d n
on-l
ivin
g s
ub
stra
ta i
n K
imb
e B
ay,
Pap
ua
New
Gu
inea
. Th
e h
igh
est
valu
e fo
r ea
ch s
pec
ies
is i
n b
old
. n =
nu
mb
er o
f in
div
idu
als
sam
ple
d p
er s
pec
ies;
(–)
sp
ecie
s n
ot r
ecor
ded
in
th
is m
acro
hab
itat

Mar Ecol Prog Ser 461: 151–163, 2012
alised with regard to macrohabitatuse (depth ranges and reef zonesoccupied). No species was either aspecialist or a generalist in its use ofall resources. In terms of both micro-habitat use and diet, species dis-played niche values at thelower end of the spectrum, indi -cating a general trend of specialisa-tion in these resources by juvenilewrasses. Halichoeres purpurescens,H. melanurus and Thalassoma lu -nare were the most general of allspecies in the use of microhabitats,but the highest niche breadth valueamong these species was only 0.5(Table 4). The narrowest nichebreadths with regard to diet weredisplayed by Labrichthys unilinea-tus, Labroides dimidiatus and H.melanurus, while Para cheilinus fila-mentosus had the highest nichebreadth value of 0.3 (Table 4).
Local abundance and nichebreadth
Halichoeres melanurus was themost abundant species, followedby Thalassoma lunare and H. purpurescens (Fig. 4). The remain-ing species were all relatively rare,i.e. ≤1 individual per 100 m2 (Fig. 4).There was a significant positiverelationship between niche breadthfor microhabitat and local abun-dance (r2 = 0.606, p = 0.005). Themost abundant species were amongthose with the greatest nichebreadths for microhabitat (i.e. H.melanurus, T. lunare and H. pur-purescens). There were no relation-ships between the other 3 nichedimensions (depth, reef zone ordiet) and abundance.
Local distribution and nichebreadth
Halichoeres melanurus had thebroadest distribution across reef
158
Foo
d i
tem
sD
.H
.H
.H
.H
.H
. pu
rpu
r-L
.L
.O
.P.
T.
xan
thu
rus
arg
us
chlo
rop
teru
sh
ortu
lan
us
mel
anu
rus
esce
ns
dim
idia
tus
un
ilin
eatu
sce
leb
icu
sfi
lam
ento
sus
lun
are
MV
PP
FO
MV
PP
FO
MV
PP
FO
MV
PP
FO
MV
PP
FO
MV
PP
FO
MV
PP
FO
MV
PP
FO
MV
PP
FO
MV
PP
FO
MV
PP
FO
n18
2117
2128
1918
3020
3721
Cru
stac
ean
sH
arp
acti
coid
cop
epod
s–
–66
.590
.542
.282
.457
.810
0.0
68.3
82.1
17.6
42.1
––
––
37.3
6514
.154
.153
.695
.2C
alan
oid
cop
epod
s0.
55.
61
14.3
1123
.50.
39.
58.
942
.932
.157
.9–
––
–28
.570
23.2
59.5
4.8
23.8
Cyc
lop
oid
cop
epod
s0.
55.
63.
19.
51.
411
.80.
614
.32.
310
.717
.447
.4–
––
–12
.535
19.7
59.5
6.4
23.8
Par
asit
ic c
opep
ods
24.2
50.0
––
––
––
––
4.3
5.3
6.4
16.7
––
––
––
––
Cir
rip
edi
(bar
nac
le)
larv
ae–
–0.
69.
5–
–4.
223
.84.
514
.311
.810
.5–
––
––
–7.
118
.97.
628
.6A
mp
hip
ods
11.3
16.7
1.4
4.8
13.9
29.4
3.3
192.
514
.30.
35.
3–
––
–0.
55
0.9
2.7
3.7
28.6
Gn
ath
id a
mp
hip
od l
arva
e (p
aras
itic
)59
.572
.21.
819
4.1
11.8
4.3
28.6
––
0.7
10.5
90.8
94.4
––
––
3.8
13.5
1.0
4.8
Isop
ods
––
––
––
6.6
190.
23.
6–
––
––
––
–0.
22.
70.
64.
8O
stra
cod
s–
–6.
119
––
7.1
19–
–2.
315
.8–
–0.
23.
38.
130
––
––
Tan
aid
s–
––
––
––
–0.
510
.7–
––
––
––
–0.
82.
70.
24.
8C
rab
s (m
egal
opa-
stag
e)–
–1.
94.
8–
–1.
44.
8–
––
––
––
–1.
55
––
––
Nau
pli
i–
––
––
–0.
14.
8–
––
––
––
––
–9.
443
.24.
623
.8O
ther
Biv
alve
s (j
uv)
––
––
2.1
5.9
––
––
5.9
5.3
––
––
––
3.4
21.6
––
Gas
trop
ods
(ju
v)0.
25.
63.
923
.87.
535
.33.
523
.8–
–0.
35.
3–
––
–0.
35
1.8
18.9
––
Pol
ych
aete
s–
–0.
34.
8–
–2.
24.
82.
87.
12.
05.
3–
––
–7.
315
––
4.1
9.5
Inse
cts
––
3.5
28.6
0.3
5.9
5.5
14.3
2.4
7.1
––
––
––
––
––
5.5
23.8
Dia
tom
s (C
osci
nod
iscu
s)–
–0.
34.
8–
––
–7.
321
.4–
––
––
––
–3.
718
.90.
49.
5D
inof
lag
ella
tes
(Par
adin
ium
)–
––
–0.
45.
9–
––
––
––
––
––
–2.
713
.5–
–F
oram
s (G
lob
iger
inid
a)–
–8.
842
.914
.241
.22.
119
0.2
3.6
5.5
31.6
––
––
2.2
58.
637
.86.
133
.3P
roto
zoan
s–
––
–3
5.9
––
––
––
––
––
––
––
––
Cor
al p
olyp
s–
––
––
––
––
––
––
–99
.810
0–
––
––
–E
gg
s/eg
g m
ass
––
0.6
4.8
––
0.9
14.3
0.1
3.6
––
––
––
1.9
100.
62.
71.
49.
5F
ish
sca
les
4.0
16.7
––
––
––
––
––
2.8
27.8
––
––
––
––
Tab
le 3
. M
ean
vol
um
etri
c p
erce
nta
ge
(MV
P)
and
per
cen
tag
e fr
equ
ency
of
occu
rren
ce (
PF
O)
for
food
ite
ms
in t
he
die
ts o
f 11
wra
sse
spec
ies
in K
imb
e B
ay,
Pap
ua
New
Gu
inea
. Val
ues
for
th
e p
rey
cate
gor
y m
ost
com
mon
ly s
elec
ted
by
each
sp
ecie
s ar
e in
bol
d. n
= t
otal
nu
mb
er o
f in
div
idu
als
stu
die
d f
or e
ach
sp
ecie
s. F
or f
ull
sp
ecie
s n
ames
see
Tab
le 2

Berkström et al.: Ecological versatility in coral reef wrasses
zones, occupying all 8 reef zones, while H. argus dis-played the narrowest distribution, occupying just 2reef zones (Fig. 5). No relationships were foundbetween any of the 3 niche values (depth, microhab-itat or diet) and local horizontal distribution, i.e.across reef zones. However, there was a significantpositive relationship between microhabitat nichebreadth and local vertical distribution, i.e. amongdepth zones (r2 = 0.433, p = 0.028). The species withthe highest microhabitat niche value had the broad-est local vertical distribution (H. purpurescens), andthe species with the lowest microhabitat niche valueshad the narrowest vertical distributions (H. argus, H.hortulanus, H. chloropterus and Labrichthys unilin-eatus).
Geographic range and niche breadth
Thalassoma lunare had the largest geographicrange, closely followed by Halichoeres hortulanus(Fig. 5). H. purpurescens and Paracheilinus filamen-tosus had the smallest ranges of the 11 species, withrange sizes roughly a third of that of Thalassomalunare (Fig. 5). There were no relationships betweenniche values (depth, reef zones, microhabitats ordiet) and geographic range. H. purpurescens wasthe most generalised species in all 4 niche dimen-sions, but it had the most restricted geographicrange. In contrast, H. hortulanus, which is an appar-ent depth specialist, had the second widest geo-graphic range.
Local abundance and geographic range
There was no relationship found be -tween local abundance and geographicrange in the 11 labrid species examined(r2 = 0.045, p = 0.533). Species with widegeographic ranges did not seem to havehigh local abundances in this study.
DISCUSSION
The results from this study suggest thatecological versatility in fishes from thefamily Labridae in Kimbe Bay, PapuaNew Guinea, plays an important role inthe distribution and abundance of spe-cies on a local scale. A broad use ofmicrohabitats was associated with highlocal abundances and broad local depthdistributions, suggesting that the degree
of specialisation on a microhabitat-level may wellrestrict the abundance and distribution of juvenilewrasses. However, no relationship was found be -tween local abundance and distribution. In addition,on a larger (geographic) scale, ecological versatilitydoes not appear to be important for limiting the distribution of species.
The results of this study provide limited support forBrown’s (1984) hypothesis linking specialisation andabundance. We found that use of a broad range ofmicrohabitats was associated with high local abun-dances and broad depth distributions. On the otherhand, no other relationship between niche breadthand local distribution and abundance was found forthe remaining resources. On a larger scale, no asso-ciations between either niche breadth or local abun-
159
Species Depth Reef zone Microhabitat Diet(n = 8) (n = 8) (n = 19) (n = 23)
Diproctacanthus xanthurus 0.69 0.22 0.13 0.06Halichoeres argus 0.00 0.01 0.08 0.05Halichoeres chloropterus 0.17 0.30 0.15 0.15Halichoeres hortulanus 0.01 0.07 0.04 0.08Halichoeres melanurus 0.38 0.42 0.41 0.05Halichoeres purpurescens 0.81 0.36 0.47 0.20Labroides dimidiatus 0.39 0.59 0.28 0.01Labrichthys unilineatus 0.09 0.38 0.10 0.00Oxycheilinus celebicus 0.62 0.31 0.30 0.14Paracheilinus filamentosus 0.54 0.20 0.02 0.28Thalassoma lunare 0.22 0.69 0.35 0.10
Table 4. Niche values for different niche dimensions (depth, reef zone,microhabitat and diet) of 11 species of juvenile wrasses in Kimbe Bay,Papua New Guinea. A low niche value represents a narrow niche breadthand high specialisation. Likewise, a high value represents a wide nichebreadth and low specialisation. n = number of categories within each
niche dimension
0
1
2
3
4
5
6
H. m
elan
urus
T. lu
nare
H. p
urpur
esce
ns
H. c
hlor
opte
rus
L. u
nilin
eatu
s
P. fila
men
tosu
s
L. d
imid
iatu
s
D. x
anth
urus
O. c
eleb
icus
H. a
rgus
H. h
ortu
lanu
s
Wra
sse
(ind. 1
00 m
–2)
Fig. 4. Mean densities of 11 species of juvenile wrasses oncoral reefs in Kimbe Bay, Papua New Guinea. Error bars
are ±1 SE. For full species names see Fig. 2

Mar Ecol Prog Ser 461: 151–163, 2012
dance and geographic range were detected. Thelocal patterns are consistent with previous studies inKimbe Bay, Papua New Guinea, on coral dwellinggobies (Munday 2000), triggerfish (Bean et al. 2002)and cardinalfish (Gardiner & Jones 2005), all ofwhich found that the most specialised species hadthe lowest local abundances. Microhabitat specialisa-tion was also found to restrict the depth distribu tionamong a group of triggerfish (Bean et al. 2002).
Many of the niche parameters measured, includinghabitat zone, depth and microhabitat, are likely toco-vary. Hence, further work is required to identifythe specific resources limiting abundance. Given thatmicrohabitat availability is known to change withdepth, experimental studies are required to distin-guish the roles of microhabitat and depth per se onlocal abundance (e.g. Srinivasan 2003). Also, this
study focused on juveniles, and given thatversatility may change with ontogeny, theapplicability of our results to adult fishesrequires further investigation.
According to Brown’s (1984) hypothesis,the low local abundance and narrow dis-tribution displayed by many taxa can beexplained by high resource specialisation.Specialists are expected to have lowerlocal abundances and limited distributionsbecause the extent of suitable resources islikely to be more restricted for specialisedspecies than for species that can use avariety of resources. Halichoeres hortu-lanus appeared to be the most specialisedspecies in terms of microhabitat and wasalso found to be the least abundant spe-cies with a restricted depth range in ourstudy, suggesting that this species’ localabundance and distribution might be lim-ited by the restricted number of microhab-itats available on the reef. H. hortulanuswas always found in sand or rubble gut-ters in shallow water, and its abundanceand distribution are likely to be restrictedby the availability of its preferred micro-habitat. The 3 most abundant species inour study (H. melanurus, Thalassomalunare and H. purpurescens) were themost generalised in terms of microhabitatusage. They also displayed the broadestdepth distributions. Being a microhabitatgeneralist most likely allows a species toaccess and move among a broader rangeof resources in other niche dimensionsthan a microhabitat specialist would,
hence enabling it to achieve higher local abundance.However, if a species specialises on the most abun-dant resources, then specialisation and low abun-dance need not be associated (Jones et al. 2002). Forexample, the anemonefish Premnas biaculeatus onthe Great Barrier Reef, Australia, and on coral reefsof Papua New Guinea is a habitat specialist but is stillthe most abundant species of anemonefish in theseregions (Fautin & Allen 1992).
According to Brown (1984), species-abundancedistributions and species-range distributions shouldhave the same mechanistic basis, i.e. both should bedependent on the versatility displayed by a particularspecies. Gaston (1996) suggested that species-range-size distributions are simply species-abundance dis-tributions on a larger scale. Species with narrowhabitat requirements might have difficulty in colonis-
160
0 5 10 15 20 25 30
Geographic range (x106 km2)
Local distribution (no. of reef zones occupied)
0 1 2 3 4 5 6 7 8
0 1 2 3 4 5 6 7 8
T. lunareP. filamentosus
O. celebicusL. unilineatusL. dimidiatus
H. purpurescensH. melanurusH. hortulanus
H. chloropterus H. argus
D. xanthurus
T. lunareP. filamentosus
O. celebicusL. unilineatusL. dimidiatus
H. purpurescensH. melanurusH. hortulanus
H. chloropterus H. argus
D. xanthurus
T. lunareP. filamentosus
O. celebicusL. unilineatusL. dimidiatus
H. purpurescensH. melanurusH. hortulanus
H. chloropterus H. argus
D. xanthurus
Local distribution (no. of depth zones occupied)
Fig. 5. Local and geographic distributions for 11 species of juvenilewrasses in Kimbe Bay, Papua New Guinea. Local distribution expressedas vertical (no. of depth zones) and horizontal (no. of reef zones) distribu-tion. Geographic distribution expressed as geographic range (km2).
For full species names see Fig. 2

Berkström et al.: Ecological versatility in coral reef wrasses
ing new areas and hence have a limited range. Geo-graphic range was correlated with niche breadth in anumber of terrestrial studies (Gaston 1988, e.g. Inki-nen 1994, Pyron 1999, Hughes 2000), but not in thepresent study. Instead, contrary to predictions, therewas no relationship between niche breadth and geo-graphic range for any of the resources, i.e. resourcespecialisation does not limit the geographic range ofthese species. Similar results were found by Jones etal. (2002) for 2 groups of coral reef fishes, anemone-fishes and butterflyfishes. There is, however, somesupport for the specialisation/geographic range rela-tionship in coral reef fishes from a study by Haw -kins et al. (2000), where depth, habitat and distri -bution data on coral reef fish were compiled froma number of sources. Hawkins et al. (2000) showedthat there was a trend for restricted-range species tohave narrower depth ranges; however, only 57% ofrestricted-range species had high levels of micro -habitat selectivity.
The results from the present study suggest that thegeographic ranges of coral reef fishes are not limitedby the level of ecological versatility. Although spe-cialised coral reef fish are most often locally rare,high levels of specificity do not necessarily result innarrow geographic ranges. Factors other than nichespecialisation appear to be of greater importance inrestricting geographic distributions. For example, thedispersal and establishment abilities of a species canstrongly influence its geographic range. It has beensuggested that factors such as dispersal characteris-tics may be more influential as spatial scale increases(Palmer et al. 1996). The time larvae spend in theplankton stage varies between species (Victor 1986,Cowen 1991, Leis 1991) and may have a profoundeffect on species geographic range. However, otherfactors including competition, predation, climatic/environmental tolerances and historical events havealso been suggested to limit the distribution of spe-cies (Gaston 1996), and should not be ignored inmodels predicting patterns of distribution in coralreef fish.
It has been suggested that resource specialists maybe more prone to rapid decline and extinction thangeneralists, due to their inability to switch resourceswhen preferred resources become scarce (Jones etal. 2002). Several studies have found that the abun-dance of coral dwelling fishes rapidly declined whencorals they inhabited declined in numbers (Bouchon-Navaro et al. 1985, e.g. Munday et al. 1997, Munday2004). Munday (2004) also found that specialists suf-fered proportionately greater losses in abundancethan generalists when coral habitat declined. Most
juvenile wrasses in our study displayed some level ofmicrohabitat specialisation. Furthermore, we founda positive relationship between microhabitat spe -cialisation and abundance, suggesting that the mostspecialised species are likely to be at risk if their preferred habitats decline.
More than half of the species were predominantlyassociated with live coral, particularly branching andbushy hard corals. Juvenile fish are often found asso-ciated with live branching corals, as these provideshelter and protection from predators (Öhman &Rajasuriya 1998, Öhman et al. 1998). Branchingcorals are more sensitive to disturbances such asstorms and coral bleaching than corals of othergrowth forms (Woodley et al. 1981, Hughes & Con-nell 1999) and hence many of the labrid speciesin this study may be at risk if such disturbancesincrease as predicted. Major changes are occurringon coral reefs around the world, and 50% of theremaining coral reefs are in decline (Wilkinson2004). On several inshore reefs in Kimbe Bay, therewas a gradual decline in branching coral cover from1997 to 2001 (Jones et al. 2004). Recent studies havehighlighted the effect of degraded coral reefs on fishcommunities, and particularly fish species that aredependent on live coral for food or habitat are nega-tively affected (Jones et al. 2004, Wilson et al. 2006,Pratchett et al. 2008, Wilson et al. 2009).
Many of the juvenile wrasses in this study also dis-played high dependency on a single food item(harpacticoid copepods). Clearly, these species arepotentially at risk should degradation of reefs extendto this resource. While loss of coral may have littleimpact on planktonic food, the effects of coastal run-off and ocean warming on the food-base requires further investigation.
In conclusion, this study provides support for thehypothesis that ecological versatility in juvenilewrasses can have implications for the abundance anddistribution on a local scale. However, contrary toBrown’s hypothesis, we found no relationshipbetween ecological versatility and geographic rangeor between species abundance and distribution. Spe-cies are not versatile in all resources at once, andhence a relationship between versatility and abun-dance/distribution is dependent on which resource isbeing investigated. For many reef fishes, high levelsof habitat specialisation may well restrict local abun-dances, but levels of specialisation are unlikely tolimit geographic distributions. Other factors that arelikely to be important for limiting geographic distrib-utions in these communities, such as relative disper-sal ability, require further investigation.
161

Mar Ecol Prog Ser 461: 151–163, 2012
Acknowledgements. Many thanks to J. Larsson, L. Gam-feldt, J. Harris, S. Kistle, J. Loga, W. D. Robbins, M.Schläppy and dive staff at Walindi Plantation Resort for theirassistance with field work and the residents of Kilu andTamare villages near Walindi for allowing access to theirreefs. Thank you C.G. Alexander for your guidance andadvice during gut content analysis. This research was sup-ported by: Mahonia Na Dari Research and ConservationCentre; Walindi Plantation Resort; the School of Marine andTropical Biology, James Cook University; an InternationalPostgraduate Research Scholarship and a JCU PostgraduateScholarship to M.S.; and an Australian Research CouncilDiscovery Grant to G.P.J. The present study is in compliancewith the current laws of Papua New Guinea.
LITERATURE CITED
Allen GR, Steene R, Allen M (1998) A guide to angelfishesand butterflyfishes. Odyssey Publishing, Perth
Allen GR, Steene R, Humann P, DeLoach N (2003) Reef fishidentification: Tropical Pacific. New World Publications,Jacksonville, FL
Bean K, Jones GP, Caley MJ (2002) Relationships amongdistribution, abundance and microhabitat specialisationin a guild of coral reef triggerfish (family Balistidae). MarEcol Prog Ser 233: 263−272
Bock CE, Ricklefs RE (1983) Range size and local abundanceof some North American songbirds: a positive correla-tion. Am Nat 122: 295−299
Bonin MC, Almany GR, Jones GP (2011) Contrasting effectsof habitat loss and fragmentation on coral-associated reeffishes. Ecology 92: 1503−1512
Bouchon-Navaro Y, Bouchon C, Harmelin-Vivien ML (1985)Impact of coral degradation on a chaetodontid fishassemblage (Moorea, French Polynesia). Proc 5th IntCoral Reef Congr, Tahiti 5: 427−432
Brown JH (1984) On the relationship between abundanceand distribution of species. Am Nat 124: 255−279
Cowen RK (1991) Variation in the planktonic larval durationof the temperate wrasse Semicossyphus pulcher. MarEcol Prog Ser 69: 9−15
Davies KF, Margules CR, Lawrence JF (2004) A synergisticeffect puts rare, specialized species at greater risk ofextinction. Ecology 85: 265−271
DeMartini EE, Friedlander AM (2004) Spatial patterns ofendemism in shallow-water reef fish populations of theNorthwestern Hawaiian Islands. Mar Ecol Prog Ser 271: 281−296
Fautin DG, Allen GR (1992) Field guide to anemonefishesand their host sea anemones. Western AustralianMuseum, Perth
Fowler SV, Lawton JH (1982) The effects of host-plant distri-bution and local abundance on the species richness ofagromyzid flies attacking British umbellifers. Ecol Ento-mol 7: 257−265
Froese R, Pauly D (2002) Fishbase. www.fishbase.org(accessed 20 January 2002)
Futuyma DJ, Moreno G (1988) The evolution of ecologicalspecialisation. Annu Rev Ecol Syst 19: 207−233
Gardiner NM, Jones GP (2005) Habitat specialisation andoverlap in a guild of coral reef cardinalfishes (Apogo-nidae). Mar Ecol Prog Ser 305: 163−175
Gaston KJ (1988) Patterns in the local and regional dynam-ics of moth populations. Oikos 53: 49−57
Gaston KJ (1990) Patterns in the geographical ranges of spe-cies. Biol Rev Camb Philos Soc 65: 105−129
Gaston KJ (1994) Rarity. Chapman & Hall, LondonGaston KJ (1996) Species-range-size distributions: patterns
mechanisms and implications. Trends Ecol Evol 11: 197−201
Gaston KJ, Blackburn TM (1996) Global scale macroecol-ogy: interactions between population size, geographicrange size and body size in the Anseriformes. J AnimEcol 65: 701−714
Gaston KJ, Spicer JI (2001) The relationship between rangesize and niche breadth: a test using five species of Gam-marus (Amphipoda). Glob Ecol Biogeogr 10: 179−188
Gaston KJ, Blackburn TM, Lawton JH (1997) Interspecificabundance−range size relationships: an appraisal ofmechanisms. J Anim Ecol 66: 579−601
Graham N (2007) Ecological versatility and the decline ofcoral feeding fishes following climate driven coral mor-tality. Mar Biol 153: 119−127
Green AL (1996) Spatial, temporal and ontogenetic patternsof habitat use by coral reef fishes (Family Labridae). MarEcol Prog Ser 133: 1−11
Gregory RD, Gaston KJ (2000) Explanations of commonnessand rarity in British breeding birds: separating resourceuse and resource availability. Oikos 88: 515−526
Hanski I (1982) Dynamics of regional distribution; the coreand satellite species hypothesis. Oikos 38: 210−221
Hanski I, Gyllenberg M (1997) Uniting two general patternsin the distribution of species. Science 275: 397−400
Hanski I, Kouki J, Halkka A (1993) Three explanations ofthe positive relationship between distribution and abun-dance of species. In: Ricklefs RE, Schluter D (eds) Spe-cies diversity in ecological communities. University ofChicago Press, Chicago, IL, p 108–116
Harcourt AH, Coppeto SA, Parks SA (2002) Rarity, special-ization and extinction in primates. J Biogeogr 29: 445−456
Hawkins JP, Roberts CM, Clark V (2000) The threatenedstatus of restricted-range coral reef fish species. AnimConserv 3: 81−88
Hobbs JP, Jones G, Munday P (2010) Rarity and extinctionrisk in coral reef angelfishes on isolated islands: interre-lationships among abundance, geographic range sizeand specialisation. Coral Reefs 29: 1−11
Hobbs JPA, Jones GP, Munday PL (2011) Extinction risk inendemic marine fishes. Conserv Biol 25: 1053−1055
Hughes JB (2000) The scale of resource specialization andthe distribution and abundance of lycaenid butterflies.Oecologia 123: 375−383
Hughes TP, Connell JH (1999) Multiple stressors on coralreefs: a long-term perspective. Limnol Oceanogr 44: 932−940
Hurlbert SH (1978) The measurement of niche overlap andsome relatives. Ecology 59: 67−77
Inkinen P (1994) Distribution and abundance in British noctuid moths. Ann Zool Fenn 31: 235−243
Jones GP, Caley MJ, Munday PL (2002) Rarity in coral reeffish communities. In: Sale PF (ed) Coral reef fishes: dynamics and diversity in complex ecosystems. Acade-mic Press, New York, NY, p 81–101
Jones GP, McCormick MI, Srinivasan M, Eagle JV (2004)Coral decline threatens fish biodiversity in marinereserves. Proc Natl Acad Sci USA 101: 8251−8253
Krebs GJ (ed) (1999) Niche measures and resource pref -erences. In: Ecological methodology. Addison-Welsey Educational Publishers, Menlo Park, CA, p 455–495
162

Berkström et al.: Ecological versatility in coral reef wrasses 163
Leis JM (1991) The pelagic stage of reef fishes: the larvalbiology of coral reef fishes. In: Sale PF (ed) The ecologyof fishes on coral reefs. Academic Press, San Diego, CA,p 183–230
Levins R (1968) Evolution in changing environments: sometheoretical explorations, Vol 2. Princeton University Press,Princeton, NJ
Liem KF (1984) Functional versatility, speciation, and nicheoverlap: Are fishes different? In: Meyers DG, Strickler JR(eds) Trophic interactions within aquatic ecosystems.Westview Press, Boulder, CO, p 269–305
Liem KF (1990) Aquatic versus terrestrial feeding modes: possible impacts on the trophic ecology of vertebrates.Am Zool 30: 209−221
MacNally RC (1995) Ecological versatility and communityecology. Cambridge University Press, Melbourne
Manly BFJ, McDonald LL, Thomas DL (1993) Resourceselection by animals. Chapman & Hall, London
McNaughton SJ, Wolf LL (1970) Dominance and the niche inecological systems. Science 167: 131−139
McPeek MA (1996) Trade-offs, food web structure, and thecoexistence of habitat specialists and generalists. AmNat 148: S124−S138
Morris DW (1996) Coexistence of specialist and generalistrodents via habitat selection. Ecology 77: 2352−2364
Munday PL (2000) Interactions between habitat use and pat-terns of abundance in coral-dwelling fishes of the genusGobiodon. Environ Biol Fishes 58: 355−369
Munday PL (2002) Does habitat availability determine geo-graphical-scale abundances of coral-dwelling fishes?Coral Reefs 21: 105−116
Munday PL (2004) Habitat loss, resource specialization,and extinction on coral reefs. Glob Change Biol 10: 1642−1647
Munday PL, Jones GP (1998) The ecological implications ofsmall body size among coral-reef fishes. Oceanogr MarBiol Annu Rev 36: 373−411
Munday PL, Jones GP, Caley MJ (1997) Habitat specialisa-tion and the distribution and abundance of coral-dwelling gobies. Mar Ecol Prog Ser 152: 227−239
Myers RF (1999) Micronesian reef fishes: a comprehensiveguide to the coral reef fishes of Micronesia. Coral Graph-ics, Guam
Öhman MC, Rajasuriya A (1998) Relationships betweenhabitat structure and fish communities on coral andsandstone reefs. Environ Biol Fishes 53: 19−31
Öhman MC, Munday PL, Jones GP, Caley MJ (1998) Settle-ment strategies and distribution patterns of coral-reeffishes. J Exp Mar Biol Ecol 225: 219−238
Palmer MA, Allan JD, Butman CA (1996) Dispersal as aregional process affecting the local dynamics of marineand stream benthic invertebrates. Trends Ecol Evol 11: 322−326
Pianka ER (1974) The ecological niche. In: Pianka ER (ed)
Evolutionary ecology. Harper & Row, New York, NY,p 267–293
Pratchett M (2005) Dietary overlap among coral-feedingbutterflyfishes (Chaetodontidae) at Lizard Island, north-ern Great Barrier Reef. Mar Biol 148: 373−382
Pratchett MS, Wilson SK, Baird AH (2006) Declines in theabundance of Chaetodon butterflyfishes followingextensive coral depletion. J Fish Biol 69: 1269−1280
Pratchett MS, Munday PL, Wilson SK, Graham NAJ and oth-ers (2008) Effects of climate-induced coral bleaching oncoral-reef fishes—ecological and economic conse-quences. Oceanogr Mar Biol Annu Rev 46: 251−296
Pyron M (1999) Relationships between geographical rangesize, body size, local abundance, and habitat breadth inNorth American suckers and sunfishes. J Biogeogr 26: 549−558
Rachlin JW, Warkentine BE, Pappantoniou A (1989) The useof niche breadth and proportional similarity in feeding tostipulate resource utilization strategies in fish. J Fish Biol5: 103−112
Randall JE, Allen GR, Steene RC (1997) The complete divers’& fishermen’s guide to fishes of the Great Barrier Reef andCoral Sea. Crawford House Publishing, Bathurst, p 557
Ross ST (1986) Resource partitioning in fish assemblages: areview on field studies. Copeia 1986: 352−388
Schoener TW (1974) Resource partitioning in ecologicalcommunities. Science 185: 27−39
Srinivasan M (2003) Depth distributions of coral reef fishes: the influence of microhabitat structure, settlement, andpost-settlement processes. Oecologia 137: 76−84
Srinivasan M, Jones G (2006) Extended breeding andrecruitment periods of fishes on a low latitude coral reef.Coral Reefs 25: 673−682
Thresher RE (1991) Geographic variability in the ecology ofcoral reef fishes: evidence, evolution, and possible impli-cations. In: Sale PF (ed) The ecology of fishes on coralreefs. Academic Press, Sydney, p 401–436
Timms R, Read AF (1999) What makes a specialist special?Trends Ecol Evol 14: 333−334
Victor BC (1986) Duration of the planktonic larval stage ofone hundred species of Pacific and Atlantic wrasses(family Labridae). Mar Biol 90: 317−326
Wilkinson C (2004) Status of coral reefs of the world: 2004.Australian Institute of Marine Sciences, Townsville
Wilson SK, Graham NAJ, Pratchett MS, Jones AG, PoluninNVC (2006) Multiple disturbances and the global degra-dation of coral reefs: are reef fishes at risk or resilient?Glob Change Biol 12: 2220−2234
Wilson S, Dolman A, Cheal A, Emslie M, Pratchett M,Sweatman H (2009) Maintenance of fish diversity on dis-turbed coral reefs. Coral Reefs 28: 3−14
Woodley JD, Chornesky EA, Clifford PA, Jackson JBC andothers (1981) Hurricane Allen’s impact on Jamaican coralreefs. Science 214: 749−755
Editorial responsibility: Charles Birkeland, Honolulu, Hawaii, USA
Submitted: November 16, 2011; Accepted: April 26, 2012Proofs received from author(s): Augsust 3, 2012
Related Documents


