Ecological Pyramids: graphs which illustrate the trophic levels in a community.

Ecological Pyramids: graphs which illustrate the trophic levels in a community.
Jan 02, 2016
Welcome message from author
This document is posted to help you gain knowledge. Please leave a comment to let me know what you think about it! Share it to your friends and learn new things together.
Transcript
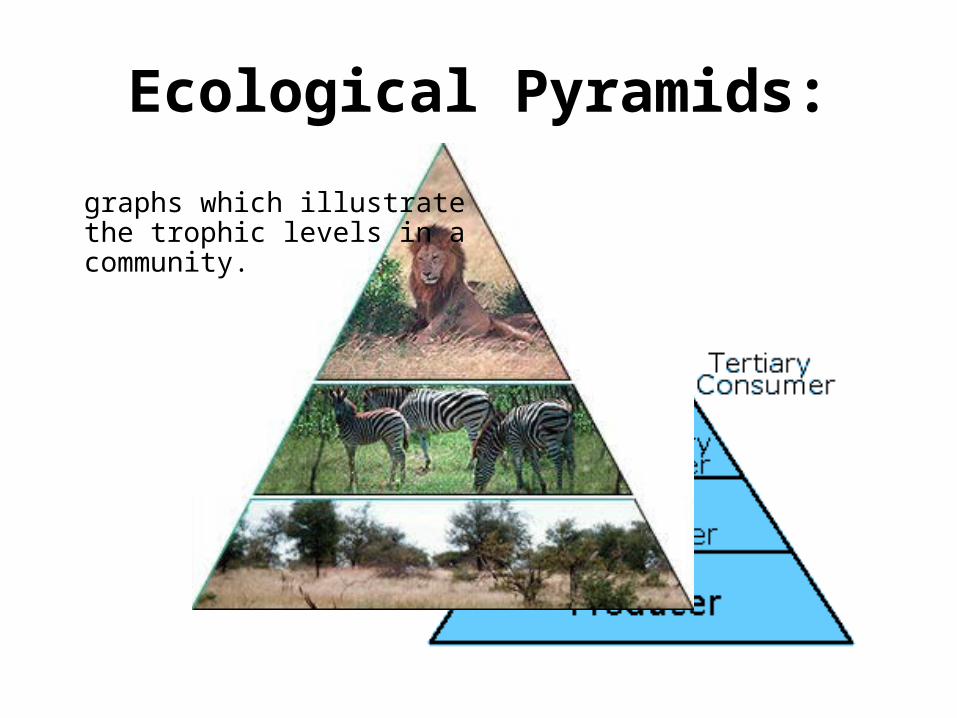
Ecological Pyramids:
graphs which illustrate the trophic levels in a community.

Most ecological pyramids are large at the base and narrow at
the top.
This is because every time that an organism is eaten by the next trophic level, some of the energy is lost as
heat. More Energy
Less Energy


3 TYPES OF PYRAMIDS:
1. Pyramid of Biomass2. Pyramid of Energy3. Pyramid of Numbers

Pyramid of Biomass:• Illustrates the amount of biomass in each trophic level
– Biomass weight is determined after dehydration
• Shows the amount of matter lost between trophic levels.
• Measured in Kg, grams or pounds
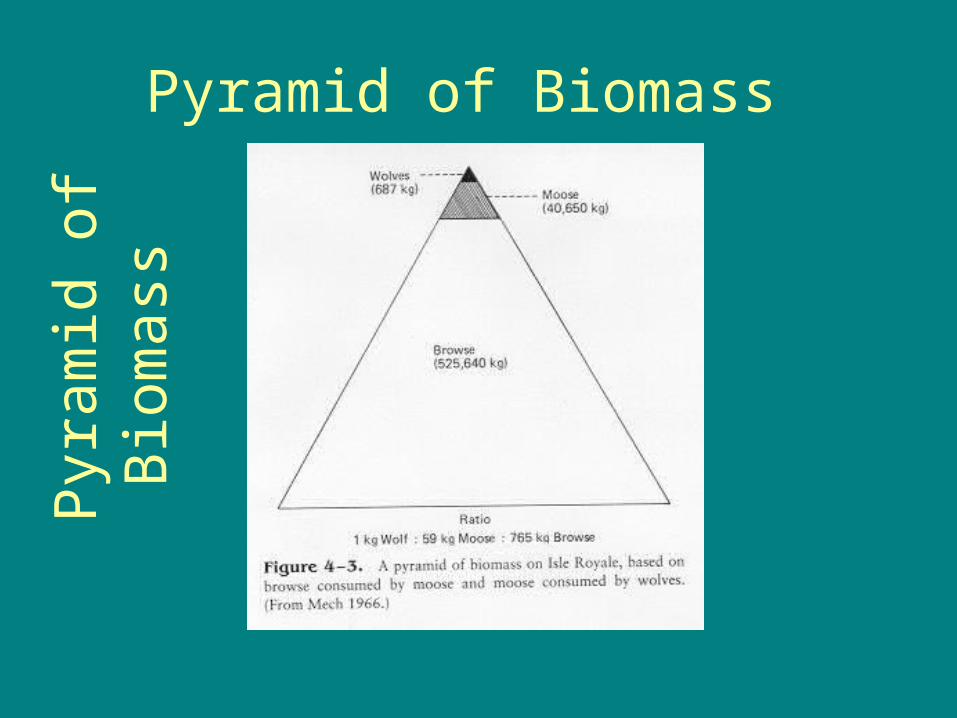
Pyramid of Biomass P
yram
id o
f Bio
mas
s
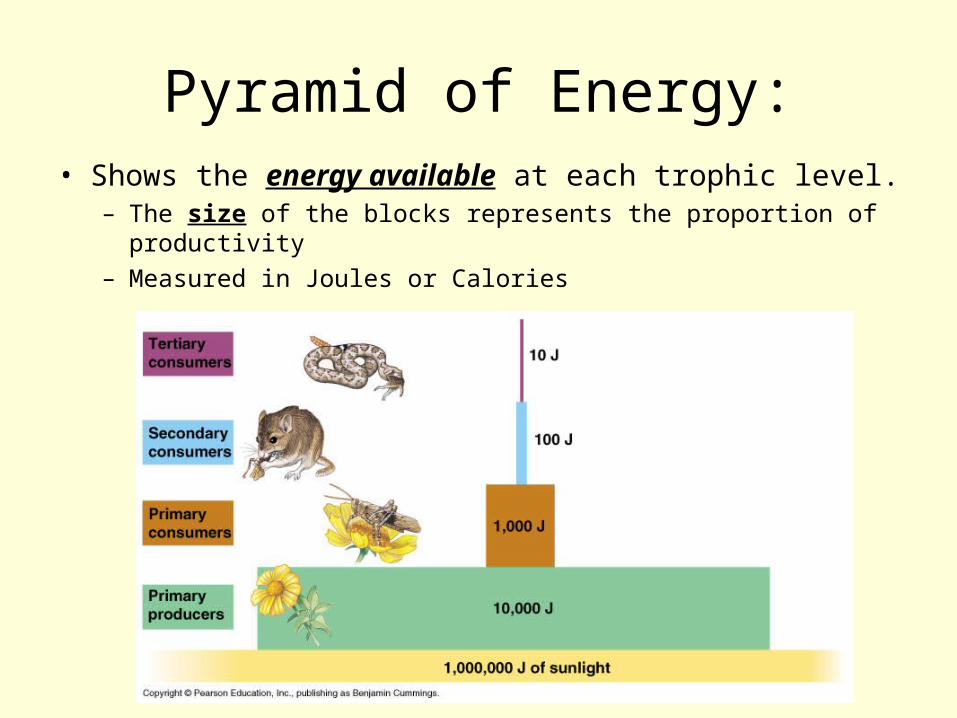
Pyramid of Energy:• Shows the energy available at each trophic level.
– The size of the blocks represents the proportion of productivity– Measured in Joules or Calories

Pyramid of Energy:• Most of the energy available to the community
is in the 1st trophic level.• Only 10-20% of the energy is available to the
next trophic level (≈ 90% lost)

Pyramid of Numbers:• Illustration of the number of organisms at
each level
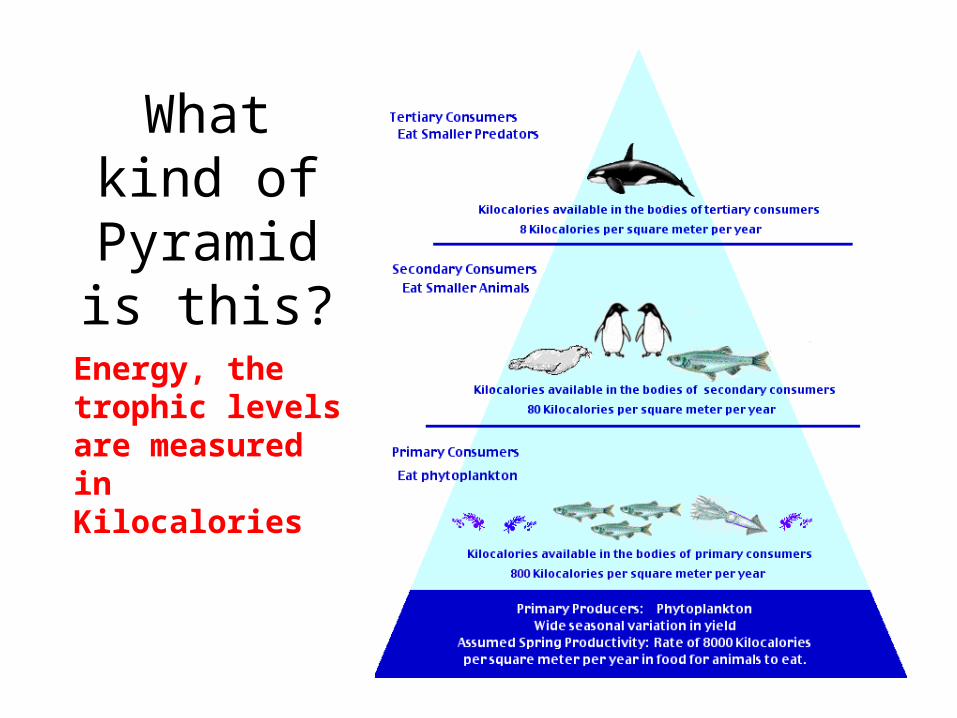
What kind of Pyramid
is this?
Energy, the trophic levels are measured in Kilocalories

How can more people be supported on Earth when there is a limited supply of resources?
Human Population Growth
It depends on what they are eating…

The End or is it just the beginning…
Related Documents