Ecological correlates of ghost lineages in ruminants Juan L. Cantalapiedra, Manuel Herna ´ndez Ferna ´ndez, Gema M. Alcalde, Beatriz Azanza, Daniel DeMiguel, and Jorge Morales Abstract.—Integration between phylogenetic systematics and paleontological data has proved to be an effective method for identifying periods that lack fossil evidence in the evolutionary history of clades. In this study we aim to analyze whether there is any correlation between various ecomorphological variables and the duration of these underrepresented portions of lineages, which we call ghost lineages for simplicity, in ruminants. Analyses within phylogenetic (Generalized Estimating Equations) and non-phylogenetic (ANOVAs and Pearson correlations) frameworks were performed on the whole phylogeny of this suborder of Cetartiodactyla (Mammalia). This is the first time ghost lineages are focused in this way. To test the robustness of our data, we compared the magnitude of ghost lineages among different continents and among phylogenies pruned at different ages (4, 8, 12, 16, and 20 Ma). Differences in mean ghost lineage were not significantly related to either geographic or temporal factors. Our results indicate that the proportion of the known fossil record in ruminants appears to be influenced by the preservation potential of the bone remains in different environments. Furthermore, large geographical ranges of species increase the likelihood of preservation. Juan L. Cantalapiedra, Gema Alcalde, and Jorge Morales. Departamento de Paleobiologı ´a, Museo Nacional de Ciencias Naturales, UCM-CSIC, Pinar 25, 28006 Madrid, Spain. E-mail: [email protected] Manuel Herna ´ndez Ferna ´ndez. Departamento de Paleontologı ´a, Facultad de Ciencias Geolo ´gicas, Universidad Complutense de Madrid y Departamento de Cambio Medioambiental, Instituto de Geociencias, Consejo Superior de Investigaciones Cientı ´ficas, Jose ´ Antonio Novais 2, 28040 Madrid, Spain Daniel DeMiguel. Departament de Faunes del Neogen i Quaternari, Institut Catala ` de Paleontologia, Edifici ICP, Universitat Auto `noma de Barcelona, 08193 Cerdanyola del Valle `s, Spain Beatriz Azanza. Departamento de Ciencias de la Tierra, Facultad de Ciencias and Instituto de Ciencias de Arago ´n, Universidad de Zaragoza, Pedro Cerbuna 12, 50009 Zaragoza, Spain Accepted: 3 March 2011 Supplementary materials deposited at Dryad: doi: 10.5061/dryad.80n50 Introduction An important part of our knowledge about evolution is based on information from fossils. Patterns of preservation in the fossil record have provided a key tool for estimating dates of appearance of new living forms on Earth and understanding events of diversification and extinction (Norell 1993). Nevertheless, our comprehension of the many factors that may influence the preservation of species in the fossil record is still incomplete. For example, although stratigraphic sampling appears to be relevant (Alroy et al. 2001; Crampton et al. 2003), we do not know whether ecological characteristics of species are also important in this context. The use of ecological data on modern species along with phylogenetic systematics synthesizing information from both extant and extinct species may provide a novel approach to this issue. Traditionally, cladistic hypotheses have been adjusted to stratigraphic ranges of species by adding inferred lineages for which no fossil has been recovered. Following this view, ghost lineages were defined as complete branches in an evolutionary tree that lacks a known fossil record, but whose presence is inferred from the tree topology obtained by phylogenetic analysis (Norell 1992; Smith 1994). These ghost lineages can be recovered only by a phyloge- netic approach calibrated with paleontological data (Norell 1996). Moreover, Smith (1994) also identified range extensions, which are tem- poral gaps that must be added to the strati- graphic ranges of taxa in order to build an evolutionary tree that fits temporal relation- ships with a phylogenetic analysis. In this context some authors have surveyed the extent to which assumptions of different cladistic hypotheses may influence the estimations of our paleontological knowledge (Norell and Novacek 1992a,b; Weishampel 1996; O’Keefe and Sander 1999; Benton et al. 2000; Wagner 2000a,b; Wills 2002; Pol and Norell 2006; Paleobiology, 38(1), 2012, pp. 101–111 ’ 2012 The Paleontological Society. All rights reserved. 0094-8373/12/3801–0006/$1.00

Welcome message from author
This document is posted to help you gain knowledge. Please leave a comment to let me know what you think about it! Share it to your friends and learn new things together.
Transcript
Ecological correlates of ghost lineages in ruminants
Juan L. Cantalapiedra, Manuel Hernandez Fernandez, Gema M. Alcalde,Beatriz Azanza, Daniel DeMiguel, and Jorge Morales
Abstract.—Integration between phylogenetic systematics and paleontological data has proved to be aneffective method for identifying periods that lack fossil evidence in the evolutionary history of clades.In this study we aim to analyze whether there is any correlation between various ecomorphologicalvariables and the duration of these underrepresented portions of lineages, which we call ghostlineages for simplicity, in ruminants. Analyses within phylogenetic (Generalized EstimatingEquations) and non-phylogenetic (ANOVAs and Pearson correlations) frameworks were performedon the whole phylogeny of this suborder of Cetartiodactyla (Mammalia). This is the first time ghostlineages are focused in this way. To test the robustness of our data, we compared the magnitude ofghost lineages among different continents and among phylogenies pruned at different ages (4, 8, 12,16, and 20 Ma). Differences in mean ghost lineage were not significantly related to either geographicor temporal factors. Our results indicate that the proportion of the known fossil record in ruminantsappears to be influenced by the preservation potential of the bone remains in different environments.Furthermore, large geographical ranges of species increase the likelihood of preservation.
Juan L. Cantalapiedra, Gema Alcalde, and Jorge Morales. Departamento de Paleobiologıa, Museo Nacional deCiencias Naturales, UCM-CSIC, Pinar 25, 28006 Madrid, Spain. E-mail: [email protected]
Manuel Hernandez Fernandez. Departamento de Paleontologıa, Facultad de Ciencias Geologicas, UniversidadComplutense de Madrid y Departamento de Cambio Medioambiental, Instituto de Geociencias, ConsejoSuperior de Investigaciones Cientıficas, Jose Antonio Novais 2, 28040 Madrid, Spain
Daniel DeMiguel. Departament de Faunes del Neogen i Quaternari, Institut Catala de Paleontologia, EdificiICP, Universitat Autonoma de Barcelona, 08193 Cerdanyola del Valles, Spain
Beatriz Azanza. Departamento de Ciencias de la Tierra, Facultad de Ciencias and Instituto de Ciencias deAragon, Universidad de Zaragoza, Pedro Cerbuna 12, 50009 Zaragoza, Spain
Accepted: 3 March 2011Supplementary materials deposited at Dryad: doi: 10.5061/dryad.80n50
Introduction
An important part of our knowledge aboutevolution is based on information from fossils.Patterns of preservation in the fossil record haveprovided a key tool for estimating datesof appearance of new living forms on Earthand understanding events of diversificationand extinction (Norell 1993). Nevertheless, ourcomprehension of the many factors that mayinfluence the preservation of species in the fossilrecord is still incomplete. For example, althoughstratigraphic sampling appears to be relevant(Alroy et al. 2001; Crampton et al. 2003), we donot know whether ecological characteristics ofspecies are also important in this context. Theuse of ecological data on modern species alongwith phylogenetic systematics synthesizinginformation from both extant and extinct speciesmay provide a novel approach to this issue.
Traditionally, cladistic hypotheses havebeen adjusted to stratigraphic ranges of species
by adding inferred lineages for which no fossilhas been recovered. Following this view, ghostlineages were defined as complete branches inan evolutionary tree that lacks a known fossilrecord, but whose presence is inferred fromthe tree topology obtained by phylogeneticanalysis (Norell 1992; Smith 1994). These ghostlineages can be recovered only by a phyloge-netic approach calibrated with paleontologicaldata (Norell 1996). Moreover, Smith (1994) alsoidentified range extensions, which are tem-poral gaps that must be added to the strati-graphic ranges of taxa in order to build anevolutionary tree that fits temporal relation-ships with a phylogenetic analysis. In thiscontext some authors have surveyed the extentto which assumptions of different cladistichypotheses may influence the estimations ofour paleontological knowledge (Norell andNovacek 1992a,b; Weishampel 1996; O’Keefeand Sander 1999; Benton et al. 2000; Wagner2000a,b; Wills 2002; Pol and Norell 2006;
Paleobiology, 38(1), 2012, pp. 101–111
’ 2012 The Paleontological Society. All rights reserved. 0094-8373/12/3801–0006/$1.00
Worthy et al. 2006). For example, given twofossil taxa with different first appearances andknown fossil ranges that do not overlap,different lengths of inferred range must beadded depending on different cladistic assump-tions. If we assume that as organisms evolvethey give rise to new taxa in dichotomous splits,the evolutionary histories of two sister groupssharing a common ancestor should have equalduration (Paul 1982). Thus, a range from thefirst appearance of the younger taxon to the dateof first appearance of the older taxon must beadded (Norell 1996). Conversely, an ancestor-descendant relationship could be assumed andwe would only have to infer a range betweenthe last appearance of the older taxon (inferredancestor) and the first appearance of theyounger taxon (Wagner 1995; 2000a,b). Inphylogenies containing fossil taxa, cladistichypotheses and temporal calibration come fromthe same source: fossils. In such cases samplingbias directly affects phylogenetic accuracy,which in turn may bias the assessment of thefossil record. Only well-resolved topologiesyield a correct interpretation of gaps in thefossil record (Wagner 2000a).
Molecular phylogenies provide a new toolin this scenario. Molecular-based phyloge-netic analyses usually generate origin datesearlier than the first appearance of knownfossil taxa (Hartenberger 1998; Adkins et al.2001; Huchon et al. 2002; Teeling et al. 2005).Comparing both fossil and molecular esti-mates of lineages origin may shed some lighton the accuracy with which the fossil recordrepresents the evolutionary history of line-ages leading to living species (Teeling et al.2005; Johnson et al. 2006). This approach,according to the criteria of Teeling et al.(2005), places the oldest known fossil for eachbranch of the molecular tree and calculatesthe percentage of unrepresented basal branchlength. Nevertheless, although taxonomicsampling bias in molecular trees of extantspecies is theoretically smaller than in phy-logenies of extinct taxa, assessing the accu-racy of the fossil record in this manner isapplicable only to lineages leading to extantspecies and it is not exempt from limitations(see further discussion in ‘‘Limitations of theMethods,’’ below).
For the sake of simplicity, hereafter we usethe term ‘‘ghost lineages’’ to refer to ghostlineages, range extensions, and unrepresentedbasal branch lengths. All of these have beenincluded in studies assessing the congruenceamong divergence dates from molecular phy-logenies and fossil ranges (Teeling et al. 2005;Johnson et al. 2006), paleodiversity estimates(Lane et al. 2005), inferences about patterns ofcharacter acquisition (Sidor and Hopson1998), and the magnitude of critical events(Cavin and Forey 2007; Ruta and Benton2008). In this work, we tested whether severalecomorphological attributes of the species(body mass, presence in biomes, range size,diet, and locomotor modes) may influence theduration of ghost lineages and, therefore, thelikelihood of generating a complete fossilrecord. Our test focused on the suborderRuminantia, which is the most speciose extantclade of large land herbivores and presentsa fossil record that covers a time span of50 Myr. Ruminants have developed a spec-tacular diversity of ecomorphological special-izations, with wide geographical and ecotypicranges and existing species inhabiting everyterrestrial biome (Walter 1970). Such ecolog-ical diversity and taxonomic richness, with197 extant species in 79 genera and about 300extinct genera (Grubb 1993; McKenna andBell 1997; Hernandez Fernandez and Vrba2005a), prove ruminants to be a valuabletarget for evolutionary research (Vrba andSchaller 2000).
Materials and Methods
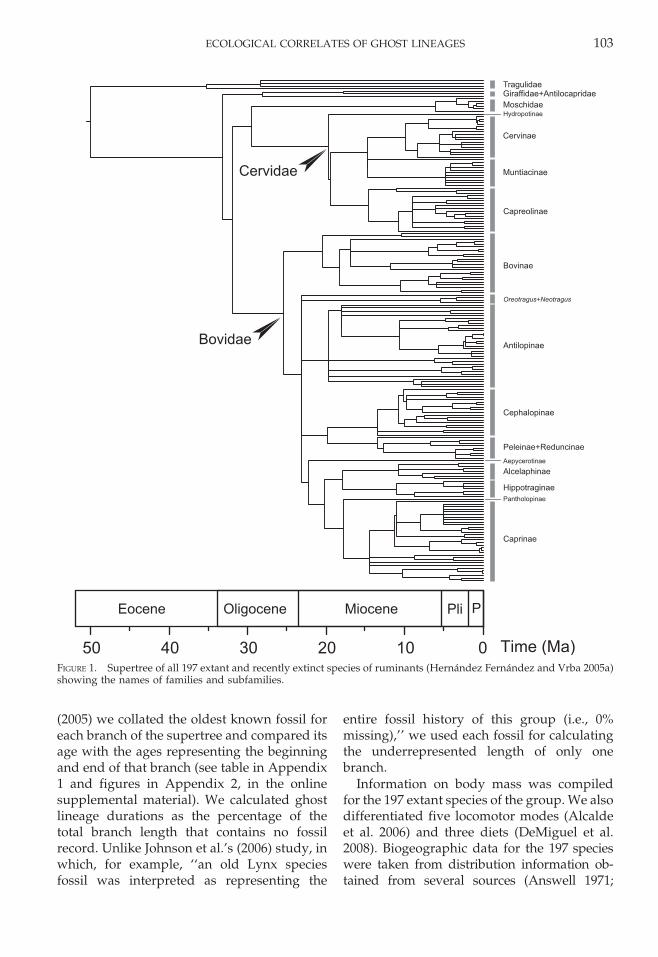
Data.—The phylogeny of suborder Rumi-nantia was taken from the supertree pub-lished by Hernandez Fernandez and Vrba(2005a), which includes all the 197 extant andrecently extinct ruminant species. This super-tree is a consensus tree combining morpho-logical, ethological and molecular informationfrom every phylogeny published up to date,and includes a time calibration using paleon-tological data (Fig. 1).
To identify the correlations among ghostlineages’ durations and the different ecomor-phological characters, we compiled data for19 binary variables and two continuousvariables (Table 1). Following Telling et al.
102 JUAN L. CANTALAPIEDRA ET AL.
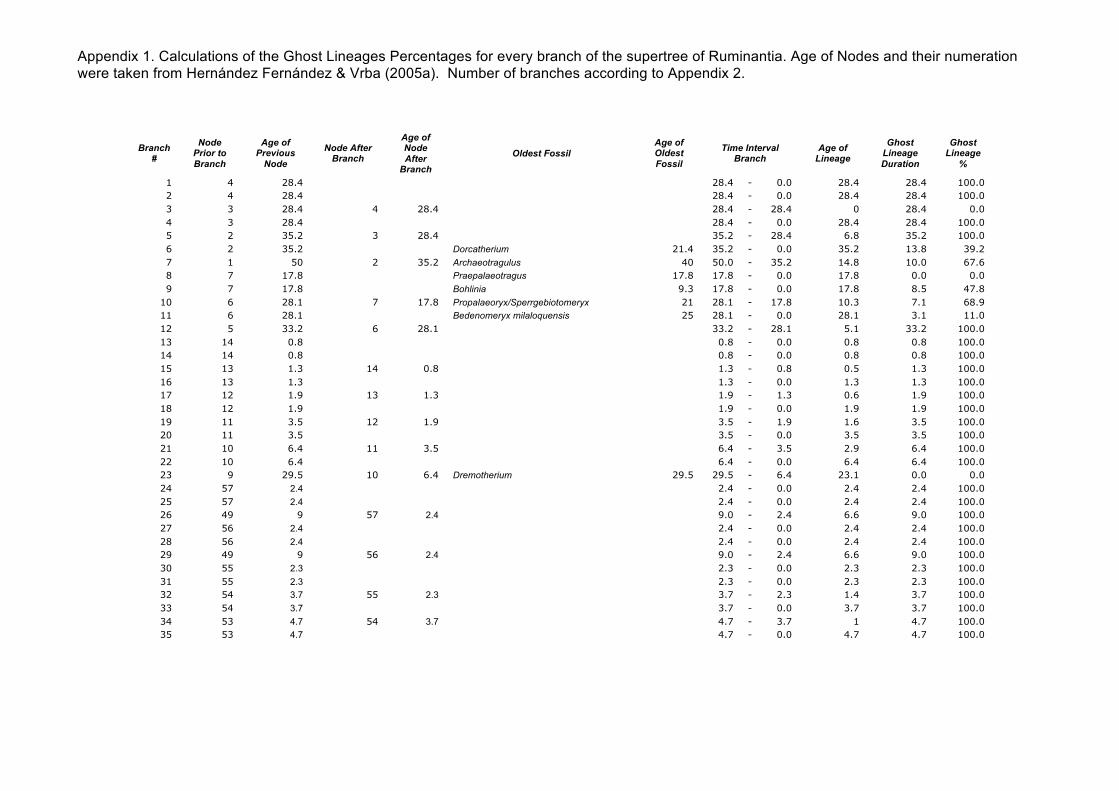
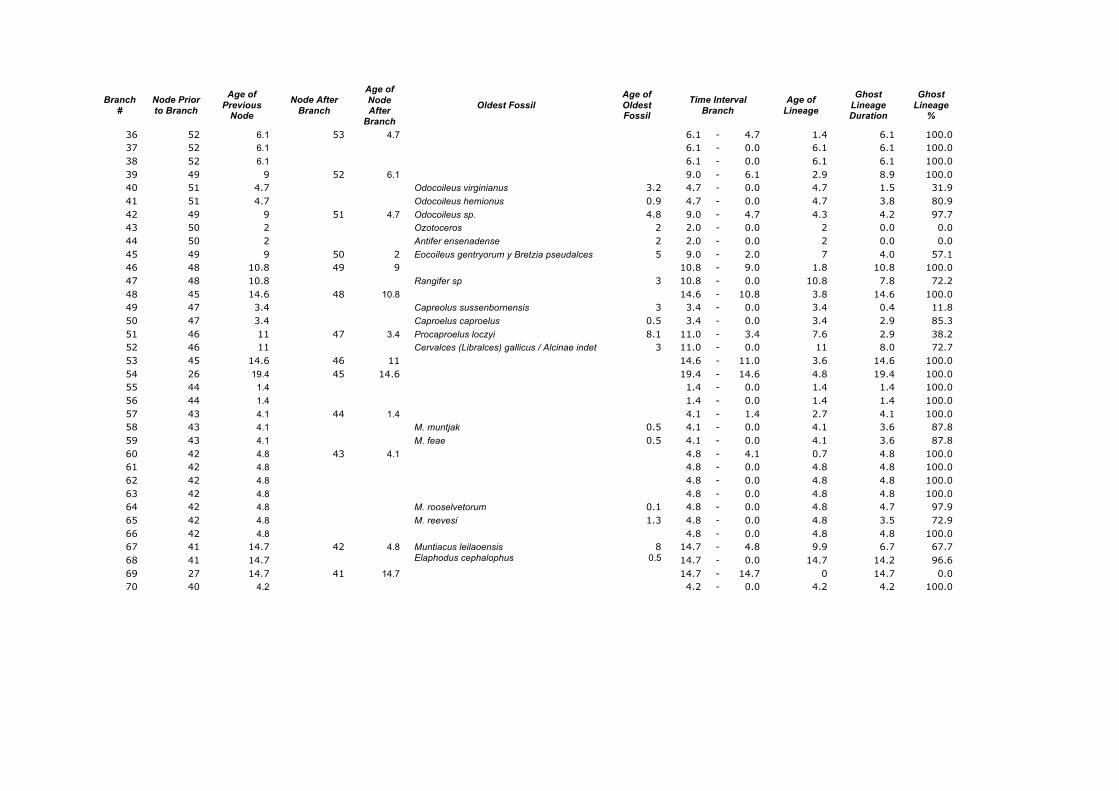
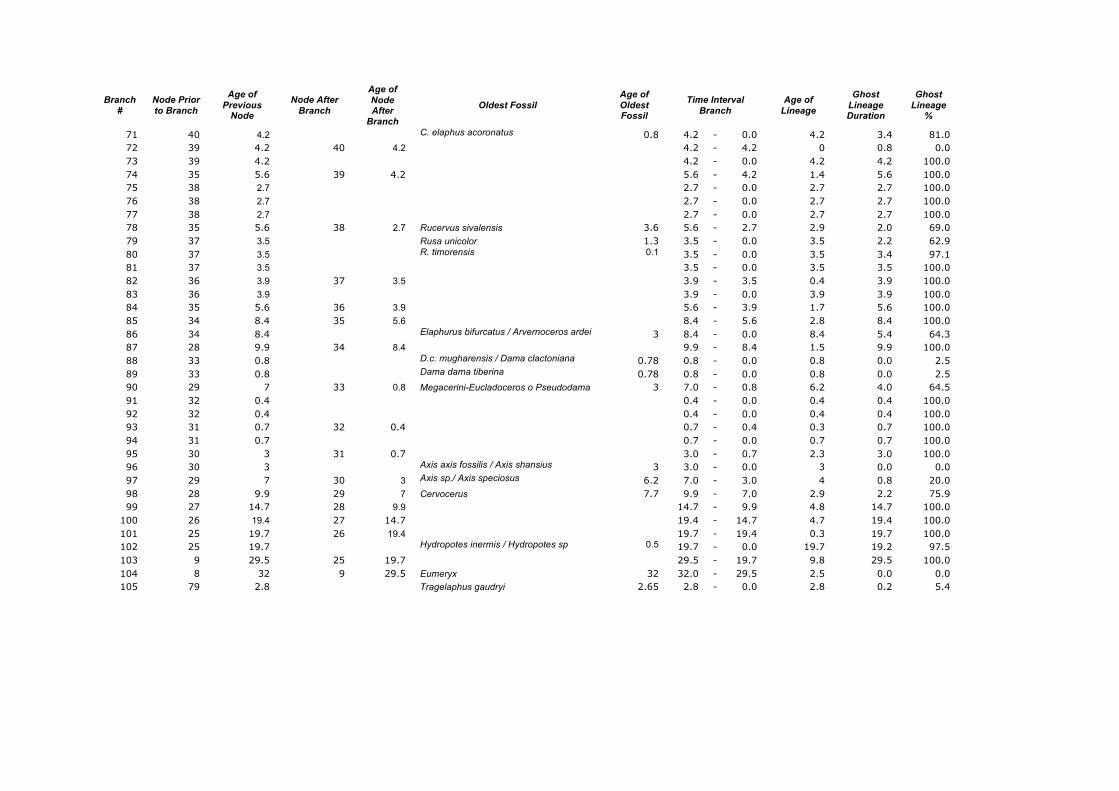
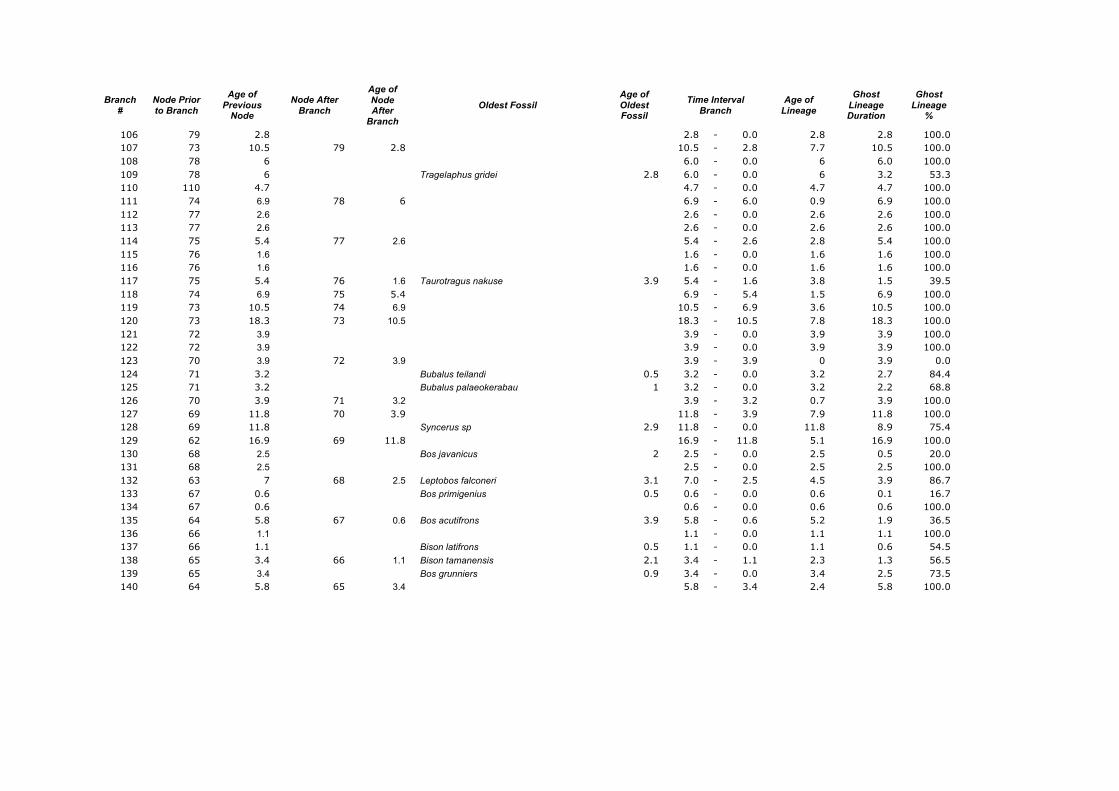
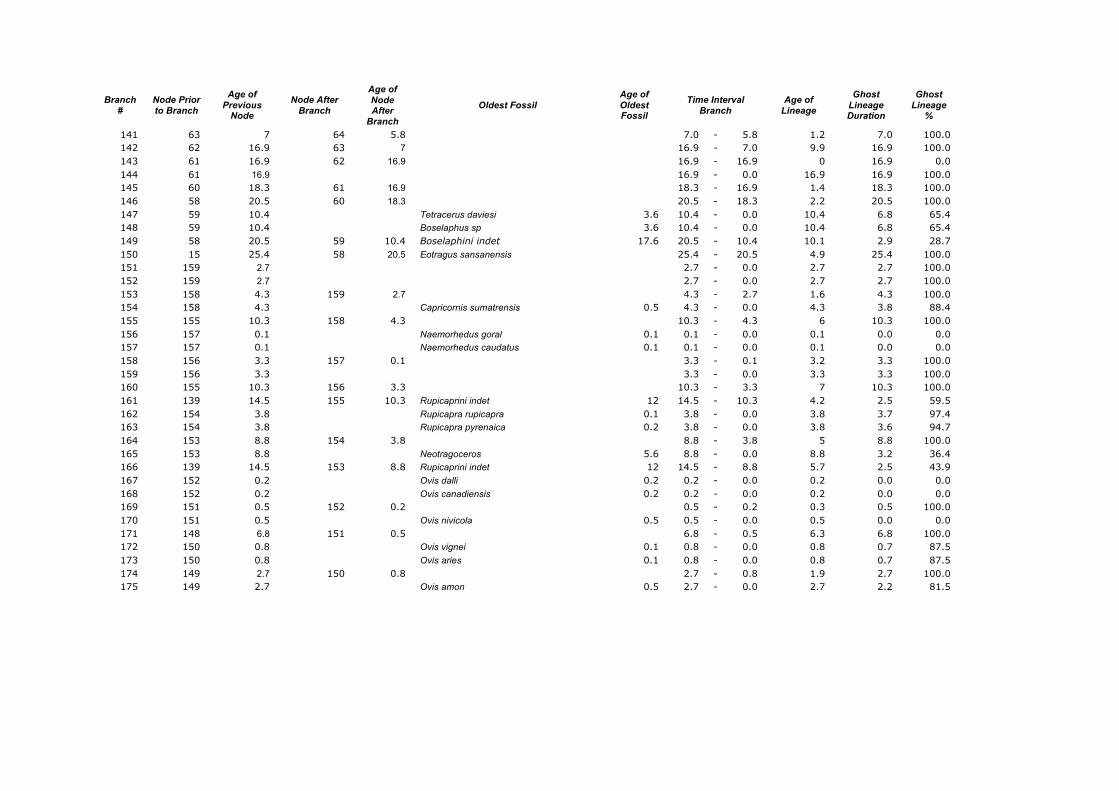
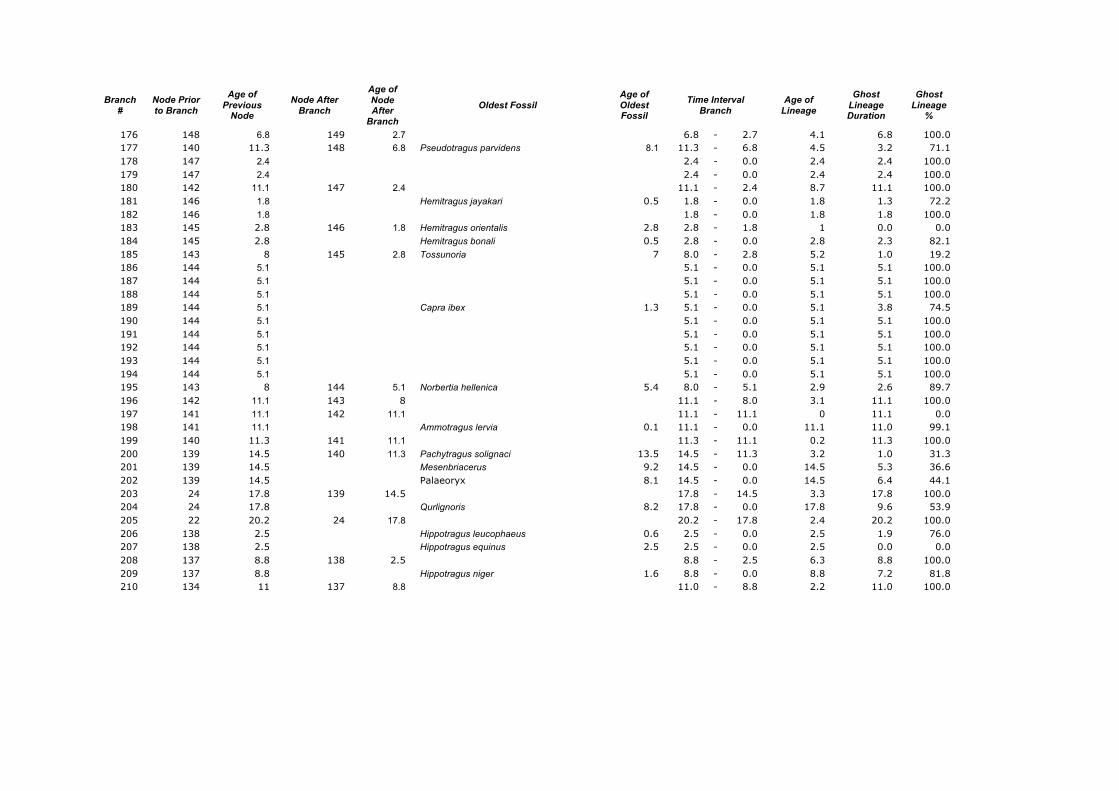
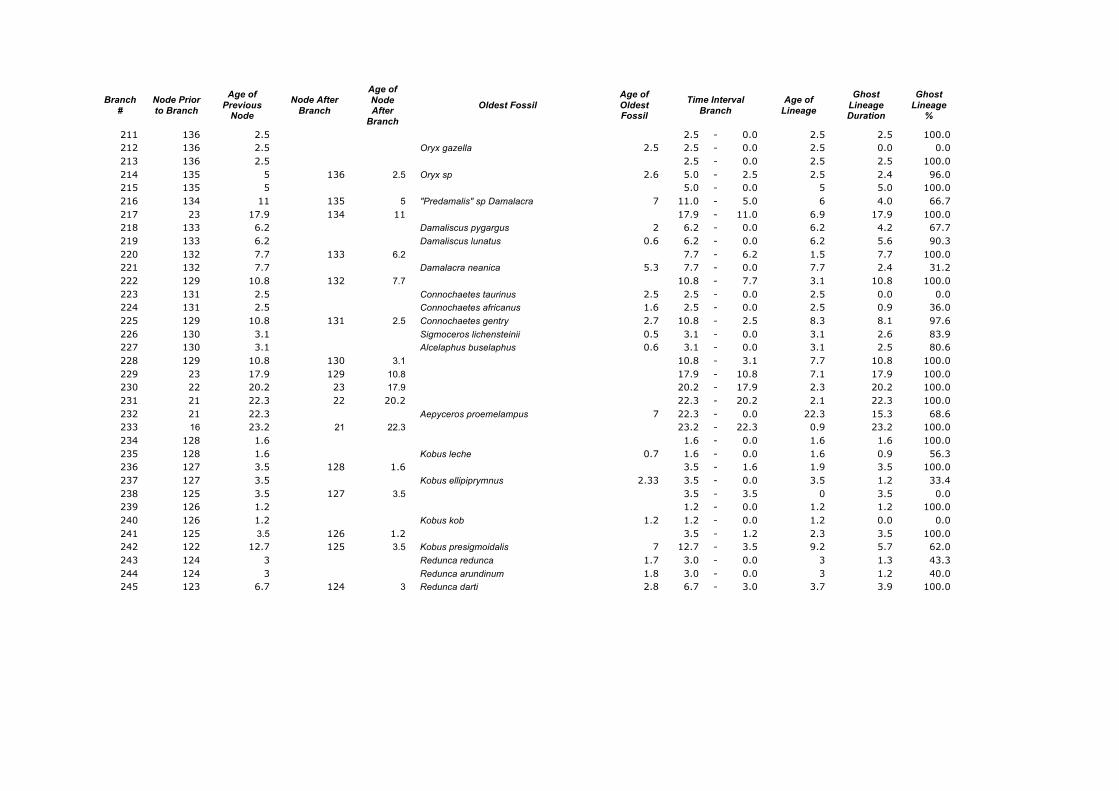
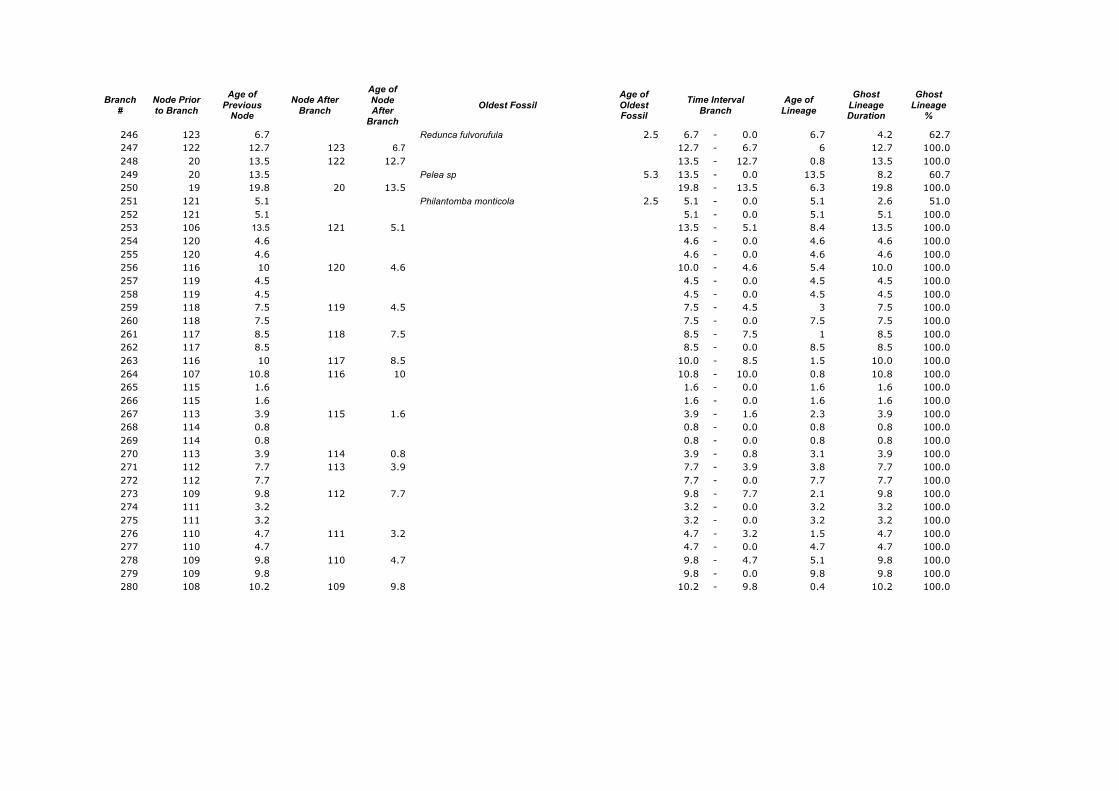
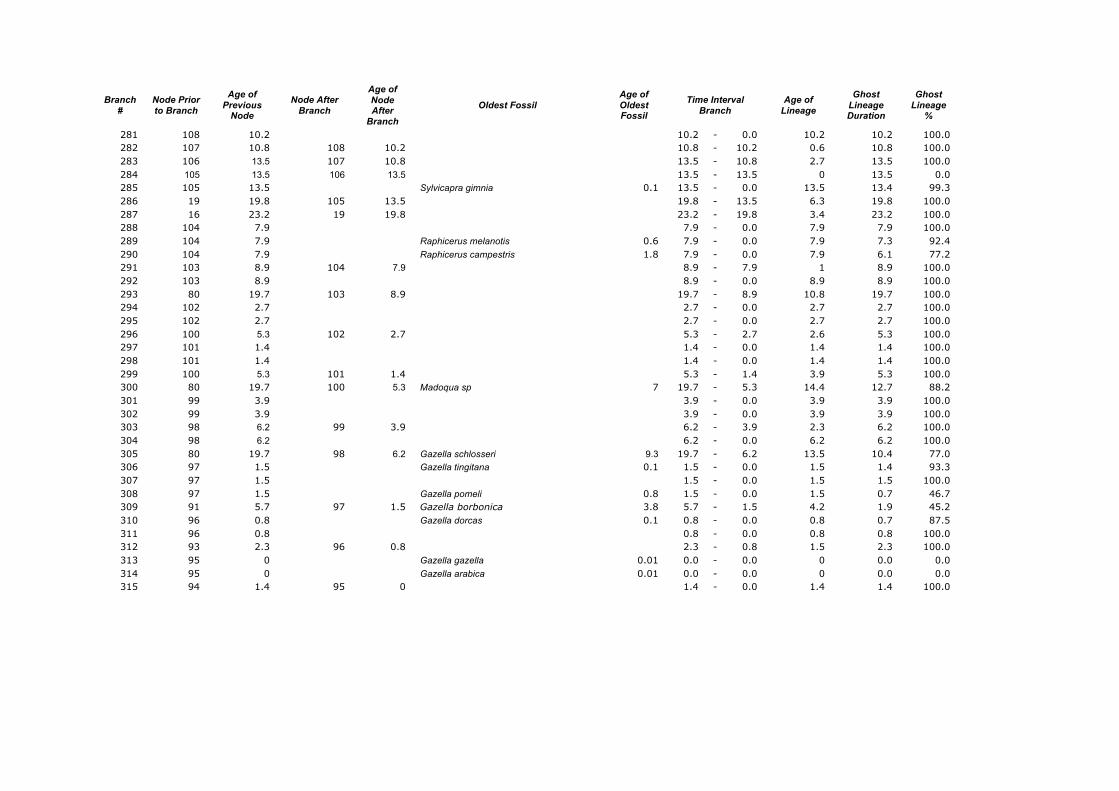
(2005) we collated the oldest known fossil foreach branch of the supertree and compared itsage with the ages representing the beginningand end of that branch (see table in Appendix1 and figures in Appendix 2, in the onlinesupplemental material). We calculated ghostlineage durations as the percentage of thetotal branch length that contains no fossilrecord. Unlike Johnson et al.’s (2006) study, inwhich, for example, ‘‘an old Lynx speciesfossil was interpreted as representing the
entire fossil history of this group (i.e., 0%missing),’’ we used each fossil for calculatingthe underrepresented length of only onebranch.
Information on body mass was compiledfor the 197 extant species of the group. We alsodifferentiated five locomotor modes (Alcaldeet al. 2006) and three diets (DeMiguel et al.2008). Biogeographic data for the 197 specieswere taken from distribution information ob-tained from several sources (Answell 1971;
FIGURE 1. Supertree of all 197 extant and recently extinct species of ruminants (Hernandez Fernandez and Vrba 2005a)showing the names of families and subfamilies.
ECOLOGICAL CORRELATES OF GHOST LINEAGES 103
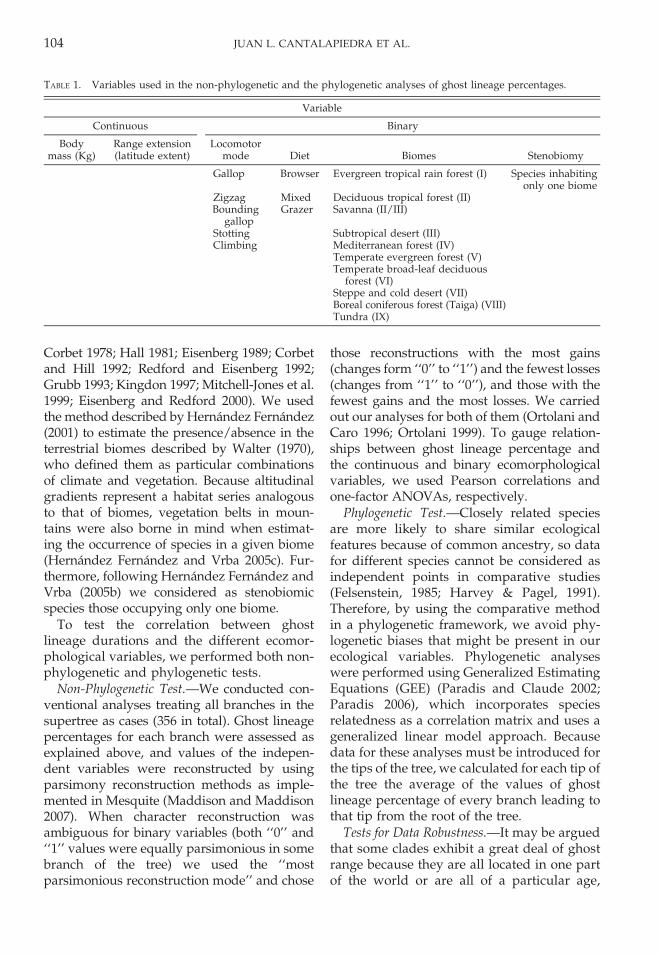
Corbet 1978; Hall 1981; Eisenberg 1989; Corbetand Hill 1992; Redford and Eisenberg 1992;Grubb 1993; Kingdon 1997; Mitchell-Jones et al.1999; Eisenberg and Redford 2000). We usedthe method described by Hernandez Fernandez(2001) to estimate the presence/absence in theterrestrial biomes described by Walter (1970),who defined them as particular combinationsof climate and vegetation. Because altitudinalgradients represent a habitat series analogousto that of biomes, vegetation belts in moun-tains were also borne in mind when estimat-ing the occurrence of species in a given biome(Hernandez Fernandez and Vrba 2005c). Fur-thermore, following Hernandez Fernandez andVrba (2005b) we considered as stenobiomicspecies those occupying only one biome.
To test the correlation between ghostlineage durations and the different ecomor-phological variables, we performed both non-phylogenetic and phylogenetic tests.
Non-Phylogenetic Test.—We conducted con-ventional analyses treating all branches in thesupertree as cases (356 in total). Ghost lineagepercentages for each branch were assessed asexplained above, and values of the indepen-dent variables were reconstructed by usingparsimony reconstruction methods as imple-mented in Mesquite (Maddison and Maddison2007). When character reconstruction wasambiguous for binary variables (both ‘‘0’’ and‘‘1’’ values were equally parsimonious in somebranch of the tree) we used the ‘‘mostparsimonious reconstruction mode’’ and chose
those reconstructions with the most gains(changes form ‘‘0’’ to ‘‘1’’) and the fewest losses(changes from ‘‘1’’ to ‘‘0’’), and those with thefewest gains and the most losses. We carriedout our analyses for both of them (Ortolani andCaro 1996; Ortolani 1999). To gauge relation-ships between ghost lineage percentage andthe continuous and binary ecomorphologicalvariables, we used Pearson correlations andone-factor ANOVAs, respectively.
Phylogenetic Test.—Closely related speciesare more likely to share similar ecologicalfeatures because of common ancestry, so datafor different species cannot be considered asindependent points in comparative studies(Felsenstein, 1985; Harvey & Pagel, 1991).Therefore, by using the comparative methodin a phylogenetic framework, we avoid phy-logenetic biases that might be present in ourecological variables. Phylogenetic analyseswere performed using Generalized EstimatingEquations (GEE) (Paradis and Claude 2002;Paradis 2006), which incorporates speciesrelatedness as a correlation matrix and uses ageneralized linear model approach. Becausedata for these analyses must be introduced forthe tips of the tree, we calculated for each tip ofthe tree the average of the values of ghostlineage percentage of every branch leading tothat tip from the root of the tree.
Tests for Data Robustness.—It may be arguedthat some clades exhibit a great deal of ghostrange because they are all located in one partof the world or are all of a particular age,
TABLE 1. Variables used in the non-phylogenetic and the phylogenetic analyses of ghost lineage percentages.
Variable
Continuous Binary
Bodymass (Kg)
Range extension(latitude extent)
Locomotormode Diet Biomes Stenobiomy
Gallop Browser Evergreen tropical rain forest (I) Species inhabitingonly one biome
Zigzag Mixed Deciduous tropical forest (II)Bounding
gallopGrazer Savanna (II/III)
Stotting Subtropical desert (III)Climbing Mediterranean forest (IV)
Temperate evergreen forest (V)Temperate broad-leaf deciduous
forest (VI)Steppe and cold desert (VII)Boreal coniferous forest (Taiga) (VIII)Tundra (IX)
104 JUAN L. CANTALAPIEDRA ET AL.
which could be related to differential paleon-tological sampling. In order to address thisissue we conducted two different ANOVAtests. The first one compared the ghost lineagepercentages of the branches implied in theevolution of ruminant species from differentcontinents (North America, South America,Eurasia, and Africa). The second analysiscompared ghost lineage percentages amongthe branches of the ruminant phylogeny whenpruned at different ages (4, 8, 12, 16 and 20 Ma)to establish whether ghost lineages were moreimportant in some geologic ages than others.We did not use phylogenies pruned at agesolder than 20 Ma because the number ofbranches implied in the analyses would be toolow to develop statistically powerful analyses.
Furthermore, as an additional test for therobustness of the data on ghost lineage length,we performed linear regression analyses be-tween the ghost lineage percentages of thebranches and the age of their previous node. Astatistically strong relationship would indicatethat the age of the branch may influence theimportance of the ghost range in it. Weanalyzed the four continental data sets as wellas the complete data set.
Limitations of the Methods.—Because thephylogeny used for the analyses is a supertree,it could change as new phylogenetic studiesare published (see, for example, the case of thesupertree for mammalian families [Liu et al.2001; Bininda-Emonds et al. 2007]). Our resultsare therefore contingent on the degree to whichfuture studies affect the interpretation ofphylogenetic relationships within Ruminantia.Nevertheless, future variations in the topologyor higher resolution of the tree will have littleinfluence on our conclusions as long as suchchanges do not affect many branches. Takinginto account the high number of studiesHernandez Fernandez and Vrba (2005a) usedto develop the ruminant supertree, as well asthe supertree’s high consistency and retentionindices, profound changes in the topology ofthe tree are unlikely in the near future.
Another possible drawback is related to theselection of fossils for the definition of ghostlineages in every branch. Some uncertainty inthe phylogenetic relationships of extinct taxa iswarranted and the position of single taxa along
the ruminant phylogeny may affect the infer-ence of ghost lineage durations. This issue,however, is also dependent on the develop-ment of new studies on phylogenetic relation-ships of extinct ruminants, including theoccurrence of new discoveries. Such uncertain-ty cannot be accounted for in this work, butfuture reviews of our conclusions may beneeded in order to confirm their robustness.
Finally, our estimate of the duration ofghost lineages for ruminants might differsubstantially from one that considers theentire fossil record of the clade, becauseincluding more taxa and branches could leadto differences in the calculation of ghostlineages. Such a problem could be solvedby using a complete supertree, one that alsoincludes all the extinct taxa of Ruminantia.Although the development of such a newsupertree is in progress, however, it is beyondthe scope of the current study.
Results
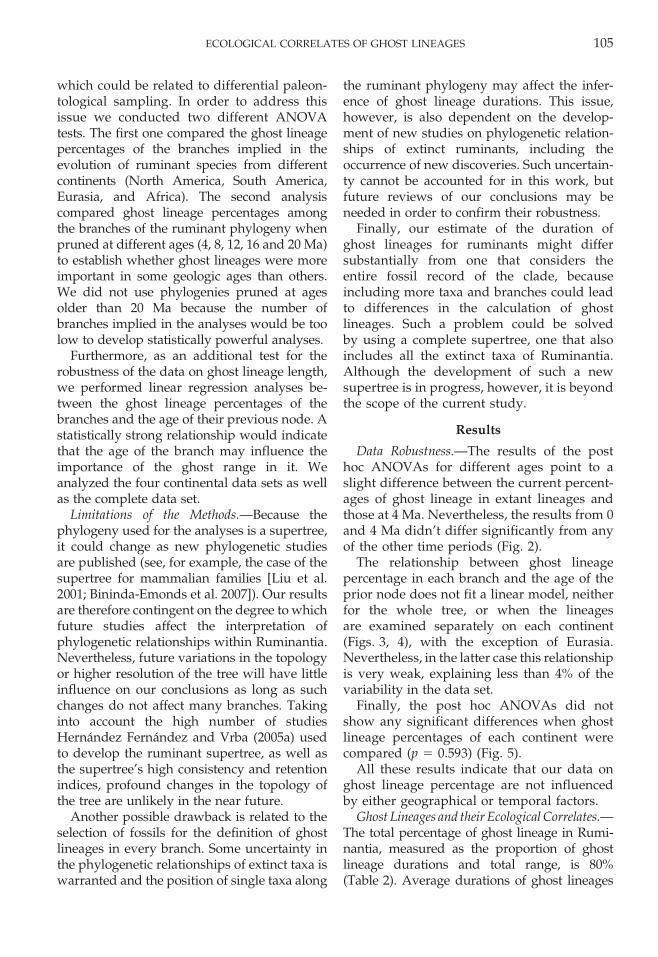
Data Robustness.—The results of the posthoc ANOVAs for different ages point to aslight difference between the current percent-ages of ghost lineage in extant lineages andthose at 4 Ma. Nevertheless, the results from 0and 4 Ma didn’t differ significantly from anyof the other time periods (Fig. 2).
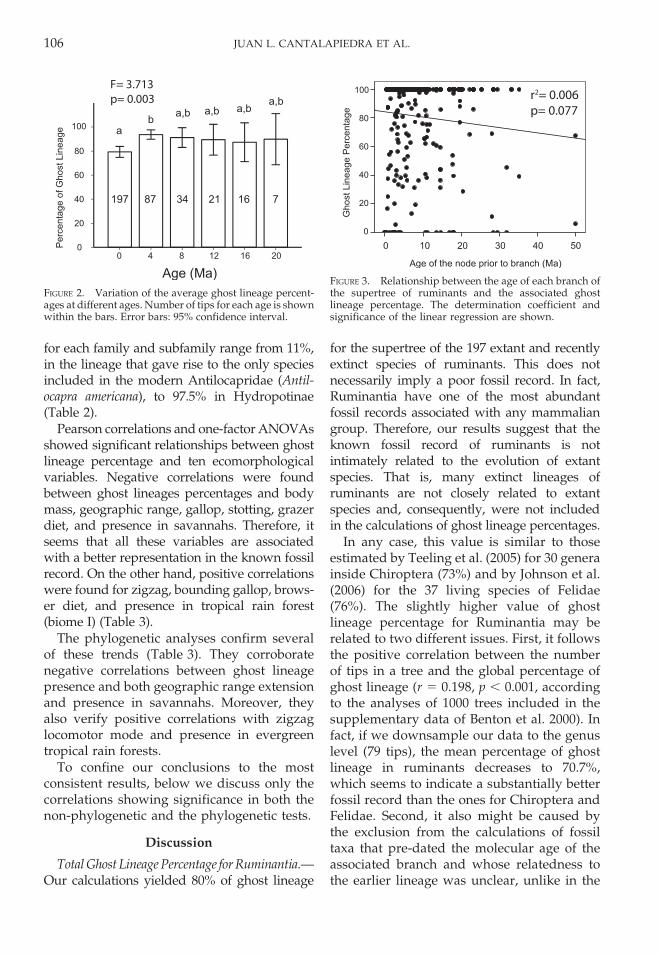
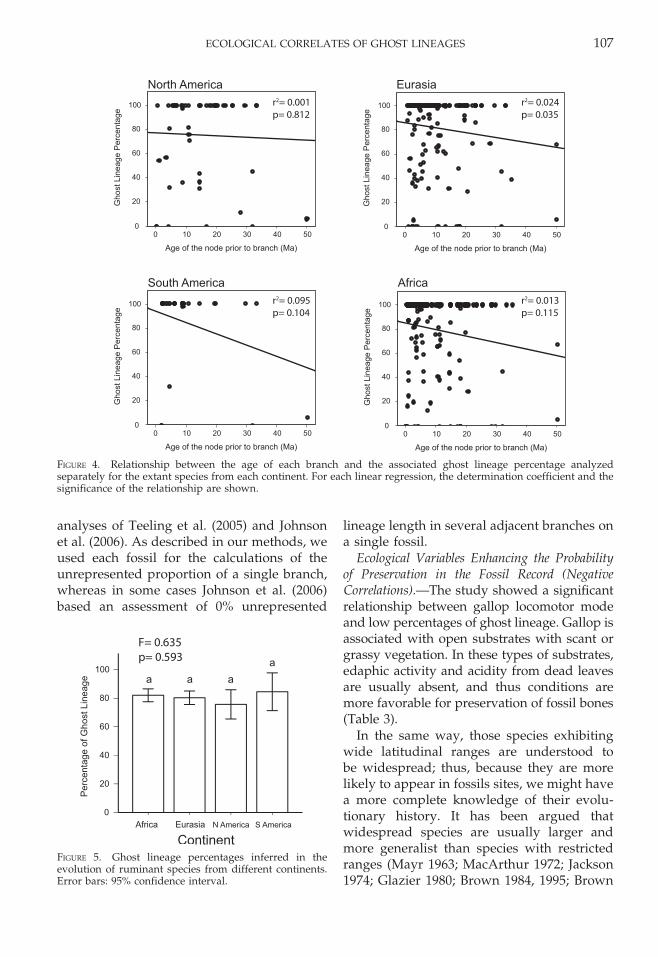
The relationship between ghost lineagepercentage in each branch and the age of theprior node does not fit a linear model, neitherfor the whole tree, or when the lineagesare examined separately on each continent(Figs. 3, 4), with the exception of Eurasia.Nevertheless, in the latter case this relationshipis very weak, explaining less than 4% of thevariability in the data set.
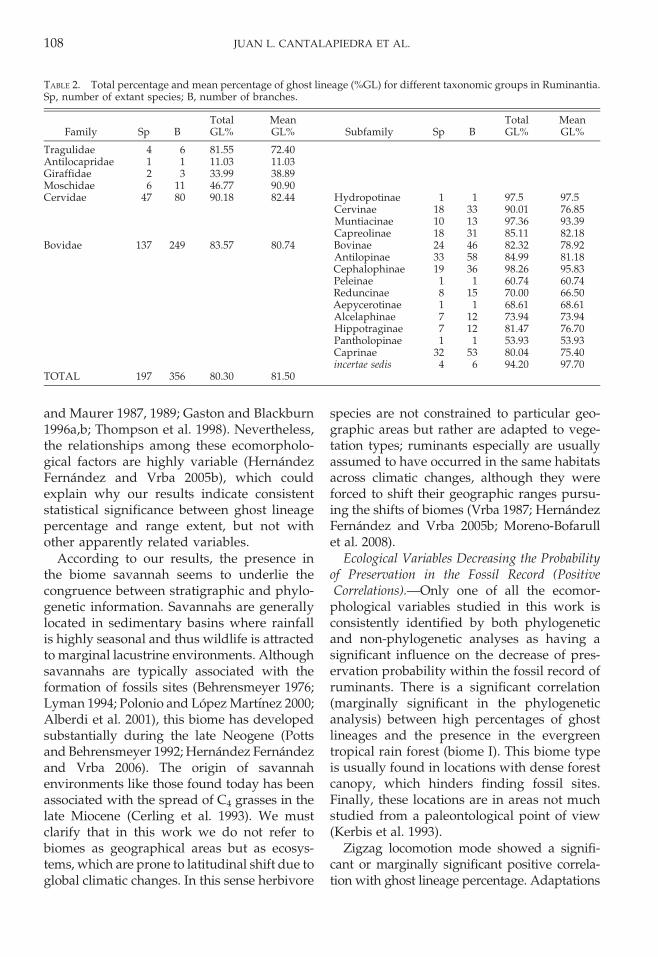
Finally, the post hoc ANOVAs did notshow any significant differences when ghostlineage percentages of each continent werecompared (p 5 0.593) (Fig. 5).
All these results indicate that our data onghost lineage percentage are not influencedby either geographical or temporal factors.
Ghost Lineages and their Ecological Correlates.—The total percentage of ghost lineage in Rumi-nantia, measured as the proportion of ghostlineage durations and total range, is 80%(Table 2). Average durations of ghost lineages
ECOLOGICAL CORRELATES OF GHOST LINEAGES 105
for each family and subfamily range from 11%,in the lineage that gave rise to the only speciesincluded in the modern Antilocapridae (Antil-ocapra americana), to 97.5% in Hydropotinae(Table 2).
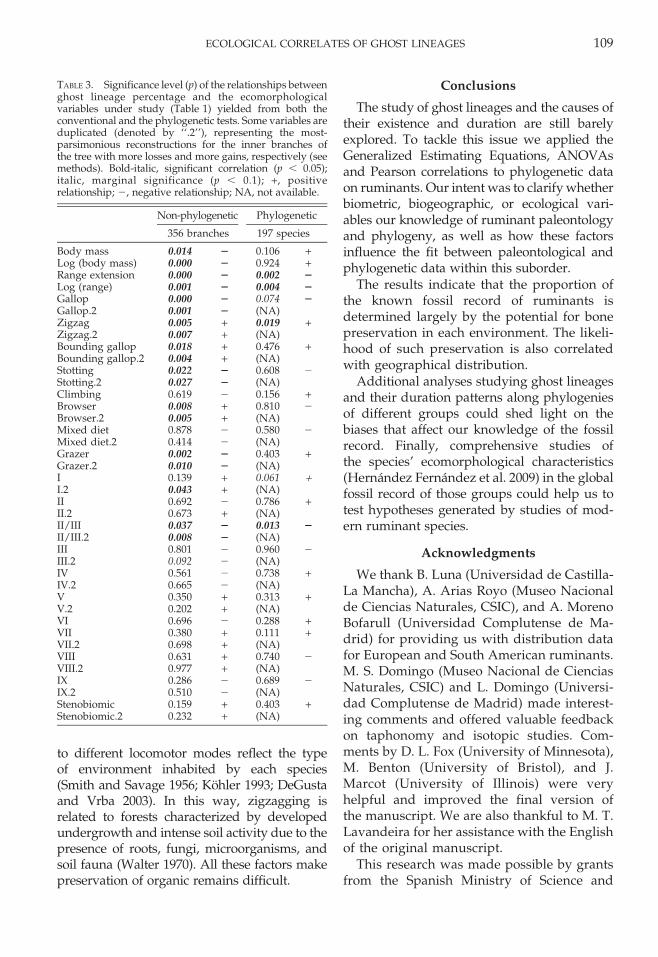
Pearson correlations and one-factor ANOVAsshowed significant relationships between ghostlineage percentage and ten ecomorphologicalvariables. Negative correlations were foundbetween ghost lineages percentages and bodymass, geographic range, gallop, stotting, grazerdiet, and presence in savannahs. Therefore, itseems that all these variables are associatedwith a better representation in the known fossilrecord. On the other hand, positive correlationswere found for zigzag, bounding gallop, brows-er diet, and presence in tropical rain forest(biome I) (Table 3).
The phylogenetic analyses confirm severalof these trends (Table 3). They corroboratenegative correlations between ghost lineagepresence and both geographic range extensionand presence in savannahs. Moreover, theyalso verify positive correlations with zigzaglocomotor mode and presence in evergreentropical rain forests.
To confine our conclusions to the mostconsistent results, below we discuss only thecorrelations showing significance in both thenon-phylogenetic and the phylogenetic tests.
Discussion
Total Ghost Lineage Percentage for Ruminantia.—Our calculations yielded 80% of ghost lineage
for the supertree of the 197 extant and recentlyextinct species of ruminants. This does notnecessarily imply a poor fossil record. In fact,Ruminantia have one of the most abundantfossil records associated with any mammaliangroup. Therefore, our results suggest that theknown fossil record of ruminants is notintimately related to the evolution of extantspecies. That is, many extinct lineages ofruminants are not closely related to extantspecies and, consequently, were not includedin the calculations of ghost lineage percentages.
In any case, this value is similar to thoseestimated by Teeling et al. (2005) for 30 generainside Chiroptera (73%) and by Johnson et al.(2006) for the 37 living species of Felidae(76%). The slightly higher value of ghostlineage percentage for Ruminantia may berelated to two different issues. First, it followsthe positive correlation between the numberof tips in a tree and the global percentage ofghost lineage (r 5 0.198, p , 0.001, accordingto the analyses of 1000 trees included in thesupplementary data of Benton et al. 2000). Infact, if we downsample our data to the genuslevel (79 tips), the mean percentage of ghostlineage in ruminants decreases to 70.7%,which seems to indicate a substantially betterfossil record than the ones for Chiroptera andFelidae. Second, it also might be caused bythe exclusion from the calculations of fossiltaxa that pre-dated the molecular age of theassociated branch and whose relatedness tothe earlier lineage was unclear, unlike in the
FIGURE 2. Variation of the average ghost lineage percent-ages at different ages. Number of tips for each age is shownwithin the bars. Error bars: 95% confidence interval.
FIGURE 3. Relationship between the age of each branch ofthe supertree of ruminants and the associated ghostlineage percentage. The determination coefficient andsignificance of the linear regression are shown.
106 JUAN L. CANTALAPIEDRA ET AL.
analyses of Teeling et al. (2005) and Johnsonet al. (2006). As described in our methods, weused each fossil for the calculations of theunrepresented proportion of a single branch,whereas in some cases Johnson et al. (2006)based an assessment of 0% unrepresented
lineage length in several adjacent branches ona single fossil.
Ecological Variables Enhancing the Probabilityof Preservation in the Fossil Record (NegativeCorrelations).—The study showed a significantrelationship between gallop locomotor modeand low percentages of ghost lineage. Gallop isassociated with open substrates with scant orgrassy vegetation. In these types of substrates,edaphic activity and acidity from dead leavesare usually absent, and thus conditions aremore favorable for preservation of fossil bones(Table 3).
In the same way, those species exhibitingwide latitudinal ranges are understood tobe widespread; thus, because they are morelikely to appear in fossils sites, we might havea more complete knowledge of their evolu-tionary history. It has been argued thatwidespread species are usually larger andmore generalist than species with restrictedranges (Mayr 1963; MacArthur 1972; Jackson1974; Glazier 1980; Brown 1984, 1995; Brown
FIGURE 4. Relationship between the age of each branch and the associated ghost lineage percentage analyzedseparately for the extant species from each continent. For each linear regression, the determination coefficient and thesignificance of the relationship are shown.
FIGURE 5. Ghost lineage percentages inferred in theevolution of ruminant species from different continents.Error bars: 95% confidence interval.
ECOLOGICAL CORRELATES OF GHOST LINEAGES 107
and Maurer 1987, 1989; Gaston and Blackburn1996a,b; Thompson et al. 1998). Nevertheless,the relationships among these ecomorpholo-gical factors are highly variable (HernandezFernandez and Vrba 2005b), which couldexplain why our results indicate consistentstatistical significance between ghost lineagepercentage and range extent, but not withother apparently related variables.
According to our results, the presence inthe biome savannah seems to underlie thecongruence between stratigraphic and phylo-genetic information. Savannahs are generallylocated in sedimentary basins where rainfallis highly seasonal and thus wildlife is attractedto marginal lacustrine environments. Althoughsavannahs are typically associated with theformation of fossils sites (Behrensmeyer 1976;Lyman 1994; Polonio and Lopez Martınez 2000;Alberdi et al. 2001), this biome has developedsubstantially during the late Neogene (Pottsand Behrensmeyer 1992; Hernandez Fernandezand Vrba 2006). The origin of savannahenvironments like those found today has beenassociated with the spread of C4 grasses in thelate Miocene (Cerling et al. 1993). We mustclarify that in this work we do not refer tobiomes as geographical areas but as ecosys-tems, which are prone to latitudinal shift due toglobal climatic changes. In this sense herbivore
species are not constrained to particular geo-graphic areas but rather are adapted to vege-tation types; ruminants especially are usuallyassumed to have occurred in the same habitatsacross climatic changes, although they wereforced to shift their geographic ranges pursu-ing the shifts of biomes (Vrba 1987; HernandezFernandez and Vrba 2005b; Moreno-Bofarullet al. 2008).
Ecological Variables Decreasing the Probabilityof Preservation in the Fossil Record (PositiveCorrelations).—Only one of all the ecomor-
phological variables studied in this work isconsistently identified by both phylogeneticand non-phylogenetic analyses as having asignificant influence on the decrease of pres-ervation probability within the fossil record ofruminants. There is a significant correlation(marginally significant in the phylogeneticanalysis) between high percentages of ghostlineages and the presence in the evergreentropical rain forest (biome I). This biome typeis usually found in locations with dense forestcanopy, which hinders finding fossil sites.Finally, these locations are in areas not muchstudied from a paleontological point of view(Kerbis et al. 1993).
Zigzag locomotion mode showed a signifi-cant or marginally significant positive correla-tion with ghost lineage percentage. Adaptations
TABLE 2. Total percentage and mean percentage of ghost lineage (%GL) for different taxonomic groups in Ruminantia.Sp, number of extant species; B, number of branches.
Family Sp BTotalGL%
MeanGL% Subfamily Sp B
TotalGL%
MeanGL%
Tragulidae 4 6 81.55 72.40Antilocapridae 1 1 11.03 11.03Giraffidae 2 3 33.99 38.89Moschidae 6 11 46.77 90.90Cervidae 47 80 90.18 82.44 Hydropotinae 1 1 97.5 97.5
Cervinae 18 33 90.01 76.85Muntiacinae 10 13 97.36 93.39Capreolinae 18 31 85.11 82.18
Bovidae 137 249 83.57 80.74 Bovinae 24 46 82.32 78.92Antilopinae 33 58 84.99 81.18Cephalophinae 19 36 98.26 95.83Peleinae 1 1 60.74 60.74Reduncinae 8 15 70.00 66.50Aepycerotinae 1 1 68.61 68.61Alcelaphinae 7 12 73.94 73.94Hippotraginae 7 12 81.47 76.70Pantholopinae 1 1 53.93 53.93Caprinae 32 53 80.04 75.40incertae sedis 4 6 94.20 97.70
TOTAL 197 356 80.30 81.50
108 JUAN L. CANTALAPIEDRA ET AL.
to different locomotor modes reflect the typeof environment inhabited by each species(Smith and Savage 1956; Kohler 1993; DeGustaand Vrba 2003). In this way, zigzagging isrelated to forests characterized by developedundergrowth and intense soil activity due to thepresence of roots, fungi, microorganisms, andsoil fauna (Walter 1970). All these factors makepreservation of organic remains difficult.
Conclusions
The study of ghost lineages and the causes oftheir existence and duration are still barelyexplored. To tackle this issue we applied theGeneralized Estimating Equations, ANOVAsand Pearson correlations to phylogenetic dataon ruminants. Our intent was to clarify whetherbiometric, biogeographic, or ecological vari-ables our knowledge of ruminant paleontologyand phylogeny, as well as how these factorsinfluence the fit between paleontological andphylogenetic data within this suborder.
The results indicate that the proportion ofthe known fossil record of ruminants isdetermined largely by the potential for bonepreservation in each environment. The likeli-hood of such preservation is also correlatedwith geographical distribution.
Additional analyses studying ghost lineagesand their duration patterns along phylogeniesof different groups could shed light on thebiases that affect our knowledge of the fossilrecord. Finally, comprehensive studies ofthe species’ ecomorphological characteristics(Hernandez Fernandez et al. 2009) in the globalfossil record of those groups could help us totest hypotheses generated by studies of mod-ern ruminant species.
Acknowledgments
We thank B. Luna (Universidad de Castilla-La Mancha), A. Arias Royo (Museo Nacionalde Ciencias Naturales, CSIC), and A. MorenoBofarull (Universidad Complutense de Ma-drid) for providing us with distribution datafor European and South American ruminants.M. S. Domingo (Museo Nacional de CienciasNaturales, CSIC) and L. Domingo (Universi-dad Complutense de Madrid) made interest-ing comments and offered valuable feedbackon taphonomy and isotopic studies. Com-ments by D. L. Fox (University of Minnesota),M. Benton (University of Bristol), and J.Marcot (University of Illinois) were veryhelpful and improved the final version ofthe manuscript. We are also thankful to M. T.Lavandeira for her assistance with the Englishof the original manuscript.
This research was made possible by grantsfrom the Spanish Ministry of Science and
TABLE 3. Significance level (p) of the relationships betweenghost lineage percentage and the ecomorphologicalvariables under study (Table 1) yielded from both theconventional and the phylogenetic tests. Some variables areduplicated (denoted by ‘‘.2’’), representing the most-parsimonious reconstructions for the inner branches ofthe tree with more losses and more gains, respectively (seemethods). Bold-italic, significant correlation (p , 0.05);italic, marginal significance (p , 0.1); +, positiverelationship; 2, negative relationship; NA, not available.
Non-phylogenetic Phylogenetic
356 branches 197 species
Body mass 0.014 2 0.106 +Log (body mass) 0.000 2 0.924 +Range extension 0.000 2 0.002 2Log (range) 0.001 2 0.004 2Gallop 0.000 2 0.074 2Gallop.2 0.001 2 (NA)Zigzag 0.005 + 0.019 +Zigzag.2 0.007 + (NA)Bounding gallop 0.018 + 0.476 +Bounding gallop.2 0.004 + (NA)Stotting 0.022 2 0.608 2Stotting.2 0.027 2 (NA)Climbing 0.619 2 0.156 +Browser 0.008 + 0.810 2Browser.2 0.005 + (NA)Mixed diet 0.878 2 0.580 2Mixed diet.2 0.414 2 (NA)Grazer 0.002 2 0.403 +Grazer.2 0.010 2 (NA)I 0.139 + 0.061 +I.2 0.043 + (NA)II 0.692 2 0.786 +II.2 0.673 + (NA)II/III 0.037 2 0.013 2II/III.2 0.008 2 (NA)III 0.801 2 0.960 2III.2 0.092 2 (NA)IV 0.561 2 0.738 +IV.2 0.665 2 (NA)V 0.350 + 0.313 +V.2 0.202 + (NA)VI 0.696 2 0.288 +VII 0.380 + 0.111 +VII.2 0.698 + (NA)VIII 0.631 + 0.740 2VIII.2 0.977 + (NA)IX 0.286 2 0.689 2
IX.2 0.510 2 (NA)Stenobiomic 0.159 + 0.403 +Stenobiomic.2 0.232 + (NA)
ECOLOGICAL CORRELATES OF GHOST LINEAGES 109
Innovation (CGL2006-01773/BTE, CGL2008-05813-C02-01/BTE and CGL2010-19116/BOS)and from the Complutensian University ofMadrid (PR1/06-14470-B). We acknowledgeadditional financial support from the UCMthrough a grant to the Research Group UCM910607 on Evolution of Cenozoic Mammalsand Continental Palaeoenvironments. Duringthe development of this research M.H.F. hada UCM contract from the Program ‘‘Ramon yCajal’’ of the Ministerio de Educacion yCiencia of Spain.
Literature Cited
Adkins, R. M., E. L. Gelke, D. Rowe, and R. L. Honeycutt. 2001.
Molecular phylogeny and divergence time estimates for major
rodent groups: evidence from multiple genes. Molecular
Biology and Evolution 18:777–791.
Alberdi, M., M. Alonso, B. Azanza, M. Hoyos, and J. Morales.
2001. Vertebrate taphonomy in circum-lake environments:
three cases in the Guadalix-Baza Basin (Granada, Spain).
Palaeogeography, Palaeoclimatology, Palaeoecology 161:1–26.
Alcalde, G., M. T. Alberdi, B. Azanza, and M. Hernandez
Fernandez. 2006. Inferencias ambientales a partir del estudio
de la locomocion en comunidades de ruminantes. Pp. 13–15 in
E. Fernandez Martınez, ed. XXII Jornadas de las Sociedad
Espanola de Paleontologıa. Leon University, Leon.
Alroy, J., C. R. Marshall, R. K. Bambach, K. Bezusko, M. Foote,
F. T. Fursich, T. A. Hansen, S. M. Holland, L. C. Ivany, D.
Jablonski, D. K. Jacobs, D. C. Jones, M. A. Kosnik, S. Lidgard, S.
Low, A. I. Miller, P. M. Novack-Gottshall, T. D. Olszewski,
M. E. Patzkowsky, D. M. Raup, K. Roy, J. J. Sepkoski Jr., M. G.
Sommes, P. J. Wagner, and A. Webber. 2001. Effects of
sampling standardization on estimates of Phanerozoic marine
diversification. Proceedings of the National Academy of
Sciences U.S.A. 98:6261–6266.
Answell, W. F. H. 1971. Order Artiodactyla. Pp. 1–84 in J. Meester
and H. W. Setzer, eds. The mammals of Africa: an identification
manual. Smithsonian Institution Press, Washington, D.C.
Behrensmeyer, A. K. 1976. Fossil assemblages in relation to
sedimentary environments in the East Rudolf succession. Pp.
383–401 in Y. Coppens, F. C. Howell, G. L. Isaac, and E. F.
Leakey, eds. Earliest man and environment in the Lake Rudolf
Basin: stratigraphy, paleoecology, and evolution. University of
Chicago Press, Chicago.
Benton, M. J., M. A. Wills, and R. Hitchin. 2000. Quality of the
fossil record through time. Nature 403:534–537.
Bininda-Emonds, O. R. P., M. Cardillo, K. E. Jones, R. D. E.
MacPhee, R. M. D. Beck, R. Grenyer, S. A. Price, R. A. Vos, J. L.
Gittleman, and A. Purvis. 2007. The delayed rise of present-day
mammals. Nature 446:507–512.
Brown, J. H. 1984. On the relationship between abundance and
distribution of species. American Naturalist 124:255–279.
———. 1995. Macroecology. University of Chicago Press, Chicago.
Brown, J. H., and B. A. Maurer. 1987. Evolution of species
assemblages: effects of energetic constraints and species
dynamics on the diversification of the North American
avifauna. American Naturalist 130:1–17.
———. 1989. Macroecology: the division of food and space
among species on continents. Science 243:1145–1150.
Cavin, L., and P. L. Forey. 2007. Using ghost lineages to identify
diversification events in the fossil record. Biology Letters
3:201–204.
Cerling, T. E., Y. Wang, and J. Quade. 1993. Expansion of C4
ecosystems as indicator of global ecological change in the late
Miocene. Nature 361:344–345.
Corbet, G. B. 1978. The mammals of the Palaearctic region: a
taxonomic review. Cornell University Press, Ithaca, N.Y.
Corbet, G. B., and J. E. Hill. 1992. The mammals of the
Indomalayan Region: a systematic review. Oxford University
Press, Oxford.
Crampton, J. S., A. G. Beu, R. A. Cooper, C. M. Jones, B. Marshall,
and P. A. Maxwell. 2003. Estimating the rock volume bias in
paleobiodiversity studies. Science 301:358–360.
DeGusta, D., and E. S. Vrba. 2003. A method for inferring
paleohabitats from the functional morphology of bovid
astragali. Journal of Archaeological Science 30:1009–1022.
DeMiguel, D., M. Fortelius, B. Azanza, and J. Morales. 2008.
Ancestral feeding state of ruminants reconsidered: earliest
grazing adaptation claims a mixed condition for Cervidae.
BMC Evolutionary Biology 8(13). doi:10.1186/1471-2148-8-13
Eisenberg, H. J. F. 1989. Mammals of the Neotropics, Vol. 1. The
northern Neotropics. University of Chicago Press, Chicago.
Eisenberg, H. J. F., and K. Redford. 2000. Mammals of the
Neotropics, Vol. 3. The central Neotropics. University of
Chicago Press, Chicago.
Gaston, K. J., and T. M. Blackburn. 1996a. Conservation
implications of geographic range size–body size relationships.
Conservation Biology 10:638–646.
———. 1996b. Range size–body size relationships: evidence of
scale dependence. Oikos 75:479–485.
Glazier, D. S. 1980. Ecological shifts and the evolution of
geographically restricted species of North American Peromyscus
(mice). Journal of Biogeography 7:63–83.
Grubb, P. 1993. Order Artiodactyla. Pp. 377–414 in D. E. Wilson
and D. M. Reeder, eds. Mammal Species of the World: a
taxonomic and geographic reference. Smithsonian Institution
Press, Washington, D.C.
Hall, E. R. 1981. The mammals of North America. Wiley, New
York.
Hartenberger, J. 1998. Description de la radiation des Rodentia
(Mammalia) du Paleocene superieur au Miocene; incidences
phylogenetiques. Comptes Rendus de l’Academie des Sciences
326:439–444.
Hernandez Fernandez, M. 2001. Bioclimatic discriminant capacity
of terrestrial mammal faunas. Global Ecology and Biogeogra-
phy 10:189–204.
Hernandez Fernandez, M., and E. S. Vrba. 2005a. A complete
estimate of the phylogenetic relationships in Ruminantia: a
dated species-level supertree of the extant ruminants. Biolog-
ical Reviews 80:269–302.
———. 2005b. Macroevolutionary processes and biomic special-
ization: testing the resource-use hypothesis. Evolutionary
Ecology 19:199–219.
———. 2005c. Rapoport effect and biomic specialization in
African mammals: revisiting the climatic variability hypothesis.
Journal of Biogeography 32:903–918.
———. 2006. Plio-Pleistocene climatic change in the Turkana
Basin (East Africa): evidence from large mammal faunas.
Journal of Human Evolution 50:595–626.
Hernandez Fernandez, M., G. M. Alcalde, D. DeMiguel, B. Garcıa-
Yelo, and B. Azanza. 2009. Functional groups in ruminants
as environmental proxies. Journal of Vertebrate Paleontology
29(Suppl. to No. 3):113.
Huchon, D., O. Madsen, M. J. Sibbald, K. Ament, M. J. Stanhope,
F. Catzeflis, W. W. de Jong, and E. J. Douzery. 2002. Rodent
phylogeny and a timescale for the evolution of glires: evidence
from an extensive taxon sampling using three nuclear genes.
Molecular Biology and Evolution 19:1053–65.
110 JUAN L. CANTALAPIEDRA ET AL.
Jackson, J. B. C. 1974. Biogeographic consequences of eurytopy
and stenotopy among marine bivalves and their evolutionary
significance. American Naturalist 108:541–560.
Johnson, W. E., E. Eizirik, J. Pecon-Slattery, W. J. Murphy, A.
Antunes, E. Teeling, and S. J. O’Brien. 2006. The late radiation
of modern Felidae: a genetic assessment. Science 311:73–77.
Kerbis, J. C., R. W. Wrangham, M. L. Carter, and H. D. Hauser.
1993. A contribution to tropical rain-forest taphonomy: retrieval
and documentation of chimpanzee remains from Kibale Forest,
Uganda. Journal of Human Evolution 25:485–514.
Kingdon, J. 1997. The Kingdon field guide to African mammals.
Academic Press, London.
Kohler, M. 1993. Skeleton and habitat of Recent and fossil
ruminants. Friedrich Pfeil, Munich.
Lane, A., C. M. Janis, and J. J. Sepkoski Jr. 2005. Estimating
paleodiversities: a test of the taxic and phylogenetic methods.
Paleobiology 31:21–34.
Liu, F. R., M. M. Miyamoto, N. P. Freire, P. Q. Ong, M. R. Tennant,
T. S. Young, and K. F. Gugel. 2001. Molecular and morpholog-
ical supertrees for eutherian (placental) mammals. Science
291:1786–1789.
Lyman, R. L. 1994. Vertebrate taphonomy. Cambridge University
Press, Cambridge.
MacArthur, R. H. 1972. Geographical ecology: patterns in the
distribution of species. Harper and Row, New York.
Maddison, W., and D. Maddison. 2007. Mesquite: a modular
system for evolutionary analysis, Version 2.0. http://mesquite
project.org
Mayr, E. 1963. Animal species and evolution. Belknap Press of
Harvard University Press, Cambridge.
McKenna, M. C., and S. K. Bell. 1997. Classification of mammals
above the species level. Columbia University Press, New York.
Mitchell-Jones, A. J., G. Amori, W. Bogdanowic, B. Krystufek, and
P. Reijnders. 1999. The atlas of European mammals. Poyser,
London.
Moreno Bofarull, A., A. Arias Royo, M. Hernandez Fernandez, E.
Ortiz-Jaurequizar, and J. Morales. 2008. Influence of continental
history on the ecological specialization and macroevolutionary
processes in the mammalian assemblage of South America:
Differences between small and large mammals. BMC Evolu-
tionary Biology 8(97). doi:10.1186/1471-2148-8-97
Norell, M. A. 1992. Taxic origin and temporal diversity: the effect
of phylogeny. Pp. 89–118 in M. J. Novacek and Q. D. Wheeler,
eds. Extinction and phylogeny. Columbia University Press,
New York.
———. 1993. Tree-based approaches to understanding history:
comments on ranks, rules, and the quality of fossil record.
American Journal of Science 293-A:407–417.
———. 1996. Ghost taxa, ancestors, and assumptions: a comment
on Wagner. Paleobiology 22:453–455.
Norell, M. A., and M. J. Novacek. 1992a. The fossil record and
evolution: comparing cladistic and paleontological evidence for
vertebrate history. Science 255:1690–1693.
———. 1992b. Congruence between superpositional and phylo-
genetic patterns: comparing cladistic patterns with fossil
record. Cladistics 8:319–337.
O’Keefe, F. R., and P. M. Sander. 1999. Paleontological paradigms
and inferences of phylogenetic pattern: a case study. Paleobi-
ology 25:518–533.
Ortolani, A. 1999. Spots, stripes, tail tips and dark eyes: predicting
the function of carnivore colour patterns using the comparative
method. Biological Journal of the Linnean Society 67:433–476.
Ortolani, A., and T. M. Caro. 1996. The adaptive significance of
color patterns in carnivores: phylogenetic tests of classic
hypotheses. Pp. 132–188 in J. L. Gittleman, ed. Carnivore behavior,
ecology, and evolution. Cornell University Press, Ithaca, N.Y.
Paradis, E. 2006. Analysis of phylogenetics and evolution with R.
Springer, New York.
Paradis, E., and J. Claude. 2002. Analysis of comparative data
using generalized estimating equations. Journal of Theoretical
Biology 218:175–185.
Paul, C. R. C. 1982. The adequacy of the fossil record. Pp. 75–117
in S. Donovan and C. R. C. Paul, eds. The adequacy of the fossil
record. Wiley, Chichester, U.K.
Pol, D., and M. A. Norell. 2006. Uncertainty in the age of fossils and
the stratigraphic fit to phylogenies. Systematic Biology 55:512–521.
Polonio, I., and N. Lopez Martınez. 2000. Analisis tafonomico de
los yacimientos de Somosaguas (Mioceno Medio, Madrid).
Coloquios de Paleontologıa 51:235–266.
Potts, R., and A. K. Behrensmeyer. 1992. Late Cenozoic terrestrial
ecosystems. Pp. 419–541 in A. K. Behrensmeyer, J. D. Damuth,
W. A. DiMichele, H. D. Sues, R. Potts, and S. L. Wing, eds.
Terrestrial ecosystems trough time. University of Chicago
Press, Chicago.
Redford, K., and H. J. F. Eisenberg. 1992. Mammals of the Neotropics,
Vol. 2. The Southern Cone. University of Chicago Press, Chicago.
Ruta, M., and M. J. Benton. 2008. Calibrated diversity, tree
topology and the mother of mass extinctions: the lesson of
temnospondyls. Paleobiology 51:1261–1288.
Sidor, C. A., and J. A. Hopson. 1998. Ghost lineages and
‘‘mammalness’’: assessing the temporal pattern of character
acquisition in the Synapsida. Paleobiology 24:254–273.
Smith, A. B. 1994. Systematics and the fossil record. Blackwell
Scientific, Oxford.
Smith, J. M., and R. J. G. Savage. 1956. Some locomotory
adaptations in mammals. Zoological Journal of the Linnean
Society 42:603–622.
Teeling, E. C., M. S. Springer, O. Madsen, P. Bates, S. J. O’Brien, and
W. J. Murphy. 2005. A molecular phylogeny for bats illuminates
biogeography and the fossil record. Science 307:580–584.
Thompson, K., J. G. Hodgson, and K. J. Gaston. 1998. Abundance-
range size relationships in the herbaceous flora of central
England. Journal of Ecology 86:439–448.
Vrba, E. S. 1987. Ecology in relation to speciation rates: some case
histories of Miocene-Recent mammal clades. Evolutionary
Ecology 1:283–300.
Vrba, E. S., and G. B. Schaller. 2000. Introduction. Pp. 1–8 in E. S.
Vrba and G. B. Schaller, eds. Antelopes, deer, and relatives:
fossil record, behavioral ecology, systematics and conservation.
Yale University Press, New Haven, Conn.
Wagner, P. J. 1995. Stratigraphic tests of cladistic hypotheses.
Paleobiology 21:153–178.
———. 2000a. Phylogenetic analyses and the fossil record: tests
and inferences, hypotheses and models. In D. H. Erwin and
S. L. Wing, eds. Deep time: Paleobiology’s perspective. Paleobi-
ology 26(Suppl. to No. 4):341–371.
———. 2000b. The quality of the fossil record and the accuracy of
phylogenetic inferences about sampling diversity. Systematic
Biology 49:65–86.
Walter, H. 1970. Vegetationszonen und Klima. Eugen Ulmer,
Stuttgart.
Weishampel, D. B. 1996. Fossils, phylogeny, and discovery: a
cladistic study of history of tree topologies and ghost lineages
durations. Journal of Vertebrate Paleontology 16:191–197.
Wills, M. A. 2002. The tree of life and the rock of ages: are we
getting better at estimating phylogeny? BioEssays 24:203–207.
Worthy, T. H., A. J. Tennyson, M. Archer, A. M. Musser, S. J.
Hand, C. Jones, B. J. Douglas, J. A. McNamara, and R. M. Beck.
2006. Miocene mammal reveals a Mesozoic ghost lineage on
insular New Zealand, southwest Pacific. Proceedings of the
National Academy of Sciences U.S.A. 103:19419–19423.
ECOLOGICAL CORRELATES OF GHOST LINEAGES 111
Branch #
Node Prior to Branch
Age of Previous
Node
Node After Branch
Age of Node After
Branch
Oldest Fossil Age of Oldest Fossil
Time Interval Branch
Age of Lineage
Ghost Lineage Duration
Ghost Lineage
%
1 4 28.4 28.4 - 0.0 28.4 28.4 100.0 2 4 28.4 28.4 - 0.0 28.4 28.4 100.0 3 3 28.4 4 28.4 28.4 - 28.4 0 28.4 0.0 4 3 28.4 28.4 - 0.0 28.4 28.4 100.0 5 2 35.2 3 28.4 35.2 - 28.4 6.8 35.2 100.0 6 2 35.2 Dorcatherium 21.4 35.2 - 0.0 35.2 13.8 39.2 7 1 50 2 35.2 Archaeotragulus 40 50.0 - 35.2 14.8 10.0 67.6 8 7 17.8 Praepalaeotragus 17.8 17.8 - 0.0 17.8 0.0 0.0 9 7 17.8 Bohlinia 9.3 17.8 - 0.0 17.8 8.5 47.8
10 6 28.1 7 17.8 Propalaeoryx/Sperrgebiotomeryx 21 28.1 - 17.8 10.3 7.1 68.9 11 6 28.1 Bedenomeryx milaloquensis 25 28.1 - 0.0 28.1 3.1 11.0 12 5 33.2 6 28.1 33.2 - 28.1 5.1 33.2 100.0 13 14 0.8 0.8 - 0.0 0.8 0.8 100.0 14 14 0.8 0.8 - 0.0 0.8 0.8 100.0 15 13 1.3 14 0.8 1.3 - 0.8 0.5 1.3 100.0 16 13 1.3 1.3 - 0.0 1.3 1.3 100.0 17 12 1.9 13 1.3 1.9 - 1.3 0.6 1.9 100.0 18 12 1.9 1.9 - 0.0 1.9 1.9 100.0 19 11 3.5 12 1.9 3.5 - 1.9 1.6 3.5 100.0 20 11 3.5 3.5 - 0.0 3.5 3.5 100.0 21 10 6.4 11 3.5 6.4 - 3.5 2.9 6.4 100.0 22 10 6.4 6.4 - 0.0 6.4 6.4 100.0 23 9 29.5 10 6.4 Dremotherium 29.5 29.5 - 6.4 23.1 0.0 0.0 24 57 2.4 2.4 - 0.0 2.4 2.4 100.0 25 57 2.4 2.4 - 0.0 2.4 2.4 100.0 26 49 9 57 2.4 9.0 - 2.4 6.6 9.0 100.0 27 56 2.4 2.4 - 0.0 2.4 2.4 100.0 28 56 2.4 2.4 - 0.0 2.4 2.4 100.0 29 49 9 56 2.4 9.0 - 2.4 6.6 9.0 100.0 30 55 2.3 2.3 - 0.0 2.3 2.3 100.0 31 55 2.3 2.3 - 0.0 2.3 2.3 100.0 32 54 3.7 55 2.3 3.7 - 2.3 1.4 3.7 100.0 33 54 3.7 3.7 - 0.0 3.7 3.7 100.0 34 53 4.7 54 3.7 4.7 - 3.7 1 4.7 100.0 35 53 4.7 4.7 - 0.0 4.7 4.7 100.0
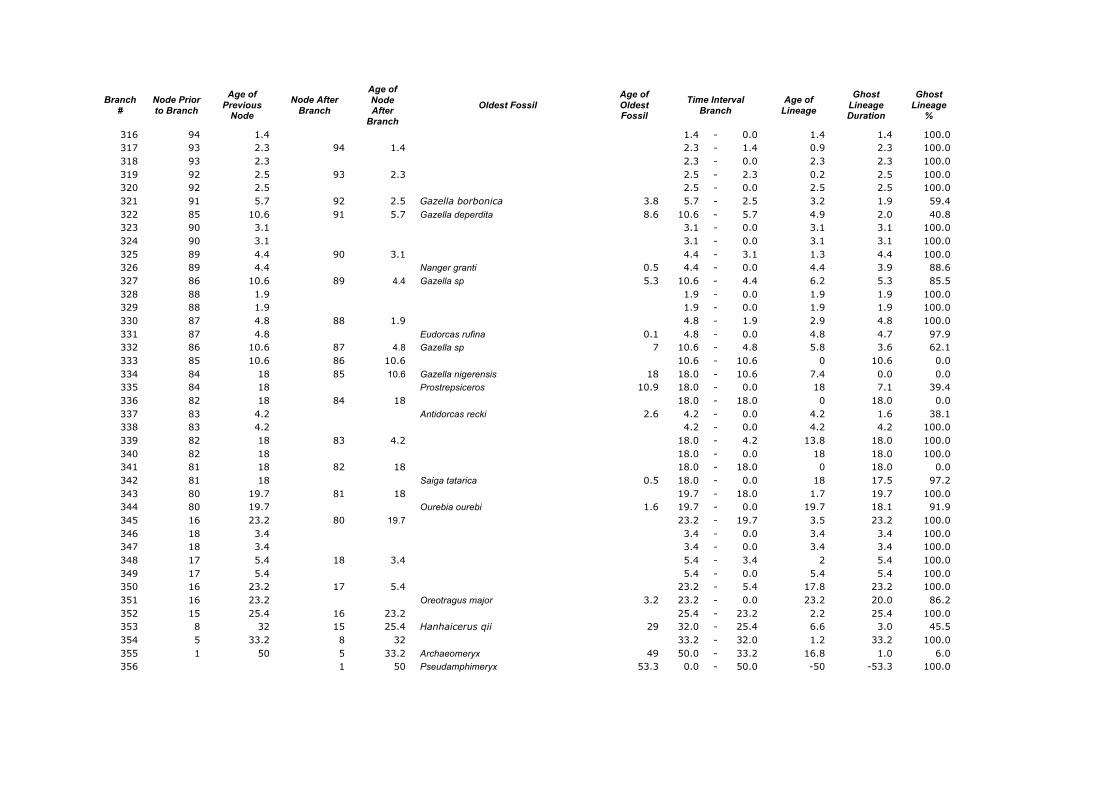
Appendix 1. Calculations of the Ghost Lineages Percentages for every branch of the supertree of Ruminantia. Age of Nodes and their numeration were taken from Hernández Fernández & Vrba (2005a). Number of branches according to Appendix 2.
Branch
# Node Prior to Branch
Age of Previous
Node
Node After Branch
Age of Node After
Branch
Oldest Fossil Age of Oldest Fossil
Time Interval Branch
Age of Lineage
Ghost Lineage Duration
Ghost Lineage
%
36 52 6.1 53 4.7 6.1 - 4.7 1.4 6.1 100.0 37 52 6.1 6.1 - 0.0 6.1 6.1 100.0 38 52 6.1 6.1 - 0.0 6.1 6.1 100.0 39 49 9 52 6.1 9.0 - 6.1 2.9 8.9 100.0 40 51 4.7 Odocoileus virginianus 3.2 4.7 - 0.0 4.7 1.5 31.9 41 51 4.7 Odocoileus hemionus 0.9 4.7 - 0.0 4.7 3.8 80.9 42 49 9 51 4.7 Odocoileus sp. 4.8 9.0 - 4.7 4.3 4.2 97.7 43 50 2 Ozotoceros 2 2.0 - 0.0 2 0.0 0.0 44 50 2 Antifer ensenadense 2 2.0 - 0.0 2 0.0 0.0 45 49 9 50 2 Eocoileus gentryorum y Bretzia pseudalces 5 9.0 - 2.0 7 4.0 57.1 46 48 10.8 49 9 10.8 - 9.0 1.8 10.8 100.0 47 48 10.8 Rangifer sp 3 10.8 - 0.0 10.8 7.8 72.2 48 45 14.6 48 10.8 14.6 - 10.8 3.8 14.6 100.0 49 47 3.4 Capreolus sussenbornensis 3 3.4 - 0.0 3.4 0.4 11.8 50 47 3.4 Caproelus caproelus 0.5 3.4 - 0.0 3.4 2.9 85.3 51 46 11 47 3.4 Procaproelus loczyi 8.1 11.0 - 3.4 7.6 2.9 38.2 52 46 11 Cervalces (Libralces) gallicus / Alcinae indet 3 11.0 - 0.0 11 8.0 72.7 53 45 14.6 46 11 14.6 - 11.0 3.6 14.6 100.0 54 26 19.4 45 14.6 19.4 - 14.6 4.8 19.4 100.0 55 44 1.4 1.4 - 0.0 1.4 1.4 100.0 56 44 1.4 1.4 - 0.0 1.4 1.4 100.0 57 43 4.1 44 1.4 4.1 - 1.4 2.7 4.1 100.0 58 43 4.1 M. muntjak 0.5 4.1 - 0.0 4.1 3.6 87.8 59 43 4.1 M. feae 0.5 4.1 - 0.0 4.1 3.6 87.8 60 42 4.8 43 4.1 4.8 - 4.1 0.7 4.8 100.0 61 42 4.8 4.8 - 0.0 4.8 4.8 100.0 62 42 4.8 4.8 - 0.0 4.8 4.8 100.0 63 42 4.8 4.8 - 0.0 4.8 4.8 100.0 64 42 4.8 M. rooselvetorum 0.1 4.8 - 0.0 4.8 4.7 97.9 65 42 4.8 M. reevesi 1.3 4.8 - 0.0 4.8 3.5 72.9 66 42 4.8 4.8 - 0.0 4.8 4.8 100.0 67 41 14.7 42 4.8 Muntiacus leilaoensis 8 14.7 - 4.8 9.9 6.7 67.7 68 41 14.7 Elaphodus cephalophus 0.5 14.7 - 0.0 14.7 14.2 96.6 69 27 14.7 41 14.7 14.7 - 14.7 0 14.7 0.0 70 40 4.2 4.2 - 0.0 4.2 4.2 100.0
Branch
# Node Prior to Branch
Age of Previous
Node
Node After Branch
Age of Node After
Branch
Oldest Fossil Age of Oldest Fossil
Time Interval Branch
Age of Lineage
Ghost Lineage Duration
Ghost Lineage
%
71 40 4.2 C. elaphus acoronatus 0.8 4.2 - 0.0 4.2 3.4 81.0 72 39 4.2 40 4.2 4.2 - 4.2 0 0.8 0.0 73 39 4.2 4.2 - 0.0 4.2 4.2 100.0 74 35 5.6 39 4.2 5.6 - 4.2 1.4 5.6 100.0 75 38 2.7 2.7 - 0.0 2.7 2.7 100.0 76 38 2.7 2.7 - 0.0 2.7 2.7 100.0 77 38 2.7 2.7 - 0.0 2.7 2.7 100.0 78 35 5.6 38 2.7 Rucervus sivalensis 3.6 5.6 - 2.7 2.9 2.0 69.0 79 37 3.5 Rusa unicolor 1.3 3.5 - 0.0 3.5 2.2 62.9 80 37 3.5 R. timorensis 0.1 3.5 - 0.0 3.5 3.4 97.1 81 37 3.5 3.5 - 0.0 3.5 3.5 100.0 82 36 3.9 37 3.5 3.9 - 3.5 0.4 3.9 100.0 83 36 3.9 3.9 - 0.0 3.9 3.9 100.0 84 35 5.6 36 3.9 5.6 - 3.9 1.7 5.6 100.0 85 34 8.4 35 5.6 8.4 - 5.6 2.8 8.4 100.0 86 34 8.4 Elaphurus bifurcatus / Arvernoceros ardei 3 8.4 - 0.0 8.4 5.4 64.3 87 28 9.9 34 8.4 9.9 - 8.4 1.5 9.9 100.0 88 33 0.8 D.c. mugharensis / Dama clactoniana 0.78 0.8 - 0.0 0.8 0.0 2.5 89 33 0.8 Dama dama tiberina 0.78 0.8 - 0.0 0.8 0.0 2.5 90 29 7 33 0.8 Megacerini-Eucladoceros o Pseudodama 3 7.0 - 0.8 6.2 4.0 64.5 91 32 0.4 0.4 - 0.0 0.4 0.4 100.0 92 32 0.4 0.4 - 0.0 0.4 0.4 100.0 93 31 0.7 32 0.4 0.7 - 0.4 0.3 0.7 100.0 94 31 0.7 0.7 - 0.0 0.7 0.7 100.0 95 30 3 31 0.7 3.0 - 0.7 2.3 3.0 100.0 96 30 3 Axis axis fossilis / Axis shansius 3 3.0 - 0.0 3 0.0 0.0 97 29 7 30 3 Axis sp./ Axis speciosus 6.2 7.0 - 3.0 4 0.8 20.0 98 28 9.9 29 7 Cervocerus 7.7 9.9 - 7.0 2.9 2.2 75.9 99 27 14.7 28 9.9 14.7 - 9.9 4.8 14.7 100.0
100 26 19.4 27 14.7 19.4 - 14.7 4.7 19.4 100.0 101 25 19.7 26 19.4 19.7 - 19.4 0.3 19.7 100.0 102 25 19.7 Hydropotes inermis / Hydropotes sp 0.5 19.7 - 0.0 19.7 19.2 97.5 103 9 29.5 25 19.7 29.5 - 19.7 9.8 29.5 100.0 104 8 32 9 29.5 Eumeryx 32 32.0 - 29.5 2.5 0.0 0.0 105 79 2.8 Tragelaphus gaudryi 2.65 2.8 - 0.0 2.8 0.2 5.4
Branch
# Node Prior to Branch
Age of Previous
Node
Node After Branch
Age of Node After
Branch
Oldest Fossil Age of Oldest Fossil
Time Interval Branch
Age of Lineage
Ghost Lineage Duration
Ghost Lineage
%
106 79 2.8 2.8 - 0.0 2.8 2.8 100.0 107 73 10.5 79 2.8 10.5 - 2.8 7.7 10.5 100.0 108 78 6 6.0 - 0.0 6 6.0 100.0 109 78 6 Tragelaphus gridei 2.8 6.0 - 0.0 6 3.2 53.3 110 110 4.7 4.7 - 0.0 4.7 4.7 100.0 111 74 6.9 78 6 6.9 - 6.0 0.9 6.9 100.0 112 77 2.6 2.6 - 0.0 2.6 2.6 100.0 113 77 2.6 2.6 - 0.0 2.6 2.6 100.0 114 75 5.4 77 2.6 5.4 - 2.6 2.8 5.4 100.0 115 76 1.6 1.6 - 0.0 1.6 1.6 100.0 116 76 1.6 1.6 - 0.0 1.6 1.6 100.0 117 75 5.4 76 1.6 Taurotragus nakuse 3.9 5.4 - 1.6 3.8 1.5 39.5 118 74 6.9 75 5.4 6.9 - 5.4 1.5 6.9 100.0 119 73 10.5 74 6.9 10.5 - 6.9 3.6 10.5 100.0 120 73 18.3 73 10.5 18.3 - 10.5 7.8 18.3 100.0 121 72 3.9 3.9 - 0.0 3.9 3.9 100.0 122 72 3.9 3.9 - 0.0 3.9 3.9 100.0 123 70 3.9 72 3.9 3.9 - 3.9 0 3.9 0.0 124 71 3.2 Bubalus teilandi 0.5 3.2 - 0.0 3.2 2.7 84.4 125 71 3.2 Bubalus palaeokerabau 1 3.2 - 0.0 3.2 2.2 68.8 126 70 3.9 71 3.2 3.9 - 3.2 0.7 3.9 100.0 127 69 11.8 70 3.9 11.8 - 3.9 7.9 11.8 100.0 128 69 11.8 Syncerus sp 2.9 11.8 - 0.0 11.8 8.9 75.4 129 62 16.9 69 11.8 16.9 - 11.8 5.1 16.9 100.0 130 68 2.5 Bos javanicus 2 2.5 - 0.0 2.5 0.5 20.0 131 68 2.5 2.5 - 0.0 2.5 2.5 100.0 132 63 7 68 2.5 Leptobos falconeri 3.1 7.0 - 2.5 4.5 3.9 86.7 133 67 0.6 Bos primigenius 0.5 0.6 - 0.0 0.6 0.1 16.7 134 67 0.6 0.6 - 0.0 0.6 0.6 100.0 135 64 5.8 67 0.6 Bos acutifrons 3.9 5.8 - 0.6 5.2 1.9 36.5 136 66 1.1 1.1 - 0.0 1.1 1.1 100.0 137 66 1.1 Bison latifrons 0.5 1.1 - 0.0 1.1 0.6 54.5 138 65 3.4 66 1.1 Bison tamanensis 2.1 3.4 - 1.1 2.3 1.3 56.5 139 65 3.4 Bos grunniers 0.9 3.4 - 0.0 3.4 2.5 73.5 140 64 5.8 65 3.4 5.8 - 3.4 2.4 5.8 100.0
Branch
# Node Prior to Branch
Age of Previous
Node
Node After Branch
Age of Node After
Branch
Oldest Fossil Age of Oldest Fossil
Time Interval Branch
Age of Lineage
Ghost Lineage Duration
Ghost Lineage
%
141 63 7 64 5.8 7.0 - 5.8 1.2 7.0 100.0 142 62 16.9 63 7 16.9 - 7.0 9.9 16.9 100.0 143 61 16.9 62 16.9 16.9 - 16.9 0 16.9 0.0 144 61 16.9 16.9 - 0.0 16.9 16.9 100.0 145 60 18.3 61 16.9 18.3 - 16.9 1.4 18.3 100.0 146 58 20.5 60 18.3 20.5 - 18.3 2.2 20.5 100.0 147 59 10.4 Tetracerus daviesi 3.6 10.4 - 0.0 10.4 6.8 65.4 148 59 10.4 Boselaphus sp 3.6 10.4 - 0.0 10.4 6.8 65.4 149 58 20.5 59 10.4 Boselaphini indet 17.6 20.5 - 10.4 10.1 2.9 28.7 150 15 25.4 58 20.5 Eotragus sansanensis 25.4 - 20.5 4.9 25.4 100.0 151 159 2.7 2.7 - 0.0 2.7 2.7 100.0 152 159 2.7 2.7 - 0.0 2.7 2.7 100.0 153 158 4.3 159 2.7 4.3 - 2.7 1.6 4.3 100.0 154 158 4.3 Capricornis sumatrensis 0.5 4.3 - 0.0 4.3 3.8 88.4 155 155 10.3 158 4.3 10.3 - 4.3 6 10.3 100.0 156 157 0.1 Naemorhedus goral 0.1 0.1 - 0.0 0.1 0.0 0.0 157 157 0.1 Naemorhedus caudatus 0.1 0.1 - 0.0 0.1 0.0 0.0 158 156 3.3 157 0.1 3.3 - 0.1 3.2 3.3 100.0 159 156 3.3 3.3 - 0.0 3.3 3.3 100.0 160 155 10.3 156 3.3 10.3 - 3.3 7 10.3 100.0 161 139 14.5 155 10.3 Rupicaprini indet 12 14.5 - 10.3 4.2 2.5 59.5 162 154 3.8 Rupicapra rupicapra 0.1 3.8 - 0.0 3.8 3.7 97.4 163 154 3.8 Rupicapra pyrenaica 0.2 3.8 - 0.0 3.8 3.6 94.7 164 153 8.8 154 3.8 8.8 - 3.8 5 8.8 100.0 165 153 8.8 Neotragoceros 5.6 8.8 - 0.0 8.8 3.2 36.4 166 139 14.5 153 8.8 Rupicaprini indet 12 14.5 - 8.8 5.7 2.5 43.9 167 152 0.2 Ovis dalli 0.2 0.2 - 0.0 0.2 0.0 0.0 168 152 0.2 Ovis canadiensis 0.2 0.2 - 0.0 0.2 0.0 0.0 169 151 0.5 152 0.2 0.5 - 0.2 0.3 0.5 100.0 170 151 0.5 Ovis nivicola 0.5 0.5 - 0.0 0.5 0.0 0.0 171 148 6.8 151 0.5 6.8 - 0.5 6.3 6.8 100.0 172 150 0.8 Ovis vignei 0.1 0.8 - 0.0 0.8 0.7 87.5 173 150 0.8 Ovis aries 0.1 0.8 - 0.0 0.8 0.7 87.5 174 149 2.7 150 0.8 2.7 - 0.8 1.9 2.7 100.0 175 149 2.7 Ovis amon 0.5 2.7 - 0.0 2.7 2.2 81.5
Branch
# Node Prior to Branch
Age of Previous
Node
Node After Branch
Age of Node After
Branch
Oldest Fossil Age of Oldest Fossil
Time Interval Branch
Age of Lineage
Ghost Lineage Duration
Ghost Lineage
%
176 148 6.8 149 2.7 6.8 - 2.7 4.1 6.8 100.0 177 140 11.3 148 6.8 Pseudotragus parvidens 8.1 11.3 - 6.8 4.5 3.2 71.1 178 147 2.4 2.4 - 0.0 2.4 2.4 100.0 179 147 2.4 2.4 - 0.0 2.4 2.4 100.0 180 142 11.1 147 2.4 11.1 - 2.4 8.7 11.1 100.0 181 146 1.8 Hemitragus jayakari 0.5 1.8 - 0.0 1.8 1.3 72.2 182 146 1.8 1.8 - 0.0 1.8 1.8 100.0 183 145 2.8 146 1.8 Hemitragus orientalis 2.8 2.8 - 1.8 1 0.0 0.0 184 145 2.8 Hemitragus bonali 0.5 2.8 - 0.0 2.8 2.3 82.1 185 143 8 145 2.8 Tossunoria 7 8.0 - 2.8 5.2 1.0 19.2 186 144 5.1 5.1 - 0.0 5.1 5.1 100.0 187 144 5.1 5.1 - 0.0 5.1 5.1 100.0 188 144 5.1 5.1 - 0.0 5.1 5.1 100.0 189 144 5.1 Capra ibex 1.3 5.1 - 0.0 5.1 3.8 74.5 190 144 5.1 5.1 - 0.0 5.1 5.1 100.0 191 144 5.1 5.1 - 0.0 5.1 5.1 100.0 192 144 5.1 5.1 - 0.0 5.1 5.1 100.0 193 144 5.1 5.1 - 0.0 5.1 5.1 100.0 194 144 5.1 5.1 - 0.0 5.1 5.1 100.0 195 143 8 144 5.1 Norbertia hellenica 5.4 8.0 - 5.1 2.9 2.6 89.7 196 142 11.1 143 8 11.1 - 8.0 3.1 11.1 100.0 197 141 11.1 142 11.1 11.1 - 11.1 0 11.1 0.0 198 141 11.1 Ammotragus lervia 0.1 11.1 - 0.0 11.1 11.0 99.1 199 140 11.3 141 11.1 11.3 - 11.1 0.2 11.3 100.0 200 139 14.5 140 11.3 Pachytragus solignaci 13.5 14.5 - 11.3 3.2 1.0 31.3 201 139 14.5 Mesenbriacerus 9.2 14.5 - 0.0 14.5 5.3 36.6 202 139 14.5 Palaeoryx 8.1 14.5 - 0.0 14.5 6.4 44.1 203 24 17.8 139 14.5 17.8 - 14.5 3.3 17.8 100.0 204 24 17.8 Qurlignoris 8.2 17.8 - 0.0 17.8 9.6 53.9 205 22 20.2 24 17.8 20.2 - 17.8 2.4 20.2 100.0 206 138 2.5 Hippotragus leucophaeus 0.6 2.5 - 0.0 2.5 1.9 76.0 207 138 2.5 Hippotragus equinus 2.5 2.5 - 0.0 2.5 0.0 0.0 208 137 8.8 138 2.5 8.8 - 2.5 6.3 8.8 100.0 209 137 8.8 Hippotragus niger 1.6 8.8 - 0.0 8.8 7.2 81.8 210 134 11 137 8.8 11.0 - 8.8 2.2 11.0 100.0
Branch
# Node Prior to Branch
Age of Previous
Node
Node After Branch
Age of Node After
Branch
Oldest Fossil Age of Oldest Fossil
Time Interval Branch
Age of Lineage
Ghost Lineage Duration
Ghost Lineage
%
211 136 2.5 2.5 - 0.0 2.5 2.5 100.0 212 136 2.5 Oryx gazella 2.5 2.5 - 0.0 2.5 0.0 0.0 213 136 2.5 2.5 - 0.0 2.5 2.5 100.0 214 135 5 136 2.5 Oryx sp 2.6 5.0 - 2.5 2.5 2.4 96.0 215 135 5 5.0 - 0.0 5 5.0 100.0 216 134 11 135 5 "Predamalis" sp Damalacra 7 11.0 - 5.0 6 4.0 66.7 217 23 17.9 134 11 17.9 - 11.0 6.9 17.9 100.0 218 133 6.2 Damaliscus pygargus 2 6.2 - 0.0 6.2 4.2 67.7 219 133 6.2 Damaliscus lunatus 0.6 6.2 - 0.0 6.2 5.6 90.3 220 132 7.7 133 6.2 7.7 - 6.2 1.5 7.7 100.0 221 132 7.7 Damalacra neanica 5.3 7.7 - 0.0 7.7 2.4 31.2 222 129 10.8 132 7.7 10.8 - 7.7 3.1 10.8 100.0 223 131 2.5 Connochaetes taurinus 2.5 2.5 - 0.0 2.5 0.0 0.0 224 131 2.5 Connochaetes africanus 1.6 2.5 - 0.0 2.5 0.9 36.0 225 129 10.8 131 2.5 Connochaetes gentry 2.7 10.8 - 2.5 8.3 8.1 97.6 226 130 3.1 Sigmoceros lichensteinii 0.5 3.1 - 0.0 3.1 2.6 83.9 227 130 3.1 Alcelaphus buselaphus 0.6 3.1 - 0.0 3.1 2.5 80.6 228 129 10.8 130 3.1 10.8 - 3.1 7.7 10.8 100.0 229 23 17.9 129 10.8 17.9 - 10.8 7.1 17.9 100.0 230 22 20.2 23 17.9 20.2 - 17.9 2.3 20.2 100.0 231 21 22.3 22 20.2 22.3 - 20.2 2.1 22.3 100.0 232 21 22.3 Aepyceros proemelampus 7 22.3 - 0.0 22.3 15.3 68.6 233 16 23.2 21 22.3 23.2 - 22.3 0.9 23.2 100.0 234 128 1.6 1.6 - 0.0 1.6 1.6 100.0 235 128 1.6 Kobus leche 0.7 1.6 - 0.0 1.6 0.9 56.3 236 127 3.5 128 1.6 3.5 - 1.6 1.9 3.5 100.0 237 127 3.5 Kobus ellipiprymnus 2.33 3.5 - 0.0 3.5 1.2 33.4 238 125 3.5 127 3.5 3.5 - 3.5 0 3.5 0.0 239 126 1.2 1.2 - 0.0 1.2 1.2 100.0 240 126 1.2 Kobus kob 1.2 1.2 - 0.0 1.2 0.0 0.0 241 125 3.5 126 1.2 3.5 - 1.2 2.3 3.5 100.0 242 122 12.7 125 3.5 Kobus presigmoidalis 7 12.7 - 3.5 9.2 5.7 62.0 243 124 3 Redunca redunca 1.7 3.0 - 0.0 3 1.3 43.3 244 124 3 Redunca arundinum 1.8 3.0 - 0.0 3 1.2 40.0 245 123 6.7 124 3 Redunca darti 2.8 6.7 - 3.0 3.7 3.9 100.0
Branch
# Node Prior to Branch
Age of Previous
Node
Node After Branch
Age of Node After
Branch
Oldest Fossil Age of Oldest Fossil
Time Interval Branch
Age of Lineage
Ghost Lineage Duration
Ghost Lineage
%
246 123 6.7 Redunca fulvorufula 2.5 6.7 - 0.0 6.7 4.2 62.7 247 122 12.7 123 6.7 12.7 - 6.7 6 12.7 100.0 248 20 13.5 122 12.7 13.5 - 12.7 0.8 13.5 100.0 249 20 13.5 Pelea sp 5.3 13.5 - 0.0 13.5 8.2 60.7 250 19 19.8 20 13.5 19.8 - 13.5 6.3 19.8 100.0 251 121 5.1 Philantomba monticola 2.5 5.1 - 0.0 5.1 2.6 51.0 252 121 5.1 5.1 - 0.0 5.1 5.1 100.0 253 106 13.5 121 5.1 13.5 - 5.1 8.4 13.5 100.0 254 120 4.6 4.6 - 0.0 4.6 4.6 100.0 255 120 4.6 4.6 - 0.0 4.6 4.6 100.0 256 116 10 120 4.6 10.0 - 4.6 5.4 10.0 100.0 257 119 4.5 4.5 - 0.0 4.5 4.5 100.0 258 119 4.5 4.5 - 0.0 4.5 4.5 100.0 259 118 7.5 119 4.5 7.5 - 4.5 3 7.5 100.0 260 118 7.5 7.5 - 0.0 7.5 7.5 100.0 261 117 8.5 118 7.5 8.5 - 7.5 1 8.5 100.0 262 117 8.5 8.5 - 0.0 8.5 8.5 100.0 263 116 10 117 8.5 10.0 - 8.5 1.5 10.0 100.0 264 107 10.8 116 10 10.8 - 10.0 0.8 10.8 100.0 265 115 1.6 1.6 - 0.0 1.6 1.6 100.0 266 115 1.6 1.6 - 0.0 1.6 1.6 100.0 267 113 3.9 115 1.6 3.9 - 1.6 2.3 3.9 100.0 268 114 0.8 0.8 - 0.0 0.8 0.8 100.0 269 114 0.8 0.8 - 0.0 0.8 0.8 100.0 270 113 3.9 114 0.8 3.9 - 0.8 3.1 3.9 100.0 271 112 7.7 113 3.9 7.7 - 3.9 3.8 7.7 100.0 272 112 7.7 7.7 - 0.0 7.7 7.7 100.0 273 109 9.8 112 7.7 9.8 - 7.7 2.1 9.8 100.0 274 111 3.2 3.2 - 0.0 3.2 3.2 100.0 275 111 3.2 3.2 - 0.0 3.2 3.2 100.0 276 110 4.7 111 3.2 4.7 - 3.2 1.5 4.7 100.0 277 110 4.7 4.7 - 0.0 4.7 4.7 100.0 278 109 9.8 110 4.7 9.8 - 4.7 5.1 9.8 100.0 279 109 9.8 9.8 - 0.0 9.8 9.8 100.0 280 108 10.2 109 9.8 10.2 - 9.8 0.4 10.2 100.0
Branch
# Node Prior to Branch
Age of Previous
Node
Node After Branch
Age of Node After
Branch
Oldest Fossil Age of Oldest Fossil
Time Interval Branch
Age of Lineage
Ghost Lineage Duration
Ghost Lineage
%
281 108 10.2 10.2 - 0.0 10.2 10.2 100.0 282 107 10.8 108 10.2 10.8 - 10.2 0.6 10.8 100.0 283 106 13.5 107 10.8 13.5 - 10.8 2.7 13.5 100.0 284 105 13.5 106 13.5 13.5 - 13.5 0 13.5 0.0 285 105 13.5 Sylvicapra gimnia 0.1 13.5 - 0.0 13.5 13.4 99.3 286 19 19.8 105 13.5 19.8 - 13.5 6.3 19.8 100.0 287 16 23.2 19 19.8 23.2 - 19.8 3.4 23.2 100.0 288 104 7.9 7.9 - 0.0 7.9 7.9 100.0 289 104 7.9 Raphicerus melanotis 0.6 7.9 - 0.0 7.9 7.3 92.4 290 104 7.9 Raphicerus campestris 1.8 7.9 - 0.0 7.9 6.1 77.2 291 103 8.9 104 7.9 8.9 - 7.9 1 8.9 100.0 292 103 8.9 8.9 - 0.0 8.9 8.9 100.0 293 80 19.7 103 8.9 19.7 - 8.9 10.8 19.7 100.0 294 102 2.7 2.7 - 0.0 2.7 2.7 100.0 295 102 2.7 2.7 - 0.0 2.7 2.7 100.0 296 100 5.3 102 2.7 5.3 - 2.7 2.6 5.3 100.0 297 101 1.4 1.4 - 0.0 1.4 1.4 100.0 298 101 1.4 1.4 - 0.0 1.4 1.4 100.0 299 100 5.3 101 1.4 5.3 - 1.4 3.9 5.3 100.0 300 80 19.7 100 5.3 Madoqua sp 7 19.7 - 5.3 14.4 12.7 88.2 301 99 3.9 3.9 - 0.0 3.9 3.9 100.0 302 99 3.9 3.9 - 0.0 3.9 3.9 100.0 303 98 6.2 99 3.9 6.2 - 3.9 2.3 6.2 100.0 304 98 6.2 6.2 - 0.0 6.2 6.2 100.0 305 80 19.7 98 6.2 Gazella schlosseri 9.3 19.7 - 6.2 13.5 10.4 77.0 306 97 1.5 Gazella tingitana 0.1 1.5 - 0.0 1.5 1.4 93.3 307 97 1.5 1.5 - 0.0 1.5 1.5 100.0 308 97 1.5 Gazella pomeli 0.8 1.5 - 0.0 1.5 0.7 46.7 309 91 5.7 97 1.5 Gazella borbonica 3.8 5.7 - 1.5 4.2 1.9 45.2 310 96 0.8 Gazella dorcas 0.1 0.8 - 0.0 0.8 0.7 87.5 311 96 0.8 0.8 - 0.0 0.8 0.8 100.0 312 93 2.3 96 0.8 2.3 - 0.8 1.5 2.3 100.0 313 95 0 Gazella gazella 0.01 0.0 - 0.0 0 0.0 0.0 314 95 0 Gazella arabica 0.01 0.0 - 0.0 0 0.0 0.0 315 94 1.4 95 0 1.4 - 0.0 1.4 1.4 100.0
Branch
# Node Prior to Branch
Age of Previous
Node
Node After Branch
Age of Node After
Branch
Oldest Fossil Age of Oldest Fossil
Time Interval Branch
Age of Lineage
Ghost Lineage Duration
Ghost Lineage
%
316 94 1.4 1.4 - 0.0 1.4 1.4 100.0 317 93 2.3 94 1.4 2.3 - 1.4 0.9 2.3 100.0 318 93 2.3 2.3 - 0.0 2.3 2.3 100.0 319 92 2.5 93 2.3 2.5 - 2.3 0.2 2.5 100.0 320 92 2.5 2.5 - 0.0 2.5 2.5 100.0 321 91 5.7 92 2.5 Gazella borbonica 3.8 5.7 - 2.5 3.2 1.9 59.4 322 85 10.6 91 5.7 Gazella deperdita 8.6 10.6 - 5.7 4.9 2.0 40.8 323 90 3.1 3.1 - 0.0 3.1 3.1 100.0 324 90 3.1 3.1 - 0.0 3.1 3.1 100.0 325 89 4.4 90 3.1 4.4 - 3.1 1.3 4.4 100.0 326 89 4.4 Nanger granti 0.5 4.4 - 0.0 4.4 3.9 88.6 327 86 10.6 89 4.4 Gazella sp 5.3 10.6 - 4.4 6.2 5.3 85.5 328 88 1.9 1.9 - 0.0 1.9 1.9 100.0 329 88 1.9 1.9 - 0.0 1.9 1.9 100.0 330 87 4.8 88 1.9 4.8 - 1.9 2.9 4.8 100.0 331 87 4.8 Eudorcas rufina 0.1 4.8 - 0.0 4.8 4.7 97.9 332 86 10.6 87 4.8 Gazella sp 7 10.6 - 4.8 5.8 3.6 62.1 333 85 10.6 86 10.6 10.6 - 10.6 0 10.6 0.0 334 84 18 85 10.6 Gazella nigerensis 18 18.0 - 10.6 7.4 0.0 0.0 335 84 18 Prostrepsiceros 10.9 18.0 - 0.0 18 7.1 39.4 336 82 18 84 18 18.0 - 18.0 0 18.0 0.0 337 83 4.2 Antidorcas recki 2.6 4.2 - 0.0 4.2 1.6 38.1 338 83 4.2 4.2 - 0.0 4.2 4.2 100.0 339 82 18 83 4.2 18.0 - 4.2 13.8 18.0 100.0 340 82 18 18.0 - 0.0 18 18.0 100.0 341 81 18 82 18 18.0 - 18.0 0 18.0 0.0 342 81 18 Saiga tatarica 0.5 18.0 - 0.0 18 17.5 97.2 343 80 19.7 81 18 19.7 - 18.0 1.7 19.7 100.0 344 80 19.7 Ourebia ourebi 1.6 19.7 - 0.0 19.7 18.1 91.9 345 16 23.2 80 19.7 23.2 - 19.7 3.5 23.2 100.0 346 18 3.4 3.4 - 0.0 3.4 3.4 100.0 347 18 3.4 3.4 - 0.0 3.4 3.4 100.0 348 17 5.4 18 3.4 5.4 - 3.4 2 5.4 100.0 349 17 5.4 5.4 - 0.0 5.4 5.4 100.0 350 16 23.2 17 5.4 23.2 - 5.4 17.8 23.2 100.0 351 16 23.2 Oreotragus major 3.2 23.2 - 0.0 23.2 20.0 86.2 352 15 25.4 16 23.2 25.4 - 23.2 2.2 25.4 100.0 353 8 32 15 25.4 Hanhaicerus qii 29 32.0 - 25.4 6.6 3.0 45.5 354 5 33.2 8 32 33.2 - 32.0 1.2 33.2 100.0 355 1 50 5 33.2 Archaeomeryx 49 50.0 - 33.2 16.8 1.0 6.0 356 1 50 Pseudamphimeryx 53.3 0.0 - 50.0 -50 -53.3 100.0
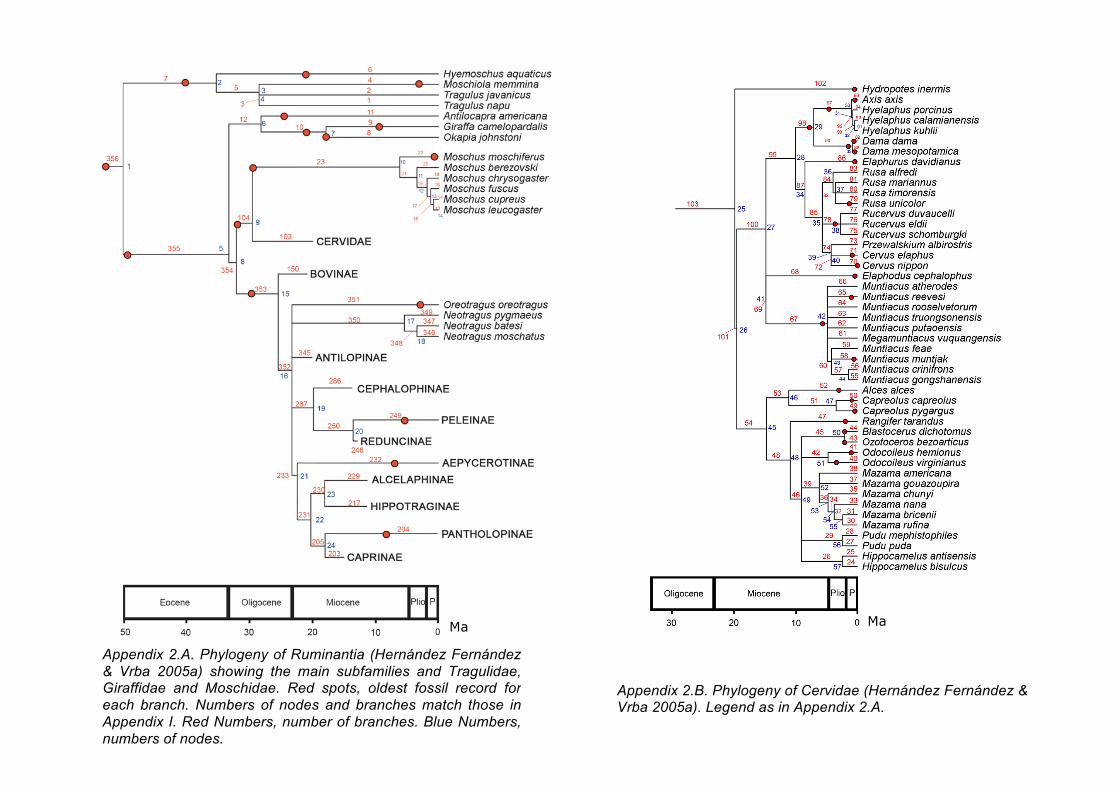
Appendix 2.A. Phylogeny of Ruminantia (Hernández Fernández & Vrba 2005a) showing the main subfamilies and Tragulidae, Giraffidae and Moschidae. Red spots, oldest fossil record for each branch. Numbers of nodes and branches match those in Appendix I. Red Numbers, number of branches. Blue Numbers, numbers of nodes.
Appendix 2.B. Phylogeny of Cervidae (Hernández Fernández & Vrba 2005a). Legend as in Appendix 2.A.
Ma Ma
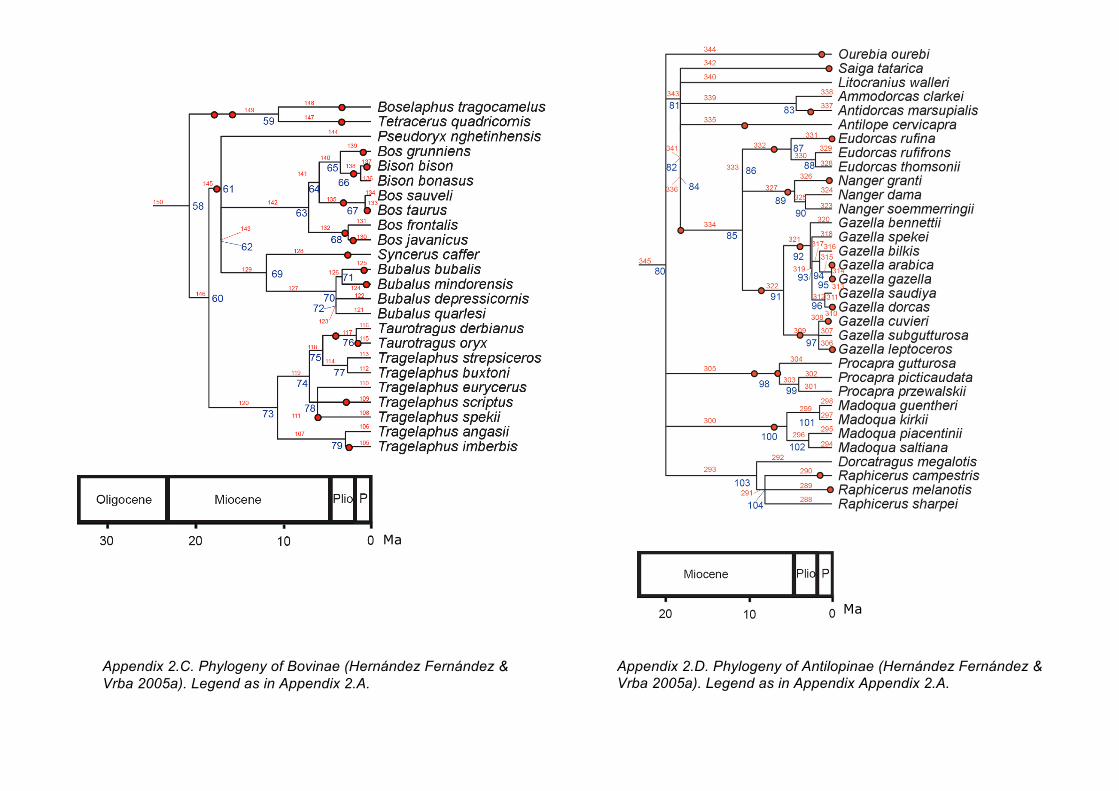
Appendix 2.C. Phylogeny of Bovinae (Hernández Fernández & Vrba 2005a). Legend as in Appendix 2.A.
Appendix 2.D. Phylogeny of Antilopinae (Hernández Fernández & Vrba 2005a). Legend as in Appendix Appendix 2.A.
Ma
Ma
Ma
Ma
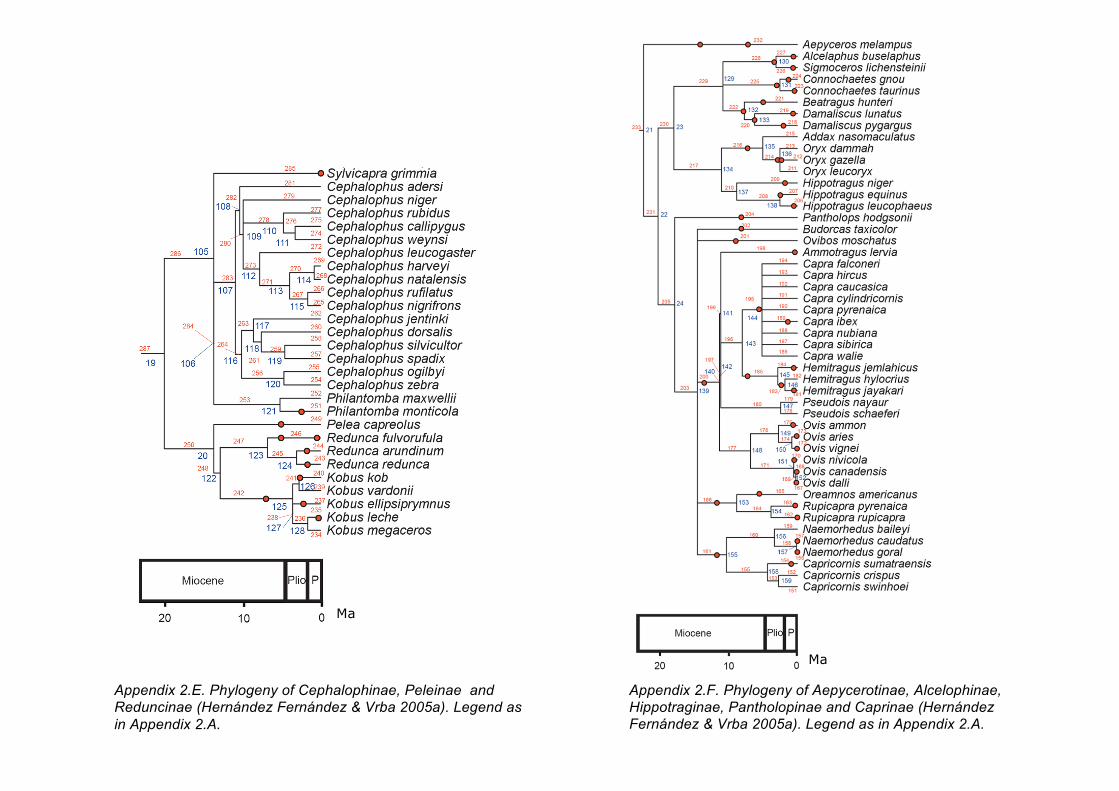
Appendix 2.E. Phylogeny of Cephalophinae, Peleinae and Reduncinae (Hernández Fernández & Vrba 2005a). Legend as in Appendix 2.A.
Appendix 2.F. Phylogeny of Aepycerotinae, Alcelophinae, Hippotraginae, Pantholopinae and Caprinae (Hernández Fernández & Vrba 2005a). Legend as in Appendix 2.A.
Ma
Ma
Related Documents


