I Ecological consequences of non-native parasites for native UK fishes Josephine Pegg This thesis has been submitted in partial fulfilment of the requirements of the degree of Doctor of Philosophy Bournemouth University October 2015

Welcome message from author
This document is posted to help you gain knowledge. Please leave a comment to let me know what you think about it! Share it to your friends and learn new things together.
Transcript
I
Ecological consequences of non-native parasites for native
UK fishes
Josephine Pegg
This thesis has been submitted in partial fulfilment of the
requirements of the degree of Doctor of Philosophy
Bournemouth University
October 2015
II
This copy of the thesis has been supplied on condition that anyone who consults it is
understood to recognise that its copyright rests with its author and due
acknowledgement must always be made of the use of any material contained in, or
derived from, this thesis.
III
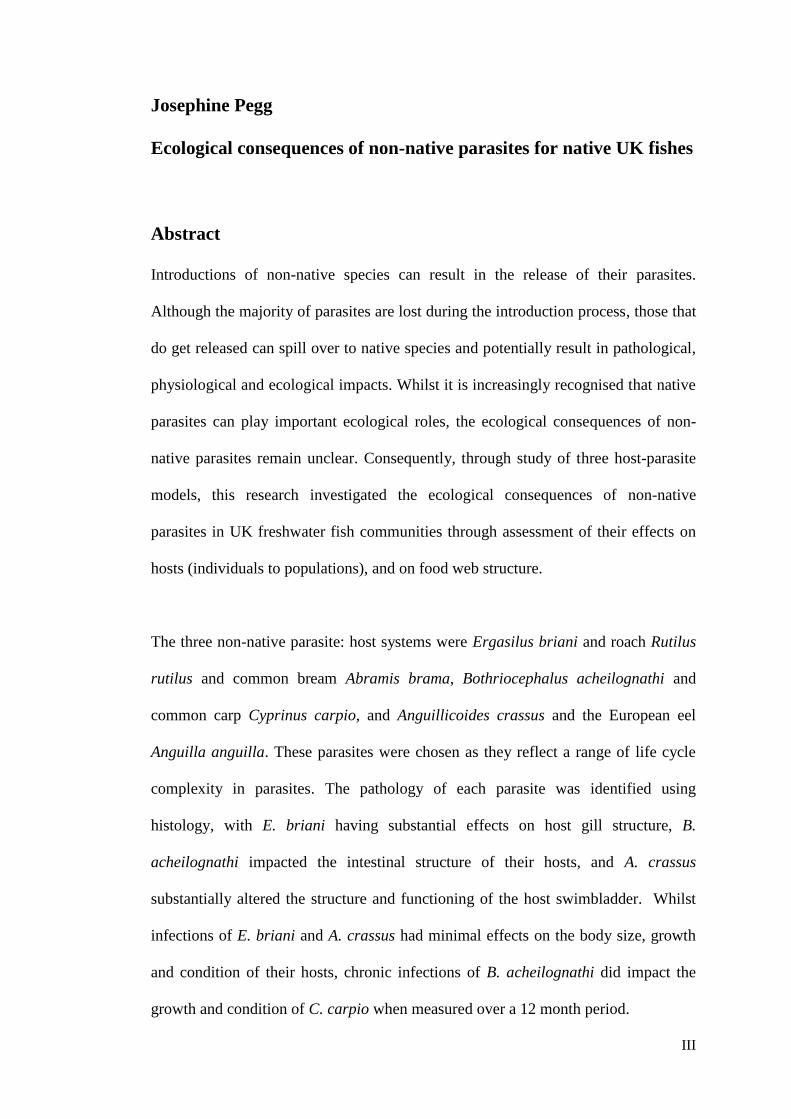
Josephine Pegg
Ecological consequences of non-native parasites for native UK fishes
Abstract
Introductions of non-native species can result in the release of their parasites.
Although the majority of parasites are lost during the introduction process, those that
do get released can spill over to native species and potentially result in pathological,
physiological and ecological impacts. Whilst it is increasingly recognised that native
parasites can play important ecological roles, the ecological consequences of non-
native parasites remain unclear. Consequently, through study of three host-parasite
models, this research investigated the ecological consequences of non-native
parasites in UK freshwater fish communities through assessment of their effects on
hosts (individuals to populations), and on food web structure.
The three non-native parasite: host systems were Ergasilus briani and roach Rutilus
rutilus and common bream Abramis brama, Bothriocephalus acheilognathi and
common carp Cyprinus carpio, and Anguillicoides crassus and the European eel
Anguilla anguilla. These parasites were chosen as they reflect a range of life cycle
complexity in parasites. The pathology of each parasite was identified using
histology, with E. briani having substantial effects on host gill structure, B.
acheilognathi impacted the intestinal structure of their hosts, and A. crassus
substantially altered the structure and functioning of the host swimbladder. Whilst
infections of E. briani and A. crassus had minimal effects on the body size, growth
and condition of their hosts, chronic infections of B. acheilognathi did impact the
growth and condition of C. carpio when measured over a 12 month period.
IV
Differences in the trophic ecology of the infected and uninfected components of the
host populations were identified using stable isotope analysis and associated metrics,
and revealed considerable differences in the trophic niche breadth of the infected and
uninfected fish. In the component infected with E. briani, their trophic niche was
constricted, indicating diet specialisation and a shift to feeding on less motile food
items. For C. carpio infected with B. acheilognathi, their niche shifted away that of
uninfected fish as they fed on higher proportions of planktonic prey resources.
Whilst differences in the trophic ecology of infected and uninfected A. anguilla were
apparent, this related to differences in their functional morphology that enabled the
infected eels to prey upon greater proportions of fish paratenic hosts that resulted in
their higher rates of infection.
The wider ecological consequences of the introduced parasite were then investigated
using topological and weighted food webs. The topological webs revealed that
lifecycle and host specificity were important factors in how each parasite impacted
the food web metrics, but in all cases the combined effects of including native
parasites in food web structure exceeded that of adding the non-native parasite.
However, weighting these food webs by using the dietary data outlined above
revealed that these infections were predicted to have greater consequences than
predicted topologically, and enabled scenarios of differing parasite prevalence and
environmental change to be tested on food web metrics. These revealed that under
increasing nutrient enrichment, infected individuals generally benefit via having
access to greater food resources, a counter-intuitive resulting from increased algal
biomass.
V
Thus, this research revealed that introductions of non-native parasites have
pathological and ecological consequences for their host populations that have
measurable effects at the food web level. These outputs have important implications
for the management of non-native parasites and their free-living hosts, and should be
incorporated into risk-management and policy frameworks.
VI
Table of Contents
1. Introduction .......................................................................................... 1
1.1 Introductions of non-native fish ..................................................................... 1
1.2 Arrival of parasites with introduced free-living species ................................ 3
1.3 How many non-native parasites arrive with free-living non-native hosts? ... 4
1.4 Infections by non-native parasites in their new range ................................... 6
1.5 Parasites in infectious food webs ................................................................... 7
1.6 Parasites affect ecosystem structure............................................................. 10
1.7 Parasites: consequences from individual hosts to ecosystems ..................... 11
1.8 Focal Parasites ............................................................................................. 12
1.9 Definitions of terminology ........................................................................... 18
1.10 Research aim and objectives ........................................................................ 20
1.11 Thesis structure ............................................................................................ 21
2. Consistent patterns of trophic niche specialisation in host
populations infected with a non-native parasite .................................................... 23
2.1 Abstract ........................................................................................................ 23
2.2 Introduction .................................................................................................. 24
2.3 Materials and Methods ................................................................................. 26
2.3.1 Sample collection and initial data collection ............................................... 26
2.3.2 Histopathology ............................................................................................ 30
2.3.3 Data analyses ............................................................................................... 31
2.3.4 Statistical analyses ....................................................................................... 32
2.4 Results .......................................................................................................... 33
2.4.1 Parasite prevalence and abundance, and effect on fish length and weight .. 33
VII
2.4.2 Histopathology ............................................................................................ 36
2.4.3 Stable isotope metrics .................................................................................. 39
2.5 Discussion .................................................................................................... 45
3. Temporal changes in growth, condition and trophic niche in
juvenile Cyprinus carpio infected with a non-native parasite .............................. 50
3.1 Abstract ........................................................................................................ 51
3.2 Introduction .................................................................................................. 51
3.3 Methods........................................................................................................ 54
3.3.1 Sample collection and initial data collection ............................................... 54
3.3.2 Histopathology ............................................................................................ 57
3.3.3 Data analyses ............................................................................................... 57
3.3.4 Statistical analyses ....................................................................................... 59
3.4 Results .......................................................................................................... 59
3.4.1 Parasite prevalence and abundance ............................................................. 59
3.4.2 Histopathology ............................................................................................ 62
3.4.3 Effect of infection on fish length and condition .......................................... 64
3.4.4 Stable isotope metrics .................................................................................. 66
3.5 Discussion .................................................................................................... 71
4. Head morphology and piscivory of European eels, Anguilla
anguilla, predict their probability of infection by the invasive parasite parasitic
nematode Anguillicoloides crassus .......................................................................... 75
4.1 Abstract ........................................................................................................ 76
4.2 Introduction .................................................................................................. 77
VIII
4.3 Methods........................................................................................................ 80
4.3.1 Sample collection and initial data collection ............................................... 80
4.3.2 Data analysis ................................................................................................ 84
4.3.3 Statistical analysis ....................................................................................... 86
4.4 Results .......................................................................................................... 88
4.5 Discussion .................................................................................................... 98
5. Consequences of non-native parasites for topological food webs 104
5.1 Abstract ...................................................................................................... 104
5. 2 Introduction ................................................................................................ 105
5.2.1 Topological food webs and parasites ........................................................ 105
5.2.2 Food web metrics to measure ecological parameters ................................ 107
5.2.3 Aims and objectives .................................................................................. 110
5. 3 Materials and methods ............................................................................... 111
5.3.1 Modelling the topological food web, data used to build food web ........... 111
5.3.2 Preparing data for modelling ..................................................................... 113
5.3.3 Food web modelling using igraph ............................................................. 114
5.3.4 Model finalisation ...................................................................................... 115
5.3.5 Modelled scenarios .................................................................................... 116
5. 4 Results ....................................................................................................... 117
5.4.1 Site 1, Ergasilus briani ............................................................................... 117
5.4.2 Site 2, Bothriocephalus acheilognathi ....................................................... 122
5.4.3 Site 3, Anguillicoides crassus .................................................................... 126
5.4.4 Model web with theoretical parasites ........................................................ 130
IX
5. 5 Discussion .................................................................................................. 133
6. Weighted food webs to predict the outcomes of interactions of non-
native parasite infection and environmental change .......................................... 138
6.1 Abstract ...................................................................................................... 138
6.2 Introduction ................................................................................................ 139
6.2.1 Weighted food webs .................................................................................. 139
6.2.2 Stable isotopes as a means of gathering food web information ................ 140
6.2.3 Maintaining food web equilibrium and impact of introducing non-native
species ……………………………………………………………………….…..141
6.2.4 Non-native parasites in a disturbed system ............................................... 143
6.2.5 Aim and objectives .................................................................................... 144
6.3 Materials and Methods .............................................................................. 145
6.3.1 Data used to build food web ...................................................................... 145
6.3.2 Preparing the data for modelling ............................................................... 146
6.3.3 Food web modelling using igraph ............................................................. 148
6.3.4 Metrics measured ...................................................................................... 149
6.3.5 Predictive modelling of scenarios ............................................................. 149
6.4 Results ....................................................................................................... 152
6.4.1 Site 1: Ergasilus briani .............................................................................. 152
6.4.2 Site 2: Bothriocephalus acheilognathi ....................................................... 160
6.5 Discussion ................................................................................................. 168
7. Discussion .......................................................................................... 172
7.1 Introduced parasites (Chapter 1) ............................................................... 172
X
7.2 Individual host consequences of non-native fish parasites (Chapters 2, 3 and
4) …………………………………………………………………… …….173
7.2.1 Pathology ................................................................................................... 174
7.2.2 Host growth and condition ........................................................................ 175
7.3 Trophic consequences of infection at the population level (Chapters 2 and
3) ……………………………………………………………………………175
7.4 Does trophic niche impact the probability of infection? (Chapter 4) ........ 177
7.5 Infectious food webs (Chapters 5 and 6) ................................................... 178
7.6 Management of non-native parasites ......................................................... 180
7.7 Potential short-comings of the research approach ..................................... 182
7.8 Future directions ........................................................................................ 184
8. References ......................................................................................... 189
Appendix 1. Post-mortem examination methodology ........................................... ii
Appendix 2. Lists of species and functional species used in topological food
webs in Chapter 5 ....................................................................................................... v
Appendix 3. Food web matrices for topological webs in Chapter 5 ..................... ix
Appendix 4. Additional data used to construct diet niches in Chapter 6 ........... xii
Appendix 5. Weighted start matrices used in Chapter 6 .................................... xiii
Appendix 6. Published papers ......................................................................... xv

XI
List of Figures
Figure 1.1 Lifecycle of Ergasilus briani ............................................................... 14
Figure 1.2 Lifecycle of Bothriocephalus acheilognathi ........................................ 16
Figure 1.3 Lifecycle of Anguillicoides crassus ..................................................... 17
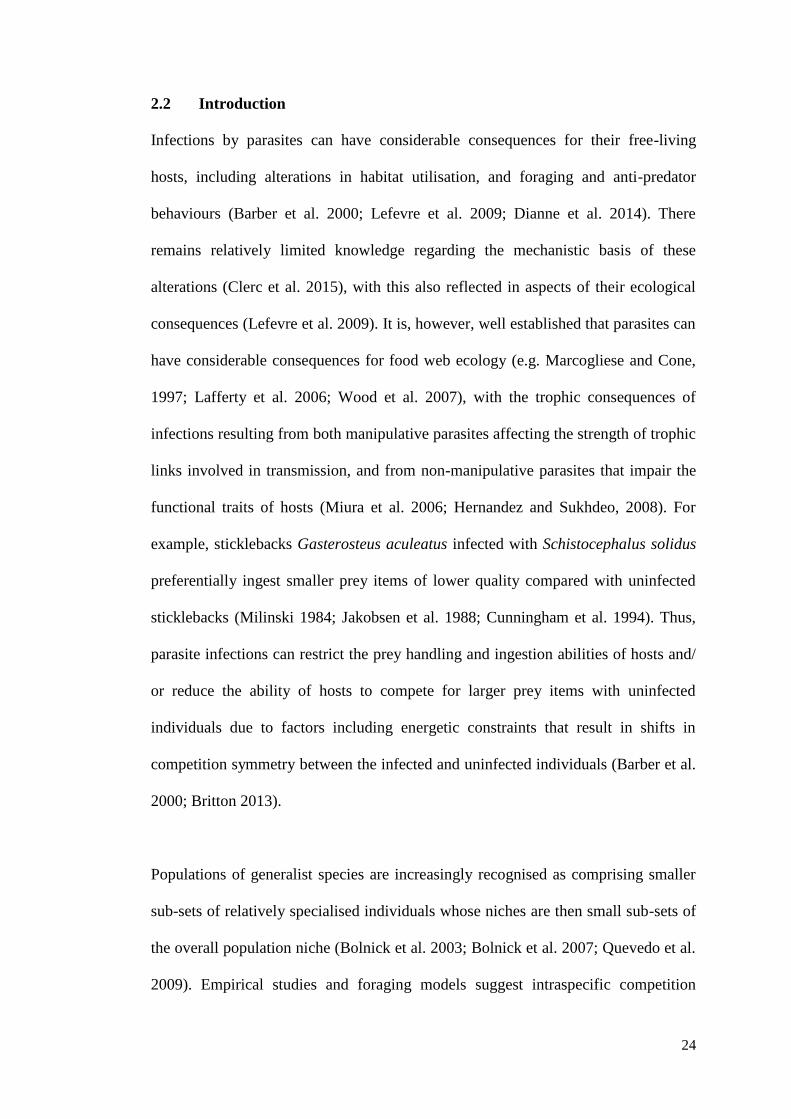
Figure 2.1 Site 1, Section of the Basingstoke canal. (Photograph by Ronn Strutt).
………………………………………………………………………..27
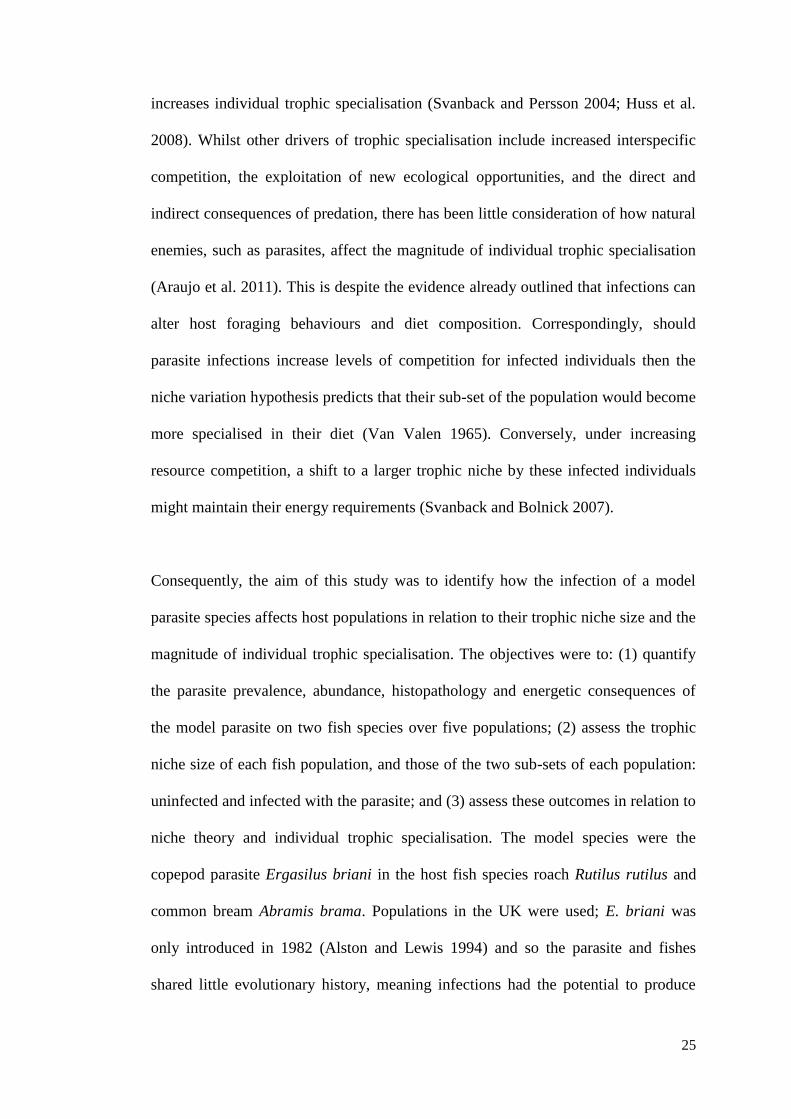
Figure 2.2 Site 2, Henleaze Lake, October 2013. In the foreground are the
swimming platforms and diving boards used by swimmers, the portion of the lake
reserved for angling starts beyond the large willow on the right. .............................. 27
Figure 2.3 Site 3, Darwell Reservoir, October 2013. ............................................ 28
Figure 2.4 Pathology of Rutilus rutilus infected with Ergasilus briani. .............. 38
Figure 2.5 Trophic niche width (as standard ellipse area, SEAc) of infected and
uninfected Abramis brama and Rutilus rutilus from Site 1. a) A. brama sampled May
2012, b) R. rutilus sampled October 2014. The black line represents the infected
individuals and the grey line represents uninfected individuals. ............................... 41
Figure 2.6 Trophic niche width (as standard ellipse area, SEAc) of infected and
uninfected Abramis brama and Rutilus rutilus from Site 2. The black line represents
the infected individuals and the grey line represents uninfected individuals. ............ 42
Figure 2.7 Trophic niche width (as standard ellipse area, SEAc) of infected and
uninfected Abramis brama and Rutilus rutilus from Site 3. The black line represents
the infected individuals and the grey line represents uninfected individuals. ............ 43
Figure 3.1 Study site, with the Greater London conurbation in the background. . 55
Figure 3.2 Pathology of Cyprinus carpio infected with Bothriocephalus
acheilognathi ……………………………………………………………………….63
XII
Figure 3.3 Length frequency histograms of infected (black) and uninfected (white)
C. carpio, in: (a) October 2012, n = 23; (b) April 2013, n = 24; and (c) October 2013,
n = 25. ………………………………………………………………………..65
Figure 3.4 Fulton’s condition factor (K) of infected (black circles) and uninfected
(white circles) C. carpio over the study period. Error bars represent standard error. 66
Figure 3.5 Trophic niche width (as standard ellipse area, SEAc) of infected and
uninfected C. carpio sampled in a) October 2012, b) April 2013 and c) October
2013. The black circles mark the infected individuals and the black line the SEAc of
infected individuals. The white circles mark the uninfected individuals and the grey
line represents the SEAc of uninfected individuals. .................................................. 70
Figure 4.1 River Huntspill study site: a typical section showing the river’s
uniform channel. ........................................................................................................ 80
Figure 4.2 The survey site on the St Ives chub stream. ......................................... 81
Figure 4.3 Study section of the River Frome (Photograph by Phil Williams). ..... 81
Figure 4.4 Adult female Anguillicoides crassus in a swim bladder. The while
patches on the parasite’s body are gonads. (Photograph by Chris Williams). ........... 84
Figure 4.5 Relationship between head width and total length (HW:TL) ratio and
estimated extent of piscivory in the diet of Anguilla anguilla in all sites (×), where
the solid line represents the significant relationship between the variables according
to linear regression, and for Sites 1 to 3 according to their infection status by
Anguillicoloides crassus (infected: ●; uninfected: ○). ............................................... 90
Figure 4.6 Stable isotope bi-plots of infected (●) and uninfected Anguilla anguilla
(○) at each site. Black ellipses represent the trophic niche size (as standard ellipse
area) of infected eels and grey ellipses represent those of uninfected eel. Note
different X and Y axes values for the sites. ............................................................... 93
XIII
Figure 5.1 Example of the structure of a network matrix as used in this study .. 114
Figure 5.2a Food web of Site 1 free-living species (blue circles), native parasites
(yellow circles) and the non-native parasite Ergasilus briani (red circle) ............... 119
Figure 5.2b Food web of Site 1 free-living species (blue circles) and native
parasites (yellow circles) .......................................................................................... 120
Figure 5.2c Food web of Site 1 free-living species. .............................................. 121
Figure 5.3a Food web of Site 2 free-living species (blue circles), native parasites
(yellow circles) and the non-native parasite Bothriocephalus acheilognathi (red
circle) ………………………………………………………………………123
Figure 5.3b Food web of Site 2 free-living species (blue circles) and native
parasites (yellow circles) .......................................................................................... 124
Figure 5.3c Food web of Site 2 free-living species ............................................... 125
Figure 5.4a Food web of Site 3 free-living species (blue circles), native parasites
(yellow circles) and the non-native parasite Anguillicoides crassus (red circle) ..... 127
Figure 5.4b Food web of Site 3 free-living species (blue circles) and native
parasites (yellow circles) .......................................................................................... 128
Figure 5.4c Food web of Site 3 free-living species ............................................... 129
Figure 5.5a Basic theoretical model web of free-living species............................ 131
Figure 5.5b Basic model web with the addition of two parasites with direct
lifecycles and high host specificity. ......................................................................... 131
Figure 5.5c Basic model web with the addition of two trophically-transmitted
parasites with complex lifecycles and multiple hosts .............................................. 132
Figure 6.1 Example of the structure of a proportional network matrix ............... 147
Figure 6.2 Example of weighted food webs created based on stable isotope
feeding niche data. a) is a food web in which no R. rutilus and A. brama, are infected
XIV
with E. briani b) is a food web in which 100% of both R. rutilus and A. brama are
infected with E. briani. Each line represents 1% of the species’ or group’s diet. ... 154
Figure 6.3 Changes in the proportion of the total biomass of the food web
contributed by the first (producers) (dark grey bars) and second (primary consumers)
(pale grey bars) trophic levels. Error bars represent 95% confidence intervals....... 155
Figure 6.4 Proportional change (0-1) in species’ biomass of a) uninfected A.
brama (dark grey) and infected with levels of E. briani encountered in the study site
on which the model is based (light grey); and b) uninfected R. rutilus (dark bars) and
nfected with observed levels of E. briani encountered (light grey) with changing
macrophyte proportions. Error bars are 95% confidence intervals. ......................... 157
Figure 6.6 Example of weighted food webs created based on stable isotope
feeding niche data. a) is a food web in which no C. carpio, are infected with B.
acheilognathi b) is a food web in which 100% of C. carpio are infected with B.
acheilognathi. Each line represents 1% of the species’ or group’s diet................... 162
Figure 6.7 Changes in the proportion of the total biomass of the food web
contributed by the first (producers) (dark grey bars) and second (primary consumers)
(pale grey bars) trophic levels. Error bars represent 95% confidence intervals....... 163
Figure 6.8 Proportional changes in a) uninfected C. carpio population biomass
(dark grey bars) and C. carpio population biomass where with 61% of fish were
infected with B. acheilognathi (light grey bars), and b) S. erythropthalmus (clear
bars), with increasing percentage of macrophyte removed from the model. Equal
biomass of phytoplankton was added so total biomass of producers remained
constant. Error bars represent 95% confidence intervals. ........................................ 165
Figure 6.9 Proportional changes of species biomass, for Cyprinus carpio
populations with differing infection levels and Scardinius erythrophthalmus, with

XV
increasing percentage of macrophyte removed from the model. Error bars represent
95% confidence intervals. ........................................................................................ 167
XVI
List of Tables
Table 2.1 Prevalence and abundance of Ergasilus briani per site and species ........ 34
Table 2.2 Sample sizes, mean lengths of subsampled fish and mean stable isotope
data of the fish species and putative food resources at each study site. ..................... 35
Table 2.3 Trophic niche width (as standard ellipse area, SEAc) of the uninfected
and infected sub-sets of fish per site, and their relative size and extent of trophic
overlap between the infected and uninfected sub-sets of fish. ................................... 40
Table 2.4 Summary of the Bayesian mixing models outputs predicting the
proportions of each major food item to the diet of infected and uninfected fish per
species and sites, and the significance of the differences according to Mann Whitney
U Tests (Z), where * P < 0.05; **P < 0.01. Values of the modelled proportions
represent their mean and standard error. .................................................................... 44
Table 3.1 Prevalence and abundance of Bothriocephalus acheilognathi by sampling
date …………………………………………………………………………..61
Table 3.2 Sample size, mean lengths of sub-sampled fish and mean stable isotope
data. …………………………………………………………………………..67
Table 3.3 Summary of the Bayesian mixing models outputs predicting the
proportions of each major food item to the diet of infected and uninfected fish on
each sample occasion, and the F value from ANOVA, where **P < 0.01. Values of
the predicted proportions represent their mean and standard error. Sample sizes as
Table 3.2 …………………………………………………………………………..69
Table 4.1 Prevalence and abundance of Anguillicoloides crassus in the Anguilla
anguilla populations ................................................................................................... 88
Table 4.2 Sample sizes and mean total lengths, and 13
C and 15
N, of infected and
uninfected Anguilla anguilla at each site, plus the mean 13
C and 15
N values of their
XVII
putative food resources used in mixing models. Error around the mean is standard
error. …………………………………………………………………………..89
Table 4.3 Mean head width/ total length ratios (HW:TL) and mean proportion of
fish in the diet of Anguilla anguilla uninfected and infected with Anguillicoloides
crassus in the three study sites. Error around the mean is standard error. ................. 91
Table 4.4 Outputs of linear mixed models testing the significance of (a) Anguilla
anguilla total length, (b) A. anguilla body mass, (c) hepatic-somatic index (HSI), (d)
standardised ratio of head width to total length, and (e) extent of piscivory in diet on
the infection status of A. anguilla from three populations. Site was the random effect
on the y intercept. ....................................................................................................... 92
Table 4.5 Binary logistic regression coefficients (Equation 1) and their statistical
significance for the probability of infection of Anguilla anguilla by Anguillicoloides
crassus according to (a) ratio of head width to total length (HW:TL), (b) predicted
proportion of fish in A. anguilla diet and (c) both variables. ..................................... 95
Table 4.6 Outputs of linear mixed models testing the significance of
Anguillicoloides crassus abundance (low, medium, heavy infections) on (a) total
length, (b) body mass, (c) hepatic-somatic index (HSI), (d) standardised ratios of
head width to total length and (e) extent of piscivory. Site was the random effect on
the y intercept. ............................................................................................................ 97
Table 5.1 Summary of food web metrics for Site 1: (1) free-living species, native
parasites and the Ergasilus briani; (2) free-living species and native parasites only;
and (3) free-living species only. ............................................................................... 118
Table 5.2 Summary of web metrics for Site 2. (1) free-living species, native
parasites and Bothriocephalus acheilognathi; (2) free-living species and native
parasites only; and (3) free-living species only........................................................ 122
XVIII
Table 5.3 Summary of web metrics for site 3. (1) free-living species, native
parasites and the Anguillicoides crassus; (2) free-living species and native parasites
only; and (3) free-living species only ...................................................................... 126
Table 5.4 Summary of the simple model web metrics, where A: free-living species
only, B: free-living species plus two directly transmitted parasites; and C: free-living
species plus two trophically-transmitted parasites ................................................... 130
Table 6.1 Scenarios modelled, to test the combined impact of disturbance (removal
of macrophyte and replacement with phytoplankton) and differing levels of infection
with Ergasilus briani. .............................................................................................. 151
Table 6.2 Scenarios modelled, to test the combined impact of disturbance (removal
of macrophyte and replacement with phytoplankton) and infection differing levels of
with B. acheilognathi. .............................................................................................. 151
Table 6.3 Summary of the Bayesian mixing models outputs predicting the
proportions of each major food item to the diet of infected and uninfected A. brama
and R. rutilus. ........................................................................................................... 152
Table 6.4 Summary of the Bayesian mixing models outputs predicting the
proportions of each major food item to the diet of Scardinius erythrophthalmus, and
infected and uninfected Cyprinus carpio. ................................................................ 160
Table 7.1 Summary of differences revealed in this study between infected and
uninfected hosts, and infected and uninfected communities for the three focal
parasites, related to the thesis’s research objectives (Section 1.10). ........................ 173
Table 7.2 Non-native Category 2 and Novel fish parasites in England, the
complexity of their lifecyles, and specificity of their final hosts (adapted from
Environment Agency 2015). .................................................................................... 185
Table A2.1 Site 1 Species list ................................................................................... v

XIX
Table A2.2 Site 2 Species list .................................................................................. vi
Table A2.3 Site 3 Species list ................................................................................. vii
Table A3.1 Site 1 Binary matrix .............................................................................. ix
Table A3.2 Site 2 Binary Matrix ............................................................................... x
Table A3.3 Site 3 Binary Matrix .............................................................................. xi
Table A4.1 Summary of proportions of the proportion of major food items in the
diet of consumers based on Bayesian mixing model outputs (this study) and
published literature. .................................................................................................... xii
Table A5.1 Site 1: Weighted matrices .................................................................. xiii
Table A5.2 Site 2: Weighted matrices ................................................................... xiv
XX
Acknowledgement
I would like to sincerely thank my supervisors Rob Britton and Demetra Andreou for
all their support, guidance and kindness. I would also like to thank Chris Williams,
who has given me a huge amount of his time and expertise throughout my PhD.
My PhD was funded by The Fisheries Society of the British Isles, to whom I am very
grateful for this chance to study and for allowing me to attend and present my
research at the Canadian Conference for Freshwater Fisheries Research.
Many people helped me in the practical aspects of identifying field sites, carrying out
fieldwork, and processing fish. These were Amy Reading, Neil Lewin, Tracey Short,
Emma Nolan, Alex Malcolm, Gordon Reid, Matthew Pang, Geoff Way, the staff of
AES Europe Ltd, Greg Murray, Danny Sheath, Farah Al-Shorbaji, John Wall and Ian
Wellby. Alexander Lovegrove helped me draw Figures 1.1, 1.2 and 1.3. I appreciate
all the fisheries managers and angling clubs for generously allowing me to sample
their fish, especially Henleaze Swimming and Angling clubs, Basingstoke Canal
Angling Association, Cranbrook and District Angling Club, and Gary Weaving.
In addition to my supervisors and co-authors, several people have helpfully
commented on this thesis, including Richard Stillman and John Stewart (transfer
report), Roger Herbert and Sian Griffiths (examiners) and several anonymous
referees (Chapters 2, 3 and 4).
Finally many thanks to my family, friends and the elks.
XXI
Author’s declaration
I confirm that the work presented in this thesis is my own work, with the following
exceptions:
Chapter 3 and Chapter 4 are based on the following paper published in collaboration
with Demetra Andreou, Chris Williams and Robert Britton as:
Pegg, J., Andreou, D., Williams, C. F. and Britton, J. R., 2015. Temporal changes in
growth, condition and trophic niche in juvenile Cyprinus carpio infected with a non-
native parasite. Parasitology. doi:10.1017/S0031182015001237
JP, DA, CW and RB designed the project, JP and DA carried out fieldwork, JP and
CW carried out laboratory analysis, JP, DA, RB analysed the data, JP, DA, CW and
RB wrote the paper.
Pegg, J., Andreou, D., Williams, C. F. and Britton, J. R., 2015. Head morphology
and piscivory of European eels, Anguilla anguilla, predict their probability of
infection by the invasive parasitic nematode Anguillicoloides crassus. Freshwater
Biology, 60: 1977–1987.
JP, DA, CW and RB designed the project, JP and RB carried out fieldwork, JP, DA
and CW carried out laboratory analysis, JP, DA, RB analysed the data, JP, DA, CW
and RB wrote the paper.
1
1. Introduction
This thesis studies how non-native parasites alter food web structure through their
interactions with free-living species and their modifications to host foraging
behaviour. It uses fish and their parasite fauna as the model species and the UK as
the study area. It doing so, the research covers topics including introduced species
generally and introduced fishes specifically, their parasite fauna, and the
consequences of parasites, including non-native parasites and at individual,
population and community levels.
1.1 Introductions of non-native fish
The rate of introductions of species worldwide has more than doubled compared
with estimates nearly three decades ago (Gozlan 2008; Gozlan et al. 2010b). These
introductions of non-native species have principally been the result of human
activity, usually associated with enhancing ecosystem services such as aquaculture,
and can be both deliberate or accidental (Vitousek et al. 1996; Koo and Mattson
2004; Gozlan et al. 2010a; Gozlan et al. 2010b). Despite this large volume of
introductions, the majority of introduced species fail to establish sustainable
populations; of those that do, many only cause minor ecological consequences
(Gozlan 2008). However, a small proportion cause more substantial impacts
(Manchester and Bullock 2000). These range from genetic consequences through to
changes in ecosystem functioning (Cucherousset and Olden 2011). Examples in
freshwater fish include habitat alteration, such as increased water turbidity caused by
benthic foraging species such as the Common carp Cyprinus carpio and goldfish
Carassius auratus (Richardson and Whoriskey 1992; Britton et al. 2007); genetic

2
contamination, such as through hybridization between native crucian carp Carassius
carssius with C. carpio and C. auratus in England that has resulted in the
introgression of gene pools and the loss of pure-strain populations of C. carassius
(Hanfling et al. 2005), and the introduction of non-native parasites with their free-
living hosts, the subject of this research.
Both aquaculture and recreational angling provide important introduction pathways
for introduced species, with these responsible for a number of introduced fishes
attaining almost global distribution (De Silva et al. 2006; Gozlan et al. 2010b).
Cyprinus carpio, originally from Southeast Asia, is now commonplace wherever
temperatures allow their survival, due to their use in aquaculture and angling
(Zambrano et al. 2006; Britton et al. 2007). Nile tilapia Oreochromis niloticus has
achieved similar distribution levels as a result of intensive pond aquaculture, being
prevalent in Asian and South American aquaculture systems (Zambrano et al. 2006;
Orsi and Britton 2012). There are, however, a number of other pathways by which
fish can be introduced into new ranges, including the ornamental fish trade that is
responsible for the introduction of many smaller species of low economic value, with
these introductions often being accidental, such as the topmouth gudgeon
Pseudorasbora parva into Europe from China (Gozlan et al. 2010a).
Introduction pathways for non-native fish parasites tend to echo those of their free-
living hosts (Britton 2013). Aquaculture is thus arguably the pathway responsible for
the introduction of the majority of non-native fish parasites, with examples including
the eel parasite Anguillicoloides crassus (Kirk 2003), the Asian tapeworm
Bothriocephalus acheilognathi (Andrews et al. 1981) and the crustacean copepod
3
parasite Ergasilus briani (Alston and Lewis 1994). These parasites are all now
present in the UK following their release into the wild with introduced free-living
hosts, and infect fish species which are considered native and naturalised.
1.2 Arrival of parasites with introduced free-living species
When free-living species are moved from their natural range into a new range, they
are likely to be host to a number of parasites and other disease causing agents that
will be introduced with them. If these pathogens are able to infect new, native hosts
in their extended range then the consequences for these hosts are often severe. For
example, in the UK, the invasive grey squirrel Sciurus carolinensis is the host of the
squirrel poxvirus, which is relatively benign in greys, but on transmission to the
native red squirrel Sciurus vulgaris can cause high mortality rates (Rushton et al.
2006; Bruemmer et al. 2010) and has thus driven the decline of the native squirrel in
the UK (Chantrey et al. 2014). The movement of fish around the world for
aquaculture purposes has also resulted in the transfer of a number of pathogens that
have then gone on to cause considerable issues in the new range. For example, in
fish of the Salmonidae family, the pathogen Yersinia ruckeri, which causes enteric
red mouth disease, has extended its geographic range from North America to Europe
with the import of live fathead minnow Pimephales promelas. Likewise infectious
hematopoietic necrosis virus that causes haematopoietic necrosis was spread along a
similar geographic route by the eggs of rainbow trout Oncorhynchus mykiss. In the
case of both diseases, mortality rates in infected populations can be high (Bovo et al.
1987; Furones et al. 1993).
Moreover, it was the transfer of a fish parasite into a new range that was responsible
for one of the most notorious examples of how an introduced pathogen can impact a
4
naïve host population. Gyrodactylus salaris is a monogenean ectoparasite native to
the Karelian part of Russia, and the Baltic parts of Finland and Sweden area, where it
occurs naturally on fins and skin of Atlantic and Baltic salmon Salmo salar when
they are in their freshwater phase. It was introduced into Norway through the
movement in aquaculture of Rainbow trout Oncorhynchus mykiss and was then
moved throughout the country via this industry and then through infected fish
migrating through rivers and in brackish water in fiords (Hansen et al. 2007). On
transmission to wild salmon in Norwegian waters, it subsequently caused disease
epidemics that incurred high mortality rates as this strain of salmon had never
experienced the pathogen previously (Johnsen 1978; Heggberget and Johnsen 1982;
Johnsen and Jensen 1986, 1991). The mortality rates reduced the abundance of
juvenile salmon by an average of 86 % and the angler catch of salmon in infected
rivers by an average of 87% (Heggberget and Johnsen 1982). Further, these losses of
salmon have had cascading effects in the freshwater pearl mussel Margaritifera
margaritifera, depleting their populations as they depend on juvenile salmon for an
important part of their lifecycle (Karlsson et al. 2014). To date, the economic losses
to G. salaris in Norway are estimated in the region of US $500,000,000 (Hansen et
al. 2003).
1.3 How many non-native parasites arrive with free-living non-native hosts?
In Section 1.1 and 1.2, it was outlined that an issue associated with introduced free-
living fish is the introduction of their parasite fauna and potentially results in naïve
native fish hosts becoming infected and incurring serious consequences.
Notwithstanding the potential seriousness of this, a number of studies have
suggested that introduced free-living species are host to a much reduced parasite

5
fauna in their new range compared to their native range (Colautti et al. 2004; Liu and
Stiling 2006; Sheath et al. 2015) . This is termed ‘enemy release’ (Colautti et al.
2004). Whilst this is beneficial from the perspective of fewer novel disease causing
agents being released with the introduced fish, it is theorised as providing
considerable benefit to that fish as it assists its survival and establishment in the new
range (hence the term) (Colautti et al. 2004; Sih et al. 2010). This benefit arises from
the reduced population regulatory pressures from their natural enemies experienced
by the introduced fish in the new range (Torchin et al. 2001; Torchin et al. 2003).
A number of studies on aquatic communities provide strong evidence for enemy
release. For example, the invasive European green crab Carcinus maenas has
significantly reduced parasite diversity and prevalence in its invasive range
compared with its natural range, with their greater population biomasses in the
invasive range attributed to this (Torchin et al. 2001). Several amphipod species that
have invaded British waters host a lower diversity, prevalence and burden of
parasites than the native amphipod Gammarus duebeni celticus (MacNeil et al. 2003;
Prenter et al. 2004b). Of the five parasite species that have been detected, three are
shared by both the native and invasive amphipod species, but two are restricted to
Gammarus duebeni celticus (Dunn and Dick 1998; MacNeil et al. 2003). Torchin et
al. (2005), found a similar pattern in mud-snail communities in North America;
whilst the native snail Cerithidea californica was host to 10 trematode species, the
invader Batillaria cumingi was host to only one. These specific examples are
supported by meta-analyses of native and invasive animals and plants which have
revealed a higher-than-average parasite diversity in native populations; for example
of 473 plant species naturalized in the United States that had originated from Europe
6
had, on average, 84% fewer fungal pathogens and 24% fewer virus species than
native fauna (Mitchell and Power 2003), whilst introduced fishes in England and
Wales had on average less than 9% of the number of macro-parasites they had in
their native range (Sheath et al. 2015). Consequently, whilst their impacts are
potentially severe in the new range, only a small proportion of non-native parasites
are actually likely to be introduced with their hosts (Torchin et al. 2003).
1.4 Infections by non-native parasites in their new range
Despite the reduced number of parasites being present in non-native free-living
species in their extended range, it is still likely some will be introduced and it is
these which are the focus of this research. These parasites may then persist within
the non-native fish population that act as a ‘reservoir’ of potential disease
transmission for the native fish populations as they ensure continual source of
infection. This source of infection and subsequent transmission to native hosts is
referred to as parasite ‘spillover’ (Prenter et al. 2004a). For example, in squirrel pox
(Section 1.2), the mortality rates of native red squirrels was so high that the virus
was predicted to die out through lack of new hosts, but it persists because grey
squirrels are asymptomatic and act as a reservoir for ‘spillover’ opportunities as they
arise (Tompkins et al. 2002).
In addition to parasite ‘spillover’, parasite ‘spillback’ also occurs in introduced free-
living species. This is where the introduced species become infected with native
parasites and then act as ‘reservoirs’ of infection for the subsequent spillback of
these parasites to their native hosts (Kelly et al. 2009). For example, in Australia, the
invasive Cane toad Bufo marinus played an important spillback role in the
7
emergence of two myxosporean parasites of native frogs, the Green and golden bell
frog Litoria aurea and the Southern bell frog Litoria raniformis, facilitating parasite
dispersal and transmission, and the consequent population declines of the frogs
(Hartigan et al. 2011). The invasive crayfish Pacifastacus leniusculus displays both
spillover and spillback. For spillover, it is an asymptomatic host for the introduced
fungus Aphanomyces astaci - crayfish plague - that is subsequently transmitted to
white-clawed crayfish Austropotamobius pallipes (Kelly et al. 2009). For spillback,
it hosts the native microsporidian Thelohania contejeani where it acts as a reservoir
of infection for A. pallipes which then tends to also cause mortality (Dunn et al.
2009).
1.5 Parasites in infectious food webs
In order to determine how an introduced parasite might impact food webs and their
structure, the role of native parasites in food webs needs to be ascertained. In the last
decade, there has been a strong focus on how the addition of parasites to food web
structure changes web properties (Lafferty et al. 2006). Infectious food webs
represent food web structure with parasites included and tend to be compared to their
structure when parasites are omitted (the traditional approach). Studies have
demonstrated that the infectious food webs tend to have increased chain length,
linkage density, nestedness and connectedness (Hudson et al. 2006; Lafferty et al.
2006; Lafferty 2008). These results suggest that food webs are very incomplete
unless parasites are included. Thus, just the mere inclusion of parasites in food web
topology has had significant effects on understandings of their structure, with the
realization that native parasites are integral to the structuring and functioning of
ecosystems (Hudson et al. 2006; Lafferty 2008).
8
Parasites in food webs result in modifications to food web structure in a number of
different ways:
1. Parasites contribute significant proportions of the biomass of ecosystems
(Johnson et al. 2010). For example, parasites in three estuaries on the Pacific
coast of California and Baja California contributed similar amounts of
biomass as major free-living groups of animals such small arthropods and
polychaetes, and a greater amount of biomass than all the vertebrate apex
predators, of fish and birds (Kuris et al. 2008). The Parasite grouped as
‘parasitic castrators’ contributed the greatest biomass, 1 - 10 kg ha-1
, or
around 1% of the total biomass of the system. Thus influencing the
ecosystems energetics and significantly contributing to the productivity of the
system (Kuris et al. 2008).
2. Parasites can induce behavioural changes in their hosts in order to complete
their lifecycles, which then modifies the foraging behaviour of the host and
so the composition of their diet (Barber et al. 2000). For example, Ligula
intestinalis infects cyprinid species, altering their swimming behaviour by
decreasing the swimming depth of infected individuals (Bean and Winfield
1989; Loot et al. 2001). This benefits the parasite as it increases the chances
of the fish being depredated by the final host, a piscivourous bird (Bean and
Winfield 1989). The consequence to the fish is that its diet can shift from
benthic to pelagic items as a result of its altered swimming behaviour (Bean
and Winfield 1989; Loot et al. 2001).
9
3. Parasites mediate competitive interactions, which will have consequences for
the quantitative food web (Hatcher et al. 2006). For example, on St Maarten
Island in the Caribbean, two species of Anolis lizard coexist, Anolis
gingivinus and Anolis wattsi. On other Caribbean islands, A. gingivinus is
larger and more competitive, but on St Maarten, the malarial parasite
Plasmodium azurophilum is present. This rarely infects A. wattsi but is very
common in A. gingivinus. Wherever infected A. gingivinus occur, A. wattsi is
also present, but wherever uninfected A. gingivinus is present then A. wattsi
is absent (Schall 1992). This has important consequences in terms of lizard
community structure, their feeding relationships and competitive interactions,
and ultimately, the structure of the topological and quantitative food web.
4. Finally, native parasites often also act as moderators of host populations that
will subsequently have important implications for moderating their cascading
effects further down the food web. For example, the reproduction of reindeer
Rangifer tarandus in Svalbard, is regulated by the parasitic nematode
Osteragaia gruehneri which decreases the fecundity of the reindeer but not
their survival (Albon et al. 2002). A feedback loop was detected of a density-
dependent parasite-mediated reduction in calf production. As population
sizes increased, so the prevalence and abundance of O. gruehneri increased
in the reindeer and prevented the reindeer populations from achieving very
high numbers (Albon et al. 2002). Similarly, the caecal worm
Trichostrongylus tenuis is a strong regulator of the population cycles of their
host the red grouse Lagopus lagopus scoticus in northern England (Hudson
10
1986; Dobson and Hudson 1992). The parasite is transmitted via the heather
which is the preferred food of adult birds, whilst young chicks which feed
primarily on insects tend to avoid infection. The parasite accumulates in
adults and high levels can cause mortality, loss of condition and can reduce
the grouse’s ability to control its scent, making it vulnerable to predation.
Eggs and larvae of T. tenuis cannot survive hot dry conditions but thrive in
warm humid ones, therefore their abundance and impact is related to
prevailing weather patterns (Hudson 1986; Dobson and Hudson 1992;
Dobson and Hudson 1995).
1.6 Parasites affect ecosystem structure
Section 1.5 discussed the substantial consequences of parasites on food web
topology and the quantitative food web through their actions on individuals and
populations. However, parasite-mediated effects on individual hosts can also
influence ecosystem structure and function. For example, trematode parasites that
infect the foot tissue of the Austrovenus stutchburyi cockle modify how the cockle
uses its foot to move and burrow after it has been dislodged (Mouritsen and Poulin
2003). The net consequence of this is changes in the structure and functioning of
soft-bodied animal communities, as epifauna benefit from the increased surface
structure and the infauna are influenced by changes in the hydrodynamics that
determine the particle composition in the upper sediment (Mouritsen and Poulin
2003). The herbivourous snail Littorina littorea is parasitized by the digenean
trematode parasite Cryptocotyle lingua in its native European range. Infection by
C.lingua reduces the consumption rate of individual L.littorea by 40 % and this
decrease in grazing pressure results in significantly increased abundance of the
11
macroalgal communities (Wood et al. 2007). The result is that in ecosystems where
the parasite has high prevalence in L. littorea, ecosystem structure tends to be more
dominated by algal communities. Both species have been introduced to North
America (Blakeslee et al. 2008), where L. littorea has been demonstrated to
significantly disrupt native communities by its voracious herbivory (Lubchenco,
1978). Thus in this case the co-introduced parasite appears to moderate the
ecological impact of its invasive host.
1.7 Parasites: consequences from individual hosts to ecosystems
Native parasites thus can have substantial consequences for individual hosts that can
have additive consequences as levels of biological organisation scale up to
population and community levels. The completion of complex parasite lifecycles,
their mediation of population abundance, and alterations in the symmetry of
competitive interactions, habitat utilisation and acquisition of food resources, all
have substantial consequences for food web structure. Nevertheless, it has only been
in the last decade that parasites have routinely been considered as integral
components of food webs and their structuring role in ecosystems is still often
overlooked.
It was also outlined in Sections 1.1 to 1.4 that whilst only a small number of non-
native parasites might get introduced with their free-living hosts (enemy release
hypothesis), these parasites might then be transmitted to native hosts (parasite
spillover). The non-native fish might then act as a reservoir of native parasites and
cause subsequent disease outbreaks in the native hosts (parasite spillback).
Transmission of non-native parasites to naïve hosts (including the same species as
12
the introduced host but an inexperienced strain that has yet to encounter the parasite)
can then have substantial consequences at the individual level (e.g. G. salaris). What
is less known (certainly compared with native parasites) is how these host
consequences of infection by non-native parasites translate into population,
community, food web and ecosystem consequences. It is this that is the basis of this
research.
1.8 Focal Parasites
This research utilises three non-native fish parasites to test their influences on food
web topology and host trophic niche size in wild conditions. The parasites were
selected on the basis of the following criteria:
1. They were classed as ‘Category 2’ parasites by the Environment Agency
(EA) (Williams 2013; Environment Agency 2015). This means their natural
range does not include England and Wales but they have been introduced,
usually with their fish host. This categorisation also means that the EA (who
have delegated responsibilities from Department of Environment, Food and
Rural Affairs (DEFRA) for regulating the movement of fishes between inland
waters in England and Wales) have assessed the parasites as having
significant disease potential for native fishes. However, their potential for
economic disruption to aquaculture is sufficiently low to not warrant their
categorisation as a ‘notifiable disease’.
2. The three selected parasites differed in their life cycles, ranging from simple
lifecycles (host-to-host) to complex lifecycles involving multiple stages and
intermediate hosts (including paratenic hosts). This enabled testing of the
13
hypothesis that as the parasite life cycle increases in complexity it will
increase food web connectivity and linkage density.
Consequently, the three non-native parasites being used are:
Ergasilus briani , a copepod crustacean from South-east Asia with a direct
lifecycle, with roach Rutilus rutilus and common bream Abramis brama
being typical fish hosts;
Bothriocepahlus acheilognathi, the ‘Asian tapeworm’ that has a two stage
lifecycle involving a copepod intermediate host and fish final host, usually
carp Cyprinus carpio; and
Anguillicoloides crassus, a nematode parasite that has as a complex lifecycle
with multiple intermediate hosts (copepods and small fish) and the European
eel Anguilla anguilla as the final host, plus numerous other fish paratenic
hosts.
These parasites were introduced into England and Wales via either the fish
movement industry for angling (E. briani, B. acheiloganthi) or the aquaculture
industry (A. crassus). The following paragraphs outline some of the key
characteristics of each parasite.
Ergasilus briani is a crustacean parasite of the family Ergasilidae that can infect a
wide range of freshwater fish species, with over 20 recorded fish host species in
England and Wales (Alston and Lewis 1994; Williams 2007). The parasite prefers
hosts of below 100 mm in length, particularly cyprinid fish (e.g. roach Rutilus
14
rutilus, rudd Scardinius erythropthalmus and common bream Abramis brama)
(Alston and Lewis 1994). Ergasilus briani was first recorded in England and Wales
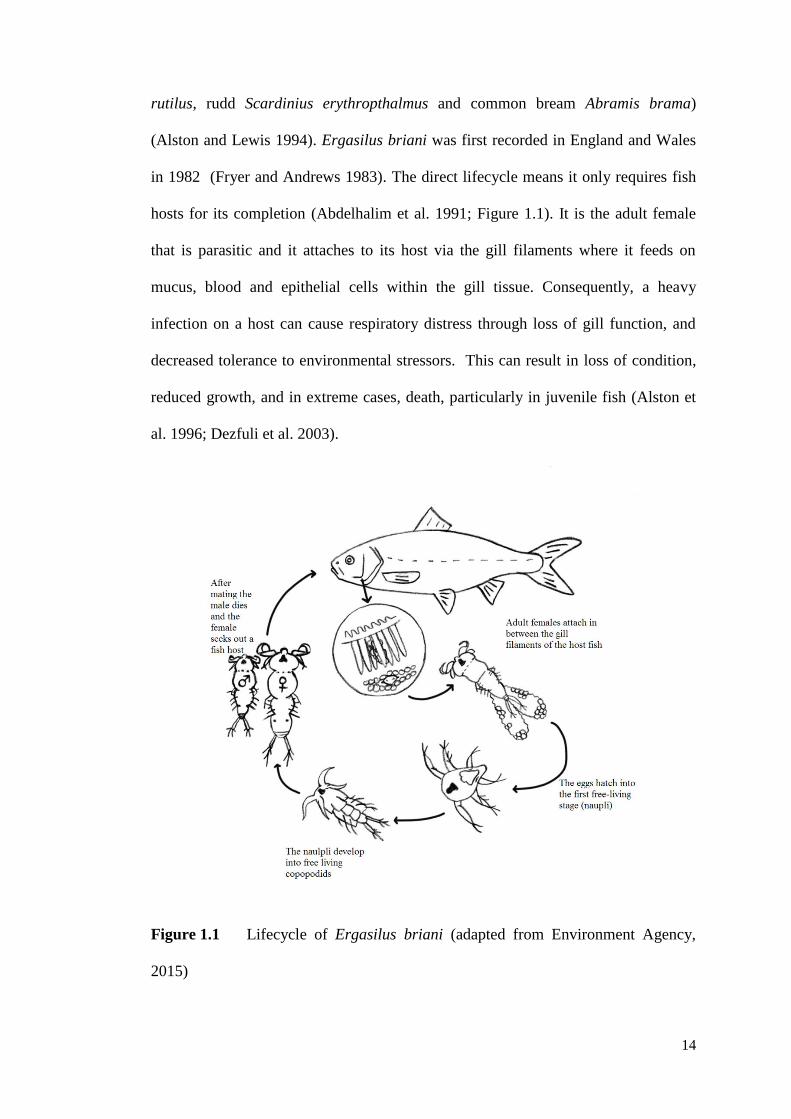
in 1982 (Fryer and Andrews 1983). The direct lifecycle means it only requires fish
hosts for its completion (Abdelhalim et al. 1991; Figure 1.1). It is the adult female
that is parasitic and it attaches to its host via the gill filaments where it feeds on
mucus, blood and epithelial cells within the gill tissue. Consequently, a heavy
infection on a host can cause respiratory distress through loss of gill function, and
decreased tolerance to environmental stressors. This can result in loss of condition,
reduced growth, and in extreme cases, death, particularly in juvenile fish (Alston et
al. 1996; Dezfuli et al. 2003).
Figure 1.1 Lifecycle of Ergasilus briani (adapted from Environment Agency,
2015)
15
Bothriocephalus acheilognathi is a parasitic flatworm of the class Cestoda.
Originally from Asia, it has been spread around the world via the global aquaculture
trade in Asian grass carp Ctenopharyngodon idella. It is non-host specific, having
been recorded in over 200 fish hosts across the world, although its more severe
consequences tend to occur in fishes of the Cyprinidae family (Williams et al. 2011;
Linder et al. 2012). It has a complex lifecycle (Figure 1.2) involving an intermediate
copepod host and one or more definitive fish hosts. In the final fish host, the mature
cestodes are within the intestinal tract where they release partially embryonated eggs
which then pass out of the fish in their faeces. The eggs settle onto the substrate
where they develop into ciliated larvae - coracidium - which then exits the egg shell
and swims in the water column until eaten by a copepod. There, it sheds its ciliated
outer and burrows into the copepod body cavity where it develops into the proceroid,
the first larval stage. A copepod heavily infected with proceroids will move more
slowly and be more susceptible to predation by fish (Nie and Kennedy 1993), thus
facilitating their transfer to the final fish host. Should a piscivorous fish then
consume the final host then this can also result in infection (Linder et al. 2012).
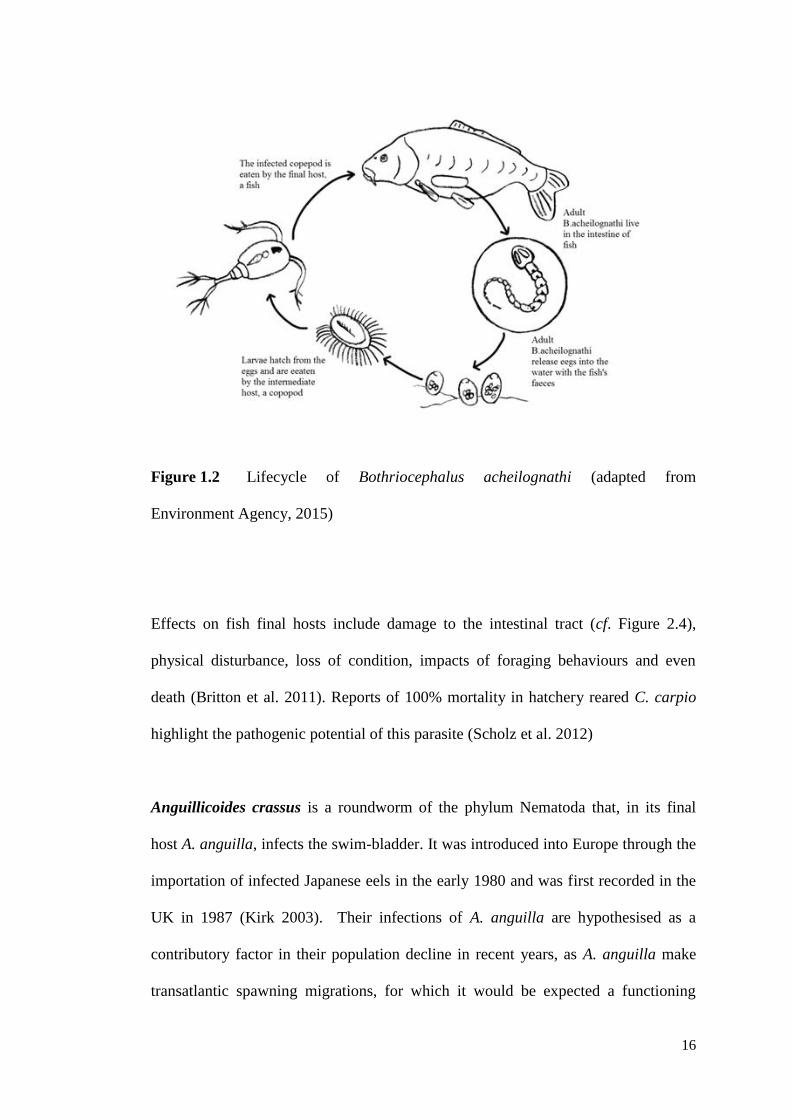
16
Figure 1.2 Lifecycle of Bothriocephalus acheilognathi (adapted from
Environment Agency, 2015)
Effects on fish final hosts include damage to the intestinal tract (cf. Figure 2.4),
physical disturbance, loss of condition, impacts of foraging behaviours and even
death (Britton et al. 2011). Reports of 100% mortality in hatchery reared C. carpio
highlight the pathogenic potential of this parasite (Scholz et al. 2012)
Anguillicoides crassus is a roundworm of the phylum Nematoda that, in its final
host A. anguilla, infects the swim-bladder. It was introduced into Europe through the
importation of infected Japanese eels in the early 1980 and was first recorded in the
UK in 1987 (Kirk 2003). Their infections of A. anguilla are hypothesised as a
contributory factor in their population decline in recent years, as A. anguilla make
transatlantic spawning migrations, for which it would be expected a functioning
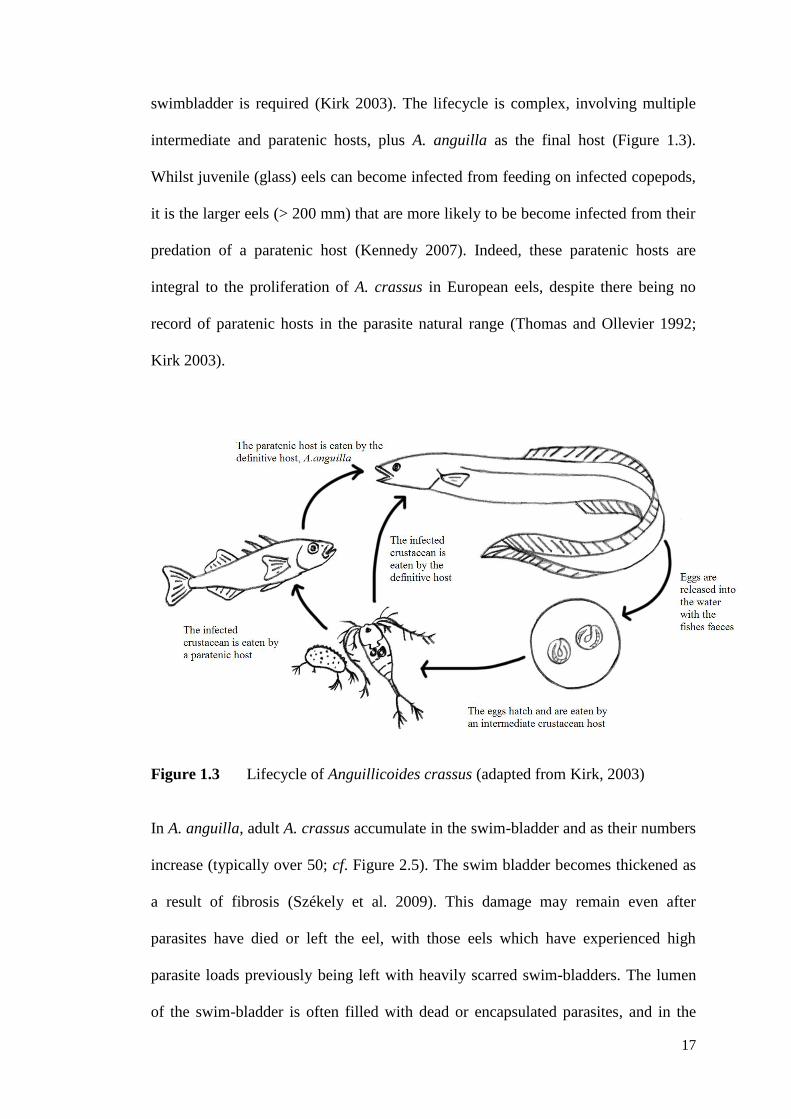
17
swimbladder is required (Kirk 2003). The lifecycle is complex, involving multiple
intermediate and paratenic hosts, plus A. anguilla as the final host (Figure 1.3).
Whilst juvenile (glass) eels can become infected from feeding on infected copepods,
it is the larger eels (> 200 mm) that are more likely to be become infected from their
predation of a paratenic host (Kennedy 2007). Indeed, these paratenic hosts are
integral to the proliferation of A. crassus in European eels, despite there being no
record of paratenic hosts in the parasite natural range (Thomas and Ollevier 1992;
Kirk 2003).
Figure 1.3 Lifecycle of Anguillicoides crassus (adapted from Kirk, 2003)
In A. anguilla, adult A. crassus accumulate in the swim-bladder and as their numbers
increase (typically over 50; cf. Figure 2.5). The swim bladder becomes thickened as
a result of fibrosis (Székely et al. 2009). This damage may remain even after
parasites have died or left the eel, with those eels which have experienced high
parasite loads previously being left with heavily scarred swim-bladders. The lumen
of the swim-bladder is often filled with dead or encapsulated parasites, and in the
18
most extreme cases, the lumen of the swim-bladder collapses (Székely et al. 2009.
Infection has been shown to produce a reduction in swimming speed (Thomas and
Ollevier 1992). Nevertheless, the primary cause of A. crassus induced mortality is
decreased resistance to secondary infections (Szekely 1994). Whilst parasite-induced
mortality in wild populations is rare, significant mortalities have occurred in
association with adverse environmental stressors (Kirk 2003).
1.9 Definitions of terminology
• Non-native species: A species, subspecies or lower taxon, introduced by
human action outside its natural past or present distribution; includes any part,
gametes, seeds, eggs, or propagules of such species that might survive and
subsequently reproduce.
• Non-native invasive species: Any non-native animal or plant that has the
ability to spread, causing damage to the environment, the economy, our health and
the way we live.
• Parasite: An organism that lives and feeds on or in an organism of a different
species and causes harm to its host.
• Host: An organism that harbours a parasite.
• Intermediate host: A host that harbours the parasite only for a short transition
period, during which (usually) some developmental stage is completed.
• Definitive host: A host in which the parasite reaches maturity and, if
possible, reproduces sexually.
• Paratenic host: A host that is not necessary for the development of a
particular species of parasite, but nonetheless may happen to serve to maintain the
life cycle of that parasite. In contrast to its development in an intermediate, a parasite
19
in a paratenic host does not undergo any changes into the following stages of its
development
• Naïve host species: A native species having no co-evolutionary history to the
non-native parasite.
• Direct lifecycle (of a parasite): Lifecycle is completed on a single host (may
have a free-living stage).
• Complex lifecycle (of a parasite): Lifecycle is completed on multiple hosts,
including one or more intermediate host in addition to a definitive host.
• Parasite prevalence: The proportion of infected hosts among all the potential
hosts examined of a single species.
• Parasite abundance: This is the mean number of parasites found in all the
individual infected hosts.
20
1.10 Research aim and objectives
The research aim is to determine how infection of naïve fish hosts by a non-native
parasite impacts individual fish, their populations, their interactions within the
community and the food web topology and trophic structure. Using three non-native
fish parasites present in the UK, the research objectives are to:
O1. Determine the prevalence and abundance and pathology of Ergasilus briani in
Rutilus rutilus and Abramis brama (Chapter 2), Bothriocephalus acheilognathi in
Cyprinus carpio (Chapter 3), and Anguillicoides crassus in Anguilla anguilla
(Chapter 4), and assess the respective impact of each parasite on their host’s growth
and condition.
O2. Identify how infection by the three focal non-native parasites affects the trophic
ecology of their respective host fish populations. Specifically whether parasitism
alters their trophic niche size (Chapter 2, 3, 4) and trophic position (Chapters 2, 3, 4);
whether there is a temporal component to the ecological impact of parasitism
(Chapter 3) and whether trophic ecology can be a predictor to parasitism (Chapter 4)
O3. Assess how infections by native and the three focal non-native parasites modify
the topology of aquatic food webs through comparison with the topology when
parasites are omitted (Chapter 5);
O4. Identify changes in the functioning of infectious foobwebs caused by the non-
native parasites E. briani and B. acheilognathi (Chapter 6).
21
1.11 Thesis structure
The structure of the thesis is as follows:
Chapter 1: Introduction. This has provided the rationale for the study and the
overall aim and objectives.
Chapter 2: Consistent patterns of trophic niche specialisation in host population
infected with a non-native parasite. This chapter provides data on parasite
prevalence and abundance of infected with Ergasilus briani in Rutilus rutilus and
Abramis brama, the consequences of infection for host fishes and how infection
impacts their trophic ecology.
Chapter 3: Temporal changes in growth, condition and trophic niche in juvenile
Cyprinus carpio infected with a non-native parasite. This chapter provides data on
parasite prevalence and abundance of Bothriocephalus acheilognathi in C. carpio,
the consequences of infection for host fish and how infection impacts their trophic
ecology.
Chapter 4: Head morphology and piscivory of European eels, Anguilla anguilla,
predict their probability of infection by the invasive parasitic nematode
Anguillicoloides crassus. This chapter provides data on parasite prevalence and
abundance of A. crassus in A. anguilla, the consequences of infection for host fish
and the interaction of eel functional morphology and parasite infection.
Chapter 5: Consequences of non-native parasites for topological food webs. This
chapter quantifies how infections by native and non-native parasites modify the
topology of aquatic food webs.
Chapter 6: Weighted food webs to predict the outcomes of interactions of non-
native parasite infection and environmental change. This chapter quantifies how
22
infections by native and non-native parasites modify the structure and energy flux of
aquatic food webs, and uses food web models predictively to determine the outcome
of specific scenarios on parasite dynamics and food web structure.
Chapter 7: Discussion: This summarises the outputs of the data chapters (Chapters
2 to 6) and discusses conclusions in relation to the initial aims and objectives.
23
2. Consistent patterns of trophic niche specialisation in host
populations infected with a non-native parasite
2.1 Abstract
Populations of generalist species often comprise smaller sub-sets of relatively
specialised individuals whose niches comprise small sub-sets of the overall
population niche. Although the ecological drivers of individual trophic specialisation
are generally well established, the role of parasitism remains unclear, despite
infections potentially altering host foraging behaviours and diet composition. This
role was tested here using five wild populations of roach Rutilus rutilus and common
bream Abramis brama infected with the non-native parasite Ergasilus briani, a
copepod parasite that has a direct lifecycle (i.e. it is not trophically transmitted) that
infects gill tissues. Parasite prevalence ranged between 16 and 67 %, with parasite
abundances of up to 66 per individual. Pathological impacts included hyperplasia
and localised haemorrhaging of gill tissues. There were, however, no differences in
the length, weight and condition of infected and uninfected fishes. Stable isotope
analyses (13
C, 15
N) revealed that across all populations, the trophic niche width of
infected fishes was consistently and substantially reduced compared to uninfected
conspecifics. The trophic niche of infected fishes always sat within that of uninfected
fish, revealing trophic specialisation in hosts, with predictions of diet composition
indicating this resulted from greater proportions of less motile items in host diets that
appeared sufficient to maintain their energetic requirements. The results here
suggest trophic specialisation is a potentially important non-lethal consequence of
parasite infection that results from impaired functional traits of the host.
24
2.2 Introduction
Infections by parasites can have considerable consequences for their free-living
hosts, including alterations in habitat utilisation, and foraging and anti-predator
behaviours (Barber et al. 2000; Lefevre et al. 2009; Dianne et al. 2014). There
remains relatively limited knowledge regarding the mechanistic basis of these
alterations (Clerc et al. 2015), with this also reflected in aspects of their ecological
consequences (Lefevre et al. 2009). It is, however, well established that parasites can
have considerable consequences for food web ecology (e.g. Marcogliese and Cone,
1997; Lafferty et al. 2006; Wood et al. 2007), with the trophic consequences of
infections resulting from both manipulative parasites affecting the strength of trophic
links involved in transmission, and from non-manipulative parasites that impair the
functional traits of hosts (Miura et al. 2006; Hernandez and Sukhdeo, 2008). For
example, sticklebacks Gasterosteus aculeatus infected with Schistocephalus solidus
preferentially ingest smaller prey items of lower quality compared with uninfected
sticklebacks (Milinski 1984; Jakobsen et al. 1988; Cunningham et al. 1994). Thus,
parasite infections can restrict the prey handling and ingestion abilities of hosts and/
or reduce the ability of hosts to compete for larger prey items with uninfected
individuals due to factors including energetic constraints that result in shifts in
competition symmetry between the infected and uninfected individuals (Barber et al.
2000; Britton 2013).
Populations of generalist species are increasingly recognised as comprising smaller
sub-sets of relatively specialised individuals whose niches are then small sub-sets of
the overall population niche (Bolnick et al. 2003; Bolnick et al. 2007; Quevedo et al.
2009). Empirical studies and foraging models suggest intraspecific competition
25
increases individual trophic specialisation (Svanback and Persson 2004; Huss et al.
2008). Whilst other drivers of trophic specialisation include increased interspecific
competition, the exploitation of new ecological opportunities, and the direct and
indirect consequences of predation, there has been little consideration of how natural
enemies, such as parasites, affect the magnitude of individual trophic specialisation
(Araujo et al. 2011). This is despite the evidence already outlined that infections can
alter host foraging behaviours and diet composition. Correspondingly, should
parasite infections increase levels of competition for infected individuals then the
niche variation hypothesis predicts that their sub-set of the population would become
more specialised in their diet (Van Valen 1965). Conversely, under increasing
resource competition, a shift to a larger trophic niche by these infected individuals
might maintain their energy requirements (Svanback and Bolnick 2007).
Consequently, the aim of this study was to identify how the infection of a model
parasite species affects host populations in relation to their trophic niche size and the
magnitude of individual trophic specialisation. The objectives were to: (1) quantify
the parasite prevalence, abundance, histopathology and energetic consequences of
the model parasite on two fish species over five populations; (2) assess the trophic
niche size of each fish population, and those of the two sub-sets of each population:
uninfected and infected with the parasite; and (3) assess these outcomes in relation to
niche theory and individual trophic specialisation. The model species were the
copepod parasite Ergasilus briani in the host fish species roach Rutilus rutilus and
common bream Abramis brama. Populations in the UK were used; E. briani was
only introduced in 1982 (Alston and Lewis 1994) and so the parasite and fishes
shared little evolutionary history, meaning infections had the potential to produce
26
pronounced consequences in naïve hosts (Taraschewski 2006). It was predicted that
the trophic niche of infected individuals differ from that of uninfected con-specifics
due to the consequences of E. briani infection, with infected individuals having
impaired growth rates and energetics.
2.3 Materials and Methods
2.3.1 Sample collection and initial data collection
Three freshwater study sites were selected in Southern England where E. briani
infections were known to be present in the fish community. The sites were chosen
which best represented the range of habitats occupied by the parasite and it’s hosts in
the UK, and thus represented the differing conditions that an infected host would be
exposed to as well as the different food webs that the parasite could potentially
impact.
The Basingstoke canal (Site 1; 51.276414N, 0.820642W) was historically
supplemented with cyprinid fish through stocking but now has a self-sustaining fish
community; it is of 6 to 10 m in width and maximum depth 2.5 m (Figure 2.1).
Henleaze Lake (Site 2; 51.49763N, 2.603867W) is a narrow lake in a former quarry
of 450 m in length, and is up to 8 m in width and with depths to 6 m (Figure 2.2). It
had been previously stocked with C. carpio, A.brama and R. rutilus, with the latter
two species now self-sustaining. Darwell reservoir (Site 3; 50.963617N, 0.440719E)
is a water supply reservoir of approximately 63 hectares where the fish community is
dominated by R. rutilus, perch Perca fluviatilis and pike Esox lucius (Figure 2.3). It
was the stocking activities on each site in the 1980s and 1990s that resulted in E.
briani introduction.
27
Figure 2.1 Site 1, Section of the Basingstoke canal. (Photograph by Ronn Strutt).
Figure 2.2 Site 2, Henleaze Lake, October 2013. In the foreground are the
swimming platforms and diving boards used by swimmers, the portion of the lake
reserved for angling starts beyond the large willow on the right.
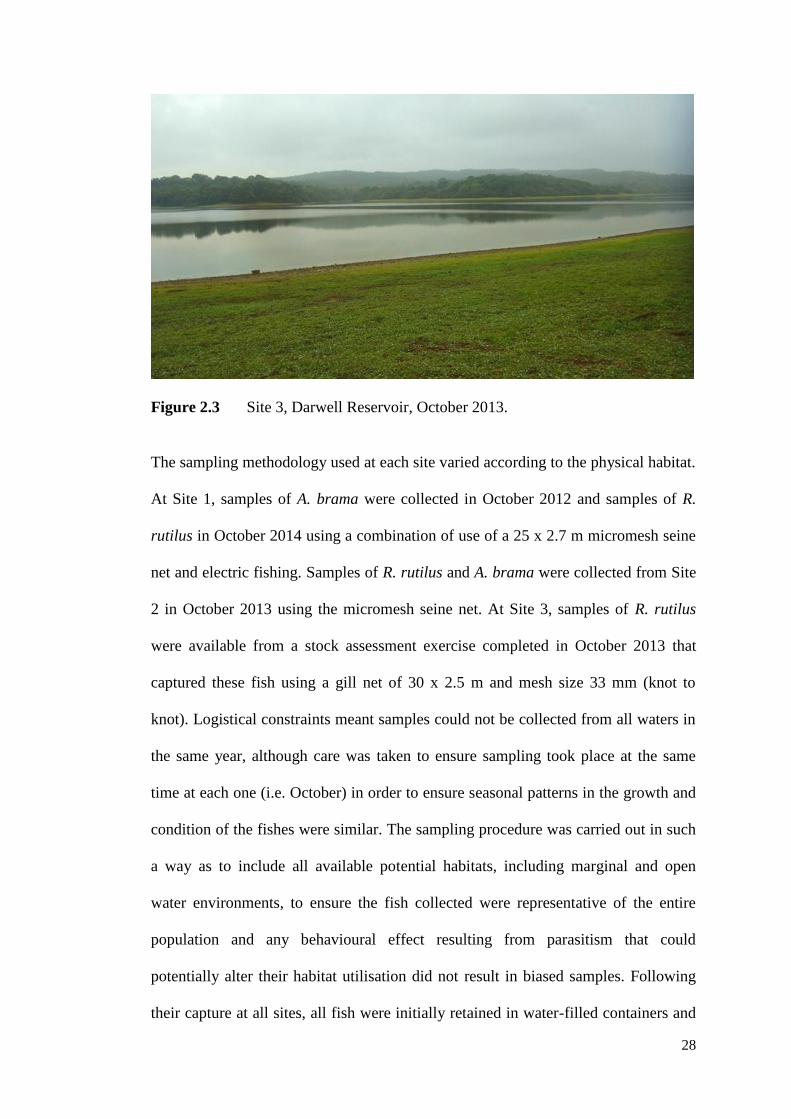
28
Figure 2.3 Site 3, Darwell Reservoir, October 2013.
The sampling methodology used at each site varied according to the physical habitat.
At Site 1, samples of A. brama were collected in October 2012 and samples of R.
rutilus in October 2014 using a combination of use of a 25 x 2.7 m micromesh seine
net and electric fishing. Samples of R. rutilus and A. brama were collected from Site
2 in October 2013 using the micromesh seine net. At Site 3, samples of R. rutilus
were available from a stock assessment exercise completed in October 2013 that
captured these fish using a gill net of 30 x 2.5 m and mesh size 33 mm (knot to
knot). Logistical constraints meant samples could not be collected from all waters in
the same year, although care was taken to ensure sampling took place at the same
time at each one (i.e. October) in order to ensure seasonal patterns in the growth and
condition of the fishes were similar. The sampling procedure was carried out in such
a way as to include all available potential habitats, including marginal and open
water environments, to ensure the fish collected were representative of the entire
population and any behavioural effect resulting from parasitism that could
potentially alter their habitat utilisation did not result in biased samples. Following
their capture at all sites, all fish were initially retained in water-filled containers and
29
for R. rutilus and A.brama, a random sub-sample of a minimum of 30 individuals per
species was taken and transported to the laboratory for processing. Concomitant to
the collection of each fish sample, their putative food items were also sampled,
including macro-invertebrates (kick-sampling and sweep netting), zooplankton
(filtering 10 l of water through a 250 μm filter) and phytoplankton (filtering 10 l of
water through a 53 μm filter). Triplicate samples of macro-invertebrate species were
taken, where a sample represented between 5 and 20 individuals of that species.
In the laboratory, all fish were euthanized (anaesthetic overdose; MS-222), with
weight (W; to 0.01 g), and fork length (L; nearest mm) recorded. A detailed post-
mortem was then conducted on each individual R. rutilus and A. brama for detecting
the presence of infections of native and non-native parasites using a standard
protocol adapted from Hoole et al. (2001; Appendix 1). Skin scrapes and internal
organs were examined with aid of low and high power microscopy to enable parasite
identification. Gill arches from both gill cavities were removed and examined under
low power for parasite presence, including E. briani. Where E. briani was present,
their intensity of infection was recorded (number of individual parasites). Hereafter,
where an individual R. rutilus or A. brama is referred to as either infected or non-
infected, it refers to the presence/ absence of E. briani in that individual during this
process. Gill tissue from infected and uninfected individuals was retained and
prepared for histopathology. On completion of the post-mortem, a sample of dorsal
muscle was taken from a random proportion of the fish samples (sample sizes 6 to 15
per sub-set of fish per population). These, and the macro-invertebrate, zooplankton
and phytoplankton samples, were then dried at 60ºC to constant weight before being
analysed for their stable isotopes of 13
C and 15
N at the Cornell Stable Isotope
30
Laboratory (New York, USA). At this laboratory, each sample was prepared by
grinding and then weighing approximately 0.5 mg into a tin cup, with the actual
weight recorded accurately using a Sartorius MC5 microbalance. The samples were
then analysed for their carbon and nitrogen isotopes using a Thermo Delta V
Advantage Isotope Ratio Mass Spectrometer. The outputs from the spectrometer
included data on the carbon and nitrogen stable isotope ratios that could be then be
expressed relative to conventional standards as δ13
C and δ15
N, respectively (Section
1.4), where δ13
C or δ15
N = [Rsample/Rstandard-1] x 1000, and R is δ13
C/ δ12
C or
δ15
N/d14
N. Standards references were Vienna Pee Dee Belemnite for δ13
C and
atmospheric nitrogen for δ15
N. A standard of animal (mink) was run every 10
samples to calculate an overall standard deviation for both δ15
N and δ13
C to ascertain
the reliability of the analyses. The overall standard deviation of the animal standard
was not more than 0.23 ‰ for δ15
N and 0.14 ‰ for δ13
C.
2.3.2 Histopathology
Histopathology of gill tissues was completed to assess the pathological changes
associated with E. briani infection. Sections of gill from infected and uninfected fish
were fixed in Bouin’s fixative for 24 hours before transferring to 70% Industrial
Methylated Spirit. The tissues were trimmed, dehydrated in alcohol series, cleared
and then embedded in paraffin wax. Transverse and longitudinal sections of 3 µm
were cut on a microtome. These were dried at 50°C, stained using Mayer's
haematoxylin and eosin, and examined microscopically for pathological changes and
described accordingly.
31
2.3.3 Data analyses
Infection levels of E. briani in R. rutilus and A. brama were described as their
prevalence (number of infected individuals/total number of individuals x 100) and
abundance (number of E. briani per host). The stable isotope data of R. rutilus and A.
brama were used to assess their trophic niche size and predict their diet composition
from the putative food resource data. Trophic niche size was calculated using the
metric standard ellipse area (SEAc) in the Stable Isotope Aanalysis in R (SIAR)
package (Parnell et al. 2010) in R (R Core Development Team, 2013). SEAc is a
bivariate measure of the distribution of individuals in trophic space, where each
ellipse encloses ~ 40% of the data and thus represents the core dietary niche of
species and so indicates their typical resource use (Jackson et al. 2011; Jackson et al.
2012). It has been widely applied to describing the dietary niche of a wide range of
species in recent years (e.g. Grey and Jackson 2012; Guzzo et al. 2013; Abrantes et
al. 2014), highlighting its utility. The subscript ‘c’ in SEAc indicated that a small
sample size correction was used here due to limited sample sizes. For each
population of R. rutilus and A. brama in each site, SEAc was calculated for two sub-
sets of individuals: those infected with E. briani and those uninfected. Where SEAc
overlapped between the sub-sets, or the SEAc of the sub-set overlapped with another
species or sub-set of another species in the community, then the extent of this
overlap (as a %) was calculated to identify the extent to which the trophic niches
were shared.
To then predict the diet composition of each sub-set of fish, their stable isotope data,
plus those of their putative food resources, were applied to Bayesian mixing models
that estimated the relative contribution of each putative food resource to the diet of
32
each individual R. rutilus or A. brama per site (Moore and Semmens 2008). The
models were run using the MixSIAR GUI package in the R computing programme
(R Core Development Team 2013). Given that excessive putative food resources can
cause mixing models to underperform, the data for resources with similar isotope
values were combined a priori, whilst respecting the taxon and functional affiliation
of the individual species (Phillips et al. 2005). Correspondingly, at Sites 1 and 2, the
groups used in the models were Arthropoda, Chironomidae and zooplankton. At Site
3, they were macrophyte, zebra mussel Dreissena polymorpha, zooplankton and
phytoplankton. Isotopic fractionation factors between resources and consumers in the
models were 3.4 ‰ (± 0.98 ‰) for δ 15
N and 0.39 ‰ (± 1.3 ‰) for δ13
C (Post,
2002). Outputs were the predicted proportion of each resource to host diet (0 to 1).
2.3.4 Statistical analyses
For each fish species and population infected with E. briani, differences between the
infected and uninfected hosts were tested for length using ANOVA, and their stable
isotopes of δ13
C and δ15
N using Mann Whitney U tests. Condition was calculated as
Fulton’s Condition Factor K, where K= 100 x W/L3, where L was measured in cm,
with differences between infected and uninfected fishes also tested using Mann
Whitney U tests. Differences in weight between the infected and uninfected fish per
population and species were then tested in a generalized linear model (GLM), where
the effect of length on weight was controlled as a co-variate; outputs included
estimated marginal means of weight controlled for length for each sub-set of fish and
the significance of their differences were identified by pairwise comparisons with
Bonferroni correction for multiple comparisons. Differences between the predicted
proportions of each putative food source to the diet of infected and uninfected fish
33
were tested by Mann Whitney U tests. Other than the stable isotope mixing models,
all analyses were completed in SPSS v. 22.0. In all analyses, where parametric tests
were used, the assumptions of normality of residuals and homoscedasticity were
checked, and response variables were log-transformed to meet the assumption if
necessary.
2.4 Results
2.4.1 Parasite prevalence and abundance, and effect on fish length and weight
Prevalence and mean parasite abundance was highest at Site 1 for both fishes, with
the maximum abundance recorded being 66 E. briani in an individual R. rutilus
(Table 2.1). Other parasites recorded were native species that would be considered as
the expected parasite fauna of these fishes in a UK community and were recorded at
levels that were considered as not high enough to cause clinical pathology (Hoole et
al. 2001) These species are listed in Appendix 2. At Site 1, the non-native parasite
Ergasilus sieboldi was also detected in the gills of two A. brama. Due to the
potential for this parasite to confound subsequent analyses, these fish were omitted
from the dataset.
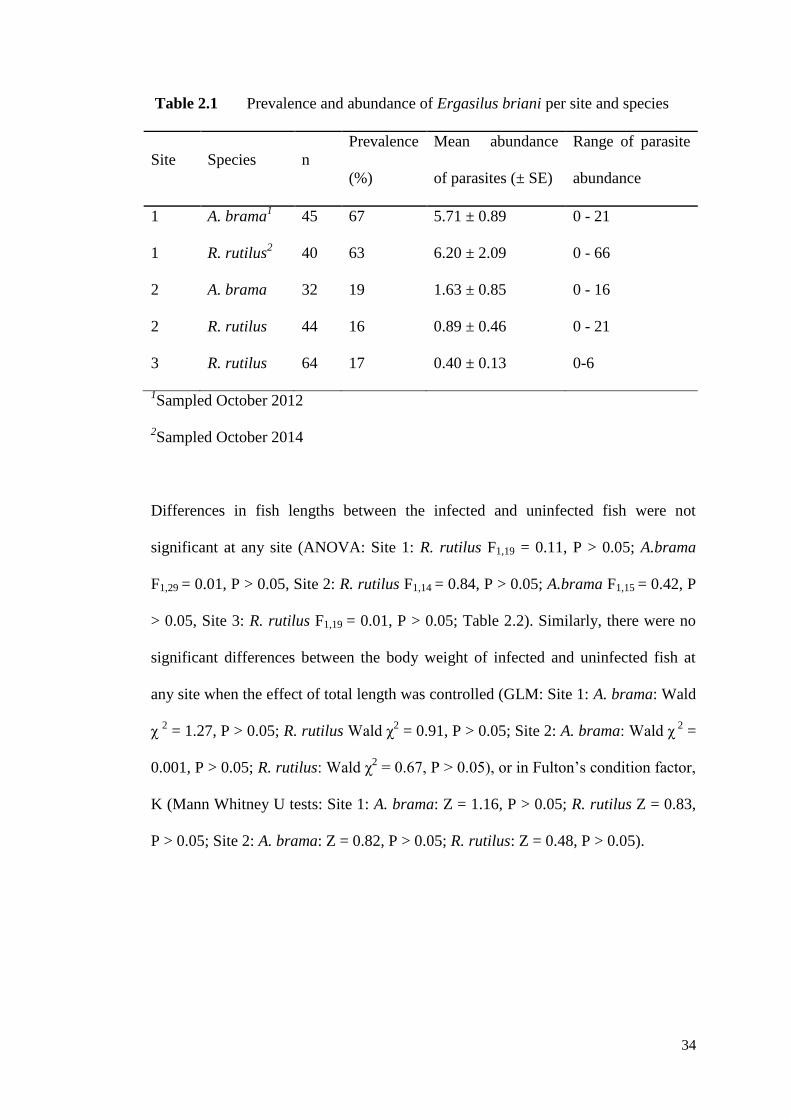
34
Table 2.1 Prevalence and abundance of Ergasilus briani per site and species
Site Species n
Prevalence
(%)
Mean abundance
of parasites (± SE)
Range of parasite
abundance
1 A. brama1 45 67 5.71 ± 0.89 0 - 21
1 R. rutilus2 40 63 6.20 ± 2.09 0 - 66
2 A. brama 32 19 1.63 ± 0.85 0 - 16
2 R. rutilus 44 16 0.89 ± 0.46 0 - 21
3 R. rutilus 64 17 0.40 ± 0.13 0-6
1Sampled October 2012
2Sampled October 2014
Differences in fish lengths between the infected and uninfected fish were not
significant at any site (ANOVA: Site 1: R. rutilus F1,19 = 0.11, P > 0.05; A.brama
F1,29 = 0.01, P > 0.05, Site 2: R. rutilus F1,14 = 0.84, P > 0.05; A.brama F1,15 = 0.42, P
> 0.05, Site 3: R. rutilus F1,19 = 0.01, P > 0.05; Table 2.2). Similarly, there were no
significant differences between the body weight of infected and uninfected fish at
any site when the effect of total length was controlled (GLM: Site 1: A. brama: Wald
χ 2 = 1.27, P > 0.05; R. rutilus Wald χ
2 = 0.91, P > 0.05; Site 2: A. brama: Wald χ
2 =
0.001, P > 0.05; R. rutilus: Wald χ2 = 0.67, P > 0.05), or in Fulton’s condition factor,
K (Mann Whitney U tests: Site 1: A. brama: Z = 1.16, P > 0.05; R. rutilus Z = 0.83,
P > 0.05; Site 2: A. brama: Z = 0.82, P > 0.05; R. rutilus: Z = 0.48, P > 0.05).
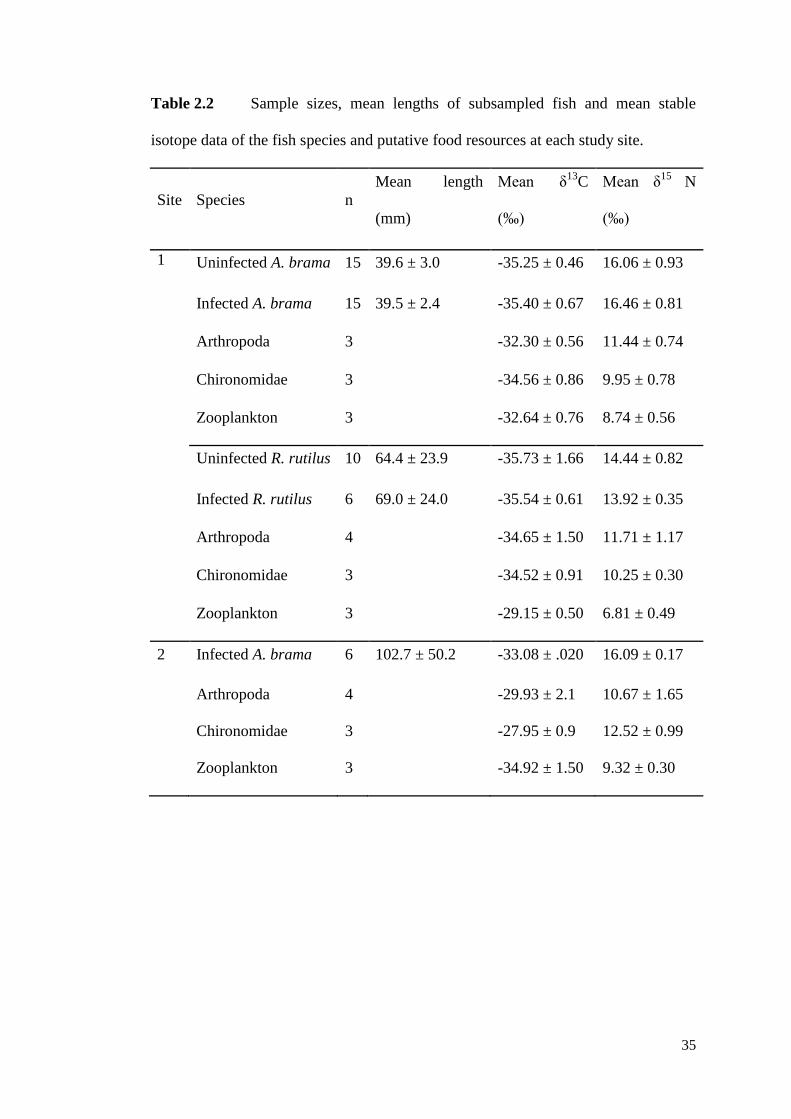
35
Table 2.2 Sample sizes, mean lengths of subsampled fish and mean stable
isotope data of the fish species and putative food resources at each study site.
Site Species n
Mean length
(mm)
Mean δ13
C
(‰)
Mean δ15
N
(‰)
1 Uninfected A. brama 15 39.6 ± 3.0 -35.25 ± 0.46 16.06 ± 0.93
Infected A. brama 15 39.5 ± 2.4 -35.40 ± 0.67 16.46 ± 0.81
Arthropoda 3
-32.30 ± 0.56 11.44 ± 0.74
Chironomidae 3
-34.56 ± 0.86 9.95 ± 0.78
Zooplankton 3 -32.64 ± 0.76 8.74 ± 0.56
Uninfected R. rutilus 10 64.4 ± 23.9 -35.73 ± 1.66 14.44 ± 0.82
Infected R. rutilus 6 69.0 ± 24.0 -35.54 ± 0.61 13.92 ± 0.35
Arthropoda 4
-34.65 ± 1.50 11.71 ± 1.17
Chironomidae 3
-34.52 ± 0.91 10.25 ± 0.30
Zooplankton 3 -29.15 ± 0.50 6.81 ± 0.49
2 Infected A. brama 6 102.7 ± 50.2 -33.08 ± .020 16.09 ± 0.17
Arthropoda 4
-29.93 ± 2.1 10.67 ± 1.65
Chironomidae 3
-27.95 ± 0.9 12.52 ± 0.99
Zooplankton 3 -34.92 ± 1.50 9.32 ± 0.30
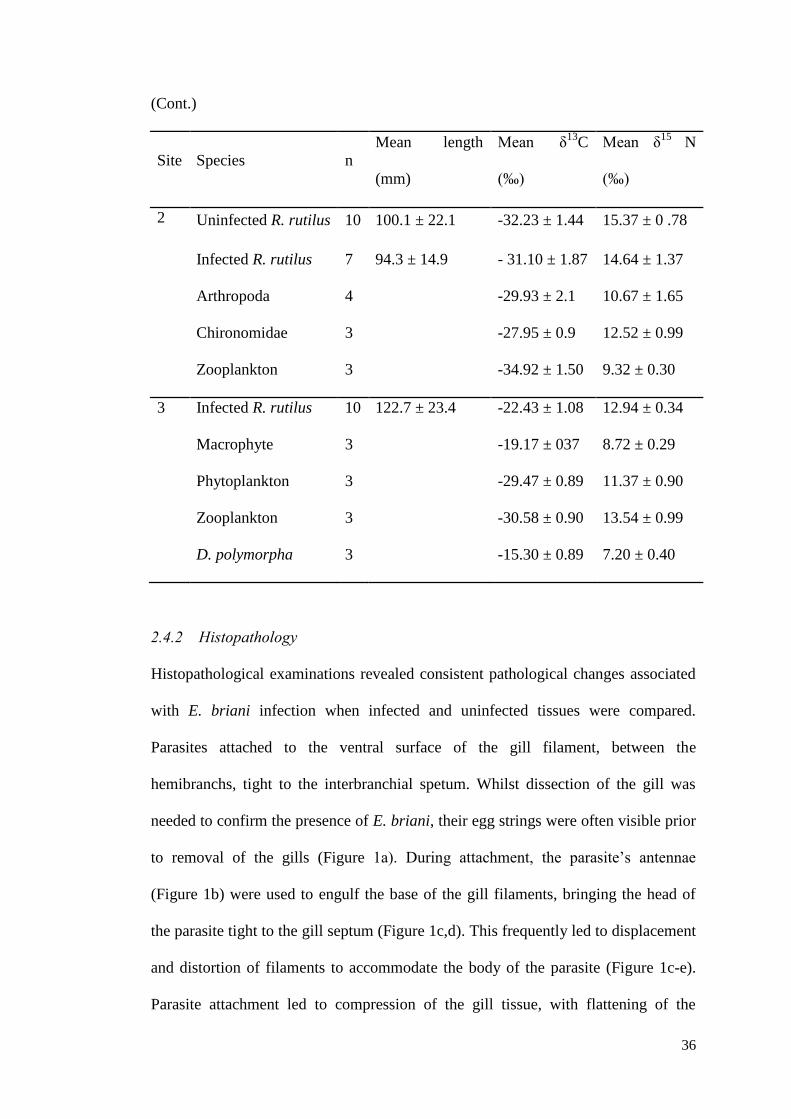
36
(Cont.)
Site Species n
Mean length
(mm)
Mean δ13
C
(‰)
Mean δ15
N
(‰)
2 Uninfected R. rutilus 10 100.1 ± 22.1 -32.23 ± 1.44 15.37 ± 0 .78
Infected R. rutilus 7 94.3 ± 14.9 - 31.10 ± 1.87 14.64 ± 1.37
Arthropoda 4
-29.93 ± 2.1 10.67 ± 1.65
Chironomidae 3
-27.95 ± 0.9 12.52 ± 0.99
Zooplankton 3 -34.92 ± 1.50 9.32 ± 0.30
3 Infected R. rutilus 10 122.7 ± 23.4 -22.43 ± 1.08 12.94 ± 0.34
Macrophyte 3
-19.17 ± 037 8.72 ± 0.29
Phytoplankton 3
-29.47 ± 0.89 11.37 ± 0.90
Zooplankton 3
-30.58 ± 0.90 13.54 ± 0.99
D. polymorpha 3 -15.30 ± 0.89 7.20 ± 0.40
2.4.2 Histopathology
Histopathological examinations revealed consistent pathological changes associated
with E. briani infection when infected and uninfected tissues were compared.
Parasites attached to the ventral surface of the gill filament, between the
hemibranchs, tight to the interbranchial spetum. Whilst dissection of the gill was
needed to confirm the presence of E. briani, their egg strings were often visible prior
to removal of the gills (Figure 1a). During attachment, the parasite’s antennae
(Figure 1b) were used to engulf the base of the gill filaments, bringing the head of
the parasite tight to the gill septum (Figure 1c,d). This frequently led to displacement
and distortion of filaments to accommodate the body of the parasite (Figure 1c-e).
Parasite attachment led to compression of the gill tissue, with flattening of the
37
epithelium (Figure 1d,e). This was often accompanied by hyperplasia, localised
haemorrhaging, epithelial erosion and compression of blood vessels underlying the
body of the parasite (Figure 1e). Although no direct evidence for parasite feeding
was observed, localised loss and compression of gill epithelium was often apparent
adjacent to the mouth (Figure 1f).
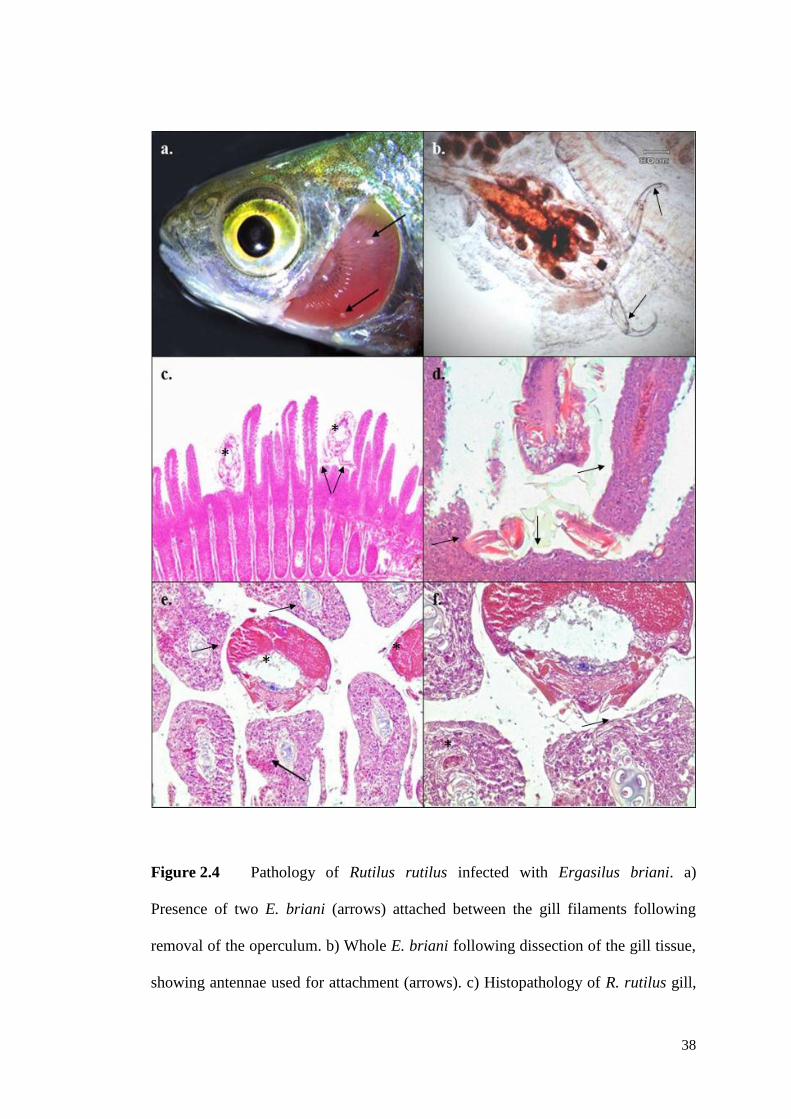
38
Figure 2.4 Pathology of Rutilus rutilus infected with Ergasilus briani. a)
Presence of two E. briani (arrows) attached between the gill filaments following
removal of the operculum. b) Whole E. briani following dissection of the gill tissue,
showing antennae used for attachment (arrows). c) Histopathology of R. rutilus gill,
39
with attachment of two E. briani (*) tight to interbranchial septum with displacement
of filaments. The antennae can been seen engulfing multiple filaments (arrow). d)
Compression and distortion of gill tissue (arrow) adjacent to E. briani, indicative of
forceful attachment to the base of the gill filaments. e) Transverse section through
infected gill arch, with multiple E. briani (*) attached between the hemibranchs, with
compression and erosion of epithelium, localised haemorrhage (**) and
displacement of filaments. f) Gill tissue adjacent to E. briani, showing epithelial loss
and compression, with constriction of blood vessel underlying the parasite (arrow).
Normal vessel shown away from the immediate site of parasite attachment (*).
2.4.3 Stable isotope metrics
The differences in the mean values of δ13
C and δ15
N between the infected and
uninfected fish were not significant for any of the species at any site (Mann Whitney:
δ13
C: Site 1: A. brama Z = 0.57, P > 0.05; R. rutilus Z = 0.23, P > 0.05 Site 2: A.
brama Z = 1.19, P > 0.05; R. rutilus Z = 1.80, P > 0.05; Site 3: R. rutilus Z = 0.01, P
> 0.05; δ 15N: Site 1: A. brama Z = 0.57, P > 0.05; R. rutilus Z = 0.16, P > 0.05; Site
2: A. brama Z = 1.30, P > 0.05; R. rutilus Z = 1.03, P > 0.05; Site 3: R. rutilus Z =
1.48, P > 0.05) (Table 2.2). There was, however, a consistent pattern of trophic niche
size (as SEAc) being considerably higher in the uninfected sub-set of fish when
compared to their infected conspecifics (Table 2.3), with very few outliers sitting
outside of these core niches. The extent of the overlap between the tropic niches of
each sub-set of the populations was high, with infected A.brama sharing 95 and 100
% of trophic space with uninfected A. brama in Sites 1 and 2 respectively, and
infected R. rutilus shared 91, 69 and 73 % of trophic niche space with uninfected R.
rutilus in Sites 1, 2 and 3 respectively. Where R. rutilis and A. brama were present in
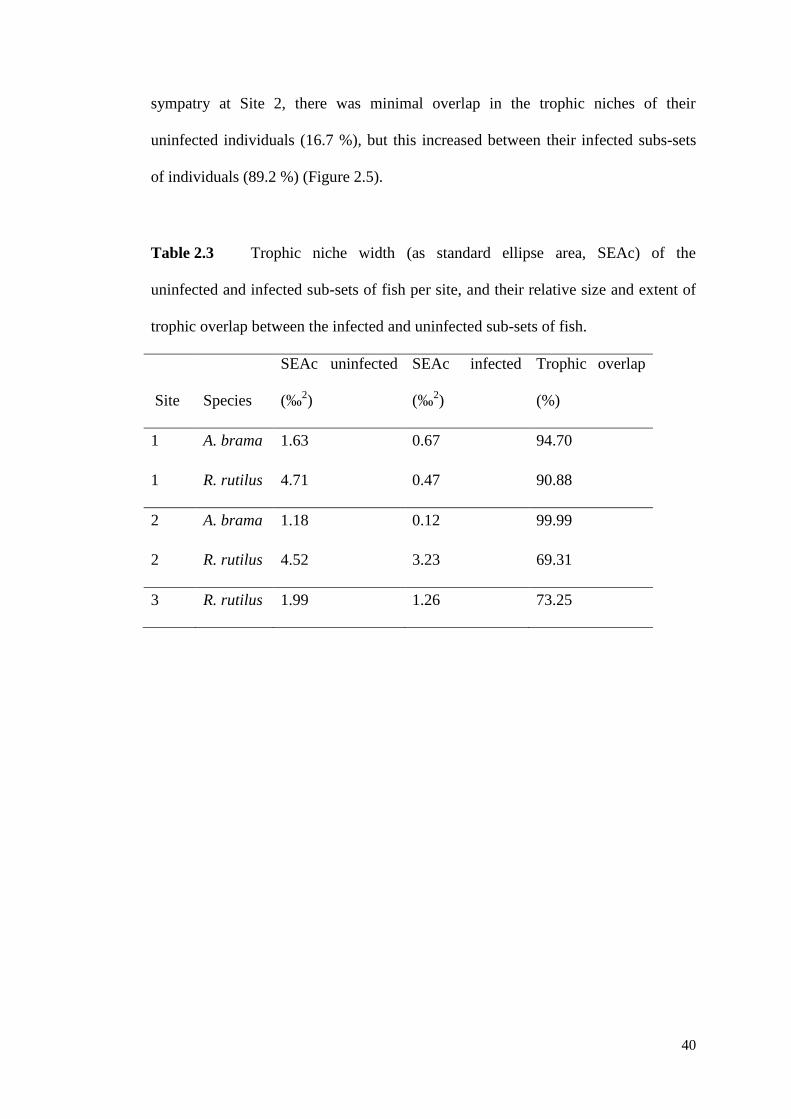
40
sympatry at Site 2, there was minimal overlap in the trophic niches of their
uninfected individuals (16.7 %), but this increased between their infected subs-sets
of individuals (89.2 %) (Figure 2.5).
Table 2.3 Trophic niche width (as standard ellipse area, SEAc) of the
uninfected and infected sub-sets of fish per site, and their relative size and extent of
trophic overlap between the infected and uninfected sub-sets of fish.
Site Species
SEAc uninfected
(‰2)
SEAc infected
(‰2)
Trophic overlap
(%)
1 A. brama 1.63 0.67 94.70
1 R. rutilus 4.71 0.47 90.88
2 A. brama 1.18 0.12 99.99
2 R. rutilus 4.52 3.23 69.31
3 R. rutilus 1.99 1.26 73.25
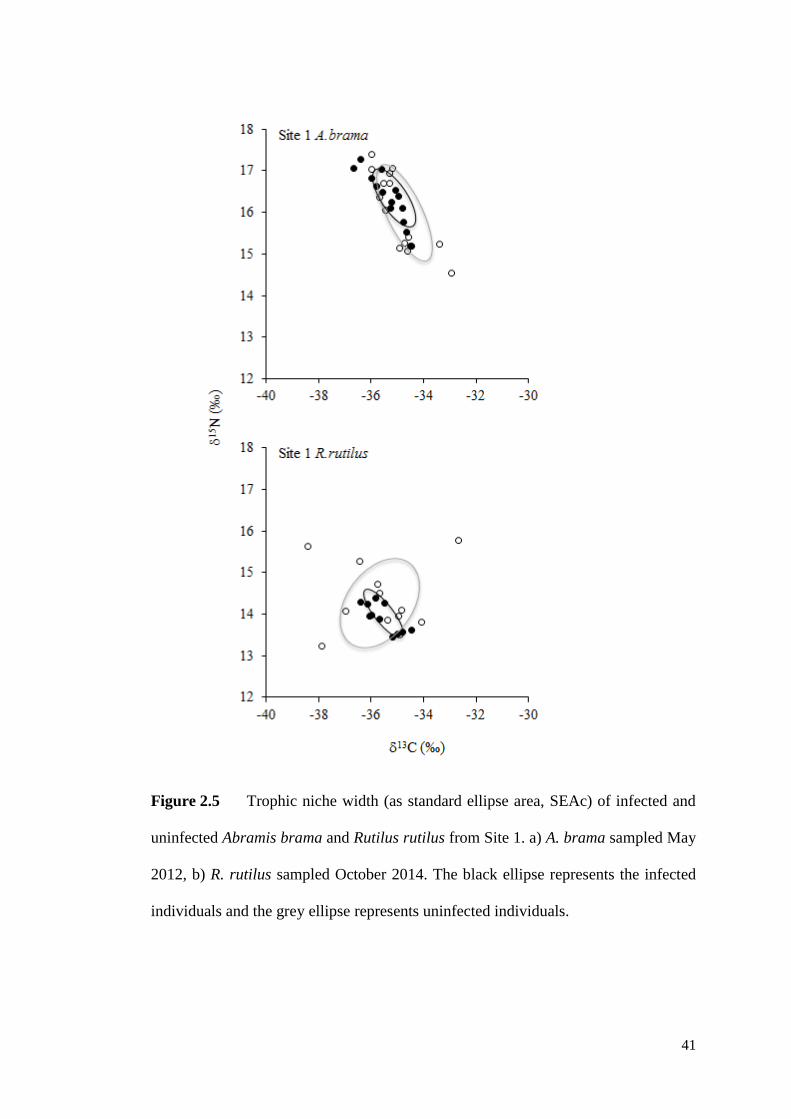
41
Figure 2.5 Trophic niche width (as standard ellipse area, SEAc) of infected and
uninfected Abramis brama and Rutilus rutilus from Site 1. a) A. brama sampled May
2012, b) R. rutilus sampled October 2014. The black ellipse represents the infected
individuals and the grey ellipse represents uninfected individuals.
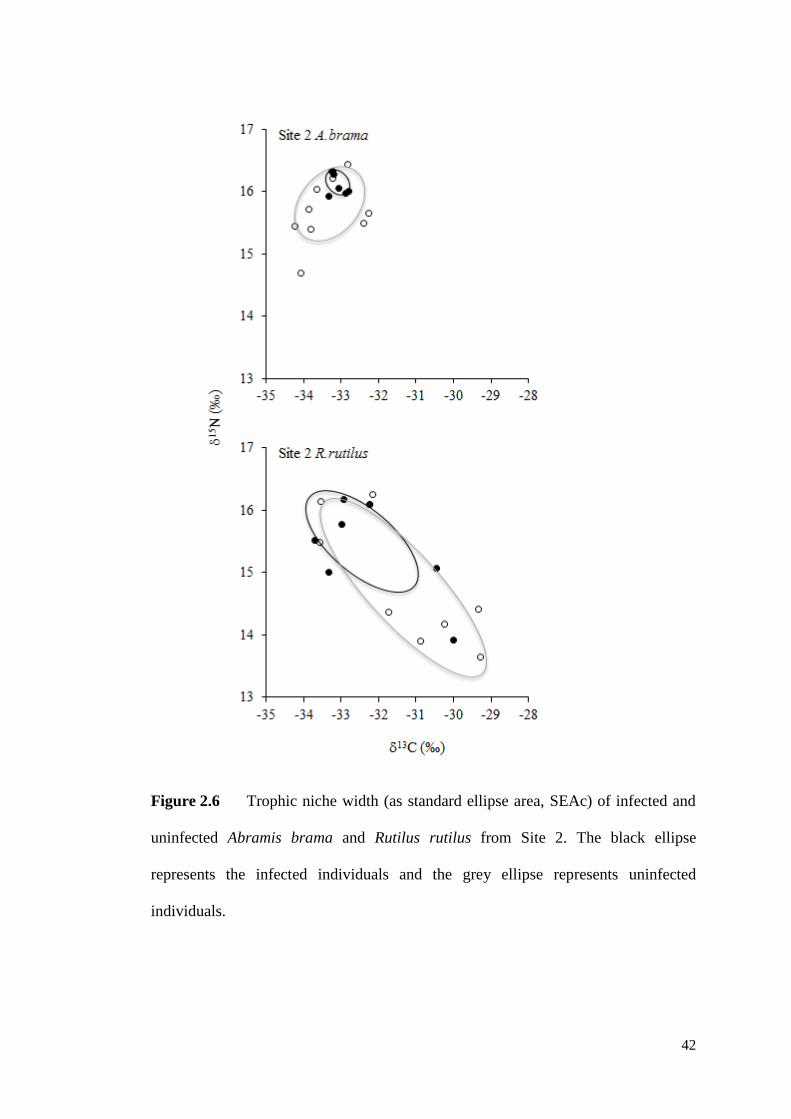
42
Figure 2.6 Trophic niche width (as standard ellipse area, SEAc) of infected and
uninfected Abramis brama and Rutilus rutilus from Site 2. The black ellipse
represents the infected individuals and the grey ellipse represents uninfected
individuals.
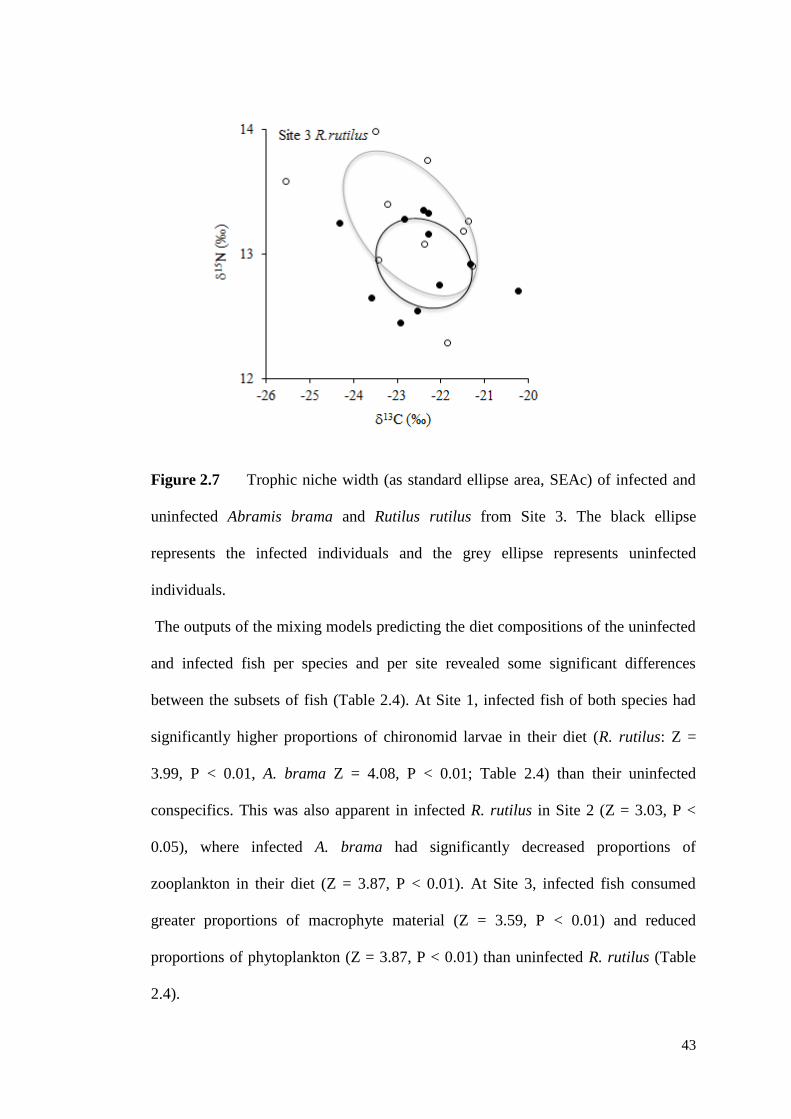
43
Figure 2.7 Trophic niche width (as standard ellipse area, SEAc) of infected and
uninfected Abramis brama and Rutilus rutilus from Site 3. The black ellipse
represents the infected individuals and the grey ellipse represents uninfected
individuals.
The outputs of the mixing models predicting the diet compositions of the uninfected
and infected fish per species and per site revealed some significant differences
between the subsets of fish (Table 2.4). At Site 1, infected fish of both species had
significantly higher proportions of chironomid larvae in their diet (R. rutilus: Z =
3.99, P < 0.01, A. brama Z = 4.08, P < 0.01; Table 2.4) than their uninfected
conspecifics. This was also apparent in infected R. rutilus in Site 2 (Z = 3.03, P <
0.05), where infected A. brama had significantly decreased proportions of
zooplankton in their diet (Z = 3.87, P < 0.01). At Site 3, infected fish consumed
greater proportions of macrophyte material (Z = 3.59, P < 0.01) and reduced
proportions of phytoplankton (Z = 3.87, P < 0.01) than uninfected R. rutilus (Table
2.4).
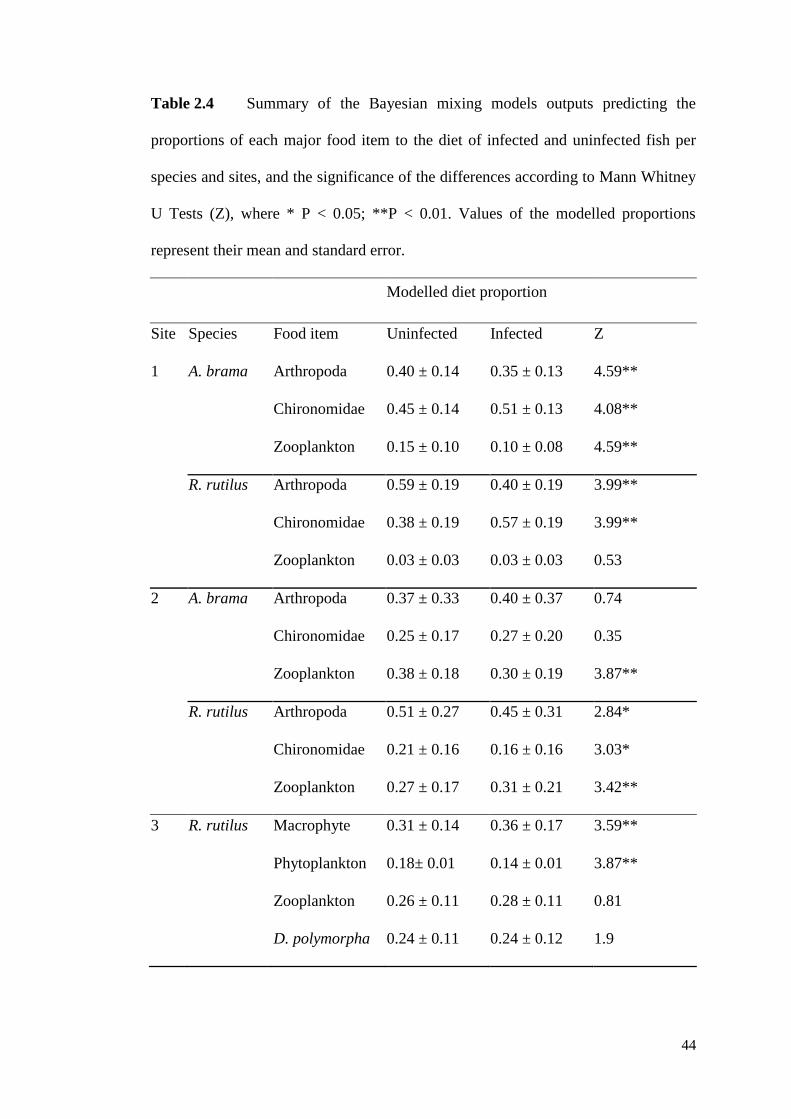
44
Table 2.4 Summary of the Bayesian mixing models outputs predicting the
proportions of each major food item to the diet of infected and uninfected fish per
species and sites, and the significance of the differences according to Mann Whitney
U Tests (Z), where * P < 0.05; **P < 0.01. Values of the modelled proportions
represent their mean and standard error.
Modelled diet proportion
Site Species Food item Uninfected Infected Z
1 A. brama Arthropoda 0.40 ± 0.14 0.35 ± 0.13 4.59**
Chironomidae 0.45 ± 0.14 0.51 ± 0.13 4.08**
Zooplankton 0.15 ± 0.10 0.10 ± 0.08 4.59**
R. rutilus Arthropoda 0.59 ± 0.19 0.40 ± 0.19 3.99**
Chironomidae 0.38 ± 0.19 0.57 ± 0.19 3.99**
Zooplankton 0.03 ± 0.03 0.03 ± 0.03 0.53
2 A. brama Arthropoda 0.37 ± 0.33 0.40 ± 0.37 0.74
Chironomidae 0.25 ± 0.17 0.27 ± 0.20 0.35
Zooplankton 0.38 ± 0.18 0.30 ± 0.19 3.87**
R. rutilus Arthropoda 0.51 ± 0.27 0.45 ± 0.31 2.84*
Chironomidae 0.21 ± 0.16 0.16 ± 0.16 3.03*
Zooplankton 0.27 ± 0.17 0.31 ± 0.21 3.42**
3 R. rutilus Macrophyte 0.31 ± 0.14 0.36 ± 0.17 3.59**
Phytoplankton 0.18± 0.01 0.14 ± 0.01 3.87**
Zooplankton 0.26 ± 0.11 0.28 ± 0.11 0.81
D. polymorpha 0.24 ± 0.11 0.24 ± 0.12 1.9
45
2.5 Discussion
Infection of R. rutilus and A. brama by E. briani resulted in gross pathological
changes characterised by displacement of gill filaments, loss and compression of
epithelium, hyperplasia, and localised haemorrhaging within the filaments as a
consequence of parasite attachment. This is consistent with pathological changes
associated with other Ergasilid parasites (Alston and Lewis 1994; Dezfuli et al.
2003). When the trophic niche widths of infected and uninfected fishes were
compared, these differed as per the prediction and revealed a general and consistent
pattern of trophic niche constriction in the infected fishes, suggesting that rather than
switching to alternative food items, the infected fishes consumed specific food items
that were also within the dietary range of uninfected individuals. Despite this diet
specialisation resulting in the trophic niche of infected individuals overlapping with
the niche width of the subset of the infected individuals of the other species, this
dietary specialisation appeared sufficient to maintain their energetic requirements,
given that infection did not adversely affect their individual condition, contrary to
the prediction.
Optimum foraging theory models typically assume that individuals rank alternative
resources according to their energetic value per unit handling time, with this
dependent on the resource traits and phenotypic capacity of individuals to capture,
handle and to digest those resources (Araujo et al. 2011). This suggests individuals
will feed on the most valuable resources, ignoring lower-value resources when
search and handling time could be better spent searching for more valuable ones
(Bolnick et al. 2003). Thus, niche variation between individuals is largely dependent
on the diversity and abundance of available resources versus the phenotypic traits of
46
the individual (Crowden and Broom 1980; Stephens and Krebs 1986). The outputs
here, revealing that infected fishes had increased specialisation in their trophic niche,
were therefore likely to be associated with the phenotypic changes resulting from the
infection pathology.
The outputs of this study provided strong evidence from field studies that parasitism
can be a driver of trophic niche specialisation. However, in the absence of
experimental study, the actual causal mechanisms involved beyond the infections
were unable to be tested. Nevertheless, parasites are recognised as impacting host
foraging efficiency through a variety of physiological, pathological and behavioural
mechanisms, resulting in, for example, altered time budgets through increased time
spent foraging (Giles 1983; Barber et al. 1995), and alterations in diet composition
compared with non-infected individuals (Milinski 1984). Moreover, in other animals
infected with gill parasites, shifts in heart rate and oxygen consumption have been
recorded (Schuwerack et al. 2001), along with reduced haemoglobin levels (Montero
et al. 2004), which impact swimming efficacy (Duthie and Hughes 1987) and the
ability to maintain normal intestinal function while swimming (Thorarensen et al.
1993). In other Ergasilid parasites, gill damage also results in respiratory
dysfunction, osmoregulatory failure, and haematological disruption (e.g. Hogans
1989; Abdelhalim et al. 1991; Alston and Lewis 1994; Dezfuli et al. 2003).
Consequently, it is speculated that the infected fishes in this study increased their
predation of prey that were highly abundant and/ or relatively slow moving, and thus
required relatively low energy expenditure to capture and handle during foraging, as
a consequence of some energetic costs associated with infection that were not
quantified experimentally and thus require further investigation.
47
Where there are sufficient numbers of predators focusing on specific prey items then
this predation pressure can impact these prey populations. Although items such as
chironomid larvae tend to ubiquitous and numerous in freshwaters (Cranston et al.
1995), increased predation pressure by infected fishes could result in reduced
abundances, potentially invoking cascading effects, particularly if the infected
individuals have to increase their food intake to maintain their condition. This is
because parasitism can significantly increase predation pressure on prey populations
with, for example, Gammarus pulex infected with the acanthocephalan parasite
Echinorhynchus truttae consuming significantly more Asellus aquaticus than
uninfected conspecifics, enabling them to maintain their condition despite the
infection (Dick et al. 2010). For predator populations containing infected individuals,
whilst specialisation may be beneficial at the population level as it appears to
facilitate the survival of infected individuals despite the pathological impacts
incurred (Lomnicki 1988), the sub-set of specialised individuals might be at greater
risk from external pressures (Durell 2000). For example, the increased time spent
foraging and/ or the utilisation of different habitats to preferentially forage on
specific prey items, allied with the potential for their anti-predator behaviours being
modified, might result in increased predation risk (Lafferty, 1999; Barber et al. 2000;
Ward et al. 2002). Indeed, when infected with Schistocephalus solidus, three-spined
stickleback Gasterosteus aculeatus spend more time foraging as a compensatory
mechanism (Giles, 1987), resulting in a trade-off with anti-predator behaviours
(Giles, 1983), and thus incurring a greater likelihood of being predated by a
piscivorous bird (Milinski, 1985). Similarly, infected banded killifish Fundulus
diaphanous are more likely to occupy the front of shoals, a position that optimises
48
feeding opportunities but also carries the greatest risk of predation (Ward et al.
2002).
The focal parasite of this study, E. briani, is an introduced parasite to the UK,
arriving as a consequence of fish being moved within aquaculture and fisheries
(Fryer and Andrews, 1983). It thus represents a parasite that was successfully
introduced into the UK, despite such movements often resulting in non-native
parasites failing to establish through, for example, enemy release (Sheath et al.
2015). The consequences of introduced parasites within native communities can be
varied, but can result in disease outbreaks resulting in high fish losses. For example,
the rosette agent Sphareothecum destruens, spread via the invasive topmouth
gudgeon Pseudorasbora parva, can cause high mortality rates in naïve fishes
(Andreou et al. 2012) and the impact of the introduced parasitic crustacean
Gyrodactylus salaris in Norway was the collapse of wild salmon populations in 45
Norwegian rivers (Peeler and Thrush 2004) with an economic cost the in excess of
US $500,000,000 (Hansen et al. 2003). Whilst the impact of E. briani here was much
less dramatic, our outputs suggested that ecological alterations did occur as a
potential cost of infection, with modification of host diet composition that
constricted the trophic niche of the host component of the population.
Studies on trophic niche specialisation have identified a range of causal factors,
particularly inter- and intra-specific competitive processes, predation pressure and
impact and the exploitation of new ecological opportunities (Araujo et al. 2011). The
role of parasitism in trophic niche specialisation has, conversely, received very little
attention. Consequently, our findings that the trophic niches of individuals infected
49
with E. briani were consistently constricted and specialised across five fish
populations are important. They strongly suggest that the host consequences of
infection, including pathological impacts, could also be an important driver of niche
constriction that has been largely overlooked and thus should be incorporated into
future studies on the ecological drivers of trophic niche specialisation. They also
suggest infection could have some consequences for food web structure (Chapters 5
and 6).
50
3. Temporal changes in growth, condition and trophic niche in
juvenile Cyprinus carpio infected with a non-native parasite
This chapter is based on the published article which is presented in Appendix 6:
Pegg, J., Andreou, D., Williams, C. F. and Britton, J. R., 2015. Temporal changes in
growth, condition and trophic niche in juvenile Cyprinus carpio infected with a non-
native parasite. Parasitology. doi:10.1017/S0031182015001237
51
3.1 Abstract
In host-parasite relationships, parasite prevalence and abundance can vary over time,
potentially impacting how hosts are affected by infection. Here, the pathology,
growth, condition and diet of a juvenile Cyprinus carpio cohort infected with the
non-native cestode Bothriocephalus acheilognathi was measured in October 2012
(end of their first summer of their life), April 2013 (end of first winter) and October
2013 (end of second summer). Pathology revealed consistent impacts, including
severe compression and architectural modification of the intestine. At the end of the
first summer, there was no difference in lengths and condition of the infected and
uninfected fish. However, at the end of the winter period, the condition of infected
fish was significantly reduced and by the end of their second summer, the infected
fish were significantly smaller and remained in significantly reduced condition.
Their diets were significantly different over time; infected fish consumed
significantly higher proportions of food items <53 μm than uninfected individuals, a
likely consequence of impaired functional traits due to infection. Thus, the sub-lethal
impacts of this parasite, namely changes in histopathology, growth and trophic niche
were dependent on time and/or age of the fish.
3.2 Introduction
Parasite infections often negatively impact the fitness of their hosts, can modulate
the dynamics of host populations, and can have consequences for non-host
populations through changes in the strength of interspecific competitive relationships
(Power & Mitchell 2004). Host responses to infection include altering their life-
history traits prior to maturity when individuals allocate more resources to
reproduction than growth and survival, as this ensures reproduction before resource
52
depletion and/or castration (Michalakis & Hochberg 1994; Agnew et al. 2000). This
can affect their reproductive effort (Christe et al. 1996; Sorci et al. 1997) and body
size (Arnott et al. 2000). Understanding these infection consequences for hosts at the
individual level then enables understanding of infection impacts at the population
and community levels (Pagan et al. 2008).
In freshwaters, the opportunity for fish parasites to be moved between localities is
high due to the introduction pathways of aquaculture, the ornamental fish trade and
sport angling (Gozlan et al. 2010; Section 1.1). Bothriocephalus acheilognathi is a
cestode that is originally from Asia (Xiang-Hua 2007) that has been introduced
around the world through the global aquaculture trade in Asian grass carp
Ctenopharyngodon idella and common carp Cyprinus carpio (Salgado-Maldonado
& Pineda-López 2003). Whilst the parasite has a broad host range, having been
recorded in over 200 fish species, pathological consequences appear to be more
severe in fishes of the family Cyprinidae (Williams et al. 2011; Linder et al. 2012;
Section 1.8). It has a complex lifecycle involving an intermediate copepod host and a
definitive fish host (Linder et al. 2012) (Figure 1.2). While fish are normally infected
by consuming infected copepods, there is some evidence that adult worms can
additionally be transmitted directly to piscivorous fish that prey on infected fish
(Hansen et al. 2007). Consequences for fish hosts include damage to the intestinal
tract, loss of condition, impacts on foraging behaviours and mortality (Britton et al.
2011), with high rates of mortality recorded in hatchery reared C. carpio (Scholz et
al. 2011). Non-lethal consequences of B. acheilognathi infection also include
changes in trophic ecology. For example, in a population of juvenile C. carpio,
application of stable isotope analysis on infected and uninfected individuals
53
suggested infected fish were feeding on items lower in the food web, resulting in
energetic consequences (Britton et al. 2011).
To date, studies on the trophic ecology of fish infected with B. acheilognathi have
focussed on single samples taken during a single growth season (e.g. Britton et al.
2011). This provides limited knowledge on how their trophic niches vary seasonally
and in relation to parasite prevalence and abundance, and how this affects metrics
such as growth and condition over longer time periods. This is important, as for
many host populations, parasite incidence varies seasonally due to factors including
the interactions of shifts in the abundance of intermediate hosts, the feeding and/ or
reproductive activities of final hosts, the reproductive activity of parasites, and the
immune response to infection (Altizer et al. 2006). For example, seasonal changes in
levels of B. achileognathi infections, stimulated by changes in water temperature,
have been recorded in Gambusia affinis and Pimephales promelas (Granath & Esch
1983; Riggs et al. 1987). Similar seasonal changes have been observed in other
parasite/host systems, for example Öztürk and Altunel (2006) observed seasonal and
annual changes in Dactylogyrus infections across four host species. In chub Squalius
cephalus, higher condition factors and seasonal variations in gonado-somatic indices
(GSI) were associated with decreased immune function and corresponding increases
in parasite loads, suggesting differences in the seasonal energy allocation between
immune function and somatic and/ or reproductive investment (Lamkova et al.
2007).
Given the recorded trophic consequences of B. acheilognathi infection for juvenile
C. carpio (Britton et al. 2011), the aim of this study was to assess how their sub-
54
lethal consequences of infection varied over a 12 month period through tracking a
single cohort. The objectives were to: (i) quantify temporal changes in parasite
prevalence, abundance, histopathology and the energetic consequences of infection
of B. acheilognathi in juvenile C. carpio; and (ii) assess the temporal changes in the
trophic ecology and diet of juvenile C. carpio infected and uninfected with B.
acheilognathi through stable isotope analysis.
3.3 Methods
3.3.1 Sample collection and initial data collection
The study population was located in the Greater London area of the UK and where
B. acheilognathi had been recorded previously. The site was a small pond of 50 m
length, 20 m width and maximum depth 1.5 m (Figure 3.1). The sampling
programme covered two summer periods and an over-wintering period, with the
initial sample collected in early October 2012 (end of the summer period and end of
the 2012 growth season), April 2013 (end of the over-wintering period) and October
2013 (end of the summer period and end of the 2013 growth season). The pond
contained a mixed population of carp C. carpio, rudd Scardinius erythropthalmus,
and perch Perca fluviatilis. Due to fishery management operations, the mature
component of the C. carpio population was removed from the lake after spawning in
2012, thus all remaining carp were young-of-the-year. Consequently, all fish
captured in October 2012 were age 0+ and by October 2013 were 1+ years, i.e. the
captured fish throughout the study were of the same cohort, with this verified by age
analysis of their scales.
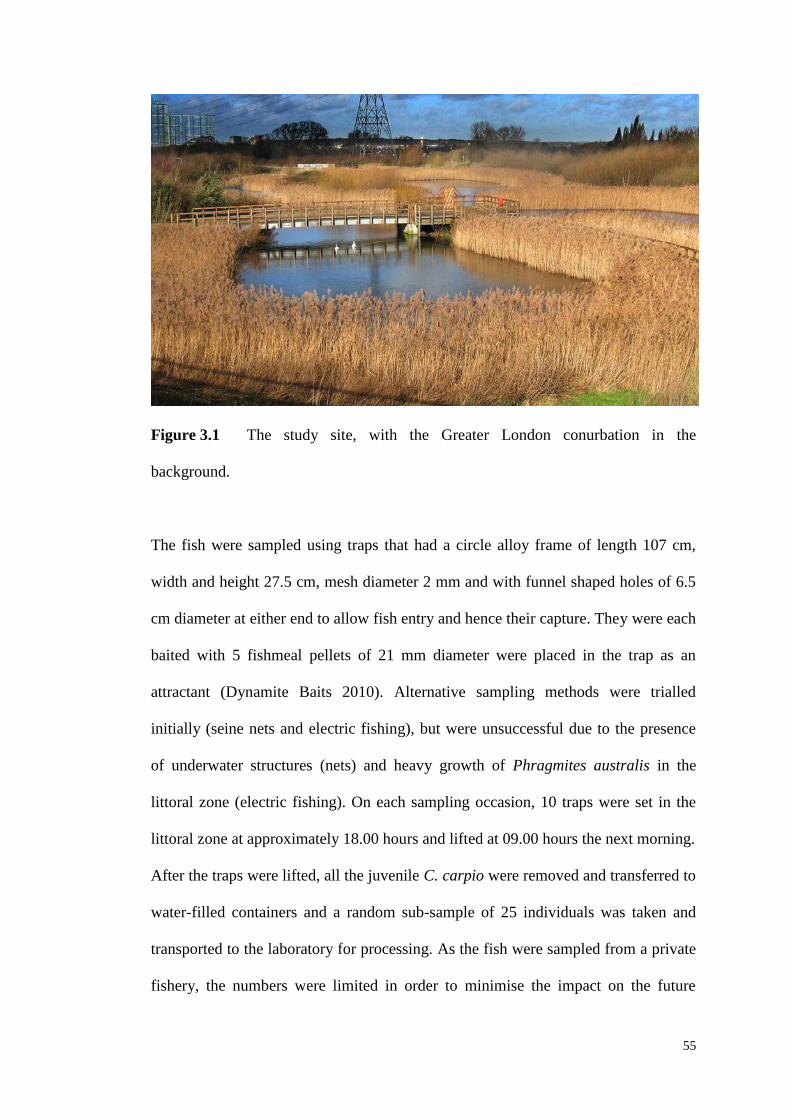
55
Figure 3.1 The study site, with the Greater London conurbation in the
background.
The fish were sampled using traps that had a circle alloy frame of length 107 cm,
width and height 27.5 cm, mesh diameter 2 mm and with funnel shaped holes of 6.5
cm diameter at either end to allow fish entry and hence their capture. They were each
baited with 5 fishmeal pellets of 21 mm diameter were placed in the trap as an
attractant (Dynamite Baits 2010). Alternative sampling methods were trialled
initially (seine nets and electric fishing), but were unsuccessful due to the presence
of underwater structures (nets) and heavy growth of Phragmites australis in the
littoral zone (electric fishing). On each sampling occasion, 10 traps were set in the
littoral zone at approximately 18.00 hours and lifted at 09.00 hours the next morning.
After the traps were lifted, all the juvenile C. carpio were removed and transferred to
water-filled containers and a random sub-sample of 25 individuals was taken and
transported to the laboratory for processing. As the fish were sampled from a private
fishery, the numbers were limited in order to minimise the impact on the future
56
angling stock, as agreed with the fishery managers. In April 2013 and October 2013,
samples of the putative food resources of the fish were also taken, covering macro-
invertebrates (through kick sampling and sweep netting with a handnet of 0.25 mm
mesh), zooplankton (through filtering 10 l of water through a net and filter of 250
μm) and phytoplankton (filtering 10 l of water through a net and filter of 53 μm). For
macro-invertebrates, triplicate samples were taken, where a sample represented
between 5 and 20 individuals of that species. Putative food resource samples were
not able to be collected in October 2012 due to logistical constraints.
In the laboratory, all fish were euthanized (anaesthetic overdose; MS-222), with
weight (W; to 0.01 g), and fork length (L; nearest mm) recorded. A detailed post-
mortem was then conducted on each individual for detecting the presence of
infections of native and non-native parasites using a standard protocol adapted from
Hoole et al. (2001; Appendix 1). Skin scrapes and internal organs were examined
with aid of low and high power microscopy to enable parasite identification. The
entire digestive tract was removed and examined under low power for detecting the
presence of intestinal parasites, including B. acheilognathi. When B. acheilognathi
was recorded, their abundance was recorded (by number, and mass to nearest 0.001
g). Hereafter, where an individual C. carpio is referred to as either infected or non-
infected, it refers to the presence/absence of B. acheilognathi in that individual
during this process. Intestinal tissue from infected and uninfected individuals was
retained and prepared for histopathology.
On completion of the post-mortem, a sample of dorsal muscle was taken from a
proportion of the fish samples (sample sizes 6 to 15 per sub-set of fish per
57
population). These, and the macro-invertebrate, zooplankton and phytoplankton
samples, were then dried at 60ºC to constant weight before being analysed for their
stable isotopes of 13
C and 15
N at the Cornell Stable Isotope Laboratory (New York,
USA) (Section 2.3.1). The initial stable isotope data outputs were in the format of
delta (δ) isotope ratios expressed per mille (‰).
3.3.2 Histopathology
Histopathology of the intestinal tract was completed to assess the pathological
changes associated with B. acheilognathi infection. Sections of intestine were
sampled from infected as well as uninfected fish. These sections were fixed in
Bouin’s fixative for 24 hours before transferring to 70% Industrial Methylated Spirit.
The tissues were trimmed, dehydrated in alcohol series, cleared and then embedded
in paraffin wax. Transverse and longitudinal sections of 3 µm were cut using a
microtome and dried at 50°C. These sections were stained using Mayer's
haematoxylin and eosin, and examined microscopically for pathological changes and
described accordingly.
3.3.3 Data analyses
Infection levels of B. acheilognathi in C. carpio were described as their prevalence
(number of infected individuals/total number of individuals 100) and abundance
(number of B. acheilognathi per host). The mass of parasite was also expressed as a
proportion of host weight to represent the parasite burden. The stable isotope data of
C. carpio were used to assess their trophic niche size and predict their diet
composition from the putative food resource data. Trophic niche size was calculated
using the metric standard ellipse area (SEAc) in the SIAR package (Parnell et al.
58
2010) in R (R Core Development Team, 2013). SEAc is a bivariate measure of the
distribution of individuals in trophic space, where each ellipse encloses ~ 40% of the
data and thus represents the core dietary niche of species and so indicates their
typical resource use (Jackson et al. 2011; Jackson et al. 2012). The subscript ‘c’ in
SEAc indicated that a small sample size correction was used due to limited sample
sizes (< 30). For each population of C. carpio on each survey date, SEAc was
calculated for two sub-sets of individuals: those infected with B. acheilognathi and
those uninfected, and the extent of the overlap of their niches determined (%).
To then predict the diet composition of each sub-set of fish, their stable isotope data,
plus those of their putative food resources, were applied to Bayesian mixing models
that estimated the relative contribution of each putative food resource to the diet of
each individual C. carpio (Moore & Semmens 2008). The models were run using the
MixSIAR GUI package in the R computing programme (R Core Development Team
2013; Stock & Semmens 2013). Given that excessive putative food resources can
cause mixing models to underperform, the data for resources with similar isotope
values were combined a priori, whilst respecting the taxon and functional affiliation
of the individual species (Phillips et al. 2005). The groups used in the models were
arthropods, zooplankton (i.e. samples captured in the net of mesh size 250 μm) and
phytoplankton (i.e. samples captured in the net of mesh size 53 μm). Isotopic
fractionation factors between resources and consumers in the models were 3.4 ‰ (±
0.98 ‰) for 15
N and 0.39 ‰ (± 1.3 ‰) for 13
C (Post 2002). Outputs were the
predicted proportion of each resource to host diet (0 to 1).
59
3.3.4 Statistical analyses
For each fish species and population infected with B. acheilognathi, differences
between the infected and uninfected hosts were tested using ANOVA for length, and
their stable isotopes of 13
C and 15
N. Condition was calculated as Fulton’s
Condition Factor (K, 100 W/L3) where L was measured in cm, with differences
between infected and uninfected fishes also tested using ANOVA. Differences
between the predicted proportions of each putative food source to the diet of infected
and uninfected fish were also tested using ANOVA. Other than the stable isotope
mixing models, all analyses were completed in SPSS v. 22.0. In all analyses, the
assumptions of normality of residuals and homoscedasticity were checked prior to
use. Where error is expressed around the mean, it represents standard error.
3.4 Results
3.4.1 Parasite prevalence and abundance
Across the three sampling periods, parasite prevalence remained relatively constant
(61, 58 and 60 % in October 2012, April 2013 and October 2013, respectively; Table
1). Parasite abundance was greatest in October 2012 (mean 10.7 ± 2.3) and lowest in
April 2013 (mean 5.4 ± 1.5) (Table 3.1). Parasite abundance was significantly
different between October 2012 and April 2013 (ANOVA: F1,45 = 9.38, P < 0.01) but
not between April 2013 and October 2013 (ANOVA: F1,45 = 1.22, P > 0.05), and
October 2012 and October 2013 (ANOVA: F1,45 = 4.05, P > 0.05). Mean parasite
burden was greatest in October 2012 (3.9 ± 0.8 %) and lowest in October 2013 (1.7
± 0.5 %). There was a significant difference between the parasite burden in October
2012 and October 2013 (ANOVA: F1,45 = 5.85, P < 0.05), but not between October
2012 and April 2013 (ANOVA: F1,45 = 1.92, P > 0.05), and April 2013 and October
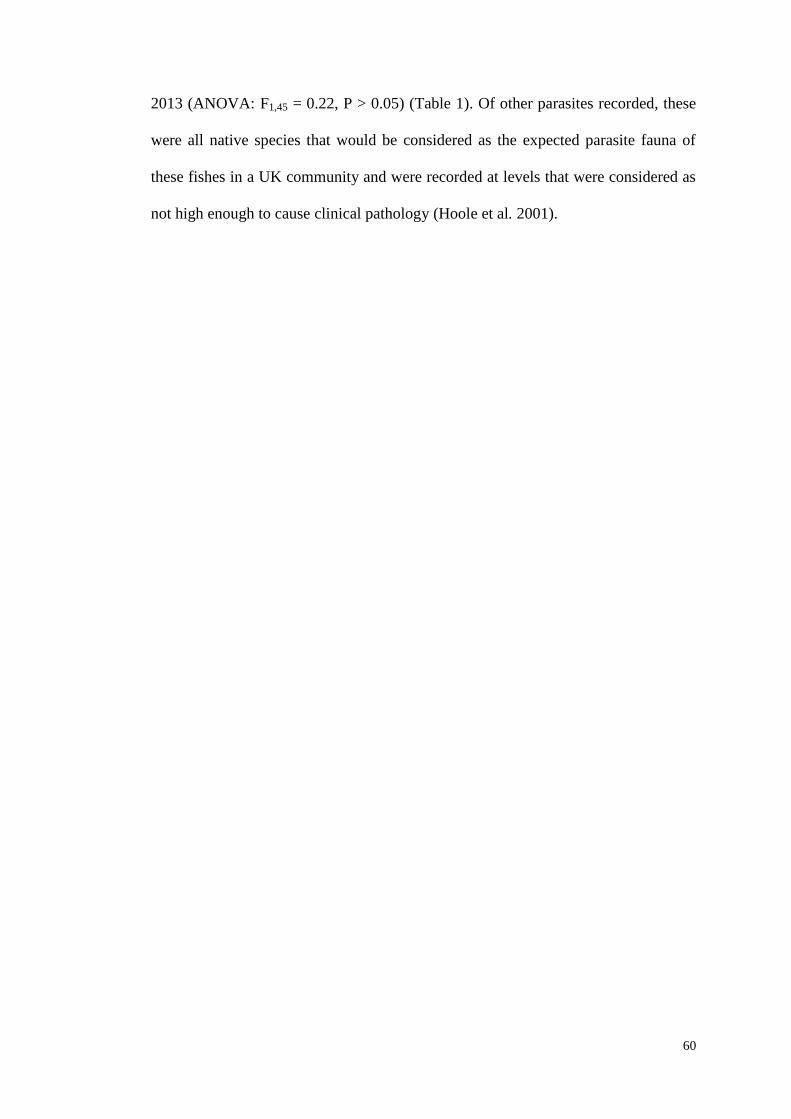
60
2013 (ANOVA: F1,45 = 0.22, P > 0.05) (Table 1). Of other parasites recorded, these
were all native species that would be considered as the expected parasite fauna of
these fishes in a UK community and were recorded at levels that were considered as
not high enough to cause clinical pathology (Hoole et al. 2001).
61
Table 3.1 Prevalence and abundance of Bothriocephalus acheilognathi in Cyprinus carpio by sampling date
Date n Prevalence (%)
Mean abundance of
parasites (± SE)
Range
Mean weight of parasite burden (percentage
of hosts weight ± SE)
Range
(%)
Oct 12 23 61 10.7 ± 2.3 0 - 35 3.9 ± 0.8 0 - 9.5
Apr 13 24 58 3.4 ± 0.9 0 - 14 2.2 ± 0.9 0 - 19.4
Oct 13 25 60 5.4 ± 1.5 0 - 26 1.7 ± 0.5 0 - 8.8
61
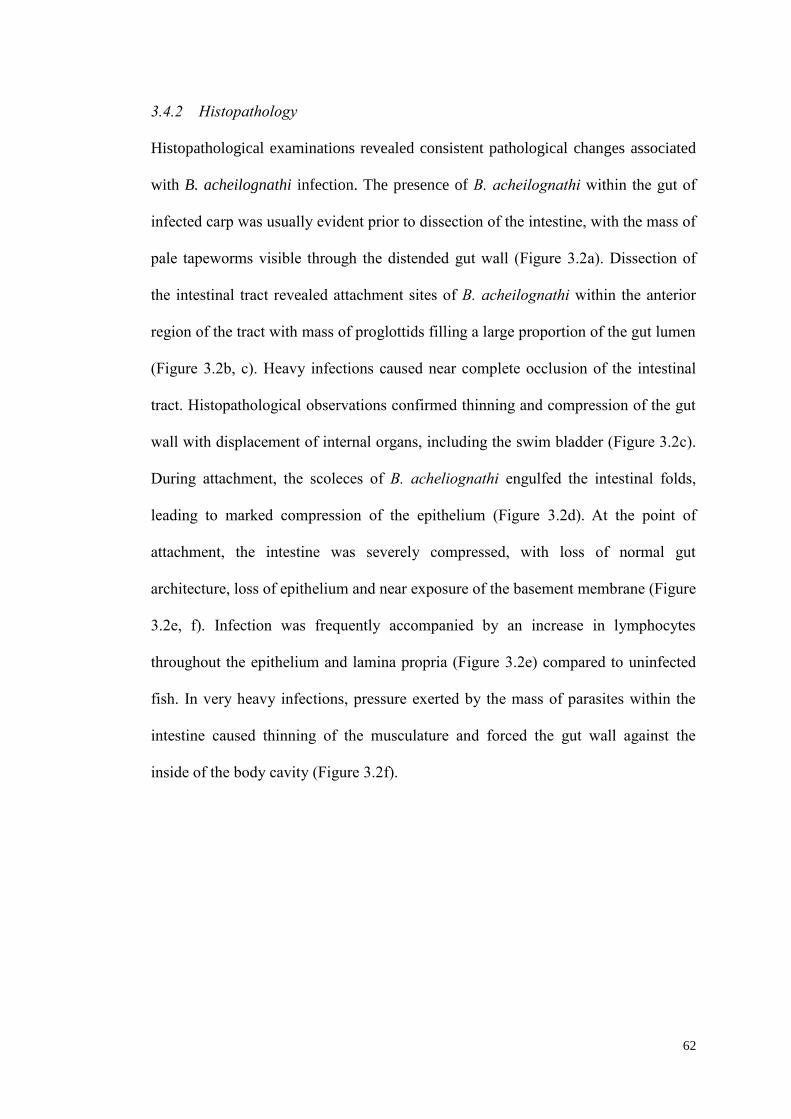
62
3.4.2 Histopathology
Histopathological examinations revealed consistent pathological changes associated
with B. acheilognathi infection. The presence of B. acheilognathi within the gut of
infected carp was usually evident prior to dissection of the intestine, with the mass of
pale tapeworms visible through the distended gut wall (Figure 3.2a). Dissection of
the intestinal tract revealed attachment sites of B. acheilognathi within the anterior
region of the tract with mass of proglottids filling a large proportion of the gut lumen
(Figure 3.2b, c). Heavy infections caused near complete occlusion of the intestinal
tract. Histopathological observations confirmed thinning and compression of the gut
wall with displacement of internal organs, including the swim bladder (Figure 3.2c).
During attachment, the scoleces of B. acheliognathi engulfed the intestinal folds,
leading to marked compression of the epithelium (Figure 3.2d). At the point of
attachment, the intestine was severely compressed, with loss of normal gut
architecture, loss of epithelium and near exposure of the basement membrane (Figure
3.2e, f). Infection was frequently accompanied by an increase in lymphocytes
throughout the epithelium and lamina propria (Figure 3.2e) compared to uninfected
fish. In very heavy infections, pressure exerted by the mass of parasites within the
intestine caused thinning of the musculature and forced the gut wall against the
inside of the body cavity (Figure 3.2f).
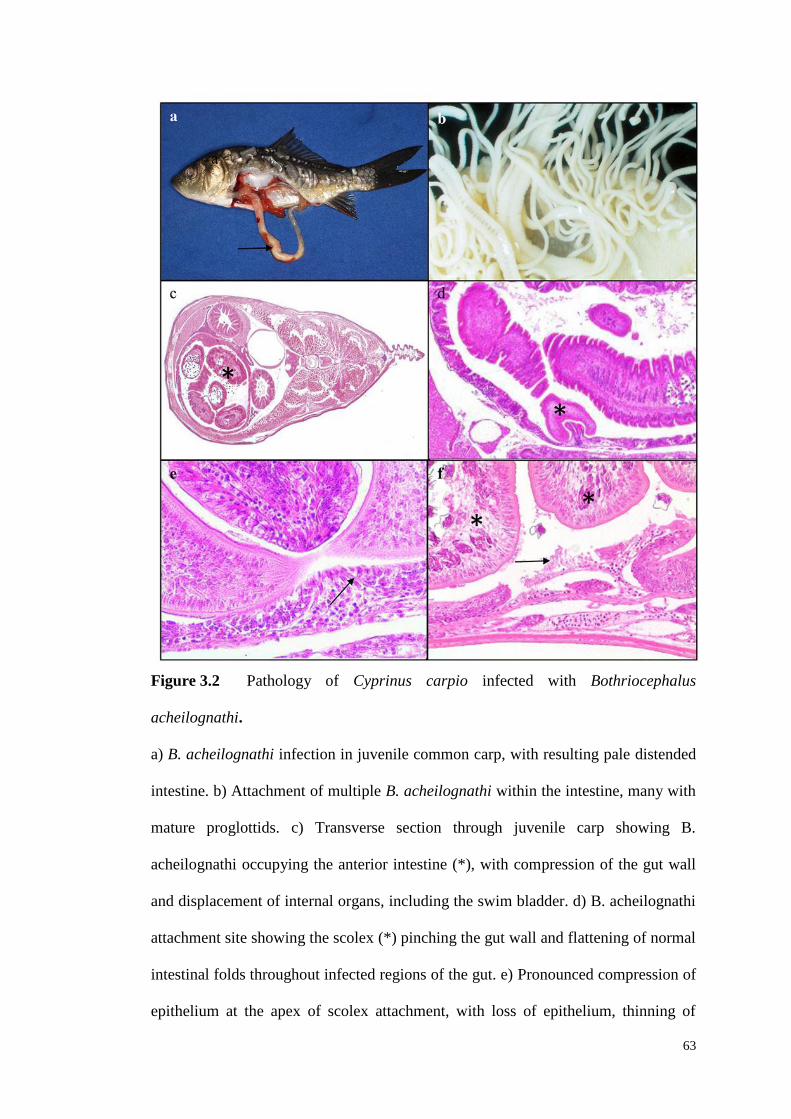
63
Figure 3.2 Pathology of Cyprinus carpio infected with Bothriocephalus
acheilognathi.
a) B. acheilognathi infection in juvenile common carp, with resulting pale distended
intestine. b) Attachment of multiple B. acheilognathi within the intestine, many with
mature proglottids. c) Transverse section through juvenile carp showing B.
acheilognathi occupying the anterior intestine (*), with compression of the gut wall
and displacement of internal organs, including the swim bladder. d) B. acheilognathi
attachment site showing the scolex (*) pinching the gut wall and flattening of normal
intestinal folds throughout infected regions of the gut. e) Pronounced compression of
epithelium at the apex of scolex attachment, with loss of epithelium, thinning of
89
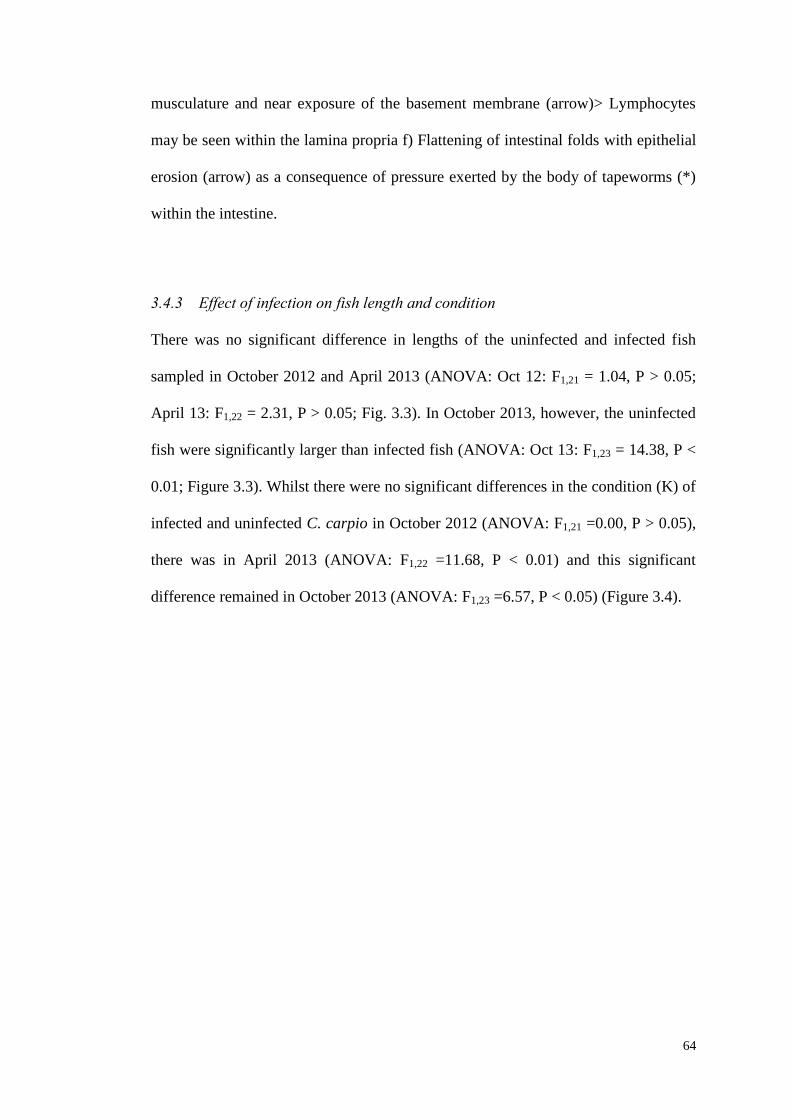
64
musculature and near exposure of the basement membrane (arrow)> Lymphocytes
may be seen within the lamina propria f) Flattening of intestinal folds with epithelial
erosion (arrow) as a consequence of pressure exerted by the body of tapeworms (*)
within the intestine.
3.4.3 Effect of infection on fish length and condition
There was no significant difference in lengths of the uninfected and infected fish
sampled in October 2012 and April 2013 (ANOVA: Oct 12: F1,21 = 1.04, P > 0.05;
April 13: F1,22 = 2.31, P > 0.05; Fig. 3.3). In October 2013, however, the uninfected
fish were significantly larger than infected fish (ANOVA: Oct 13: F1,23 = 14.38, P <
0.01; Figure 3.3). Whilst there were no significant differences in the condition (K) of
infected and uninfected C. carpio in October 2012 (ANOVA: F1,21 =0.00, P > 0.05),
there was in April 2013 (ANOVA: F1,22 =11.68, P < 0.01) and this significant
difference remained in October 2013 (ANOVA: F1,23 =6.57, P < 0.05) (Figure 3.4).
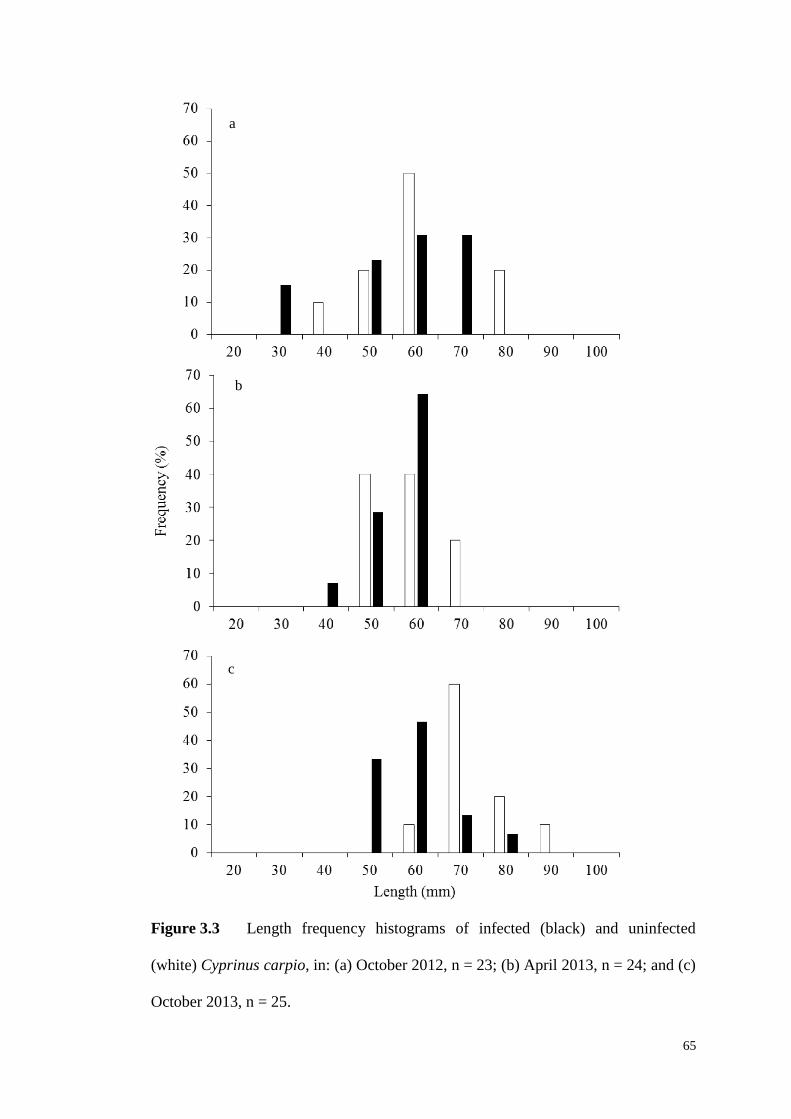
65
Figure 3.3 Length frequency histograms of infected (black) and uninfected
(white) Cyprinus carpio, in: (a) October 2012, n = 23; (b) April 2013, n = 24; and (c)
October 2013, n = 25.
a
c
b
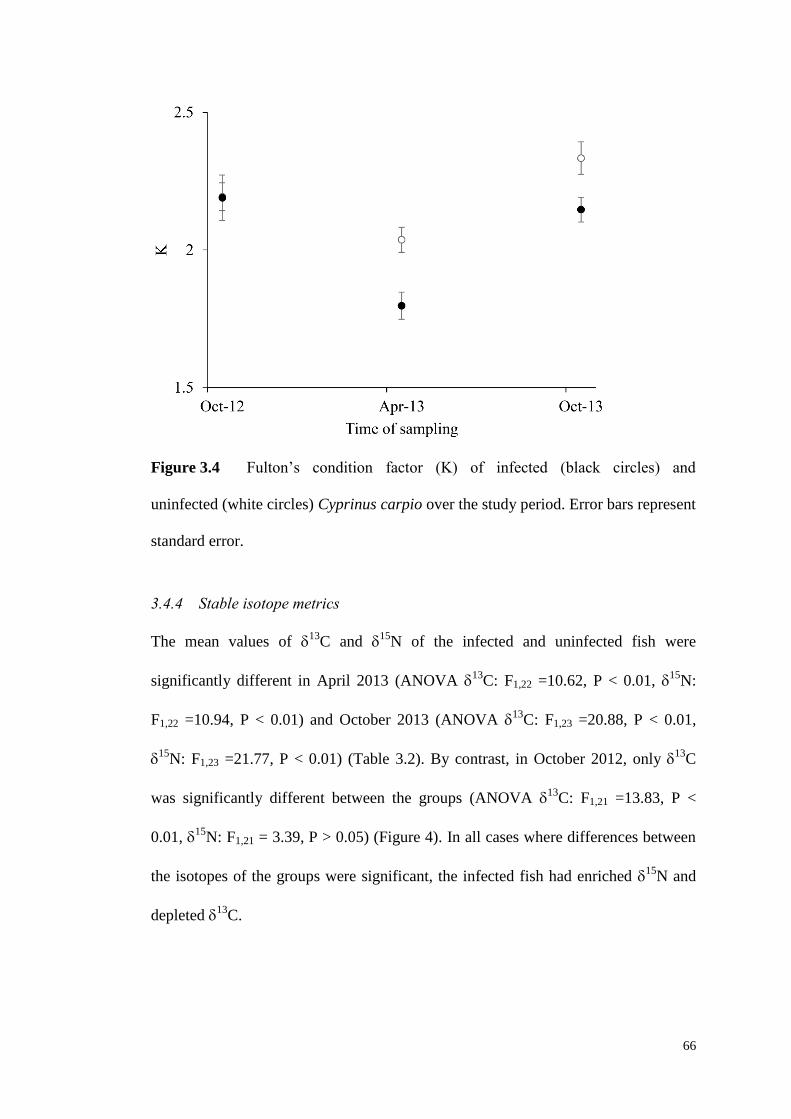
66
Figure 3.4 Fulton’s condition factor (K) of infected (black circles) and
uninfected (white circles) Cyprinus carpio over the study period. Error bars represent
standard error.
3.4.4 Stable isotope metrics
The mean values of 13
C and 15
N of the infected and uninfected fish were
significantly different in April 2013 (ANOVA 13
C: F1,22 =10.62, P < 0.01, 15
N:
F1,22 =10.94, P < 0.01) and October 2013 (ANOVA 13
C: F1,23 =20.88, P < 0.01,
15
N: F1,23 =21.77, P < 0.01) (Table 3.2). By contrast, in October 2012, only 13
C
was significantly different between the groups (ANOVA 13
C: F1,21 =13.83, P <
0.01, 15
N: F1,21 = 3.39, P > 0.05) (Figure 4). In all cases where differences between
the isotopes of the groups were significant, the infected fish had enriched 15
N and
depleted 13
C.
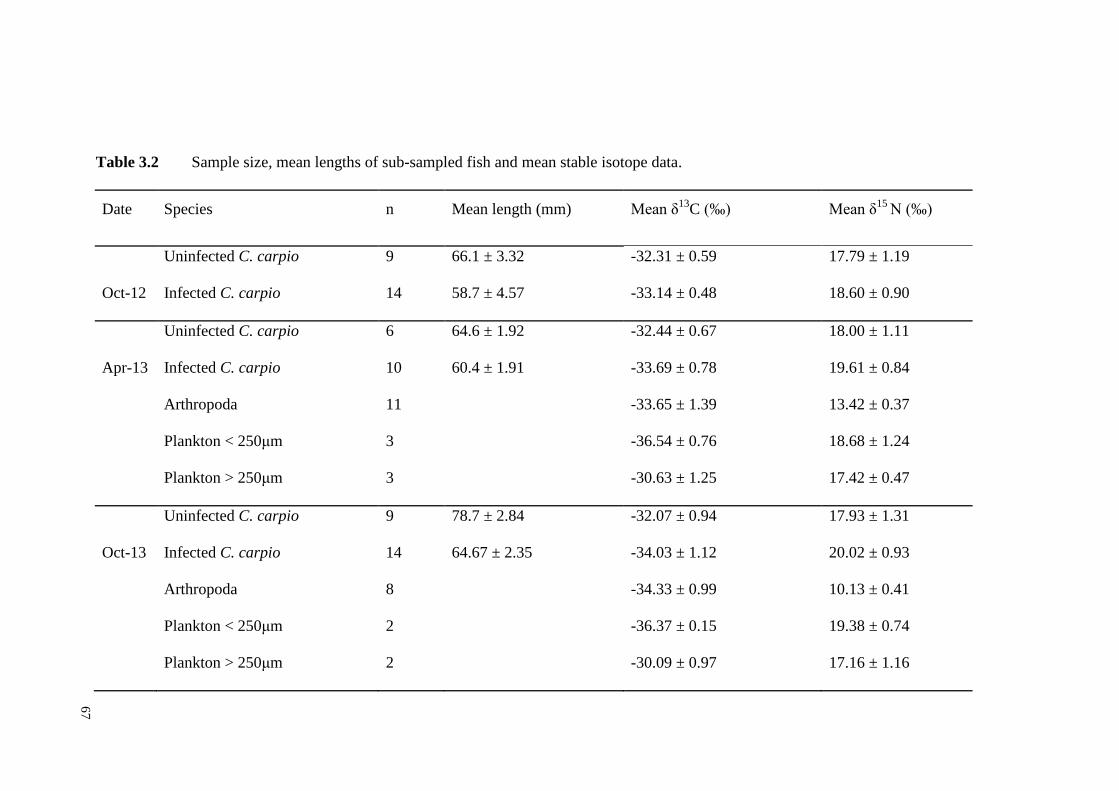
67
Table 3.2 Sample size, mean lengths of sub-sampled fish and mean stable isotope data.
Date Species n Mean length (mm) Mean δ13
C (‰) Mean δ15
N (‰)
Uninfected C. carpio 9 66.1 ± 3.32 -32.31 ± 0.59 17.79 ± 1.19
Oct-12 Infected C. carpio 14 58.7 ± 4.57 -33.14 ± 0.48 18.60 ± 0.90
Uninfected C. carpio 6 64.6 ± 1.92 -32.44 ± 0.67 18.00 ± 1.11
Apr-13 Infected C. carpio 10 60.4 ± 1.91 -33.69 ± 0.78 19.61 ± 0.84
Arthropoda 11
-33.65 ± 1.39 13.42 ± 0.37
Plankton < 250μm 3
-36.54 ± 0.76 18.68 ± 1.24
Plankton > 250μm 3 -30.63 ± 1.25 17.42 ± 0.47
Uninfected C. carpio 9 78.7 ± 2.84 -32.07 ± 0.94 17.93 ± 1.31
Oct-13 Infected C. carpio 14 64.67 ± 2.35 -34.03 ± 1.12 20.02 ± 0.93
Arthropoda 8
-34.33 ± 0.99 10.13 ± 0.41
Plankton < 250μm 2
-36.37 ± 0.15 19.38 ± 0.74
Plankton > 250μm 2 -30.09 ± 0.97 17.16 ± 1.16
67
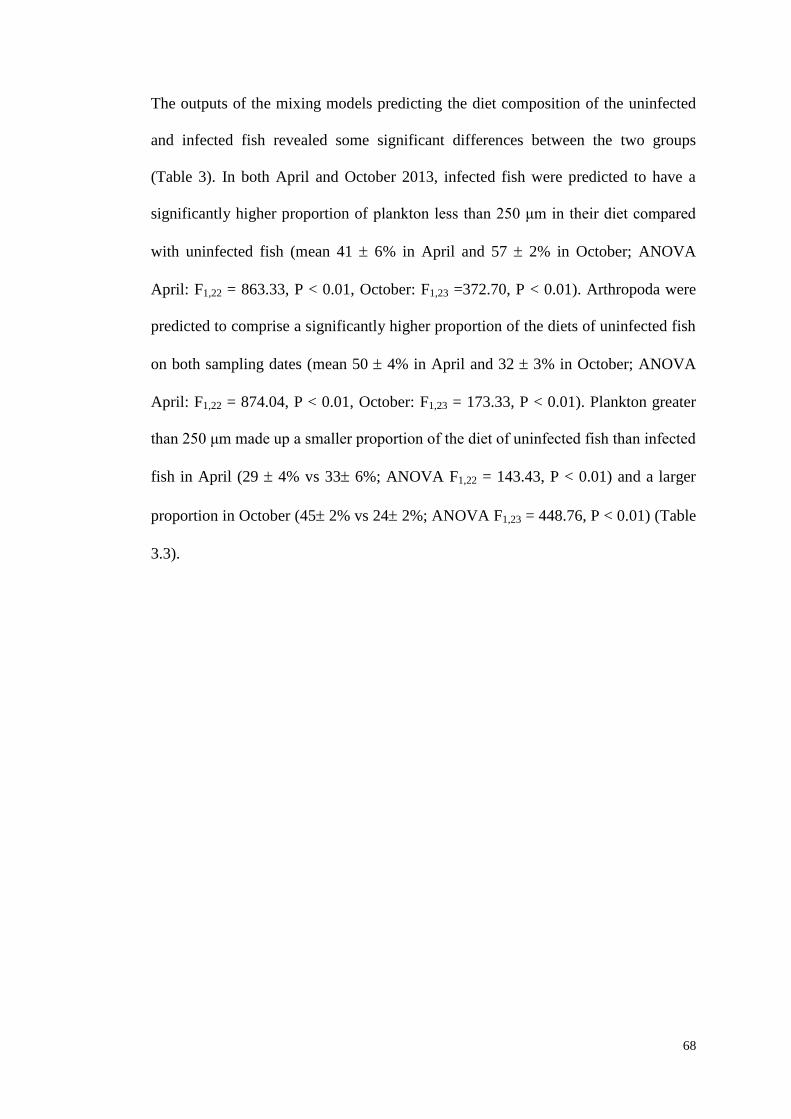
68
The outputs of the mixing models predicting the diet composition of the uninfected
and infected fish revealed some significant differences between the two groups
(Table 3). In both April and October 2013, infected fish were predicted to have a
significantly higher proportion of plankton less than 250 μm in their diet compared
with uninfected fish (mean 41 6% in April and 57 2% in October; ANOVA
April: F1,22 = 863.33, P < 0.01, October: F1,23 =372.70, P < 0.01). Arthropoda were
predicted to comprise a significantly higher proportion of the diets of uninfected fish
on both sampling dates (mean 50 4% in April and 32 3% in October; ANOVA
April: F1,22 = 874.04, P < 0.01, October: F1,23 = 173.33, P < 0.01). Plankton greater
than 250 μm made up a smaller proportion of the diet of uninfected fish than infected
fish in April (29 4% vs 33 6%; ANOVA F1,22 = 143.43, P < 0.01) and a larger
proportion in October (45 2% vs 24 2%; ANOVA F1,23 = 448.76, P < 0.01) (Table
3.3).
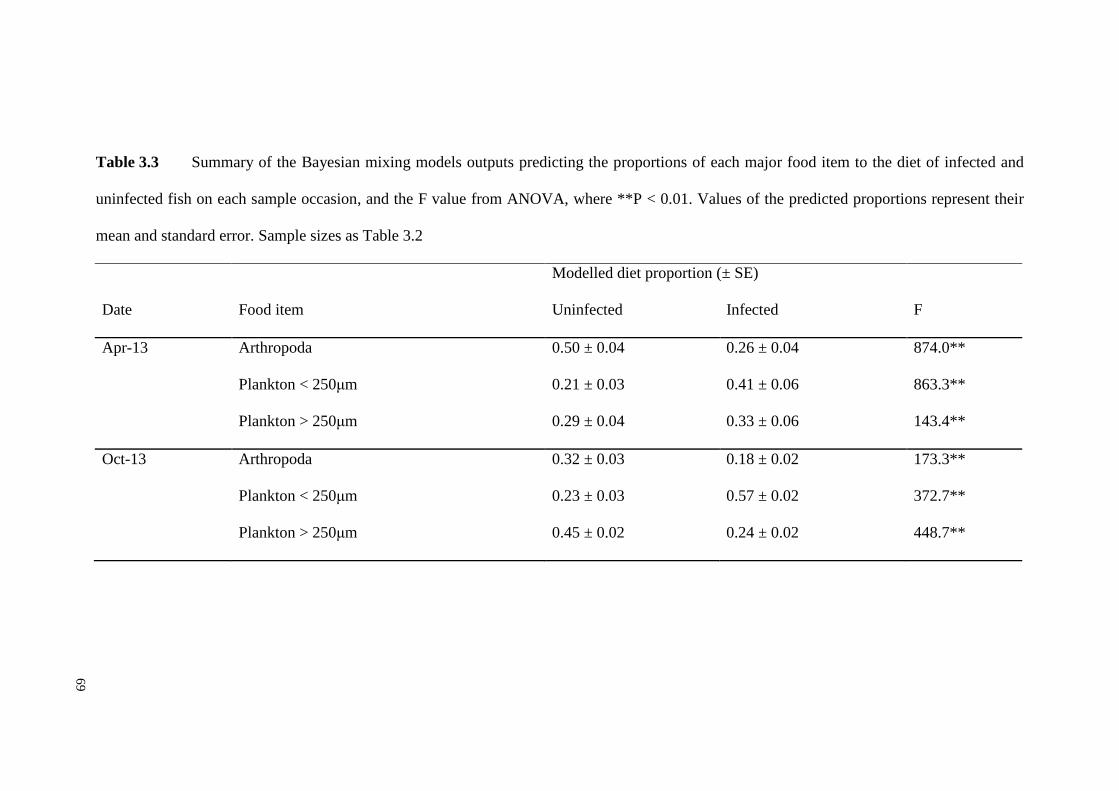
69
Table 3.3 Summary of the Bayesian mixing models outputs predicting the proportions of each major food item to the diet of infected and
uninfected fish on each sample occasion, and the F value from ANOVA, where **P < 0.01. Values of the predicted proportions represent their
mean and standard error. Sample sizes as Table 3.2
Modelled diet proportion (± SE)
Date Food item Uninfected Infected F
Apr-13 Arthropoda 0.50 ± 0.04 0.26 ± 0.04 874.0**
Plankton < 250μm 0.21 ± 0.03 0.41 ± 0.06 863.3**
Plankton > 250μm 0.29 ± 0.04 0.33 ± 0.06 143.4**
Oct-13 Arthropoda 0.32 ± 0.03 0.18 ± 0.02 173.3**
Plankton < 250μm 0.23 ± 0.03 0.57 ± 0.02 372.7**
Plankton > 250μm 0.45 ± 0.02 0.24 ± 0.02 448.7**
69
70
Figure 3.5 Trophic niche width (as standard ellipse area, SEAc) of infected and
uninfected Cyprinus carpio sampled in a) October 2012, b) April 2013 and c)
October 2013. The black circles mark the infected individuals and the black line the
SEAc of infected individuals. The white circles represent data from uninfected
individuals and the grey line represents the SEAc of uninfected individuals.
71
3.5 Discussion
Sampling of the juvenile fish over the 12 month period revealed that infection by B.
acheilognathi resulted in the development of long-term pathological and ecological
consequences. Although the hosts sampled at the end of their first summer revealed
little difference in lengths and condition compared with their uninfected
conspecifics, the outputs of stable isotope analysis revealed they already had a
significantly different diet composition. The condition of infected fish was
significantly reduced after their first winter and by the end of their second summer,
they were significantly smaller than uninfected fish and remained in significantly
reduced condition. The diet of these two sub-sets of fish also remained significantly
different over this time.
Other studies on B. acheilognathi have also suggested that infection causes a range
of foraging consequences for hosts, including impairment of their ability to capture
prey (Scott & Grizzle 1979; Britton et al. 2011; Britton et al. 2012; Scholz et al.
2012). The shift towards foraging on less motile, more easily available food sources
by hosts has also been observed in other parasitized populations. For example, the
freshwater amphipod Gammarus roeseli infected with the acanthocephalan
Polymorphus minutus (as an intermediate host) consumed equivalent numbers of
dead isopods as uninfected conspecifics, but fewer live isopods (Medoc et al. 2011).
In stickleback Gasterosteus aculeatus, parasitism by the cestode Schistocephalus
solidus tends to lead to selection of smaller prey items (Barber et al. 1995). Shifts in
host feeding behaviours arise through a variety of mechanisms; for example,
parasites utilise energy reserves of their hosts, infection may increase metabolic costs
or be associated with increases in energetically demanding immune functions
72
(Barber et al. 2000). Hosts infected with strongly debilitating parasites may also
exhibit reduced activity levels that impact foraging behaviours (Britton et al. 2011;
Britton 2013). Thus, infection consequences frequently manifest as changes in
energy budgets expenditure and, subsequently, appetite, foraging and diet
composition (Barber et al. 2000). Moreover, in fish populations, the frequency
distribution of phenotypic trait values often follows a normal distribution, reflecting
genotypic differences and environmental noise, but parasitic infection can shift the
mean value of traits, increasing their variance at the population level (Poulin &
Thomas 1999). This was apparent in the C. carpio of this study where the increase in
the trophic niche size of the host population was related to it comprising two, almost
discrete niches that corresponded with uninfected and infected carp.
Over the study period, temporal changes were also detected in parasite burden. These
tended to reduce over time, despite being sufficient to incur pathological and
ecological consequences. Although this reduction might relate to the mortality of
hosts with high parasite abundances, seasonal shifts in aspects of fish parasite
infections are often apparent in temperate regions due to its influence on the
behaviours, habitat utilisation and immune responses of potential hosts (Bromage et
al. 2001; Bowden et al. 2007). Given these can vary between host species then
parasite prevalence and abundance can show considerable variability across species
within communities. For example, in reservoirs in North Carolina, USA, B.
acheilognathi abundance was highest in fathead minnow Pimephales promelas and
red shiner Notropis lutrensis in autumn, whereas it was highest in winter in mosquito
fish Gambusia affinis (Riggs et al. 1987). For parasites whose transmission to final
hosts is through trophic links, the phenology of intermediate hosts is also important,
73
with seasonal changes in copepod communities identified as a driver of the different
infection levels of B. acheilognathi observed in fish host communities (Riggs et al.
1987). Temporal and spatial changes in definitive host infection level that result
from varying transmission success due to shifts in the dynamics of intermediate host
populations have also been recorded across a range of fishes and their parasites
(Amundsen et al. 2003; Jiménez-Garcia & Vidal-Martínez 2005).
The divergence in the lengths of the infected and uninfected fish that developed over
time has the potential to restrict host fitness, as in most fish species, maturation is
associated with size and thus faster growing individuals will mature earlier in life
(Scott 1962; Bagenal 1969; Ali & Wootton 1999). Furthermore, larger fish are more
fecund, and thus contribute more to the population (Hislop 1988; Beldade et al.
2012;). Whilst a reduction in growth associated with parasitism has been recorded in
a variety of species, such as the rainbow smelt Osmerus mordax infected by
protocephalid parasites (Sirois & Dodson 2000), and farmed and wild salmonids
infected with sea lice (e.g. Lepeophtheirus salmonis) (Costello 2006), it is not the
universal response to parasitism (Loot et al. 2001). Indeed, rapid growth aligned with
parasitic castration in hosts is the response recorded in other cestode parasites, such
as Ligula intestinalis (Thompson & Kavaliers 1994; Loot et al. 2001) and
Schistocephalus solidus (Arnott et al. 2000; Barber et al. 2000).
In summary, significant differences in the condition and body lengths of infected and
uninfected populations developed over the course of the study, with histopathology
revealing substantial local damage in the intestine of hosts. Analyses then revealed
the diet composition of the infected fish was predicted to comprise of a significantly
74
higher proportion of smaller items (< 53 μm) than uninfected fish. Thus, it was
demonstrated that in this cohort of juvenile C. carpio, sub-lethal impacts of
parasitism included substantial histopathological consequences that resulted in
significant growth and trophic impacts whose development could have been
overlooked had the temporal context of the study been lacking. It is thus especially
important to investigate the temporal influence of parasitism in any evaluation of
potential parasite impacts on trophic niche and condition of the host. These outputs
also suggest some modifications to food webs infected with B.acheilognathi, as their
hosts forage on different prey taxa (Chapters 5 and 6).
75
4. Head morphology and piscivory of European eels, Anguilla
anguilla, predict their probability of infection by the invasive
parasite parasitic nematode Anguillicoloides crassus
This chapter is based on the published article which is presented in Appendix 6:
Pegg, J., Andreou, D., Williams, C. F. and Britton, J. R., 2015, Head morphology
and piscivory of European eels, Anguilla anguilla, predict their probability of
infection by the invasive parasitic nematode Anguillicoloides crassus. Freshwater
Biology, 60: 1977–1987.
76
4.1 Abstract
The morphology of animal body structures influences their function; intra-population
plasticity in diet composition can occur where head morphology limits gape size.
The European eel, Anguilla anguilla, a critically endangered catadromous fish,
shows significant intra-population variations in head width, with broader-headed
individuals being more piscivorous. Infection of eels during their freshwater phase
by Anguillicoloides crassus, an invasive nematode parasite, involves paratenic fish
hosts. Here, the relationship between their infection status and head functional
morphology (as head width/total length ratio; HW:TL) was tested across three
populations and the proportion of fish in diet (estimated by stable isotope mixing
models) across three populations.
In all populations the extent of piscivory in the diets of individual eels increased
significantly as their HW:TL ratios increased. There were no significant differences
between infected and uninfected eels in their total lengths and hepatic-somatic
indices. However, the HW:TL ratios of infected eels were significantly higher than
those of uninfected eels and, correspondingly, their diet comprised a higher
proportion of fish. Logistic regression revealed head morphology and diet were
significant predictors of infection status, with models correctly assigning up to 78 %
of eels to their infection status. Thus, eel head functional morphology significantly
influenced their probability of being infected by invasive A. crassus, most likely
through increased exposure to fish paratenic hosts. Accordingly, the detrimental
consequences of infections are likely to be focused on those individuals in
freshwater populations whose functional morphology enables greater specialisation
in piscivory.
77
4.2 Introduction
Phenotypic differences in morphology, physiology and behaviour are frequently
observed between parasitized and non-parasitized individuals (Lafferty 1999; Krist
2000; Miura et al. 2006). Although often considered in the context of parasite-
induced changes to the host post-infection (Blanchet et al. 2009), some traits
increase the susceptibility of individuals to infection, resulting in a small number of
hosts harbouring the majority of parasites (Viljoen et al. 2011). These traits include
host body size, where increased size favours the development of larger parasite loads
(Lindenfors et al. 2007); social behaviours, where increased social interactions
increase parasite transmission (Viljoen et al. 2011); and sex, as oestrogens can
stimulate immunity whereas testosterone can act as an immuno-suppressant (Folstad
and Karter 1992), so that males often have higher parasite loads (Schalk and Forbes
1997; Moore and Wilson 2002). Functional traits that enable the development of
specialized feeding behaviours in individuals can also increase the risk of infection
by trophically transmitted parasites through increased exposure to intermediate hosts
(Bolnick et al. 2003). For example, different feeding specializations of individuals
within Arctic charr (Salvelinus alpinus) populations result in aggregations of
helminth parasites in those individuals that persistently forage on the pelagic
copepods that act as intermediate hosts (Knudsen et al.2004).
Paratenic hosts can play important roles in the transmission of trophically
transmitted parasites (Ewald 1995; Galaktionov 1996), as they increase parasite
fitness and ensure that larvae that would otherwise be ‘lost’ in unsuitable hosts are
recovered (Morand et al. 1995). They can assist transmission when obligate
intermediate hosts are not represented strongly in the diet of final hosts (Medoc et al.
78
2011; Benesh et al. 2014; Moehl et al. 2009), and thus facilitate parasite transfer
along food chains and across trophic levels (Marcogliese 2007). For example, Alaria
trematode parasites, whose obligate amphibian intermediate hosts are rarely
consumed by their canine final host, also have mammalian and bird paratenic hosts
that substantially increase their transmission rates (Moehl et al. 2009). Paratenic
hosts also increase the time over which potential hosts are vulnerable to infection.
For example, because the obligate intermediate hosts of Bothriocephalus barbatus
and Bothriocephalus gregarious are copepods, their flatfish final hosts are
vulnerable to infection during their planktonic juvenile stages (Robert et al. 1988).
However, as B. gregarious also has a gobiid fish paratenic host, the predaceous adult
stages of potential hosts continue to be exposed to the parasite, resulting in higher
prevalence rates than for B. barbatus (Robert et al. 1988; Morand et al. 1995).
The nematode parasite Anguillicoloides crassus was introduced from Asia into
Europe in the 1980s, where it infects the freshwater lifestages of the European eel, A.
anguilla, (Kirk 2003), now a critically-endangered species (Jacoby and Gollock
2014). A number of factors have been suggested as contributing to the decline of
European eel populations, including A. crassus infections as these affect swim-
bladder function (Lefebvre et al. 2013). This parasite has a complex life cycle; in the
native range, infection of Japanese eel is via ingestion of crustacean intermediate
hosts (Nagasawa at al. 1994), but in Europe a wide range of species, primarily fishes,
also act as paratenic hosts (Szekely 1994; Kennedy 2007). Although not evident in
the native range (Thomas and Ollevier 1992), studies suggest that the consumption
of paratenic fish hosts has contributed to increased transmission rates and prevalence
79
in A. anguilla (Szekely 1994; Sures and Streit 2001; Kirk 2003; Knopf and Mahnke
2004).
Within populations, A. anguilla exhibits considerable variation in head width, with
‘broad-headed individuals’ and ‘narrow-headed individuals’ (Lammens and Visser
1989; Proman and Reynolds 2000; Tesch 1977; Tesch 2003), although a recent study
suggests that there is continuous morphological variation rather than a dichotomy
(Cucherousset et al. 2011). As with other species where head morphology limits
energy acquisition (Smith and Skulason 1996; Bulte, Irschick and Blouin-Demers
2008), these differences in head morphology have been related to individual
specialisation, with broader-headed A. anguilla individuals being more piscivorous
(Cucherousset et al. 2011). This chapter investigated how A. anguilla head
morphology, diet and trophic ecology influence the infection status and parasite load
with A. crassus over three river populations. It was predicted that variation in the
functional head morphology of A. anguilla leads to significant differences in
individual diet composition and trophic niche, significantly influencing the
probability of infection by A. crassus in broader-headed individuals through their
increased parasite exposure via fish paratenic hosts.
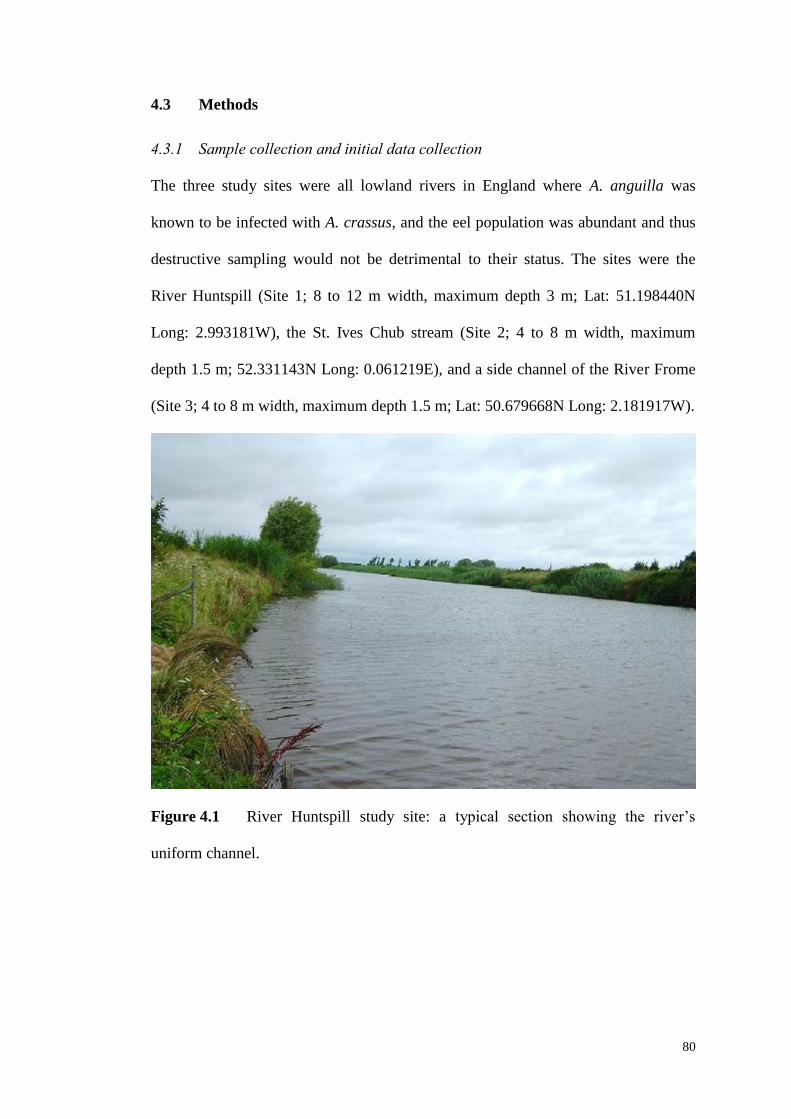
80
4.3 Methods
4.3.1 Sample collection and initial data collection
The three study sites were all lowland rivers in England where A. anguilla was
known to be infected with A. crassus, and the eel population was abundant and thus
destructive sampling would not be detrimental to their status. The sites were the
River Huntspill (Site 1; 8 to 12 m width, maximum depth 3 m; Lat: 51.198440N
Long: 2.993181W), the St. Ives Chub stream (Site 2; 4 to 8 m width, maximum
depth 1.5 m; 52.331143N Long: 0.061219E), and a side channel of the River Frome
(Site 3; 4 to 8 m width, maximum depth 1.5 m; Lat: 50.679668N Long: 2.181917W).
Figure 4.1 River Huntspill study site: a typical section showing the river’s
uniform channel.
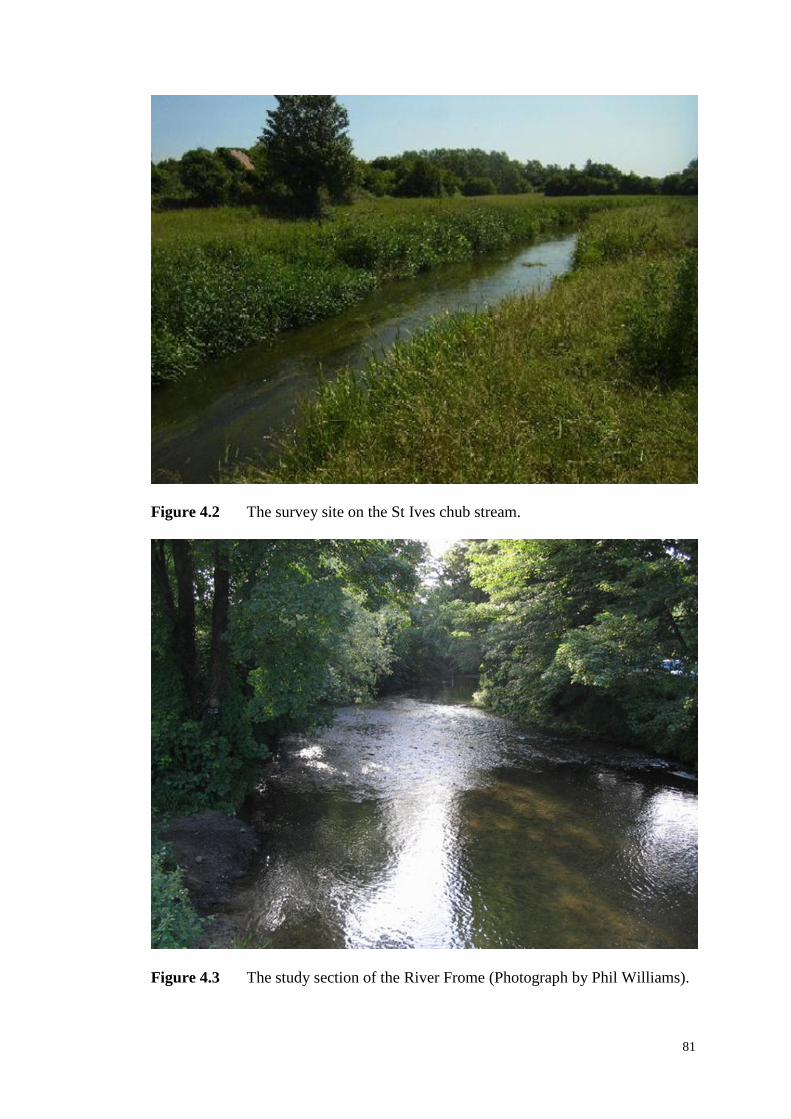
81
Figure 4.2 The survey site on the St Ives chub stream.
Figure 4.3 The study section of the River Frome (Photograph by Phil Williams).
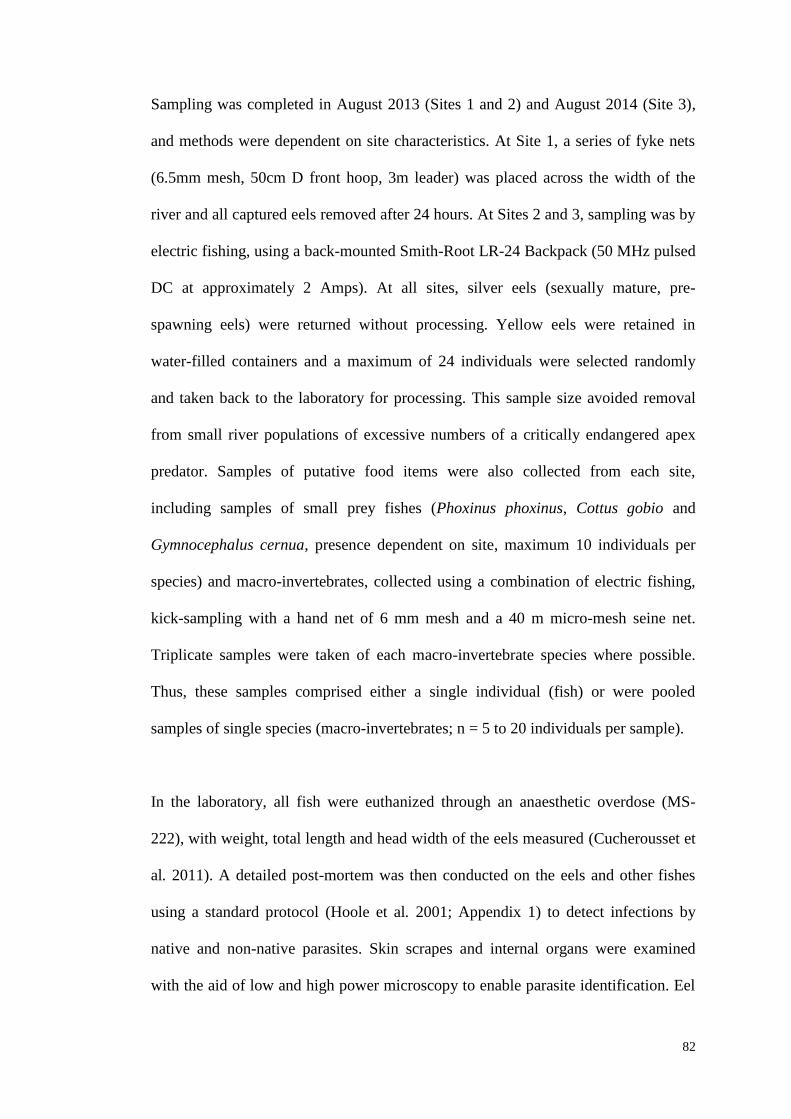
82
Sampling was completed in August 2013 (Sites 1 and 2) and August 2014 (Site 3),
and methods were dependent on site characteristics. At Site 1, a series of fyke nets
(6.5mm mesh, 50cm D front hoop, 3m leader) was placed across the width of the
river and all captured eels removed after 24 hours. At Sites 2 and 3, sampling was by
electric fishing, using a back-mounted Smith-Root LR-24 Backpack (50 MHz pulsed
DC at approximately 2 Amps). At all sites, silver eels (sexually mature, pre-
spawning eels) were returned without processing. Yellow eels were retained in
water-filled containers and a maximum of 24 individuals were selected randomly
and taken back to the laboratory for processing. This sample size avoided removal
from small river populations of excessive numbers of a critically endangered apex
predator. Samples of putative food items were also collected from each site,
including samples of small prey fishes (Phoxinus phoxinus, Cottus gobio and
Gymnocephalus cernua, presence dependent on site, maximum 10 individuals per
species) and macro-invertebrates, collected using a combination of electric fishing,
kick-sampling with a hand net of 6 mm mesh and a 40 m micro-mesh seine net.
Triplicate samples were taken of each macro-invertebrate species where possible.
Thus, these samples comprised either a single individual (fish) or were pooled
samples of single species (macro-invertebrates; n = 5 to 20 individuals per sample).
In the laboratory, all fish were euthanized through an anaesthetic overdose (MS-
222), with weight, total length and head width of the eels measured (Cucherousset et
al. 2011). A detailed post-mortem was then conducted on the eels and other fishes
using a standard protocol (Hoole et al. 2001; Appendix 1) to detect infections by
native and non-native parasites. Skin scrapes and internal organs were examined
with the aid of low and high power microscopy to enable parasite identification. Eel
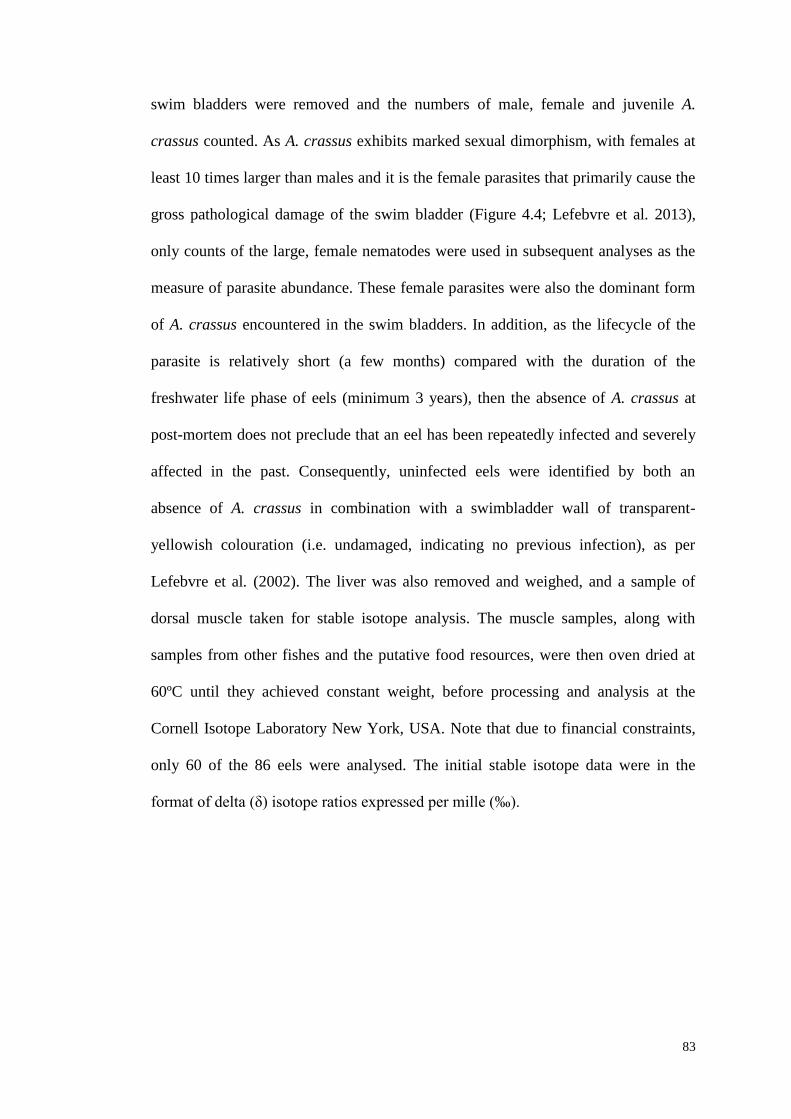
83
swim bladders were removed and the numbers of male, female and juvenile A.
crassus counted. As A. crassus exhibits marked sexual dimorphism, with females at
least 10 times larger than males and it is the female parasites that primarily cause the
gross pathological damage of the swim bladder (Figure 4.4; Lefebvre et al. 2013),
only counts of the large, female nematodes were used in subsequent analyses as the
measure of parasite abundance. These female parasites were also the dominant form
of A. crassus encountered in the swim bladders. In addition, as the lifecycle of the
parasite is relatively short (a few months) compared with the duration of the
freshwater life phase of eels (minimum 3 years), then the absence of A. crassus at
post-mortem does not preclude that an eel has been repeatedly infected and severely
affected in the past. Consequently, uninfected eels were identified by both an
absence of A. crassus in combination with a swimbladder wall of transparent-
yellowish colouration (i.e. undamaged, indicating no previous infection), as per
Lefebvre et al. (2002). The liver was also removed and weighed, and a sample of
dorsal muscle taken for stable isotope analysis. The muscle samples, along with
samples from other fishes and the putative food resources, were then oven dried at
60ºC until they achieved constant weight, before processing and analysis at the
Cornell Isotope Laboratory New York, USA. Note that due to financial constraints,
only 60 of the 86 eels were analysed. The initial stable isotope data were in the
format of delta (δ) isotope ratios expressed per mille (‰).
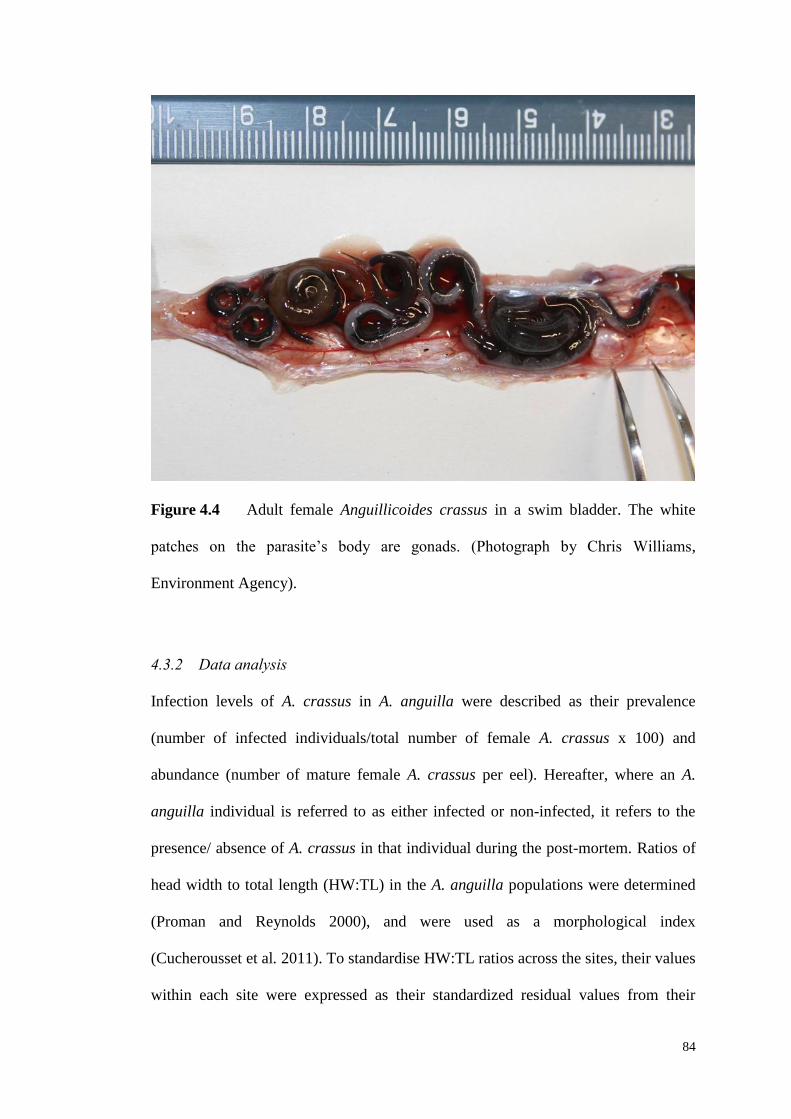
84
Figure 4.4 Adult female Anguillicoides crassus in a swim bladder. The white
patches on the parasite’s body are gonads. (Photograph by Chris Williams,
Environment Agency).
4.3.2 Data analysis
Infection levels of A. crassus in A. anguilla were described as their prevalence
(number of infected individuals/total number of female A. crassus x 100) and
abundance (number of mature female A. crassus per eel). Hereafter, where an A.
anguilla individual is referred to as either infected or non-infected, it refers to the
presence/ absence of A. crassus in that individual during the post-mortem. Ratios of
head width to total length (HW:TL) in the A. anguilla populations were determined
(Proman and Reynolds 2000), and were used as a morphological index
(Cucherousset et al. 2011). To standardise HW:TL ratios across the sites, their values
within each site were expressed as their standardized residual values from their
85
population mean. Hepato-somatic index (HSI), a measure of energy storage, was
then calculated for each individual A. anguilla using the formula: HSI = liver weight
(g)/ total bodyweight (g). Note this could not be completed for A. anguilla from Site
3.
Anguilla anguilla diet composition and trophic niche size was investigated at each
site using the stable isotope data. Diet composition was assessed using Bayesian
mixing models that estimated the relative contribution of each putative food resource
to the diet of each individual A. anguilla per site (Moore and Semmens 2008). The
models were run using the MixSIAR GUI package in the R computing programme
(Stock and Semmens 2013; R Development Core Team 2013). Given that excessive
putative food resources can cause mixing models to underperform, the data for
resources with similar isotope values were combined a priori, whilst respecting the
taxon and functional affiliation of the individual species, as per Phillips et al. (2005).
Accordingly, models at each site always included ‘prey fishes’. At Site 1, they also
included one macro-invertebrate group, ‘Arthropoda’ (Gammarus pulex,
Hydropsychidae and Simuliidae spp.). At Site 2, differences in stable isotope data
within the Arthropoda enabled inclusion of two groups in the mixing model (1:
Gammarus pulex and Asellus aquaticus, 2: other Arthropoda), and at Site 3, two
groups of Arthropoda (as Site 2), plus Lymnaea sp. Isotopic fractionation factors
between resources and consumers in the models were 3.4 ‰ (± 0.98 ‰) for 15
N and
0.39 ‰ (± 1.3 ‰) for 13
C (Post 2002). Outputs were the predicted proportion of
each resource to eel diet (0 to 1), with the predicted proportion of fish used as a
measure of the extent of piscivory in each individual A. anguilla. The stable isotope
data were then used to calculate the standard ellipse area (SEAc) for the infected and
86
uninfected eels at each site using the SIAR package (Parnell et al. 2010) in the R
computing program (R Development Core Team 2013) (as per Section 2.3.3).
4.3.3 Statistical analysis
Differences in δ13
C and δ15
N between infected and uninfected A. anguilla at each
site were tested using generalized linear models (GLM); the stable isotope data were
dependent variables and infection status was the independent variable. The effect of
total A. anguilla length was included in initial models but removed if its effect was
not significant. In subsequent analyses, as the data used were standard for all sites,
they were combined and used in linear mixed models. In all cases, to correct for the
inflated number of residual degrees of freedom that would have occurred in the
model if the data of individual A. anguilla were used as true replicates, models were
fitted with site as a random effect on the intercept. Thus, the model testing for
difference in A. anguilla weight according to A. crassus infection used weight as the
dependent variable, infection status as the independent variable, site as the random
effect and total length as the covariate (Garcia-Berthou 2001). The significance of
the difference in weight between the groups was determined by pairwise
comparisons of estimated marginal means, adjusted for multiple comparisons
(Bonferroni). Differences in hepatic-somatic index, mean HW:TL ratios, total
lengths and the extent of piscivory in diet between infected and uninfected A.
anguilla were then tested using the same model structure, but without length as a
covariate. Finally, the effect of HW:TL ratios on the extent of piscivory in eel diet
was tested across the sites using linear regression.
87
As infection status was binomial (0 = uninfected, 1 = infected), binary logistic
regression was used to build probability of infection (PoI) models that determined
PoI from the data of each individual eel on their (i) HW:TL ratio, and (ii) estimated
proportion of fish in their diet, using equation 1: e(a+bx)
/ 1+e(a+bx)
, where a and b were
the regression coefficients, and x either HW:TL ratio or proportion of fish in diet. A
final PoI model used both HW:TL ratios and estimated proportion of fish in their
diet (D) in equation 2: e(a+bHW:TL+cD)
/ 1+ e(a+bHW:TL+cD)
, where a, b and c were the
regression coefficients. Predicted group membership and its probability (infected or
uninfected) were stored as model outputs, with differences in probabilities tested
between groups using Mann Whitney U tests. Predicted group membership was
compared with the actual data set and expressed as the proportion that were correctly
assigned.
The relationships of parasite abundance (as number of mature female A. crassus)
with total length, body mass, hepatic-somatic index, HW:TL ratios and extent of
piscivory were then tested in two ways. Firstly, the abundances were grouped by the
number of mature female parasites present in the swim bladder, where low = 1 to 3
parasites, medium = 4 to 6 and high > 7. These groups were then used in linear
mixed models using the same model structures as already described for infected and
uninfected eels. The abundance data were then used as the continuous variable in
multiple regression, where total length, body mass, hepatic-somatic index, HW:TL
ratios and extent of piscivory were used as explanatory variables. Outputs were
assessed according to the values of the standardised β coefficients (higher values
indicate a greater contribution to the variance of the data) and the significance of the
explanatory variables.
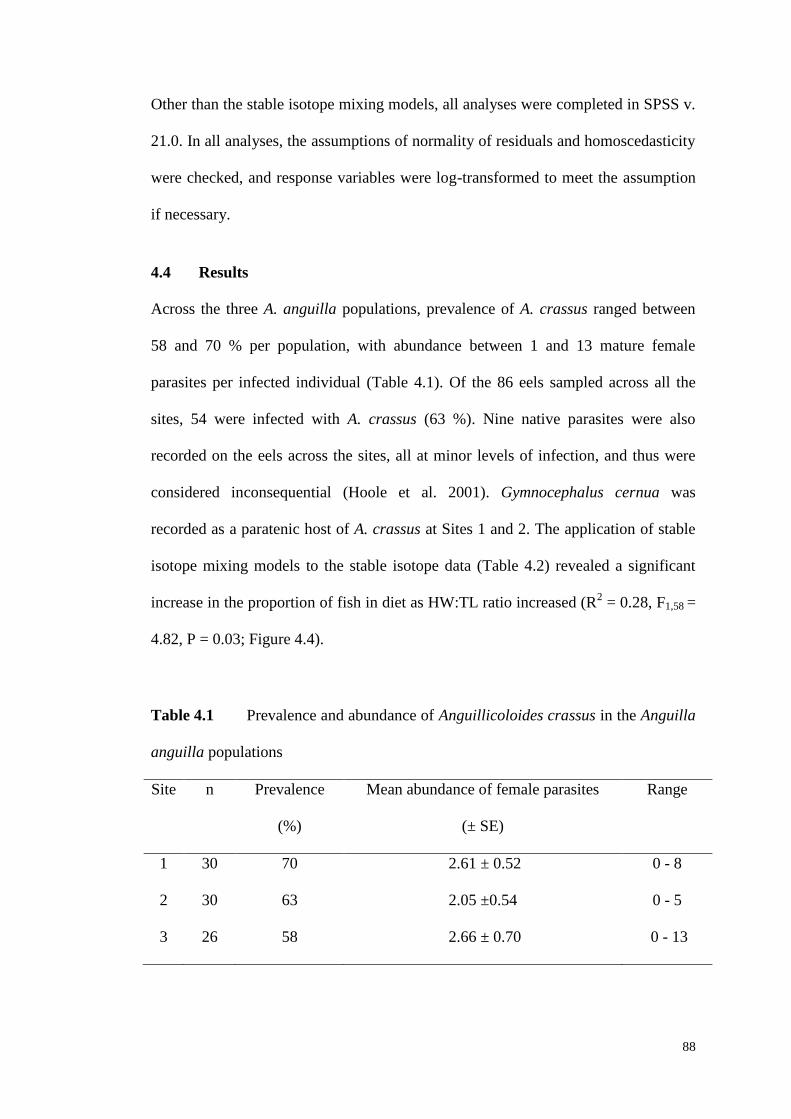
88
Other than the stable isotope mixing models, all analyses were completed in SPSS v.
21.0. In all analyses, the assumptions of normality of residuals and homoscedasticity
were checked, and response variables were log-transformed to meet the assumption
if necessary.
4.4 Results
Across the three A. anguilla populations, prevalence of A. crassus ranged between
58 and 70 % per population, with abundance between 1 and 13 mature female
parasites per infected individual (Table 4.1). Of the 86 eels sampled across all the
sites, 54 were infected with A. crassus (63 %). Nine native parasites were also
recorded on the eels across the sites, all at minor levels of infection, and thus were
considered inconsequential (Hoole et al. 2001). Gymnocephalus cernua was
recorded as a paratenic host of A. crassus at Sites 1 and 2. The application of stable
isotope mixing models to the stable isotope data (Table 4.2) revealed a significant
increase in the proportion of fish in diet as HW:TL ratio increased (R2 = 0.28, F1,58 =
4.82, P = 0.03; Figure 4.4).
Table 4.1 Prevalence and abundance of Anguillicoloides crassus in the Anguilla
anguilla populations
Site n Prevalence
(%)
Mean abundance of female parasites
(± SE)
Range
1 30 70 2.61 ± 0.52 0 - 8
2 30 63 2.05 ±0.54 0 - 5
3 26 58 2.66 ± 0.70 0 - 13
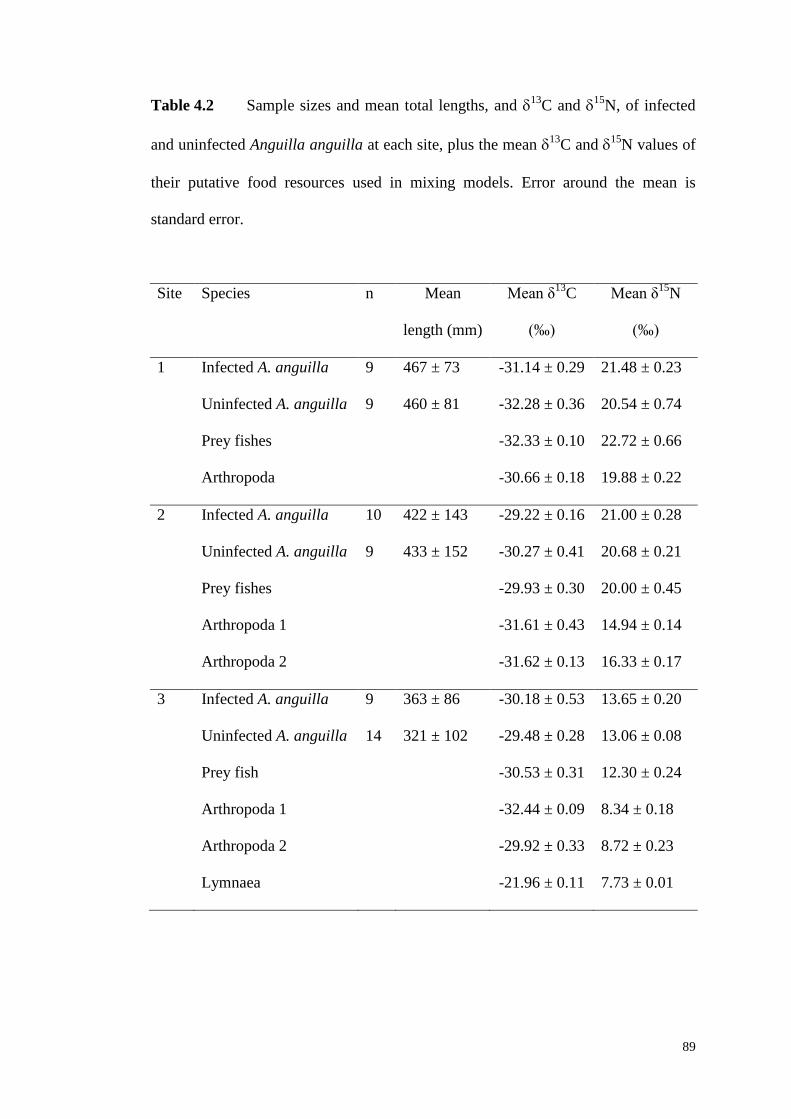
89
Table 4.2 Sample sizes and mean total lengths, and 13
C and 15
N, of infected
and uninfected Anguilla anguilla at each site, plus the mean 13
C and 15
N values of
their putative food resources used in mixing models. Error around the mean is
standard error.
Site Species n Mean
length (mm)
Mean δ13
C
(‰)
Mean δ15
N
(‰)
1 Infected A. anguilla 9 467 ± 73 -31.14 ± 0.29 21.48 ± 0.23
Uninfected A. anguilla 9 460 ± 81 -32.28 ± 0.36 20.54 ± 0.74
Prey fishes -32.33 ± 0.10 22.72 ± 0.66
Arthropoda -30.66 ± 0.18 19.88 ± 0.22
2 Infected A. anguilla 10 422 ± 143 -29.22 ± 0.16 21.00 ± 0.28
Uninfected A. anguilla 9 433 ± 152 -30.27 ± 0.41 20.68 ± 0.21
Prey fishes -29.93 ± 0.30 20.00 ± 0.45
Arthropoda 1 -31.61 ± 0.43 14.94 ± 0.14
Arthropoda 2 -31.62 ± 0.13 16.33 ± 0.17
3 Infected A. anguilla 9 363 ± 86 -30.18 ± 0.53 13.65 ± 0.20
Uninfected A. anguilla 14 321 ± 102 -29.48 ± 0.28 13.06 ± 0.08
Prey fish -30.53 ± 0.31 12.30 ± 0.24
Arthropoda 1 -32.44 ± 0.09 8.34 ± 0.18
Arthropoda 2 -29.92 ± 0.33 8.72 ± 0.23
Lymnaea -21.96 ± 0.11 7.73 ± 0.01
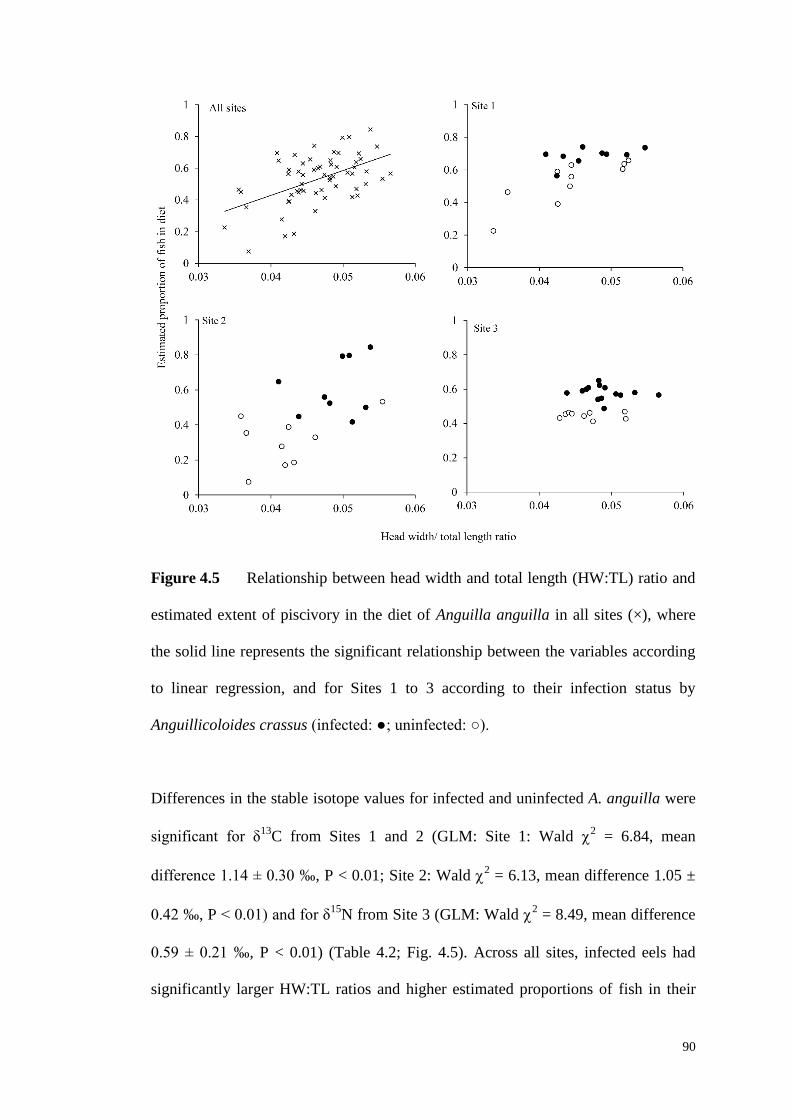
90
Figure 4.5 Relationship between head width and total length (HW:TL) ratio and
estimated extent of piscivory in the diet of Anguilla anguilla in all sites (×), where
the solid line represents the significant relationship between the variables according
to linear regression, and for Sites 1 to 3 according to their infection status by
Anguillicoloides crassus (infected: ●; uninfected: ○).
Differences in the stable isotope values for infected and uninfected A. anguilla were
significant for δ13
C from Sites 1 and 2 (GLM: Site 1: Wald 2 = 6.84, mean
difference 1.14 ± 0.30 ‰, P < 0.01; Site 2: Wald 2 = 6.13, mean difference 1.05 ±
0.42 ‰, P < 0.01) and for δ15
N from Site 3 (GLM: Wald 2 = 8.49, mean difference
0.59 ± 0.21 ‰, P < 0.01) (Table 4.2; Fig. 4.5). Across all sites, infected eels had
significantly larger HW:TL ratios and higher estimated proportions of fish in their
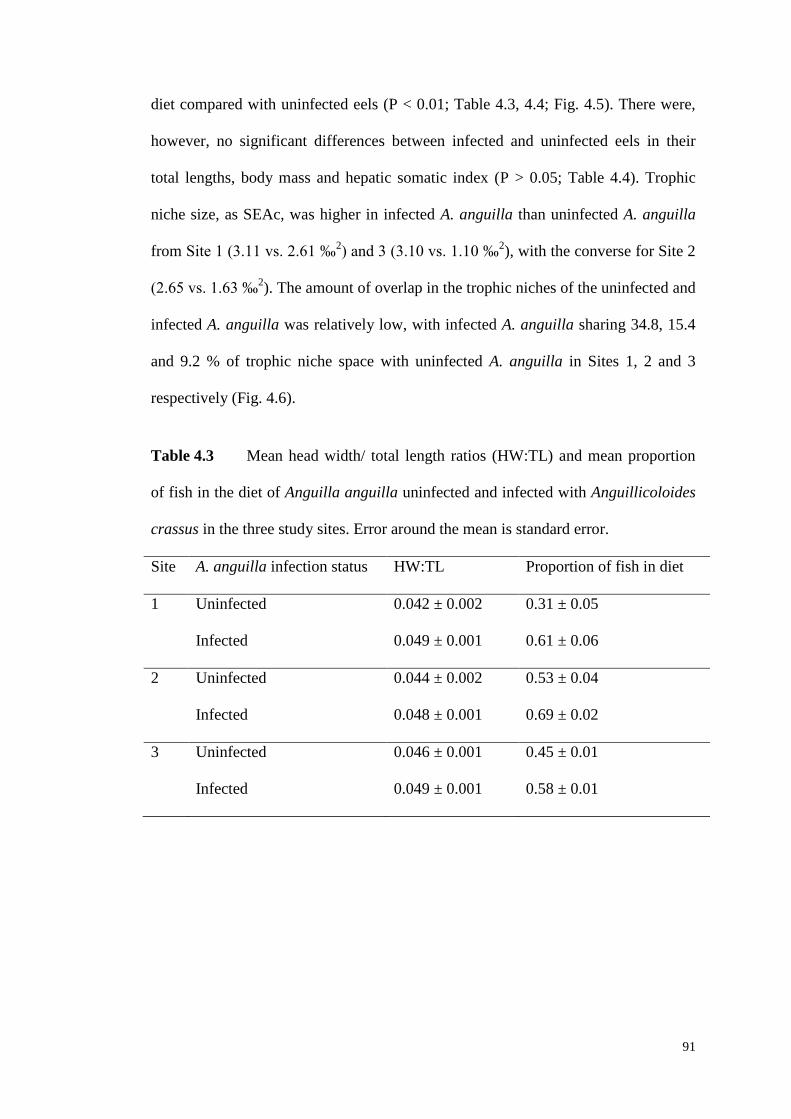
91
diet compared with uninfected eels (P < 0.01; Table 4.3, 4.4; Fig. 4.5). There were,
however, no significant differences between infected and uninfected eels in their
total lengths, body mass and hepatic somatic index (P > 0.05; Table 4.4). Trophic
niche size, as SEAc, was higher in infected A. anguilla than uninfected A. anguilla
from Site 1 (3.11 vs. 2.61 ‰2) and 3 (3.10 vs. 1.10 ‰
2), with the converse for Site 2
(2.65 vs. 1.63 ‰2). The amount of overlap in the trophic niches of the uninfected and
infected A. anguilla was relatively low, with infected A. anguilla sharing 34.8, 15.4
and 9.2 % of trophic niche space with uninfected A. anguilla in Sites 1, 2 and 3
respectively (Fig. 4.6).
Table 4.3 Mean head width/ total length ratios (HW:TL) and mean proportion
of fish in the diet of Anguilla anguilla uninfected and infected with Anguillicoloides
crassus in the three study sites. Error around the mean is standard error.
Site A. anguilla infection status HW:TL Proportion of fish in diet
1 Uninfected 0.042 ± 0.002 0.31 ± 0.05
Infected 0.049 ± 0.001 0.61 ± 0.06
2 Uninfected 0.044 ± 0.002 0.53 ± 0.04
Infected 0.048 ± 0.001 0.69 ± 0.02
3 Uninfected 0.046 ± 0.001 0.45 ± 0.01
Infected 0.049 ± 0.001 0.58 ± 0.01
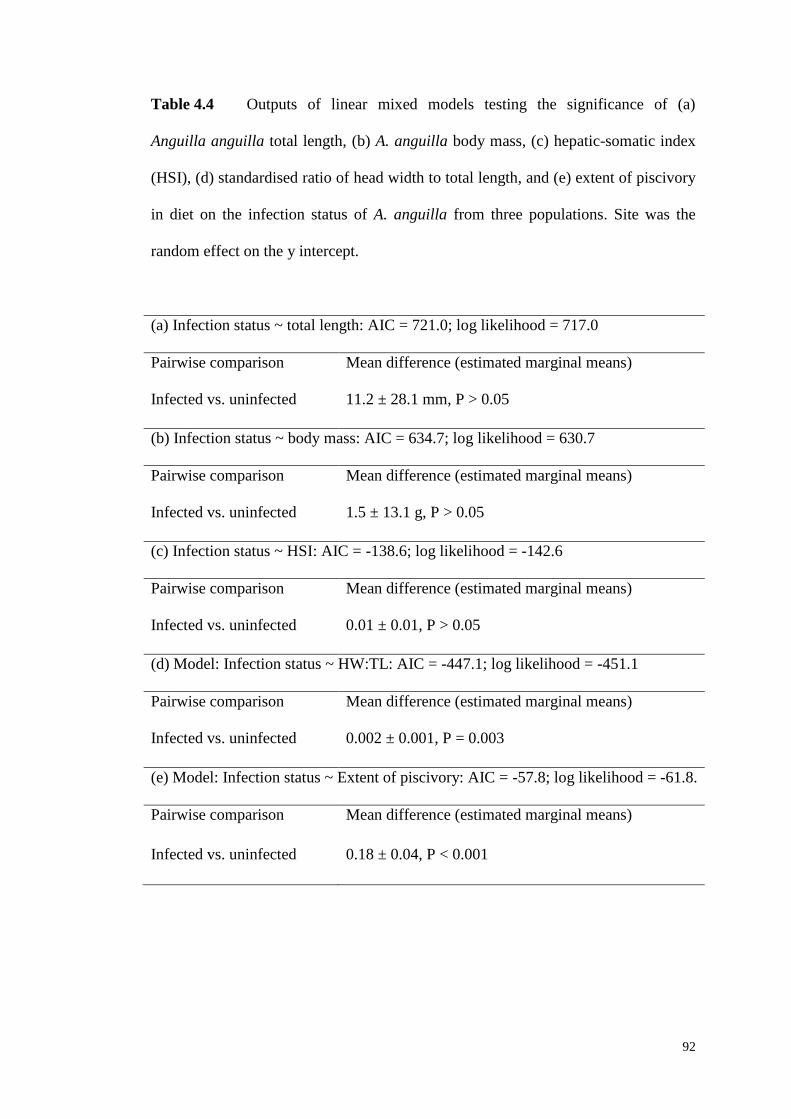
92
Table 4.4 Outputs of linear mixed models testing the significance of (a)
Anguilla anguilla total length, (b) A. anguilla body mass, (c) hepatic-somatic index
(HSI), (d) standardised ratio of head width to total length, and (e) extent of piscivory
in diet on the infection status of A. anguilla from three populations. Site was the
random effect on the y intercept.
(a) Infection status ~ total length: AIC = 721.0; log likelihood = 717.0
Pairwise comparison Mean difference (estimated marginal means)
Infected vs. uninfected 11.2 ± 28.1 mm, P > 0.05
(b) Infection status ~ body mass: AIC = 634.7; log likelihood = 630.7
Pairwise comparison Mean difference (estimated marginal means)
Infected vs. uninfected 1.5 ± 13.1 g, P > 0.05
(c) Infection status ~ HSI: AIC = -138.6; log likelihood = -142.6
Pairwise comparison Mean difference (estimated marginal means)
Infected vs. uninfected 0.01 ± 0.01, P > 0.05
(d) Model: Infection status ~ HW:TL: AIC = -447.1; log likelihood = -451.1
Pairwise comparison Mean difference (estimated marginal means)
Infected vs. uninfected 0.002 ± 0.001, P = 0.003
(e) Model: Infection status ~ Extent of piscivory: AIC = -57.8; log likelihood = -61.8.
Pairwise comparison Mean difference (estimated marginal means)
Infected vs. uninfected 0.18 ± 0.04, P < 0.001
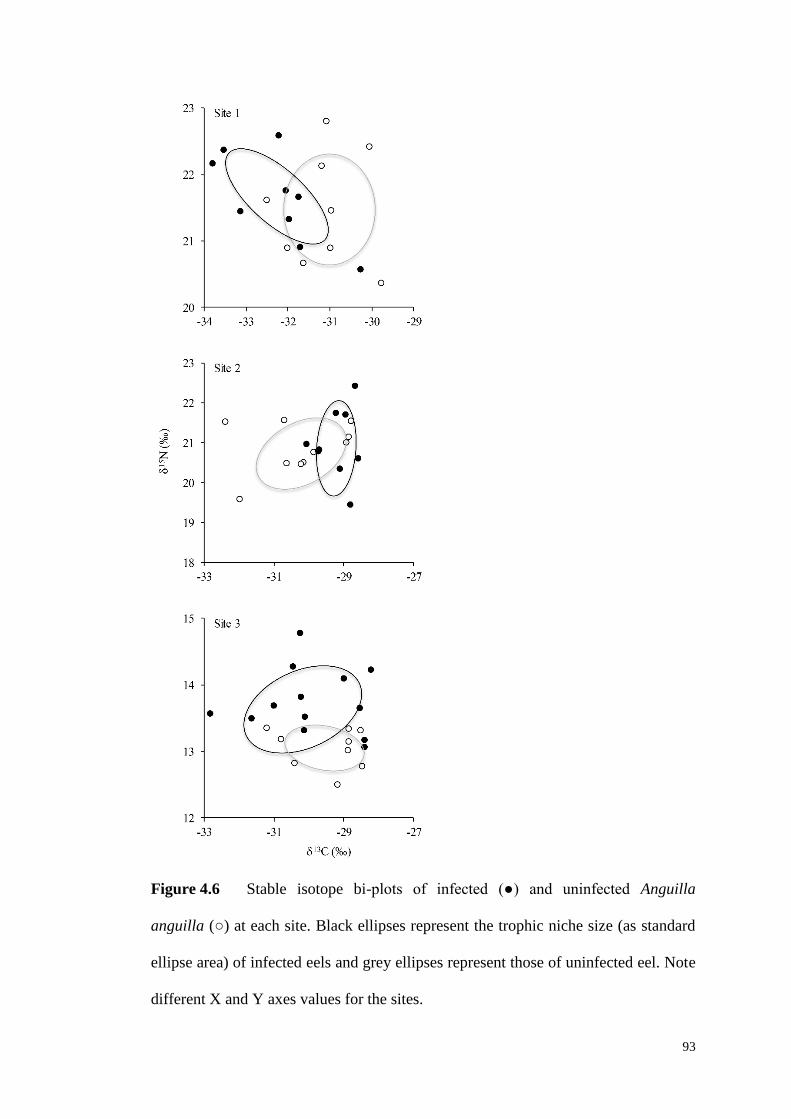
93
Figure 4.6 Stable isotope bi-plots of infected (●) and uninfected Anguilla
anguilla (○) at each site. Black ellipses represent the trophic niche size (as standard
ellipse area) of infected eels and grey ellipses represent those of uninfected eel. Note
different X and Y axes values for the sites.
94
The binary logistic regression models were all significant, revealing both HW:TL
ratios and the extent of piscivory had significant effects on A. crassus infection
(Table 4.5). Comparison of predicted group membership revealed that HW:TL ratio
correctly assigned 72 % of A. anguilla to their observed infection status, HW:TL
ratio and extent of piscivory correctly assigned 76 %, and extent of piscivory 78 %.
In the latter model, the difference in the mean probability of infection between
uninfected and infected A. anguilla was significant (uninfected: 0.34 ± 0.05;
infected: 0.71 ± 0.04; Mann Whitney U test Z = -4.72, P < 0.01) (Table 4.5).
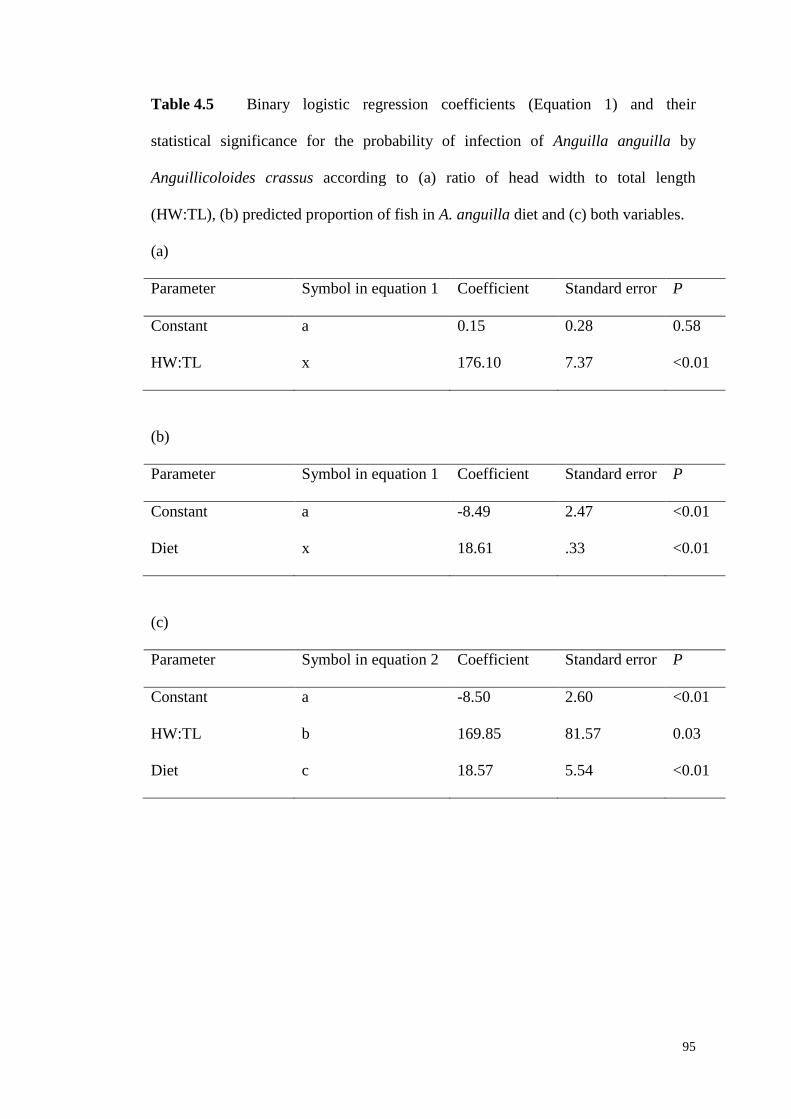
95
Table 4.5 Binary logistic regression coefficients (Equation 1) and their
statistical significance for the probability of infection of Anguilla anguilla by
Anguillicoloides crassus according to (a) ratio of head width to total length
(HW:TL), (b) predicted proportion of fish in A. anguilla diet and (c) both variables.
(a)
Parameter Symbol in equation 1 Coefficient Standard error P
Constant a 0.15 0.28 0.58
HW:TL x 176.10 7.37 <0.01
(b)
Parameter Symbol in equation 1 Coefficient Standard error P
Constant a -8.49 2.47 <0.01
Diet x 18.61 .33 <0.01
(c)
Parameter Symbol in equation 2 Coefficient Standard error P
Constant a -8.50 2.60 <0.01
HW:TL b 169.85 81.57 0.03
Diet c 18.57 5.54 <0.01
96
The linear mixed models testing the significance of differences in biometrics
according to light, medium and heavy A. crassus infections across the 32 infected A.
anguilla revealed some significant differences in lengths between these groups
(Table 4.6). However, there were no significant differences in HW:TL ratios, extent
of piscivory in diet, hepatic-somatic index and weight (Table 6), where the effect of
length as a covariate was significant in the latter model (P < 0.01). When these
variables were used in a multiple regression with parasite abundance used as a
continuous variable, the overall model was not significant (R2 = 0.17; F4,27 = 1.19, P
> 0.05), and none of the variables had significant effects on parasite abundance (P >
0.05 in all cases). Total length had the highest standardised β coefficient (β = 0.39, P
> 0.05)
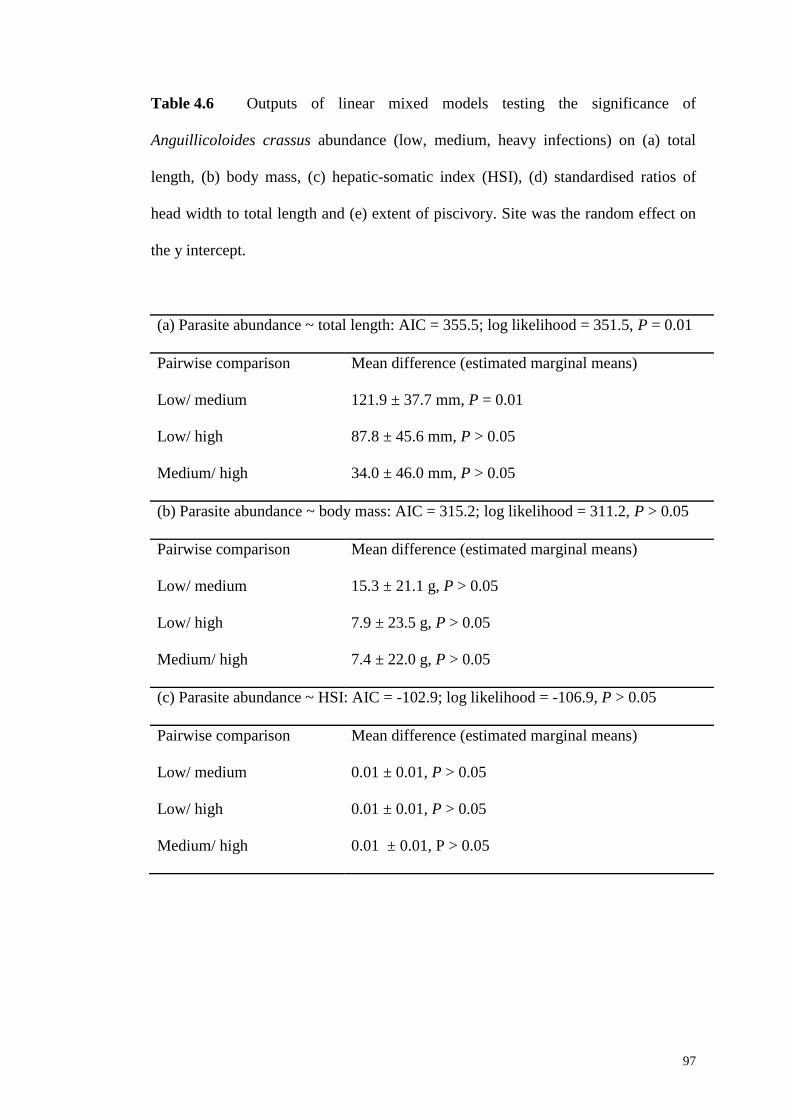
97
Table 4.6 Outputs of linear mixed models testing the significance of
Anguillicoloides crassus abundance (low, medium, heavy infections) on (a) total
length, (b) body mass, (c) hepatic-somatic index (HSI), (d) standardised ratios of
head width to total length and (e) extent of piscivory. Site was the random effect on
the y intercept.
(a) Parasite abundance ~ total length: AIC = 355.5; log likelihood = 351.5, P = 0.01
Pairwise comparison Mean difference (estimated marginal means)
Low/ medium 121.9 ± 37.7 mm, P = 0.01
Low/ high 87.8 ± 45.6 mm, P > 0.05
Medium/ high 34.0 ± 46.0 mm, P > 0.05
(b) Parasite abundance ~ body mass: AIC = 315.2; log likelihood = 311.2, P > 0.05
Pairwise comparison Mean difference (estimated marginal means)
Low/ medium 15.3 ± 21.1 g, P > 0.05
Low/ high 7.9 ± 23.5 g, P > 0.05
Medium/ high 7.4 ± 22.0 g, P > 0.05
(c) Parasite abundance ~ HSI: AIC = -102.9; log likelihood = -106.9, P > 0.05
Pairwise comparison Mean difference (estimated marginal means)
Low/ medium 0.01 ± 0.01, P > 0.05
Low/ high 0.01 ± 0.01, P > 0.05
Medium/ high 0.01 ± 0.01, P > 0.05
98
(Cont.)
(d) Model: Parasite abundance ~ HW:TL: AIC = -229.0; log likelihood = -233.0, P >
0.05
Pairwise comparison Mean difference (estimated marginal means)
Low/ medium 0.01 ± 0.01, P > 0.05
Low/ high 0.01 ± 0.01, P > 0.05
Medium/ high 0.01 ± 0.01, P > 0.05
(e) Model: Parasite abundance ~ piscivory: AIC = -59.89; log likelihood = -63.86; P
> 0.05
Pairwise comparison Mean difference (estimated marginal means)
Low/ medium 0.03 ± 0.03, P > 0.05
Low/ high 0.03 ± 0.03, P > 0.05
Medium/ high 0.06 ± 0.04, P > 0.05
4.5 Discussion
Anguilla anguilla head morphology is related to intra-population diet specialisation
whereby broader-headed fish are more piscivorous (Cucherousset et al. 2011).
Consequently, that head width: total length ratios were significantly higher in eel
infected by A. crassus in the three populations suggests this was associated with their
increased piscivory. This then infers that the consumption of paratenic fish hosts by
A. anguilla was important for A. crassus transmission in these populations. This
inference was also supported by the outputs of the stable isotope mixing models.
Whilst these indicated that all of the eels were facultative piscivores, individuals
with higher estimated proportions of fish in their diet had greater probabilities of
99
being infected with A. crassus. Thus, both head width: total length ratios and the
estimated proportion of fish in diet were significant predictors of infection status,
with up to 78 % of eels correctly assigned by the models.
The trophic fractionation between the eels and their prey fishes was often low and
highly variable, but generally below the 3.4 ‰ δ15
N that would be expected had their
diet been based entirely on fish, i.e. one trophic level (Grey 2006). This variability in
fractionation was then reflected in the predictions from the mixing models of the
proportions of fish in the diet of individual eels, where the mean for all eels was 0.53
(± 0.02 SE) and range 0.08 to 0.84. It should be noted that the mixing models
provided estimates of diet composition based on standard isotopic fractionation
factors and given that mixing models are sensitive to the fractionation factors used
(Phillips et al. 2014) then these might have influenced their outputs. Had species-
specific fractionation factors been available then some absolute differences in the
dietary proportions might have resulted (Bond and Diamond 2011; Phillips et al.
2014). Whilst this suggests some uncertainty in the extent of the actual differences in
piscivory between the infected and infected eels, it remains that broader headed eels
tend to be more piscivorous (e.g. Cucherousset et al. 2011) and the study outputs
revealed that the probability of infection increased significantly as head width
increased, irrespective of diet predictions. An alternative approach to providing
robust estimates of the extent of piscivory in A. anguilla diet would have been
stomach contents analysis, although this was not feasible with the low A. anguilla
sample numbers available. Indeed, the sample sizes used per population in the study
were relatively low compared with other recent studies on A. crassus (e.g. Lefebvre
et al. 2013), but this was unavoidable given the endangered status of eel populations
100
generally allied with the sampled populations being from small rivers. Consequently,
although the study outputs were unambiguous across the sites with consistent
infection patterns apparent, the use of small sample sizes and the diet estimates being
derived from mixing models does introduce some inherent uncertainties in the
overall output.
The recent study in Southern France of Lefebvre et al. (2013) revealed that A.
anguilla with severe swim bladder damage due to A. crassus infections had greater
body lengths and mass compared to non-infected individuals of the same age. The
authors postulated that their findings were most likely due to the most active foragers
growing faster and having a greater probability of becoming repeatedly infected via
trophic-transmission and with infection having a low energetic burden. Here, the
research did not reveal a similar significant difference in body length and mass
between infected and non-infected individuals, or any effect of parasite abundance
on biometrics, although the mean infection levels we recorded (< 3.0) were lower
than those (4.1 ± 4.4) reported by Lefebvre et al. (2013). Whilst it cannot be
discounted this being a potential effect of a smaller sample size used here, these
findings are consistent with other studies (Koops and Hartmann 1989; Wuertz et al.
1998). Irrespective, it can be argued argue that these outputs provide empirical
support for the interpretations of Lefebvre et al. (2013). However, rather that the
most active foragers are most vulnerable to the parasite, as the more piscivorous
individuals that are repeatedly exposed to the parasite, most likely via increased
consumption of paratenic fish hosts, facilitated by their head functional morphology.
It is speculated that the consequent greater energetic intake associated with piscivory
would then facilitate the faster growth rates observed by Lefebvre et al. (2013).
101
Notwithstanding these significant relationships between functional morphology, diet
and A. crassus infections, it is acknowledged that the extent of piscivory of
individual A. anguilla at the time of infection could not be determined.
Consequently, it cannot definitively be concluded that infection was a causal
consequence of head functional morphology. Moreover, in some fishes, parasitism
causes shifts in feeding behaviour and trophic position through mechanical processes
and/ or changes in energy demand (Barber et al. 2000; Britton et al. 2011), and can
induce changes in habitat utilisation that can influence foraging behaviours (Blanchet
et al. 2009; Britton et al. 2009). Thus, it cannot be discounted that the shift to
piscivory in A. anguilla occurred post-infection. However, this scenario was
considered unlikely, as A. anguilla head morphology is a well-recognised functional
trait known to enable greater individual specialisation in piscivory (Proman and
Reynolds 2000; Cucherousset et al. 2011), and was documented in their populations
prior to the introduction of A. crassus into Europe (Moriarty 1974; Tesch 1977). In
addition, the development of the trait of ‘broad-headedness’ is apparent throughout
the life of individual eels (from glass eel to maturity; Proman and Reynolds 2000)
and thus is unlikely to be a parasite-induced trait (Decharleroy et al. 1990; Moravec
et al. 1994). As such, it is proposed that the higher extent of piscivory that was
apparent through this functional morphology in infected A. anguilla at the time of
sampling was most likely a causal factor in their infection, with their increased
consumption of fish paratenic hosts at least partially responsible. However, we also
recognise that other factors, such as individual differences in MHC genes and
differences in cytokine regulation, might have also influenced the host qualities of
these eels, so that vulnerability to A. crassus infection is likely to depend on more
102
complex factors than diet and functional morphology alone (Knopf and Lucius
2008).
Several studies of A. crassus in A. anguilla have suggested that body size is a strong
predictor of infection, with larger A. anguilla having higher levels of prevalence and
abundance than smaller A. anguilla (Barus and Prokes 1996; Schabuss et al. 2005;
Lefebvre et al. 2013). In German populations, however, there was no correlation
between infection status and A. anguilla length and weight (Wuertz et al. 1998), as
with here. Overall, it is suggested that body length and mass are relatively crude
metrics to test against A. crassus infection, as A. anguilla growth rates in their
freshwater life-stage can be extremely variable (e.g. 14 to 152 mm per year
(Aprahamian 2000)), and the duration of the freshwater lifestage can be as low as 3
to 5 years (Camargue Lagoon, France; Melia et al. 2006) and as high as 33 to 57
years (Burrishole, Ireland; Poole and Reynolds 1996). Therefore, assessing infection
levels using a metric that is subject to such variability over time and space might be
limited in its utility for understanding infection dynamics. We suggest that
measurements that incorporate head functional morphology are a more appropriate
metric due to its influence on diet composition and the apparent importance of
paratenic hosts in A. crassus transmission.
Whilst the actual role of A. crassus in the decline of A. anguilla populations remains
unclear, the pathology associated with infections has been related to increased
freshwater mortality in populations exposed to additional environmental stressors
(Kirk 2003). Additionally, the damage to the swim bladder severely impacts on
swimming performance (Palstra et al. 2007), and can thus potentially disrupt
103
spawning migrations (Barry et al. 2014; Pelster 2015). Thus, in conclusion, it is
suggested these consequences of parasitism in A. anguilla are focused on those
individuals in populations whose functional morphology enables greater
specialisation in piscivory, through a mechanism of greater parasite exposure via
higher consumption of paratenic fish hosts. It also means that the effect of the
parasite, whilst potentially important for food web topology (Chapter 5) is less likely
to result in food web alterations when weighting is applied. Thus A.crassus is only
assessed in food web topology (Chapter 5) and is not considered thereafter.
104
5. Consequences of non-native parasites for topological food
webs
5.1 Abstract
Infectious food webs (food webs where parasites are included) tend to have distinct
properties from those where parasites are excluded, having increased chain length,
linkage density, nestedness and connectedness. Parasite inclusion in topological food
webs has highlighted that parasites are integral to the structuring and functioning of
ecosystems. However, how non-native parasites alter food web topology and metrics
remains uncertain. Here, topological food webs were built for each focal non-native
parasite to test their influence on food web structure and metrics. The metrics used
were food chain length, connectance and nestedness, the latter two being measures of
the web stability and robustness. At all sites, food web connectance was greatest in
the free-living species web, and chain length was highest in the fully infected web.
Two main factors were identified as important in determining the extent of alteration
when the addition of a non-native parasite to a topological web was completed: the
complexity of the extant food web and the complexity of the lifecycle of the non-
native parasite. When a non-native parasite with a complex lifecycle was added to a
complex web (Anguillicoides crassus), it had less effect on food web connectivity
and nestedness than when than a complex non-native parasite was added to a simpler
extant food web (Bothriocephalus acheilognathi). Thus, whilst the consequences of
non-native parasites for food web topology and associated metrics appeared context
dependent, all had less effect on food web topology than the addition of the native
parasite fauna.
105
5. 2 Introduction
5.2.1 Topological food webs and parasites
Food webs represent ecological communities via networks of trophic relationships,
and the structure and complexity of these networks influence community dynamics
and stability (Bascompte et al. 2003; Dunne et al. 2005). Analysis of food webs can
be used to investigate ecosystem changes and address general ecological questions.
For example, food-web analyses of species additions and deletions can be used to
understand the impact of invasions and extinctions (Dunne et al. 2002a; Petchey et
al. 2008a). In particular, species introductions - in addition to increasing species
richness - can alter food-web topology because a new species might act as a
consumer of, or a new resource for, existing species, or provide the critical resource
needed for other consumers to invade the web (Amundsen et al. 2013).
The case for including parasites in food webs has been well established in recent
years (Lafferty et al. 2006b; Marcogliese 2007; Hatcher and Dunn 2011; Hatcher et
al. 2012). The inclusion of parasites in topological food webs affects network
structure (Amundsen et al. 2003; Hudson et al. 2006; Lafferty et al. 2006a; Lafferty
et al. 2006b; Hernandez and Sukhdeo 2008; Lafferty 2008; Amundsen et al. 2009;
Amundsen et al. 2013), increases food-web complexity (Hudson et al. 2006) and
alters ecosystem stability (Dobson et al. 2006; Wood et al. 2007). Thus, it has been
realized through these studies that including parasites in food webs, i.e. building
infectious food webs, is fundamental to understanding food web structure and energy
flux. For example, along the Pacific coast of North America, the invasive Japanese
mud snail Batillaria cumingi has competitively excluded the native mud snail
Cerithidea californica (Torchin et al. 2005). This replacement would appear to have
106
minimal consequences for the topology of the food-web as one species is being
replaced directly with another with similar functional traits. However, once parasites
are considered then the topology of the food web is altered substantially, as B.
cumingi is host to only one trematode parasite whilst C. californica hosted eleven
(Lafferty and Kuris 2009) Thus, this loss of 10 species from the food web has
repercussions reflected in a range of food web metrics, including reduced
complexity, robustness and connectedness which occurred with the arrival of the
invasive snail.
When introduced species do not extirpate native species then parasite diversity could
increase as for every introduced free-living species, two parasite species are, on
average, also introduced (Torchin et al. 2003). Direct empirical evidence for shifts in
food web topology arising from the introduction of free living species with their
parasites is provided by invasive fishes in the pelagic food web of Lake Takvatn,
Norway (Amundsen et al. 2013). Introductions into this subarctic lake of Arctic charr
Salvelinus alpinus and three-spined stickleback, and their co-introduced parasites,
strongly altered the pelagic food web structure through increasing species richness
from 39 to 50 species (the two fishes plus nine parasites). This increased the number
of nodes and trophic links in the topological food web, the food-chain length and the
total number of trophic levels in the food web (Amundsen et al. 2013). Food web
complexity also increased, as revealed through increased linkage density, degree
distribution, vulnerability to natural enemies, and nestedness, all of which may have
consequences for network functioning and stability (Dunne et al. 2002a; Hatcher and
Dunn 2011; Amundsen et al. 2013).
107
When parasites are co-introduced with their free-living hosts, substantial alterations
in the structure of the qualitative food web can thus result, highlighting the
importance of accounting for native and introduced hosts and parasites in food-web
studies (Britton 2013). Furthermore, these changes in structure result not simply
from increases in diversity and complexity when parasites are included, but are
instead attributable to the unique roles that parasites play in food webs (Dunne et al.
2013). In their roles as resources, parasites have close physical intimacy with their
hosts, and thus are concomitant resources for the same predators. In their roles as
consumers, they can have complex life cycles and inverse consumer–resource body-
size ratios, different from many free-living consumers (Dunne et al. 2013). These
unique roles of parasites in food webs result in differing patterns of connection
compared to free-living species in the case of their roles as resources, and differences
in the breadth and contiguity of trophic niches between parasites and free-living
species in the case of their roles as consumers (Dunne et al. 2013).
Nevertheless, there remains a lack of studies examining how non-native parasites
affect food web topology in relation to different parasite lifecycles and assessing
how the additive effect of firstly native parasites and then the non-native parasite
modify food web structure. It is this that is being addressed here.
5.2.2 Food web metrics to measure ecological parameters
Food webs have long been used to visualise and describe ecological communities
through analysis of their networks. A number of metrics, of which some of the most
important and widely used are described below, describe aspects of food web
topology that can be calculated in order to explore the relationship of community
108
properties. These methods complement more conventional dynamical modelling,
experimental and comparative approaches that are traditionally used to explore
questions in stability-diversity and species richness-ecosystem function research
(Dunne et al. 2002a). Consequently, the utility of food web models is not just their
visual representation of food web structure but also their ability to determine food
web metrics that allow comparison between the food web in the presence or absence
of certain species. Note, however, that differences in values will not be associated
with a significance value; instead they are designed to reveal the scale of
modification through their numerical output. Theoretical work has demonstrated
how these measures relate to community stability properties such as robustness and
vulnerability to extinction and/ or invasion (Hatcher and Dunn 2011). The most
useful metrics are used in this chapter and are described below:
Food chain length. Food-chain length is an important food web property as it affects
a variety of ecosystem functions, such as primary and secondary production, rates
and stability of material cycling, and persistence of higher-order predators under
human-exploitation (Post 2002b). Food chain length indicates the number of times
chemical energy is transformed from a consumer’s diet into a consumer’s biomass
along the food chains that lead to the species. Maximum food chain length is the
maximum number of links between basal resources and top predator species
(Hatcher and Dunn 2011), whereas characteristic chain length is the mean chain
length for the web (Dunne et al. 2002a). Mean chain length is the metric used here.
As a general rule, parasites tend to considerably increase food chain length
(Thompson et al. 2012) with, for example, the addition of parasite species increasing
the maximum chain length (or height) of the food webs of the Ythan Estuary, Wales,
109
from 9 to 10, and for Loch Leven, Scotland, from 4 to 5, with parallels increase in
mean chain length (Huxham and Raffaelli 1995).
Connectance. Connectance of a food web (also called web density) is the percentage
of the possible links that are realized, i.e. it is the ratio of observed links to the total
number of possible links. Traditionally for a web of F species, the possible links
comprise a matrix of size F2 (Martinez 1991; Warren 1994). Here, however, the
modification developed by (Lafferty et al. 2006b) is used that was specifically
designed for parasitized webs. In this modified version, connectance (C) is
calculated as C = Lo/[(F + P)2], where Lo is number of observed links, F the number
of free-living species, and P the number of parasites. Including parasite species in a
food web increases both the numerator and the denominator, i.e. number of observed
and possible links (Lafferty et al. 2006b), however both need not change the same
amount. For example the addition of a single parasite species with multiple hosts,
would increase the numerator more than it would increase the denominator, thus
connectance is a valuable metric as altered not just by the addition of parasite
numbers but by the properties of those added species. A full description of
connectance in the context of parasites is provided in lafferty at al (2006b). Overall
inclusion of parasites tends to increase connectance (Lafferty et al. 2006b), for
example, analysis of seven food webs with and without parasites revealed that
including parasites always increased connectance (Dunne et al. 2013).
Nestedness. Nestedness, also termed clustering coefficient when referring to webs in
general, describes an aspect of how links are organised in a network. In a perfectly
nested network, each species interacts with a strict subset of other species in order of
110
increasing generality. Nestedness has implications for community robustness
(Hatcher and Dunn 2011) and is a relative measure of the cohesiveness of a network.
This pattern of interactions occurs because both generalists (species with many
interactions in the network) and specialists (species with few interactions in the
network) tend to interact with generalists, whereas specialist-to-specialist
interactions are rare (Bascompte et al. 2003). If perturbed, a highly nested
community is predicted to recover because species are less likely to be isolated after
the loss of other species (Bascompte et al. 2003). Previous studies have produced
conflicting results when considering the addition of parasites in food webs. For
example, relative nestedness increased in the Carpinteria salt marsh food web (USA)
with the addition of parasites (Lafferty et al. 2006b), whilst adding parasites
decreased nestedness in the food web of Muskingum Brook, New Jersey, USA
(Hernandez and Sukhdeo 2008).
5.2.3 Aims and objectives
The aim of the chapter was thus to determine how the inclusion of native and
introduced non-native macro-parasites modifies food web topology and associated
metrics. The objectives were to:
(i) assess the extent of topological food web modification caused by parasites by
analysing food web topology under three states: (1) free-living species only; (2) free-
living species and their native macro-parasites; and (3) free-living species, their
native macro-parasites and the non-native parasite. This objective was completed for
each non-native parasite, i.e. E. briani, A. crassus and B. acheilognathi within a
modelled environment; and
111
(ii) determine how parasite life-cycle (i.e. direct or complex) affects food-web
topology, irrespective of its native or non-native status. This objective was
completed using a simplified, theoretical food web.
5. 3 Materials and methods
5.3.1 Modelling the topological food web: data used to build food web
The basis of the food webs was data on the fish community and their parasite fauna.
These data were derived as per Chapters 2, 3 and 4. One series of food web models
was constructed per non-native parasite species, using one of each study sites as the
modelled environment. For the latter, the site selected was considered the most
representative of the parasite’s invaded habitat (subjective of the author) and where
the most information was available on the food web components. Consequently, the
sites were:
Ergasilus briani, Site 1: Basingstoke canal (Section 2.3, Figure 2.1);
Bothriocephalus acheilognathi, Site 2: Greater London fishery (Section 3.3,
Figure 3.1)
Anguillicoides crassus, Site 3: River Huntspill (Section 4.3, Figure 4.1).
It was then necessary to include parasites for species at lower trophic levels than fish
in order to provide a more comprehensive infectious food web model. However,
logistical constraints had prevented the detailed analysis of the parasites of macro-
invertebrates from field samples. Consequently, a heuristic approach was adopted for
parasites of macro-invertebrates, a common approach for topological food web
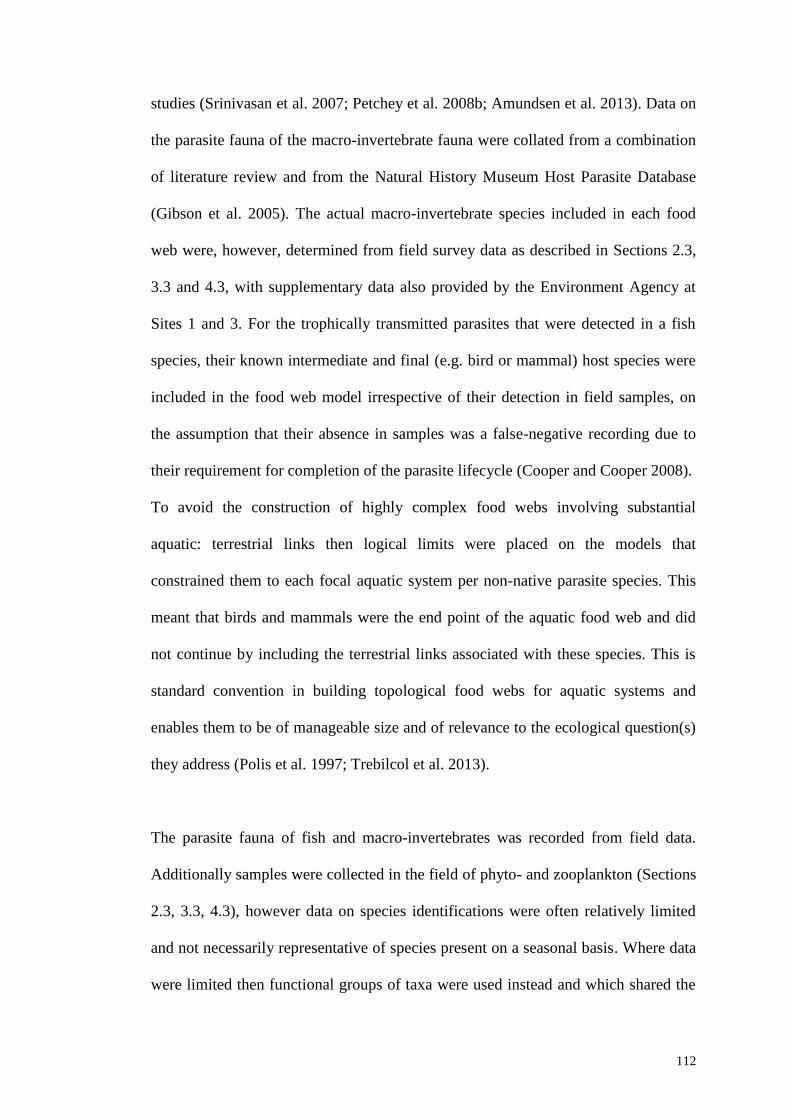
112
studies (Srinivasan et al. 2007; Petchey et al. 2008b; Amundsen et al. 2013). Data on
the parasite fauna of the macro-invertebrate fauna were collated from a combination
of literature review and from the Natural History Museum Host Parasite Database
(Gibson et al. 2005). The actual macro-invertebrate species included in each food
web were, however, determined from field survey data as described in Sections 2.3,
3.3 and 4.3, with supplementary data also provided by the Environment Agency at
Sites 1 and 3. For the trophically transmitted parasites that were detected in a fish
species, their known intermediate and final (e.g. bird or mammal) host species were
included in the food web model irrespective of their detection in field samples, on
the assumption that their absence in samples was a false-negative recording due to
their requirement for completion of the parasite lifecycle (Cooper and Cooper 2008).
To avoid the construction of highly complex food webs involving substantial
aquatic: terrestrial links then logical limits were placed on the models that
constrained them to each focal aquatic system per non-native parasite species. This
meant that birds and mammals were the end point of the aquatic food web and did
not continue by including the terrestrial links associated with these species. This is
standard convention in building topological food webs for aquatic systems and
enables them to be of manageable size and of relevance to the ecological question(s)
they address (Polis et al. 1997; Trebilcol et al. 2013).
The parasite fauna of fish and macro-invertebrates was recorded from field data.
Additionally samples were collected in the field of phyto- and zooplankton (Sections
2.3, 3.3, 4.3), however data on species identifications were often relatively limited
and not necessarily representative of species present on a seasonal basis. Where data
were limited then functional groups of taxa were used instead and which shared the
113
same set of predators and prey within a food web. Again, this heuristic approach is a
widely accepted convention in structural food-web studies that aims to reduce
methodological biases related to uneven resolution of taxa within and among food
webs (Dunne et al. 2002a). Full lists of species/functional species for each network
are available in Appendix 2.
Following collation of all of the species (or functional groups) of the piscivorous
birds and mammals, fish, macro-invertebrates, zooplankton and phytoplankton, and
their parasites, their feeding relationships were determined. For those involving the
fish species, these were constructed through analysis of their stomach contents and
the outputs of mixing models in stable isotope analysis (Section 2.4, 3.4, 4.4). For
the other species being modelled, their feeding relationships were derived
heuristically from literature reviews based on their typical diet composition. This
latter method is again the standard methodology used to reconstruct trophic
relationships in similar food web studies (Amundsen et al. 2013).
5.3.2 Preparing data for modelling
Following collation of the species lists to be modelled and derivation of their feeding
relationships, these data were then prepared for inputting into the food web models.
This involved the construction of a binary matrix (completed in MS Excel 2010),
where the relationship between each species included in the food web model was
recorded as 0 (no feeding interaction) or 1 (feeding interaction). The direction of that
relationship (i.e. which was the predator and which was the prey) was determined by
their direction within the matrix, whereby the x-axis of the matrix listed all the
species as predators and the y-axis of the matrix listed all the species as prey/
114
producers. Thus, in Figure 5.1, Species A is a producer, species B predates A only,
species C predates both species A and B and is cannibalistic. Species D predates
species B and C. Species D may be a free-living predator or a parasite, as both would
be represented in the same way. The food web matrices used for model construction
are provided in Appendix 3.
A B C D
A 0 0 0 0
B 1 0 0 0
C 1 1 1 0
D 0 1 1 0
Figure 5.1 Example of the structure of a network matrix as used in this study,
where 0 represents no feeding interaction and 1 represents a feeding interaction.
On their completion in MS Excel, the matrices were then transferred into R using the
package gdata (Warnes et al. 2015). This package comprises of various tools for data
manipulation, including the transformation of Excel spreadsheets into R readable
formats.
5.3.3 Food web modelling using igraph
Following conversion into R of the matrices being used as the basis of the food web
models, they were then converted into food webs (networks) using the network
analysis package igraph (Csardi and Nepusz 2006). This is an open source software
package that is used to create, manipulate and analyse the properties of graphs and
networks. It has the capability of specifying whole graph properties as well as those
115
of individual nodes (here, the species in the food web) and links (here, their feeding
relationships). These properties represented the food web metrics outlined in Section
5.2, i.e. connectedness, nestedness and food chain length.
5.3.4 Model finalisation
The parameterised food web models that were constructed in igraph, as outlined
above, were only considered as final (i.e. complete) when the tests revealed they had
small-world properties (Montoya and Sole 2002). This ‘small world’ attribute refers
to a food web that has many loosely connected nodes, non-random dense clustering
of a few nodes (i.e. keystone species), and small path length compared to a regular
lattice (Montoya and Sole 2002; Williams et al. 2002; Montoya et al. 2006). As the
webs were constructed heuristically (at least in part) then the small world test was
applied as a quantitative step to assess whether the food web could be considered to
have realistic structure and were comparable to other published food webs (Montoya
and Sole 2002; Proulx et al. 2005; Montoya et al. 2006).
This ‘small world’ procedure for model finalisation involved generating networks
with equivalent numbers of nodes (species) and links using the random graph
generator function in igraph. The connectance (C), number of links (L) and number
of Nodes (species) (N) of the modelled food web were then compared with those of
the random equivalent network (rand), i.e. Crand, Lrand, Nrand. As the networks in this
study are small (<100 species) and small networks, whilst displaying small world
properties fail to meet traditional mathematical criteria (Dunne et al. 2002a), a small
network correction was applied (Humphries and Gurney 2008). This recognises the
fact that small networks sit on a continuum of small world network attributes, whilst
116
having somewhat different mathematical properties and compensates for this. Thus,
for a food web to be a small world network and this considered final, then:
(C / Crand) / (L / Lrand) ≥ 0.012N1.11
At their completion, no webs failed this test.
5.3.5 Modelled scenarios
For each modelled non-native parasite system, three food webs were created, (1)
free-living species, native parasites and the focal non-native parasite; (2) free-living
species and native parasites only, derived by deletion of the foci non-native parasite
species from the data matrix prior to its running in i-graph; and (3) free-living
species only, derived by deletion of the native parasites from the matrices prior to
their running in igraph. This sequential method of deleting species to create new
food webs follows the procedure of (Amundsen et al. 2013). For each of these food
web scenarios, the graph metrics relating to the major ecological metrics of
connectance, nestedness and mean shortest chain length were obtained using igraph
functions and compared between them.
5.3.6 Parasite life-history testing using a simple model
To address the second objective of the Chapter regarding the consequences of
parasites with differing lifecycle properties, a basic model based on a simple
pyramid of free living species was constructed (Odum and Barrett 2005) that was
equivalent to a highly simplified version of the real food web. The properties of this
web were established as described in the steps above and then two directly- or two
trophically-transmitted parasites were added, and the metrics recalculated to assess
differences between parasite’s life-history on network metrics. The theoretical direct
parasites were modelled as if they parasitised only one species of fish in one case,
117
and two species in the other case, whilst the trophically transmitted parasites were
modelled to each infect multiple fish and invertebrate hosts and the single bird
included in the model food web.
5. 4 Results
5.4.1 Site 1, Ergasilus briani
The food web comprised of 42 species, of which 28 were free-living species, 13
were native parasites and E. briani (Table 5.1). The removal of native parasites from
the food web resulted in web properties that differed substantially from that in which
they were included (Table 5.1; Figure 5.2b, c). The number of species decreased
from 41 to 28, with 58 links removed from the web. Nestedness was reduced in the
web containing only free-living species, as was mean chain length, whilst
connectance was greater. Differences between metrics of the web containing E.
briani and all native parasites and free-living species were minor, with E. briani
removal slightly increasing connectance and nestedness but reducing mean chain
length (Table 5.1; Figures 5.2a and b).
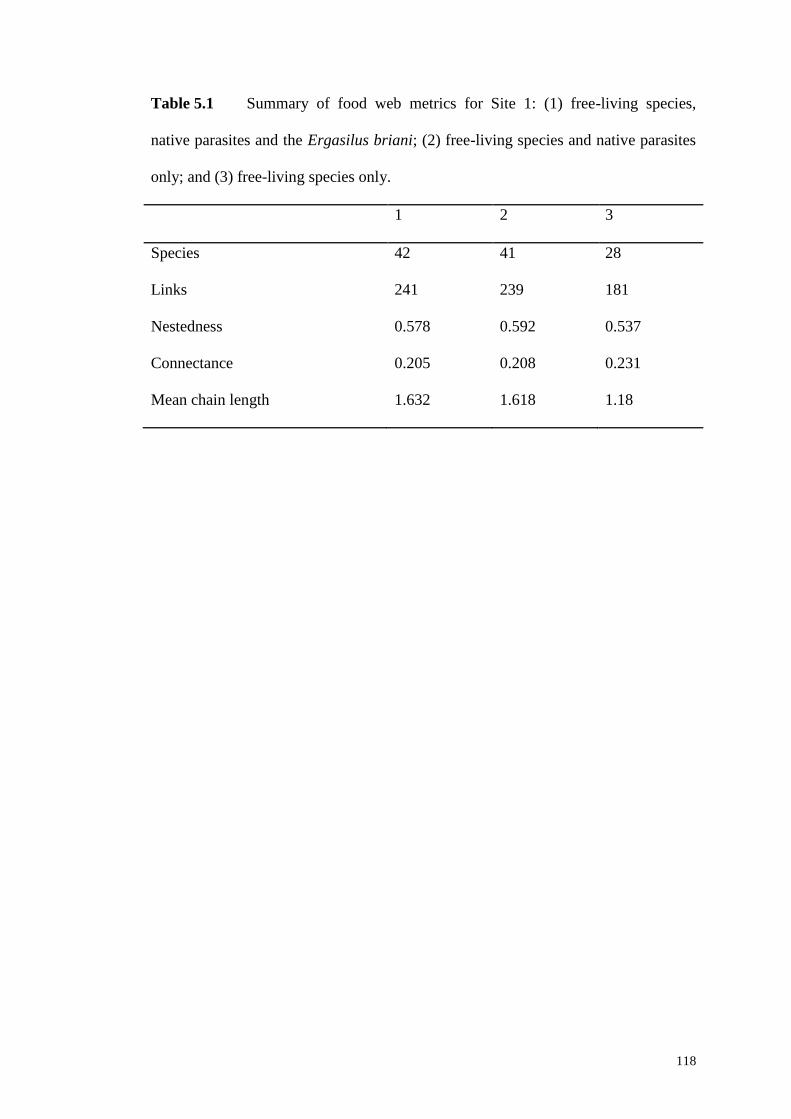
118
Table 5.1 Summary of food web metrics for Site 1: (1) free-living species,
native parasites and the Ergasilus briani; (2) free-living species and native parasites
only; and (3) free-living species only.
1 2 3
Species 42 41 28
Links 241 239 181
Nestedness 0.578 0.592 0.537
Connectance 0.205 0.208 0.231
Mean chain length 1.632 1.618 1.18
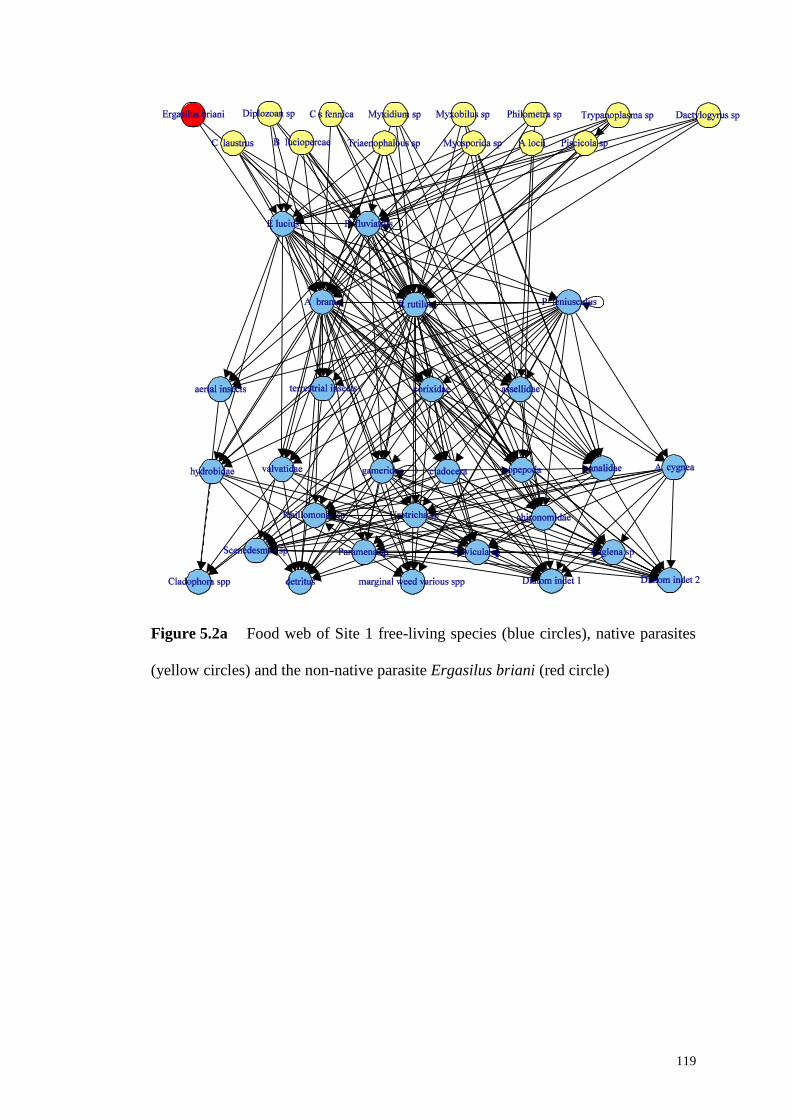
119
Figure 5.2a Food web of Site 1 free-living species (blue circles), native parasites
(yellow circles) and the non-native parasite Ergasilus briani (red circle)
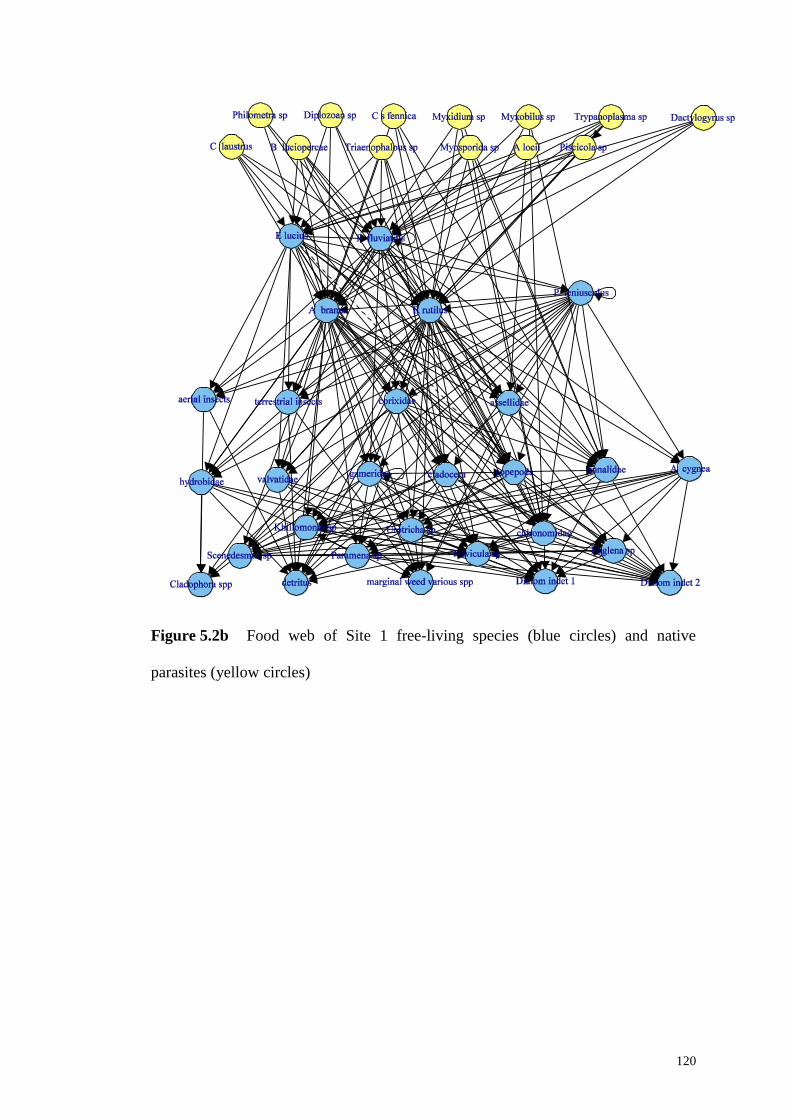
120
Figure 5.2b Food web of Site 1 free-living species (blue circles) and native
parasites (yellow circles)
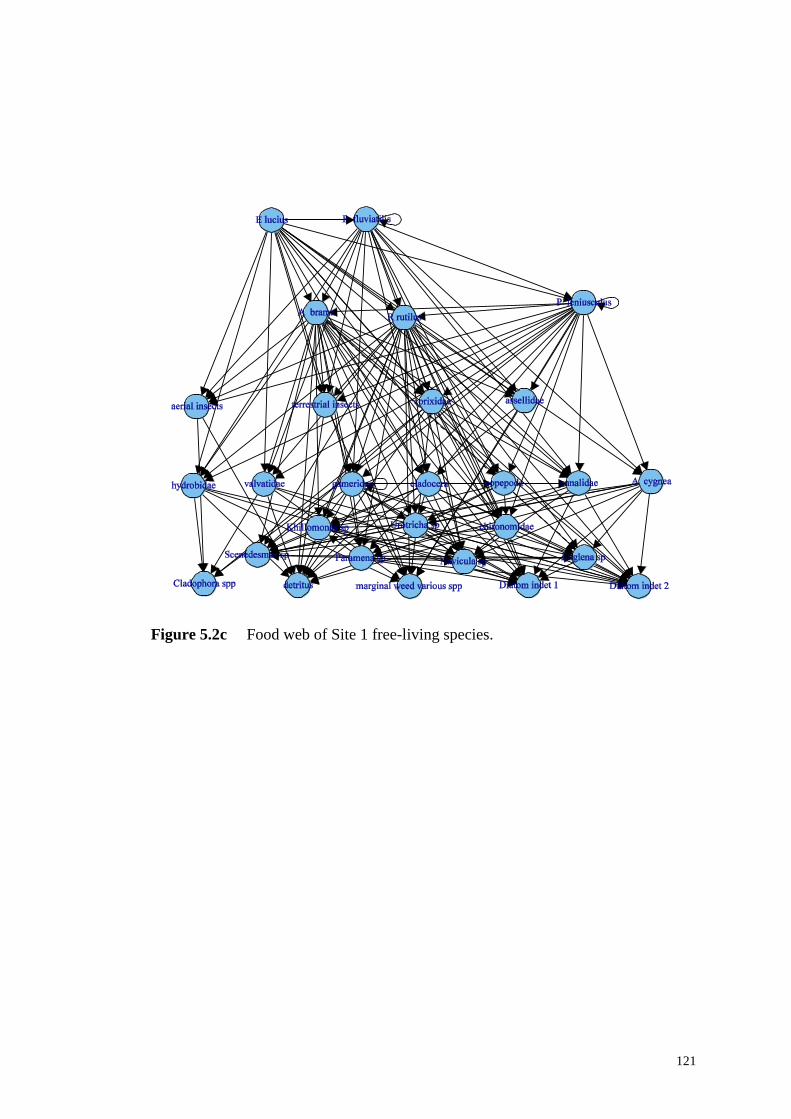
121
Figure 5.2c Food web of Site 1 free-living species.
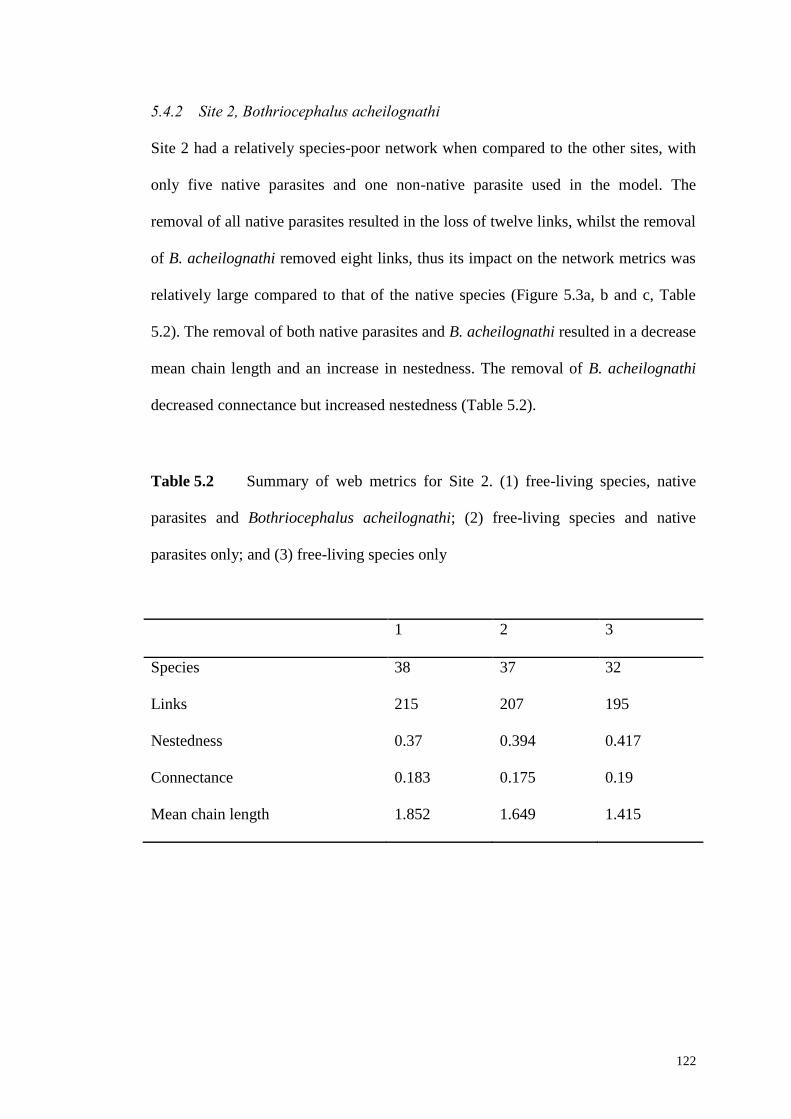
122
5.4.2 Site 2, Bothriocephalus acheilognathi
Site 2 had a relatively species-poor network when compared to the other sites, with
only five native parasites and one non-native parasite used in the model. The
removal of all native parasites resulted in the loss of twelve links, whilst the removal
of B. acheilognathi removed eight links, thus its impact on the network metrics was
relatively large compared to that of the native species (Figure 5.3a, b and c, Table
5.2). The removal of both native parasites and B. acheilognathi resulted in a decrease
mean chain length and an increase in nestedness. The removal of B. acheilognathi
decreased connectance but increased nestedness (Table 5.2).
Table 5.2 Summary of web metrics for Site 2. (1) free-living species, native
parasites and Bothriocephalus acheilognathi; (2) free-living species and native
parasites only; and (3) free-living species only
1 2 3
Species 38 37 32
Links 215 207 195
Nestedness 0.37 0.394 0.417
Connectance 0.183 0.175 0.19
Mean chain length 1.852 1.649 1.415
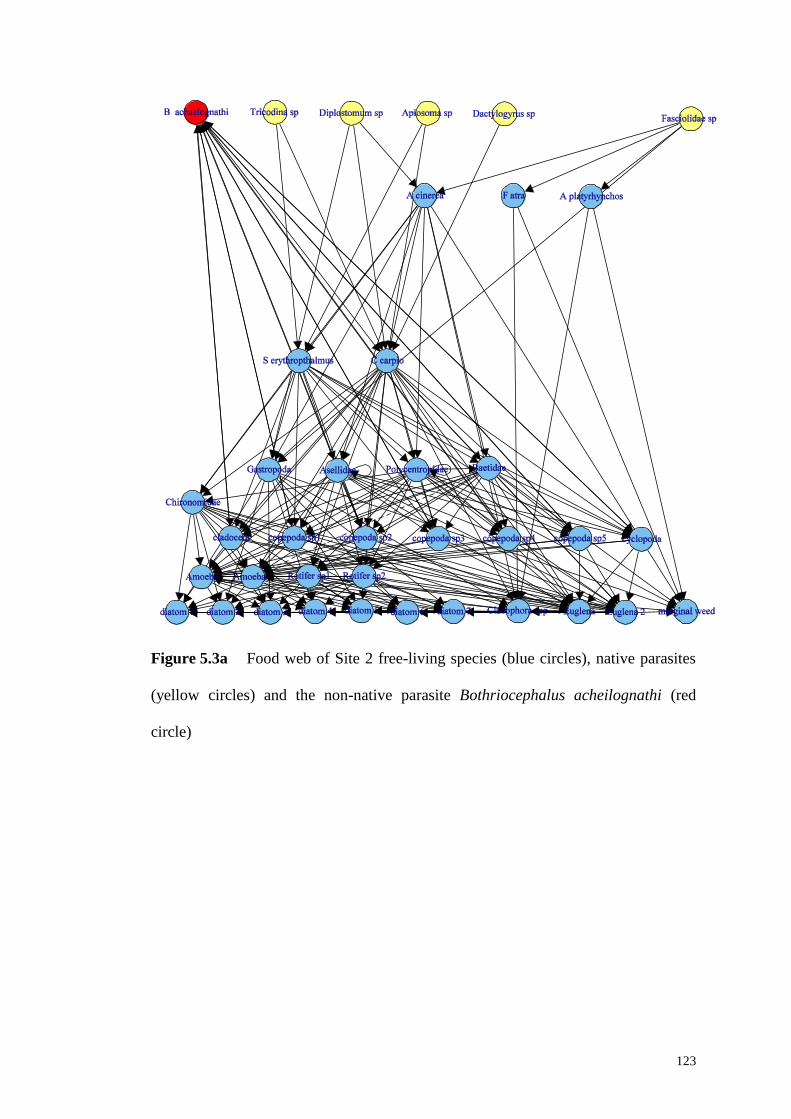
123
Figure 5.3a Food web of Site 2 free-living species (blue circles), native parasites
(yellow circles) and the non-native parasite Bothriocephalus acheilognathi (red
circle)
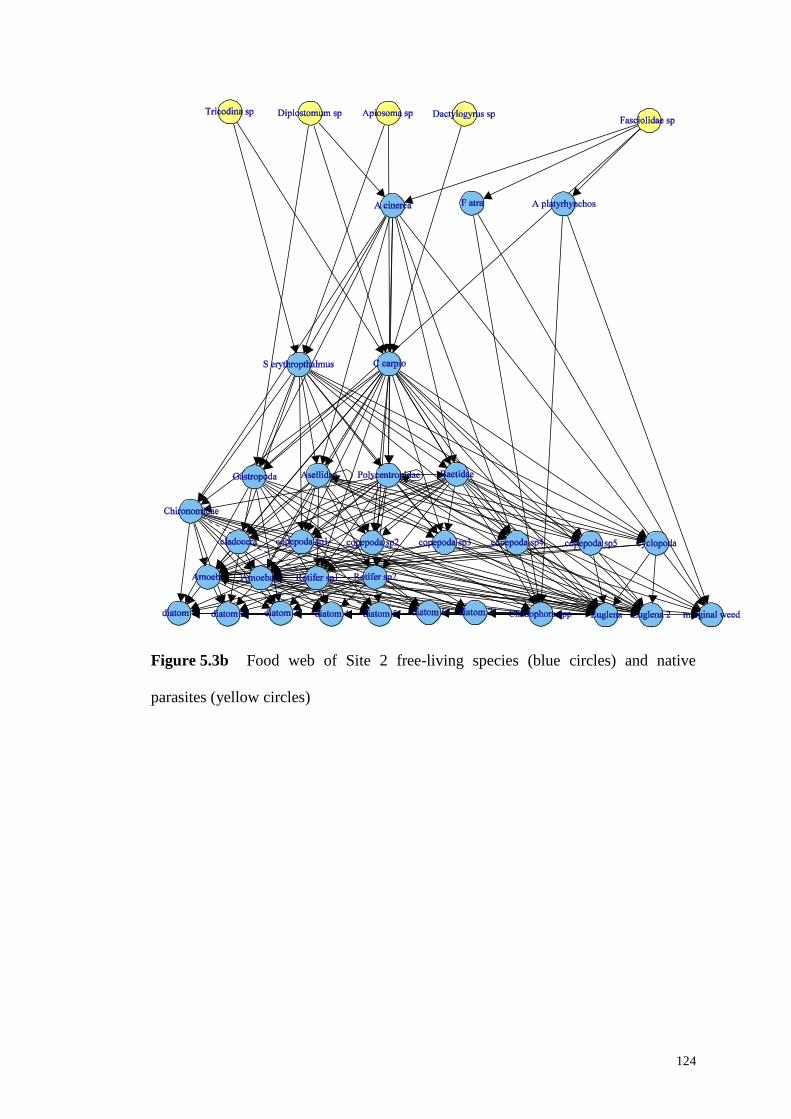
124
Figure 5.3b Food web of Site 2 free-living species (blue circles) and native
parasites (yellow circles)
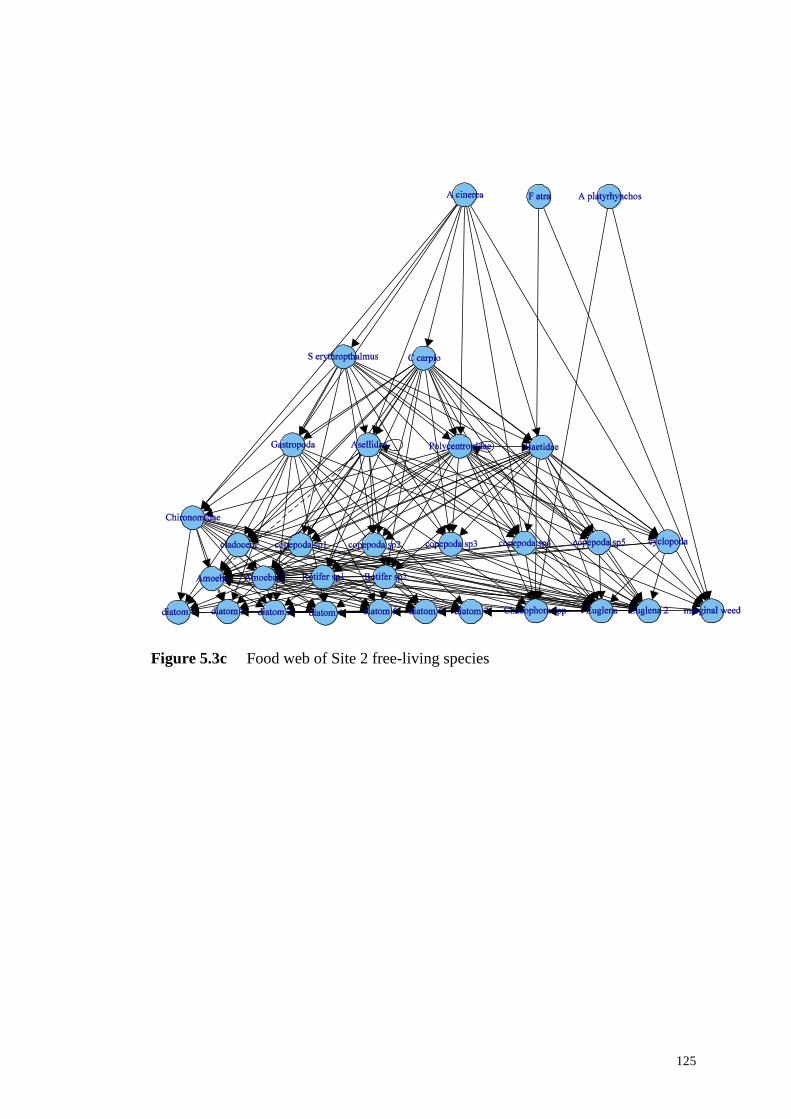
125
Figure 5.3c Food web of Site 2 free-living species
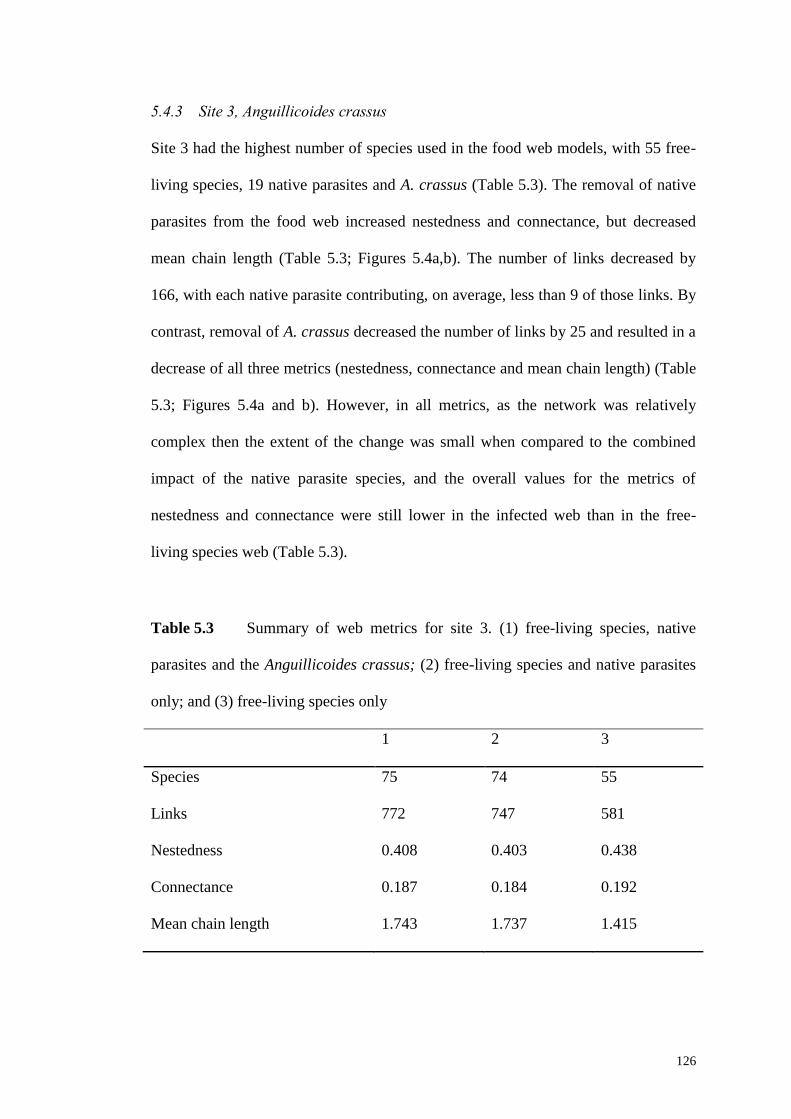
126
5.4.3 Site 3, Anguillicoides crassus
Site 3 had the highest number of species used in the food web models, with 55 free-
living species, 19 native parasites and A. crassus (Table 5.3). The removal of native
parasites from the food web increased nestedness and connectance, but decreased
mean chain length (Table 5.3; Figures 5.4a,b). The number of links decreased by
166, with each native parasite contributing, on average, less than 9 of those links. By
contrast, removal of A. crassus decreased the number of links by 25 and resulted in a
decrease of all three metrics (nestedness, connectance and mean chain length) (Table
5.3; Figures 5.4a and b). However, in all metrics, as the network was relatively
complex then the extent of the change was small when compared to the combined
impact of the native parasite species, and the overall values for the metrics of
nestedness and connectance were still lower in the infected web than in the free-
living species web (Table 5.3).
Table 5.3 Summary of web metrics for site 3. (1) free-living species, native
parasites and the Anguillicoides crassus; (2) free-living species and native parasites
only; and (3) free-living species only
1 2 3
Species 75 74 55
Links 772 747 581
Nestedness 0.408 0.403 0.438
Connectance 0.187 0.184 0.192
Mean chain length 1.743 1.737 1.415
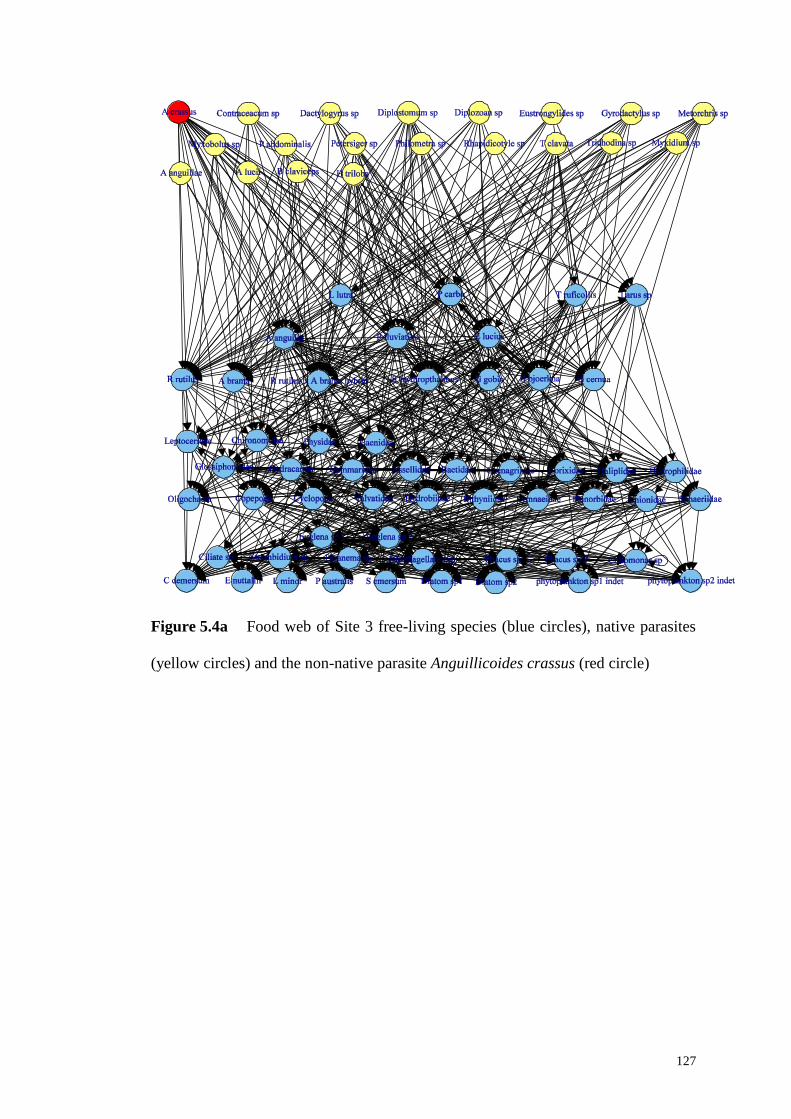
127
Figure 5.4a Food web of Site 3 free-living species (blue circles), native parasites
(yellow circles) and the non-native parasite Anguillicoides crassus (red circle)
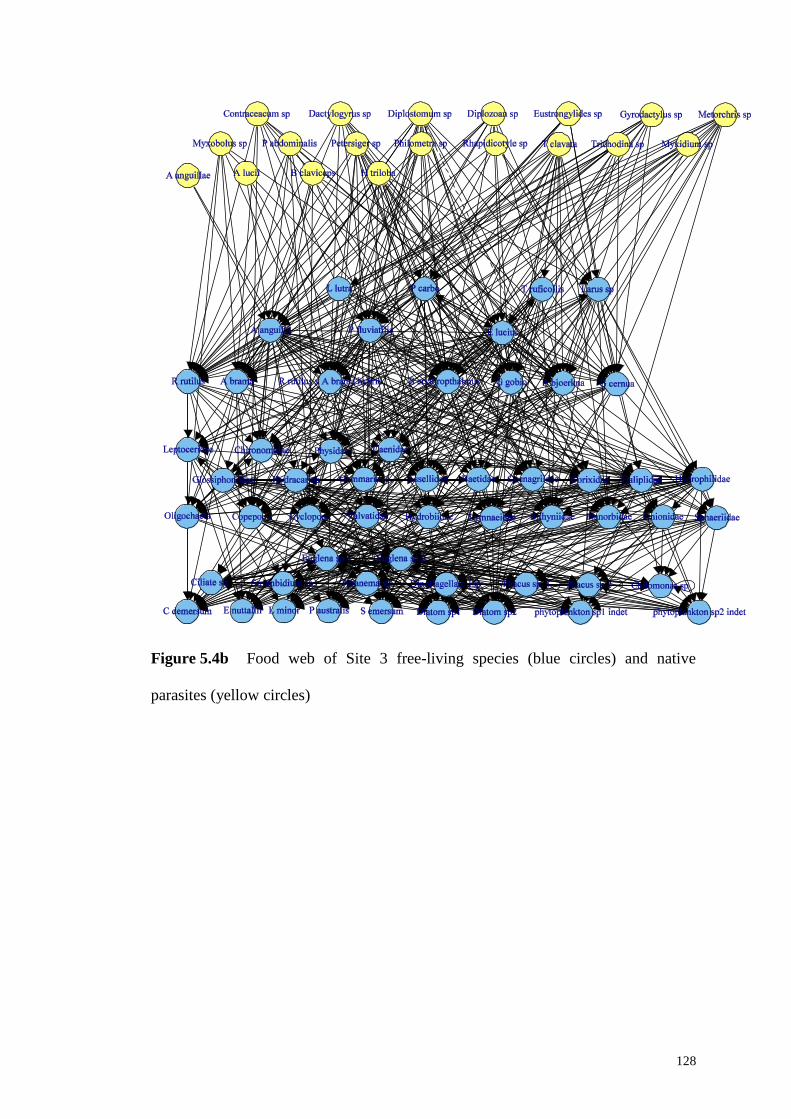
128
Figure 5.4b Food web of Site 3 free-living species (blue circles) and native
parasites (yellow circles)
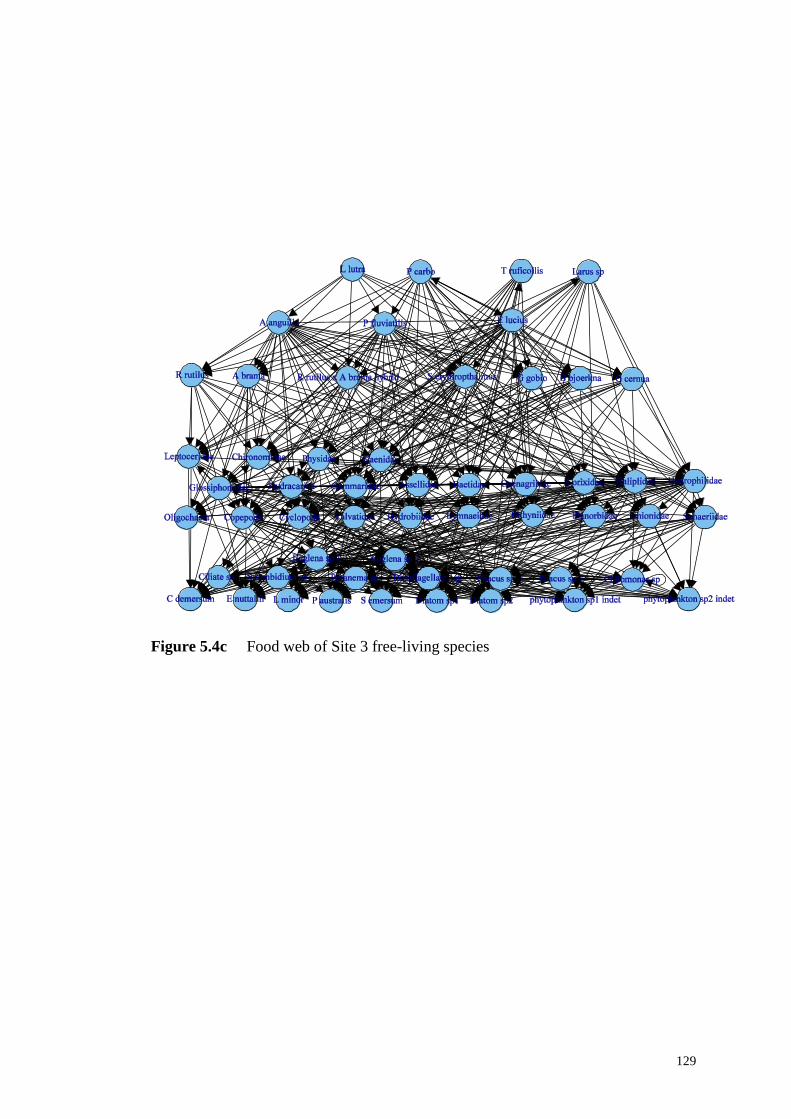
129
Figure 5.4c Food web of Site 3 free-living species
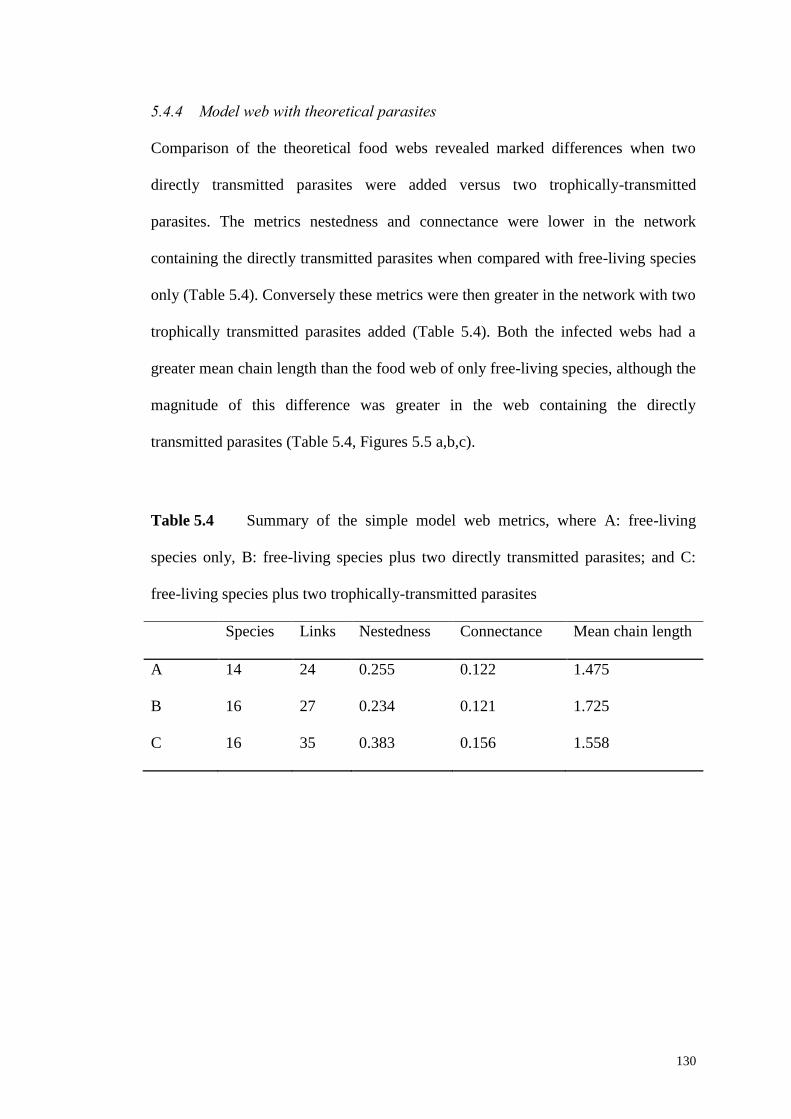
130
5.4.4 Model web with theoretical parasites
Comparison of the theoretical food webs revealed marked differences when two
directly transmitted parasites were added versus two trophically-transmitted
parasites. The metrics nestedness and connectance were lower in the network
containing the directly transmitted parasites when compared with free-living species
only (Table 5.4). Conversely these metrics were then greater in the network with two
trophically transmitted parasites added (Table 5.4). Both the infected webs had a
greater mean chain length than the food web of only free-living species, although the
magnitude of this difference was greater in the web containing the directly
transmitted parasites (Table 5.4, Figures 5.5 a,b,c).
Table 5.4 Summary of the simple model web metrics, where A: free-living
species only, B: free-living species plus two directly transmitted parasites; and C:
free-living species plus two trophically-transmitted parasites
Species Links Nestedness Connectance Mean chain length
A 14 24 0.255 0.122 1.475
B 16 27 0.234 0.121 1.725
C 16 35 0.383 0.156 1.558
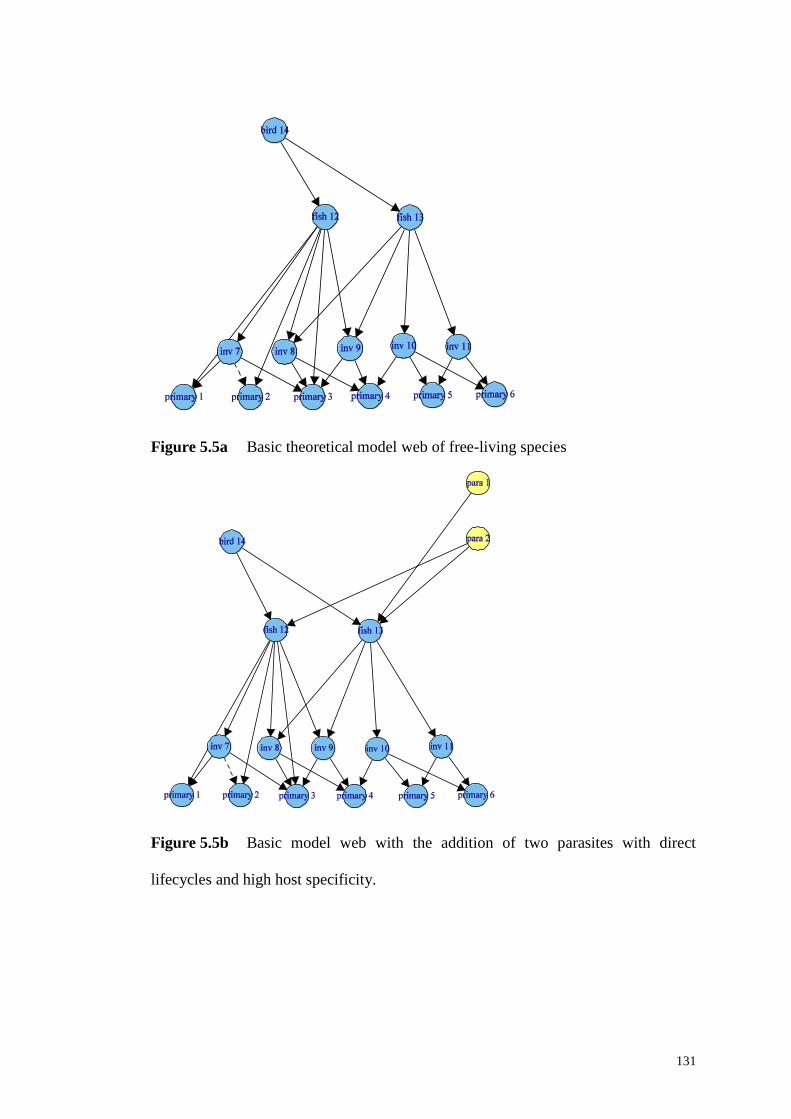
131
Figure 5.5a Basic theoretical model web of free-living species
Figure 5.5b Basic model web with the addition of two parasites with direct
lifecycles and high host specificity.
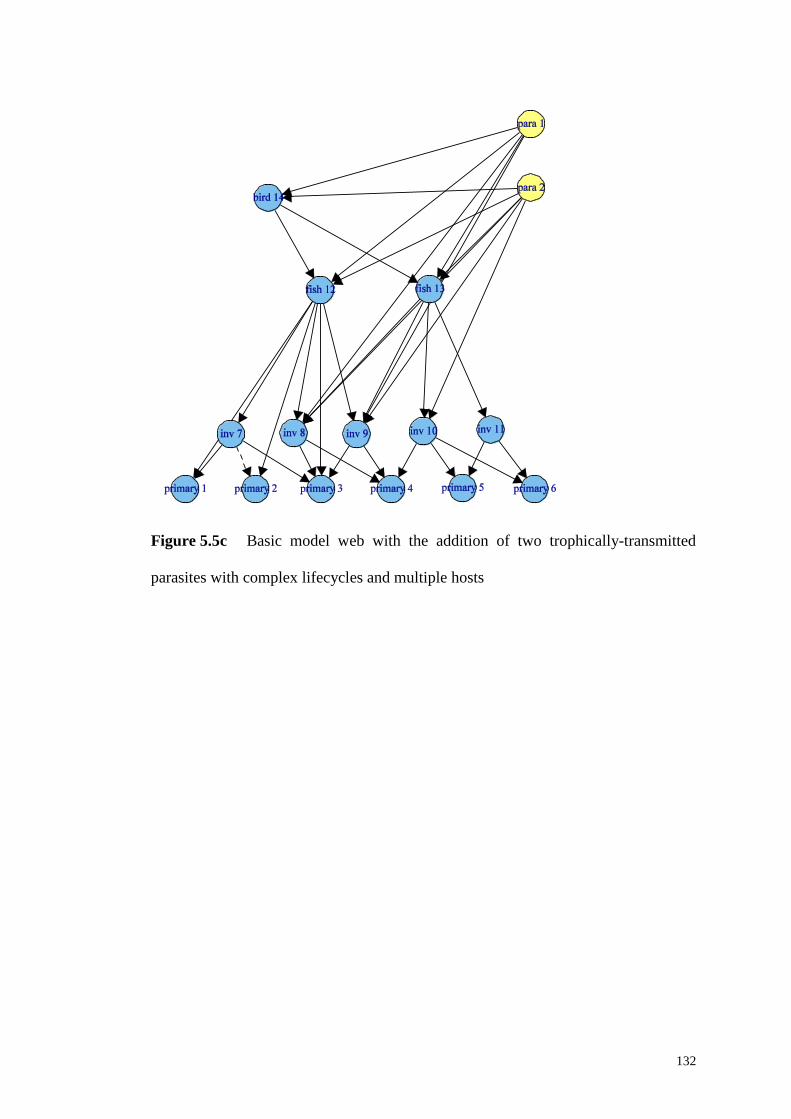
132
Figure 5.5c Basic model web with the addition of two trophically-transmitted
parasites with complex lifecycles and multiple hosts
133
5. 5 Discussion
The effects on the topological food web of adding native parasites to the free-living
species followed by the addition of a non-native parasite were successfully modelled.
Their effects varied at each site according to the complexity of the extant free-living
communities and their parasite fauna. At Site 3, the most complex site, the inclusion
of native parasites substantially altered the number of species and links in the food
web, and impacted the food web metrics as a result, with only minor changes then
caused by the inclusion of A. crassus. At Site 1, the effect of E. briani on the food
web was minimal, primarily because it is a directly-transmitted parasite that,
consequently, only created two new links. Whilst Site 2 was the least complex,
involving the lowest number of species and links, as the focal non-native parasite, B.
acheilognathi, was trophically-transmitted then when compared with E. briani, it had
a relatively large effect on the food web metrics, with the creation of 8 new links and
markedly reduced nestedness. This comparison of topological changes incurred in
the food web by directly-transmitted and trophically-transmitted parasites was also
supported by the theoretical models that revealed similar patterns.
The characteristics of the parasites used in the food web models were thus a large
influence on the food web topology. This indicates that it is the ecology and biology
of a parasite that will determine its influence on food web structure rather than, for
example, its native/ non-native status. This also means there is likely to be
considerable variability in the influences of different parasites on food web models
due to issues including:
Host specificity: Many parasite species are specific to only a single host, whereas
others have multiple hosts, with examples of extreme generalists such as the
134
amphibian parasite Batrachochytrium dendrobatidis that infects over 500 species
(Bielby et al. 2015). From a food web perspective, the larger the number of links that
a parasite has potential to make, the stronger its effect on the food web metrics. From
an invasion perspective, a generalist parasite has an increased chance of successful
establishment due to a greater number of potential host species (Taraschewski 2006;
Douda et al. 2012). The destabilization in the food web models incurred by the
addition of direct, specific parasites is also consistent with empirical data, as
parasites with high host specificity are particularly vulnerable to secondary
extinctions (Lafferty and Kuris 2009).
Lifecycle and strategy: Parasites differ widely in their life history strategy, and this
variability is key both to their mode of life as well as their impact on a food web
(Thompson et al. 2005). A direct lifecycle can be advantageous in that it only
requires the definitive host for completion, whereas a parasite with a complex
lifecycle might require a series of intermediate hosts prior to transmission to the final
host. In the case of the latter, the use of paratenic hosts can increase the probability
of transmission, as observed with A. crassus (Chapter 4).
Parasite detection: A problem with infectious food web studies such as this is that
discrepancies in parasite detection rates can have significant effects on the outcomes
of food web construction and analysis. As Poulin (1992) notes, parasite species that
have been observed more frequently are more likely to have a more complete record
of their hosts and ecology simply as a result of chance. For example, there is a much
higher prevalence of records for copepod parasites than monogeneans, despite these
two groups of ecto-parasites sharing similar direct lifecycles (Poulin 1992), a result
of copepods having received a greater amount of research effort. Another related
factor likely to skew structure of any food web model incorporating parasites is the
135
extent of the scrutiny that the hosts have been subjected to. For example, parasites of
commercially- and recreationally-important species are far more likely to have been
identified and studied than those of other species (Henderson et al. 2003). This was
reflected here where there was extensive literature on the fish parasites but with
substantially less available for macro-invertebrate species, other than those involved
in parasite trophic-transmission.
Comparison of the effects of parasites in food web metrics of this study with other
studies revealed the following similarities and differences.
Connectance: Here, in all three sites, connectance was reduced in the food webs
with parasites compared with only free-living organisms. Whilst this is contrary to
the majority of parasite-based food web studies (e.g. Martinez 1991; Huxham et al.
1996; Memmott et al. 2000), it is in agreement with the recent study of Amundsen et
al. (2013) of Lake Takvatn. This is of particular interest as this study considered the
impact of non-native fish and their associated parasites on web characteristics, as
opposed to the majority of other studies, which consider only native parasites.
Connectance is important in biological systems as robustness, the ability of a system
to resist cascading extinctions, increases with food-web connectance. In particular,
food webs experience `rivet-like' thresholds past which they display extreme
sensitivity to removal of highly connected species. Higher connectance delays the
onset of this threshold (Dunne et al. 2002b). Thus, an observed reduction in
connectance may signal an increase in the vulnerability of a system to extinctions.
Nestedness: The nestedness of the food web increased with the addition of parasites
at Site 1, as also shown in the Carpinteria salt marsh food web (Lafferty et al.
2006b), but decreased at Sites 2 and 3, as seen in the infectious food webs of
136
Muskingum Brook, New Jersey, USA (Hernandez and Sukhdeo 2008). Similar to
connectance, nestedness is considered to increase ecological stability, as a nested
system should recover better from perturbation as species are not isolated
(Bascompte et al. 2003). Reciprocal specialisation is the process that results in non-
nested patterns in networks and occurs, for example, when a parasite specialises on a
particular host through co-evolutionary processes (Joppa et al. 2010). Whilst
reciprocal specialisation is relatively rare in ecological networks (Joppa et al. 2009),
it is more frequent in parasites (Pedersen et al. 2005). Thus, the reduced nestedness
in this Chapter was the result of the inclusion of highly specialised parasites in the
food webs.
Mean chain length: At all sites, the mean chain length increased with the addition of
parasites, a trend consistent with all the studies cited above. Food chain length is of
interest in that it can be an indicator of limiting factors to a system, such as resource
availability and productive space, and it can modify key ecosystem functions such as
nutrient cycling, primary productivity and atmospheric carbon exchange (Post
2002a). Furthermore, food chain length can influence the concentration of
contaminants in top predators (Kidd et al. 1998), and indeed parasites have been
shown to play a role of sink to pollutants, for example Pomphorhynchus laevis has
been shown to act as a bioaccumulator of the heavy metals, lead and cadmium (Sures
and Siddall 1999; Thomas et al. 2000).
Determining the sub-lethal and ecological consequences of parasites can be
inherently difficult, and here a topological food web model approach was used in
order to identify the wider ecological implications of parasite introductions. The use
of network modelling was shown to provide a valuable analytical tool for
137
understanding how parasites can modify food web structure over multiple trophic
levels, and highlighted how the unique properties of parasites may alter networks in
a manner that differs from free-living species. From single host species to the case of
B. dendrobatidis, with the ability to infect over 500 species (Bielby et al. 2015),
there can be considerable variability in the parasite impact. Similarly, the properties
of the receiving system are critical in mitigating or exacerbating their effect, as
shown in comparisons of the effects of A. crassus, E. briani and B. acheilognathi in
the selected freshwater food webs of this chapter.
138
6. Weighted food webs to predict the outcomes of interactions of
non-native parasite infection and environmental change
6.1 Abstract
Weighted topological food webs incorporate the strength of the predator-prey
relationships into their network and thus have greater complexity and realism than
unweighted webs, and can provide a strong predictive tool. Weighting can be
completed via incorporating energy transfer between predators and prey that reflect
their measured trophic interactions. Here, the stable isotope data (Chapters 2 and 3)
and topological food webs (Chapter 5) were integrated to provide weighted food web
models for E. briani and B. acheilognathi that were then used to test scenarios of
environmental change on food web structure using (i) the relative proportions of
producers and primary consumers that contribute to diets of higher consumers (i.e.
fish); and (ii) biomass of fish species that models of fixed biomass would be
predicted to support. Models predicted that increasing parasite prevalence in host
populations of E. briani would have little impact on food web structure, whereas
increasing parasite prevalence in host C. carpio populations of B. acheilognathi
would alter the overall structure of the food web and ratio of trophic levels to each
other, with higher consumers directly consuming more primary producers and a
lower biomass of primary consumers. Models then simulated how environmental
disturbance affected the weighted food webs and suggested that shifts to more
eutrophic conditions provided some net benefits for infected fishes via facilitating
their increased biomass through the provision of increased food resources based on
primary producers. Thus, where infection consequences of non-native parasites are

139
sub-lethal and include some constraints on host foraging performance, then
eutrophication could provide these fishes with greater food availability and thus
resilience to both the adverse effects of parasitism and environmental change.
6.2 Introduction
6.2.1 Weighted food webs
The food webs developed in Chapter 5 provided a topological description of the
complexity of the networks in the presence and absence of parasites, including the
focal non-native parasites. They produced descriptive statistics from the networks
that enabled, for example, comparison in food web metrics between infected and
uninfected webs, and between webs constructed from different systems involving
different parasites.
A short-coming of the topological approach is, however, that all links are treated as
equal, giving no indication of the strength of each relationship, such as whether a
prey item was major food component of a predator, consuming it regularly, or rather
just a minor component, preying upon it infrequently (Bersier et al. 2002).
Consequently, when food webs can be ‘weighted’ by including a measure of the
strengths of predator-prey relationships in the network, then the resultant food web
model has greater complexity allied with more realism (Zhang and Guo 2010), thus
improving its utility as a predictive tool (Thompson et al. 2012).
Different metrics, such as strength of the trophic interaction (Emmerson and
Raffaelli 2004), or the amount of energy flow (Amundsen et al. 2013), can be
incorporated into ecological networks in order to weight the network dependent on
140
the question the network analysis aims to answer. In the case of the former, body
size has been used in a number of studies (Woodward et al. 2005), such as the study
of Emmerson and Raffaelli (2004) examining dynamics of food web stability in the
Ythan estuary, whilst Dorresteijn et al. (2015) used the frequency of interaction to
weight a terrestrial food web and investigate human impact on large mammal
behaviours and predation patterns in Transylvania. More frequently, energy is
incorporated into webs to create realistic simulations of trophic interactions in food
webs, and where these steps have been taken to incorporate trophic data into
weighted networks then important ecological attributes have been determined, for
example, estimating food chain length from basal energy (Thompson and Townsend
2005; Arim et al. 2007), or determining the importance of terrestrial input in aquatic
systems (Kawaguchi et al. 2003).
6.2.2 Stable isotopes as a means of gathering food web information
Stable isotope analysis increasingly represents an effective ecological tool for
elucidating trophic relationships in food webs (Peterson et al. 1985; Grey 2006;
Semmens et al. 2009). The application of δ13
C and δ15
N to food web structure has
enabled reconstructions of the trophic relationships between species (Sections 2.4,
3.4, 4.4) and identified the basis of production, such as allochthonous versus
autochthonous energy inputs (McCutchan et al. 2005; Grey 2006). They can be used
to determine trophic niche sizes and associated relationships between species
(Sections 2.4, 3.4, 4.4; (Layman et al. 2007; Jackson et al. 2011; Jackson et al.
2012)), and estimate diet composition (Sections 2.4, 3.4, 4.4, Jackson et al. 2011).
Thus, through stable isotope analysis, it is possible to establish not only if predator
prey relationships exist between species, but also estimate the relative proportions of
141
each food item in the diet of each consumer species. In doing so, it provides a
methodology that can be used as the basis for ‘weighting’ topological food webs.
6.2.3 Maintaining food web equilibrium and impact of introducing non-native
species
Food webs are driven by a combination of bottom-up (from primary producers) and
top-down (from consumers) processes (Reid et al. 2000). Shifts in this balance can
have significant impacts on the web community. An example of a bottom-up process
impacting food web structure is the shift from eelgrass (Zostera marina) to sea
lettuce (Ulva lactuca) as a dominant producer in Canadian estuaries, the result of
anthropogenic eutrophication that caused major shifts in the composition of major
faunal and floral communities, and reduced fish species richness and abundance
(Schein et al. 2012). There are multiple examples of trophic cascades resulting from
top-down processes, where changes in predator-prey relationships alter the food web
beyond the immediate prey populations. For example, experimental manipulations of
fish in a Northern California river revealed removal of predatory fish, which
consume predatory insects and fish fry, increased the survival of these species that in
turn fed on chironomid larvae. In the presence of fish, filamentous green algae were
very limited and were infested with chironomids. When the larger fish were absent,
this released the predation pressure on the smaller predators that previously
suppressed chironomids, resulting in substantially reduced algal grazing and
increased algal biomass (Power 1990).
Non-native invasive species can also have significant impacts when they invade food
webs (Vitousek et al. 1996), for example, invasive zebra mussels Dreissena
142
polymorpha in the Hudson River estuary reduced phytoplankton densities by up to
85%, with associated declines in planktonic grazers that drastically transformed the
food web (Caraco et al. 1997; Strayer et al. 2014). The invasion of Pseudorasbora
parva into ponds in the UK, induced multiple changes in the foodweb, with shifts to
a cyanobacteria dominated phytoplankton community, and increased trophic overlap
between cohabiting fish species, that reduced somatic growth in R. rutilus (Britton et
al. 2010). In Topanga Creek, California, benthic macroinvertebrate abundance and
species richness was lower in the presence of the invasive red swamp crayfish,
Procambarus clarkii. This change in the structure of the web impacted the California
newt Taricha torosa (endemic species) and the California steelhead trout
Oncorhynchus mykiss irideus (endangered), which are predators of the depleted
macroinvertebrate community (Garcia et al. 2015). Adding an additional species to a
food web is, therefore, more than a simple topological addition, as it can potentially
have multiple cascading trophic consequences throughout the entire foodweb.
Due to their small size, parasites are rarely considered in a trophic context except
when their total biomass is such that they represent a significant food resource (Kuris
et al. 2008). Yet in Chapters 2 and 3, two ways were identified in which parasitism
can alter trophic niche of hosts by causing them to become more specialised in their
diet (as in the case of Ergasilus briani infected R. rutilus and A. brama; Chapter 2)
or to shift their trophic niche, preying on different resources (as in Bothriochephalus
acheilognathi infected C. carpio, Chapter 3). Although some examples of significant
dietary changes induced by native parasites exist, for example cyprinids infected
with Ligula intestinalis shift to exploiting prey items for which competition is less
(Loot et al. 2001), the impacts of non-native parasites on naïve hosts are often more
143
severe as their hosts lack any co-evolved mechanisms of resistance or tolerance
(Johnsen and Jensen 1986), and thus can provide excellent model species to study
the whole foodweb consequences of opportunistic parasitism.
Numerous factors, such as host density (Jansen et al. 2012), co-existence of other
parasites (Cox 2001) or environmental abiotic variables (Sures 2008), affect parasite
prevalence and abundance, yet levels of infection are critical to the impact of the
parasite on its host population (MacKenzie and Abaunza 1998). Application of
weighted models allows variability in infection level to be incorporated into the food
web, and the scale of infection consequences to be investigated, which is very
difficult to achieve empirically.
6.2.4 Non-native parasites in a disturbed system
Invasive species can cause habitat degradation with, for example, burrowing and
foraging by the invasive crayfish Procambarus clarkii causing structural damage to
river banks and increasing erosion (Angeler et al. 2001). However, many invasive
species are opportunistic, taking advantage of other forms of ecosystem change, such
as habitat disturbance, rather than being the drivers of change themselves (Gurevitch
and Padilla 2004; MacDougall and Turkington 2005). Anthropogenic eutrophication
is a major cause of degradation of freshwater systems (Carpenter et al. 1998), as the
increase in biologically available nitrate and phosphate impacts aspects of the water
chemistry and biota, and alters ecosystem structure and functioning (Smith et al.
1999; Dodds et al. 2009). The effect is a shift from a system in which macrophytes
are significant primary producers to ones in which phytoplankton are dominant,
reducing water clarity and resulting in further declines in macrophyte biomass,
144
further releasing nutrients to drive the phytoplankton dynamics (Hough et al. 1989;
Smith et al. 1999). Moreover, eutrophication often increases parasite prevalence in
host populations (Lafferty 2008), especially those parasites that are generalists with
local recruitment and short life cycles (Marcogliese 2001). Correspondingly, the
consequences of the interactions of anthropogenic eutrophication and parasite
prevalence on host populations are a key focus of this Chapter.
6.2.5 Aim and objectives
The aim here was to develop weighted food web models for each food web of
Chapter 5 in order to provide an analysis of how food web structure was altered by
parasites when the feeding relationships of the consumer species were accounted for.
Objectives (O) were to:
O1. Develop the method of weighting the topological food webs from Chapter 5
using the outputs of stable isotope analysis outlined in previous data chapters;
O2. Apply the weighting to the topological food web models to develop final models
capable of predicting the impacts of the parasites on food web structure and energy
flux; and
O3. Use the final weighted webs to quantify the ecological consequences of parasites
on infected fishes under scenarios of altered parasite prevalence and anthropogenic
eutrophication, where the latter is represented by shifts in the proportions of
phytoplankton and macrophytes.
145
6.3 Materials and Methods
6.3.1 Data used to build food web
Data from the stable isotope analyses from Sites 1 and 2 (cf. Chapter 5) were used in
which the following non-native parasites were present:
Ergasilus briani, Site 1: Basingstoke canal (Section 2.3, Figure 2.1);
Bothriocephalus acheilognathi, Site 2: Greater London fishery (Section 3.3,
Figure 3.1)
The effect of Anguillicoides crassus on Anguilla anguilla was not included in this
chapter as although significant differences in the trophic niche of infected and
uninfected A.anguilla were observed, the differences were not necessarily due to
infection by A. crassus but were instead related to eel functional morphology
(Chapter 4).
Data collection at each site was as per Sections 2.3 and 3.3. This provided data on
the stable isotopes of δ13
C and δ15
N for the infected and uninfected fish in the host
populations, the other fish species present, and their putative food resources.
Bayesian mixing models were used to estimate the proportions of these food
resources in the diets of all fish species, including the infected and uninfected
components of the host populations (Sections 2.4 and 3.4). For the other species
present in the food web but for which these dietary data were not collected and
analysed (primarily the piscivorous birds and the macro-invertebrates), a heuristic
approach was used, applying published information on their diet compositions to the
food web calculations, as per (Vander Zanden et al. 1997; Vadeboncoeur et al.
2002).
146
6.3.2 Preparing the data for modelling
The basis of the weighted food web modelling was the topological webs used in
Chapter 5. However, as here they were being combined with the outputs of the stable
isotope mixing models, the topological models were modified so they matched the
way in which fish putative food resources were combined in the mixing models. For
example, rather than including a number of arthropod species in the web, these were
now combined into a single node as the mixing models had combined their data due
to minimal differences in stable isotope values (Phillips et al. 2005). An advantage of
weighting the foodweb in this manner was that as well as adding content, it
eliminated an issue generally encountered in topological webs, whereby the level of
taxonomic sensitivity of the data can skew their metrics (Williams and Martinez
2000)
The next step was to construct a matrix that described the feeding relationships
between each species (or species grouping) in the food web. As per Chapter 5, this
was completed in MS Excel 2010 but whereas there it was based on binary relations
(0 and 1), here they were based on the dietary proportions (scale of 0 to 100) that
were estimated from the mixing models and the heuristic analysis that quantified the
strengths of the relationships between the consumers and prey species/ groups; 95%
confidence intervals were calculated from the standard error of the mixing models
and also incorporated into the matrix. As per Section 5.3, the direction of that
relationship (i.e. which was the predator and which was the prey) was determined by
their direction within the matrix, whereby the y-axis of the matrix listed all the
species as predators and the x-axis of the matrix listed all the species as prey/
producers. Thus, in the example of Figure 6.1, Species A is a producer, species B
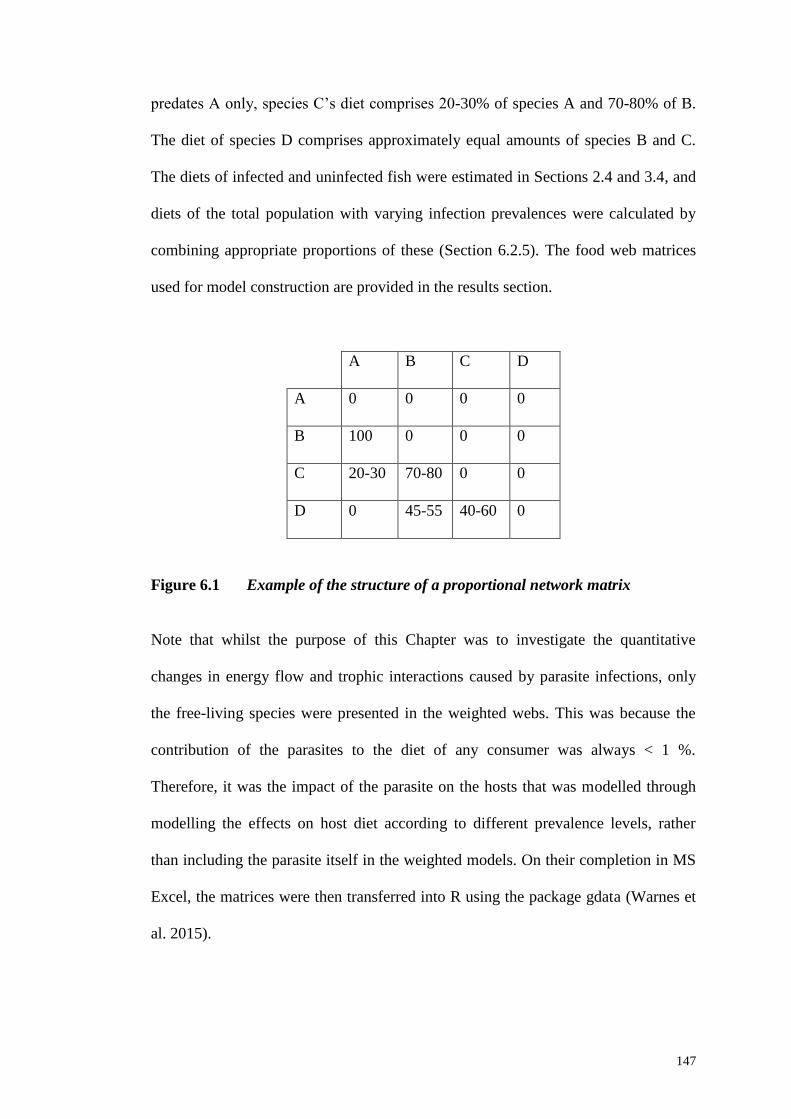
147
predates A only, species C’s diet comprises 20-30% of species A and 70-80% of B.
The diet of species D comprises approximately equal amounts of species B and C.
The diets of infected and uninfected fish were estimated in Sections 2.4 and 3.4, and
diets of the total population with varying infection prevalences were calculated by
combining appropriate proportions of these (Section 6.2.5). The food web matrices
used for model construction are provided in the results section.
A B C D
A 0 0 0 0
B 100 0 0 0
C 20-30 70-80 0 0
D 0 45-55 40-60 0
Figure 6.1 Example of the structure of a proportional network matrix
Note that whilst the purpose of this Chapter was to investigate the quantitative
changes in energy flow and trophic interactions caused by parasite infections, only
the free-living species were presented in the weighted webs. This was because the
contribution of the parasites to the diet of any consumer was always < 1 %.
Therefore, it was the impact of the parasite on the hosts that was modelled through
modelling the effects on host diet according to different prevalence levels, rather
than including the parasite itself in the weighted models. On their completion in MS
Excel, the matrices were then transferred into R using the package gdata (Warnes et
al. 2015).
148
6.3.3 Food web modelling using igraph
Following conversion of the matrices into R, they were then converted into food
webs (networks) using the network analysis package igraph (Csardi and Nepusz
2006), as described in Section 5.3. The model networks had the following two
simple rules:
The total diet of all consumers had to equal 100% of any other food source at
the start of the model. Unless this was met, then consumers were unable to
switch diets during predictions of environmental change.
If the proportion of an item being consumed by an organism or group
increased, then it was assumed the consumer eats proportionally more of that
item, and as a consequence, the biomass of that consumer will increase.
For example, a consumer with a diet comprising items x, y and z, and where n is the
starting proportion of diet at time t, then:
nt = nx + ny + nz = 100
If the biomass of x is doubled the diet of the consumer would be
nt = 2nx + ny + nz > 100
and the biomass (b) of that consumer would increase proportionally and where
overall biomass per trophic level is determined as diminishing to 10 % of the
previous trophic level at each trophic level (Pauly and Christensen 1995).
When ‘top-down’ changes occur, if the proportion of an item consumed increases
then it is assumed that that item must exist in that proportion, and thus its prey must
increase proportionally also, i.e. there is a cascading effect in the model. For
149
comparison, the web can then be recalculated with fixed starting quantities, using the
new proportions.
6.3.4 Metrics measured
This study measured two primary metrics:
1. The relative proportions that producers and primary consumers contributed to
the diets of the focal higher consumers (i.e. fish).
2. The biomass of fish species that a model of fixed biomass but differing
weighting and topology (i.e. different proportions of producers or differing
diets of consumers) would be predicted to support.
These are measured as proportional changes on a scale of 0 to 1 from an original
web, i.e. one that contains no fish infected with the focal parasite (E. briani or B.
acheilognathi) and with a community of primary producers at their proportions
originally measured at the study sites (Chapters 2 and 3).
6.3.5 Predictive modelling of scenarios
The development of the initial food web was based on the dietary proportions of the
host fish population according to the stable isotope analysis, i.e. they reflected the
differences measured between the infected and uninfected individuals. Thus, the
modelled diet of the infected fish was initially as per their observed parasite
prevalence, with the relative proportions of the remainder of the food web calculated
accordingly. This final model was then used as the basis for predicting the
consequences of scenarios on the food web structure according to the following
scenarios (S):
150
S1. Shifts in parasite prevalence of the host populations (using 0, 25, 50, 75, 100 %).
S2. Shifts in the proportion of primary producers, with increasing proportions of
phytoplankton to macrophyte, simulating the outcomes of increasing anthropogenic
eutrophication.
S3. The interaction of (1) and (2) above.
For S1 at Site 1 where two fishes (R. rutilus and A. brama) were present that were
host to E. briani, the infection level was kept the same for both species in the model,
as this generally reflected the observed similarity in their infection levels (Table 2.1)
and is consistent with the preferred size of fish that the parasite infects, which does
not differ significantly between these two host species (Alston and Lewis 1994).
For S2, the scenario of anthropogenic eutrophication centred on the resultant shift
that tends to occur in eutrophic freshwaters, i.e. from macrophyte to phytoplankton
domination (Hough et al. 1989). The infected and uninfected food webs were
adjusted by decreasing the proportion of macrophyte in the foodweb, to 75%, 50%,
25% and 0% of the starting macrophyte biomass and increasing the phytoplankton
by the same amount so the total biomass remained constant.
For S3, the scenarios combined all those completed in S1 with those completed in
S2. All tested scenarios are summarised in Table 6.1 and 6.2.
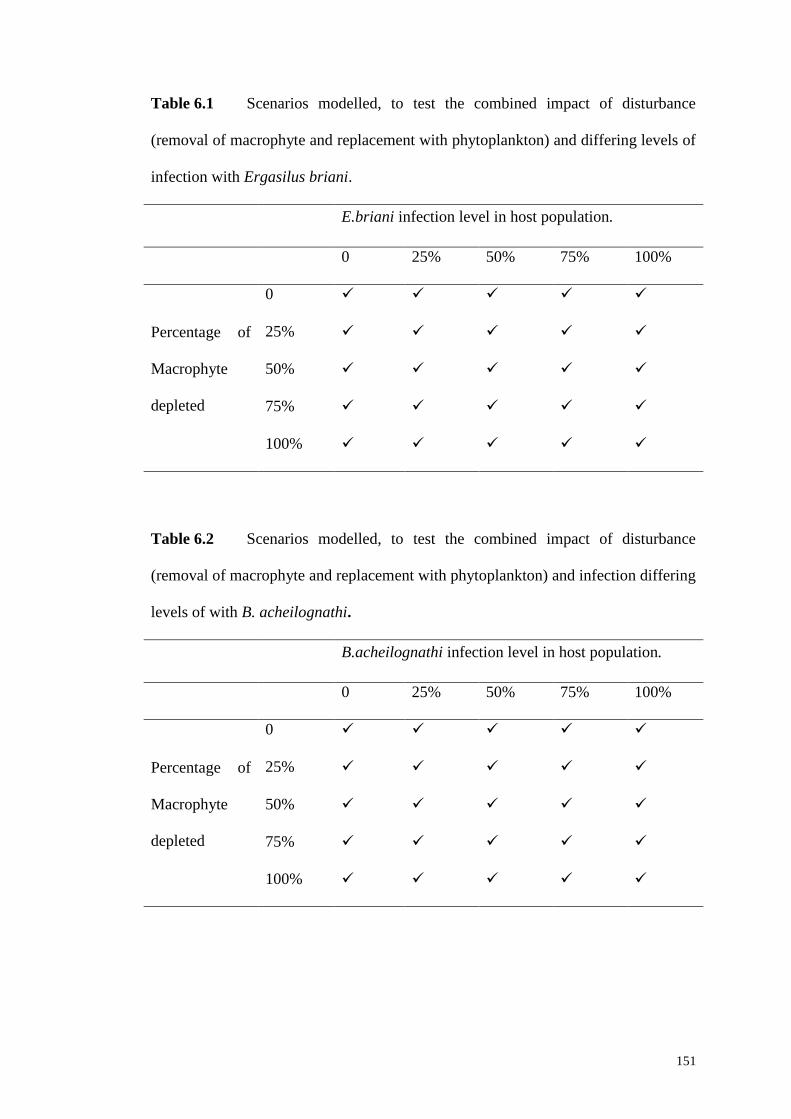
151
Table 6.1 Scenarios modelled, to test the combined impact of disturbance
(removal of macrophyte and replacement with phytoplankton) and differing levels of
infection with Ergasilus briani.
E.briani infection level in host population.
0 25% 50% 75% 100%
Percentage of
Macrophyte
depleted
0
25%
50%
75%
100%
Table 6.2 Scenarios modelled, to test the combined impact of disturbance
(removal of macrophyte and replacement with phytoplankton) and infection differing
levels of with B. acheilognathi.
B.acheilognathi infection level in host population.
0 25% 50% 75% 100%
Percentage of
Macrophyte
depleted
0
25%
50%
75%
100%
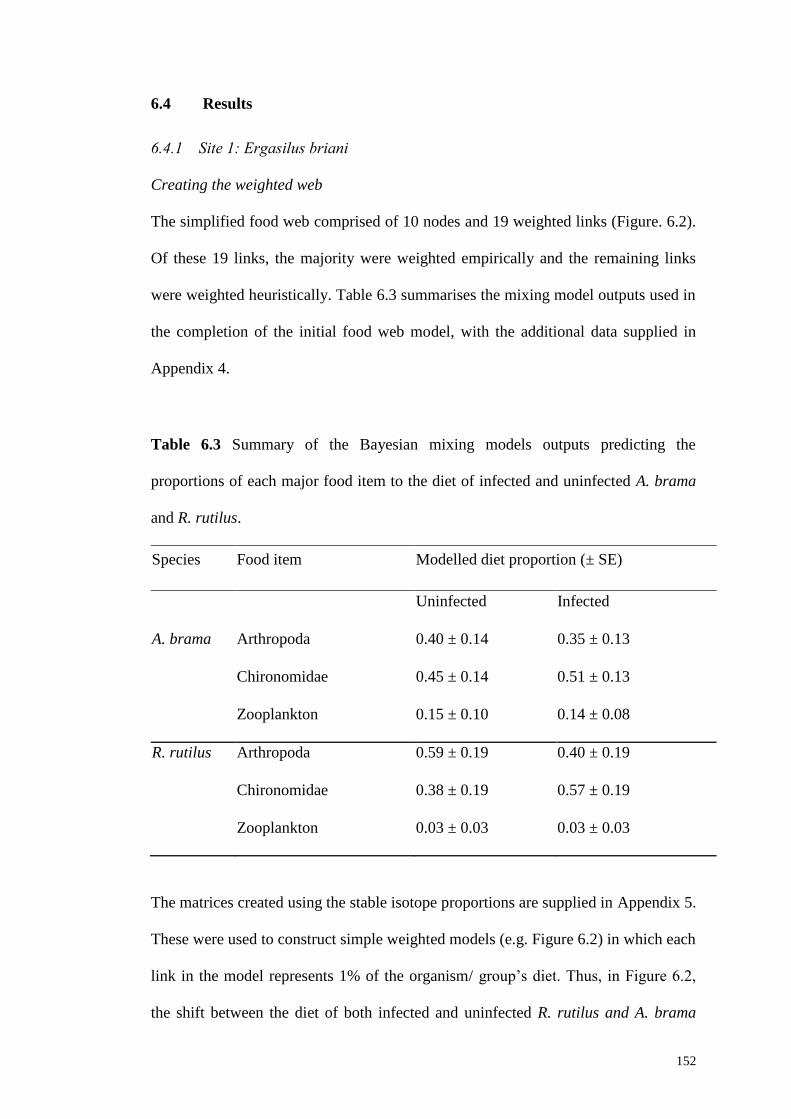
152
6.4 Results
6.4.1 Site 1: Ergasilus briani
Creating the weighted web
The simplified food web comprised of 10 nodes and 19 weighted links (Figure. 6.2).
Of these 19 links, the majority were weighted empirically and the remaining links
were weighted heuristically. Table 6.3 summarises the mixing model outputs used in
the completion of the initial food web model, with the additional data supplied in
Appendix 4.
Table 6.3 Summary of the Bayesian mixing models outputs predicting the
proportions of each major food item to the diet of infected and uninfected A. brama
and R. rutilus.
Species Food item Modelled diet proportion (± SE)
Uninfected Infected
A. brama Arthropoda 0.40 ± 0.14 0.35 ± 0.13
Chironomidae 0.45 ± 0.14 0.51 ± 0.13
Zooplankton 0.15 ± 0.10 0.14 ± 0.08
R. rutilus Arthropoda 0.59 ± 0.19 0.40 ± 0.19
Chironomidae 0.38 ± 0.19 0.57 ± 0.19
Zooplankton 0.03 ± 0.03 0.03 ± 0.03
The matrices created using the stable isotope proportions are supplied in Appendix 5.
These were used to construct simple weighted models (e.g. Figure 6.2) in which each
link in the model represents 1% of the organism/ group’s diet. Thus, in Figure 6.2,
the shift between the diet of both infected and uninfected R. rutilus and A. brama
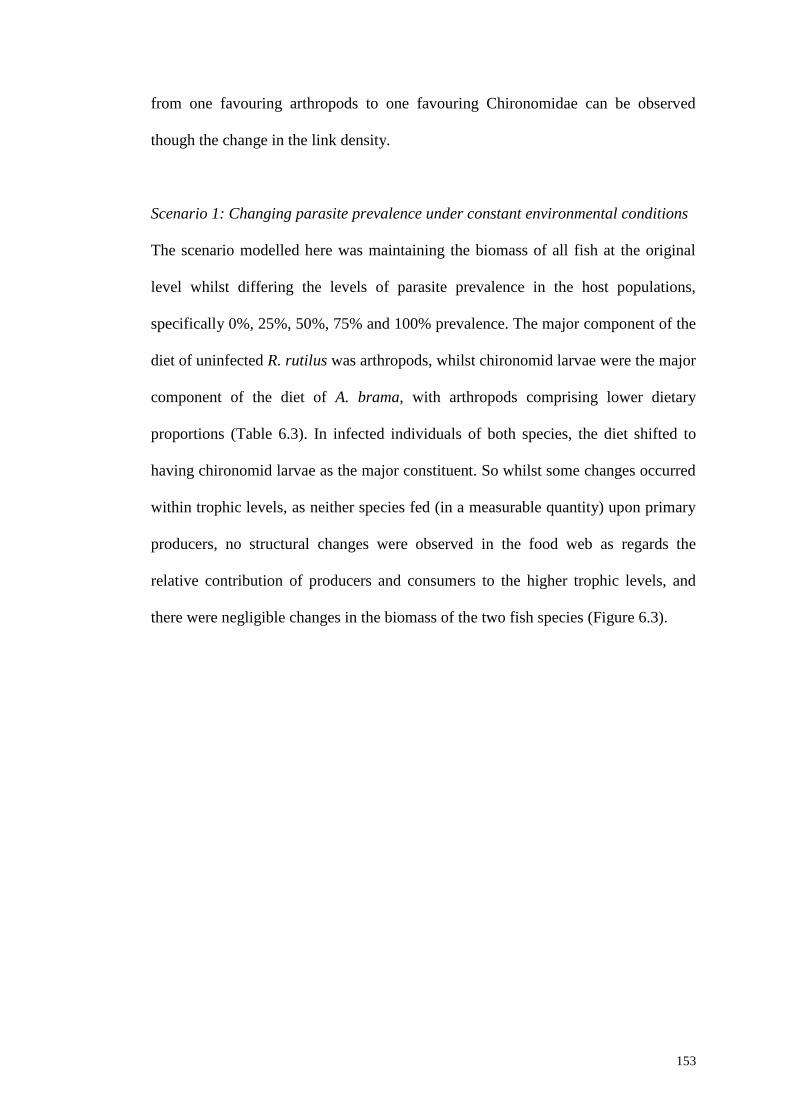
153
from one favouring arthropods to one favouring Chironomidae can be observed
though the change in the link density.
Scenario 1: Changing parasite prevalence under constant environmental conditions
The scenario modelled here was maintaining the biomass of all fish at the original
level whilst differing the levels of parasite prevalence in the host populations,
specifically 0%, 25%, 50%, 75% and 100% prevalence. The major component of the
diet of uninfected R. rutilus was arthropods, whilst chironomid larvae were the major
component of the diet of A. brama, with arthropods comprising lower dietary
proportions (Table 6.3). In infected individuals of both species, the diet shifted to
having chironomid larvae as the major constituent. So whilst some changes occurred
within trophic levels, as neither species fed (in a measurable quantity) upon primary
producers, no structural changes were observed in the food web as regards the
relative contribution of producers and consumers to the higher trophic levels, and
there were negligible changes in the biomass of the two fish species (Figure 6.3).
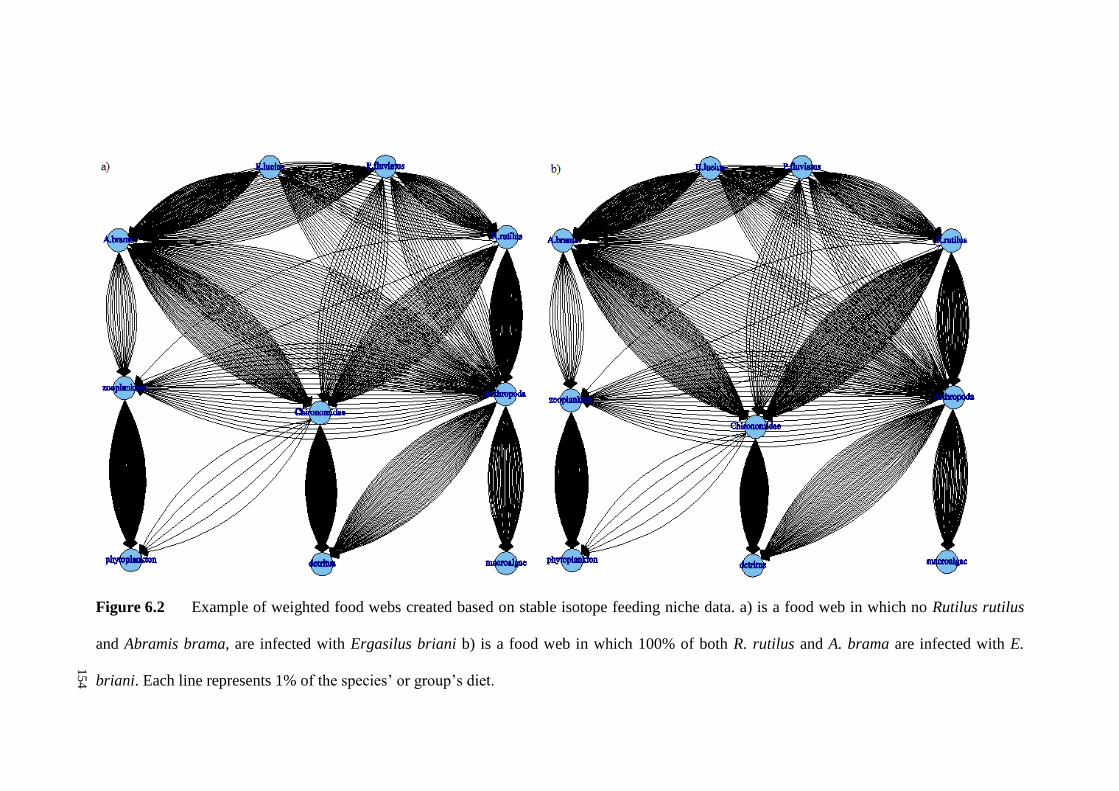
154
Figure 6.2 Example of weighted food webs created based on stable isotope feeding niche data. a) is a food web in which no Rutilus rutilus
and Abramis brama, are infected with Ergasilus briani b) is a food web in which 100% of both R. rutilus and A. brama are infected with E.
briani. Each line represents 1% of the species’ or group’s diet.
15
4
155
Figure 6.3 Changes in the proportion of the total biomass of the food web
contributed by the first (producers) (dark grey bars) and second (primary consumers)
(pale grey bars) trophic levels. Error bars represent 95% confidence intervals.
Scenario 2 environmental change with fixed numbers of parasites.
The scenario modelled here was a shift from the original system where macrophytes
contributed 14% of the primary production, to one dominated by phytoplankton.
This was achieved by deleting 25%, 50%, 75% and 100% of the macrophyte
biomass from the original model web (i.e. the modelled system comprised 14%,
10.5%, 7%, 3.5% and 0% of the biomass provided by macrophyte, with this lost
biomass replaced by phytoplankton biomass, ensuring the total biomass of the
system remained constant).
-0.01
-0.005
0
0.005
0.01
0% 25% 50% 75% 100%
Pro
port
ion
of
tota
l b
iom
ass
Percentage of infected R.rutilus and A.brama
156
Two initial food webs were developed, one in which no fish were infected with E.
briani (i.e. 0% parasite prevalence) and a second with both A. brama and R. rutilus
infected at the levels recorded in the field, 67% and 63% respectively (Section 2.4).
The biomass of uninfected and infected fish of both species decreased with
decreasing proportions of macrophytes (Figure 6.4 and, b), with a proportionally
greater decline in R. rutilus biomass than A. brama biomass, and the reduction in
both species being less in the infected populations than in the uninfected populations
(Figure 6.4). This biomass reduction occurred due to a bottom-up change in the
proportion of arthropods available to the fish, as their availability reduced as the
macrophytes proportion reduced. As the uninfected fish consumed proportionally
more arthropoda than the infected fishes, then their biomass was more impacted by
the arthropod reduction. The infected fish fed more on chironomid larvae that fed
upon detritus, and thus was less impacted by changes in macrophyte proportions.
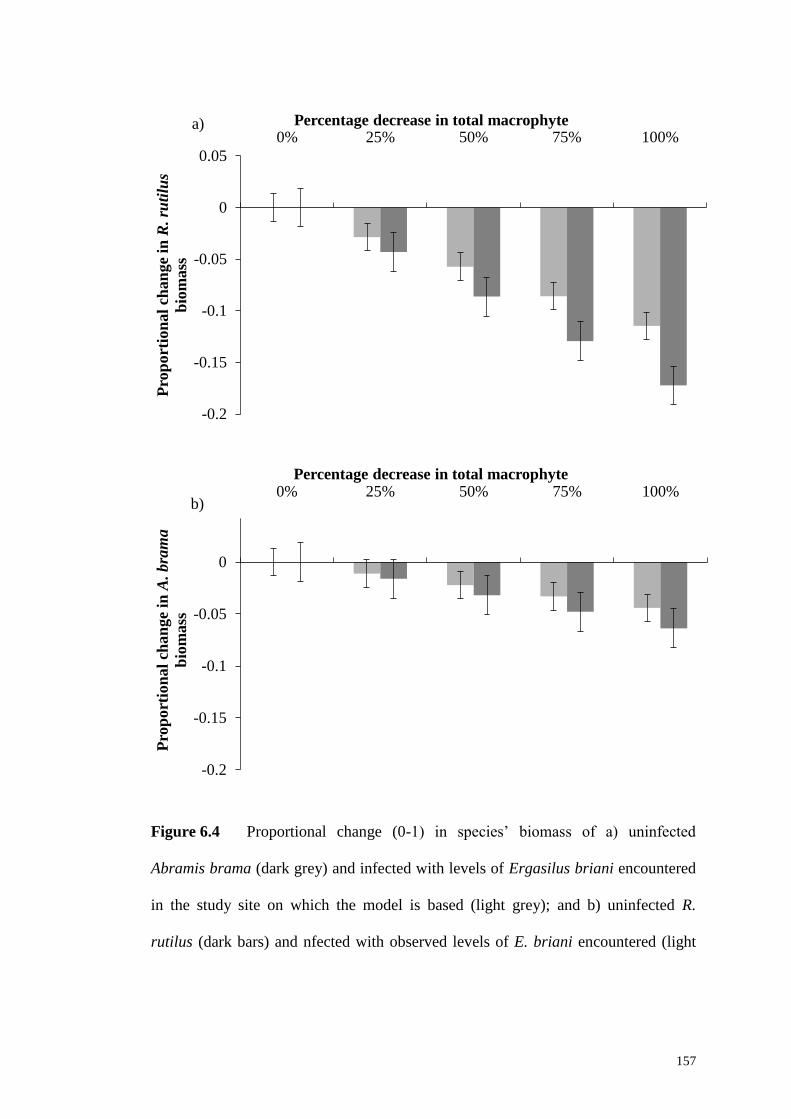
157
Figure 6.4 Proportional change (0-1) in species’ biomass of a) uninfected
Abramis brama (dark grey) and infected with levels of Ergasilus briani encountered
in the study site on which the model is based (light grey); and b) uninfected R.
rutilus (dark bars) and nfected with observed levels of E. briani encountered (light
-0.2
-0.15
-0.1
-0.05
0
0.05
0% 25% 50% 75% 100%
Pro
port
ion
al
chan
ge
in R
. ru
tilu
s
bio
mass
Percentage decrease in total macrophyte
-0.2
-0.15
-0.1
-0.05
0
0.05
0% 25% 50% 75% 100%
Pro
port
ion
al
chan
ge
in A
. bra
ma
bio
mass
Percentage decrease in total macrophyte
a)
b)
158
grey) with changing macrophyte proportions. Error bars are 95% confidence
intervals.
Scenario 3 - effects of changing environmental conditions versus changing parasite
prevalence.
The scenario modelled here was a combination of Scenario 1 and Scenario 2, with
reductions in macrophyte allied with changes in parasite prevalence, resulting in 25
modelled permutations (Table 6.2).
The predictions resulting from the scenario testing are similar to the pattern observed
in the outputs of Scenario 2 (Figure 6.5). The eventual elimination of the macrophyte
biomass results in declines in the A. brama and R. rutilus populations, but for both
species the decline in biomass was less in parasitised fish, due to their greater
reliance on chironomid larvae that were less affected by the changes in the primary
producers.

159
Figure 6.5 Proportional changes (0 to 1) of species’ biomass, for Abramis brama
and Rutilus rutilus populations with differing parasite prevalences and increasing
proportions of macrophytes removed from the model. Error bars represent 95%
confidence intervals.
-0.2
-0.15
-0.1
-0.05
0
0% 25% 50% 75% 100%P
rop
ort
ion
al
chan
ge
in s
pec
ies
bio
ma
ss
Percentage of Macrophyte depleted
A.brama
100% infected
75% infected
uninfected
25% infected
50% infected
R.rutilus
100%
infected
R.rutilus
75% infected
R.rutilus
50% infected
R.rutilus
25% infected
R.rutilus
uninfected
160
6.4.2 Site 2: Bothriocephalus acheilognathi
Creating the weighted web
The simplified food web comprised of 8 nodes and 13 weighted links (Figure 6.6), of
which the majority of links were weighted empirically, using the outputs of the
stable isotope mixing models (Chapter 3). The remaining links were developed
heuristically from published data. Table 6.4 summarises the mixing model outputs
used in the completion of this web, with additional data supplied in Appendix 4.
Table 6.4 Summary of the Bayesian mixing models outputs predicting the
proportions of each major food item to the diet of Scardinius erythrophthalmus, and
infected and uninfected Cyprinus carpio.
Species Food item
Modelled diet proportion (±
SE)
S. erythrophthalmus Arthropoda 0.46 ± 0.04
Plankton < 250μm 0.24 ± 0.04
Plankton > 250μm 0.11 ± 0.03
Macrophyte 0.19 ± 0.02
C. carpio
Uninfected Infected
Arthropoda 0.50 ± 0.04 0.26 ± 0.04
Plankton <250μm 0.21 ± 0.03 0.41 ± 0.06
Plankton > 250μm 0.29 ± 0.04 0.33 ± 0.06
The matrices created using the stable isotope proportions are supplied in Appendix 5.
These were used to construct simple weighted models (e.g. Figure 6.6) in which each
link in the model represents 1% of the organism/ group’s diet. Thus, in Figure 6.6,
161
the shift between the diet of an infected and uninfected C. carpio from one favouring
arthropods, to one favouring phytoplankton, can be observed via the change in link
density.
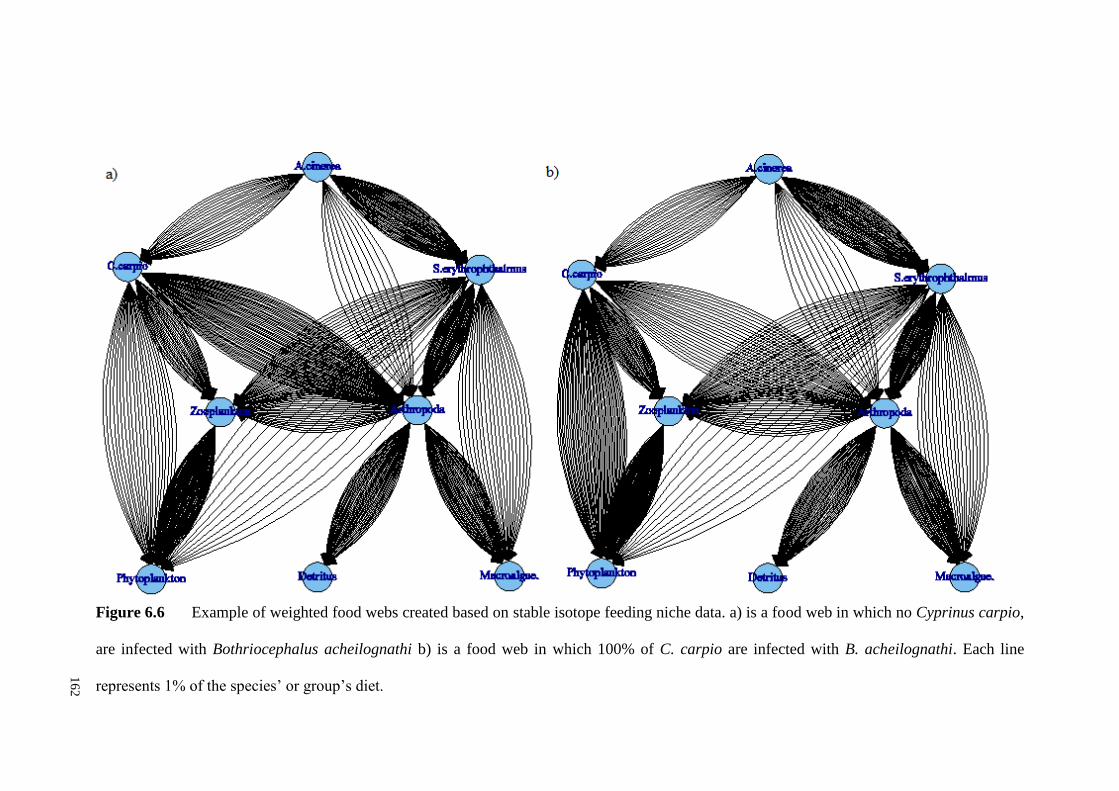
162
Figure 6.6 Example of weighted food webs created based on stable isotope feeding niche data. a) is a food web in which no Cyprinus carpio,
are infected with Bothriocephalus acheilognathi b) is a food web in which 100% of C. carpio are infected with B. acheilognathi. Each line
represents 1% of the species’ or group’s diet.
16
2
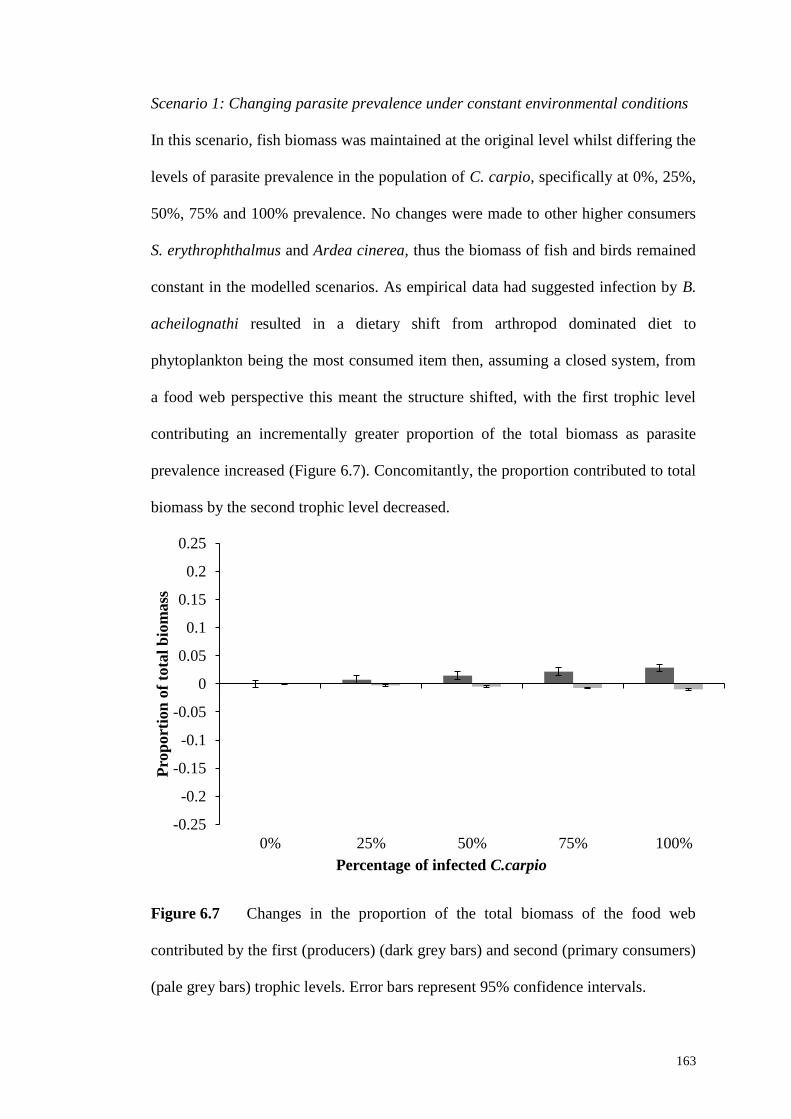
163
Scenario 1: Changing parasite prevalence under constant environmental conditions
In this scenario, fish biomass was maintained at the original level whilst differing the
levels of parasite prevalence in the population of C. carpio, specifically at 0%, 25%,
50%, 75% and 100% prevalence. No changes were made to other higher consumers
S. erythrophthalmus and Ardea cinerea, thus the biomass of fish and birds remained
constant in the modelled scenarios. As empirical data had suggested infection by B.
acheilognathi resulted in a dietary shift from arthropod dominated diet to
phytoplankton being the most consumed item then, assuming a closed system, from
a food web perspective this meant the structure shifted, with the first trophic level
contributing an incrementally greater proportion of the total biomass as parasite
prevalence increased (Figure 6.7). Concomitantly, the proportion contributed to total
biomass by the second trophic level decreased.
Figure 6.7 Changes in the proportion of the total biomass of the food web
contributed by the first (producers) (dark grey bars) and second (primary consumers)
(pale grey bars) trophic levels. Error bars represent 95% confidence intervals.
-0.25
-0.2
-0.15
-0.1
-0.05
0
0.05
0.1
0.15
0.2
0.25
0% 25% 50% 75% 100%
Pro
port
ion
of
tota
l b
iom
ass
Percentage of infected C.carpio
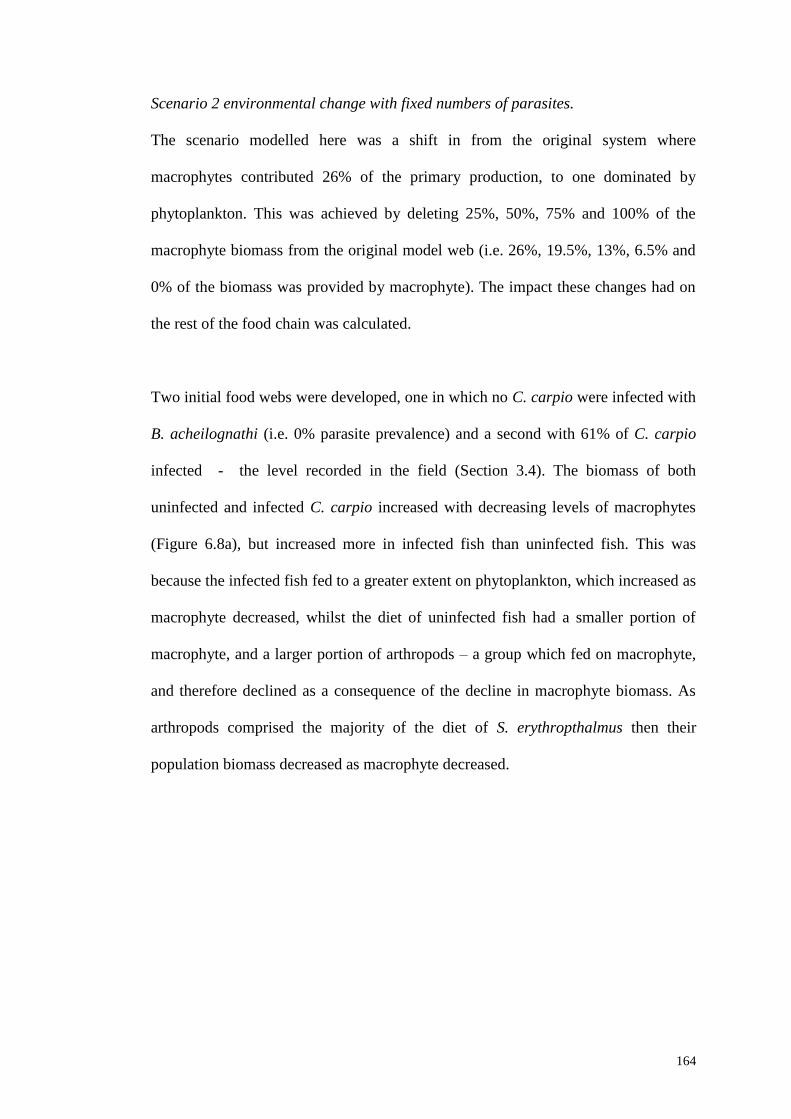
164
Scenario 2 environmental change with fixed numbers of parasites.
The scenario modelled here was a shift in from the original system where
macrophytes contributed 26% of the primary production, to one dominated by
phytoplankton. This was achieved by deleting 25%, 50%, 75% and 100% of the
macrophyte biomass from the original model web (i.e. 26%, 19.5%, 13%, 6.5% and
0% of the biomass was provided by macrophyte). The impact these changes had on
the rest of the food chain was calculated.
Two initial food webs were developed, one in which no C. carpio were infected with
B. acheilognathi (i.e. 0% parasite prevalence) and a second with 61% of C. carpio
infected - the level recorded in the field (Section 3.4). The biomass of both
uninfected and infected C. carpio increased with decreasing levels of macrophytes
(Figure 6.8a), but increased more in infected fish than uninfected fish. This was
because the infected fish fed to a greater extent on phytoplankton, which increased as
macrophyte decreased, whilst the diet of uninfected fish had a smaller portion of
macrophyte, and a larger portion of arthropods – a group which fed on macrophyte,
and therefore declined as a consequence of the decline in macrophyte biomass. As
arthropods comprised the majority of the diet of S. erythropthalmus then their
population biomass decreased as macrophyte decreased.
165
Figure 6.8 Proportional changes in a) uninfected Cyprinus carpio population
biomass (dark grey bars) and C. carpio population biomass where with 61% of fish
were infected with Bothriocephalus acheilognathi (light grey bars), and b) S.
erythropthalmus (clear bars), with increasing percentage of macrophyte removed
from the model. Equal biomass of phytoplankton was added so total biomass of
producers remained constant. Error bars represent 95% confidence intervals.
-0.25
-0.2
-0.15
-0.1
-0.05
0
0.05
0.1
0.15
0.2
0.25
0% 25% 50% 75% 100%
Pro
port
ion
al
chan
ge
in C
. ca
rpio
bio
mass
Percentage of macrophyte removed
a)
-0.25
-0.2
-0.15
-0.1
-0.05
0
0.05
0.1
0.15
0.2
0.25
0% 25% 50% 75% 100%
Pro
port
ion
al
chan
ge
in S
.
eryt
hro
ph
thalm
us
bio
mass
Percentage of macrophyte removed
b)
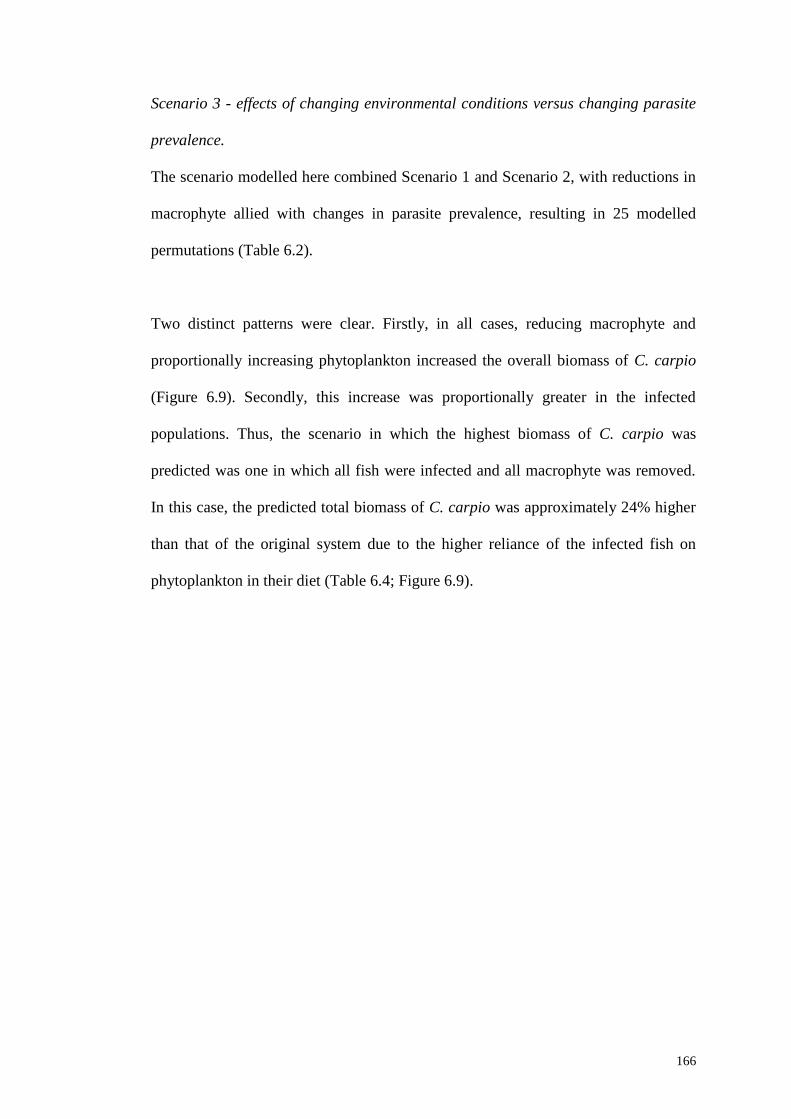
166
Scenario 3 - effects of changing environmental conditions versus changing parasite
prevalence.
The scenario modelled here combined Scenario 1 and Scenario 2, with reductions in
macrophyte allied with changes in parasite prevalence, resulting in 25 modelled
permutations (Table 6.2).
Two distinct patterns were clear. Firstly, in all cases, reducing macrophyte and
proportionally increasing phytoplankton increased the overall biomass of C. carpio
(Figure 6.9). Secondly, this increase was proportionally greater in the infected
populations. Thus, the scenario in which the highest biomass of C. carpio was
predicted was one in which all fish were infected and all macrophyte was removed.
In this case, the predicted total biomass of C. carpio was approximately 24% higher
than that of the original system due to the higher reliance of the infected fish on
phytoplankton in their diet (Table 6.4; Figure 6.9).
167
Figure 6.9 Proportional changes of species biomass, for Cyprinus carpio
populations with differing infection levels and Scardinius erythrophthalmus, with
increasing percentage of macrophyte removed from the model. Error bars represent
95% confidence intervals.
-0.3
-0.2
-0.1
0
0.1
0.2
0.3
0% 25% 50% 75% 100%
Pro
port
ion
al
chan
ge
in s
pec
ies
bio
mass
Percentage of macrophyte removed
100%
infected
uninfected
25% infected
50%
infected
75% infected
S. erythrophthalmus
C.carpio
168
6.5 Discussion
Chapter 5 revealed that whilst the addition of native parasites to food webs greatly
altered the food web topology, the addition of non-native parasites had a relatively
minor effect, including when the non-native parasite was trophically transmitted.
This, however, did not consider the effect of the non-native parasites on the trophic
ecology of the host. Through incorporation of the information on how infection
altered the trophic niche of the infected fishes, it was demonstrated here that the
infections with non-native parasites can have more substantial consequences for the
food web than demonstrated topologically. Building weighted food webs that utilised
data on the parasite-mediated modified trophic niches of the host fishes
demonstrated that parasites can have a substantial influence on how the fish
population and community responds to environmental changes. Thus, the weighted
models suggest that the host population and food web consequences of infection, that
already include contributing biomass (Johnson et al. 2010), mediating competitive
interactions (Hatcher et al. 2006) and moderating host populations (Dobson and
Hudson 1995), also includes altering how hosts could respond to environmental
changes.
Altering the parasite prevalence in the host populations had relatively minor
consequences for their population biomass, with the consequences of environmental
changes through eutrophication (modelled as decreased proportions of macrophytes)
being more pronounced on both the uninfected and infected individuals. Indeed,
alterations in water quality can have pronounced implications for parasite ecology
(Lafferty and Kuris 1999), often resulting in improved conditions for parasites
should their host density increase, with generalist fish species such as R. rutilus
169
usually being favoured by eutrophic conditions (Beardsley and Britton 2012; Elliott
et al. 2015). Eutrophic conditions also influence parasite prevalence through the
associated increased productivity that increase the abundance of intermediate hosts.
For example, Beer and German (1993) outlined that eutrophication improved
conditions for snails (intermediate host) that, when combined with escapee farmed
ducks (final host), accelerated the life cycle of the digenean Trichobilharzia ocellata.
Valtonen et al. (1997) also discussed how increasing eutrophication in lakes over
time was associated with greater overall parasite species richness in two fish species,
including R. rutilus. Consequently, the scenario of increased parasite prevalence and
anthropogenic eutrophication is realistic in the context of the host populations used
and thus the model outputs should have relatively wide application to freshwaters
and their fish communities.
The interaction of environmental change with increased parasite prevalence for C.
carpio infected with B. acheilognathi resulted in significantly increased biomass in
infected individuals. Although counter-intuitive, the energetic effects of B.
acheilognathi can be relatively minor to host fishes, particularly once they attain
lengths at which they only act as reservoirs of infection (e.g. >100 mm (Britton et al.
2012), with mortality incurred by the parasite being primarily in fishes < 50 mm
(Britton et al. 2011). Moreover, whilst reduced condition in infected individuals was
observed over time in this research, this only developed over a 12 month time frame.
For E. briani, although all scenarios of eutrophication resulted in reduced biomass of
the fish populations, this was reduced in the infected individuals. Again, whilst this
parasite can cause mortality in hosts, this can be size-selective, with smaller hosts
being more susceptible (Dezfuli et al. 2003; Linder et al. 2012), and thereafter, the
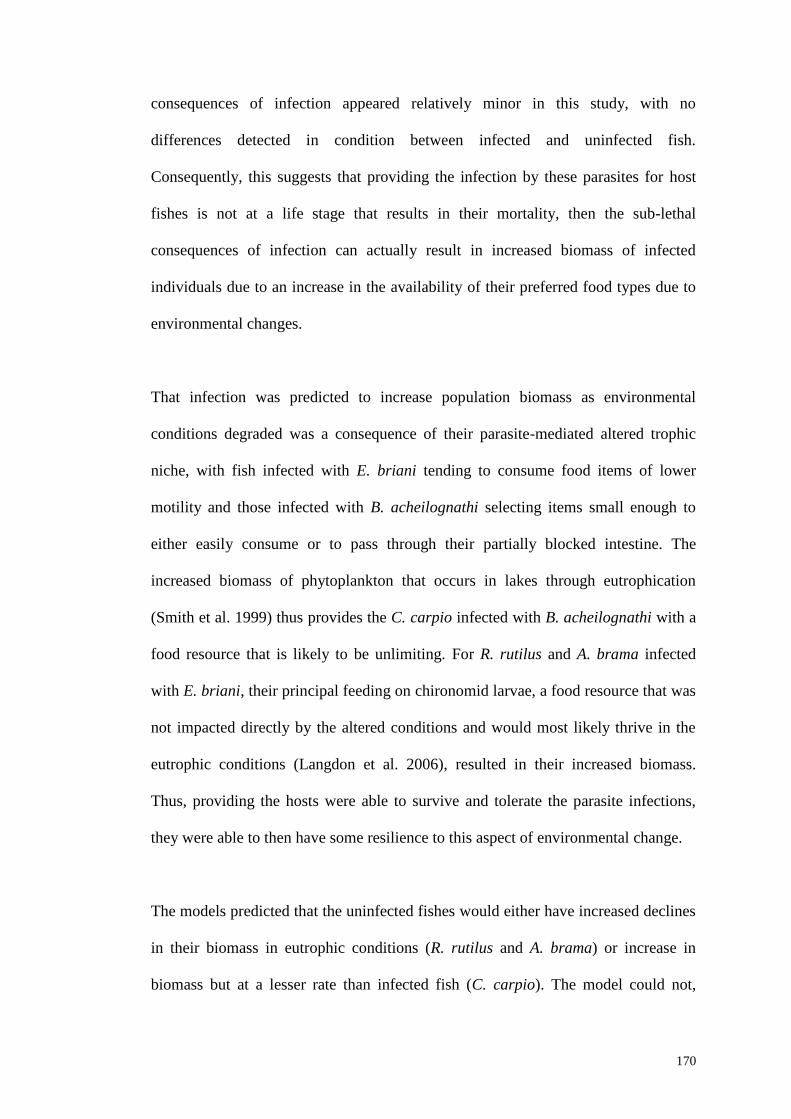
170
consequences of infection appeared relatively minor in this study, with no
differences detected in condition between infected and uninfected fish.
Consequently, this suggests that providing the infection by these parasites for host
fishes is not at a life stage that results in their mortality, then the sub-lethal
consequences of infection can actually result in increased biomass of infected
individuals due to an increase in the availability of their preferred food types due to
environmental changes.
That infection was predicted to increase population biomass as environmental
conditions degraded was a consequence of their parasite-mediated altered trophic
niche, with fish infected with E. briani tending to consume food items of lower
motility and those infected with B. acheilognathi selecting items small enough to
either easily consume or to pass through their partially blocked intestine. The
increased biomass of phytoplankton that occurs in lakes through eutrophication
(Smith et al. 1999) thus provides the C. carpio infected with B. acheilognathi with a
food resource that is likely to be unlimiting. For R. rutilus and A. brama infected
with E. briani, their principal feeding on chironomid larvae, a food resource that was
not impacted directly by the altered conditions and would most likely thrive in the
eutrophic conditions (Langdon et al. 2006), resulted in their increased biomass.
Thus, providing the hosts were able to survive and tolerate the parasite infections,
they were able to then have some resilience to this aspect of environmental change.
The models predicted that the uninfected fishes would either have increased declines
in their biomass in eutrophic conditions (R. rutilus and A. brama) or increase in
biomass but at a lesser rate than infected fish (C. carpio). The model could not,
171
however, incorporate diet switching in the uninfected fishes and so could not reflect
any changes in their diet that would most likely occur as their food resources
changed. Indeed, eutrophication is frequently associated with alterations in fish diet,
such as through changes in prey size structure (Hayward and Margraf 1987) and prey
species (Winfield et al. 2012). Consequently, it is likely that considerable alterations
in the diet composition of the uninfected fish would occur with the onset of
eutrophic conditions and it is likely that this would ensure that their responses to the
altered conditions were as equal, if not higher, than for the infected fishes. Thus,
whilst it can be argued that the predictions for the infected fishes were robust and
ensured their survival in the face of the changes, some caution is needed when
comparing their output to the uninfected fishes, especially given the plasticity in diet
observed in generalist cyprinid species such as R. rutilus and C. carpio (Kahl and
Radke 2006; Britton et al. 2007; Estlander et al. 2010). Nevertheless, these outcomes
reveal the high utility in developing weighted models to predict the outcomes of
changes in parasite prevalence and environmental change on fish populations and
communities that are affected by introduced parasites, and indicate that their
outcomes can be counter-intuitive, with the altered trophic niches of hosts caused by
infection providing some subsequent benefits that ensure they are able to take
advantage of the new conditions.
172
7. Discussion
7.1 Introduced parasites (Chapter 1)
Introductions of free-living species are often accompanied with the release of their
parasites (De Silva et al. 2006; Gozlan et al. 2006; Gozlan et al. 2010). In fisheries,
this often occurs most commonly via the movement of fish or eggs for aquaculture
purposes (De Silva et al. 2006; Peeler et al. 2011). Whilst many non-native parasites
are lost during the introduction process (Colautti et al. 2004), those that are released
into new environments have the potential to cause significant harm to their hosts
(Poulin et al. 2011). Whilst infections are known to cause mortality and high
morbidity in their hosts (Bovo et al. 1987; Gozlan et al. 2005; Johnson et al. 2010),
there has been less attention paid to their sub-lethal ecological consequences, despite
the important roles that native parasites are known to play as ecosystem engineers
and within food webs (Mouritsen and Poulin 2003; Dobson et al. 2006; Hatcher et al.
2006). Thus here, through use of three host-parasite models, with those three
parasites having differing lifecycles from simple direct transmission to complex
multi-host lifecycles, the ecological consequences of parasites introduced into the
UK was investigated through their effects on hosts (from individual to population
effects) and food web structure, the results are summarised in Table 7.1.
173
Table 7.1 Summary of impacts revealed in this study in infected hosts, and infected communities for the three focal parasites, related to the
thesis’s research objectives (Section 1.10).
Objective
Host/Parasite system
O1 O1 O2 O2 O3 O4
Pathology
Host growth and
condition
Trophic niche
width
Trophic
position
Topological web
impact
Weighted web
impact
E. briani in R.rutilus and
A. brama × × ×
B. acheilognathi in C. carpio * ×
A. crassus in A. anguilla × × -
* Significant difference observed only after extended period of infection
17
3
174
7.2 Individual host consequences of non-native fish parasites (Chapters 2, 3
and 4)
7.2.1 Pathology
Infections of all three parasites resulted in noticeable pathological effects on host
fishes. In Chapter 2, R. rutilus and A. brama infected with E. briani were examined
and the gross pathological changes included displacement of gill filaments,
hyperplasia and localised haemorrhaging within the filaments as a consequence of
parasite attachment, as well as localised loss and compression of gill epithelium
attributed to parasite feeding. These findings were consistent with pathological
changes associated with other Ergasilid parasites (Alston and Lewis 1994; Dezfuli et
al. 2003). In Chapter 3, the pathology of B. acheliognathi infection in juvenile C.
carpio was described. During dissections, the parasite was often visible as a large
solid mass in the intestine prior to its opening. Within the intestine, at the point of
attachment, the scolesces of the parasites pinched the intestinal folds, compressing
the epithelium and, in places, almost exposing the basement membrane. Heavy
infections caused near complete occlusion of the intestinal tract, thinning and
compressing the gut wall, and displacing internal organs, including the swim
bladder. These outcomes were consistent with reported impacts of B. acheliognathi
(Britton et al. 2011b). In Chapter 4, the pathology of A. crassus in A. anguilla, two
specific stages of infection were observed. The initial stage was where parasites were
present, often in large numbers and occupying the swimbladder. The second stage
was following the departure of the parasite when the swimbladder walls were left
scarred and opaque, as also noted from other studies (Lefebvre et al. 2002; Kirk
2003).
175
7.2.2 Host growth and condition
Infection by the non-native parasites appeared to have only minor consequences for
the growth (as differences in 0-group fish length) and condition of individual hosts in
two of the three focal host/parasite systems. For R. rutilus and A. brama infected
with E. briani (Chapter 2), and A. anguilla infected with A. crassus (Chapter 4),
there were no significant differences in body length and condition, and
hepatosomatic index (A. anguilla only), between the infected and uninfected
individuals. In Chapter 4, by monitoring a cohort of juvenile C.carpio infected with.
B. acheliognathi over a 12 month period, substantial and significant changes were,
however, detected that developed over time. Whilst there were no significant
differences in length of infected and uninfected fish on initial sampling, this altered
after 12 months, with lengths of infected individuals now being significantly smaller
than uninfected. Similarly, in initial samples, differences in condition (as Fulton’s
condition factor, K) between infected and uninfected fish were not significantly
different, but were by month 12. This highlights the potential requirement to measure
infection consequences over long-time periods, and suggests that the lack of
differentiation observed in the other parasite: host systems might have been related
to only taking samples on discrete occasions.
7.3 Trophic consequences of infection at the population level (Chapters 2
and 3)
Chapters 2 and 3 demonstrated how infection by non-native parasites could induce
significant but differing changes in the trophic niche of the infected component of a
host population. In Chapter 2, niche constriction was apparent in the infected
components of the R. rutilus and A. brama populations, with this being consistent
176
across the different sites studied. Chapter 3 revealed that the trophic niche of C.
carpio infected with B. acheilognathi differed significantly from that of uninfected
fish, with a distinct shift in resource utilisation that increased the trophic niche of the
overall population. Stable isotope mixing models predicted these changes occurred
through the diet of infected R. rutilus and A. brama becoming less diverse and more
focused on less motile food items, whilst for infected C. carpio, their diet shifted
from one with a high arthropod content to one more dependent on phytoplankton.
Optimum foraging theory predicts that animals will feed on the most valuable
resources, ignoring lower-value resources when search and handling time could be
better spent searching for more valuable resources (Bolnick et al. 2003). The factors
acting in this process are the resource traits and phenotypic capacity of individuals to
capture, handle and to digest those resources (Araujo et al. 2011). Thus, niche
variation between individuals is largely dependent on the diversity and abundance of
available resources versus the phenotypic traits of the individual (Crowden and
Broom 1980; Stephens and Krebs 1986). Here, it was suggested that the parasite
infection was acting as a trait that exerted a strong influence on their niche variation.
Moreover, the functional response of a consumer is the relationship between prey
density and prey consumption (Holling 1959), thus is a useful descriptor of predator
behaviour and their impacts on prey populations (Dick et al. 2010), with a previous
study on young-of-year C. carpio detecting a reduced functional response in
individuals infected with B. acheilognathi compared with uninfected individuals
(Britton et al. 2011b). Infected fish had higher handling times and longer searching
times for food, potentially providing some explanation for the patterns observed
here. The determinants of these remain uncertain, but potentially relate to the
177
parasite blocking the intestine and in doing so, reducing feeding motivation, and
food and energy intake (Scott and Grizzle 1979; Britton et al. 2011a).
Although the causal mechanisms behind the niche constriction measured in R. rutilus
and A. brama infected with E. briani can only be speculated as they were unable to
be tested here, other studies suggest that infections by other Ergasilid parasites that
result in similar gill damage have consequences of respiratory dysfunction,
osmoregulatory failure and haematological disruption (Hogans 1989; Abdelhalim et
al. 1991; Alston and Lewis 1994; Dezfuli et al. 2003). Thus, the reduced ability of
infected fishes to access the same resources as uninfected ones might relate to their
reduced foraging abilities caused by such issues. Irrespective of their underlying
mechanisms, in both cases it was apparent that infected fishes increased their
predation of prey items that were highly abundant and/ or relatively slow moving,
and thus presumably required relatively lower energy expenditure to capture and
handle during foraging.
7.4 Does trophic niche impact the probability of infection? (Chapter 4)
Phenotypic differences in behaviours are frequently reported between individual fish
uninfected and infected with specific parasites (Barber et al. 2000; Loot et al. 2001).
This, however, tends to be more in the context of parasite-induced changes to the
host post-infection (Blanchet et al. 2009). Chapter 4 demonstrated an alternate
scenario, whereby the host phenotype influenced their probability of infection.
Within populations of A. anguilla, variation in head morphology is common, with
individuals on a spectrum between broad-headed and narrow-headed (Lammens and
Visser 1989; Proman and Reynolds 2000; Tesch 2003). These differences in head
178
morphology have been related to individual specialisation, with broader-headed A.
anguilla individuals being more piscivorous (Cucherousset et al. 2011). The parasite
A. crassus has multiple paratenic hosts in its invasive range resulting in elevated
parasite exposure in piscivorous animals, including A. anguilla, the definitive
European host. Thus, the eels with broader head widths have increased probability of
infection by A. crassus, as they have greater exposure to the parasite through
consuming higher proportions of paratenic fish hosts. Indeed, the logistic regression
model revealed head morphology and diet were significant predictors of infection
status, with up to 78 % of eels correctly assigned to their infection status in models
(Section 4.4).
7.5 Infectious food webs (Chapters 5 and 6)
Chapter 5 and 6 illustrated the utility of food web structure to investigate the
consequences of additions of new parasites into aquatic communities (Dunne et al.
2002; Petchey et al. 2008; Amundsen et al. 2013). These chapters also illustrated
how data derived for food webs can be applied in different ways with consequent
contrasting outcomes, i.e. the topological versus weighting approaches. In Chapter 5,
topological changes were modelled going from food webs including all parasites
(including non-native) and free-living species, to ones where only free-living species
were modelled. Several factors were identified as critical to the scale of impact
caused by introduced parasites to web topology, including host specificity,
complexity of lifecycle and the extant diversity of the communities being invaded.
When A. crassus, a parasite with a complex lifecycle, was present in a relatively
diverse fish and native parasite community, their effect on topological metrics were
reduced compared to B. acheilognathi when their host population was within a
179
relatively simple fish community, despite a similarly complex lifecycle. Whilst the
connectance, nestedness and chain length of the food webs were all altered by the
addition of the non-native parasites, the magnitude of that change was, in all cases,
far less than the change caused by the addition of native parasites to a non-
parasitised food web.
In Chapter 6, the dietary data produced in Chapters 2 and 3 were incorporated into
simplified versions of the topological webs from Chapter 5 to create weighted webs,
and those weighted webs were then applied to test the outcomes of a series of
scenarios that tested outcomes of changes in parasite prevalence and nutrient
enrichment. In contrast to the food web topology, the weighted models revealed how
even a single introduced parasite with a simple direct lifecycle can have substantial
food web level effects. Where infection resulted in its host feeding at a lower trophic
level, the entire structure of the web shifted, with the biomass of the first trophic
level increasing proportionally to the second. Chapter 6 further demonstrated how
the conditions of eutrophic systems could be beneficial to infected hosts, which
tended to feed on abundant food items of lower nutritional status. Thus, providing
that the hosts were able to survive and tolerate infections, they then had some
resilience to this aspect of environmental disturbance. This interaction suggests that
the effects of global changes, such as anthropogenic eutrophication and introduced
species, could have counter-intuitive consequences for fish communities via their
interactions that result in additive or synergistic outcomes.
180
7.6 Management of non-native parasites
Freshwater fish in the UK are a valuable resource. Considering specifically the
species studied in this research, export figures from Britain for elvers and mature
A.anguilla are £3.5 and £2.75 million per annum, respectively (Peirson et al. 2001).
Meanwhile the value of recreational sport fishing, for species including C.carpio,
R.rutilus and A.brama in the UK is valued in the region of £1 billion (Hickley and
Chare 2004). In addition, inland fisheries have great value in terms of existence
value, rural economics and the social benefit of urban fisheries (Peirson et al. 2001).
Thus there is considerable need to protect stocks against potentially harmful novel
parasites. In practice this is balanced against the benefits of stock movement and
enhancement, and the practicalities of management and enforcement of any
restrictions (Hickley and Chare 2004). Whilst predicting the impact of a non-native
species is difficult (Manchester and Bullock 2000), the findings of this study add
new information to the body of evidence available for decision makers governing
UK fisheries management. Previous to this study, risk assessments for non-native
parasites considered the potential impact that parasite may have on its host (Williams
2007; Williams et al. 2013). However this study has demonstrated that even in
scenarios where infection may not appear to have marked consequences for the
growth or condition of a host, and thus the parasite appears benign, this can be a
superficial assessment, as there might be trophic consequences apparent that
subsequently manifest as wider consequences at the food web or even ecosystem
level. Thus, this research has highlighted that in considering the issues of non-native
parasites, looking beyond immediate host pathological and energetic consequences
and looking at wider ecological perspectives can provide contrasting evaluations of
impact.
181
These aspects are important to consider in a management context given that
controlling the distribution and spread of introduced parasites is inherently difficult
in wild situations (Hoole et al. 2001). Unlike in aquaculture systems, treatment via
medical interventions is not feasible (Ward 2007) and, irrespective, there would be a
high risk of potentially serious side effects on native invertebrate fauna
(Kolodziejska et al. 2013). Thus, in lentic situations at least, available options are
limited to either dewatering and removing all fish to eliminate all the parasite life
stages, or accepting a degree of parasitism and managing the infected stock
(Simberloff 2009; Davies and Britton 2015). In lotic situations, arguably only the
latter option is available in a disease context (Williams et al. 2013), although
introduced G. salaris has been managed successfully in Norwegian rivers using a
biocide approach (Johnsen and Jensen 1991; Cable et al. 2000). Under present
legislation, the movement of fish infected with the three parasites used in this
research to online waters in England and Wales is prohibited (Agency 2015). Any
such prohibition has financial implications for the fish movement industry (Williams
et al. 2013) and, therefore, ought not to be taken lightly. However, the results of this
study tend to support the continued control of E.briani, B.acheilognathi and
A.crassus. Furthermore, these results suggest that the consideration of wider, non-
lethal consequences of non-native parasites that move beyond individual pathology
and condition assessments should be incorporated into the decision-making and risk-
assessment processes.
For fishery managers, knowledge of parasite behaviour is already used in a disease
management context, when spread of trophically transmitted parasites is controlled
182
by elimination of intermediate hosts. For example, infections of diplostomatid eye-
flukes are controlled in aquaculture situations by controlling snail populations
(Chappell 1995) and prevention of contact between gulls and farmed fish can reduce
the spread of the digenean Cryptocotyle lingua (Kristoffersen 1991). The research
presented here provides evidence on how manipulation of the physical habitat and
food resources could be manipulated in a way as to limit parasite transmission. For
example, Chapter 6 highlighted how a eutrophic system suited the diet of infected
hosts, thus it could be construed that a relatively undisturbed system would be less
favourable, thus a simple measure of maintaining relatively high macrophyte
abundances with a diverse macroinvertebrate fauna could create an environment that
could potentially support a greater proportion of fish that remain uninfected by the
non-native parasites.
7.7 Potential short-comings of the research approach
In all cases in this research, the number of fish populations studied per non-native
parasite was limited and the sample sizes often relatively limited. This was the result
of logistical and financial constraints, low numbers of known fish populations
infected with some of the parasites, and problems in obtaining permissions to
remove large sample sizes of fishes of unknown infection status at the time of
collection, especially A. anguilla as these have recently been assessed in the IUCN
Red List as critically endangered (Jacoby and Gollock 2014). The three model
parasites were chosen as they were all introduced into the UK and have differing
complexities in their lifecycles (Section 1.9), yet the fact that they all occupied
different hosts and those hosts occupied different habitats could confound the ability
to make strong comparisons between them. Furthermore, in terms of data collection,
183
only the consequences of B. acheilognathi on their hosts were able to be measured
over an extended time period. Nevertheless, it can also be argued that this approach
still provided some extremely insightful outcomes that were then used as the basis
for modelling approaches that resulted in substantially increasing the extant
knowledge on these parasite-host systems and their consequences for freshwater
food webs.
In this study, stable isotope analysis was used as the method to determine dietary
differences in the fishes rather than more traditional dietary analytical tools, such as
stomach contents analysis. The benefits of using stable isotope analysis are through
its provision of a much longer temporal perspective on diet composition, with the
timescale dependent on the tissues analysed (e.g. 4 to 6 months for muscle and fin-
tissue; Jackson et al. 2012). It avoids the requirement for completing stomach
contents analysis on cyprinind fishes that are agastric, thus have relatively long
intestinal tracts that are often full of material whose contents are sufficiently
masticated by the action of the pharyngeal teeth to make their accurate identification
extremely difficult (Grey 2006). Had stomach contents analysis been used, then it
would also have meant much larger sample sizes would have required collecting
over much longer timeframes and at different times of day in order to ensure that
dietary comparisons between infected and uninfected fish reflect their actual
differences and are not biased due to sampling issues. Notwithstanding these issues,
it is acknowledged that the diet composition of the fishes were estimated from
mixing models rather than from direct observations, and mixing model performance
is dependent upon the quality of data and knowledge used to build them (Phillips et
al. 2014; Busst et al. 2015).
184
In addition, whilst infections by both B. acheilognathi and E. briani both resulted in
differences in trophic niche between infected and uninfected fish, the mechanism by
which these changes occurred were suggested but not tested further, and this remains
an outstanding research requirement.
7.8 Future directions
As with any study based on wild population sampling, increasing the spatial and
temporal replication of samples should ultimatly increase understandings of the
results and identify where these have inherent context dependency versus general
patterns that are ecologically relevant (Eberhardt and Thomas 1991; Kratzer and
Warren 2012; Hadfield et al. 2014). In a regulatory context, there are currently seven
‘Category 2’ non-native parasites (those considered harmful) and seven novel
parasite species (introduced and of un-assessed impact) in England (summarised in
Table 7.2), providing many options to expand the scope of the research in terms of
model parasite: host systems. These parasites include species that parasitise different
hosts, have different host specificity and different lifecycle complexities (Table 7.2).
Whether these factors lead to any overarching themes in terms of parasite impact is
unlikely, but from a risk management perspective attempting to establish if this is the
case could lead to better management of non-native parasites in the UK.
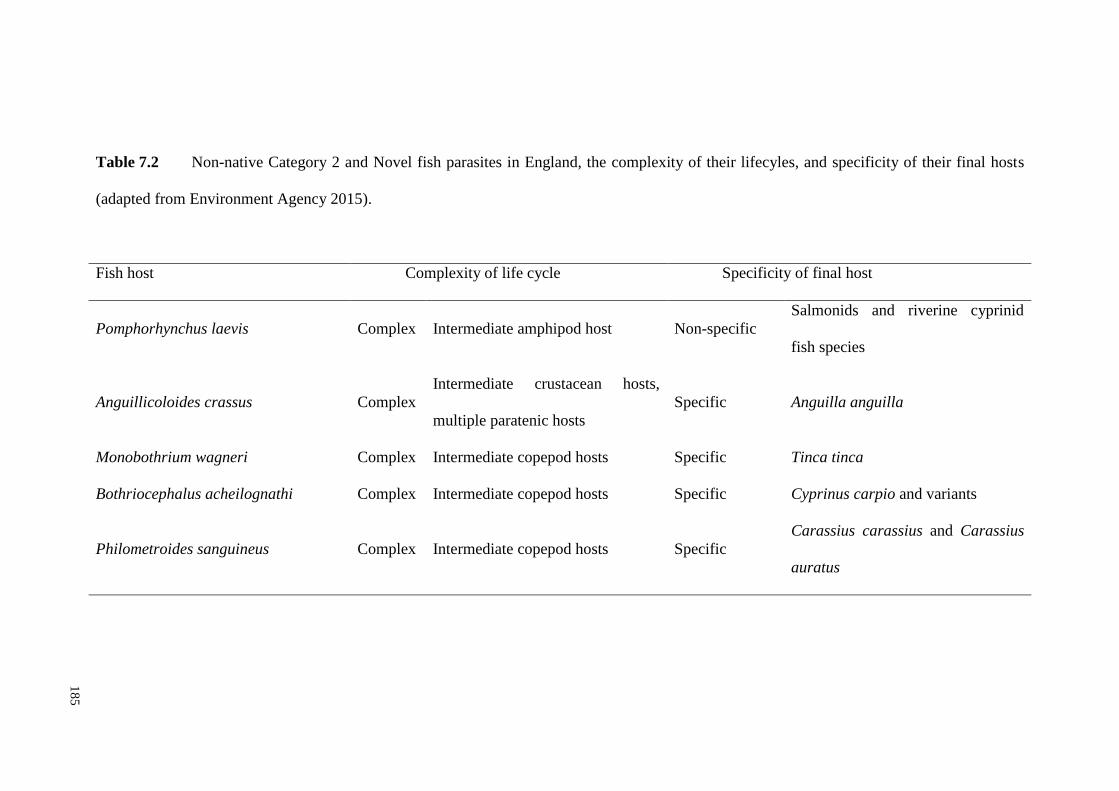
185
Table 7.2 Non-native Category 2 and Novel fish parasites in England, the complexity of their lifecyles, and specificity of their final hosts
(adapted from Environment Agency 2015).
Fish host Complexity of life cycle Specificity of final host
Pomphorhynchus laevis Complex Intermediate amphipod host Non-specific
Salmonids and riverine cyprinid
fish species
Anguillicoloides crassus Complex
Intermediate crustacean hosts,
multiple paratenic hosts
Specific Anguilla anguilla
Monobothrium wagneri Complex Intermediate copepod hosts Specific Tinca tinca
Bothriocephalus acheilognathi Complex Intermediate copepod hosts Specific Cyprinus carpio and variants
Philometroides sanguineus Complex Intermediate copepod hosts Specific
Carassius carassius and Carassius
auratus
18
5
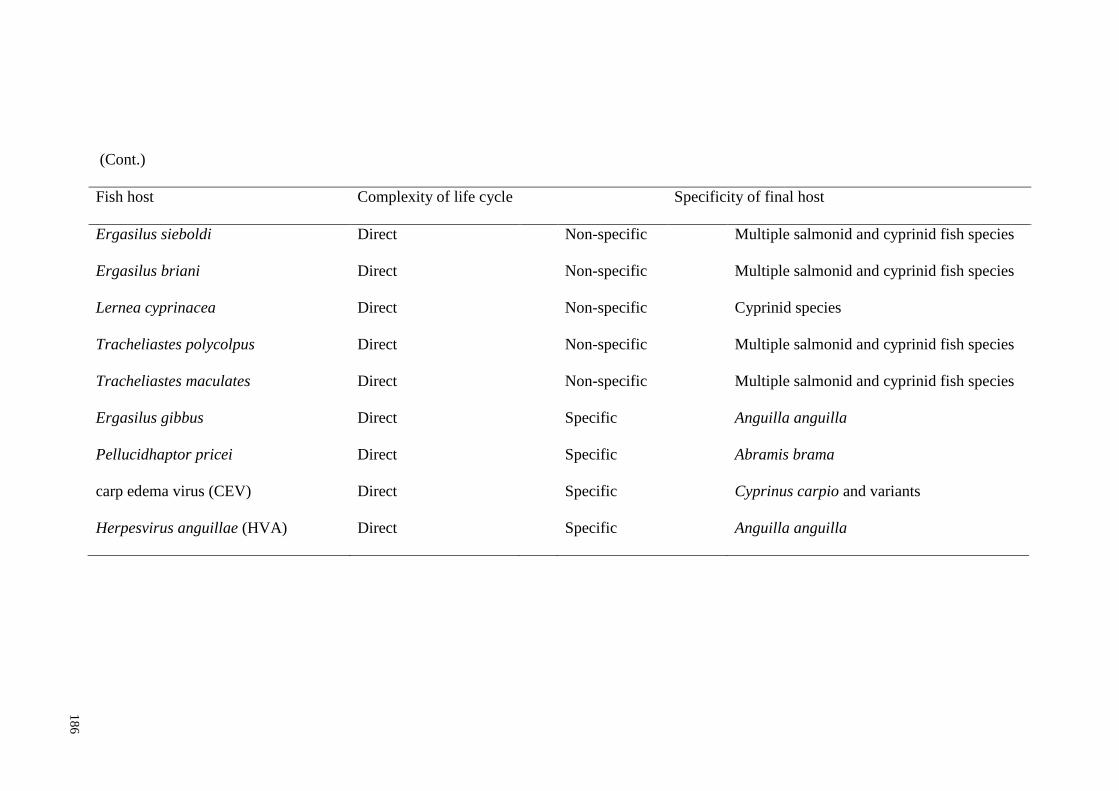
186
(Cont.)
Fish host Complexity of life cycle Specificity of final host
Ergasilus sieboldi Direct
Non-specific Multiple salmonid and cyprinid fish species
Ergasilus briani Direct
Non-specific Multiple salmonid and cyprinid fish species
Lernea cyprinacea Direct
Non-specific Cyprinid species
Tracheliastes polycolpus Direct
Non-specific Multiple salmonid and cyprinid fish species
Tracheliastes maculates Direct
Non-specific Multiple salmonid and cyprinid fish species
Ergasilus gibbus Direct
Specific Anguilla anguilla
Pellucidhaptor pricei Direct
Specific Abramis brama
carp edema virus (CEV) Direct
Specific Cyprinus carpio and variants
Herpesvirus anguillae (HVA) Direct Specific Anguilla anguilla
18
6
187
Additionally, a major finding of Chapter 3 was the importance of repeated
observation of parasite impact over an extended timescale, a feature which could be
incorporated into future studies but one that has distinct resource and logistical
implications.
The decision to base the dietary analyses on stable isotope analysis was deliberate
due to the reasons outlined in Section 7.8. When applied appropriately, it provides a
powerful ecological tool that has been applied to a wide range of ecological
questions, such as assessing the ecological impacts of non-native fishes
(Cucherousset et al. 2012). Nevertheless, future studies could also incorporate some
stomach content analyses to verify the outcomes. It should, however, be noted that
studies that rely on both stable isotope analysis and stomach contents analysis often
show contrasting outcomes, for example food items found in high abundance in
stomach contents may in fact only be briefly temporally abundant therefore their
overall contribution to the fishes diet may be over–represented, so due to the
different timescales the results of the two methods can be contradictory rather than
complementary (Locke et al. 2013).
As previous experimental studies have shown changes in functional response as a
result of parasitism (Dick et al. 2010; Britton et al. 2012), then behavioural
functional response models could be applied further to parasites, such as E. briani, in
order to derive greater mechanistic understandings of the processes underlying the
development of differences in trophic niche. This could then be supplemented by
studies examining the physiological impacts of the parasite, for example by
measuring haematocrit levels (e.g. Jones and Grutter 2005), or experimentally testing
188
the comparative excretion metabolites associated with stress such as ammonia
(Buttle et al. 1996) and steroids (Pankhurst 2011).
Finally, the weighted models have much potential for refinement, addition and
expansion. For example, the survival of all infected fish is assumed, yet both of the
parasites used in the weighted models are known to result in some host mortality
(Alston and Lewis 1994; Scholz et al. 2012). Consequently, models could be
developed that build in mortality rates, although this would require further
information on how the parasite results in host death, e.g. directly via pathological
damage and/ or indirectly via energetic consequences that result from heavy
infections. Similarly, modelling reactive changes into the diet of uninfected fish, to
capitalise on increased abundances of non-preferred items would enhance the realism
of the model, and provide a more representative insight into the competitive
interactions of infected and uninfected conspecifics. Furthermore, the model
outcomes have yet to be validated by empirical study, with controlled experiments in
mesocosm contexts potentially providing systems where this could be completed. An
example is provided by (Buck et al. 2015) who successfully used mesocosm
experiments to demonstrate the community impacts of an amphibian parasite,
revealing that contrary to their predictions the effects of nutrient supplementation
and infection were additive rather than interactive. Thus, testing the impacts of the
focal parasites in their fish hosts in a similar fashion could corroborate the model
outputs or suggest areas of improvement, such that the model could have ultimately
have greater research and management value as a predictive tool for assessing the
potential impact of these parasites in future scenarios of environmental change.

189
8. References
Abdelhalim, A. I., Lewis, J. W. and Boxshall, G. A., 1991. The life-cycle of
Ergasilus sieboldi Nordmann (Copepoda, Poecilostomatoida) parasitic of
British freshwater fish. Journal of Natural History, 25 (3), 559-582.
Agnew, P., Koella, J. C. and Michalakis, Y., 2000. Host life history responses to
parasitism. Microbes and Infection, 2, 891-896.
Albon, S. D., Stien, A., Irvine, R. J., Langvatn, R., Ropstad, E. and Halvorsen, O.,
2002. The role of parasites in the dynamics of a reindeer population.
Proceedings of the Royal Society B-Biological Sciences, 269 (1500), 1625-
1632.
Ali, M. and Wootton, R. J., 1999. Effect of variable food levels on reproductive
performance of breeding female three-spined sticklebacks. Journal of Fish
Biology, 55, 1040-1053.
Alston, S. and Lewis, J. W., 1994. The ergasililid parasites (Copepoda:
Poecilostomatoida) of British freshwater fish. In: Pike, A. W. and Lewis, J.
W., eds. Parasitic Diseases of Fish. Dyfed: Samara Publishing Ltd, 251.
Altizer, S., Dobson, A., Hosseini, P., Hudson, P., Pascual, M. and Rohani, P., 2006.
Seasonality and the dynamics of infectious diseases. Ecology Letters, 9, 467-
484.
Amundsen, P. -A., Knudsen, R., Kuris, A. M. and Kristoffersen, R., 2003. Seasonal
and ontogenetic dynamics in trophic transmission of parasites. Oikos, 102
(2), 285-293.
Amundsen, P. A., Knudsen, R., Kuris, A. M. and Kristoffersen, R., 2003. Seasonal
and ontogenetic dynamics in trophic transmission of parasites. Oikos, 102,
285-293.
190
Amundsen, P.-A., Lafferty, K. D., Knudsen, R., Primicerio, R., Klemetsen, A. and
Kuris, A. M., 2009. Food web topology and parasites in the pelagic zone of a
subarctic lake. Journal of Animal Ecology, 78 (3), 563-572.
Amundsen, P.-A., Lafferty, K. D., Knudsen, R., Primicerio, R., Kristoffersen, R.,
Klemetsen, A. and Kuris, A. M., 2013. New parasites and predators follow
the introduction of two fish species to a subarctic lake: implications for food-
web structure and functioning. Oecologia, 171 (4), 993-1002.
Andreou, D., Arkush, K. D., Guegan, J.-F. and Gozlan, R. E., 2012. Introduced
Pathogens and Native Freshwater Biodiversity: A Case Study of
Sphaerothecum destruens. Plos One, 7 (5).
Andrews, C., Chubb, J. C., Coles, T. and Dearsley, A., 1981. The occurrence of
Bothriocephauls acheilognathi Yamaguti, 1934 (B. gowkongensis) (Cestoda,
pseudophyllidea) in the British Isles. Journal of Fish Diseases, 4 (1), 89-93.
Angeler, D. G., Sanchez-Carrillo, S., Garcia, G. and Alvarez-Cobelas, M., 2001. The
influence of Procambarus clarkii (Cambaridae, Decapoda) on water quality
and sediment characteristics in a Spanish floodplain wetland. Hydrobiologia,
464 (1-3), 89-98.
Aprahamian, M. W., 2000. The growth rate of eel in tributaries of the lower River
Severn, England, and its relationship with stock size. Journal of Fish
Biology, 56 (1), 223-227.
Araujo, M. S., Bolnick, D. I. and Layman, C. A., 2011. The ecological causes of
individual specialisation. Ecology Letters, 14 (9), 948-958.
Arim, M., Marquet, P. A. and Jaksic, F. M., 2007. On the relationship between
productivity and food chain length at different ecological levels. American
Naturalist, 169 (1), 62-72.
191
Armitage, P. D., Pinder, L. C. and Cranston, P., 2012. The Chironomidae: biology
and ecology of non-biting midges. Springer Science & Business Media. New
York
Arnott, S. A., Barber, I. and Huntingford, F. A., 2000. Parasite-associated growth
enhancement in a fish-cestode system. Proceedings of the Royal Society B-
Biological Sciences, 267, 657-663.
Bagenal, T. B., 1969. Relationship between food supply and fecundity in brown trout
Salmo trutta L. Journal of Fish Biology, 1, 167-182.
Barber, I., Hoare, D. and Krause, J., 2000. Effects of parasites on fish behaviour: a
review and evolutionary perspective. Reviews in Fish Biology and Fisheries,
10 (2), 131-165.
Barber, I., Huntingford, F. A. and Crompton, D. W. T., 1995. The effect of hunger
and cestode parasitism on the shoaling decisions of small freshwater fish.
Journal of Fish Biology, 47, 524-536.
Barry, J., McLeish, J., Dodd, J. A., Turnbull, J. F., Boylan, P. and Adams, C. E.,
2014. Introduced parasite Anguillicola crassus infection significantly
impedes swim bladder function in the European eel Anguilla anguilla (L.).
Journal of Fish Diseases, 37 (10), 921-924.
Barus, V. and Prokes, M., 1996. Length-weight relations of uninfected and infected
eels (Anguilla anguilla) by Anguillicola crassus (nematoda). Folia
Zoologica, 45 (2), 183-189.
Bascompte, J., Jordano, P., Melian, C. J. and Olesen, J. M., 2003. The nested
assembly of plant-animal mutualistic networks. Proceedings of the National
Academy of Sciences of the United States of America, 100 (16), 9383-9387.
192
Bean, C. W. and Winfield, I. J., 1989. Biological and ecological effects of a lugula
instestinals (L) infestation of the gudgeon, Gobio gobio (L), in Lough Neagh,
Northern Ireland. Journal of Fish Biology, 34 (1), 135-147.
Beardsley, H. and Britton, J. R., 2012. Contribution of temperature and nutrient
loading to growth rate variation of three cyprinid fishes in a lowland river.
Aquatic Ecology, 46 (1), 143-152.
Beer, S. A. and German, S. M., 1993. Ecological prerequisites of worsening of the
cercariosis situation in cities of Russia (Moscow Region as an example).
Parazitologiya (St. Petersburg), 27 (6), 441-449.
Beldade, R., Holbrook, S. J., Schmitt, R. J., Planes, S., Malone, D. and Bernardi, G.,
2012. Larger female fish contribute disproportionately more to self-
replenishment. Proceedings of the Royal Society B-Biological Sciences, 279,
2116-2121.
Benesh D.P., Chubb J.C. and Parker G.A., 2014 The trophic vacuum and the
evolution of complex life cycles in trophically transmitted helminths.
Proceedings of the Royal Society B-Biological Sciences, 281 (1793),
20141462.
Bersier, L. F., Banasek-Richter, C. and Cattin, M. F., 2002. Quantitative descriptors
of food-web matrices. Ecology, 83 (9), 2394-2407.
Bielby, J., Fisher, M. C., Clare, F. C., Rosa, G. M. and Garner, T. W. J., 2015. Host
species vary in infection probability, sub-lethal effects, and costs of immune
response when exposed to an amphibian parasite. Scientific Reports, 5.
Blakeslee, A. M. H., Byers, J. E. and Lesser, M. P., 2008. Solving cryptogenic
histories using host and parasite molecular genetics: the resolution of
193
Littorina littorea's North American origin. Molecular Ecology, 17 (16), 3684-
3696.
Blanchet, S., Mejean, L., Bourque, J.-F., Lek, S., Thomas, F., Marcogliese, D. J.,
Dodson, J. J. and Loot, G., 2009. Why do parasitized hosts look different?
Resolving the "chicken-egg" dilemma. Oecologia, 160 (1), 37-47.
Bolnick, D. I., Svanback, R., Araujo, M. S. and Persson, L., 2007. Comparative
support for the niche variation hypothesis that more generalized populations
also are more heterogeneous. Proceedings of the National Academy of
Sciences of the United States of America, 104 (24), 10075-10079.
Bolnick, D. I., Svanback, R., Fordyce, J. A., Yang, L. H., Davis, J. M., Hulsey, C. D.
and Forister, M. L., 2003. The ecology of individuals: Incidence and
implications of individual specialization. American Naturalist, 161 (1), 1-28.
Bond, A.L. and Diamond, A.W., 2011. Recent Bayesian stable-isotope mixing
models are highly sensitive to variation in discrimination factors. Ecological
Applications, 21, 1017-1023.
Bovo, G., Giorgetti, G., Jørgensen, P. E. V. and Olesen, N. J., 1987. Infectious
haematopoietic necrosis: first detection in Italy. Bulletin of the European
Association of Fish Pathologists, 7, 24.
Bowden, T. J., Thompson, K. D., Morgan, A. L., Gratacap, R. M. L. and
Nikoskelainen, S., 2007. Seasonal variation and the immune response: A fish
perspective. Fish & Shellfish Immunology, 22, 695-706.
Britton, J. R., 2013. Introduced parasites in food webs: new spades, shifting
structures? Trends in Ecology & Evolution, 28 (2), 93-99.
Britton, J. R., Boar, R. R., Grey, J., Foster, J., Lugonzo, J. and Harper, D. M., 2007.
From introduction to fishery dominance: the initial impacts of the invasive
194
carp Cyprinus carpio in Lake Naivasha, Kenya, 1999 to 2006. Journal of
Fish Biology, 71, 239-257.
Britton, J. R., Davies, G. D. and Harrod, C., 2010. Trophic interactions and
consequent impacts of the invasive fish Pseudorasbora parva in a native
aquatic foodweb: a field investigation in the UK. Biological Invasions, 12
(6), 1533-1542.
Britton, J. R., Jackson, M. C. and Harper, D. M., 2009. Ligula intestinalis (Cestoda:
Diphyllobothriidae) in Kenya: a field investigation into host specificity and
behavioural alterations. Parasitology, 136 (11), 1367-1373.
Britton, J. R., Pegg, J. and Williams, C. F., 2011. Pathological and ecological host
consequences of infection by an introduced fish parasite. PLoS ONE, (10),
e26365-e26365.
Britton, J. R., Pegg, J., Baker, D. and Williams, C. F., 2012. Do lower feeding rates
result in reduced growth of a cyprinid fish infected with the Asian tapeworm?
Ecology of Freshwater Fish, 21, 172-175.
Bromage, N., Porter, M. and Randall, C., 2001. The environmental regulation of
maturation in farmed finfish with special reference to the role of photoperiod
and melatonin. Aquaculture, 197, 63-98.
Bruemmer, C. M., Rushton, S. P., Gurnell, J., Lurz, P. W. W., Nettleton, P.,
Sainsbury, A. W., Duff, J. P., Gilray, J. and McInnes, C. J., 2010.
Epidemiology of squirrelpox virus in grey squirrels in the UK. Epidemiology
and Infection, 138 (7), 941-950.
Buck, J. C., Rohr, J. R. and Blaustein, A. R., 2015. Effects of nutrient
supplementation on host-pathogen dynamics of the amphibian chytrid
fungus: a community approach. Freshwater Biology.
195
Bulte, G., Irschick, D. J. and Blouin-Demers, G., 2008. The reproductive role
hypothesis explains trophic morphology dimorphism in the northern map
turtle. Functional Ecology, 22 (5), 824-830.
Busst, G. M. A., Basic, T. and Britton, J. R., 2015. Stable isotope signatures and
trophic-step fractionation factors of fish tissues collected as non-lethal
surrogates of dorsal muscle. Rapid Communications in Mass Spectrometry,
29 (16), 1535-1544.
Buttle, L. G., Uglow, R. F. and Cowx, I. G., 1996. The effect of emersion and
handling on the nitrogen excretion rates of Clarias gariepinus. Journal of
Fish Biology, 49 (4), 693-701.
Cable, J., Harris, P. D. and Bakke, T. A., 2000. Population growth of Gyrodactylus
salaris (Monogenea) on Norwegian and Baltic Atlantic salmon (Salmo salar)
stocks. Parasitology, 121, 621-629.
Caraco, N. F., Cole, J. J., Raymond, P. A., Strayer, D. L., Pace, M. L., Findlay, S. E.
G. and Fischer, D. T., 1997. Zebra mussel invasion in a large, turbid river:
Phytoplankton response to increased grazing. Ecology, 78 (2), 588-602.
Carpenter, S. R., Caraco, N. F., Correll, D. L., Howarth, R. W., Sharpley, A. N. and
Smith, V. H., 1998. Nonpoint pollution of surface waters with phosphorus
and nitrogen. Ecological Applications, 8 (3), 559-568.
Chantrey, J., Dale, T. D., Read, J. M., White, S., Whitfield, F., Jones, D., McInnes,
C. J. and Begon, M., 2014. European red squirrel population dynamics driven
by squirrelpox at a gray squirrel invasion interface. Ecology and Evolution, 4
(19), 3788-3799.
Chappell, L. H., 1995. The biology of Diplostomatid eyeflukes of fishes. Journal of
Helminthology, 69 (2), 97-101.
196
Christe, P., Richner, H. and Oppliger, A., 1996. Begging, food provisioning, and
nestling competition in great tit broods infested with ectoparasites.
Behavioral Ecology, 7, 127-131.
Clerc, M., Ebert, D. and Hall, M. D., 2015. Expression of parasite genetic variation
changes over the course of infection: implications of within-host dynamics
for the evolution of virulence. Proceedings. Biological sciences / The Royal
Society, 282 (1804).
Colautti, R. I., Ricciardi, A., Grigorovich, I. A. and MacIsaac, H. J., 2004. Is
invasion success explained by the enemy release hypothesis? Ecology
Letters, 7 (8), 721-733.
Cooper, J. E. and Cooper, M. E., 2008. Forensic veterinary medicine: a rapidly
evolving discipline. Forensic Science Medicine and Pathology, 4 (2), 75-82.
Costello, M. J. 2006. Ecology of sea lice parasitic on farmed and wild fish. Trends in
Parasitology, 22, 475-483.
Cox, F. E. G., 2001. Concomitant infections, parasites and immune responses.
Parasitology, 122, S23-S38.
Cranston, P. S., Armitage, P. D. and Pinder, L. C. V., 1995. The Chironomidae :
biology and ecology of non-biting midges. London: Chapman & Hall.
Crowden, A. E. and Broom, D. M., 1980. Effects of the eye fluke Diplostomum
spathaceum on the behaviour of Dace Leuciscuc leuciscus. Animal
Behaviour, 28 (1), 286-294.
Csardi, G. and Nepusz, T., 2006. The igraph software package for complex network
research. InterJournal, Complex Systems, 1695.
Csardi, G. and Nepusz, T., 2006. The igraph software package for complex network
research. InterJournal, Complex Systems, 1695.
197
Cucherousset, J. and Olden, J. D., 2011. Ecological Impacts of Non native
Freshwater Fishes. Fisheries, 36 (5), 215-230.
Cucherousset, J., Acou, A., Blanchet, S., Britton, J. R., Beaumont, W. R. C. and
Gozlan, R. E., 2011. Fitness consequences of individual specialisation in
resource use and trophic morphology in European eels. Oecologia, 167 (1),
75-84.
Cucherousset, J., Bouletreau, S., Martino, A., Roussel, J. M. and Santoul, F., 2012.
Using stable isotope analyses to determine the ecological effects of non-
native fishes. Fisheries Management and Ecology, 19 (2), 111-119.
Cucherousset, J., Paillisson, J.-M. and Roussel, J.-M., 2007. Using PIT technology to
study the fate of hatchery-reared YOY northern pike released into shallow
vegetated areas. Fisheries Research, 85 (1-2), 159-164.
Cunningham, E. J., Tierney, J. F. and Huntingford, F. A., 1994. Effects of the
cestode Schistocephalus solidis on food intake and foraging decisions in the 3
spined stickleback Gasterosteus aculeatus. Ethology, 97 (1), 65-75.
Davies, G. D. and Britton, J. R., 2015. Assessing the efficacy and ecology of
biocontrol and biomanipulation for managing invasive pest fish. Journal of
Applied Ecology, 52 (5), 1264-1273.
De Silva, S. S., Nguyen, T. T. T., Abery, N. W. and Amarasinghe, U. S., 2006. An
evaluation of the role and impacts of alien finfish in Asian inland
aquaculture. Aquaculture Research, 37 (1), 1-17.
Decharleroy, D., Grisez, L., Thomas, K., Belpaire, C. and Ollevier, F., 1990. The life
cycle of Anguillicola crassus. Diseases of Aquatic Organisms, 8 (2), 77-84.
Dezfuli, B. S., Giari, L., Konecny, R., Jaeger, P. and Manera, M., 2003.
Immunohistochemistry, ultrastructure and pathology of gills of Abramis
198
brama from Lake Mondsee, Austria, infected with Ergasilus sieboldi
(Copepoda). Diseases of Aquatic Organisms, 53 (3), 257-262.
Dianne, L., Perrot-Minnot, M.-J., Bauer, A., Guvenatam, A. and Rigaud, T., 2014.
Parasite-induced alteration of plastic response to predation threat: increased
refuge use but lower food intake in Gammarus pulex infected with the
acanothocephalan Pomphorhynchus laevis. International Journal for
Parasitology, 44 (3-4), 211-216.
Dick, J. T. A., Armstrong, M., Clarke, H. C., Farnsworth, K. D., Hatcher, M. J.,
Ennis, M., Kelly, A. and Dunn, A. M., 2010. Parasitism may enhance rather
than reduce the predatory impact of an invader. Biology Letters, 6 (5), 636-
638.
Dobson, A. and Hudson, P., 1995. The interaction between the parasites and
predators of red grouse Lagopus lagopus scoticus. Ibis, 137, S87-S96.
Dobson, A. P. and Hudson, P. J., 1992. Regulation and stabiliy of a free-living host-
parasite system, Trichostrongylus tenius in red grouse. 2 Population models.
Journal of Animal Ecology, 61 (2), 487-498.
Dobson, A. P., Lafferty, K. D. and and Kuris, A. M., 2006. Parasites and food webs.
In: M, P. and J.A, D., eds. Ecological networks: linking structure to
dynamics in food webs. Oxford: Oxford University Press, 119-135.
Dodds, W. K., Bouska, W. W., Eitzmann, J. L., Pilger, T. J., Pitts, K. L., Riley, A. J.,
Schloesser, J. T. and Thornbrugh, D. J., 2009. Eutrophication of US
Freshwaters: Analysis of Potential Economic Damages. Environmental
Science & Technology, 43 (1), 12-19.
Dorresteijn, I., Schultner, J., Nimmo, D. G., Fischer, J., Hanspach, J., Kuemmerle,
T., Kehoe, L. and Ritchie, E. G., 2015. Incorporating anthropogenic effects
199
into trophic ecology: predator-prey interactions in a human-dominated
landscape. Proceedings. Biological sciences / The Royal Society, 282 (1814).
Douda, K., Vrtilek, M., Slavik, O. and Reichard, M., 2012. The role of host
specificity in explaining the invasion success of the freshwater mussel
Anodonta woodiana in Europe. Biological Invasions, 14 (1), 127-137.
Draulans, D., 1988. Effects of fish-eating birds on freshwater fish stocks: an
evaluation. Biological Conservation, 44(4), 251-263.
Dunn, A. M. and Dick, J. T. A., 1998. Parasitism and epibiosis in native and non-
native gammarids in freshwater in Ireland. Ecography, 21 (6), 593-598.
Dunn, J. C., McClymont, H. E., Christmas, M. and Dunn, A. M., 2009. Competition
and parasitism in the native White Clawed Crayfish Austropotamobius
pallipes and the invasive Signal Crayfish Pacifastacus leniusculus in the UK.
Biological Invasions, 11 (2), 315-324.
Dunne, J. A., Brose, U., Williams, R. J. and Martinez, N. D., 2005. Modeling food-
web dynamics: complexity-stability implications. Aquatic Food Webs: An
Ecosystem Approach, 117-129.
Dunne, J. A., Lafferty, K. D., Dobson, A. P., Hechinger, R. F., Kuris, A. M.,
Martinez, N. D., McLaughlin, J. P., Mouritsen, K. N., Poulin, R., Reise, K.,
Stouffer, D. B., Thieltges, D. W., Williams, R. J. and Zander, C. D., 2013.
Parasites Affect Food Web Structure Primarily through Increased Diversity
and Complexity. Plos Biology, 11 (6).
Dunne, J. A., Williams, R. J. and Martinez, N. D., 2002. Food-web structure and
network theory: The role of connectance and size. Proceedings of the
National Academy of Sciences of the United States of America, 99 (20),
12917-12922.

200
Dunne, J. A., Williams, R. J. and Martinez, N. D., 2002. Network structure and
biodiversity loss in food webs: robustness increases with connectance.
Ecology Letters, 5 (4), 558-567.
Durell, S., 2000. Individual feeding specialisation in shorebirds: population
consequences and conservation implications. Biological Reviews, 75 (4),
503-518.
Duthie, G. G. and Hughes, G. M., 1987. The effects of reduced gill area and
hyperoxia on the oxygen consumption and swimming speed of rainbow trout.
Journal of Experimental Biology, 127, 349-354.
Eberhardt, L. L. and Thomas, J. M., 1991. Designing environmental field studies.
Ecological Monographs, 61 (1), 53-73.
Elliott, J. A., Henrys, P., Tanguy, M., Cooper, J. and Maberly, S. C., 2015.
Predicting the habitat expansion of the invasive roach Rutilus rutilus
(Actinopterygii, Cyprinidae), in Great Britain. Hydrobiologia, 751 (1), 127-
134.
Emmerson, M. C. and Raffaelli, D., 2004. Predator-prey body size, interaction
strength and the stability of a real food web. Journal of Animal Ecology, 73
(3), 399-409.
Environment Agency, 2015. Environmental management – guidance Fish health
checks [online]. https://www.gov.uk/fish-health-checks: Available from:
06/02/15].
Estlander, S., Nurminen, L., Olin, M., Vinni, M., Immonen, S., Rask, M., Ruuhijarvi,
J., Horppila, J. and Lehtonen, H., 2010. Diet shifts and food selection of
perch Perca fluviatilis and roach Rutilus rutilus in humic lakes of varying
water colour. Journal of Fish Biology, 77 (1), 241-256.
201
Ewald, P. W., 1995. The evolution of virulence – a unifying link between
parasitology and ecology. Journal of Parasitology, 81 (5), 659-669.
Folstad, I. and Karter, A. J., 1992. Parasites, bright males, and the
immunocompetence handicap. American Naturalist, 139 (3), 603-622.
Fryer, A. G. and Andrews, A. C., 1983. The parasitic copepod Ergasilus briani
Markewitsch in Yorkshire: An addition to the British fauna. Naturalist, 108,
7 - 10.
Furones, M. D., Rodgers, C. J. and Munn, C. B., 1993. Yersinia ruckeri, the causal
agent of enteric redmouth disease (ERM) in fish. Annual Review of Fish
Diseases, 3 (0), 105-125.
Galaktionov, K. V., 1996. Life cycles and distribution of seabird helminths in arctic
and sub-arctic regions. Bulletin of the Scandinavian Society of Parasitology,
6, 31-49.
Garcia, C., Montgomery, E., Krug, J. and Dagit, R., 2015. Removal Efforts and
Ecosystem Effects of Invasive Red Swamp Crayfish (Procambarus clarkii)
in Topanga Creek, California. Bulletin, Southern California Academy of
Sciences, 114 (1), 12-21.
Garcia-Berthou, E., 2001. On the misuse of residuals in ecology: testing regression
residuals vs. the analysis of covariance. Journal of Animal Ecology, 70 (4),
708-711.
Gibson, D. I., Bray, R. A. and Harris, E. A., 2005. Host-Parasite Database of the
Natural History Museum. London.
Giles, N., 1983. Behavoral effects of the parasite Schistocephalus solidus (cestoda)
on an intermedaite host, the 3 spined stickleback, Gasterosteus aculeatus L.
Animal Behaviour, 31 (NOV), 1192-1194.
202
Giles, N., 1987. Predation risk and reduced foraging activity in fish experiments with
parasitized and non-parasitized 3 spined sticklebacks, Gasterosteus aculeatus
L. Journal of Fish Biology, 31 (1), 37-44.
Gozlan, R. E., 2008. Introduction of non-native freshwater fish: is it all bad? Fish
and Fisheries, 9 (1), 106-115.
Gozlan, R. E., Andreou, D., Asaeda, T., Beyer, K., Bouhadad, R., Burnard, D.,
Caiola, N., Cakic, P., Djikanovic, V., Esmaeili, H. R., Falka, I., Golicher, D.,
Harka, A., Jeney, G., Kovac, V., Musil, J., Nocita, A., Povz, M., Poulet, N.,
Virbickas, T., Wolter, C., Tarkan, A. S., Tricarico, E., Trichkova, T.,
Verreycken, H., Witkowski, A., Zhang, C.-g., Zweimueller, I. and Britton, J.
R., 2010a. Pan-continental invasion of Pseudorasbora parva: towards a
better understanding of freshwater fish invasions. Fish and Fisheries, 11 (4),
315-340.
Gozlan, R. E., Britton, J. R., Cowx, I. and Copp, G. H., 2010. Current knowledge on
non-native freshwater fish introductions. Journal of Fish Biology, 76, 751-
786.
Gozlan, R. E., Peeler, E. J., Longshaw, M., St-Hilaire, S. and Feist, S. W., 2006.
Effect of microbial pathogens on the diversity of aquatic populations, notably
in Europe. Microbes and Infection, 8 (5), 1358-1364.
Gozlan, R. E., St-Hilaire, S., Feist, S. W., Martin, P. and Kent, M. L., 2005.
Biodiversity - Disease threat to European fish. Nature, 435 (7045), 1046-
1046.
Granath, W. O. and Esch, G. W., 1983. Temperature and other facctors that regulate
the composition and infrapopulation densities of Bothriocephalus
203
acheilognathi (Cestoda) in Gambusia affinis (Pisces. Journal of
Parasitology, 69.
Grey J., 2006. The use of stable isotope analyses in freshwater ecology: current
awareness. Polish Journal of Ecology, 54, 563-584.
Grey, J and Jackson, M.C., 2012. Leaves and eats shoots direct terrestrial feeding
can supplement invasive red swamp crayfish in times of need. PloS one 7,
e42575.
Gurevitch, J. and Padilla, D. K., 2004. Are invasive species a major cause of
extinctions? Trends in Ecology & Evolution, 19 (9), 470-474.
Guzzo, M.M., Haffner, G.D., Legler, N.D., Rush, S.A. and Fisk, A.T., 2013 Fifty
years later: trophic ecology and niche overlap of a native and non-indigenous
fish species in the western basin of Lake Erie. Biological invasions, 15, 1695-
1711.
Hadfield, J. D., Krasnov, B. R., Poulin, R. and Nakagawa, S., 2014. A Tale of Two
Phylogenies: Comparative Analyses of Ecological Interactions. American
Naturalist, 183 (2), 174-187.
Hanfling, B., Bolton, P., Harley, M. and Carvalho, G. R., 2005. A molecular
approach to detect hybridisation between crucian carp (Carassius carassius)
and non-indigenous carp species (Carassius spp. and Cyprinus carpio).
Freshwater Biology, 50 (3), 403-417.
Hansen, H., Bachmann, L. and Bakke, T. A., 2003. Mitochondrial DNA variation of
Gyrodactylus spp. (Monogenea, Gyrodactylidae) populations infecting
Atlantic salmon, grayling, and rainbow trout in Norway and Sweden.
International Journal for Parasitology, 33 (13), 1471-1478.
204
Hansen, H., Bakke, T. A. and Bachmann, L., 2007. DNA taxonomy and barcoding of
monogenean parasites: lessons from Gyrodactylus. Trends in Parasitology,
23 (8), 363-367.
Hansen, S. P., Choudhury A., and Cole, R. A., 2007. Evidence of experimental
postcyclic transmission of Bothriocephalus acheilognathi in bonytail chub
(Gila elegans. Journal of Parasitology, 93, 202-204.
Hartigan, A., Fiala, I., Dykova, I., Jirku, M., Okimoto, B., Rose, K., Phalen, D. N.
and Slapeta, J., 2011. A Suspected Parasite Spill-Back of Two Novel
Myxidium spp. (Myxosporea) Causing Disease in Australian Endemic Frogs
Found in the Invasive Cane Toad. Plos One, 6 (4).
Hatcher, M. J. and Dunn, A. M., 2011. Parasites in Ecological CommunitiesFrom
Interactions to Ecosystems. Cambridge: Cambridge University Press.
Hatcher, M. J., Dick, J. T. A. and Dunn, A. M., 2006. How parasites affect
interactions between competitors and predators. Ecology Letters, 9 (11),
1253-1271.
Hatcher, M. J., Dick, J. T. A. and Dunn, A. M., 2012. Diverse effects of parasites in
ecosystems: linking interdependent processes. Frontiers in Ecology and the
Environment, 10 (4), 186-194.
Hayward, R. S. and Margraf, F. J., 1987. Eutrophication effects on prey size and
food available to yellow perch in Lake Erie. Transactions of the American
Fisheries Society, 116 (2), 210-223.
Heggberget, T. G. and Johnsen, B. O., 1982. Infestations by Gyrodactylus Sp. of
Atlantic salmon, Salmo salar L, in Norwegian rivers. Journal of Fish
Biology, 21 (1), 15-26.
205
Henderson, A. C., Flannery, K. and Dunne, J., 2003. Biological observations on
shark species taken in commercial fisheries to the west of Ireland. Biology
and Environment, 103B (1), 1-7.
Hernandez, A. D. and Sukhdeo, M. V. K., 2008. Parasites alter the topology of a
stream food web across seasons. Oecologia, 156 (3), 613-624.
Hickley, P. and Chare, S., 2004. Fisheries for non-native species in England and
Wales: angling or the environment? Fisheries Management and Ecology, 11
(3-4), 203-212.
Hislop, J. R. G., 1988. The influence of maternal length and age on the size and
weight of the eggs and the relative fecunsity of the haddock, Melanogrammus
melanogrammus aeglefinus, in British waters. Journal of Fish Biology, 32,
923-930.
Hogans, W. E., 1989. Mortality of cultured Atlantic salmon, Salmo salar L, parr
caused by infection of Ergasilus Labracis (Copepoda, Poecilostomatoida) in
the lower Saint John River, New Brunswick, Canada. Journal of Fish
Diseases, 12 (5), 529-531.
Holling, C. S., 1959. Some characteristics of simple types of predation and
parasitism. The Canadian Entomologist 91 (07), 385-398
Hoole, D., Bucke, D., Burgess, P. and Wellby, I., 2001. Diseases of carp and other
cyprinid fishes. Oxford: Fishing News Books.
Hough, R. A., Fornwall, M. D., Negele, B. J., Thompson, R. L. and Putt, D. A.,
1989. Plant community dynamics in a chain of lakes – principal factors in the
decline of rooted macrophytes with eutrophication. Hydrobiologia, 173 (3),
199-217.
206
Hudson, P. J., 1986. The effect of a parasitic nematode on the breeding productaion
of red grouse. Journal of Animal Ecology, 55 (1), 85-92.
Hudson, P. J., Dobson, A. P. and Lafferty, K. D., 2006. Is a healthy ecosystem one
that is rich in parasites? Trends in Ecology & Evolution, 21 (7), 381-385.
Humphries, M. D. and Gurney, K., 2008. Network 'Small-World-Ness': A
Quantitative Method for Determining Canonical Network Equivalence. Plos
One, 3 (4).
Huss, M., Bystrom, P. and Persson, L., 2008. Resource heterogeneity, diet shifts and
intra-cohort competition: effects on size divergence in YOY fish. Oecologia,
158 (2), 249-257.
Huxham, M. and Raffaelli, D., 1995. Parasites and food web patterns. Journal of
Animal Ecology, 64 (2), 168-176.
Huxham, M., Beaney, S. and Raffaelli, D., 1996. Do parasites reduce the chances of
triangulation in a real food web? Oikos, 76 (2), 284-300.
Jackson A.L., Inger R., Parnell A.C. and Bearhop S., 2011. Comparing isotopic
niche widths among and within communities: SIBER - Stable Isotope
Bayesian Ellipses in R. Journal of Animal Ecology, 80, 595-602.
Jackson M.C., Donohue I., Jackson A.L., Britton J.R., Harper D.M. and Grey J.,
2012. Population-Level Metrics of Trophic Structure Based on Stable
Isotopes and Their Application to Invasion Ecology. Plos One, 7.
Jacoby D. and Gollock M., 2014. Anguilla anguilla. The IUCN Red List of
Threatened Species. Version 2014.3. Vol. 26/1/14. IUCN,
www.iucnredlist.org.
207
Jacoby, D. and Gollock, M., 2014. Anguilla anguilla. The IUCN Red List of
Threatened Species. Version 2014.3 [online]. www.iucnredlist.org: IUCN.
Available from: 26/1/14].
Jakobsen, P. J., Johnsen, G. H. and Larsson, P., 1988. Effects of predation risk and
parasitism on the feeding ecology, habitat use and abundance of laucustrine
threespine stickleback (Gasterosteus aculeatus). Canadian Journal of
Fisheries and Aquatic Sciences, 45 (3), 426-431.
Jansen, P. A., Kristoffersen, A. B., Viljugrein, H., Jimenez, D., Aldrin, M. and Stien,
A., 2012. Sea lice as a density-dependent constraint to salmonid farming.
Proceedings of the Royal Society B-Biological Sciences, 279 (1737), 2330-
2338.
Jiménez-Garcia, M. I. and Vidal-Martínez, V. M., 2005. Temporal variation in the
infection dynamics and maturation cycle of Oligogonotylus manteri (digenea)
in the cichlid fish, 'Cichlasoma' urophthalmus, from Yucatan, Mexico.
Journal of Parasitology, 91, 1008-1014.
Johnsen, B. O., 1978. The effect of an attack by the parasite Gyrodactylus salaris on
the population of salmon parr in the River Lakselva Misvaer in northern
Norway. Astarte, 11 (1), 7-10.
Johnsen, B. O. and Jensen, A. J., 1986. Infestations of Atlantic salmon, Salmo salar,
by Gyrodactylus salaris in Noregian Rivers. Journal of Fish Biology, 29 (2),
233-241.
Johnsen, B. O. and Jensen, A. J., 1991. The Gyrodactylus story in Norway.
Aquaculture, 98 (1-3), 289-302.
Johnson, P. T. J., Dobson, A., Lafferty, K. D., Marcogliese, D. J., Memmott, J.,
Orlofske, S. A., Poulin, R. and Thieltges, D. W., 2010. When parasites
208
become prey: ecological and epidemiological significance of eating parasites.
Trends in Ecology & Evolution, 25 (6), 362-371.
Jones, C. M. and Grutter, A. S., 2005. Parasitic isopods (Gnathia sp.) reduce
haematocrit in captive blackeye thicklip (Labridae) on the Great Barrier Reef.
Journal of Fish Biology, 66 (3), 860-864.
Joppa, L. N., Bascompte, J., Montoya, J. M., Sole, R. V., Sanderson, J. and Pimm, S.
L., 2009. Reciprocal specialization in ecological networks. Ecology Letters,
12 (9), 961-969.
Joppa, L. N., Montoya, J. M., Sole, R., Sanderson, J. and Pimm, S. L., 2010. On
nestedness in ecological networks. Evolutionary Ecology Research, 12 (1),
35-46.
Kahl, U. and Radke, R. J., 2006. Habitat and food resource use of perch and roach in
a deep mesotrophic reservoir: enough space to avoid competition? Ecology of
Freshwater Fish, 15 (1), 48-56.
Karlsson, S., Larsen, B. M. and Hindar, K., 2014. Host-dependent genetic variation
in freshwater pearl mussel (Margaritifera margaritifera L.). Hydrobiologia,
735 (1), 179-190.
Kawaguchi, Y., Taniguchi, Y. and Nakano, S., 2003. Terrestrial invertebrate inputs
determine the local abundance of stream fishes in a forested stream. Ecology,
84 (3), 701-708.
Kelly, D. W., Paterson, R. A., Townsend, C. R., Poulin, R. and Tompkins, D. M.,
2009. Parasite spillback: A neglected concept in invasion ecology? Ecology,
90 (8), 2047-2056.
Kennedy C.R., 2007. The pathogenic helminth parasites of eels. Journal of Fish
Diseases, 30, 319-334.
209
Kennedy, C. R., 2007. The pathogenic helminth parasites of eels. Journal of Fish
Diseases, 30 (6), 319-334.
Kidd, K. A., Schindler, D. W., Hesslein, R. H. and Muir, D. C. G., 1998. Effects of
trophic position and lipid on organochlorine concentrations in fishes from
subarctic lakes in Yukon Territory. Canadian Journal of Fisheries and
Aquatic Sciences, 55 (4), 869-881.
Kirk, R. S., 2003. The impact of Anguillicola crassus on European eels. Fisheries
Management and Ecology, 10 (6), 385-394.
Knopf, K. and Lucius, R., 2008. Vaccination of eels (Anguilla japonica and Anguilla
anguilla) against Anguillicola crassus with irradiated L(3). Parasitology, 135
(5), 633-640.
Knopf, K. and Mahnke, M., 2004. Differences in susceptibility of the European eel
(Anguilla anguilla) and the Japanese eel (Anguilla japonica) to the swim-
bladder nematode Anguillicola crassus. Parasitology, 129, 491-496.
Knudsen, R., Curtis, M. A. and Kristoffersen, R., 2004. Aggregation of helminths:
The role of feeding behavior of fish hosts. Journal of Parasitology, 90 (1), 1-
7.
Kolodziejska, M., Maszkowska, J., Bialk-Bielinska, A., Steudte, S., Kumirska, J.,
Stepnowski, P. and Stolte, S., 2013. Aquatic toxicity of four veterinary drugs
commonly applied in fish farming and animal husbandry. Chemosphere, 92
(9), 1253-1259.
Koo, W. W. and Mattson, J. W., 2004. Economics of detection and control of
invasive species: Workshop Highlights. North Dakota State University,
Center for Agricultural Policy and Trade Studies.
210
Koops, H. and Hartmann, F., 1989. Anguillicola infestations in Germany and in
German eel imports. Journal of Applied Ichthyology-Zeitschrift Fur
Angewandte Ichthyologie, 5 (1), 41-45.
Kratzer, J. F. and Warren, D. R., 2012. How much temporal replication do we need
to estimate salmonid abundance in streams? Fisheries Management and
Ecology, 19 (5), 441-443.
Krist, A. C., 2000. Effect of the digenean parasite Proterometra macrostoma on host
morphology in the freshwater snail Elimia livescens. Journal of Parasitology,
86 (2), 262-267.
Kristoffersen, R., 1991. Occurrence of the digenean Cryptocotyle lingua in farmed
Arctic charr Salvelinus alpinus and periwinkles Littorina littorea sampled
close to charr farms in northern Norway. Diseases of Aquatic Organisms, 12
(1), 59-65.
Kuris, A. M., Hechinger, R. F., Shaw, J. C., Whitney, K. L., Aguirre-Macedo, L.,
Boch, C. A., Dobson, A. P., Dunham, E. J., Fredensborg, B. L., Huspeni, T.
C., Lorda, J., Mababa, L., Mancini, F. T., Mora, A. B., Pickering, M.,
Talhouk, N. L., Torchin, M. E. and Lafferty, K. D., 2008. Ecosystem
energetic implications of parasite and free-living biomass in three estuaries.
Nature, 454 (7203), 515-518.
Lafferty, K. D., 1999. The evolution of trophic transmission. Parasitology Today, 15
(3), 111-115.
Lafferty, K. D. and Kuris, A. M., 1999. How environmental stress affects the
impacts of parasites. Limnology and Oceanography, 44 (3), 925-931.
Lafferty, K. D. and Kuris, A. M., 2009. Parasites reduce food web robustness
because they are sensitive to secondary extinction as illustrated by an
211
invasive estuarine snail. Philosophical Transactions of the Royal Society B-
Biological Sciences, 364 (1524), 1659-1663.
Lafferty, K. D., Dobson, A. P. and Kuris, A. M., 2006. Parasites dominate food web
links. Proceedings of the National Academy of Sciences of the United States
of America, 103 (30), 11211-11216.
Lamkova, K., Simkova, A., Palikova, M., Jurajda, P. and Lojek, A., 2007. Seasonal
changes of immunocompetence and parasitism in chub (Leuciscus cephalus),
a freshwater cyprinid fish. Parasitology Research, 101, 775-789.
Lammens, E. and Visser, J. T., 1989. Variability of mouth width in European eel,
Anguilla anguilla, in relation to varying feeding conditions in 3 Dutch lakes.
Environmental Biology of Fishes, 26 (1), 63-75.
Langdon, P. G., Ruiz, Z., Brodersen, K. P. and Foster, I. D. L., 2006. Assessing lake
eutrophication using chironomids: understanding the nature of community
response in different lake types. Freshwater Biology, 51 (3), 562-577.
Layman, C. A., Arrington, D. A., Montana, C. G. and Post, D. M., 2007. Can stable
isotope ratios provide for community-wide measures of trophic structure?
Ecology, 88 (1), 42-48.
Lefebvre F., Contournet P. and Crivelli A. J., 2002. The health state of the eel
swimbladder as a measure of parasite pressure by Anguillicola crassus.
Parasitology, 124, 457-463.
Lefevre, T., Lebarbenchon, C., Gauthier-Clerc, M., Misse, D., Poulin, R. and
Thomas, F., 2009. The ecological significance of manipulative parasites.
Trends in Ecology & Evolution, 24 (1), 41-48.
Lefebvre, F., Fazio, G., Mounaix, B. and Crivelli, A. J., 2013. Is the continental life
of the European eel Anguilla anguilla affected by the parasitic invader
212
Anguillicoloides crassus? Proceedings of the Royal Society B-Biological
Sciences, 280 (1754).
Lindenfors, P., Nunn, C. L., Jones, K. E., Cunningham, A. A., Sechrest, W. and
Gittleman, J. L., 2007. Parasite species richness in carnivores: effects of host
body mass, latitude, geographical range and population density. Global
Ecology and Biogeography, 16 (4), 496-509.
Linder, C. M., Cole, R. A., Hoffnagle, T. L., Persons, B., Choudhury, A., Haro, R.
and Sterner, M., 2012. Parasites of fishes in the Colorado River and selected
tributaries in Grand Canyon, Arizona. Journal of Parasitology, 98 (1), 117-
127.
Liu, H. and Stiling, P., 2006. Testing the enemy release hypothesis: a review and
meta-analysis. Biological Invasions, 8 (7), 1535-1545.
Locke, S. A., Bulte, G., Forbes, M. R. and Marcogliese, D. J., 2013. Estimating diet
in individual pumpkinseed sunfish Lepomis gibbosus using stomach contents,
stable isotopes and parasites. Journal of Fish Biology, 82 (2), 522-537.
Lomnicki, A., 1988. Population ecology of individuals. Monographs in population
biology, 25, 1-216.
Loot, G., Brosse, S., Lek, S. and Guegan, J. F., 2001. Behaviour of roach (Rutilus
rutilus L.) altered by Ligula intestinalis (Cestoda : Pseudophyllidea): a field
demonstration. Freshwater Biology, 46 (9), 1219-1227.
Lubchenco, J., 1978. Plant species diversity in the marine inter-tidal- Importance of
herbivore food preference and algal competetive abilities. American
Naturalist, 112 (983), 23-39.
MacDougall, A. S. and Turkington, R., 2005. Are invasive species the drivers or
passengers of change in degraded ecosystems? Ecology, 86 (1), 42-55.
213
MacKenzie, K. and Abaunza, P., 1998. Parasites as biological tags for stock
discrimination of marine fish: a guide to procedures and methods. Fisheries
Research, 38 (1), 45-56.
MacNeil, C., Fielding, N. J., Dick, J. T. A., Briffa, M., Prenter, J., Hatcher, M. J. and
Dunn, A. M., 2003. An acanthocephalan parasite mediates intraguild
predation between invasive and native freshwater amphipods (Crustacea).
Freshwater Biology, 48 (12), 2085-2093.
Manchester, S. J. and Bullock, J. M., 2000. The impacts of non-native species on UK
biodiversity and the effectiveness of control. Journal of Applied Ecology, 37
(5), 845-864.
Marcogliese, D. J., 2001. Implications of climate change for parasitism of animals in
the aquatic environment. Canadian Journal of Zoology-Revue Canadienne
De Zoologie, 79 (8), 1331-1352.
Marcogliese D.J., 2007. Evolution of parasitic life in the ocean: paratenic hosts
enhance lateral incorporation. Trends in Parasitology, 23, 519-521.
Marcogliese, D. J. and Cone, D. K., 1997. Food webs: A plea for parasites. Trends in
Ecology & Evolution, 12 (8), 320-325.
Martinez, N. D., 1991. Artifacts or attributes – effects of resolution on the Little
Rock Lake food web. Ecological Monographs, 61 (4), 367-392.
McCutchan, J. H., Lewis, W. M., Kendall, C. and McGrath, C. C., 2005. Variation in
trophic shift for stable isotope ratios of carbon, nitrogen, and sulfur (vol 102,
pg 378, 2003). Oikos, 111 (2).
Medoc V., Rigaud T., Motreuil S., Perrot-Minnot M.-J. and Bollache L., 2011.
Paratenic hosts as regular transmission route in the acanthocephalan
214
Pomphorhynchus laevis: potential implications for food webs.
Naturwissenschaften, 98, 825-835.
Melia, P., Bevacqua, D., Crivelli, A. J., De Leo, G. A., Panfili, J. and Gatto, M.,
2006. Age and growth of Anguilla anguilla in the Camargue lagoons. Journal
of Fish Biology, 68 (3), 876-890.
Memmott, J., Martinez, N. D. and Cohen, J. E., 2000. Predators, parasitoids and
pathogens: species richness, trophic generality and body sizes in a natural
food web. Journal of Animal Ecology, 69 (1), 1-15.
Michalakis, Y. and Hochberg, M. E., 1994. Parasitic effects on host life history traits
– a review of recent studies. Parasite, 1, 291-294.
Milinski, M., 1984. Parasites determine a predators optimal feeding strategy.
Behavioral Ecology and Sociobiology, 15 (1), 35-37.
Milinski, M., 1985. Risk of predation of parasitized sticklebacks (Gasterosteus
aculeatus L.) under competition for food. Behaviour. 93, 203-216.
Mitchell, C. E. and Power, A. G., 2003. Release of invasive plants from fungal and
viral pathogens. Nature, 421 (6923), 625-627.
Miura, O., Kuris, A. M., Torchin, M. E., Hechinger, R. F. and Chiba, S., 2006.
Parasites alter host phenotype and may create a new ecological niche for snail
hosts. Proceedings of the Royal Society B-Biological Sciences, 273 (1592),
1323-1328.
Montero, F. E., Crespo, S., Padros, F., De la Gandara, F., Garcia, A. and Raga, J. A.,
2004. Effects of the gill parasite Zeuxapta seriolae (Monogenea :
Heteraxinidae) on the amberjack Seriola dumerili Risso (Teleostei :
Carangidae). Aquaculture, 232 (1-4), 153-163.
215
Montoya, J. M. and Sole, R. V., 2002. Small world patterns in food webs. Journal of
Theoretical Biology, 214 (3), 405-412.
Montoya, J. M., Pimm, S. L. and Sole, R. V., 2006. Ecological networks and their
fragility. Nature, 442 (7100), 259-264.
Moore, J. W. and Semmens, B. X., 2008. Incorporating uncertainty and prior
information into stable isotope mixing models. Ecology Letters, 11 (5), 470-
480.
Moore, S. L. and Wilson, K., 2002. Parasites as a viability cost of sexual selection in
natural populations of mammals. Science, 297 (5589), 2015-2018.
Morand, S., Robert, F. and Connors, V. A., 1995. Complexity in parasite life-cycles
– population biology of cestodes in fish. Journal of Animal Ecology, 64 (2),
256-264.
Moravec, F., Dicave, D., Orecchia, P. and Paggi, L., 1994. Experimental
observations on the development of Anguillicola crassus (Nematoda,
Dracunculoidea) in its definitive host, Anguilla anguilla (Pisces). Folia
Parasitologica, 41 (2), 138-148.
Moriarty, C., 1974. Studies of the eel Anguilla anguilla in Ireland. 3. In the Shannon
catchment. Irish Fisheries Investigations Series, A14 (1), 25.
Moriarty, C. and Dekker, W., 1997. Management of the European eel – enhancement
of the European eel fishery and conservation of the species. Fisheries
Bulletin (Dublin), 15.
Mouritsen, K. N. and Poulin, R., 2003. Parasite-induced trophic facilitation exploited
by a non-host predator: a manipulator's nightmare. International Journal for
Parasitology, 33 (10), 1043-1050.
216
Mouritsen, K. N. and Poulin, R., 2003. The risk of being at the top: foot-cropping in
the New Zealand cockle Austrovenus stutchburyi. Journal of the Marine
Biological Association of the United Kingdom, 83 (3), 497-498.
Nagasawa K., Kim Y.G. and Hirose H., 1994. Anguillicola crassus and A. globiceps
(Nematoda, Dracunculoidea) Parasitic in the swimbladder of eels (Anguilla
japonica and Anguilla anguilla) in east Asia – A review. Folia
Parasitologica, 41, 127-137.
Nie, P. and Kennedy, C. R., 1993. Infection dynamics of larval Bothriocephalus
claviceps in Cyclops vicinus. Parasitology, 106, 503-509.
Odum, E. P. and Barrett, G. W., 2005. Fundamentals of Ecology. 5th. Independence,
USA: Brooks/Cole.
Orsi, M. L. and Britton, J. R., 2012. Length-weight relationships of 15 fishes of the
Capivara Reservoir (Paranapanema basin, Brazil). Journal of Applied
Ichthyology, 28 (1), 146-147.
Öztürk, M. O. and Altunel, F. N. 2006. Occurrence of Dactylogyrus infection linked
to seasonal changes and host fish size on four cyprinid fishes in Lake
Manyas, Turkey. Acta Zoologica Academiae Scientiarum Hungaricae, 52,
407-415.
Pagan, I., Alonso-Blanco, C. and Garcia-arenal, F., 2008. Host responses in life-
history traits and tolerance to virus infection in Arabidopsis thaliana. Plos
Pathogens, 4.
Palstra, A. P., Heppener, D. F. M., van Ginneken, V. J. T., Szekely, C. and van den
Thillart, G. E. E. J. M., 2007. Swimming performance of silver eels is
severely impaired by the swim-bladder parasite Anguillicola crassus. Journal
of Experimental Marine Biology and Ecology, 352 (1), 244-256.
217
Pankhurst, N. W., 2011. The endocrinology of stress in fish: An environmental
perspective. General and Comparative Endocrinology, 170 (2), 265-275.
Parnell, A. C., Inger, R., Bearhop, S. and Jackson, A. L., 2010. Source Partitioning
Using Stable Isotopes: Coping with Too Much Variation. Plos One, 5 (3),
e9672.
Pauly, D. and Christensen, V., 1995. Priary production required to sustain global
fisheries. Nature, 374 (6519), 255-257.
Pedersen, A. B., Altizer, S., Poss, M., Cunningham, A. A. and Nunn, C. L., 2005.
Patterns of host specificity and transmission among parasites of wild
primates. International Journal for Parasitology, 35 (6), 647-657.
Peeler, E. J. and Thrush, M. A., 2004. Qualitative analysis of the risk of introducing
Gyrodactylus salaris into the United Kingdom. Diseases of Aquatic
Organisms, 62 (1-2), 103-113.
Peeler, E. J., Oidtmann, B. C., Midtlyng, P. J., Miossec, L. and Gozlan, R. E., 2011.
Non-native aquatic animals introductions have driven disease emergence in
Europe. Biological Invasions, 13 (6), 1291-1303.
Peirson, G., Tingley, D., Spurgeon, J. and Radford, A., 2001. Economic evaluation
of inland fisheries in England and Wales. Fisheries Management and
Ecology, 8 (4-5), 415-424.
Pelster, B., 2015. Swimbladder function and the spawning migration of the European
eel Anguilla anguilla. Frontiers in Physiology, 5, 486.
Petchey, O. L., Beckerman, A. P., Riede, J. O. and Warren, P. H., 2008a. Size,
foraging, and food web structure. Proceedings of the National Academy of
Sciences of the United States of America, 105 (11), 4191-4196.
218
Petchey, O. L., Eklof, A., Borrvall, C. and Ebenman, B., 2008b. Trophically unique
species are vulnerable to cascading extinction. American Naturalist, 171 (5),
568-579.
Peterson, B. J., Howarth, R. W. and Garritt, R. H., 1985. Multiple stable isotopes
used to trace the flow of organic matter in estuarine food webs. Science, 227
(4692), 1361-1363.
Phillips, D. L., Newsome, S. D. and Gregg, J. W., 2005. Combining sources in stable
isotope mixing models: alternative methods. Oecologia, 144 (4), 520-527.
Phillips, D. L., Inger, R., Bearhop, S., Jackson, A. L., Moore, J. W., Parnell, A. C.,
Semmens, B. X. and Ward, E. J., 2014. Best practices for use of stable
isotope mixing models in food-web studies. Canadian Journal of Zoology, 92
(10), 823-835.
Polis, G. A., Anderson, W. B. and Holt, R. D., 1997. Toward an integration of
landscape and food web ecology: The dynamics of spatially subsidized food
webs. Annual Review of Ecology and Systematics, 28, 289-316.
Poole, W. R. and Reynolds, J. D., 1996. Growth rate and age at migration of
Anguilla anguilla. Journal of Fish Biology, 48 (4), 633-642.Post D.M., 2002.
Using stable isotopes to estimate trophic position: Models, methods, and
assumptions. Ecology, 83, 703-718.
Post, D. M., 2002a. The long and short of food-chain length. Trends in Ecology &
Evolution, 17 (6), 269-277.
Post, D. M., 2002b. Using stable isotopes to estimate trophic position: Models,
methods, and assumptions. Ecology, 83 (3), 703-718.
Poulin, R., 1992. Determinants of host specificity in parasites of freshwater fishes.
International Journal for Parasitology, 22 (6), 753-758.
219
Poulin, R. and Thomas, F., 1999. Phenotypic variability induced by parasites: Extent
and evolutionary implications. Parasitology Today, 15, 28-32.
Poulin, R., Paterson, R. A., Townsend, C. R., Tompkins, D. M. and Kelly, D. W.,
2011. Biological invasions and the dynamics of endemic diseases in
freshwater ecosystems. Freshwater Biology, 56 (4), 676-688.
Power, A. G. and Mitchell, C. E., 2004. Pathogen spillover in disease epidemics.
American Naturalist, 164, S79-S89.
Power, M. E., 1990. Effects of fish in river food webs. Science, 250 (4982), 811-814.
Prenter, J., MacNeil, C., Dick, J. T. A. and Dunn, A. M., 2004a. Roles of parasites in
animal invasions. Trends in Ecology & Evolution, 19 (7), 385-390.
Prenter, J., MacNeil, C., Dick, J. T. A., Riddell, G. E. and Dunn, A. M., 2004b.
Lethal and sublethal toxicity of ammonia to native, invasive, and parasitised
freshwater amphipods. Water Research, 38 (12), 2847-2850.
Proman, J. M. and Reynolds, J. D., 2000. Differences in head shape of the European
eel, Anguilla anguilla (L.). Fisheries Management and Ecology, 7 (4), 349-
354.
Proulx, S. R., Promislow, D. E. L. and Phillips, P. C., 2005. Network thinking in
ecology and evolution. Trends in Ecology & Evolution, 20 (6), 345-353.
Quevedo, M., Svanback, R. and Eklov, P., 2009. Intrapopulation niche partitioning
in a generalist predator limits food web connectivity. Ecology, 90 (8), 2263-
2274.
R Development Core Team, 2013. R: A language and environment for statistical
computing. R Foundation for Statistical Computing, Vienna. ISBN 3-
900051-07-0, URL http://www.R-project.org/
220
Reid, P. C., Battle, E. J. V., Batten, S. D. and Brander, K. M., 2000. Impacts of
fisheries on plankton community structure. Ices Journal of Marine Science,
57 (3), 495-502.
Richardson, M. J. and Whoriskey, F. G., 1992. Factors influencing the production of
turbidity by goldfish (Carassius auratus). Canadian Journal of Zoology-
Revue Canadienne De Zoologie, 70 (8), 1585-1589.
Riggs, M. R., Lemly, A. D. and Esch, G. W., 1987. The growth, biomass, and
fecundity of Bothriocephalus acheilognathi in a North Carolina cooling
reservoir. Journal of Parasitology, 73, 893-900.
Robert F., Renaud F., Mathieu E. and Gabrion C., 1988. Importance of the paratenic
host in the biology of Bothriocephalus gregarius (Cestoda, Pseudophyllidea),
A parasite of the turbot. International Journal for Parasitology, 18, 611-621.
Rushton, S. P., Lurz, P. W. W., Gurnell, J., Nettleton, P., Bruemmer, C., Shirley, M.
D. F. and Sainsbury, A. W., 2006. Disease threats posed by alien species: the
role of a poxvirus in the decline of the native red squirrel in Britain.
Epidemiology and Infection, 134 (3), 521-533.
Salgado-Maldonado, G. and Pineda-López, R. F., 2003. The Asian fish tapeworm
Bothriocephalus acheilognathi: a potential threat to native freshwater fish
species in Mexico. Biological Invasions, 5, 261-268.
Schabuss, M., Kennedy, C. R., Konecny, R., Grillitsch, B., Reckendorfer, W.,
Schiemer, F. and Herzig, A., 2005. Dynamics and predicted decline of
Anguillicola crassus infection in European eels, Anguilla anguilla, in
Neusiedler See, Austria. Journal of Helminthology, 79 (2), 159-167.
Schalk, G. and Forbes, M. R., 1997. Male biases in parasitism of mammals: Effects
of study type, host age, and parasite taxon. Oikos, 78 (1), 67-74.
221
Schall, J. J., 1992. Parasite mediated competition in Anolis lizards. Oecologia, 92
(1), 58-64.
Schein, A., Courtenay, S. C., Crane, C. S., Teather, K. L. and van den Heuvel, M. R.,
2012. The Role of Submerged Aquatic Vegetation in Structuring the
Nearshore Fish Community Within an Estuary of the Southern Gulf of St.
Lawrence. Estuaries and Coasts, 35 (3), 799-810.
Scholz, T., Kutcha, R. and Williams, C., 2012. Bothriocephalus acheilognathi. In
Fish parasites: pathobiology and protection (eds. Woo, P. T. K., and
Buchmann, K.), pp. 282 - 297. CAB International, London.
Schuwerack, P. M. M., Lewis, J. W. and Jones, P. W., 2001. Pathological and
physiological changes in the South African freshwater crab Potamonautes
warreni calman induced by microbial gill infestations. Journal of
Invertebrate Pathology, 77 (4), 269-279.
Scott, D. P., 1962. Effect of food quality on fecundity of rainbow trout, Salmo
gairdneri. Journal of the Fisheries Research Board of Canada, 19, 715-731.
Scott, A. L. and Grizzle, J. M., 1979. Pathology of cyprinid fishes caused by
Bothriocephalus gowkongensis Yea, 1955 (Cestoda, pseudophyllidea).
Journal of Fish Diseases, 2 (1), 69-73.
Semmens, B. X., Ward, E. J., Moore, J. W. and Darimont, C. T., 2009. Quantifying
Inter- and Intra-Population Niche Variability Using Hierarchical Bayesian
Stable Isotope Mixing Models. Plos One, 4 (7).
Sheath, D. J., Williams, C. F., Reading, A. J. and Britton, J. R., 2015. Parasites of
non-native freshwater fishes introduced into England and Wales suggest
enemy release and parasite acquisition. Biological Invasions, 17 (8), 2235-
2246.
222
Sih, A., Bolnick, D. I., Luttbeg, B., Orrock, J. L., Peacor, S. D., Pintor, L. M.,
Preisser, E., Rehage, J. S. and Vonesh, J. R., 2010. Predator-prey naivete,
antipredator behavior, and the ecology of predator invasions. Oikos, 119 (4),
610-621.
Simberloff, D., 2009. We can eliminate invasions or live with them. Successful
management projects. Biological Invasions, 11 (1), 149-157.
Sirois, P. and Dodson, J. J., 2000. Influence of turbidity, food density and parasites
on the ingestion and growth of larval rainbow smelt Osmerus mordax in an
estuarine turbidity maximum. Marine Ecology Progress Series, 193, 167-
179.
Smith, T. B. and Skulason, S., 1996. Evolutionary significance of resource
polymorphisms in fishes, amphibians, and birds. Annual Review of Ecology
and Systematics, 27, 111-133.
Smith, V. H., Tilman, G. D. and Nekola, J. C., 1999. Eutrophication: impacts of
excess nutrient inputs on freshwater, marine, and terrestrial ecosystems.
Environmental Pollution, 100 (1-3), 179-196.
Sorci, G., Morand, S. and Hugot, J. P., 1997. Host-parasite coevolution:
Comparative evidence for covariation of life history traits in primates and
oxyurid parasites. Proceedings of the Royal Society B-Biological Sciences,
264, 285-289.
Srinivasan, U. T., Dunne, J. A., Harte, J. and Martinez, N. D., 2007. Response of
complex food webs to realistic extinction sequences. Ecology, 88 (3), 671-
682.
Stephens, D. W. and Krebs, J. R., 1986. Monographs in Behavior and Ecology:
Foraging Theory. Princeton University Press.
223
Stock, B. C. and Semmens, B. X., 2013. MixSIAR GUI User Manual, version 1.0.
http://conserver.iugo-cafe.org/user/brice.semmens/MixSIAR.
Strayer, D. L., Hattala, K. A., Kahnle, A. W. and Adams, R. D., 2014. Has the
Hudson River fish community recovered from the zebra mussel invasion
along with its forage base? Canadian Journal of Fisheries and Aquatic
Sciences, 71 (8), 1146-1157.
Sures, B., 2008. Host-parasite interactions in polluted environments. Journal of Fish
Biology, 73 (9), 2133-2142.
Sures, B. and Siddall, R., 1999. Pomphorhynchus laevis: The intestinal
acanthocephalan as a lead sink for its fish host, chub (Leuciscus cephalus).
Experimental Parasitology, 93 (2), 66-72.
Sures, B. and Streit, B., 2001. Eel parasite diversity and intermediate host abundance
in the River Rhine, Germany. Parasitology, 123, 185-191.
Svanback, R. and Persson, L., 2004. Individual diet specialization, niche width and
population dynamics: implications for trophic polymorphisms. Journal of
Animal Ecology, 73 (5), 973-982.
Svanback, R. and Bolnick, D. I., 2007. Intraspecific competition drives increased
resource use diversity within a natural population. Proceedings of the Royal
Society B-Biological Sciences, 274 (1611), 839-844.
Szekely, C., 1994. Paratenic hosts for the parasitic nematode Anguillicola crassus in
Lake Balaton, Hungary. Diseases of Aquatic Organisms, 18 (1), 11-20.
Székely, C., Palstra, A., Molnár, K. and van den Thillart, G., 2009. Impact of the
swim-bladder parasite on the health and performance of European eels.
Spawning migration of the European eel. Netherlands: Springer, 201-226.
224
Taraschewski, H., 2006. Hosts and parasites as aliens. Journal of Helminthology, 80
(2), 99-128.
Tesch, F. W., 1977. The Eel: Biology and Management of Anguillid Eels. Chapman
and Hall, London.
Tesch, F. W., 2003. The Eel. 5th Edition. Oxford, Blackwell.
Thomas, K. and Ollevier, F., 1992. Paratenic hosts of the parasitic nematode
Anguillicola crassus. Diseases of Aquatic Organisms, 13 (3), 165-174.
Thomas, F., Poulin, R., Guegan, J. F., Michalakis, Y. and Renaud, F., 2000. Are
there pros as well as cons to being parasitized? Parasitology Today, 16 (12),
533-536.
Thompson, R. M. and Townsend, C. R., 2005. Energy availability, spatial
heterogeneity and ecosystem size predict food-web structure in streams.
Oikos, 108 (1), 137-148.
Thompson, R. M., Mouritsen, K. N. and Poulin, R., 2005. Importance of parasites
and their life cycle characteristics in determining the structure of a large
marine food web. Journal of Animal Ecology, 74 (1), 77-85.
Thompson, R. M., Brose, U., Dunne, J. A., Hall, R. O., Jr., Hladyz, S., Kitching, R.
L., Martinez, N. D., Rantala, H., Romanuk, T. N., Stouffer, D. B. and
Tylianakis, J. M., 2012. Food webs: reconciling the structure and function of
biodiversity. Trends in Ecology & Evolution, 27 (12), 689-697.
Thompson, S. N. and Kavaliers, M., 1994. Physiological bases for parasite induced
alterations of host behavior. Parasitology, 109, 119-138.
Thorarensen, H., Gallaugher, P. E., Kiessling, A. K. and Farrell, A. P., 1993.
Intestinal blood flow in swimming chinook salmon Oncorhynchus
225
tshawytscha and the effects of hematocrit on blood flow distribution. Journal
of Experimental Biology, 179, 115-129.
Tompkins, D. M., Sainsbury, A. W., Nettleton, P., Buxton, D. and Gurnell, J., 2002.
Parapoxvirus causes a deleterious disease in red squirrels associated with UK
population declines. Proceedings of the Royal Society B-Biological Sciences,
269 (1490), 529-533.
Torchin, M. E., Lafferty, K. D. and Kuris, A. M., 2001. Release from parasites as
natural enemies: Increased performance of a globally introduced marine crab.
Biological Invasions, 3 (4), 333-345.
Torchin, M. E., Lafferty, K. D., Dobson, A. P., McKenzie, V. J. and Kuris, A. M.,
2003. Introduced species and their missing parasites. Nature, 421 (6923),
628-630.
Torchin, M. E., Byers, J. E. and Huspeni, T. C., 2005. Differential parasitism of
native and introduced snails: Replacement of a parasite fauna. Biological
Invasions, 7 (6), 885-894.
Trebilcol, R., Baum, J. K., Salomon, A. K. and Dulvy, N. K., 2013. Ecosystem
ecology: size-based constraints on the pyramids of life. Trends in Ecology &
Evolution, 28 (7), 423-431.
Vadeboncoeur, Y., Vander Zanden, M. J. and Lodge, D. M., 2002. Putting the lake
back together: Reintegrating benthic pathways into lake food web models.
Bioscience, 52 (1), 44-54.
Valtonen, E. T., Holmes, J. C. and Koskivaara, M., 1997. Eutrophication, pollution,
and fragmentation: Effects on parasite communities in roach (Rutilus rutilus)
and perch (Perca fluviatilis) in four lakes in central Finland. Canadian
Journal of Fisheries and Aquatic Sciences, 54 (3), 572-585.

226
Van Valen, L., 1965. Morphological variation and width of ecological niche.
American Naturalist, 377-390.
Vander Zanden, M. J., Cabana, G. and Rasmussen, J. B., 1997. Comparing trophic
position of freshwater fish calculated using stable nitrogen isotope ratios
(delta N-15) and literature dietary data. Canadian Journal of Fisheries and
Aquatic Sciences, 54 (5), 1142-1158.
Viljoen, H., Bennett, N. C., Ueckermann, E. A. and Lutermann, H., 2011. The Role
of Host Traits, Season and Group Size on Parasite Burdens in a Cooperative
Mammal. Plos One, 6 (11).
Vitousek, P. M., Dantonio, C. M., Loope, L. L. and Westbrooks, R., 1996.
Biological invasions as global environmental change. American Scientist, 84
(5), 468-478.
Ward, A. J. W., Hoare, D. J., Couzin, I. D., Broom, M. and Krause, J., 2002. The
effects of parasitism and body length on positioning within wild fish shoals.
Journal of Animal Ecology, 71 (1), 10-14.
Ward, D. L., 2007. Removal and quantification of Asian tapeworm from bonytail
chub using praziquantel. North American Journal of Aquaculture, 69 (3),
207-210.
Warnes, G. R., Bolker, B., Gorjanc, G., Grothendieck, G., Korosec, G., Lumley, T.,
MacQueen, D., Magnusson, A. and Rogers, J., 2015. Package gdata: Various
R Programming Tools for Data Manipulation.
Warren, P. H., 1994. Making connections in food webs. Trends in Ecology &
Evolution, 9 (4), 136-141.
Williams, C. F., 2007. Impact assessment of non-native parasites in freshwater
fisheries in England and Wales. (PhD). University of Stirling.
227
Williams, C. F., Poddubnaya, L. G., Scholz, T., Turnbull, J. F. and Ferguson, H. W.,
2011. Histopathological and ultrastructural studies of the tapeworm
Monobothrium wageneri (Caryophyllidea) in the intestinal tract of tench
Tinca tinca. Diseases of Aquatic Organisms, 97, 143-154.
Williams, C. F., Britton, J. R. and Turnbull, J. F., 2013. A risk assessment for
managing non-native parasites. Biological Invasions, 15 (6), 1273-1286.
Williams, D. D. and Feltmate, B. W., 1992. Aquatic insects. CAB international.
Wallingford
Williams, R. J. and Martinez, N. D., 2000. Simple rules yield complex food webs.
Nature, 404 (6774), 180-183.
Williams, R. J., Berlow, E. L., Dunne, J. A., Barabasi, A. L. and Martinez, N. D.,
2002. Two degrees of separation in complex food webs. Proceedings of the
National Academy of Sciences of the United States of America, 99 (20),
12913-12916.
Winfield, I. J., Fletcher, J. M. and Ben James, J., 2012. Long-term changes in the
diet of pike (Esox lucius), the top aquatic predator in a changing Windermere.
Freshwater Biology, 57 (2), 373-383.
Wood, C. L., Byers, J. E., Cottingham, K. L., Altman, I., Donahue, M. J. and
Blakeslee, A. M. H., 2007. Parasites alter community structure. Proceedings
of the National Academy of Sciences of the United States of America, 104
(22), 9335-9339.
Woodward, G., Ebenman, B., Emmerson, M., Montoya, J. M., Olesen, J. M., Valido,
A. and Warren, P. H., 2005. Body size in ecological networks. Trends in
Ecology & Evolution, 20 (7), 402-409.
228
Wuertz, J., Knopf, K. and Taraschewski, H., 1998. Distribution and prevalence of
Anguillicola crassus (Nematoda) in eels Anguilla Anguilla of the rivers Rhine
and Naab, Germany. Diseases of Aquatic Organisms, 32 (2), 137-143.
Xiang-Hua, L., 2007. Diversity of the Asiatic tapeworm Bothriocephalus
acheilognathi parasitizing common carp and grass carp in China. Current
Zoology, 53, 470-480.
i
Zambrano, L., Martinez-Meyer, E., Menezes, N. and Peterson, A. T., 2006. Invasive
potential of common carp (Cyprinus carpio) and Nile tilapia (Oreochromis
niloticus) in American freshwater systems. Canadian Journal of Fisheries
and Aquatic Sciences, 63 (9), 1903-1910.
Zhang, J. and Guo, L., 2010. Scaling behaviors of weighted food webs as energy
transportation networks. Journal of Theoretical Biology, 264 (3), 760-770.
ii
Appendix 1. Post-mortem examination methodology
Adapted from:
Hoole, D., Bucke, D., Burgess, P. and Wellby, I., 2001. Diseases of carp and other
cyprinid fishes. Oxford: Fishing News Books.
Detailed internal examination
The skin and body wall musculature is cut away to reveal the internal organs. The
first incision is made parallel to the operculum from just dorsal to the lateral line, to
below the pectoral fin-joint and round to the mid-line of the fish. Holding the
pectoral fin with forceps, a second incision is made along the midline of the fish to a
point between the opercula. Pulling the pectoral fin up and away from the body
exposes the pericardial cavity and the heart.
Heart removal and examination
The heart is removed using forceps just in front of the bulbus arteriosus, and pulling
the whole heart gently out of the pericardial cavity. The heart is then placed on a
petri dish with phosphate buffered saline (PBS) and examined under a low power
dissecting microscope. The organ is then cut longitudinally to reveal the interior; this
procedure is done at x10 magnification.
After removal of the heart a ventrolateral opening in the body of the fish is made by
using blunt ended scissors from the top of the first incision along the flank just
ventral to the lateral line, curving the cut ventrally to the vent. Remove the resulting
flap from the fish, making sure that all internal organs remain intact. To gain access
to the kidneys in cyprinids, the swimbladder is gently removed.
iii
Visceral organs
The spleen, liver and kidney are examined in situ, and any discolouration,
haemorrhaging, tumours, abnormalities, parasites etc., noted. Small pieces of each
organ (approximately 2mm size) are taken, placed on slide with a small amount of
saline, squashed using the coverslip and examined under a compound phase contrast
microscope at x100 and x400 magnification.
Intestine
The gastro-intestinal tract should be carefully removed from the body cavity, noting
any discoloration, haemorrhaging, fluid retention, necrosis, tumours, fat deposition,
etc. The intestine is opened using a longitudinal cut and examined in PBS under a
low power microscope, noting the contents and any abnormalities and parasites.
Gills
Gills are removed intact, by cutting each end of the branchial arches separately, and
their general appearance and any abnormalities, e.g. Necrosis clubbing or
haemorrhaging, noted. Examination of the gills is carried out in PBS under a low
power dissection microscope, teasing out the connective tissue between the gill
filaments and examining for parasites. Squashes of gill tissue are made from a
number of filaments and examined at magnification x100 and x400 in phase contrast,
for parasites.
Eyes and nasal cavity
Following a general external examination of the eye in which any abnormalities, e.g.
lens opacity, are noted, the organ is removed by slipping a pair of curved forceps
iv
under the eyeball, and cutting the connective tissue below and around it. The lens
and humour of the eye are examined in a petri dish containing PBS under a low
power light microscope, taking care not to damage the lens during removal.
Following removal of the nasal flaps, a brief examination of the nasal cavity can be
made under low power dissection microscope, and any abnormalities and parasites
noted.
Brain
A transverse cut is made vertically into the head of the fish, dorsal to the top of the
operculum. The brain, which is located posterior-dorsally to the eyes, can be
removed intact and examined for any obvious signs of disease, e.g. tumours,
haemorrhaging and necrosis.
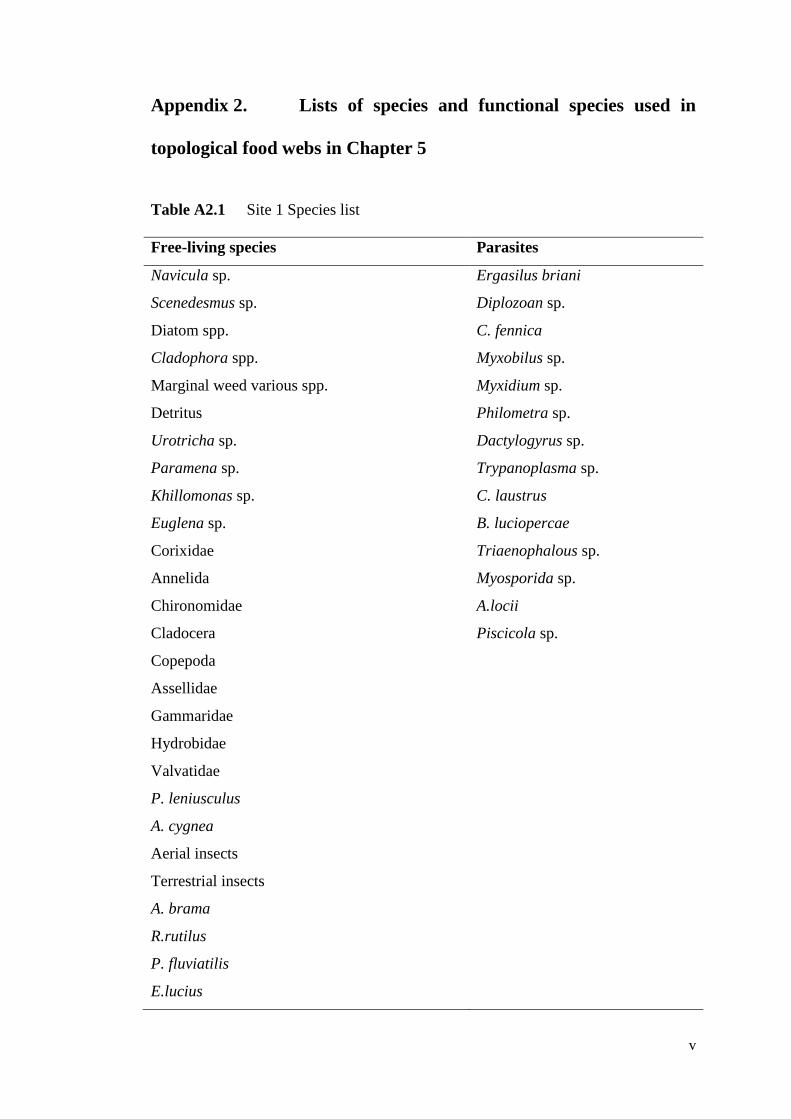
v
Appendix 2. Lists of species and functional species used in
topological food webs in Chapter 5
Table A2.1 Site 1 Species list
Free-living species Parasites
Navicula sp. Ergasilus briani
Scenedesmus sp. Diplozoan sp.
Diatom spp. C. fennica
Cladophora spp. Myxobilus sp.
Marginal weed various spp. Myxidium sp.
Detritus Philometra sp.
Urotricha sp. Dactylogyrus sp.
Paramena sp. Trypanoplasma sp.
Khillomonas sp. C. laustrus
Euglena sp. B. luciopercae
Corixidae Triaenophalous sp.
Annelida Myosporida sp.
Chironomidae A.locii
Cladocera Piscicola sp.
Copepoda
Assellidae
Gammaridae
Hydrobidae
Valvatidae
P. leniusculus
A. cygnea
Aerial insects
Terrestrial insects
A. brama
R.rutilus
P. fluviatilis
E.lucius
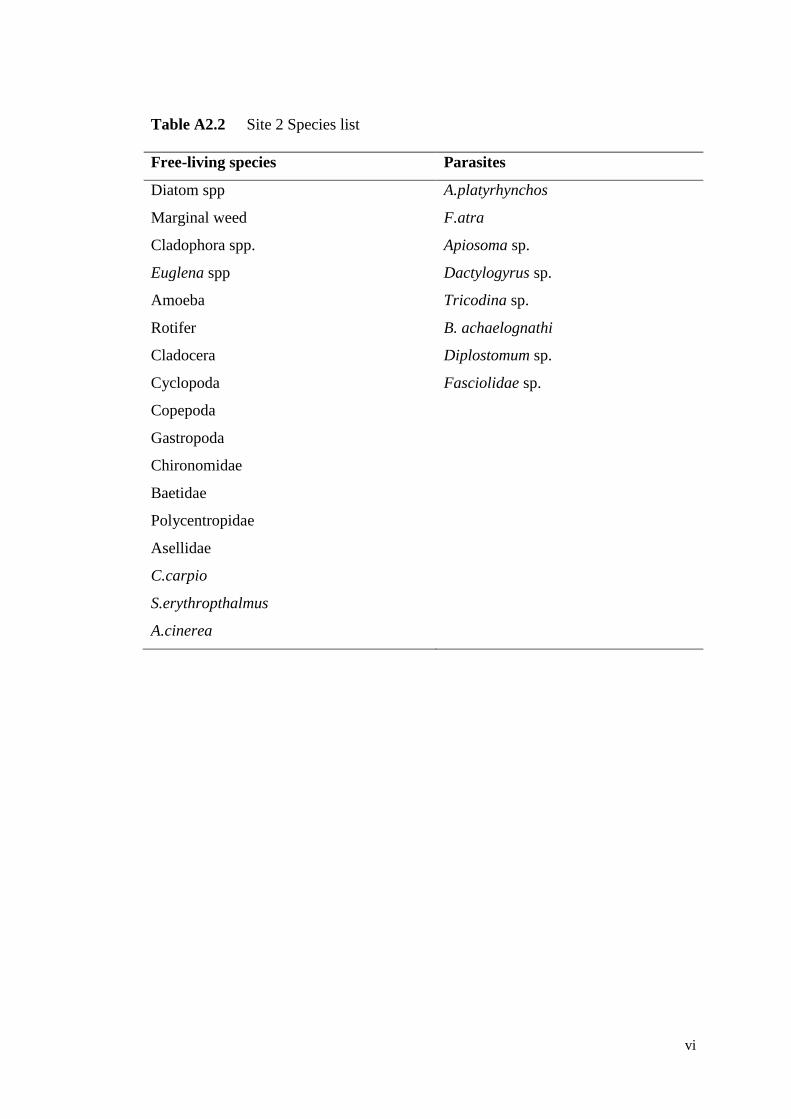
vi
Table A2.2 Site 2 Species list
Free-living species Parasites
Diatom spp A.platyrhynchos
Marginal weed F.atra
Cladophora spp. Apiosoma sp.
Euglena spp Dactylogyrus sp.
Amoeba Tricodina sp.
Rotifer B. achaelognathi
Cladocera Diplostomum sp.
Cyclopoda Fasciolidae sp.
Copepoda
Gastropoda
Chironomidae
Baetidae
Polycentropidae
Asellidae
C.carpio
S.erythropthalmus
A.cinerea
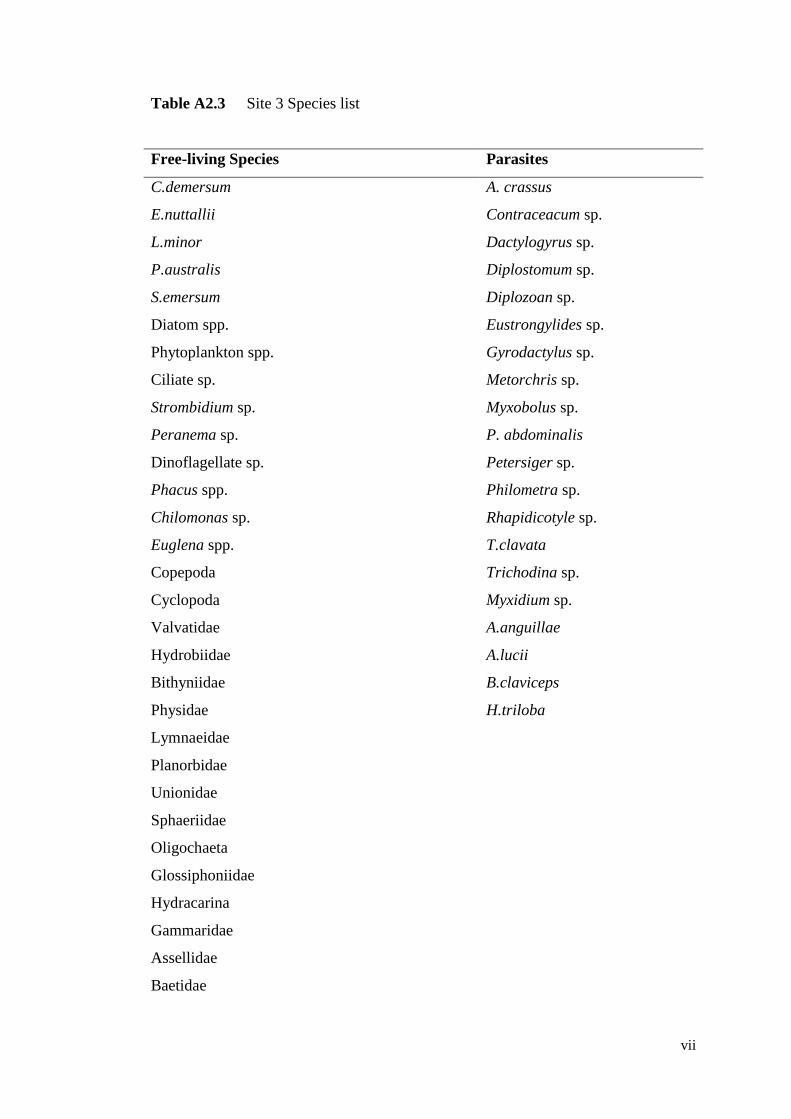
vii
Table A2.3 Site 3 Species list
Free-living Species Parasites
C.demersum A. crassus
E.nuttallii Contraceacum sp.
L.minor Dactylogyrus sp.
P.australis Diplostomum sp.
S.emersum Diplozoan sp.
Diatom spp. Eustrongylides sp.
Phytoplankton spp. Gyrodactylus sp.
Ciliate sp. Metorchris sp.
Strombidium sp. Myxobolus sp.
Peranema sp. P. abdominalis
Dinoflagellate sp. Petersiger sp.
Phacus spp. Philometra sp.
Chilomonas sp. Rhapidicotyle sp.
Euglena spp. T.clavata
Copepoda Trichodina sp.
Cyclopoda Myxidium sp.
Valvatidae A.anguillae
Hydrobiidae A.lucii
Bithyniidae B.claviceps
Physidae H.triloba
Lymnaeidae
Planorbidae
Unionidae
Sphaeriidae
Oligochaeta
Glossiphoniidae
Hydracarina
Gammaridae
Assellidae
Baetidae
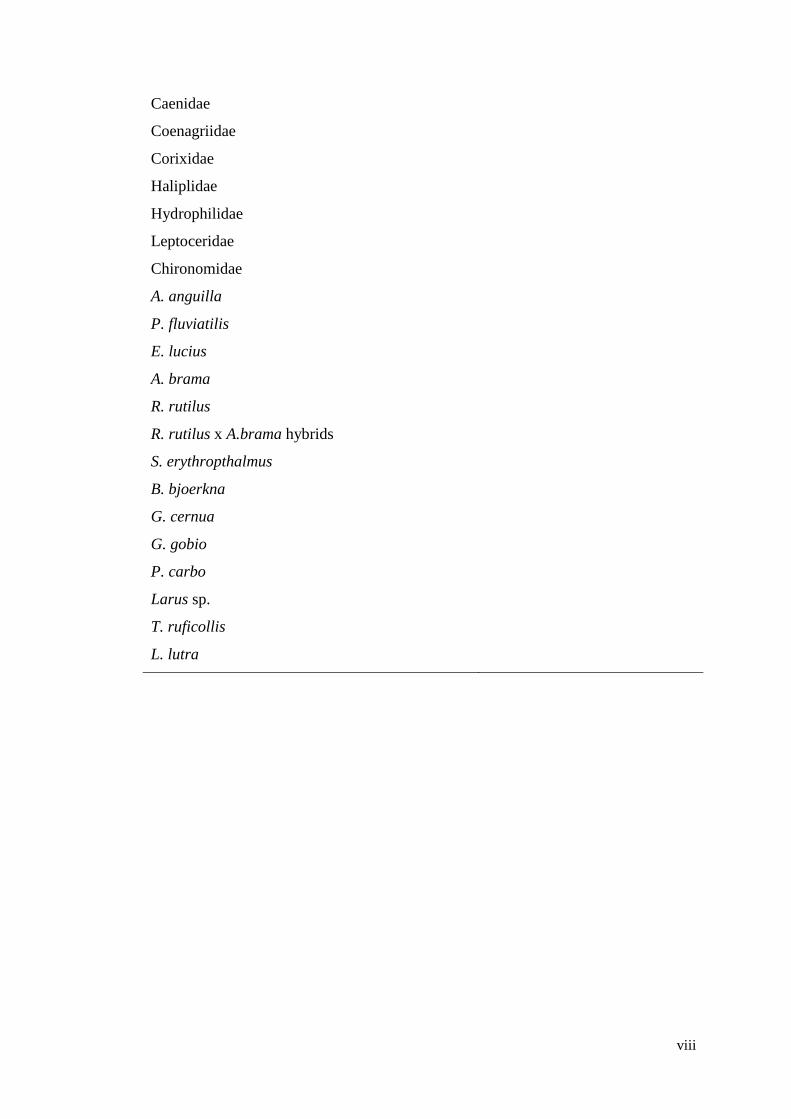
viii
Caenidae
Coenagriidae
Corixidae
Haliplidae
Hydrophilidae
Leptoceridae
Chironomidae
A. anguilla
P. fluviatilis
E. lucius
A. brama
R. rutilus
R. rutilus x A.brama hybrids
S. erythropthalmus
B. bjoerkna
G. cernua
G. gobio
P. carbo
Larus sp.
T. ruficollis
L. lutra
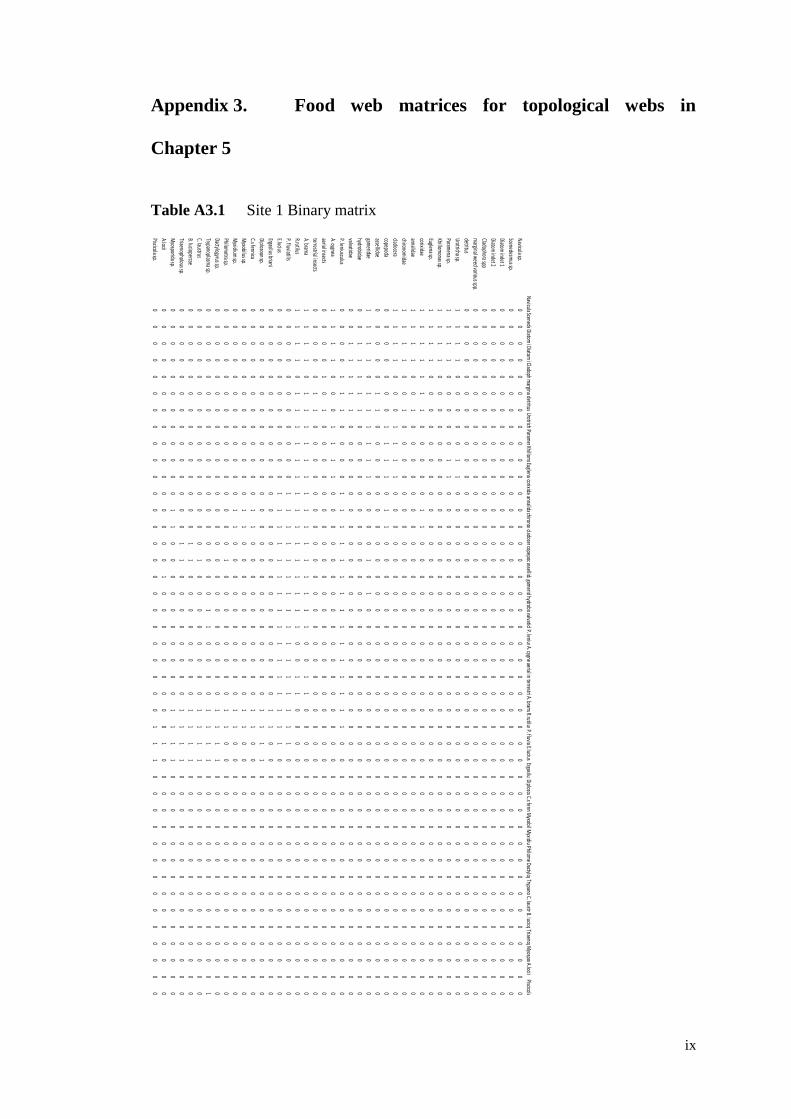
ix
Appendix 3. Food web matrices for topological webs in
Chapter 5
Table A3.1 Site 1 Binary matrix
Navicula sp.Scenedesm
us sp.Diatom
indet 1Diatom
indet 2Cladophora spp
marginal w
eed various spp.detritus
Urotricha sp.Param
ena sp.Khillom
onas sp.Euglena sp.
corixidaeannalidaechironomidae
cladoceracopepodaassellidaegameridaehydrobidaevalvatidaeP. leniusculus
A. cygneaaerial insectsterrestrial insects
A. bramaR.rutilusP. fluviatilis
E.luciusErgasilus briani
Diplozoan sp.C.s fennicaMyxobilus sp.
Myxidium
sp.Philom
etra sp.Dactylogyrus sp.
Trypanoplasma sp.
C. laustrus B. luciopercaeTriaenophalous sp.
Myosporida sp.
A.lociiPiscicola sp.
Navicula sp.0
00
00
00
00
00
00
00
00
00
00
00
00
00
00
00
00
00
00
00
00
0
Scenedesmus sp.
00
00
00
00
00
00
00
00
00
00
00
00
00
00
00
00
00
00
00
00
00
Diatom indet 1
00
00
00
00
00
00
00
00
00
00
00
00
00
00
00
00
00
00
00
00
00
Diatom indet 2
00
00
00
00
00
00
00
00
00
00
00
00
00
00
00
00
00
00
00
00
00
Cladophora spp0
00
00
00
00
00
00
00
00
00
00
00
00
00
00
00
00
00
00
00
00
0
marginal w
eed various spp.0
00
00
00
00
00
00
00
00
00
00
00
00
00
00
00
00
00
00
00
00
0
detritus0
00
00
00
00
00
00
00
00
00
00
00
00
00
00
00
00
00
00
00
00
0
Urotricha sp.1
11
10
00
00
11
00
00
00
00
00
00
00
00
00
00
00
00
00
00
00
0
Paramena sp.
11
11
00
00
01
10
00
00
00
00
00
00
00
00
00
00
00
00
00
00
00
Khillomonas sp.
11
11
00
00
00
00
00
00
00
00
00
00
00
00
00
00
00
00
00
00
00
Euglena sp.1
11
10
00
00
00
00
00
00
00
00
00
00
00
00
00
00
00
00
00
00
0
corixidae1
11
11
11
00
00
01
10
00
00
00
00
00
00
00
00
00
00
00
00
00
0
annalidae1
11
10
01
00
00
00
00
00
00
00
00
00
00
00
00
00
00
00
00
00
0
chironomidae
11
11
00
10
00
00
00
00
00
00
00
00
00
00
00
00
00
00
00
00
00
cladocera1
11
10
00
11
11
00
00
00
00
00
00
00
00
00
00
00
00
00
00
00
0
copepoda0
00
00
00
11
11
01
10
00
00
00
00
00
00
00
00
00
00
00
00
00
0
assellidae0
00
00
11
00
00
00
00
00
00
00
00
00
00
00
00
00
00
00
00
00
0
gameridae
11
11
01
11
11
10
00
01
01
00
00
00
00
00
00
00
00
00
00
00
00
hydrobidae0
01
11
11
00
00
00
00
00
00
00
00
00
00
00
00
00
00
00
00
00
0
valvatidae0
01
11
11
00
00
00
00
00
00
00
00
00
00
00
00
00
00
00
00
00
0
P. leniusculus0
00
01
11
00
00
11
11
11
11
11
11
11
10
00
00
00
00
00
00
00
0
A. cygnea1
11
10
00
11
11
00
00
00
00
00
00
00
00
00
00
00
00
00
00
00
0
aerial insects0
00
01
01
00
00
00
00
00
00
00
00
00
00
00
00
00
00
00
00
00
0
terrestrial insects0
00
00
11
00
00
00
00
00
00
00
00
00
00
00
00
00
00
00
00
00
0
A. brama
11
11
01
11
11
11
11
11
11
11
00
11
00
00
00
00
00
00
00
00
00
R.rutilus1
11
10
11
11
11
11
11
11
11
10
01
10
00
00
00
00
00
00
00
00
0
P. fluviatilis0
00
00
00
00
00
11
11
11
11
11
11
11
11
00
00
00
00
00
00
00
0
E.lucius0
00
00
00
00
00
11
11
11
11
11
11
11
11
00
00
00
00
00
00
00
0
Ergasilus briani0
00
00
00
00
00
00
00
00
00
00
00
01
10
00
00
00
00
00
00
00
0
Diplozoan sp.0
00
00
00
00
00
00
00
00
00
00
00
01
11
10
00
00
00
00
00
00
0
C.s fennica0
00
00
00
00
00
01
10
00
00
00
00
01
10
00
00
00
00
00
00
00
0
Myxobilus sp.
00
00
00
00
00
00
11
00
00
00
00
00
11
00
00
00
00
00
00
00
00
Myxidium
sp.0
00
00
00
00
00
01
10
00
00
00
00
01
10
00
00
00
00
00
00
00
0
Philometra sp.
00
00
00
00
00
00
00
01
00
00
00
00
11
00
00
00
00
00
00
00
00
Dactylogyrus sp.0
00
00
00
00
00
00
00
00
00
00
00
01
11
10
00
00
00
00
00
00
0
Trypanoplasma sp.
00
00
00
00
00
00
00
00
00
11
00
00
11
11
00
00
00
00
00
00
01
C. laustrus 0
00
00
00
00
00
00
00
10
00
00
00
01
11
10
00
00
00
00
00
00
0
B. luciopercae0
00
00
00
00
00
00
01
10
00
00
00
01
11
10
00
00
00
00
00
00
0
Triaenophalous sp.0
00
00
00
00
00
00
01
10
00
00
00
01
11
10
00
00
00
00
00
00
0
Myosporida sp.
00
00
00
00
00
00
11
00
00
00
00
00
11
11
00
00
00
00
00
00
00
A.locii0
00
00
00
00
00
00
00
01
00
00
00
00
01
00
00
00
00
00
00
00
0
Piscicola sp.0
00
00
00
00
00
00
00
00
00
00
00
00
11
10
00
00
00
00
00
00
0
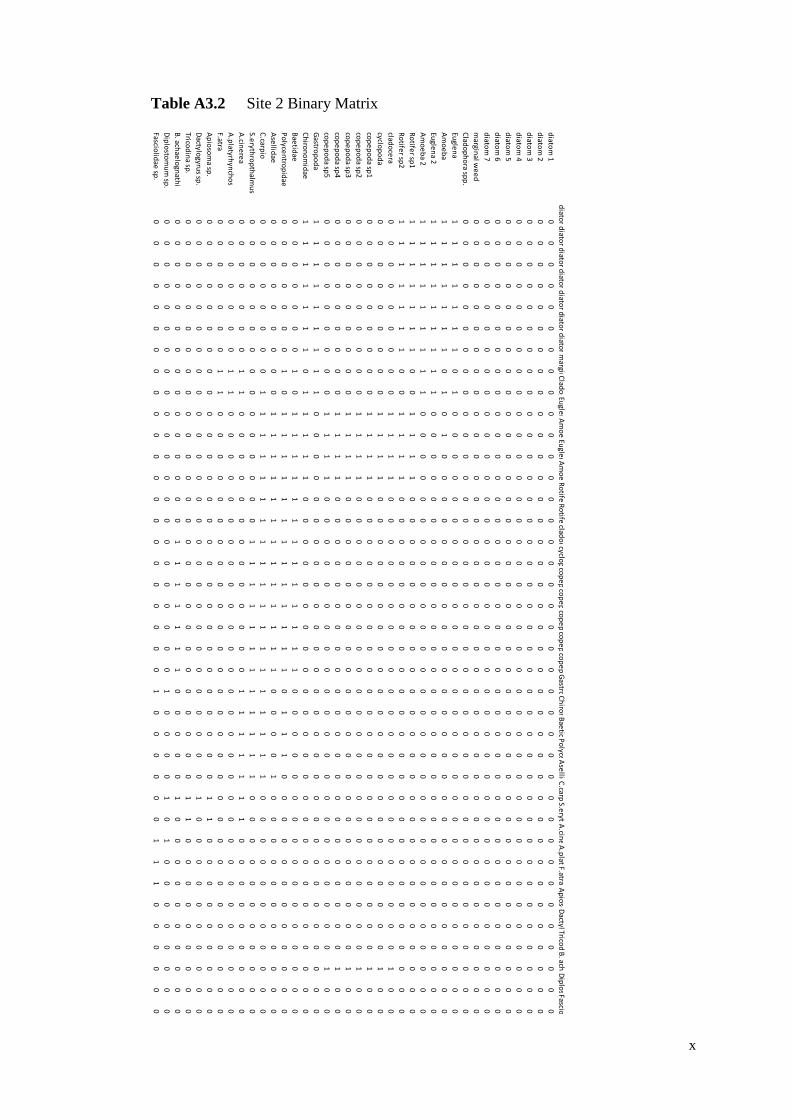
x
Table A3.2 Site 2 Binary Matrix
diato
m 1diato
m 2diato
m 3diato
m 4diato
m 5diato
m 6diato
m 7margin
al we
ed
Clad
op
ho
ra spp
.Eu
glen
aAmo
eb
aEugle
na 2A
mo
eb
a 2R
otife
r sp1
Ro
tifer sp
2clad
oce
racyclo
po
da
cop
ep
od
a sp1
cop
ep
od
a sp2
cop
ep
od
a sp3
cop
ep
od
a sp4
cop
ep
od
a sp5
Gastro
po
da
Ch
iron
om
idae
Bae
tidaePo
lycen
trop
idae
Ase
llidaeC
.carpioS.e
rythro
pth
almu
s A
.cine
rea
A.p
latyrhyn
cho
sF.atra
Ap
ioso
ma sp
.D
actylogyru
s sp.
Tricod
ina sp
.B
. achae
logn
athi
Dip
losto
mu
m sp
.Fascio
lidae
sp.
diato
m 1
00
00
00
00
00
00
00
00
00
00
00
00
00
00
00
00
00
00
00
diato
m 2
00
00
00
00
00
00
00
00
00
00
00
00
00
00
00
00
00
00
00
diato
m 3
00
00
00
00
00
00
00
00
00
00
00
00
00
00
00
00
00
00
00
diato
m 4
00
00
00
00
00
00
00
00
00
00
00
00
00
00
00
00
00
00
00
diato
m 5
00
00
00
00
00
00
00
00
00
00
00
00
00
00
00
00
00
00
00
diato
m 6
00
00
00
00
00
00
00
00
00
00
00
00
00
00
00
00
00
00
00
diato
m 7
00
00
00
00
00
00
00
00
00
00
00
00
00
00
00
00
00
00
00
margin
al we
ed
00
00
00
00
00
00
00
00
00
00
00
00
00
00
00
00
00
00
00
Clad
op
ho
ra spp
.0
00
00
00
00
00
00
00
00
00
00
00
00
00
00
00
00
00
00
0
Eugle
na
11
11
11
10
10
00
00
00
00
00
00
00
00
00
00
00
00
00
00
Am
oe
ba
11
11
11
10
10
10
00
00
00
00
00
00
00
00
00
00
00
00
00
Eugle
na 2
11
11
11
11
10
00
00
00
00
00
00
00
00
00
00
00
00
00
00
Am
oe
ba 2
11
11
11
11
10
00
00
00
00
00
00
00
00
00
00
00
00
00
00
Ro
tifer sp
11
11
11
11
00
11
11
00
00
00
00
00
00
00
00
00
00
00
00
0
Ro
tifer sp
21
11
11
11
00
11
11
00
00
00
00
00
00
00
00
00
00
00
00
0
clado
cera
00
00
00
00
01
11
10
00
00
00
00
00
00
00
00
00
00
01
00
cyclop
od
a0
00
00
00
00
11
11
00
00
00
00
00
00
00
00
00
00
00
10
0
cop
ep
od
a sp1
00
00
00
00
01
11
10
00
00
00
00
00
00
00
00
00
00
01
00
cop
ep
od
a sp2
00
00
00
00
01
11
10
00
00
00
00
00
00
00
00
00
00
01
00
cop
ep
od
a sp3
00
00
00
00
01
11
10
00
00
00
00
00
00
00
00
00
00
01
00
cop
ep
od
a sp4
00
00
00
00
01
11
10
00
00
00
00
00
00
00
00
00
00
01
00
cop
ep
od
a sp5
00
00
00
00
01
11
10
00
00
00
00
00
00
00
00
00
00
01
00
Gastro
po
da
11
11
11
11
10
00
00
00
00
00
00
00
00
00
00
00
00
00
00
Ch
iron
om
idae
11
11
11
10
11
11
10
00
00
00
00
00
00
00
00
00
00
00
00
Bae
tidae
00
00
00
01
01
11
11
11
11
11
11
00
00
00
00
00
00
00
00
Po
lycen
trop
idae
00
00
00
01
01
11
11
11
11
11
11
01
11
00
00
00
00
00
00
Ase
llidae
00
00
00
00
01
11
11
11
11
11
11
00
00
10
00
00
00
00
00
C.carp
io0
00
00
00
01
11
11
11
11
11
11
11
11
11
00
00
00
00
00
0
S.eryth
rop
thalm
us
00
00
00
00
00
00
00
01
11
11
11
11
11
10
00
00
00
00
00
A.cin
ere
a0
00
00
00
11
00
00
00
00
00
00
01
11
11
11
00
00
00
00
0
A.p
latyrhyn
cho
s0
00
00
00
11
00
00
00
00
00
00
00
00
00
00
00
00
00
00
0
F.atra0
00
00
00
11
00
00
00
00
00
00
00
00
00
00
00
00
00
00
0
Ap
ioso
ma sp
.0
00
00
00
00
00
00
00
00
00
00
00
00
00
11
00
00
00
00
0
Dactylo
gyrus sp
.0
00
00
00
00
00
00
00
00
00
00
00
00
00
10
00
00
00
00
0
Tricod
ina sp
.0
00
00
00
00
00
00
00
00
00
00
00
00
00
11
00
00
00
00
0
B. ach
aelo
gnath
i0
00
00
00
00
00
00
00
11
11
11
10
00
00
10
00
00
00
00
0
Dip
losto
mu
m sp
.0
00
00
00
00
00
00
00
00
00
00
01
00
00
10
10
00
00
00
0
Fasciolid
ae sp
. 0
00
00
00
00
00
00
00
00
00
00
01
00
00
00
11
10
00
00
0
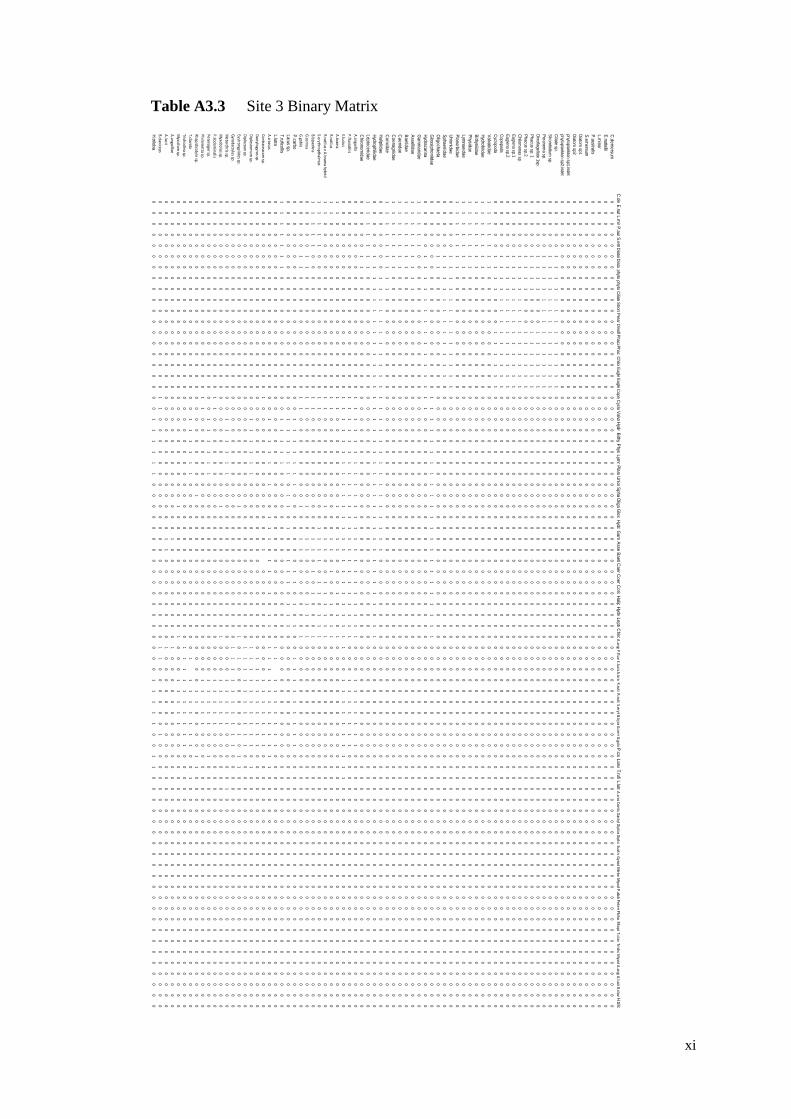
xi
Table A3.3 Site 3 Binary Matrix
C.d
em
ersum
E.nutta
lliiL
.mino
rP.austra
lisS
.em
ersum
Dia
tom
sp1
Dia
tom
sp2
phyto
pla
nkto
n s
p1.in
det
phyto
pla
nkto
n s
p2.in
det
Cilia
te s
p.
Stro
mbid
ium
sp.
Pera
nem
a s
p.
Din
ofla
gella
te 1
sp.
Phacus s
p. 1
Phacus s
p.2
Chilo
monas s
p.
Eugle
na s
p.1
Eugle
na s
p.2
Copepoda
Cyc
lopoda
Va
lvatid
ae
Hyd
rob
iida
eB
ithyniida
eP
hysida
eL
ymna
eid
ae
Pla
norb
ida
eU
nionid
ae
Sp
hae
riida
eO
ligo
chae
taG
lossip
honiid
ae
Hyd
raca
rinaG
am
ma
rida
eA
ssellid
ae
Ba
etid
ae
Ca
enid
ae
Co
ena
griid
ae
Co
rixida
eH
alip
lida
eH
ydro
philid
ae
Le
pto
cerid
ae
Chiro
nom
ida
eA
.anguillaP.fluviatilis
E.luciusA.bramaR.rutilusR.rutilus x A
.brama hybrid
S.erythropthalmus
B.bjoerknaG
.cernuaG.gobioP.ca
rboLa
rus sp.
T.rufico
llisL
.lutraA.crassus
Contraceacum sp.
Dactylogyrus sp.
Diplostom
um sp.
Diplozoan sp.
Eustrongylides sp.G
yrodactylus sp.M
etorchris sp.M
yxobolus sp.P.abdom
inalis Petersiger sp.
Philometra sp.
Rhapidicotyle sp.T.clavataTrichodina sp.
Myxidium
sp.A
.anguillaeA
.luciiB.clavicepsH
.trilob
a
C.d
em
ersum
00
00
00
00
00
00
00
00
00
00
00
00
00
00
00
00
00
00
00
00
00
00
00
00
00
00
00
00
00
00
00
00
00
00
00
00
00
0
E.nutta
llii0
00
00
00
00
00
00
00
00
00
00
00
00
00
00
00
00
00
00
00
00
00
00
00
00
00
00
00
00
00
00
00
00
00
00
00
00
00
L.m
inor
00
00
00
00
00
00
00
00
00
00
00
00
00
00
00
00
00
00
00
00
00
00
00
00
00
00
00
00
00
00
00
00
00
00
00
00
00
0
P.a
ustralis
00
00
00
00
00
00
00
00
00
00
00
00
00
00
00
00
00
00
00
00
00
00
00
00
00
00
00
00
00
00
00
00
00
00
00
00
00
0
S.e
me
rsum0
00
00
00
00
00
00
00
00
00
00
00
00
00
00
00
00
00
00
00
00
00
00
00
00
00
00
00
00
00
00
00
00
00
00
00
00
00
Dia
tom
sp1
00
00
00
00
00
00
00
00
00
00
00
00
00
00
00
00
00
00
00
00
00
00
00
00
00
00
00
00
00
00
00
00
00
00
00
00
00
0
Dia
tom
sp2
00
00
00
00
00
00
00
00
00
00
00
00
00
00
00
00
00
00
00
00
00
00
00
00
00
00
00
00
00
00
00
00
00
00
00
00
00
0
phyto
pla
nkto
n s
p1.in
det
00
00
00
00
00
00
00
00
00
00
00
00
00
00
00
00
00
00
00
00
00
00
00
00
00
00
00
00
00
00
00
00
00
00
00
00
00
0
phyto
pla
nkto
n s
p2.in
det
00
00
00
00
00
00
00
00
00
00
00
00
00
00
00
00
00
00
00
00
00
00
00
00
00
00
00
00
00
00
00
00
00
00
00
00
00
0
Cilia
te s
p.
00
00
01
11
11
11
11
11
11
00
00
00
00
00
00
00
00
00
00
00
00
00
00
00
00
00
00
00
00
00
00
00
00
00
00
00
00
0
Stro
mbid
ium
sp.
00
00
01
11
11
11
11
11
11
00
00
00
00
00
00
00
00
00
00
00
00
00
00
00
00
00
00
00
00
00
00
00
00
00
00
00
00
0
Pera
nem
a s
p.
00
00
01
11
11
11
11
11
11
00
00
00
00
00
00
00
00
00
00
00
00
00
00
00
00
00
00
00
00
00
00
00
00
00
00
00
00
0
Din
ofla
gella
te 1
sp.
00
00
01
11
10
00
11
11
11
00
00
00
00
00
00
00
00
00
00
00
00
00
00
00
00
00
00
00
00
00
00
00
00
00
00
00
00
0
Phacus s
p. 1
00
00
01
11
10
00
11
11
11
00
00
00
00
00
00
00
00
00
00
00
00
00
00
00
00
00
00
00
00
00
00
00
00
00
00
00
00
0
Phacus s
p.2
00
00
01
11
10
00
11
11
11
00
00
00
00
00
00
00
00
00
00
00
00
00
00
00
00
00
00
00
00
00
00
00
00
00
00
00
00
0
Chilo
monas s
p.
00
00
01
11
11
11
11
11
11
00
00
00
00
00
00
00
00
00
00
00
00
00
00
00
00
00
00
00
00
00
00
00
00
00
00
00
00
0
Eugle
na s
p.1
00
00
01
11
11
11
11
11
11
00
00
00
00
00
00
00
00
00
00
00
00
00
00
00
00
00
00
00
00
00
00
00
00
00
00
00
00
0
Eugle
na s
p.2
00
00
01
11
11
11
11
11
11
00
00
00
00
00
00
00
00
00
00
00
00
00
00
00
00
00
00
00
00
00
00
00
00
00
00
00
00
0
Copepoda
00
00
01
11
11
11
11
11
11
00
00
00
00
00
00
00
00
00
00
00
00
00
00
00
00
00
00
00
00
00
00
00
00
00
00
00
00
0
Cyc
lopoda
00
00
01
11
10
00
11
11
11
00
00
00
00
00
00
00
00
00
00
00
00
00
00
00
00
00
00
00
00
00
00
00
00
00
00
00
00
0
Va
lvatid
ae
11
11
11
10
00
00
00
00
00
00
00
00
00
00
00
00
00
00
00
00
00
00
00
00
00
00
00
00
00
00
00
00
00
00
00
00
00
0
Hyd
rob
iida
e1
11
11
11
00
00
00
00
00
00
00
00
00
00
00
00
00
00
00
00
00
00
00
00
00
00
00
00
00
00
00
00
00
00
00
00
00
00
Bithyniid
ae
11
11
11
10
00
00
00
00
00
00
00
00
00
00
00
00
00
00
00
00
00
00
00
00
00
00
00
00
00
00
00
00
00
00
00
00
00
0
Physid
ae
11
11
11
10
00
00
00
00
00
00
00
00
00
00
00
00
00
00
00
00
00
00
00
00
00
00
00
00
00
00
00
00
00
00
00
00
00
0
Lym
nae
ida
e1
11
11
11
00
00
00
00
00
00
00
00
00
00
00
00
00
00
00
00
00
00
00
00
00
00
00
00
00
00
00
00
00
00
00
00
00
00
Pla
norb
ida
e1
11
11
11
00
00
00
00
00
00
00
00
00
00
00
00
00
00
00
00
00
00
00
00
00
00
00
00
00
00
00
00
00
00
00
00
00
00
Unio
nida
e0
00
00
11
11
11
11
11
11
10
00
00
00
00
00
00
00
00
00
00
00
00
00
00
00
00
00
00
00
00
00
00
00
00
00
00
00
00
Sp
hae
riida
e0
00
00
11
11
11
11
11
11
00
00
00
00
00
00
00
00
00
00
00
00
00
00
00
00
00
00
00
00
00
00
00
00
00
00
00
00
00
Olig
ocha
eta
00
00
01
10
00
00
00
00
00
00
00
00
00
00
00
00
00
00
00
00
00
00
00
00
00
00
00
00
00
00
00
00
00
00
00
00
00
0
Glo
ssipho
niida
e0
00
00
00
00
00
00
00
00
01
11
11
11
11
11
11
11
11
11
11
11
00
00
00
00
00
00
00
00
00
00
00
00
00
00
00
00
00
Hyd
raca
rina0
00
00
11
11
11
11
11
11
11
10
00
00
00
00
00
00
00
00
00
00
00
00
00
00
00
00
00
00
00
00
00
00
00
00
00
00
00
Ga
mm
arid
ae
11
11
10
00
00
00
00
00
00
00
00
00
00
00
00
00
00
00
00
00
00
00
00
00
00
00
00
00
00
00
00
00
00
00
00
00
00
0
Asse
llida
e1
11
11
11
11
00
00
00
00
00
00
00
00
00
00
00
00
00
00
00
00
00
00
00
00
00
00
00
00
00
00
00
00
00
00
00
00
00
Ba
etid
ae
11
11
11
10
00
00
00
00
00
00
00
00
00
00
00
00
00
00
00
00
00
00
00
00
00
00
00
00
00
00
00
00
00
00
00
00
00
0
Ca
enid
ae
11
11
11
10
00
00
00
00
00
00
00
00
00
00
00
00
00
00
00
00
00
00
00
00
00
00
00
00
00
00
00
00
00
00
00
00
00
0
Co
ena
griid
ae
11
11
11
10
00
00
00
00
00
00
00
00
00
00
00
00
00
00
00
00
00
00
00
00
00
00
00
00
00
00
00
00
00
00
00
00
00
0
Co
rixida
e1
11
11
11
11
00
00
00
00
00
00
00
00
00
00
00
00
00
00
00
00
00
00
00
00
00
00
00
00
00
00
00
00
00
00
00
00
00
Ha
liplid
ae
00
00
00
01
11
11
11
11
11
11
11
11
11
11
11
11
10
00
00
00
00
00
00
00
00
00
00
00
00
00
00
00
00
00
00
00
00
0
Hyd
rop
hilida
e0
00
00
11
11
11
11
11
11
11
11
11
11
11
11
11
11
11
11
10
11
00
00
00
00
00
00
00
00
00
00
00
00
00
00
00
00
00
Le
pto
cerid
ae
11
11
11
10
00
00
00
00
00
00
00
00
00
00
00
00
00
00
00
00
00
00
00
00
00
00
00
00
00
00
00
00
00
00
00
00
00
0
Chiro
nom
ida
e0
00
00
11
00
00
00
00
00
00
00
00
00
00
00
00
00
00
00
00
00
00
00
00
00
00
00
00
00
00
00
00
00
00
00
00
00
00
A.anguilla
00
00
00
00
00
00
00
00
00
11
11
11
11
11
11
11
11
11
11
11
10
00
11
11
11
10
00
00
00
00
00
00
00
00
00
00
00
0
P.fluviatilis0
00
00
00
00
00
00
00
00
01
11
11
11
11
11
11
11
11
11
11
11
00
01
11
11
11
00
00
00
00
00
00
00
00
00
00
00
00
E.lucius0
00
00
00
00
00
00
00
00
01
11
11
11
11
11
11
11
11
11
11
11
10
01
11
11
11
11
10
00
00
00
00
00
00
00
00
00
00
A.bram
a1
10
00
00
00
00
00
00
00
01
10
00
00
00
01
00
11
00
01
01
01
00
00
00
00
00
00
00
00
00
00
00
00
00
00
00
00
00
R.rutilus1
10
00
00
00
00
00
00
00
01
10
00
00
00
00
00
11
01
00
10
11
00
00
00
00
00
00
00
00
00
00
00
00
00
00
00
00
00
R.rutilus x A.bram
a hybrid1
10
00
00
00
00
00
00
00
01
10
00
00
00
01
00
11
00
11
11
11
00
00
00
00
00
00
00
00
00
00
00
00
00
00
00
00
00
S.erythropthalmus
11
11
10
00
00
00
00
00
00
11
00
00
00
00
00
11
11
01
10
11
10
00
00
00
00
00
00
00
00
00
00
00
00
00
00
00
00
0
B.bjoerkna1
11
11
00
00
00
00
00
00
01
10
00
00
00
00
00
11
01
01
00
01
00
00
00
00
00
00
00
00
00
00
00
00
00
00
00
00
00
G.cernua
00
00
01
10
00
00
00
00
00
11
00
00
00
00
10
01
10
00
01
10
10
00
00
00
00
00
00
00
00
00
00
00
00
00
00
00
00
0
G.gobio
00
00
01
10
00
00
00
00
00
11
00
00
00
00
10
01
10
00
00
00
10
00
00
00
00
00
00
00
00
00
00
00
00
00
00
00
00
0
P.ca
rbo
00
00
00
00
00
00
00
00
00
00
11
11
11
10
00
00
00
11
01
01
00
11
11
11
11
10
00
00
00
00
00
00
00
00
00
00
00
0
La
rus sp.
00
00
00
00
00
00
00
00
00
00
11
11
11
01
10
10
01
11
01
11
00
00
00
00
00
00
00
00
00
00
00
00
00
00
00
00
00
0
T.rufico
llis1
11
11
11
00
00
00
00
00
00
01
11
11
00
00
00
00
00
00
00
00
00
00
00
00
00
00
00
00
00
00
00
00
00
00
00
00
00
L.lutra
00
00
00
00
00
00
00
00
00
00
00
00
00
00
00
00
00
00
00
00
01
11
11
11
11
00
00
00
00
00
00
00
00
00
00
00
00
A.crassus
00
00
00
00
00
00
00
00
00
00
10
11
10
10
01
11
01
10
10
11
01
11
11
11
11
11
10
00
00
00
00
00
00
00
00
00
00
0
Contraceacum sp.
00
00
00
00
00
00
00
00
00
10
00
00
00
00
00
00
10
00
00
00
00
01
11
11
11
00
00
00
00
00
00
00
00
00
00
00
00
Dactylogyrus sp.
00
00
00
00
00
00
00
00
00
00
00
00
00
00
00
00
00
00
00
00
00
11
11
11
11
10
00
00
00
00
00
00
00
00
00
00
00
0
Diplostom
um sp.
00
00
00
00
00
00
00
00
00
00
11
11
11
00
00
00
00
00
00
00
01
11
11
11
11
10
10
00
00
00
00
00
00
00
00
00
00
0
Diplozoan sp.
00
00
00
00
00
00
00
00
00
00
00
00
00
00
00
00
00
00
00
00
01
11
11
11
11
10
00
00
00
00
00
00
00
00
00
00
00
0
Eustrongylides sp.0
00
00
00
00
00
00
00
00
00
00
00
00
00
01
00
00
00
00
00
01
01
00
00
00
10
11
00
00
00
00
00
00
00
00
00
00
00
Gyrodactylus sp.
00
00
00
00
00
00
00
00
00
00
00
00
00
00
00
00
00
00
00
00
01
11
11
11
11
10
00
00
00
00
00
00
00
00
00
00
00
0
Metorchris sp.
00
00
00
00
00
00
00
00
00
00
11
11
11
00
00
00
00
00
00
00
00
00
11
11
10
00
00
10
00
00
00
00
00
00
00
00
00
0
Myxobolus sp.
00
00
00
00
00
00
00
00
00
00
00
00
00
00
10
00
00
00
00
00
10
00
11
11
10
00
00
00
00
00
00
00
00
00
00
00
00
0
P.abdominalis
00
00
00
00
00
00
00
00
00
11
00
00
00
00
00
00
00
00
00
00
00
00
11
11
10
00
00
00
00
00
00
00
00
00
00
00
00
0
Petersiger sp.0
00
00
00
00
00
00
00
00
00
01
11
11
10
00
00
00
00
00
00
00
00
01
11
11
00
10
00
00
00
00
00
00
00
00
00
00
00
Philometra sp.
00
00
00
00
00
00
00
00
00
11
00
00
00
00
00
00
00
00
00
00
00
00
11
11
10
00
00
00
00
00
00
00
00
00
00
00
00
0
Rhapidicotyle sp.0
00
00
00
00
00
00
00
00
00
00
00
00
00
10
00
00
00
00
00
00
00
00
11
00
00
11
00
00
00
00
00
00
00
00
00
00
00
T.clavata0
00
00
00
00
00
00
00
00
00
01
11
11
10
00
00
00
00
00
00
00
01
11
11
11
10
01
00
00
00
00
00
00
00
00
00
00
0
Trichodina sp.0
00
00
00
00
00
00
00
00
00
00
00
00
00
00
00
00
00
00
00
00
11
11
11
11
11
00
00
00
00
00
00
00
00
00
00
00
00
Myxidium
sp.0
00
00
00
00
00
00
00
00
00
00
00
00
00
01
00
00
00
00
00
01
00
01
11
11
00
00
00
00
00
00
00
00
00
00
00
00
00
A.anguillae
00
00
00
00
00
00
00
00
00
00
00
00
00
00
00
01
00
00
00
00
01
00
00
00
00
00
00
00
00
00
00
00
00
00
00
00
00
0
A.lucii
00
00
00
00
00
00
00
00
00
00
00
00
00
00
00
01
10
00
00
00
01
00
00
00
00
00
00
00
00
00
00
00
00
00
00
00
00
0
B.claviceps0
00
00
00
00
00
00
00
00
01
10
00
00
00
00
00
00
00
00
00
00
11
00
00
00
10
00
00
00
00
00
00
00
00
00
00
00
00
H.trilo
ba
0
00
00
00
00
00
00
00
00
00
01
11
11
10
00
00
00
00
00
00
00
00
01
11
11
00
11
00
00
00
00
00
00
00
00
00
00
00
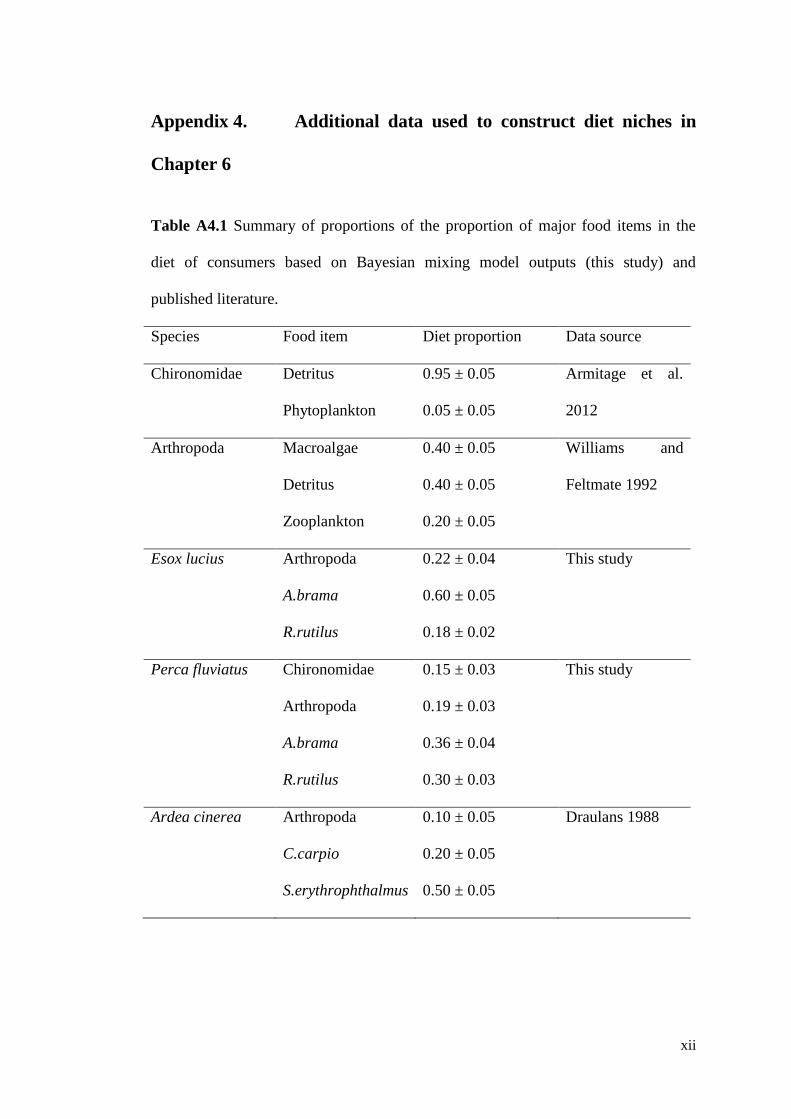
xii
Appendix 4. Additional data used to construct diet niches in
Chapter 6
Table A4.1 Summary of proportions of the proportion of major food items in the
diet of consumers based on Bayesian mixing model outputs (this study) and
published literature.
Species Food item Diet proportion Data source
Chironomidae Detritus 0.95 ± 0.05 Armitage et al.
2012 Phytoplankton 0.05 ± 0.05
Arthropoda Macroalgae 0.40 ± 0.05 Williams and
Feltmate 1992
Detritus 0.40 ± 0.05
Zooplankton 0.20 ± 0.05
Esox lucius Arthropoda 0.22 ± 0.04 This study
A.brama 0.60 ± 0.05
R.rutilus 0.18 ± 0.02
Perca fluviatus Chironomidae 0.15 ± 0.03 This study
Arthropoda 0.19 ± 0.03
A.brama 0.36 ± 0.04
R.rutilus 0.30 ± 0.03
Ardea cinerea Arthropoda 0.10 ± 0.05 Draulans 1988
C.carpio 0.20 ± 0.05
S.erythrophthalmus 0.50 ± 0.05
xiii
Appendix 5. Weighted start matrices used in Chapter 6
Table A5.1 Site 1: Weighted matrices
Infection: uninfected Low 95% confidence interval low High 95% confidence interval
macroalgae detritus phytoplanktonzooplanktonchironomidaearthropodaA.brama R.rutilus E.lucius P.fluviatus macroalgae detritus phytoplanktonzooplanktonchironomidaearthropodaA.brama R.rutilus E.lucius P.fluviatus
macroalgae 0 0 0 0 0 0 0 0 0 0 macroalgae and detritus 0 0 0 0 0 0 0 0 0 0
phytoplankton 0 0 0 0 0 0 0 0 0 0 phytoplankton 0 0 0 0 0 0 0 0 0 0
detritus 0 0 0 0 0 0 0 0 0 0 detritus 0 0 0 0 0 0 0 0 0 0
zooplankton 0 0 100 0 0 0 0 0 0 0 zooplankton 0 0 100 0 0 0 0 0 0 0
chironomidae 0 85 -5 0 0 0 0 0 0 0 chironomidae 0 105 15 0 0 0 0 0 0 0
arthropoda 30 30 0 10 0 0 0 0 0 0 arthropoda 50 50 0 30 0 0 0 0 0 0
A.brama 0 0 0 -12 18 24 0 0 0 0 A.brama 0 0 0 42 72 56 0 0 0 0
R.rutilus 0 0 0 -34 1 53 0 0 0 0 R.rutilus 0 0 0 40 75 65 0 0 0 0
E.lucius 0 0 0 0 0 12 50 8 0 0 E.lucius 0 0 0 0 0 32 70 28 0 0
P.fluviatus 0 0 0 0 5 9 26 20 0 0 P.fluviatus 0 0 0 0 25 29 46 40 0 0
Infection: 25%
macroalgae detritus phytoplanktonzooplanktonchironomidaearthropodaA.brama R.rutilus E.lucius P.fluviatus macroalgae detritus phytoplanktonzooplanktonchironomidaearthropodaA.brama R.rutilus E.lucius P.fluviatus
macroalgae and detritus 0 0 0 0 0 0 0 0 0 0 macroalgae and detritus 0 0 0 0 0 0 0 0 0 0
phytoplankton 0 0 0 0 0 0 0 0 0 0 phytoplankton 0 0 0 0 0 0 0 0 0 0
detritus 0 0 0 0 0 0 0 0 0 0 detritus 0 0 0 0 0 0 0 0 0 0
zooplankton 0 0 100 0 0 0 0 0 0 0 zooplankton 0 0 100 0 0 0 0 0 0 0
chironomidae 0 85 -5 0 0 0 0 0 0 0 chironomidae 0 95 5 0 0 0 0 0 0 0
arthropoda 30 30 0 20 0 0 0 0 0 0 arthropoda 40 40 0 20 0 0 0 0 0 0
A.brama 0 0 0 -13 19 23 0 0 0 0 A.brama 0 0 0 22 53 43 0 0 0 0
R.rutilus 0 0 0 -34 6 48 0 0 0 0 R.rutilus 0 0 0 12 52 56 0 0 0 0
E.lucius 0 0 0 0 0 12 50 8 0 0 E.lucius 0 0 0 0 0 22 60 18 0 0
P.fluviatus 0 0 0 0 5 9 26 20 0 0 P.fluviatus 0 0 0 0 15 19 36 30 0 0
Infection: 50%
macroalgae detritus phytoplanktonzooplanktonchironomidaearthropodaA.brama R.rutilus E.lucius P.fluviatus macroalgae detritus phytoplanktonzooplanktonchironomidaearthropodaA.brama R.rutilus E.lucius P.fluviatus
macroalgae and detritus 0 0 0 0 0 0 0 0 0 0 macroalgae and detritus 0 0 0 0 0 0 0 0 0 0
phytoplankton 0 0 0 0 0 0 0 0 0 0 phytoplankton 0 0 0 0 0 0 0 0 0 0
detritus 0 0 0 0 0 0 0 0 0 0 detritus 0 0 0 0 0 0 0 0 0 0
zooplankton 0 0 100 0 0 0 0 0 0 0 zooplankton 0 0 100 0 0 0 0 0 0 0
chironomidae 0 85 -5 0 0 0 0 0 0 0 chironomidae 0 95 5 0 0 0 0 0 0 0
arthropoda 30 30 0 20 0 0 0 0 0 0 arthropoda 40 40 0 20 0 0 0 0 0 0
A.brama 0 0 0 -13 19 23 0 0 0 0 A.brama 0 0 0 1 34 30 0 0 0 0
R.rutilus 0 0 0 -34 6 48 0 0 0 0 R.rutilus 0 0 0 -16 29 47 0 0 0 0
E.lucius 0 0 0 0 0 12 50 8 0 0 E.lucius 0 0 0 0 0 22 60 18 0 0
P.fluviatus 0 0 0 0 5 9 26 20 0 0 P.fluviatus 0 0 0 0 15 19 36 30 0 0
Infection: 75%
macroalgae detritus phytoplanktonzooplanktonchironomidaearthropodaA.brama R.rutilus E.lucius P.fluviatus macroalgae detritus phytoplanktonzooplanktonchironomidaearthropodaA.brama R.rutilus E.lucius P.fluviatus
macroalgae and detritus 0 0 0 0 0 0 0 0 0 0 macroalgae and detritus 0 0 0 0 0 0 0 0 0 0
phytoplankton 0 0 0 0 0 0 0 0 0 0 phytoplankton 0 0 0 0 0 0 0 0 0 0
detritus 0 0 0 0 0 0 0 0 0 0 detritus 0 0 0 0 0 0 0 0 0 0
zooplankton 0 0 100 0 0 0 0 0 0 0 zooplankton 0 0 100 0 0 0 0 0 0 0
chironomidae 0 85 -5 0 0 0 0 0 0 0 chironomidae 0 95 5 0 0 0 0 0 0 0
arthropoda 30 30 0 20 0 0 0 0 0 0 arthropoda 40 40 0 20 0 0 0 0 0 0
A.brama 0 0 0 -13 19 23 0 0 0 0 A.brama 0 0 0 -20 16 16 0 0 0 0
R.rutilus 0 0 0 -34 6 48 0 0 0 0 R.rutilus 0 0 0 -44 6 37 0 0 0 0
E.lucius 0 0 0 0 0 12 50 8 0 0 E.lucius 0 0 0 0 0 22 60 18 0 0
P.fluviatus 0 0 0 0 5 9 26 20 0 0 P.fluviatus 0 0 0 0 15 19 36 30 0 0
Infection: 100%
macroalgae detritus phytoplanktonzooplanktonchironomidaearthropodaA.brama R.rutilus E.lucius P.fluviatus macroalgae detritus phytoplanktonzooplanktonchironomidaearthropodaA.brama R.rutilus E.lucius P.fluviatus
macroalgae and detritus 0 0 0 0 0 0 0 0 0 0 macroalgae and detritus 0 0 0 0 0 0 0 0 0 0
phytoplankton 0 0 0 0 0 0 0 0 0 0 phytoplankton 0 0 0 0 0 0 0 0 0 0
detritus 0 0 0 0 0 0 0 0 0 0 detritus 0 0 0 0 0 0 0 0 0 0
zooplankton 0 0 100 0 0 0 0 0 0 0 zooplankton 0 0 100 0 0 0 0 0 0 0
chironomidae 0 85 -5 0 0 0 0 0 0 0 chironomidae 0 75 -15 0 0 0 0 0 0 0
arthropoda 30 30 0 10 0 0 0 0 0 0 arthropoda 20 20 0 0 0 0 0 0 0 0
A.brama 0 0 0 -13 24 19 0 0 0 0 A.brama 0 0 0 -41 -4 4 0 0 0 0
R.rutilus 0 0 0 -34 20 34 0 0 0 0 R.rutilus 0 0 0 -71 -17 28 0 0 0 0
E.lucius 0 0 0 0 0 12 50 8 0 0 E.lucius 0 0 0 0 0 2 40 -2 0 0
P.fluviatus 0 0 0 0 5 9 26 20 0 0 P.fluviatus 0 0 0 0 -5 -1 16 10 0 0
xiv
Table A5.2 Site 2: Weighted matrices
Infection: Uninfected Low 95% confidence interval High 95%confidence interval
macroalgae detritus phytoplanktonzooplanktonarthropodaC.carpio S.erythrophthalmusA.cinerea macroalgae detritus phytoplanktonzooplanktonarthropodaC.carpio S.erythrophthalmusA.cinerea
macroalgae 0 0 0 0 0 0 0 0 macroalgae 0 0 0 0 0 0 0 0
detritus 0 0 0 0 0 0 0 0 detritus 0 0 0 0 0 0 0 0
phytoplankton 0 0 0 0 0 0 0 0 phytoplankton 0 0 0 0 0 0 0 0
zooplankton 0 0 100 0 0 0 0 0 zooplankton 0 0 100 0 0 0 0 0
arthropoda 30 30 0 20 0 0 0 0 arthropoda 50 50 0 30 0 0 0 0
C.carpio 0 0 15 21 42 0 0 0 C.carpio 0 0 27 37 58 0 0 0
S.erythrophthalmus8 0 0 13 35 0 0 0 S.erythrophthalmus30 0 22 35 57 0 0 0
A.cinerea 0 0 0 0 0 10 40 0 A.cinerea 0 0 0 0 20 30 60 0
Infection: 25%
macroalgae detritus phytoplanktonzooplanktonarthropodaC.carpio S.erythrophthalmusA.cinerea macroalgae detritus phytoplanktonzooplanktonarthropodaC.carpio S.erythrophthalmusA.cinerea
macroalgae 0 0 0 0 0 0 0 0 macroalgae 0 0 0 0 0 0 0 0
detritus 0 0 0 0 0 0 0 0 detritus 0 0 0 0 0 0 0 0
phytoplankton 0 0 0 0 0 0 0 0 phytoplankton 0 0 0 0 0 0 0 0
zooplankton 0 0 100 0 0 0 0 0 zooplankton 0 0 100 0 0 0 0 0
arthropoda 30 30 0 20 0 0 0 0 arthropoda 50 50 0 30 0 0 0 0
C.carpio 0 0 18 21 36 0 0 0 C.carpio 0 0 34 39 52 0 0 0
S.erythrophthalmus8 0 0 13 35 0 0 0 S.erythrophthalmus30 0 22 35 57 0 0 0
A.cinerea 0 0 0 0 0 10 40 0 A.cinerea 0 0 0 0 20 30 60 0
Infection: 50%
macroalgae detritus phytoplanktonzooplanktonarthropodaC.carpio S.erythrophthalmusA.cinerea macroalgae detritus phytoplanktonzooplanktonarthropodaC.carpio S.erythrophthalmusA.cinerea
macroalgae 0 0 0 0 0 0 0 0 macroalgae 0 0 0 0 0 0 0 0
detritus 0 0 0 0 0 0 0 0 detritus 0 0 0 0 0 0 0 0
phytoplankton 0 0 0 0 0 0 0 0 phytoplankton 0 0 0 0 0 0 0 0
zooplankton 0 0 100 0 0 0 0 0 zooplankton 0 0 100 0 0 0 0 0
arthropoda 30 30 0 20 0 0 0 0 arthropoda 50 50 0 30 0 0 0 0
C.carpio 0 0 22 21 30 0 0 0 C.carpio 0 0 40 41 46 0 0 0
S.erythrophthalmus8 0 0 13 35 0 0 0 S.erythrophthalmus30 0 22 35 57 0 0 0
A.cinerea 0 0 0 0 0 10 40 0 A.cinerea 0 0 0 0 20 30 60 0
Infection: 75%
macroalgae detritus phytoplanktonzooplanktonarthropodaC.carpio S.erythrophthalmusA.cinerea macroalgae detritus phytoplanktonzooplanktonarthropodaC.carpio S.erythrophthalmusA.cinerea
macroalgae 0 0 0 0 0 0 0 0 macroalgae 0 0 0 0 0 0 0 0
detritus 0 0 0 0 0 0 0 0 detritus 0 0 0 0 0 0 0 0
phytoplankton 0 0 0 0 0 0 0 0 phytoplankton 0 0 0 0 0 0 0 0
zooplankton 0 0 100 0 0 0 0 0 zooplankton 0 0 100 0 0 0 0 0
arthropoda 30 30 0 20 0 0 0 0 arthropoda 50 50 0 30 0 0 0 0
C.carpio 0 0 25 21 24 0 0 0 C.carpio 0 0 47 43 40 0 0 0
S.erythrophthalmus8 0 0 13 35 0 0 0 S.erythrophthalmus30 0 22 35 57 0 0 0
A.cinerea 0 0 0 0 0 10 40 0 A.cinerea 0 0 0 0 20 30 60 0
Infection: 100%
macroalgae detritus phytoplanktonzooplanktonarthropodaC.carpio S.erythrophthalmusA.cinerea macroalgae detritus phytoplanktonzooplanktonarthropodaC.carpio S.erythrophthalmusA.cinerea
macroalgae 0 0 0 0 0 0 0 0 macroalgae 0 0 0 0 0 0 0 0
detritus 0 0 0 0 0 0 0 0 detritus 0 0 0 0 0 0 0 0
phytoplankton 0 0 0 0 0 0 0 0 phytoplankton 0 0 0 0 0 0 0 0
zooplankton 0 0 100 0 0 0 0 0 zooplankton 0 0 100 0 0 0 0 0
arthropoda 30 30 0 20 0 0 0 0 arthropoda 50 50 0 30 0 0 0 0
C.carpio 0 0 29 21 18 0 0 0 C.carpio 0 0 53 45 34 0 0 0
S.erythrophthalmus8 0 0 13 35 0 0 0 S.erythrophthalmus30 0 22 35 57 0 0 0
A.cinerea 0 0 0 0 0 10 40 0 A.cinerea 0 0 0 0 20 30 60 0
xv
Appendix 6. Published papers
Chapter 3:
Pegg, J., Andreou, D., Williams, C. F. and Britton, J. R., 2015. Temporal changes in
growth, condition and trophic niche in juvenile Cyprinus carpio infected with a non-
native parasite. Parasitology. doi:10.1017/S0031182015001237
Chapter 4:
Pegg, J., Andreou, D., Williams, C. F. and Britton, J. R., 2015, Head morphology
and piscivory of European eels, Anguilla anguilla, predict their probability of
infection by the invasive parasitic nematode Anguillicoloides crassus. Freshwater
Biology, 60: 1977–1987.
xvi
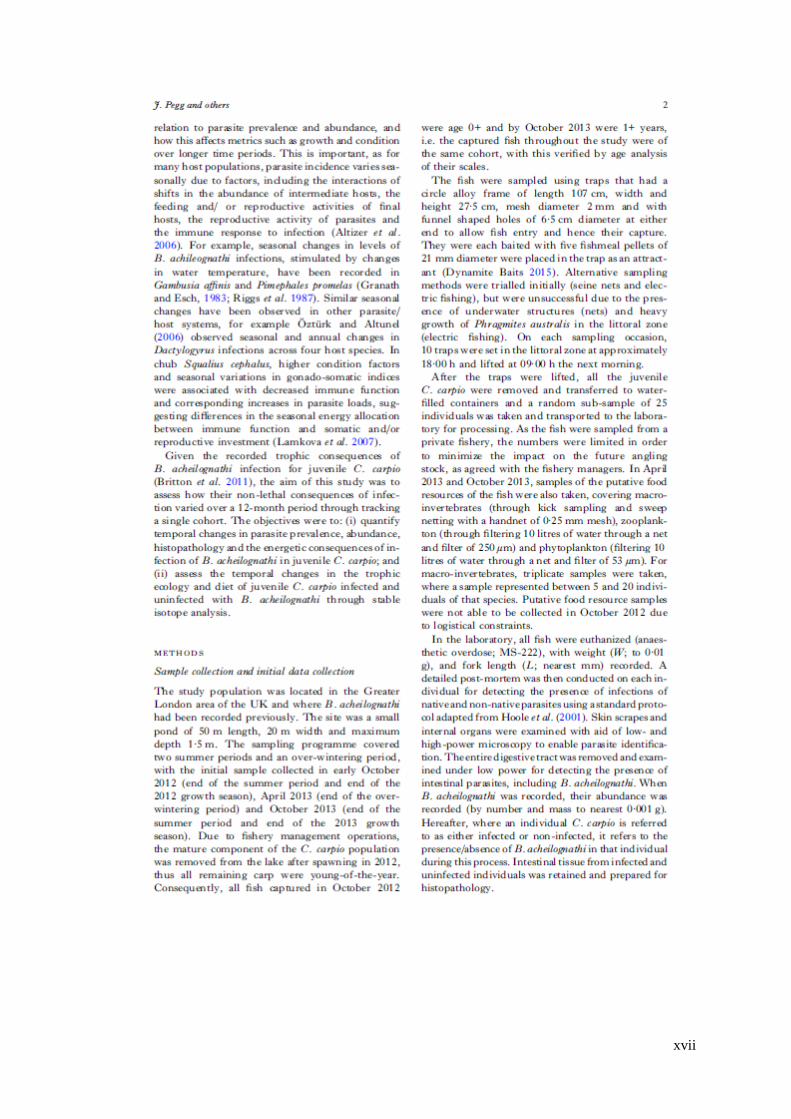
xvii
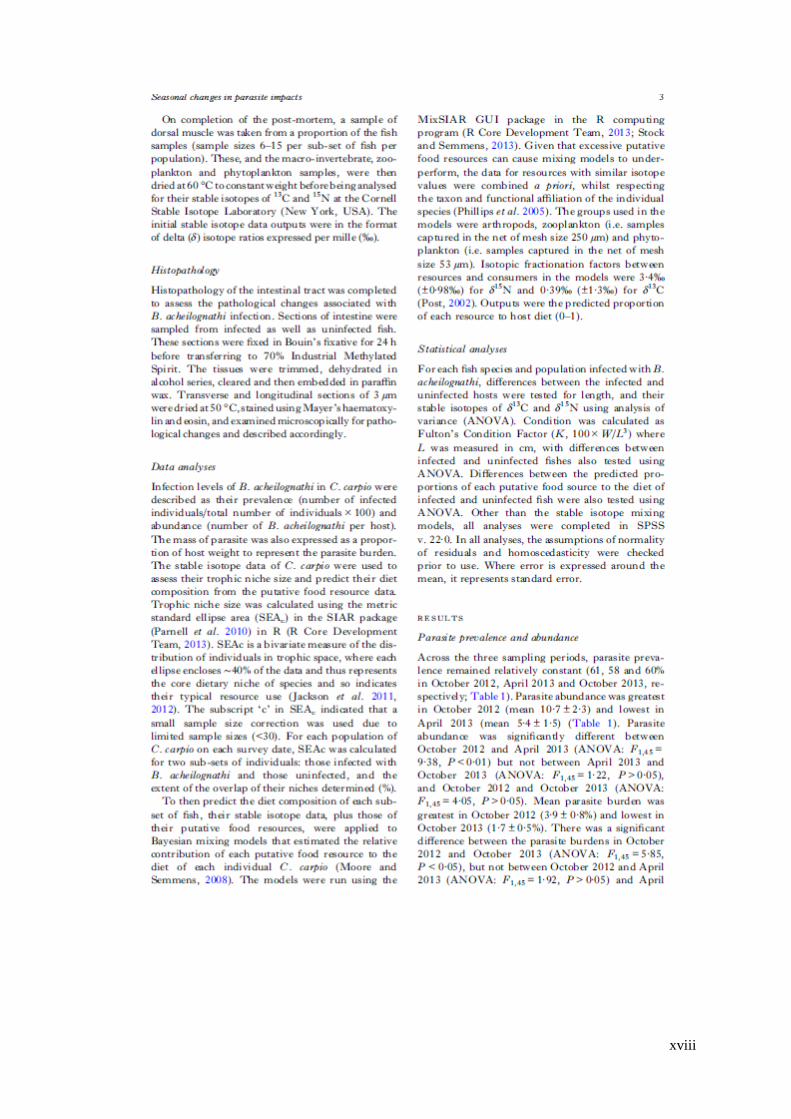
xviii
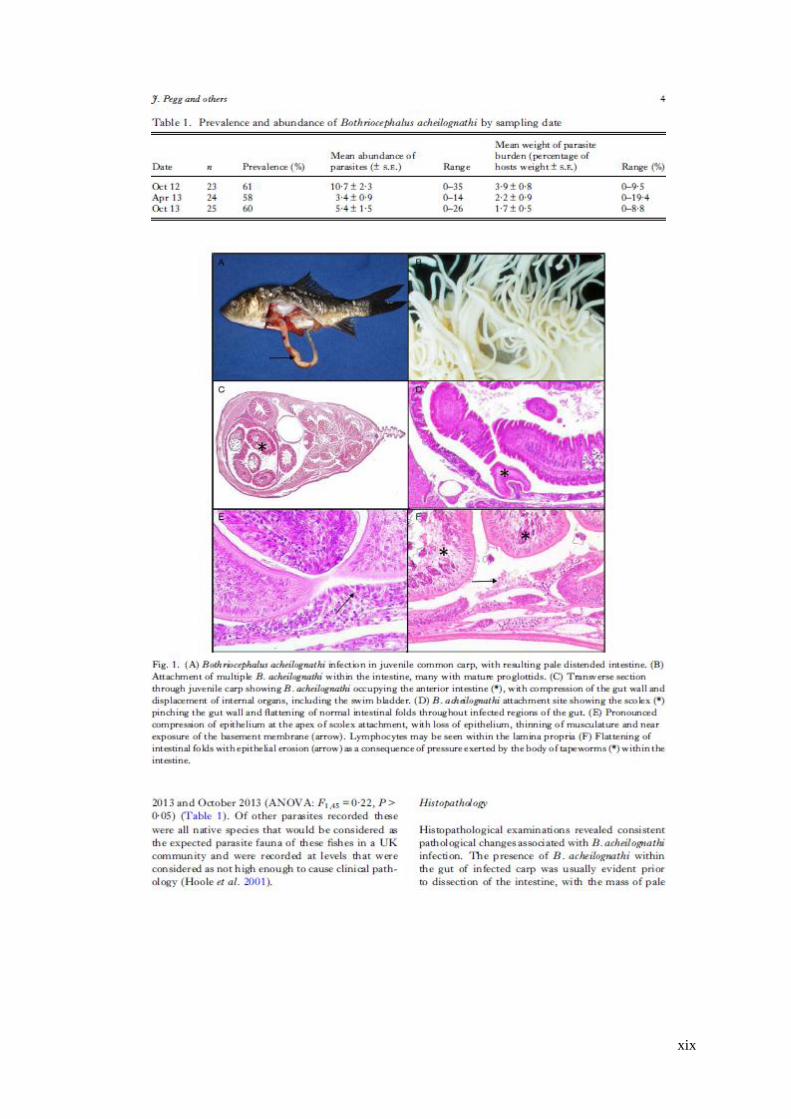
xix
xx
xxi
xxii

xxiii
xxiv
xxv
xxvi
xxvii
xxviii
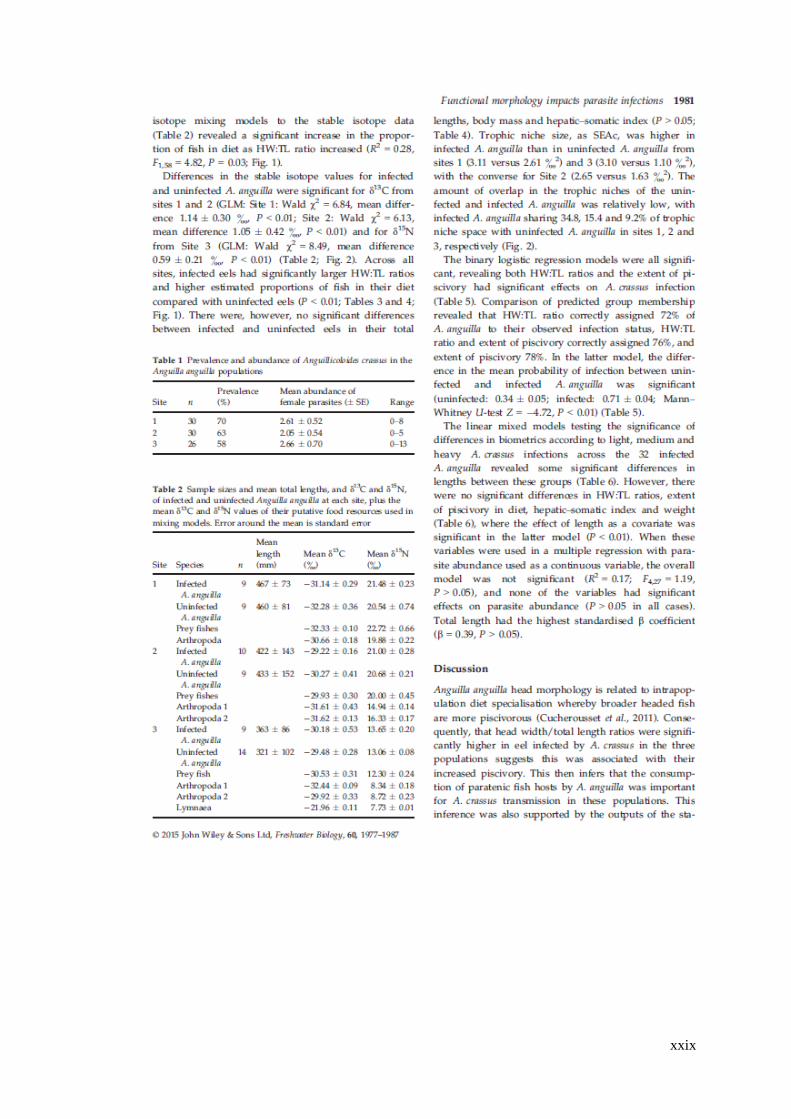
xxix
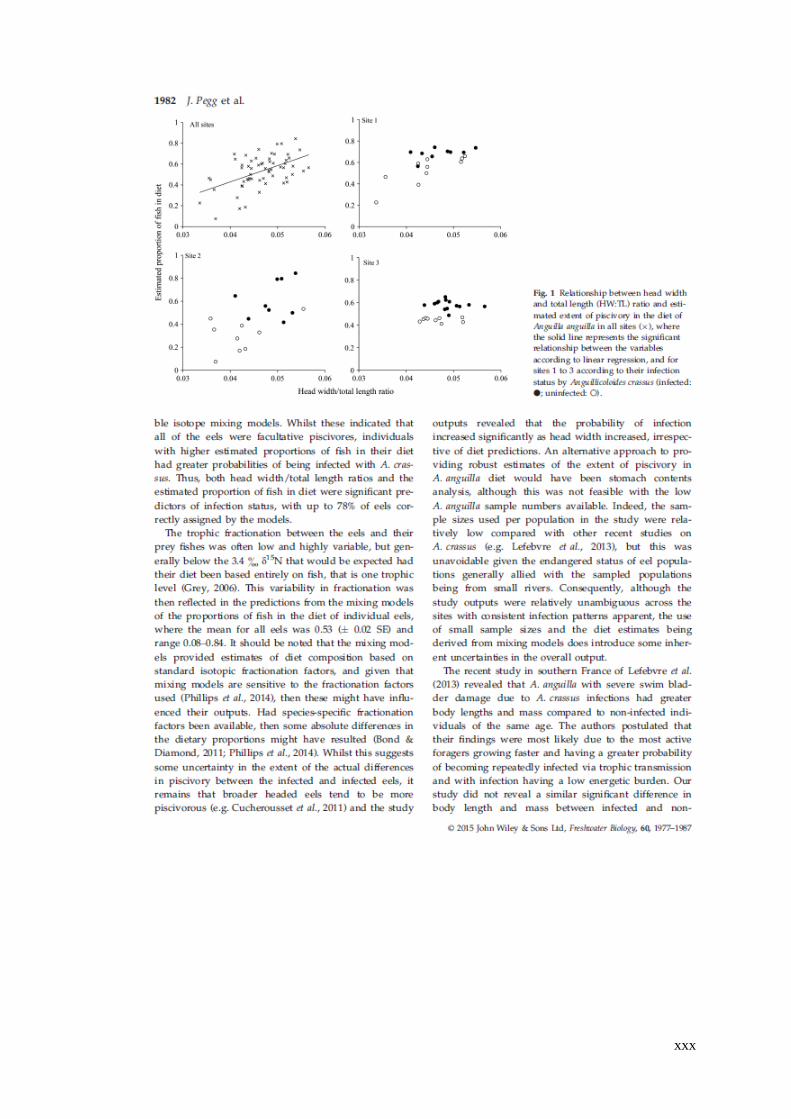
xxx
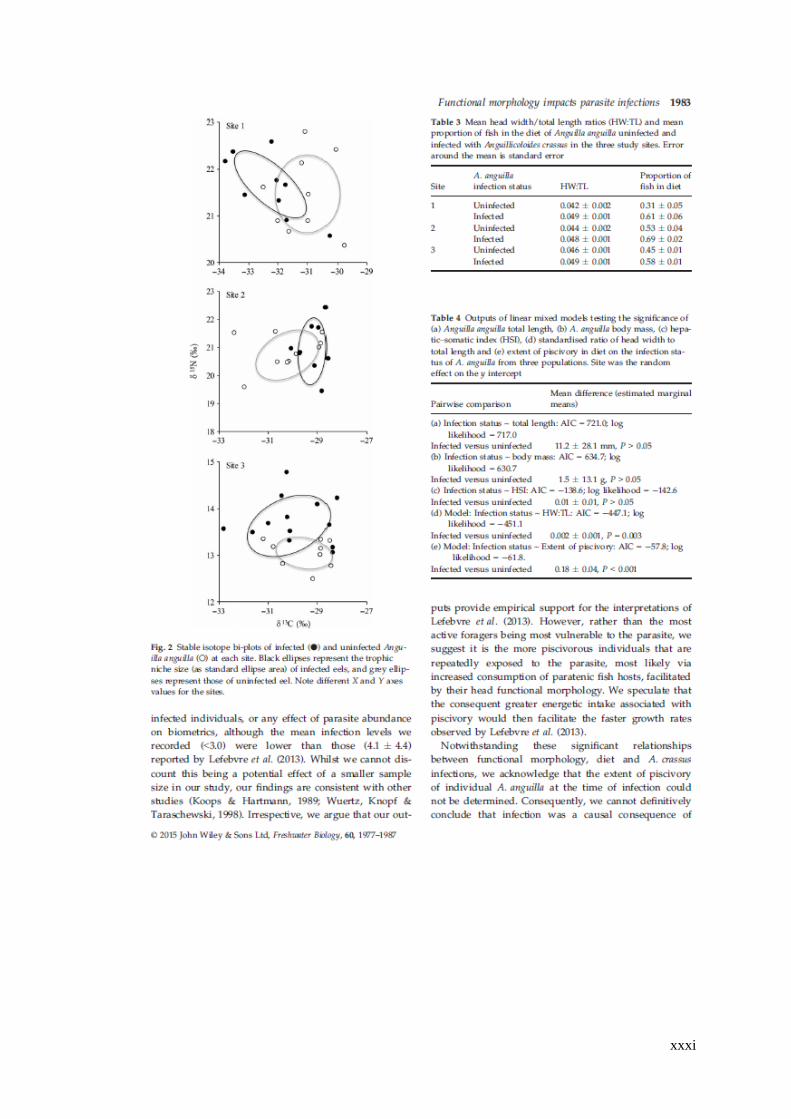
xxxi
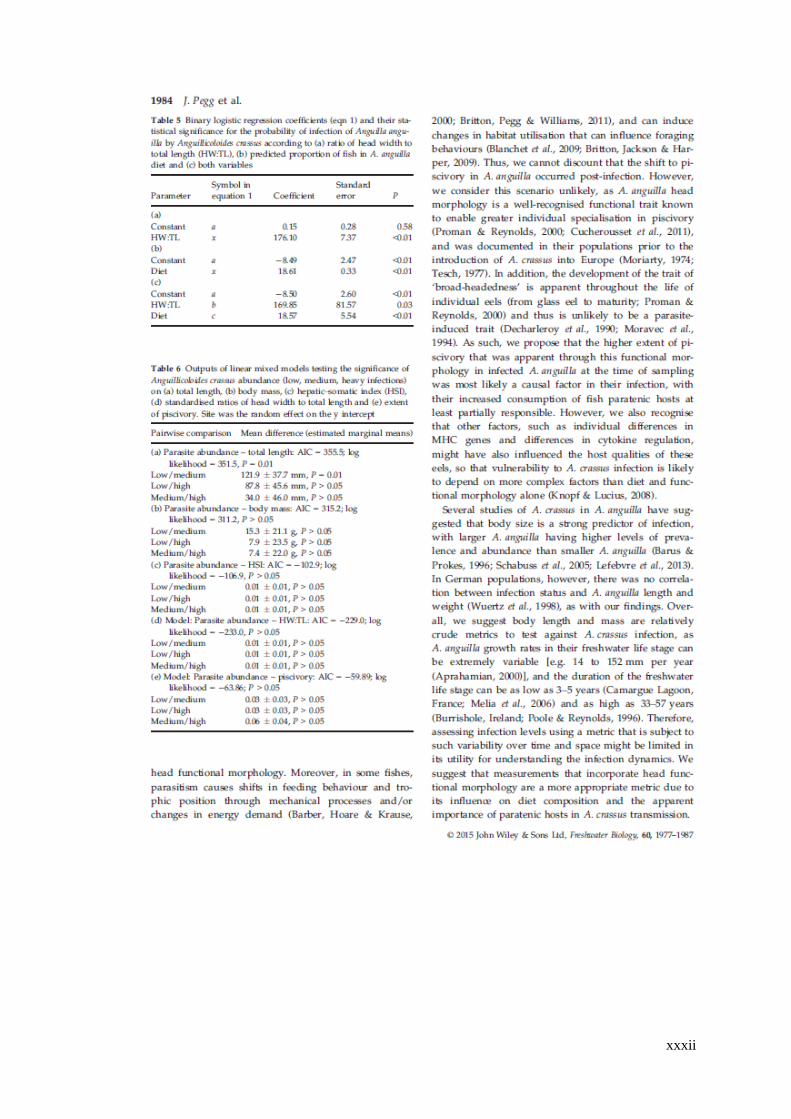
xxxii
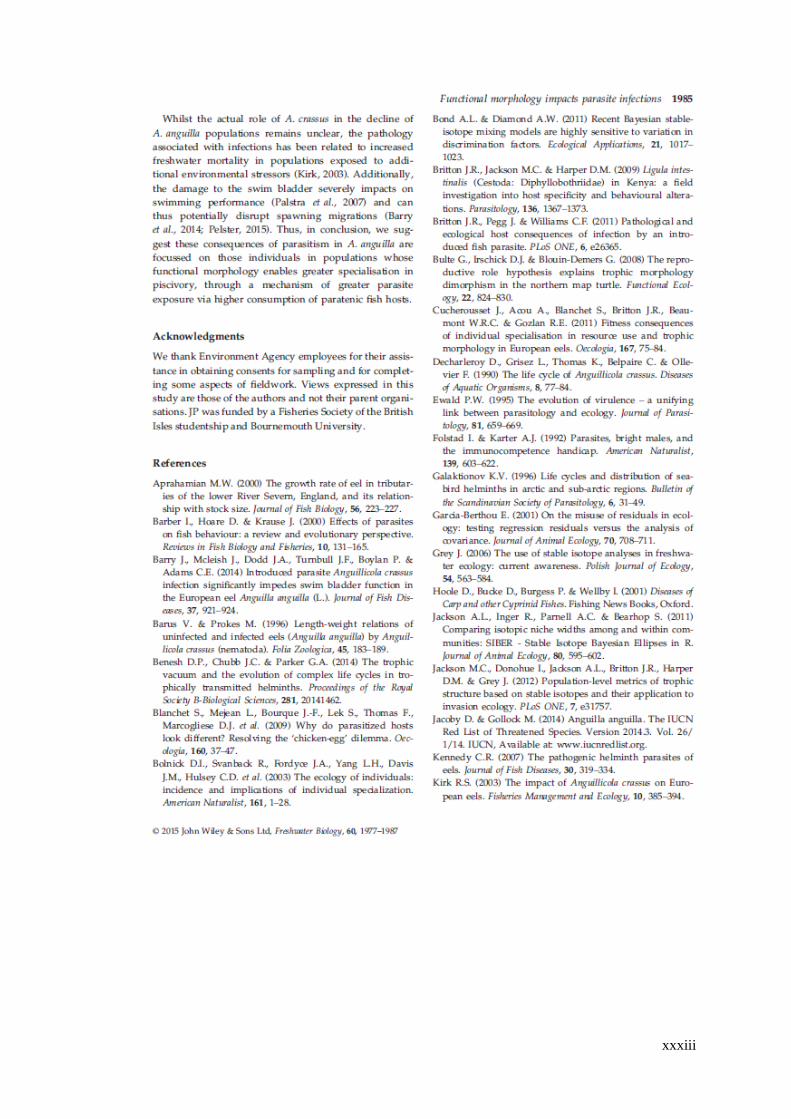
xxxiii
xxxiv
xxxv
Related Documents