Philippines Biodiversity & Watersheds Improved for Stronger Economy & Ecosystem Resilience (B+WISER) Ecological Assessments in the B+WISER Sites (Northern Sierra Madre Natural Park, Upper Marikina-Kaliwa Forest Reserve, Bago River Watershed and Forest Reserve, Naujan Lake National Park and Subwatersheds, Mt. Kitanglad Range Natural Park and Mt. Apo Natural Park) 23 March 2015

Welcome message from author
This document is posted to help you gain knowledge. Please leave a comment to let me know what you think about it! Share it to your friends and learn new things together.
Transcript

Philippines Biodiversity & Watersheds Improved for Stronger Economy & Ecosystem Resilience (B+WISER)
Ecological Assessments in the B+WISER Sites (Northern Sierra Madre Natural Park, Upper Marikina-Kaliwa Forest Reserve, Bago River Watershed and Forest Reserve, Naujan Lake National Park and Subwatersheds, Mt. Kitanglad Range Natural Park and Mt. Apo Natural Park)
23 March 2015

This publication was produced for review by the United States Agency for International Development. It was prepared by Chemonics International Inc. The Biodiversity and Watersheds Improved for Stronger Economy and Ecosystem Resilience Program is funded by the USAID, Contract No. AID-492-C-13-00002 and implemented by Chemonics International in association with:
Fauna and Flora International (FFI)
Haribon Foundation
World Agroforestry Center (ICRAF) The author’s views expressed in this publication do not necessarily reflect the views of the United States Agency for International Development or the United States Government.

Ecological Assessments in the B+WISER Sites
Philippines Biodiversity and Watersheds Improved for Stronger Economy and Ecosystem Resilience
(B+WISER) Program
Implemented with:
Department of Environment and Natural Resources Other National Government Agencies Local Government Units and Agencies
Supported by:
United States Agency for International Development Contract No.: AID-492-C-13-00002
Managed by:
Chemonics International Inc. in partnership with
Fauna and Flora International (FFI) Haribon Foundation
World Agroforestry Center (ICRAF)
23 March 2015


ECOLOGICAL ASSESSMENTS IN THE B+WISER SITES | i
CONTENTS
List of Tables .................................................................................................................. vi
List of Figures............................................................................................................... viii
List of Annexes ............................................................................................................... ix
Acronyms ..................................................................................................................... xiii
EXECUTIVE SUMMARY ............................................................................................... xv
I. INTRODUCTION ................................................................................................... 1
1.1. Recognizing the constraints in making informed Management decisions ......... 1
1.2. Addressing the constraints (Technical Approach: Biodiversity Assessment vs Ecological assessment) ............................................................................ 2
Information Tiers .................................................................................................... 2 HCVA approach ..................................................................................................... 2
II. RESEARCH METHODOLOGY .............................................................................. 5
2.1 Pre-survey ....................................................................................................... 5
Stratification and Sampling design ........................................................................ 5 Transect establishment ......................................................................................... 5 Proxy Sites............................................................................................................. 5 Transect layout .................................................................................................... 12
Northern Sierra Madre Natural Park (NSMNP) ......................................................13
Kaliwa Watershed Forest Reserve (KWFR) and Upper Marikina River Basin Protected Landscape (UMRBPL) ...........................................................................14
Bago River Watershed, Mt Kanlaon Natural Park (MKNP) and North Negros Natural Park (NNNP) .............................................................................................15
Mt. Kitanglad Range Natural Park (MKRNP) .........................................................16
Mt. Apo Natural Park (MANP) ................................................................................17
2.2. Field Survey Proper ...................................................................................... 18
Vegetation/Habitat Assessment (Tier 1) .............................................................. 18
Broad Habitat Classification ...................................................................................18
Detailed Habitat Assessment .................................................................................18
Tree Diversity and Stand Composition ...................................................................19
Faunal Assessment (Tier 1) ................................................................................ 19
Avifauna .................................................................................................................19
Mammals ...............................................................................................................20
Amphibians and Reptiles .......................................................................................20

ii | ECOLOGICAL ASSESSMENTS IN THE B+WISER SITES
2.3. Determination of Key Drivers of Deforestation and Degradation ................... 21
2.4. Data Processing and Analysis ...................................................................... 21
Species-habitat Ordination analysis (Tier 2) ....................................................... 21 Species Occupancy Modeling (Tier 3) ................................................................ 22 Estimating Populations of Key species (Tier 3) ................................................... 22 Species Distribution Modeling (Tier 4) ................................................................ 22
2.5. Species and Site Diagnosis .......................................................................... 23
Determining Species survival envelopes (Tier 2) ................................................ 23 Analysis of congruence of the various Species Distribution Models (Tier 4) ...... 23 Identifying hotspots of land use changes via change detection analysis (Tier 4) ................................................................................................................. 23
2.6. Survey effort ................................................................................................. 24
III. RESULTS AND DISCUSSION ............................................................................. 26
3.1. Species Richness, Endemism and IUCN Threat Status ................................ 26
NSMNP ................................................................................................................ 26
Plants (Trees) ........................................................................................................26
Birds .......................................................................................................................26
Mammals ...............................................................................................................27
Reptiles and Amphibians .......................................................................................27
KWFR and UMRBPL ........................................................................................... 27
Plants (Trees) ........................................................................................................28
Birds .......................................................................................................................28
Mammals ...............................................................................................................28
Reptiles and Amphibians .......................................................................................28
NLNP ................................................................................................................... 28
Birds .......................................................................................................................29
Reptiles and Amphibians .......................................................................................29
Bago Watershed, MKNP and NNNP ................................................................... 30
Plants (Trees) ........................................................................................................31
Birds .......................................................................................................................31
Mammals ...............................................................................................................31
Reptiles and Amphibians .......................................................................................31
MKRNP ................................................................................................................ 32
Plants (Trees) ........................................................................................................33
Birds .......................................................................................................................33
Mammals ...............................................................................................................33
Reptiles and Amphibians .......................................................................................33
MANP .................................................................................................................. 34
Plants (Trees) ........................................................................................................34

ECOLOGICAL ASSESSMENTS IN THE B+WISER SITES | iii
Birds .......................................................................................................................34
Mammals ...............................................................................................................35
Reptiles and Amphibians .......................................................................................35
3.2. Results of Ordination .................................................................................... 35
NSMNP ................................................................................................................ 36
Plants (Trees) ........................................................................................................36
Birds .......................................................................................................................37
KWFR and UMRBPL ........................................................................................... 39
Plants (Trees) ........................................................................................................39
Birds .......................................................................................................................39
Mammals ...............................................................................................................41
Amphibians ............................................................................................................42
Reptiles ..................................................................................................................42
Bago Watershed, MKNP and NNNP ................................................................... 43
Plants (Trees) ........................................................................................................43
Birds .......................................................................................................................44
Mammals ...............................................................................................................45
Amphibians ............................................................................................................46
MKNRP ................................................................................................................ 47
Plants (Trees) ........................................................................................................47
Birds .......................................................................................................................48
Mammals ...............................................................................................................49
Reptiles ..................................................................................................................50
MANP .................................................................................................................. 50
Plants (Trees) ........................................................................................................50
Birds .......................................................................................................................51
Mammals ...............................................................................................................52
Reptiles ..................................................................................................................53
3.3. Results of Species Occupancy Modeling of Trees, Birds, Reptiles, Amphibians and Mammals and Population Estimation of Birds ................... 53
NSMNP ................................................................................................................ 54
Plants (Trees) ........................................................................................................54
Birds .......................................................................................................................55
Amphibians ............................................................................................................56
Kaliwa and UMRBPL ........................................................................................... 57
Plants (Trees) ........................................................................................................57
Birds .......................................................................................................................58
Mammals ...............................................................................................................58
Amphibians ............................................................................................................59

iv | ECOLOGICAL ASSESSMENTS IN THE B+WISER SITES
Reptiles ..................................................................................................................60
Bago Watershed, MKNP and NNNP. .................................................................. 61
Plants (Trees) ........................................................................................................61
Birds .......................................................................................................................61
Mammals ...............................................................................................................62
MKNRP ................................................................................................................ 63
Plants (Trees) ........................................................................................................63
Birds .......................................................................................................................64
Mammals ...............................................................................................................65
Amphibians ............................................................................................................66
Reptiles ..................................................................................................................67
MANP .................................................................................................................. 68
Plants (Trees) ........................................................................................................68
Birds .......................................................................................................................69
Mammals ...............................................................................................................70
Amphibians ............................................................................................................71
Reptiles ..................................................................................................................72
Population Density Estimates for Birds in NSMNP ............................................. 73
3.4. High Conservation Value Areas using congruence of the various Species Distribution Models...................................................................................... 74
NSMNP ................................................................................................................ 74 KWFR and UMRBPL ........................................................................................... 79 NLNP ................................................................................................................... 80 Bago .................................................................................................................... 81
Birds .......................................................................................................................81
Bats ........................................................................................................................82
Herps .....................................................................................................................83
Trees ......................................................................................................................84
MKRNP ................................................................................................................ 85
Birds .......................................................................................................................85
Flora .......................................................................................................................86
MANP .................................................................................................................. 87
Birds .......................................................................................................................87
Trees ......................................................................................................................88
3.5. Land use changes via change detection analysis using remote-sensed data ............................................................................................................. 89
NSMNP ................................................................................................................ 89 KWFR and UMRBPL ........................................................................................... 91 NLNP ................................................................................................................... 92 Bago Watershed, MKNP and NNNP ................................................................... 93 MKNRP ................................................................................................................ 94

ECOLOGICAL ASSESSMENTS IN THE B+WISER SITES | v
MANP .................................................................................................................. 95
3.6 Key Drivers of Deforestation and Degradation ............................................... 95
NSMNP ................................................................................................................ 95 Kaliwa and UMRBPL ........................................................................................ xcvii Bago Watershed, MKNP and NNNP ................................................................ xcvii MKRNP ................................................................................................................ 98 Habitat conversion ................................................................................................. 98 MANP .................................................................................................................. 99
IV. CONCLUSIONS AND RECOMMENDATIONS: IMPLICATIONS FOR MANAGEMENT ................................................................................................. 100
4.1. Species level Interventions (SSE, occupancy vis-à-vis BMS and restoration) ................................................................................................ 100
NSMNP .............................................................................................................. 100 KWFR and UMRBPL ......................................................................................... 101 NLNP ................................................................................................................. 101 Bago Watershed, MKNP and NNNP ................................................................. 101 MKNRP .............................................................................................................. 102 MANP ................................................................................................................ 102
4.2. Landscape level Interventions .................................................................... 102
HCVAs vis-à-vis PA/WS management regimes and boundaries ...................... 103
NSMNP ................................................................................................................103
KWFR and UMRBPL ...........................................................................................104
NLNP ...................................................................................................................105
Bago Watershed, MKNP and NNNP ....................................................................106
MKRNP ................................................................................................................107
MANP ..................................................................................................................108
HCVA vis-à-vis Hotspots ................................................................................... 108
NSMNP ................................................................................................................109
UMRBPL-KWFR ..................................................................................................110
NLNP ...................................................................................................................111
Bago Watershed, MKNP and NNNP ....................................................................112
MKRNP ................................................................................................................113
MANP ..................................................................................................................114
V. GLOSSARY OF TERMS AND ACRONYMS ...................................................... 115
VI. BIBLIOGRAPHY ................................................................................................ 118
VII. ANNEXES .......................................................................................................... 123

vi | ECOLOGICAL ASSESSMENTS IN THE B+WISER SITES
LIST OF TABLES
Table 1. List of Endemic Bird Areas (EBAs): Mindoro ..................................................... 6
Table 2. List of Endemic Bird Areas (EBAs): Luzon ........................................................ 7
Table 3. List of Endemic Bird Areas: Negros and Panay ................................................ 9
Table 4. List of Endemic Bird Areas: Mindanao and the Eastern Visayas ..................... 10
Table 5. Description of the different habitat types adapted from Mallari et al. (2011) ........................................................................................................... 18
Table 6. Summary list of sampled habitat parameters sampled in every point station with its corresponding coverage. ........................................................ 19
Table 7. Overall survey effort for all sites. ..................................................................... 24
Table 8. Survey effort for NSMNP ................................................................................ 24
Table 9. Survey effort for Kaliwa and UMRBPL ............................................................ 24
Table 10. Survey effort for BRWFR .............................................................................. 25
Table 11. Survey effort for MKRNP .............................................................................. 25
Table 12. Survey effort for MANP ................................................................................. 25
Table 13. Summary of endemicity and the threatened status (according to the 2014 IUCN Red List) of species surveyed in NSMNP. .................................. 26
Table 14. Summary of endemicity of the species surveyed in UMRBPL-KWFR. .......... 27
Table 15. Summary of the threatened status of species surveyed in UMRBPL-KWFR according to the 2014 IUCN Red List. ................................................ 27
Table 16. Endemicity of species on Mindoro Island. ..................................................... 29
Table 17. Conservation status of species recorded in Mindoro Island based on the IUCN Red List (2014). ................................................................................... 29
Table 18. Summary of endemicity and distribution of species recorded in BRWFR. ..... 30
Table 19. Summary of the threatened status of species surveyed in BRWFR according to the IUCN Red List (2014). ......................................................... 30
Table 20. Summary of species recorded in MKRNP. .................................................... 32
Table 21. Conservation status of species observed in MKRNP based on IUCN Red List (2014). ............................................................................................ 32
Table 22. Distribution of species surveyed in MANP. ................................................... 34
Table 23. Summary of threatened species surveyed in MANP according to the 2014 IUCN Red List. ..................................................................................... 34
Table 24. Species survival envelopes for tree species in NSMNP generated using Canonical Correspondence Analysis. ............................................................ 36
Table 25. Species survival envelopes for birds in NSMNP using Canonical Correspondence Analysis. ............................................................................ 37
Table 26. Species survival envelopes of trees in KWFR-UMRBPL using Canonical Correspondence Analysis. ............................................................................ 39
Table 27. Species survival envelopes for birds in KWFR-UMRBPL using Canonical Correspondence Analysis. ............................................................ 40
Table 28. Species survival envelopes of bats in KWFR-UMRBPL using Canonical Correspondence Analysis. ............................................................................ 41

ECOLOGICAL ASSESSMENTS IN THE B+WISER SITES | vii
Table 29. Species survival envelopes of amphibians in KWFR-UMRBPL using Canonical Correspondence Analysis. ............................................................ 42
Table 30. Species survival envelopes of reptiles in KWFR-UMRBPL using Canonical Correspondence Analysis. ............................................................ 43
Table 31. Species survival envelopes of trees in Bago Watershed, MKNP and NNNP using Canonical Correspondence Analysis. ....................................... 43
Table 32. Species survival envelopes of birds in Bago Watershed, MKNP and NNNP using Canonical Correspondence Analysis. ....................................... 44
Table 33. Species survival envelopes of mammals in Bago Watershed, MKNP and NNNP using Canonical Correspondence Analysis. ................................ 46
Table 34. Species survival envelopes of amphibians in Bago Watershed, MKNP and NNNP using Canonical Correspondence Analysis. ................................ 47
Table 35. Species survival envelopes of trees in MKRNP using Canonical Correspondence Analysis. ............................................................................ 47
Table 36. Species survival envelopes of birds in MKRNP using Canonical Correspondence Analysis. ............................................................................ 48
Table 37. Species survival envelopes of mammals in MKRNP using Canonical Correspondence Analysis. ............................................................................ 49
Table 38. Species survival envelopes of reptiles in MKRNP using Canonical Correspondece Analysis. .............................................................................. 50
Table 39. Species survival envelopes of trees in MANP using Canonical Correspondence Analysis. ............................................................................ 51
Table 40. Species survival envelopes of birds in MANP using Canonical Correspondence Analysis. ............................................................................ 51
Table 41. Species survival envelopes of bats in MANP using Canonical Correspondence Analysis. ............................................................................ 52
Table 42. Species survival envelopes of reptiles in MANP using Canonical Correspondence Analysis. ............................................................................ 53
Table 43. Occupancy models of selected tree in NSMNP. ........................................... 54
Table 44. Occupancy models of selected birds in NSMNP. .......................................... 55
Table 45. Occupancy models of selected amphibians in NSMNP. ................................ 56
Table 46. Occupancy models of selected trees in Kaliwa and UMRBPL. ...................... 57
Table 47. Occupancy models of selected birds in KWFR and UMRBPL. ...................... 58
Table 48. Occupancy models of selected mammals in Kaliwa and UMRBPL. .............. 59
Table 49. Occupancy models of selected amphibians in KWFR and UMRBPL. ........... 60
Table 50. Occupancy models of selected reptiles in KWFR and UMRBPL. .................. 60
Table 51. Occupancy models of selected trees in Bago Watershed, MKNP and NNNP. ........................................................................................................... 61
Table 52. Occupancy models of selected birds in Bago Watershed, MKNP and NNNP. ........................................................................................................... 62
Table 53. Occupancy models of selected bats in Bago Watershed, MKNP and NNNP. ........................................................................................................... 63
Table 54. Occupancy models of selected trees in MKRNP. .......................................... 64
Table 55. Occupancy models of selected birds in MKRNP. .......................................... 64
viii | ECOLOGICAL ASSESSMENTS IN THE B+WISER SITES
Table 56. Occupancy models of selected bats in MKRNP. ........................................... 66
Table 57. Occupancy models of selected amphibians in MKRNP. ................................ 67
Table 58. Occupancy models of selected reptiles in MKRNP. ...................................... 68
Table 59. Occupancy models of selected trees in MANP. ............................................ 69
Table 60. Occupancy models of selected birds in MANP. ............................................ 69
Table 61. Occupancy models of selected bats in MANP. ............................................. 70
Table 62. Occupancy models of selected amphibians in MKRNP. ................................ 71
Table 63. Occupancy models of selected reptiles in MANP. ......................................... 72
Table 64. Population density estimates (number per hectare) of 23 species of birds across different habitat types. ............................................................... 73
LIST OF FIGURES Figure 1. Transects surveyed in Northern Sierra Madre Natural Park. .......................... 13
Figure 2. Transects surveyed in Ipo Dam, Norzagary, Bulacan and boundaries for Kaliwa Forest Watershed Reserve and Upper Marikina Basin Protected Landscape. ................................................................................................... 14
Figure 3. Transects surveyed in Bago River Watershed Forest Reserve. ..................... 15
Figure 4. Transects surveyed in Mt. Kitanglad Range Natural Park. ............................. 16
Figure 5. Transects surveyed in Mt. Apo Natural Park. ................................................. 17
Figure 6. Species distribution of selected tree species in NSMNP. ............................... 75
Figure 7. Species Distribution of selected species of birds in NSMNP. ......................... 76
Figure 8. Species distribution of selected bat species in NSMNP. ................................ 77
Figure 9. Species distribution model of selected amphibians and reptile species in NSMNP. ........................................................................................................ 78
Figure 10. Species distribution model of selected bird species in Kaliwa-UMRBPL. ..... 79
Figure 11. Species distribution model of selected bird species in NLNP. ...................... 80
Figure 12. Species distribution model of selected species of herps in NLNP. ............... 81
Figure 13. Species distribution model of selected bird species in BRFWR. .................. 82
Figure 14. Species distribution model of bats in BRFWR.............................................. 83
Figure 15. Species distribution model of selected species of herps in BRFWR. ........... 84
Figure 16. Species distribution model of selected tree species in BRFWR. .................. 85
Figure 17. Species distribution model of selected species of birds in MKRNP. ............. 86
Figure 18. Species distribution model of tree species in MKRNP. ................................ 87
Figure 19. Species distribution model of birds in MANP. .............................................. 88
Figure 20. Species distribution model of selected trees in MANP. ................................ 89
Figure 21. Identified High Conservation Value Areas in NSMNP. ............................... 103
Figure 22. Identified High Conservation Value Area in Kaliwa-UMRBPL. ................... 104
Figure 23. Identified High Conservation Value Area in NLNP. .................................... 105
Figure 24. Identified High Conservation Value Areas in BRFWR. ............................... 106
Figure 25. Identified High Conservation Value Areas in MKRNP. ............................... 107

ECOLOGICAL ASSESSMENTS IN THE B+WISER SITES | ix
Figure 26. Identified High Conservation Value Areas in MANP. ................................. 108
Figure 27. Identified conservation hotspots in NSMNP. .............................................. 109
Figure 28. Identified conservation hotspots in KWFR-UMRBPL. ................................ 110
Figure 29. Identified conservation hotspots in NLNP. ................................................. 111
Figure 30. Identified conservation hotspots in BRFWR. .............................................. 112
Figure 31. Identified conservation hotspots in MKRNP. .............................................. 113
Figure 32. Identified conservation hotspots in MANP. ................................................ 114
LIST OF ANNEXES
Annex A. Species List ....................................................................................... 123
NSMNP ............................................................................................................ 123
Annex 1.1a. Summary of tree species recorded in NSMNP, their extent of occurrence and conservation status based on the IUCN Red List of Threatened Species (2014). .............................123
Annex 1.1b. Summary of bird species recorded in NSMNP, their extent of occurrence and conservation status based on the IUCN Red List of Threatened Species (2014). .............................125
Annex 1.1c. Summary of mammal species recorded in NSMNP, their extent of occurrence and conservation status based on the IUCN Red List of Threatened Species (2014). ..........128
Annex 1.1d. Summary of amphibians and species recorded in NSMNP, their extent of occurrence and conservation status based on the IUCN Red List of Threatened Species (2014). ..........129
Kaliwa – UMRBPL .......................................................................................... 130
Annex 1.2a.List of all floral species recorded from the survey for the proxy sites of UMRBPL-KWFR. Shown also is the species conservation status based on IUCN 2014 and their endemicity. .......................................................................................................130
Annex 1.2b. List of all bird species from the survey for the proxy sites of UMRBPL-KWFR. Shown also is the species conservation status based on IUCN and their occurrence in the study sites. .......................................................................................................131
Annex.1.2c. List of all mammal species recorded from the survey for the proxy sites of UMRBPL-KWFR. Shown also is the species conservation status based on IUCN and their occurrence in the study sites. ....................................................................134
Annex 1.2d. List of all amphibian species recorded from the survey for the proxy sites of UMRBPL-KWFR. Shown also is the species conservation status based on IUCN and their occurrence in the study sites. ....................................................................134

x | ECOLOGICAL ASSESSMENTS IN THE B+WISER SITES
Annex 1.2e. List of all reptile species recorded from the survey for the proxy sites of UMRBPL-KWFR. Shown also is the species conservation status based on IUCN and their occurrence in the study sites. ....................................................................135
NLNP ................................................................................................................ 136
Annex 1.3a. List of bird species in NLNP used for the ecological assessment as collected from the Philippine National Museum, California Academy of Sciences, Field Museum of Natural History and Kansas University. ..................................................136
Annex 1.3b. List of amphibians in NLNP used for the ecological assessment as collected from the Philippine National Museum, California Academy of Sciences, Field Museum of Natural History and Kansas University. .................................................................137
Annex 1.3c. List of amphibians in NLNP used for the ecological assessment as collected from the Philippine National Museum, California Academy of Sciences, Field Museum of Natural History and Kansas University. .................................................................137
BRWFR ............................................................................................................ 138
Annex 1.4a. List of all floral species recorded from the survey for the proxy sites of BRWFR. Shown also is the species conservation status based on IUCN 2014 and their endemicity. ....138
Annex 1.4.b List of birds recorded in BRWFR during the ecological assessment, their threat status and extent of occurrence. ......................................................................................................139
MKRNP ............................................................................................................ 142
Annex 1.5a. List of trees recorded in MKRNP during the ecological assessment, their threat status and extent of occurrence. ......................................................................................................143
Annex 1.5b. List of birds recorded in MKRNP during the ecological assessment, their threat status and extent of occurrence. ......................................................................................................145
Annex 1.5c. List of mammals recorded in MKRNP during the ecological assessment, their threat status and extent of occurrence. ......................................................................................................149
Annex.1.5d. List of amphibians recorded in MKRNP during the ecological assessment, their threat status and extent of occurrence. ......................................................................................................151
Annex 1.5e. List of reptiles recorded in MKRNP during the ecological assessment, their threat status and extent of occurrence. ......................................................................................................153
MANP ............................................................................................................... 154

ECOLOGICAL ASSESSMENTS IN THE B+WISER SITES | xi
Annex 1.6a. List of trees recorded in MANP during the ecological assessment, their threat status and extent of occurrence. ......................................................................................................154
Annex 1.6b. List of birds recorded in MANP during the ecological assessment, their threat status and extent of occurrence. ......................................................................................................156
Annex 1.6c. List of mammals recorded in MANP during the ecological assessment, their threat status and extent of occurrence. ......................................................................................................158
Annex 1.6d. List of amphibians recorded in MANP during the ecological assessment, their threat status and extent of occurrence. ......................................................................................................158
Annex 1.6e. List of reptiles recorded in MANP during the ecological assessment, their threat status and extent of occurrence. ......................................................................................................159
Annex B. Spreadsheet of Raw Data (See Attachment) ....................................... 160
Annex C. Canonical Correspondence Analysis Biplots ....................................... 160
NSMNP ............................................................................................................ 160
Flora (Trees) ....................................................................................................160
Birds ...................................................................................................................160
Kaliwa-UMRBPL ............................................................................................. 161
Flora (Trees) ....................................................................................................161
Birds ...................................................................................................................162
Amphibians ......................................................................................................163
Bats ....................................................................................................................164
BRFWR ............................................................................................................ 165
Flora (Trees) ....................................................................................................165
Birds ...................................................................................................................166
Bats ....................................................................................................................167
Amphibians ......................................................................................................168
Reptiles .............................................................................................................169
MKNRP ............................................................................................................ 170
Flora (Trees) ....................................................................................................170
Birds ...................................................................................................................171
Bats ....................................................................................................................172
Amphibians ......................................................................................................173
Reptiles .............................................................................................................174

xii | ECOLOGICAL ASSESSMENTS IN THE B+WISER SITES
Annex D. Niche Width and Niche Position of Key Species ................................. 176
NSMNP ............................................................................................................ 176
Flora (Trees) ....................................................................................................176
Birds ...................................................................................................................176
Kaliwa-UMRBPL ............................................................................................. 177
Flora (Trees) ....................................................................................................177
Birds ...................................................................................................................178
Amphibians ......................................................................................................179
Reptiles .............................................................................................................180
Bats ....................................................................................................................181
BRWFR ............................................................................................................ 181
Flora (Trees) ....................................................................................................181
Birds ...................................................................................................................182
Bats ....................................................................................................................183
Amphibians ......................................................................................................184
MKRNP and MANP ........................................................................................ 185
Flora (Trees) ....................................................................................................185
Birds ...................................................................................................................186
Bats ....................................................................................................................187
Reptiles .............................................................................................................187
Annex E. B+WISER Directory ........................................................................... 189

ECOLOGICAL ASSESSMENTS IN THE B+WISER SITES | xiii
ACRONYMS
A
AIC Akaike’s Information Criterion
ASG Advanced Secondary Growth forest
B
BRWFR Bago River Watershed Forest Reserve
BRWFRMC Bago River Watershed Forest Reserve Management Council
B+WISER Biodiversity and Watersheds Improved for Stronger Economy and
Ecosystem Resilience
C
CCA Canonical Correspondence Analysis
CPA Conservation Priority Area
CR Critically Endangered (based on IUCN RedList)
CVT Cultivated
D
DBH Diameter at Breast Height
DD Data Deficient (based on IUCN RedList)
DENR Department of Environment and Natural Resources
DENR-BMB Department of Environment and Natural Resources –Biodiversity
Management Bureau
E
EBA Endemic Bird Area
EN Endangered (based on IUCN RedList)
ESG Early Secondary Growth forest
F
FAO Food and Agriculture Organization
FFI PH Fauna & Flora International Philippines
G
GIS Geographic Information System
GPS Global Positioning System
H
HCVA High Conservation Value Area
I
IBA Important Bird Area
IUCN International Union for Conservation of Nature
K
KBA Key Biodiversity Area
KWFR Kaliwa Watershed Forest Reserve

xiv | ECOLOGICAL ASSESSMENTS IN THE B+WISER SITES
L
LC Least Concern (based on IUCN RedList)
LGU Local Government Unit (barangay and/or municipal levels)
M
MANP Mt. Apo Natural Park
MKNP Mt. Kanla-on Natural Park
MKRNP Mt. Kitanglad Range Natural Park
N
NCIP National Commission on Indigenous Peoples
NLNP Naujan Lake Natural Park & Subwatersheds
NNNP North Negros Natural Park
NSMNP Northern Sierra Madre Natural Park
NT Near Threatened (based on IUCN RedList)
O
OG Old Growth forest
P
PAIC Pleistocene Aggregate Island Complexes
PAMB Protected Area Management Board
PA Protected Area
PAO Proportion of Area Occupied
PSR Pressure-State-Response
R
RR Restricted Range
S SDM Species Distribution Model
U UMRBPL Upper Marikina River Basin Protected Landscape
USAID United States Agency for International Development

ECOLOGICAL ASSESSMENTS IN THE B+WISER SITES | xv
EXECUTIVE SUMMARY
The Philippines Biodiversity and Watersheds Improved for Stronger Economy and Ecosystem
Resilience (B+WISER) Program supports the Department of Environment and Natural Resources
in achieving improved management of natural resources. Delivery of the program is ensured by
the conduct of integrated baseline assessments on forest cover, biodiversity and watershed
functions, in the seven program sites. The results of these assessments will update and enhance
management tools to enable the DENR, local government units, and protected area management
boards to incorporate contemporary concerns of climate change, vulnerability, disaster
preparedness, and integrating ecosystems approach to natural resource management.
This report is a consolidation of the ecological assessments that employed the High Conservation
Value Areas approach or HCVA (Mallari et al. in prep) which aimed at generating robust
ecological baselines on each B+WISER site. Four types of ecological modeling, the Canonical
Correspondence Analysis, Species Occupancy, Distance Sampling, and Maximum Entropy
Algorithm, were employed to generate species-habitat relationships, species’ spatial requirement,
population density estimates, and species distribution models, respectively. These analyses were
complemented with land-cover analysis aimed to generate the extent of forest cover and habitat
gradients (e.g., forest – old growth, advanced second growth, interface of forest and non-forest –
early second growth and non-forest – cultivated areas) for each site. Change detection analysis
was also performed to explicitly locate areas undergoing changes and produce a change matrix
showing the changes between the different land cover classes during the period 2003-2010.
These ecological assessments were conducted in the six B+WISER sites (Northern Sierra Madre
Natural Park, Upper-Marikina River Basin Protected Landscape-Kaliwa Watershed Forest
Reserve, Naujan Lake Natural Park and subwatersheds, Bago River Watershed Forest Reserve
including Mt. Kanla-on Natural Park and North Negros Natural Park, Mt. Kitanglad Range
Natural Park and Mt. Apo Natural Park). These assessments were implemented by Fauna & Flora
International Philippines (FFI PH) in collaboration with Mabuwaya Foundation Incorporated
(MFI) and the Philippine Eagle Foundation Incorporated (PEFI) from March to October 2014.
Through the State, Pressure and Response model, the key findings and recommendations of the
ecological assessment on each site are presented below in tabular form. The STATE section
summarizes the key findings on the land cover analysis, species profile, species-habitat relation,
species occupancy, population density estimates, and species distribution. Under the PRESSURE
section, key findings on the change detection analysis and the identified key drivers of
deforestation are enumerated. Lastly, the RESPONSE section reflects the recommendations based
on the implications of the species survival envelopes (the ecological niche the species can survive
in) on the species.
This report was designed to provide decision-making tools/inputs for protected area management
of the B+WISER Program sites to set specific biodiversity conservation targets. It is envisaged
these scientific inputs will guide park management through the planning process from selection of
target areas or HCVAs, site profiling and zoning to monitoring and evaluating impacts of the
adopted management interventions.

xvi | ECOLOGICAL ASSESSMENTS IN THE B+WISER SITES
B+WISER Ecological Assessment
Sites State Pressure Response
Northern Sierra Madre Natural Park (NSMNP)
Survey performed on site from February to May 2014.
Total forest cover is 276,227 ha
Species recorded: 121 birds, 17 mammals, 19 amphibians, 19 reptiles and 89 trees.
New records for the park include the migratory Pale Thrush (Turdus pallidus), the Crab-eating frog (Fejervarya cancrivora) and the Emerald flying frog (Rhacophorus pardalis).
Forest cover loss from 2003 to 2010 is 10,256 ha (at an annual rate of loss of 1,465 ha/yr).
Key Drivers of Deforestation and Degradation for this site include: hunter trails and live hunter traps, pasture land for carabaos, carabao trails, access trails, irrigation canals, old logging trails, kaingin, and main access roads.
Four HCVAs were identified in these following areas: (1) Municipality of Divilacan: Dicatian, Dicambangan, Ditarum, Dilakit and Bicobian. (2) Municipality of San Mariano: Dibuluan, Disalup and San Jose; (3) Municipality of Palanan: Villa Robles, Bisag, Santa Jacinta, Dicadyuan and Marikit; (4) Municipality of Cabagan: Union
Management plan should be revised in consideration of the HCVAs as core protection zones.
Upper Marikina River Basin Protected Landscape (UMRBPL)-Kaliwa Watershed Forest Reserve (KWFR)
Survey performed in proxy site Ipo Dam Watershed located in Norzagaray, Bulacan in April 21-28 and July 24-August 5, 2014.
Total forest cover is 6,111 ha in UMRBPL and 12,470 ha in KWFR
Species recorded: 20 trees, 93 birds, 12 amphibians, 15 reptiles, and 14 mammals.
16 Luzon endemic species were detected.
Total area deforested in seven years (2003-2010) was 2,247 ha with an annual deforestation rate of 321 ha/yr.
Tanay has the highest net negative change from forest to non-forest.
Key drivers of deforestation for this site include: legal and illegal logging, kaingin and charcoal consumption.
One HCVA identified, located in the municipalities of Rodriguez and Norzagaray.
Management plan should be revised in consideration of the HCVA as core protection zone.
Bago River Watershed Forest Reserve (BRWFR) including Mt. Kanlaon Natural Park (MKNP) and North Negros Natural Park (NNNP)
Survey performed on site from September to October 2014.
Total forest cover as of 2010 is 10,098 ha.
Species recorded: 26 trees, 109 birds, 25 bats, 10 amphibians, and 11 reptiles.
71 Philippine endemic species
were detected. 22 spp. are categorized as threatened.
Noteworthy species include the following: Philippine bare-backed fruit bat, which was captured once, and is Critically Endangered (CR); the endemic and endangered Philippine tube-nosed fruit bat, which was captured several times in both survey sites; threatened species of frogs of the genus Platymantis, were recorded,
From 2003-2010, net forest change is reported at 1,068 ha with Salvador Benedicto having the highest net forest change of 1,014 ha.
Key driver of deforestation and degradation is increasing land conversion. There is also hunting pressure on wildlife species i.e. Visayan warty pigs and Visayan spotted deer, both of which are threatened species.
Three (3) hotspots were
identified and are located in the following areas: (1) Municipality of Salvador Benedicto - Brgy. Bagong Silang, Brgy. Bunga, Brgy. Kumaliskis, Brgy. Igmaya-an, Brgy. Pandanon-silos; Silay City – Brgy. Patag; Municipality of Murcia – Brgy. Canlandog and Brgy.

ECOLOGICAL ASSESSMENTS IN THE B+WISER SITES | xvii
B+WISER Ecological Assessment
Sites State Pressure Response e.g., P. negrosensis, and P. hazelae; and about five species of threatened dipterocarps were recorded.
Buenavista; Talisay City – Brgy. Cabatangan and Brgy. San Fernando; Cadiz - Brgy. Villacin; Sagay City – Brgy. Puey; Municipality of Calatrava – Brgy. Lalong; (2) Brgy. Minoyan, Municipality of Murcia; and (3) Brgy. Cabagnag-an, Municipality of La Castellana.
Naujan Lake National Park (NLNP) and sub-watersheds
Total forest cover in NLNP is estimated at 25,000 ha.
A total of 36 species were used in Species Distribution Modeling. These include three Critically Endangered, two Endangered, and four Vulnerable birds and amphibians.
Forest cover loss reached 3,899 ha (557 ha/yr) from 2003 to 2010.
Five hotspots or priority areas were identified. These are the following: (1) Puerto Galera, Baco, San Teodoro of Oriental Mindoro and Abra de Ilog of Occidental Mindoro; (2) Lubang Group of Islands; (3) Naujan and Pola of Oriental Mindoro; (4) Sablayan of Occidental Mindoro; and (5) San Jose and Magsaysay of Occidental Mindoro.
Three HCVAs were
identified: (1) Puerto Galera, Baco, San Teodoro, Calapan, Naujan, Pola, Victoria and Soccorro of Oriental Mindoro and Abra de Ilog of Occidental Mindoro; (2) Lubang Group of Islands; and (3) Palaun, Mamburao and Sta. Cruz of Occidental Mindoro.
Management plan should be revised in consideration of the HCVAs as core protection zone.
Mt. Kitanglad Range Natural Park (MKRNP)
Survey performed on site
during the months of January,
February, March, and October
2014.
Total forest cover for MKRNP is estimated at 43,000 ha.
Recorded species include: 124 birds, including the Amethyst Brown Dove; 32 mammals; 20 frogs; 15 reptiles; and 81 trees.
Total forest gain is 4,788 ha from 2003 to 2010.
Total forest loss is 1,014 ha from 2003 to 2010.
Threats observed in the area include habitat conversion and logging.
Three hotspots were observed, which are: (1) Municipality of Malaybalay – Brgy. Mapayag and Brgy. Imbayao,Municipality of Sumilao – Brgy. Lupiagan and Brgy. Licoan; (2) Municipality of Libona – Brgy. Sil-ipon and Brgy. Dahilayan, Municipality of Baungon – Brgy. San Vicente; (3) Municipality of Lantapan – Brgy. Kibangan, Brgy. Cawayan, and Brgy. Victory.
Three HCVAs were identified in the following areas: (1) Municipalities of Malaybalay and Sumilao; (2) Municipalities of Libona and Baungon; and (3) Municipality of Lantapan.
Management plan should be revised in consideration of the HCVAs as core protection zone.

xviii | ECOLOGICAL ASSESSMENTS IN THE B+WISER SITES
B+WISER Ecological Assessment
Sites State Pressure Response
Mt. Apo Natural Park (MANP)
Survey done on site from June to July 2014.
Total forest cover for MANP is estimated at 19,000 ha.
Species recorded include 70 birds, 37 of which are Philippine endemics, with 6 species endemic to the island of Mindanao, 20 mammals, 12 amphibians, 7 reptiles, and 76 trees.
Noteworthy species recorded in MANP are the Critically Endangered Philippine Eagle (Pithecophaga jefferyi), and the Philippine Large-headed Fruit Bat (Dyacopterus rickartii).
Forest loss reached 11,088 ha (1,584 ha/year) from 2003 to 2010.
For MANP, identified drivers of deforestation and degradation include cultivated area inside the protected area, resource extraction, management or land conflict, and development such as roads and possible construction of energy resource extraction.
Three hotspot areas were identified in the following locations: (1) Municipalty of Makilala – Brgy. Buhay, Brgy. Garsika, Brgy. New Cebu,Municipality of Bansalang – Brgy. Sibayan, Brgy. Tinungtungan, Municipality of Bigos – Brgy. Kapatagan; (2) Municipality of Davao – Brgy. Talomo, Brgy Tagurano,Municipality of Atan-awe – Brgy. Kapatagan; and (3) Municipality of Sta. Cruz – Brgy. Tibolo.
Three HCVAs were identified in the following areas: (1) Municipalities of Makilala, Bansalang, and Bigos; (2)Municipalities of Davao and Atan-awe; (3) Municipality of Sta.Cruz.
Management plan should be revised in consideration of the HCVAs as core protection zone.

ECOLOGICAL ASSESSMENT IN THE B+WISER SITES | 1
I. INTRODUCTION
1.1. RECOGNIZING THE CONSTRAINTS IN MAKING INFORMED MANAGEMENT
DECISIONS
The gap between management systems/infrastructure and science-based conservation planning
resulting to a mismatch between the conservation needs at the species/sites level and the
Protected Area Management Plans clearly undermines the efficacy of PAs in the Philippines.
This is the same criticism made by many protected areas especially in the developing world
where there is a dearth of technical expertise to support and guide conservation planning
(Carwardine et al. 2007; Lovejoy 2006; Wilson et al. 2007). The mismatch of conservation
intervention vis-à-vis priorities is attributable to a number of factors: (a) national and local
natural resources statutes that lack scientific basis (e.g., Ribot & Peluso 2003); (b) limitations in
the technical capacity in many protected areas (Hayes 2006) and (c) the simplistic data
requirements (e.g., vegetative cover, list of threatened and endangered species and list of threats
to the protected area) and short-cuts for management planning prescribed by law (Lindenmayer
et al. 2006).
This weakness of the management plans of many PAs globally lie in their failure to take into
account the importance of the quality (Johnson 2007) and extent of lowland forests where most
of the threatened species are found (Collar et al. 1999). For example, key lowland habitats and
key species are under enormous anthropogenic or human-induced pressures of habitat loss and
degradation as well as direct exploitation (Wells et al. 2007). The current management regime in
most PAs in the Philippines (including management zoning) were found to be inadequate in
securing these key lowland habitats and species since these key habitats have lower protection
status (i.e. currently designated as buffer zones) than high-elevation forest (i.e. currently
designated as core zone) and there seems to be an absence of a clear conservation program and
biodiversity monitoring protocol (Mallari et al. 2013). Another key finding of the PA assessment
in the Philippines (Mallari et al. 2011) is the importance of intermediate habitats and ecotones
(usually in lowlands), where species richness and abundance was highest. This pattern of
increasing bird species richness and abundance in intermediate habitats illustrated by recent
studies, for example, study of edge effect and ecotonal species; comparison of bird community
differences in mature and secondary growth forest; edge influence on forest structure and
composition in fragmented landscapes; and studies on ecological responses to habitat edges
(Becker & Agreda 2005; Harper et al. 2005). However, with the current zoning system in the
Philippines, all of these lowland second growth forests are in buffer zones or multiple use zones
and are therefore accorded lower protection status. This reinforces the need to incorporate these
habitat types into the strict protection zones bearing in mind the responses of key species to
habitat gradients.
This report was designed to provide decision-making tools/inputs for protected area management
of the B+WISER Program sites to set biodiversity conservation targets that will take into
account people’s legitimate livelihood interests inside or around its boundaries. It is envisaged
that this will provide scientific inputs to guide park management through the planning process
from selection of HCVAs, site profiling, and zoning to monitoring and evaluating impacts of the
adopted management interventions.

2 | ECOLOGICAL ASSESSMENTS IN THE B+WISER SITES
1.2. ADDRESSING THE CONSTRAINTS (TECHNICAL APPROACH: BIODIVERSITY ASSESSMENT VS ECOLOGICAL ASSESSMENT)
Information Tiers
The main agenda of the Convention on Biological Diversity was to develop strategies aimed at
protecting vulnerable species, habitats, and ecosystems (McNeely 1999 and 2004). At the level
of the species, species conservation action plans are developed to address conservation issues of
biodiversity (Mulongoy & Chape 2004) whilst at the level of the habitats/ecosystems or sites,
protected areas are established to address species conservation issues at the landscape level,
which includes many other economic, social, and political dimensions (Lovejoy 2006).
The key weakness in the PA management planning process globally is that the biodiversity
baselines are based only on species richness/diversity data (biodiversity assessments/inventories
or Tier 1), but lack population densities of key species including natural and anthropogenic
(human-induced) determinants of diversity and abundance (Tiers 2&3). Quantitative baselines
such as population densities improve the ability of protected area managers to design appropriate
management interventions as well as provide indicators for change (Brito & Grelle 2004;
Lindenmayer et al. 2008; Monadjem 2003; Purvis et al. 2000). These baselines are also essential
to determine and report the conservation significance of any management intervention through
changes in numbers of target /focal species. Coupled with the minimum required dataset (i.e. list
of threatened and endangered species, vegetative cover and land use, ethnographic forest
occupants’ data) for the General Management Planning Strategy (GMPS)1, the management plan
may now be able to articulate site-level (landscape) conservation strategies as well as species-
level management interventions (Tier 4), which are currently lacking. The hierarchy of the data
organization (following an increasing level of complexity) is as follows:
Tier 1 – Species inventories resulting to identification of species richness and diversity
i.e.ϒ -diversity β-diversity α-diversity. (see section 3.2.1)
Tier 2 – determine Species Survival envelopes. This will inform management of species-
habitat relationships, which indicate levels of tolerance to varying degrees of
habitat ‘naturalness’, and disturbance indices. (see section 3.2.2)
Tier 3 – determine Species Occupancy and Population. At this tier, it is determined how
much of the species is present and how much of the habitat is required to inform
management planning on impacts of natural and anthropogenic factors on key
species. (see section 3.2.3).
Tier 4 – determine hotspots. Here, it is analyzed how much of the habitats required are
available and where these are, (see section 3.4), and their threats are identified.
(see section 4.2.2)
HCVA approach
1 See Implementing Rules and Regulations or the National Integrated Protected Areas System or NIPAS law and the
DENR Department Administrative Order No. 25, Series of 1992

ECOLOGICAL ASSESSMENT IN THE B+WISER SITES | 3
One novel and practical approach in providing the guidance to site managers is the High
Conservation Value Areas (HCVAs) approach. HCVAs are natural areas containing significant
concentration of biodiversity (e.g., endemic and threatened species), providing basic
environmental services, and are culturally important to local communities (FSC 2002). HCVAs
are where biological, ecological, social, or cultural values are considered outstandingly
significant or critically important at the national, regional, or global level. The concept of HCVA
was first introduced by the Forest Stewardship Council (FSC) in 1999 (FSC 2002). It was
originally used in forest management certification until it became widely used in conservation
and natural resources management particularly in identifying priority areas (UNEP-WCMC
2013) even within pre-determined priority areas such as Important Biodiversity/Bird Areas
(Mallari et al. 2001) or Key biodiversity Areas (DENR 2002). Identification of HCVAs is
mainly anchored on FSC principles and criteria (FSC 2002). It includes the compilation of data
on significant record of species and their distribution, in addition to key habitats (e.g., Clark
2006). However, another work (e.g., Kennard 2010) used the combination of spatial
technologies and species records to delineate HCVAs. Examples of HCV approach applications
include their use to identify important aquatic ecosystems in Northern Australia (Kennard 2010)
and forest ecosystems and landscapes in Canada (Timoney and Sherwood Park 2003). The
approach was also used in Reducing Carbon Emissions from forest Degradation and
Deforestation (REDD) projects – a mechanism used to mitigate climate change impacts — in
developing countries e.g., Kasigau Corridor REDD project in Kenya (Freund 2011). In the
Philippines, the Fauna & Flora International is piloting the use of HCV approach for a REDD+
project in Southern Leyte and Southern Palawan (FFI 2013a).
All natural habitats possess some inherent conservation values, including the presence of rare or
endemic species, provision of ecosystem services, sacred sites, or resources harvested by local
residents. However, some values are more significant or critical than others, and the HCVA
approach offers an objective way of identifying which values should be maintained or enhanced.
The key to the concept of HCVAs is the identification of High Conservation Values (HCVs)
(http://www.hcvnetwork.org/about-hcvf/the-six-high-conservation-values). HCVAs must
possess one or more of the following attributes (HCVs):
HCV1 - Areas containing globally, regionally, or nationally significant concentrations of
biodiversity values (e.g., endemism, endangered species, refugia).
HCV2 - Globally, regionally, or nationally significant large landscape-level areas where
viable populations of most if not all naturally occurring species exist in natural
patterns of distribution and abundance.
HCV3 - Areas that are in or contain rare, threatened, or endangered ecosystems, e.g.,
patches of a regionally rare type of freshwater swamp.
HCV4 - Basic ecosystem services in critical situations, including protection of water
catchments and control of erosion of vulnerable soils and slopes, e.g., forest on
steep slopes with avalanche risk above a town.
HCV5 - Areas fundamental to meeting basic needs of local communities (e.g., for
livelihoods, subsistence, health, nutrition, water) identified through engagement
with these communities or indigenous peoples, e.g., key hunting areas for
communities living at subsistence level.

4 | ECOLOGICAL ASSESSMENTS IN THE B+WISER SITES
HCV6 – Sites, resources, habitats, and landscapes of that have national or global or national
cultural, archaeological, or historical significance as well as being and/or of
critical cultural, ecological, economic, or religious/sacred importance to the
traditional cultures of local communities or indigenous peoples identified through
engagement with these local communities or indigenous peoples, e.g., sacred
burial grounds within a forest management area or new agricultural plantation.
HCV criteria and respective identified HCVAs are not mutually exclusive but in many cases
overlap. This ecological assessment focuses on the identification of areas mainly with the first
three attributes or HCV criteria with focus on HCV 1 and 2.

ECOLOGICAL ASSESSMENT IN THE B+WISER SITES | 5
II. RESEARCH METHODOLOGY
2.1 PRE-SURVEY
Stratification and Sampling design
Stratified sampling was used in this assessment. Stratification focused on the habitat particularly
on the different forest classes/habitat types that were based mainly on forest structure
(dominance), elevation, rainfall and degree of disturbance. To achieve this, the following general
approach on stratification was used:
Delineation of the project area boundary.
Review of available literature on the habitat requirements of the focal species or taxa.
Develop a habitat stratification system based on what is expected to coincide with the key
species’ habitat requirements
Use the forest stratification map to review the project area, and select study areas, which
are representative of the project area, in terms of the types of strata they contain.
Lay out on the map the possible location of transects and sample points.
Transect establishment
Main biodiversity transects were established by stratified random sampling along various
disturbance and elevation gradients, such that each would cover different habitat types.
Transects comprised of a 1-or 2-km line with point stations marked at every 250 meters (0.0,
1.0, 2.0….) while transect sections were marked at every 25 meters (0.1, 0.2, 0.3….).
Proxy Sites
The on-going discussions and negotiations with the National Commission on Indigenous Peoples
(NCIP) at various levels caused serious delays in the conduct of baseline ecological assessments
in all relevant B+WISER sites. Because these negotiations took longer than expected, further
delays in the baseline assessments would have very serious effects on the entire project
(PA/watershed planning) cycle. Therefore, proxy sites were identified to establish the baselines
of the B+WISER sites through these ecological equivalents/surrogates or proxy sites.
Table 1 shows the tabulated proxy sites vis-à-vis the relevant B+WISER sites for the Mindoro
and Luzon Sites. Each table shows the species and their corresponding endemic bird areas,
International Union for Conservation of Nature (IUCN) status, and main habitats in each
location. Also listed under are the Priority Important Bird Areas (IBAs), which represent the full
assemblage of key species in that particular bio-geographic region. A combination of these
Priority IBAs should be considered in designing a conservation agenda for the whole area.

6 | ECOLOGICAL ASSESSMENTS IN THE B+WISER SITES
Table 1. List of Endemic Bird Areas (EBAs): Mindoro
SPECIES Endemic
Bird Areas
Red Data Book
MAIN HABITATS
Naujan (main site)
Halcon (proxy site)
Siburan (proxy site)
Philippine Duck Anas luzonica E VU Wetlands X 0 X
Philippine Hawk-eagle Spizaetus philippensis
E VU Forest 0 X X
Mindoro Bleeding-heart Gallicolumba platenae
RR CR Lowland forest X** X X
Mindoro Imperial-pigeon Ducula mindorensis
RR VU Montane forest X** X X
Spotted Imperial-pigeon Ducula carola E VU Forest X** X X
Philippine Cockatoo Cacatua haematuropygia
E CR Lowland forest X** X X
Black-hooded Coucal Centropus
steerii RR CR Lowland forest X** X X
Mindoro Scops-owl Otus mindorensis
RR NT Montane forest X** X X
Mindoro Hornbill Penelopides mindorensis
RR EN Lowland forest X** X X
Mountain Shrike Lanius validirostris RR NT Montane forest 0 X X
Ashy Thrush Zoothera cinerea RR VU Lowland forest X X X
Scarlet-collared Flowerpecker Dicaeum retrocinctum
RR VU Lowland forest 0 X X
X** - species recorded in Mindoro Experimental Forest in Victoria, Oriental Mindoro (not located in Naujan Lake proper).
Key: SPECIES: All threatened and restricted-range species which occur in this EBA are listed, with those species which are endemic to the EBA in bold (note that species marked with an asterisk are mainly confined to the EBA, but are also known by a few records from elsewhere); EBA: Species marked “RR” have restricted ranges, and were used in BirdLife International’s EBA analysis; species marked “E” are national endemics to the Philippines, but are too widespread within the archipelago to be considered to have restricted ranges; RDB: The IUCN threat categories from Collar et al. (1999), CR = Critical, EN = Endangered, VU = Vulnerable, NT = Near Threatened, LC = Least Concern, DD = Data Deficient; MAIN HABITAT: The most important habitat of each species. Note that many “Lowland forest” species may sometimes occur outside this habitat type, and species vary considerably in their tolerance of habitat degradation. Species coded “Forest” either occurs in both lowland and montane forest, and the available data do not clearly indicate a preference for one of these habitat types.
The key points of the above presented tables are summarized to justify proxy site selection.
Key points
Ten restricted-range species occur in this EBA, of which five are confined to it and seven
are globally threatened. An additional four threatened species also occur there.
No large areas of lowland forest remain in the Mindoro EBA, and the three lowland
specialists that are endemic to Mindoro are all highly threatened.
The areas of montane forest that remain on Mindoro are relatively large and less
immediately threatened than the lowland forests, and the two montane specialists which are
endemic to Mindoro are not as highly threatened as the lowland endemics.
The similarity in the bird species composition between the three sites is evidence that
Halcon and Siburan can be used as proxy sites for Naujan.

ECOLOGICAL ASSESSMENT IN THE B+WISER SITES | 7
Priority Important Bird Areas (IBAs)
Siburan is the best remaining area of lowland forest on Mindoro, and therefore a top
priority site for conservation.
Despite their relatively small size, the other areas of lowland forest on Mindoro are also
important: Mt Calavite; Puerto Galera; Mt Halcon; Iglit-Baco Mountains; Malpalon;
Bogbog, Bongabong and Mt Hitdong; and Mt Hinunduang.
Several IBAs contain large areas of montane forest, notably Mt Halcon, and also Iglit-Baco
Mountains and Mt Hinunduang.
All of the IBAs on Mindoro require more detailed ecological assessment.
Particularly poorly known IBAs, where surveys are required to establish both the extent
and quality of the remaining habitats as well as the current status of the birds and other
biodiversity are: Mt Calavite; Lake Naujan; Bogbog, Bongabong and Mt Hitding; and Mt
Hinunduang. Table 2. List of Endemic Bird Areas (EBAs): Luzon
SPECIES Endemic
Bird Areas
Red Data Book
MAIN HABITATS NSMNP (main site)
Angat-Ipo (proxy site)
Spot-billed Pelican Pelecanus philippensis VU Wetlands 0 0
Chinese Egret Egretta eulophotes EN Wetlands 0 0
Japanese Night-heron Gorsachius goisagi VU Forest 0 0
Oriental Stork Ciconia boyciana EN Wetlands X 0
Black-faced Spoonbill Platalea minor CR Wetlands 0 0
Philippine Duck Anas luzonica E VU Wetlands X 0
Philippine Eagle Pithecophaga jefferyi E CR Forest X X
Philippine Hawk-eagle Spizaetus philippensis
E VU Forest X X
Spotted Buttonquail Turnix ocellata* RR LC Grassland X X
Worcester's Buttonquail Turnix worcesteri
RR DD Grassland 0 X
Brown-banded Rail Lewinia mirificus* RR DD Grassland 0 0
Nordmann's Greenshank Tringa guttifer EN Wetlands 0 0
Chinese Crested-tern Sterna bernsteini CR Wetlands 0 0
Luzon Bleeding-heart Gallicolumba luzonica
RR NT Lowland forest X X
Flame-breasted Fruit-dove Ptilinopus
marchei RR VU Montane forest X X
Cream-bellied Fruit-dove Ptilinopus merrilli
RR NT Lowland forest X X
Spotted Imperial-pigeon Ducula carola E VU Forest X X
Philippine Cockatoo Cacatua haematuropygia
E CR Lowland forest X ?
Luzon Racquet-tail Prioniturus montanus
RR NT Montane forest X ?
Green Racquet-tail Prioniturus luconensis
RR VU Lowland forest X X
Red-crested Malkoha Phaenicophaeus superciliosus
RR LC Lowland forest X X
Scale-feathered Malkoha Phaenicophaeus cumingi
RR LC Forest X X
Rufous Coucal Centropus unirufus RR NT Lowland forest X X
Luzon Scops-owl Otus longicornis RR NT Montane forest X X
Philippine Eagle-owl Bubo philippensis E VU Lowland forest X X
Whitehead's Swiftlet Collocalia whiteheadi RR DD Montane forest X X
Philippine Kingfisher Ceyx melanurus E VU Lowland forest X X

8 | ECOLOGICAL ASSESSMENTS IN THE B+WISER SITES
SPECIES Endemic
Bird Areas
Red Data Book
MAIN HABITATS NSMNP (main site)
Angat-Ipo (proxy site)
Luzon Hornbill Penelopides manillae RR LC Lowland forest X X
Whiskered Pitta Pitta kochi RR VU Montane forest X X
Blackish Cuckoo-shrike Coracina coerulescens*
RR LC Lowland forest X X
Mountain Shrike Lanius validirostris RR NT Montane forest X X
Ashy Thrush Zoothera cinerea RR VU Lowland forest X X
Luzon Water-redstart Rhyacornis bicolor RR VU Montane forest X 0
Rabor's Wren-babbler Napothera rabori RR NT Lowland forest X X
Golden-crowned Babbler Stachyris dennistouni
RR NT Lowland forest X 0
Chestnut-faced Babbler Stachyris whiteheadi
RR LC Montane forest X 0
Luzon Striped-babbler Stachyris striata RR NT Lowland forest X X
Ijima's Leaf-warbler Phylloscopus ijimae VU Forest 0 0
Streaked Reed-warbler Acrocephalus sorghophilus
VU Wetlands 0 0
Philippine Bush-warbler Cettia seebohmi RR LC Montane forest 0 0
Long-tailed Bush-warbler Bradypterus caudatus
RR LC Montane forest 0 0
Grey-backed Tailorbird Orthotomus
derbianus* RR LC Lowland forest X X
White-browed Jungle-flycatcher Rhinomyias insignis
RR VU Montane forest X 0
Ashy-breasted Flycatcher Muscicapa randi*
RR VU Lowland forest X X
Furtive Flycatcher Ficedula disposita RR NT Lowland forest X X
Blue-breasted Flycatcher Cyornis herioti RR LC Lowland forest X 0
Short-crested Monarch Hypothymis helenae RR NT Lowland forest X 0
Celestial Monarch Hypothymis coelestis RR VU Lowland forest X X
Green-backed Whistler Pachycephala albiventris
RR LC Forest X 0
White-fronted Tit Parus semilarvatus RR NT Lowland forest X X
Long-billed Rhabdornis Rhabdornis grandis
RR LC Lowland forest X X
Flame-crowned Flowerpecker Dicaeum anthonyi
RR NT Montane forest X 0
White-cheeked Bullfinch Pyrrhula leucogenis
RR LC Montane forest X 0
Green-faced Parrotfinch Erythrura viridifacies
RR VU Montane forest X X
White-lored Oriole Oriolus albiloris RR LC Lowland forest X X
Isabela Oriole Oriolus isabellae RR EN Lowland forest X 0
Yellow Bunting Emberiza sulphurata VU Open areas, scrub 0 0
Key: refer to Table 1 for EBA: Mindoro.
Key points
Forty restricted-range species occur in this EBA, of which 28 are mainly confined to it, and
10 are globally threatened and three are Data Deficient. An additional 17 threatened species
also occur there.
Most of the endemic birds of Luzon occur in both lowland and montane forest, but there are
several lowland forest specialists, and a group of montane species, which are mainly
confined to the Cordillera Central and the montane forests of the Sierra Madre.

ECOLOGICAL ASSESSMENT IN THE B+WISER SITES | 9
The habitat requirements, distributions and seasonal movements of three of the highly
threatened species of Luzon, Worcester's Buttonquail, Brown-banded Rail and Isabela
Oriole, are exceptionally poorly known.
The similarity in the bird species composition between the two sites is evidence that the
Angat-Ipo Watershed can be used as proxy sites.
Priority Important Bird Areas
The NSMNP is exceptional in the Philippines, because of the large area of pristine lowland
forest that survives there, and because unbroken forests extend from the beach forests on
the coast to montane forest on the highest peaks.
Several other IBAs on Luzon are reported to contain substantial areas of lowland forest:
Bataan Natural Park and Subic Bay National Park; Aurora Memorial Park; Angat
Watershed; Mt Makiling; Caramoan peninsula; and Catanduanes Watershed Forest
Reserve . It is possible that significant areas of lowland forest also remain in some of the
more poorly known IBAs, such as Mt Cagua; Central Sierra Madre mountains; Mt
Dingalan; and Mt Irid-Mt Angilo.
The Sierra Madre mountains support an important population of Philippine Eagle, and the
IBAs that are crucial for the survival of the Luzon population, notably: Mt Cetaceo;
Northern Sierra Madre Nature Park; Central Sierra Madre mountains; Aurora Memorial
Park; and Mt Dingalan, and probably also Mt Cagua and Mt Irid-Mt Angilo.
Almost all of the IBAs on Luzon require more detailed ecological assessment.
Table 3. List of Endemic Bird Areas: Negros and Panay
SPECIES Endemic
Bird Areas Red Data
Book MAIN HABITAT
Japanese Night-heron Gorsachius goisagi VU Forest
Philippine Duck Anas luzonica E VU Wetlands
Philippine Hawk-eagle Spizaetus philippensis E VU Forest
Spotted Buttonquail Turnix ocellata RR LC Grassland
Negros Bleeding-heart Gallicolumba keayi RR CR Lowland forest
Negros Fruit-dove Ptilinopus arcanus RR CR Montane forest?
Spotted Imperial-pigeon Ducula carola E VU Forest
Philippine Cockatoo Cacatua haematuropygia E CR Lowland forest
Philippine Needletail Mearnsia picina RR NT Lowland forest
Rufous-lored Kingfisher Todirhamphus winchelli E VU Lowland forest
Visayan Hornbill Penelopides panini RR EN Lowland forest
Writhed-billed Hornbill Aceros waldeni RR CR Lowland forest
White-winged Cuckoo-shrike Coracina ostenta RR VU Lowland forest
Mountain Shrike Lanius validirostris RR NT Montane forest
Flame-templed Babbler Stachyris speciosa RR EN Lowland forest
Panay Striped-babbler Stachyris latistriata RR NT Montane forest
Negros Striped-babbler Stachyris nigrorum RR EN Montane forest
Streaked Reed-warbler Acrocephalus sorghophilus VU Wetlands
White-throated Jungle-flycatcher Rhinomyias albigularis
RR EN Lowland forest
Ashy-breasted Flycatcher Muscicapa randi RR VU Lowland forest
Celestial Monarch Hypothymis coelestis RR VU Lowland forest
Visayan Flowerpecker Dicaeum haematostictum RR VU Lowland forest
Scarlet-collared Flowerpecker Dicaeum retrocinctum
RR VU Lowland forest
Green-faced Parrotfinch Erythrura viridifacies RR VU Montane forest
Key: see the table for EBA 150: Mindoro.

10 | ECOLOGICAL ASSESSMENTS IN THE B+WISER SITES
Key points:
Seventeen restricted-range species occur in this EBA, of which 10 are confined to it and 13
are globally threatened. An additional seven threatened species also occur there.
Very few extensive areas of lowland forest remain in the Negros and Panay EBA, and five
of the seven lowland and lower montane specialists that are endemic to this EBA are highly
threatened.
The areas of montane forest which remain on Negros and Panay are relatively large and
less immediately threatened than the lowland forests, and the two montane specialists that
are endemic to this EBA are not as highly threatened as the lowland endemics.
Priority Important Bird Areas
Despite their relatively small size, the other areas of lowland forest on Negros and Panay
are also important: lower altitude forests in Mt. Kanlaon National Park (MKNP); Ban-ban;
and Hinoba-an.
Several IBAs contain large areas of montane forest, notably the Central Panay Mountains
and MKNP, and also Mt Silay and Mt Mandalangan and the Cuernos de Negros.
MKNP is the only known locality in the world for the Negros Fruit-dove, although there
are no recent confirmed records there.
The Central Panay Mountains IBA supports the entire global population of the Panay
Striped-babbler.
Cuernos de Negros is the most important locality in the world for Negros Striped-babbler
(which is otherwise only known by a single record in Mt Kanlaon National Park.
All of the IBAs on Negros and Panay require more detailed biological surveys
A particularly poorly known IBA, where surveys are required to establish the extent and
quality of the remaining lowland forests and the current status of the birds and other
biodiversity is the western section of the Cuernos de Negros.
The applicability of looking at this in the case of Bago Watershed is that since it is not an
identified IBA, and therefore, at the outset, it has low biodiversity value. Therefore, the
Negros-Panay biogeographic region was examined to ascertain the combination of IBAs
that will ensure full coverage and representativeness of this biogeographic region. In this
analysis, it shows that the Kanlaon and Negros IBAs represent biodiversity assemblages
that represent this biogeographic area. By adding these two IBAs to Bago Watershed, its
biodiversity value increases.
Table 4. List of Endemic Bird Areas: Mindanao and the Eastern Visayas
SPECIES Endemic
Bird Areas Red Data
Book MAIN HABITAT
Spot-billed Pelican Pelecanus philippensis VU Wetlands
Chinese Egret Egretta eulophotes EN Wetlands
Japanese Night-heron Gorsachius goisagi VU Forest
Philippine Duck Anas luzonica E VU Wetlands
Philippine Eagle Pithecophaga jefferyi E CR Forest
Philippine Hawk-eagle Spizaetus philippensis E VU Forest
Brown-banded Rail Lewinia mirificus RR DD Grassland?
Mindanao Bleeding-heart Gallicolumba criniger RR EN Lowland forest
Mindanao Brown-dove Phapitreron brunneiceps RR VU Forest
Spotted Imperial-pigeon Ducula carola E VU Forest
Mindanao Lorikeet Trichoglossus johnstoniae RR NT Montane forest
Philippine Cockatoo Cacatua haematuropygia E CR Lowland forest
Mindanao Racquet-tail Prioniturus waterstradti RR NT Montane forest
Mindanao Scops-owl Otus mirus RR NT Montane forest

ECOLOGICAL ASSESSMENT IN THE B+WISER SITES | 11
SPECIES Endemic
Bird Areas Red Data
Book MAIN HABITAT
Lesser Eagle-owl Mimizuku gurneyi RR VU Lowland forest
Philippine Eagle-owl Bubo philippensis E VU Lowland forest
Whitehead's Swiftlet Collocalia whiteheadi RR DD Montane forest
Philippine Needletail Mearnsia picina RR NT Lowland forest
Silvery Kingfisher Alcedo argentata RR VU Lowland forest
Philippine Kingfisher Ceyx melanurus E VU Lowland forest
Rufous-lored Kingfisher Todirhamphus winchelli E VU Lowland forest
Blue-capped Kingfisher Actenoides hombroni RR VU Montane forest
Samar Hornbill Penelopides samarensis RR LC Lowland forest
Mindanao Hornbill Penelopides affinis RR LC Lowland forest
Writhed Hornbill Aceros leucocephalus RR NT Lowland forest
Wattled Broadbill Eurylaimus steerii RR VU Lowland forest
Visayan Broadbill Eurylaimus samarensis RR VU Lowland forest
Azure-breasted Pitta Pitta steerii RR VU Lowland forest
McGregor's Cuckoo-shrike Coracina mcgregori RR NT Montane forest
Zamboanga Bulbul Ixos rufigularis RR NT Forest
Yellowish Bulbul Ixos everetti RR LC Lowland forest
Philippine Leafbird Chloropsis flavipennis RR VU Lowland forest
Mountain Shrike Lanius validirostris RR NT Montane forest
Bagobo Babbler Trichastoma woodi RR LC Montane forest
Striated Wren-babbler Ptilocichla mindanensis RR LC Lowland forest
Pygmy Babbler Stachyris plateni RR NT Lowland forest
Rusty-crowned Babbler Stachyris capitalis RR LC Lowland forest
Miniature Tit-babbler Micromacronus leytensis RR DD Forest
Long-tailed Bush-warbler Bradypterus caudatus RR LC Montane forest
Streaked Reed-warbler Acrocephalus sorghophilus VU Wetlands
Rufous-headed Tailorbird Orthotomus heterolaemus
RR LC Montane forest
Yellow-breasted Tailorbird Orthotomus
samarensis RR NT Lowland forest
Black-headed Tailorbird Orthotomus nigriceps RR LC Lowland forest
White-eared Tailorbird Orthotomus cinereiceps RR LC Lowland forest
Slaty-backed Jungle-flycatcher Rhinomyias goodfellowi
RR NT Montane forest
Ashy-breasted Flycatcher Muscicapa randi RR VU Lowland forest
Little Slaty Flycatcher Ficedula basilanica RR VU Lowland forest
Cryptic Flycatcher Ficedula crypta RR LC Forest
Short-crested Monarch Hypothymis helenae RR NT Lowland forest
Celestial Monarch Hypothymis coelestis RR VU Lowland forest
Black-and-cinnamon Fantail Rhipidura nigrocinnamomea
RR LC Montane forest
White-fronted Tit Parus semilarvatus RR NT Lowland forest
Whiskered Flowerpecker Dicaeum proprium RR NT Montane forest
Olive-capped Flowerpecker Dicaeum nigrilore RR LC Montane forest
Flame-crowned Flowerpecker Dicaeum anthonyi RR NT Montane forest
Grey-hooded Sunbird Aethopyga primigenius RR NT Montane forest
Apo Sunbird Aethopyga boltoni RR NT Montane forest
Lina's Sunbird Aethopyga linaraborae RR NT Montane forest
Black-masked White-eye Lophozosterops goodfellowi
RR LC Montane forest
Cinnamon Ibon Hypocryptadius cinnamomeus RR LC Montane forest
Mountain Serin Serinus estherae RR LC Montane forest
White-cheeked Bullfinch Pyrrhula leucogenis RR LC Montane forest
Red-eared Parrotfinch Erythrura coloria RR NT Montane forest
Apo Myna Basilornis miranda RR NT Montane forest
Key: see the table for EBA 150: Mindoro.

12 | ECOLOGICAL ASSESSMENTS IN THE B+WISER SITES
Key points
Fifty-two restricted-range species occur in this EBA, of which 39 are confined to it, 12 are
globally threatened and three are Data Deficient. An additional 12 threatened species also
occur there.
The Mindanao and Eastern Visayas EBAs have distinct lowland and montane avifaunas,
with 27 of the threatened and restricted-range birds confined to lowland forest, and 24
confined to montane forest.
The lowland forests are under great pressure and are being rapidly lost, and many of the
endemic lowland forest birds are threatened.
The montane forests are relatively secure, and few of the endemic montane forest birds are
threatened.
Some of the restricted-range species are confined to particular parts of the EBA, notably
Samar Hornbill, Visayan Broadbill and Yellow-breasted Tailorbird, which are found only
on Samar, Leyte and Bohol, and Zamboanga Bulbul, which is mainly confined to the
Zamboanga peninsula in western Mindanao.
Priority IBAs
Several of the large protected areas on Mindanao formerly included substantial areas of
lowland forest, but have now lost most of this habitat type, notably: Mt Kitanglad; Mt Apo;
and Mt Malindang.
Several IBAs contain large areas of montane forest which are likely to support populations
of most of the montane threatened and endemic birds of the Mindanao and Eastern Visayas
EBA: Mt Hilong-hilong; Mt Puting Bato-Kampalili-Mayo complex; Mt Kaluayan-Mt
Kinabalian complex; Mt Kitanglad; Kalatungan Mountains; Mt Piagayungan; Mt Apo; Mt
Matutum; Mt Busa-Kiamba; and Mt Malindang.
Many IBAs on Samar, Leyte and Mindanao support important populations of Philippine
Eagle, and together form networks of sites which are essential for the survival of the
remaining populations of this Critically Endangered species.
Particularly poorly known IBAs, where surveys are required to establish the extent and
quality of the remaining forests and the current status of the birds and other biodiversity
are: Mt Yacgun-Mt Sohoton complex; Bulosao River Watershed Forest Reserve; Mt
Nacolod; Mt Balatukan; Mt Kaluayan-Mt Kinabalian complex; Mt Tago Range;
Kalatungan Mountains; Butig Mountains; Liguasan Marsh; Mt Daguma; Mt Timolan; and
Lituban-Quipit Watersheds.
In this case, looking at Priority IBAs, including MKRNP and MANP which are in the same
biogeographic region, helps in validating the additionality of having two sites. Transect layout
The site level figures that follow show transects and sampling points that were surveyed for each
B+WISER site.

ECOLOGICAL ASSESSMENT IN THE B+WISER SITES | 13
Northern Sierra Madre Natural Park (NSMNP)
The ecological assessment for NSMNP was conducted in Dicaruyan, Ilagan and Sapinit from
February to May 2014. Eighteen transects, measuring 34.5 km, were surveyed that span an
elevation range from 38 meters above sea level (masl) to 732 masl.
Figure 1. Transects surveyed in Northern Sierra Madre Natural Park.

14 | ECOLOGICAL ASSESSMENTS IN THE B+WISER SITES
Kaliwa Watershed Forest Reserve (KWFR) and Upper Marikina River Basin Protected Landscape (UMRBPL)
The ecological assessment was conducted in Ipo Dam, a proxy site for the UMRBPL-KWFR.
This was the consequence of insurgency problems and issues regarding the certificate of
precondition in the actual B+WISER site. Six transect lines were established and surveyed in Ipo
Dam, Norzagaray, Bulacan in April 21-28 and July 24-August 5, 2014.
Figure 2. Transects surveyed in Ipo Dam, Norzagary, Bulacan and boundaries for Kaliwa Forest Watershed Reserve and Upper Marikina Basin
Protected Landscape.

ECOLOGICAL ASSESSMENT IN THE B+WISER SITES | 15
Bago River Watershed, Mt Kanlaon Natural Park (MKNP) and North Negros Natural Park (NNNP)
The ecological assessment for Bago Watershed, MKNP and NNNP were conducted in Brgy.
Bagong Silang, Salvador Benedicto, and Brgy. Mailum, Bago City between September and
October 2014. A total of 14 transects were sampled, of which seven were established per
locality.
Figure 3. Transects surveyed in Bago River Watershed Forest Reserve.

16 | ECOLOGICAL ASSESSMENTS IN THE B+WISER SITES
Mt. Kitanglad Range Natural Park (MKRNP)
For MKRNP, the ecological assessment was conducted in Barangay Kaatuan (January 22 –
February 14 and October 27 – 30), Barangay Lupiagan (February 21 – March 19), Barangay
Lacolac (October 20 – 23, and Barangay Ondingan (October 24 – 25) – all in 2014. A total of 24
transects were established. Twelve were surveyed in Kaatuan, eight in Luipiagan, three in
Lacolac and one transect in Ondingan.
Figure 4. Transects surveyed in Mt. Kitanglad Range Natural Park.
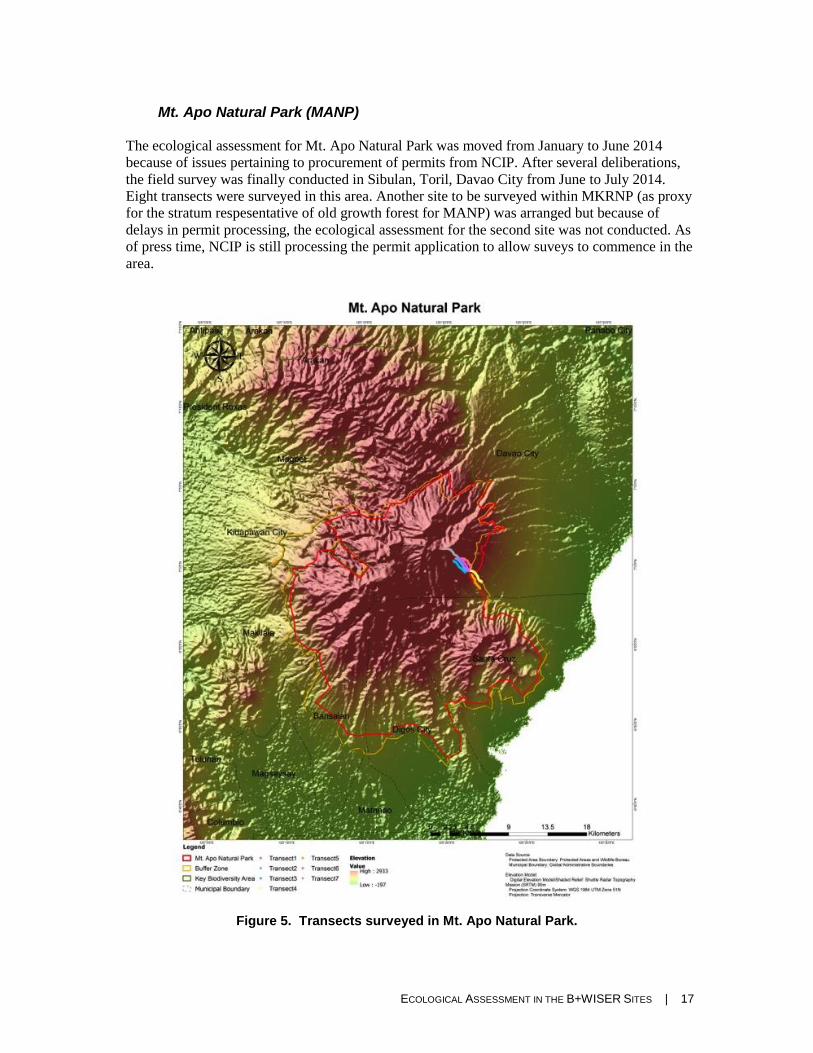
ECOLOGICAL ASSESSMENT IN THE B+WISER SITES | 17
Mt. Apo Natural Park (MANP)
The ecological assessment for Mt. Apo Natural Park was moved from January to June 2014
because of issues pertaining to procurement of permits from NCIP. After several deliberations,
the field survey was finally conducted in Sibulan, Toril, Davao City from June to July 2014.
Eight transects were surveyed in this area. Another site to be surveyed within MKRNP (as proxy
for the stratum respesentative of old growth forest for MANP) was arranged but because of
delays in permit processing, the ecological assessment for the second site was not conducted. As
of press time, NCIP is still processing the permit application to allow suveys to commence in the
area.
Figure 5. Transects surveyed in Mt. Apo Natural Park.

18 | ECOLOGICAL ASSESSMENTS IN THE B+WISER SITES
2.2. FIELD SURVEY PROPER
Vegetation/Habitat Assessment (Tier 1)
Habitat assessment was conducted in three phases: (i) the Broad Habitat Classification, (ii) the
Detailed Habitat Assessment, and (iii) Tree Diversity and Stand Composition.
Broad Habitat Classification
Broad habitat types (cultivation, early second growth, advanced second growth, old growth
dipterocarp, and old growth mossy forest) were identified for every point station and transect
section. Table 5 gives a description of these habitat types as adapted from Mallari et al. (2011):
Table 5. Description of the different habitat types adapted from Mallari et al. (2011)
Habitat types Description
Cultivation (CVT)
- areas with active or recently abandoned farmland; included grasslands, brushlands, agricultural plots, and small orchards with fruit trees ≤ 4 meters tall.
Early Second Growth forests (ESG)
- areas of newly regenerating forest (< 20 years old) dominated by saplings and other small- to medium-sized trees
Advanced Secondary Growth forests (ASG)
- forests that are c. 20–40 years old, which have a less dense understorey and are dominated by medium to large trees
Old Growth forests (OG)
- Divided in two categories, namely mixed-dipterocarp forest and mossy forest. a. Mixed Dipterocarp forest (OGD) - Members of the family Dipterocarpacea
dominate this forest type in terms of biomass and emergents. This also includes the five recognised subtypes, namely: Lauan forest, Lauan-apitong forest, Yakal-lauan forest, Lauan-hagakhak, and Montane forest (Razal et.al. 2003). Extent of the area is not limited to the lower and upper altitudinal limit of the dipterocarp forest but also includes primary forest or forests >40 years old which are dominated by large to very large trees and have a less complex understorey compared to ESG and ASG.
b. Mossy forest (OGM) - consists of dwarfed and stunted trees with trunks and branches commonly covered with epiphytes (mosses and liverworts) and occur in high elevation areas (usually above 1000 m elevation with the upper limits varying depending on the locality and height of the mountains) having relatively low temperature, high and uniform humidity, short sunshine duration, and strong winds (Razal et.al.2003).
Detailed Habitat Assessment
Habitat variables were recorded at every point station using the variable circular plot method and
modified point-center quarter method, which is nested within a 10-meter, and 20-meter radius.
The variable circular plot was placed perpendicular to the main transect and subdivided into four
quarters (NW, NE, SE and SW). Table 6 summarizes the physical and structural habitat
parameters sampled:

ECOLOGICAL ASSESSMENT IN THE B+WISER SITES | 19
Table 6. Summary list of sampled habitat parameters sampled in every point station with its corresponding coverage.
Habitat parameters Coverage
a. General Habitat (Forest threat parameters)
• Presence of dead wood and fallen trees >30 cm dbh (natural and cut), • Presence of fruiting trees and flowering trees. • Percentage cover of canopy, midstorey, and understorey. • Humus or leaf litter thickness • Signs of anthropogenic disturbances occurring in the plot.
20 m
b. Understorey Parameters*
• Percentage ground cover of moss, ferns, grass, herbs, rock, leaf litter and ground (bare soil)
• Number of saplings, palms, and pandan per strata • Number of clumps of rattan and bamboo per strata
20 m
c. Overstorey Parameters**
• Tree species name • Tree height, merchantable height, canopy height, crown cover and diameter (DBH) • Presence of scarring, lianas and climbing bamboo in each measured tree
10 m
d. Biophysical parameters
• Distance of water (<100 m) from the center point of the plot • Distance from the forest edge, valley bottom, and the ridge tops • Position and altitude of the point station using a global positioning system (GPS)
receiver
Note: *The parameters were measured vertically in each quadrat within the range of 0-0.5m, 0.5-2m, 2-5m and 5-12m ** Five nearest trees in each quarter with greater than 25 cm diameter at breast height (DBH) were measured in this parameter. The distance from the center point of the plot to the nearest tree was at least 0.1meter.
Tree Diversity and Stand Composition
The numbers of trees within the given radius and DBH range including its species name were
also recorded. Trees 25-50cm, 50-100 cm, and above 100 cm DBH were tallied within a 20-
meter radius while 6-12 cm and 12-25 cm DBH were recorded within 10-m radius.
Faunal Assessment (Tier 1)
Avifauna
Bird samplings were conducted at dawn when bird activity is highest (Loiselle & Blake 1991).
A combination of the Variable Transect Width Method (transect walk) and the Variable Circular
Width Method (point count) were employed on the main biodiversity transect lines sampled for
this survey. During favourable weather conditions all birds that were observed visually or
aurally were recorded at a transect walk speed of 1 km/hr. The perpendicular distances from the
bird(s) to the transect line were also recorded. Point counts were done by recording all birds
observed for eight minutes at every point station and measuring the distance from the sample to
the point station. Additional parameters were noted which includes: number of birds in a group,
type of contact, height from where the sample was first encountered, and its activity. The bird
samplings were repeated on a different day in the reverse direction to minimise bias due to route
direction (Karr 1981), bird activity, and the time of day.

20 | ECOLOGICAL ASSESSMENTS IN THE B+WISER SITES
Mammals
Survey technique using mist nets and cage traps were used in determining the species occurrence
of mammals. Additional ethno-survey amongst local people and indirect evidences of species
presence such as feces/scats, footprints, bite marks, and other indicators. The survey focused on
Volant (bats) Non-Volant (rodents) mammals.
In capturing Volant (flying) ammals, mist nets measuring 6-m and 12-m were used. These mist
nets were set along natural flyways and laid at varying points within the designated main
transect line. The nets were left open for two consecutive nights per transect. Nets were left open
daily from dusk (between five and six o’clock, depending on the time of year) until nine o’clock
in the evening. Nets were checked and trapped animals were removed and kept for identification
and biometrics every 30 minutes or more frequent. The nets were kept closed in days when
weather was bad to: (i) avoid possible capture of non-target species such as nocturnal birds; (ii)
to prevent excessive entanglement in the nets that may result to eventual death of specimen/s;
and (iii) to avoid possible escape of trapped specimen.
To capture non-volant mammals (rodents), live traps baited with roasted coconut coated with
peanut butter (in combination with dried fish in some occasions) were used. A minimum of three
trap lines, spread across the two-kilometer transect were laid per transect line. Each trap line is
composed of at least eight live traps that were set in strategic areas (i.e. tree stumps, natural
pathways, dead logs, etc.), where target species are more likely to be observed or encountered.
Traps were set 5–10 m apart within the trap line, noting the distance of each of the traps from the
nearest transect section of the main transect line. Baiting and re-baiting of traps were done twice
daily - in the afternoon and in the morning, after the traps were checked for possible catch.
Trapped animals were brought to the camp for biometrics and proper identification.
Other pertinent data per transect that were recorded include the following:
i. Specific coordinates of each of the established net line and trap line (whenever possible);
ii. Distance of the trap (mist net or live trap) from the main transect line and/or body of
water;
iii. Photograph of species caught from the mist net or live trap; and
iv. Presence or absence of fruiting tree/s and cave/s in the area.
Amphibians and Reptiles
A combination of methods was used to sample reptiles and amphibians. The herpetofauna
surveys were performed in the daytime (0800-1100H and 1300-1600H) and nighttime (1800-
2300H). Frogs, froglets, tadpoles, and lizards were collected by hand or with the use of hand
nets and dip nets. Snake hooks or sticks were used to capture snakes and only experienced field
technicians were allowed to handle snakes. Methods used for the survey are as follows:
Transect sampling. This method was used to generate information on species
assemblages and richness of the different survey sites. Two types of sampling efforts
were executed: sampling in a given habitat type and sampling across a gradient of habitat
types and elevation.
Plot sampling. Plots measuring 100m x 10m representing different vegetation strata, were
randomly surveyed for species richness and density of reptiles and amphibians. Data
generated from this sampling technique can be used later to monitor the herpetofauna in
the area.

ECOLOGICAL ASSESSMENT IN THE B+WISER SITES | 21
Microhabitat sampling. Specific microhabitats were searched intensively for any
occupying reptile or amphibian species. Sampling was conducted within 5 to 30 minutes
in areas where the herpetofauna are most likely to be encountered, such as tree holes,
barks, tree buttresses, forest floor, palm and aroid leaf axils, epiphytes, tree ferns, aerial
ferns, puddles, as well as lotic and lentic bodies of water (Diesmos 1998).
2.3. DETERMINATION OF KEY DRIVERS OF DEFORESTATION AND
DEGRADATION Threats that were observed at the transect level in the project site were recorded by the team. It is
envisaged that these threats are validated and triangulated by the results of the other teams, i.e.,
the socioeconomic, governance, and field management teams. Photos for documentation were
also taken, some of which are presented on page 107.
2.4. DATA PROCESSING AND ANALYSIS
Species-habitat Ordination analysis (Tier 2)
To show the relationships between species and their environment, an ordination technique called
the Canonical Correspondence Analysis (CCA) was used (ter Braak, 1986; Braak, 1987). CCA is
a multivariate analytic method that determines the association of two sets of variables: (1) the
dependent matrix, which refers to the species to be ordinated, and (2) the environmental matrix,
which are measurable ecological parameters that describe environmental conditions. This results
into a final ordination diagram where species and environmental data are incorporated.
NSMNP: 35 species and 23 environmental variables for birds, and 36 species and 24
variables for flora. Only species with >5 observations were included in the analysis
(Appendix 7.3.1.1).
Kaliwa and UMRBPL: Thirty-seven species of birds; 23 species of trees; 16 mammals
and 16 species of herpetofauna were used in the CCA (Appendix 7.3.1.2).
Bago: Flora: 26 species and 21 environmental variables; birds: 34 species and 19 habitat
variables; amphibians: 11 species and 23 environmental variables; reptiles: 12 species
and 30 environmental variable; and mammals: 13 species and 18 environmental
variables. Only species with >5 observations were included in the analysis (Appendix
7.3.1.3).
MKRNP: 40 species and 23 environmental variables for birds, 13 bats and 25
environmental variables, 21 species of reptiles and 17 environmental variables, and 22
species and 18 habitat covariates for amphibians were used. A total of 46 species and 15
habitat covariates were used for CCA of flora (Appendix 7.3.1.4)
MANP: 40 species and 23 environmental variables for birds, 13 bats and 25
environmental variables, 21 species of reptiles and 17 environmental variables, and 22
species and 18 habitat covariates for amphibians were used. A total of 46 species and 15
habitat covariates were used for CCA of flora (Appendix 7.3.1.5).
CCA was performed in R v.3.1.1 using the vegan 2.0 package (Oksanen et al. 2007).

22 | ECOLOGICAL ASSESSMENTS IN THE B+WISER SITES
Species Occupancy Modeling (Tier 3)
Determination of species space requirement or the proportion of area occupied by the species ()
was done using PRESENCE v.3.1 (Hines 2006). The contribution of a particular environmental
factor (ω) on species occupancy was determined using the Akaike Information Criterion (AIC)
cumulative model weight. Environmental variable used in the analysis were as follows:
NSMNP: The modeling was performed on six species of bats, 20 bird species, 25 tree
species and 25 amphibians and reptiles.
Kaliwa and UMRBPL: The modeling was performed on 15 species of bats, 15 birds, 13
trees and 14 amphibians and reptiles.
Bago: The modeling was performed for 12 species of trees, 31 birds, 11 amphibians, 13
reptiles, and 12 bats.
MKRNP: The modeling was performed for 9 species of trees, 18 species of birds, 15
amphibians, 11 reptiles and 12 bats. MANP: The modeling was performed for 18 species
of birds, 15 amphibians, 11 reptiles and 12 bats.
Estimating Populations of Key species (Tier 3)
Estimation of population of key species was done only for the NSMNP site because it has the
most robust set of data. The criterion for selection for analysis is that there must be at least 30
unique encounters per species. Twenty-three species of birds were analyzed. The other sites have
low encounter rates partially due to the fact that the assessments were done during rainy season.
Species population density was estimated using the distance sampling technique
(Buckland 1993; Buckland et al. 2004). Point count data, species radial distance and area
of habitats were used to perform the analysis.
Program Distance v.6.0. (Thomas et al. 2010) was used. Half-normal key function was
used and the best model fit was chosen based on lowest AIC score.
Post-stratification was performed to determine the variation of population density across
different habitat types.
The result of the analysis is presented in a table showing the estimated population density
of each species on each habitat type.
Species Distribution Modeling (Tier 4)
Species distribution models were produced using the Maximum Entropy Algorithm (MAXENT)
v.3.3.3.k. (Phillips et al. 2006).
NSMNP: Four species of bats, 51 birds, 26 trees and 10 reptiles and amphibians. Species
with <5 occurrences were not included in the analysis.
Kaliwa and UMRBPL: Only species of birds were used. The other taxa were not included
in the analysis since they have species with <5 occurrences.
NLNP: Twelve birds and 10 herpetofauna while 15 environmental variables were used.
Bago: Five species of flora, 31 birds, 12 reptiles and amphibians, and seven mammals
were used to run the analysis. Species with <5 occurrences were not included in the
analysis. Five environmental variables (per taxa) were used as predictors. Elevation and
climate datasets were obtained from WorldClim (Hijmans et al. 2005), land cover 2009

ECOLOGICAL ASSESSMENT IN THE B+WISER SITES | 23
from European Space Agency (ESA; Bontemps et al. 2010) and soil from Harmonized
World Soil Database (HWSD; Nachtergaele et al. 2009).
MKRNP: Twelve birds and 10 species of trees were used. Species with <5 occurrences
were not included in the analysis. Fifteen environmental variables comprising of
temperature, precipitation, elevation and land cover were used. Elevation and climate
datasets were obtained from WorldClim (Hijmans et al. 2005), land cover 2009 from
European Space Agency (ESA; Bontemps et al. 2010) and soil from Harmonized World
Soil Database (HWSD; Nachtergaele et al. 2009).
MANP: Twenty-four environmental variables comprising of temperature, precipitation,
elevation and land cover were used. Elevation and climate datasets were obtained from
WorldClim (Hijmans et al. 2005), land cover 2009 from European Space Agency (ESA;
Bontemps et al. 2010) and soil from Harmonized World Soil Database (HWSD;
Nachtergaele et al. 2009).
Species distribution models were presented as maps (Sec 3.4).
2.5. SPECIES AND SITE DIAGNOSIS
Determining Species survival envelopes (Tier 2)
The results of the CCA were presented in an ordination diagram where the points represent the
species and the vectors indicate the environmental variables. Clustering of points indicate the
relationship of the species and the environmental variables (Appendix 7.3). Niche width and
niche position was presented using a boxplot. Species niche width and niche position indicates
the habitat preference and tolerance of the species. These were determined using the CCA site
scores for all taxa used (Appendix 7.3). The results from the boxplot were tabularized to easily
show the habitat preference or the tolerance of a species to various habitat alterations (see section
3.2 Results of Ordination).
Analysis of congruence of the various Species Distribution Models (Tier 4)
Key species to model were selected based on several factors such as conservation status,
extent of occurrence, surrogate or proxy species and number of available records.
All model output were collated and transformed into binary maps (0-absence; 1-
presence).
Using GIS, all rasters were added to produce another raster grid, which contains the
richness or overlaps of the species. The maximum number of overlaps must be the total
number of key species modeled.
Areas with high value for conservation were then determined through the output maps of
areas with high number of species overlaps.
Identifying hotspots of land use changes via change detection analysis (Tier 4)
Prior to identifying the hotspots for the different B+WISER sites, historical forest cover
change analysis was conducted using NAMRIA 2003 and 2010 land cover maps in each
of the sites. Land area figures of forest changes were computed using ArcGIS v.10. Areas
showing forest loss or change from forest in 2003 to non-forest in 2010 were identified as
hotspots. The forest change areas were overlaid with results of Maxent species
distribution models to show pressures (forest loss) vis-a-vis high species richness areas in
each of the sites.

24 | ECOLOGICAL ASSESSMENTS IN THE B+WISER SITES
2.6. SURVEY EFFORT
The total survey effort for each site is tabulated below by site (Tables 7-12). This includes the
total transect length and sampling points that were surveyed throughout the sites. This also
includes the total number of trap nights and net nights for mammals, and net hours surveyed for
birds. Overall, the survey effort for all sites is as follows:
Table 7. Overall survey effort for all sites.
Assessment Group Total Survey Effort
Habitat & Flora 141.5 km (700 stations)
Avifaunal 264.5 km (1404 stations)
Mammals 2446 net nights (volant mammals) 3204 trap nights (non-volant mammals)
Amphibians & Reptiles 232 km (1192 stations)
Table 8. Survey effort for NSMNP
Assessment Group Total Survey Effort
Habitat & Flora 34.5 km (154 stations)
Avifaunal 68.5 km (304 stations)
Mammals 496 net nights (volant mammals) 1054 trap nights (non-volant mammals)
Amphibians & Reptiles 102 km (472 stations)
Table 9. Survey effort for Kaliwa and UMRBPL
Assessment Group
Total Survey Effort
Habitat and Flora
19 km transect 86 point station
Avifaunal 20 km transect 180 sampling points
Mammals 10km transect 320 net nights (volant mammals)
Amphibians & Reptiles 72 sampling points
The ecological assessment was not conducted in NLNP because the permits needed to conduct
the field survey were not issued on time. Nonetheless, ecological modeling was done from data
collected from Philippine National Museum, California Academy of Sciences, Field Museum of
Natural History, and Kansas University.

ECOLOGICAL ASSESSMENT IN THE B+WISER SITES | 25
Table 10. Survey effort for BRWFR
Assessment Group Total Survey Effort
Habitat and Flora 26 km transect 118 point stations
Avifaunal 52 km transect 236 point stations
Mammals 250 net nights (volant mammals) 360 trap nights (non-volant mammals)
Amphibians & Reptiles 10 km transect 90 point stations
Table 11. Survey effort for MKRNP
Table 12. Survey effort for MANP
Assessment Group
Total Survey Effort
Habitat and Trees 14 km transect
126 survey points
Avifauna 28 km transect
252 survey points
3500 net hours
Mammals 14 km transect
126 survey points
490 trap nights (non-volant mammals)
350 net nights (volant mammals)
Amphibians and Reptiles 14 km transect
126 survey points
Assessment Group Total Survey Effort
Habitat and Trees 48-km transect
216 survey points
Birds 96-km transect
432 survey points
9700 net hours
Mammas 96-km transect
432 survey points
1200 net nights (volant mammals)
1120 trap nights (non-volant mamals)
Amphibians and Reptiles 96-km transect
432 survey points

26 | ECOLOGICAL ASSESSMENTS IN THE B+WISER SITES
III. RESULTS AND DISCUSSION
3.1. SPECIES RICHNESS, ENDEMISM AND IUCN THREAT STATUS
In this section the results of the species (=biodiversity) inventories (see Tier 1 in section 1.2)
across the sites are presented, with focus on the measures of species richness (number of species),
endemism and their IUCN status. Notable species records per site are highlighted. The results of
this Tier 1 analysis will then feed into the Tier 2 and Tier 3 analyses in the succeeding sections.
NSMNP
A total of 265 species of flora and fauna were recorded in NSMNP. Among the faunal species,
birds were the most numerous with 121 species observed, including the migratory Pale Thrush
(Turdus pallidus). This is followed by amphibians and reptiles with 19 species recorded for each
taxon, including the Crab-eating frog (Fejervarya cancrivora) and the Emerald flying frog
(Rhacophorus pardalis), which are new records for the park. Seventeen mammals were also
recorded and 89 species trees were observed. Table 13 below summarizes the number of endemic
and threatened species in NSMNP. For the total list of species recorded during the survey, see
Appendix 7.1.1.
Table 13. Summary of endemicity and the threatened status (according to the 2014 IUCN
Red List) of species surveyed in NSMNP.
Taxa Philippine Endemic
Non Endemic
Threatened Total
CR EN VU
Flora (trees) 8 (9%) 81 (91%) 10 (11%) 3 (3%) 18 (20%) 89
Birds 56 (46.3%) 65 (53.7%) 0 (0%) 0 (0%) 5 (4%) 121
Mammals 8 (47%) 9 (53%) 0 (0%) 0 (0%) 2 (12%) 17
Amphibians 13 (68%) 6 (32%) 0 (0%) 2 (11%) 3 (16%) 19
Reptiles 15 (79%) 4 (21%) 0 (0%) 0 (0%) 2 (11%) 19
Note: Values in parentheses are percentages (%) relative to total number of the species per taxon.
Plants (Trees)
Key Findings:
A total of 89 species of plants were recorded, 9% of which are endemic to the
Philippines. Ten critically endangered species were observed and these include
Dipterocarpus grandiflorus, Pterocarpus indicus and three species of Shorea (S. astylosa,
S. guiso, and S. palosapis).
Birds Key Findings:
A total of 121 species of birds were recorded, 56 or 46.3% of which is endemic to the
Philippines. Five vulnerable species were observed, these are the Green Racquet-tail
(Prioniturus luconensis), Ashy Ground-Thrush (Zoothera cinerea), Black-bibbed Cuckoo-
Shrike (Coracina mindanensis), Philippine Dwarf-Kingfisher (Ceyx melanurus), and
North Philippine Hawk-Eagle (Nisaetus philippensis).
The migratory Pale Thrush (Turdus pallidus) is a new record for the park.

ECOLOGICAL ASSESSMENT IN THE B+WISER SITES | 27
Mammals Key Findings:
There were 17 species (12 volant, five non-volant) of mammals observed. Two are
vulnerable and endemic species, the Philippine warty pig and Philippine brown deer,
which are also the more commonly hunted species in the area. Eight species are endemic
to the Philippines; these include the Mottle-winged Flying Fox (Desmalopex
leucopterus), Philippine dawn bat (Eonycteris robusta), Fischer’s pygmy fruit bat
(Haplonycteris fischeri), and the Philippine forest rat (Rattus everetti).
Reptiles and Amphibians Key Findings:
Nineteen amphibians and 19 reptiles were identified.
Seven species are threatened, including the Kalinga Narrowmouth Toad (Kaloula
kalingensis), Mcnamara’s Burrowing Snake (Pseudorhabdion cf mcnamerae) and three
species of Platymantis (P. cagayanensis, P. pygmaeus, and P. taylori).
The Crab-eating frog (Fejervarya cancrivora) and the Emerald flying frog (Rhacophorus
pardalis) are new species records for NSMNP
Philippine endemics include 13 amphibians and 15 reptiles
Some species of amphibians (n=3) and reptiles (n=4) are in the process of taxonomic
verification.
KWFR and UMRBPL
A total of 154 floral and faunal species were recorded in the proxy site during the conduct of the
survey, of which 16 are endemic to the Luzon Island (Table 14). Six species observed were
Vulnerable, most of which are trees, while 10 species were classified as Near Threatened (Table
15). For a more detailed list of species, see Appendix 7.1.2.
Table 14. Summary of endemicity of the species surveyed in UMRBPL-KWFR.
Taxa Philippine endemic Luzon endemic Total
Flora (trees) 6 (30%) 0 (0 %) 20
Birds 47 (51%) 9 (10%) 93
Mammals 3 (21%) 0 (0%) 14
Amphibians 6 (50%) 4 (33%) 12
Reptiles 7 (47%) 3 (20%) 15
TOTAL 69 (45%) 16 (10%) 154
Note: Values in parentheses are percentages (%) relative to total number of the species per taxon.
Table 15. Summary of the threatened status of species surveyed in UMRBPL-KWFR according to the 2014 IUCN Red List.
Taxa Critically Endangered (CR)
Endangered (EN)
Vulnerable (VU)
Near Threatened
(NT)
Least Concern
(LC)
Not Assessed
(NA)
Data Deficient
Total
Flora (trees) 0 (0%) 0 (0%) 5 (26%) 0 (0%) 0 (0%) 14 (74%) 0 (0%) 19
Birds 0 (0%) 0 (0%) 1 (1%) 6 (7%) 83 (91%) 0 (0%) 1 (1%) 91
Mammals 0 (0%) 0 (0%) 0 (0%) 1 (7%) 13 (93%) 0 (0%) 0 (0%) 14
Amphibians 0 (0%) 0 (0%) 0 (0%) 3 (25%) 9 (75%) 0 (0%) 0 (0%) 12
Reptiles 0 (0%) 0 (0%) 0 (0%) 0 (0%) 7 (47%) 8 (53%) 0 (0%) 15
TOTAL 0 (0%) 0 (0%) 6 (4%) 10 (6%) 112 (73%) 26 (17%) 1 (0.01%) 154
Note: Values in parentheses are percentages (%) relative to total number of the species per taxon

28 | ECOLOGICAL ASSESSMENTS IN THE B+WISER SITES
Plants (Trees) Key Findings:
A total of 20 tree species was identified. Five species were considered threatened, namely
Narra (Pterocarpus indicus) (VU), Mahogany (Swietenia macrophylla) (VU), Lanutan
(Mitrephora lanotan) (VU), Takip Asin (Macaranga grandifolia) (VU) and Pili (Canarium
ovatum) (VU).
Birds Key Findings:
Ninety species of birds were recorded. Of these, 47 are Philippine endemics.
Seven recorded species are threatened based on the IUCN Red List of Threatened Species
(IUCN 2014).
Frequently encountered species recorded were the Scale-Feathered Malkoha
(Phaenicophaeus cumingi) and the Red-crested Malkoha (Phaenicophaeus superciliosus),
which are unique to Luzon Island and are common in forest, forest edges and clearings
(Kennedy et al. 2001)
Mammals Key Findings:
A total of 14 species were encountered belonging to 6 families. Seven of these are
considered as frugivorous while the other half are insectivores.
Three species are Philippine endemics namely the Greater Musky Fruit Bat (Ptenochirus
jagori), Philippine Pygmy Fruit Bat (Haplonycteris fischeri) and the Philippine Nectar
Bat (Eonycteris robusta).
Reptiles and Amphibians Key Findings:
There were 12 amphibian species recorded during the survey. Four of which are Luzon
endemics.
Three species of amphibians are Near Threatened, namely Husky-voiced Wrinkled
Ground Frog (Platymantis mimulus), Luzon Fanged Frog (Limnonectes macrocephalus)
and Luzon Striped Stream Frog (Hylarana similis).
Fifteen reptile species were recorded. Three species are Luzon endemics, which include
Philippine Flying Dragon (Draco spilopterus) Banded Worm Snake (Calamaria
bitorques) and Red-headed Worm Snake (Malayotyphlops ruficaudus).
NLNP
Data used for NLNP ecological assessment were collected from the Philippine National
Museum, California Academy of Sciences, Field Museum of Natural History and Kansas
University from 1980 to 2010. A total of 36 species of birds, amphibians and reptiles were used
to determine suitable habitats in the park (Tables 16 and 17).

ECOLOGICAL ASSESSMENT IN THE B+WISER SITES | 29
Table 16. Endemicity of species on Mindoro Island.
Taxa Philippine endemic
Mindoro endemic
Not endemic
Introduced Migratory Total
Birds 5 (56%) 4 (44%) 0 (0%) 0 (0%) 0 (0%) 9
Amphibians 10 (56%) 3 (17%) 4 (22%) 1 (5%) 0 (0%) 18
Reptiles 11 (48%) 1 (4%) 11 (48%) 0 (0%) 0 (0%) 23
TOTAL 26 (52%) 8 (16%) 15 (30%) 1 (2%) 0 (0%) 50
Note: Values in parentheses are percentages (%) relative to total number of the species per taxon
Table 17. Conservation status of species recorded in Mindoro Island based on the IUCN
Red List (2014).
Taxa Critically Endangered (CR)
Endangered (EN)
Vulnerable (VU)
Near Threatene
d (NT)
Least Concern
(LC)
Not Assessed
(NA)
Data Deficient
Total
Birds 3 (33%) 2 (22%) 4 (45%) 0 (0%) 0 (0%) 0 (0%) 0 (0%) 9
Amphibians 0 (0%) 2 (12%) 3 (18%) 0 (0%) 10 (59%) 1 (6%) 1 (6%) 17
Reptiles 0 (0%) 0 (0%) 0 (0%) 0 (0%) 10 (43%) 12 (52%) 1 (4%) 23
TOTAL 3 (6%) 4 (8%) 7 (14%) 0 (0%) 20 (41%) 13 (27%) 2 (4%) 49
Note: Values in parentheses are percentages (%) relative to total number of the species per taxon
Birds Key Findings:
Data gathered from Vertnet revealed that five out of nine species were Philippine
endemic Philippine Duck (Anas luzonica), Philippine Cockatoo (Cacatua
haematuropygia), Scarlet-collared Flowerpecker (Dicaeum retrocinctum), Spotted
Imperial-pigeon (Ducula carola), and Ashy Thrush (Zoothera cinerea), while four of them
are island endemic Black-hooded Coucal (Centropus steerii), Mindoro Imperial-pigeon
(Ducula mindorensis), Mindoro Bleeding-heart (Gallicolumba platenae), Mindoro
Hornbill (Penelopides mindorensis).
Nine were categorized as Threatened species. Three species were Critically Endangered
which are Philippine Cockatoo, Black-hooded Coucal and Mindoro Bleeding-heart, two
species were Endangered these are Mindoro Imperial-pigeon and Mindoro Hornbill.
Philippine Duck, Scarlet-collared Flowerpecker, Spotted Imperial-pigeon and Ashy
Thrush are under the category of Vulnerable.
Reptiles and Amphibians Key Findings:
Ten out of 21 species were Philippine endemics, the Masked wrinkled ground Frog
(Platymantis corrugatus), Whistling wrinkled ground frog (Platymantis dorsalis),
Mindanao flying frog (Rhacophorus bimaculatus), Philippine painted narrowmouth
(Kaloula picta), Philippine grass frog (Fejervarya vittigera), Brackish Frog (Fejervarya
moodiei), Palawan fanged-Frog (Limnonectes acanthi), Western mindanao dwarf toad
(Pelophryne brevipes), Visayan fanged-frog (Limnonectes visayanus), and Philippine
narrowmouth toad (Kaloula conjuncta), three were island endemic Mindoro striped
stream frog (Hylarana mangyanum, Mindoro litter frog (Leptobrachium mangyanorum),
and Mindoro bush frog (Philautus schmackeri), One introduced species Chinese tiger
frog (Hoplobatrachus rugolosus) and the rest are well distributed in Southeast Asia.
A total of five species were categorized threatened. Two species were endangered namely
Mindoro striped stream frog and the Mindoro bush frog. The Palawan fanged frog,
Visayan fanged frog and Mindanao flying frog were categorized as Vulnerable due to
their severely fragmented distribution, and the continuing decline of their habitat.

30 | ECOLOGICAL ASSESSMENTS IN THE B+WISER SITES
Eleven out of 23 species were Philippine endemic such as the Stub-limbed Burrowing
Skink (Brachymeles bonitae), Gervais' Worm Snake (Calamaria gervaisi), Mindoro
Narrow-disked Gecko (Gekko mindorensis), Mindoro Forest Dragon (Gonocephalus
semperi), Small Broad-tailed Smooth-scaled Gecko (Lepidodactylus planicaudus), Cox's
Sphenomorphus (Sphenomorphus coxi), Cuming’s Sphenomorphus (Sphenomorphus
cumingi), Jagor's Sphenomorphus (Sphenomorphus jagori), Steere's Sphenomorphus
(Sphenomorphus steerei), Northern Triangle-spotted Snake (Cyclocorus lineatus), and
(Dendrelaphis fuliginosus). One island endemic was recorded the Mindoro Short-legged
Skink (Brachymeles mindorensis) and 11 were Southeast Asian species.
Bago Watershed, MKNP and NNNP
One hundred fifty-five species of terrestrial vertebrates (109 birds, 25 mammals, 10 amphibians,
and 11 reptiles) and 26 species of trees were recorded (Table 18). Of these, 71 species are
Philippine endemics and 22 are threatened species, including the Critically Endangered
Philippine barebacked fruit bat (Dobsonia chapmani), as shown in Table 19. For a complete list
of species observed in the forest reserve, see Appendix 7.1.4.
Table 18. Summary of endemicity and distribution of species recorded in BRWFR.
Note: Values in parentheses are percentages (%) relative to total number of the species per taxon.
Table 19. Summary of the threatened status of species surveyed in BRWFR according to
the IUCN Red List (2014).
Taxa Critically Endangered (CR)
Endangered
(EN)
Vulnerable (VU)
Near Threatened
(NT)
Least Concern
(LC)
Not Assessed
(NA)
Data Deficient
(DD)
Total
Flora (trees) 4 (15%) 0 (0%) 3 (12%) 0 (0%) 1 (4%) 18 (69%) 0 (0%) 26
Birds 0 (0%) 2 (2%) 4 (4%) 1 (1%) 102 (93%) 0 (0%) 0 (0%) 109
Mammals 2 (8%) 3 (12.5%) 0 (0%) 3 (12.5%) 15 (63%) 0 (0%) 1 (4%) 24
Amphibians 0 (0%) 2 (20%) 1 (10%) 0 (0%) 6 (60%) 0 (0%) 1 (10%) 10
Reptiles 0 (0%) 1 (10%) 0 (0%) 0 (0%) 3 (30%) 0 (0%) 7 (70%) 11
TOTAL 6 (3%) 8 (4%) 8 (4%) 4 (2%) 127 (69%) 21 (11%) 9 (5%) 183
Note: Values in parentheses are percentages (%) relative to total number of the species per taxon
Taxa Philippine Endemic
Negros Endemic
Resident Introduced Migratory Total
Flora (trees) 6
(23%) 0 (0%)
20 (77%)
0 (0%) 0 (0%) 26
Birds 41 (38%) 0 (0%) 56
(51%) 4
(4%) 8
(7%) 109
Mammals 8
(32%) 2
(8%) 10
(40%) 5
(20%) 0 (0%) 25
Amphibians 3 (14%) 3 (14%) 4
(19%) 0 (0%) 0 (0%) 10
Reptiles 6
(55%) 2 (18%)
3 (27%)
0 (0%) 0 (0%) 11
TOTAL 64 (35%) 7 (4%) 93 (51%) 9 (5%) 8 (4%) 181

ECOLOGICAL ASSESSMENT IN THE B+WISER SITES | 31
Plants (Trees) Key Findings:
About 388 individual trees belonging to 11 families, 12 genera, and 26 species (including
12 unidentified specimens) were recorded. Dominant species of flora belong to Family
Myrtaceae and Family Dipterocarpaceae.
Seven species are threatened (IUCN RedList 2014) which includes four (4) Critically
Endangered species - Parashorea malaanonan, Shorea contortam, S. polysperma and S.
negrosensis. While the remaining three (3) threatened species are considered as
Vulnerable, include Macaranga bicolor, Palaquium luzoniense, and Swietenia
macrophylla.
Six species namely: Macaranga bicolor, Myristica philippinensis, Palaquium luzoniense,
Shorea contorta, S. negrosensis and S. polysperma are endemic to the Philippines.
Birds Key Findings:
There were 109 bird species encountered. Of these, 41 (37.61%) are Philippine endemics,
4 (3.67%) are introduced species, 8 (7.34%) are migratory species and the remaining 56
(57.38%) species are non-endemics and/or resident species.
Seven (7) species are threatened (IUCN 2014) and these include the following:
Endangered species - Tarictic Hornbill (Penelopides panini) and Negros Striped Babbler
(Stachyris nigrorum); Vulnerable species - Philippine hawk-eagle (Spizaetus philippensis
pinskeri), Pink-bellied imperial pigeon (Ducula poliocephala), White-winged cuckoo
shrike (Coracina ostentata), and Celestial monarch (Hypothymis coelestis); and one Near
Threatened (NT) species – Rufous Hornbill (Buceros hydrocorax).
Mammals
Key Findings:
Of the 56 terrestrial mammals recorded for Negros Island (Heaney et al. 2014), 25 of
which were recorded during the survey. Eight species are Philippine endemics namely:
Golden-crowned flying fox (Acerodon jubatus), Philippine pygmy fruit bat
(Haplonycteris fischeri), Harpy fruit bat (Harpyionycteris whiteheadi), Philippine tube-
nosed fruit bat (Nyctimene rabori), Musky fruit bat (Ptenochirus jagori), Little golden-
mantled flying fox (Pteropus pumilus), Yellow-faced horseshoe bat (Rhinolophus virgo),
and Visayan spotted deer (Rusa alfredi).
Aside from the Philippine endemics, two species of terrestrial mammals are found only
within the Negros-Panay Faunal Region, the Visayan warty pig (Sus cebifrons) and
Philippine barebacked fruit bat (Dobsonia chapmani). Both are Critically Endangered
(CR) species. The latter has not been recorded since 1964, despite intensive surveys and
therefore (inaccurately) considered as Extinct (IUCN 2014) because extant populations
were recently rediscovered in Cebu (2001) and Negros (2003). Fortunately for this
survey, the group was able to capture a single individual that yet again validates the
species’ presence on the island.
Reptiles and Amphibians Key Findings:
Ten amphibian species was recorded, two of which are Philippine endemics and three are
found in the Negros-Panay Faunal Region.
Three amphibians were recorded as threatened (IUCN RedList 2014) namely Negros
Horned Toad (Platymantis negrosensis), Hazel’s Cloud Frog (P. hazelae) and Visayan

32 | ECOLOGICAL ASSESSMENTS IN THE B+WISER SITES
Fanged Frog (Limnonectes visayanus). Both species of Platymantis are regarded as
Endangered (EN) while the Limnonectes visayanus is a Vulnerable (VU) species.
Of the 11 reptile species recorded, only one species is considered as Endangered (EN) –
Mountain Burrowing Snake (Pseudorabdion montanum). The species is endemic only to
Negros Island.
Six species are endemic to the Philippines, which include among others the Dumeril’s
Short-legged Skink (Brachymeles talinis), Marbled Crested Lizard (Bronchocela
marmorata) Negros Forest Dragon (Gonocephalus sophiae) and Jagor’s Sphenomorphus
(Pinoyscincus jagori). Apparently, all of these species are also Data Deficient (DD) and
thus, need further research to establish its distribution and other ecological and biological
data, distinct to the species or taxa.
MKRNP
About 272 species of fauna and flora were observed in MKRNP during the ecological
assessment. Of these, 124 were birds, 32 were mammals, 20 amphibians, and 15 reptiles while 81
species of trees were also observed (Table 20). A total of 84 species are endemic to the
Philippines while 29 are restricted to the Island of Mindanao. Three species were classified as
Critically Endangered (two trees; one bird) one Endangered and 22 Vulnerable as seen in Table
21. See Appendix 7.1.5 for a more detailed list of species.
Table 20. Summary of species recorded in MKRNP.
Taxa Philippine endemic
Mindanao endemic
Not endemic
Introduced Migratory Total
Flora (trees) 16 (20%) 6 (7%) 43 (53%) 16 (20%) 0 (0%) 81
Birds 41 (33%) 12 (10%) 64 (52%) 0 (0%) 7 (6%) 124
Mammals 10 (31%) 11 (34%) 11 (34%) 0 (0%) 0 (0%) 32
Amphibians 11 (50%) 5 (25%) 3 (15%) 1 (5%) 0 (0%) 20
Reptiles 6 (40%) 6 (40%) 3 (20%) 0 (0%) 0 (0%) 15
TOTAL 84 (31%) 29 (11%) 24 (46%) 17 (6%) 7 (3%) 272
Note: Values in parentheses are percentages (%) relative to total number of the species per taxon
Table 21. Conservation status of species observed in MKRNP based on IUCN Red List
(2014).
Note: Values in parentheses are percentages (%) relative to total number of the species per taxon
Taxa Critically Endangered (CR)
Endangered (EN)
Vulnerable (VU)
Near Threatened
(NT)
Least Concern
(LC)
Not Assessed
(NA)
Data Deficient
Total
Flora (trees) 2 (2%) 0 (0%) 7 (9%) 1 (1%) 9 (11%) 59 (73%) 3 (4%) 81
Birds 1 (1%) 1 (1%) 5 (4%) 11 (9%) 106 (85%) 0 (0%) 0 (0%) 124
Mammals 0 (0%) 0 (0%) 3 (9%) 0 (0%) 0 (0%) 0 (0%) 29 (91%) 32
Amphibians 0 (0%) 0 (0%) 9 (45%) 1 (5%) 8 (40%) 2 (10%) 0 (0%) 20
Reptiles 0 (0%) 0 (0%) 1 (7%) 0 (0%) 10 (67%) 2 (13%) 2 (13%) 15
TOTAL 3 (1%) 1 (0.4%) 22 (9%) 13 (5%) 133 (55%) 63 (26%) 5 (2%) 240

ECOLOGICAL ASSESSMENT IN THE B+WISER SITES | 33
Plants (Trees) Key Findings:
Two critically endangered species were recorded: Red Lauan (Shorea negrosensis) and
Tanguile (Shore polysperma). Both dipterocarps are endemic in the Philippines.
Sixteen species observed were introduced such as Artocarpus heterophyllus,
Aphanamixis polystachya, Calliandra haematocephala, Cassia javanica, and Durio
zibethinus.
A total of 81 species of trees belonging to 68 genera and 40 families were recorded.
Birds Key Findings:
Rare and threatened species like Mindanao brown dove (Phapitreron brunneiceps) and
Black-bibbed cuckoo-shrike (Coracina mindanensis) were recorded in the lowland forest
of Baungon.
Several threatened species were recorded one of which is Critically Endangered
(Philippine eagle, Pithecophaga jefferyi); one Endangered (Pinsker’s hawk eagle,
Nisaetus pinskeri); five Vulnerable: Mindanao brown dove (Phapitreron brunneiceps),
Black-bibbed cuckooshrike (Coracina mindanensis), Blue-capped kingfisher (Actenoides
hombroni), Philippine leafbird (Chloropsis flavipennis), and Celestial monarch
(Hypothymis coelestis). Eleven birds were classified as Near Threatened such as
Mindanao boobook (Ninox philippensis), Short-crest Monarch (Hypothymis helenae) and
Slaty-backed Jungle Flycatcher (Rhinomyias goodfellowi) were also recorded.
Out of 124 bird species recorded, 63 (42.74%) of these are endemic. 41 (33.06%) are
Philippine endemic and 12 (9.68%) are restricted to Mindanao.
Mammals Key Findings:
A total of 32 species of mammals were observed. Three are Vulnerable namely;
Philippine warty pig (Sus philippensis), Philippine deer (Rusa marianna), and White
collared fruit bat (Megaerops wetmorei).
Reptiles and Amphibians Key Findings:
Of the 20 species of frogs, nine were Vulnerable (Rabor’s forest frog Platymantis rabori,
Montane narrow-mouthed frog Oreophyrne anulata, Guenther’s forest frog Platymantis
guentheri, Eastern Mindanao Dwarf Toad Pelophryne lighti, Southeast Asian Horned
Toad Megophrys stejnegeri, Spiny Cinnamon Frog Nyctixalus spinosus) and one Near
Threatened (Giant litter frog Limnonectes magnus).
A total of 15 species of reptiles were observed. Six are found only in the Philippines
(Elaphe erythrura, Sphenomorphus jagori, Trimeresurus flavomaculatus, Rhabdophis
auriculata, Cyclorus lineatus, and Oxyrhabdium modestum) and six were island restricted
(Gonocephalus interruptus, Sphenomorphus diwata, Sphenomorphus coxi, Draco
mindanensis, Tropidophorus davaoensis, and Cyrtodactylus agusanensis).
One Vulnerable species was found, Draco mindanensis.

34 | ECOLOGICAL ASSESSMENTS IN THE B+WISER SITES
MANP
A total of 184 flora and fauna comprising of 76 species of trees, 70 birds, 19 mammals, 12
amphibians and seven species of reptiles were recorded for MANP during the survey (Table 22).
There are 69 species in MANP that are Philippine endemic while 21 are island endemics
(Table 22). As for threatened species in the site, five were recorded to be Critically Endangered,
one Endangered bird species, and 13 were Vulnerable (Table 23). See Appendix 7.1.6 for the
species list.
Table 22. Distribution of species surveyed in MANP.
Taxa Philippine endemic
Mindanao endemic
Not endemic
Introduced Migratory Total
Flora (trees) 17 (27%) 4 (6%) 42 (67%) 0 (0%) 0 (0%) 63
Birds 37
(53%) 6 (9%)
27 (39%)
0 (0%) 0 (0%) 70
Mammals 8 (42%) 3 (16%) 7 (37%) 1 (5%) 0 (0%) 19
Amphibians 5 (42%) 5 (42%) 2 (17%) 0 (0%) 0 (0%) 12
Reptiles 2 (29%) 3 (43%) 2 (29%) 0 (0%) 0 (0%) 7
TOTAL 69 (38%) 21(11%) 80 (43.5%) 1 (0.5%) 0 (0%) 171
Note: Values in parentheses are percentages (%) relative to total number of the species per taxon
Table 23. Summary of threatened species surveyed in MANP according to the 2014 IUCN
Red List.
Taxa Critically Endangered (CR)
Endangered (EN)
Vulnerable (VU)
Near Threatened
(NT)
Least Concern
(LC)
Not Assessed
(NA)
Data Deficient
Total
Flora (trees)
4 (5%) 0 (0%) 2 (3%) 1 (1%) 8 (11%) 60 (79%) 1 (1%) 76
Birds 1 (1%) 1 (1%) 0 (0%) 8 (11%) 60 (86%) 0 (0%) 0 (0%) 70
Mammals 0 (0%) 0 (0%) 2 (11%) 0 (0%) 16
(84%) 0 (0%) 1 (5%)
19
Amphibians 0 (0%) 0 (0%) 9 (75%) 0 (0%) 2 (17%) 1 (8%) 0 (0%) 12
Reptiles 0 (0%) 0 (0%) 0 (0%) 0 (0%) 5 (71%) 2
(29%) 0 (0%)
7
TOTAL 5 (3%) 1
(0.5%) 13 (7%) 9 (5%)
91 (49.5%)
63 (34%) 2 (1%) 184
Note: Values in parentheses are percentages (%) relative to total number of the species per taxon
Plants (Trees)
Key Findings:
There were 76 species of trees documented belonging to 63 genera and 41 families.
Four Critically Endangered tree species were documented in the area: Philippine
mahogany (Shorea almon), White Lauan (Shorea contorta), Red Lauan (Shorea
negrosensis), and Tanguile (Shorea polysperma), which are all endemic to the
Philippines. Agathis dammara and the Philippine endemic Cinnamomum mercadoi are
Vulnerable.
Birds Key Findings:
A total of 70 bird species were recorded where 37 are endemic to the Philippines while
six are endemic to island of Mindanao.

ECOLOGICAL ASSESSMENT IN THE B+WISER SITES | 35
Ten threatened bird species were detected. These include the Critically Endangered
Philippine Eagle (Pithecophaga jefferyi) and the Endangered South Philippine Hawk-
eagle (Nisaetus pinskeri).
Mammals Key Findings:
The rare Philippine Large-headed Fruit Bat (Dyacopterus rickartii) was observed.
Previous records from Mindanao were only from Mt. Kitanglad, Mt. Mahuson and Mt.
Tagub-Kampalili.
A total of 20 mammal species were recorded. Eight species were Philippine endemic,
which includes Mindanao Flying-squirrel (Petinomys crinitus), Philippine warty pig (Sus
philippinensis), Philippine forest rat (Rattus everetti), Mindanao treeshrew (urogale
everetti), Philippine large-headed fruit bat (Dyacopterus rickartii), Philippine pygmy fruit
bat (Haplonycteris fischeri), Harpy Fruit bat (Harpyionycteris whiteheadi), Hardwick’s
woolly bat (Kerivoula hardwickii), Greater musky fruit bat (Ptenochirus jagori), Lesser
Musky fruit bat (Ptenochirus minor), and Philippine forest horseshoe bat (Rhinolopus
inops).
Reptiles and Amphibians Key Findings:
Five of 12 amphibians documented during the survey are endemic to the Philippines
while another five species are island endemics.
The following species were classified as threatened: Muller’s Toad (Ansonia muellerii),
Southeast Asian Horned Toad (Megophrys stejnegeri), Pointed Snout Tree Frog
(Philautus acutirostris), Smooth Skinned Tree Frog (Philautus worcesteri), Mottled Tree
Frog (Philautus poecillus), Common Forest Tree Frog (Philautus surdus), Guenther’s
Forest Frog (Platymantis guentheri), and White-lipped Tree Frog (Polypedates
leucomystax).
Out of seven reptiles observed, two are Philippine endemics: Philippine rat snake (Elaphe
erythrura) and White lined water snake (Rhabdophis auriculata). Three are Mindanao
endemic: Graceful short-legged skink (Brachymeles gracilis), Striped bronzeback snake
(Dendrelaphis caudolineatus terrificus) and Agusan bent-toed gecko (Cyrtodactylus
agusanensis).
3.2. RESULTS OF ORDINATION
This section presents the key findings of the analysis for each taxon using Canonical
Correspondence Analysis (CCA) to determine the relationship between the species and its habitat.
For a more detailed interpretation of the ordination results, see Appendix 7.3 for the ordination
diagrams presented in biplots and Appendix 7.4. The result of this analysis is a description of
the mean niche position on each selected gradient (niche position) for each species, which
represents a measure of the distance between the mean conditions used by the species and
the mean conditions of the study area for that gradient. This is referred to as Species
Survival Envelope.

36 | ECOLOGICAL ASSESSMENTS IN THE B+WISER SITES
NSMNP
Plants (Trees) Key Findings (Table 24):
Most of the tree species are associated with disturbed and forest interface habitats.
The ordination results suggest that the community (species composition and diversity) of
trees is determined largely by elevation, increasing thickness of leaf litter and increasing
number of palms (see Appendix A6).
Species positioned in forest habitats with narrow niche width (forest specialist) include
the endemic and threatened Agathis philippinensis, Diospyrus philippinensis and
Palaquium luzoniensis.
Macaranga bicolor, Octomeles sumatrana and Parkia timoriana are some of the species
positioned in forest interface that are also tolerant to cultivated areas (forest generalists).
Species such as Dillenia philippinensis, Shorea negrosensis, Shorea palosapis, Shorea
polysperma and Syzigium ciliato-setosum appear to be generalists. Table 24. Species survival envelopes for tree species in NSMNP generated using
Canonical Correspondence Analysis.
Note: Checkmarks indicate extent of occurrence/presence of species.
Species
Common Name Forest
Dependent Degraded
Forest
Interface of forest and non-forest
Non-forest/ Cultivation
Anisoptera thurifera Palosapis ✓ ✓
Shorea guiso Guijo ✓ ✓
Diptetrocarpus grandiflorus
Apitong ✓ ✓
Shorea polysperma Tangile ✓ ✓ ✓
Syzigium ciliato-setosum
Lakangan ✓ ✓ ✓
Syzygium tripinnatum Hagis ✓ ✓ ✓
Shorea contorta White Lauan ✓ ✓ ✓ ✓
Shorea negrosensis Red Lauan ✓ ✓ ✓ ✓
Palaquium luzoniensis Nato ✓
Celtis philippinensis Malaikmo ✓
Diospyrus philippensis Oi-Oi ✓ ✓
Garcinia venulosa Gatasan ✓ ✓
Guisat* Guisat* ✓ ✓
Kanaring* Kanaring* ✓ ✓
Kulipapa* Kulipapa* ✓ ✓
Lithocarpus sp. ✓ ✓
Parashorea malaanonan
Bagtikan ✓ ✓
Artocarpus rigidus Monkey jak ✓ ✓
Calophyllum inophyllum Bitaog ✓ ✓
Shorea palosapis Mayapis ✓ ✓ ✓
Dillenia philippinensis Katmon ✓ ✓ ✓
Litsea leytensis Batikuling ✓ ✓ ✓
Macaranga tanarius Binunga ✓ ✓ ✓
Mangifera altissima Pahutan ✓ ✓ ✓
Palaquium philippense Malakmalak ✓ ✓ ✓
Dracontomelon dao Dao ✓ ✓

ECOLOGICAL ASSESSMENT IN THE B+WISER SITES | 37
Species
Common Name Forest
Dependent Degraded
Forest
Interface of forest and non-forest
Non-forest/ Cultivation
Duabanga moluccana Loktob ✓ ✓
Ficus nota Tibig ✓ ✓
Ficus sp. ✓ ✓
Ficus variegata Tangisang Baywak
✓ ✓
Macaranga bicolor Hamindang ✓ ✓
Nephelium lappaceum Kapulasan ✓ ✓
Octomeles sumatrana Binuang ✓ ✓
Pterocarpus indicus Narra ✓ ✓
Shorea astylosa Yakal ✓
Nauclea orientalis Bangkal ✓
Birds Key Findings (Table 25):
The ordination results suggest that most of the bird species are associated with the forest
habitats.
The bird community (species composition and diversity) is influenced mainly by
elevation, increasing thickness of leaf litter and humus, and increasing number of fruit
trees.
Species with narrow niche width indicate that they are habitat specialists. Examples of
the forest specialists or obligates include the Sooty Woodpecker (Mulleripicus funebris),
Flaming Sunbird (Aethopyga flagrans) and Yellow-wattled Bulbul (Pycnonotus
urostictus).
The White-lored Oriole (Oriolus albiloris) appears tolerant to early second growth forest
and cultivated lands and the Red-keeled Flowerpecker (Dicaeum australe) in early and
advanced second growth forest.
Generalist species such as the Philippine Bulbul (Ixos philippinus), Elegant Tit (Parus
elegans), the Orange-bellied Flowerpecker (Dicaeum trigonostigma) and the Philippine
Tailorbird (Orthotomus castaneiceps) and appear tolerant to varying degrees of
disturbance.
Table 25. Species survival envelopes for birds in NSMNP using Canonical
Correspondence Analysis.
Note: Checkmarks indicate extent of occurrence/presence of species.
Species Common Name Intact Forest
Degraded Forest
Interface of forest and non-
forest
Non-forest/ Cultivation
Phapitreron amethystinus Amethyst Brown-dove
✓ ✓
Dicrurus balicassius Balicassiao ✓ ✓
Phaenicophaeus cumingi Scale-feathered Malkoha
✓ ✓
Mulleripicus funebris Sooty Woodpecker ✓ ✓
Coracina coerulescens Blackish Cuckoo-Shrike
✓ ✓
Dicaeum hypoleucum Buzzing Flowerpecker
✓ ✓

38 | ECOLOGICAL ASSESSMENTS IN THE B+WISER SITES
Species Common Name Intact Forest
Degraded Forest
Interface of forest and non-
forest
Non-forest/ Cultivation
Loriculus philippensis Colasisi ✓ ✓
Chalcophaps indica Common Emerald Dove
✓ ✓
Aethopyga flagrans Flaming Sunbird ✓ ✓
Phylloscopus cebuensis Lemon-throated Leaf-warbler
✓ ✓
Pycnonotus urostictus Yellow-wattled Bulbul
✓ ✓
Dicaeum australe Red-keeled Flowerpecker
✓ ✓
Coracina striata Bar-bellied Cuckoo-Shrike
✓ ✓
Oriolus albiloris White-lored Oriole
✓ ✓
Lanius cristatus Brown Shrike ✓ ✓ ✓
Zosterops nigrorum Yellowish White-eye
✓ ✓ ✓
Pachycephala philippinensis
Yellow-bellied Whistler
✓ ✓ ✓
Harpactes ardens Philippine Trogon ✓ ✓ ✓
Irena cyanogastra Philippine Fairy Blue-bird
✓ ✓ ✓
Hypothymis azurea Black-naped Monarch
✓ ✓ ✓
Centropus viridis Philippine Coucal
✓ ✓ ✓
Nectarinia sperata Purple-throated Sunbird
✓ ✓ ✓
Centropus unirufus Rufous Coucal
✓ ✓ ✓
Orthotomus castaneiceps Philippine Tailorbird
✓ ✓ ✓ ✓
Lonchura leucogastra White-breasted Munia
✓ ✓ ✓ ✓
Copsychus luzoniensis White-browed Shama
✓ ✓ ✓ ✓
Phapitreron leucotis White-eared Brown-dove
✓ ✓ ✓ ✓
Rhipidura cyaniceps Blue-headed Fantail
✓ ✓ ✓ ✓
Parus elegans Elegant Tit ✓ ✓ ✓ ✓
Bolbopsittacus lunulatus Guaiabero ✓ ✓ ✓ ✓
Prionochilus olivaceus Olive-backed Flowerpecker
✓ ✓ ✓ ✓
Cinnyris jugularis Olive-backed Sunbird
✓ ✓ ✓ ✓
Dicaeum trigonostigma Orange-bellied Flowerpecker
✓ ✓ ✓ ✓
Ixos philippinus Philippine Bulbul ✓ ✓ ✓ ✓

ECOLOGICAL ASSESSMENT IN THE B+WISER SITES | 39
KWFR and UMRBPL
Plants (Trees) Key Findings (Table 26):
Tree species such as Tibig (Ficus nota), Takip Asin (Macaranga grandiflora), Lanutan
(Mitrephora lanotan) and Malapapaya (Polyscias nodosa) were found to be forest
dependent. However, these species are also found in more degraded areas suggesting that
these may be remnant of the original habitat.
Rain tree (Samanea saman) and Makaasim (Syzygium nitidum) were found to tolerate
degraded areas and the interface between forest and non-forest areas.
Table 26. Species survival envelopes of trees in KWFR-UMRBPL using Canonical
Correspondence Analysis.
Note: Checkmarks indicate extent of occurrence/presence of species.
Scientific Name Common
Name
Forest
dependent
Degraded
forest
Interface of
forest and
non-forest
Non-forest
/ Open
Forest
Ficus nota Tibig ✓
Mitrephora lanotan Lanutan ✓
Macaranga grandiflora Takip Asin ✓
Polyscias nodosa Malapapaya ✓ ✓
Ceiba pentandra Kapok ✓
Gmelina arborea Gmelina ✓
Nauclea orientalis Bangkal ✓
Pterocarpus indicus Narra ✓
Swietenia macrophylla Mahogany ✓
Syzygium cumini Duhat ✓
Samanea saman Rain Tree ✓ ✓
Syzygium nitidum Makaasim ✓ ✓
Brousonnetia luzonica Himbabao ✓
Celtis philippinensis Malaikmo ✓
Diospyros pilosanthera Bolong Eta ✓
Ficus variegata Tangisang Bayawak
✓
Lagerstromeia speciosa Banaba ✓
Antidesma bunius Bignai ✓
Canarium ovatum Piling liitan ✓
Ficus balete Balete ✓
Ficus odorata Pakiling ✓
Heritiera sylvatica Dungon ✓
Hopea acuminata Manggachapui ✓
Birds Key Findings (Table 27):
Five species have wide niche width (Balicassiao Dicrurus balicassius, Common
Emerald-Dove Chalcophaps endica, White-eared Brown-Dove Phapitreron leucotis,
Elegant Tit Parus elegans, Philippine Bulbul Ixos philippinus). They extend from forest
to cultivation, which indicate that they do not have specific habitat preference.

40 | ECOLOGICAL ASSESSMENTS IN THE B+WISER SITES
Cacomantis variolosus and Orthotomus cuculatus are species with narrow niche width
associated with forest. These suggest that they are intolerant to degraded forest or
cultivation.
Table 27. Species survival envelopes for birds in KWFR-UMRBPL using Canonical
Correspondence Analysis.
Note: Checkmarks indicate extent of occurrence/presence of species.
Species Common Name Forest
dependent
Degraded
forest
Interface of
forest and
non-forest
Non-forest/
Cultivation
Dicrurus balicassius Balicassiao ✓ ✓ ✓ ✓
Ixos philippinus Philippine Bulbul ✓ ✓ ✓ ✓
Phapitreron leucotis White-eared Brown-dove
✓ ✓ ✓ ✓
Chalcophaps endica Common Emerald-Dove
✓ ✓ ✓ ✓
Parus elegans Elegant Tit ✓ ✓ ✓ ✓
Bolbopsittacus lunulatus Guaiabero ✓ ✓ ✓
Orthotomus castaneiceps
Philippine Tailorbird ✓ ✓ ✓
Phaenicophaeus superciliosus
Red-crested Malkoha ✓ ✓ ✓
Phaenicophaeus cumingi
Scale-feathered Malkoha
✓ ✓ ✓
Pycnonotus goiavier Yellow-vented Bulbul ✓ ✓ ✓
Pycnonotus urostictus Yellow-wattled Bulbul ✓ ✓ ✓
Stachyris whiteheadi Chestnut-faced Babbler
✓ ✓
Megalaima haemacephala
Coppersmith Barbet ✓ ✓
Macropygia tenuirostris Philippine Cuckoo-Dove
✓ ✓
Ptilinopus occipitalis Yellow-breasted Fruit-Dove
✓ ✓
Cacomantis variolosus Brush Cuckoo ✓
Orthotomus cuculatus Mountain Tailorbird ✓
Sarcops calvus Coleto ✓ ✓ ✓
Centropus bengalensis Lesser Coucal ✓ ✓ ✓
Centropus viridis Philippine Coucal ✓ ✓ ✓
Buceros hydrocorax Rufous Hornbill ✓ ✓ ✓
Corvus macrorhynchos Large-billed Crow ✓ ✓
Stachyris striata Luzon-striped Babbler ✓ ✓
Brachypterix montana White-browed Shortwing
✓ ✓
Halcyon smyrnensis White-throated Kingfisher
✓ ✓
Caprimulgus manillensis
Philippine Nightjar ✓
Phapitreron amethystina
Amethyst Brown-Dove ✓ ✓

ECOLOGICAL ASSESSMENT IN THE B+WISER SITES | 41
Note: Checkmark indicates extent of occurrence/presence of the species.
Mammals Key Findings (Table 28):
Diadem Leaf-nosed Bat (Hipposideros diadema) and Luzon Fruit Bat Otopterupus
cartilagonodus are generalist species that can be found in all habitat types.
Most species are found in the interface between forest and non-forest, e.g., Common
Short-nosed Fruit Bat (Cynopterus brachyotis), Philippine Nectar Bat (Eonycterus
robusta), Common Dawn Bat (Eonycterus spelaean), Lesser Long-tongued Fruit Bat
(Macroglossus minimus), Bare-rumped Sheathtail Bat (Saccolaimus saccolaimus) and
Greater Flat-headed Bat (Tylonycteris robustula. These species are tolerant to high degree
of habitat disturbance. Table 28. Species survival envelopes of bats in KWFR-UMRBPL using Canonical
Correspondence Analysis.
Note: Checkmarks indicate extent of occurrence/presence of species.
Scientific Name
Common Name
Forest
dependent
Degraded
forest
Interface of
forest and
non-forest
Non-forest
Hipposideros diadema Diadem Leaf-nosed Bat
✓ ✓ ✓ ✓
Otopterupus cartilagonodus
Luzon Fruit Bat ✓ ✓ ✓ ✓
Cynopterus brachyotis Common Short-nosed Fruit Bat
✓
Eonycterus robusta Philippine Nectar Bat
✓
Eonycterus spelaean Common Dawn Bat
✓
Haplonycteris fischeri Philippine Pygmy Fruit Bat
✓
Kerivoula whiteheadi Whitehead’s Woolly Bat
✓
Macroglossus minimus Lesser Long-
tongued Fruit Bat ✓
Megaderma spasma Lesser False Vampire
✓
Species Common Name Forest
dependent
Degraded
forest
Interface of
forest and
non-forest
Non-forest/
Cultivation
Loriculus philippensis Colasisi ✓ ✓
Dendrocopos maculatus
Philippine Pygmy Woodpecker
✓ ✓
Centropus unirufus Rufous Coucal ✓ ✓
Streptopelia chinensis Spotted Dove ✓ ✓
Chrysocolaptes lucidus Greater Flameback ✓
Penelopides manillae Tarictic Hornbill ✓
Harpactes ardens Philippine Trogon ✓
Pitta erythrogaster Red-bellied Pitta ✓
Copsychus luzoniensis White-browed Shama ✓
Penelopides manillae ✓

42 | ECOLOGICAL ASSESSMENTS IN THE B+WISER SITES
Scientific Name
Common Name
Forest
dependent
Degraded
forest
Interface of
forest and
non-forest
Non-forest
Myotis muricola Wall-roosting mouse-eared bat
✓
Pterochirus jagori Greater Musky Fruit Bat
✓
Rhinolopus arcuatus Arcuate Horseshoe Bat
✓
Rouseffus amplexicaudatus
Geoffroy's rousette
✓
Saccolaimus saccolaimus
Bare-rumped Sheathtail Bat
✓
Tylonycteris pachypus Lesser Bamboo Bat
✓
Tylonycteris robustula Greater Flat-headed Bat
✓
Amphibians Key Findings (Table 29):
The Masked wrinkled ground frog (Platymantis corrugatus), Whistling wrinkled ground
frog (Platymantis dorsalis), Asiatic painted narrowmouth toad (Kaloula picta), Luzon
striped stream frog (Hylarana similis) and the Common puddle frog (Occidozyga laevis)
are species that can tolerate a wide range of habitat, degraded to open areas.
Table 29. Species survival envelopes of amphibians in KWFR-UMRBPL using Canonical
Correspondence Analysis. Note: Checkmarks indicate extent of occurrence/presence of species
.Species Common Name Forest
dependent
Degraded
forest
Interface of
forest and
non-forest
Non-forest/
Cultivation
Polypedates leucomystax
Four-lined tree frog
✓
Platymantis corrugatus Masked wrinkled ground frog
✓ ✓ ✓
Platymantis dorsalis Whistling wrinkled ground frog
✓ ✓ ✓
Kaloula picta Asiatic painted narrowmouth toad
✓ ✓
Hylarana similis Luzon striped stream frog
✓ ✓
Limnonectes macrocephalus
Luzon fanged frog
✓
Occidozyga laevis Common puddle frog
✓ ✓
Note: Checkmark indicates extent of occurrence/presence of the species.
Reptiles Key Findings (Table 30):
The Negros forest dragon (Gonocephalus sophiae) appears to be forest dependent.
The Gunther's Whip Snake (Ahaetulla prasina), Common House Gecko (Hemidactylus
frenatus), Philippine Flying Dragon (Draco spilopterus), Many-keeled Mabuya (Eutropis
multicarinata), Tokay Gecko (Gekko gecko), Jagor's Sphenomorphus (Pinoyscinus

ECOLOGICAL ASSESSMENT IN THE B+WISER SITES | 43
jagori) and the Philippine pit viper (Trimeresurus flavomaculatus) are found in degraded
to non-forested areas.
Table 30. Species survival envelopes of reptiles in KWFR-UMRBPL using Canonical
Correspondence Analysis.
Note: Checkmarks indicate extent of occurrence/presence of species.
Species Common Name Forest
dependent
Degraded
forest
Interface
of forest
and
non-forest
Non-forest
Bronchocela cristatella Green crested lizard
✓ ✓
Gonocephalus sophiae Negros forest dragon
✓
Gekko gecko Tokay Gecko ✓ ✓
Hemidactylus frenatus Common house gecko
✓ ✓
Ahaetulla prasina Gunther’s whip snake
✓
Draco spilopterus Philippine flying dragon
✓
Eutropis multicarinata Many-keeled mabuya
✓
Pinoyscinus jagori Jagor’s sphenomorphus
✓
Trimeresurus flavomaculatus Philippine vit viper
✓
Bago Watershed, MKNP and NNNP
Plants (Trees) Key Findings (Table 31):
Syzygium sp.9 and Tristianopis decorticate are specialists that prefer intact forest
habitats.
Syzygium sp.1, Agathis philippensis, Dendrocnide sp., Parashorea malaanonan, Shorea
negrosensis, and Shorea polysperma are dipterocarps that are forest dependents but are
tolerant to anthropogenic disturbances.
Table 31. Species survival envelopes of trees in Bago Watershed, MKNP and NNNP using
Canonical Correspondence Analysis. Note: Checkmark indicates extent of occurrence/presence of the species.
.Scientific Name Common
Name
Intact
Forest
Degraded
forest
Interface
of forest
and
non-forest
Non-forest
/ Open
Forest
Syzygium sp. 9 ✓
Tristianopsis decorticata Malabayabas ✓
Syzygium sp. 1 ✓ ✓
Agathis philippensis Almaciga ✓ ✓
Dendrocnide sp. ✓ ✓
Bischofia javanica Tuai ✓ ✓ ✓
Palaquium sp. 2 ✓ ✓ ✓

44 | ECOLOGICAL ASSESSMENTS IN THE B+WISER SITES
.Scientific Name Common
Name
Intact
Forest
Degraded
forest
Interface
of forest
and
non-forest
Non-forest
/ Open
Forest
Parashorea malaanonan Bagtikan ✓ ✓
Shorea negrosensis Red Lauan ✓ ✓ ✓
Shorea polysperma Tangile ✓ ✓ ✓
Palaquium sp. 1 ✓
Macaranga bicolor Hamindang ✓
Swietenia macrophylla Mahogany ✓
Syzygium sp. 5 ✓
Dacryocarpus imbricata Igem ✓ ✓
Shorea contorta White Lauan ✓ ✓
Syzygium sp. 2 ✓ ✓
Syzygium sp. 6 ✓ ✓
Syzygium sp. 7 ✓ ✓
Myristica philippinensis Duguan ✓
Syzygium sp. 3 ✓
Syzygium sp. 4 ✓
Syzygium sp. 8 ✓
Birds
Key Findings (Table 32):
Results showed that 25 species (Amethyst brown-dove, Balicassiao, Blue-headed fantail,
Blue-backed parrot, Coleto, Elegant tit, Metallic pigeon, Mountain white-eye, Mountain
verditer flycatcher, Negros striped babbler, Pink-bellied imperial pigeon, Philippine
pygmy woodpecker, Philippine tailorbird, Pied triller, Snowy-browed flycatcher, White-
breasted wood-swallow, White-eared brown-dove, White-vented whistler, White-winged
cuckoo-shrike, Yellow-bellied whistler, Yellow-vented bulbul, Yellow-wattled bulbul,
and Yellow-breasted fruit-dove) have preference to mature forest type but with some
degree of tolerance to habitat degradation. With a wide niche width, these species can
also occupy a wide range of forest habitat types ranging from old growth to early
secondary growth forests.
Species such as Blue-naped parrot, Tarictic hornbill, White-bellied wood-pecker, Lovely
sunbird, Philippine tailorbird, Cetrine canary flycatcher and Philippine coucal show a
higher preference to advance secondary growth and old growth forests suggesting that
these species are forest obligates.
Table 32. Species survival envelopes of birds in Bago Watershed, MKNP and NNNP using
Canonical Correspondence Analysis. Note: Checkmark indicates extent of occurrence/presence of the species.
Species Common Name Intact
forest
Degraded
forest
Interface of
forest and
non-forest
Non-
forest /
Open
Forest
Phapitreron amethystina Amethyst brown dove
✓ ✓ ✓
Dicrurus balicassius Balicassiao ✓ ✓ ✓ ✓
Rhipidura cyaniceps Blue-headed fantail ✓ ✓ ✓
Tanygnathus sumatranus Blue-backed parrot ✓ ✓ ✓

ECOLOGICAL ASSESSMENT IN THE B+WISER SITES | 45
Species Common Name Intact
forest
Degraded
forest
Interface of
forest and
non-forest
Non-
forest /
Open
Forest
Tanygnathus lucionensis salvadorii
Blue-naped parrot ✓
Culicicapa helianthea Citrine canary flycatcher
✓
Sarcops calvus Coleto ✓ ✓ ✓ ✓
Parus elegans Elegant tit ✓ ✓ ✓
Aethopyga shelleyi Lovely sunbird ✓
Columba vitiensis anthracina
Metallic imperial-pigeon
✓ ✓ ✓ ✓
Zosterops montanus Mountain white-eye ✓ ✓
Eumyias panayensis Mountain verditer flycatcher
✓ ✓ ✓ ✓
Stachyris nigrorum Negros striped-babbler
✓ ✓
Ducula poliocephala Pink-bellied imperial-pigeon
✓ ✓ ✓ ✓
Macropygia tenuirostris tenuirostris
Philippine cuckoo-dove
✓ ✓
Ixos philippinus Philippine bulbul ✓ ✓ ✓ ✓
Centropus viridis Philippine coucal ✓ ✓
Dendrocopos maculatus Philippine pygmy woodpecker
✓
Orthotomus castaneiceps Philippine tailorbird ✓ ✓
Lalage nigra Pied triller ✓ ✓
Ficedula hyperythra nigrorum
Snowy-browed flycatcher
✓ ✓ ✓ ✓
Penelopides panini Visayan hornbill ✓ ✓
Brachypteryx montana White-browed shortwing
✓ ✓ ✓ ✓
Dryocopus javensis White-bellied woodpecker
✓ ✓ ✓
Phapitreron leucotis nigrorum
White-eared brown dove
✓ ✓ ✓ ✓
Pachycephala homeyeri White-vented whistler
✓ ✓
Coracina ostenta White-winged cuckoo-shrike
✓ ✓
Ptilinopus occipitalis occipitalis
Yellow-breasted fruit-dove
✓ ✓
Zosterops nigrorum Yellowish white-eye ✓ ✓
Pycnonotus goiavier Yellow-vented bulbul ✓ ✓
Pycnonotus urostictus Yellow-wattled bulbul
✓ ✓
Mammals Key Findings (Table 33):
Myotis rufopictus, Rhinolophus virgo, Haplonycteris fischeri and Nyctimene rabori are
associated with advanced secondary growth forests. While those species associated with
more degraded habitats include Rhinolophus arcuatus and Macroglossus minimus.
Noteworthy species such as the endemic and Critically Endangered Dobsonia chapmani
and the Endangered Nyctimene rabori were mainly observed only in advanced secondary
growth. This suggests that this type of habitat is more preferred by the species.

46 | ECOLOGICAL ASSESSMENTS IN THE B+WISER SITES
Almost all species of bats recorded during the survey are associated with forest habitats,
may it be pristine or degraded in condition.
The Critically Endangered Dobsonia chapmani (Barebacked fruit bat) is a forest species
with very narrow niche width suggesting that the species is a specialist. The same goes
with the Near Threatened Miniopterus schreibersii (Common bent-winged bat) whose
narrow niche width may have contributed to its very low occurrence in area/s where the
species is most likely to be found.
Table 33. Species survival envelopes of mammals in Bago Watershed, MKNP and NNNP
using Canonical Correspondence Analysis. Note: Checkmark indicates extent of occurrence/presence of the species.
Scientific Name Common Name Intact
Forest
Degraded
forest
Interface of
forest and
non-forest
Non-forest /
Open
Forest
Cynopterus brachyotis
Common Short-nosed Fruit Bat
✓ ✓ ✓
Dobsonia chapmani Philippine naked-backed fruit bat
✓
Haplonysteris fischeri Philippine Pygmy Fruit Bat
✓ ✓ ✓
Harpyionycteris whiteheadi
Harpy fruit bat ✓ ✓
Macroglossus minimus
Lesser Long-tongued Fruit Bat
✓ ✓ ✓
Miniopterus schreibersii
Common bent-wing bat
✓ ✓
Nyctimene rabori Philippine tube-nosed fruit bat
✓ ✓ ✓
Ptenochirus jagori Greater Musky Fruit Bat
✓ ✓ ✓
Pteropus pumilus Little golden-mantled flying fox
✓ ✓
Rhinolophus arcuatus Arcuate Horseshoe Bat
✓ ✓ ✓
Rhinolophus virgo Yellow-faced horseshoe bat
✓
Rousettus amplexicaudatus
Geoffroy's rousette ✓ ✓
Amphibians Key Findings (Table 34):
Hylarana everetti, Platymantis guentheri, Polypedates leucomystax, Rhacophorus
pardalis, Platymantis hazelae and Occidozyga laevis prefer ASG forest.
The results of the species are positioned closely to habitat continuum (secondary growth
forest to forest edges). Occidozyga laevis shows a wide range of habitat preference,
ranging from degraded forest-to-forest edges. L. visayanus prefer habitat on forest edges.
All the frog species selected have tolerance to degraded forest except for Limnonectes
visayanus. Occidozyga laevis also prefer habitat on forest edges aside from degraded
forest.

ECOLOGICAL ASSESSMENT IN THE B+WISER SITES | 47
Table 34. Species survival envelopes of amphibians in Bago Watershed, MKNP and NNNP using Canonical Correspondence Analysis.
Note: Checkmark indicates extent of occurrence/presence of the species.
Species Common
Name
Intact
Forest
Degraded
forest
Interface of
forest and
non-forest
Non-forest
/ Open
Forest
Limnonectes visayanus
Philippine wart frog
✓
Hylarana erythraea Common green frog
✓
Platymantis corrugatus
Masked wrinkled ground frog
✓
Platymantis dorsalis Whistling wrinkled ground frog
✓
Platymantis guentheri Guenther’s forest frog
✓
Platymantis hazelae Hazel’s wrinkled ground frog
✓
Polypedates leucomystax
Four-lined tree frog
✓
Occidozyga laevis Common puddle frog
✓ ✓
Sanguirana everetti Everett’s frog ✓
Rhacophorus pardalis
Harlequin tree frog
✓
MKNRP
Plants (Trees) Key Findings (Table 35):
The following species of trees prefer forest habitats: Agathis philippinensis, Calophyllum
inophyllum, Mallotus mollisimus, and Syzygium nitidum. This suggests that these species
are intolerant to habitat disturbance.
Cinnamomum mercadoi, Dacrycarpus imbricatus and Palaquium tenuipetoliatum prefer
wide range of habitat from forest to non-forest, which indicate that these species are
generalists and can withstand habitat disturbance.
Shorea negrosensis (Red Lauan) and Shorea polysperma (Tanguile), both classified as
Critically Endangered, showed association with degraded forest. This indicates that these
species can possibly tolerate certain degree of disturbance.
Table 35. Species survival envelopes of trees in MKRNP using Canonical Correspondence
Analysis. Note: Checkmark indicates extent of occurrence/presence of the species.
Species Common
Name Intact Forest
Degraded Forest
Forest Edge
Non-forest
Agathis philippinensis Almaciga ✓ ✓
Calophyllum inophyllum Bitaog ✓ ✓
Mallotus mollisimus Hinlaumo ✓ ✓
Syzygium nitidum Makaasim ✓ ✓

48 | ECOLOGICAL ASSESSMENTS IN THE B+WISER SITES
Species Common
Name Intact Forest
Degraded Forest
Forest Edge
Non-forest
Acer laurinum Philippine
Maple ✓ ✓ ✓
Cinnamomum mercadoi Kalingag ✓ ✓ ✓ ✓
Dacrycarpus imbricatus Igem ✓ ✓ ✓ ✓
Palaquium tenuipetoliatum Maniknik ✓ ✓ ✓
Shorea negrosensis Red Lauan ✓ ✓
Shorea polysperma Tangile ✓ ✓
Birds Key Findings (Table 36):
Short-crested monarch (Hypothymis helenae) and Mindanao White-eye (Lophozosterops
goodfellowi) have narrow niche widths that indicate their sensitivity with forest
degradation and deforestation.
Phapitreron amethystinus, Basilornis mirandus, Prioniturus discurus, Centropus
melanops, Rhipidura superciliaris, Hypocryptadius cinnamomeus, Prioniturus montanus
and Rhabdotorrhinus leucocephalus are forest species with wide niche width that can
inhabit varying forest habitats.
Rhipidura nigrocinnamomea, Ptilinopus occipitalis, Aethopyga primigenius, Irena
cyanogastra and Penelopides panini panini are species that prefer forest habitats and can
tolerate forests that are highly degraded. This suggests that these species can be indicators
of habitat disturbance.
Colasisi and White-eared Brown dove are forest obligate species but are very tolerant of
various degrees of degradation and anthropogenic disturbances.
The highly elusive Black-bibbed Cuckoo-shrike, categorized as Vulnerable, prefer forest
habitats but showed tolerance to various degrees of forest degradation.
Table 36. Species survival envelopes of birds in MKRNP using Canonical Correspondence
Analysis.
Note: Checkmark indicates extent of occurrence/presence of the species.
Species Common Name Intact Forest Degraded
Forest Forest Edge
Non-forest
Hypothymis helenae Short crested monarch
✓
Lophozosterops goodfellowi
Black-masked White-eye
✓
Phapitreron amethystina Amethyst brown dove
✓ ✓
Basilornis mirandus Apo myna ✓ ✓
Prioniturus discurus Blue-crowned Racquet-tail
✓ ✓
Centropus melanops Black-masked coucal
✓ ✓
Rhipidura superciliaris Blue fantail ✓ ✓
Hypocryptadius cinnamomeus
Cinnamon ibon ✓ ✓
Prioniturus montanus Mountain Racquet-tail
✓ ✓
Rhabdotorrhinus leucocephalus
Writhed hornbill ✓ ✓

ECOLOGICAL ASSESSMENT IN THE B+WISER SITES | 49
Species Common Name Intact Forest Degraded
Forest Forest Edge
Non-forest
Rhipidura nigrocinnamomea
Black and cinnamon fantail
✓ ✓ ✓
Ptilinopus occipitalis Yellow-breasted Fruit Dove
✓ ✓ ✓
Aethopyga primigenius Grey-hooded sunbird
✓ ✓ ✓
Irena cyanogastra Philippine fairy bluebird
✓ ✓ ✓
Penelopides affinis Mindanao hornbill ✓ ✓ ✓
Loriculus philippensis Colasisi ✓ ✓ ✓ ✓
Phapitreron leucotis White-eared Brown Dove
✓ ✓ ✓ ✓
Corasina mindanensis Black-bibbed Cuckoo Shrike
✓ ✓
Mammals Key Findings (Table 37):
Eonycteris spelaea and Rhinolophus inops are forest species but are very tolerant to
habitat degradation.
Macroglossus minimus, Ptenochirus jagori and Ptenochirus minor have wide niche
widths and can be observed in different habitat types from forest to non-forest areas or
generalists.
Cynopterus brachyotis, Harpyionycteris whiteheadi, Kerivoula hardwicki, Pipistrellus
javanicus, and Dyacopterus rickartii are forest generalists. These cannot survive in non-
forest habitats but have high level of tolerance to disturbance gradients.
Table 37. Species survival envelopes of mammals in MKRNP using Canonical
Correspondence Analysis. Note: Checkmark indicates extent of occurrence/presence of the species.
Scientific Name Common Name Intact Forest
Degraded Forest
Forest Edge Non-forest
Eonycteris spelaea Common Dawn Bat ✓ ✓
Rhinolophus inops Philippine forest horseshoe bat
✓ ✓ ✓
Macroglossus minimus
Lesser Long-tongued Fruit Bat
✓ ✓ ✓ ✓
Ptenochirus jagori Greater Musky Fruit Bat
✓ ✓ ✓ ✓
Ptenochirus minor ✓ ✓ ✓ ✓
Cynopterus brachyotis Common Short-nosed Fruit Bat
✓ ✓ ✓
Harpyionycteris whiteheadi
Harpy fruit bat
✓ ✓
Kerivoula cf hardwickii Hardwicke's woolly bat
✓ ✓
Pipistrellus cf javanicus
Java pipistrelle
✓ ✓
Dyacopterus rickartii Philippine Large-headed Fruit bat
✓ ✓

50 | ECOLOGICAL ASSESSMENTS IN THE B+WISER SITES
Reptiles Key Findings (Table 38):
Negros Forest Dragon (Gonocephalus sophiae) preference for intact forest, which
indicates that this species is a forest obligate and cannot tolerate degraded habitats.
Cox’s sphenomorphus (Sphenomorphus coxi), Diwata sphenomorphus (Sphenomorphus
diwata), Northern Triangle-spotted Snake (Cyclocorus lineatus), and White-lined Water
Snake (Rhabdophis auriculata) are forest generalists - tolerant of habitat varying degrees
of degradation.
Banded Malaysian burrowing snake (Calliophis intestinalis), Non-banded Philippine
burrowing snake (Oxyrhabdium modestum), Philippine Pit viper (Trimeresurus
flavomaculatus) and Davao waterside skink (Tropidophorus davaoensis) are species that
thrive in degraded forest habitats.
Table 38. Species survival envelopes of reptiles in MKRNP using Canonical
Correspondece Analysis. Note: Checkmark indicates extent of occurrence/presence of the species.
Species Common name Intact Forest
Degraded Forest
Forest Edge
Non-forest
Gonocephalus sophiae Negros forest dragon
✓
Sphenomorphus coxi Cox’s sphenomorphus
✓ ✓
Sphenomorphus diwata Diwata sphenomorphus
✓ ✓
Cyclocorus lineatus Northern triangle-spotted snake
✓ ✓
Rhabdophis auriculata White-lined water snake
✓ ✓ ✓
Calliophis intestinalis Malaysian burrowing snake
✓ ✓
Oxyrhabdium modestum Philippine burrowing snake
✓ ✓
Trimeresurus flavomaculatus
Philippine pt viper
✓ ✓
Tropidophorus davaoensis Davao waterside skink
✓ ✓
Varanus salvator Common water monitor
✓ ✓
MANP
Plants (Trees)
Key Findings (Table 39):
The following species of trees prefer forest habitats but intolerant degradation: A.
philippinensis, C. inophyllum, M. mollisimus, and S. nitidum.
C. mercadoi, D. imbricatus and P. tenuipetoliatum prefer a wide range of habitat from
forest to non-forest, which indicates that these species are generalists and can withstand
habitat disturbance.
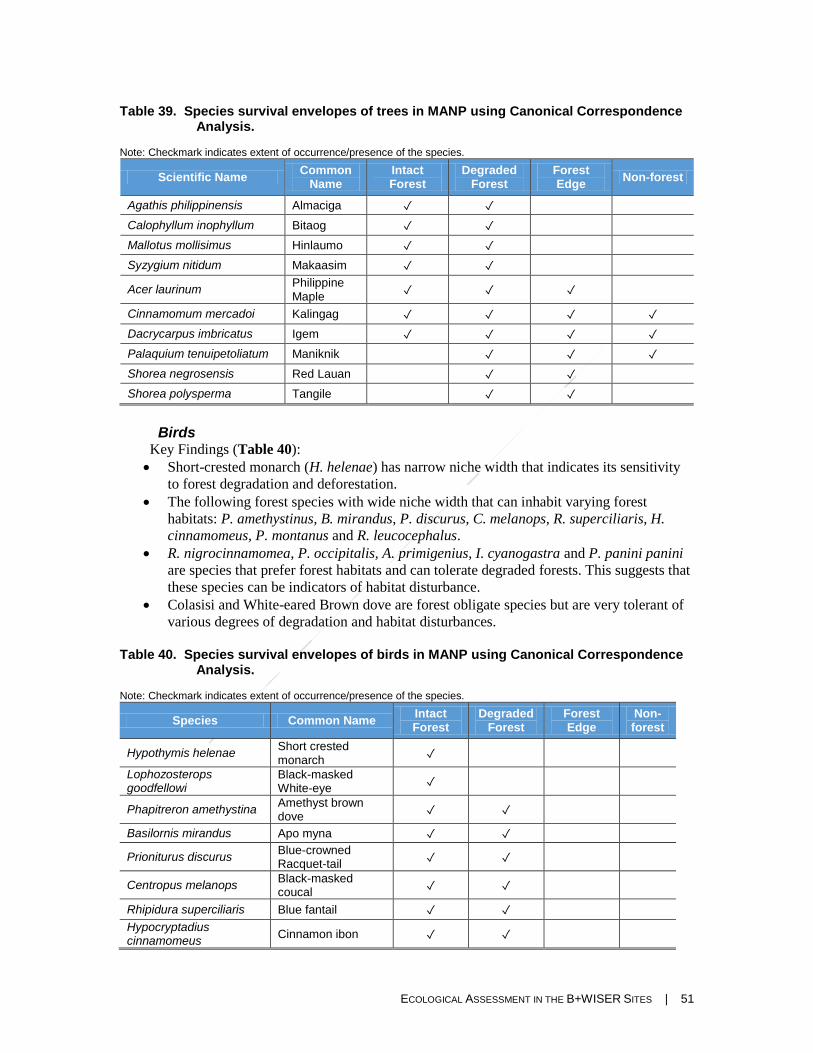
ECOLOGICAL ASSESSMENT IN THE B+WISER SITES | 51
Table 39. Species survival envelopes of trees in MANP using Canonical Correspondence Analysis.
Note: Checkmark indicates extent of occurrence/presence of the species.
Scientific Name Common
Name Intact Forest
Degraded Forest
Forest Edge
Non-forest
Agathis philippinensis Almaciga ✓ ✓
Calophyllum inophyllum Bitaog ✓ ✓
Mallotus mollisimus Hinlaumo ✓ ✓
Syzygium nitidum Makaasim ✓ ✓
Acer laurinum Philippine Maple
✓ ✓ ✓
Cinnamomum mercadoi Kalingag ✓ ✓ ✓ ✓
Dacrycarpus imbricatus Igem ✓ ✓ ✓ ✓
Palaquium tenuipetoliatum Maniknik ✓ ✓ ✓
Shorea negrosensis Red Lauan ✓ ✓
Shorea polysperma Tangile ✓ ✓
Birds
Key Findings (Table 40):
Short-crested monarch (H. helenae) has narrow niche width that indicates its sensitivity
to forest degradation and deforestation.
The following forest species with wide niche width that can inhabit varying forest
habitats: P. amethystinus, B. mirandus, P. discurus, C. melanops, R. superciliaris, H.
cinnamomeus, P. montanus and R. leucocephalus.
R. nigrocinnamomea, P. occipitalis, A. primigenius, I. cyanogastra and P. panini panini
are species that prefer forest habitats and can tolerate degraded forests. This suggests that
these species can be indicators of habitat disturbance.
Colasisi and White-eared Brown dove are forest obligate species but are very tolerant of
various degrees of degradation and habitat disturbances.
Table 40. Species survival envelopes of birds in MANP using Canonical Correspondence
Analysis. Note: Checkmark indicates extent of occurrence/presence of the species.
Species Common Name Intact Forest
Degraded Forest
Forest Edge
Non-forest
Hypothymis helenae Short crested monarch
✓
Lophozosterops goodfellowi
Black-masked White-eye
✓
Phapitreron amethystina Amethyst brown dove
✓ ✓
Basilornis mirandus Apo myna ✓ ✓
Prioniturus discurus Blue-crowned Racquet-tail
✓ ✓
Centropus melanops Black-masked coucal
✓ ✓
Rhipidura superciliaris Blue fantail ✓ ✓
Hypocryptadius cinnamomeus
Cinnamon ibon ✓ ✓

52 | ECOLOGICAL ASSESSMENTS IN THE B+WISER SITES
Species Common Name Intact Forest
Degraded Forest
Forest Edge
Non-forest
Prioniturus montanus Mountain Racquet-tail
✓ ✓
Rhabdotorrhinus leucocephalus
Writhed hornbill ✓ ✓
Rhipidura nigrocinnamomea
Black and cinnamon fantail
✓ ✓ ✓
Ptilinopus occipitalis Yellow-breasted Fruit Dove
✓ ✓ ✓
Aethopyga primigenius Grey-hooded sunbird
✓ ✓ ✓
Irena cyanogastra Philippine fairy bluebird
✓ ✓ ✓
Penelopides affinis Mindanao hornbill ✓ ✓ ✓
Loriculus philippensis Colasisi ✓ ✓ ✓ ✓
Phapitreron leucotis White-eared Brown Dove
✓ ✓ ✓ ✓
Corasina mindanensis Black-bibbed Cuckoo Shrike
✓ ✓
Mammals
Key Findings (Table 41):
E. spelaea and R. inops are forest species but are very tolerable to habitat degradation.
M. minimus, P. jagori and P. minor have wide niche widths and can be observed in
different habitat types from forest to non-forest areas.
C. brachyotis, H. whiteheadi, K. hardwicki, P. javanicus, and D. rickartii are species with
high level of tolerance to disturbed gradients but not extending to non-forest areas.
Table 41. Species survival envelopes of bats in MANP using Canonical Correspondence
Analysis. Note: Checkmark indicates extent of occurrence/presence of the species.
Scientific Name
Common Name Intact Forest
Degraded Forest
Forest Edge Non-forest
Eonycteris spelaea Common Dawn Bat ✓ ✓
Rhinolophus inops Philippine forest horseshoe bat
✓ ✓ ✓
Macroglossus minimus
Lesser Long-tongued Fruit Bat
✓ ✓ ✓ ✓
Ptenochirus jagori Greater Musky Fruit Bat
✓ ✓ ✓ ✓
Ptenochirus minor ✓ ✓ ✓ ✓
Cynopterus brachyotis Common Short-nosed Fruit Bat
✓ ✓ ✓
Harpyionycteris whiteheadi
Harpy fruit bat
✓ ✓
Kerivoula cf hardwickii Hardwicke's woolly bat
✓ ✓
Pipistrellus cf javanicus
Java pipistrelle
✓ ✓
Dyacopterus rickartii Philippine Large-headed Fruit bat
✓ ✓

ECOLOGICAL ASSESSMENT IN THE B+WISER SITES | 53
Reptiles Key Findings (Table 42):
Negros Forest Dragon (G. sophiae) showed association with intact forest, which indicate
that this species is a forest obligate and cannot tolerate anthropogenic disturbances.
The following are forest species but are tolerant of habitat degradation at a certain degree:
Cox’s sphenomorphus (S. coxi), Diwata sphenomorphus (S. diwata), Northern Triangle-
spotted Snake (C. lineatus), and White-lined Water Snake (R. auriculata).
Banded Malaysian burrowing snake (C. intestinalis), Non-banded Philippine burrowing
snake (O. modestum), Philippine Pit viper (T. flavomaculatus) and Davao waterside skink
(T. davaoensis) are species that thrive in degraded forest habitats.
Table 42. Species survival envelopes of reptiles in MANP using Canonical
Correspondence Analysis. Note: Checkmark indicates extent of occurrence/presence of the species.
Species Common Name Intact Forest
Degraded Forest
Forest Edge Non-forest
Gonocephalus sophiae Negros forest dragon
✓
Sphenomorphus coxi Cox’s sphenomorphus
✓ ✓
Sphenomorphus diwata Diwata sphenomorphus
✓ ✓
Cyclocorus lineatus Northern triangle-spotted snake
✓ ✓
Rhabdophis auriculata White-lined water snake
✓ ✓ ✓
Calliophis intestinalis Malaysia burrowing snake
✓ ✓
Oxyrhabdium modestum Non-banded Philippine burrowing snake
✓ ✓
Trimeresurus flavomaculatus
Philippine pit viper
✓ ✓
Tropidophorus davaoensis
Davao waterside skink
✓ ✓
Varanus salvator Common water monitor
✓ ✓
3.3. RESULTS OF SPECIES OCCUPANCY MODELING OF TREES, BIRDS, REPTILES, AMPHIBIANS AND MAMMALS AND POPULATION
ESTIMATION OF BIRDS
This section presents the result of the occupancy modeling which estimates the proportion of
sites occupied by a single species during a short time interval (single breeding season) when a
probability of detecting a species is less than one. These models are based on detection histories
for each site constructed using straightforward probabilistic arguments and permits maximum
likelihood estimation of the modeled parameters. (See section 4.1.)

54 | ECOLOGICAL ASSESSMENTS IN THE B+WISER SITES
NSMNP
Plants (Trees) Key Findings (Table 43):
Five species of trees have >50% occupancy (Calophylllum inophyllum, Dipterocarpus
grandiflorus, Ficus variegata, Shorea contorta, Shorea negrosensis). These species
occupy a significant area of the park. This also suggests that these species are the most
abundant and dominant.
Seven tree species have 5% occupancy. This includes the forest-restricted species such as
the endangered Manggachapoi Hopea acuminata and the critically endangered Kalantas
Toona kalantas. These two species appear to naturally occur in low densities in the park.
Macaranga grandifolia is another species with only 5% occupancy. This species is an
indicator of regenerating forest habitats.
Environmental variables with the highest contribution to most species’ occupancy and
detection are elevation, humus thickness and extent of ground exposure.
Table 43. Occupancy models of selected tree in NSMNP.
Scientific Name Common
Name Occupancy,
Ψ (%)1
Environmental factors influencing species occupancy, ω2
Elevation Humus Canopy Cover
Avg. Ground
exposure
Trees with DBH 25-50cm
Agathis philippinensis Almaciga 11 45.14 41.99 44.68 65.15 34.08
Calophylllum inophyllum Bitaog 50 18.56 49.85 18.56 18.56 46.06
Canarium ovatum Piling Liitan 11 34.55 47.9 43.99 57.14 29.41
Dillenia philippinensis Katmon 38 39.41 92.53 29.25 84.15 99.27
Diospyros philippinensis Oi-Oi 16 52.8 57.3 61.82 90.46 97.19
Dipterocarpus grandiflorus
Apitong 72 99.69 76.1 47.91 96.13 47.64
Dracontomelon dao Dao 16 93.52 39.22 29.11 27.45 82.12
Ficus minahassae Hagimit 5 64.87 61.39 52.73 45 51.67
Ficus variegata Tangisang bayawak
50 32.37 38.89 36.47 44.11 47.98
Gmelina arborea Gmelina 5 27.54 39.96 55.57 71.85 36.96
Hopea acuminata Manggachapui 5 42.15 32.42 39.8 52.26 41.35
Macaranga grandifolia Takip Asin 5 57.07 34.73 47.39 64.23 42.15
Macaranga tanarius Binunga 33 33.35 60.17 59.36 47.1 45.95
Nauclea orientalis Bangkal 11 33.04 85.9 63.8 48.16 50.29
Nephelium lappaceum Usau 22 31.04 50.26 34.3 43.75 54.5
Palaquium luzoniensis Nato 11 34.64 59.12 35.5 97.2 94.11
Palaquium philippense Malakmak 16 41.14 41.14 59.52 52.16 35.02
Parkia timoriana Kupang 5 63.1 47.39 60.86 46.24 29.8
Pterocarpus indicus Narra 33 99.66 58.4 58.14 92.29 37.11
Shorea contorta White Lauan 83 22.8 48.46 22.8 22.8 38.94

ECOLOGICAL ASSESSMENT IN THE B+WISER SITES | 55
Scientific Name Common
Name Occupancy,
Ψ (%)1
Environmental factors influencing species occupancy, ω2
Elevation Humus Canopy Cover
Avg. Ground
exposure
Trees with DBH 25-50cm
Shorea negrosensis Red Lauan 88 37.86 79.69 77.51 69.08 21.55
Syzygium tripinnatum Hagis 27 29.85 28.57 38.3 87.38 90.85
Toona kalantas Kalantas 5 35.61 35.82 46.61 39 45.85
Tristaniopsis decorticata Malabayabas 11 45.46 34.24 62.13 62.7 40.33
Vitex parviflora Molave 5 51.67 34.51 43.21 43.85 53.48 1 Occupancy indicates the proportion of area occupied (PAO) by the species in the site. 2 Akaike's Information Criterion (AIC) cummulative weights of five environmental covariates indicating level of support for each model.
Birds
Key Findings (Table 44):
Eight species of birds have an occupancy of >20% (see Table 44). These species include
the endemic Yellow-wattled Bulbul (Pycnonotus urostictus), White-lored Oriole (Oriolus
albiloris), Balicassiao (Dicrurus balicassius), Blue-breasted Flycatcher (Cyornis herioti)
and the near- threatened Sooty Woodpecker (Mulleripicus funebris). This result indicates
that these species were commonly detected and appeared abundant in the survey sites.
Species with 5% occupancy include the endemic Luzon Hornbill (Penelopides manillae),
Philippine Dwarf-Kingfisher (Ceyx melanurus), Philippine Hawk-Eagle (Nisaetus
philippenis) and Red-crested Malkoha (Dasylophus superciliosus). These species are
naturally wide-ranging but the results suggest that these species occur in low densities
and occupy small areas.
Environmental variables with significant contribution to most species are saplings, rattan
and canopy cover. It suggests that these parameters are predictors of the species’
occurrence.
Table 44. Occupancy models of selected birds in NSMNP.
Species Common Name Occupancy,
Ψ (%) 1
Environmental factors influencing species occupancy, ω 2
Saplings Rattan Large Trees
Ground cover
Canopy cover
Dicrurus balicassius Balicassiao 35 35% 38% 39% 40% 41%
Cyornis herioti Blue-breasted Flycatcher
23 42% 35% 59% 49% 62%
Chalcophaps indica Common Emerald-Dove
23 70% 41% 94% 41% 39%
Ficedula disposita Furtive Flycatcher
5 36% 33% 29% 33% 31%
Sterrhoptilus dennistouni
Golden-crowned Babbler
11 40% 46% 35% 35% 39%
Penelopides manillae
Luzon Hornbill 5 41% 42% 37% 46% 33%
Prionochilus olivaceus
Olive-backed Flowerpecker
27 33% 35% 25% 34% 30%
Ceyx melanurus Philippine Dwarf_Kingfisher
5 40% 52% 35% 42% 43%
Nisaetus philippensis
Philippine Hawk-Eagle
5 40% 61% 35% 35% 40%

56 | ECOLOGICAL ASSESSMENTS IN THE B+WISER SITES
Species Common Name Occupancy,
Ψ (%) 1
Environmental factors influencing species occupancy, ω 2
Saplings Rattan Large Trees
Ground cover
Canopy cover
Otus megalotis Philippine Scops-Owl
11 51% 71% 32% 46% 46%
Gallus gallus Red Junglefowl 5 58% 35% 36% 42% 53%
Phaenicophaeus superciliosus
Red-crested Malkoha
5 42% 55% 45% 42% 52%
Centropus unirufus Rufous Coucal 16 39% 44% 42% 36% 39%
Phaenicophaeus cumingi
Scale-feathered Malkoha
27 50% 32% 34% 51% 34%
Hypothymis helenae
Short-crested Monarch
11 51% 34% 44% 46% 51%
Corvus enca Slender-billed Crow
5 41% 42% 39% 46% 32%
Mulleripicus funebris
Sooty Woodpecker
22 47% 48% 30% 31% 38%
Oriolus albiloris White-lored Oriole
22 78% 31% 48% 44% 51%
Ptilinopus occipitalis Yellow-breasted Fruit-Dove
5 42% 55% 45% 42% 52%
Pycnonotus urostictus
Yellow-wattled Bulbul
22 68% 50% 37% 37% 36%
1 Occupancy indicates the proportion of area occupied (PAO) by the species in the site. 2 Akaike's Information Criterion (AIC) cummulative weights of five environmental covariates indicating level of support for each model.
Amphibians
Key Findings (Table 45):
Of the eight amphibian species modeled for occupancy, five have <20% occupancy. This
includes the endangered Platymantis cagayanensis and the vulnerable Kaloula
kalingensis.
Hylarana similis, Limnonectes macrocephalus and Occidozyga laevis have >20%
occupancy. This result suggest that these species common in the park.
Water bodies and the presence of saplings influence amphibian occupancy in the park
suggesting preference of riverine ecosystem.
Table 45. Occupancy models of selected amphibians in NSMNP.
Species Common Name
Occupancy Environmental factors influencing species
occupancy, ω 2
Ψ (%) 1 Elevation
Distance from Water Bodies
Canopy Cover
Humus Sapling
Fejervarya cancrivora Asian brackish frog 5 39.61% 56.72% 53.39% 29.91% 78.28%
Fejervarya vittigera Luzon wart frog 16 33.11% 45.58% 53.90% 41.97% 57.94%
Hylarana similis Laguna del bay frog 33 39.86% 82.69% 39.08% 40.49% 66.40%
Kaloula kalingensis Smooth-fingered narrow-mouthed frog
11 47.08% 57.77% 55.75% 42.86% 51.88%
Limnonectes macrocephalus
Luzon fanged frog 22 46.54% 78.23% 57.60% 46.46% 73.83%

ECOLOGICAL ASSESSMENT IN THE B+WISER SITES | 57
Species Common Name
Occupancy Environmental factors influencing species
occupancy, ω 2
Ψ (%) 1 Elevation
Distance from Water Bodies
Canopy Cover
Humus Sapling
Occidozyga laevis Common puddle frog
38 43.31% 35.79% 54.35% 50.51% 24.47%
Platymantis cagayanensis
Cagayan forest frog 16 85.91% 69.64% 65.87% 48.22% 26.42%
Sanguirana luzonensis
Luzon stream frog 16 51.51% 56.72% 53.39% 29.91% 78.28%
1 Occupancy indicates the proportion of area occupied (PAO) by the species in the site. 2 Akaike's Information Criterion (AIC) cummulative weights of five environmental covariates indicating level of support for each model.
Kaliwa and UMRBPL
Plants (Trees) Key Findings (Table 46):
Lagerstroemia speciosa, Antidesma bunius, Broussonetia luzonica Nauclea orientalis,
Hopea acuminata and Polyscias nodosa have low occupancy (10%). It indicates that
these species do not require large areas but require a specific combination of habitat
parameters such as rock, understorey and leaf litter.
Table 46. Occupancy models of selected trees in Kaliwa and UMRBPL.
Scientific Name Common Name Occupancy,
Ψ (%) 1
Environmental factors affecting occupancy (ω) 2
Leaf Litter
Canopy Ferns Rock Under-storey
Antidesma bunius Bignai 10 47.03% 39.71% 36.12% 36.00% 79.31%
Broussonetia luzonica
Himbabao 10 33.95% 44.94% 34.58% 56.05% 35.36%
Canarium ovatum Piling liitan 20 36.81% 40.54% 56.64% 39.95% 37.93%
Celtis philippinensis Malaikmo 20 40.67% 36.27% 58.49% 53.44% 48.27%
Ficus balete Balete 20 57.22% 42.76% 42.73% 42.68% 57.86%
Ficus nota Tibig 40 52.77% 38.46% 95.68% 55.34% 70.75%
Ficus odorata Pakiling 20 49.62% 28.52% 31.98% 70.60% 47.87%
Ficus variegata Tangisang Bayawak
30 46.55% 46.49% 87.32% 60.53% 57.16%
Lagerstroemia speciosa
Banaba 10 34.30% 45.23% 34.91% 56.28% 35.16%
Nauclea orientalis Bangkal 10 33.95% 44.94% 34.58% 56.05% 35.36%
Hopea acuminata Manggachapui 10 73.11% 45.43% 40.53% 48.18% 34.63%
Polyscias nodosa Malapapaya 10 33.95% 44.94% 34.58% 56.05% 35.36%
Syzygium nitidum Makaasim 30 53.29% 38.22% 65.32% 34.74% 56.61%
1 Occupancy indicates the proportion of area occupied (PAO) by the species in the site. 2 Akaike's Information Criterion (AIC) cummulative weights of five environmental covariates indicating level of support for each model.

58 | ECOLOGICAL ASSESSMENTS IN THE B+WISER SITES
Birds Key Findings (Table 47):
Luzon-Bleeding Heart (Gallicolumba luzonica), Philippine Fairy-Bluebird (Irena
cyanogaster) and Sooty Woodpecker (Mulleripicus funebris) have the lowest occupancy
(10%). Although these species do not require wide areas, they are influenced by certain
habitat requirements such as humus/leaf litter.
Philippine bulbul (Ixos philippinus) and the Philippine coucal (Centropus viridis) have
the highest occupancy at 50%. These species occupy wide areas in the watershed.
Table 47. Occupancy models of selected birds in KWFR and UMRBPL.
Species
Common Name
Occupancy
(%) 1
Environmental factors affecting occupancy (ω) 2
Canopy Moss Ferns Humus/
Litter Thickness
Midstorey
Phapitreron amethystina
Amethyst Brown-Dove
40 47.6 48.48 42.28 38.03 40.17
Loriculus philippensis
Colasisi 40 55.99 62.94 30.72 64.55 64.55
Parus elegans Elegant Tit 40 39.73 45.21 41.94 34.55 34.47
Gallicolumba luzonica
Luzon Bleeding-Heart
10 34.93 35.38 35.6 41.65 38.96
Stachyris striata Luzon-striped Babbler
20 43.62 40.66 60.9 69.6 66.44
Irena cyanogaster Philippine Fairy-Bluebird
10 34.93 35.38 35.6 41.65 38.96
Ixos philippinus Philippine Bulbul 50 36.5 48.22 39.42 38.96 36.63
Centropus viridis Philippine Coucal 50 43.05 47.99 46.29 42.71 44.44
Phaenicophaeus superciliosus
Red-crested Malkoha
20 39.6 32.5 33.7 34.21 30.66
Centropus unirufus Rufous Coucal 40 65.87 53.82 40.94 43.83 61.87
Buceros hydrocorax Rufous Hornbill 20 52.64 44.78 42.67 34.08 29.76
Mulleripicus funebris
Sooty Woodpecker
10 30.97 30.57 35.95 57.23 51.84
Phapitreron leucotis White-eared Brown-dove
40 38.3 47.68 41.23 35.94 36.98
Pycnonotus goiavier
Yellow-vented Bulbul
20 47.99 44.46 68.41 71.86 68.33
Pycnonotus urostictus
Yellow-wattled Bulbul
30 34.6 36.33 44.49 31.35 31.67
1 Occupancy indicates the proportion of area occupied (PAO) by the species in the site. 2 Akaike's Information Criterion (AIC) cummulative weights of five environmental covariates indicating level of support for each model.
Mammals Key Findings (Table 48):
Two species of bats, the Common Short-nosed Fruit Bat (Cynopterus brachyotis) and the
Greater Musky Fruit Bat (Pterochirus jagori) have the highest occupancy (50%). The
midstorey habitat variable influences their occupancy. This suggests that these species are
vulnerable to landscape-wide changes.
Whitehead’s Woolly Bat (Kerivoula whiteheadi), Wall-roosting mouse-eared bat (Myotis
muricola) and Pouch bat (Saccolaimus saccolaimus) have the lowest occupancy (10%).

ECOLOGICAL ASSESSMENT IN THE B+WISER SITES | 59
These species are insect eating bats that do not require large areas but need specific
habitat requirements such as fruiting/ flowering trees and canopy cover.
Table 48. Occupancy models of selected mammals in Kaliwa and UMRBPL.
1 Occupancy indicates the proportion of area occupied (PAO) by the species in the site. 2 Akaike's Information Criterion (AIC) cummulative weights of five environmental covariates indicating level of support for each model.
Amphibians
Key Findings (Table 49):
All four species of frogs have occupancy of 40-60%. Canopy cover, large diameter of
trees, saplings and the presence of water bodies influence these four species’ occupancy.
Scientific Name Common Name Occupancy
(%) 1
Environmental factors affecting occupancy (ω) 2
Distance to Ridge Top
Fruiting/ Flowering
Trees Canopy Midstorey Rattan
Cynopterus brachyotis
Common Short-nosed Fruit Bat
50 41.15% 41.39% 39.75% 44.99% 41.60%
Eonycterus robusta
Philippine Nectar Bat
30 35.87% 36.18% 53.67% 54.30% 46.21%
Eonycterus spelaean
Common Dawn Bat
20 37.32% 26.96% 50.31% 36.68% 87.57%
Haplonycteris fischeri
Philippine Pygmy Fruit Bat
20 55.00% 41.07% 73.40% 44.44% 49.49%
Hipposideros diadema
Diadem Leaf-nosed Bat
20 36.72% 39.81% 43.09% 35.63% 57.90%
Kerivoula whiteheadi
Whitehead’s Woolly Bat
10 45.99% 35.00% 56.54% 43.99% 33.52%
Macroglossus minimus
Lesser Long-tongued Fruit Bat
30 43.24% 39.29% 52.62% 53.60% 67.11%
Megaderma spasma
Lesser False Vampire
30 55.04% 32.16% 46.20% 46.82% 42.95%
Myotis muricola Wall-roosting mouse-eared bat
10 36.07% 58.00% 37.79% 36.32% 38.14%
Otopterupus cartilagonodus
Luzon Fruit Bat 10 52.84% 35.44% 45.66% 43.93% 35.38%
Pterochirus jagori Greater Musky Fruit Bat
50 41.05% 41.30% 39.65% 44.89% 41.49%
Rhinolopus arcuatus
Arcuate Horseshoe Bat
30 42.13% 35.95% 52.00% 51.95% 67.16%
Saccolaimus saccolaimus
Bare-rumped Sheathtail Bat
10 35.07% 58.80% 39.01% 35.58% 37.09%
Tylonycteris pachypus
Lesser Bamboo Bat
30 48.01% 33.71% 57.69% 29.25% 53.21%
Tylonycteris robustula
Greater Flat-headed Bat
40 55.31% 31.38% 65.42% 54.81% 41.62%

60 | ECOLOGICAL ASSESSMENTS IN THE B+WISER SITES
Table 49. Occupancy models of selected amphibians in KWFR and UMRBPL.
Species Common
Name Occupancy
(%) 1
Environmental factors affecting occupancy (ω) 2
Distance to Water Bodies
% Canopy Saplings Rattan
50-100 cm
DBH
Platymantis corrugatus
Masked wrinkled ground frog
60 45% 61% 51% 37% 57%
Platymantis mimulus
Diminutive forest frog
40 58% 47% 62% 35% 50%
Hylarana similis Luzon striped stream frog
60 55% 34% 51% 30% 59%
Polypedates leucomystax
Four-lined tree frog
60 64% 38% 30% 29% 62%
1 Occupancy indicates the proportion of area occupied (PAO) by the species in the site. 2 Akaike's Information Criterion (AIC) cummulative weights of five environmental covariates indicating level of support for each model.
Reptiles Key Findings (Table 50):
Ahaetulla prasina, Eutropis multicarinata, Pinoyscincus jagori, and Trimeresurus
flavomaculatus have high occupancy (100%). This indicates that these species are widely
occuring in the watershed.
Bronchocela cristatella, Gekko gecko, Common House Gecko (Hemidactylus frenatus)
and Philippine Bent-toed Gecko (Cyrtodactylus philippinicus) have the least occupancy
(40%). Occupancy of these species is influenced by humus/litter thickness and canopy.
Table 50. Occupancy models of selected reptiles in KWFR and UMRBPL.
Species
Occupancy Ψ (%) 1
Environmental factors affecting occupancy (ω) 2
% Canopy
50-100 cm DBH
Saplings
Humus/Litter Thickness
Dead Woods (Natural)
Ahaetulla prasina 100 28.81 28.81 33.61 33.61 33.61
Bronchocela cristatella
40 43.09 31.44 38.17 46.05 39.88
Cyrtodactylus philippinicus
40 58.98 27.77 45.88 60.84 46.15
Draco spilopterus 60 65.97 29.36 32.19 47.28 45.09
Eutropis multicarinata
100 28.81 28.81 33.61 33.61 33.61
Gekko gecko 40 35.82 35.73 39.19 45.83 45.73
Gonocephalus sophiae
80 57.71 29.88 19.89 32.67 32.67
Hemidactylus frenatus
40 61.99 33.82 50.22 41.77 41.69
Pinoyscincus jagori 100 29.08 29.08 33.95 33.95 33.95
Trimeresurus flavomaculatus
100 27.69 27.69 32.28 32.28 32.28
Ahaetulla prasina 100 28.81 28.81 33.61 33.61 33.61 1 Occupancy indicates the proportion of area occupied (PAO) by the species in the site. 2 Akaike's Information Criterion (AIC) cummulative weights of five environmental covariates indicating level of support for each model.

ECOLOGICAL ASSESSMENT IN THE B+WISER SITES | 61
Bago Watershed, MKNP and NNNP.
Plants (Trees) Key Findings (Table 51):
The occupancy (Ψ) models of selected flora species in Bago Watershed showed that most
tree species selected have occupancy of above 50%. This scenario suggests that wider
landscape is needed for these key species. Most of the selected species with higher
occupancy are part of the Dipterocarpaceae group and tree species that thrives from lower
to upper montane forests. Bischofia javanica has the lowest area occupied (21%) together
with Shorea polysperma (28%).
Table 51. Occupancy models of selected trees in Bago Watershed, MKNP and NNNP.
1 Occupancy indicates the proportion of area occupied (PAO) by the species in the site. 2 Akaike's Information Criterion (AIC) cummulative weights of five environmental covariates indicating level of support for each model.
Birds
Key Findings (Table 52):
The occupancy (Ψ) models of selected bird species in BRWFR showed that Dicrurus
balicassius, Culicicapa helianthea, Rhipidura cyaniceps, and Stachyris nigrorum,
Phapitreron leucotis nigrorum and Penelopides panini both Island endemic species and
sub-species have occupancy value of 50% and greater than 50%, whilst the species
Phapitreron amethystina maculipectus, Coracina ostenta, Ducula poliocephala and
Macropygia tenuirostris tenuirostris having less than 50% naïve occupancy and
Tanygnathus lucionensis salvadorii have the lowest naïve occupancy.
The results of occupancy models further showed that the selected species have significant
response to the environmental variables used. Penelopides panini, Coracina ostenta,
Phapitreron leucotis nigrorum, Rhipidura cyaniceps and Macropygia tenuirostris
tenuirostris were strongly influenced by presence of rattan. While species Phapitreron
amethystina maculipectus occupancy was influenced by DBH (61%) and ground (82%),
Stachyris nigrorum and Tanygnathus lucionensis salvadorii occupancy are influenced by
DBH (32% and 35%, respectively).
Species Common
Name Occupancy,
Ψ (%) 1
Environmental Factors Influencing Species Occupancy (ω) 2
25-100 DBH % Canopy %
Moss Saplings Palms
Agathis philippinensis Almaciga 21 76.31 32.76 54.19 79.87 35.71
Bischofia javanica Tuai 43 77.54 31.85 40.26 32.7 78.77
Dacrycarpus imbricatus Igem 14 71.42 46.33 47.58 47.08 79.05
Macaranga bicolor Hamindang 7 34.45 37.01 44.2 45.24 62.24
M. tanarius Binunga 14 31.31 42.22 85.94 49.83 31.64
Myristica philippinensis Duguan 14 39.06 42.97 47.24 43.81 33.93
Palaquium luzoniense Nato 36 41.29 64.49 85.04 50.76 45.13
Parashorea malaanonan Bagtikan 21 31.94 80.1 33.68 40.08 69
Shorea contorta White Lauan 43 36.69 44.97 63.43 38.85 41.61
S. negrosensis Red Lauan 50 32.4 31.88 32.75 35.9 35.89
S. polysperma Tangile 29 33.03 29.85 52.93 35.42 34.59
Tristianopsis decorticata Malabayabas 7 38.87 38.95 41.55 38.2 66.28

62 | ECOLOGICAL ASSESSMENTS IN THE B+WISER SITES
Table 52. Occupancy models of selected birds in Bago Watershed, MKNP and NNNP.
Species Common
Name Occupancy
(%) 1
Environmental Factors Influencing Species Occupancy (ω) 2
% Canopy
Saplings
Rattan
25-50 cm
DBH
Ground
Phapitreron amethystina maculipectus
Amethyst brown dove
0.3571 41% 36% 31% 61% 82%
Stachyris nigrorum Negros striped-babbler
0.7143 2% 2% 30% 32% 28%
Penelopides panini Visayan hornbill 0.5 44% 86% 63% 51% 75%
Coracina ostenta White-winged cuckoo-shrike
0.2143 43% 77% 85% 78% 33%
Phapitreron leucotis nigrorum
White-eared brown dove
0.7143 28% 28% 36% 33% 40%
Dicrurus balicassius Balicassiao 0.8571 28% 28% 26% 27% 28%
Rhipidura cyaniceps Blue-headed fantail
0.8571 2% 2% 26% 27% 18%
Tanygnathus lucionensis salvadorii
Blue-naped parrot
0.1429 34% 34% 38% 35% 30%
Culicicapa helianthea Citrine canary flycatcher
0.7143 9% 9% 25% 29% 40%
Ducula poliocephala Pink-bellied imperial-pigeon
0.3571 44% 77% 36% 51% 75%
Macropygia tenuirostris tenuirostris
Philippine cuckoo-dove
0.4286 43% 46% 49% 53% 49%
1 Occupancy indicates the proportion of area occupied (PAO) by the species in the site. 2 Akaike's Information Criterion (AIC) cummulative weights of five environmental covariates indicating level of support for each model.
Mammals
Key Findings (Table 53):
The occupancy (Ψ) models of selected mammal species in BRWFR showed that
Common short-nosed fruit bat (Cynopterus brachyotis), Philippine pygmy fruit bat
(Haplonycteris fischeri), Harpy fruit bat (Harpyionycteris whiteheadi), Dagger-toothed
fruit bat (Macroglossus minimus), and Philippine tube-nosed fruit bat (Nyctimene rabori)
have occupancy values of 35.7. This suggests that these species occupy a relatively small
area.
H. whiteheadi (Harpy fruit bat), N. rabori (Philippine tube-nosed fruit bat) and Pteropus
pumilus (Little golden-mantled flying fox) were strongly influenced by fruiting and
flowering trees. All three species are Philippine endemics and with the exception of H.
whiteheadi, the other two are considered as threatened species (IUCN RedList 2014) as
Endangered (E) and Near Threatened (NT), respectively.
Eight (8) out of the 13 species recorded were strongly influenced by the presence of trees
with 25-100cm DBH. These species include: Cynopterus brachyotis, D. chapmani, H.
fischeri, Macroglossus minimus, Myotis rufopictus, Ptenochirus jagori, Rhinolophus
arcuatus and R. virgo. This suggests that these species occupy forested areas with
medium to large trees.
D. chapmani, Miniopterus schreibersii, M. rufopictus, R. virgo, and Rousettus
amplexicaudatus, have low occupancy at 7%. The species were encountered only once

ECOLOGICAL ASSESSMENT IN THE B+WISER SITES | 63
during the course of the survey. Hence, the very low species detection rate and probably
explains why they also showed very low occupancy.
As expected, frugivorous species of bats such as Pteopus pumilus, Nyctimene rabori and
H. whiteheadi are associated with fruiting and flowering trees as evidenced by the higher
values of environmental factors affecting occupancy.
Known to be a forest specialist, the endemic P. jagori is associated to trees with 25-100
cm DBH that validates the specie’s preference to forested areas over that of open and
cultivated habitats.
Table 53. Occupancy models of selected bats in Bago Watershed, MKNP and NNNP.
Scientific Name Common Name Occupancy
(%) 1
Environmental Factors Influencing Species Occupancy (ω) 2
FRTrees Canopy Sapling %
Herbs 25-100
cm DBH
Cynopterus brachyotis
Common Short-nosed Fruit Bat
35.71 38.61 35.95 30.72 32.21 50.49
Dobsonia chapmani Philippine naked-backed fruit bat
7.14 39.88 55.57 34.31 32.90 56.35
Haplonycteris fischeri
Philippine Pygmy Fruit Bat
35.71 37.95 35.33 30.11 31.48 49.47
Harpyionycteris whiteheadi
Lesser Long-tongued Fruit Bat
35.71 62.84 31.93 36.61 54.20 56.47
Macroglossus minimus
Lesser Long-tongued Fruit Bat
35.71 40.21 36.74 31.56 31.98 50.31
Miniopterus schreibersii
Common bent-wing bat
7.14 34.00 52.02 61.09 46.56 37.86
Myotis rufopictus Orange fingered Myotis
7.14 39.88 55.57 34.31 32.90 56.35
Nyctimene rabori Philippine tube-nosed fruit bat
35.71 58.85 40.69 47.20 43.79 38.30
Ptenochirus jagori Greater Musky Fruit Bat
28.57 35.48 36.49 34.99 29.40 56.21
Pteropus pumilus Little golden-mantled flying fox
14.29 51.14 45.71 50.26 47.44 45.03
Rhinolophus arcuatus
Arcuate Horseshoe Bat
28.57 43.21 35.95 32.06 41.34 47.87
Rhinolophus virgo Yellow-faced horseshoe bat
7.14 39.88 55.57 34.31 32.90 56.35
Rousettus amplexicaudatus
Little golden-mantled flying fox
7.14 34.00 52.02 61.09 46.56 37.86
1 Occupancy indicates the proportion of area occupied (PAO) by the species in the site. 2 Akaike's Information Criterion (AIC) cummulative weights of five environmental covariates indicating level of support for each model.
MKNRP
Plants (Trees) Key Findings (Table 54):
Kalingag (Cinnamomum mercadoi) has the highest occupancy (65%) suggesting it is
common in the park. Trees with 50-100cm dbh appear to influence its occupancy.
Dacrycarpus cumingii has the lowest occupancy that suggests low species density
because of low encounter rates with high association to litter thickness.
Occupancy of tree species such as C. inophyllum, A. rhomboidea and A. philippinensis
are influenced by canopy height by having the highest weight scores. This suggests that
conservation intervention on trees should consider canopy height.

64 | ECOLOGICAL ASSESSMENTS IN THE B+WISER SITES
Table 54. Occupancy models of selected trees in MKRNP.
Scientific Name Common Name Occupancy
(%) 1
Environmental Factors Influencng Species Occupancy (ω) 2
Altitude Litter
Thickness Under-storey
Canopy Height
50-100 cm dbh
Shorea negrosensis
Red Lauan 10% 39% 29% 63% 32% 72%
Agathis philippinensis
Almaciga 13% 48% 49% 74% 40% 34%
Calophyllum inophyllum
Bitaog 26% 94% 48% 57% 97% 53%
Cinnamomum mercadoi
Kalingag 65% 21% 0% 0% 0% 79%
Dacrycarpus cumingii
Igem 3% 73% 93% 36% 56% 54%
Afzelia rhomboidea Tindalo 26% 98% 38% 52% 98% 84%
Shorea almon Almon 32% 54% 54% 44% 66% 43%
Alseodaphne philippinensis
Boga 10% 87% 40% 75% 96% 48%
Palaquium tenuipetiolatum
Maniknik 48% 69% 95% 44% 36% 59%
1 Occupancy indicates the proportion of area occupied (PAO) by the species in the site. 2 Akaike's Information Criterion (AIC) cummulative weights of five environmental covariates indicating level of support for each model.
Birds
Key Findings (Table 55):
Rhipidura nigrocinnamomea, Hypocryptadius cinnamomeus, Loriculus philippensis,
Phapitreron leucotis, Aethopyga primigenius, and Ptilinopus occipitalis are abundant and
common in the park, occupying greater than 50% of the area surveyed. This suggests that
these species are susceptible to landscape-wide change.
Phapitreron amethystinus, Basilornis mirandus, Prioniturus discurus, Centropus
melanops, Rhipidura supercliaris, Lophozosterops goodfellowi, Prioniturus montanus,
Irena cyanogastra, Hypothymis helenae, Penelopides panini, Coracina mindanensis and
Rhabdotorrhinus leucocephalus have low occupancy. These species do not require large
areas but they need specific habitat parameters such as medium to large trees (25-50
dbh), altitude, understorey, rattan and grass.
Table 55. Occupancy models of selected birds in MKRNP.
Scientific Name Common Name Occupancy
(%) 1
Environmental Factors Influencing Species Occupancy (ω) 2
Altitude DBH 25-50
cm Rattan
Under-storey
Grass
Phapitreron amethystinus Amethyst brown dove
19% 32% 38% 31% 27% 26%
Basilornis mirandus Apo myna 26% 53% 45% 37% 36% 55%
Rhipidura nigrocinnamomea
Black and cinnamon fantail
81% 0% 10% 3% 0% 1%
Corasina mindanensis Black-bibbed Cuckoo Shrike
10% 96% 86% 25% 41% 74%
Prioniturus discurus Blue-crowned Racquet-tail
26% 29% 40% 32% 30% 26%

ECOLOGICAL ASSESSMENT IN THE B+WISER SITES | 65
Scientific Name Common Name Occupancy
(%) 1
Environmental Factors Influencing Species Occupancy (ω) 2
Altitude DBH 25-50
cm Rattan
Under-storey
Grass
Centropus melanops Black-masked coucal
26% 39% 46% 68% 48% 71%
Rhipidura superciliaris Blue fantail 16% 51% 66% 52% 65% 32%
Lophozosterops goodfellowi
Black-masked White-eye
13% 47% 70% 49% 42% 44%
Hypocryptadius cinnamomeus
Cinnamon ibon 53% 0% 51% 72% 44% 36%
Loriculus philippensis Colasisi 58% 57% 38% 43% 60% 73%
Aethopyga primigenius Grey-hooded sunbird
77% 6% 105% 85% 6% 175%
Prioniturus montanus Mountain Racquet-tail
35% 38% 30% 33% 35% 83%
Irena cyanogastra Philippine fairy bluebird
32% 36% 50% 41% 31% 29%
Hypothymis helenae Short crested monarch
26% 32% 34% 35% 44% 41%
Penelopides panini panini
Mindanao hornbill
45% 57% 70% 76% 46% 32%
Phapitreron leucotis White-eared Brown Dove
66% 0% 47% 11% 0% 17%
Rhabdotorrhinus leucocephalus
Writhed hornbill 10% 69% 40% 73% 72% 78%
Ptilinopus occipitalis Yellow-breasted Fruit Dove
68% 74% 41% 51% 43% 49%
1 Occupancy indicates the proportion of area occupied (PAO) by the species in the site. 2 Akaike's Information Criterion (AIC) cummulative weights of five environmental covariates indicating level of support for each model.
Mammals Key Findings (Table 56):
Macroglossus minimus, Cynopterus brachyotis, Haplonycteris fischeri, and Megaerops
wetmorei have high occupancy with high species density. These species were the most
common in the project site. Ptenochirus jagori, Rhinolopus inops, Pipistrellus cf
javanicus, and Ptenochirus jagori have lower occupancy and low species density.
Harpyionycteris whiteheadi, Kerivoula hardwicki, Dyacopterus rickartii and Eonycteris
spelea have occupancy less than 0.15. These species have low detection rates and are
uncommon in the site such as D. rickartii, which typically inhabits caves.
P. jagori, E. spelaea, and H. fischeri, as expected, are associated to fruiting and flowering
trees which the species’ preferred source of food. P. minor, H. whiteheadi and K.
hardwickii showed association to elevation gradients. Macroglossus minimus and
Megaerops wetmorei are both associated to anthropogenic disturbances. These species
are known to thrive in lowland areas and are commonly observed in plantations.
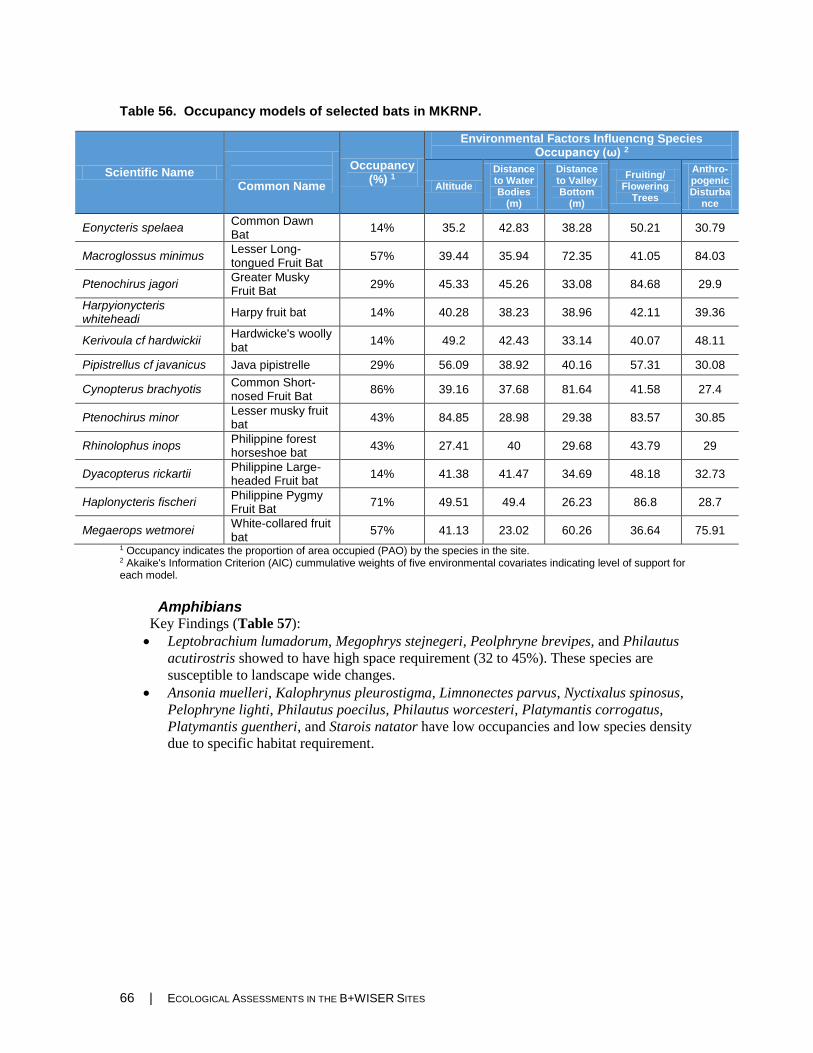
66 | ECOLOGICAL ASSESSMENTS IN THE B+WISER SITES
Table 56. Occupancy models of selected bats in MKRNP.
Scientific Name
Common Name
Occupancy (%) 1
Environmental Factors Influencng Species Occupancy (ω) 2
Altitude
Distance to Water Bodies
(m)
Distance to Valley Bottom
(m)
Fruiting/ Flowering
Trees
Anthro-pogenic Disturba
nce
Eonycteris spelaea Common Dawn Bat
14% 35.2 42.83 38.28 50.21 30.79
Macroglossus minimus Lesser Long-tongued Fruit Bat
57% 39.44 35.94 72.35 41.05 84.03
Ptenochirus jagori Greater Musky Fruit Bat
29% 45.33 45.26 33.08 84.68 29.9
Harpyionycteris whiteheadi
Harpy fruit bat 14% 40.28 38.23 38.96 42.11 39.36
Kerivoula cf hardwickii Hardwicke's woolly bat
14% 49.2 42.43 33.14 40.07 48.11
Pipistrellus cf javanicus Java pipistrelle 29% 56.09 38.92 40.16 57.31 30.08
Cynopterus brachyotis Common Short-nosed Fruit Bat
86% 39.16 37.68 81.64 41.58 27.4
Ptenochirus minor Lesser musky fruit bat
43% 84.85 28.98 29.38 83.57 30.85
Rhinolophus inops Philippine forest horseshoe bat
43% 27.41 40 29.68 43.79 29
Dyacopterus rickartii Philippine Large-headed Fruit bat
14% 41.38 41.47 34.69 48.18 32.73
Haplonycteris fischeri Philippine Pygmy Fruit Bat
71% 49.51 49.4 26.23 86.8 28.7
Megaerops wetmorei White-collared fruit bat
57% 41.13 23.02 60.26 36.64 75.91
1 Occupancy indicates the proportion of area occupied (PAO) by the species in the site. 2 Akaike's Information Criterion (AIC) cummulative weights of five environmental covariates indicating level of support for each model.
Amphibians Key Findings (Table 57):
Leptobrachium lumadorum, Megophrys stejnegeri, Peolphryne brevipes, and Philautus
acutirostris showed to have high space requirement (32 to 45%). These species are
susceptible to landscape wide changes.
Ansonia muelleri, Kalophrynus pleurostigma, Limnonectes parvus, Nyctixalus spinosus,
Pelophryne lighti, Philautus poecilus, Philautus worcesteri, Platymantis corrogatus,
Platymantis guentheri, and Starois natator have low occupancies and low species density
due to specific habitat requirement.

ECOLOGICAL ASSESSMENT IN THE B+WISER SITES | 67
Table 57. Occupancy models of selected amphibians in MKRNP.
Species Common Name Occupancy
(%) 1
Environmental Factors Influencng Species Occupancy (ω) 2
Distance to Water Bodies
(m)
Canopy Saplings Rattan 50-100 cm dbh
Ansonia muelleri
Mueller’s Toad 16% 40.49 68.68 83.23 42.91 73.96
Kalophrynus pleurostigma
Black-spotted sticky frog
16% 55.75 74.90 28.47 43.93 84.51
Leptobrachium lumadorum
42% 49.78 48.60 61.00 40.74 51.50
Limnonectes magnus
Giant Philippine frog
10% 72.92 82.07 60.35 80.89 49.71
Limnonectes parvus
Philippine small-disked frog
13% 33.86 77.12 75.31 65.87 36.35
Megophrys stejnegeri
Southeast Asian horned toad
32% 55.94 28.68 18.18 86.04 75.69
Nyctixalus spinosus
Spiny tree frog 12% 40.60 43.37 43.91 49.22 48.06
Pelophryne brevipes
45% 99.99 99.95 25.77 29.76 29.73
Pelophryne lighti
19% 79.35 27.63 69.37 43.34 46.09
Philautus acutirostris
Philippine bubble-nest frog
68% 87.76 34.75 90.11 90.16 88.98
Philautus poecilus
Mottled tree frog 13% 34.10 54.33 54.40 35.01 28.59
Philautus worcesteri
Smooth-skinned tree frog
13% 34.11 54.34 54.40 35.01 28.59
Platymantis corrogatus
Masked wrinkled ground frog
19% 18.04 77.51 86.33 86.45 31.39
Platymantis guentheri
Gunether’s ground frog
19% 52.01 74.55 38.28 40.95 72.39
Starois natator Black-spotted rock frog
23% 48.09 44.94 42.09 52.44 36.67
1 Occupancy indicates the proportion of area occupied (PAO) by the species in the site. 2 Akaike's Information Criterion (AIC) cummulative weights of five environmental covariates indicating level of support for each model.
Reptiles Key Findings (Table 58):
Sphenomorphus coxi, S. diwata and T. flavomaculatus have the highest occupancy among
selected reptile species. This suggests that species are more susceptible to landscape
changes.
Cyclocorus lineatus, G. sophiae, T. davaoensis and V. salvator are species with low
occupancies. These species do not require large areas but they need specific habitat
parameters such as medium to large trees (50-100 dbh), dead woods and canopy.

68 | ECOLOGICAL ASSESSMENTS IN THE B+WISER SITES
Table 58. Occupancy models of selected reptiles in MKRNP.
Species Common
Name Occupancy
(%) 1
Environmental Factors Influencng Species Occupancy (ω) 2
Canopy 50-100
cm dbh
Saplings Humus Natural
Deadwood
Brachymeles gracilis Short-legged skink
3% 50.96 34.56 46.31 37.52 46.52
Cyclocorus lineatus Northern Triangle-spotted snake
3% 33.95 40.49 56.61 52.66 59.11
Gonocephalus sophiae
Negros forest dragon
3% 37.94 64.51 59.64 44.24 40.46
MatIcora intestinalis Banded Malaysian coral snake
6% 44.16 88.34 53.85 31.28 41.54
Oxyrhabdium modestum
Philippine shrub snake
6% 38.58 76.52 53.84 35.57 39.14
Rhabdophis auriculata
White-lined water snake
4% 86.97 34.42 58.61 30.82 64.17
Sphenomorphus coxi Cox’s sphenomorphus
10% 93.53 51.37 59.29 53.03 39.23
Sphenomorphus diwata
Diwata sphenomorphus
10% 32.36 50.20 33.61 78.10 60.80
Trimeresurus flavomaculatus
Philippine pit viper
10% 56.22 43.54 42.59 68.87 52.79
Tropidophorus davaoensis
Davao waterside skink
3% 40.69 67.00 45.94 33.72 42.01
Varanus salvator Common Water monitor
3% 40.69 67.00 45.94 33.72 42.01
1 Occupancy indicates the proportion of area occupied (PAO) by the species in the site. 2 Akaike's Information Criterion (AIC) cummulative weights of five environmental covariates indicating level of support for each model.
MANP
Plants (Trees) Key Findings (Table 59):
Kalingag (Cinnamomum mercadoi) has the highest occupancy (65%) suggesting it is
common in the park. Trees with 50-100cm dbh appear to influence its occupancy.
Dacrycarpus cumingii has the lowest occupancy that suggests low species density
because of low encounter rates with high association to litter thickness.
Occupancy of tree species such as Bitaog (C. inophyllum), Tindalo (A. rhomboidea) and
Almaciga (A. philippinensis) are influenced by canopy height by having the highest
weight scores. This suggests that conservation intervention on trees should consider
canopy height.

ECOLOGICAL ASSESSMENT IN THE B+WISER SITES | 69
Table 59. Occupancy models of selected trees in MANP.
Scientific Name Common
Name Occupancy
(%) 1
Environmental Factors Influencng Species Occupancy (ω) 2
Altitude Litter
Thickness Under-storey
Canopy Height
50-100 cm dbh
Shorea negrosensis Red Lauan 10% 39% 29% 63% 32% 72%
Agathis philippinensis Almaciga 13% 48% 49% 74% 40% 34%
Calophyllum inophyllum Bitaog 26% 94% 48% 57% 97% 53%
Cinnamomum mercadoi Kalingag 65% 21% 0% 0% 0% 79%
Dacrycarpus cumingii Igem 3% 73% 93% 36% 56% 54%
Afzelia rhomboidea Tindalo 26% 98% 38% 52% 98% 84%
Shorea almon Almon 32% 54% 54% 44% 66% 43%
Alseodaphne philippinensis
Boga 10% 87% 40% 75% 96% 48%
Palaquium tenuipetiolatum
Maniknik 48% 69% 95% 44% 36% 59%
1 Occupancy indicates the proportion of area occupied (PAO) by the species in the site. 2 Akaike's Information Criterion (AIC) cummulative weights of five environmental covariates indicating level of support for each model.
Birds Key Findings (Table 60):
R. nigrocinnamomea, H. cinnamomeus, L. philippensis, P. leucotis, Aet primigenius, and
Ptilinopus occipitalis are abundant and common in the park, occupying greater than 50%
of the area surveyed. This suggests that these species are susceptible to landscape-wide
change.
P. amethystinus, B. mirandus, P. discurus, C. melanops, R. supercliaris, L. goodfellowi,
P. montanus, I. cyanogastra, H. helenae, P. panini, C. mindanensis and R. leucocephalus
have low occupancy. These species do not require large areas but they need specific
habitat parameters such as medium to large trees (25-50 dbh), altitude, understorey, rattan
and grass.
Table 60. Occupancy models of selected birds in MANP.
Species Common Name Occupancy
(%) 1
Environmental Factors Influencing Species Occupancy (ω) 2
Altitude DBH 25-50 cm
Rattan Understorey Grass
Phapitreron amethystinus
Amethyst brown dove
19% 32% 38% 31% 27% 26%
Basilornis mirandus Apo myna 26% 53% 45% 37% 36% 55%
Rhipidura nigrocinnamomea
Black and cinnamon fantail
81% 0% 10% 3% 0% 1%
Corasina mindanensis Black-bibbed Cuckoo Shrike
10% 96% 86% 25% 41% 74%
Prioniturus discurus Blue-crowned Racquet-tail
26% 29% 40% 32% 30% 26%
Centropus melanops Black-masked coucal
26% 39% 46% 68% 48% 71%
Rhipidura superciliaris Blue fantail 16% 51% 66% 52% 65% 32%
Lophozosterops goodfellowi
Black-masked White-eye
13% 47% 70% 49% 42% 44%

70 | ECOLOGICAL ASSESSMENTS IN THE B+WISER SITES
Species Common Name Occupancy
(%) 1
Environmental Factors Influencing Species Occupancy (ω) 2
Altitude DBH 25-50 cm
Rattan Understorey Grass
Hypocryptadius cinnamomeus
Cinnamon ibon 53% 0% 51% 72% 44% 36%
Loriculus philippensis Colasisi 58% 57% 38% 43% 60% 73%
Aethopyga primigenius Grey-hooded sunbird
77% 6% 105% 85% 6% 175%
Prioniturus montanus Mountain Racquet-tail
35% 38% 30% 33% 35% 83%
Irena cyanogastra Philippine fairy bluebird
32% 36% 50% 41% 31% 29%
Hypothymis helenae Short crested monarch
26% 32% 34% 35% 44% 41%
Penelopides panini panini
Mindanao hornbill 45% 57% 70% 76% 46% 32%
Phapitreron leucotis White-eared Brown Dove
66% 0% 47% 11% 0% 17%
Rhabdotorrhinus leucocephalus
Writhed hornbill 10% 69% 40% 73% 72% 78%
Ptilinopus occipitalis Yellow-breasted Fruit Dove
68% 74% 41% 51% 43% 49%
1 Occupancy indicates the proportion of area occupied (PAO) by the species in the site. 2 Akaike's Information Criterion (AIC) cummulative weights of five environmental covariates indicating level of support for each model.
Mammals
Key Findings (Table 61):
M. minimus, C. brachyotis, H. fischeri, and M. wetmorei have high occupancy with high
species density. These species were the most common in the project site. P. jagori, R.
inops, P. cf javanicus, and P. jagori have lower occupancy and low species density.
H. whiteheadi, K. hardwicki, D. rickartii and E. spelea have occupancy less than 0.15.
These species have low detection rates and are uncommon in the site such as D. rickartii,
which typically inhabits caves.
P. jagori, E. spelaea, and H. fischeri, as expected, are associated to fruiting and flowering
trees which the species’ preferred source of food. P. minor, H. whiteheadi and K.
hardwickii showed association to elevation gradients. Macroglossus minimus and
Megaerops wetmorei are both associated to anthropogenic disturbances. These species
are known to thrive in lowland areas and are commonly observed in plantations.
Table 61. Occupancy models of selected bats in MANP.
Scientific Name Common
Name
Occupancy (%) 1
Environmental Factors Influencng Species Occupancy (ω) 2
Altitude
Distance to Water Bodies
(m)
Distance to Valley Bottom
(m)
Fruiting/ Flowering
Trees
Anthro-pogenic
Disturbance
Eonycteris spelaea Common Dawn Bat
14% 35.2 42.83 38.28 50.21 30.79
Macroglossus minimus
Lesser Long-tongued Fruit Bat
57% 39.44 35.94 72.35 41.05 84.03
Ptenochirus jagori Greater Musky Fruit Bat
29% 45.33 45.26 33.08 84.68 29.9

ECOLOGICAL ASSESSMENT IN THE B+WISER SITES | 71
Scientific Name Common
Name
Occupancy (%) 1
Environmental Factors Influencng Species Occupancy (ω) 2
Altitude
Distance to Water Bodies
(m)
Distance to Valley Bottom
(m)
Fruiting/ Flowering
Trees
Anthro-pogenic
Disturbance
Harpyionycteris whiteheadi
Harpy fruit bat 14% 40.28 38.23 38.96 42.11 39.36
Kerivoula cf hardwickii
Hardwicke's woolly bat
14% 49.2 42.43 33.14 40.07 48.11
Pipistrellus cf javanicus
Java pipistrelle 29% 56.09 38.92 40.16 57.31 30.08
Cynopterus brachyotis
Common Short-nosed Fruit Bat
86% 39.16 37.68 81.64 41.58 27.4
Ptenochirus minor Lesser musky fruit bat
43% 84.85 28.98 29.38 83.57 30.85
Rhinolophus inops Philippine forest horseshoe bat
43% 27.41 40 29.68 43.79 29
Dyacopterus rickartii Philippine Large-headed Fruit bat
14% 41.38 41.47 34.69 48.18 32.73
Haplonycteris fischeri Philippine Pygmy Fruit Bat
71% 49.51 49.4 26.23 86.8 28.7
Megaerops wetmorei White-collared fruit bat
57% 41.13 23.02 60.26 36.64 75.91
1 Occupancy indicates the proportion of area occupied (PAO) by the species in the site. 2 Akaike's Information Criterion (AIC) cummulative weights of five environmental covariates indicating level of support for each model.
Amphibians Key Findings (Table 62):
L. lumadorum, M. stejnegeri, P. brevipes, and P. acutirostris showed to have high space
requirement (32 to 45%). These species are susceptible to landscape wide changes.
muelleri, K. pleurostigma, L. parvus, N. spinosus, P. lighti, P. poecilus, P. worcesteri, P.
corrogatus, P. guentheri, and S. natator have low occupancies and low species density
due to specific habitat requirement.
Table 62. Occupancy models of selected amphibians in MKRNP.
Species Common Name Occupancy
(%) 1
Environmental Factors Influencng Species Occupancy (ω) 2
Distance to Water Bodies
(m)
Canopy Saplings Rattan 50-100 cm dbh
Ansonia muelleri Mueller’s Toad 16% 40.49 68.68 83.23 42.91 73.96
Kalophrynus pleurostigma
Black-spotted sticky frog
16% 55.75 74.90 28.47 43.93 84.51
Leptobrachium lumadorum
42% 49.78 48.60 61.00 40.74 51.50
Limnonectes magnus
Giant Philippine frog
10% 72.92 82.07 60.35 80.89 49.71
Limnonectes parvus
Philippine small-disked frog
13% 33.86 77.12 75.31 65.87 36.35
Megophrys Southeast Asian 32% 55.94 28.68 18.18 86.04 75.69

72 | ECOLOGICAL ASSESSMENTS IN THE B+WISER SITES
Species Common Name Occupancy
(%) 1
Environmental Factors Influencng Species Occupancy (ω) 2
Distance to Water Bodies
(m)
Canopy Saplings Rattan 50-100 cm dbh
stejnegeri horned toad
Nyctixalus spinosus
Spiny tree frog 12% 40.60 43.37 43.91 49.22 48.06
Pelophryne brevipes
45% 99.99 99.95 25.77 29.76 29.73
Pelophryne lighti 19% 79.35 27.63 69.37 43.34 46.09
Philautus acutirostris
Philippine bubble-nest frog
68% 87.76 34.75 90.11 90.16 88.98
Philautus poecillus
Mottled tree frog 13% 34.10 54.33 54.40 35.01 28.59
Philautus worcesteri
Smooth-skinned tree frog
13% 34.11 54.34 54.40 35.01 28.59
Platymantis corrogatus
Masked wrinkled ground frog
19% 18.04 77.51 86.33 86.45 31.39
Platymantis guentheri
Gunether’s ground frog
19% 52.01 74.55 38.28 40.95 72.39
Starois natator Black-spotted rock frog
23% 48.09 44.94 42.09 52.44 36.67
1 Occupancy indicates the proportion of area occupied (PAO) by the species in the site. 2 Akaike's Information Criterion (AIC) cummulative weights of five environmental covariates indicating level of support for each model.
Reptiles
Key Findings (Table 63):
Sphenomorphus coxi, S. diwata and T. flavomaculatus have the highest occupancy among
selected reptile species. This suggests that species are more susceptible to landscape
changes.
Cyclocorus lineatus, G. sophiae, T. davaoensis and V. salvator are species with low
occupancies. These species do not require large areas but they need specific habitat
parameters such as medium to large trees (50-100 dbh), dead woods and canopy.
Table 63. Occupancy models of selected reptiles in MANP.
Species Common
Name Occupancy (%) 1
Environmental Factors Influencng Species Occupancy (ω) 2
Canopy 50-100 cm dbh
Saplings Humus Natural
Deadwood
Brachymeles gracilis Short-legged skink
3% 50.96 34.56 46.31 37.52 46.52
Cyclocorus lineatus
Northern Triangle-spotted snake
3% 33.95 40.49 56.61 52.66 59.11
Gonocephalus sophiae Negros forest dragon
3% 37.94 64.51 59.64 44.24 40.46
MatIcora intestinalis Banded Malaysian coral snake
6% 44.16 88.34 53.85 31.28 41.54
Oxyrhabdium modestum
Philippine shrub snake
6% 38.58 76.52 53.84 35.57 39.14

ECOLOGICAL ASSESSMENT IN THE B+WISER SITES | 73
Species Common
Name Occupancy (%) 1
Environmental Factors Influencng Species Occupancy (ω) 2
Canopy 50-100 cm dbh
Saplings Humus Natural
Deadwood
Rhabdophis auriculata White-lined water snake
4% 86.97 34.42 58.61 30.82 64.17
Sphenomorphus coxi Cox’s sphenomorphus
10% 93.53 51.37 59.29 53.03 39.23
Sphenomorphus diwata
Diwata sphenomorphus
10% 32.36 50.20 33.61 78.10 60.80
Trimeresurus flavomaculatus
Philippine pit viper
10% 56.22 43.54 42.59 68.87 52.79
Tropidophorus davaoensis
Davao waterside skink
3% 40.69 67.00 45.94 33.72 42.01
Varanus salvator Common Water monitor
3% 40.69 67.00 45.94 33.72 42.01
1 Occupancy indicates the proportion of area occupied (PAO) by the species in the site. 2 Akaike's Information Criterion (AIC) cummulative weights of five environmental covariates indicating level of support for each model.
Population Density Estimates for Birds in NSMNP
Key Findings (Table 64):
The population density estimates generated for the 23 selected species of birds is the first
attempt to provide population baseline for these species.
Species having high densities in second growth forests are Yellow-breasted Fruit-dove
(Ptilinopus occipitalis) and the Near Threatened Philippine Fairy-bluebird (Irena
cyanogaster). To secure these species, conservation intervention should be directed in
this habitat, the second growth forest.
Table 64. Population density estimates (number per hectare) of 23 species of birds across
different habitat types.
Species Density Estimates±CV (number/ha)
CVT ESG ASG OGF
Amethyst Brown-Dove 0±0 1.97±22.60 1.96±30.21 3.48±42.73
Balicassiao 1.76±50.00 0.68±55.50 0.50±79.69 0.25±97.47
Bar-bellied Cuckoo-Shrike 5.30±100.00 3.77±47.03 1.58±49.07 0.75±97.47
Black-and-White Triller 0±0* 1.23±38.45 1.44±36.08 0.50±97.47
Blackish Cuckoo-Shrike 0.21±100 1.96±41.05 3.32±36.21 1.51±65.19
Black-naped Monarch 0±0* 4.45±47.81 1.97±55.89 5.40±78.02
Blue-headed Fantail 0±0* 11.06±75.52 5.09±39.27 2.02±65.19
Buzzing Flowerpecker 0±0* 6.47±49.81 4.35±52.05 11.62±53.21
Elegant Tit 0±0* 2.98±39.62 2.10±37.08 4.92±44.59
Hodgson's Hawk-Cuckoo 0±0* 0.85±34.57 0.81±36.97 0.37±97.47
Olive-backed Flowerpecker 0±0 4.85±46.40 3.21±99.07 2.52±97.47
Orange-bellied Flowerpecker 0±0* 5.61±35.34 6.47±64.49 6.06±54.20

74 | ECOLOGICAL ASSESSMENTS IN THE B+WISER SITES
Species Density Estimates±CV (number/ha)
CVT ESG ASG OGF
Philippine Bulbul 3.83±57.67 24.60±41.05 23.94±53.40 4.21±31.39
Philippine Coucal 1.20±50.92 3.13±42.35 1.28±57.77 1.01±97.47
Philippine Fairy-Bluebird 0±0* 3.85±30.05 4.35±30.12 3.94±39.54
Philippine Tailorbird 12.06±69.66 13.75±23.56 10.71±21.18 7.40±22.39
Purple-throated Sunbird 0±0 7.27±46.91 0.57±99.07 0±0
White-browed Shama 3.53±100.00 5.12±40.99 2.12±36.89 0±0
White-eared Brown-Dove 0±0* 3.46±17.72 1.56±27.72 3.18±46.92
White-lored Oriole 0±0* 1.27±43.51 0.93±38.51 0.60±117.38
Yellow-bellied Whistler 0±0* 1.64±36.15 0.87±54.20 4.54±81.14
Yellow-breasted Fruit-Dove 0±0* 2.15±46.89 9.39±39.23 3.03±82.92
Yellow-wattled Bulbul 0±0 0.96±69.42 1.20±65.98 4.54 ±69.52
Note: Coefficient of variation (CV) or relative standard error (SE) is expressed in percentage that indicates the precision of the estimates. A value of zero indicates that there was no observation of the species in that particular habitat.
3.4. HIGH CONSERVATION VALUE AREAS USING CONGRUENCE OF THE
VARIOUS SPECIES DISTRIBUTION MODELS
This section presents the congruence analysis or finding geographic overlaps of the different
species distribution models across the landscape (See Section 4.2).
NSMNP Key Findings:
Based on the combined species distribution model results, areas with high congruence of
species are located in lowlands particularly in Divilacan. Increasing color shading the
overlapping species richness on a 1-km2 pixel.
Coverage of HCVAs for birds is the largest whilst the non-volant (non-flying) vertebrates
showed smaller coverage.
Species tend to pack in lowland forests around the Palanan point and west of San
Ildefonso point.

ECOLOGICAL ASSESSMENT IN THE B+WISER SITES | 75
Figure 6. Species distribution of selected tree species in NSMNP.
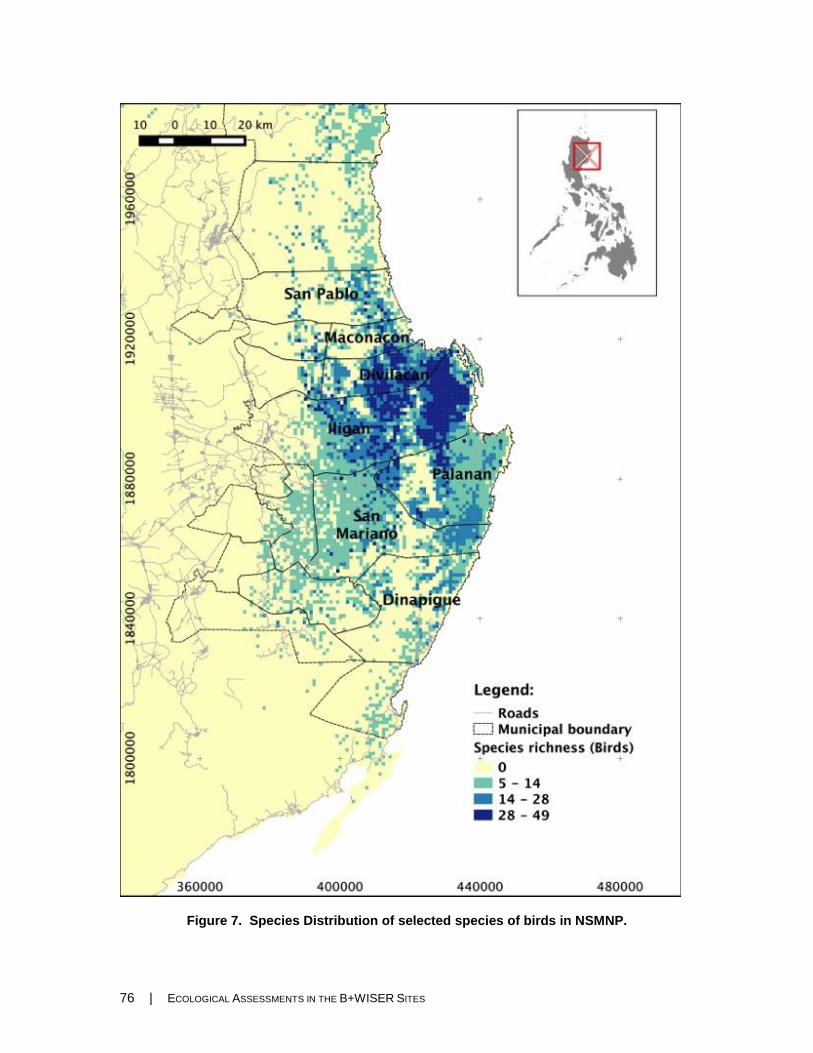
76 | ECOLOGICAL ASSESSMENTS IN THE B+WISER SITES
Figure 7. Species Distribution of selected species of birds in NSMNP.

ECOLOGICAL ASSESSMENT IN THE B+WISER SITES | 77
Figure 8. Species distribution of selected bat species in NSMNP.

78 | ECOLOGICAL ASSESSMENTS IN THE B+WISER SITES
Figure 9. Species distribution model of selected amphibians and reptile species in NSMNP.

ECOLOGICAL ASSESSMENT IN THE B+WISER SITES | 79
KWFR and UMRBPL
Key Findings:
The prediction of the bird species distribution model using data from the proxy sites was
projected within the boundaries of the Upper Marikina River Basin Protected Landscape
(UMRBPL) and Kaliwa Watershed Forest Reserve (KWFR) although most of these are
outside the current boundaries.
Large extent of predicted suitable habitats of four (4) bird species is high in the
northwestern portion of UMRBPL and KWFR.
Figure 10. Species distribution model of selected bird species in Kaliwa-UMRBPL.

80 | ECOLOGICAL ASSESSMENTS IN THE B+WISER SITES
NLNP Key Findings:
The SDM performed on birds and herpetofauna predicted the northeastern section of
Mindoro as the suitable habitats for these groups of species (Appendix 3 for list of
species).
The high species congruence of both groups were almost similarly located mostly at the
Northern segments of Oriental and Occidental Mindoro.
Low congruence of species occupied the areas at the Southern part of Mindoro.
The amalgamated results of species distribution models suggest that the northern part of
the island has the highest congruence of species (Figure 4).
Figure 11. Species distribution model of selected bird species in NLNP.

ECOLOGICAL ASSESSMENT IN THE B+WISER SITES | 81
Figure 12. Species distribution model of selected species of herps in NLNP.
Bago
Birds Key Findings:
The HCVAs were likewise identified for 31 trigger species of birds in BRWFR.
These 31 key species are Phapitreron amethystine maculipectus, Dicrurus
balicassius, Rhipidura cyaniceps, Tanygnathus sumatranus, T. lucionensis
salvadorii, Culicicapa helianthea, Sarcops calvus, Parus elegans, Aethopyga
shelleyi, Columba vitiensis anthracina, Zosterops montanus, Eumyias panayensis,
Stachyris nigrorum, Ducula poliocephala, Macropygia tenuitris tenuistris, Ixos
philippinus, Centropus viridis, Dendrocopus maculatus, Orthotomus castaneiceps,
Lalage nigra, Ficedula hyperythra nigrorum, Penelopides Panini, Brachypterys
Montana, Dryocopus javensis, Phapitreron leucotis nigrorum, Pachycephala
homeyeri, Coracina ostentata, Ptilinopus occipitalis occipitalis, Zosterops
nigrorum, Pycnonotus goiavier and P. urostictus.
As shown below, high concentrations of the trigger species of birds are predicted to
be located on the northern side of the watershed covering the Municipaitiy of
Salvador Benedicto and Silay City; and on the southern southern part that covers the
Muncipality of Murcia.

82 | ECOLOGICAL ASSESSMENTS IN THE B+WISER SITES
Figure 13. Species distribution model of selected bird species in BRFWR.
Bats Key Findings:
The HCVAs were likewise identified for seven (7) trigger species of bats in BRWFR.
These key species include Cynopterus brachyotis, Haplonycteris fischeri,
Harpyionycteris whiteheadi, Macroglossus minimus, Nyctimene rabori, Ptenochirus
jagori and Rhinolophus arcuatus.
Almost the same pattern for all taxa are projected for the BRWFR site. For bats however,
the major big difference is the intensity and congruence with which the species are
concentrated in areas where they are most likely to be found.
A large portion of the key species of bats tend to clump along the boundaries of Silay
City and Talisay City where the remaining forests are currently situated. Same goes for
the Municipality of Murcia that overlaps with both BRWFR and NNNP where majority
of the key species of mammals are predicted still to be most likely to be found.

ECOLOGICAL ASSESSMENT IN THE B+WISER SITES | 83
Figure 14. Species distribution model of bats in BRFWR.
Herps Key Findings:
The HCVAs were identified for 12 trigger species of herps in Bago Watershed,
MKNP and NNNP. These 12 key species include six (6) amphibians - Platymantis
corrugatus, P. dorsalis, P. guentheri, P. hazelae, Occidozyga laevis, Rhacophorus
pardalis, and six (6) reptile species – Draco spilopterus, Gonocephalus sophiae,
Pinoyscincus jagori, Ahaetulla prasina, Pseudorabdion montanum, Cyclocorus
lineatus and Psammodynastes pulverulentus.
Key species of reptiles and amphibians analysed for SDM were predicted to be
concentrated just a little inside Bago Watershed on the side of Salvador Benedicto
and extends beyond Silay City, Talisay City Municipality of Calatrava and Cadiz
City. Note that this portion of the province overlaps with the NNNP.
The same scenario is predicted on the southwestern flank of the watershed – where
most of the key herpetofaunal species are most likely to be present in the
Municipality of Murcia that overlaps with MKNP.
Sporadic predictions of the key species of reptiles were recorded for Canlaon City,
Municipality of La Castella and La Carlota City.

84 | ECOLOGICAL ASSESSMENTS IN THE B+WISER SITES
Figure 15. Species distribution model of selected species of herps in BRFWR.
Trees
Key Findings:
The HCVA for five (5) key species of trees were identified using Species Distribution
Modelling (SDM) throughout Bago Watershed, MKNP and NNNP. These species
include Bischofia javanica, Palaquium luzoniense, Shorea contorta, S. negrosensis and S.
polysperma.
Key tree species analysed for SDM are mostly concentrated on the northern most side of
the watershed covering the Municipality of Salvador Benedicto. This type of species
distribution pattern also extends toward the Mt. Kanla-on Natural Park, particularly in
Cadiz City and parts of Silay City and Talisay City as well. Note though that this part of
NNNP is beyond the boundaries of the watershed except for a very small portion that
overlaps with Talisay City.
The part of Murcia that overlaps with Bago Watershed on its southwestern flank is
another spot where the five key tree species were also predicted to be present in the area.

ECOLOGICAL ASSESSMENT IN THE B+WISER SITES | 85
Figure 16. Species distribution model of selected tree species in BRFWR.
MKRNP
Birds Key Findings:
There is low congruence of species in high elevation areas while high species congruence
was observed in lowland areas, within the buffer zones and outside the park boundary.
Species distribution models for species of birds: Cinnamon Ibon, Black and Cinnamon
Fantail, Black-bibbed Cuckoo Shrike, Black-faced Coucal, Celestial Monarch, Grey-
hooded Sunbird, Mindanao Hornbill, Mountain Racquet-tail, Philippine Hawk Eagle,
Philippine Fairy Bluebird, and Writhed Horbill based on the logistic output of Maxent.

86 | ECOLOGICAL ASSESSMENTS IN THE B+WISER SITES
Figure 17. Species distribution model of selected species of birds in MKRNP.
Flora Key Findings:
Areas with high congruence of species for trees were located on the northern and
northeastern part of MKRNP, which are lowland areas.
There is poor species congruence in the highland areas of the park and an even lower
congruence on the western part.
Species distribution models for species of birds: Acer laurinum, Shorea contorta,
Cinnamomum mercadoi, Agathis philippinensis, Dacrycarpus imbricatus, Calophyllum
inophyllum, Palaquium tenuipetiolatum, Syzygium nitidum, Mallotus mollisimus, Shorea
negrosensis, and Shorea polysperma based on the logistic output of Maxent. Increasing
color shading represents overlapping number of species richness on a 1-km2 pixel.

ECOLOGICAL ASSESSMENT IN THE B+WISER SITES | 87
Figure 18. Species distribution model of tree species in MKRNP.
MANP
Birds Key Findings:
Dark shadings in the map indicate areas with high species congruence in terms of suitable
habitats. These areas are low elevation forests.
Species congruence is lower at higher elevations.
It can also be noted that species richness for birds is higher in areas outside the protected
area.
Species distribution models for species of birds: Cinnamon Ibon, Black and Cinnamon
Fantail, Black-bibbed Cuckoo Shrike, Black-faced Coucal, Celestial Monarch, Grey-
hooded Sunbird, Mindanao Hornbill, Mountain Racquet-tail, Philippine Hawk Eagle,
Philippine Fairy Bluebird, and Writhed Hornbill based on the logistic output of Maxent.

88 | ECOLOGICAL ASSESSMENTS IN THE B+WISER SITES
Figure 19. Species distribution model of birds in MANP.
Trees Key Findings:
Areas with high congruence of species of trees were located on the upper part and outside
of MANP.
There is low species congruence in the highland areas of the park.
Species distribution models for species of trees: Acer laurinum, Shorea contorta,
Cinnamomum mercadoi, Agathis philippinensis, Dacrycarpus imbricatus, Calophyllum
inophyllum, Palaquium tenuipetiolatum, Syzygium nitidum, Mallotus mollisimus, Shorea
negrosensis, and Shorea polysperma based on the logistic output of Maxent.

ECOLOGICAL ASSESSMENT IN THE B+WISER SITES | 89
Figure 20. Species distribution model of selected trees in MANP.
3.5. LAND USE CHANGES VIA CHANGE DETECTION ANALYSIS USING
REMOTE-SENSED DATA NSMNP
Key Findings:
The total natural forest loss in seven years (2003 to 2010) is 10,256 ha.
The total forest gain through either reforestation or natural regeneration is 5,715 ha.
The annual rate of net change per year based on 2003 to 2010 data is 649 ha./yr.

90 | ECOLOGICAL ASSESSMENTS IN THE B+WISER SITES
Figure 21. Areas within NSMNP with extensive forest change.

ECOLOGICAL ASSESSMENT IN THE B+WISER SITES | 91
KWFR and UMRBPL
Key Findings:
Total area deforested over a span of seven years (2003-2010) was 2,247 ha with
annual deforestation rate of 321 ha/yr.
From among the different municipalities that have jurisdiction over UMRBPL and
KWFR, the municipality of Tanay had the highest net negative change from forest to
non-forest of 2,204 ha (over 7 yrs) and an annual net loss of 315 ha/yr. (Table 14)
The previous trend is quite contrary to the municipality of Gen. Nakar where a
seemingly positive net gain of forests occurred over the period of 2003-2010, having
a rate of 92 ha/yr of positive net forest change.
Figure 22. Forest cover change detection from 2003 to 2010 at KWFR and UMBPLR.

92 | ECOLOGICAL ASSESSMENTS IN THE B+WISER SITES
NLNP
Key Findings:
Forest cover loss reached 3,899 ha (557 ha/yr) from 2003 to 2010
On the same period, proximate watersheds in NLNP had a net negative forestchange of
99 ha/year in Pula watershed, while a net positive forest cover change was happened in
Butas watershed with 202 ha/yr gain.
Naujan had the highest net negative forest change and highest rate of net negative forest
change on annual basis (4,321 ha; 617 ha/yr).
The analysis identified 5 hotspots of forest cover change, these are the following;
1. Puerto Galera, Baco, San Teodoro of Oriental Mindoro and Abra de Ilog
of Occidental Mindoro
2. Lubang Group of Islands
3. Naujan and Pola of Oriental Mindoro
4. Sablayan of Occidental Mindoro
Figure 23. Forest cover change detection from 2003 to 2010 at NLNP.

ECOLOGICAL ASSESSMENT IN THE B+WISER SITES | 93
Bago Watershed, MKNP and NNNP
Key Findings:
In a span of seven years, both forest loss (2,169 ha; 310 ha/yr) and forest gain (1,101 ha;
157 ha/yr) was observed from 2003 to 2010 within Bago Watershed. A total of 8,997 ha
of forests remained comprising 11.5% of the total land area of the watershed.
In terms of forest to non-forest change, Salvador Benedicto (7.1%) had the highest
percent change against total land area followed by Murcia (2.6%). Highest total forest
cover loss was similarly observed in Salvador Benedicto (1,286 ha) followed by Murcia
(933 ha) within the period. The lowest percent change against total land area was
observed in Bago City (0%). Lowest total forest cover loss, with the exception of Bago
City, occurred in San Carlos City (215 ha) and Talisay City (227 ha).
All municipalities exhibited change from non-forest to forest (forest gain) perhaps due to
extensive reforestation efforts. Murcia has the highest percent change against total land
area (5.5%) followed by Salvador Benedicto (1.5%). Calatrava (0.1%) and Bago City
(0.7%) showed the lowest percent change against total land area. Murcia (4,915 ha)
similarly exhibited the highest total forest gain observed within the period, which was
even higher compared to the forest gain observed within BRWFR.
In terms of forests in 2003 remaining as forests in 2010, the most extensive forests
remained in Murcia (7,703 ha; 21.2% of total area) followed by Talisay City (5,160 ha;
25.9% of total area).
Figure 24. Forest cover change detection from 2003 to 2010 at BRWFR (black), NNNP (yellow), and MKNP (pink).

94 | ECOLOGICAL ASSESSMENTS IN THE B+WISER SITES
MKNRP
Key Findings:
There is 4,788 ha (10.1%) forest gain and 1,014 ha (2.1%) forest loss from 2003 to 2010
in MKRNP.
The total natural forest loss either from deforestation or forest degradation is 1,014 ha.
The total forest gain through natural regeneration from 2003 to 2010 is 4,788.
The annual rate of net change per year is 539 ha/yr.
Figure 25. Forest cover change detection from 2003 to 2010 at MKRNP.

ECOLOGICAL ASSESSMENT IN THE B+WISER SITES | 95
MANP
Key Findings:
Forest loss in MANP reached 11,088 ha or 1,1584 ha/year from 2003 to 2010.
Figure 26. Forest cover change detection from 2003 to 2010 at MANP.
3.6 KEY DRIVERS OF DEFORESTATION AND DEGRADATION
NSMNP The following are the threats observed by the team in each municipality during the study:
Ilagan
Hunter trails and
live hunter traps
Pasture land for
Carabaos
Carabao trails
Access trails
Dicaruyan
Irrigation canal
Hunter trail
Old logging trail
Kaingin
Residential areas
Sapinit
Main access roads
Old logging trail
Kaingin
Hunter trails and
live hunter traps
Residential areas

96 | ECOLOGICAL ASSESSMENTS IN THE B+WISER SITES
Figure 27. Photo documentation of threats and key drivers of deforestation
and degradation in NSMNP. (a) Logging roads, (b) Cartmen with their crafts full of illegal logs, (c) rice paddies, (d) snare traps along hunter trails, (e) aerial view of Sapinit showing the proximity of residential and farmlands to forest lands

ECOLOGICAL ASSESSMENT IN THE B+WISER SITES | 97
Kaliwa and UMRBPL
Based on the feasibility study report entitled “Developing Community Carbon Pools for
Reduced Emissions from Deforestation and Forest Degradation, plus Enhancing forest carbon
stocks (REDD+) projects in selected ASEAN countries” (FFI, in draft), the following are the
drivers of deforestation and forest degradation within the UMRBPL-KWFR:
Legal and Illegal logging
Logging companies practiced selective logging system until the 1990’s, wherein
large diameter trees were cut and exported.
Confiscated forest products from nearby municipalities of Gen. Nakar have an
average of 4,000 m3 /month with an estimated value of Php 33,000.
In recent years, there are continuing reports on confiscated forest products retained at
the Community Environment and Natural Resources Office. It only shows that
despite the efforts to lessen or eliminate logging, it continues to happen within the
area.
On the Ipo Watershed proxy site, remnants of logging are very evident in the site.
Sound of the saw used in cutting trees can also be heard. Some logs were also
transported from the mountain through the river.
Kaingin Making/Shifting Cultivation
Non-IP migration forces the IPs (original shifting-cultivators of the land) to move to
the upper portions of the forest; thus, giving options for the IPs to use more advanced
forested areas for kaingin.
Land claimants open up kaingin in untitled lands. They are hoping that in due time,
the said land will be given titles under their names.
On the Ipo Watershed proxy site, there are patches of kaingin within the area.
Charcoal consumption
There are demands for charcoal in urban and per-urban areas adjacent to Gen. Nakar.
However, in the area of Gen Nakar, the charcoal consumption has been reduced by
50% because most people are now using charcoal cooking stoves that require lesser
volume of charcoal than the more traditional ones.
Bago Watershed, MKNP and NNNP
The following are the threats observed by the team during the study:
Bagong Silang, Municipality of Salvador Benedicto
Collection of dead twigs (and trees) for fuel and charcoal making.
Increasing land conversion i.e. forested area converted to agricultural lands and some
other land use forms like resorts for recreational purposes.
Increasing demand for poultry, thereby increasing forest land being converted to
accommodate such economic demand.

98 | ECOLOGICAL ASSESSMENTS IN THE B+WISER SITES
Increasing number of ‘trails’ made towards the interior of the remaining forests
which increases access to forest lands.
Brgy. Mailum, Bago City
Hunting of wild pigs (possibly that of the Critically Endangered (CR) Visayan warty
pig) and Visayan spotted deer (Endangered, IUCN RedList 2014)
Flying foxes are being hunted and poached for source of meat.
MKRNP
The following are threats observed to occur in the area:
Habitat conversion
Lowland forests in the area are now converted into tree plantation, pasture land and
cultivated areas like vegetable garden, corn, coffee plantation, sugarcane plantation,
etc.
Logging
In finding intact primary forest, only sites that are within intact closed canopy forest
with little disturbance could be found. It was intended to include lowland forest
habitats as these are usually areas with high species diversity and most vertebrate
species decrease in richness with higher elevation due to lower temperature, higher
precipitation, and change in vegetation. Fruit bats, for example, have shown a
decrease in species richness and abundance at higher elevation though there is also
an observed increase of endemics at higher elevations. Changes are predicted to be
associated with the reduce abundance of Ficus species at higher elevation, which
fruit bat species rely on (Heaney et al 1989).
Baungon and Libona survey sites were also under logging concession in the past but
selected survey areas are now under closed canopy forest and more than 200m away
from the edge. Although these areas were disturbed but it is difficult to locate
lowland forest in the Mt. Kitanglad Natural Park that have not undergone logging in
the past or even at present. Disturbed lowland forests have also been shown to be
important for biodiversity. Studies conducted in logged forest of Southeast Asia
have shown to support recovery of bird species richness and may harbor high
species diversity after logging activities have stopped. Although forest fragments
(400 ha), if unrestored, have shown continued decrease in species diversity even
after years of isolation. Mammals have also shown to recover in logged over forest.
Many species were found to persist after habitat degradation and logged forest were
able to retain species found in undisturbed habitat although species diversity were
lower as compared to undisturbed forest (Koh et al 2013). These show how
important logged over forest are to monitoring status forest restoration initiatives
and species persistence. Rehabilitated forests, for example, have been shown to be
important for insectivore bird diversity. Forest rehabilitation in Sabah and Borneo
has led to an increase in abundance of insectivorous birds (Edwards et al 2009).

ECOLOGICAL ASSESSMENT IN THE B+WISER SITES | 99
Figure 28. Habitat conversion in Mt. Kitanglad Range Natural Park. (A) Pasture land in Brgy. Kaatuan, Lantapan; (B) Corn and banana plantation in Lantapan; (C) and (D)
Vegetable garden in Lupiagan.
MANP
The following are the threats observed by the team during the study:
Cultivated area inside the protected area
Abaca and banana plantation surrounds the periphery of the forest in the area surveyed at Mount
Apo Natural Park. These cultivated areas are still within the boundaries of the park. Fruit trees
like durian and lanzones were also observed in the area. And, coffee is one of the important
products of the area.
Resource extraction
Timber poaching and rattan collection are still present in the area. Some trees are also harvested
for local use.
Management or land conflict
Conflict between the Indigenous People Organization in the area and the barangay local
government unit can be an indirect threat to deforestation and degradation. Management conflict
and conflict of interest between the two groups are very evident during the survey.
Development
Road development is already encroaching towards the park. The indigenous people’s organization
in the area is also concern about the possible application of including the forested area surveyed
for energy resource extraction purposes to address energy crisis in Mindanao.
A C
B D

100 | ECOLOGICAL ASSESSMENTS IN THE B+WISER SITES
IV. CONCLUSIONS AND RECOMMENDATIONS: IMPLICATIONS FOR MANAGEMENT
4.1. SPECIES LEVEL INTERVENTIONS (SSE, OCCUPANCY VIS-À-VIS BMS AND
RESTORATION)
In general terms, across the sites evaluated, the analysis of the species survival envelopes at the
community level (using CCA) with an added dimension of space requirement (occupancy) and at the
landcape scale (species distribution modeling) provided the information at all the tiers described in the
introduction. The results clearly demonstrate how the information generated at every tier enriches our
understanding of the conservation requirements of the various species. These then can be translated into
measurable and verifiable conservation targets, which are the cornerstones of the PA management plan.
The various species-habitat ordinations illustrated a range of habitat fidelity and exclusivity, which
ultimately suggest survival potentials of triggers species in each of the PAs in corresponding habitat
conditions. To match conservation intervention to these various degrees of habitat fidelity and
exclusivity will be the centerpiece of the activities leading to the improvement/enhancement of the
management plans. For example, to apply this approach, the species survival envelopes of the tree
species modelled can help guide the restoration and rehabilitation initiative using the knowledge of
species-habitat parameter matching i.e. species that are strict forest obligates will be a poor choice for
reforestation but good to excellent for rehabilitation (planting on recently altered forest edge);
conversely, species that are not forest obligates are good pioneers (can be planted in open areas).
Occupancy on the other hand, showed a range of survival envelopes in terms of space. For example,
species with high occupancy implies commonness and dominance but may also imply, in conservation
terms, vulnerability to habitat contractions. Species with low occupancy, on the other hand, suggests that
these species are rare and occur naturally in small populations. This may suggest that these species may
not respond to landscape wide habitat change (contraction) per se but on the changes in its microhabitat.
These species that will not respond to landscape scale interventions but would require direct species
management intervention, e.g., control hunting etc. It is also possible that in areas where these species
occur special habitat management will be necessary, e.g., the maintenance of understorey habitat
characteristics (presence of saplings and leaf-litter) which influence its area of occupancy.
In this section, a number of indicator species are suggested that will help the PA identify conservation
targets, e.g., no net loss of old growth forest in the next 5 years. To monitor this target, occupancy or
population density estimates of indicator species will be used as baseline and monitored. Changes in its
densities will indicate levels and extent of degradation. Conversely, if the target was to reduce the level
of degradation by X% in X years, the species indicators that can be used are species that thrive in
degraded habitats. An increase in population and occupancy will suggest that there has been an
expansion of the preferred habitats of these species.
NSMNP
Forest restricted species with narrow niche width that are intolerant to disturbance should be
included in the biodiversity monitoring protocol as indicators of good quality forest. These
species are as follows: bird species include Sooty Woodpecker (Mulleripicus funebris), Flaming
Sunbird (Aethopyga flagrans), and Yellow-wattled Bulbul (Pycnonotus urostictus), while for tree
species are Agathis philippinensis, Diospyrus philippinensis and Palaquium luzoniense.

ECOLOGICAL ASSESSMENT IN THE B+WISER SITES | 101
Birds such as Philippine Bulbul (Ixos philippinus), Elegant Tit (Parus elegans), the Orange-
bellied Flowerpecker (Dicaeum trigonostigma) and the Philippine Tailorbird (Orthotomus
castaneiceps) are forest species that can tolerate various levels of degradation. These are good
indicators of disturbance in natural forests.
The Philippine endemic Anisoptera thurifera (Palosapis) and Shorea polysperma (Tangile), and
the non-endemic Dipterocarpus grandiflorus (Apitong) and Shorea guise (Guijo) are forest
generalists that are tolerant to various degrees of degradation. These species can be used for forest
restoration.
Macaranga tanarius (Binunga) is a fast-growing forest generalist with a wide niche width
suggesting very high tolerance to high degree of habitat disturbance (including open areas). This
species can be used for reforestation purposes.
The central strategy in delivering conservation of key species will be the habitat management of
the HCVAs.
KWFR and UMRBPL
Forest restricted species that were found to be intolerant to disturbance are suggested to be used
in the monitoring biodiversity as indicators of good quality forest. These birds include,
Cacomantis variolosus (Brush cuckoo) and Orthotomus cucullatus (Mountain tailorbird).
The following are bird species that can tolerate various levels of degradation and should be used
as indicators of disturbance in natural forests: Dicrucus balicassius (Balicassiao), Ixos philippinus
(Philippine Bulbul), Phapitreron leucotis (White-eared brown dove), Chalcophaps endica
(Common emerald dove) and Parus elegans (Elegant tit).
For Ipo Dam, as a proxy site for Kaliwa-UMRBPL, the team has observed prevailance of
invasive and exotic species such as Swietenia macrophylla (Mahogany), Gmelina arbor
(Gmelina) and Ceiba pentrandra (Malabulak), showing evidence of how the reforestation
program was implemented in the area in the past. In line with this, it is recommended using
Macaranga grandiflora and Polyscias nodosa for reforestation.
NLNP
Key species such as the Mindoro Bleeding-heart (Gallicolumba platenae), Mindoro Imperial-
pigeon (Ducula mindorensis), Mindoro Hornbill (Penelopides mindorensis), Scarlet-collared
Flowerpecker (Dicaeum retrocinctum), Spotted Imperial-pigeon (Ducula carola), Ashy Thrush
(Zoothera cinerea), Mindoro Striped Stream Frog (Hylarana mangyanum), Mindoro Bush Frog
(Philautus schmackeri), Palawan Fanged Frog (Limnonectes acanthi), Visayan Fanged Frog
(Limnonectes visayanus) and Mindanao Flying Frog (Rhacophorus bimaculatus) are trigger
species that needs to be included in the management plan for the reason that they are indicator of
good forest habitat type.
Bago Watershed, MKNP and NNNP
Species with very narrow niche width are those that also show very low tolerance to disturbance.
Such species will make excellent indicators of gauging the quality of a forest. The Critically
Endangered (CR) Dobsonia chapmani (Philippine bare-backed fruit bat) and Sus cebifrons
(Philippine warty pig) can be utilised as indicator species in a biodiversity monitoring protocol
that may be developed in a particular area i.e. HCVA or hotspot.
The most dominant tree species are the dipterocarps i.e. Shorea negrosensis (Red lauan), S.
contorta (White lauan), and S. polysperma (Tangile). These species showed very narrow niche
width which suggests that these species are forest specialists.. These species can also be used for
forest restoration purposes.
Tristianopsis decorticate (Malabayabas) and Macaranga bicolor (Hamindang) are forest
generalist species that have high tolerance to varying degrees of anthropogenic disturbances or

102 | ECOLOGICAL ASSESSMENTS IN THE B+WISER SITES
habitat alteration, to the extent that these can survive on open areas. This might be a good
candidate to be used for reforestation.
MKNRP
Forest restricted species such as Short-crested monarch and Black-Masked White-eye could be
used as indicator of good quality forest because these are intolerant of habitat degradation.
Species such as the Amethyst Brown Dove, Apo Myna, Blue-crowned Racquet-tail, Blue Fantail,
Cinnamon Ibon, Mountain Racquet-tail and Black-and-Cinnamon Fantail could be used as
indicators of degraded forest habitats. These species are forest obligates but can tolerate habitat
degradation and deforestation.
The Critically Endangered Shorea negrosensis and Shorea polysperma had survival envelopes
that range from degraded forest habitats to the interface of forest and non-forest, which suggests
its tolerance of degradation. These species were also recorded at high numbers in the project site.
It is recommended a further reassessment of the status for both species of Shorea.
MANP
Short-crested monarch and the lizard Gonocephalus sophiae could be used as indicator of forests
with minimal disturbances because of their restriction to forest habitats.
Amethyst Brown Dove, Apo Myna, Blue-crowned Racquet-tail, Blue Fantail, Cinnamon Ibon,
Mountain Racquet-tail and Black-and-Cinnamon Fantail could be used as indicators of degraded
forest habitats.
Wide niche widths of Acer laudanum (Philippine Maple) and Dacrycarpus imbricatus
(Igem) suggest that these can be used as indicators for degraded forest habitats. The niche
position of these species is forest but with a rather wide niche width suggesting these are forest
generalists but unlikely to survive outside of forest. These species can be considered for
restoration interventions in the park.
Mallotus mollisimus, Agathis philippinensis, and Syzygium nitidum (Makaasim) are fast-growing
species that can be used for reforestation.
4.2. LANDSCAPE LEVEL INTERVENTIONS The philosophy used in the ecological modelling (SDM) follows the convention and recommendations
that guide many protected areas in the tropics. The main guiding principle in the modelling is the
protection of large tracts of forest especially in the lowlands (Curran et al. 2004; Sodhi et al. 2004a). The
knowledge of how different indicator species from vertebrate taxa use forest and non-forest habitat is
therefore essential in planning conservation strategies (Arriaga-Weiss et al. 2008; Lee et al. 2007;
Sekercioglu & Sodhi 2007; Wells et al. 2007). The ecological modelling has also underscored the
importance of intermediate habitats or edge habitats (Harper et al. 2005), which are connected to a large
old growth forest (Hughes et al. 2002). The removal of such intermediate habitats will constrict the
movements of birds, for example) across different habitat types (Paquet et al. 2006). The choice of a
mixture of threatened species, non-threatened endemic species and rare forest non-endemics as focal
species was to provide a representative sample of important biodiversity elements through which
population responses to land-cover and land-use changes could be simulated, in order to test if the
philosophy/model of ‘full protection’ will achieve the biodiversity conservation aims of the protected
area.
The long-term survival of the threatened endemic species will rely on their protection across the whole
biogeographic region (landscape approach). Most of the key species modelled are predicted to respond
positively to landscape-scale protection and management approaches (especially those with high species

ECOLOGICAL ASSESSMENT IN THE B+WISER SITES | 103
occupancy) whilst those with smaller occupancy will not. In this section, recommendations based on the
analysis of hotspots are provided i.e. the juxtaposition of current and potential land use/cover change vis-
avis the HCVAs.
HCVAs vis-à-vis PA/WS management regimes and boundaries
NSMNP
There are three identified HCVAs found in the following areas (See Figure 21):
o HCVA No. 1: Northern: Peñablanca-San Pablo-Maconacon
o HCVA No. 2: Western: Maconacon-Divilacan-Iligan-Palanan-San Mariano-
Dinapigue
o HCVA No. 3: Eastern: Maconacon-Divilacan-Iligan-Palanan-San Mariano-
Dinapigue
Identified HCVAs should be included in management plan as core protection zone (see
Figure 21). Revision of management regimes must be considered.
High conservation values areas found outside the existing boundary of the park should be
put under some form of management regimes.
Figure 21. Identified High Conservation Value Areas in NSMNP.

104 | ECOLOGICAL ASSESSMENTS IN THE B+WISER SITES
KWFR and UMRBPL
The sole HCVA that resulted from model encompasses majority of the southern portion
of the Sierra Madre Mountain Range, spanning the provinces of Nueva Ecija, Bulacan,
Aurora, Quezon, and Rizal (See Figure 22).
The identified HCVA is found outside of the two protected areas. The government should
contemplate reconfiguration of the current management zones of these sites.
The two protected areas are severely fragmented. Reforestation from the forest edge is a
proven cost-effective approach to initiate forest restoration and must be undertaken to re-
link fragments and patches of habitats. Intensive monitoring and patrol in these forest
edges are also recommended to reduce or completely reverse deforestation and
degradation in these areas.
Figure 22. Identified High Conservation Value Area in Kaliwa-UMRBPL.

ECOLOGICAL ASSESSMENT IN THE B+WISER SITES | 105
NLNP
Three HCVAs (see Figure 23) outside of NLNP were identified, namely:
o HCVA No. 1: Eastern: Puerto Galera, Baco, San Teodoro and Calapan
o HCVA No. 2: Western: Areas in Abra de ilog, Paluan, Mamburao and Sta. Cruz
o HCVA No. 3: Lubang Island
Based on high species congruence, the Lubang island HCVA is worth investigating by
the DENR as a potential protected area candidate as critical habitat of key Mindoro
species.
Identified HCVAs on Mindoro, particularly the most proximate to NLNP should be
considered as potential areas of expansion for NLNP.
Figure 23. Identified High Conservation Value Area in NLNP.
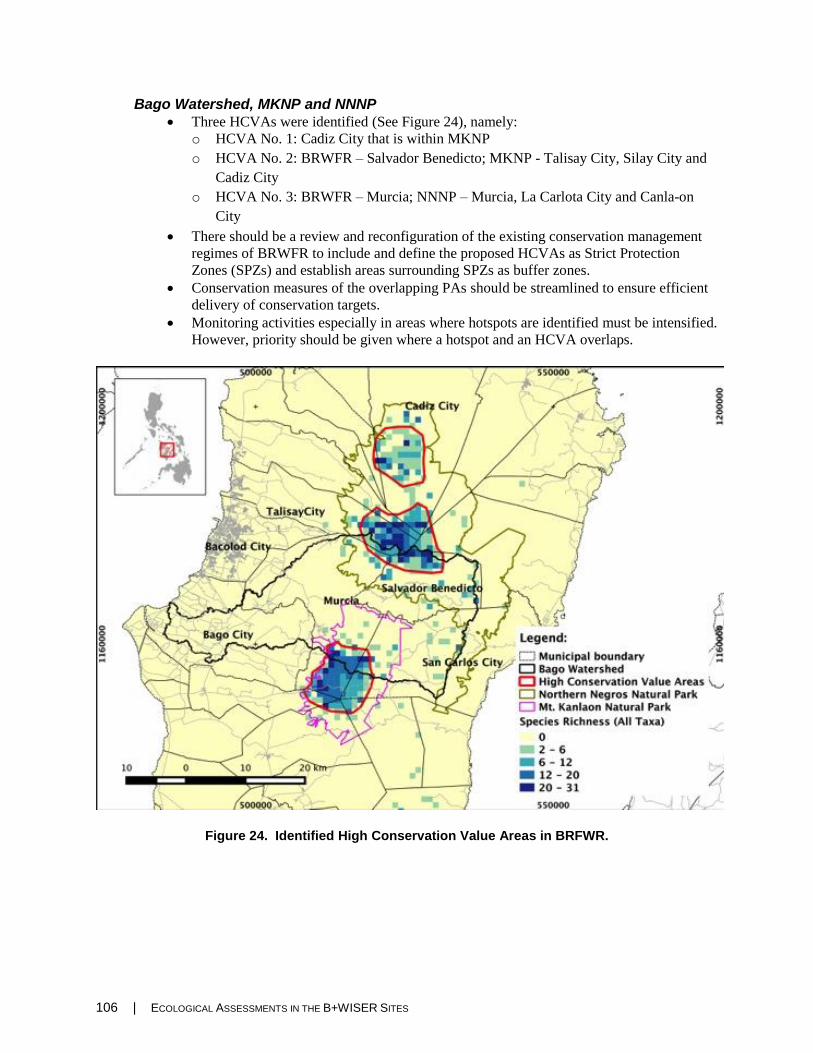
106 | ECOLOGICAL ASSESSMENTS IN THE B+WISER SITES
Bago Watershed, MKNP and NNNP
Three HCVAs were identified (See Figure 24), namely:
o HCVA No. 1: Cadiz City that is within MKNP
o HCVA No. 2: BRWFR – Salvador Benedicto; MKNP - Talisay City, Silay City and
Cadiz City
o HCVA No. 3: BRWFR – Murcia; NNNP – Murcia, La Carlota City and Canla-on
City
There should be a review and reconfiguration of the existing conservation management
regimes of BRWFR to include and define the proposed HCVAs as Strict Protection
Zones (SPZs) and establish areas surrounding SPZs as buffer zones.
Conservation measures of the overlapping PAs should be streamlined to ensure efficient
delivery of conservation targets.
Monitoring activities especially in areas where hotspots are identified must be intensified.
However, priority should be given where a hotspot and an HCVA overlaps.
Figure 24. Identified High Conservation Value Areas in BRFWR.

ECOLOGICAL ASSESSMENT IN THE B+WISER SITES | 107
MKRNP
Three HCVAs were identified for MKRNP. These are as follows (see Figure 25):
o HCVA No. 1: Municipality of Malaybalay – Brgy. Mapayag and Brgy. Imbayao;
Municipality of Sumilao – Brgy. Lupiagan and Brgy. Licoan
o HCVA No. 2: Municipality of Libona – Brgy. Sil-ipon and Brgy. Dahilayan;
Municipality of Baungon – Brgy. San Vicente
o HCVA No. 3: Municipality of Lantapan – Brgy. Kibangan, Brgy. Cawayan, and
Brgy. Victory
HCVAs identified are located within the buffer zone. Reconfiguration of the park’s
boundary is recommended to increase.
Figure 25. Identified High Conservation Value Areas in MKRNP.

108 | ECOLOGICAL ASSESSMENTS IN THE B+WISER SITES
MANP
HCVAs identified are located in the upper part and some outside of the park (See Figure
26). These areas represent the high congruence of environmental requirements of key
species, and therefore must be priority sites for conservation. They are:
o HCVA No. 1: Municipality of Makilala – Brgy. Buhay, Brgy. Garsika, Brgy. New
Ceby; Municipality of Bansalang – Brgy. Sibayan, Brgy. Tinungtungan; Municipality
of Bigos – Brgy. Kapatagan
o HCVA No. 2: Municipality of Davao – Brgy. Talomo, Brgy Tagurano; Municipality
of Atan-awe – Brgy. Kapatagan
o HCVA No. 3: Municipality of Sta. Cruz – Brgy. Tibolo
The management zones of the park must be reconfigured to assign the HCVAs as strict
protection zones and include its surrounding areas as buffer zones. Core zones of MANP
should also be extended to include the identified HCVAs in the Makilala, especially since
some HCVAs are at lower elevations.
MANP is severely fragmented. Reforestation from the deforested area should be initiated
to facilitate the closure of forest gaps.
Intensive monitoring and patrol inside and perimeter of the park should be undertaken.
It could also help also to address the degradation inside the park by creating programs
that will form cohesion within the indigenous peoples of Bagobo Tagabawa.
Figure 26. Identified High Conservation Value Areas in MANP.
HCVA vis-à-vis Hotspots
Conservation hotspots are areas where there is high concentration of trigger and endemic species that are
under severe threats i.e. habitat loss. The generic recommendations for these hotspots are either to (1)
intensify the patrolling to prevent further degradation or loss on these hotspots or (2) target these hotspots
for restoration activities to allow these patches to rehabilitated. Based on the results conducted on the
various analysis for all taxa surveyed, the locations of these HCVA hotspots are enumerated:

ECOLOGICAL ASSESSMENT IN THE B+WISER SITES | 109
NSMNP
Four areas identified as conservation hotspots:
o Hotspot 1
− Municipality of Divilacan: Dicatian, Dicambangan, Ditarum, Dilakit and
Bicobian.
o Hotspot 2
− Municipality of San Mariano: Dibuluan, Disalup and San Jose
o Hotspot 3
− Municipality of Palanan: Villa Robles, Bisag, Santa Jacinta, Dicadyuan and
Marikit
o Hotspot 4
− Municipality of Cabagan: Union
Figure 27. Identified conservation hotspots in NSMNP.

110 | ECOLOGICAL ASSESSMENTS IN THE B+WISER SITES
UMRBPL-KWFR
The following are areas are identified as conservation hotspots:
o Hotspot 1
− Antipolo City (Upper left portion)
o Hotspot 2
− Antipolo City-Rodriguez
o Hotspot 3
− Tanay
o Hotspot 4
− Antipolo City (Lower left portion)
Figure 28. Identified conservation hotspots in KWFR-UMRBPL.

ECOLOGICAL ASSESSMENT IN THE B+WISER SITES | 111
NLNP
The following are areas are identified as conservation hotspots:
o Hotspot 1
− Puerto Galera, Baco, San Teodoro of Oriental Mindoro and Abra de Ilog of
Occidental Mindoro
o Hotspot 2
− Lubang Group of Islands
o Hotspot 3
− Naujan and Pola of Oriental Mindoro
o Hotspot 4
− Sablayan of Occidental Mindoro
Figure 29. Identified conservation hotspots in NLNP.

112 | ECOLOGICAL ASSESSMENTS IN THE B+WISER SITES
Bago Watershed, MKNP and NNNP
The following are HCVA hotspots identified for Bago Watershed, MKNP and NNNP:
o Hotspot 1
− Municipality of Salvador Benedicto - Brgy. Bagong Silang, Brgy. Bunga, Brgy.
Kumaliskis, Brgy. Igmaya-an, Brgy. Pandanon-silos
− Silay City – Brgy. Patag
− Municipality of Murcia – Brgy. Canlandog and Brgy. Buenavista
− Talisay City – Brgy. Cabatangan and Brgy. San Fernando
− Cadiz - Brgy. Villacin
− Sagay City – Brgy. Puey
− Municipality of Calatrava – Brgy. Lalong
o Hotspot 2 - this includes Brgy. Minoyan, Municipality of Murcia
o Hotspot 3 - this includes Brgy. Cabagnag-an, Municipality of La Castellana
Figure 30. Identified conservation hotspots in BRFWR.

ECOLOGICAL ASSESSMENT IN THE B+WISER SITES | 113
MKRNP
The following are HCVA hotspots identified for MKRNP:
o Hotspot 1
− Municipality of Malaybalay – Brgy. Mapayag and Brgy. Imbayao; and
Municipality of Sumilao – Brgy. Lupiagan and Brgy. Licoan
o Hotspot 2
− Municipality of Libona – Brgy. Sil-ipon and Brgy. Dahilayan; and Municipality
of Baungon – Brgy. San Vicente
o Hotspot 3
− Municipality of Lantapan – Brgy. Kibangan, Brgy. Cawayan, and Brgy. Victory
Figure 31. Identified conservation hotspots in MKRNP.

114 | ECOLOGICAL ASSESSMENTS IN THE B+WISER SITES
MANP
The following are HCVA hotspots identified for MANP:
o Hotspot 1
− Municipality of Makilala - Brgy. Buhay, Brgy. Garsika, Brgy. New Cebu
− Municipality of Bansalang – Brgy. Sibayan, Brgy. Tinungtungan
o Hotspot 2
− Davao City – Brgy. Talomo, Brgy Tagurano
o Hotspot 3x
− Municipality of Atan-awe – Brgy. Kapatagan, 3. Municipality of Sta. Cruz –
Brgy. Tibolo
Figure 32. Identified conservation hotspots in MANP.

ECOLOGICAL ASSESSMENT IN THE B+WISER SITES | 115
V. GLOSSARY OF TERMS AND ACRONYMS
Biodiversity – The variety and variability among living organisms and the ecological complexes in
which they occur.
Canonical Correspondence Analysis (CCA) – A multivariate statistical method used to explain the
relationships between biological assemblages of species and their environment.
Conservation hotspot – areas where high concentrations of trigger and endemic species which facing
extraordinary loss of habitats.
Critically Endangered (CR) – An IUCN threat category stating that there is an extremely high
possibility of the taxon’s extinction in the wild because all available data meets criteria A to E for
Critically Endangered. (Please see section V of the “IUCN Red List Categories and Criteria” at
http://jr.iucnredlist.org/documents/redlist_cats_crit_en.pdf for a detailed explanation of criteria A to E
for Critically Endangered.)
Data Deficient (DD) – An IUCN category stating that there is insufficient information to make an
assessment of the possibility of extinction based on the available data for distribution and/or population
status of the taxon.
Eigenvalues –is a number value, telling you how much variance there is in the dataset. In PCA, they are
calculated and used in deciding how many factors to extract in the overall factor analysis. It is the scaling
factor of eigenvector.
Endangered (EN) – An IUCN threat category stating that there is a very high possibility of the taxon’s
extinction in the wild because the best available data meets any of the criteria A to E for Endangered. It
is one step below Critically Endangered and one step above Vulnerable. (Please see section V of the
“IUCN Red List Categories and Criteria” at http://jr.iucnredlist.org/documents/redlist_cats_crit_en.pdf
for a detailed explanation of criteria A to E for Critically Endangered.)
Endemic – a species that is only found in a given region or location and nowhere else in the world.
Forest – A portion of land more than half a hectare in size with trees that are at least 5 meters in height
and having a canopy cover of more than 10% of the land area. It usually has a slope greater than 18%.
Forest dependent – relating to a species that is restricted in forest habitat.
Forest edge – refers to the interface or boundary between the forest and non-forest area.
Habitat – The place where a population (e.g., human, animal, plant, microorganism) lives and its
surroundings, both living and non-living.
High Conservation Value Area (HCVA) – natural habitat of outstanding significance and critical
importance to species conservation because it is the habitat of threatened and/or endemic species. Any
major habitat changes in this area will almost certainly lead to species extinctions and should therefore
become non-negotiable protected areas.

116 | ECOLOGICAL ASSESSMENTS IN THE B+WISER SITES
Introduced – a species living outside its native distributional range, which has arrived there
by human activity, either deliberate or accidental.
Key Biodiversity Areas (KBA) – nationally identified sites of global significance. The identification of
KBAs is an important approach to address biodiversity conservation at the site scale i.e. at the level of
individual protected areas, concessions, and land management units.
Least Concern (LC) – An IUCN threat category stating that the possibility of the taxon’s extinction in
the wild is low. This is because it does not qualify as Near Threatened, Vulnerable, Endangered, or
Critically Endangered. This category includes widespread and abundant taxa.
Lowland Forest – natural forests between 500m to 900m altitude.
Migratory - are species which perform cyclical movements between two distinct geographical areas,
one of which is usually the area in which they breed.
Montane Forest – natural forests, above 1200m altitude, with canoopy cover that is greater than 30%.
Not Assessed (NA) – An IUCN threat category that has not yet been evaluated.
Near Threatened (NT) – An IUCN threat category stating that the possibility of a taxon’s extinction in
the wild is medium, being worse than Least Concern taxa but not as bad as Vulnerable taxa. Although it
does not qualify as Vulnerable, Endangered, or Critically Endangered, it is close to being threatened and
may be classified as such in the near future.
Niche width – refers to theoretical range of conditions that a species could inhabit and successfully
survive and reproduce in.
Non-forest – all land that is not classified as forest area (i.e cultivated, wooded grassland, built-up area,
grassland, barren, fallow land).
Non-Volant Mammals – This term refers to species of mammals that are not capable of flight such as
rodents, squirrels, pigs, and flying lemurs.
Open Forest – Forest where the canopy cover is between 10 and 40 percent of the area.
Proxy Sites – substitute areas to surveyed as an alternative to the proposed project sites due to issues on
permits, certifications, and insurgency problems.
Species Distribution Modelling - A technique used to predict and produce spatially explicit distribution
of animals and plants. (Elith and Leathwick 2009b).
Species Occupancy Modelling – A method to show the proportion of an area, patches, or sampled units
that is occupied by a species.
Survival envelopes – defines the limits of environmental features essential to that species' survival, or
"niche." The result of this analysis is a description of the mean niche position on each selected gradient
(niche position) for each species, which represents a measure of the distance between the mean
conditions used by the species and the mean conditions of the study area for that gradient.

ECOLOGICAL ASSESSMENT IN THE B+WISER SITES | 117
Taxa/Taxon – A taxon (pl. taxa) refers to a taxonomic unit, a population or group of population of
organisms that are phylogenetically related.
Transect – A transect is a cut or path established along different elevation and disturbance gradients, in
which counts and species occurrence are recorded.
Trigger Species – Species of high conservation importance. In this study, the trigger species were
chosen based on their distribution and IUCN Red List Classification: the species (or subspecies) are
endemic and/or threatened according to their IUCN Red List classification. In addition, these species
should be manageable as a distinct unit.
Volant Mammals – Mammals that are capable of flying such as bats.
Vulnerable (VU) – An IUCN threat category stating that the possibility of a taxon’s extinction in the
wild is high. This is because the best available data meet any of the criteria A to E for Vulnerable. It is
one step below Endangered. (For a detailed explanation of criteria A to E for Vulnerable, please see
section V of the “IUCN Red List Categories and Criteria” at
http://jr.iucnredlist.org/documents/redlist_cats_crit_en.pdf.

118 | ECOLOGICAL ASSESSMENTS IN THE B+WISER SITES
VI. BIBLIOGRAPHY
Andal, E.S., Shoji, A., Yumul Jr., G. P. 2005. Complete mantle section of a slow-spreading ridge-derived
ophiolite: An example from the Isabela ophiolite in the Philippines. Island Arc 14 (3): 272–294.
Araño, R.R., Van Weerd, M. and J. Van der Ploeg. 2010. The Northern Sierra Madre Natural Park. Pp.
149-157 in Persoon, G., Masipiqueña, A., Van der Ploeg, J., Masipiqueña, M. and M. van Weerd.
Crossing Boundaries: celebrating 20 years of environmental research in Cagayan Valley and Sierra
Madre. Cabagan: Isabela State University and Leiden: Leiden University.
Arriaga-Weiss S.L., Calme, S., Kampichler C., (2008). Bird communities in rainforest fragments:
guildresponses to habitat variables in Tabasco, Mexico. Biodivers Conserv 17:173–190
Becker, C. D., and A. Aggreda. 2005. Bird community differences in mature and second growth garu?a
forest in Machalilla National Park, Ecuador. Ornitologia Neotropical 16:297-319.
Bontemps, S., Defourny, P., Bogaert, E.V., Arino, O., Kalogirou, V. & Perez, J.R. (2010) GLOBCOVER
2009-Products Description and Validation Report. European Space Agency.
Brown, R.M., Siler, C.D., Oliveros, C.H., Welton, L.J., Rock, A., Swab, J., Van Weerd, M., Van Beijnen,
J., Jose, E., Rodriguez, D., Jose, E., Diesmos, A.C. 2013. The amphibians and reptiles of Luzon
Island, Philippines, VIII: the herpetofauna of Cagayan and Isabela Provinces, northern Sierra Madre
Mountain Range. ZooKeys 266: 1–120.
Buckland, S.T. (1993) Distance sampling: estimating abundance of biological populations. Chapman &
Hall.
Buckland, S.T., Anderson, D.R., Burnham, K.P., Laake, J.L., Borchers, D.L. & Thomas, L. (2004)
Advanced distance sampling.
Carwardine, J., W. A. Rochester, K. S. Richardson, K. J. Williams, R. L. Pressey, and H. P. Possingham.
2007. Conservation planning with irreplaceability: does the method matter? Biodiversity and
Conservation 16:245-258.
Co, L.L., Tan, B.C., 1992. Botanical exploration in Palanan wilderness, Isabela Province, the Philippines:
first report. Flora Malesiana Bulletin 11 (1), 49-53.
Co L.L., Lagunzad D.A., LaFrankie J.V., Bartolome N.A., Molina J.E., Yap S.L., Garcia H.G., Bautista
J.P., Gumpal E.C., Arano R.R., Davies S.J. 2004. Palanan forest dynamic plot, Philippines. In: Losos
E.C. and Leigh Jr. E.G. (eds.), Tropical forest diversity and dynamism: findings form a large-scale
plot network. Chicago: the University of Chicago Press, pp. 574-584.
Collins, N.M., Sayer, J.A., Whitmore, T.C. 1991. The conservation atlas of tropical forests. Gland: IUCN.
Curran LM, Trigg SN, McDonald AK, Astiani D, Hardiono YM, Siregar P, Caniago I, Kasischke E
(2004). Lowland forest loss in protected areas of Indonesian Borneo. Science 303:1000–1003. doi:
10.1126/science.1091714

ECOLOGICAL ASSESSMENT IN THE B+WISER SITES | 119
Danielsen F., Balete D.S., Christensen T.D., Heegaard M., Jacobsen O.F., Jensen A., Lund T. and Poulsen
M.K. 1993. Conservation of biological diversity in the Sierra Madre Mountains of Isabela and
southern Cagayan Province, the Philippines. Manila: DENR and Copenhagen: Birdlife
International/DOF.
ESSC (Environmental Science for Social Change Inc.). 1999. Decline of the Philippine forest. Makati
City: Bookmark.
Fortus, J.F. and Garcia, H.G. 2002a. Floristic study of ultrabasic forest at Northern part [Diguides] of
Northern Sierra Madre Natural Park. Technical report. Cabagan: Northern Sierra Madre Natural Park
– Conservation Project.
Fortus, J.F. and Garcia, H.G. 2002b. Floristic study of ultrabasic forest at Southern part [Divinisa] of
Northern Sierra Madre Natural Park. Technical report. Cabagan: Northern Sierra Madre Natural Park
– Conservation Project.
Garcia, H.G. 2002a. Floristic study of mangrove forest [Dimasalansan] in Northern Sierra Madre Natural
Park. Technical report. Cabagan: Northern Sierra Madre Natural Park – Conservation Project.
Garcia, H.G. 2002b. Floristic study of lowland dipterocarp forest at western part [Apaya] of Northern
Sierra Madre Natural Park. Technical report. Cabagan: Northern Sierra Madre Natural Park –
Conservation Project.
Garcia, H.G. 2002c. Floristic study of lowland dipterocarp forest at eastern part [Dimolid] of Northern
Sierra Madre Natural Park. Technical report. Cabagan: Northern Sierra Madre Natural Park –
Conservation Project.
Garcia, H.G. 2002d. Floristic study of mossy forest in Northern Sierra Madre Natural Park. Technical
report. Northern Sierra Madre Natural Park – Conservation Project, Cabagan.
Harper, K. A., S.E. Macdonald, P.J. Burton, J. Chen, K.D. Brosofske, S.C. Saunders, E.S. Euskirchen, D.
Roberts, M.S. Jaiteh, and P.A. Esseen. 2005. Edge of influence on forest structure and composition
in fragmented landscapes. Conservation Biology 19:768-872
Hayes, T. M. 2006. Parks, people, and forest protection: An institutional assessment of the effectiveness
of protected areas. World Development 34:2064-2075.
Hijmans, R.J., Cameron, S.E., Parra, J.L., Jones, P.G. & Jarvis, A. (2005) Very high resolution
interpolated climate surfaces for global land areas. International Journal of Climatology, 25, 1965nal
JouHines, J.E. (2006) PRESENCE software to estimate patch occupancy rates and related
parameters. Patuxent Wildlife Research Center, Laurel.
Hughes, J.B., G.C. Daily, and P.R. Erlich. 2002. Conservation of tropical forest birds in countryside
habitats. Ecology Letters: 5:121-129.
Lee, T., M., M. C. K. Sodhi, and D.M. Prawiradilaga. 2007. The importance of protected areas for the
forest and endemic avifauna of Sulawesi (Indonesia). Ecological Applications 17:1727-1741.
Lindenmayer, D. B., J. F. Franklin, and J. Fischer. 2006. General management principles and a checklist
of strategies to guide forest biodiversity conservation. Biological Conservation 131:433-445.

120 | ECOLOGICAL ASSESSMENTS IN THE B+WISER SITES
Lovejoy, T. E. 2006. Protected areas: a prism for a changing world. Trends in Ecology and Evolution
21:329-333.
MacKenzie, D.I., Nichols, J.D., Royle, J.A., Pollock, K.H., Bailey, L.L. & Hines, J.E. (2005) Occupancy
Estimation and Modeling: Inferring Patterns and Dynamics of Species Occurrence, 1st edition.
Academic Press.
Mallari, N.A.D. and A. Jensen. 1993. Biological diversity in Northern Sierra Madre. Philippines: its
implication for conservation and management. Asia Life Sciences 2: 101- 112.
Mallari, N.A.D., Collar, N.J., Lee, D.C., McGowan, P.J.K., Wilkinson, R., and Marsden, S.J. 2011.
Population densities of understorey birds across a habitat gradient in Palawan, Philippines:
implications for conservation. Oryx 45(2), 234-242.
Mallari, N.A.D., Collar, N.J., McGowan, P.J.K., and Marsden, S.J. Science-driven management of
protected areas: a Philippine case study. 2013. Environmental Management 51:1236-1246.
Mallari et al., Biodiversity Assessment Manual. in prep.
Minter, T. 2010. The Agta of the Northern Sierra Madre. Livelihood strategies and resilience amiong
Philippine hunter-gatherers. PhD dissertation. Leiden: Leiden University.
Mudar, K.M. and M.S. Allen. 1986. A list of bats from northeastern Luzon, Philippines. Mammalia 50
(2): 219-225.
Nachtergaele, F., Van Velthuizen, H., Verelst, L., Batjes, N., Dijkshoorn, K., Van Engelen, V., et al.
(2009) Harmonized world soil database. Food and Agriculture Organization of the United Nations.
NORDECO and DENR. 1998. Technical Report. Integrating conservation and development in protected
area management in the Northern Sierra Madre Natural Park, the Philippines. Manila: NORDECO
and DENR.
Oksanen, J., Kindt, R., Legendre, P., Oe United Nationses, N., Dijkshoorn, K., Van Engelen, V., (2007)
The vegan package. CRAN.
Paquet J.Y., X. Vandevyvre, L. Delahaye, and J. Rondeux. 2006. Bird assemblages of a mixed woodland-
farmland landscape: The conservation value of silviculture dependant open areas in plantation forest.
Forest Ecology and Management 227:59-70
PAGASA (Philippine Atmospheric, Geophysical and Astronomical Services Administration). 2005.
Monthly minimum, maximum and rainfall data from weather stations Tuguegarao and Casiguran
1975-2004. Manila: PAGASA.
Phillips, S.J., Anderson, R.P. & Schapire, R.E. (2006) Maximum entropy modeling of species geographic
distributions. Ecological Modelling, 190, 231
Poulsen, M.K. 1995. The threatened and near-threatened birds of Luzon, Philippines, and the role of the
Sierra Madre mountains in their conservation. Bird Conservation International 5: 79-115.

ECOLOGICAL ASSESSMENT IN THE B+WISER SITES | 121
Sekercioglu, C. H., Sodhi, N.S. (2007). Conservation biology: Predicting birds' responses to forest
fragmentation. Current Biology 17: R838-R840
Sodhi NS, Koh LP, Brook BW, Ng PKL (2004) Southeast Asian biodiversity: an impending disaster.
Trends Ecol Evol 19:654–660. doi:10.1016/j.tree.2004.09.006
Snelder, D.,Van Weerd, M., Van ’t Zelfde, M. And W. Tamis. 2013. Modelling the impact of climate and
land use changes on forest bird species for adaptive management of the Northern Sierra Madre
Natural Park (Philippines). Report within the framework of the project on Mainstreaming Climate
Change in Biodiversity Planning and Conservation in the Philippines”, coordinated by the World
Agroforestry Centre (ICRAF-Philippines) and funded by USAID. Leiden: Leiden University
Tan, J.M.L.. 2000. The last great forest: Luzon’s Northern Sierra Madre Natural Park. Makati City:
Bookmark.
Ter Braak, C.J.F. (1986) Canonical Correspondence Analysis: A New Eigenvector Technique for
Multivariate Direct Gradient Analysis. Ecology, 67, 1167nonicalBraak, C.J.F.T. (1987) The analysis
of vegetation-environment relationships by canonical correspondence analysis. In Theory and
models in vegetation science (eds I.C. Prentice & E. van der Maarel), pp. 69–77. Springer
Netherlands.
Thomas, L., Buckland, S.T., Rexstad, E.A., Laake, J.L., Strindberg, S., Hedley, S.L., et al. (2010)
Distance software: design and analysis of distance sampling surveys for estimating population size.
Journal of Applied Ecology, 47, 5
Van der Ploeg, J. van Weerd, M., Masipiqueña, A.B. and G.A. Persoon. 2011. Illegal logging in the
Northern Sierra Madre Natural Park, the Philippines. Conservation & Society 9: 202–215.
Van Weerd, M. 2002. Summary report of the fauna study results in the Northern Sierra Madre Natural
Park by the PLAN Philippines/Northern Sierra Madre Natural Park – Conservation Project.
Cabagan: Plan International/NSMNP-CP.
Van Weerd, M. and R. Hutchinson. 2004. Observations of Isabela oriole Oriolus Isabellae in the Sierra
Madre, Luzon, the Philippines, with descriptions of the call. Forktail 20 (2004): 133-136.
Van Weerd, M. and J. van der Ploeg. 2004. A new future for the Philippine crocodile. Sylvatrop13: 31–
50.
Van Weerd, M. and J. van der Ploeg. 2012. The Philippine crocodile: ecology, culture and conservation.
Mabuwaya Foundation: Cabagan.
Verburg, P.H., Overmars, K.P., Huigen, M.G.A., de Groot, W.T. and A.Veldkamp. 2005. Analysis of the
effects of land use change on protected areas in the Philippines. Applied Geography 26:153–173.
Villanueva, R.J., Van der Ploeg, J. and M. van Weerd. 2009. Some Odonata from the Northern Sierra
Madre Natural Park, Isabela, Luzon, Philippines. Agrion 13(2): 72-74.
Wells, K., E. K. V. Kalko, M.B. Lakim, M. Pfeiffer. 2007. Effects of rain forest logging on species
richness and assemblage composition of small mammals in Southeast Asia. Journal of Biogeography
34:1087-1099

122 | ECOLOGICAL ASSESSMENTS IN THE B+WISER SITES
Welton, L.J., Siler C.D., Bennett D., Diesmos A.C., Duya M.R., Dugay R., Rico E.L., van Weerd M. and
R.M. Brown. 2010. A spectacular new Philippine monitor lizard reveals a hidden biogeographic
boundary and a novel flagship species for conservation. Biology Letters 6: 654–658.
Wilson, K. A., E. C. Underwood, S. A. Morrison, K. R. Klausmeyer, W. W. Murdoch, B. Reyers, G.
Wardell-Johnson, P. A. Marquet, P. W. Rundel, M. F. McBride, R. L. Pressey, M. Bode, J. M.
Hoekstra, S. Andelman, M. Looker, C. Rondinini, P. Kareiva, M. R. Shaw, and H. P.
Possingham. 2007. Conserving biodiversity efficiently: what to do, where, and when. Plos
Biology Sept 5(9):e223.

ECOLOGICAL ASSESSMENT IN THE B+WISER SITES | 123
VII. ANNEXES
ANNEX A. SPECIES LIST
NSMNP
Annex 1.1a. Summary of tree species recorded in NSMNP, their extent of occurrence and conservation
status based on the IUCN Red List of Threatened Species (2014).
Scientific Name Common/Local Name Extent of Occurrence* IUCN Status**
Agathis philippinensis Almaciga VU
Alahan
Alstonia scholaris Batino LC
Anisoptera thurifera Palosapis CR
Artocarpus blancoi Nangka VU
Artocarpus rigidus Monkey Jak
Azadirachta sp.
Bignai Kalabaw
Bischofia javanica Tuai
Calophyllum inophyllum Bitaog LC
Canarium ovatum Piling liitan Endemic VU
Canthium dicoccum Luing-luing VU
Celtis philippinensis Malaikmo
Citrus sp.
Claoxylon purpureum Anot-ot
Dillenia philippinensis Katmon Endemic VU
Diospyrus philippensis Oi-Oi CR
Diospyrus pilosanthera Bolong Eta EN
Diptetrocarpus grandiflorus Apitong CR
Dracontomelon dao Dao VU
Duabanga moluccana Loktob
Ficus minahassae Hagimit
Ficus nota Tibig
Ficus sp.
Ficus variegata Tangisang bayawak VU
Garcinia venulosa Gatasan
Glochidion album Malabagang
Gmelina arborea Gmelina
Guisat
Hopea accuminata Manggachapui EN
Kanagitan
Kanaring

124 | ECOLOGICAL ASSESSMENTS IN THE B+WISER SITES
Scientific Name Common/Local Name Extent of Occurrence* IUCN Status**
Kantingan
Kasiray
Kleinhovia hospita Tan-ag
Knema sp.
Koordersiodendron pinnatum Amugis VU
Kulipapa
Lithocarpus sp.
Litsea leytensis Batikuling VU
Luecaena luecocephala Ipil-pil LC
Macaranga bicolor Hamindang VU
Macaranga grandifolia Takip-Asin Endemic VU
Macaranga tanarius Binunga
Malugay
Mangifera altissima Pahutan VU
Maraceda
Marachesa
Maragawid
Marakasiray
Marasida
Melastoma malabathricum
Myristica philippensis Duguan VU
Nauclea orientalis Bangkal
Nephelium lappaceum
LC
Octomeles sumatrana Binuang LC
Palaquium luzoniensis Nato Endemic VU
Palaquium philippense Malakmak VU
Parashorea malaanonan Bagtikan CR
Parkia timoriana Kupang
Pouteria campechiana
Pterocarpus indicus Narra CR
Sapindus sapunaria Kusibeng
Semicarpus cuneiformis
Semicarpus longifolius
Seralbizia acle
Shorea astylosa Yakal CR
Shorea contorta White Lauan Endemic VU
Shorea guiso Guijo CR
Shorea negrosensis Red Lauan Endemic VU
Shorea palosapis Mayapis CR
Shorea polysperma Tangile Endemic VU

ECOLOGICAL ASSESSMENT IN THE B+WISER SITES | 125
Scientific Name Common/Local Name Extent of Occurrence* IUCN Status**
Sterculia foetida Kalumpang
Syzigium ciliato-setosum Lakangan
Syzygium nitidum Makaasim
Syzygium tripinnatum Hagis
Toona kalantas Kalantas CR
Trema orientalis Anabiong
Tristaniopsis decorticata Malabayabas Endemic CR
Vitex parviflora Molave EN
Voacanga globosa
*Extent of occurrence refers to the species endemic (EN) to the Philippines. **Conservation status of species according to the IUC Red List of Threatened Species (2014): Least Concern (LC), Near Threatened (NT), Endangered (EN), Vulnerable (VU), and Critically Endangered (CR)
Annex 1.1b. Summary of bird species recorded in NSMNP, their extent of occurrence and conservation
status based on the IUCN Red List of Threatened Species (2014).
Scientific Name Common Name Extent of Occurrence* IUCN Status**
Phapitreron amethystinus
Amethyst Brown-Dove Endemic LC
Phylloscopus borealis Arctic Warbler
Zoothera cinerea Ashy Ground-Thrush Endemic VU
Cypsiurus balasiensis Asian Palm-Swift
Dicrurus balicassius Balicassiao Endemic LC
Coracina striata Bar-bellied Cuckoo-Shrike
LC
Gallirallus torquatus Barred Rail
Dicaeum bicolo Bicolored Flowerpecker Endemic LC
Lalage melanoleuca Black-and-White Triller Endemic LC
Coracina mindanensis Black-bibbed Cuckoo-Shrike Endemic VU
Ptilinopus leclancheri Black-chinned Fruit-dove Endemic LC
Coracina coerulescens Blackish Cuckoo-Shrike Endemic LC
Hypothymis azurea Black-naped Monarch
Cyornis herioti Blue-breasted Flycatcher Endemic LC
Rhipidura cyaniceps Blue-headed Fantail Endemic LC
Merops viridis Blue-throated Bee-eater
Cisticola exilis Bright-capped Cisticola
Brown Shrike Brown Shrike
Cacomantis variolosus Brush Cuckoo
Coracina coerulescens Blackish Cuckoo-Shrike Endemic LC
Lonchura atricapilla Chestnut Munia
Loriculus philippensis Colasisi
LC
Sarcops calvus Coleto Endemic LC
Chalcophaps indica Common Emerald-Dove
Eudynamys scolopaceus Common Koel

126 | ECOLOGICAL ASSESSMENTS IN THE B+WISER SITES
Scientific Name Common Name Extent of Occurrence* IUCN Status**
Actitis hypoleucos Common Sandpiper
Psilopogon haemacephalus
Coppersmith Barbet
Ramphiculus merrilli Cream-bellied Fruit-dove Endemic NT
Acridotheres cristatellus Crested Myna
Eurystomus orientalis Dollarbird
Parus elegans Elegant Tit Endemic LC
Aethopyga flagrans Flaming Sunbird
Ficedula disposita Furtive Flycatcher Endemic NT
Sterrhoptilus dennistouni Golden-crowned Babbler Endemic NT
Lyncornis macrotis Great-eared Nightjar
chrysocolaptes guttacristatus
Greater Flameback
Prioniturus luconensis Green Racquet tail Endemic VU
Ardea cinerea Grey Heron
Motacilla cinerea Grey Wagtail
Muscicapa griseisticta Grey-streaked Flycatcher
Tringa brevipes Grey-tailed Tattler
Bolbopsittacus lunulatus Guaiabero
Cuculus fugax Hodgson's Hawk-Cuckoo Endemic LC
Pitta sordida Hooded Pitta
Alcedo cyanopectus Indigo-banded Kingfisher
Mesophoyx intermedia Intermediate Egret
Accipiter gularis Japanese Sparrowhawk
Corvus macrorhynchos Large-billed Crow
Phylloscopus cebuensis Lemon-throated Leaf-Warbler
Centropus bengalensis Lesser Coucal
Egretta garzetta Little Egret
Gallicolumba luzonica Luzon Bleeding-Heart Endemic NT
Penelopides manillae Luzon Hornbill Endemic LC
Zosterornis striatus Luzon-striped Babbler Endemic NT
Aethopyga pulcherrima Metallic-winged Sunbird Endemic LC
Prionochilus olivaceus Olive-backed Flowerpecker Endemic LC
Cinnyris jugularis Olive-backed Sunbird
Dicaeum trigonostigma Orange-bellied Flowerpecker
Hirundo tahitica Pacific Swallow
Rostratula benghalensis Painted Snipe
Turdus pallidus Pale Thrush
Anthus gustavi Pechora Pipit
Hypsipetes philippinus Philippine Bulbul Endemic LC
Centropus viridis Philippine Coucal Endemic LC
Macropygia tenuirostris Philippine Cuckoo-Dove Endemic LC
Ceyx melanurus Philippine Dwarf Kingfisher Endemic VU

ECOLOGICAL ASSESSMENT IN THE B+WISER SITES | 127
Scientific Name Common Name Extent of Occurrence* IUCN Status**
Irena cyanogastra Philippine Fairy-Bluebird Endemic
Microhierax erythrogenys
Philippine Falconet Endemic
LC
Batrachostomus septimus
Philippine Frogmouth Endemic
LC
Nisaetus philippensis Philippine Hawk-Eagle Endemic VU
Ninox philippensis Philippine Hawk-Owl Endemic LC
Caprimulgus manillensis Philippine Nightjar Endemic LC
Dendrocopos maculatus Philippine Pygmy Woodpecker Endemic LC
Otus megalotis Philippine Scops-Owl Endemic LC
Spilornis holospilus Philippine Serpent-Eagle Endemic LC
Orthotomus castaneiceps
Philippine Tailorbird Endemic
LC
Harpactes ardens Philippine Trogon Endemic LC
Saxicola caprata Pied Bushchat
Ducula poliocephala Pink-bellied Imperial Pigeon Endemic NT
Amaurornis olivacea Plain Bush-hen Endemic LC
Anthreptes malacensis Plain-throated Sunbird
Cacomantis merulinus Plaintive Cuckoo
Treron pompadora Pompadour Green-Pigeon
Hirundapus celebensis Purple Needletail
Nectarinia sperata Purple-throated Sunbird
Dicaeum pygmaeum Pygmy Flowerpecker
Collocalia troglodytes Pygmy Swiftlet
Gallus gallus Red Junglefowl
Erythropitta erythrogaster
Red-bellied Pitta
Phaenicophaeus superciliosus
Red-crested Malkoha Endemic
LC
Dicaeum australe Red-keeled Flowerpecker Endemic
Anthus richard Richard's Pipit
Halcyon coromanda Ruddy Kingfisher
Centropus unirufus Rufous Coucal Endemic NT
Buceros hydrocorax Rufous Hornbill Endemic NT
Terpsiphone cinnamomea
Rufous Paradise-Flycatcher
Phaenicophaeus cumingi Scale-feathered Malkoha Endemic LC
Zoothera dauma Scaly Ground-Trush
Hypothymis helenae Short-crested Monarch Endemic NT
Luscinia calliope Siberian Rubythroat
Robsonius thompsoni Sierra Madre Ground-Warbler Endemic NT
Corvus enca Slender-billed Crow
Mulleripicus funebris Sooty Woodpecker Endemic LC
Actenoides lindsayi Spotted Wood-Kingfisher Endemic LC
Megalurus palustris Striated Grassbird
LC

128 | ECOLOGICAL ASSESSMENTS IN THE B+WISER SITES
Scientific Name Common Name Extent of Occurrence* IUCN Status**
Rhabdornis mystacalis Stripe-headed Rhabdornis Endemic LC
Hemiprocne comata Whiskered Tree-Swift
Lonchura leucogastra White-bellied Munia
Dryocopus javensis White-bellied Woodpecker
Amaurornis phoenicurus White-breasted Waterhen
Artamus leucorynchus White-breasted Woodswallow
Porzana cinerea White-browed Crake
Copsychus luzoniensis White-browed Shama Endemic LC
Oriolus albiloris White-lored Oriole Endemic LC
White-throated Kingfisher
White-throated Kingfisher
Motacilla flava Yellow Wagtail
Pachycephala philippinensis
Yellow-bellied Whistler Endemic LC
Ptilinopus occipitalis Yellow-breasted Fruit-Dove Endemic LC
Zosterops nigrorum Yellowish White-eye Endemic LC
Pycnonotus goiavier Yellow-vented Bulbul
Pycnonotus urostictus Yellow-wattled Bulbul Endemic LC
*Extent of occurrence refers to the species endemic (EN) to the Philippines. **Conservation status of species according to the IUC Red List of Threatened Species (2014): Least Concern (LC), Near Threatened (NT), Endangered (EN), Vulnerable (VU), and Critically Endangered (CR)
Annex 1.1c. Summary of mammal species recorded in NSMNP, their extent of occurrence and
conservation status based on the IUCN Red List of Threatened Species (2014).
Scientific Name Common Name Extent of Occurrence* IUCN Status**
VOLANT MAMMALS
Cynopterus brachyotis Lesser short-nosed fruit bat LC
Eonycteris robusta Philippine dawn bat Endemic NT
Haplonycteris fischeri Fischer's pygmy fruit bat Endemic LC
Macroglossus minimus Long-tongued nectar bat LC
Otopteropus cartilagonodus Luzon pygmy fruit bat Endemic LC
Ptenochirus jagori Musky fruit bat Endemic
Desmalopex leucopterus Mottle-winged flying fox Endemic LC
Rousettus amplexicaudatus Common rousette
Hipposideros diadema Diadem leaf-nosed bat LC
Megaderma spasma Lesser false vampire bat LC
Rhinolophus arcuatus Arcuate horseshoe bat LC
NONVOLANT MAMMALS
Rattus everetti Philippine forest rat Endemic LC
Rattus sp
Paradoxurus hermaphroditus Asian palm civet LC
Sus philippensis Philippine warty pig Endemic VU
Macaca fascicularis Long-tailed Macaque NT

ECOLOGICAL ASSESSMENT IN THE B+WISER SITES | 129
Scientific Name Common Name Extent of Occurrence* IUCN Status**
Rusa marianna Philippine brown deer Endemic VU
*Extent of occurrence refers to the species endemic (EN) to the Philippines.
**Conservation status of species according to the IUC Red List of Threatened Species (2014): Least
Concern (LC), Near Threatened (NT), Endangered (EN), Vulnerable (VU), and Critically Endangered
(CR)
Annex 1.1d. Summary of amphibians and species recorded in NSMNP, their extent of occurrence and
conservation status based on the IUCN Red List of Threatened Species (2014).
Scientific Name Common Name Extent of
Occurrence* IUCN
Status**
Brachymeles bonitae Stub-limbed Burrowing Skink Endemic LC
Brachymeles sp
Calamaria gervaisi Gervais' Worm Snake Endemic
LC
Cuora amboinensis South Asian Box Turtle Endemic
VU
Cyrtodactylus philippinicus Philippine Bent-toed Gecko Endemic
LC
Dendrelaphis luzonensis Gray Bronzeback Endemic
LC
Draco spilopterus Philippine Flying Dragon
Eutropis cumingi Cuming’s Mabuya Endemic
LC
Eutropis multicarinata borealis
Endemic LC
Fejervarya cancrivora Crab-eating Frog
LC
Fejervarya vittigera Common Pond Frog Endemic LC
Gekko sp
Gonocephalus sp
Hylarana similis
Endemic NT
Kaloula kalingensis Kalinga Narrowmouth Toad Endemic
VU
Kaloula picta Painted narrowmouth toad Endemic
LC
Kaloula rigida Luzon narrow-mouthed frog Endemic
VU
Lamprolepis smaragdina philippinica Emerald Green Tree Skink Endemic
Limnonectes macrocephalus Luzon fanged frog
Endemic NT
Limnonectes woodworthi Woodworth's frog Endemic LC
Lycodon capucinus Indian Wolf Snake
LC
Lycodon muelleri Muller's Wolf Snake Endemic LC
Occidozyga laevis Common Puddle Frog
LC
Otosaurus cumingi Cuming's Sphenomorphus Endemic LC
Oxyrhabdium leporinum leporinum Banded Philippine Burrowing Snake
Endemic LC
Pinoyscincus abdictus aquilonius Endemic
LC
Platymantis cagayanensis
Endemic EN
Platymantis corrugatus
Endemic LC
Platymantis dorsalis
Endemic LC
Platymantis luzonensis
Endemic NT
Platymantis pygmaeus
Endemic VU
Platymantis sp

130 | ECOLOGICAL ASSESSMENTS IN THE B+WISER SITES
Scientific Name Common Name Extent of
Occurrence* IUCN
Status**
Platymantis sp seeyok
Platymantis taylori
Endemic EN
Polypedates leucomystax Common tree frog
LC
Pseudorabdion cf mcnamarae Mcnamara's Burrowing Snake Endemic VU
Ramphotyphlops braminus Brahminy blindsnake
Rhabdophis spilogaster
Endemic LC
Rhacophorus pardalis Emerald Flying Frog
LC
Rhinella marina
LC
Sanguirana luzonensis
Endemic NT
Sphenomorphus hadrus
Sphenomorphus sp
Sphenomorphus tagapayo Aurora Mountain Skink Endemic NT Trimeresurus flavomaculatus flavomaculatus Philippine Pit Viper Endemic NT *Extent of occurrence refer to the species endemic (EN) to the Philippines. **Conservation status of species according to the IUC Red List of Threatened Species (2014): Least Concern (LC), Near Threatened (NT), Endangered (EN), Vulnerable (VU), and Critically Endangered (CR)
Kaliwa – UMRBPL
Annex 1.2a.List of all floral species recorded from the survey for the proxy sites of UMRBPL-KWFR.
Shown also is the species conservation status based on IUCN 2014 and their endemicity.
Scientific Name Common Name State of
Occurrence* IUCN Status**
Polyscias nodosa Malapapaya Non Endemic NA
Nauclea orientalis Bangkal Non Endemic NA
Diospyros pilosanthera Bolong Eta Non Endemic NA
Heritiera sylvatica Dungon Non Endemic NA
Ficus balete Balite Philippine Endemic NA
Ficus variegata Tangisang Bayawak Non Endemic NA
Celtis philippinensis Malaikmo Non Endemic NA
Pterocarpus indicus Narra Non Endemic VU
Ceiba pentandra Malabulak Non Endemic NA
Samanea saman RainTree Non Endemic NA
Swietenia macrophylla Mahogany Non Endemic VU
Mitrephora lanotan Lanutan Philippine Endemic VU
Macaranga grandifolia Takip Asin Philippine Endemic VU
Canarium ovatum Pili Philippine Endemic VU
Broussonetia luzonica Himbabao Philippine Endemic NA
Syzygium cumini Duhat Non Endemic NA
Pterocymbium tinctorium Taluto Non Endemic NA
Gmelina arborea Gmelina Non Endemic NA
Ficus odorata Pakiling Philippine Endemic NA

ECOLOGICAL ASSESSMENT IN THE B+WISER SITES | 131
Scientific Name Common Name State of Occurrence*
IUCN Status**
Lagerstroemia speciosa Banaba Non Endemic NA
Ficus nota Tibig Non Endemic NA
Hopea acuminata Manggachapui Philippine Endemic CR
Antidesma bunius Bignai
*Extent of occurrence refers to the species endemic to the Philippines **Conservation status of species according to the IUC Red List of Threatened Species (2014): Least Concern (LC), Near Threatened (NT), Endangered (EN), Vulnerable (VU), and Critically Endangered (CR)
Annex 1.2b. List of all bird species from the survey for the proxy sites of UMRBPL-KWFR. Shown also
is the species conservation status based on IUCN and their occurrence in the study sites.
Scientific Name Common Name Extent of
Occurrence* IUCN
Status**
Pandion haliaetus Osprey Migratory LC
Haliastur indus Brahminy Kite Resident LC
Haliaeetus leucogaster White-bellied Sea-Eagle Resident LC
Spilornis holospilus Philippine Serpent-Eagle Endemic LC
Gallus gallus Red Junglefowl Resident LC
Turnix worcesteri Worcester's Buttonquail Endemic DD
Phapitreron leucotis White-eared Brown-Dove Endemic LC
Phapitreron amethystina Amethyst Brown-Dove Endemic LC
Ptilinopus occipitalis Yellow-breasted Fruit-Dove Endemic LC
Ptilinopus leclancheri Black-chinned Fruit-Dove Endemic LC
Ducula aenea Green Imperial-Pigeon Resident LC
Macropygia tenuirostris Philippine Cuckoo-Dove Endemic LC
Streptopelia chinensis Spotted Dove Resident LC
Geopelia striata Zebra Dove Resident LC
Chalcophaps indica Common Emerald-Dove Resident LC
Gallicolumba luzonica Luzon Bleeding-heart Endemic NT
Bolbopsittacus lunulatus Guaiabero Endemic LC
Loriculus philippensis Colasisi Endemic LC
Cacomantis merulinus Plaintive Cuckoo Resident LC
Cacomantis variolosus Brush Cuckoo Resident LC
Surniculus velutinus Philippine Drongo-Cuckoo Endemic LC
Eudynamys scolopacea Common Koel Resident LC
Phaenicophaeus cumingi Scale-feathered Malkoha Endemic LC
Phaenicophaeus superciliosus Red-crested Malkoha Endemic LC
Centropus bengalensis Lesser Coucal Resident LC
Centropus viridis Philippine Coucal Endemic LC
Centropus unirufus Rufous Coucal Endemic NT
Otus longicornis Luzon Scops-Owl Endemic NT
Otus megalotis Philippine Scops-Owl Endemic LC

132 | ECOLOGICAL ASSESSMENTS IN THE B+WISER SITES
Scientific Name Common Name Extent of
Occurrence* IUCN
Status**
Batrachostomus septimus Philippine Frogmouth Endemic LC
Eurostopodus macrotis Great Eared Nightjar Resident LC
Caprimulgus manillensis Philippine Nightjar Endemic LC
Collocalia vanikorensis Island Swiftlet Resident LC
Collocalia mearnsi Philippine Swiftlet Endemic LC
Collocalia esculenta Glossy Swiftlet Resident LC
Collocalia troglodytes Pygmy Swiftlet Endemic LC
Harpactes ardens Philippine Trogon Endemic LC
Eurystomus orientalis Dollarbird Resident LC
Alcedo atthis Common Kingfisher Migratory LC
Alcedo cyanopecta Indigo-banded Kingfisher Endemic LC
Ceyx melanurus Philippine Dwarf-Kingfisher Endemic VU
Halcyon coromanda Ruddy Kingfisher Resident LC
Halcyon smyrnensis White-throated Kingfisher Resident LC
Halcyon chloris White-collared Kingfisher Resident LC
Merops viridis Blue-throated Bee-eater Resident LC
Merops philippinus Blue-tailed Bee-eater Resident LC
Penelopides manillae Luzon Tarictic Endemic LC
Buceros hydrocorax Rufous Hornbill Endemic NT
Megalaima haemacephala Coppersmith Barbet Resident LC
Dendrocopos maculatus Philippine Pygmy Woodpecker Endemic LC
Mulleripicus funebris Sooty Woodpecker Endemic LC
Dryocopus javensis White-bellied Woodpecker Resident LC
Pitta erythrogaster Red-bellied Pitta Resident LC
Pitta sordida Hooded Pitta Resident LC
Hirundo tahitica Pacific Swallow Resident LC
Coracina striata Bar-bellied Cuckoo-shrike Resident LC
Pycnonotus goiavier Yellow-vented Bulbul Resident LC
Pycnonotus urostictus Yellow-wattled Bulbul Endemic LC
Hypsipetes philippinus Philippine Bulbul Endemic LC
Dicrurus balicassius Balicassiao Endemic LC
Oriolus chinensis Black-naped Oriole Resident LC
Irena cyanogaster Philippine Fairy-Bluebird Endemic LC
Corvus macrorhynchos Large-billed Crow Resident LC
Parus elegans Elegant Tit Endemic LC
Stachyris striata Luzon Striped-Babbler Endemic NT
Brachypteryx montana White-browed Shortwing Resident LC
Copsychus saularis Oriental Magpie-Robin Resident LC
Copsychus luzoniensis White-browed Shama Endemic LC
Megalurus timoriensis Tawny Grassbird Resident LC

ECOLOGICAL ASSESSMENT IN THE B+WISER SITES | 133
Scientific Name Common Name Extent of
Occurrence* IUCN
Status**
Orthotomus castaneiceps Philippine Tailorbird Endemic LC
Hypothymis azurea Black-naped Monarch Resident LC
Lanius schach Long-tailed Shrike Resident LC
Lanius cristatus Brown Shrike Migratory LC
Aplonis panayensis Asian Glossy Starling Resident LC
Sarcops calvus Coleto Endemic LC
Anthreptes malacensis Plain-throated Sunbird Resident LC
Nectarinia jugularis Olive-backed Sunbird Resident LC
Nectarinia sperata Purple-throated Sunbird Resident LC
Aethopyga shelleyi Lovely Sunbird Endemic LC
Arachnothera clarae Naked-faced Spiderhunter Endemic LC
Prionochilus olivaceus Olive-backed Flowerpecker Endemic LC
Dicaeum anthonyi Flame-crowned Flowerpecker Endemic NT
Dicaeum australe Red-keeled Flowerpecker Endemic LC
Dicaeum hypoleucum Buzzing Flowerpecker Endemic LC
Dicaeum trigonostigma Orange-bellied Flowerpecker Resident LC
Dicaeum pygmaeum Pygmy Flowerpecker Endemic LC
Zosterops meyeni Lowland White-eye Endemic LC
Passer montanus Eurasian Tree Sparrow Resident LC
Lonchura leucogastra White-bellied Munia Resident LC
Lonchura punctulata Scaly-breasted Munia Resident LC
Lonchura atricapilla Black-headed Munia Resident LC
*Extent of occurrence refers to the species endemic to the Philippines **Conservation status of species according to the IUC Red List of Threatened Species (2014): Least Concern (LC), Near Threatened (NT), Endangered (EN), Vulnerable (VU), and Critically Endangered (CR).

134 | ECOLOGICAL ASSESSMENTS IN THE B+WISER SITES
Annex.1.2c. List of all mammal species recorded from the survey for the proxy sites of UMRBPL-
KWFR. Shown also is the species conservation status based on IUCN and their occurrence in the study
sites.
Scientific Name Common name Extent of
Occurrence*
Threat Level**
IUCN CITES DAO
Cynopterus brachyotis Common Short-nosed Fruit Bat Common LC NA NA
Ptenochirus jagori Greater Musky Fruit Bat Philippine
Endemic
LC NA NA
Eonycteris spelaea Common Dawn Bat Common LC NA NA
Eonycteris robusta Philippine Nectar Bat Philippine Endemic
NT NA NA
Haplonycteris fischeri Philippine Pygmy Fruit Bat Philippine Endemic
LC NA NA
Rousettus
amplexicaudatus
Geoffroy’s Rousette Common LC NA NA
Macroglossus minimus Lesser Long-tongued Fruit Bat Common LC NA NA
Hipposideros diadema Diadem Leaf-nosed Bat Common LC NA NA
Megaderma spasma Lesser False Vampire Common LC NA NA
Rhinolophus arcuatus Arcuate Horseshoe Bat Common LC NA NA
Saccolaimus
saccolaimus
Bare-rumped Sheathtail Bat Common LC NA NA
Tylonycteris pachypus Lesser Bamboo Bat Common LC NA NA
Tylonycteris robustula Greater Flat-headed Bat Common LC NA NA
Octopterupus
cartilagonodus
Luzon Fruit Bat Luzon Endemic LC NA NA
Kerivoula whiteheadi Whitehead’s Woolly Bat Common LC NA NA
*Extent of occurrence refers to the species endemic to the Philippines or non-endemics **Conservation status of species according to the IUC Red List of Threatened Species (2014): Least Concern (LC), Near Threatened (NT), Endangered (EN), Vulnerable (VU), and Critically Endangered (CR).
Annex 1.2d. List of all amphibian species recorded from the survey for the proxy sites of UMRBPL-
KWFR. Shown also is the species conservation status based on IUCN and their occurrence in the study
sites.
Scientific Name Common Name Extent of Occurrence* Threat Level**
IUCN CITES DAO
Rhinella marina Cane Toad Widespread LC NA NA
Platymantis corrugatus Masked Wrinkled Ground Frog
Philippine Endemic LC NA NA
Platymantis dorsalis Whistling Wrinkled Ground Frog
Philippine Endemic LC NA NA
Platymantis mimulus Husky-voiced Wrinkled Ground Frog
Luzon PAIC Endemic
NT NA NA

ECOLOGICAL ASSESSMENT IN THE B+WISER SITES | 135
Scientific Name Common Name Extent of Occurrence* Threat Level**
IUCN CITES DAO
Limnonectes macrocephalus
Luzon Fanged Frog
Luzon PAIC Endemic
NT NA NA
Limnonectes woodworthi Luzon Swamp Frog Luzon PAIC Endemic
LC NA NA
Occidozyga laevis Common Puddle Frog Widespread
LC NA NA
Kaloula pulchra Asiatic Painted Narrowmouth Toad
Widespread
LC NA NA
Hylarana erythraea Green Paddy Frog Widespread
LC NA NA
Hylarana similis Luzon Striped Stream Frog
Luzon PAIC Endemic NT NA NA
Hylarana signata Spotted Stream Frog Widespread
LC NA NA
Polypedates leucomystax Asiatic Tree Frog Widespread
LC NA NA
*Extent of occurrence refers to the species endemic to the Philippines or non-endemics **Conservation status of species according to the IUC Red List of Threatened Species (2014): Least Concern (LC), Near Threatened (NT), Endangered (EN), Vulnerable (VU), and Critically Endangered (CR).
Annex 1.2e. List of all reptile species recorded from the survey for the proxy sites of UMRBPL-KWFR.
Shown also is the species conservation status based on IUCN and their occurrence in the study sites.
Scientific Name Common Name Extent of
Occurrence*
Threat Level**
IUCN CITES DAO
Bronchocela cristatella Green crested Lizard Widespread NA NA NA
Draco spilopterus Philippine Flying Dragon Luzon PAIC Endemic NA NA NA
Gonocephalus sophiae Negros Forest Dragon Philippine Endemic DD NA NA
Cyrtodactylus philippinicus
Philippine Bent-toed Gecko Philippine Endemic LC NA NA
Gekko gecko Tokay Gecko Widespread
NA NA NA
Hemidactylus frenatus Common House Gecko
Widespread
NA NA NA
Lepidodactylus lugubris Common Smooth-Scaled Gecko
Widespread
NA NA NA
Eutropis multicarinata Many-keeled Mabuya Widespread
NA NA NA

136 | ECOLOGICAL ASSESSMENTS IN THE B+WISER SITES
Scientific Name Common Name Extent of
Occurrence*
Threat Level**
IUCN CITES DAO
Pinoyscincus jagori Jagor's Sphenomorphus Philippine Endemic NA NA NA
Ahaetulla prasina Gunther's Whip Snake Widespread
LC NA NA
Boiga dendrophila Mangrove Cat Snake Widespread
NA NA NA
Boiga cynodon Dog-toothed Cat Snake Widespread
LC NA NA
Calamaria bitorques Banded Worm Snake Luzon PAIC Endemic LC NA NA
Malayotyphlops ruficaudus
Red-headed Worm Snake Luzon PAIC Endemic LC NA NA
Trimeresurus flavomaculatus
Philippine Pit Viper Philippine Endemic LC NA NA
*Extent of occurrence refers to the species endemic to the Philippines or non-endemics
**Conservation status of species according to the IUC Red List of Threatened Species (2014): Least
Concern (LC), Near Threatened (NT), Endangered (EN), Vulnerable (VU), and Critically Endangered
(CR).
NLNP
Annex 1.3a. List of bird species in NLNP used for the ecological assessment as collected from the
Philippine National Museum, California Academy of Sciences, Field Museum of Natural History and
Kansas University.
Scientific Name Common Name Extent of Occurrence* IUCN
Status**
Anas luzonica Philippine Duck Philippine Endemic
VU
Cacatua haematuropygia Philippine Cockatoo, Red-vented Cockatoo
Philippine Endemic CR
Centropus steerii Black-hooded Coucal Mindoro Island CR
Dicaeum retrocinctum Scarlet-collared Flowerpecker Philippine Endemic
VU
Ducula carola Spotted Imperial-pigeon Philippine Endemic
VU
Ducula mindorensis Mindoro Imperial-pigeon Mindoro Island
EN
Gallicolumba platenae Mindoro Bleeding-heart Mindoro Island
CR
Penelopides mindorensis Mindoro Hornbill Mindoro Island
EN
Zoothera cinerea Ashy Thrush Philippine Endemic VU
*Extent of occurrence refers to the species endemic to the Philippines or non-endemics. **Conservation status of species according to the IUC Red List of Threatened Species (2014): Least Concern (LC), Near Threatened (NT), Endangered (EN), Vulnerable (VU), and Critically Endangered (CR).

ECOLOGICAL ASSESSMENT IN THE B+WISER SITES | 137
Annex 1.3b. List of amphibians in NLNP used for the ecological assessment as collected from the
Philippine National Museum, California Academy of Sciences, Field Museum of Natural History and
Kansas University.
Scientific Name Common Name Extent of
Occurrence* IUCN
Status**
Fejervarya cancrivora Asian Brackish Frog Southeast Asia LC
Fejervarya moodiei Brackish Frog Philippines DD
Fejervarya vittigera Philippine Grass Frog Philippines LC
Hoplobatrachus rugulosus Chinese Tiger Frog Southeast Asia LC
Hylarana mangyanum Mindoro Striped Stream Frog Mindoro Island EN
Kaloula conjuncta Narrowmouth Toad Philippines LC
Kaloula picta Philippine Painted Narrowmouth Philippines LC Leptobrachium mangyanorum Mindoro Litter Frog Mindoro Island NA
Limnonectes acanthi Palawan Fanged Frog Palawan and Mindoro VU
Limnonectes visayanus Visayan Fanged Frog Negros-Panay PAIC VU
Occidozyga laevis laevis Philippine Oriental Frog Southeast Asia LC
Pelophryne brevipes Western Mindanao Dwarf Toad Mindanao PAIC LC
Philautus schmackeri Mindoro Bush Frog Mindoro Island EN
Platymantis corrugatus Masked Wrinkled Ground Frog Philippine Endemic LC
Platymantis dorsalis Whistling Wrinkled Ground Frog Philippine Endemic LC
Rhacophorus bimaculatus Mindanao Flying Frog Philippine Endemic VU
Rhinella marina Cane Toad Widely Distributed LC
*Extent of occurrence refers to the species endemic to the Philippines or non-endemics **Conservation status of species according to the IUC Red List of Threatened Species (2014): Least Concern (LC), Near Threatened (NT), Endangered (EN), Vulnerable (VU), and Critically Endangered (CR).
Annex 1.3c. List of amphibians in NLNP used for the ecological assessment as collected from the
Philippine National Museum, California Academy of Sciences, Field Museum of Natural History and
Kansas University.
Scientific Name Common Name Extent of
Occurrence* IUCN
Status**
Brachymeles bonitae Stub-limbed Burrowing Skink Philippine Endemic LC
Brachymeles mindorensis Mindoro Short-legged Skink Mindoro Island NA
Bronchocela cristatella Green crested lizard Southeast Asia NA
Calamaria gervaisi Gervais' Worm Snake Philippine Endemic LC
Cosymbotus platyurus Flat-tailed House Gecko Southeast Asia NA
Cyclocorus lineatus Northern Triangle-spotted Snake Negros-Panay PAIC LC
Cyrtodactylus jambangan
Southeast Asia NA
Cyrtodactylus philippinicus Philippine Bow-fingered Gecko Southeast Asia NA
Dendrelaphis fuliginosus
Negros-Panay PAIC NA
Eutropis indeprensa Brown's Mabuya Southeast Asia NA
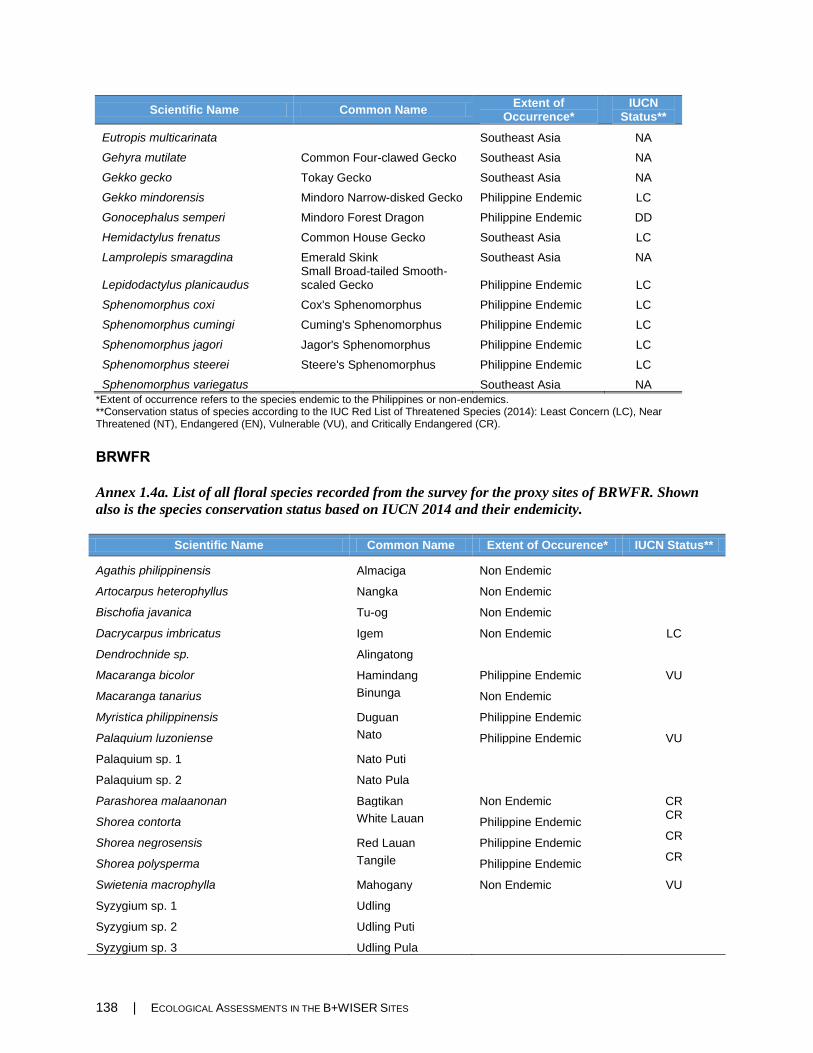
138 | ECOLOGICAL ASSESSMENTS IN THE B+WISER SITES
Scientific Name Common Name Extent of
Occurrence* IUCN
Status**
Eutropis multicarinata
Southeast Asia NA
Gehyra mutilate Common Four-clawed Gecko Southeast Asia NA
Gekko gecko Tokay Gecko Southeast Asia NA
Gekko mindorensis Mindoro Narrow-disked Gecko Philippine Endemic LC
Gonocephalus semperi Mindoro Forest Dragon Philippine Endemic DD
Hemidactylus frenatus Common House Gecko Southeast Asia LC
Lamprolepis smaragdina Emerald Skink Southeast Asia NA
Lepidodactylus planicaudus Small Broad-tailed Smooth-scaled Gecko Philippine Endemic LC
Sphenomorphus coxi Cox's Sphenomorphus Philippine Endemic LC
Sphenomorphus cumingi Cuming's Sphenomorphus Philippine Endemic LC
Sphenomorphus jagori Jagor's Sphenomorphus Philippine Endemic LC
Sphenomorphus steerei Steere's Sphenomorphus Philippine Endemic LC
Sphenomorphus variegatus Southeast Asia NA
*Extent of occurrence refers to the species endemic to the Philippines or non-endemics. **Conservation status of species according to the IUC Red List of Threatened Species (2014): Least Concern (LC), Near Threatened (NT), Endangered (EN), Vulnerable (VU), and Critically Endangered (CR).
BRWFR
Annex 1.4a. List of all floral species recorded from the survey for the proxy sites of BRWFR. Shown
also is the species conservation status based on IUCN 2014 and their endemicity.
Scientific Name Common Name Extent of Occurence* IUCN Status**
Agathis philippinensis Almaciga Non Endemic
Artocarpus heterophyllus Nangka Non Endemic
Bischofia javanica Tu-og Non Endemic
Dacrycarpus imbricatus Igem Non Endemic LC
Dendrochnide sp. Alingatong
Macaranga bicolor Hamindang Philippine Endemic VU
Macaranga tanarius Binunga Non Endemic
Myristica philippinensis Duguan Philippine Endemic
Palaquium luzoniense Nato Philippine Endemic VU
Palaquium sp. 1 Nato Puti
Palaquium sp. 2 Nato Pula
Parashorea malaanonan Bagtikan Non Endemic CR
Shorea contorta White Lauan Philippine Endemic CR
Shorea negrosensis Red Lauan Philippine Endemic CR
Shorea polysperma Tangile Philippine Endemic CR
Swietenia macrophylla Mahogany Non Endemic VU
Syzygium sp. 1 Udling
Syzygium sp. 2 Udling Puti
Syzygium sp. 3 Udling Pula

ECOLOGICAL ASSESSMENT IN THE B+WISER SITES | 139
Scientific Name Common Name Extent of Occurence* IUCN Status**
Syzygium sp. 4 Udling Pinhan
Syzygium sp. 5 Udling Malabahi Syzygium sp. 6 Udling lanahan
Syzygium sp. 7 Udling Tagabinlod
Syzygium sp. 8 Udling Tisa
Syzygium sp. 9 Ublas
Tristaniopsis decorticata Malabayabas Non Endemic
List of species that are only identified through their common or local names
Agumit Baslayan Koldemon Rod Tree
Ahos-ahos Batikuling Labnog Tabayog
Alowhaw Bay-ang Laco Laco Tagi lumboy
Anagdong Bay-ang Lantuan Lambunao Tago Santol
Anilaw Bay-ang lantuhan Lawi-lawi Tago-Binlod
Bagobinlod Bay-ang Puti Malaiba Tagosantol
Baguilumboy Beri Malatabaco Talot
Bahai Bulo Bacado Malatisa Taulay
Bakan Coldemon Manudtod Tulan manok
Bakan mandulawnun Dalaquit Mindang/Anilaw Tulo Tabako
Bakan Puti Habon-habon Ngot-ngotan Ulo-Anonang
Bakan yellow Halpo Pangguom Wilti green
Balabaga Haras Panubol
Balukanag Kabal Tree Pitik-pitik
*Extent of occurrence refers to the species endemic (EN) to the Philippines. **Conservation status of species according to the IUC Red List of Threatened Species (2014): Least Concern (LC), Near Threatened (NT), Endangered (EN), Vulnerable (VU), and Critically Endangered (CR)
Annex 1.4.b List of birds recorded in BRWFR during the ecological assessment, their threat status and
extent of occurrence.
Scientific Name Common Name Extent of
Occurrence
SB, Bagong Silang
BC, Mailum
IUCN Status
Bubulcus ibis coromandus Cattle Egret Resident
LC
Haliastur indus intermedius Brahminy Kite Resident
LC
Accipiter soloensis Chinese Goshawk Migratory
LC
Accipiter trivirgatus extimus Crested Goshawk Resident
LC
Spilornis holospilus Philippine Serpent-Eagle Endemic
LC
Spizaetus philippensis pinskeri Philippine Hawk-Eagle Endemic
VU
Gallus gallus Red Junglefowl Introduced
LC
Phapitreron leucotis nigrorum White-eared Brown-Dove
Endemic LC
Phapitreron amethystina maculipectus Amethyst Brown-Dove
Endemic LC

140 | ECOLOGICAL ASSESSMENTS IN THE B+WISER SITES
Scientific Name Common Name Extent of
Occurrence
SB, Bagong Silang
BC, Mailum
IUCN Status
Ptilinopus occipitalis occipitalis Yellow-breasted Fruit-Dove
Endemic LC
Ptilinopus leclancheri Black-chinned Fruit-Dove
Endemic
LC
Ducula poliocephala Pink-bellied Imperial-Pigeon
Endemic VU
Columba vitiensis anthracina Metallic Imperial-Pigeon Resident
LC
Macropygia tenuirostris tenuirostris
Philippine Cuckoo-Dove Endemic
LC
Streptopelia chinensis Spotted Dove Resident
LC
Geopelia striata striata Zebra Dove Intro
LC
Chalcophaps indica indica Common Emerald-Dove Resident
LC
Gallicolumba keayi Negros Bleeding-heart Negros-Panay
LC Tanygnathus lucionensis salvadorii Blue-naped Parrot Endemic
LC
Tanygnathus sumatranus Blue-backed Parrot Resident
LC
Loriculus philippensis regulus Colasisi Endemic
LC
Cacomantis merulinus Plaintive Cuckoo Resident
LC
Cacomantis variolosus Brush Cuckoo Resident
LC
Eudynamys scolopacea Common Koel Resident
LC
Centropus bengalensis Lesser Coucal Resident
LC
Centropus viridis Philippine Coucal Endemic
LC
Otus megalotis Philippine Scops-Owl Endemic
LC
Batrachostomus septimus Philippine Frogmouth Endemic
LC
Caprimulgus manillensis Philippine Nightjar Endemic
LC
Collocalia mearnsi Philippine Swiftlet Endemic
LC
Collocalia esculenta Glossy Swiftlet Resident
LC
Collocalia troglodytes Pygmy Swiftlet Endemic
LC
Alcedo cyanopecta Indigo-banded Kingfisher
Endemic LC
Ceyx lepidus Variable Kingfisher Resident
LC
Ceyx erithacus Oriental Kingfisher Resident
LC
Halcyon smyrnensis White-throated Kingfisher
Resident
LC
Halcyon winchelli Rufous-lored Kingfisher Endemic
LC
Halcyon chloris White-collared Kingfisher Resident
LC
Actenoides lindsayi Spotted Wood-Kingfisher Endemic
LC
Merops viridis Blue-throated Bee-eater
Resident
LC
Merops philippinus Blue-tailed Bee-eater Resident
LC
Penelopides panini Visayan Hornbill Negros-Panay
EN
Buceros hydrocorax Rufous Hornbill Endemic
NT

ECOLOGICAL ASSESSMENT IN THE B+WISER SITES | 141
Scientific Name Common Name Extent of
Occurrence
SB, Bagong Silang
BC, Mailum
IUCN Status
Megalaima haemacephala Coppersmith Barbet Resident
LC
Dendrocopos maculatus Philippine Pygmy Woodpecker Endemic
LC
Dryocopus javensis White-bellied Woodpecker
Resident LC
Chrysocolaptes lucidus Greater Flameback Resident
LC
Pitta erythrogaster Red-bellied Pitta Resident
LC
Pitta sordida Hooded Pitta Resident
LC
Hirundo rustica Barn Swallow Migratory
LC
Hirundo tahitica Pacific Swallow Resident
LC
Coracina striata Bar-bellied Cuckoo-shrike
Resident LC
Coracina ostenta White-winged Cuckoo-shrike Negros-Panay
VU
Lalage nigra Pied Triller Resident
LC
Pericrocotus divaricatus Ashy Minivet Migratory
LC
Pericrocotus flammeus Scarlet Minivet Resident
LC
Pycnonotus goiavier Yellow-vented Bulbul Resident
LC
Pycnonotus urostictus Yellow-wattled Bulbul Endemic
LC
Ixos philippinus Philippine Bulbul Endemic
LC
Dicrurus balicassius Balicassiao Endemic
LC
Oriolus steerii Philippine Oriole Endemic
LC
Oriolus chinensis Black-naped Oriole Resident
LC
Corvus macrorhynchos Large-billed Crow Resident
LC
Parus elegans Elegant Tit Endemic
LC
Sitta oenochlamys Sulphur-billed Nuthatch
Endemic LC
Stachyris speciosa Flame-templed Babbler Negros-Panay
LC
Stachyris nigrorum Negros Striped-Babbler Negros-Panay
EN
Brachypteryx montana White-browed Shortwing Resident
LC
Luscinia calliope Siberian Rubythroat Migratory
LC
Copsychus saularis Oriental Magpie-Robin Resident
LC
Copsychus luzoniensis White-browed Shama Endemic
LC
Phylloscopus borealis Arctic Warbler Migratory
LC
Phylloscopus olivaceus Philippine Leaf-Warbler
Endemic
LC
Phylloscopus cebuensis Lemon-throated Leaf-Warbler
Endemic
LC
Megalurus timoriensis Tawny Grassbird Resident
LC
Orthotomus castaneiceps Philippine Tailorbird Endemic
LC
Eumyias panayensis Mountain Verditer-Flycatcher
Resident
LC
Ficedula hyperythra nigrorum Snowy-browed Flycatcher
Resident LC

142 | ECOLOGICAL ASSESSMENTS IN THE B+WISER SITES
Scientific Name Common Name Extent of
Occurrence
SB, Bagong Silang
BC, Mailum
IUCN Status
Culicicapa helianthea Citrine Canary-Flycatcher
Resident LC
Rhipidura javanica Pied Fantail Resident
LC
Rhipidura cyaniceps Blue-headed Fantail Endemic
LC
Terpsiphone cinnamomea Rufous Paradise-Flycatcher
Resident
LC
Hypothymis azurea Black-naped Monarch Resident
LC
Hypothymis coelestis Celestial Monarch Endemic
VU
Pachycephala homeyeri White-vented Whistler Endemic
LC
Motacilla cinerea Grey Wagtail Migratory
LC
Motacilla flava Yellow Wagtail Migratory
LC
Lanius schach Long-tailed Shrike Resident
LC
Lanius cristatus Brown Shrike Migratory
LC
Aplonis panayensis Asian Glossy Starling Resident
LC
Sarcops calvus Coleto Endemic
LC
Acridotheres cristatellus Crested Myna Introduced
LC
Anthreptes malacensis Plain-throated Sunbird Resident
LC
Nectarinia jugularis Olive-backed Sunbird Resident
LC
Nectarinia sperata Purple-throated Sunbird
Resident
LC
Aethopyga flagrans Flaming Sunbird Endemic
LC
Aethopyga shelleyi Lovely Sunbird Endemic
LC
Aethopyga siparaja Crimson Sunbird Resident
LC
Dicaeum aeruginosum Striped Flowerpecker Endemic
LC
Dicaeum bicolor Bicolored Flowerpecker
Endemic
LC
Dicaeum trigonostigma Orange-bellied Flowerpecker
Resident
LC
Dicaeum ignipectus Fire-breasted Flowerpecker
Resident
LC
Dicaeum pygmaeum Pygmy Flowerpecker Endemic
LC
Zosterops nigrorum Yellowish White-eye Endemic
LC
Zosterops montanus Mountain White-eye Resident
LC
Passer montanus Eurasian Tree Sparrow Introduced
LC
Lonchura leucogastra White-bellied Munia Resident
LC
Lonchura punctulata Scaly-breasted Munia Resident
LC
Lonchura atricapilla Black-headed Munia Resident
LC
*Extent of occurrence refers to the species endemic to the Philippines **Conservation status of species according to the IUC Red List of Threatened Species (2014): Least Concern (LC), Near Threatened (NT), Endangered (EN), Vulnerable (VU), and Critically Endangered (CR).
MKRNP

ECOLOGICAL ASSESSMENT IN THE B+WISER SITES | 143
Annex 1.5a. List of trees recorded in MKRNP during the ecological assessment, their threat status and
extent of occurrence.
Scientific Name Common
Name Extent of Occurrence* Baungon Libona Lantapan Lupiagan
IUCN Status**
Acalypha cardiophylla Non endemic
Acer laurinum Philippine Maple
Non endemic
Afzelia rhomboidea Tindalo Non endemic VU
Agathis dammara Non endemic VU
Alseodaphne philippinensis Boga Mindanao endemic
Alstonia scholaris Batino Non endemic LC
Aphanamixis polystachya Kangko Introduced LC
Aquilaria sp. Non endemic
Artocarpus heterophyllus Nangka Introduced
Astrocalyx calycina Tanghau Philippine endemic
Astronia megalantha Philippine endemic
Breynia cernua Matang-katang
Non endemic
Calliandra haematocephala Fireball Introduced
Calophyllum inophyllum Bitaog Non endemic LC
Canarium asperum Pagsahingin Philippine endemic LC
Cassia javanica Introduced
Castanopsis philippensis Philippine chestnut
Philippine endemic
Casuarina equisitifolia Agoho Non endemic
Cinchona calisaya Quinine Cultivated
Cinnamomum mercadoi Kalingag Philippine endemic VU
Dacrycarpus imbricarus Igem Non endemic LC
Dacrycarpus cumingii Cumingi Igem
Non endemic LC
Dacryodes rostrata Lunai Non endemic LC
Decaspermum parviflorum Non endemic
Dendrocnide stimulans Lingaton Philippine endemic
Dillenia philippinensis Katmon Philippine endemic VU
Dodonaea angustifolia Non endemic
Durio zibethinus Durian Introduced
Elaeocarpus angustifolius Non endemic
Magnolia pubescens Mindanao endemic DD
Erythrina subumbrans Rarang Non endemic
Eucalyptus deglupta Bagras Non endemic
Eugenia aherniana Non endemic
Eusideroxylon zwageri Non endemic VU
Melicope mindanaensis Liuaan Mindanao endemic
Ficus botryocarpa Non endemic
Ficus callosa Kalukoi Non endemic

144 | ECOLOGICAL ASSESSMENTS IN THE B+WISER SITES
Scientific Name Common
Name Extent of Occurrence* Baungon Libona Lantapan Lupiagan
IUCN Status**
Ficus heteropleura Kalapat Non endemic
Ficus involucrata Agosahis Non endemic
Ficus minahassae Hagimit Endemic
Ficus nota Tibig Non endemic
Gmelina arborea Gmelina Introduced
Gnetum gnemon Bago Non endemic LC
Guioa keolreuteria Alahan Non endemic
Omalanthus macradenius Philippine endemic
Lagerstroemia speciosa Banaba Non endemic
Leucaena leucocephala Ipil-ipil Introduced
Limnophila rugosa Non endemic LC
Lithocapus philippinensis Pangan-bundok
Non endemic
Lithocarpus celebicus Celebes Oak Non endemic
Maesopsis eminii Introduced
Mallotus molissimus Hinlaumo Non endemic
Mangifera indica Mango Introduced DD
Melastoma setosum Mindanao endemic
Melia azedarach Cultivated
Melicope mindanaensis Liuaan Mindanao endemic
Myrica javanica Hindang Non endemic
Palaquium polyandrum Tipurus Philippine endemic
Palaquium tenuipetiolatum Maniknik Non endemic
Paraserianthes falcataria Moluccan Sau
Introduced
Parasponia rugosa Hanagdong Non endemic
Persea americana Avocado Introduced
Phyllocadus hypophyllus Non endemic
Phyllocadus hypophyllus Non endemic
Podocarpus rumphii Malakauayan Non endemic NT
Pterocarpus indicus Narra Non endemic VU
Pterocymbium tinctorium Taluto Non endemic
Sandoricum koetjape Santol Introduced
Schefflera bukidnonensis Mindanao endemic
Shorea negrosensis Red Lauan Philippine endemic CE
Shorea polysperma Tangile Philippine endemic CE
Spathodea campanualata African Tulip Introduced
Sweitenia macrophylla Mahogany Introduced VU
Syzygium decipiens Malaruhat-pula
Non endemic
Syzygium nitidum Makaasim Non endemic
Syzygium astronioides Langauisan Philippine endemic
Toona calantas Kalantas Non endemic DD

ECOLOGICAL ASSESSMENT IN THE B+WISER SITES | 145
Scientific Name Common
Name Extent of Occurrence* Baungon Libona Lantapan Lupiagan
IUCN Status**
Trema orientalis Anabiong Non endemic
Tristianopsis decorticata Malabayabas Philippine endemic
Vatica odorata Narig Philippine endemic
Weinmannia urdanetensis Non endemic
*Extent of occurrence refers to the species endemic to the Philippines or non-endemics. **Conservation status of species according to the IUC Red List of Threatened Species (2014): Least Concern (LC), Near Threatened (NT), Endangered (EN), Vulnerable (VU), and Critically Endangered (CR).
Annex 1.5b. List of birds recorded in MKRNP during the ecological assessment, their threat status and
extent of occurrence.
Scientific name Common
Name Extent of
Occurrence* Baungon Libona Lantapan Lupiagan
IUCN Status**
Actenoides hombroni
Blue-capped kingfisher
Mindanao endemic VU
Aethopyga primigenia Grey-hooded sunbird
Mindanao endemic NT
Amaurornis phoenicurus White-breasted waterhen
Resident LC
Aplonis panayensis
Asian Glossy Starling
Resident LC
Basilornis mirandus
Apo Myna Mindanao endemic NT
Brachpyteryx montana White-browed shortwing
Resident LC
Butastur indicus
Grey-faced buzzard
Migratory LC
Cacomantis variolosus
Brush Cuckoo Resident LC
Caprimulgus manillensis Philippine nightjar
Resident LC
Centropus viridis
Philippine Coucal
Philippine endemic LC
Chloropsis flavipennis
Philippine leafbird
Philippine endemic VU
Chrysocolaptes lucidus Buff-spotted flameback
Resident LC
Collocalia esculenta
Glossy swiftlet Resident LC
Collocalia troglodytes
Pygmy swiftlet Philippine endemic LC
Copsychus saularis
Oriental Magpie-Robin
Resident LC
Cuculus fugax
Hodgson's hawk cuckoo
Resident LC
Dendrocopos maculatus Philippine pygmy woodpecker
Philippine endemic LC
Dicaeum anthonyi
Flame-crowned flowerpecker
Philippine endemic NT
Dicaeum australe
Red-keeled flowerpecker
Philippine endemic LC
Dicaeum hypoleucum
Buzzing flowerpecker Philippine endemic LC
Dicaeum trigonostigma Orange-bellied Resident LC

146 | ECOLOGICAL ASSESSMENTS IN THE B+WISER SITES
Scientific name Common
Name Extent of
Occurrence* Baungon Libona Lantapan Lupiagan
IUCN Status**
flowerpecker
Dicaeum pygmaeum
Pygmy flowerpecker
Philippine endemic LC
Dicrurus bracteatus
Spangled Drongo
Resident LC
Dryocopus javensis
White-bellied woodpecker
Resident LC
Eumyias panayensis Island flycatcher
Resident LC
Erythrura coloria
Red eared parrotfinch
Mindanao endemic NT
Eurystomus orientalis Oriental dollarbird
Resident LC
Ficedula hyperythra
Snowy-browed flycatcher
Resident LC
Ficedula westermanni Little Pied flycatcher
Resident LC
Gallus gallus Red junglefowl Resident LC
Harpactes ardens Philippine Trogon
Philippine endemic LC
Hemiprocne comate
Whiskered treeswift
Resident LC
Hypocryptadius cinnamomeus
Cinnamon Ibon
Mindanao endemic LC
Hypothymis helenae
Short-crested monarch
Philippine endemic NT
Hypothymis azurea Black-naped monarch
Resident LC
Hypothymis coelestis
Celestial Monarch
Philippine endemic VU
Irena cyanogastra
Philippine fairy-bluebird
Philippine endemic NT
Ixos philippinus
Philippine Bulbul
Philippine endemic LC
Lanius cristatus Brown shrike Migratory LC
Lanius schach Long-tailed shrike
Resident LC
Lonchura atricapilla Chestnut munia
Resident LC
Lophozosterops goodfellowi
Black-masked white-eye
Mindanao endemic LC
Loriculus philippensis
Philippine hanging-parrot
Philippine endemic LC
Macronous striaticeps
Brown tit-babbler
Philippine endemic LC
Macropygia tenuirostris Philippine Cuckoo-dove
Resident LC
Psilopogon haemacephalus
Coppersmith barbet
Resident LC
Megalurus palustris Striated Grassbird
Resident LC
Megalurus timoriensis Tawny grassbird
Resident LC
Motacilla flava Yellow wagtail Migratory LC
Muscicapa greseisticta
Grey streaked flycatcher
Migratory LC
Nectarinia jugularis Olive-backed Resident LC

ECOLOGICAL ASSESSMENT IN THE B+WISER SITES | 147
Scientific name Common
Name Extent of
Occurrence* Baungon Libona Lantapan Lupiagan
IUCN Status**
sunbird
Ninox philippensis
Mindanao boobook
Mindanao endemic NT
Nisaetus pinskeri
South Philippine Hawk-eagle
Philippine endemic EN
Orthotomus castaneiceps Philippine tailorbird
Philippine endemic LC
Orthotomus cuculatus Mountain tailorbird
Resident LC
Pachycephala philippensis Yellow-bellied whistler
Philippine endemic LC
Parus elegans
Elegant tit Philippine endemic LC
Penelopides affinis
Mindanao hornbill
Mindanao endemic LC
Pericocrotus flammeus Scarlet Minivet Resident LC
Pernis ptilorhynchus
Oriental Honey-buzzard
Resident LC
Phaphitreron amethystinus
Amethyst brown-dove
Philippine endemic LC
Phaphitreron leucotis
White-eared brown-dove
Philippine endemic LC
Phylloscopus olivaceus Philippine leaf-warbler
Philippine endemic LC
Pithecophaga jefferyi
Philippine eagle
Philippine endemic CR
Prioniturus discurus
Blue-crowned raquet-tail
Philippine endemic LC
Ramphiculus lechlancheri Black-chinned fruit-dove
Resident LC
Ramphiculus occipitalis Yellow-breasted fruit-dove
Philippine endemic LC
Pycnonotus goaivier Yellow vented bulbul
Resident LC
Pyrrhula leucogenis
White-cheeked bullfinch
Philippine endemic LC
Rhinomyias goodfellowi Slaty-backed jungle-flycatcher
Mindanao endemic NT
Rhipidura nigrocinnamomea
Black-and-cinnamon fantail
Philippine endemic LC
Sarcops calvus
Coleto Philippine endemic LC
Saxicola caprata Pied bushchat Resident LC
Scolopax bukidnonensis Philippine woodcock
Philippine endemic LC
Sitta oenochlamys
Sulphur-billed nuthatch
Resident LC
Spilornis holospilus
Philippine serpent-eagle
Philippine endemic LC
Turdus obscurus Eyebrowed thrush
Migratory LC

148 | ECOLOGICAL ASSESSMENTS IN THE B+WISER SITES
Scientific name Common
Name Extent of
Occurrence* Baungon Libona Lantapan Lupiagan
IUCN Status**
Turdus poliocephalus Island Thrush Resident LC
Zosterops montanus Mountain white-eye
Resident LC
Arachnothera clarae
Naked-faced Spiderhunter
Philippine endemic LC
Centropus melanops
Black-faced Coucal
Mindanao endemic LC
Corasina mindanensis
Black-bibbed Cuckoo-shrike
Philippine endemic VU
Dicaeum bicolor
Bicoloured Flowerpecker
Philippine endemic LC
Lonchura leucogastra White-bellied Munia
Resident LC
Nectarinia sperata
Purple-throated Sunbird
Resident LC
Pachycephala homeyeri White-vented Whistler
Resident LC
Phapitreron brunneiceps Dark-eared Brown-Dove
Mindanao endemic VU
Prioniturus montanus
Montane Racquet-tail
Philippine endemic NT
Rhabdotorrhinus leucocephalus
Writhed Hornbill
Mindanao endemic NT
Rhipidura superciliaris Blue Fantail Philippine endemic LC
Anthreptes malacensis Plain-throated sunbird
Resident LC
Columba vitiensis
Metallic pigeon
Resident LC
Cuculos micropterus Indian Cuckoo migratory LC
Microhierax erythrogenys Philippine Falconet
Philippine endemic LC
Aplonis minor Short tailed starling
Resident LC
Artamus leucorynchus
White breasted woodswallow
Resident LC
Batrachostomus septimus Philippine frogmouth
Philippine endemic LC
Chalcophaps indica
Grey-capped emerald dove
Resident LC
Cisticola juncidis Zitting Cisticola
Resident LC
Aerodramus vanikorensis Uniform swiftlet
Resident LC
Coracina striata
Bar-bellied cuckooshrike
Resident LC
Corvus macrorhynchos Large billed crow
Resident LC
Culicicapa helianthea
Citrine canary flycatcher
Resident LC
Cypsiurus balasiensis Asian Palm swift
Resident LC
Falco peregrinus Peregrine falcon
migratory LC
Hypotaenidia torquata
Barred rail Resident LC

ECOLOGICAL ASSESSMENT IN THE B+WISER SITES | 149
Scientific name Common
Name Extent of
Occurrence* Baungon Libona Lantapan Lupiagan
IUCN Status**
Geopelia striata
Zebra dove Resident LC
Gerygone sulphurea
Golden bellied gerygone
Resident LC
Halcyon coromanda
Ruddy kingfisher
Resident LC
Halcyon smyrnensis
White-breasted kingfisher
Resident LC
Haliastur indus
Brahminy kite Resident LC
Hirundo tahitica
Pacific swallow
Resident LC
Lanius validirostris
Mountain shrike
Philippine endemic NT
Merops viridis
Blue throarted bee-eater
Resident LC
Nycticorax caledonicus Rufous Night heron
Resident LC
Oriolus chinensis Black naped oriole
Resident LC
Passer montanus Eurasian tree sparrow
Resident LC
Phylloscopus nigrorum Mountain leaf warbler
Philippine endemic LC
Pitta sordida Hooded pitta Resident LC
Ptilocichla mindanensis Striated wren babbler
Philippine endemic LC
Rhabdornis inornatus
Stripe-breasted rhabdornis
Philippine endemic LC
Rhipidura javanica
Pied fantail Resident LC
Spilopelia chinensis
Eastern Spotted dove
Resident LC
Todiramphus chloris Collared kingfisher
Resident LC
Zosterops everetti Everette's white-eye
Resident LC
*Extent of occurrence refers to the species endemic to the Philippines or non-endemics. **Conservation status of species according to the IUC Red List of Threatened Species (2014): Least Concern (LC), Near Threatened (NT), Endangered (EN), Vulnerable (VU), and Critically Endangered (CR).
Annex 1.5c. List of mammals recorded in MKRNP during the ecological assessment, their threat status
and extent of occurrence.
Scientific Name Common
name Extent of
Occurrence* Baungon Libona Lantapan Lupiagan
IUCN Status**
Cynocephalus volans Philippine flying lemur
Mindanao endemic LC
Sus philippensis
Philippine warty pig
Philippine endemic VU
Petinomys crinitus
Mindanao flying squirrel
Mindanao endemic LC
Paradoxurus hermaphroditus
Common palm civet
Resident LC
Rusa marianna
Philippine deer
Philippine endemic VU

150 | ECOLOGICAL ASSESSMENTS IN THE B+WISER SITES
Scientific Name Common
name Extent of
Occurrence* Baungon Libona Lantapan Lupiagan
IUCN Status**
Sundasciurus philippinensis
Philippine tree squirrel
Mindanao endemic LC
Urogale everetti
Midanao tree shrew
Mindanao endemic LC
Apomys hylocoetes
Mindanao mossy forest apomys
Mindanao endemic LC
Rattus everetti
Philippine forest rat
Philippine endemic LC
Macaca fascicularis Crab-eating macaque
Resident LC
Bullimus bagobus
Mindanao bullimus
Mindanao endemic LC
Podogymnura truei
Mindanao gymnure
Mindanao endemic LC
Batomys salomonseni
Mindanao batomys
Mindanao endemic LC
Rattus tanezumi Oriental house rat
Introduced LC
Alionycteris paucidentata Mindanao pygmy fruit bat
Mindanao endemic LC
Coelops hirsutus
Philippine tailless leafnosed bat
Mindanao endemic DD
Harpyionycteris whiteheadi
Harpy fruit bat
Philippine endemic LC
Hipposideros sp. Roundleaf bat
Unidentified DD
Rhinolophus sp Horse shoe bat
Unidentified NL
Hipposideros obscurus Philippine forest leafnosed bat
Philippine endemic LC
Cynopterus luzoniensis
Peter's fruitbat
Resident LC
Haplonycteris fischeri Philippine pygmy fruitbat
Philippine endemic LC
Megaerops wetmorei
White collared fruitbat
Resident VU
Ptenochirus minor
Lesser musky fruitbat
Mindanao endemic LC
Ptenochirus jagori
Greater musky fruitbat
Philippine endemic LC
Rhinolophus subrufus
Small rufous horseshoe bat
Philippine endemic LC
Philetor brachypterus
Short-winged Pipistrelle
Resident LC
Kerivoula herdwickii
Hardwicke's wolly bat
Philippine endemic LC
Macrglossus minimus
Long tongued nectar bat
Resident LC
Eonycteris spelaea Dawn bat Resident LC

ECOLOGICAL ASSESSMENT IN THE B+WISER SITES | 151
Scientific Name Common
name Extent of
Occurrence* Baungon Libona Lantapan Lupiagan
IUCN Status**
Haplonycteris fischeri Philippine pygmy fruit bat
Philippine endemic LC
Hipposideros diadema Diadem leaf-nosed bat
Resident LC
Pipistrellus cf javanicus Javan pipistrelle
Resident
*Extent of occurrence refers to the species endemic to the Philippines or non-endemics. **Conservation status of species according to the IUC Red List of Threatened Species (2014): Least Concern (LC), Near Threatened (NT), Endangered (EN), Vulnerable (VU), and Critically Endangered (CR).
Annex.1.5d. List of amphibians recorded in MKRNP during the ecological assessment, their threat
status and extent of occurrence.
Scientific Name Common
Name Extent of Occrrence* Baungon Libona Lantapan Lupiagan
IUCN Status**
Hylarana grandocula
Big eyed frog
Philipppine endemic LC
Kalophrynus pleurostigma
Rufous-sided sticky frog
Resident LC
Leptobrachium lumadorum
Litter frog Mindanao endemic NL
Limnonectes magnus
Giant Philippine Frog
Philipppine endemic NT
Megophrys stejnegeri
Southeast Asian Horned Toad
Philipppine endemic VU
Nyctixalus spinosus
Litter frog Mindanao endemic VU
Pelophryne brevipes
Southeast asian toadlet
Resident NL
Pelophryne lighti Philipppine endemic VU
Philautus acutirostris
Pointed snouted tree frog
Mindanao endemic VU
Philautus surdus
Common Forest Tree Frog
Philipppine endemic LC
Staurois natator
Rock frog Mindanao endemic LC
Ansonia muelleri
Mueller's toad
Philippine endemic VU
Platymantis corrugatus Philippine endemic LC
Platymantis dorsalis
Common Forest Frog
Philippine endemic LC
Platymantis guentheri
Guenther's Forest Frog
Philippine endemic VU
Polypedates leucomystax
White-lipped tree frog
Introduced LC
Occidozyga laevis
Puddle frog
Resident LC

152 | ECOLOGICAL ASSESSMENTS IN THE B+WISER SITES
Scientific Name Common
Name Extent of Occrrence* Baungon Libona Lantapan Lupiagan
IUCN Status**
Platymantis rabori
Rabor's forest frog
Philippine endemic VU
Oreophryne anulata
Montane Narrow-mouthed frog
Philippine endemic VU
Philautus poecilius
Mottled tree frog
Mindanao endemic VU
*Extent of occurrence refers to the species endemic to the Philippines or non-endemics. **Conservation status of species according to the IUC Red List of Threatened Species (2014): Least Concern (LC), Near Threatened (NT), Endangered (EN), Vulnerable (VU), and Critically Endangered (CR).

ECOLOGICAL ASSESSMENT IN THE B+WISER SITES | 153
Annex 1.5e. List of reptiles recorded in MKRNP during the ecological assessment, their threat status
and extent of occurrence.
Scientific Name Common Name Extent of Occurrence* Baungon Libona Lantapan Lupiagan IUCN
Status**
Elaphe erythrura
Philippine rat snake
Philippine endemic LC
Gonocephalus interruptus Mindanao endemic LC
Psammodyanstes pulverulentus Resident LC
Sphenomorphus diwata
Diwata Sphenomorphus
Mindanao endemic LC
Sphenomorphus jagori
Jagor's Sphenomorphus
Philippine endemic LC
Trimeresurus flavomaculatus
Philippine pit viper
Philippine endemic LC
Rhabdophis auriculata
White-lined water snake
Philippine endemic LC
Sphenomorphus coxi
Cox's Sphenomorphus
Mindanao endemic LC
Cyclocorus lineatus
Northern Triangle-spotted Snake
Philippine endemic LC
Draco mindanensis Mindanao endemic LC
Maticora intestinalis philippina Striped Coral Snake
Resident LC
Tropidophorus davaoensis
Davao waterside skink
Mindanao endemic LC
Varanus salvator
Common water monitor
Resident LC
Cyrtodactylus agusanensis
Mindanao bow-fingered gecko
Mindanao endemic LC
Oxyrhabdium modestum
Non-banded Philippine Burrowing Snake
Philippine endemic LC
*Extent of occurrence refers to the species endemic to the Philippines or non-endemics. **Conservation status of species according to the IUC Red List of Threatened Species (2014): Least Concern (LC), Near Threatened (NT), Endangered (EN), Vulnerable (VU), and Critically Endangered (CR).

154 | ECOLOGICAL ASSESSMENTS IN THE B+WISER SITES
MANP
Annex 1.6a. List of trees recorded in MANP during the ecological assessment, their threat status and
extent of occurrence.
Scientific Name Common name Extent of
Occurrence* IUCN status**
Acer laurinum Non endemic Not listed
Actinodaphne apoensis Mindanao endemic Not listed
Adinandra sp Not listed
Agathis dammara Amboina Pitch tree Non endemic VU
Aglaia leucophylla Non endemic Near Threatened
Alstonia scholaris White cheesewood Non endemic LC
Alstonia scholaris White cheesewood Non endemic LC
Ardisia copelandii Non endemic Not listed
Artcarpus heterophyllus Jackfruit Introduced Not listed
Artocarpus odoratisimus Non endemic Not listed
Ascarina philippinensis Non endemic Not listed
Astronia megalantha Philippine endemic Not listed
Astronia williamsii Philippine endemic Not listed
Breynia cernua Non endemic Not listed
Spiraeopsis celebica Non endemic Not listed
Callicarpa longifolia Non endemic LC
Calophyllum blancoi Bitaog Non endemic Not listed
Canarium asperum Philippine endemic LC
Castanopsis philippensis Philippine endemic Not listed
Castanopsis philippensis Philippine endemic Not listed
Cordia dichotoma Anonang/Soap berry Non endemic Not listed
Cinnamomum mercadoi Cinnamomon Philippine endemic VU
Cinnamomum sp. Not listed
Clethra canescens Non endemic Not listed
Dacrycarpus cumingii Non endemic LC
Dacrydium beccarii Non endemic LC
Daphniphyllum luzonense Philippine endemic Not listed
Dendrocnide venosa Philippine endemic Not listed
Dysoxylum arborescens Non endemic Not listed
Durio sp. Durian Introduced Not listed
Durio zibethinus Durian Introduced Not listed
Elaeocarpus culminicola Philippine endemic Not listed
Engelhardia apoensis Non endemic Not listed
Erythrina subumbrans Non endemic Not listed
Eurya trichocarpa Philippine endemic Not listed
Eusideroxylon zwageri Non endemic Not listed
Ficus balete Non endemic Not listed
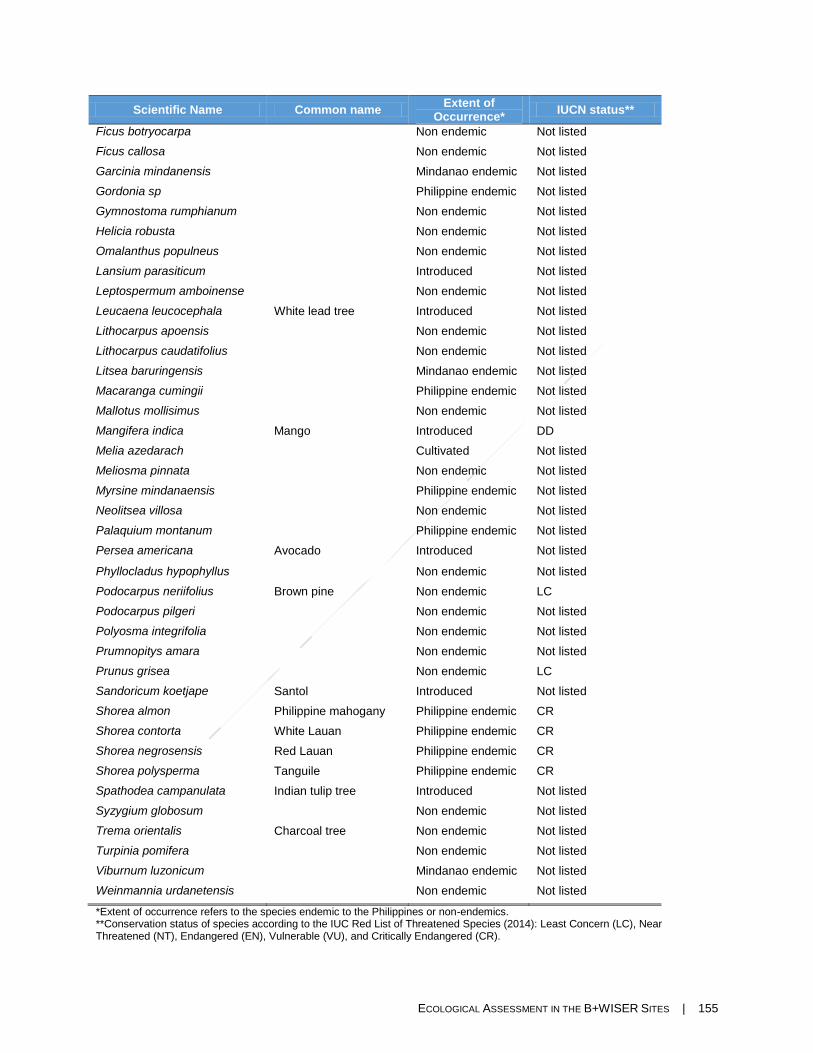
ECOLOGICAL ASSESSMENT IN THE B+WISER SITES | 155
Scientific Name Common name Extent of
Occurrence* IUCN status**
Ficus botryocarpa Non endemic Not listed
Ficus callosa Non endemic Not listed
Garcinia mindanensis Mindanao endemic Not listed
Gordonia sp Philippine endemic Not listed
Gymnostoma rumphianum Non endemic Not listed
Helicia robusta Non endemic Not listed
Omalanthus populneus Non endemic Not listed
Lansium parasiticum Introduced Not listed
Leptospermum amboinense Non endemic Not listed
Leucaena leucocephala White lead tree Introduced Not listed
Lithocarpus apoensis Non endemic Not listed
Lithocarpus caudatifolius Non endemic Not listed
Litsea baruringensis Mindanao endemic Not listed
Macaranga cumingii Philippine endemic Not listed
Mallotus mollisimus Non endemic Not listed
Mangifera indica Mango Introduced DD
Melia azedarach Cultivated Not listed
Meliosma pinnata Non endemic Not listed
Myrsine mindanaensis Philippine endemic Not listed
Neolitsea villosa Non endemic Not listed
Palaquium montanum Philippine endemic Not listed
Persea americana Avocado Introduced Not listed
Phyllocladus hypophyllus Non endemic Not listed
Podocarpus neriifolius Brown pine Non endemic LC
Podocarpus pilgeri Non endemic Not listed
Polyosma integrifolia Non endemic Not listed
Prumnopitys amara Non endemic Not listed
Prunus grisea Non endemic LC
Sandoricum koetjape Santol Introduced Not listed
Shorea almon Philippine mahogany Philippine endemic CR
Shorea contorta White Lauan Philippine endemic CR
Shorea negrosensis Red Lauan Philippine endemic CR
Shorea polysperma Tanguile Philippine endemic CR
Spathodea campanulata Indian tulip tree Introduced Not listed
Syzygium globosum Non endemic Not listed
Trema orientalis Charcoal tree Non endemic Not listed
Turpinia pomifera Non endemic Not listed
Viburnum luzonicum Mindanao endemic Not listed
Weinmannia urdanetensis Non endemic Not listed
*Extent of occurrence refers to the species endemic to the Philippines or non-endemics. **Conservation status of species according to the IUC Red List of Threatened Species (2014): Least Concern (LC), Near Threatened (NT), Endangered (EN), Vulnerable (VU), and Critically Endangered (CR).

156 | ECOLOGICAL ASSESSMENTS IN THE B+WISER SITES
Annex 1.6b. List of birds recorded in MANP during the ecological assessment, their threat status
and extent of occurrence.
Scientific Name Common name Extent of
Occurrence* IUCN Status**
Accipiter gularis Japanese sparrowhawk Migrant LC
Accippter virgatus Besra Resident LC
Aethopyga primigenia Grey-hooded sunbird Mindanao endemic NT
Aethopyga pulcherrima Metallic-winged sunbird Philippine endemic LC
Amaurornis phoenicurus White-breasted waterhen Resident LC
Arachnothera clarae Naked-faced spiderhunter Philippine endemic LC
Basilornis mirandus Apo myna Philippine endemic NT
Brachypteryx montana White-browed shortwing Resident LC
Buceros mindanensis Southern Rufous hornbill Philippine endemic NT
Cacomantis variolosus Brush cuckoo Resident LC
Centropus melanops Black-faced coucal Philippine endemic LC
Centropus viridis Philippine coucal Philippine endemic LC
Chalcophaps indica Grey-capped emerald-dove Resident LC
Chrysocolaptes lucidus Buff-spotted flameback Philippine endemic LC
Collocalia troglodytes Pygmy swiftlet Philippine endemic LC
Columba vitiensis Metallic pigeon Resident LC
Copsychus saularis Philippine magpie-robin Philippine endemic LC
Corvus macrorhynchos Large-billed crow Resident LC
Dicaeum australe Red-striped flowerpecker Philippine endemic LC
Dicaeum hypoleucum Buzzing flowperpecker Philippine endemic LC
Dicaeum pygmaeum Pygmy flowerpecker Philippine endemic LC
Dicaeum trigonostigma Orange-bellied flowerpecker Resident LC
Dicrurus hottentottus Hair-crested drongo Resident LC
Dryocopus javensis White-bellied woodpecker Resident LC
Eumyias panayensis Island flycatcher Resident LC
Ficedula westermanni Little pied flycatcher Resident LC
Gallirallus torquatus Barred rail Resident LC
Gallus gallus Red junglefowl Resident LC
Harpactes ardens Philippine trogon Philippine endemic LC
Hemiprocne comata Whiskered treeswift Resident LC
Hypocryptadius cinnamomeus
Cinnamon ibon Mindanao endemic LC
Hypothymis helenae Short-crested monarch Philippine endemic NT
Irena cyanogastra Philippine fairy-bluebird Philippine endemic NT
Ixos philippinus Philippine bulbul Philippine endemic LC
Lalage nigra Pied triller Resident LC
Lonchura atricapilla Chestnut munia Resident LC
Lophozosterops goodfellowi Mindanao white-eye Philippine endemic LC
Loriculus philippensis Philippine Hanging-parrot Philippine endemic LC

ECOLOGICAL ASSESSMENT IN THE B+WISER SITES | 157
Scientific Name Common name Extent of
Occurrence* IUCN Status**
Macronous striaticeps Brown tit-babbler Philippine endemic LC
Macropygia tenuirostris Philippine cuckoo-dove Philippine endemic LC
Psilopogon haemacephalus Coppersmith barbet Resident LC
Megalurus timoriensis Tawny grassbird Resident LC
Microhierax erythrogenys Philippine falconet Philippine endemic LC
Nectarinia jugularis Olive-backed sunbird Resident LC
Orthotomus castaneiceps Philippine tailorbird Philippine endemic LC
Pachycephala philippinensis Yellow-bellied whistler Philippine endemic LC
Penelopides affinis Mindanao Hornbill Mindanao endemic LC
Periparus elegans Elegant tit Philippine endemic LC
Phapitreron leucotis White-eared brown-dove Philippine endemic LC
Phylloscopus olivaceus Philippine leaf-warbler Philippine endemic LC
Pithecophaga jefferyi Philippine eagle Philippine endemic CE
Prioniturus waterstradti Mindanao racket-tail Mindanao endemic NT
Prionochilus olivaceus Olive-backed flowerpecker Philippine endemic LC
Ptilinopus occipitalis Yellow-breasted fruit-dove Philippine endemic LC
Pycnonotus goiavier Yellow-vented bulbul Resident LC
Pycnonotus urostictus Yellow-wattled bulbul Philippine endemic LC
Rhinomyias goodfellowi Slaty-backed jungle-flycatcher Mindanao endemic NT
Rhipidura javanica Pied fantail Resident LC
Rhipidura nigrocinnamomea Black -and-cinnamon fantail Philippine endemic LC
Sarcops calvus Coleto Philippine endemic LC
Sitta oenochlamys Sulfur-billed nutchatch Philippine endemic LC
Spilornis holospilus Philippine serpent eagle Philippine endemic LC
Nisaetus pinskeri South Philippine Hawk-eagle Philippine endemic E
Todiramphus chloris Collard kingfisher Resident LC
Turdus poliocephalus Island thrush Resident LC
Zosterops montanus Mountain white-eye Resident LC
Batrachostomus septimus Philippine frogmouth Philippine endemic LC
Otus everetti Mindanao Lowland Scops-owl Philippine endemic LC
Otus mirus Mindanao Highland Scops-owl Mindanao endemic NT
Rallina eurizonoides Slatty-legged crake Resident LC
*Extent of occurrence refers to the species endemic to the Philippines or non-endemics. **Conservation status of species according to the IUC Red List of Threatened Species (2014): Least Concern (LC), Near Threatened (NT), Endangered (EN), Vulnerable (VU), and Critically Endangered (CR).

158 | ECOLOGICAL ASSESSMENTS IN THE B+WISER SITES
Annex 1.6c. List of mammals recorded in MANP during the ecological assessment, their threat status
and extent of occurrence.
Scientific Name Common name Extent of
Occurrence* IUCN Status**
Paradoxurus hermaphroditus
Common palm civet Resident LC
Petinomys crinitus Mindanao flying squirrel Mindanao endemic
LC
Sus philippensis Philippine warty pig Philippine endemic
VU
Rattus argentiventer Ricefield rat Resident LC
Rattus everetti Philippine forest rat Philippine endemic
LC
Rattus tanezumi Oriental house rat Introduced LC
Urogale everetti Mindanao treeshrew Mindanao endemic
LC
Cynopterus luzonieinsis Peter's Fruit bat Resident LC
Dyacopterus rickartii Philippine Large headed fruit bat Philippine endemic
DD
Eonycteris spelaea Dawn Bat Resident LC
Haplonycteris fischeri Philippine pygmy fruit bat Philippine endemic
LC
Harpyionycteris whiteheadi
Harpy fruitbat Philippine endemic
LC
Kerivoula cf hardwickii Hardwick's woolly bat Philippine endemic
LC
Macroglossus minimus Dagger toothed long-nosed fruitbat
Resident LC
Megaerops wetmorei White collared fruit bat Resident VU
Pipistrellus cf javanicus Javan pipistrelle Resident LC
Ptenochirus jagori Greater Musky fruit bat Philippine endemic
LC
Ptenochirus minor Lesser Musky fruit bat Mindanao endemic
LC
Rhinolophus inops Philippine Forest horseshoe bat Philippine endemic
LC
*Extent of occurrence refers to the species endemic to the Philippines or non-endemics. **Conservation status of species according to the IUC Red List of Threatened Species (2014): Least Concern (LC), Near Threatened (NT), Endangered (EN), Vulnerable (VU), and Critically Endangered (CR).
Annex 1.6d. List of amphibians recorded in MANP during the ecological assessment, their threat
status and extent of occurrence.
Scientific Name Common name Extent of Occurrence* IUCN Status**
Ansonia muelleri Mueller's toad Philippine endemic VU
Kalophrynus pleurostigma Rufous-sided sticky frog Resident LC
Leptobrachium lumadorum Litter frog Mindanao endemic NA
Limnonectes parvus Philippine small disked frog Mindanao endemic VU
Megophrys stejnegeri Southeast asian horned toad Philippine endemic VU
Philautus acutirostris Pointed snouted tree frog Mindanao endemic VU
Philautus poecilius Mottled tree frog Mindanao endemic VU
Philautus surdus Common forest tree frog Philippine endemic VU

ECOLOGICAL ASSESSMENT IN THE B+WISER SITES | 159
Scientific Name Common name Extent of Occurrence* IUCN Status**
Philautus worcesteri Smooth skinned tree frog Philippine endemic VU
Platymantis guentheri Guenther's forest frog Philippine endemic VU
Polypedates leucomystax White-lipped tree frog Resident VU
Staurois natator Rock frog Mindanao endemic LC
*Extent of occurrence refers to the species endemic to the Philippines or non-endemics. **Conservation status of species according to the IUC Red List of Threatened Species (2014): Least Concern (LC), Near Threatened (NT), Endangered (EN), Vulnerable (VU), and Critically Endangered (CR).
Annex 1.6e. List of reptiles recorded in MANP during the ecological assessment, their threat status and
extent of occurrence.
Scientific Name Common name Extent of Occurrence* IUCN Status**
Elaphe erythrura Philippine rat snake Philippine endemic NA
Ahaetulla prasina preocularis Asian vine snake Resident LC
Brachymeles gracilis Graceful short-legged skink Mindanao endemic LC
Cyrtodactylus agusanensis Agusan bent-toed gecko Mindanao endemic LC
Dendrelaphis caudolineatus terrificus Striped bronzeback snake Mindanao endemic NA
Psammodynastes pulverulentus Common mock viper Resident LC
Rhabdophis auriculata White-lined water snake Philippine endemic LC
*Extent of occurrence refers to the species endemic to the Philippines or non-endemics.
**Conservation status of species according to the IUC Red List of Threatened Species (2014): Least
Concern (LC), Near Threatened (NT), Endangered (EN), Vulnerable (VU), and Critically Endangered
(CR).

160 | ECOLOGICAL ASSESSMENTS IN THE B+WISER SITES
ANNEX B. SPREADSHEET OF RAW DATA (SEE ATTACHMENT)
ANNEX C. CANONICAL CORRESPONDENCE ANALYSIS BIPLOTS NSMNP
Flora (Trees)
The eigenvalue for Axis 1 is 0.42 while Axis 2 is 0.38, and the accounted variance is 16.07% and
14.75%, respectively.
Centroids of most tree species are projected on the right-hand side of the ordination plot. This
suggests that many species are associated to disturbed and forest interface habitats.
The community of trees is determined by elevation, increasing thickness of leaf litter and
increasing number of palms.
Figure 41. CCA biplot of 36 species of trees and 24 environmental variables.
Line vectors represent the variables, texts in red font represent the species and circles indicate the sites. Species are coded as follows: ANTH Anisoptera thurifera ARRI Artocarpus rigidus CAIN Calophyllum inophyllum CEPH Celtis philippinensis DIPH Dillenia philippinensis DIOPH Diospyrus philippensis DIGR Diptetrocarpus grandiflorus DRDA Dracontomelon dao DUMO Duabanga moluccana FINO Ficus nota FICU Ficus sp. FIVA Ficus variegata GAVE Garcinia venulosa GUIS Guisat KANAR Kanaring KULI Kulipapa LITH Lithocarpus sp. LILE Litsea leytensis MABI Macaranga bicolor MATA Macaranga tanarius MAAL Mangifera altissima NAOR Nauclea orientalis NELA Nephelium lappaceum, OCSU Octomeles sumatrana PALU Palaquium luzoniensis PAPH Palaquium philippense PAMA Parashorea malaanonan PTIN Pterocarpus indicus SHAS Shorea astylosa SHCO Shorea contorta SHGU Shorea guiso SHNE Shorea negrosensis SHPA Shorea palosapis SHPO Shorea polysperma SYCI Syzigium ciliato-setosum SYTR Syzygium tripinnatum.
Birds
Species-habitat association of 25 birds and 23 environmental variables was attained by CCA
Axes 1 and 2 with eigenvalues of 0.26 and 0.22, and accounted variance of 13.09% and 11.13%,
respectively.
Most species centroids are projected on the upper side of the ordination plot suggesting many
species are associated to forest habitats.
Bird’s community is influenced mainly by elevation, increasing thickness of leaf litter and
humus, and increasing number of fruit trees.
-6 -4 -2 0 2 4 6
-8-6
-4-2
02
CCA Variable & Species Scores
Axis 1
Axis
2
-10
Elev Slope
Aspec
Humus
DWoodNat
DWoodCut
Anthro
Sap
Ebamb
Rattan
Palm
Pandan
Grass
Herbs
FernsRock
Moss
LeafLit
Ground
Dbh100
Dbh50_100
Dbh25_50Dbh12_25
Dbh6_12 ANTHARRI
CAIN
CEPH DIPH
DIOPH
DIGR
DRDA
DUMO
FINO
FICU
FIVA
GAVE
GUIS
KANARKULI
LITH
LILEMABI
MATAMAAL
NAOR
NELAOCSU
PALU
PAPHPAMA
PTIN
SHAS
SHCOSHGU
SHNESHPASHPOSYCISYTR

ECOLOGICAL ASSESSMENT IN THE B+WISER SITES | 161
Figure 42. CCA biplot of 35 species of birds and 23 environmental variables.
Line vectors represent the variables, texts in red font represent the species and circles indicate the sites. Species are coded as follows: AMBD Phapitreron amethystinus, BALIC Dicrurus balicassius, BBCS Coracina striata, BCS Coracina coerulescens, BNM Hypothymis azurea, BHF Rhipidura cyaniceps, BS Brown Shrike, BZFP Dicaeum, COLA Loriculus philippensis, EMDOVE Chalcophaps indica, ELTIT Parus elegans, FLSB Parus elegans GUAIA Bolbopsittacus lunulatus LTLW Phylloscopus cebuensisOLBFP Prionochilus olivaceusOLBSB Cinnyris jugularisORBFP Dicaeum trigonostigma PBUL Ixos philippinusPCOU Centropus viridis PFBB Irena cyanogastra, PTAILB Orthotomus castaneiceps, PTROG Harpactes ardens PURTSB Nectarinia sperata REDKFP Dicaeum australe RUFCOU Centropus unirufus SCFMAL Phaenicophaeus cumingi SOWP Mulleripicus funebris WBMUN Lonchura leucogastra WBSHAM Copsychus luzoniensis WEBD Phapitreron leucotis WLOR Oriolus albiloris YBWHI Pachycephala philippinensis YBFDOVE Ptilinopus occipitalis YWEYE Zosterops nigrorum YWBUL Pycnonotus urostictu.
Kaliwa-UMRBPL
Flora (Trees)
Eigenvalues for Axes 1 and 2 are 0.97 and 0.98, respectively. Accounted variance for Axis 1 is
11.56% and Axis 2 11.61%.
Species centroids above the x-axis such as Macaranga grandifolia, Mitrephora lanotan and
Polyscias nodosa are indicative of less degraded habitats. Whereas, species centroids located
below the x-axis such as Canarium ovatum, Ficus variegata and Heritiera sylvatica are those that
are associated with open and highly degraded habitats.
Presence and distribution of trees can be attributed to the following environmental variables: leaf
litter, humus and canopy.
Most of the tree species can be found in both degraded and interface of forest and non-forest
habitat types.
-3 -2 -1 0 1 2 3
-3-2
-10
12
3
CCA Variable & Species Scores
Axis 1
Axis
2
0
Elev
Humus
DWoodNatDWoodCut
FrTrees
Anthro
Sap
Ebamb
Rattan
Palm
Pandan
GrassHerbs
Ferns
Rock
Moss
LeafLit
Ground
Dbh100
Dbh50_100Dbh25_50
Dbh12_25
Dbh6_12AMBD
BALIC
BBCS
BCS
BNM
BHF
BS
BZFP
COLA
EMDOVE
ELTIT
FLSB
GUAIA
LTLW
OLBFP
OLBSB
ORBFP
PBUL
PCOU
PFBB
PTAILB
PTROG
PURTSB REDKFP
RUFCOU
SCFMAL
SOWP
WBMUN
WBSHAM
WEBD
WLOR
YBWHI
YBFDOVE
YWEYEYWBUL
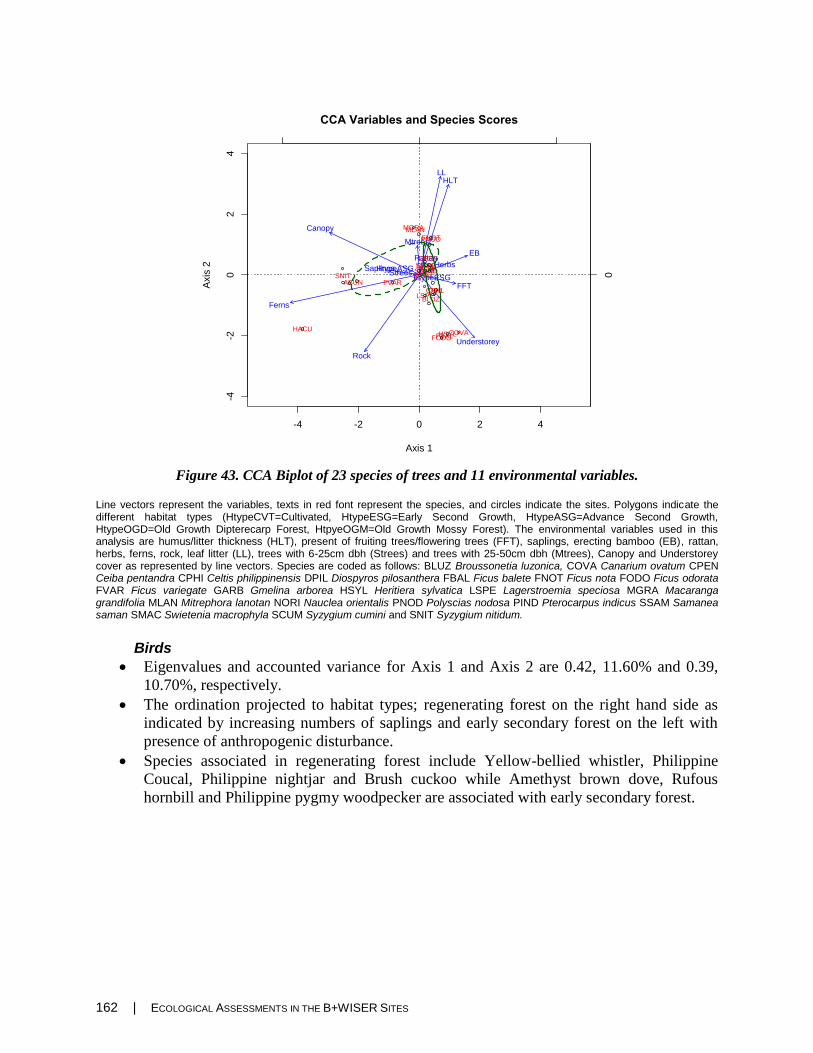
162 | ECOLOGICAL ASSESSMENTS IN THE B+WISER SITES
Figure 43. CCA Biplot of 23 species of trees and 11 environmental variables.
Line vectors represent the variables, texts in red font represent the species, and circles indicate the sites. Polygons indicate the different habitat types (HtypeCVT=Cultivated, HtypeESG=Early Second Growth, HtypeASG=Advance Second Growth, HtypeOGD=Old Growth Dipterecarp Forest, HtpyeOGM=Old Growth Mossy Forest). The environmental variables used in this analysis are humus/litter thickness (HLT), present of fruiting trees/flowering trees (FFT), saplings, erecting bamboo (EB), rattan, herbs, ferns, rock, leaf litter (LL), trees with 6-25cm dbh (Strees) and trees with 25-50cm dbh (Mtrees), Canopy and Understorey cover as represented by line vectors. Species are coded as follows: BLUZ Broussonetia luzonica, COVA Canarium ovatum CPEN Ceiba pentandra CPHI Celtis philippinensis DPIL Diospyros pilosanthera FBAL Ficus balete FNOT Ficus nota FODO Ficus odorata FVAR Ficus variegate GARB Gmelina arborea HSYL Heritiera sylvatica LSPE Lagerstroemia speciosa MGRA Macaranga grandifolia MLAN Mitrephora lanotan NORI Nauclea orientalis PNOD Polyscias nodosa PIND Pterocarpus indicus SSAM Samanea saman SMAC Swietenia macrophyla SCUM Syzygium cumini and SNIT Syzygium nitidum.
Birds
Eigenvalues and accounted variance for Axis 1 and Axis 2 are 0.42, 11.60% and 0.39,
10.70%, respectively.
The ordination projected to habitat types; regenerating forest on the right hand side as
indicated by increasing numbers of saplings and early secondary forest on the left with
presence of anthropogenic disturbance.
Species associated in regenerating forest include Yellow-bellied whistler, Philippine
Coucal, Philippine nightjar and Brush cuckoo while Amethyst brown dove, Rufous
hornbill and Philippine pygmy woodpecker are associated with early secondary forest.
-4 -2 0 2 4
-4-2
02
4
CCA Variables and Species Scores
Axis 1
Axis
2 HtypeASGHtypeESG 0
HLT
FFT
Canopy
Understorey
Saplings
EBRattan
Herbs
Ferns
Rock
LL
Strees
Mtrees
BLUZ
COVA
CPEN
CPHIDPIL
FBAL
FNOT
FODO
FVAR
GARB
HSYL
LSPE
MGRAMLAN
NORI
PNOD
PINDSSAM
SMACSCUM
SNIT
HACU
ABUN

ECOLOGICAL ASSESSMENT IN THE B+WISER SITES | 163
Figure 44. CCA biplot of 37 birds and 18 environmental variables.
Line vectors represent the variables, texts in red font represent the species, and circles indicate the sites. Polygons indicate the different habitat types (HtypeCVT=Cultivated, HtypeESG=Early Second Growth, HtypeASG=Advance Second Growth, HtypeOGD=Old Growth Dipterecarp Forest, HtpyeOGM=Old Growth Mossy Forest). The environmental variables used are humus/litter thickness (HLT), present of fruiting trees/flowering trees (FFT), saplings, erecting bamboo (EB), rattan, palms, pandan, grass, herbs, ferns, rock, moss, leaf litter (LL), trees with 6-25cm dbh (SmallDBH), trees with 25-50cm dbh (MedDBH) and trees with 100cm above dbh (LargeDBH), Ground, Canopy, Midstorey and Understorey cover and signs of anthropogenic disturbances (Anthro) as represented by line vectors. Species are coded as follows: AMBD Phapitreron amethystine BALI Dicrurus balicassius BCFD Ptilinopus leclancheri BLNM Hypothymis azurea BRUC Cacomantis variolosus BUFP Dicaeum hypoleucum COED Chalcophaps indica COLA Loriculus philippensis COLE Sarcops calvus COSB Megalaima haemacephala ELET Parus elegans GRFB GUAI Bolbopsittacus lunulatus LABC Corvus macrorhynchos LESC Centropus bengalensis LUSB Stachyris striata LUZT Penelopides manillae PHCD Macropygia tenuirostris PHIB Ixos philippinus PHIC Centropus viridis PHIT Harpactes ardens PHTB Orthotomus castaneiceps PPWP Dendrocopos maculatus REBP Pitta erythrogaster RECM Phaenicophaeus superciliosus RUFC Centropus unirufus RUFH Buceros hydrocorax SCFM Phaenicophaeus cumingi SPOD Streptopelia chinensis WBSW Brachypteryx montana WEBD Phapitreron leucotis WHBS Copsychus luzoniensis WTKF Halcyon smyrnensis YBFD Ptilinopus occipitalis YEVB Pycnonotus goiavier YEWB Pycnonotus urostictus.
Amphibians
CCA Axes 1 and 2 had eigenvalues of 0.38 and 0.20, respectively while their accounted variances
are 36.10% and 18.90%.
-4 -2 0 2 4
-4-2
02
4
CCA Variables and Species Scores
Axis 1
Axis
2
HtypeASG
HtypeCVT
HtypeESG 0
HLT
FTFT
Canopy
Midstorey
Understorey
Anthro
Saplings
Bamboo
Rattan
Palms
Pandan
Grass
Herbs
Ferns
RockMoss
Leaf_Litter
Ground_Cover
LargeDBH
SmallDBHMedDBH
AMBD
BALI
BBFCBCFD
BHFTBLNM
BRUC
BUFP
CCFCCHFB
CHFMCOED
COLA
COLE
COSB
ELET
GRFB GUAI
LABC
LESC
LUSB
LUZT
MOTB
PHCD
PHIB
PHIC
PHIT
PHNJPHTB
PPWP
REBP
RECM
RUFC
RUFH
SCFM
SHCM
SPOD
TARH
WBSW
WEBD
WHBS
WTKF YBFDYEBWYEVB
YEWB

164 | ECOLOGICAL ASSESSMENTS IN THE B+WISER SITES
Figure 45. CCA Biplot of 7 amphibians and environmental variables.
Line vectors represent the variables, texts in red font represent the species, and circles indicate the sites. Polygons indicate the different habitat types (HtypeCVT=Cultivated, HtypeESG=Early Second Growth, HtypeASG=Advance Second Growth, HtypeOGD=Old Growth Dipterecarp Forest, HtpyeOGM=Old Growth Mossy Forest). The variables used in this analysis are distance from bodies of water (DWB), humus/litter thickness (HLT), present of natural dead wood (DWN), cut dead wood (DWC), fruiting trees/flowering trees (FFT), saplings, erecting bamboo (EB), rattan, palms, pandan, grass, herbs, ferns, rock, moss, leaf litter (LL), trees with 6-25cm dbh (SDT), trees with 25-50cm dbh (MDT) and trees with 100cm above dbh (LDT/VLDT), Ground (GC), Canopy, Midstorey (MS) and Understorey (US) cover as represented by line vectors. Species are coded as Platcor Platymantis corrugatus Platdorsalis Platymantis dorsalis Kalopicta Kaloula picta, Hylasimilis Hylarana similis Occilaevis Occidozyga laevis Limnmac Limnonectes macrocephalus and Polyleu Polypedates leucomystax.
Bats
CCA of Axes 1 and 2 with eigenvalues of 0.34 and 0.18 attained species habitat association and
their accounted variance is 35.10% and 18.30%, respectively.
-2 -1 0 1 2
-2-1
01
2
CCA Variables and Species Scores
Axis 1
Axis
2
HtypeASG
HtypeCVT
HtypeESG 0
Bhab
DWB
HLT
DWN
DWCCanopy
MS
Saplings
Rattan
Grass
RockMoss
LL
GC
SDTMDT
LDT
VLDT
Platcor
Platdorsalis
Kalopicta
Hylasimilis
Occilaevis
Limnmac
Polyleu

ECOLOGICAL ASSESSMENT IN THE B+WISER SITES | 165
Figure 46. CCA biplot of 15 species of bats and environmental variables.
Line vectors represent the variables, texts in red font represent the species, and circles indicate the sites. Polygons indicate the different habitat types (HtypeCVT=Cultivated, HtypeESG=Early Second Growth, HtypeASG=Advance Second Growth, HtypeOGD=Old Growth Dipterecarp Forest, HtpyeOGM=Old Growth Mossy Forest). The environmental variables used are distance to ridge top (DRT), distance to forest edge (DFE), average tree height (ATH), crown cover (ACC), canopy height (ACH), present of fruiting trees/flowering trees (FFT), saplings, erecting bamboo (EB), rattan, palms, grass, herbs, rock, moss, trees with 6-25cm dbh (Stress), trees with 25-50cm dbh (Mtrees) and trees with 100cm above dbh (Ltrees), Canopy, Midstorey (MS) and Understorey (US) cover and signs of anthropogenic disturbances (Anthro) as represented by line vectors. Species coded as CYBRA Cynopterus brachyotis EOROB Eonycteris robusta EOSPE Eonycteris spelaea HAFIS Haplonycteris fischeri HIDIA Hipposideros diadema KEWHI Kerivoula whiteheadi MAMIN Macroglossus minimus MESPA Megaderma spasma OTCAR Octopterupus cartilagonodus PTJAG Ptenochirus jagori RHARC Rhinolophus arcuatus ROAMP Rousettus amplexicaudatus SASAC Saccolaimus saccolaimus TYPAC Tylonycteris pachypus TYROB Tylonycteris robustula.
BRFWR
Flora (Trees)
CCA Axis 1 has an eigenvalue of 0.36 while CCA Axis 2 has an eigenvalue of 0.32. Accounted
variance is 14.6% and 12.6%, respectively.
Species centroids positioned on the left-hand side of the main axis such as Macaranga bicolor,
M. tanarius and Bischofia javanica are associated with disturbed forests.
Centroids of species positioned on the right-hand side of the main axis are associated to advance
secondary (ASG) to old growth forest (OG). These include dipterocarp species such as Red lauan
(Shorea negrosensis), White lauan (Shorea contorta), and Tanguile (Shorea polysperma), all of
which are considered as Critically Endangered (CR) species (IUCN, 2014).
-5 0 5
-6-4
-20
24
6
CCA Variables and Species Scores
Axis 1
Axis
2
HtypeASG
HtypeCVT
HtypeESG
0
DRT
DFE
FTFT
Canopy
Midstorey
Anthro
Saplings
Bamboo
Rattan
CYBRAEOROB
EOSPE
HAFIS
HIDIA
KEWHI
MAMINMESPA
MYMUR
OTCAR
PTJAG
RHARCROAMPSASAC
TYPAC
TYROB

166 | ECOLOGICAL ASSESSMENTS IN THE B+WISER SITES
Figure 47. CCA biplot of 26 species of trees and 21 environmental variables.
Line vectors represent the variables, texts in red font represent the species, and circles indicate the sites. Polygons indicate the different habitat types (HtypeCVT=Cultivated, HtypeESG=Early Second Growth, HtypeASG=Advance Second Growth, HtypeOGD=Old Growth Dipterecarp Forest, HtpyeOGM=Old Growth Mossy Forest). The environmental variables used in this analysis are: gradient (GRAD), humus, fruiting trees/flowering trees (FRFT), canopy (CAN), midstorey (MID), understorey (UND), sapling (SAP), erecting bamboo (EBAMB), rattan, palms, pandan, grass, herbs, ferns, rock, moss, leaf litter (LL) ground cover (GROUND), tree diameter measuring 6-25cm (DBH6_25), tree diameter measuring 26-100cm (DBH25_100), average crown cover (AVECC) as represented by line vectors. Species are coded as follows: AGATHPH Agathis philippinensis, BISCHJA Bischofia javanica, DACRIM Dacrycarpus imbricatus, DENDSP Dendrochnide sp., MACABI Macaranga bicolor, MACATA Macaranga tanarius, MYRIPH Myristica philippinensis, PALALU Palaquium luzoniense, PALASP1 Palaquium sp. 1, PALASP2 Palaquium sp. 2, PARAMA Parashorea malaanonan, SHORCO Shorea contorta, SHORNE Shorea negrosensis, SHORPO Shorea polysperma, SWIEMA Swietenia macrophylla, SYZY1 Syzygium sp. 1, SYZY2 Syzygium sp. 2, SYZY3 Syzygium sp. 3 , SYZY4 Syzygium sp. 4, SYZY5 Syzygium sp. 5, SYZY6 Syzygium sp. 6, SYZY7 Syzygium sp. 7, SYZY8 Syzygium sp. 8, SYZY9 Syzygium sp. 9, TRISDE Tristaniopsis decorticate
Birds
Species-habitat association was attained by two CCA axes (1 and 2) with eigenvalues of 0.58 and
0.19, with accounted variance of 41.2% and 13.7%, respectively.
Species centroids positioned on the right-hand side are associated to cultivated and degraded
forests. These include Eumyias panayensis (Mountain Verditer Flycatcher), Orthotomus
castaneiceps (Philippine Tailorbird), Pycnonotus goiavier (Yellow-vented Bulbul), and Centropus
viridis (Philippine Coucal), which are able to tolerate habitats with presence of anthropogenic
disturbances. Penelopides panini (Tarictic Hornbill), a vulnerable species (IUCN, 2014), was
recorded in forest edges.
Centroids of species positioned on the left-hand side of main axis are associated to advance
secondary and old growth forests. These include Tanygnathus lucionensis salvadorii (Blue-naped
Parrot) and Phapitreron amethystina (Amethyst Brown Dove) that are forest-dependent species.
-4 -2 0 2 4
-4-2
02
4
CCA Variables and Species Scores
Axis 1
Axis
2
H_TypeASGH_TypeCVT
H_TypeESG
H_TypeOGD
H_TypeOGM
0
GRAD
Humus
FRFT
CAN
MIDSAP
Palms
Pandan
Herbs
Ferns
Rock
Moss
LL
GROUND
DBH6_25
DBH25_100
AVECCAGATPHBISHJA
DACRIM
DENDSP
MACABI
MACATA
MYRIPH
PALALU
PALASP1
PALASP2PARAMA
SHORCO
SHORNESHORPO
SWIEMA
SYZY1
SYZY2SYZY3
SYZY4
SYZY5
SYZY6SYZY7
SYZY8
SYZY9TRISDE
X

ECOLOGICAL ASSESSMENT IN THE B+WISER SITES | 167
Figure 48. CCA biplot of 34 species of birds and 19 environmental variables.
Line vectors represent the variables, texts in red font represent the species, and circles indicate the sites. Polygons indicate the different habitat types (HtypeCVT=Cultivated, HtypeESG=Early Second Growth, HtypeASG=Advance Second Growth, HtypeOGD=Old Growth Dipterecarp Forest, HtpyeOGM=Old Growth Mossy Forest). The environmental variables used are distance to ridge top (DRT), distance to valley bottom (DVB), humus/litter thickness (Humus), present of fruiting trees/flowering trees (Fr_Fl_Trees), erecting bamboo (Ebamb), rattan, palms, pandan, grass, herbs, moss, leaf litter (Leaf_Litter), trees with 6-12cm dbh (Dbh6_12) and trees with 50-100cm dbh (Dbh50_100), ground, Canopy cover (CanCover), Midstorey cover (MidCover), Understorey cover (UndCover) and signs of anthropogenic disturbances (Anthro). Species are coded as follows: AMBD Phapitreron amethystine BALI Dicrurus balicassius BHFT Rhipidura cyaniceps BLBP Tanygnathus sumatranus BLNP Tanygnathus lucionensis salvadorii CCFC Culicicapa helianthea COLE Sarcops calvus ELET Parus elegans LOSB Aethopyga shelleyi METP Columba vitiensis anthracina MOWE Zosterops montanus MVFC Eumyias panayensis NESB Stachyris nigrorum PBIP Ducula poliocephala PHCD Macropygia tenuirostris PHIB Ixos philippinus PHIC Centropus viridis PHIT Harpactes ardens PHTB Orthotomus castaneiceps PHWP Dendrocopos maculatus PIET Lalage nigra SBFC Ficedula hyperythra nigrorum TARH Penelopides panini WBSW Brachypteryx montana WBWP Dryocopus javensis WEBD Phapitreron leucotis WHVW Pachycephala homeyeri WWCS Coracina ostenta YBFD Ptilinopus occipitalis YEWE Zosterops nigrorum YEVB Pycnonotus goiavier YEWB Pycnonotus urostictus.
Bats
Eigenvalues for Axis 1 and Axis 2 are 0.40 and 0.24 while their accounted variance are 38.3%
and 23.4%, respectively.
-4 -2 0 2 4
-3-2
-10
12
3
CCA Variables and Species Scores
Axis 1
Axis
2 HtypeASG
HtypeCVT
HtypeESGHtypeOGD
HtypeOGM
0
DRT
DVBHumus
Fr_Fl_Trees
CanCover
MidCover
UndCover
Anthro
Ebamb
Rattan
PalmsPandan
Grass
Herbs
Moss
Leaf_Litter
Ground
Dbh6_12
Dbh50_100
AMBD
BALI
BHFT
BLBP
BLHF
BLNPCCFC
COLE
ELET
LOSB
METP
MOWE
MVFC
NESBPBIP
PHCDPHIB PHIC
PHIT
PHPW
PHTB
PIET
SBFC
SNFC
TARH
WBSW
WBWP
WEBD
WHVWWWCSYBFD
YELWYEVB
YEWB

168 | ECOLOGICAL ASSESSMENTS IN THE B+WISER SITES
Figure 49. CCA biplot of 13 mammals and 18 environmental variables.
Line vectors represent the variables, texts in red font represent the species, and circles indicate the sites. Polygons indicate the different habitat types (HtypeCVT=Cultivated, HtypeESG=Early Second Growth, HtypeASG=Advance Second Growth, HtypeOGD=Old Growth Dipterecarp Forest, HtpyeOGM=Old Growth Mossy Forest). The environmental variables used are distance to ridge top (DisRT), distance to valley bottom (DisVB), distance to forest edge (DisFE), present of fruiting trees/flowering trees (Fr_Fl_Trees), saplings (Sap), rattan, palms, herbs, rock, moss, trees with 6-25cm dbh (Dbh6_25) and trees with 25-100cm dbh (Dbh25_100), Canopy cover (Can), Midstorey cover (Mid), Understorey cover (Und) and signs of anthropogenic disturbances (Anthro). Species are coded as follows: CYBRA Cynopterus brachyotis DOCHA Dobsonia chapmani HAFIS Haplonycteris fischeri HAWHI Harpyionycteris whiteheadi MAMIN Macroglossus minimus MISCH Miniopterus schreibersii MYRUF Myotis rufopictus PTJAG Ptenochirus jagori PTPUM Pteropus pumilus RHARC Rhinolophus arcuatus RHVIR Rhinolophus virgo, and ROAMP Rousettus amplexicaudatus
Amphibians
Eigenvalue for CCA Axis 1 is 0.28 and CCA axis 2 is 0.19 while the accounted variance is 37.9%
and 25.9%, respectively.
-4 -2 0 2 4
-4-2
02
4
CCA Variables and Species Scores
Axis 1
Axis
2
HtypeASGHtypeCVT
HtypeESG
0
DistVB
DistRT
DistFEFFT
Can
Mid
Sap
Rattan
Palms
Herbs
Rocks
Moss
Dbh6_25
Dbh25_100
CYBRA
DOCHA
HAFIS
HAWHI
MAMIN
MISCH
MYRUF
NYRAB PTJAG
PTPUM
RHARC
RHVIR
ROAMP

ECOLOGICAL ASSESSMENT IN THE B+WISER SITES | 169
Figure 50. CCA biplot of 11 species of amphibians and 23 environmental variables.
Line vectors represent the variables, texts in red font represent the species, and circles indicate the sites. Polygons indicate the different habitat types (HtypeCVT=Cultivated, HtypeESG=Early Second Growth, HtypeASG=Advance Second Growth, HtypeOGD=Old Growth Dipterecarp Forest, HtpyeOGM=Old Growth Mossy Forest). The environmental variables used in this analysis are ground temperature (GroundTemp), relative humiditiy (RelHum), distance to water bodies (Diswb), present of saplings (Sap), erecting bamboo (Ebamb), rattan, palms, pandan, grass, herbs, ferns, rock, moss, leaf litter (Leaf_Litter), trees with 6-12cm dbh (Dbh6_12) and trees with 12-25cm dbh (Dbh12_25), trees with 25-50cm dbh (Dbh25_50), ground cover, Canopy cover (Can), Midstorey cover (Mid), Understorey cover (Und) and signs of anthropogenic disturbances (Anthro). Species ordinated are Limnonecte_visayanus Hylarana_erythreae Platymantis_corrugatus Platymantis_dorsalis Platymantis_guentheri Platymantis_hazelae Polypedates_leucomystax Occidozyga_laevis Hylarana_everetti and Rhacophorus_pardalis
Reptiles
CCA Axis 1 has an eigenvalue of 0.50 with an accounted variance of 27.4%. Axis 2 has an
eigenvalue of 0.33 and 18.2% accounted variance.
-4 -2 0 2 4
-4-2
02
4
CCA Variables and Species Scores
Axis 1
Axis
2
HtypeASG
HtypeESG
0
DistWB
Canopy
Midstorey
Sap
Rattan
Palms
Limnonecte_visayanus
Platymantis_corrugatus
Platymantis_dorsalis
Platymantis_guentheri
Platymantis_hazelae
Polypedates_leucomystax
Occidozyga_laevisHylarana_everetti
Rhacophorus_pardalis

170 | ECOLOGICAL ASSESSMENTS IN THE B+WISER SITES
Figure 51. CCA biplot of 12 reptiles and 30 environmental variables.
Line vectors represent the variables, texts in red font represent the species, and circles indicate the sites. Polygons indicate the different habitat types (HtypeCVT=Cultivated, HtypeESG=Early Second Growth, HtypeASG=Advance Second Growth, HtypeOGD=Old Growth Dipterecarp Forest, HtpyeOGM=Old Growth Mossy Forest). The environmental variables used in this analysis are ground temperature (GroundTemp), relative humiditiy (RelHum), distance to ridge top (Diswb), humus/litter thickness (Humus) average crown cover (AveCC), present of natural dead woods and cut dead woods, natural (FLN) and cut (FLC) fallen logs, saplings (Sap), erecting bamboo (Ebamb), rattan, palms, pandan, grass, herbs, ferns, rock, moss, leaf litter (Leaf_Litter), trees with 6-12cm dbh (Dbh6_12) and trees with 12-25cm dbh (Dbh12_25), trees with 25-50cm dbh (Dbh25_50), ground cover, Canopy cover, Midstorey cover and Understorey cover. The species that were ordinated are Brachymeles_sp, Bronchocela_marmorata, Draco_Spilopterus, Pseudogekko_compressicorpus, Gonocephalus_sophiae, Pinoyscincus_jagori, Ahaetulla_prasina, Pseudorabdion _montanum, Cyclocorus_lineatus, Psammodynastes_pulverulentus and Sphenomorphus_sp.
MKNRP
Flora (Trees)
Species-habitat association of 46 trees and 15 habitat variables was attained by CCA axes 1 and 2 with axis
1 having an eigenvalue of 0.84 and an accounted variation of 27.3% while axis 2 have 0.70 eigenvalue and
22.8% accounted variation.
-10 -5 0 5 10
-50
5
CCA Variables and Species Scores
Axis 1
Axis
2
HtypeASG
HtypeCVT
HtypeESGHtypeOGD 0
DistRT
HumusDWN
DWC
Canopy Midstorey
Understorey
Sap Rattan
Palms
Pandan
Rock
MossLeaf_Litter
GroundCover
Dbh12_25
Dbh25_50
Brachymeles_spBronchocela_marmorata
Draco_Spilopterus
Pseudogekko_compressicorpus
Gonocephalus_sophiaePinoyscincus_jagori
Ahaetulla_prasina
Pseudorabdion._montanum.
Cyclocorus_lineatus
Psammodynastes_pulverulentusSphenomorphus_spX

ECOLOGICAL ASSESSMENT IN THE B+WISER SITES | 171
Figure 52. CCA biplot of 46 tree species and 15 environmental variables.
Line vectors represent the variables, texts in red font represent the species, and circles indicate the sites. Polygons indicate the different habitat types (HtypeCVT=Cultivated, HtypeESG=Early Second Growth, HtypeASG=Advance Second Growth, HtypeOGD=Old Growth Dipterecarp Forest, HtpyeOGM=Old Growth Mossy Forest). The environmental variables used in this analysis are: altitude, canopy height, average DBH (AvgDBH), moss, humus/litter thickness (HLThickness), tree diameter measuring 6-12cm (DBH6_12), tree diameter measuring 12-25cm (DBH12_25), tree diameter measuring 50-100cm (DBH50_100), understorey, signs of anthropogenic disturbance (SignAnthro), palms, crown cover, rattan, grass and herbs as represented by line vectors. Species are coded as follows: ACERLA Acer laurinum, AGATPH Agathis philippinensis, CALOIN Calophyllum inophyllum, CINNME Cinnamomum mercadoi, DACRIM Dacrycarpus imbricatus, MALLMO Mallotus mollisimus, PALATE Palaquium tenuipetiolatum, SHORNE Shorea negrosensis, SHORPO Shorea polysperma, SYZYNI Syzygium nitidum.
Birds
The eigenvalue for Axis 1 is 0.36 with an accounted variance of 29.8% while Axis 2 is 0.19 and
15..3%.
Pycnonotus goiavier (Yellow-vented Bulbul), Centropus viridis (Philippine Coucal), and
Loriculus philippensis (Colasisi) are associated to non-forest habitats. Sightings of the
endangered Spizaetus philippensis (Philippine Hawk-Eagle) are made in areas associated with
cultivated habitats.
The left-hand side of the main axis represents forest habitats as evinced by increasing presence of
medium to large trees (25-50 cm DBH and 50-100 cm DBH) and dense canopy cover. Species
associated to this habitat type include the vulnerable Coracina mindanensis (Black-bibbed
Cuckoo-shrike), the near-threatened Basilornis miranda (Apo Myna), the near-threatened
Hypothymis helenae (Short-crested Monarch), and the near-threatened Rhynomyias goodfellowi
(Slaty-backed Jungle Flycatcher).
-4 -2 0 2 4
-4-2
02
4
CCA Variables and Species Scores
Axis 1
Axis
2 HtypeASG
HtypeCVT
HtypeESG
-10
1
Altitude
HLThickness
Understorey
SignAnthroRattan
Palms
GrassHerbs
Moss
DBH6_12
DBH12_25
DBH50_gr100
CanopyHeight
AvgDBH
CrownCover
ACERLA
AFZERHAGATPH
ALSEPH
ARTOHE
CALOINCASTEV
CINNME
DACRIM
DACRRO
DISCCY
ELAE
ERYTSUEUCADE
EUSIZW
FICUBO
FICUCA
FICUHEFICUIN
GUIOKO
LITHLL
LITH
LITHSU
MAESEM
MALLMO
MELIDU
MYRIJA
PALATE
PARAFA
PHYLHY
PODONE
PODORU
PODO
PRUMA
PTERIN
PTERMA
SHORAL
SHORNESHORPO
SPATCA
SWIEMA
SYZYDESYZYNI SYZY
TOONCA
TREMOR

172 | ECOLOGICAL ASSESSMENTS IN THE B+WISER SITES
Figure 53. CCA biplot of 40 birds and 23 environmental variables.
Line vectors represent the variables, texts in red font represent the species, and circles indicate the sites. Polygons indicate the different habitat types (HtypeCVT=Cultivated, HtypeESG=Early Second Growth, HtypeASG=Advance Second Growth, HtypeOGD=Old Growth Dipterocarp Forest, HtpyeOGM=Old Growth Mossy Forest). The environmental variables used in this analysis are: distance to ridge top (DistRT), distance to forest edge (DistFE), fruiting trees (FrTrees), percentage canopy (CanCov), percentage midstorey (MidCov), percentage understorey (UndCov), sapling (Sap), erecting bamboo (Ebamb), rattan, palms, pandan, grass herbs, ferns, rock, moss, leaf litter, ground, altitude, tree diameter measuring 12-25cm (Dbh12_25), tree diameter measuring 25-50cm (Dbh25_50), tree diameter measuring 50-100 (Dbh50_100) and tree diameter measuring 100 cm (Dbh100). Species are coded as follows: AMBD Phapitreron amethystine APOM Basilornis mirandus BACF Rhipidura nigrocinnamomea BBCS Corasina mindanensis BCRT Prioniturus discurus BLCK Actenoides hombroni BLFC Centropus melanops BLFT Rhipidura superciliaris BMWE Lophozosterops goodfellowi BRTB Macronous striaticeps BUKW Scolopax bukidnonensis CELM Hypothymis coelestis CINI Hypocryptadius cinnamomeus COLA Loriculus philippensis COLE Sarcops calvus ELET Parus elegans GREF Muscicapa griseistica GRHS Aethopyga primigenius MORT Prioniturus montanus MOUT Orthotomus cuculatus MOVF Eumyias panayensis MOWE Zosterops montanus PHCD Macropygia tenuirostris PHFB Irena cyanogastra PHIB Ixos philippinus PHIC Centropus viridis PHIT Harpactes ardens PHLW Phylloscopus olivaceus PHSE Spilornis holospilus SBJF Rhinomyias goodfellowi SHCM Hypothymis helenae SPAD Dicrurus bracteatus SUBN Sitta oenochlamys TARH Penelopides panini,WEBD Phapitreron leucotis WRHB Rhabdotorrhinus leucocephalus YBFD Ptilinopus occipitalis YBWH Pachycephala philippensis and YEVB Pycnonotus goiavier .
Bats
CCA Axis 1 has an eigenvalue of 0.50 with an accounted variance of 37.90%. CCA Axis 2 has an
eigenvalue of 0.31 and accounted variance of 23%,
Bat centroids on the left-hand side of the axis such as Cynopterus brachyotis (Lesser dog-faced
fruit bat), Macroglossus minimus (Dagger-toothed long-nosed fruit bat) and the endemic
Ptenochirus jagori (Greater Musky fruit bat) are associated with cultivated and degraded habitats.
Species found on the right-hand side of the axis include Harpyionycteris whiteheadi (Harpy fruit
bat), Rhinolophus inops (Philippine forest horseshoe bat) and Haplonycteris fischeri (Philippine
pygmy fruit), all of which are associated with early secondary to advanced secondary forests.
Both R. inops and H. fischeri are endemic to the Philippines.
-2 0 2
-3-2
-10
12
3
CCA Variables and Species Scores
Axis 1
Axis
2
HtypeASG HtypeCVT
HtypeESG
-10
1
DistRT
DistFE
FrTrees
CanCovMidCov
UndCov
Sap
Ebamb
Rattan
PalmsPandan
GrassHerbs
Ferns
Rock
Moss
Leaf_Litter
Ground
Altitude
Dbh12_25
Dbh25_50
Dbh50_100
Dbh100
AMBD
APOM
BACF
BBCS
BCRTBLCK
BLFCBLFT
BMWE
BRTB
BUKWCELM
CINICOLA
COLE
ELET
GREF
GRHS
TARHMORT
MOUTMOVF
MOWEPHCDPHFB PHHE
PHIB
PHIC
PHITPHLW
PHSE
SBJF
SHCM
SPAD
SUBN
WEBD
WRHB
YBFD
YBWH
YEVB

ECOLOGICAL ASSESSMENT IN THE B+WISER SITES | 173
Figure 54. CCA biplot of 13 species of bats and 25 environmental variables.
Line vectors represent the variables, texts in red font represent the species, and circles indicate the sites. Polygons indicate the different habitat types (HtypeCVT=Cultivated, HtypeESG=Early Second Growth, HtypeASG=Advance Second Growth, HtypeOGD=Old Growth Dipterocarp Forest, HtpyeOGM=Old Growth Mossy Forest). The environmental variables used in this analysis are: distance to ridge top (DistRT), distance to forest edge (DistFE), distance to valley bottom (DistVB), fruiting trees (FrTrees), percentage canopy (CanCover), percentage midstorey (MidCover), percentage understorey (UndCover), sapling (Sap), erecting bamboo (Ebamb), rattan (Rat), palm, pandan, grass, herbs, ferns, rock, moss, leaf litter (LeafLit), percentage ground cover (GrdCov), tree diameter measuring 6-12cm (Dbh6_12), tree diameter measuring 12-25cm (Dbh12_25), tree diameter measuring 25-50cm (Dbh25_50), tree diameter measuring 50-100cm (Dbh50_100) and tree diameter measuring 100cm (Dbh100). Species used for this analysis are Cynopterus brachyotis, Dyacopterus rickartii, Eonycteris spelaea, Haplonycteris fischeri, Harpyionycteris whiteheadi, Kerivoula cf hardwickii, Macroglossus minimus, Megaerops wetmorei, Philetor brachypterus, Pipistrellus cf javanicus, Ptenochirus jagori, Ptenochirus minor and Rhinolophus inops.
Amphibians
The eigenvalue for CCA axis 1 is 0.54 while Axis 2 is 0.44. The accounted variance is 23.03%
and 18.63%, respectively.
-6 -4 -2 0 2 4 6
-4
-2
0
2
4
CCA Variable and Species Scores
Axis 1
Axis
2
HtypeASGHtypeCVTHtypeESG
0
Alt
DistRT
DistFE
DistVB
FrTrees
CanCover
UndCover
Ebamb
Rattan
Palm
Pandan
Grass
Herbs
Ferns
Rock
Moss
LeafLit
GrdCov
Dbh6_12
Dbh12_25 Dbh25_50
Dbh50_100
Dbh100
CynBra
DyaRicEonSpe
HapFis
HarWhi
KerHar
MacMin
MegWet
PhiBra
PipJav
PteJagPteMin
RhiIno

174 | ECOLOGICAL ASSESSMENTS IN THE B+WISER SITES
Figure 54. CCA biplot for 22 species of frogs and 18 environmental variables.
Line vectors represent the variables, texts in red font represent the species, and circles indicate the sites. Polygons indicate the different habitat types (HtypeCVT=Cultivated, HtypeESG=Early Second Growth, HtypeASG=Advance Second Growth, HtypeOGD=Old Growth Dipterocarp Forest, HtpyeOGM=Old Growth Mossy Forest). The environmental variables used in this analysis are: percentage canopy, percentage midstorey (Mid), percentage understorey (Under), sapling (Sap), erecting bamboo (Ebamb), rattan, pandan, grass, ferns, rock, moss, leaf litter (LeafLit), percentage ground cover (Ground), tree diameter measuring 6-12cm (Dbh6_12), tree diameter measuring 12-25cm (Dbh12_25), tree diameter measuring 25-50cm (Dbh25_50), tree diameter measuring 50-100cm (Dbh50_100) and tree diameter measuring 100cm (Dbh100). Species are coded as follows: AnsMue Ansonia muelleri HylGra Hylarana grandocula KalPle Kalophrynus pleurostigma LepLum Leptobrachium lumadorum LimMag Limnonectes magnus MegSte Megophrys stejnegeri NycSpi OccLae Occidozyga laevis PelBre Pelophryne brevipes PelLig PhiAcu Philautus acutirostris PhiSur Philautus surdus PhiSp Philautus sp. PlaCor Platymantis corrugatus PlaDor Platymantis dorsalis PlaGue Platymantis guentheri PlaSp Platymantis sp. PolLeu Polypedates leucomystax StaNat Staurois natator LimPar Limnonectes parvus PhiPoe Philautus poecilius PhiWor Philautus worcesteri.
Reptiles
The eigenvalue for CCA Axis 1 is 0.87 while Axis 2 is 0.85 and the accounted variance is 12.9%
and 12.7%.
Species positioned on the lower part of the ordination are associated with early secondary forest.
This includes Sphenomorphus coxi, Sphenomorphus diwata and Tropidophorus davaoensis.
Species community in this habitat is influenced mainly by understorey parameters as indcated by
increasing thickness of leaf litter, increasing presence grass and ferns.
While species on the upper part are associated to advanced secondary forest. Environmental
parameters that mainly influence the reptile’s community are small to medium trees, increasing
presence of rattan and moss.
-4 -2 0 2 4
-4-3
-2-1
01
2
CCA Variable and Species Scores
CCA1
CC
A2
HtypeASGHtypeCVT
HtypeESG
0
Canopy
Mid
Under
Sap
Ebamb
Rattan
Pandan
Grass
Ferns
Rock
Moss
LeafLit
Ground
Dbh6_12
Dbh12_25
Dbh25_50
Dbh50_100
Dbh100
AnsMue
HylGra
KalPle
LepLum
LimMagMegSte
NycSpi
OccLae
PelBre
PelLig
PhiAcu
PhiSur
PhiSp
PlaCorPlaDor
PlaGue
PlaSp
PolLeu
StaNat
LimPar
PhiPoePhiWor

ECOLOGICAL ASSESSMENT IN THE B+WISER SITES | 175
Figure 55. CCA biplot of 21 reptiles and 17 environmental variables.
Line vectors represent the variables, texts in red font represent the species, and circles indicate the sites. Polygons indicate the different habitat types (HtypeCVT=Cultivated, HtypeESG=Early Second Growth, HtypeASG=Advance Second Growth, HtypeOGD=Old Growth Dipterocarp Forest, HtpyeOGM=Old Growth Mossy Forest). The environmental variables used in this analysis are: percentage canopy, percentage midstorey (Mid), percentage understorey (Under), sapling (Sap), erecting bamboo (Ebamb), rattan, grass, ferns, rock, moss, leaf litter (LeafLit), percentage ground cover (Ground), tree diameter measuring 6-12cm (Dbh6_12), tree diameter measuring 12-25cm (Dbh12_25), tree diameter measuring 25-50cm (Dbh25_50), tree diameter measuring 50-100cm (Dbh50_100) and tree diameter measuring 100cm (Dbh100). Species are coded as follows: DracoSp Draco sp., CycLin Cyclocorus lineatus,CyrAgu Cyrtodactylus agusanensis DraLin Draco lineatus MatInt Maticora intestinalis OxyMod Oxyrhabdium modestum RhaAur Rabdophis auriculata SphCox Sphenomorphus coxi SphDiw Sphenomorphus diwata SphJag Sphenomorphus jagori PsaPul Psammodynastes pulverulentus GonSop Gonocephalus interruptus LipiniaSp Lipinia sp. TriFla Trimeresurus flavomaculatus TroDav Tropidophorus davaoensis VarSal Varanus salvator AhaPra Ahaetulla prasina preocularis BraGra Brachymeles gracilis DenCau Dendrelaphis caudolineatus ElaEry Elaphe erythrura.
-2 0 2 4
-3-2
-10
12
34
CCA Variable & Species Scores
CCA1
CC
A2
HtypeASG
HtypeESG
0
Canopy
Mid
Under
Sap
Ebamb
Rattan
Grass
Ferns
Rock
Moss
LeafLit
Ground
Dbh6_12
Dbh12_25 Dbh25_50
Dbh50_100Dbh100
DracoSp
CycLin
CalCali
CyrAgu
DraLin
MatInt
OxyMod
RhaAur
SphCoxSphDiw
SphJag
PsaPul
GonSop
LipiniaSpTriFla
TroDav
VarSal
AhaPra
BraGra
DenCau
ElaEry

176 | ECOLOGICAL ASSESSMENTS IN THE B+WISER SITES
ANNEX D. NICHE WIDTH AND NICHE POSITION OF KEY SPECIES
NSMNP
Flora (Trees)
Species positioned in forest habitats with narrow niche width include the endemic Celtis
philippinesis, Agathis philippinensis, Diospyrus philippinensis and Palaquium luzoniense.
Macaranga bicolor, Octomeles sumatrana and Parkia timoriana are some species positioned in
forest interface and can withstand in cultivated areas.
Species such as Dillenia philippinensis, Shorea negrosensis, Shorea palosapis, Shorea
polysperma and Syzigium ciliato-setosum appeared as forest generalists with wide niche.
Figure 56. Niche width and niche position of 35 species of birds in different habitat types.
Habitat types are labeled as follows: CVT=Cultivated, ESG=Early Second Growth Forest, ASG=Advance Second Growth Forest, OGF=Old Growth Forest.
ANTH Anisoptera thurifera ARRI Artocarpus rigidus CAIN Calophyllum inophyllum CEPH Celtis philippinensis DIPH Dillenia philippinensis DIOPH Diospyrus philippensis DIGR Diptetrocarpus grandiflorus DRDA Dracontomelon dao DUMO Duabanga moluccana FINO Ficus nota FICU Ficus sp. FIVA Ficus variegata GAVE Garcinia venulosa GUIS Guisat KANAR Kanaring KULI Kulipapa LITH Lithocarpus sp. LILE Litsea leytensis MABI Macaranga bicolor MATA Macaranga tanarius MAAL Mangifera altissima NAOR Nauclea orientalis NELA Nephelium lappaceum, OCSU Octomeles sumatrana PALU Palaquium luzoniensis PAPH Palaquium philippense PAMA Parashorea malaanonan PTIN Pterocarpus indicus SHAS Shorea astylosa SHCO Shorea contorta SHGU Shorea guiso SHNE Shorea negrosensis SHPA Shorea palosapis SHPO Shorea polysperma SYCI Syzigium ciliato-setosum SYTR Syzygium tripinnatum
Birds
Species positioned in forest habitats with narrow niche include the endemic species Mulleripicus
funebris (Sooty Woodpecker), Aethopyga flagrans (Flaming Sunbird), Lepidogrammus cumingi

ECOLOGICAL ASSESSMENT IN THE B+WISER SITES | 177
(Scale-feathered Malkoha) and Dicaeum australe (Red-keeled Flowerpecker). This suggests that
these species are specialist.
Species with wide niche that extends from forest to disturbed habitats include Parus elegans
(Elegant Tit), Dicaeum trigonostigma (Orange-bellied Flowerpecker), Ixos philippinus
(Philippine Bulbul) and Orthotomus castaneiceps (Philippine Tailorbird). This result suggests
that these species are generalist and have high tolerance to disturbance.
Figure 57. Niche width and niche position of 36 species of trees in different habitat types. Habitat types are labeled as follows: CVT=Cultivated, ESG=Early Second Growth Forest, ASG=Advance Second Growth Forest, OGF=Old Growth Forest. AMBD Phapitreron amethystinus, BALIC Dicrurus balicassius, BBCS Coracina striata, BCS Coracina coerulescens, BNM Hypothymis azurea, BHF Rhipidura cyaniceps, BS Brown Shrike, BZFP Dicaeum, COLA Loriculus philippensis, EMDOVE Chalcophaps indica, ELTIT Parus elegans, FLSB Aethopyga flagrans, GUAIA Bolbopsittacus lunulatus LTLW Phylloscopus cebuensis OLBFP Prionochilus olivaceusOLBSB Cinnyris jugularisORBFP Dicaeum trigonostigma PBUL Ixos philippinusPCOU Centropus viridis PFBB Irena cyanogastra, PTAILB Orthotomus castaneiceps, PTROG Harpactes ardens PURTSB Nectarinia sperata REDKFP Dicaeum australe RUFCOU Centropus unirufus SCFMAL Phaenicophaeus cumingi SOWP Mulleripicus funebris WBMUN Lonchura leucogastra WBSHAM Copsychus luzoniensis WEBD Phapitreron leucotis WLOR Oriolus albiloris YBWHI Pachycephala philippinensis YBFDOVE Ptilinopus occipitalis YWEYE Zosterops nigrorum YWBUL Pycnonotus urostictus.
Kaliwa-UMRBPL
Flora (Trees)
Species niche positions suggest that Canarium ovatum, Ficus balete, Ficus odorata, Heritiera
sylvatica, and Hopea acuminate prefer cultivated and degraded forest habitats. Broussonetia
luzonica, Celtis philippinensis, Ficus variegate, Lagerstroemia speciosa, and Antidesma bunius
prefer early second growth forests while Ceiba pentandra, Gmelina arborea, Nauclea orientalis,
Pterocarpus indicus, Samanea saman, and Swietenia macrophyla has their mean positioned in
advance second growth forest.

178 | ECOLOGICAL ASSESSMENTS IN THE B+WISER SITES
Most of the trees have narrow niche width this could either mean that these trees are specialists or
because of few samples.
Figure 58. Niche width and niche position of trees in Kaliwa-UMRBPL in different habitat types.
Habitat types are labeled as follows: CVT=Cultivated, ESG=Early Second Growth Forest, ASG=Advance Second Growth Forest, OGF=Old Growth Forest.Species are coded as follows: BLUZ Broussonetia luzonica, COVA Canarium ovatum CPEN Ceiba pentandra CPHI Celtis philippinensis DPIL Diospyros pilosanthera FBAL Ficus balete FNOT Ficus nota FODO Ficus odorata FVAR Ficus variegate GARB Gmelina arborea HSYL Heritiera sylvatica LSPE Lagerstroemia speciosa MGRA Macaranga grandifolia MLAN Mitrephora lanotan NORI Nauclea orientalis PNOD Polyscias nodosa PIND Pterocarpus indicus SSAM Samanea saman SMAC Swietenia macrophyla SCUM Syzygium cumini, SNIT Syzygium nitidum, HACU Hopea acuminate, ABUN Antidesma bunius.
Birds
Figure 59. Niche width and niche position of birds in different habitat types.

ECOLOGICAL ASSESSMENT IN THE B+WISER SITES | 179
Habitat types are labeled as follows: CVT=Cultivated, ESG=Early Second Growth Forest, ASG=Advance Second Growth Forest, OGF=Old Growth Forest. Species coded as follows: AMBD Phapitreron amethystine BALI Dicrurus balicassius BCFD Ptilinopus leclancheri BLNM Hypothymis azurea BRUC Cacomantis variolosus BUFP Dicaeum hypoleucum COED Chalcophaps indica COLA Loriculus philippensis COLE Sarcops calvus COSB Megalaima haemacephala ELET Parus elegans GRFB GUAI Bolbopsittacus lunulatus LABC Corvus macrorhynchos LESC Centropus bengalensis LUSB Stachyris striata LUZT Penelopides manillae PHCD Macropygia tenuirostris PHIB Ixos philippinus PHIC Centropus viridis PHIT Harpactes ardens PHTB Orthotomus castaneiceps PPWP Dendrocopos maculatus REBP Pitta erythrogaster RECM Phaenicophaeus superciliosus RUFC Centropus unirufus RUFH Buceros hydrocorax SCFM Phaenicophaeus cumingi SPOD Streptopelia chinensis WBSW Brachypteryx montana WEBD Phapitreron leucotis WHBS Copsychus luzoniensis WTKF Halcyon smyrnensis YBFD Ptilinopus occipitalis YEVB Pycnonotus goiavier YEWB Pycnonotus urostictus.
Amphibians
Figure 60. Niche width and niche position of amphibians in different habitats. Habitat types are labeled as follows: CVT=Cultivated, ESG=Early Second Growth Forest, ASG=Advance Second Growth Forest, OGF=Old Growth Forest. Species are coded as follows: Platcor Platymantis corrugatus, Platdorsalis Platymantis dorsalis Kalopicta Kaloula picta, Hylasimilis Hylarana similis Occilaevis Occidozyga laevis Limnmac Limnonectes macrocephalus and Polyleu Polypedates leucomystax.

180 | ECOLOGICAL ASSESSMENTS IN THE B+WISER SITES
Reptiles
Figure 61. Niche width and niche position of reptiles in different habitat types.
Habitat types are labeled as follows: CVT=Cultivated, ESG=Early Second Growth Forest, ASG=Advance Second Growth Forest, OGF=Old Growth Forest.

ECOLOGICAL ASSESSMENT IN THE B+WISER SITES | 181
Bats
Figure 62. Niche width and niche position of mammals in different habitat types.
Habitat types are labeled as follows: CVT=Cultivated, ESG=Early Second Growth Forest, ASG=Advance Second Growth Forest, OGF=Old Growth Forest. Species are coded as CYBRA cynopterus brachyotis EOROB eonycteris robusta EOSPE eonycteris spelaea HAFIS haplonycteris fischeri HIDIA hipposideros diadema KEWHI kerivoula whiteheadi MAMIN macroglossus minimus MESPA megaderma spasma OTCAR octopterupus cartilagonodus PTJAG ptenochirus jagori RHARC rhinolophus arcuatus ROAMP rousettus amplexicaudatus SASAC saccolaimus saccolaimus TYPAC tylonycteris pachypus TYROB tylonycteris robustula.
BRWFR
Flora (Trees)
The boxplot results show that medians of 13 species of trees are positioned below the mean,
which could indicate preference to increasing forest quality. Agathis philippinensis (AGATPH),
(DENDSP), Macaranga bicolor (MACABI), Palaquium luzoniense (PALALU), Palaquium sp.1
(PALASP1), Parashorea malaanonan (PARAMA), Syzygium sp.1 (SYZY1), Syzygium sp.2
(SYZY2), Syzygium sp.5 (SYZY5), Syzygium sp.9 (SYZY9), Tristianopsis decorticata (TRISDE),
show exclusive preference to forested areas, ranging from advanced secondary growth (ASG) to
old growth forest (OG). Exhibiting a narrow niche width, these species may be regarded as forest
dependents.
Five species of trees, Bischofia javanica (BISHJA), Palaquium sp.2 (PALASP2), Shorea
negrosensis (SHORNE), S. polysperma (SHORPO), Syzygium sp.6 (SYZY6) shows wider niche
widths suggesting that these species can occupy a wide range of habitat types. The Critically
Endangered (CR) Shorea contorta (SHORCO) and Syzygium sp.2 (SYZYSP2) are positioned
above the mean which may be suggestive of the species’ preference to forested areas specifically
the lowland types.
The boxplot results show that medians of ten (10) species are positioned below the mean, which
may indicate preference to increasing forest quality. Agathis philippinensis (AGATPH),
Dendrocnide sp. (DENDSP), Macaranga bicolor (MACABI), Palaquium luzoniense (PALALU),
Parashorea malaanonan (PARAMA), Swietenia macrophylla (SWIEMA) Syzygium sp.1 (SYZY1),
Syzygium sp.5 (SYZY5), Syzygium sp.9 (SYZY9), Tristianopsis decorticata (TRISDE), show

182 | ECOLOGICAL ASSESSMENTS IN THE B+WISER SITES
exclusive preference to forested area ranging from advanced secondary growth to old growth
forest. Thus, they tend to have narrow niche width, which confirms the species dependence to
relatively good forest habitats.
Five species Bischofia javanica (BISHJA), Palaquium sp.2 (PALASP2), Shorea negrosensis
(SHORNE), Shorea polysperma (SHORPO), Syzgium sp.6 (SYZY6) shows wider niche width
indicating that these species may be found in a wide range of habitat types. The Critically
Endangered Shorea contorta (SHORCO) and Syzgium sp.2 (SYZYSP2) are positioned above the
mean, which could suggest that although the species prefer forest habitats, it can also, tolerate
some degree of habitat disturbance.
Figure 63. Niche width and niche position of trees in different habitat types. Habitat types are labeled as follows: CVT=Cultivated, ESG=Early Second Growth Forest, ASG=Advance Second Growth Forest, OGF=Old Growth Forest. Species are coded as follows: AGATHPH Agathis philippinensis, BISCHJA Bischofia javanica, DACRIM Dacrycarpus imbricatus, DENDSP Dendrochnide sp., MACABI Macaranga bicolor, MACATA Macaranga tanarius, MYRIPH Myristica philippinensis, PALALU Palaquium luzoniense, PALASP1 Palaquium sp. 1, PALASP2 Palaquium sp. 2, PARAMA Parashorea malaanonan, SHORCO Shorea contorta, SHORNE Shorea negrosensis, SHORPO Shorea polysperma, SWIEMA Swietenia macrophylla, SYZY1 Syzygium sp. 1, SYZY2 Syzygium sp. 2, SYZY3 Syzygium sp. 3 , SYZY4 Syzygium sp. 4, SYZY5 Syzygium sp. 5, SYZY6 Syzygium sp. 6, SYZY7 Syzygium sp. 7, SYZY8 Syzygium sp. 8, SYZY9 Syzygium sp. 9, TRISDE Tristaniopsis decorticate.
Birds
For the survival envelopes of key species of birds, results show that the median of all 34 bird
species were positioned close to or on the center of the habitat continuum (matured stage to early
stage), confirming that all of these species prefer forest with some degree of disturbance.
25 species (Amethyst brown-dove, Balicassiao, Blue-headed fantail, Blue-backed parrot, Coleto,
Elegant tit, Metallic pigeon, Mountain white-eye, Mountain verditer flycatcher, Negros striped

ECOLOGICAL ASSESSMENT IN THE B+WISER SITES | 183
babbler, Pink-bellied imperial pigeon, Philippine pygmy woodpecker, Philippine tailorbird, Pied
triller, Snowy-browed flycatcher, White-breasted wood-swallow, White-eared brown-dove,
White-vented whistler, White-winged cuckoo-shrike, Yellow-bellied whistler, Yellow-vented
bulbul, Yellow-wattled bulbul, and Yellow-breasted fruit-dove) are positioned above the mean,
which may indicate preference to matured forest type but with some degree of tolerance to habitat
degradation. With a wide niche width, these species can also occupy a wide range of forest
habitat types ranging from OG to ESG forests.
Species such as Blue-naped parrot, Tarictic hornbill, White-bellied wood-pecker, Lovely sunbird,
Philippine tailorbird, Cetrine canary flycatcher and Philippine coucal show a higher preference to
advance secondary growth (ASG) and old growth (OG) forests.
Figure 64. Niche width and niche position of birds in different habitat types. Habitat types are labeled as follows: CVT=Cultivated, ESG=Early Second Growth Forest, ASG=Advance Second Growth Forest, OGF=Old Growth Forest. Species are coded as follows: AMBD Phapitreron amethystine BALI Dicrurus balicassius BHFT Rhipidura cyaniceps BLBP Tanygnathus sumatranus BLNP Tanygnathus lucionensis salvadorii CCFC Culicicapa helianthea COLE Sarcops calvus ELET Parus elegans LOSB Aethopyga shelleyi METP Columba vitiensis anthracina MOWE Zosterops montanus MVFC Eumyias panayensis NESB Stachyris nigrorum PBIP Ducula poliocephala PHCD Macropygia tenuirostris PHIB Ixos philippinus PHIC Centropus viridis PHIT Harpactes ardens PHTB Orthotomus castaneiceps PHWP Dendrocopos maculatus PIET Lalage nigra SBFC Ficedula hyperythra nigrorum TARH Penelopides panini WBSW Brachypteryx montana WBWP Dryocopus javensis WEBD Phapitreron leucotis WHVW Pachycephala homeyeri WWCS Coracina ostenta YBFD Ptilinopus occipitalis YEWE Zosterops nigrorum YEVB Pycnonotus goiavier YEWB Pycnonotus urostictus.
Bats Species that show a narrow range in niche width include Yellow-faced horseshoe bat
(Rhinolophus virgo), Orange-fingered myotis (Myotis rufopictus) and Little golden-mantled
flying fox (Pteropus pumilus). The latter is endemic to the Philippines and is considered as a Near
Threatened (NT) species (IUCN RedList 2014).
Species with wider range of niche width include Common short-nosed fruit bat (Cynopterus
brachyotis), Philippine pygmy fruit bat (Haplonycteris fischeri), Dagger-toothed fruit bat
CVT
ESG
ASG

184 | ECOLOGICAL ASSESSMENTS IN THE B+WISER SITES
(Macroglossus minimus), Philippine tube-nosed fruit bat (Nyctimene rabori), Musky fruit bat
(Ptenochirus jagori) and Arcuate horseshoe bat (Rhinolophus arcuatus).
Figure 65. Niche width and niche position of bats in different habitat types.
Habitat types are labeled as follows: CVT=Cultivated, ESG=Early Second Growth Forest, ASG=Advance Second Growth Forest, OGF=Old Growth Forest. Species are coded as follows: CYBRA Cynopterus brachyotis DOCHA Dobsonia chapmani HAFIS Haplonycteris fischeri HAWHI Harpyionycteris whiteheadi MAMIN Macroglossus minimus MISCH Miniopterus schreibersii MYRUF Myotis rufopictus PTJAG Ptenochirus jagori PTPUM Pteropus pumilus RHARC Rhinolophus arcuatus RHVIR Rhinolophus virgo, and ROAMP Rousettus amplexicaudatus
Amphibians
The results of the species are positioned closely to habitat continuum (secondary growth forest to
forest edges). All the frog species except Limnonectes visayanus are positioned below the mean,
which may indicate preference to secondary growth forest. On the other hand, Occidozyga laevis
shows a wide range of habitat preference, ranging from degraded forest to forest edges. L.
visayanus prefer habitat on forest edges.
All the frog species selected have tolerance to degraded forest except for Limnonectes visayanus.
Occidozyga laevis prefer also habitat on forest edges aside from degraded forest.
CVT
ESG

ECOLOGICAL ASSESSMENT IN THE B+WISER SITES | 185
Figure 66. Niche width and niche position of amphibians in different habitats. Habitat types are labeled as follows: CVT=Cultivated, ESG=Early Second Growth Forest, ASG=Advance Second Growth Forest, OGF=Old Growth Forest. Species are coded as follows: Limnonecte_visayanus Hylarana_erythreae Platymantis_corrugatus Platymantis_dorsalis Platymantis_guentheri Platymantis_hazelae Polypedates_leucomystax Occidozyga_laevis Hylarana_everetti and Rhacophorus_pardalis
MKRNP and MANP
Flora (Trees)
Figure 67. Niche width and niche position of trees in different habitat types. Habitat types are labeled as follows: CVT=Cultivated, ESG=Early Second Growth Forest, ASG=Advance Second Growth Forest, OGF=Old Growth Forest. Species are coded as follows: ACERLA Acer laurinum, AGATPH Agathis philippinensis, CALOIN
CVT
ESG

186 | ECOLOGICAL ASSESSMENTS IN THE B+WISER SITES
Calophyllum inophyllum, CINNME Cinnamomum mercadoi, DACRIM Dacrycarpus imbricatus, MALLMO Mallotus mollisimus, PALATE Palaquium tenuipetiolatum, SHORNE Shorea negrosensis, SHORPO Shorea polysperma, SYZYNI Syzygium nitidum.
Birds
Species with narrow niche width are the vulnerable Actenoides hombroni (Blue-capped
Kingfisher), Centropus melanops (Black-faced Coucal), and Rhiphidura superciliaris (Blue
fantail). These species are specialists and have lower tolerance to disturbances.
Loriculus philippensis, Centropus viridis, and Phapitreron leucotis (White-eared Brown Dove)
are examples of species with wide niche width, denoting higher tolerance to anthropogenic
disturbances.
Figure 68. Niche width and niche position of birds in different habitat types. Habitat types are labeled as follows: CVT=Cultivated, ESG=Early Second Growth Forest, ASG=Advance Second Growth Forest, OGF=Old Growth Forest. Species are coded as follows: AMBD Phapitreron amethystine APOM Basilornis mirandus BACF Rhipidura nigrocinnamomea BBCS Corasina mindanensis BCRT Prioniturus discurus BLCK Actenoides hombroni BLFC Centropus melanops BLFT Rhipidura superciliaris BMWE Lophozosterops goodfellowi BRTB Macronous striaticeps BUKW Scolopax bukidnonensis CELM Hypothymis coelestis CINI Hypocryptadius cinnamomeus COLA Loriculus philippensis COLE Sarcops calvus ELET Parus elegans GREF Muscicapa griseistica GRHS Aethopyga primigenius MORT Prioniturus montanus MOUT Orthotomus cuculatus MOVF Eumyias panayensis MOWE Zosterops montanus PHCD Macropygia tenuirostris PHFB Irena cyanogastra PHIB Ixos philippinus PHIC Centropus viridis PHIT Harpactes ardens PHLW Phylloscopus olivaceus PHSE Spilornis holospilus SBJF Rhinomyias goodfellowi SHCM Hypothymis helenae SPAD Dicrurus bracteatus SUBN Sitta oenochlamys TARH Penelopides panini,WEBD Phapitreron leucotis WRHB Rhabdotorrhinus leucocephalus YBFD Ptilinopus occipitalis YBWH Pachycephala philippensis and YEVB Pycnonotus goiavier .

ECOLOGICAL ASSESSMENT IN THE B+WISER SITES | 187
Bats
Figure 69. Niche width and niche position of bats in different habitat types.
Habitat types are labeled as follows: CVT=Cultivated, ESG=Early Second Growth Forest, ASG=Advance Second Growth Forest, OGF=Old Growth Forest. Species used for this analysis are Cynopterus brachyotis, Dyacopterus rickartii, Eonycteris spelaea, Haplonycteris fischeri, Harpyionycteris whiteheadi, Kerivoula cf hardwickii, Macroglossus minimus, Megaerops wetmorei, Philetor brachypterus, Pipistrellus cf javanicus, Ptenochirus jagori, Ptenochirus minor and Rhinolophus inops
Reptiles Species positioned in early secondary forest with wide niche, e.g., Sphenomorphus coxi,
Sphenomorphus diwata and Rhabdophis auriculata are more generalist, which indicate that they
do not have specific habitat requirement as compared to specialist species such as Brachymeles
gracilis.

188 | ECOLOGICAL ASSESSMENTS IN THE B+WISER SITES
Figure 70. Niche width and niche position of reptiles in different habitat types.
Habitat types are labeled as follows: CVT=Cultivated, ESG=Early Second Growth Forest, ASG=Advance Second Growth Forest, OGF=Old Growth Forest. Species are coded as follows: DracoSp Draco sp., CycLin Cyclocorus lineatus,CyrAgu Cyrtodactylus agusanensis DraLin Draco lineatus MatInt Maticora intestinalis OxyMod Oxyrhabdium modestum RhaAur Rabdophis auriculata SphCox Sphenomorphus coxi SphDiw Sphenomorphus diwata SphJag Sphenomorphus jagori PsaPul Psammodynastes pulverulentus GonSop Gonocephalus interruptus LipiniaSp Lipinia sp. TriFla Trimeresurus flavomaculatus TroDav Tropidophorus davaoensis VarSal Varanus salvator AhaPra Ahaetulla prasina preocularis BraGra Brachymeles gracilis DenCau Dendrelaphis caudolineatus ElaEry Elaphe erythrura.

ECOLOGICAL ASSESSMENT IN THE B+WISER SITES | 189
ANNEX E. B+WISER DIRECTORY
DENR PROGRAM STEERING COMMITTEE FOR.RICARDO L. CALDERON, CESO III Chair Director, Forest Management Bureau (FMB) Department of Environment and Natural Resources FMB Bldg., Visayas Avenue, Diliman 1100 Quezon City Phone: 928-9313/927-4788; Fax: 920-0374 Email address: [email protected] MS. LOURDES G. FERRER Co-Chair Director for Program Implementation Office of the Undersecretary for Field Operations (OUFO) Department of Environment and Natural Resources Visayas Avenue, Diliman 1100 Quezon City Phone: 928-4969; Fax: 929-4969 Email address: [email protected] DR. THERESA MUNDITA S. LIM Member Director, Protected Areas and Wildlife Bureau (PAWB) Department of Environment and Natural Resources Ninoy Aquino Parks and Wildlife Center Diliman, 1100 Quezon City Phone: 924-6031 to 35 local 203 & 204; Fax: 920-4417 Email address: [email protected] ENGR. EDWIN G. DOMINGO Member Overall Director, Foreign-Assisted and Special Projects Office (FASPO) Department of Environment and Natural Resources Visayas Avenue, Diliman 1100 Quezon City Phone: 925-2344; Fax: 926-8065 Email address: [email protected] DR. HENRY A. ADORNADO Member Director, Ecosystems Research and Development Bureau (ERDB) Department of Environment and Natural Resources University of the Philippines at Los Baños College, Laguna Phone: (049) 536-3628; Fax: (049) 536-2850 Email address: [email protected]

190 | ECOLOGICAL ASSESSMENTS IN THE B+WISER SITES
FOR. ERIBERTO C. ARGETE, CESO IV Member Director, Planning and Policy Studies Office (PPSO) Department of Environment and Natural Resources Visayas Avenue, Diliman 1100 Quezon City Phone: 929-6626 local 2043, 925-1184 Email address: [email protected] ENGR. LEO L. JASARENO Member Director, Mines and Geo-Sciences Bureau (MGB) Department of Environment and Natural Resources MGB Compound North Avenue, Diliman Quezon City Phone: 920-9120; 920-9130; Fax 920-1635 Email address: [email protected] DR. RIJALDIA N. SANTOS Member Director, Resource Data Analysis Branch National Mapping and Resource Information Authority (NAMRIA) Lawton Avenue, Fort Andres Bonifacio 1638 Taguig City Phone: 884-2857 / 816-1033 Email address: [email protected]

ECOLOGICAL ASSESSMENT IN THE B+WISER SITES | 191
TECHNICAL WORKING GROUP FOR.MAYUMI MA. QUINTOS-NATIVIDAD OIC, Assistant Director Forest Management Bureau (FMB) Department of Environment and Natural Resources FMB Bldg., Diliman, 1100 Quezon City Phone: 927-4784; 928-2778; TeleFax: 920-8650 Email address: [email protected] FOR.EDNA D. NUESTRO Chief, Forest Policy, Planning and Knowledge Management Services Division Forest Management Bureau (FMB) Department of Environment and Natural Resources FMB Bldg., Diliman, 1100 Quezon City Phone: 927-6217; TeleFax: 920-0368 Email address: [email protected] FOR.REMEDIOS T. EVANGELISTA Chief, Forest Plans & Standards Section Forest Management Bureau (FMB) Department of Environment and Natural Resources FMB Bldg., Diliman, 1100 Quezon City TeleFax: 928-2891 Email address: [email protected] FOR.NORMA M. MOLINYAWE OIC-Chief, National Parks Division Biodiversity Management Bureau (BMB) Department of Environment and Natural Resources Ninoy Aquino Parks and Wildlife Center Diliman, 1100 Quezon City Phone: 924-6031 to 35 local 232; TeleFax: 925-8947 Email: [email protected], [email protected] FOR. ARMIDA P. ANDRES OIC-Chief, Biodiversity Policy and Knowledge Management Division Biodiversity Management Bureau (BMB) Department of Environment and Natural Resources Ninoy Aquino Parks and Wildlife Center Diliman, 1100 Quezon City Phone: 924-6031 to 35 local 210; TeleFax: 920-4486 Email: [email protected]
FOR. MARLYNN M. MENDOZA OIC-Chief, Coastal and Marine Division Biodiversity Management Bureau (BMB) Department of Environment and Natural Resources Ninoy Aquino Parks and Wildlife Center Diliman, 1100 Quezon City Phone: 924-6031 to 35 local 226; TeleFax: 925-8950 Email: [email protected]

192 | ECOLOGICAL ASSESSMENTS IN THE B+WISER SITES
DR. CARMELITA VILLAMOR Ecosystems Research and Development Bureau (ERDB) Department of Environment and Natural Resources University of the Philippines at Los Baños College, Laguna Phone: (049) 536-2229, TeleFax: 536-7746 Email address: [email protected] FOR. MONINA M. CUNANAN Chief, Project Development and Evaluation Division Planning and Policy Studies Office (PPSO) Department of Environment and Natural Resources Visayas Avenue, Diliman 1100 Quezon City Phone: 929-6626 local 2042, 928-9737 Email address: [email protected] MS. LLARINA MOJICA OIC, Policy Studies Division Planning and Policy Studies Office (PPSO) Department of Environment and Natural Resources Visayas Avenue, Diliman 1100 Quezon City Phone: 929-6626 local 2046, TeleFax: 925-1183 Email address: [email protected] Ms. SOLITA CASTRO Senior Remote Sensing Technologist National Mapping and Resource Information Authority (NAMRIA) Lawton Avenue, Fort Andres Bonifacio 1638 Taguig City Phone: 810-4831 loc. 741 / 810-2891 / 884-2867 Email address: [email protected] MR. CONRAD BRAVANTE OIC-Chief, Project Monitoring Division Foreign-Assisted and Special Projects Service Department of Environment and Natural Resources Visayas Avenue, Diliman 1100 Quezon City Phone: 929-6626 local 2118, TeleFax: 927-6755 Email address: [email protected] MS. MOONYEEN MANRIQUE Project Officer, Project Monitoring Division Foreign-Assisted and Special Projects Service Department of Environment and Natural Resources Visayas Avenue, Diliman 1100 Quezon City TeleFax: 928-0028 Email address: [email protected]

ECOLOGICAL ASSESSMENT IN THE B+WISER SITES | 193
UNITED STATES AGENCY FOR INTERNATIONAL DEVELOPMENT (USAID) Mr. JEREMY GUSTAFSON Director Office of Environment, Energy, and Climate Change (OEECC) U.S. Agency for International Development Annex 2 Building, U.S. Embassy 1201 Roxas Boulevard 1000 Ermita, Manila, Philippines (632) 301-2129; Fax: (632) 301-6213 Email: [email protected] Mr. JOSEPH FOLTZ Deputy Director Office of Environment, Energy, and Climate Change (OEECC) U.S. Agency for International Development Annex 2 Building, U.S. Embassy 1201 Roxas Boulevard 1000 Ermita, Manila, Philippines Phone: (632) 301-4823; Fax: (632) 301-6213 Email: [email protected] Mr. OLIVER O. AGONCILLO Natural Resources Policy Advisor Office of Environment, Energy, and Climate Change (OEECC) U.S. Agency for International Development Annex 2 Building, U.S. Embassy 1201 Roxas Boulevard 1000 Ermita, Manila, Philippines Phone: (632) 301-4828; (632) 301-6000 local 4828; Fax: (632) 301-6213 Email: [email protected] Mr. RANDY JOHN N. VINLUAN Sustainable Landscape Specialist Office of Environment, Energy, and Climate Change (OEECC) U.S. Agency for International Development Annex 2 Building, U.S. Embassy 1201 Roxas Boulevard 1000 Ermita, Manila, Philippines Phone: (632) 301-4826; (632) 301-6000 local 4826; Fax: (632) 301-6213 Email: [email protected]

194 | ECOLOGICAL ASSESSMENTS IN THE B+WISER SITES
B+WISER PROGRAM KEY STAFF
Staff Designation E-mail Address Marian S. delos Angeles Chief of Party [email protected] Roberto B. Rapera Deputy Chief of Party [email protected] Ferdinand S. Esguerra Communications Specialist [email protected] Rojessa T. Saceda Communication Specialist [email protected] Rodolfo B. Santos, Jr. M&E Specialist [email protected] Nena O. Espiritu Sustainable Finance Specialist [email protected] Maria Zita B. Toribio Policy & Governance Specialist [email protected] Guillermo A. Mendoza REDD+/MRV Specialist [email protected] Elena Chiong-Javier Gender & Inclusion Specialist [email protected] Felix Gaschick Forestry & Biodiversity Specialist [email protected] Ryan Whisnant* Public-Private Partnership Specialist [email protected] Wilman C. Pollisco Legal & Alternate Dispute Specialist [email protected] Siegfried L. Batucan* Mapping & GIS Specialist [email protected] Raul M. Caceres* Social Marketing & BCC Consultant [email protected] Calixto E. Yao Coastal Forest Ecosystem Specialist [email protected] Restituta V. Antolin Field Manager – NSMNP [email protected] Roldan R. Dugay Field Manager – UMRBPL-KWFR [email protected] Marius M. Agua Field Manager – NLNP [email protected] Geoffrey E. Sa-ong Field Manager – QAW [email protected] Anselmo P. Cabrera Field Manager – BRWNP [email protected] Rodolfo V. Aragon Field Manager – MKRNP [email protected] Gregory Benjamin M. Luz Field Manager – MANP [email protected] Sarah M. Simmons Operations Manager [email protected] Susan R. Elizondo Procurement/SAF Manager [email protected] Catherine C. Pollisco Finance Manager [email protected] Nicanor P. Gonzalo Senior Accountant [email protected] Eugene C. Bennagen Technical Activity Manager [email protected] Robert R. Araño Sites Activity Manager rarañ[email protected] Jay Lowell H. Payuyo IT/MIS Specialist [email protected] Romero Y. Inamac Publications Associate [email protected] Ramil S. Alcala Program Associate [email protected] John Kevin D.G. Benico Program Associate [email protected] Desiree A. Donceras Program Associate [email protected] Joyce Lyn S. Molina Program Associate [email protected] Kent C. Tangcalagan Program Associate for IPs & Social Media [email protected] Ana Georgina C. Ciriaco Program Development Associate [email protected] Ina Karissa D. Tobias PCU Coordinator [email protected]
SUBCONTRACTORS FFI Neil Aldrin D. Mallari Biodiversity and Ecology Specialist [email protected] Jose Don T. de Alban RS/GIS Specialist [email protected] Edmund Leo B. Rico Carbon Inventory & Assessment Specialist [email protected] Orlando Arciaga Community Development Specialist [email protected] Angelica Kristina Monzon RS/GIS Data Analysis Associate angelica.monzon@fauna-flora. Christian Supsup RS/GIS Data Analysis Associate [email protected] Rizza Karen A. Veridiano Forest Carbon & Inventory Assess. Assoc. [email protected] Nevong Puna Biodiv Assess. (BA) & Monitoring Assoc. [email protected] Jackie Lou Wenceslao BA & Monitoring Associate [email protected] Laila Pornel Community Development Associate [email protected]

ECOLOGICAL ASSESSMENT IN THE B+WISER SITES | 195
ICRAF
Rodel P. Lasco REDD+ and Agro-Forestry Specialist [email protected] Florencia B. Pulhin Climate Change & Forest Biodiversity Sp. [email protected] Joan P. Urquiola Researcher [email protected]
HARIBON FOUNDATION*
Arlie Jo B. Endonila, Head, Training & Education Division
_________________ * Short-term/part-time
CHEMONICS INTERNATIONAL INC. – B+WISER PROGRAM Unit 201, 2nd Floor, CTC Building
2232 Roxas Boulevard, Pasay City Trunk Line: +63 2 550-1012/15/16
Fax: +63 2 552-1696
Related Documents


