ECOLOGICAL AND SOCIO-ECONOMIC IMPACTS OF DIVE AND SNORKEL TOURISM IN ST. LUCIA, WEST INDIES Nola H. L. Barker Thesis submitted for the Degree of Doctor of Philosophy in EnvironmentalScience Environment Department University of York August 2003

Welcome message from author
This document is posted to help you gain knowledge. Please leave a comment to let me know what you think about it! Share it to your friends and learn new things together.
Transcript
ECOLOGICAL AND SOCIO-ECONOMIC IMPACTS OF DIVE
AND SNORKEL TOURISM IN ST. LUCIA, WEST INDIES
Nola H. L. Barker
Thesis submitted for the Degree of Doctor of Philosophy
in
Environmental Science
Environment Department
University of York
August 2003
Abstract
Coral reefs provide many services and are a valuable resource, particularly for
tourism, yet they are suffering significant degradation and pollution worldwide. To
manage reef tourism effectively a greater understanding is needed of reef ecological
processes and the impacts that tourist activities have on them. This study explores the impact of divers and snorkelers on the reefs of St. Lucia, West Indies, and how
the reef environment affects tourists' perceptions and experiences of them. Observations of divers and snorkelers revealed that their impact on the reefs followed
certain patterns and could be predicted from individuals', site and dive
characteristics. Camera use, night diving and shore diving were correlated with higher levels of diver damage. Briefings by dive leaders alone did not reduce tourist
contacts with the reef but intervention did. Interviews with tourists revealed that
many chose to visit St. Lucia because of its marine protected area. Certain site
attributes, especially marine life, affected tourists' experiences and overall enjoyment
of reefs. Tourists were not always able to correctly ascertain abundance of marine life
or sediment pollution but they were sensitive to, and disliked seeing damaged coral,
poor underwater visibility, garbage and other tourists damaging the reef. Some
tourists found sites to be noisy and over-crowded both with people and boats. Many
tourists wanted more information on local marine life and said they would be willing
to pay more to visit sites within St. Lucia's marine protected area than was currently being asked. Such funds could enable better protection and management of St.
Lucia's reefs. Management recommendations include, among others, that all visitors be supervised on their dive and snorkel trips, that reef use be more evenly distributed
throughout the island and that restrictions be placed on the number of people allowed to use sites over a given period. This thesis demonstrates how countries could use
visitors to fund a greater proportion of their reef management costs, and that various
management strategies could contain and reduce tourism damage to reefs, whilst simultaneously accommodating an expansion in the reef-tourism industry.
Table of contents
Abstract Table of contents List of tables v List of figures vii Acknowledgments ix Declaration x
Chapter 1 Introduction 1 1.1 References 5
Chapter 2 Scuba diver behaviour and the management of diving impacts 8 on coral reefs 2.1 Abstract 8 2.2 Introduction 8 2.3 Methods 13
2.3.1 Study site and diver samples 13 2.3.2 Dive sites 13 2.3.3 Factors recorded 15 2.3.4 Statistical analyses 18 2.3.5 Constraints of methods used 21
2.4 Results 23 2.4.1 Diver characteristics 23 2.4.2 Dive site characteristics and diver behaviour underwater 26 2.4.3 Effect of dive leader briefing and intervention on diver 28
behaviour underwater 2.4.4 Diver behaviour and influencing characteristics 30 2.4.5 Prediction of the likelihood of a diver causing a contact 39 2.4.6 Prediction of the likelihood of a diver breaking coral 41 2.4.7 Predicting the rate of contacts 45 2.4.8 Predicting the rate of breakage 46
2.5 Discussion 49 2.6 References 55
Chapter 3 Snorkeler behaviour on coral reefs 60 3.1 Abstract 60 3.2 Introduction 61 3.3 Methods 64 3.4 Results 68 3.5 Discussion 74 3.6 References 77
ii
Chapter 4 Economic benefits of coral reef tourism and maximising 82 the potential for tourists to fund management of marine protected areas 4.1 Abstract 82 4.2 Introduction 83 4.3 Methods 87 4.4 Results 89
4.4.1 Visitor characteristics 89 4.4.2 Expenditure patterns 93 4.4.3 The SMMA and visitor's willingness to pay fees 96 4.4.4 Dive companies 103
4.5 Discussion 106 4.6 References 115
Chapter 5 Relationships between tourist perceptions and measured 122 attributes of coral reefs 5.1 Abstract 122 5.2 Introduction 123 5.3 Methods 125 5.4 Results 129
5.4.1 Questionnaire 1, Period 1 129 5.4.2 Questionnaire 2, Period 1 150 5.4.3 Questionnaire 3, Period 2 157
5.5 Discussion 160 5.6 References 165
Chapter 6 Management of coral reef tourism 169 6.1 Abstract 169 6.2 Introduction 170 6.3 Managing coral reefs for tourism 170
6.3.1 Marine protected areas and carrying capacity estimates 170 6.3.2 Choosing the tourism market 172 6.3.3 Management options for reef tourism 174
6.4 The case study of St. Lucia 177 6.4.1 Management options for St. Lucia's reef-tourism 181
6.5 Conclusion 187 6.6 References 188
Chapter 7 General discussion 194 7.1 Predicting damage to reefs 194 7.2 The socio-economic impact of dive and snorkel tourism 196 7.3 Visitor perceptions of reef attributes 197 7.4 Carrying capacities of St. Lucia's reefs 198 7.2 Conclusion and implications for management 198
iii
Appendices 200 Appendix A Questionnaire 1 200 Appendix B Questionnaire 2 202 Appendix C Questionnaire 3 205 Appendix D Questionnaire 4 207 Appendix E Content of a typical dive briefing 211 Appendix F Kernel density estimates for significant variables 212
used in the logistic regression Appendix G Range of environmental organisations belonged to, 219
and material read by visitors
iv
List of tables Chapter 2 Table 2.1 Dive sites and corresponding sample of divers observed ' 14 Table 2.2 Factors recorded for each dive during which a diver was observed 16 Table 2.3 Current rate classes 17 Table 2.4 Additional information gained from questioning divers observed 17 Table 2.5 Variables, their value and description used in the logistic and 20
multiple regression anaylses Table 2.6 Distribution of observed divers by country of residence 23 Table 2.7 Age and sex distribution of observed divers over the first sample 24
period Table 2.8 Sex, age and photographer status of divers 24 Table 2.9 Results of a Scheirer-Ray-Hare test on the effect of briefing and 29
intervention measures by dive leaders on the contact rate of divers Table 2.10 Distribution of contact results between shore and boat dives 32 Table 2.11 Effect of diver intent on contact number and result 33 Table 2.12 Results of a logistic regression of influences on the probability of a 40
diver causing a contact during their dive Table 2.13 Results of a logistic regression of influences on the probability of a 41
diver breaking a coral during their dive Table 2.14 Correlation matrix for variables used in the logistic regressions 44 Table 2.15 Variables with significant influence on divers causing a contact 45
during their dive Table 2.16 Influencing variable on the rate of breakage by divers 46 Table 2.17 Correlation matrix for variables used in the multiple regression 48
Chapter 3 Table 3.1 Factors recorded during snorkeler observations 66 Table 3.2 Independent variables used in the logistic regression for 67
predicting whether a snorkeler would have a contact or not during their snorkel
Table 3.3 Results of a logistic regression of influences on the probability of a 73 snorkeler causing a contact with the reef during their snorkel
Table 3.4 Comparison of contacts made by divers and snorkelers at three 76 sites
Chapter 4 Table 4.1 Number of dives planned by respondents that were diving in St. 92
Lucia Table 4.2 Percentage of divers and snorkelers taking part in underwater 93
photography and camera type used
V
Table 4.3 Total cost of trip according to type of accommodation used in St. 94 Lucia
Table 4.4 Total cost of trip per person classified by main purpose of visit 95 Table 4.5 Spending per person per day by main purpose of visit 95 Table 4.6 Income distribution of respondents 98 Table 4.7 Variables with significant influence on snorkelers' willingness to 100
pay
Chapter 5 Table 5.1 Fish species identified during counts 128 Table 5.2 Sites used by the company for their dive and snorkel trips 129 Table 5.3 Percentage of answers given by divers to various attributes that 150
would have improved their diving in St. Lucia Table 5.4 Visitors' top three motivations for diving or snorkeling in St. Lucia 151 Table 5.5 The importance of certain site attributes to visitors 151 Table 5.6 Percentage of answers given by visitors on attributes that they 152
enjoyed most Table 5.7 Percentage of answers given by visitors on attributes that reduced 153
their enjoyment of the marine environment of St. Lucia Table 5.8 Percentage of answers given by visitors on what would have 154
improved their diving or snorkeling experience Table 5.9 Percentage of answers given by visitors on attributes that they 155
associated with the best reef that they had ever visited Table 5.10 Percentage of answers given by visitors on attributes that they 156
associated with the worst reef that they had ever visited Table 5.11 Visitors' median perception scores for reef attributes at different 157
sites Table 5.12 Spearman's Rank Order Correlation test results of visitor 158
perception scores of reef attributes versus measured data on the same attributes
Table 5.13 Spearman's Rank Order Correlation test results for divers' and 159 snorkelers' overall satisfaction scores versus perceived and measured reef attributes
Chapter 6 Table 6.1 Estimates of carrying capacities for coral reefs 171 Table 6.2 Distribution of dive site use in St. Lucia (year 2000) and 180
corresponding estimate of number of dives done at each using 2001 data
Table 6.3 Potential increases in carrying capacity per site outside of the 184 SMMA and their estimated ecological and economic impacts
Table 6.4 Options for managing St. Lucia's reef tourism 186
vi
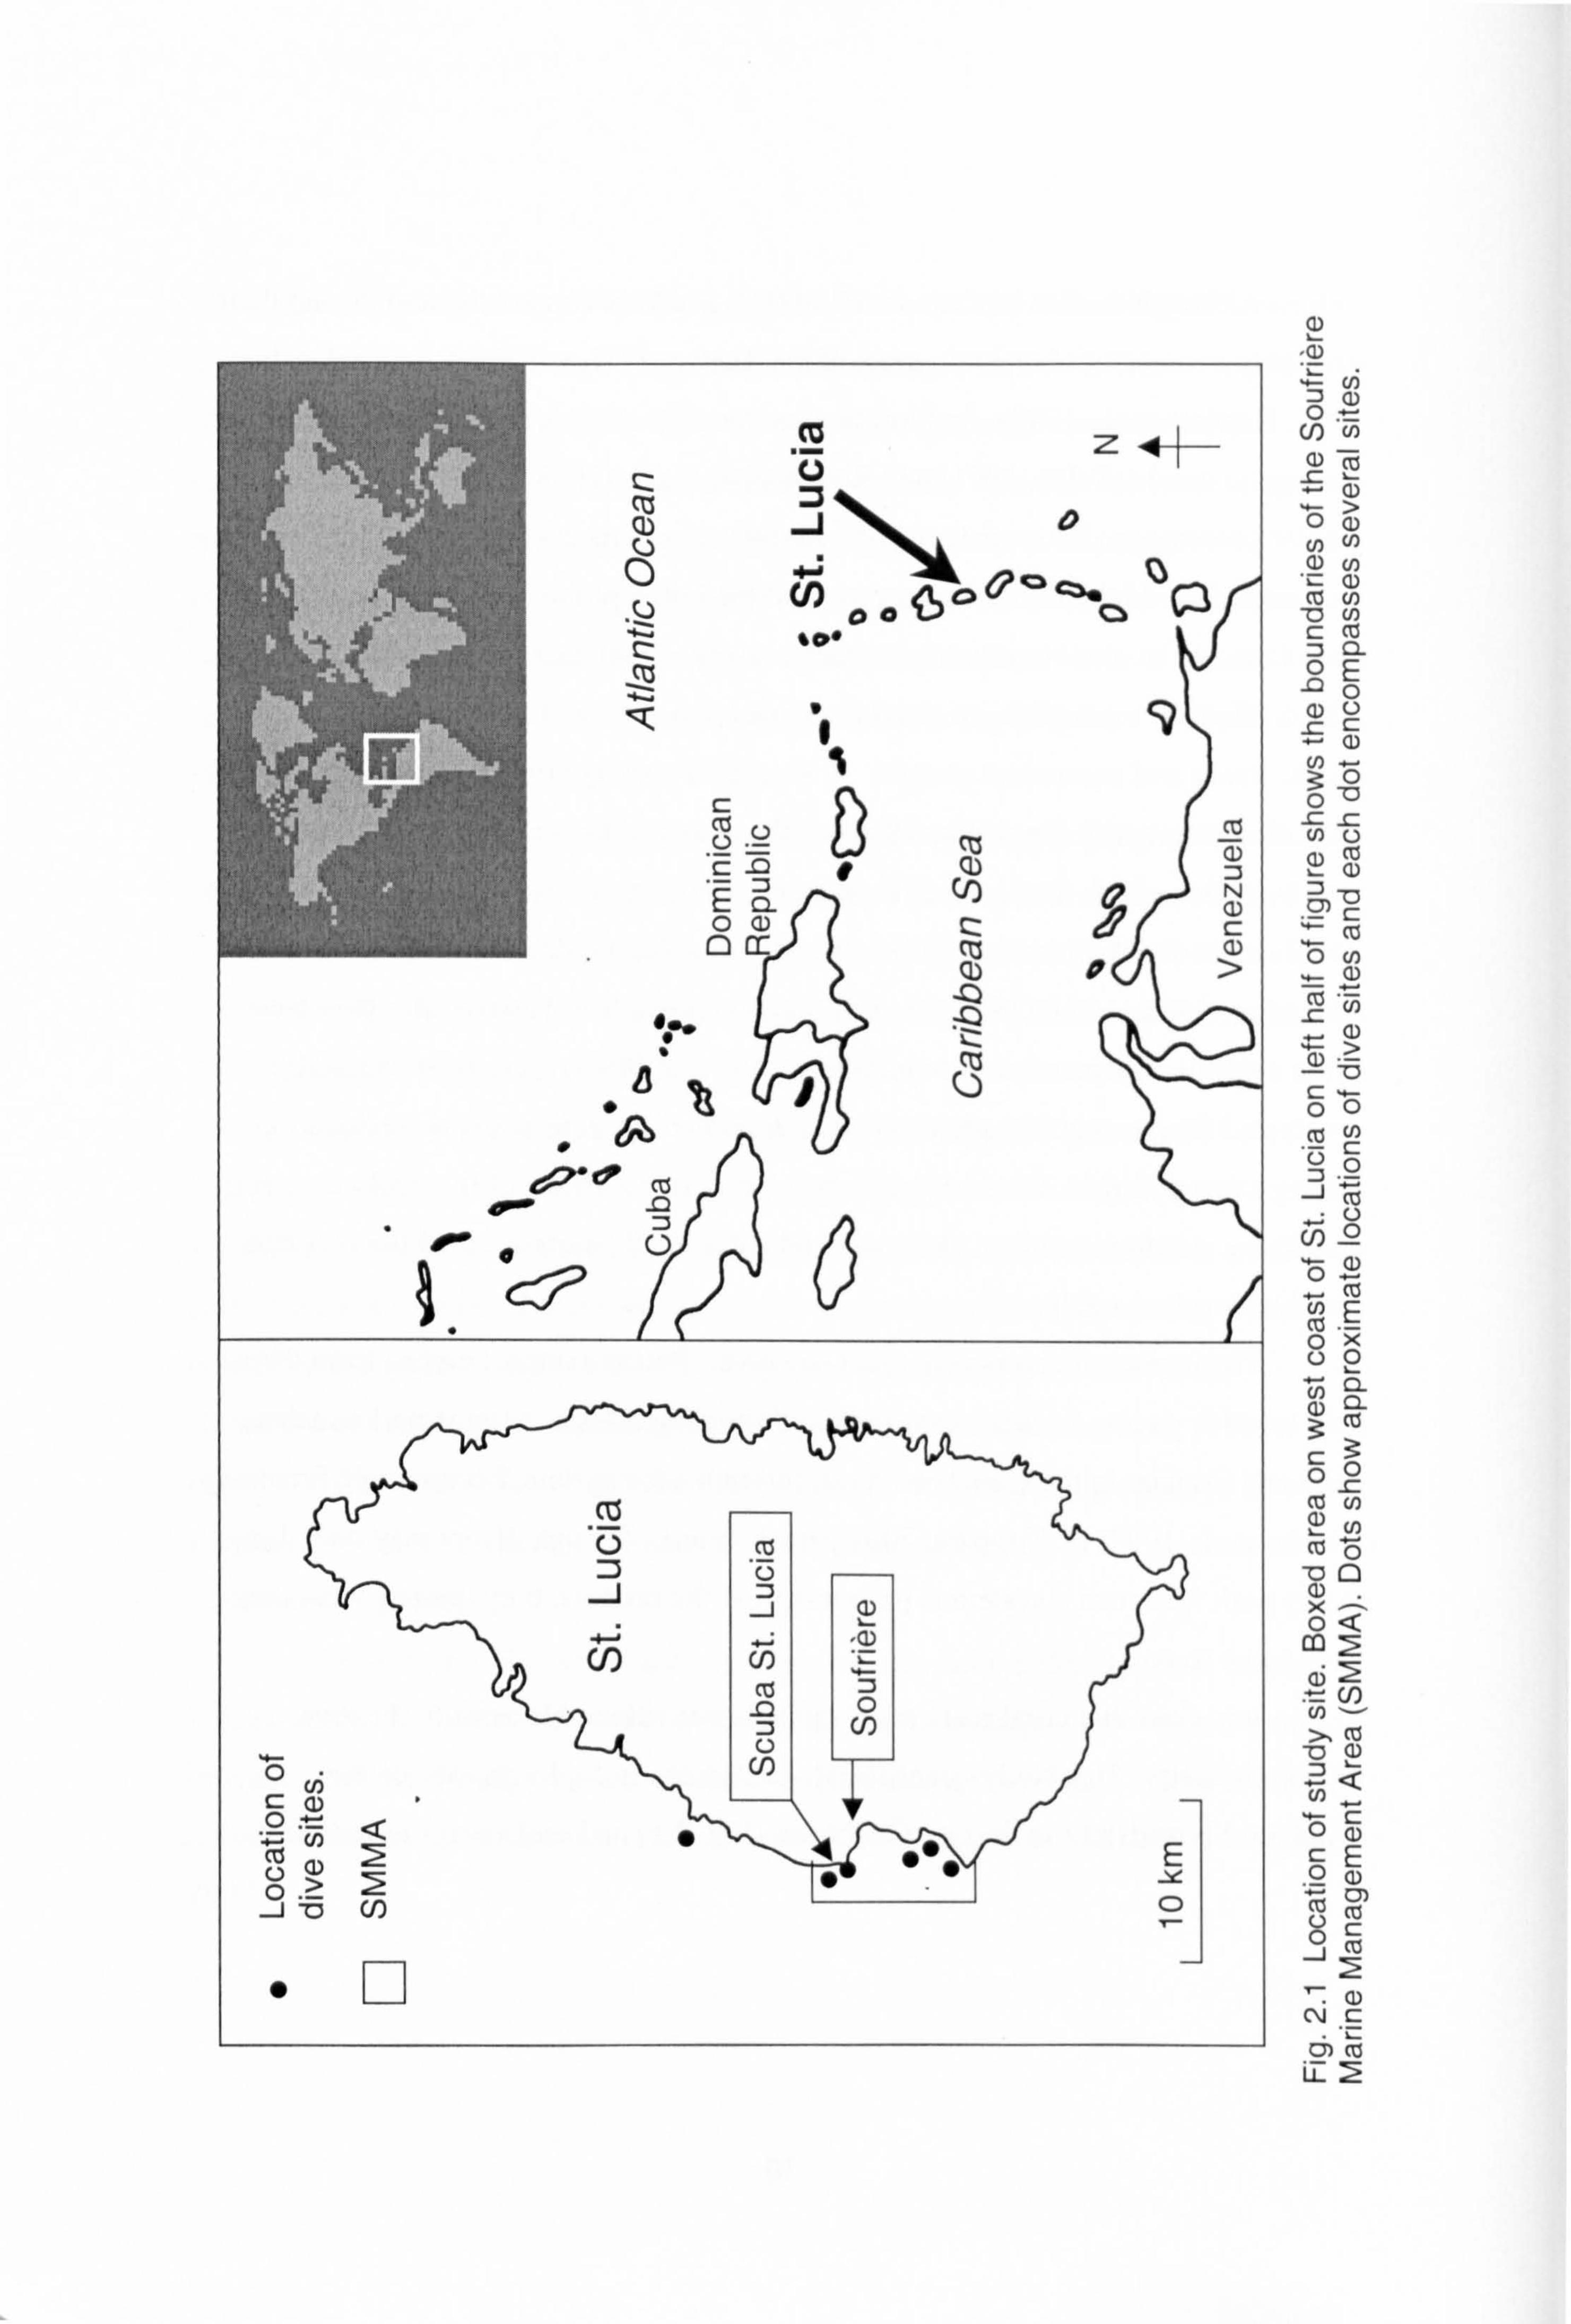
List of figures Chapter 2 Figure 2.1 Location of the study site 11 Figure 2.2 Number of dives completed by observed divers and expected 25
number of dives to be undertaken during their stay in St. Lucia Figure 2.3 Contact rates by divers according to dive site topography 26 Figure 2.4 Contact rates of divers and time period throughout the dive 28 Figure 2.5 The effect of briefing and intervention by dive leaders on diver 30
contact rate Figure 2.6 Number of contacts associated with particular parts of the diver's 31
body or their equipment Figure 2.7 Contact rate of divers taking photographs compared to divers 34
without cameras Figure 2.8 Distribution of diver contact rates according to their level of dive 35
qualification Figure 2.9 Contact rates of scuba divers and number of dives done on trip 36 Figure 2.10 Contact rates and number of dives completed during St. Lucia trip 37
at point of observation. Boat dives only Figure 2.11 Contact rate and time of dive 38 Figure 2.12 Comparison of contact rates from no current to strong current 39
Chapter 3 Figure 3.1 Sites used for 'organised' (a) and 'independent' (b) snorkel trips 65 Figure 3.2 Rates of snorkeler contacts with the reef from start of snorkel 69 Figure 3.3 Photographer status and contact rate 70 Figure 3.4 Snorkeler contact rate according to snorkel trip type and whether 72
or not they were given a briefing before the snorkel
Chapter 4 Figure 4.1 Number of days spent by respondents in St. Lucia 91 Figure 4.2 Number of dives planned by respondents that were diving in St. 92
Lucia Figure 4.3 Maximum amount visitors surveyed were willing to pay for use 97
of reefs in the Soufriere Marine Management Area in St. Lucia Figure 4.4 Maximum daily snorkeling fee respondents were willing to pay 99
according to income level Figure 4.5 Program rank distribution 102 Figure 4.6 Location of sites used by dive businesses in 2001 105
Chapter 5 Figure 5.1 Diver perception of fish abundance at dive sites 131 Figure 5.2 Diver perception of fish diversity 132
vii
Figure 5.3 Diver perceptions of small (<25cm long) and big (ý: 25crn long) 133 fish abundance
Figure 5.4 Diver perceptions of fish attributes versus measured fish attributes 134 Figure 5.5 Diver perception of amount of living coral 135 Figure 5.6 Diver perception of coral diversity 136 Figure 5.7 Diver perceptions of living coral versus measured coral attributes 137 Figure 5.8 Diver expectations versus their perceptions of fish, coral and 138
underwater visibility Figure 5.9 Diver perceptions of damage seen on reef 140 Figure 5.10 Divers' perception of trash 141 Figure 5.11 Diver perception of sediment and trash versus measured sediment 142
and trash Figure 5.12 Divers' enjoyment score versus their perception of coral damage, 144
sediment and trash Figure 5.13 Divers' enjoyment versus dive group size 145 Figure 5.14 Diver perception of underwater visibility 146 Figure 5.15 Measured underwater visibility readings 147 Figure 5.16 Diver perception scores versus measured underwater visibility 148 Figure 5.17 Divers' overall satisfaction according to site 149
viii

Acknowledgments
I sincerely thank my supervisor, Professor Callum Roberts for his guidance and support and members of my thesis advisory committee, Professor Dave Raffaelli, Dr
Riccardo Scarpa and Dr Piran White for their advice and comments on earlier drafts.
I am indebted to Karyn and Michael Allard, managers of Scuba St. Lucia, for giving
me use of their dive facilities and equipment, for allowing me to accompany their
guests on dive and snorkel trips and for their permission to modify the briefings given by their staff. I thank them and their staff and in particular Andr6 William for
delivering the intervention measures. My appreciation goes to Kai Wulf, manager of the Soufriere Marine Management Area for helpful discussions on management issues, and the Department of Fisheries for providing me with data on site use by dive
companies. I am grateful to all those divers and snorkelers who answered my questions,
and to the following who gave generously of their time and offered valuable information on their dive and snorkel businesses: Donovan Brown of Sandals,
Thomas DeNobrega of Frogs Diving Ltd., Ian Drysdale of Buddies Scuba, James
Emmanuel of Le Sport Hotel, Julie Lamber of Rendezvous Hotel, Jeremy Mutton and Vitus Joyeux of Jalousie Hilton Resort & Spa, Mark Oldfield of Regency Sea Sports,
Mia Smit of Scuba St. Lucia and Andrd St. Omer and Shannon Lawrence of Dive
Fair Helen.
I thank Dr Colin McClean, Geraldine Newton-Cross, James Barker, Julie
Hawkins and Jim Smart for their help with questionnaire construction, statistics and
editorial comments. Finally, my heartfelt thanks go to my husband James for his
endless encouragement, my parents, especially my father for his invaluable critique
of my work, and my soulmate Gerry for her unfailing friendship.
Fieldwork costs were part-funded by the Natural Environment Research
Council (NERC) and by the UK Department for International Development (DflD).
ix
Declaration
Staff employed at Scuba St. Lucia assisted me with my research by giving the
briefings on dive and snorkel trips and by carrying out pre-determined intervention
measures. Staff members also assisted me with underwater visibility measurements. Professor Callum Roberts and Julie Hawkins collected fish and coral attribute
measurements. Dr Christiane Schelten collected sediment measurements. I undertook all other data
collection, underwater observations and interviews with the public and managers of St. Lucia's dive companies. All data analysis and writing of this thesis is my own
work with the exception of the bootstrapping programme written by Dr Riccardo
Scarpa.
JU, - &u6, t
Nola H. L. Barker
x
Chapter 1: Introduction
Since the end of the second world war, tourism has exploded in terms of numbers of
people travelling, development and building of associated infrastructure and
provision of tourism services. Globally, the tourism industry is expected to grow by
5% per annum between 2002 and 2012 (VVTTC, 2002). Some of the fastest growth has been in coastal and marine areas (Miller, 1993; Orams, 1999), particularly those
with coral reefs (Hoegh-Guldberg, 1999). Coral reefs are biologically rich and
diverse, generally found in shallow waters and naturally erode to maintain some of
the finest beaches in the world (Bryant et al., 1998). As such they provide the ideal
environment to host the rising trend in activity and sport based holidays (Tabata,
1992; Dignam, 1990; EIU, 1994; Goodhead & Johnson, 1996) including scuba diving
(BSAC, 2002; PADI, 2002) and snorkeling, and people's increased interest in the
environment (Ceballos-Lascurdin, 1993).
The economic benefits from tourism associated with coral reefs are
significant, notwithstanding their role as a resource for fishing (Munro, 1996),
building materials, coastal protection and their use for development of drugs and
biochemicals (Carte, 1996). Coral reef tourism generates approximately US$ 1.1
billion in Australia (Done et al., 1996), US$1.8 billion in Florida, USA (Birkeland,
1997) and US$102.9 billion throughout the Caribbean (Jameson et al., 1995) (values
inflated by US GDP deflator 2002 = 100, World Bank data, 2003). One hundred
million tourists visit the Caribbean each year and scuba diving in the Caribbean alone
is projected to generate almost US$1 billion by the year 2005 (US Department of
State, 1998 cited in Hoegh-Guldberg, 1999).
Despite the obvious importance of coral reefs to people, between 50% and 80% of reefs are at risk (Bryant et al., 1998) from human pressures brought about by
human activities (Spalding, 2001). Almost half a billion people, 8% of the total
global population, live within 100 km of a coral reef. Human activities that are destructive to coral reefs include extractive ones such as mining and fishing and non-
extractive ones such as land clearance for agriculture and construction. Bare soil due
to land-based activities increases the potential for sediment and nutrients to enter the
drainage system, eventually bringing them into the marine environment. This can
cause change in species composition, decrease coral growth and adversely affect
water quality (Sladek Nowlis et al., 1997). Users such as divers and snorkelers may
also contribute directly to reef degradation (Rouphael, 1995; Harriott et al., 1997;
Muthiga & McClanahan, 1997; Hawkins et al., 1999; Zakai & Chadwick-Furman,
2002).
Human activities need not be 'in-situ' such as around coastal areas - but can be from distant sources spanning the whole globe. Mid-1997 to 1998 saw the biggest
'bleaching' event in history. Bleaching refers to the white calcareous skeleton of the
coral that can be seen through the coral's tissue after its symbiotic algae, usually
coloured, are expelled from the animal. Bleaching was blamed on increased water
temperatures caused by global warming and affected corals in the Middle East, East
Africa, the Indian Ocean, South, Southeast and East Asia, far West and far East
Pacific, the Caribbean, and the Atlantic Ocean (Wilkinson, 1998). In the Maldives
and Sri Lanka, losses in revenue due to bleaching in 1998 were estimated at US$3
million and US$ 200,000 respectively (Westmacott et al., 2000). Costs estimated from willingness of visitors to pay extra to experience unbleached reefs were an order
of magnitude higher, with an estimate of US$19 million for the Maldives and US$2.2
million for Sri Lanka (Westmacott et al., 2000).
The costs of reef degradation from local and global sources of pressure are
therefore significant. At the local scale, a starting point for countries relying on their
reefs for tourism, fishing, coastal defence and other uses, is to manage them to obtain
maximum benefit at minimum cost. For that to be achieved, impacts on the reefs of
the various uses and activities on land and sea need to be understood and quantified. My study site, St. Lucia, is an island state of 43km long by 23km wide in the
eastern Caribbean, that relies on its reefs for its dive and snorkel tourism industry.
The island has 160km2 of reefs that fringe much of the coast (Spalding et al., 2001),
2
with the best-developed and most used reefs in the south-west. Tourism is one of St.
Lucia's main industries and in 2001 accounted for 53% of GDP (WI`TC, 2002).
Little is known of the impacts of diving and snorkeling on the island's reefs nor how
the quality of the reefs may be affecting visitor perception and experience and thus
potentially influencing future tourism trends. There is already evidence of reef degradation at certain sites and steps to conserve some of the reefs resulted in the
establishment of the island's first marine protected area, the Soufriere Marine
Management Area (SMMA) in 1995. Dive companies also formed an association 'Anbaglo', Creole for 'underwater', to promote safe and sustainable sport diving in
St. Lucia. Anbaglo's objectives include improvement and expansion of the dive
industry, promoting sport diving as a non-extractive use of reefs, fostering harmony
between sport diving and other uses of reef resources, and assistance in training.
Baseline information on diver behaviour underwater is a prerequisite to further
develop management policy for the marine park and assist Anbaglo in achieving its
objectives. My research explored how the quality of coral reefs is affected by human
activities, including both the effect of divers and snorkelers themselves and the
implications of land-based activities, and whether coral reef quality affects visitor
perception. I hypothesised that damage to reefs could be predicted from visitor, dive
type and site characteristics, and that the ecological integrity of a reef would affect
visitors' appreciation of it and hence affect local community tourism revenue. Should these hypotheses be true then the implication is that it is in the interest of
stakeholders in the reef to see that reefs are well managed. It became obvious early in my research that reef quality does affect visitor perception, so I wanted to know
how the visitors' appreciation of the reef was related to biological and physical
attributes which could be measured, since that would affect the kind of management
action that would be appropriate. In addition, the value of protected areas was
measured by eliciting visitors' willingness to pay for marine park entrance fees and I
investigated whether visitors were prepared to pay above the current fee. By
3
measuring diver and snorkeler expenditures and the economic gains of dive
companies, I was able to ascribe a monetary value to the reef. That could be used to
build further support for managing the reefs and to develop measures to prevent other
activities, such as those on land, from damaging them.
My research objectives were therefore to:
1. determine what darnage divers and snorkelers were doing to the reefs and whether
damage could be predicted from visitor, dive or snorkel leader, or site
characteristics;
2. determine what the economic gains from dive and snorkel tourism were to the
country's tourism industry, to the dive and snorkel companies and to the marine
park, and whether visitors would be willing to pay more to use sites within the
marine park than they were cuffently paying;
3. determine whether the quality of the reef environment affected visitor
appreciation and how it compared to measured biological and physical attributes;
4. estimate the capacity of the various sites for diving and snorkeling taking into
account the information gathered on diver and snorkeler ecological impacts.
My results are divided into five chapters, Chapters 2 to 6. In Chapter 21
quantify diver damage and show that certain diver and dive site characteristics increased the likelihood of a diver damaging the reef. The time of dive and whether
or not dive leaders intervened when they saw a diver damaging the reef also appeared
to influence levels of damage. In Chapter 31 quantify snorkeler damage and reveal
that certain snorkeler characteristics influence their level of damage to the reef. I
show that although their levels of damage were lower than that found for divers,
4
higher densities of snorkelers at some sites could result in as much damage as that
expected from a few divers. In Chapter 41 calculate the economic benefits of coral
reef tourism to St. Lucia and its dive businesses and, using visitors' maximum
willingness to pay for marine park fees, I estimate the potential for tourists to fund
more of the marine park's management costs. From my interviews with visitors I
show in Chapter 5 factors that influenced visitors' perceptions and appreciation of St.
Lucia's dive and snorkel sites. I compare visitors' perception of certain reef
attributes with measurements taken by other researchers and myself, and show which
attributes were correctly perceived and which were not. Finally, in Chapter 6,1
summarise issues of reef resource use and the management tools that could help
managers reduce tourist damage to coral reefs. These include carrying capacity
estimates for St. Lucia's reefs and the importance of other factors such as distribution
of tourism over sites, increasing number of sites available, managing visitor behaviour and monitoring the ecology of the reef.
1.1 REFERENCES
Birkeland, C. (ed. ). 1997. Life and Death of Coral Reefs. Chapman and Hall, New York, 536 pp.
BSAC: British Sub-Aqua Club. 2002. Telford's Quay, South Pier Road, Ellesmere Port, Cheshire CH65 4FL, UK. http: //www. bsac. com
Bryant, D., Burke, L., McManus, J. & M. Spalding. 1998. Reefs at Risk. A Map- Based Indicator of Threats to the World's Coral Reefs. World Resources Institute, Washington, D. C., USA, 56 pp.
Carte, B. K. 1996. Biomedical potential of marine natural products. BioScience 46: 271-286.
Ceballos-Lascurdin, H. 1993. Ecotourism as a Worldwide Phenomenon. In: Lindberg, K., & D. E. Hawkins (eds), Ecotourism: A Guidefor Planners and Managers. The Ecotourism Society, North Bennington, VT, USA, pp. 175.
5
Dignam, D. 1990. Scuba gaining among mainstream travellers. Tour and Travel News, March 1990.
Done, T. J., Ogden, J. C. & W. J. Wiebe. 1996. Biodiversity and ecosystem function
of coral reefs. In: Mooney, H. A., Cushman, J. H., Medina, E., Sala, O. E. & E. D. Schulze (eds). Functional Roles of Biodiversity: A Global Perspective. Wiley, Chichester, UK, pp. 393-429.
EIU: The Economist Intelligence Unit Limited. 1994. Diving. In: Market segment: Watersports holidays. EIU Travel and Tourism Analyst 5: 45-50.
Goodhead, T. & D. Johnson. 1996. Coastal Recreation Management: 771e Sustainable Management of Maritime Leisure. E& FN Spon, London, UK, 332 pp.
Harriott, V. J., Davis, D. & S. A. Banks. 1997. Recreational diving and its impact in
marine protected areas in Eastern Australia. Ambio 26: 172-179.
Hawkins, J. P. Roberts, C. M., Van't Hof, T., De Meyer, K, Tratalos, J., & C. Aldam. 1999. Effects of recreational scuba diving on Caribbean coral and fish communities. Conservation Biology 13: 888-897.
Hoegh-Guldberg, 0.1999. Climate change, coral bleaching and the future of the world's coral reefs. Marine Freshwater Research 50: 839-866.
Jameson, S. C., McManus, J. W. & M. D. Spalding. 1995. State of the Reefs: Regional and Global Perspectives. US Department of State: Washington, D. C.
Miller, M. L. 1993. The rise of coastal and marine tourism. Ocean and Coastal Management 20: 181-199.
Munro, J. L. 1996. The Scope of Tropical Reef Fisheries and their Management. In: Polunin, N. V. C. & C. M. Roberts (eds). Reef Fisheries. Chapman and Hall, London pp. 1-14.
Muthiga, N. A. & T. R. McClanahan. 1997. The effect of visitor use on the hard coral communities of the Kisite Marine Park, Kenya. In: Proceedings of the Eighth International Coral Reef Symposium, Smithsonian Tropical Research Institute, Balboa, Panama 2: 1879-1882.
Orams, M. 1999. Marine Tourism: Development, Impacts and Management. Routledge, London, 115 pp.
PADI: Professional Association of Diving Instructors Statistics. 2002. http: //www. padi. com/news/stats
6
Rouphael, A. B. & G. J. Inglis. 1995. The Effect of Qualified Recreational Scuba Divers on Coral Reefs. CRC Reef Research Technical Report No. 4, James Cook University, Townsville, Australia, 39 pp.
Sladek Nowlis, J., Roberts, C. M., Smith, A. H. & E. Siirila. 1997. Human-enhanced impacts of a tropical storm on nearshore coral reefs. Ambio 26: 515-521.
Spalding, M. D., Ravilious, C. & E. P. Green. 2001. World Atlas of Coral Reefs. Prepared at the UNEP World Conservation Monitoring Centre. University of California Press, Berkeley, USA, 424 pp.
Tabata, R. S. 1992. Scuba Diving Holidays. In: Weiler, B. & C. M. Hall (eds). Special Interest Tourism (pp. 171-184). Belhaven Press, London, UK.
Westmacott, S., Pet-Soede, L. & H. Cesar. 2000. Assessment of the Socio-Economic Impacts of the 1998 Coral Reef Bleaching in the Indian Ocean. Report prepared for CORDIO programme, Coral Reef Degradation in the Indian Ocean, 149 pp.
Wilkinson, C. (ed. ). 1998. Status of Coral Reefs of the World- 1998. Australian Institute of Marine Science, Queensland and Western Australia, 184 pp.
World Bank. 2003. http: //devdata. worldbank. org/data-query/
WTTC: World Travel and Tourism Council. 2002. Saint Lucia Travel & Tourism: A World of Opportunity, WTTC, London, UK, 28pp. http: //www. wttc. org/measure/PDF/Saint%20Lucia. pdf
Zakai, D. & N. E. Chadwick-Furman. 2002. Impacts of intensive recreational diving on reef corals at Eilat, northern Red Sea. Biological Conservation 105: 179-187.
7
Chapter 2: Scuba diver behaviour and the management of diving impacts on coral reefs
2.1 ABSTRACT
Coral reefs worldwide are attracting increasing numbers of scuba divers leading to
growing concern about damage. There is now a need to manage diver behaviour
more closely especially as many dive companies are offering unlimited, unsupervised day and night diving from shore. I observed 353 divers in St. Lucia noting all their
contacts with the reef during their entire dive to quantify rates of damage and seek
ways of reducing it. Divers using a camera versus those not using one caused
significantly more contacts with the reef (mean 0.4 versus 0.2 contacts min-), as did
shore versus boat dives (mean 0.5 versus 0.2 contacts min-'), and night versus day
dives (mean 1.0 versus 0.4 contacts min-'). I tested the effect of a dive briefing given by local staff and the effect of dive leader intervention on rates of diver contact with
the reef. Briefing alone had no effect on diver contact rates or the probability of a diver breaking living substrate but dive leader intervention when a diver was seen to
touch the reef did. This reduced mean contact rates from 0.3 to 0.1 contacts min-' for
both shore and boat dives, and from 0.2 to 0.1 contacts min-' for boat dives. Given
that briefings alone are insufficient to reduce diver damage, I suggest that divers need
close supervision and dive leaders must manage diver behaviour in situ.
2.2 INTRODUCTION
Coral reefs are renowned for their beauty, diversity and the spectacular array of life
that they support and provide many important services to people. These include
coastal defence, fisheries, a focus for tourism and products for construction and
medicinal compounds. Despite their obvious value, coral reefs are in global decline
from a wide range of anthropogenic stresses. Pollution from sediment (Hodgson,
8
1993; Sladek Nowlis et al., 1997; Carias, 1998; Nemeth & Nowlis, 2001), chemicals (Guzmdn & Holst, 1993; Negri et al., 2002) and sewage (Walker & Ormond, 1982;
Bell, 1992; Koop et al., 2001) has led to a decrease in growth, reproduction and
survival rates of corals and other reef-associated species. The decline in reefs comes
at a time when marine tourism is greatly expanding. Technical advances in
equipment in addition to a rising interest in nature, conservation and environmental
matters (Ceballos-Lascurdin, 1993; Orams, 1999) have resulted in the increased
popularity of coral reef recreation, particularly scuba diving (Dignam, 1990; Tabata,
1992).
Financial gains from coral reef tourism can be significant, ranging from US$2
million per year for the tiny I 1km2 Caribbean island of Saba (Fernandes, 1995), to US$682 million gained in 1991-2 from tourists to the Great Barrier Reef, Australia (Driml, 1994). However, diving, once thought to be benign (Tilmant & Schmahl, 198 1; Talge, 1992; Hawkins & Roberts, 1992,1993) is not necessarily so. Signs of diver damage such as broken coral fragments, dead, re-attached and abraded corals have been reported at heavily used dive sites throughout the Caribbean, Red Sea and Australia (Muthiga & McClanahan, 1997; Hawkins et al., 1999; Tratalos & Austin, 2001; Zakai & Chadwick-Furman, 2002). Diver damage differs depending on the type of corals present. Branching corals appear to sustain most of the breaks
(Rouphael & Inglis, 1997; Garrabou et al., 1998) although Hawkins et al. (1999) found that due to their faster growth, percentage cover of branching corals in Bonaire increased by 8.2% in heavily dived areas, their expansion being at the expense of slower growing corals.
Certain dive and diver characteristics have also been linked to diver damage. Inexperienced divers, those with only basic training for example, have been found to be more likely to damage the reef (Roberts & Harriott, 1994). That finding is not universal though, as other studies found no such trend (Harriott et al., 1997; Rouphael,
1997).
9
Although studies indicate that 70-90 % of divers contact the reef during their
dive only a minority of them do most of the damage (Talge, 1991; Rouphael & Inglis,
1995; Harriott et al., 1997). In Florida, less than 2% of divers caused any discernible
damage to corals (Talge, 1991) and Rouphael & Inglis (1995) calculated that a
similar percentage (2%, consisting of 5 divers) caused more than 50% of the damage
they recorded. Male divers, camera use and the initial phase of the dive have also been found to be associated with increased levels of reef damage (Rouphael & Inglis,
2001). Fins are most often involved in contact and damage to the reef, followed by
hands, knees and equipment gauges. In Rouphael's study (1997), fins accounted for
58% of contacts with the reef and 95% of the damage. Divers also kick up sediment
with their fins which then can settle on surrounding corals (Rouphael & Inglis, 1995;
Zakai & Chadwick-Furman, 2002). One way of reducing diver damage is by
education. Medio et al. (1997) showed that divers did less damage after they were
given a 45min illustrated dive briefing covering reef biology, contacts caused by
divers and the concept of a protected area, followed by an in-water demonstration
lasting a few minutes. Divers were shown the different forms of live reef cover and
non-living substrate, such as rock and dead coral, to illustrate areas of the reef that
could be touched safely. The impact of divers is notjust negative. Positive impact comes from their
help towards paying for reef management through user fees. Marine parks such as Saba and Bonaire in the Caribbean have, through a fee system, become self-financing (Dixon et al., 1993; D. Kooistra, 2002 pers. comm. ). Though divers may be willing
to pay park fees such a system is pointless if, in the process, they destroy what they
have come to see. It is clear that coral reefs are a valuable but vulnerable asset to the dive
tourism industry. This study quantifies diver damage in St. Lucia, one of the
Windward Islands of the Eastern Caribbean (Fig. 2.1) and seeks ways to reduce it.
10
(D
C6
U)
(D 0 (D
m (n -0 U) r- M m c2- 0E
-0 0
3: -0 0 _C -r- cn C)
(n
i-n (D
Q) -0 r- ö 0 U) 0
U)
,n co 0x 0 c2- in c2-
r 0 Co (n (D U) Co
x 0
in >, vö -0 Q)
E (D
0 Vö
cý r- . iz
m vö i- 2
Tourism is one of St. Lucia's main industries (CIA, 2002) accounting in 2001 for an
estimated 53% of GDP (VMC, 2002) and in 2000 annual visitor arrivals numbered
over seven hundred thousand (St. Lucia Government Statistics, 2002). Among its
natural resources are forests, sandy beaches, thermal springs and coral reefs. Reefs
cover 160 krný and fringe most of the island (Spalding et al., 2001).
Dive tourism in St. Lucia began in the 1970's with the opening of the island's first dive business (Xavier, 2002, pers. comm. ) and has been increasing ever since. By 2001, nine dive businesses sold courses and trips either as part of activities
offered by a resort or hotel or as independent companies. Since 1995, dive permits
sold for use of sites within the Soufri6re Marine Management Area (SMMA), a
marine park in the south west of the island, have increased by over 200% (SMMA,
2000). An estimated 137,000 dives are done yearly throughout the island with 60%
at sites within St. Lucia's Soufriere Marine Management Area (see Chapter 6, Table
6.2). Dive tourism is heavily reliant on the island's reefs and yet direct impact from
dive tourists themselves combined with other sources of stress from human activities
could threaten their existence. In this study I determined the influence of certain characteristics of divers,
dives and dive sites on levels of damage caused by divers visiting St. Lucia. Close
proximity of dive sites to the dive company and hence time constraints by which the
company worked precluded the thorough diver education such as done in Medio et
al. 's 1997 study. Instead I tested the effect on diver behaviour of a one-sentence inclusion in the usual dive briefing given by dive leaders asking divers to avoid all
contact with the reef. I also tested the effect of intervention by dive leaders if and
when they saw a diver contacting the reef. In contrast to Medio et al. (1997), where Medio carried out all briefings and demonstrations himself, I used non-scientifically
trained staff employed by the dive company to give the briefings and carry out interventions, this being more realistic.
12
2.3 METHODS
2.3.1 Study site and diver samples
I collected data on scuba divers in St. Lucia for 26 weeks spread over two periods. The first (12 weeks between 13 December 2000 and II March 2001) coincided with
the high tourist season and the second (14 weeks between 28 June and 7 October
2001) the low season. I accompanied guests diving with Scuba St. Lucia, a dive
company situated 2km north of Soufri6re in the Soufriere Marine Management Area
(SMMA, Fig. 2.1). Stratified random selection was used to decide which divers were
to be observed before they got into the water in order to fill chosen sub-groups. Once
a sub-group was filled, those individuals in that group were avoided. Sub-groups
included: photographers and non-photographers, first day divers and divers on their
second or more day of diving, men and women, cruiseship visitors and visitors
staying in hotels on the island, visitors diving from the shore and from the boat. On
each dive, between one and three divers were discretely observed from a distance of
three to four meters underwater. Observations started from the time divers descended
from the surface of the water to the point when they began their ascent back to the
surface at the end of their dive. To remain anonymous so as to prevent any change in
behaviour by the divers due to my presence, I asked the dive staff to treat me as any
other guest. My answer to visitors' questions directed at my note taking underwater
was that I was collecting infon-nation on the fish and corals for the marine park.
2.3.2 Dive sites
The company used 10 dive sites in and two sites outside of the SMMA. I only used
the coral reef sites (as opposed to boat wrecks), of which there were eleven, for my diver observations and classed them according to topography: plateau, sloping, wall
and varied, the last being for sites that had some combination of the three (Table 2.1).
The dive company used sites in rotation but weather or client needs sometimes
13
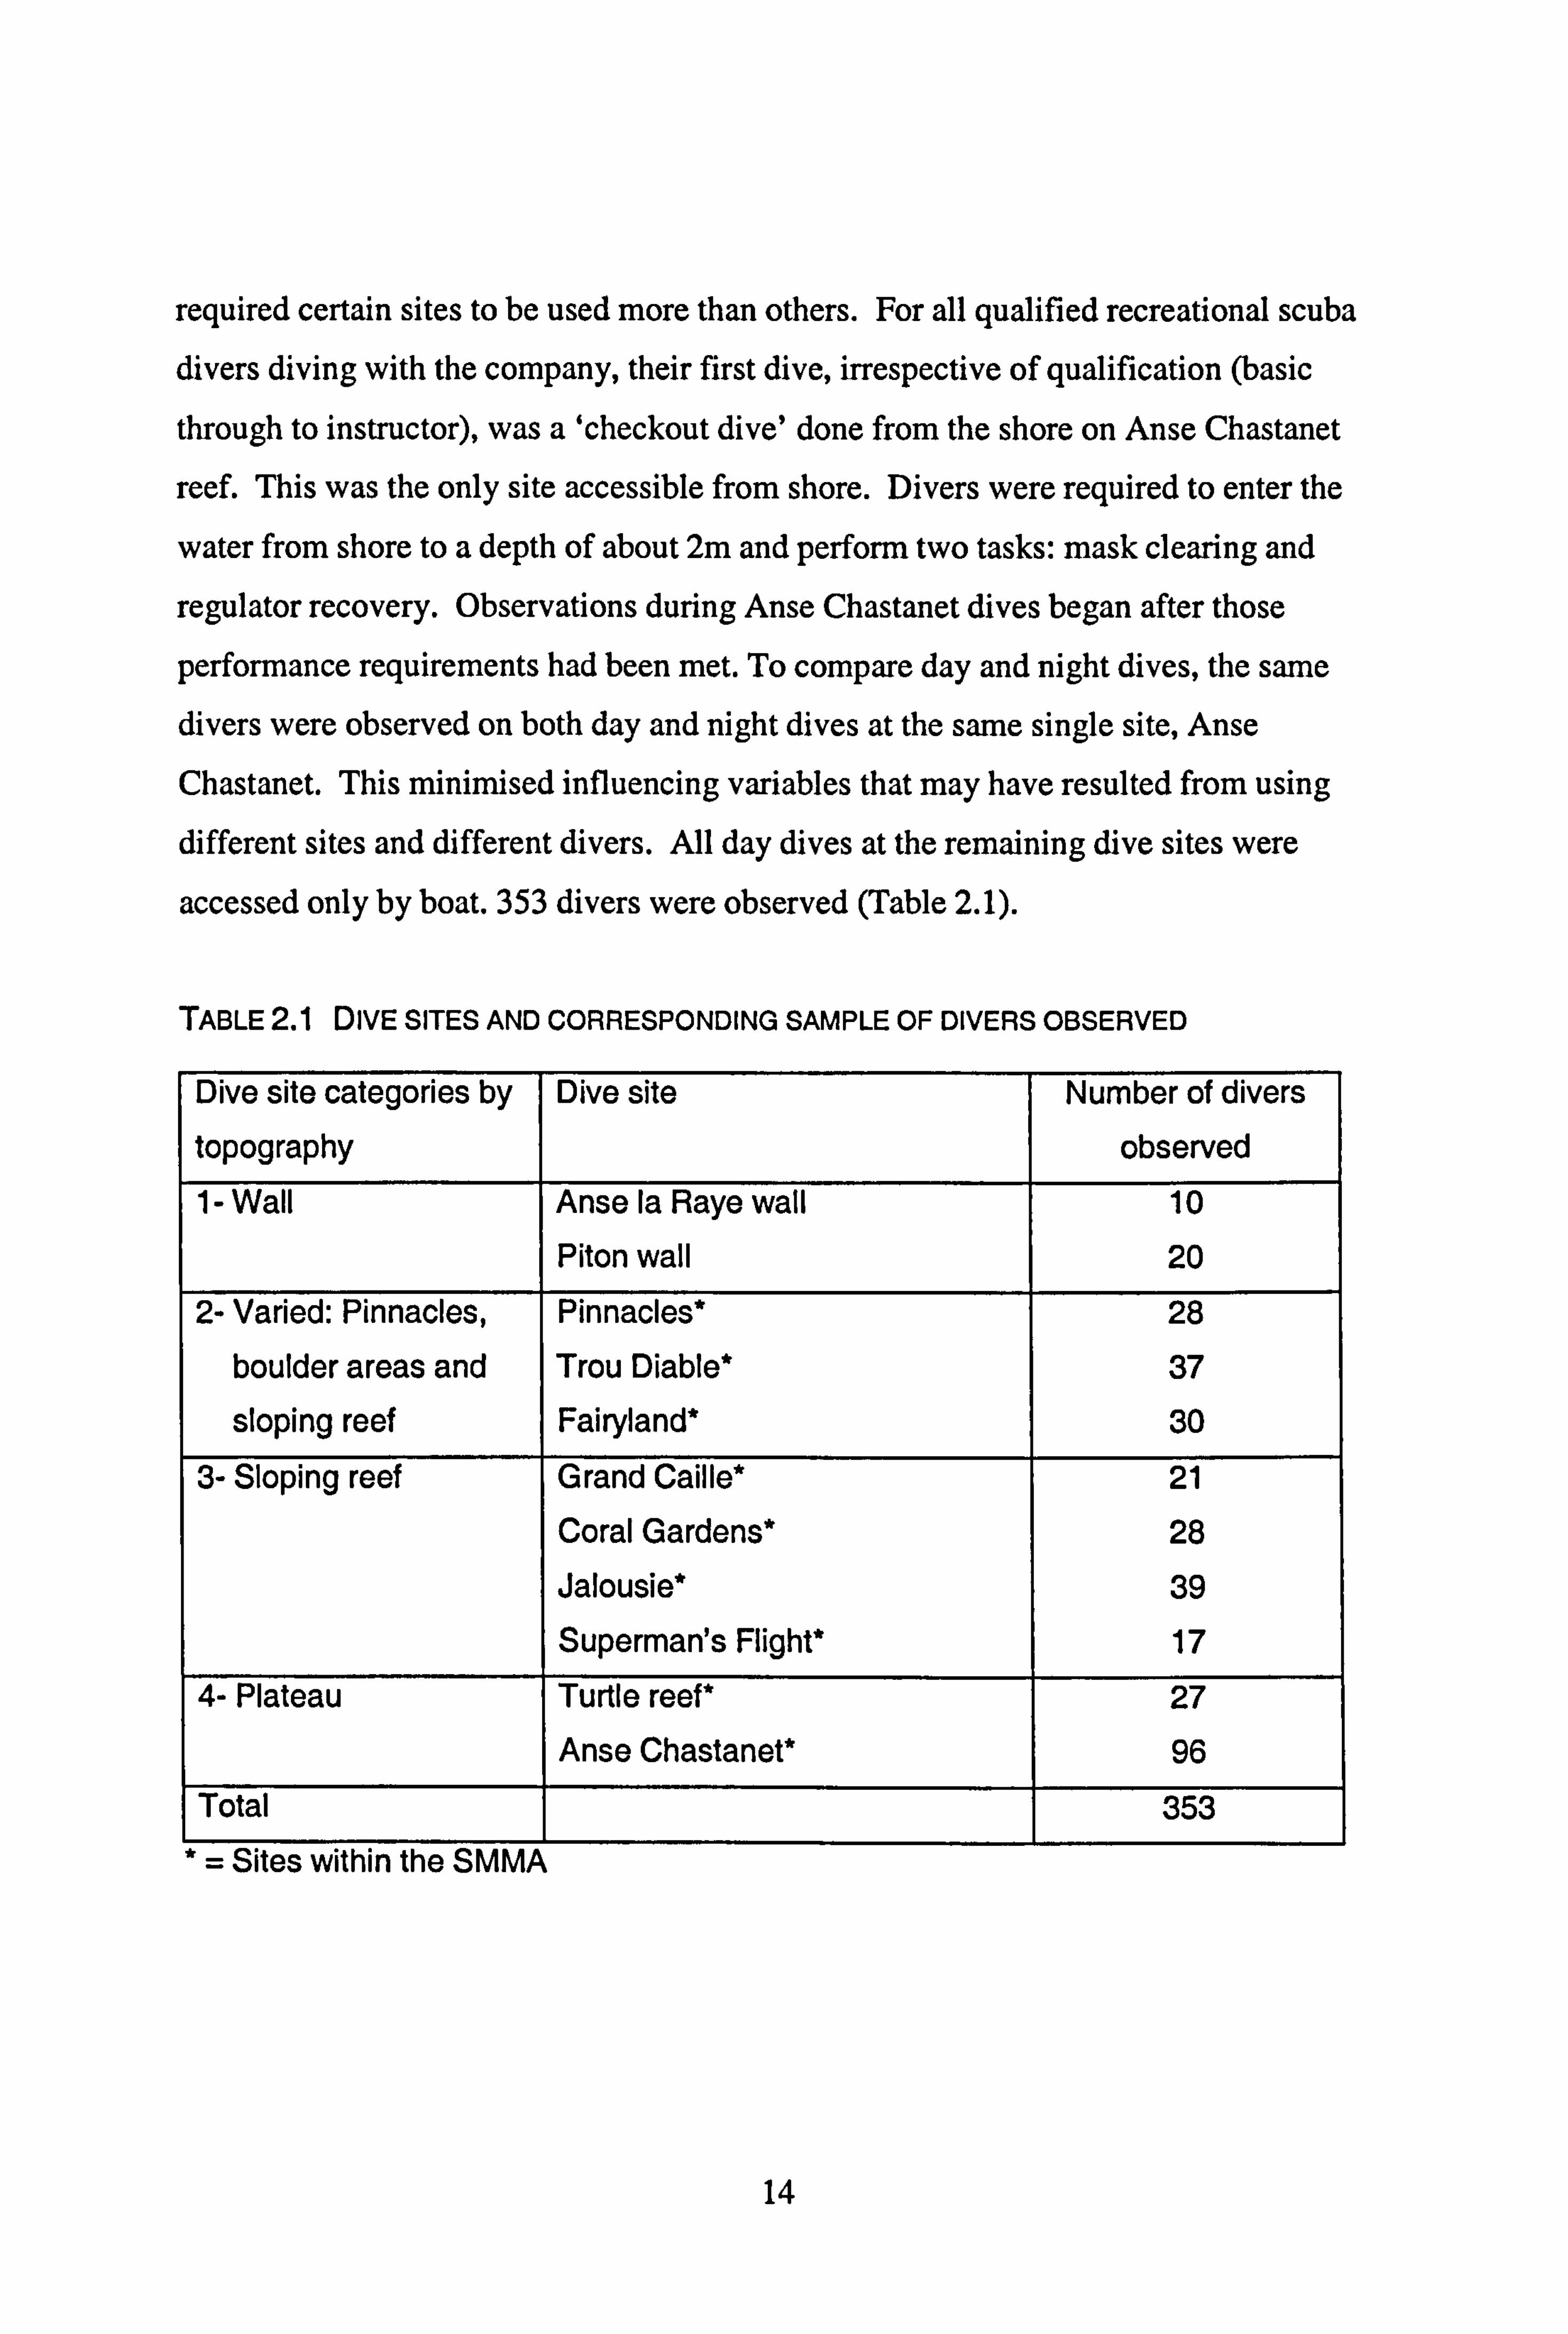
required certain sites to be used more than others. For all qualified recreational scuba divers diving with the company, their first dive, irrespective of qualification (basic
through to instructor), was a 'checkout dive' done from the shore on Anse Chastanet
reef. This was the only site accessible from shore. Divers were required to enter the
water from shore to a depth of about 2m and perform two tasks: mask clearing and
regulator recovery. Observations during Anse Chastanet dives began after those
performance requirements had been met. To compare day and night dives, the same divers were observed on both day and night dives at the same single site, Anse
Chastanet. This minimised influencing variables that may have resulted from using different sites and different divers. All day dives at the remaining dive sites were
accessed only by boat. 353 divers were observed (Table 2.1).
TABLE 2.1 DIVE SITES AND CORRESPONDING SAMPLE OF DIVERS OBSERVED
Dive site categories by Dive site Number of divers
topography observed 1- Wall Anse la Raye wall 10
Piton wall 20
2- Varied: Pinnacles, Pinnacles* 28
boulder areas and Trou Diable* 37
sloping reef Fairyland* 30
3- Sloping reef Grand Caille* 21 Coral Gardens* 28
Jalousie* 39 Superman's Flight* 17
4- Plateau Turtle reef* 27 Anse Chastanet* 96
Total 353
*= Sites within the SMMA
14
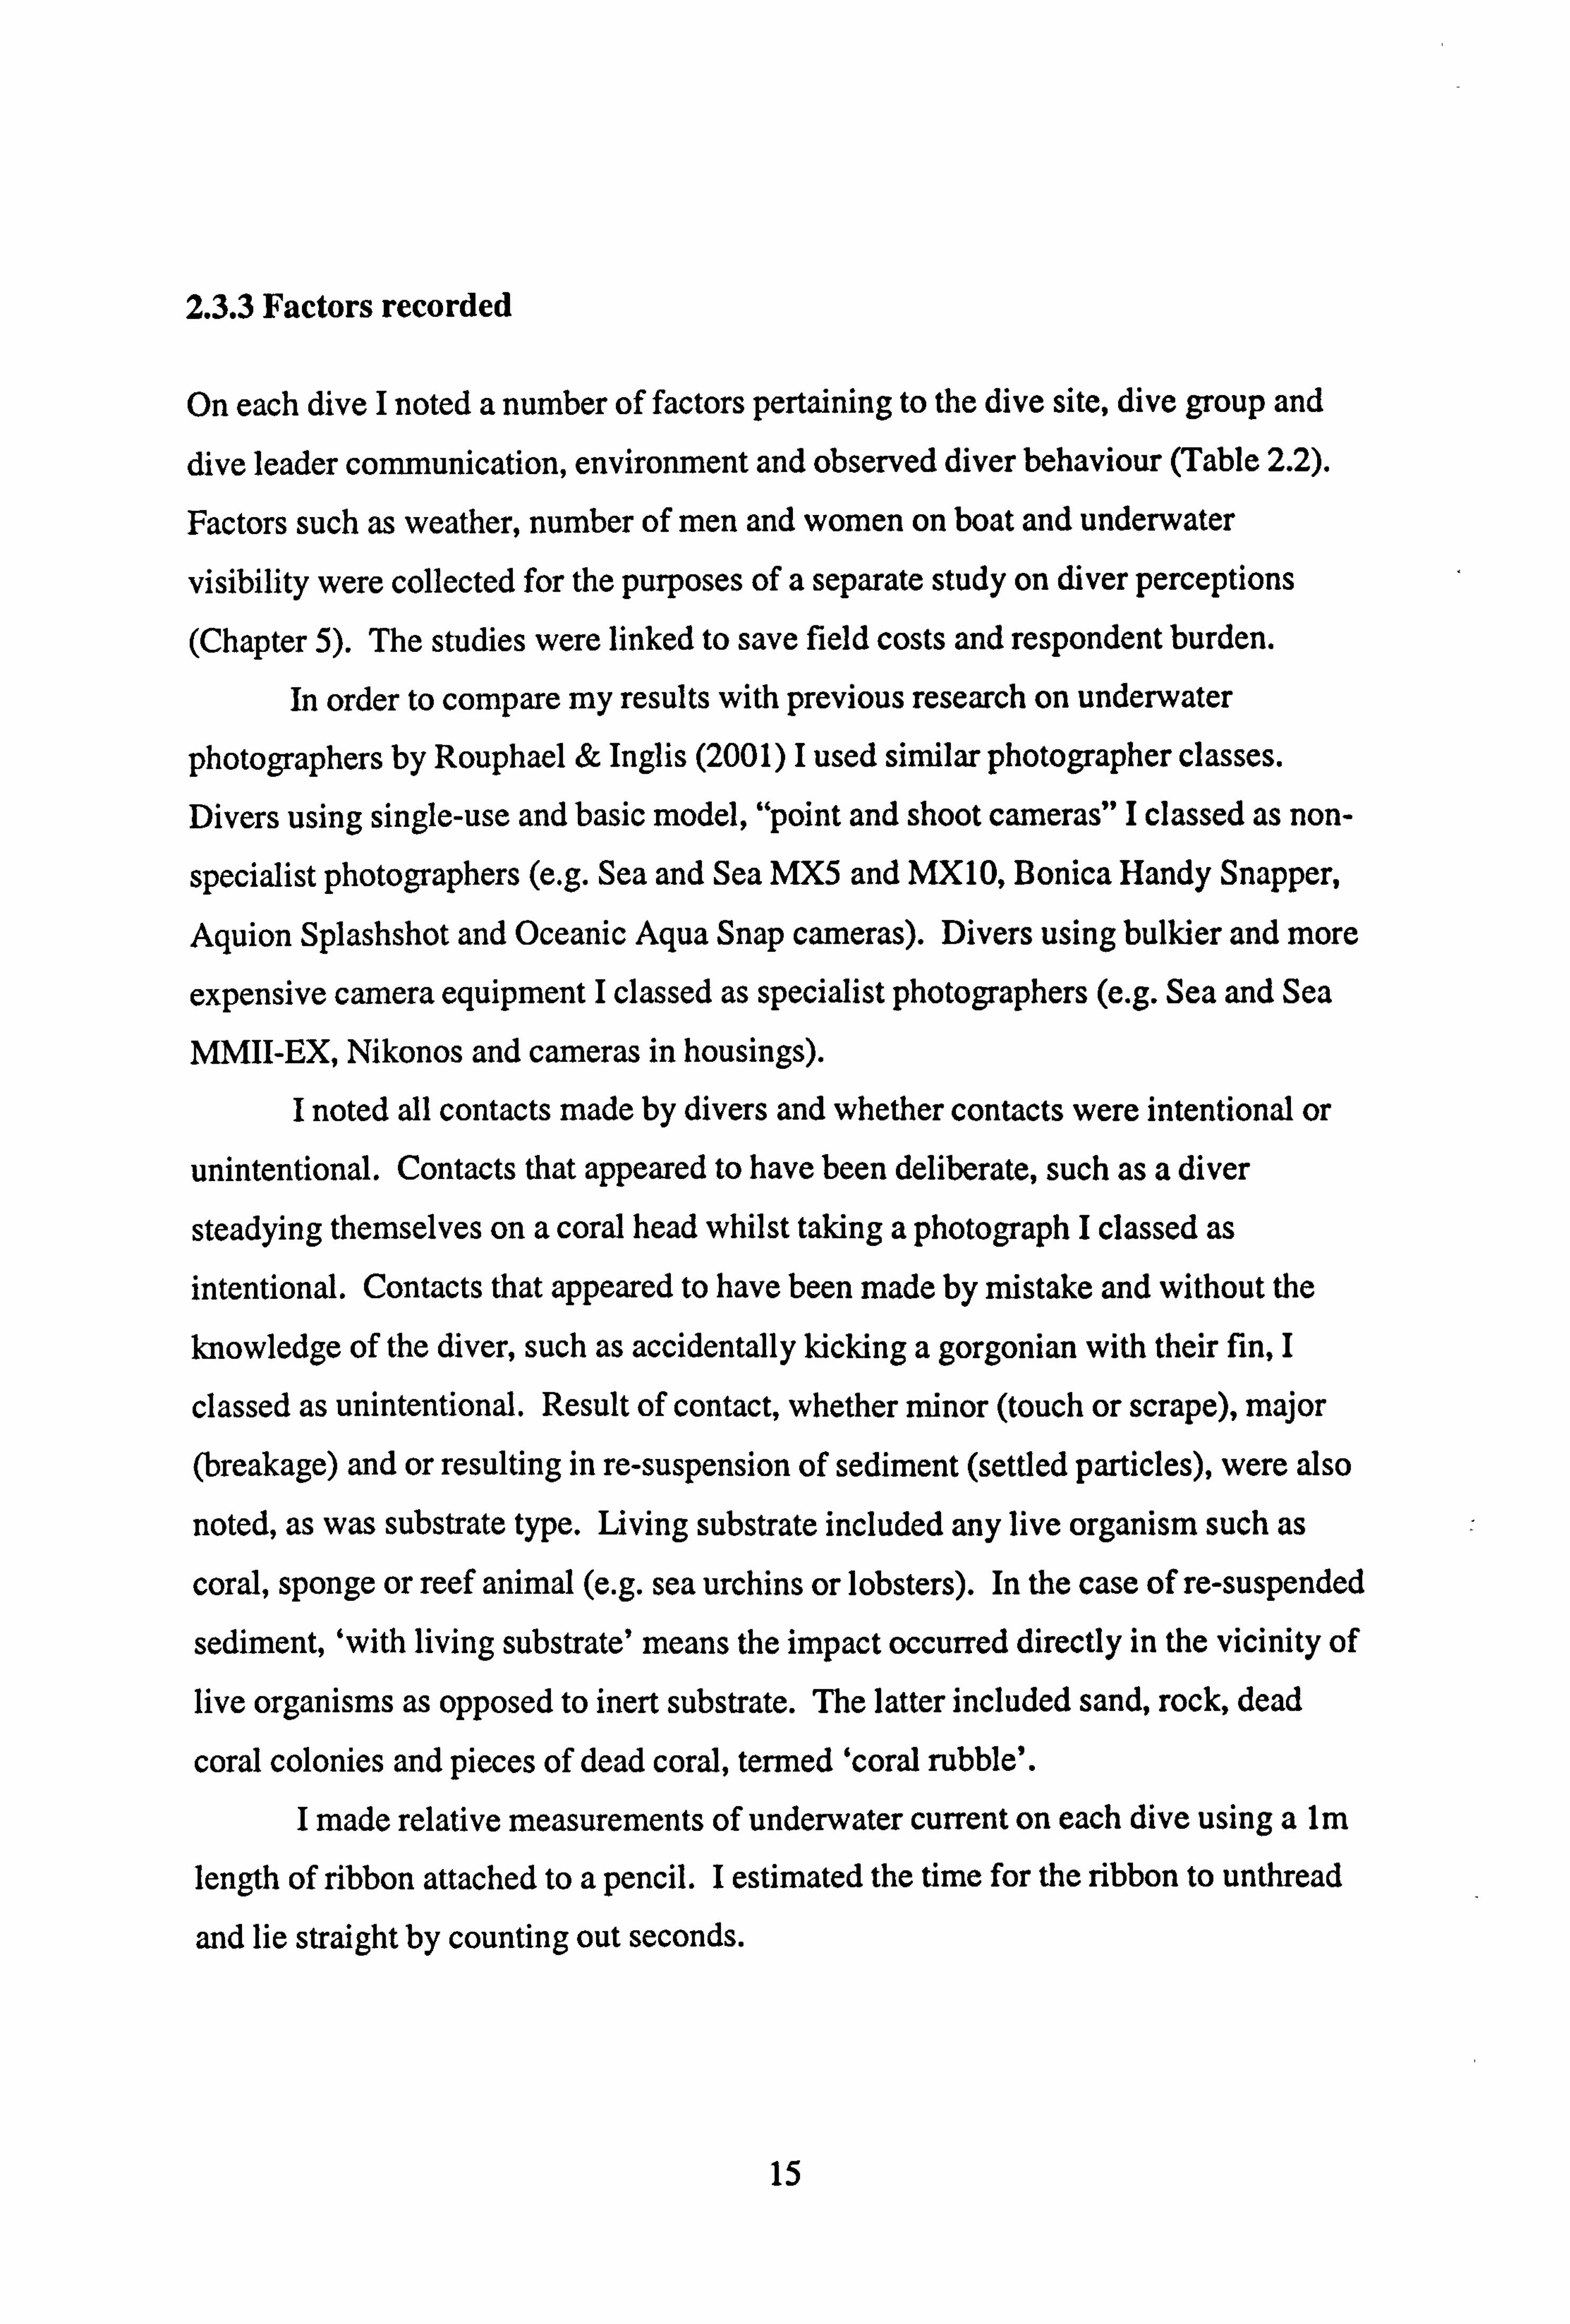
2.3.3 Factors recorded
On each dive I noted a number of factors pertaining to the dive site, dive group and
dive leader communication, envirom-nent and observed diver behaviour (Table 2.2).
Factors such as weather, number of men and women on boat and underwater
visibility were collected for the purposes of a separate study on diver perceptions (Chapter 5). The studies were linked to save field costs and respondent burden.
In order to compare my results with previous research on underwater
photographers by Rouphael & Inglis (2001) 1 used similar photographer classes. Divers using single-use and basic model, "point and shoot cameras" I classed as non-
specialist photographers (e. g. Sea and Sea MX5 and MX10, Bonica Handy Snapper,
Aquion Splashshot and Oceanic Aqua Snap cameras). Divers using bulkier and more
expensive camera equipment I classed as specialist photographers (e. g. Sea and Sea
MMII-EX, Nikonos and cameras in housings).
I noted all contacts made by divers and whether contacts were intentional or
unintentional. Contacts that appeared to have been deliberate, such as a diver
steadying themselves on a coral head whilst taking a photograph I classed as intentional. Contacts that appeared to have been made by mistake and without the
knowledge of the diver, such as accidentally kicking a gorgonian with their fin, I
classed as unintentional. Result of contact, whether minor (touch or scrape), major (breakage) and or resulting in re-suspension of sediment (settled particles), were also
noted, as was substrate type. Living substrate included any live organism such as
coral, sponge or reef animal (e. g. sea urchins or lobsters). In the case of re-suspended
sediment, 'with living substrate' means the impact occurred directly in the vicinity of live organisms as opposed to inert substrate. The latter included sand, rock, dead
coral colonies and pieces of dead coral, termed 'coral rubble'. I made relative measurements of underwater current on each dive using a lm
length of ribbon attached to a pencil. I estimated the time for the ribbon to unthread
and lie straight by counting out seconds.
15
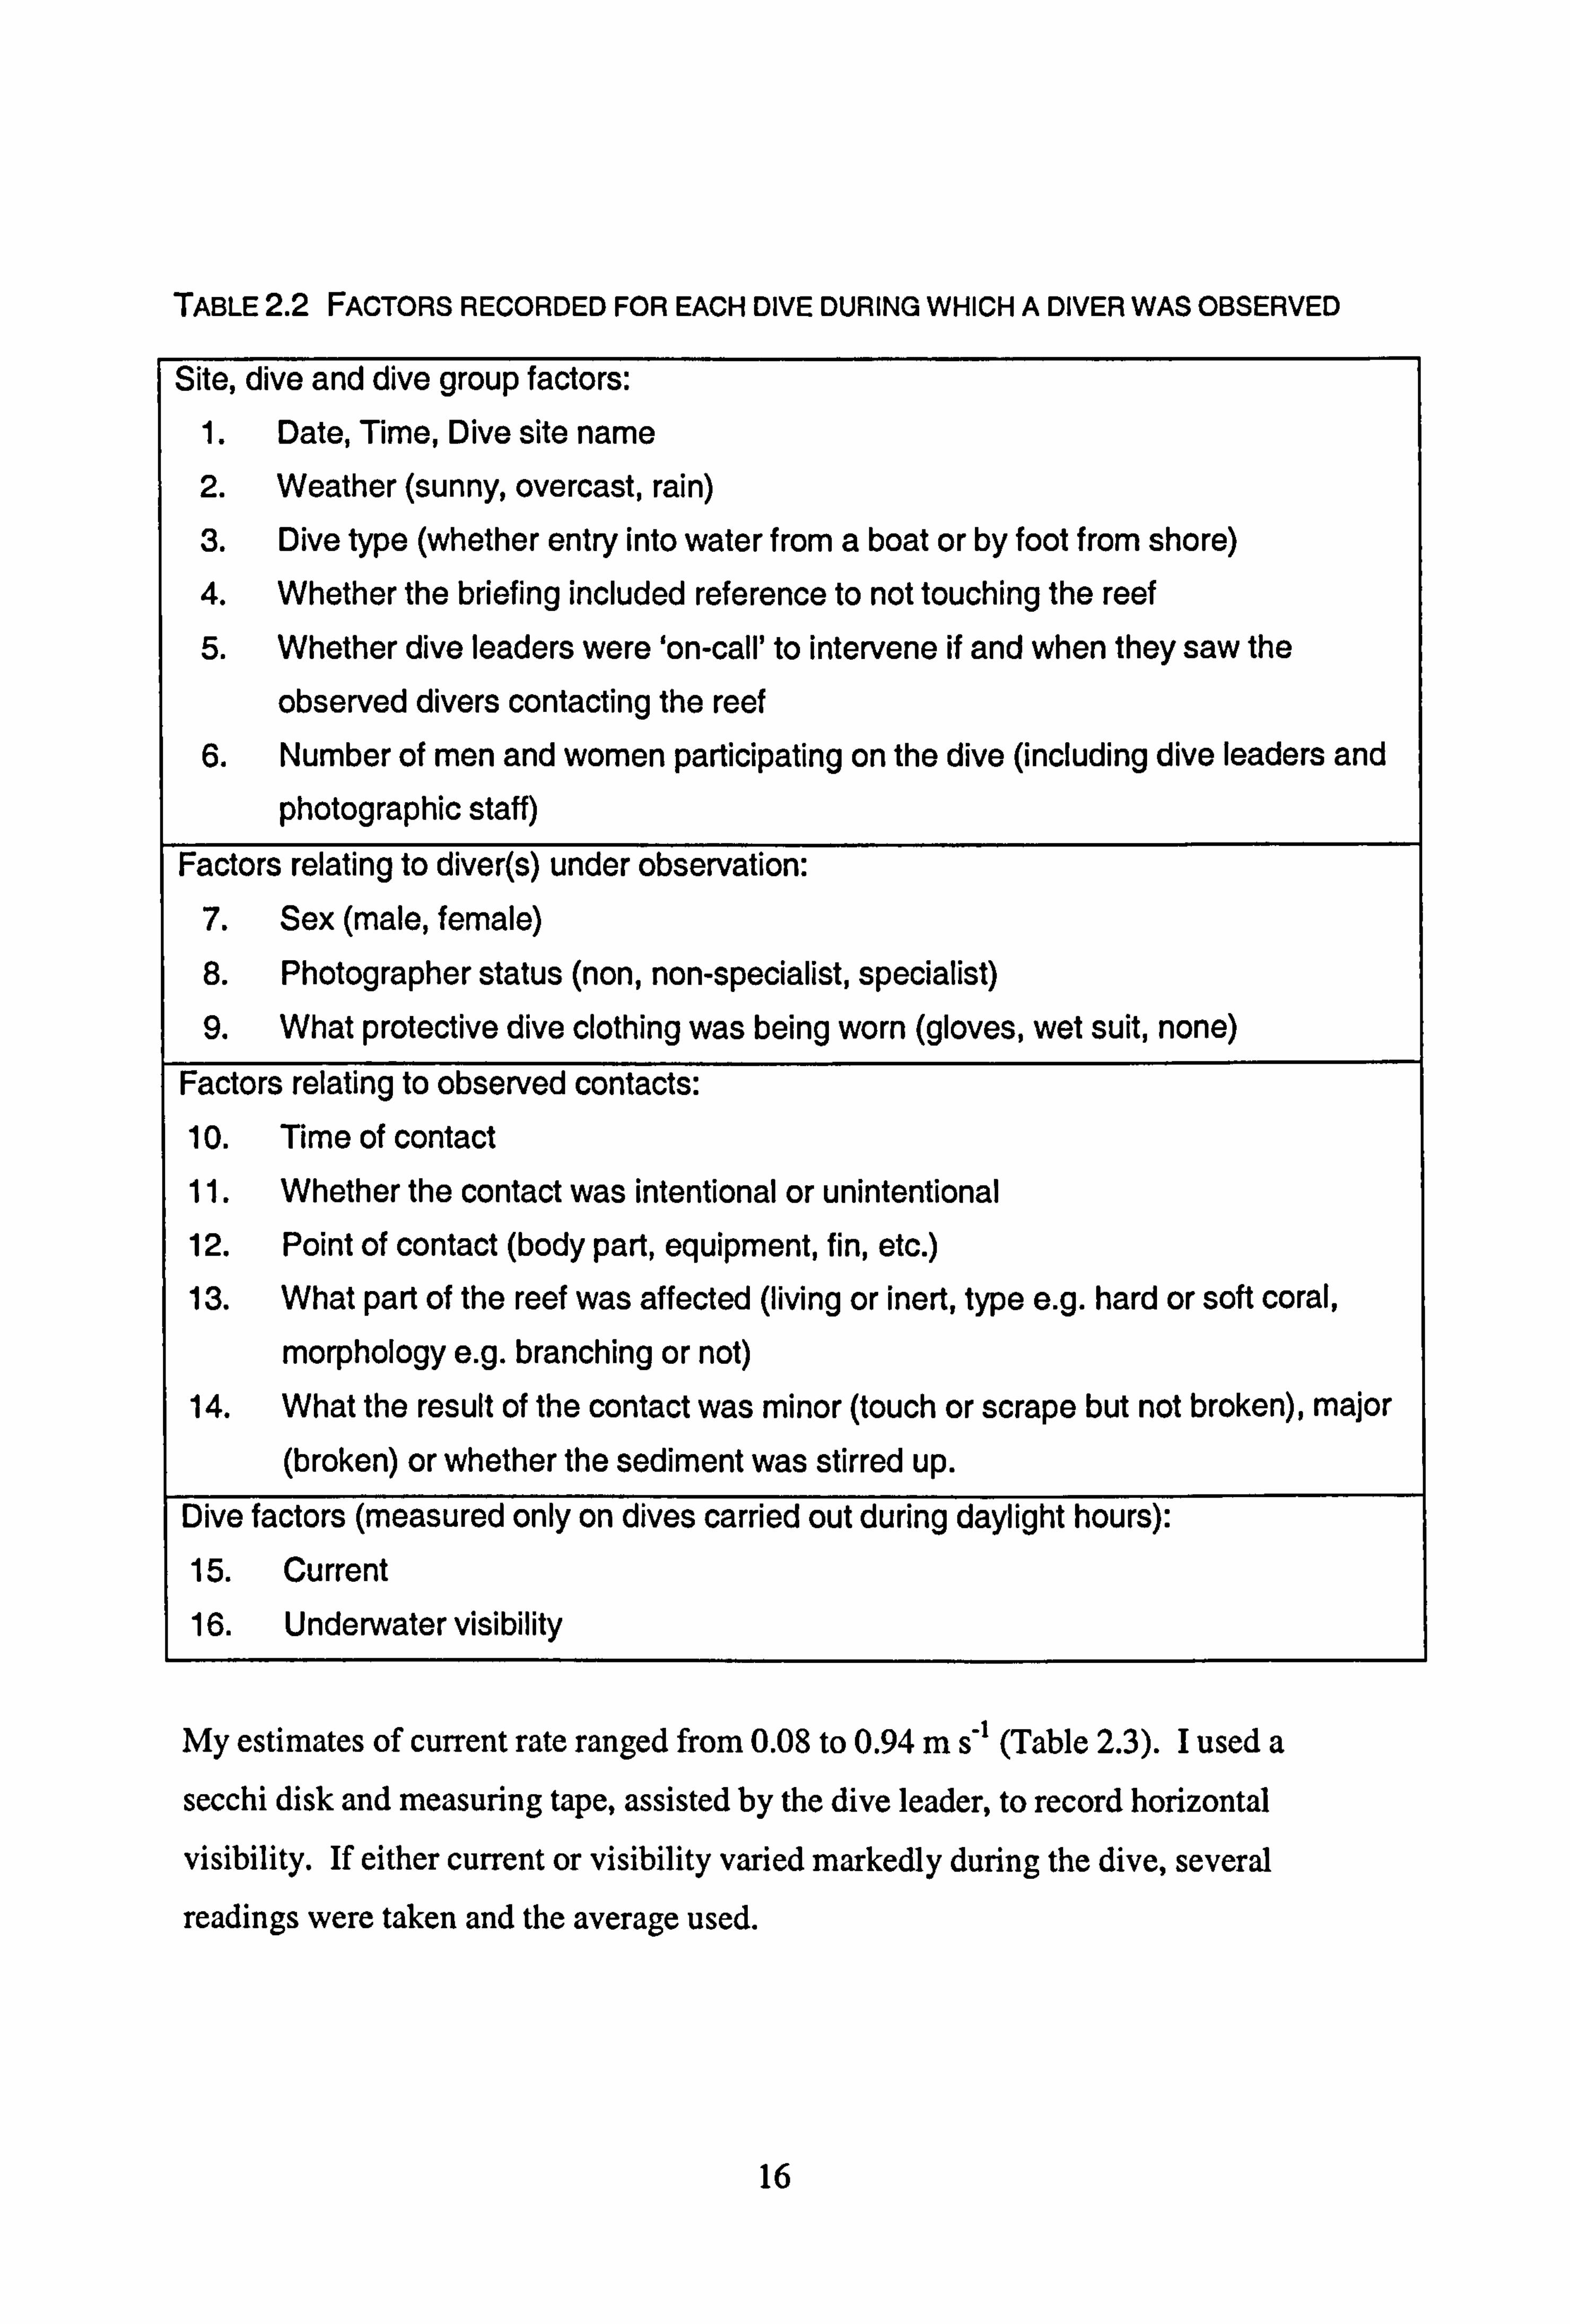
TABLE 2.2 FACTORS RECORDED FOR EACH DIVE DURING WHICH A DIVER WAS OBSERVED
Site, dive and dive group factors:
1. Date, Time, Dive site name 2. Weather (sunny, overcast, rain) 3. Dive type (whether entry into water from a boat or by foot from shore) 4. Whether the briefing included reference to not touching the reef 5. Whether dive leaders were 'on-call' to intervene if and when they saw the
observed divers contacting the reef 6. Number of men and women participating on the dive (including dive leaders and
photographic staff) Factors relating to diver(s) under observation:
7. Sex (male, female)
8. Photographer status (non, non-specialist, specialist) 9. What protective dive clothing was being worn (gloves, wet suit, none)
Factors relating to observed contacts: 10. Time of contact 11. Whether the contact was intentional or unintentional 12. Point of contact (body part, equipment, fin, etc. )
13. What part of the reef was affected (living or inert, type e. g. hard or soft coral,
morphology e. g. branching or not) 14. What the result of the contact was minor (touch or scrape but not broken), major
(broken) or whether the sediment was stirred up. Dive factors (measured only on dives carried out during daylight hours):
15. Current
16. Underwater visibility
My estimates of current rate ranged from 0.08 to 0.94 m s-1 (Table 2.3). 1 used a secchi disk and measuring tape, assisted by the dive leader, to record horizontal
visibility. If either current or visibility varied markedly during the dive, several readings were taken and the average used.
16
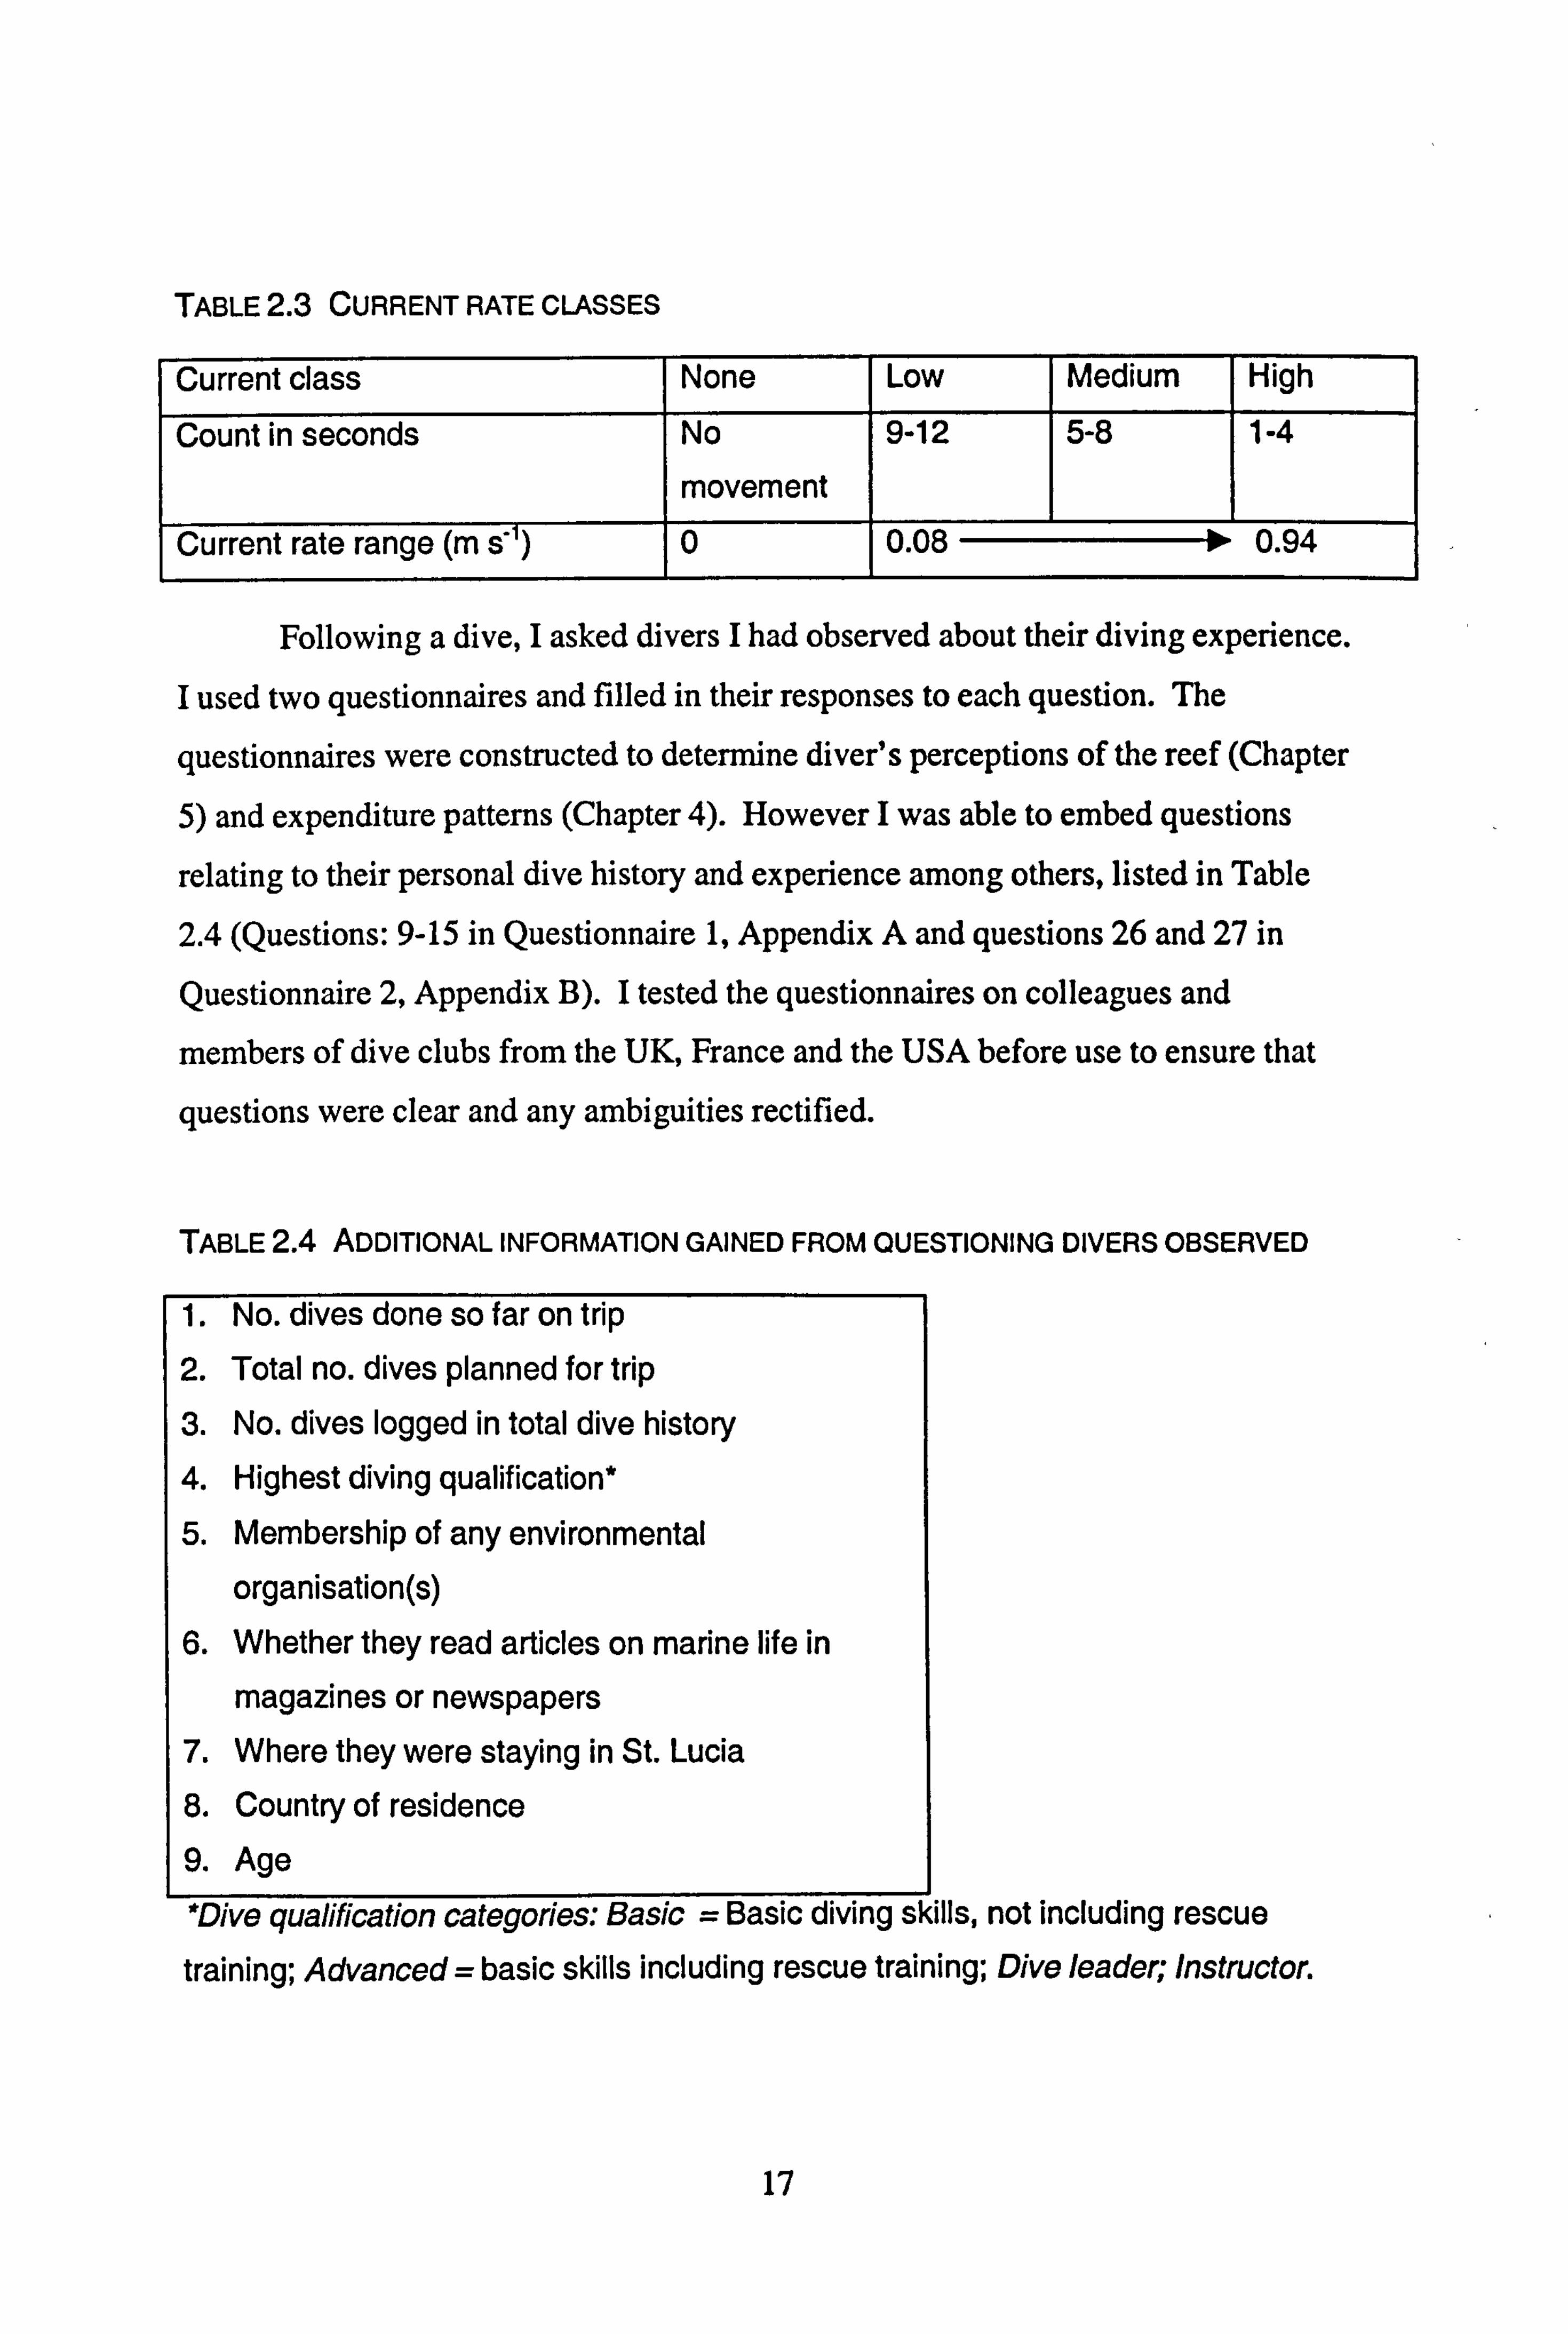
TABLE 2.3 CURRENT RATE CLASSES
Current class None Low Medium High
Count in seconds
-
No
movement
9-12 5-8 1-4
Current rate range (m s-7 0 0.08 10 0.94
Following a dive, I asked divers I had observed about their diving experience. I used two questionnaires and filled in their responses to each question. The
questionnaires were constructed to determine diver's perceptions of the reef (Chapter
5) and expenditure patterns (Chapter 4). However I was able to embed questions
relating to their personal dive history and experience among others, listed in Table
2.4 (Questions: 9-15 in Questionnaire 1, Appendix A and questions 26 and 27 in
Questionnaire 2, Appendix B). I tested the questionnaires on colleagues and
members of dive clubs from the UK, France and the USA before use to ensure that
questions were clear and any ambiguities rectified.
TABLE 2.4 ADDITIONAL INFORMATION GAINED FROM QUESTIONING DIVERS OBSERVED
1. No. dives done so far on trip
2. Total no. dives planned for trip
3. No. dives logged in total dive history
4. Highest diving qualification* 5. Membership of any environmental
organisation(s) 6. Whether they read articles on marine life in
magazines or newspapers 7. Where they were staying in St. Lucia
8. Country of residence 9. Age *Diva emalifiratinn cateanries., Basic = Jlls, not including rescue training; Advanced= basic skills including rescue training; Dive leader, Instructor.
17
2.3.4 Statistical analyses
My data were non-normal and remained so despite application of various
transformations. Hence I used non-parametric statistical analyses to examine
relationships between diver and dive site characteristics and diver contact rates. I used the Sheirer-Ray-Hare test, a non-parametric equivalent to a two-way analysis
of variance (Dytham, 1999) to test the relationship between dive briefings, dive
leader intervention during dive and diver behaviour underwater, individually and
together. Box and whisker plots are used to show summary plots based on the median,
quartiles and extreme values. Each box represents the interquartile range which
contains 50% of values. The whiskers are lines that extend from the box to the 5 th
and 95th percentiles and dots denote outliers. A line across the box indicates the
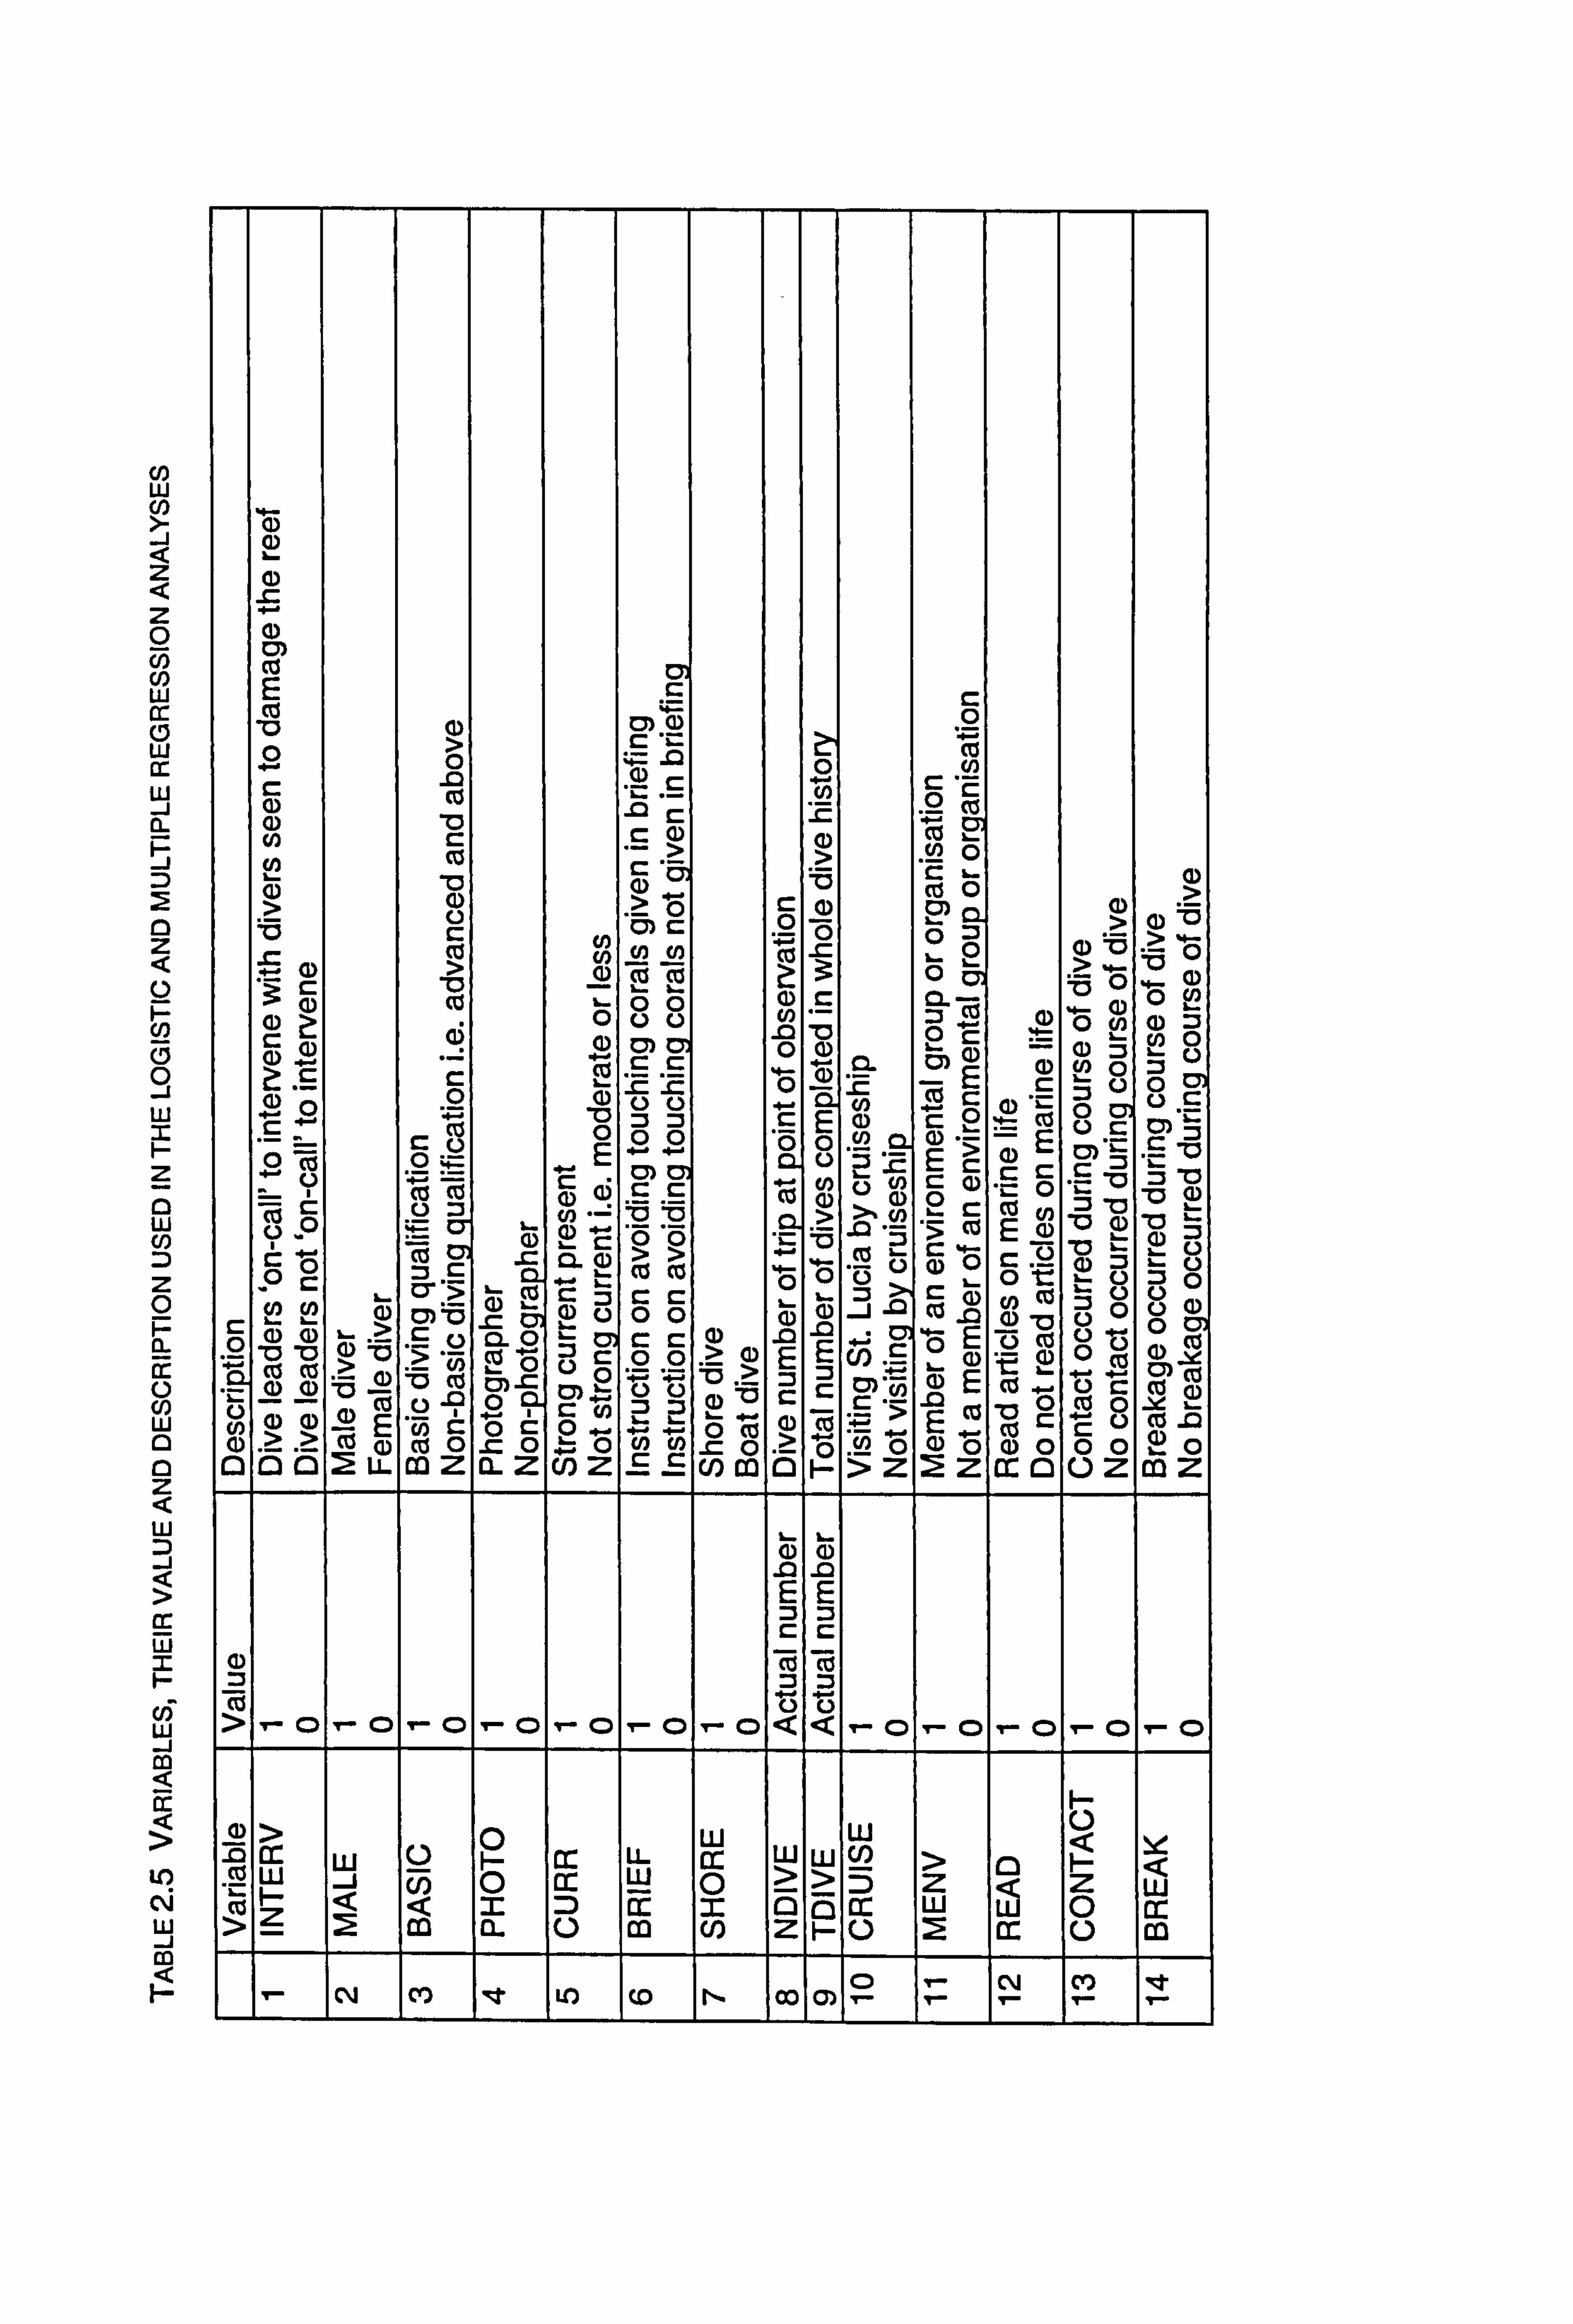
median. In order to analyse the effect of a number of covariates on the probability of a diver
having a contact with the reef and of causing a breakage during their dive logistic
regression was employed. Table 2.5 lists the fourteen variables used in the logistic
regression. The first twelve are independent variables and the last two are the
dependent variables. To test the robustness of the parameter estimates a bootstrap procedure was
employed. This involved artificially enhancing the sample size by picking random
numbers using the seed 123456789 to represent a population of approximately 34,000
divers (my initial estimate of number of divers visiting St. Lucia annually). 10,000
bootstrap replications were computed and the variability of estimates analysed. To
supplement this test, density curves for the significant covariates were compared
graphically. In lieu of a suitable non-parametric method, to obtain predicted contact rates
for divers, I used multiple regression to explore the relationships between the same twelve independent variables used in the logistic regression, and the number of
contacts per minute and the number of coral breakages per minute. Transformation
18
of contact rate by taking the square root improved normality. Other assumptions including multicollinearity, singularity and nonnality, linearity, homoscedasticity and independence of residuals were checked and did not seem to have been violated.
19
C/) w U)
z
z 0 V) Cl) w X 0 w cr w -j a-
co (. 13
q w
z 0 w (1) D z 0 F- a-
w
z w
(6 LJ
cc
LO
Cý LU -j m
c3) Co cm E
0 2? .2
Cö 0
a) cr,
(D CI) (D (D
m (D (Z > U) M (Q Cö M
ý "2 c) -0 >
> 0 r3 .ýc .,
2 i> -
0 CY, b0 (D a) 00 9) c
. - a-
CO (D 2» 0 o0 (n -0 «c3
Z] (D in Co 0 0 (D L-
(D C» (D " rj
D -4- 0
Z :E CL
-E w (D r-
U) " ci :i
Z 0 cm G) 0 A G) c) c) +-
r - c, E
(0 0
C
c: (D "
CO 0 L) c
cm C) E 00 ý -' - 0 0 . 52 CI - w > E 12) 0 . 2. -. c: c3) c31. ci. ,
Q (0 Zm " E c C: (D rr
r 0 r :3
M "c3
ýu c C) :3 c) (n . - M c3
(1) >% A
0 r- - CO (n Z -0 « (D
« " op -
'- (D ý 'a - A :3 >W E .2
a0 a
lý t a cy m CL 0 >9 cö (0 . - - 0 (0 u0 c) 0 a .2 0 :3 -0 012
0
Z> r (D
0ä (0 Co
Z. 0 :3
:30 0 Co L- " (D cm V CY (D 0 00 a) (D -1 -0 Co 0 0 (D
cm c 0 (D (D
M >
(D r
5:. 2 , 0-0
«ö -= Bc
c r_ 00
0 m E
-a E -; c5 E m
-5 Co (D
lu 0
0 0 le
2A > -0
0 rD Co e cm= 2 cy) ý -5 0
c3 > :3 Z c C» n (D E Co
" t - (0 a)
. 0 gL r: rL > -0 t Co 0 Je " (D (D A E 0 E Co r >> (D 0 m0 g0 0 > 0 00 a) 0 00 LL MZ CL Z u) Z u) m Z 2Z CC 0 0Z MZ
(D G) M -0 E E
[
C: ) 1 "-
CD - C: ) 1-C:
) 1-
CD -C t -0 < < 9. - C r- (D - C: ) - C: )
> 0 w w CC W LL CE w w > < W
_j U) 0 ir w - 0 ýý k Z) Z Z w < < 1: 3 0 e2 CC LU c)
12 m JEL 10 z iý- 10 >
1 cm 1m 1
�t
['n
(0 N m 1 c»
1 T- T- cm
m 1 le
2.3.5 Constraints of methods used
There were various constraints in the methods I used which may have led to bias in
my results.
Dive company All dives were carried out with a single dive company and work involved
collaboration with that company's employees. Their dive schedule, objectives and
working methods may be dissimilar to other dive companies on the island. However,
the company used was among one of the bigger businesses on the island catering to
around 10,000 divers per year. This compares with the range of 450 to 14,000 divers
for other resorts in St. Lucia (personal interviews, 200 1, see Chapter 4). The
company that I worked with sold dive trips to guests from its own resort, other resorts
on the island and to visitors arriving by cruise ship. For this reason, I believe that the
sample of divers I observed was representative of the general diving population at
that time. Variation among dive leaders may also have had some influence on diver
behaviour. However, my main objective was to test the effectiveness of divers being
given a briefing that included instructions on not touching the coral, therefore slight
differences in delivery of the information by the various dive leaders was not as
important as whether or not it was given at all. To keep the influence of intervention
as similar as possible, the same dive leader was used throughout to be 'on-call'.
Diver samples Sample sizes might not have been representative of their respective populations
visiting St. Lucia. Virtually all the photographers diving with the company were
observed because they were so few, whereas a smaller proportion of non-camera
users was observed. My sample of cruiseship visitors was limited to those sending
divers to the dive company that I worked with and these visitors may not have been
representative of those from other cruise ships diving with other companies.
21
Diver behaviour
For reasons of safety, it is universally recommended that divers only dive in pairs. In
St. Lucia the water visibility was generally 20m or more and diver pairs were able to
spread out with several meters between them and still be able to see the dive leader,
the latter being a recommendation given in the pre-dive briefing. To ensure a
maximum number of observations during my study, and to be close enough to see
what if any, contacts divers were having with the reef, I usually observed pairs of divers. Diver pairs ranged from couples to complete strangers. Bias could have been
introduced from divers copying each other's behaviour. Although I did not test for
this, I observed many couples with opposite behavioural tendencies, e. g. one with
poor buoyancy and one with good. Sometimes partners would try and help the other,
thus decreasing likelihood of reef damage; but others confounded the situation and
appeared to make matters worse. Photography was most often done by only one
individual in the pair.
Observation method Some diver contacts with the reef may have been missed both during the day and at
night when I lost sight of divers who went behind reef formations. However, these
instances were few and only lasted a few seconds. General low visibility at night
may have also led me to miss more diver contacts with the reef than during the day.
To compensate for the reduced visibility, I followed divers at a closer distance than
during the day (1-1.5m instead of 2-4m). The light from divers' torches typically
illuminated an area of a few meters. Divers' attention focused on the illuminated area
allowing me to get closer unnoticed.
22
2.4 RiEsuLTs
2.4.1 Diver characteristics
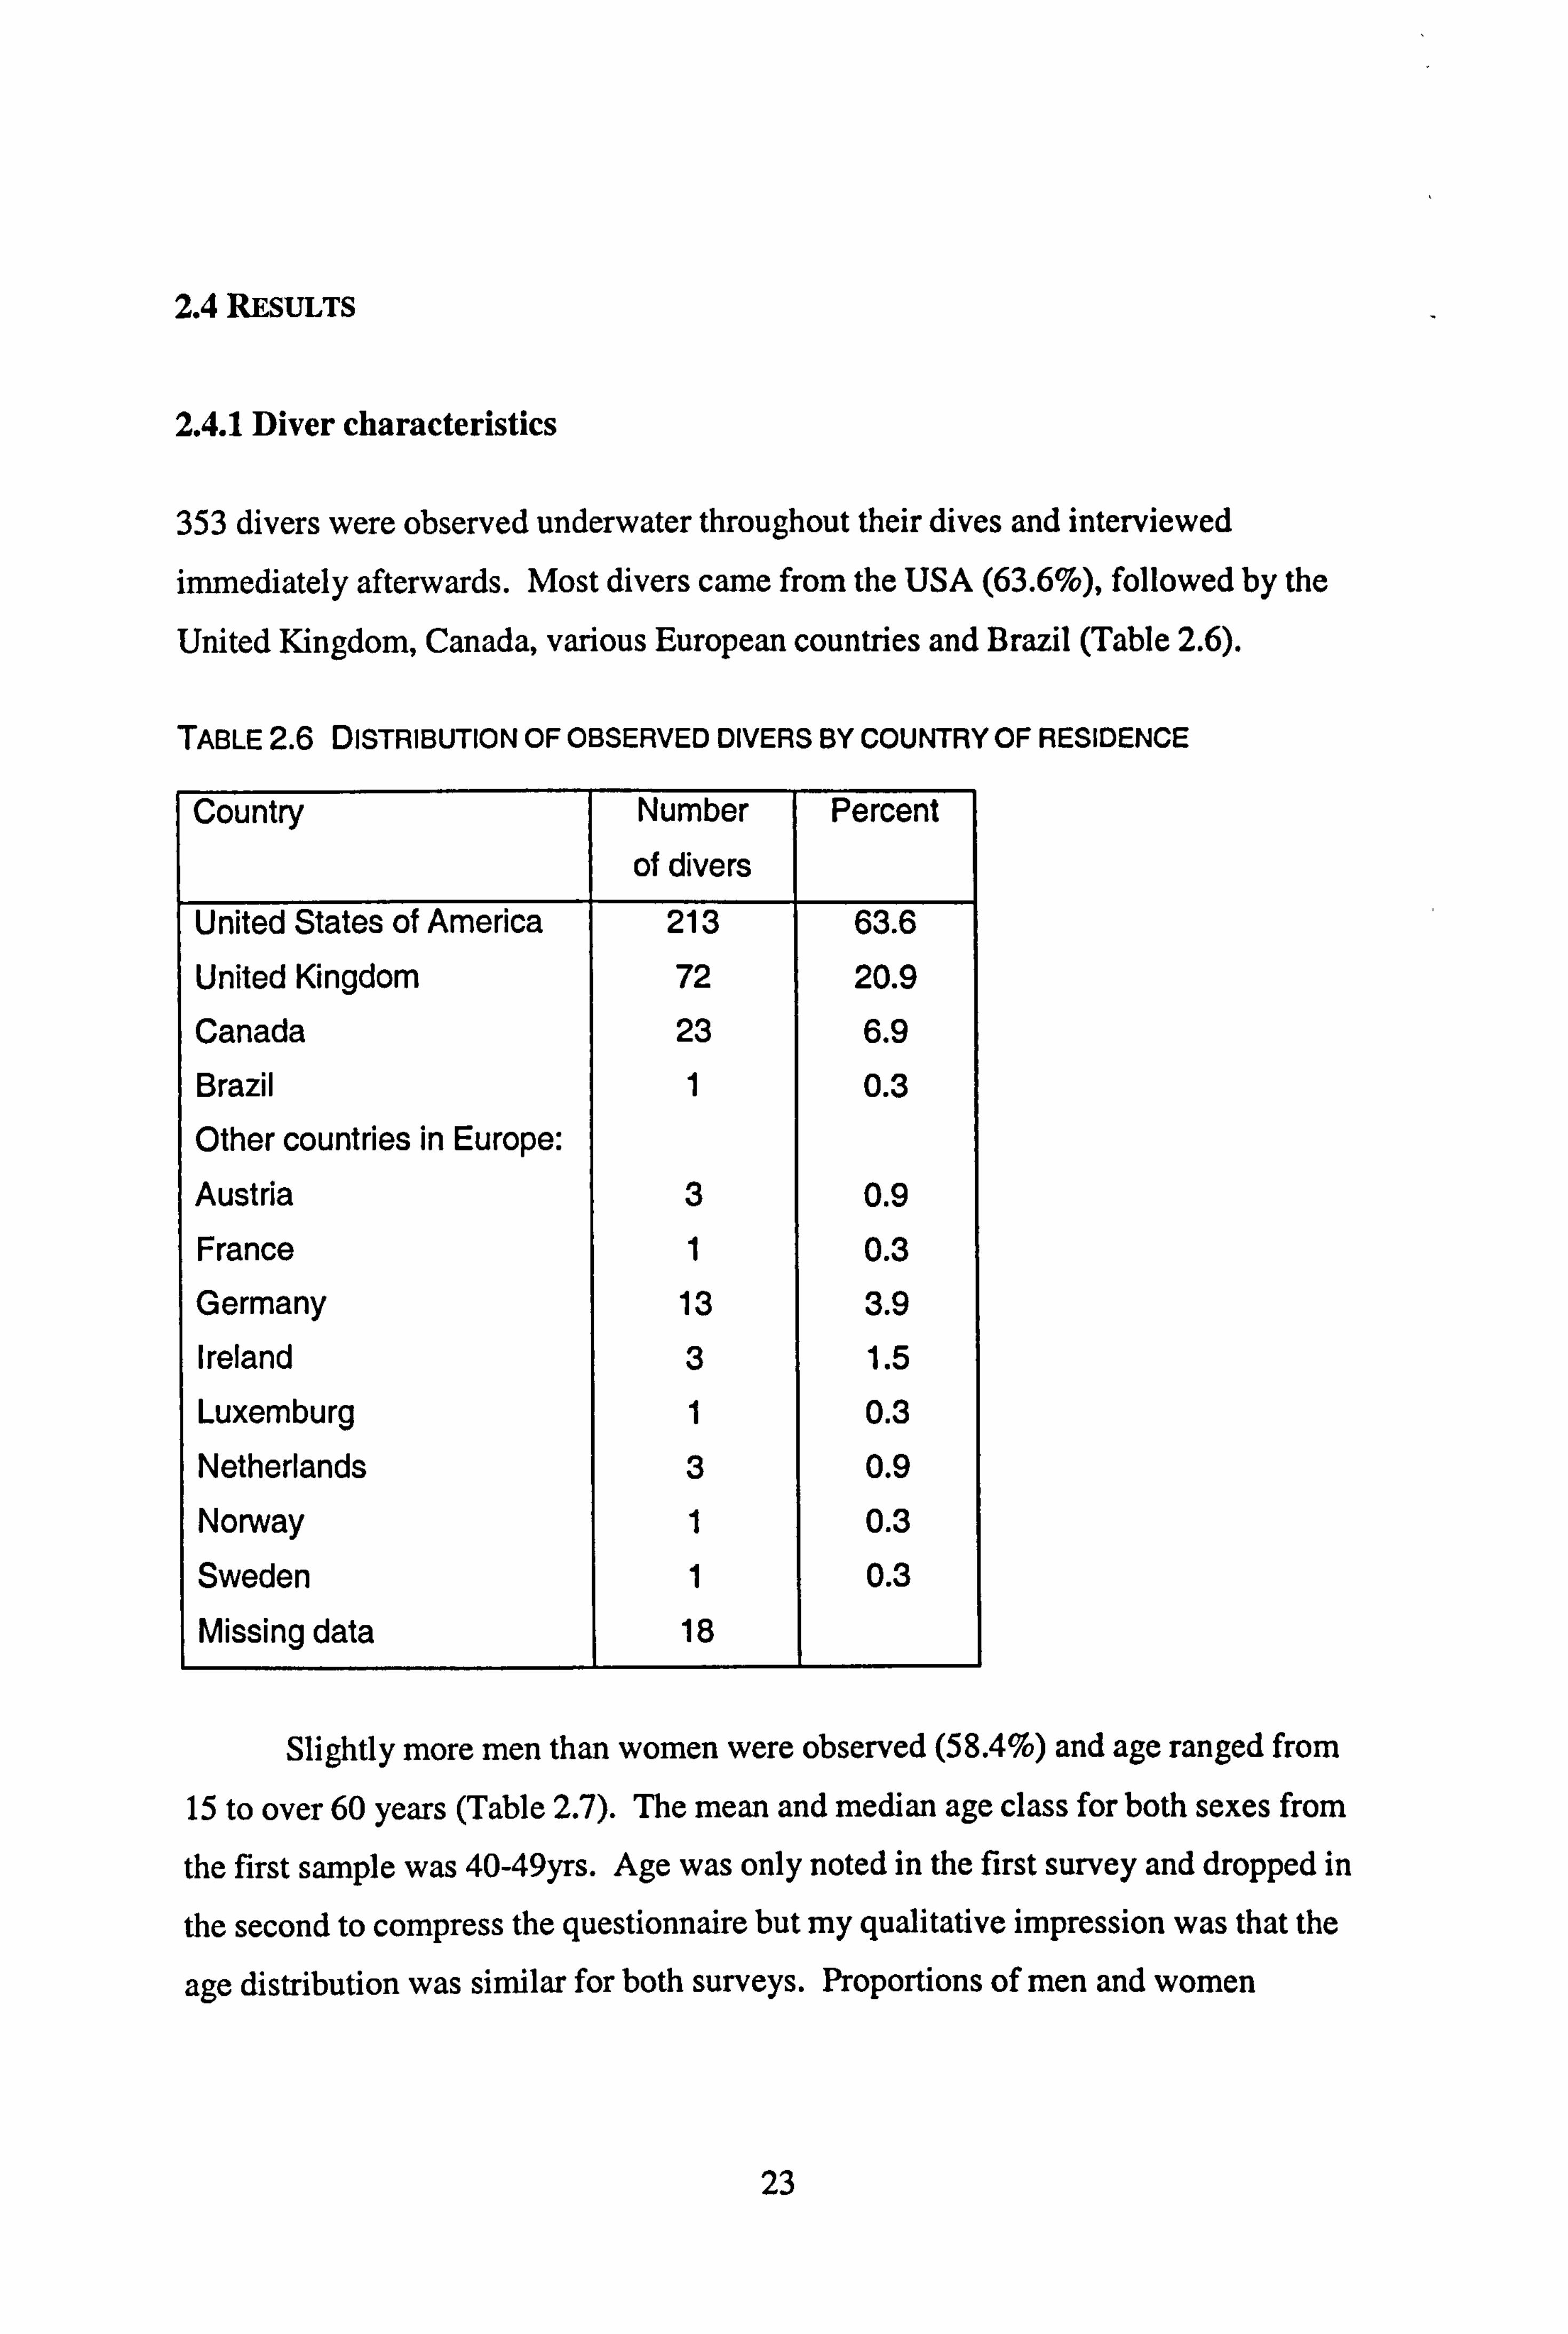
353 divers were observed underwater throughout their dives and interviewed
immediately afterwards. Most divers came from the USA (63.6%), followed by the
United Kingdom, Canada, various European countries and Brazil (Table 2.6).
TABLE2.6 DISTRIBUTION OF OBSERVED DIVERS BY COUNTRY OF RESIDENCE
Country Number
of divers Percent
United States of America 213 63.6 United Kingdom 72 20.9 Canada 23 6.9 Brazil 1 0.3 Other countries in Europe: Austria 3 0.9 France 1 0.3 Germany 13 3.9 Ireland 3 1.5 Luxemburg 1 0.3 Netherlands 3 0.9 Norway 1 0.3 Sweden 1 0.3 Missing data 18
Slightly more men than women were observed (58.4%) and age ranged from
15 to over 60 years (Table 2.7). The mean and median age class for both sexes from
the first sample was 40-49yrs. Age was only noted in the first survey and dropped in
the second to compress the questionnaire but my qualitative impression was that the
age distribution was similar for both surveys. Proportions of men and women
23
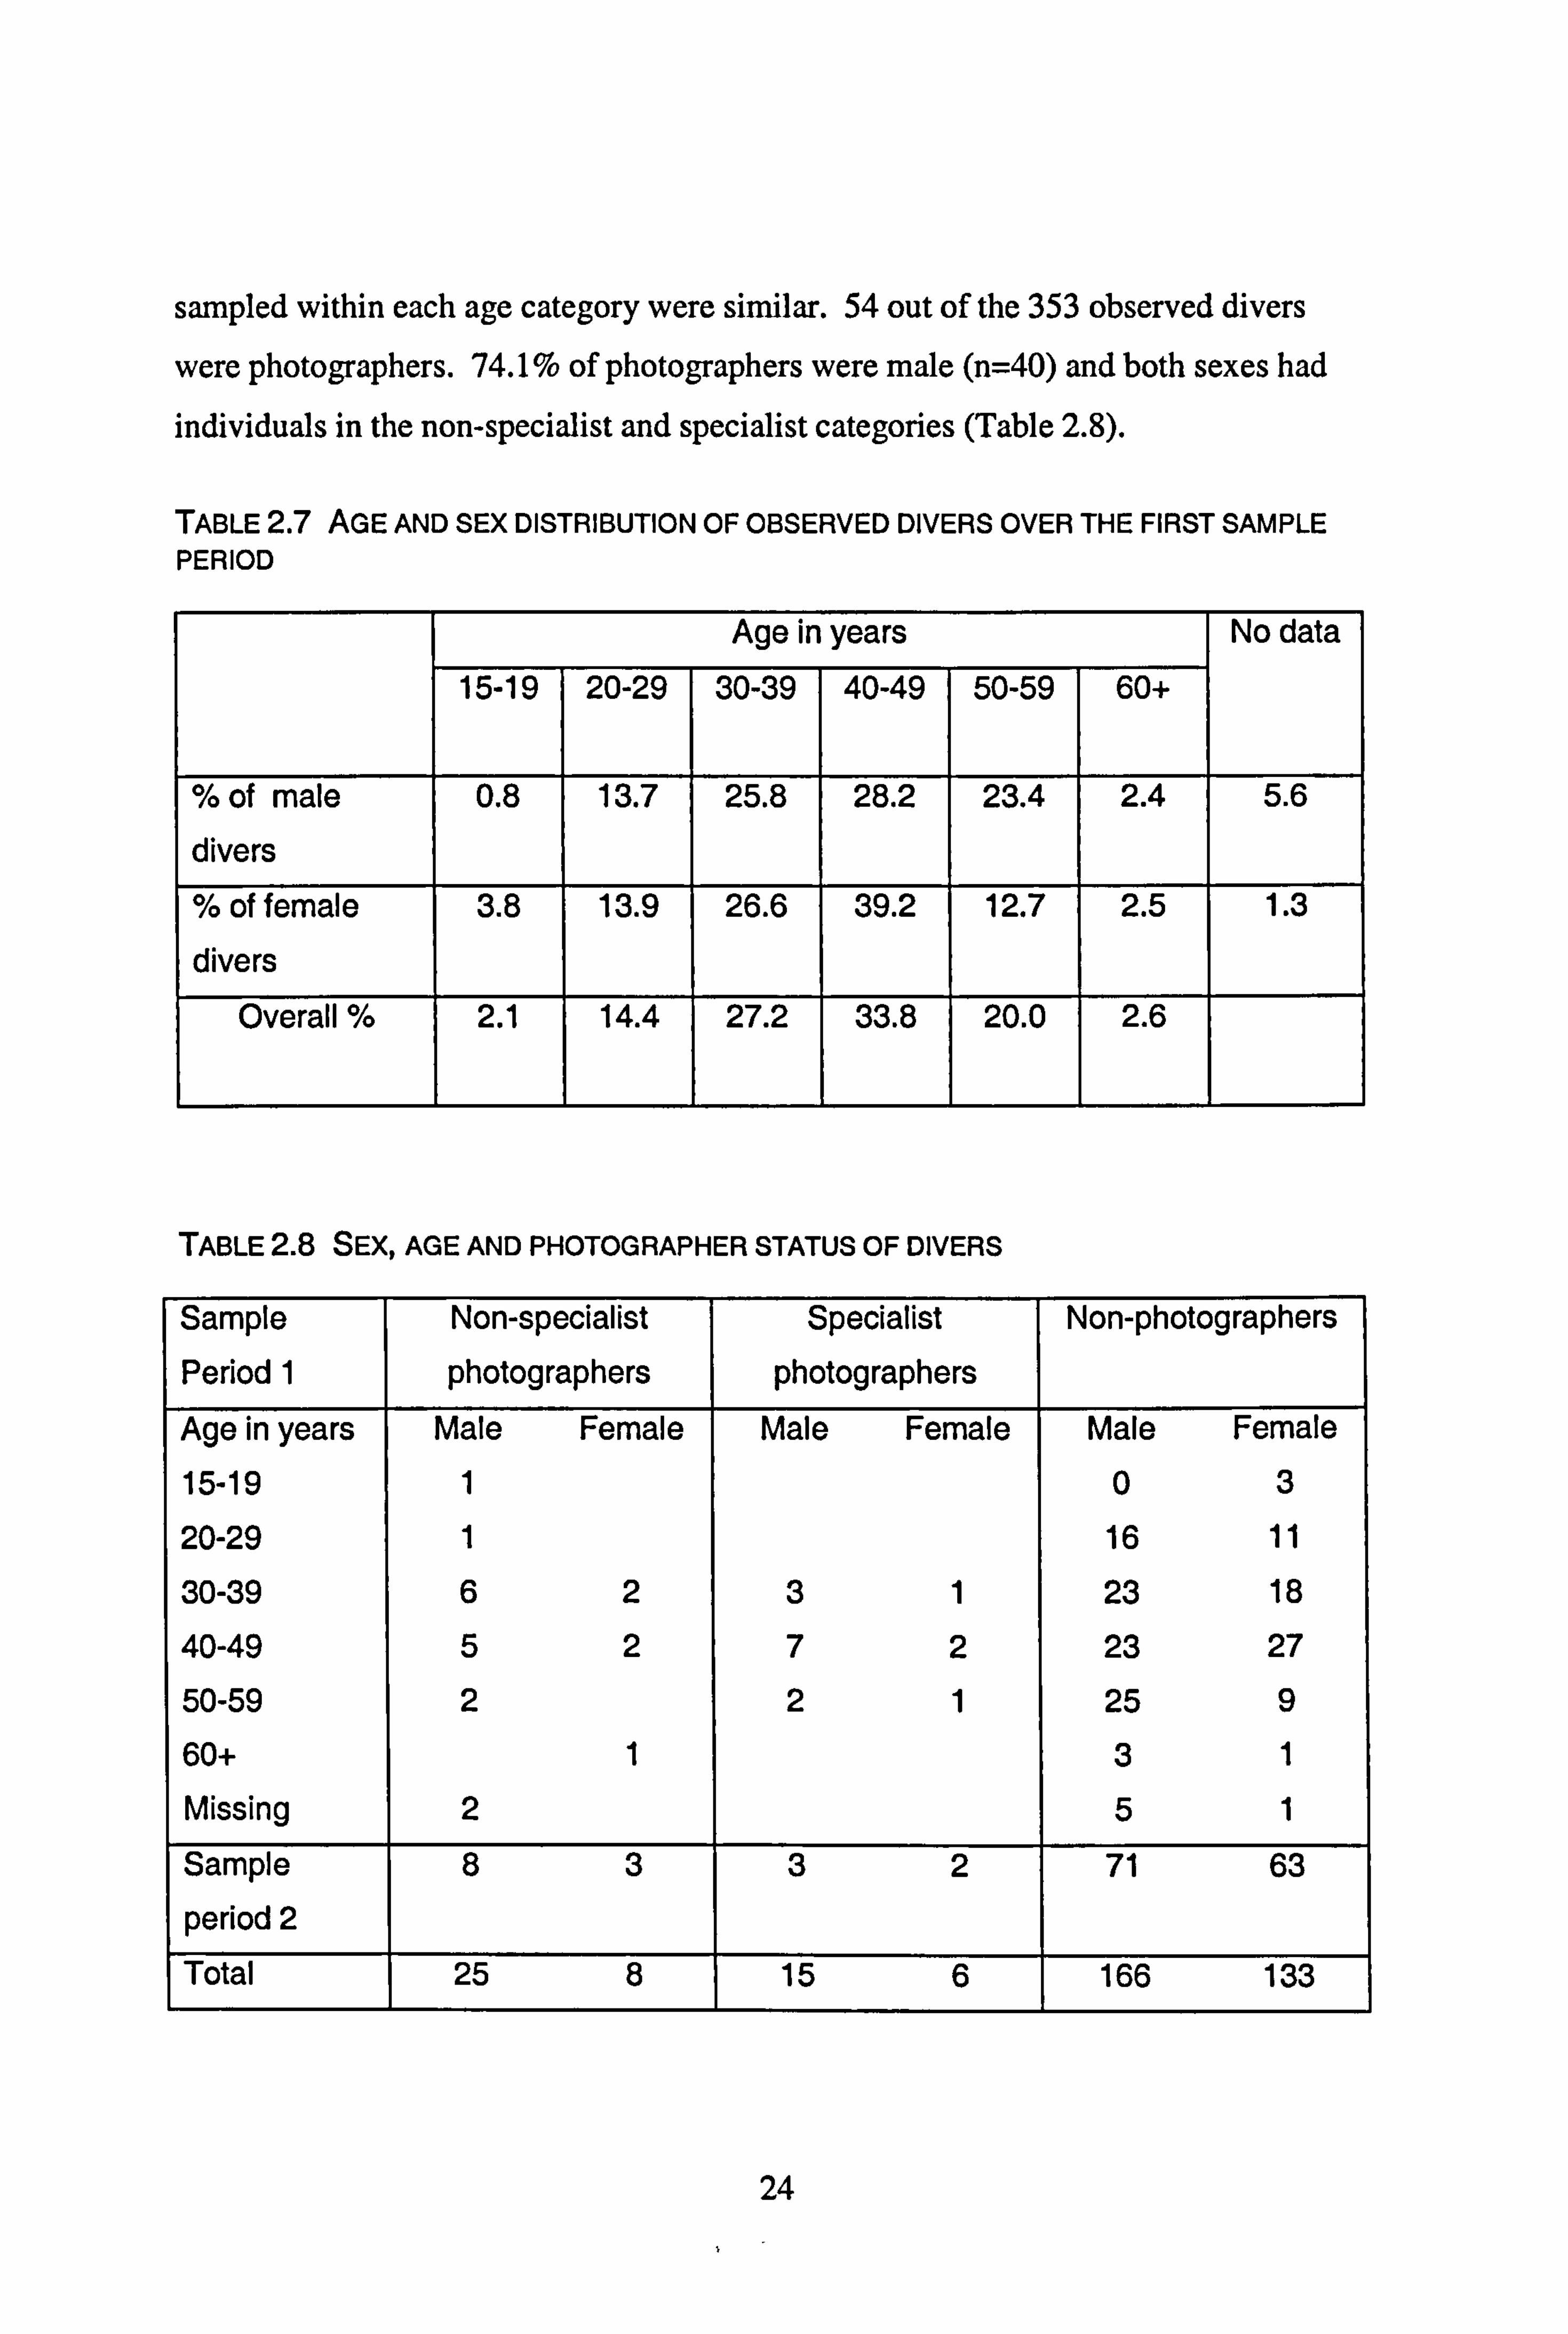
sampled within each age category were similar. 54 out of the 353 observed divers
were photographers. 74.1 % of photographers were male (n=40) and both sexes had
individuals in the non-specialist and specialist categories (Table 2.8).
TABLE 2.7 AGE AND SEX DISTRIBUTION OF OBSERVED DIVERS OVER THE FIRST SAMPLE PERIOD
Age in years No data
15-19 20-29 30-39 40-49 50-59 60+
%of male divers
0.8 13.7 25.8 28.2 23.4 2.4 5.6
% of female
divers
3.8 13.9 26.6 39.2 12.7 2.5 1.3
Overall % 2.1 14.4 27.2 33.8 20.0 2.6
TABLE 2.8 SEX, AGE AND PHOTOGRAPHER STATUS OF DIVERS
Sample Non-specialist Specialist Non-photographers
Period 1 photographers photographers Age in years Male Female Male Female Male Female
15-19 1 03
20-29 1 16 11
30-39 62 31 23 18
40-49 52 72 23 27
50-59 2 21 25 9
60+ 1 31
Missing 2 51
Sample 83 32 71 63
period 2
Total 25 8 15 6 166 133
24
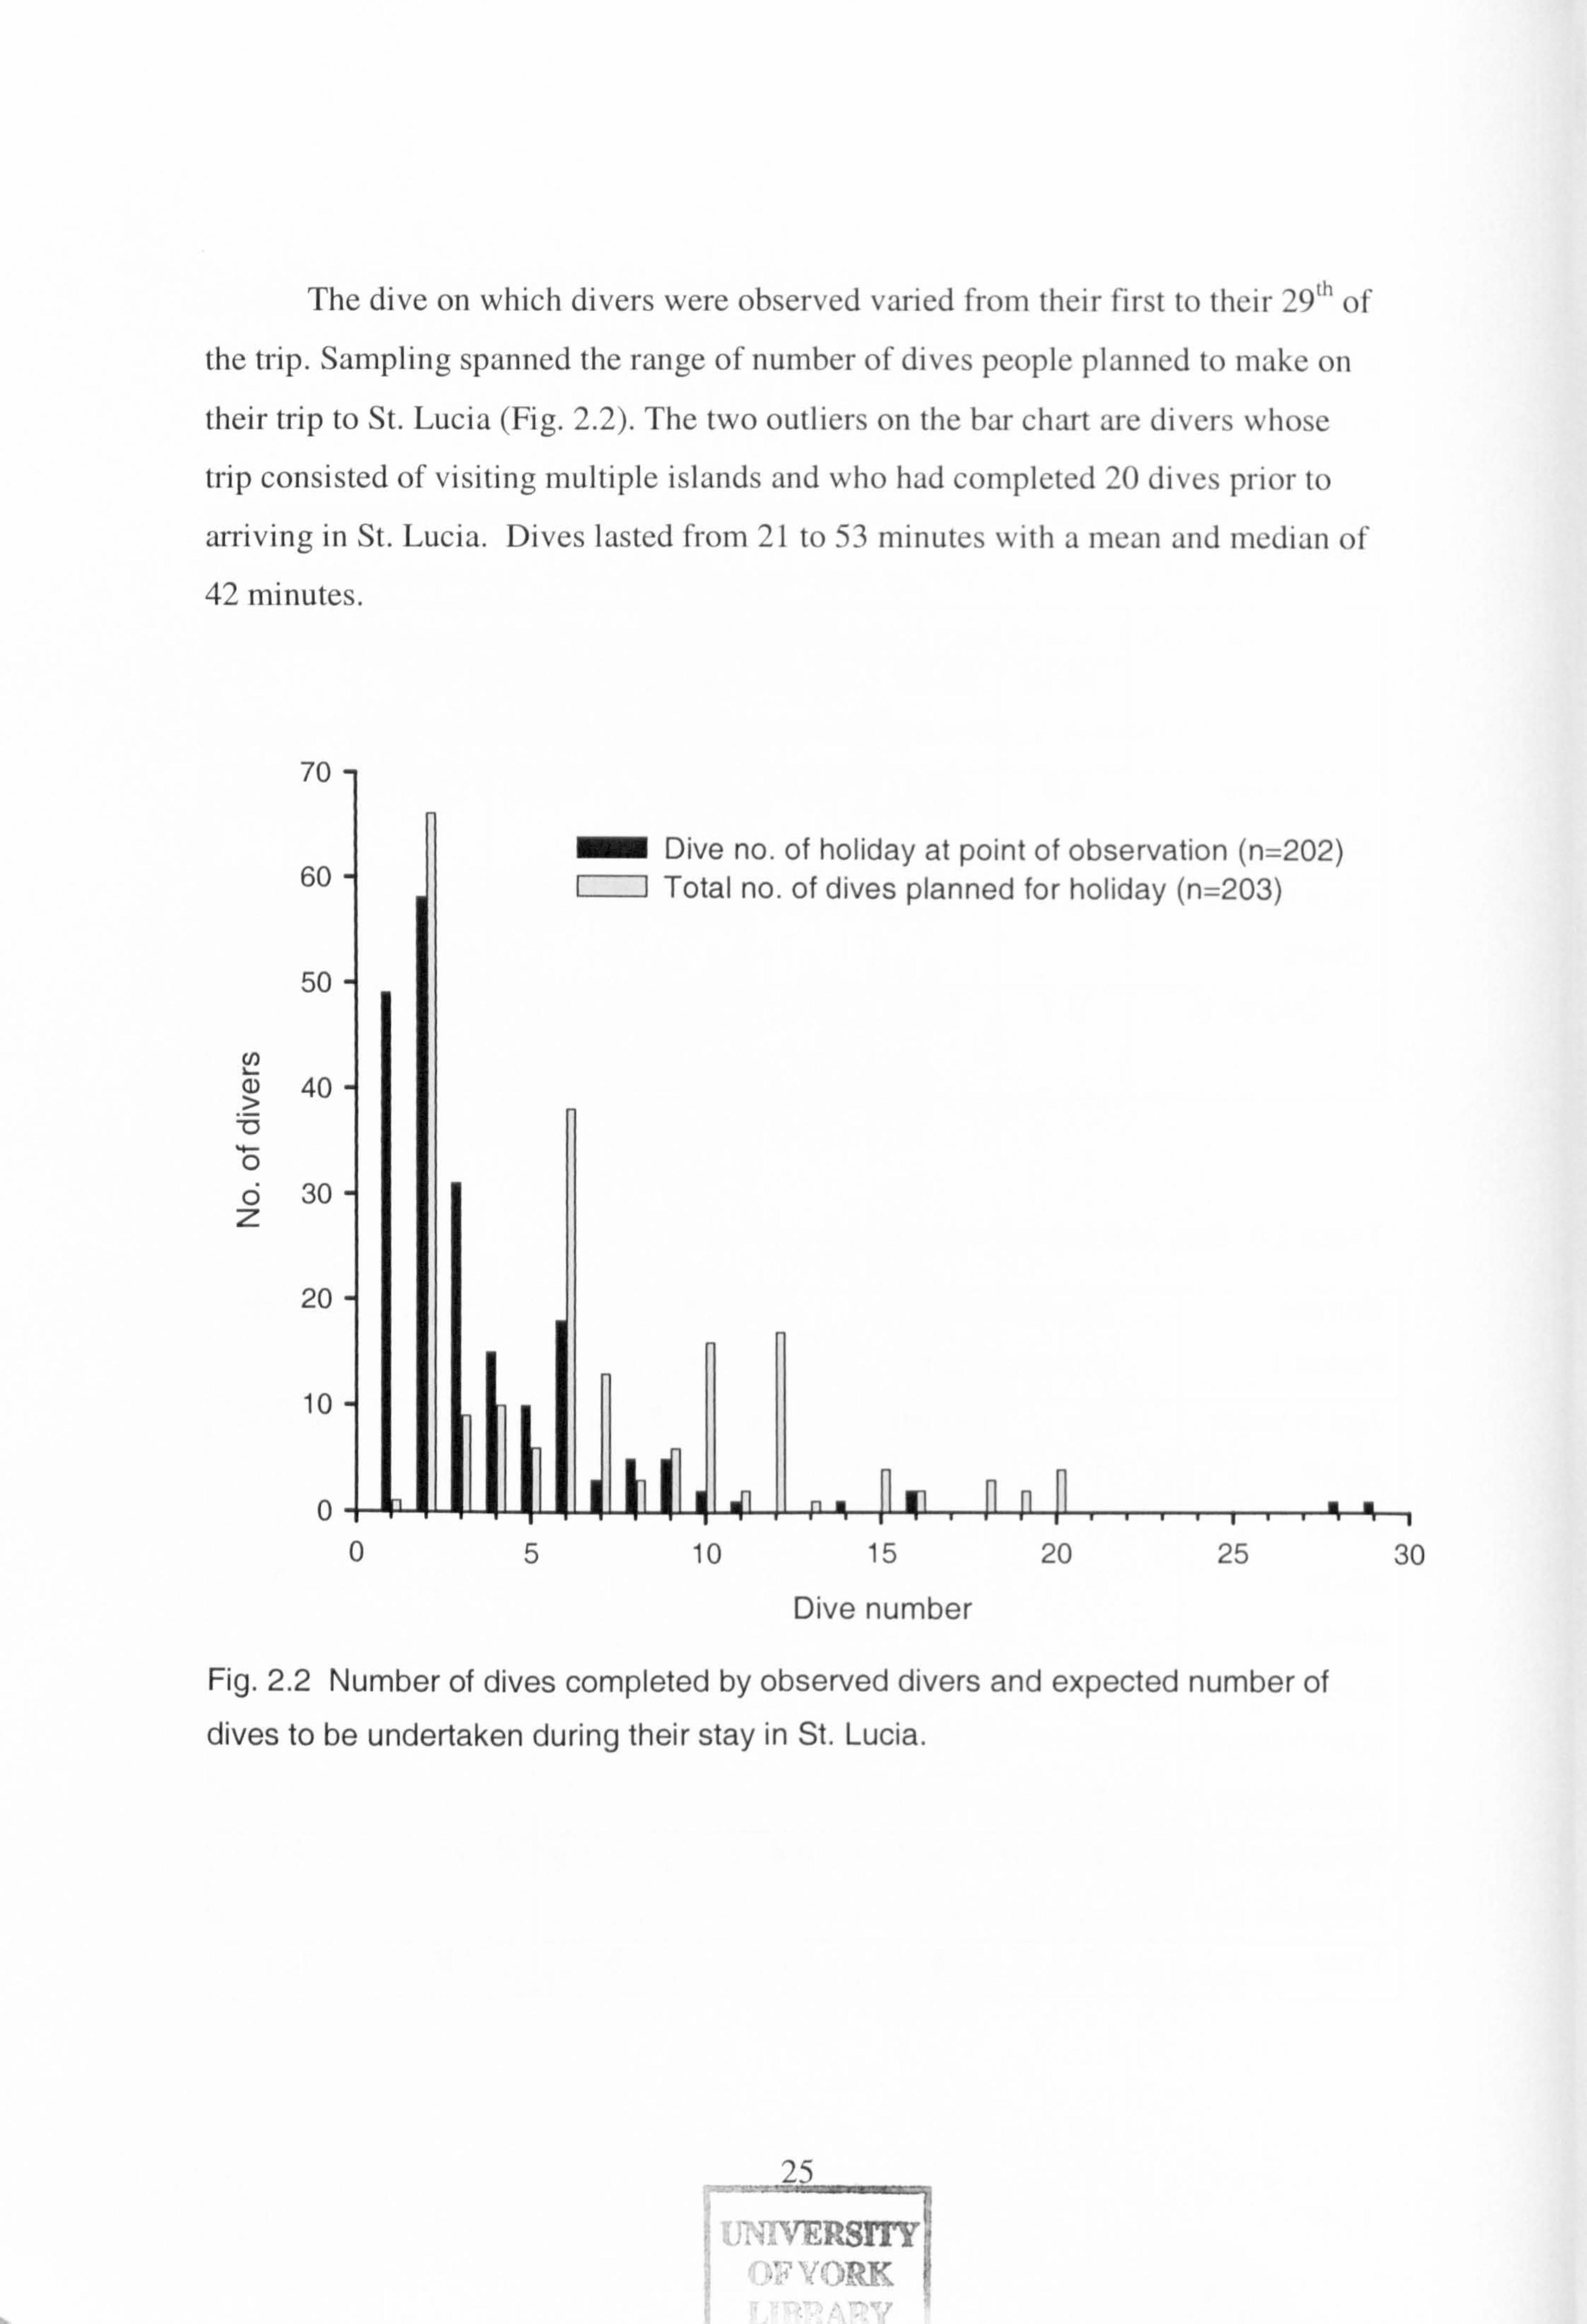
The dive on which divers were observed varied from their first to their 29 th ol
the trip. Sampling spanned the range of number of dives people planned to make oil
their trip to St. Lucia (Fig. 2.2). The two outliers on the bar chart are divers whose
trip consisted of visiting multiple islands and who had completed 20 dives prior to
arriving in St. Lucia. Dives lasted from 21 to 53 minutes with a mean and median of 42 minutes.
70-
60-
50-
40
30
20
10
0
Dive number
Fig. 2.2 Number of dives completed by observed divers and expected number of dives to be undertaken during their stay in St. Lucia.
25
ý, DRK
05 10 15 20 25 30
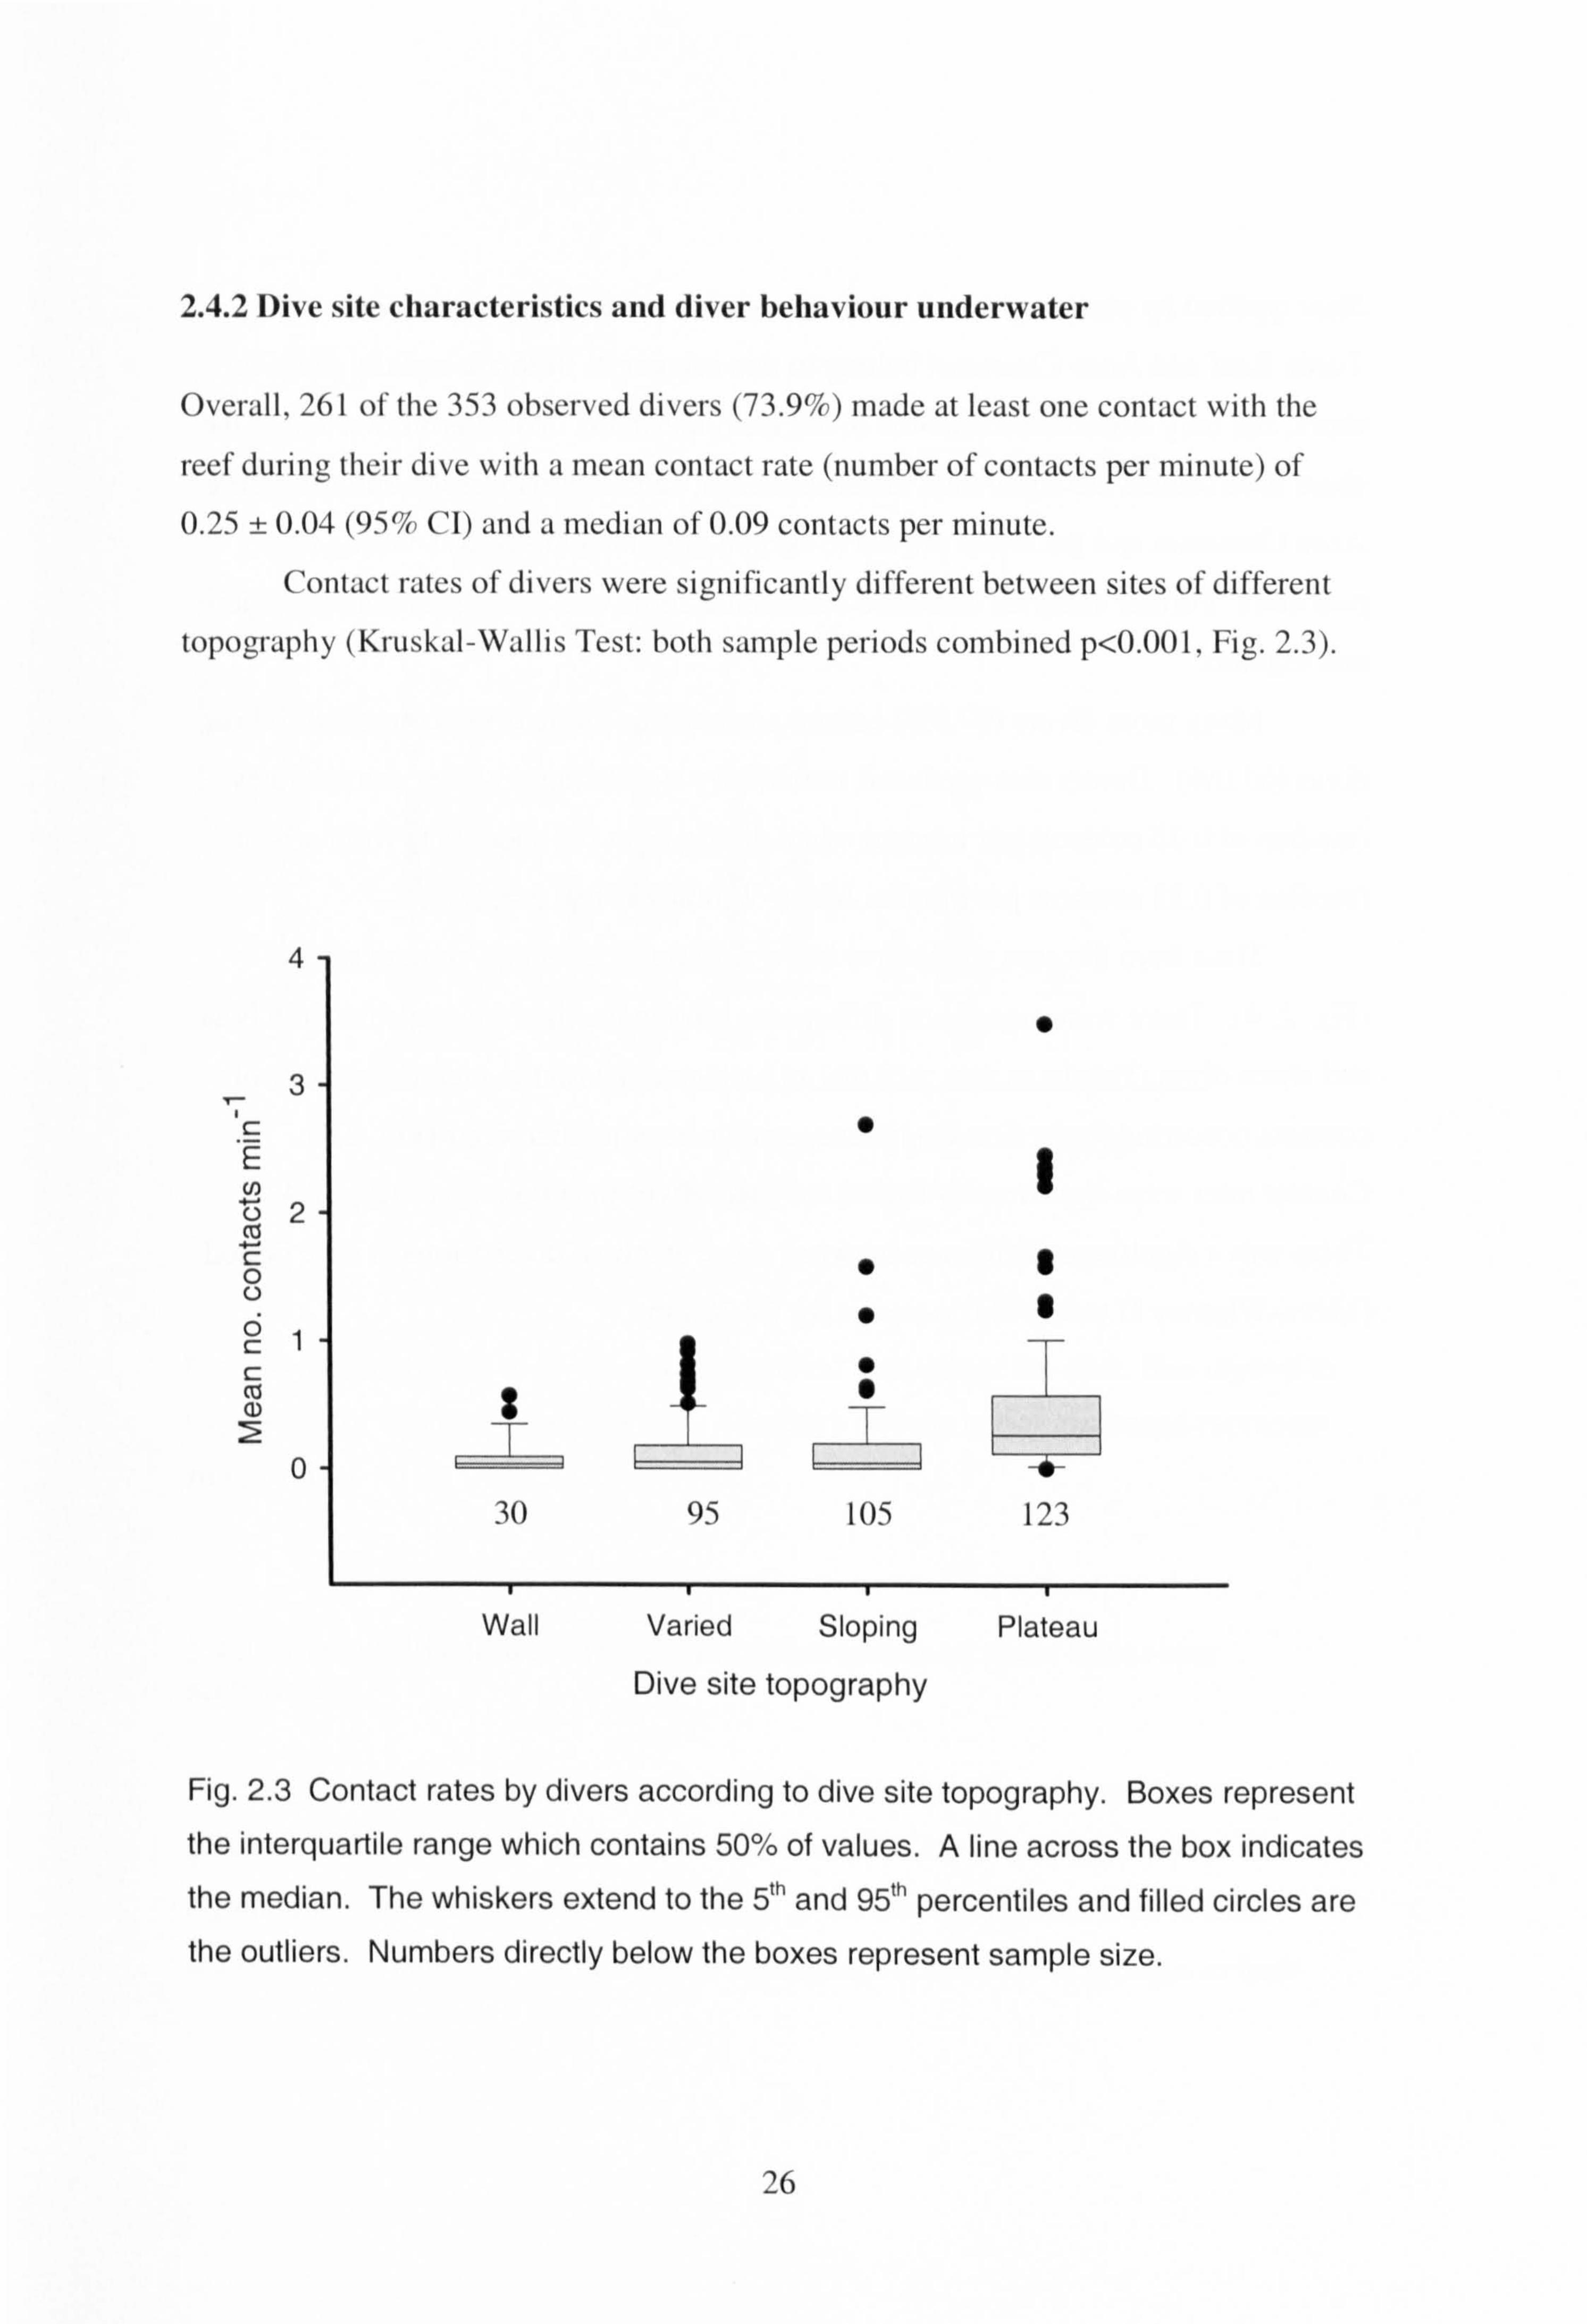
2.4.2 Dive site characteristics and diver behaviour underwater
Overall, 26 1 ofthe 353 observed divers (73.9%) made at least one contact with the
reef during their dive with a mean contact rate (number of contacts per minute) of 0.25 ± 0.04 (95% Cl) and a inedian of 0.09 contacts per minute.
Contact rates of divers were significantly different between sites of different
topography (Kruskal-Wallis Test: both sample periods combined p<0.001, Fig. 2.3).
4
0
U)
0
C;
co T (D : ýi
0
30 95 105 123
Wall Varied Sloping Plateau
Dive site topography
Fig. 2.3 Contact rates by divers according to dive site topography. Boxes represent the interquartile range which contains 50% of values. A line across the box indicates
the median. The whiskers extend to the 5 th and 95 Ih percentiles and filled circles are the outliers. Numbers directly below the boxes represent sample size.
26
Sites typified by plateaus had a higher rate of diver contact than other sites. Only
Turtle Reef and Anse Chastanet belong to this category. Both are equally close to
shore, but only Anse Chastanet was dived from the shore. To determine whether the
shore dive caused the significant difference seen, calculations were re-run excluding
Anse Chastanet and the result proved to be non-significant (Kruskal-Wallis test,
p=0.464). Further analyses therefore considered shore and boat dives both separately
and together.
Many more divers (97.9%) caused a contact on shore dives compared to boat
dives (65.0%). Divers also produced statistically significantly higher contact rates (median of 0.35 contacts per minute) when diving from the shore than from a boat
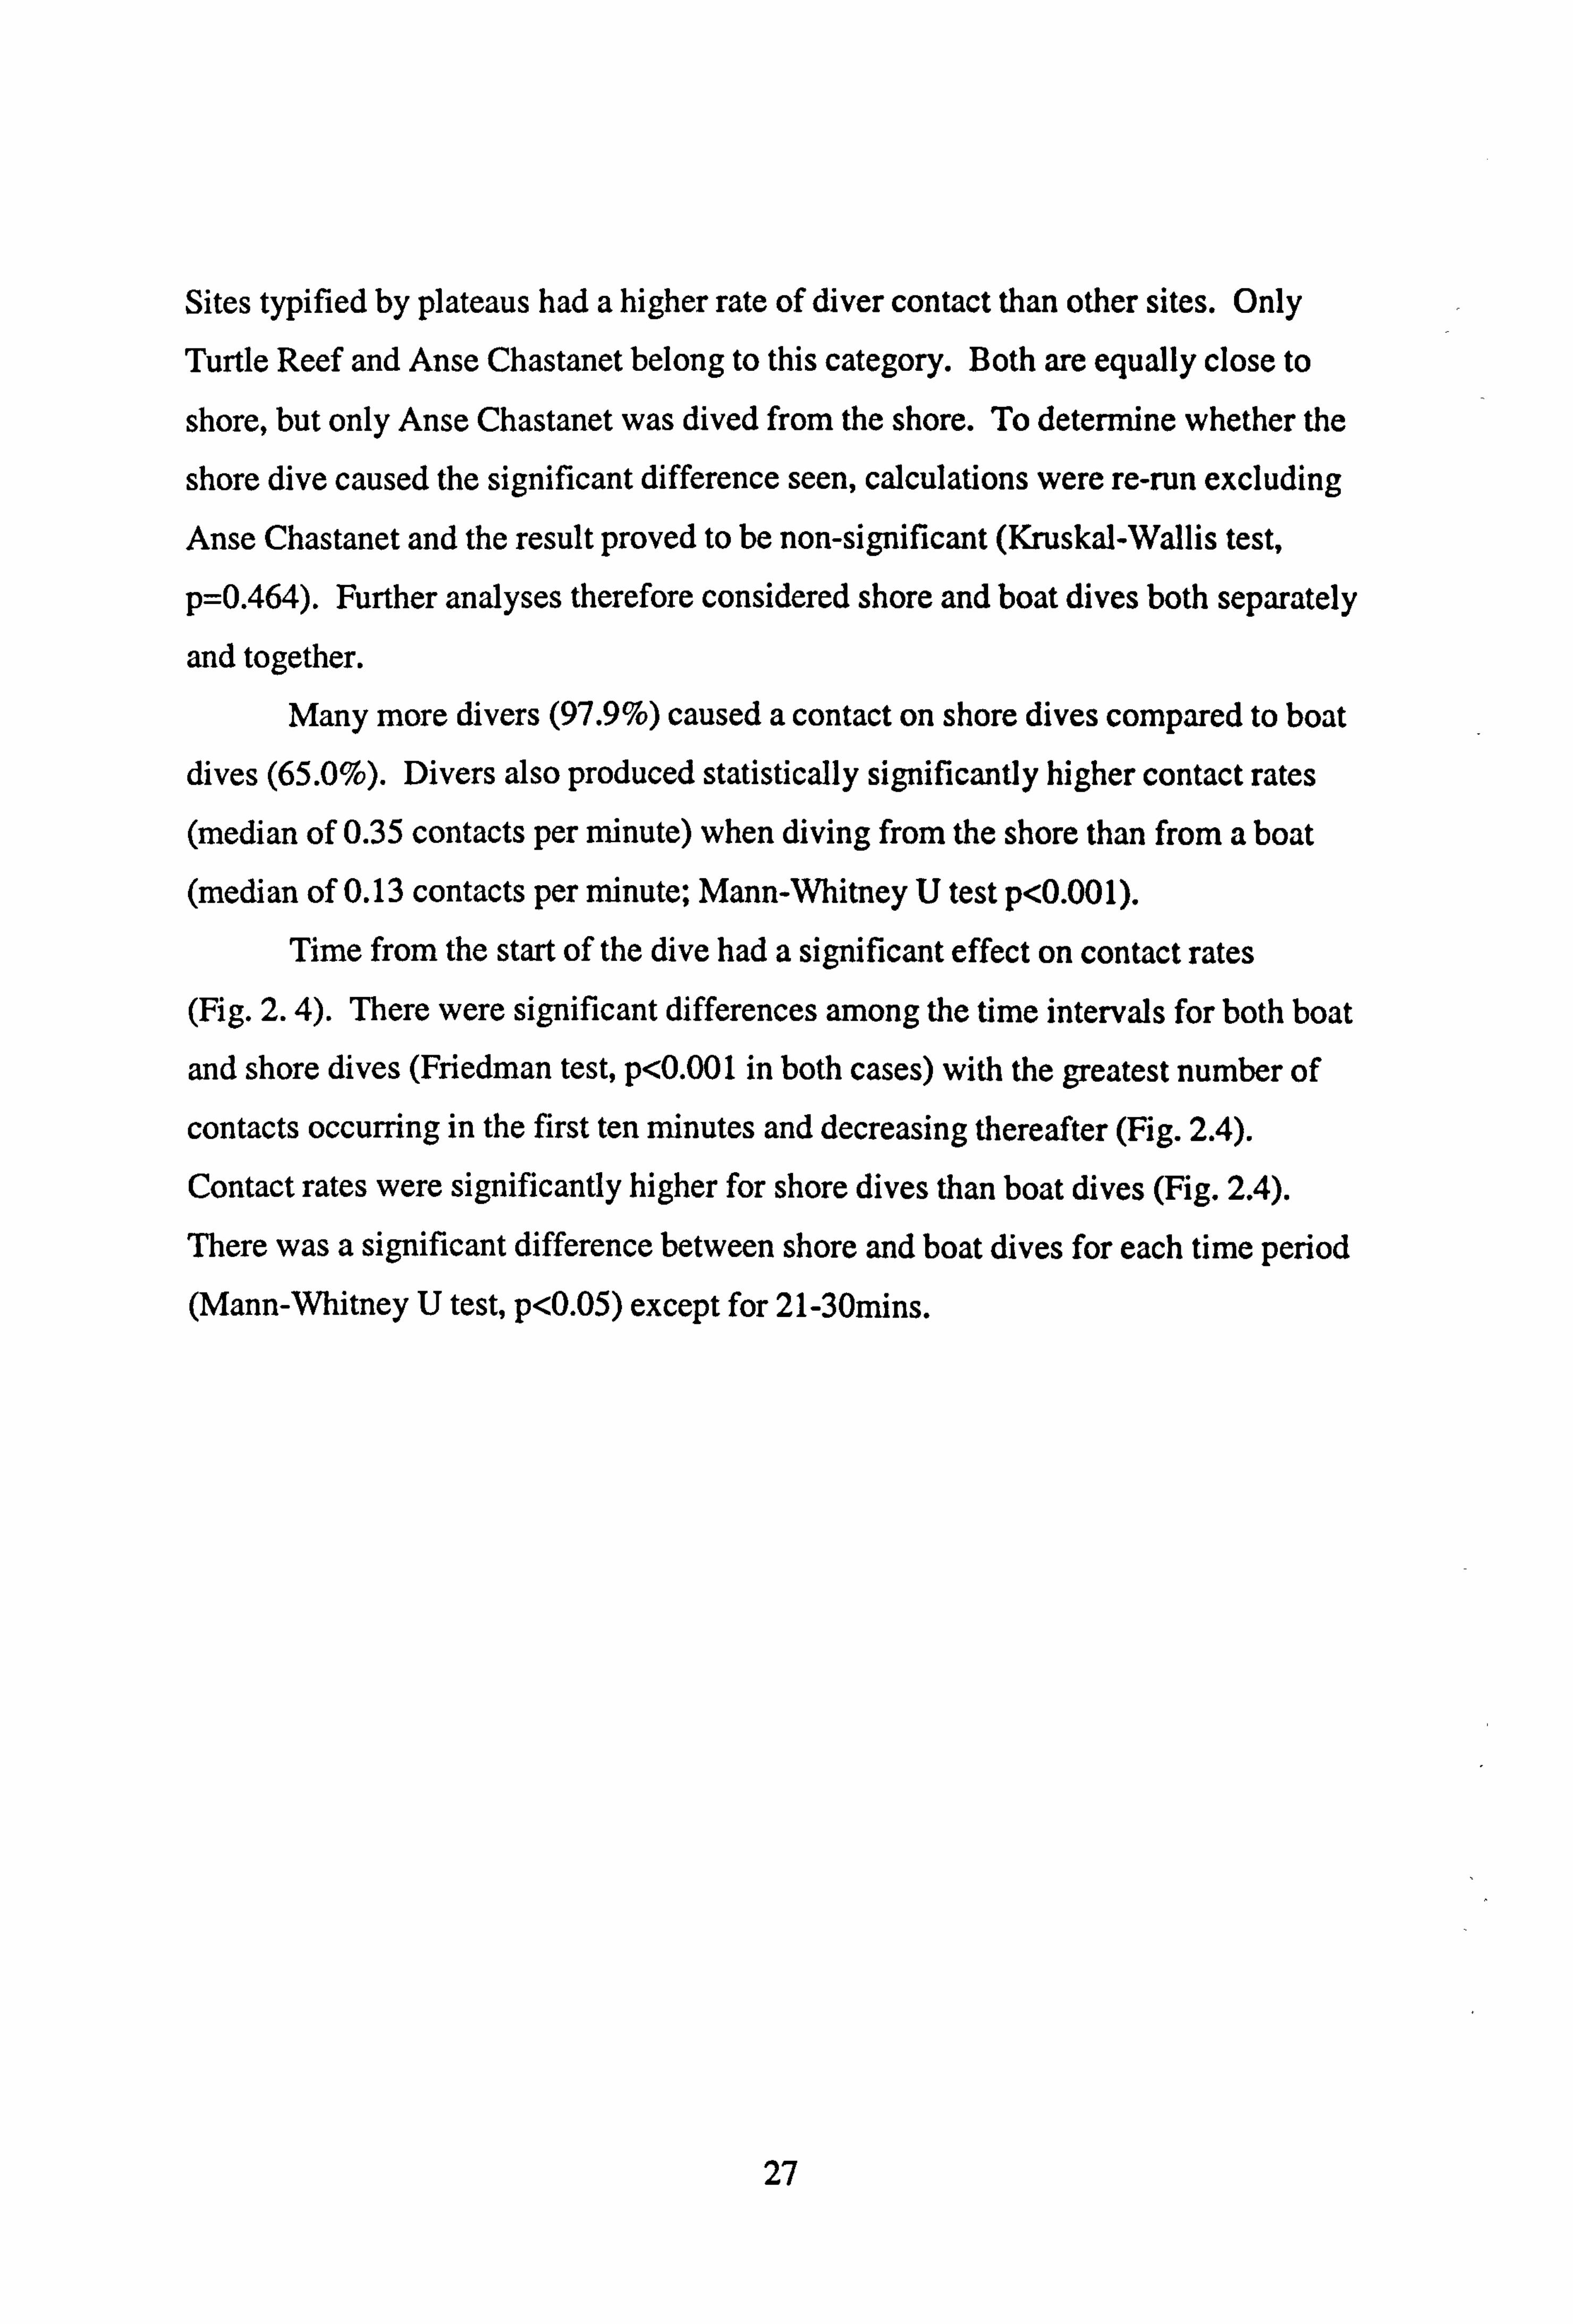
(median of 0.13 contacts per minute; Mann-Whitney U test p<0.001). Time from the start of the dive had a significant effect on contact rates
(Fig. 2.4). There were significant differences among the time intervals for both boat
and shore dives (Friedman test, p<0.001 in both cases) with the greatest number of
contacts occurring in the first ten minutes and decreasing thereafter (Fig. 2.4).
Contact rates were significantly higher for shore dives than boat dives (Fig. 2.4).
There was a significant difference between shore and boat dives for each time period (Mann-Whitney U test, p<0.05) except for 21-30mins.
27
6 Boat dives Shore dives
4-
E
C)
02-
0 246 107 246 107 238 105 191 70 21
0-10 11-20 21-30 31-40 41-50 Time from start of dive (minutes)
Fig. 2.4 Contact rates of divers and time period throughout the dive. See legend to
Figure 2.3 for explanation of box plot. Numbers directly under the boxes represent
sample size.
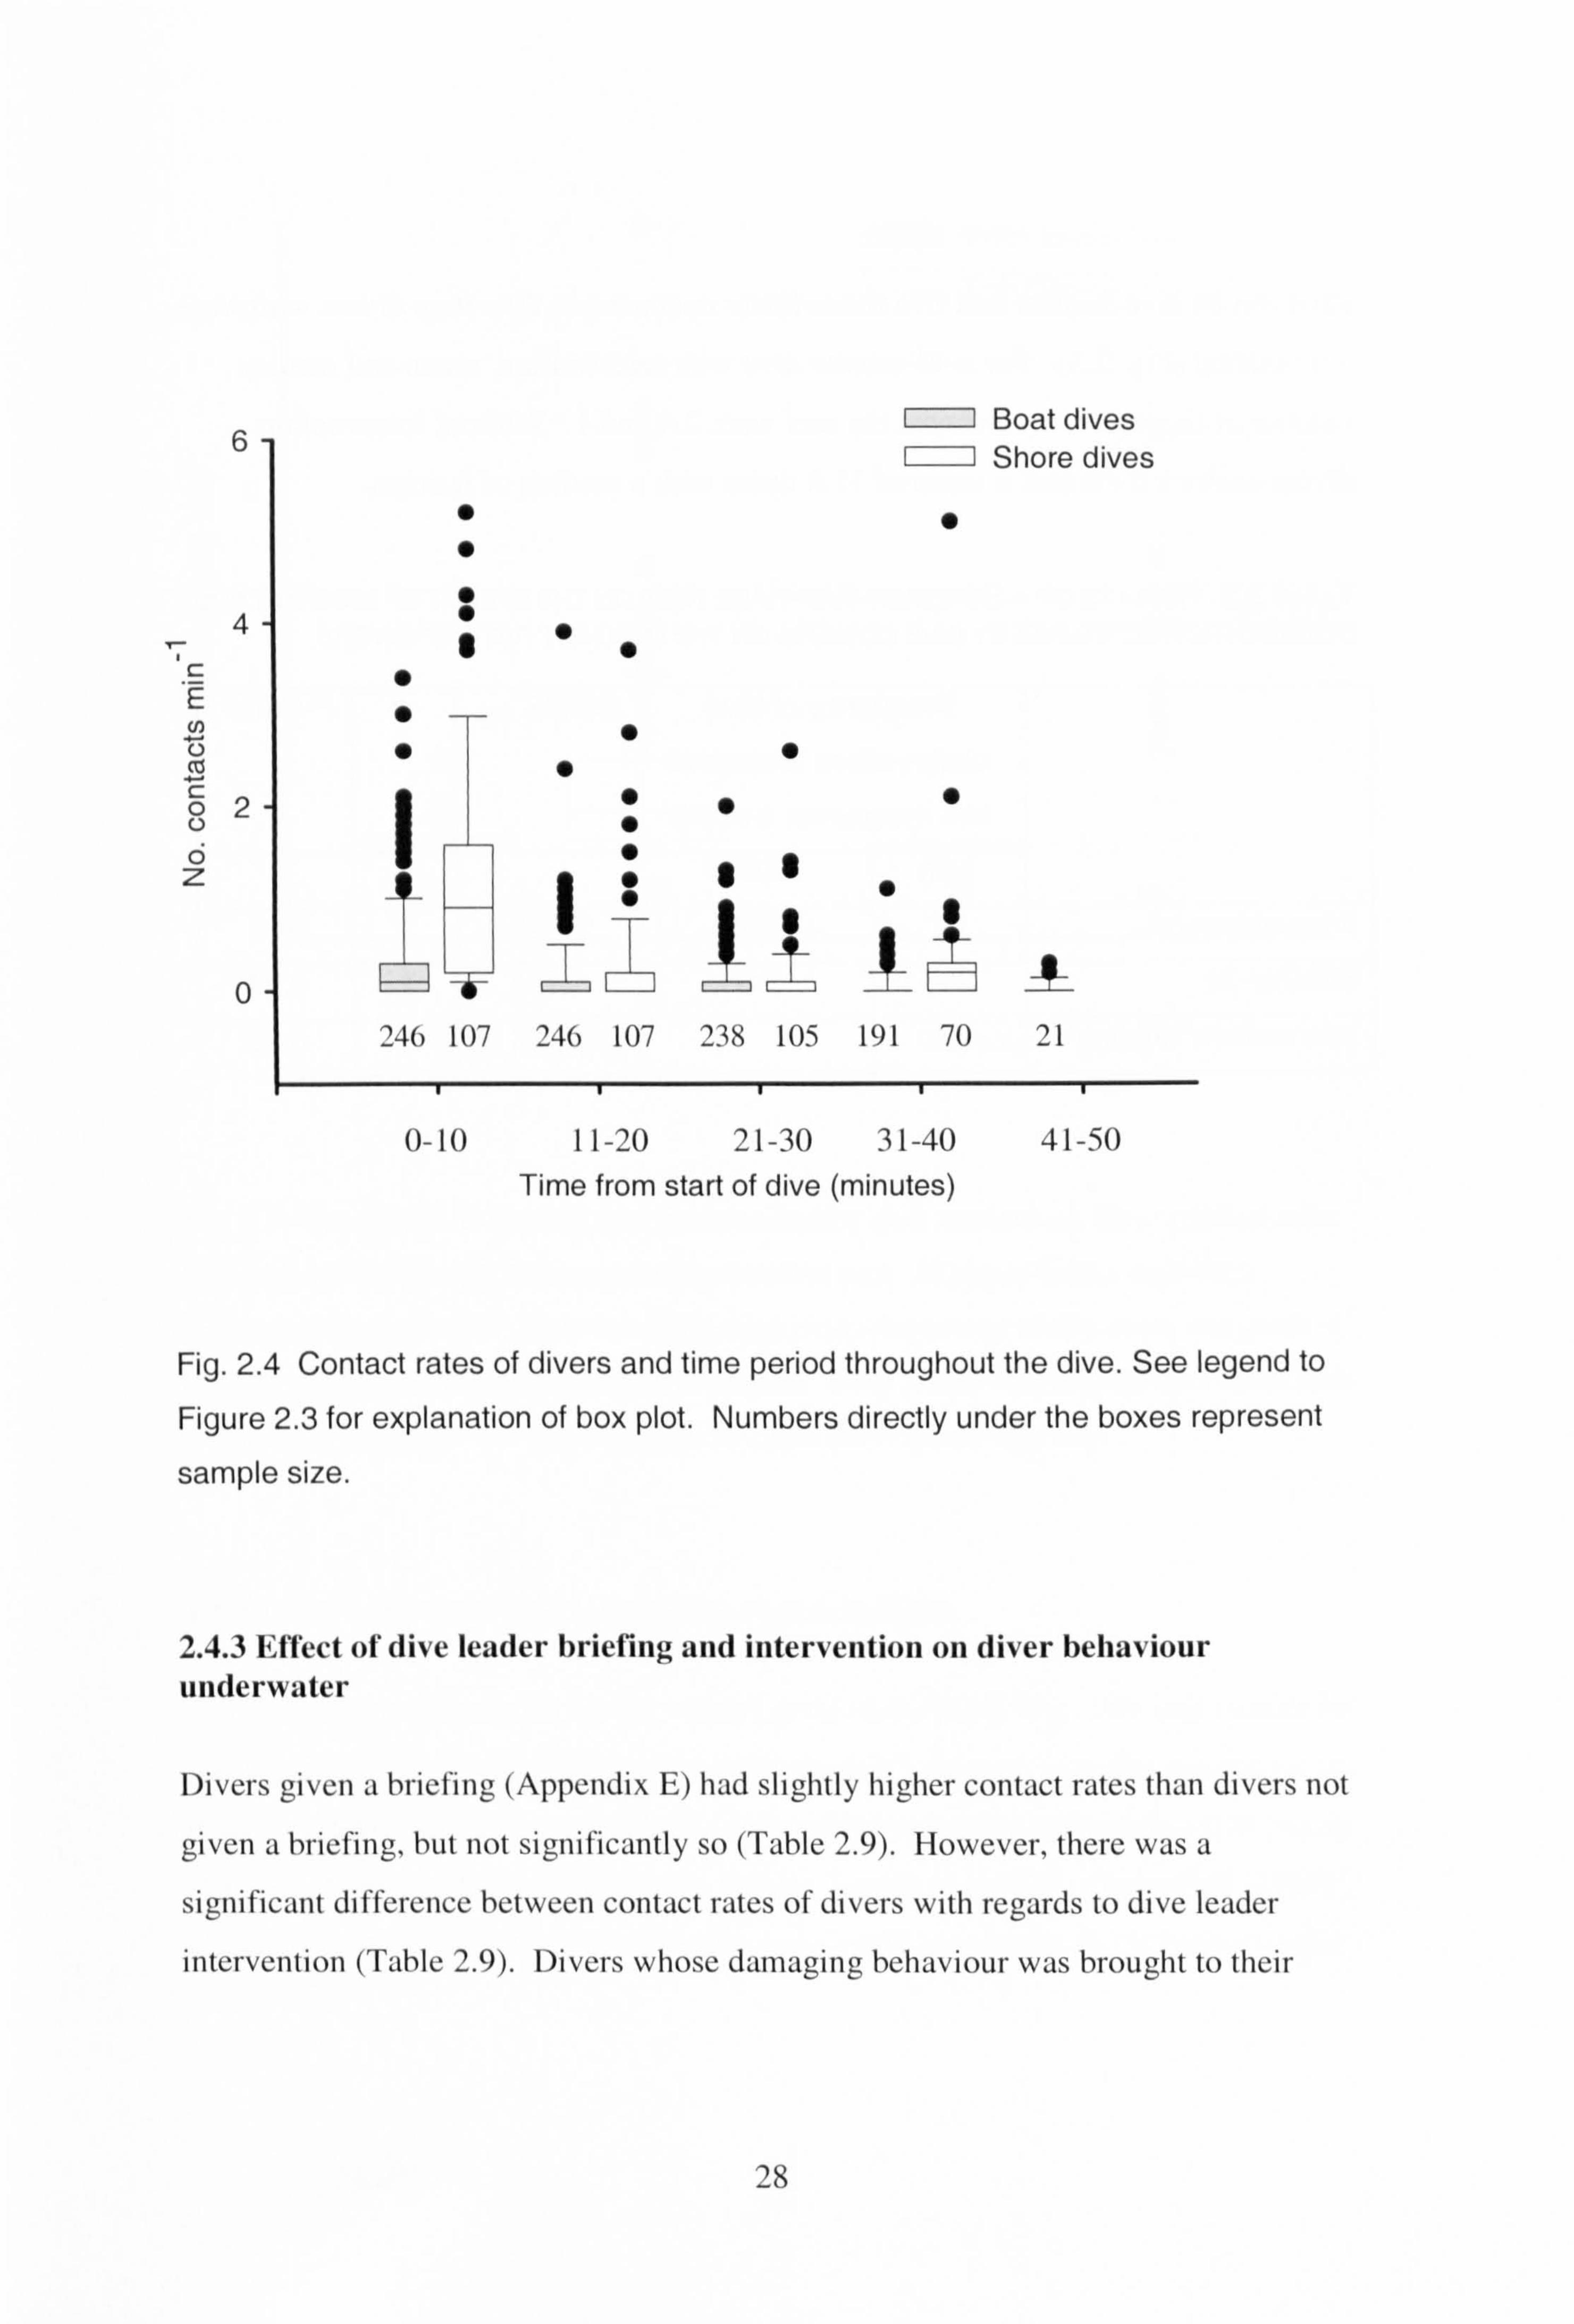
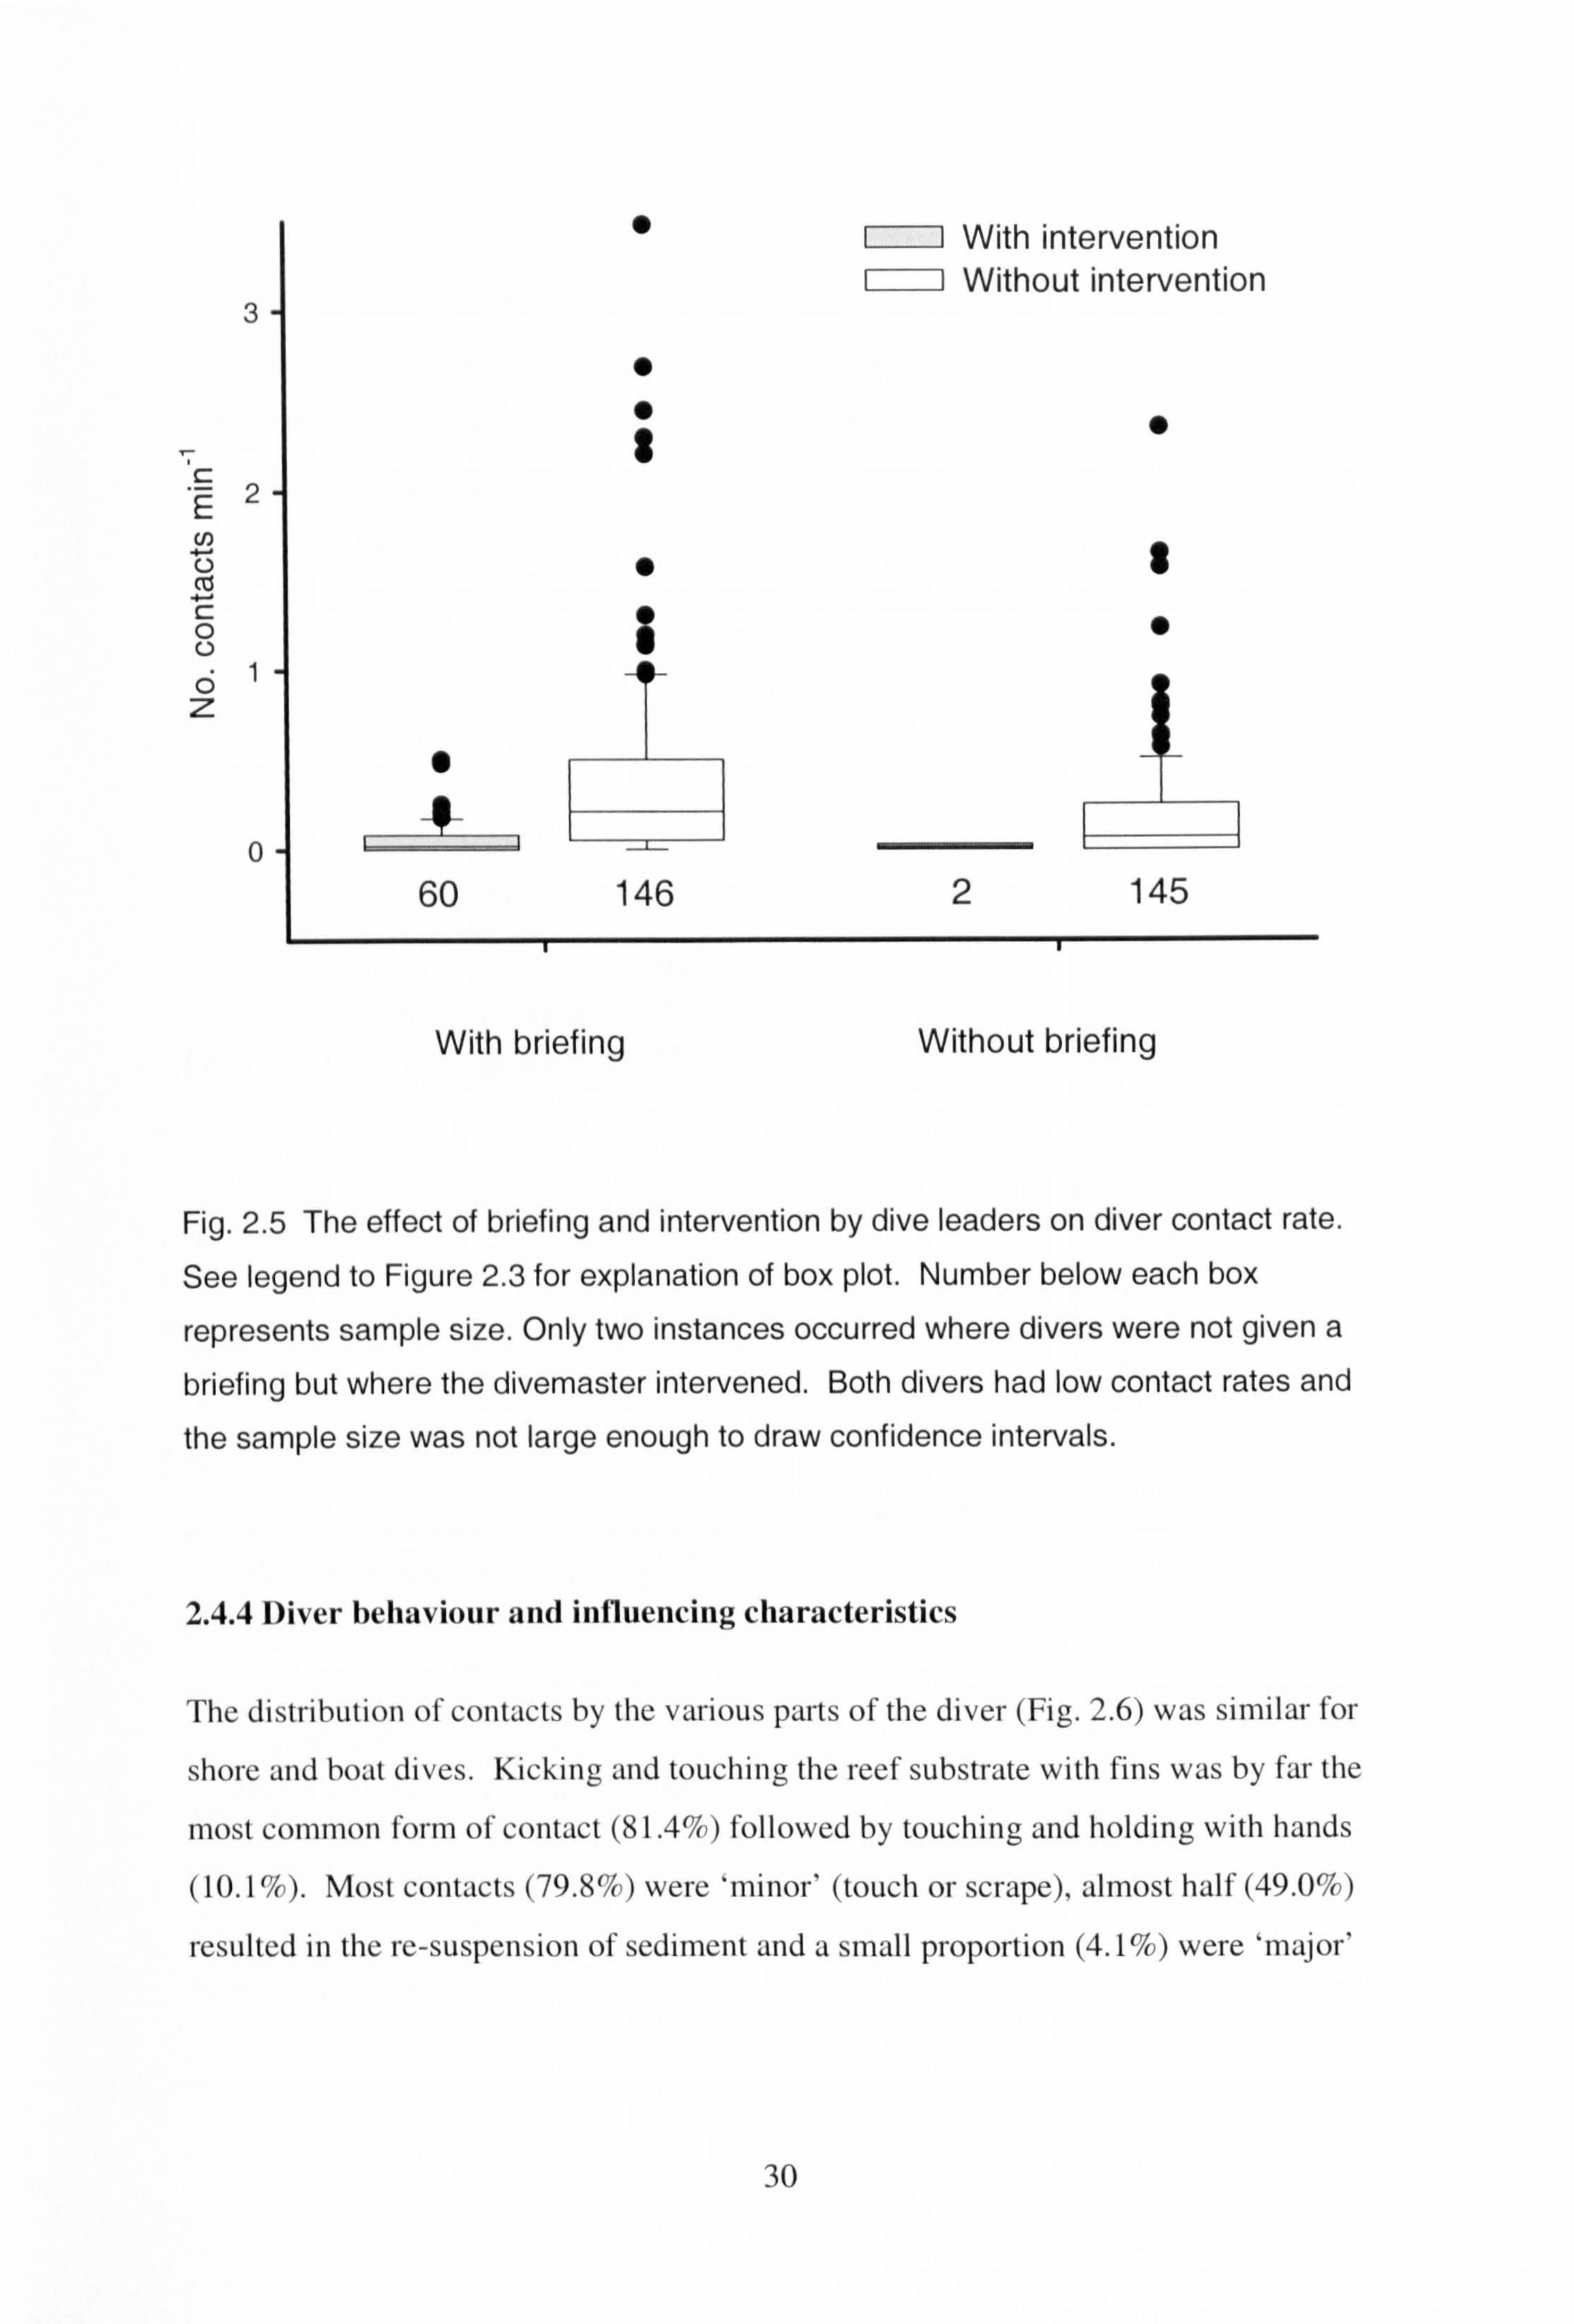
2.4.3 Effect of dive leader briefing and intervention on diver behaviour underwater
Divers given a briefing (Appendix E) had slightly higher contact rates than divers not
given a briefing, but not significantly so (Table 2.9). However, there was a
significant difference between contact rates of divers with regards to dive leader
intervention (Table 2.9). Divers whose darnaging behaviour was brought to their
28
attention by dive-leaders had five times fewer contacts per dive than divers who were
not notified (Fig. 2.5). For a 40-minute dive with intervention, mean and median
number of times divers contacted the reef were 2.4 and 1. Without intervention,
divers contacted the reef a mean of 11.6 times with a median of 6 times.
TABLE2.9 RESULTS OF A SCHEIRER-RAY-HARE TEST ON THE EFFECT OF BRIEFING AND INTERVENTION MEASURES BY DIVE LEADERS ON THE CONTACT RATE OF DIVERS
Frequency of dive
observations under the two measures: a and b
SS/MS ttl df P-value
with without Intervention (a) 62 291 6.199 1 0.01 Briefing (b) 206 147 1.386 1 0.24 InterventionTriefing 0.104 1 0.75
29
0
3
C
E Cl) C-)
C 0 0
0 z
2
.
$
60 146
With briefing
With intervention Without intervention
0
I
0
2 145
Without briefing
Fig. 2.5 The effect of briefing and intervention by dive leaders on diver contact rate.
See legend to Figure 2.3 for explanation of box plot. Number below each box
represents sample size. Only two instances occurred where divers were not given a
briefing but where the divernaster intervened. Both divers had low contact rates and
the sample size was not large enough to draw confidence intervals.
2.4.4 Diver behaviour and intluencing characteristics
The distribution of contacts by the various parts of the diver (Fig. 2.6) was similar for
shore and boat dives. Kicking and touching the reef substrate with fins was by far the
most common form ofcontact (81.4%) followed by touching and holding with hands
(10.1 17c). Most contacts (79.817c) were *ininor' (touch or scrape), almost half (49.0%)
resulted in the re-suspci-ision ofsediment and a small proportion (4.1%) were 'rnajor'
30
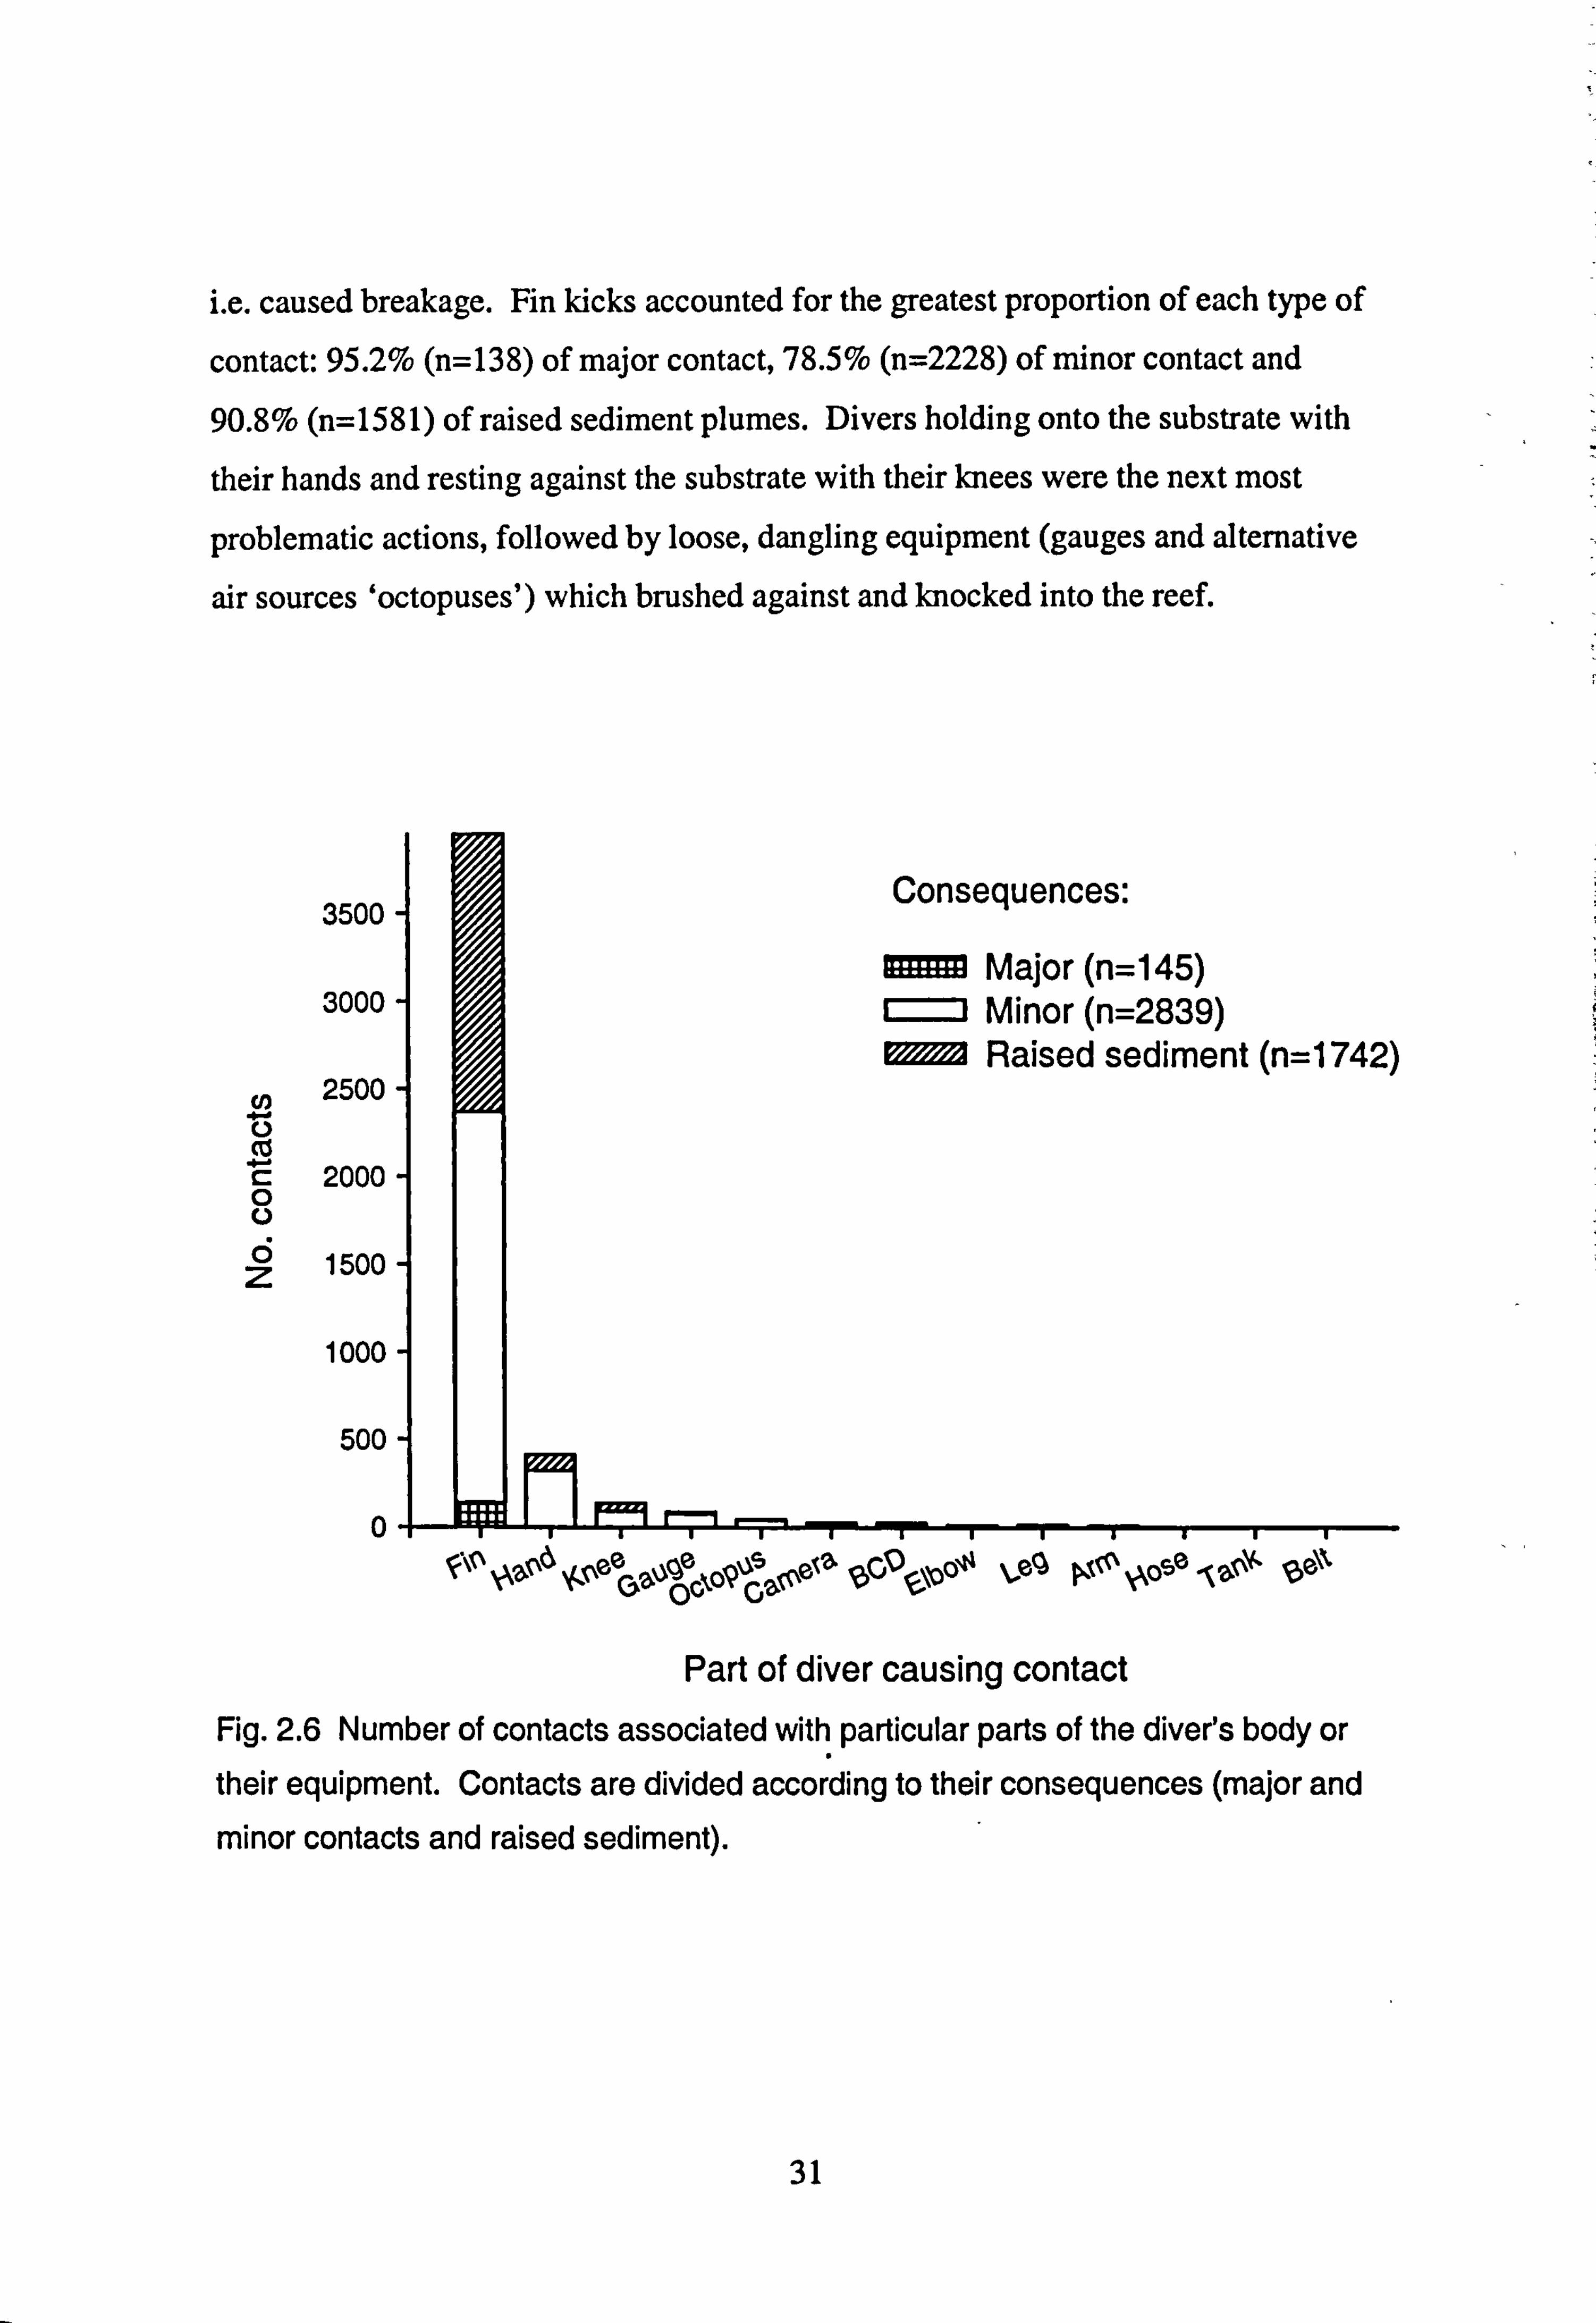
i. e. caused breakage. Fin kicks accounted for the greatest proportion of each type of
contact: 95.2% (n=138) of major contact, 78.5% (n=2228) of minor contact and
90.8% (n=1581) of raised sediment plumes. Divers holding onto the substrate with
their hands and resting against the substrate with their knees were the next most
problematic actions, followed by loose, dangling equipment (gauges and alternative
air sources 'octopuses') which brushed against and knocked into the reef.
Consequences: 3500-
Major (n=145) 3000- Minor (n=2839)
Raised sediment (n=1742) Cn 2500-
0 Cz C: ZU00 - 0 0 6 15001 z
1000
500
0
oc eq ý. jo \Nose - Y, 5e\'-
Part of diver causing contact Fig. 2.6 Number of contacts associated with particular parts of the diver's body or their equipment. Contacts are divided according to their consequences (major and minor contacts and raised sediment).
31
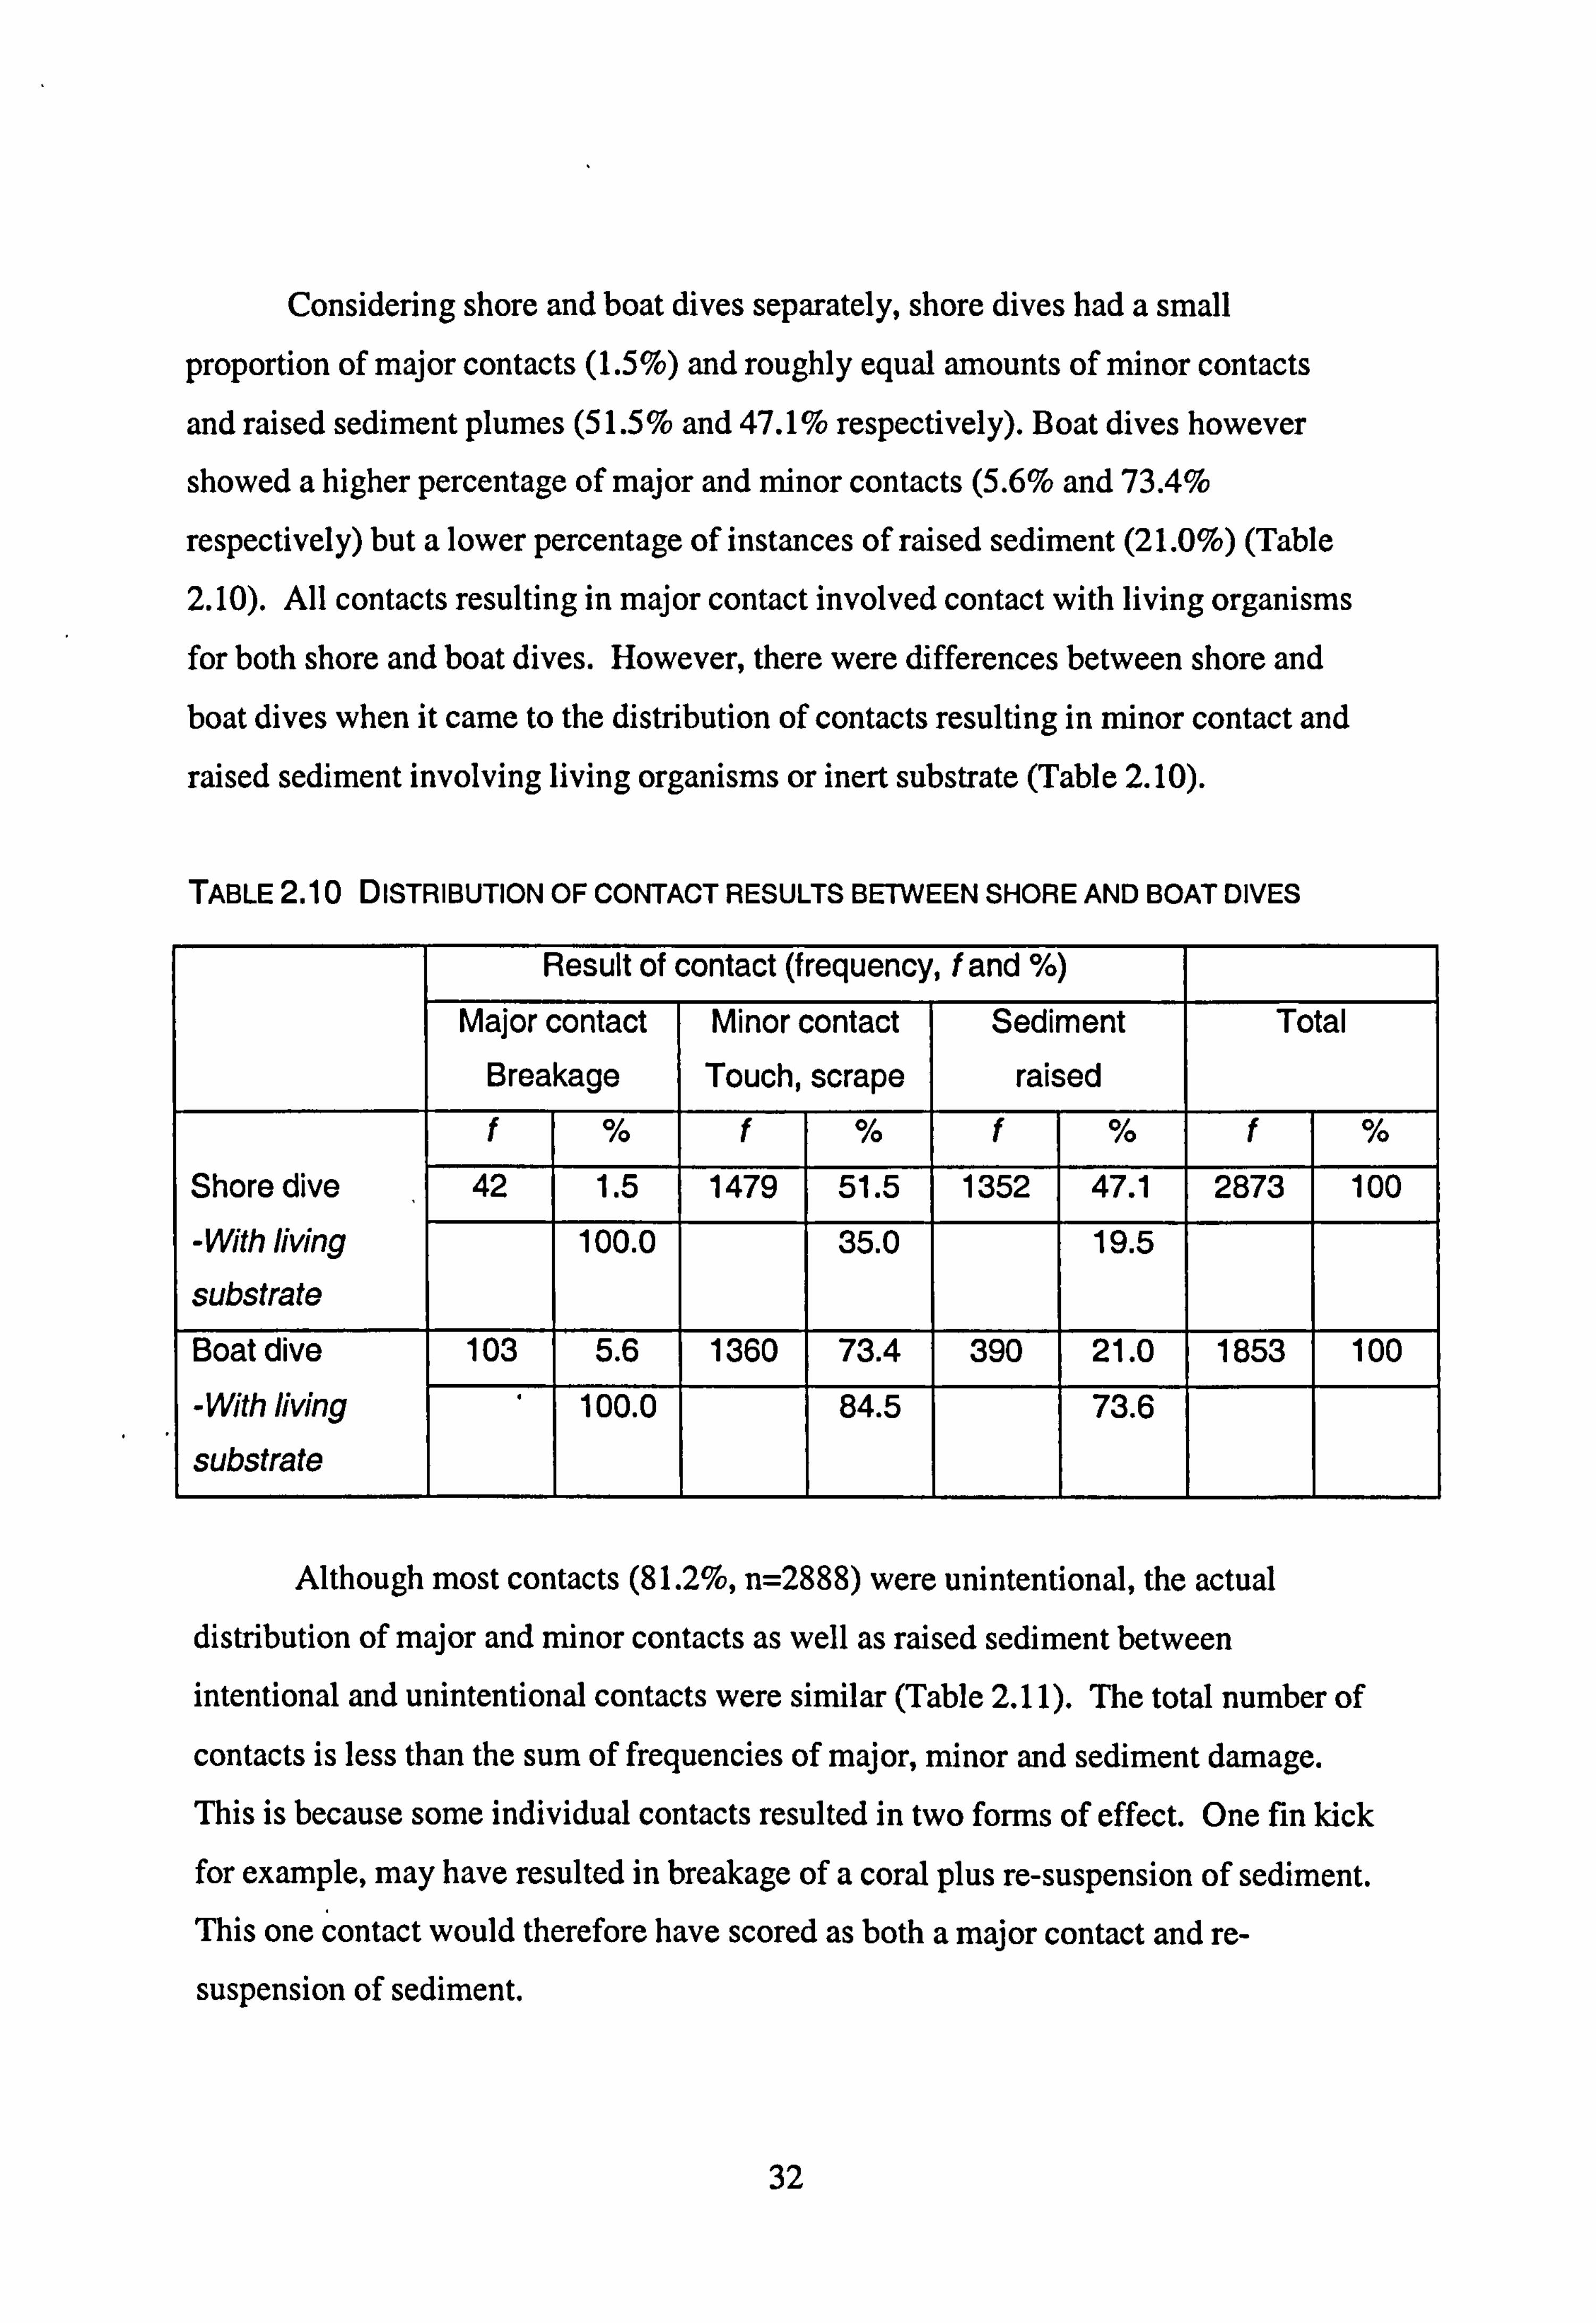
Considering shore and boat dives separately, shore dives had a small
proportion of major contacts (1.5%) and roughly equal amounts of minor contacts
and raised sediment plumes (51.5% and 47.1% respectively). Boat dives however
showed a higher percentage of major and minor contacts (5.6% and 73.4%
respectively) but a lower percentage of instances of raised sediment (21.0%) (Table
2.10). All contacts resulting in major contact involved contact with living organisms
for both shore and boat dives. However, there were differences between shore and boat dives when it came to the distribution of contacts resulting in minor contact and
raised sediment involving living organisms or inert substrate (Table 2.10).
TABLE2.10 DISTRIBUTION OF CONTACT RESULTS BETWEEN SHORE AND BOAT DIVES
Result of contact (frequency, f and %) Major contact
Breakage Minor contact Touch, scrape
Sediment
raised
Total
f % f % f % f % Shore dive 42 1.5 1479 51.5 1352 47.1 2873 100
-With living
substrate
100.0 35.0 19.5
Boat dive 103 5.6 1360 73.4 390 21.0 1853 100
-With living
substrate
100.0
I
84.5
I
73.6
I
Although most contacts (81.2%, n=2888) were unintentional, the actual distribution of major and minor contacts as well as raised sediment between
intentional and unintentional contacts were similar (Table 2.11). The total number of
contacts is less than the sum of frequencies of major, minor and sediment damage.
This is because some individual contacts resulted in two forms of effect. One fin kick
for example, may have resulted in breakage of a coral plus re-suspension of sediment. This one contact would therefore have scored as both a major contact and re- suspension of sediment.
32
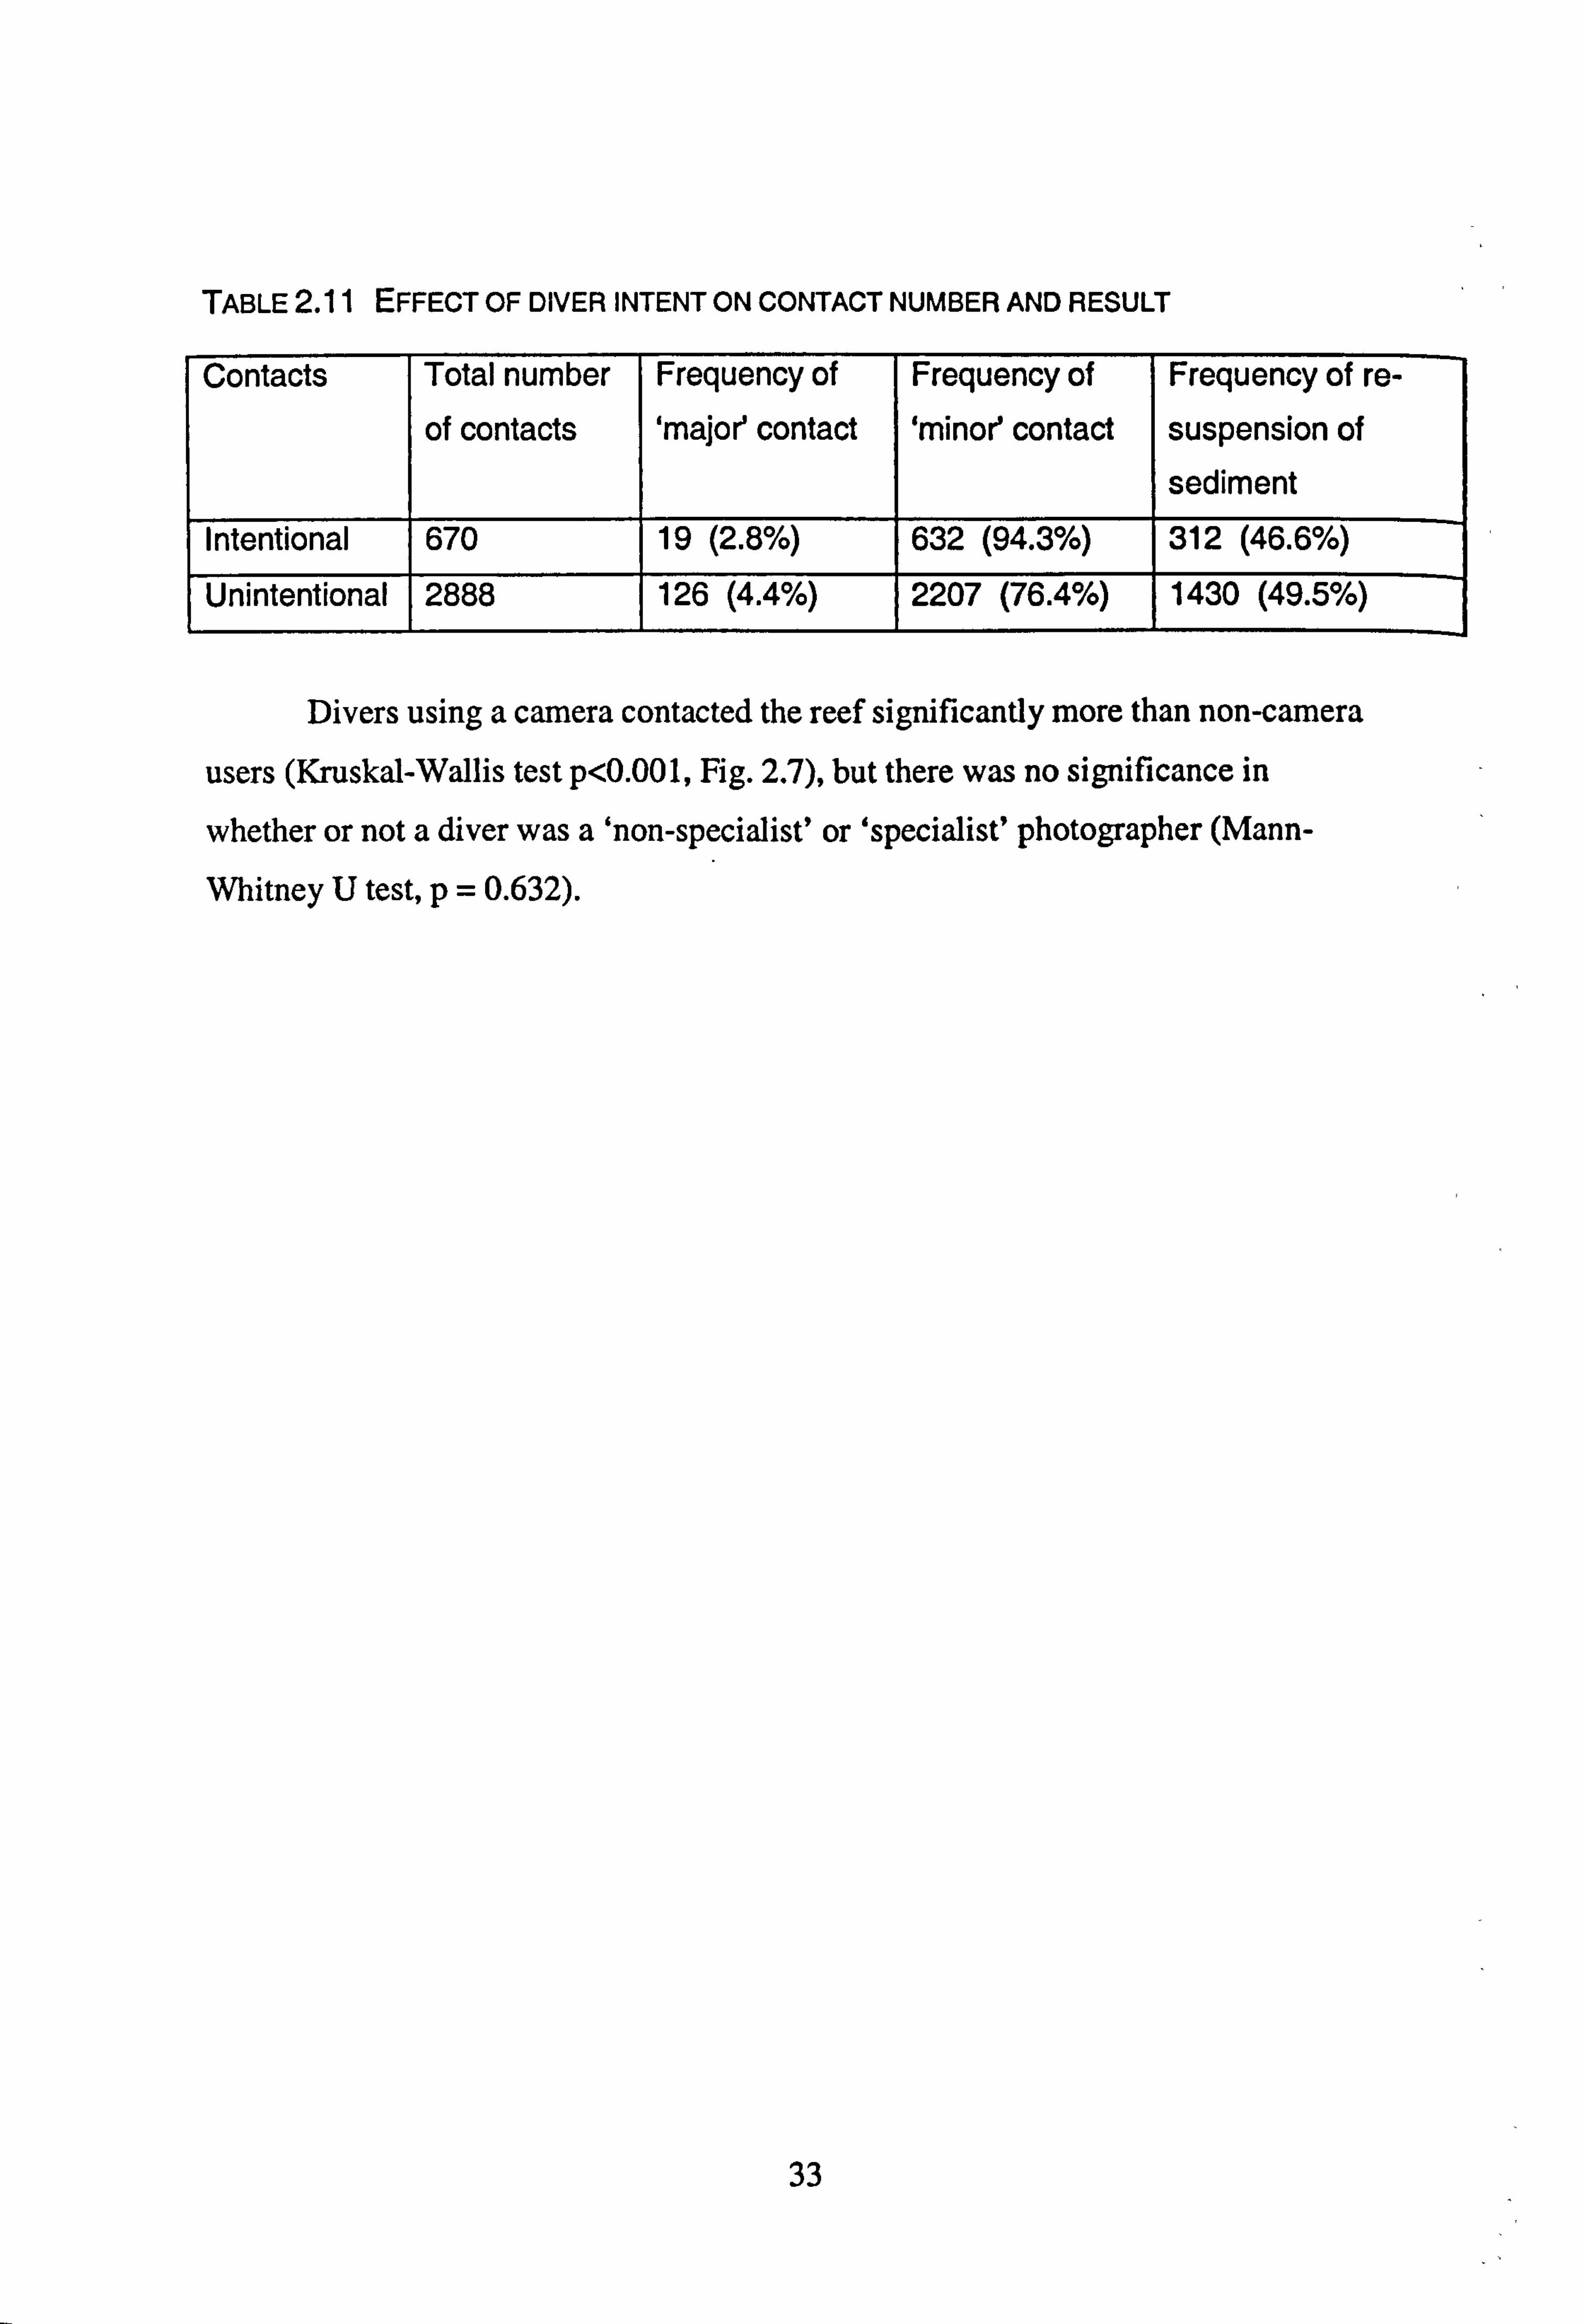
TABLE2.11 EFFECT OF DIVER INTENT ON CONTACT NUMBER AND RESULT
Contacts Total number Frequency of Frequency of Frequency of re- of contacts 'major' contact 'minor' contact suspension of
sediment Intentional 670 19 (2.8%) 632 (94.3%) 312 (46.6%)
Unintentional 2888 126 (4.4%) 1 2207 (76.4%) 1 1430 (49.5%)
Divers using a camera contacted the reef significantly more than non-camera
users (Kruskal-Wallis test p<0.001, Fig. 2.7), but there was no significance in
whether or not a diver was a 'non-specialist' or 'specialist' photographer (Mann-
Whitney U test, p=0.632).
33
4
0
c E (1) 0
0 z
Non Non-Specialist Specialist
Photographer level
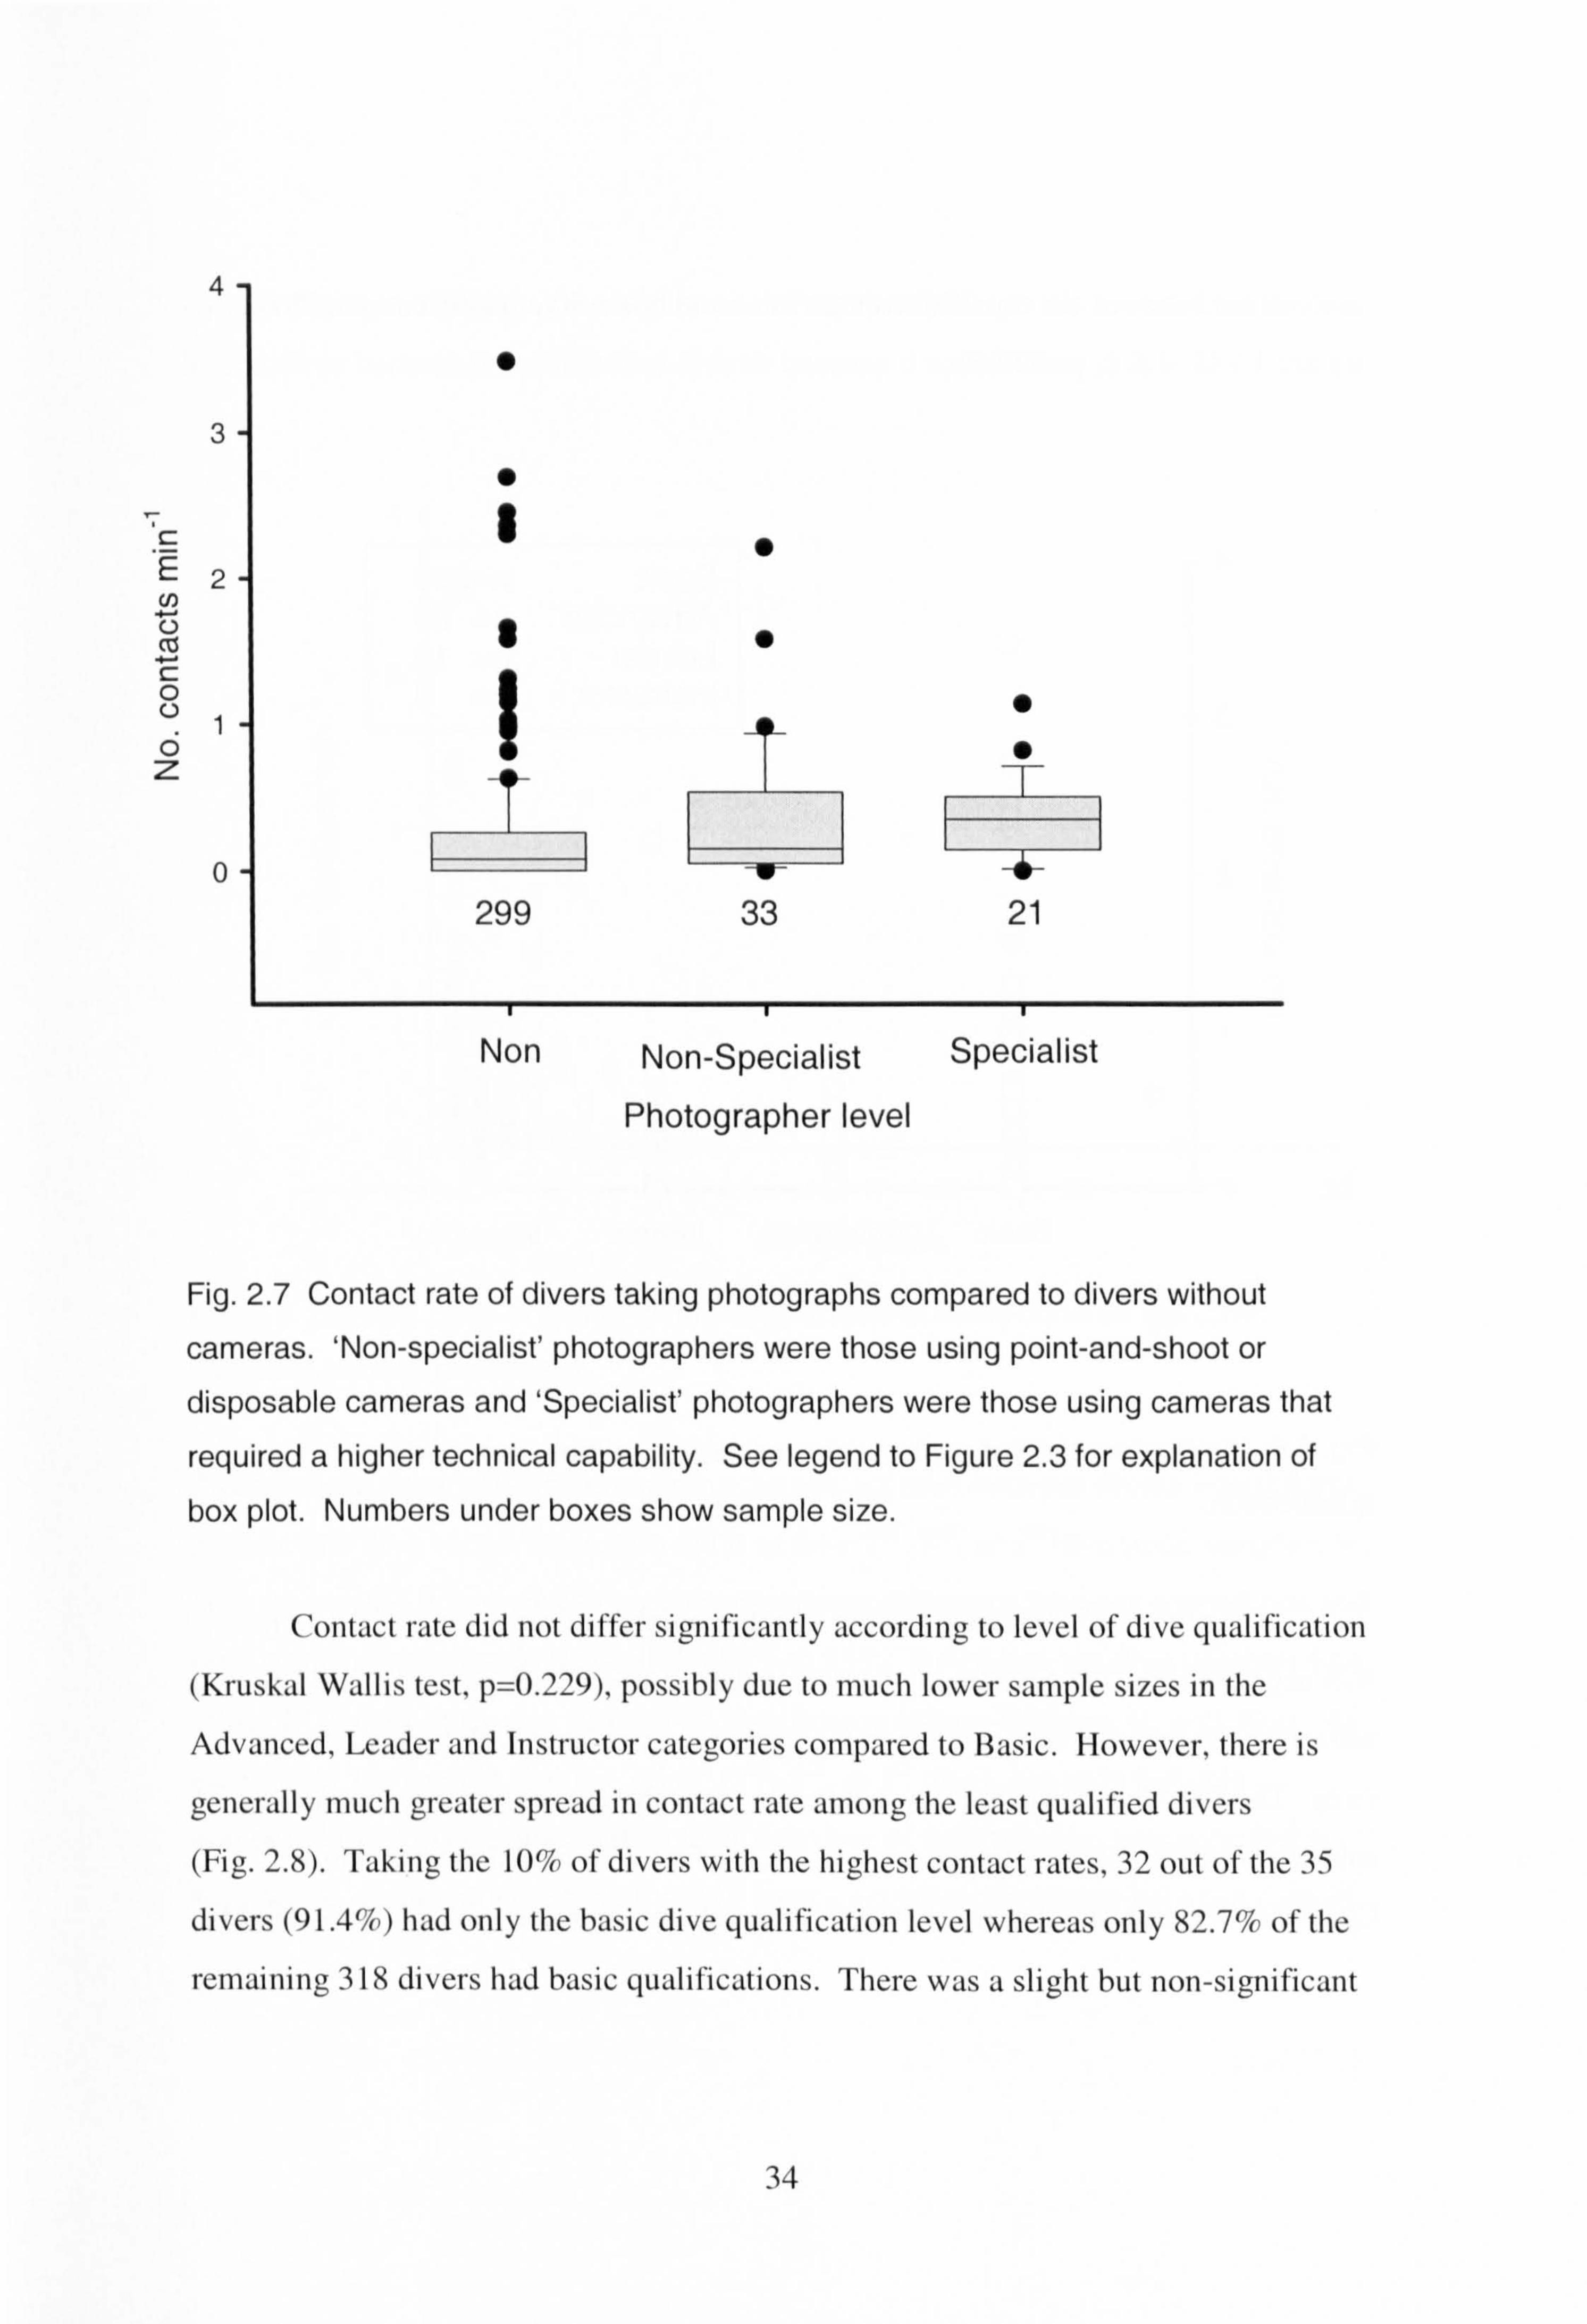
Fig. 2.7 Contact rate of divers taking photographs compared to divers without
cameras. 'Non-specialist' photographers were those using point-and-shoot or disposable cameras and 'Specialist' photographers were those using cameras that
required a higher technical capability. See legend to Figure 2.3 for explanation of box plot. Numbers under boxes show sample size.
Contact rate did not differ significantly according to level of dive qualification (Kruskal Wallis test, p=0.229), possibly due to much lower sample sizes in the
Advanced, Leader and Instructor categories compared to Basic. However, there is
generally much greater spread in contact rate aniong the least qualified divers
(Fig. 2.8). Taking the 10% of divers with the highest contact rates, 32 out ofthe 35
divers (91.417o) had only the basic dive qualification level whereas only 82.7% of the
remaining 3 18 divers had basic qualifications. There was a slight but non-significant
34
association between the top 10% contact rates and basic dive qualification (Chi-
square 1.748, dI 1, p=0.093).
4- Basic n=295 Advanced n= 30
0 Leader n= 19 Instructor n= 9
3- 0
E 0
CO 2-
0 C. ) C; z
00
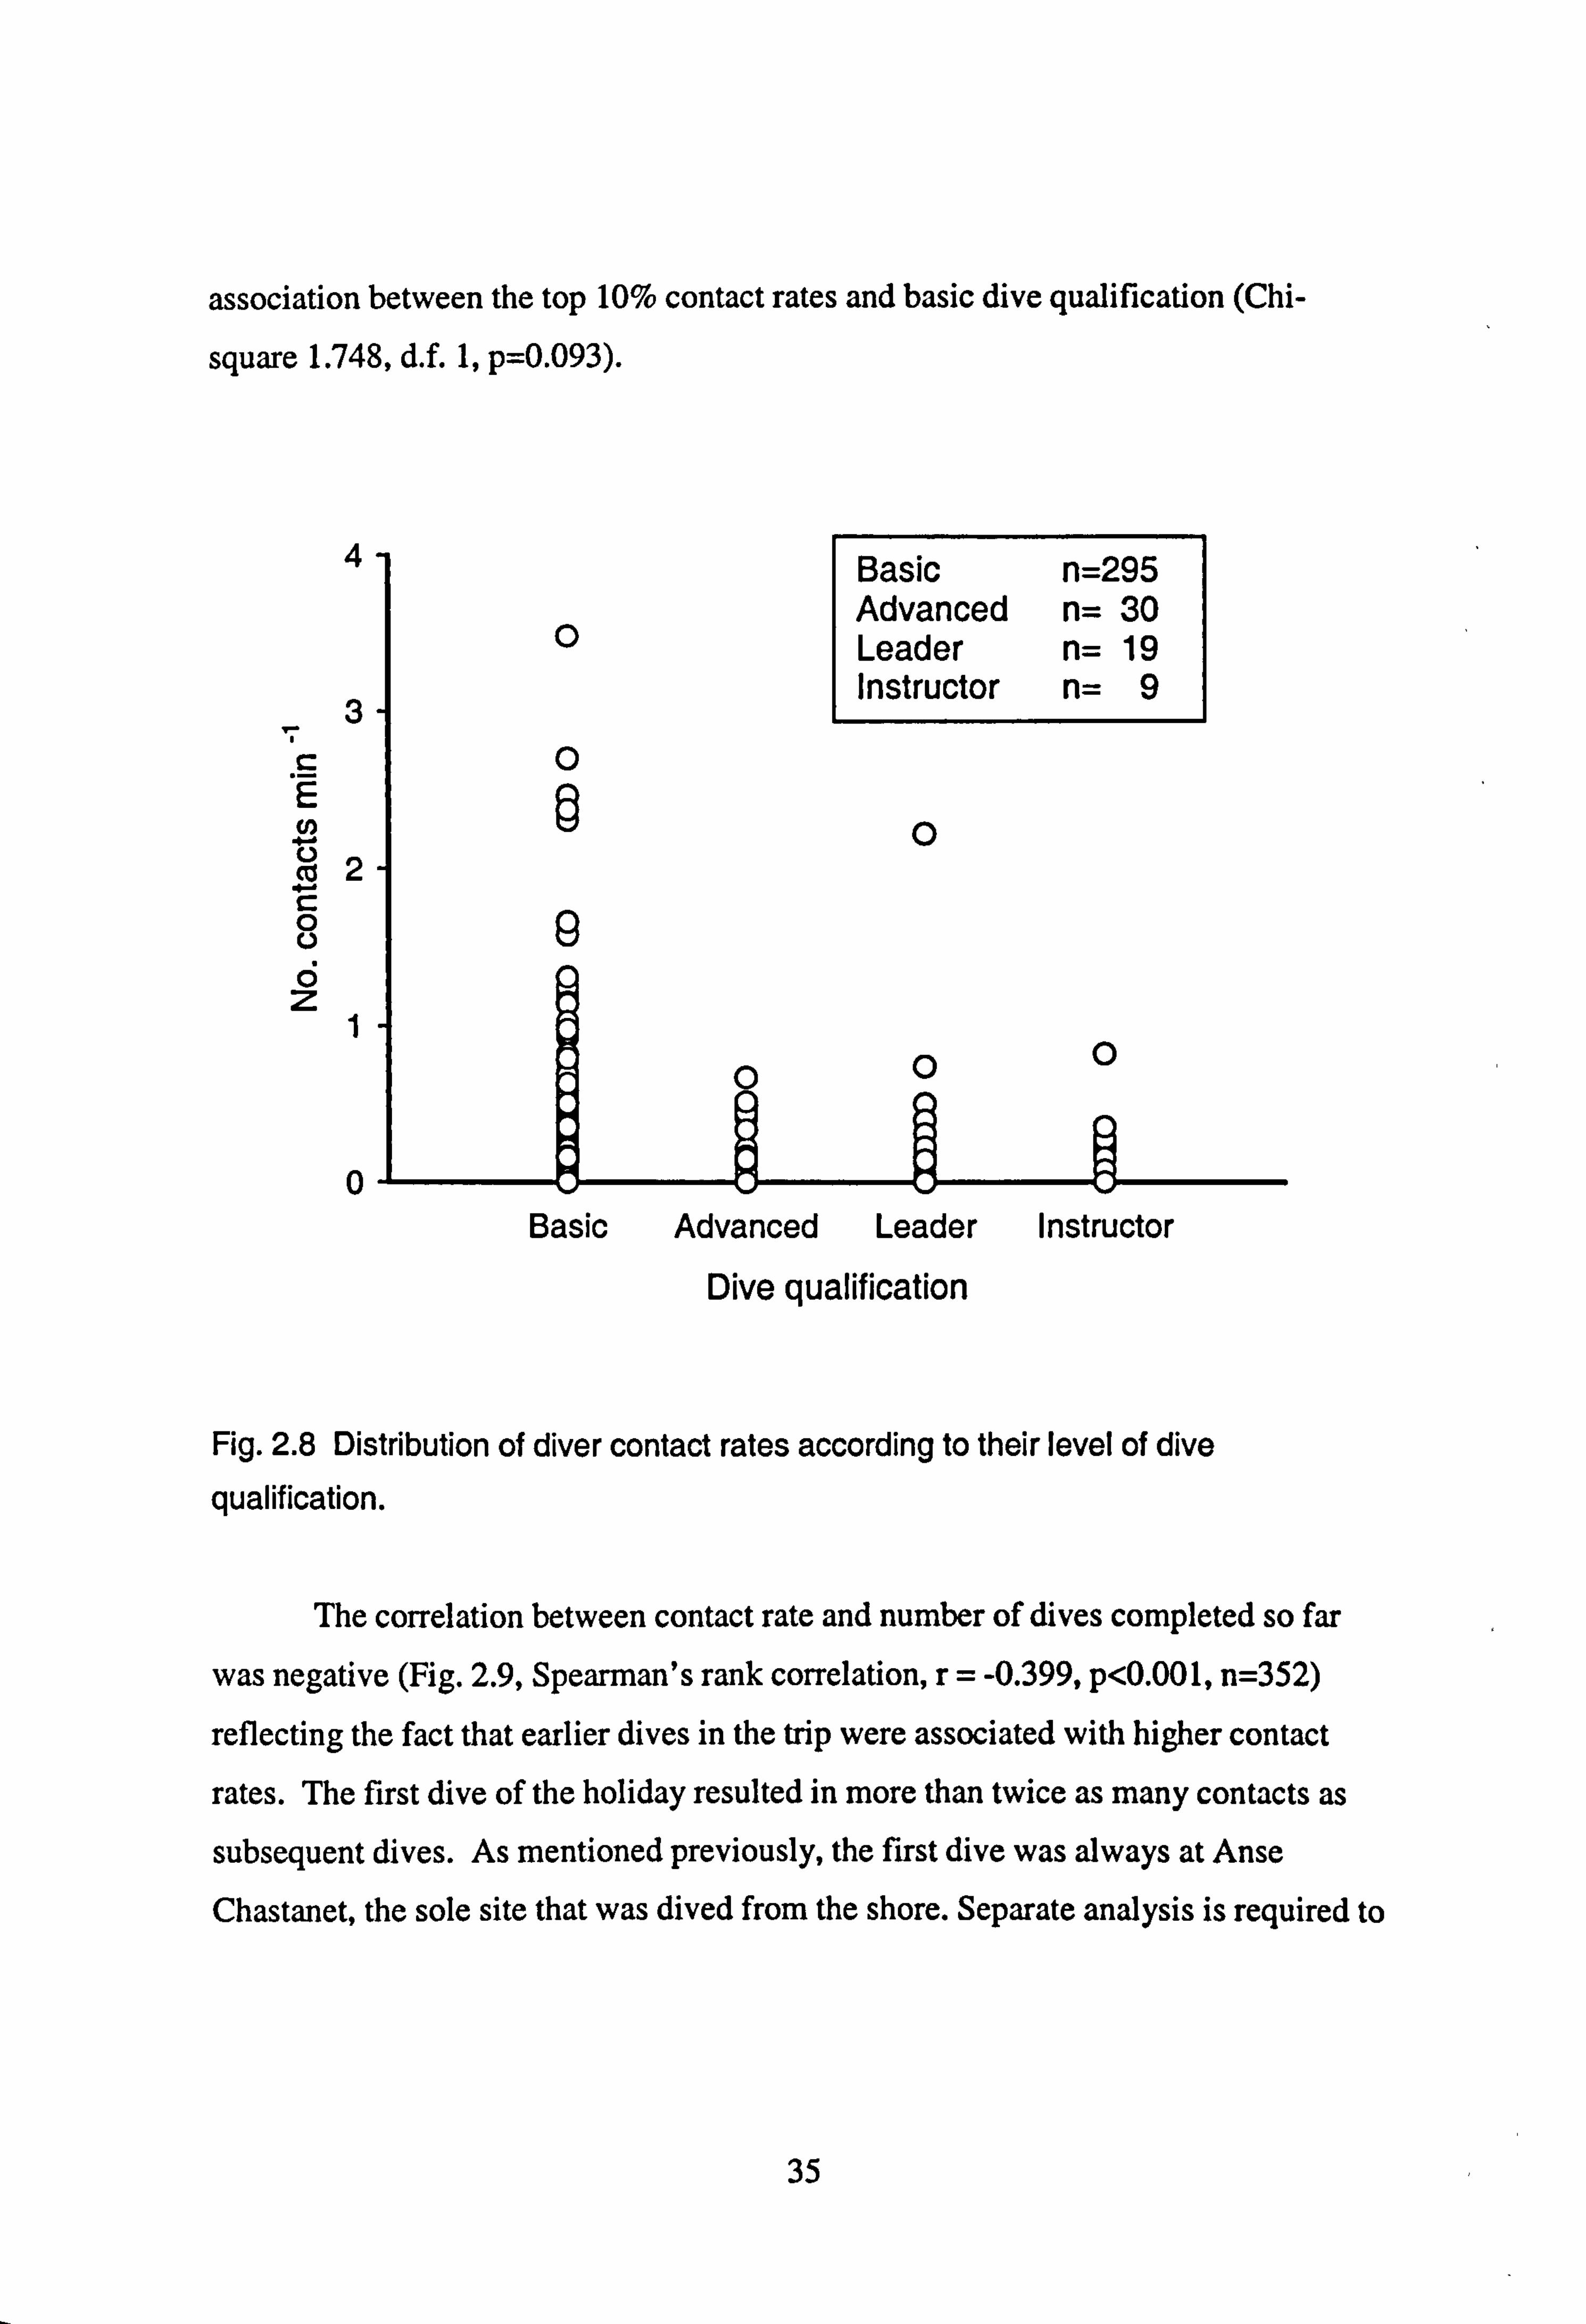
0 Basic Advanced Leader Instructor
Dive qualification
Fig. 2.8 Distribution of diver contact rates according to their level of dive
qualification.
The correlation between contact rate and number of dives completed so far
was negative (Fig. 2.9, Spearman's rank correlation, r= -0.399, p<0.001, n=352)
reflecting the fact that earlier dives in the trip were associated with higher contact
rates. The first dive of the holiday resulted in more than twice as many contacts as subsequent dives. As mentioned previously, the first dive was always at Anse
Chastanet, the sole site that was dived from the shore. Separate analysis is required to
35
try and distinguish whether the higher rate of contacts seen on the first dive of the
holiday was because it was the first dive or because it was a shore dive.
4
3
E
Co c 0 0 ci Z
0
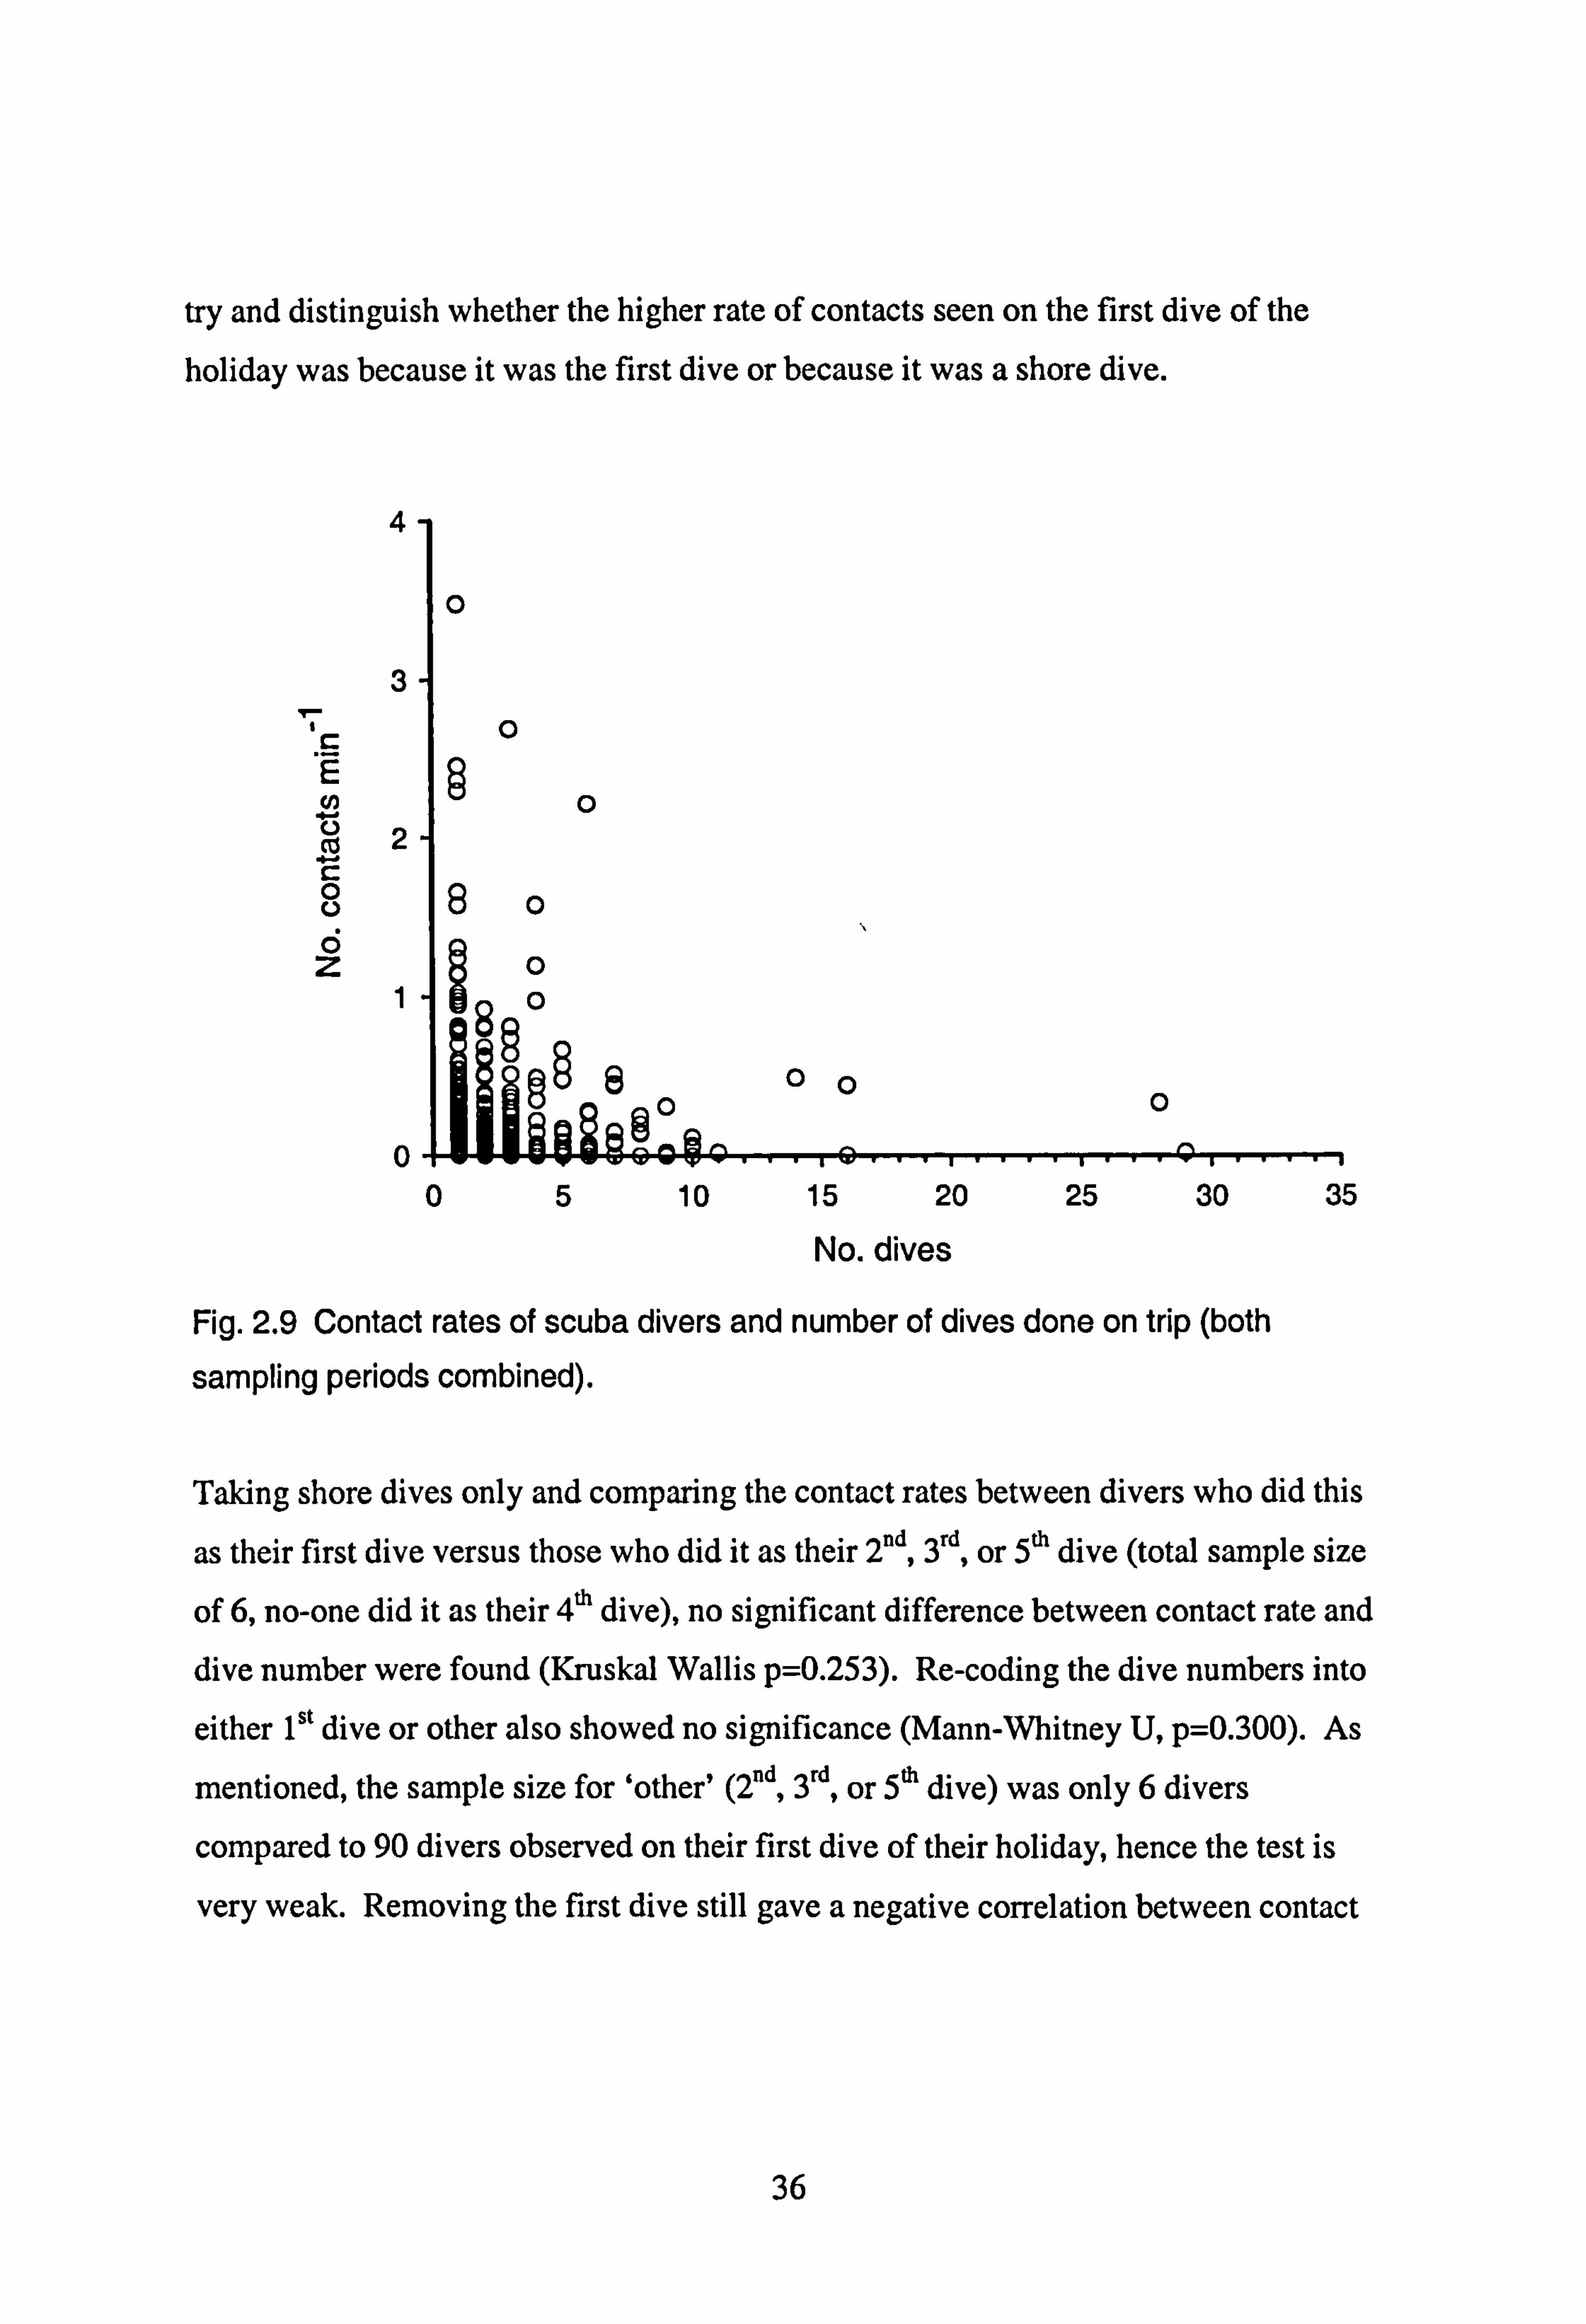
Fig. 2.9 Contact rates of scuba divers and number of dives done on trip (both
sampling periods combined).
Taking shore dives only and comparing the contact rates between divers who did this
as their first dive versus those who did it as their 2 nd , P, or 5th dive (total sample size
of 6, no-one did it as their 4th dive), no significant difference between contact rate and dive number were found (Kruskal Wallis p=0.253). Re-coding the dive numbers into
either 1" dive or other also showed no significance (Mann-Whitney U, p=0.300). As
mentioned, the sample size for 'other' (fd , P, or 5th dive) was only 6 divers
compared to 90 divers observed on their first dive of their holiday, hence the test is
very weak. Removing the first dive still gave a negative correlation between contact
36
05 10 15 20 25 30 35
No. dives
rate and number of dives completed, but failed statistical significance at the 5% level
(r=-0.088, p=0.078, n=262).
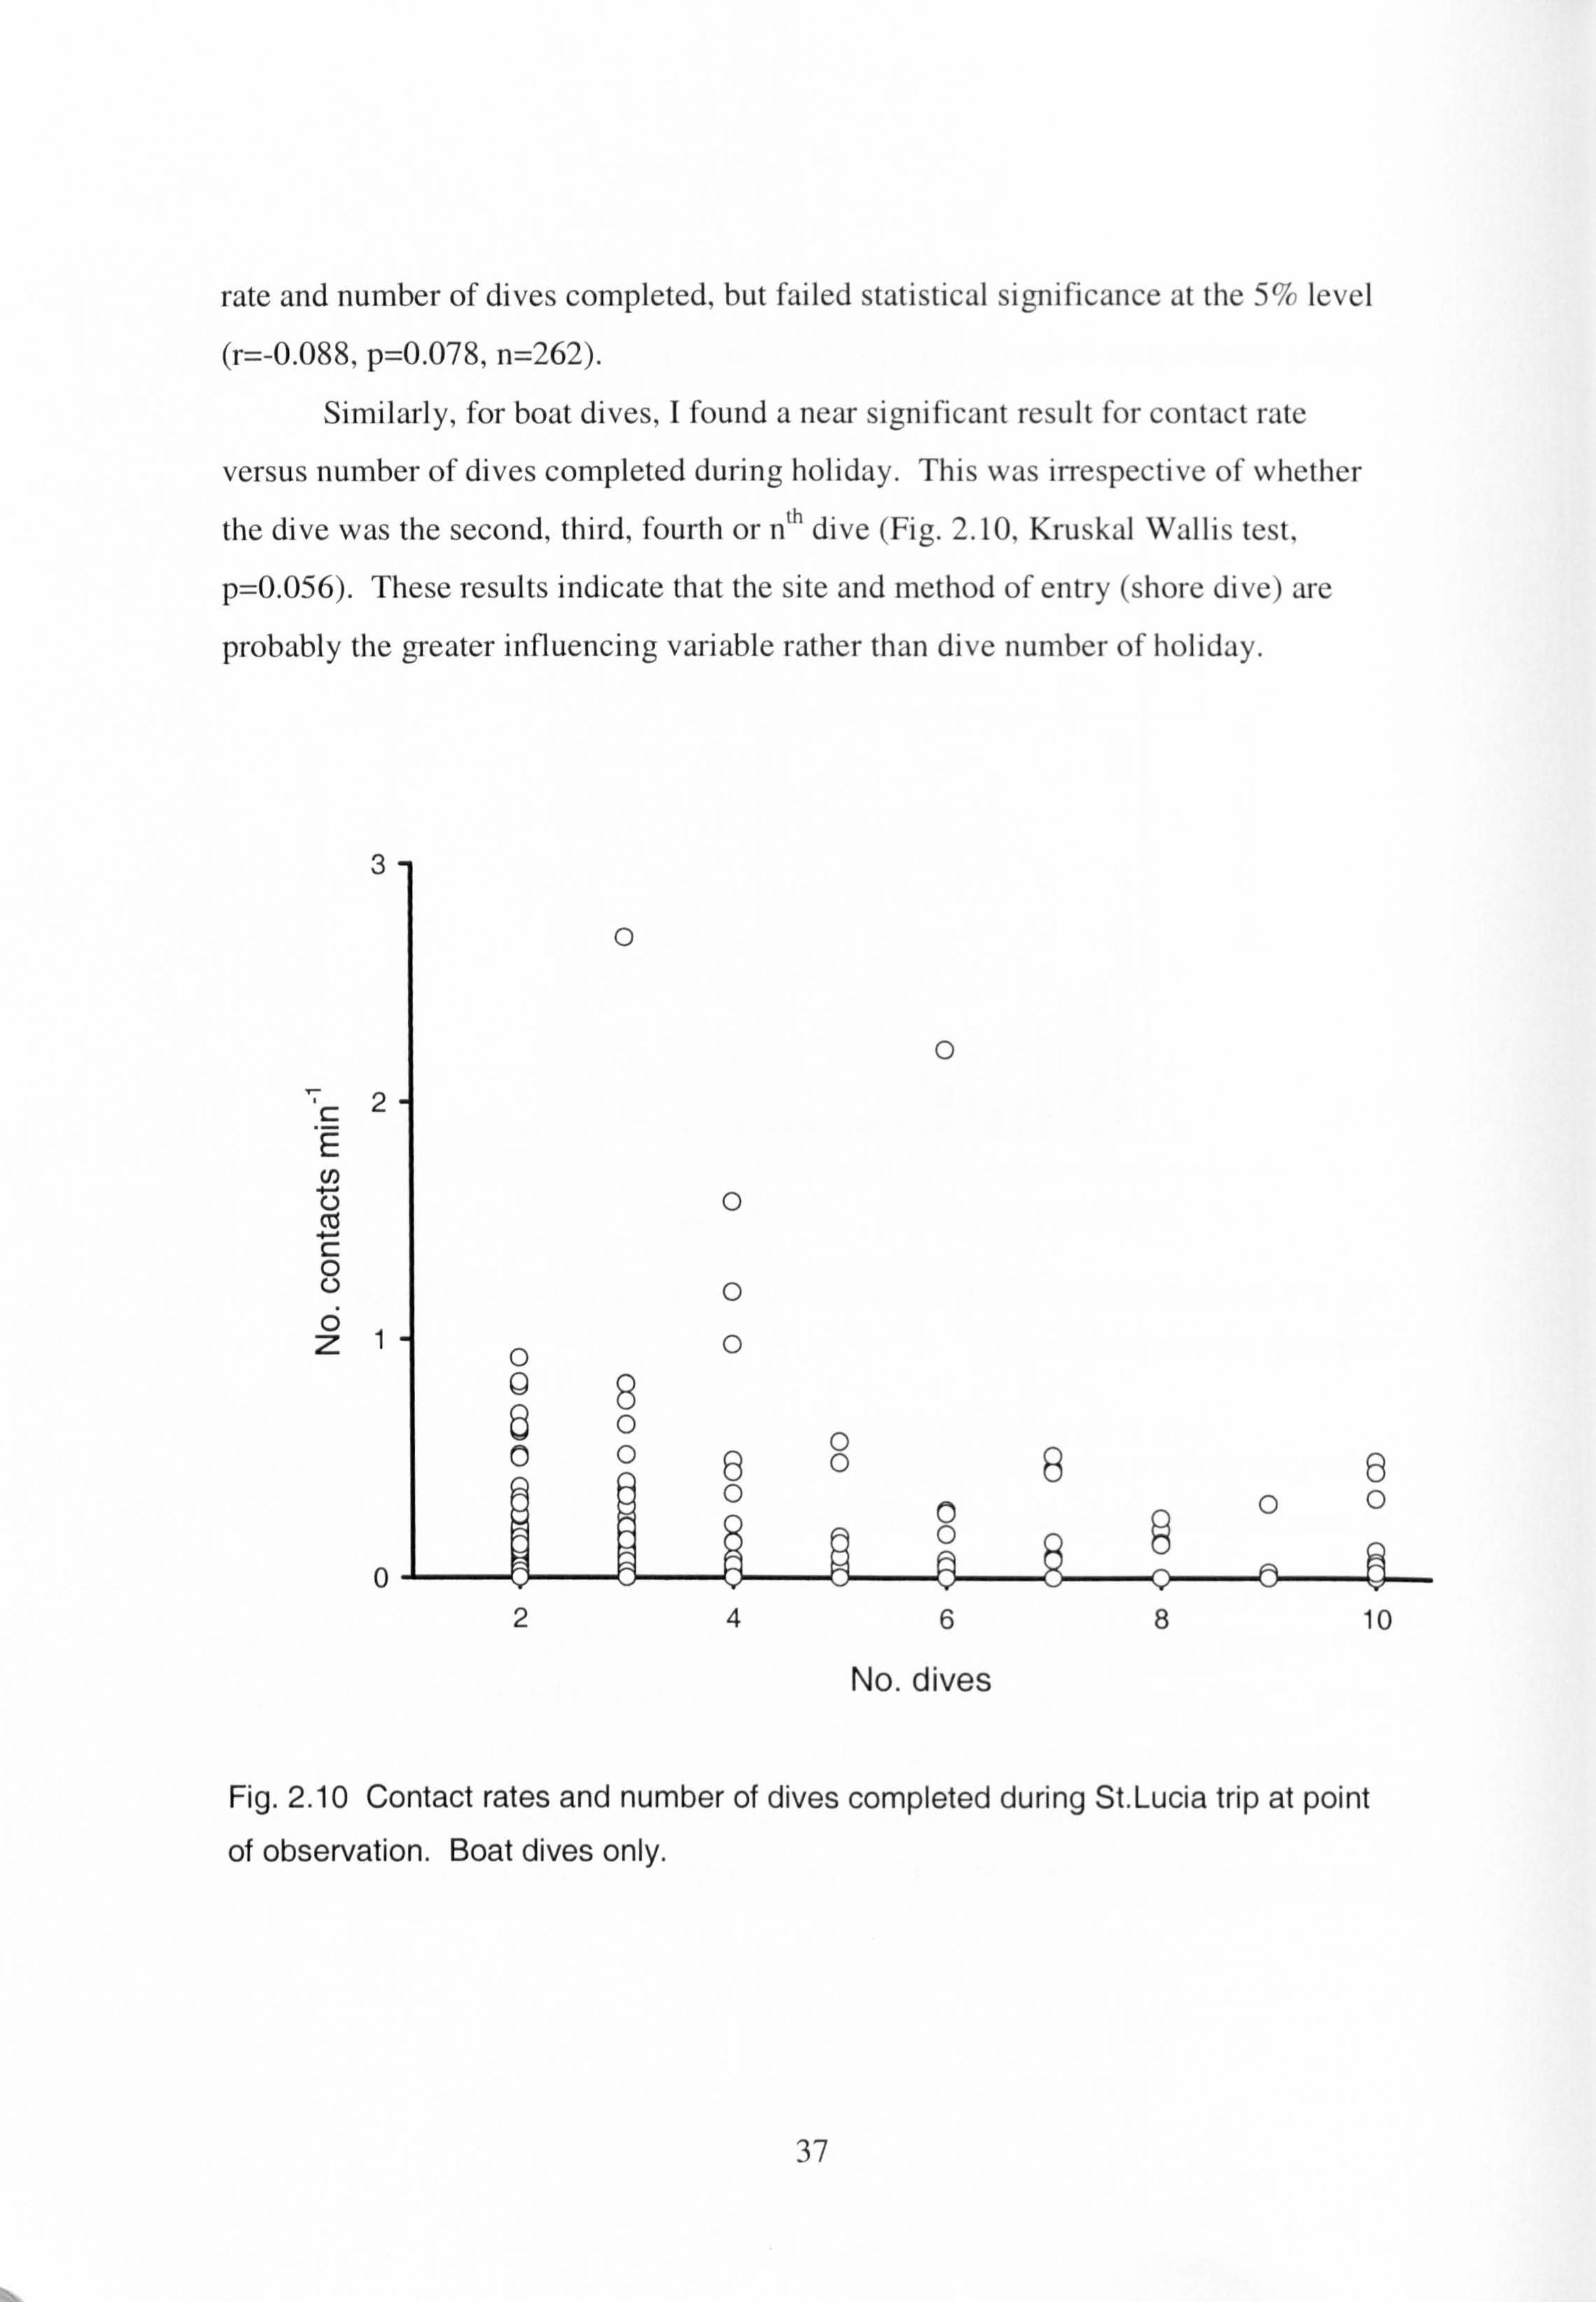
Similarly, for boat dives, I found a near significant result for contact rate
versus number of dives completed during holiday. This was irrespective ot'whether
the dive was the second, third, fourth or n Ih dive (Fig. 2.10, Kruskal Wallis test,
p=0.056). These results indicate that the site and method of entry (shore dive) are
probably the greater influencing variable rather than dive number of holiday.
3
C: E U) U cz C: 0
0 z
0
No. dives
Fig. 2.10 Contact rates and number of dives completed during StIucia trip at point
of observation. Boat dives only.
37
10
Experience, as measured by total dives in whole dive history also had a weak but non-significant negative correlation with contact rate (Spearman's rank
correlation: r= -0.077, p=O. 147).
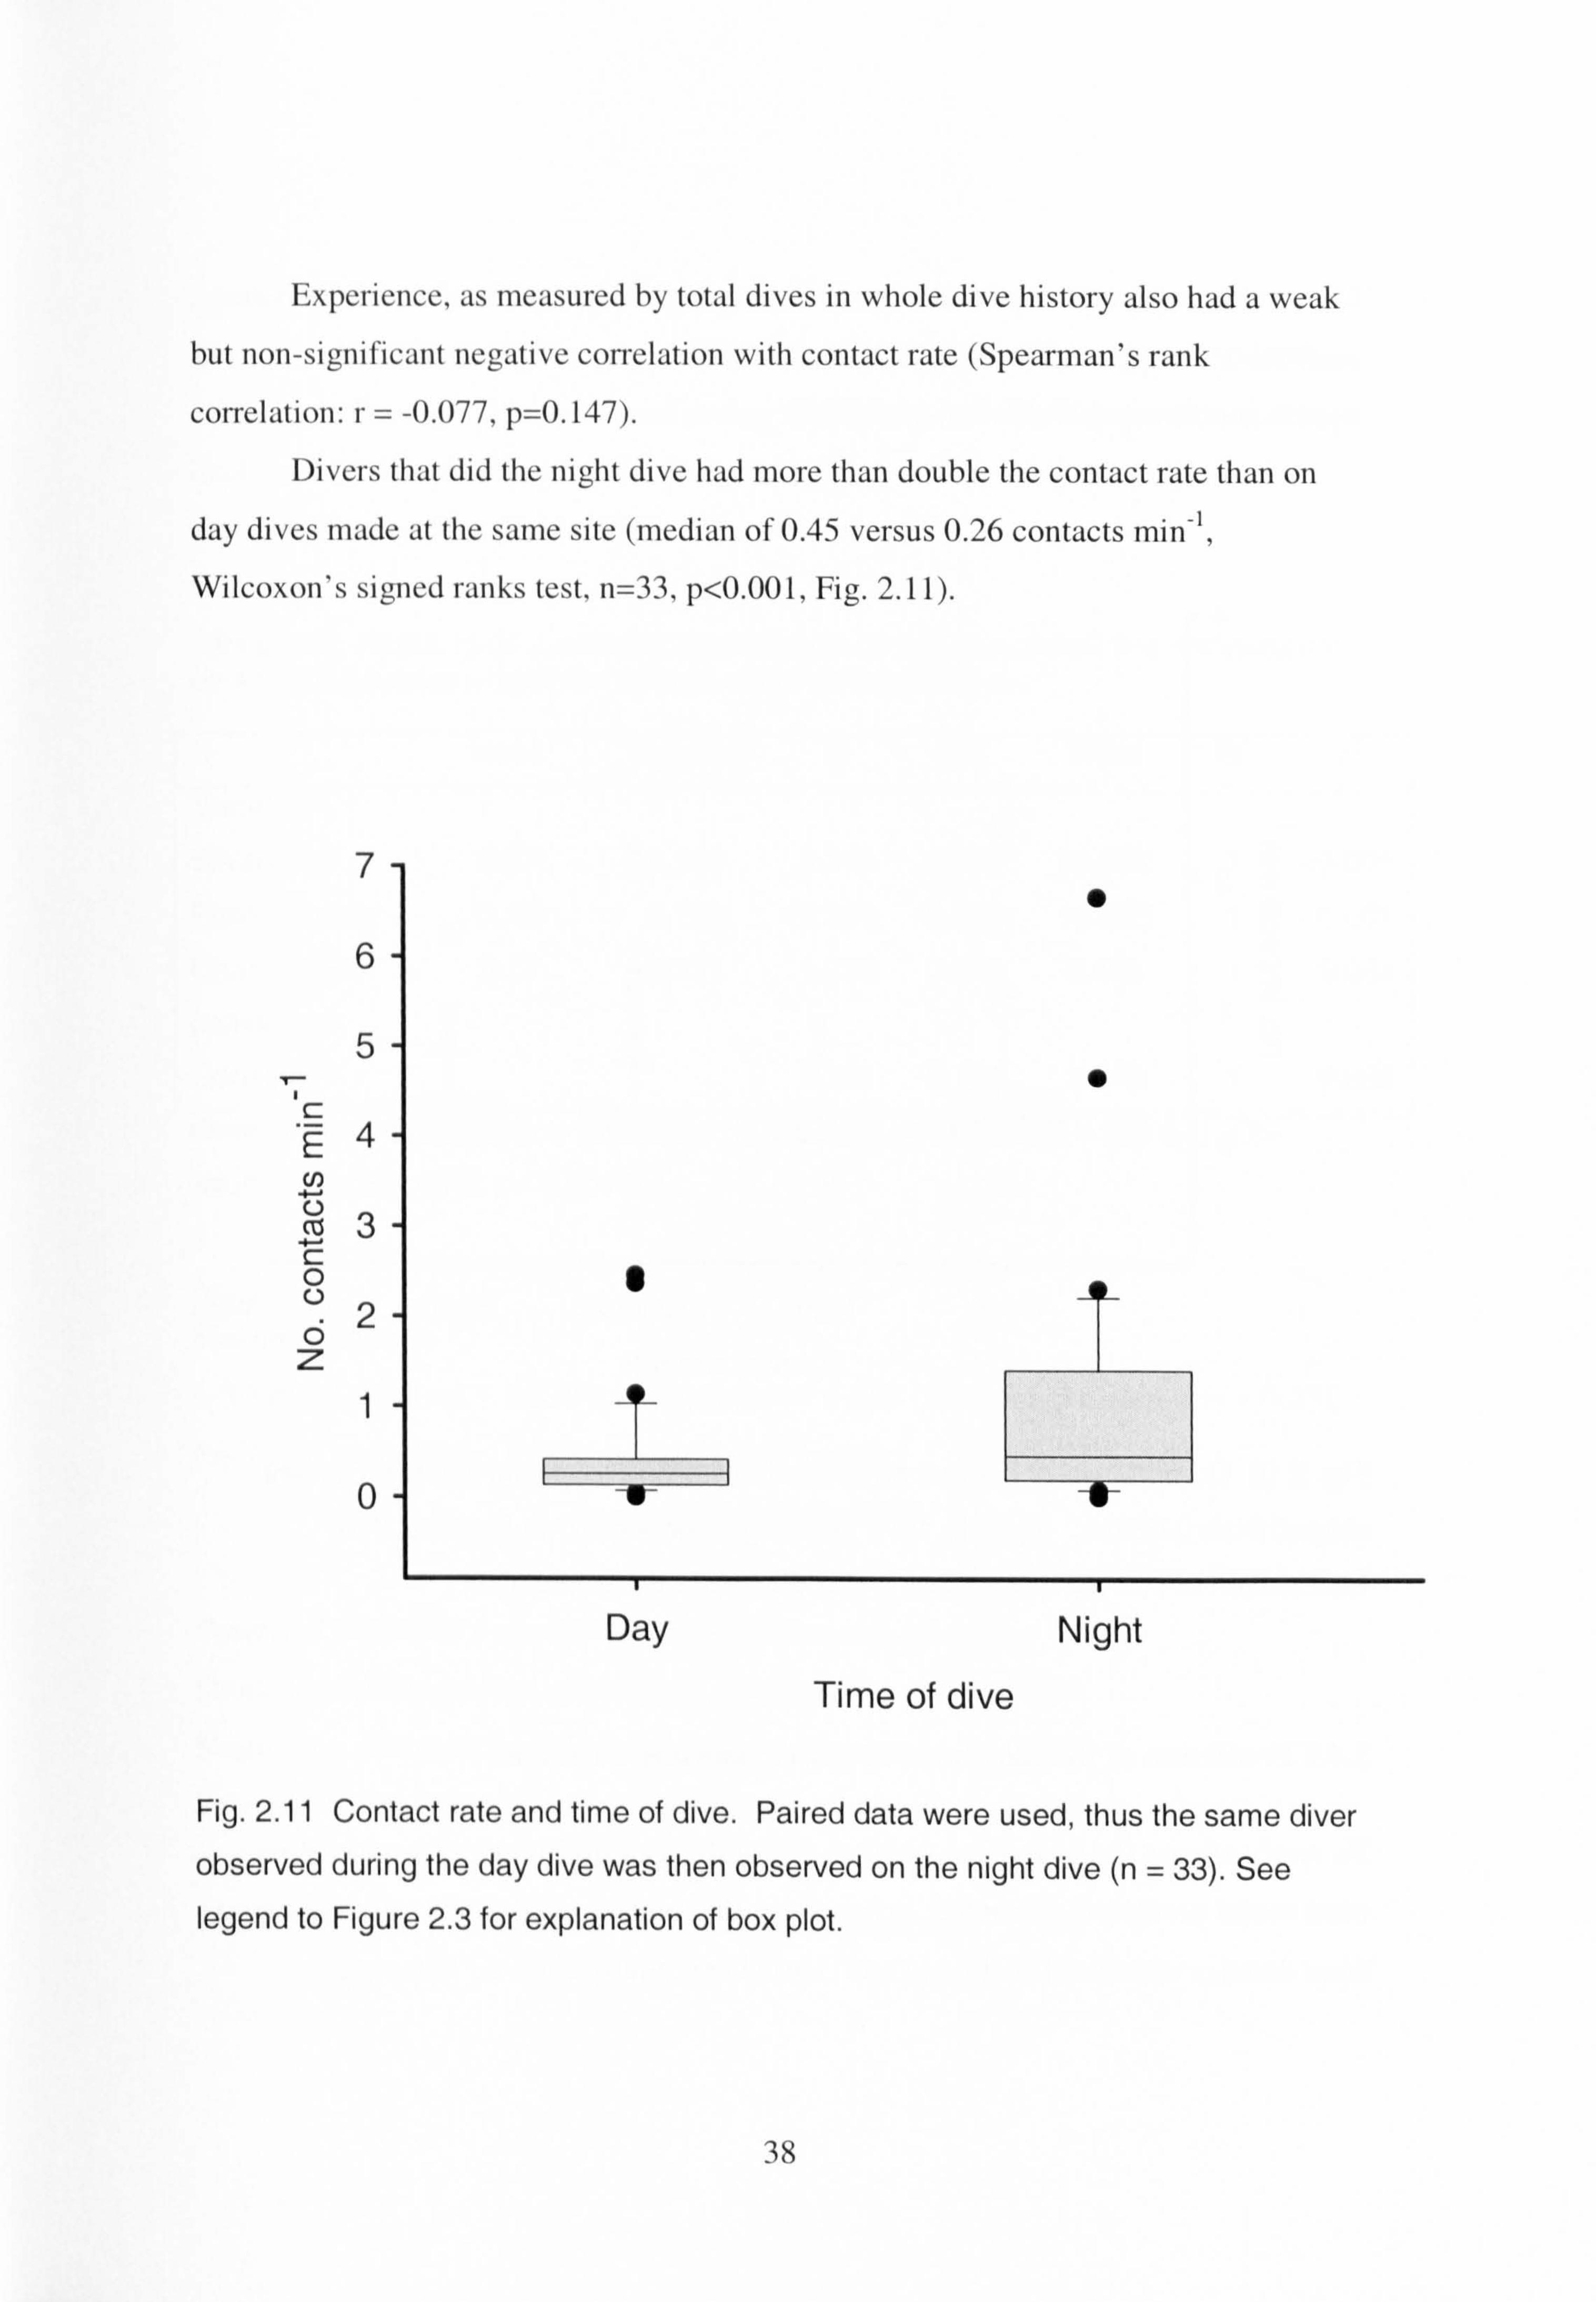
Divers that did the night dive had more than double the contact rate than on day dives made at the sarne site (median of 0.45 versus 0.26 contacts min-], Wilcoxon's signed ranks test, n=33, p<0.001, Fig. 2.11).
7
6
5
E4
co 3
0 02 C5 z
1
0
Time of dive
Fig. 2.11 Contact rate and time of dive. Paired data were used, thus the same diver
observed during the day dive was then observed on the night dive (n = 33). See legend to Figure 2.3 for explanation of box plot.
38
Day Night
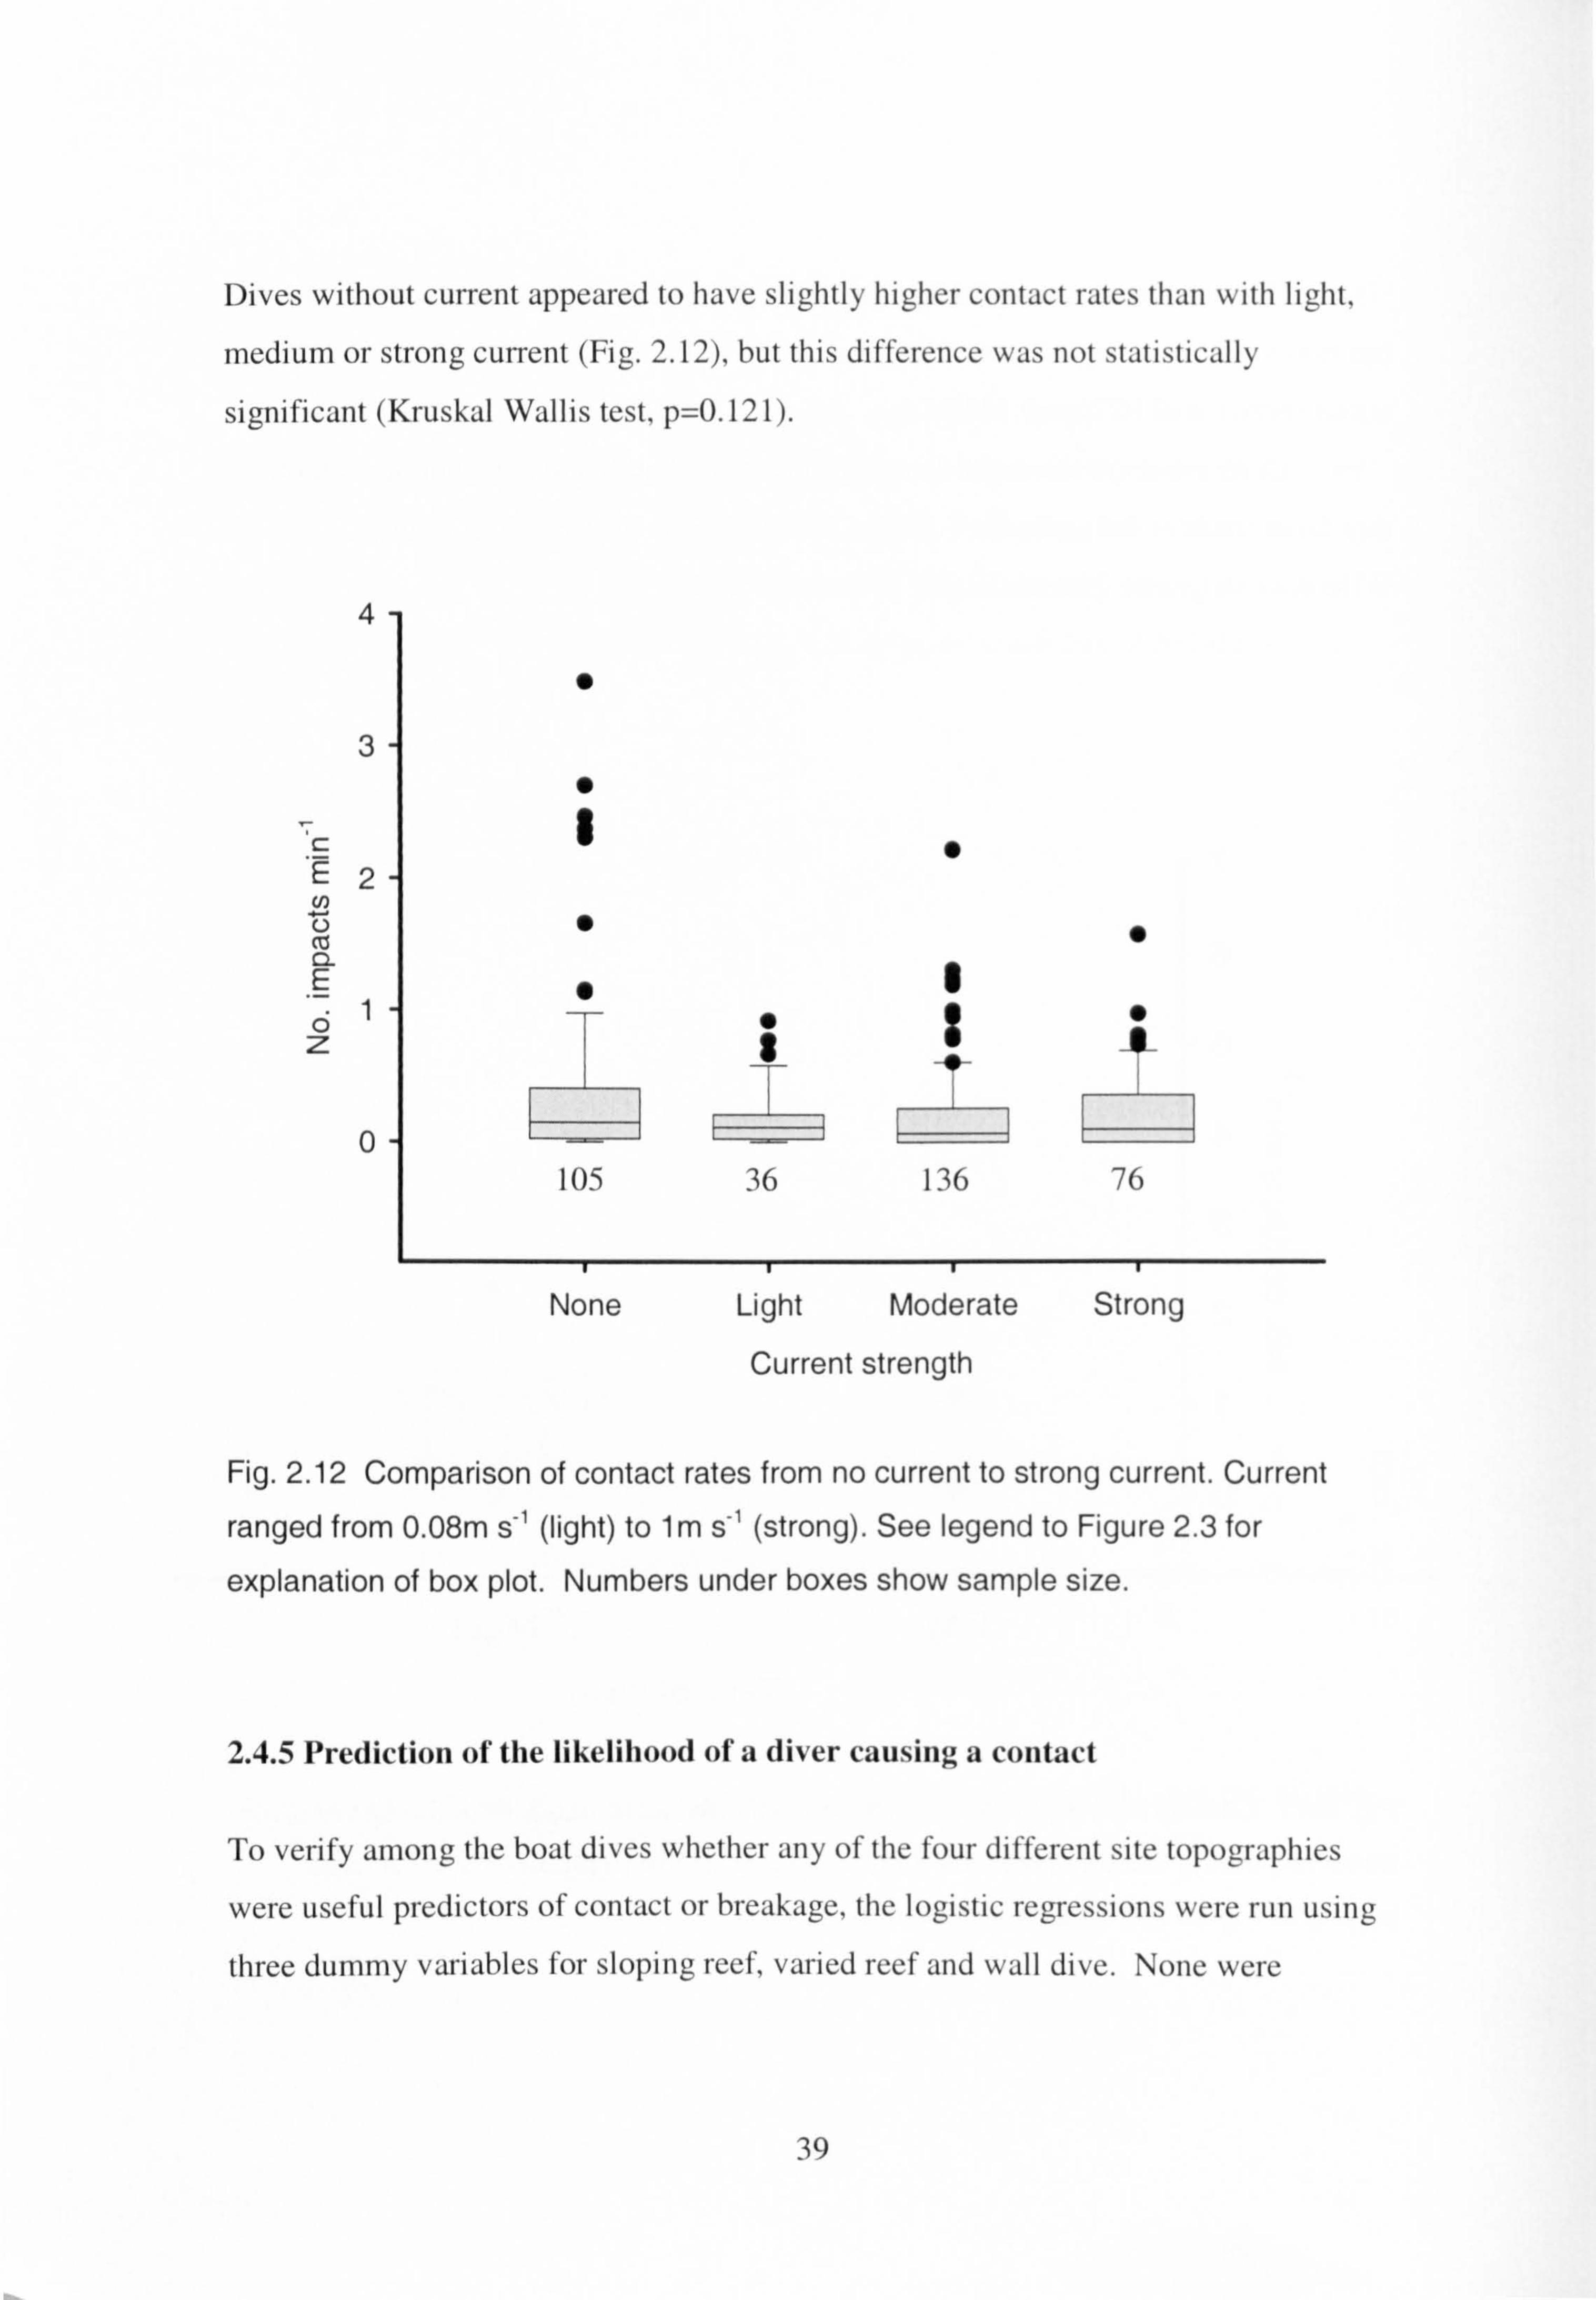
Dives without current appeared to have slightly higher contact rates than with light,
medium or strong current (Fig. 2.12), but this difference was not statistically
significant (Kruskal Wallis test, p=O. 12 1).
4
0
None Light Moderate Strong
Current strength
Fig. 2.12 Comparison of contact rates from no current to strong current. Current
ranged from 0.08m s-1 (light) to 1m s-' (strong). See legend to Figure 2.3 for
explanation of box plot. Numbers under boxes show sample size.
2.4.5 Prediction of the likelihood of a diver causing a contact
To verify among the boat dives whether any of the four different site topographies
were useful predictors of contact or breakage, the logistic regressions were run using
three dummy variables for sloping reef, varied reef and wall dive. None were
39
significant and so I did not include them in the final model. Contact rates of non- specialist and specialist photographers did not differ significantly so I pooled the two
categories. Photographer status and diving from the shore were key predictors of the
likelihood of divers contacting the reef, while being a cruise-ship passenger had a
near significant effect (Table 2.12).
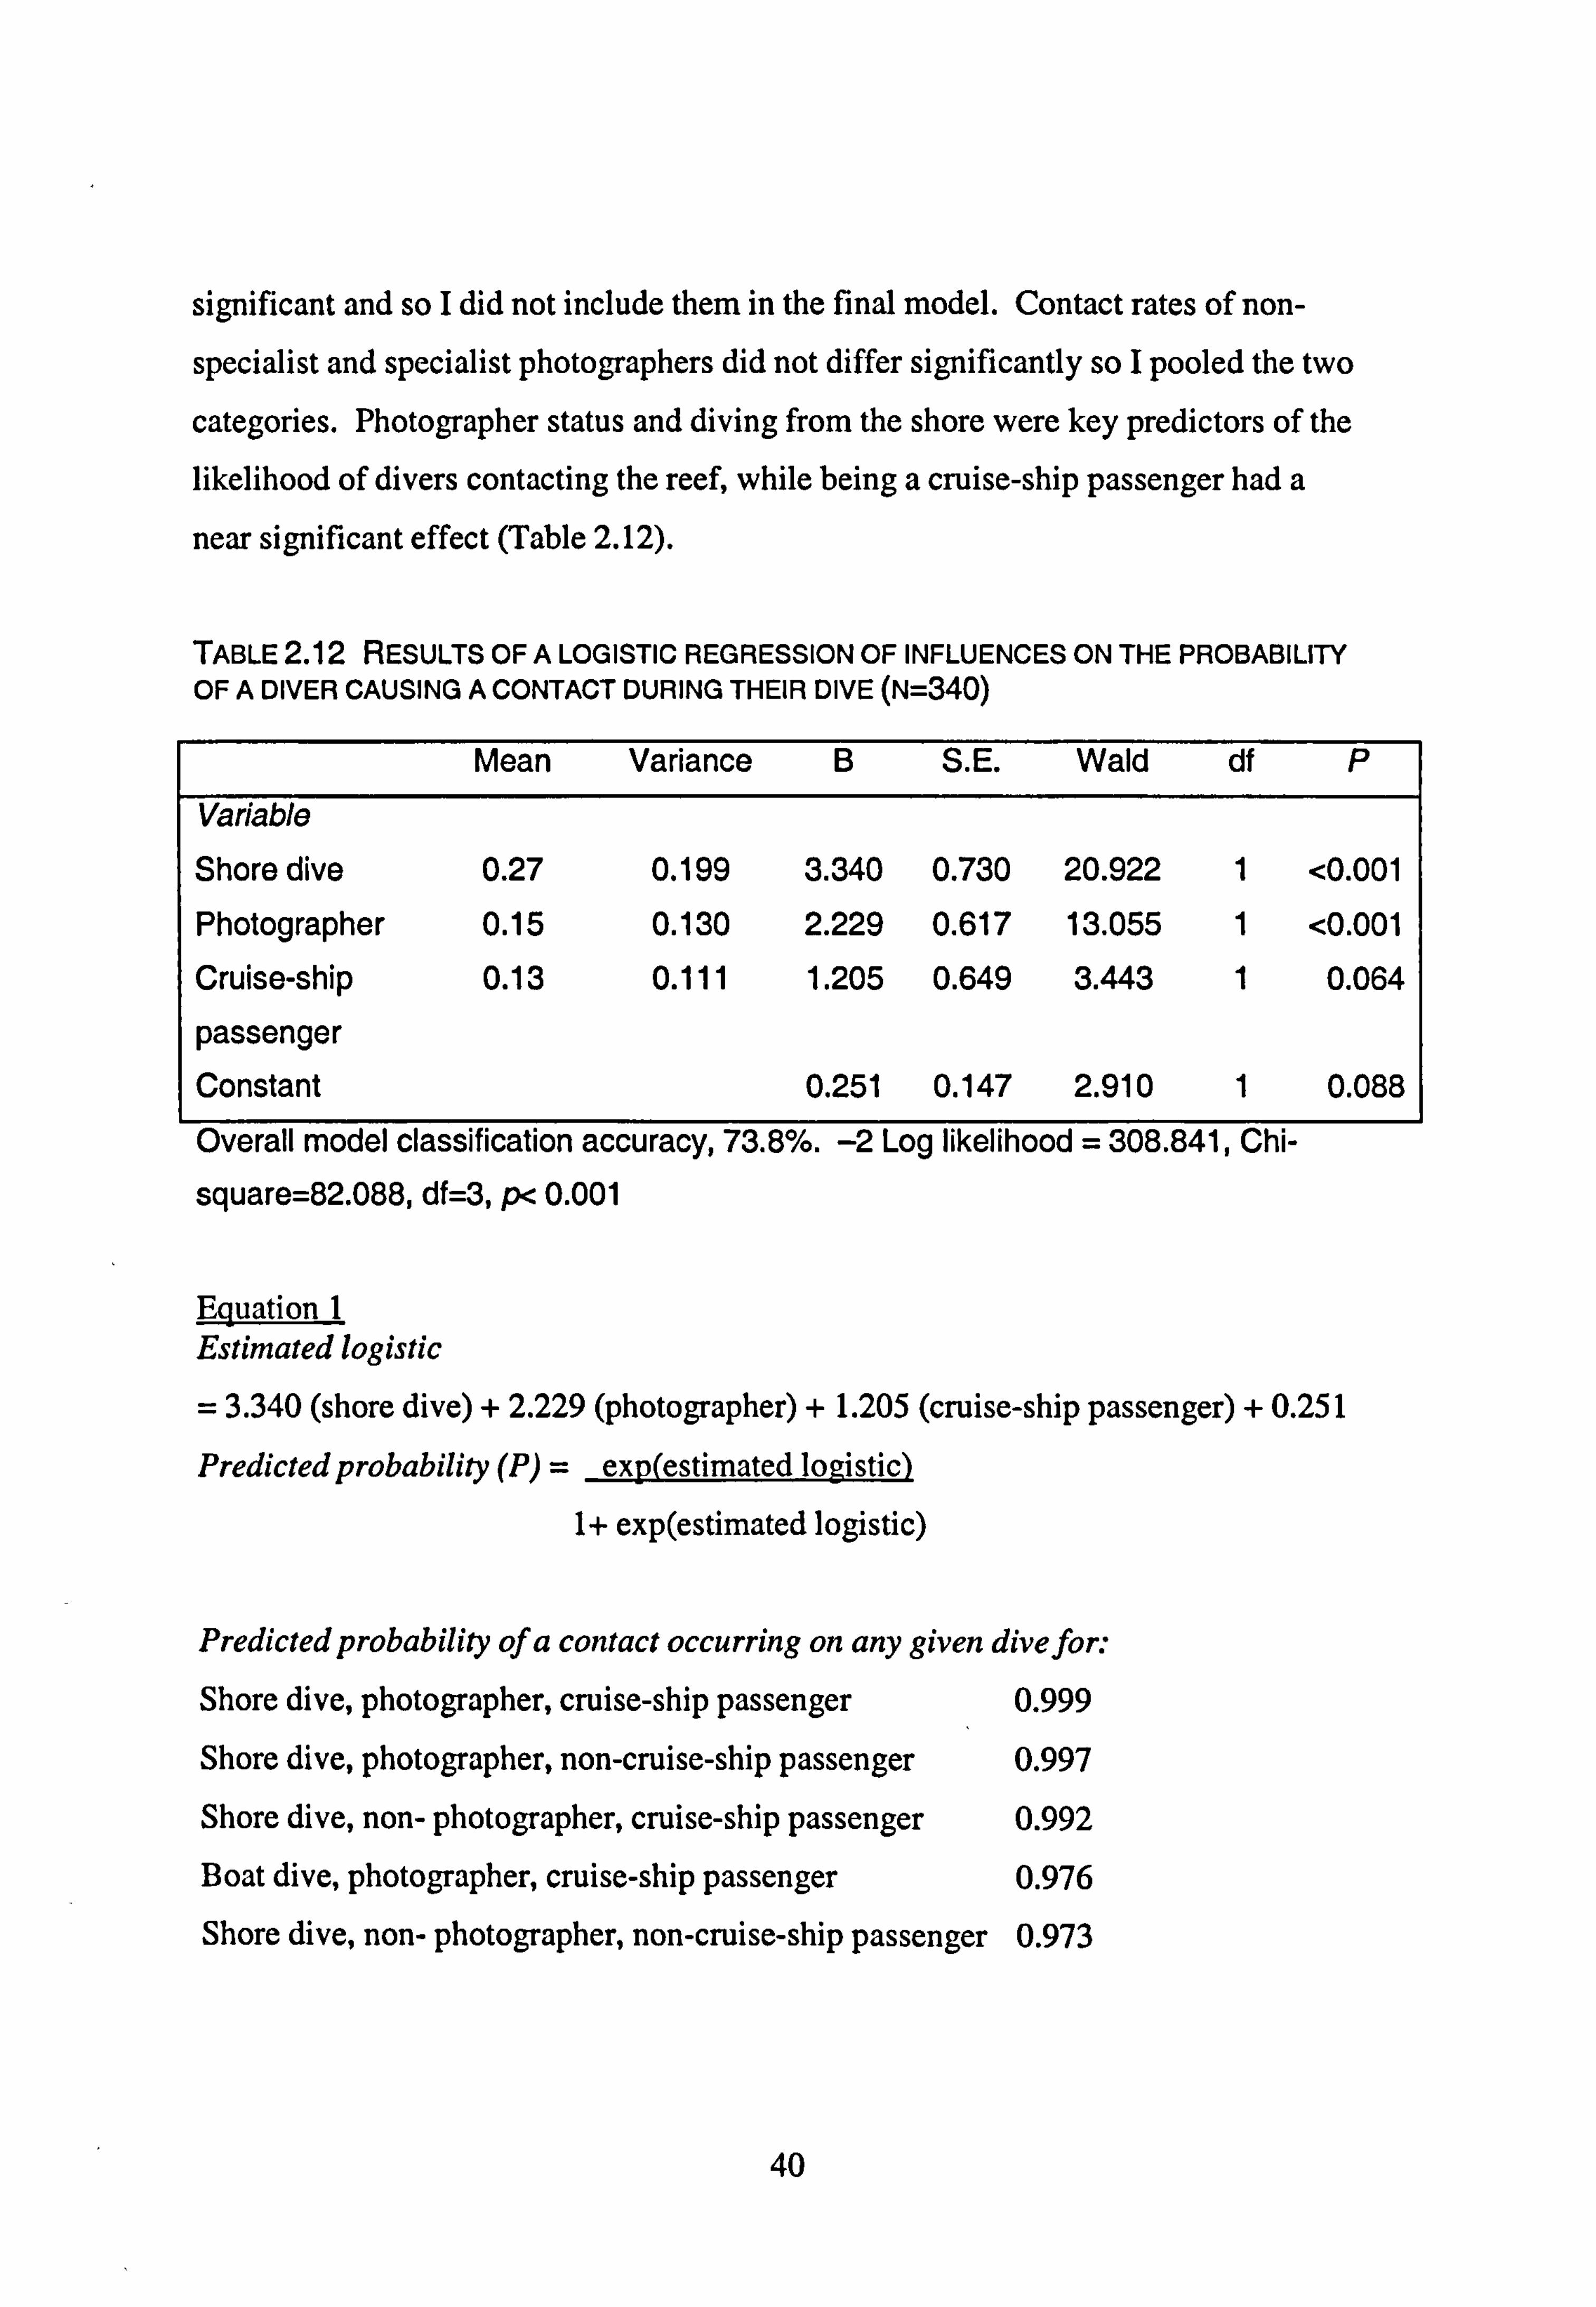
TABLE 2.12 RESULTS OF A LOGISTIC REGRESSION OF INFLUENCES ON THE PROBABILITY OF A DIVER CAUSING A CONTACT DURING THEIR DIVE (N=340)
Mean Variance B S. E. Wald df P
Variable
Shore dive 0.27 0.199 3.340 0.730 20.922 1 <0.001 Photographer 0.15 0.130 2.229 0.617 13.055 1 <0.001 Cruise-ship 0.13 0.111 1.205 0.649 3.443 1 0.064
passenger Constant 0.251 0.147 2.910 1 0.088
Overall model classification accuracv. 73.8%. -2 Loa likelihood = 308.841. Chi-
square=82.088, df=3, p< 0.001
Equation I Estimated logistic
= 3.340 (shore dive) + 2.229 (photographer) + 1.205 (cruise-ship passenger) + 0.251
Predicted probability (P) = exp(estimatedloaistic) 1+ exp(estimated logistic)
Predicted probability of a contact occurring on any given divefor.
Shore dive, photographer, cruise-ship passenger 0.999
Shore dive, photographer, non-cruise-ship passenger 0.997
Shore dive, non- photographer, cruise-ship passenger 0.992
Boat dive, photographer, cruise-ship passenger 0.976
Shore dive, non- photographer, non-cruise-ship passenger 0.973
40
Boat dive, photographer, non-cruise-ship passenger 0.923
Boat dive, non- photographer, cruise-ship passenger 0.811
Boat dive, non- photographer, non-cruise-ship passenger 0.562
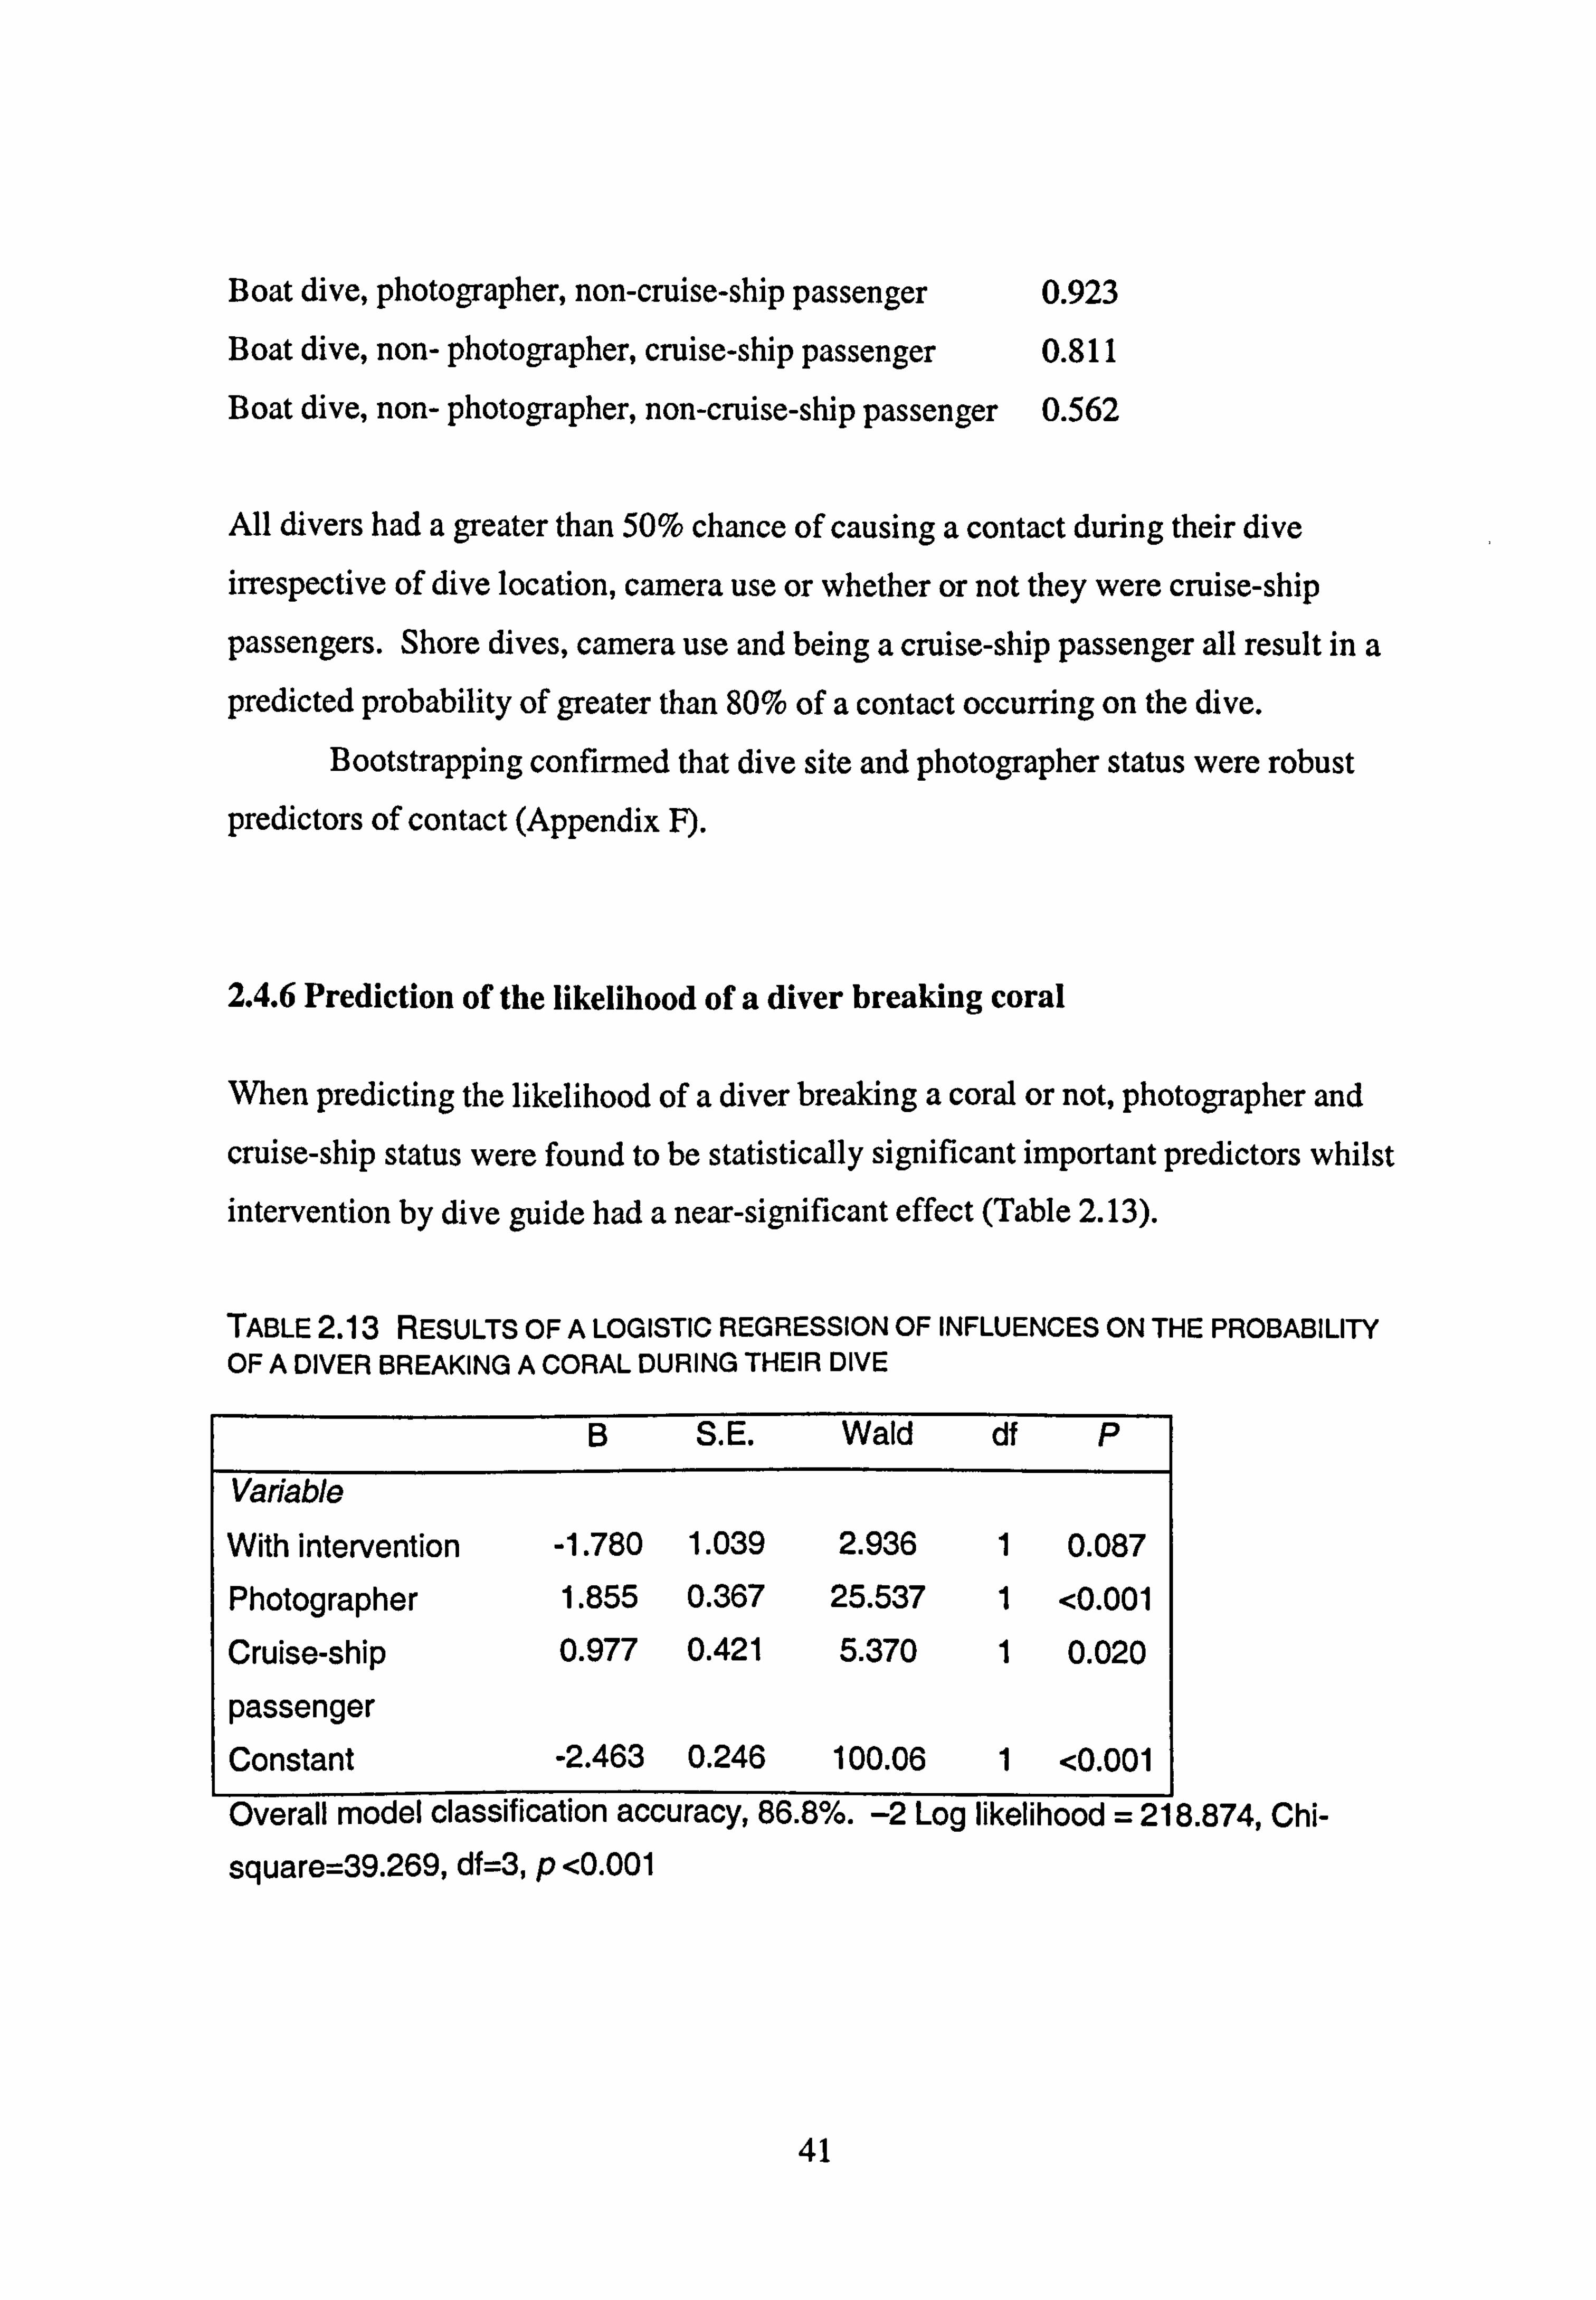
All divers had a greater than 50% chance of causing a contact during their dive
irrespective of dive location, camera use or whether or not they were cruise-ship
passengers. Shore dives, camera use and being a cruise-ship passenger all result in a
predicted probability of greater than 80% of a contact occurring on the dive.
Bootstrapping confirmed that dive site and photographer status were robust
predictors of contact (Appendix F).
2.4.6 Prediction of the likelihood of a diver breaking coral
When predicting the likelihood of a diver breaking a coral or not, photographer and
cruise-ship status were found to be statistically significant important predictors whilst intervention by dive guide had a near-significant effect (Table 2.13).
TABLE 2.13 RESULTS OF A LOGISTIC REGRESSION OF INFLUENCES ON THE PROBABILITY OF A DIVER BREAKING A CORAL DURING THEIR DIVE
B S. E. Wald df P
Variable
With intervention -1.780 1.039 2.936 1 0.087
Photographer 1.855 0.367 25.537 1 <0.001 Cruise-ship 0.977 0.421 5.370 1 0.020
passenger Constant -2.463 0.246 100.06 1 <0.001 Overall model classification accuracv. 86.8%. -2 Loa likelihood = 21
square=39.269, df=3, p <0.001
8.874, Chi-
41
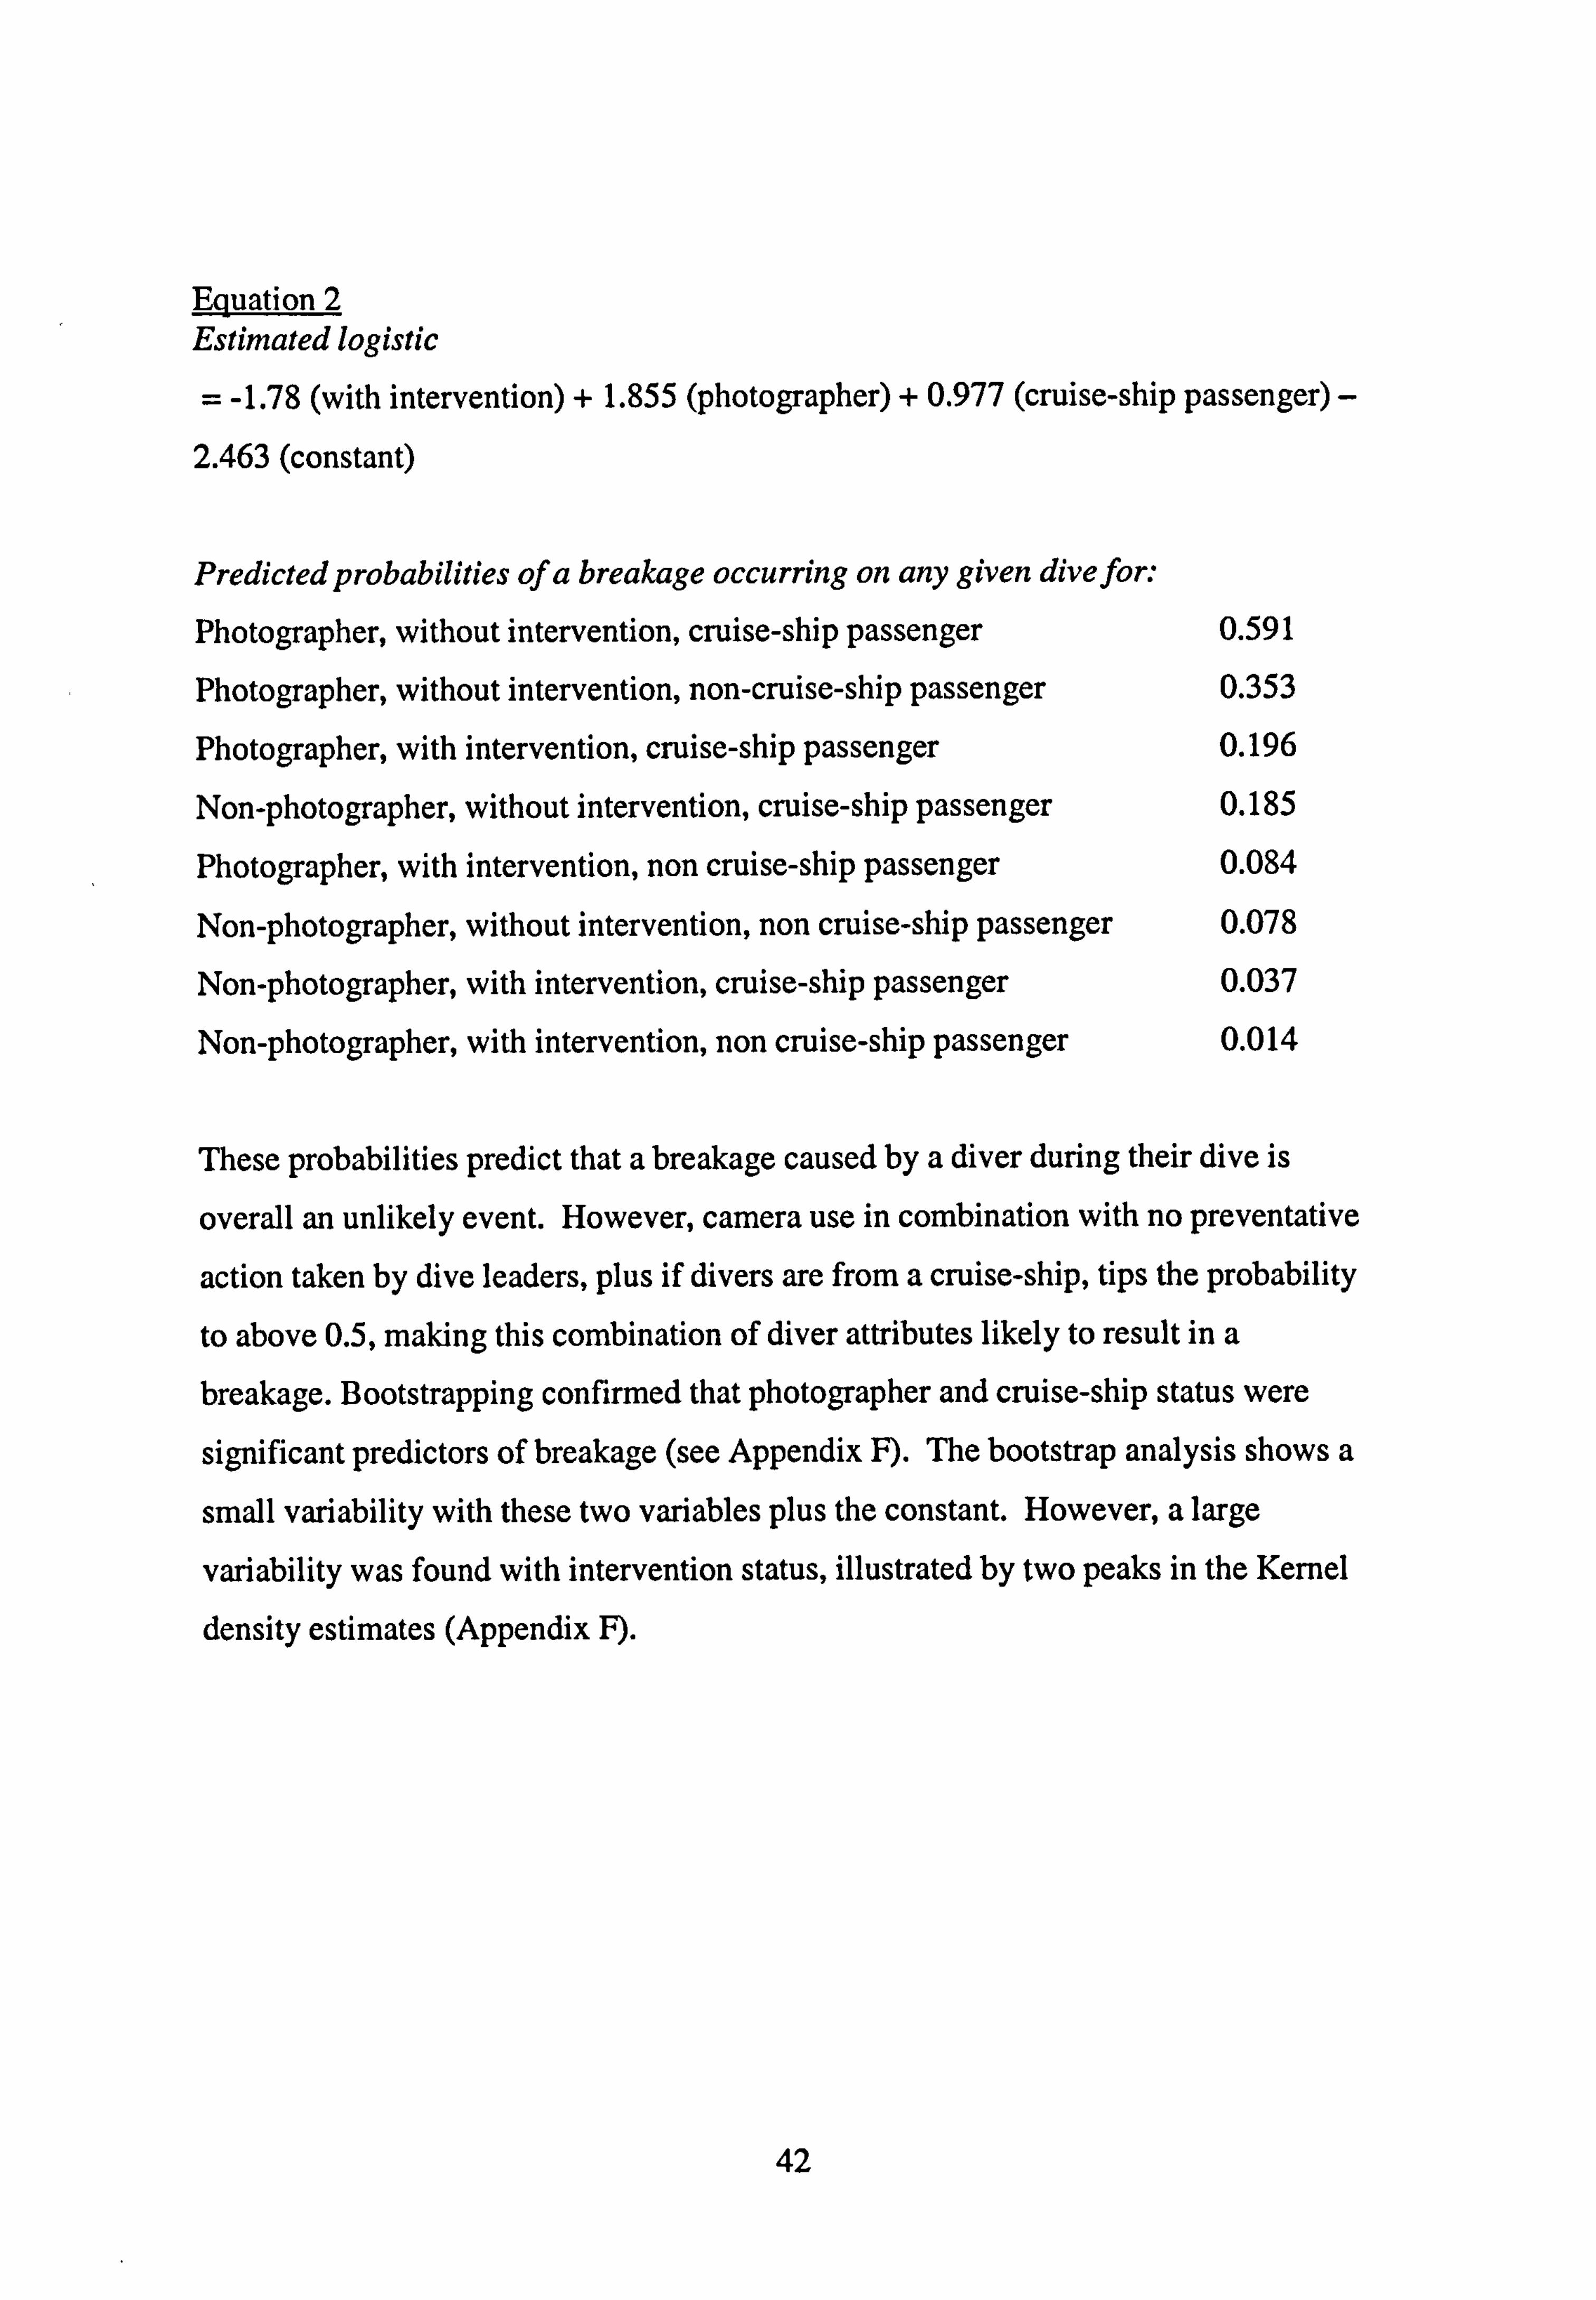
Equation 2 Estimated logistic
= -1.78 (with intervention) + 1.855 (photographer) + 0.977 (cruise-ship passenger) - 2.463 (constant)
Predicted probabilities of a breakage occurring on any given divefor.
Photographer, without intervention, cruise-ship passenger 0.591
Photographer, without intervention, non-cruise-ship passenger 0.353
Photographer, with intervention, cruise-ship passenger 0.196
Non-photographer, without intervention, cruise-ship passenger 0.185
Photographer, with intervention, non cruise-ship passenger 0.084
Non-photographer, without intervention, non cruise-ship passenger 0.078
Non-photographer, with intervention, cruise-ship passenger 0.037
Non-photographer, with intervention, non cruise-ship passenger 0.014
These probabilities predict that a breakage caused by a diver during their dive is
overall an unlikely event. However, camera use in combination with no preventative
action taken by dive leaders, plus if divers are from a cruise-ship, tips the probability
to above 0.5, making this combination of diver attributes likely to result in a
breakage. Bootstrapping confirmed that photographer and cruise-ship status were
significant predictors of breakage (see Appendix F). The bootstrap analysis shows a
small variability with these two variables plus the constant. However, a large
variability was found with intervention status, illustrated by two peaks in the Kernel
density estimates (Appendix F).
42
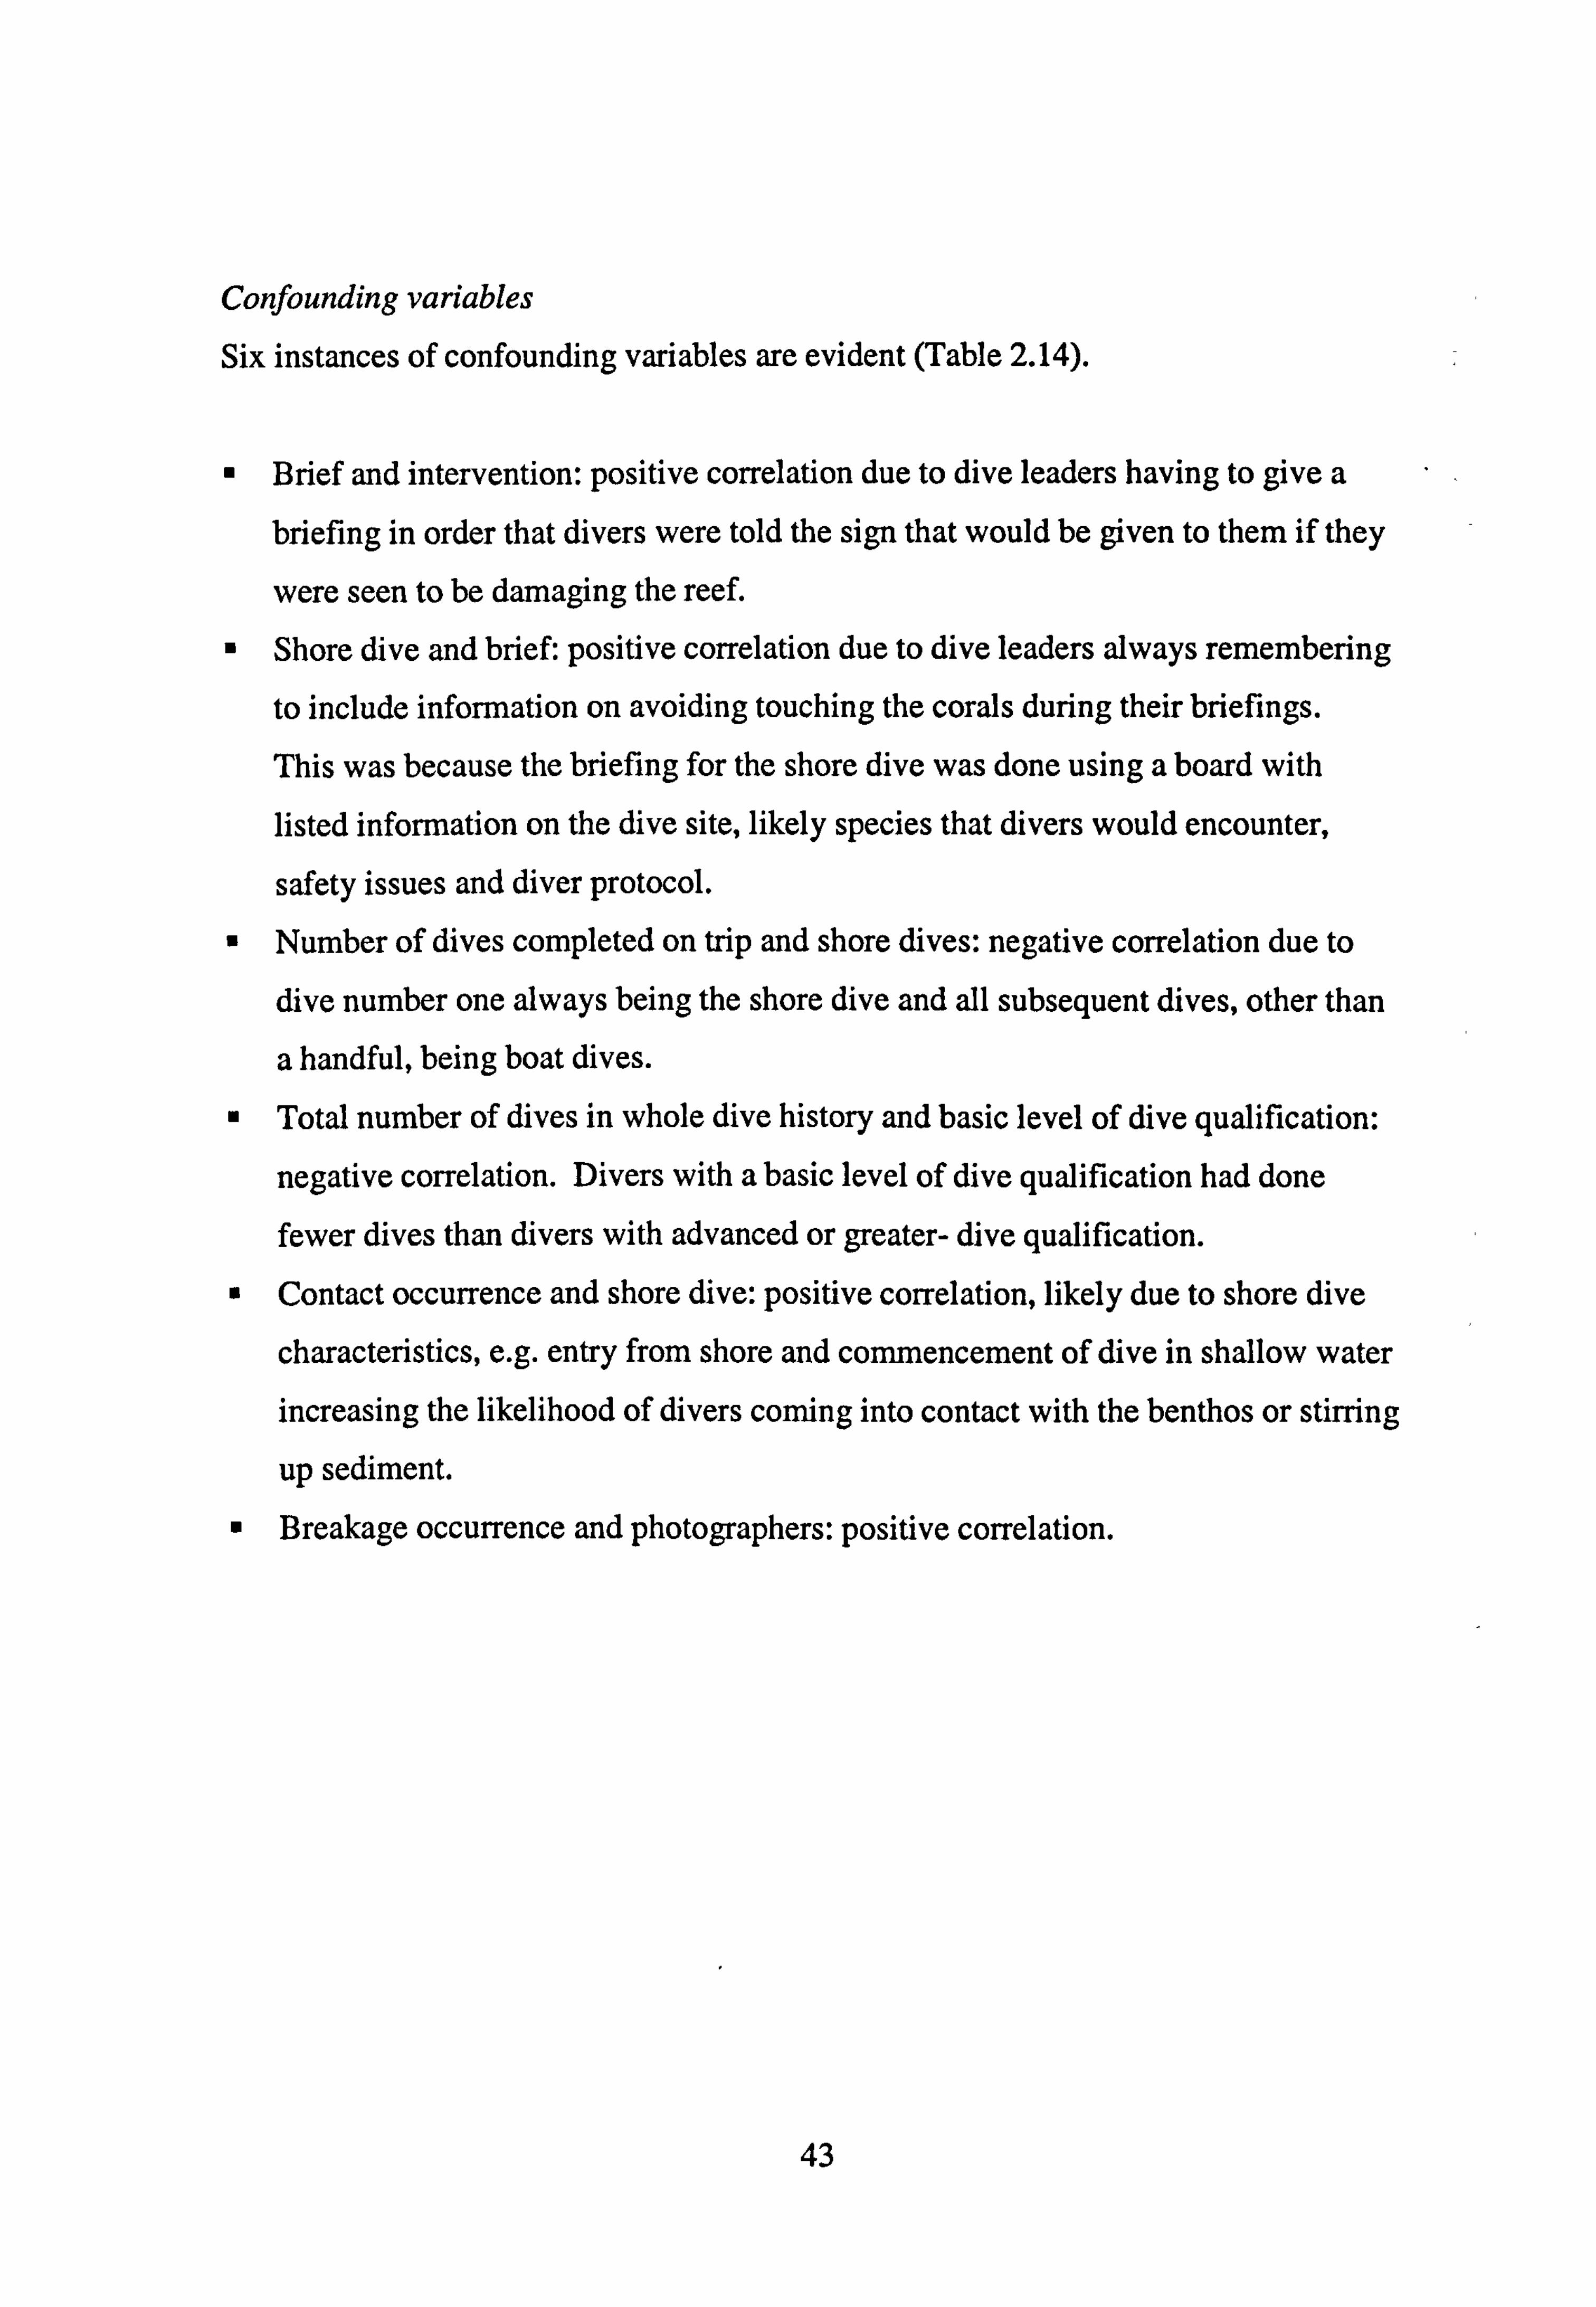
Confounding variables Six instances of confounding variables are evident (Table 2.14).
m Brief and intervention: positive correlation due to dive leaders having to give a
briefing in order that divers were told the sign that would be given to them if they
were seen to be damaging the reeL
m Shore dive and brief: positive correlation due to dive leaders always remembering
to include information on avoiding touching the corals during their briefings.
This was because the briefing for the shore dive was done using a board with
listed information on the dive site, likely species that divers would encounter,
safety issues and diver protocol.
w Number of dives completed on trip and shore dives: negative correlation due to
dive number one always being the shore dive and all subsequent dives, other than
a handful, being boat dives.
0 Total number of dives in whole dive history and basic level of dive qualification:
negative correlation. Divers with a basic level of dive qualification had done
fewer dives than divers with advanced or greater- dive qualification.
m Contact occurrence and shore dive: positive correlation, likely due to shore dive
characteristics, e. g. entry from shore and commencement of dive in shallow water
increasing the likelihood of divers coming into contact with the benthos or stirring
up sediment. 0 Breakage occurrence and photographers: positive correlation.
43
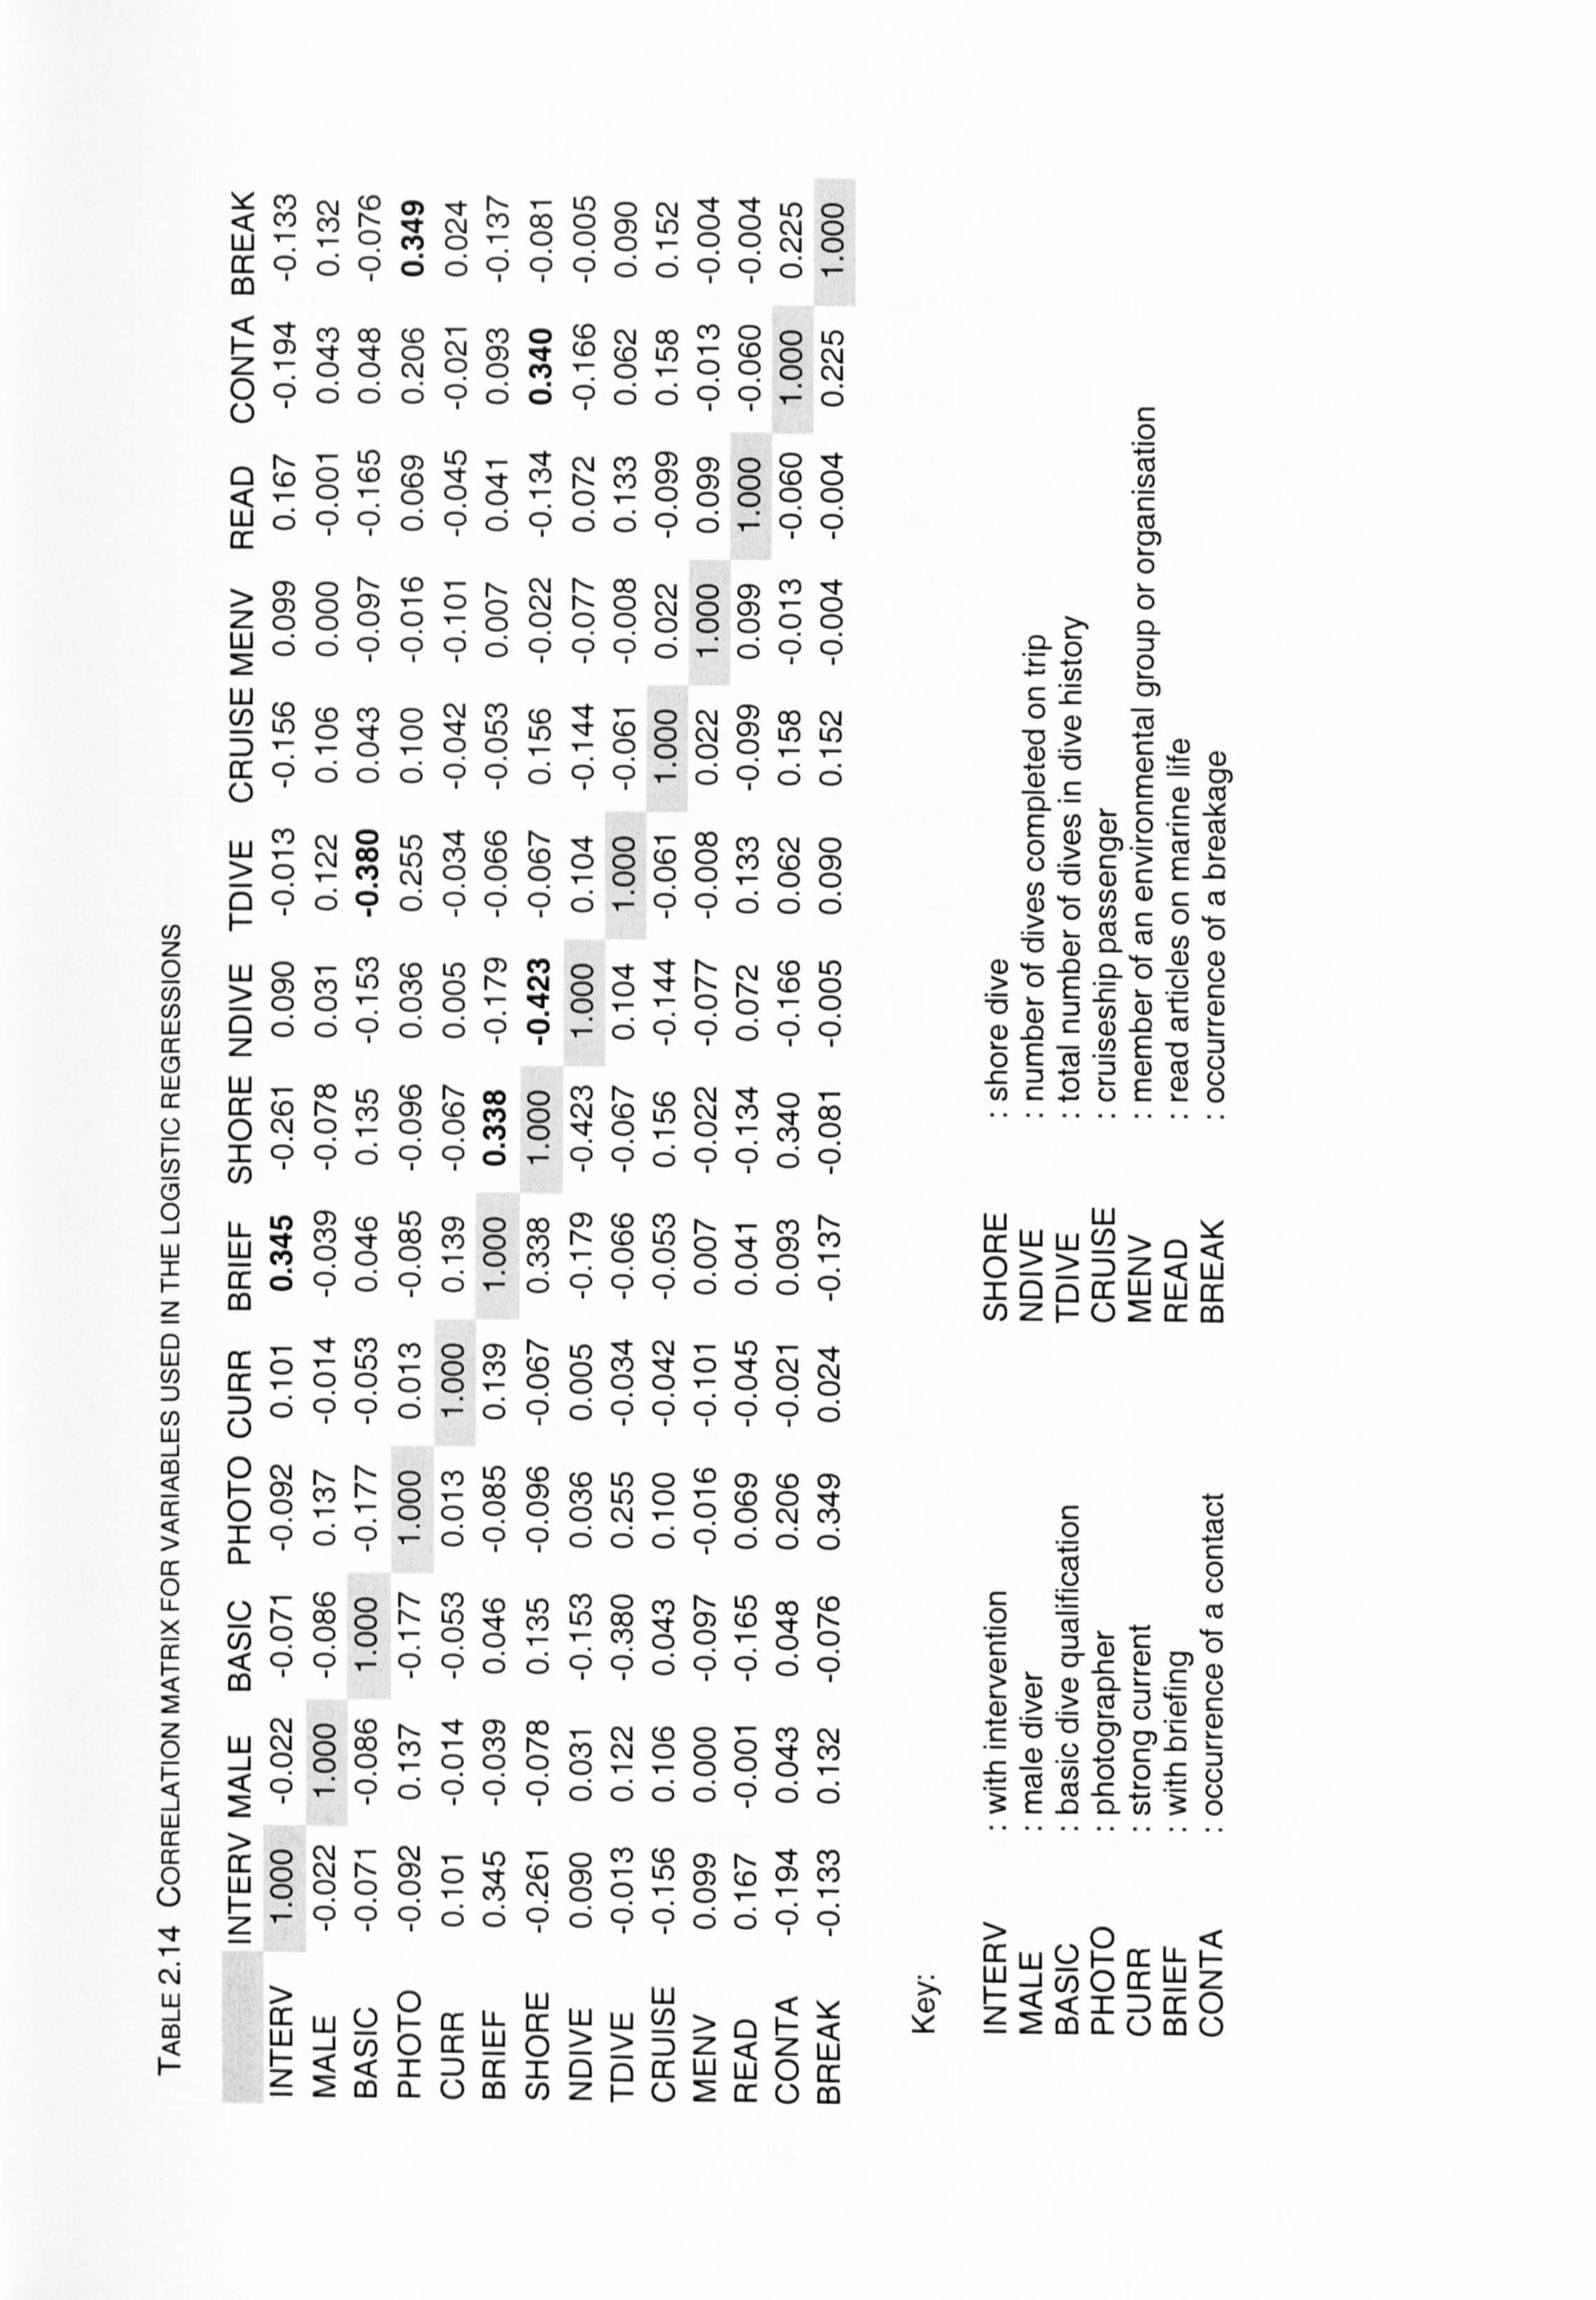
c'i w -J
I-
YM C\j (D a) .T
r- - LO C: ) C\J It zT Lr) CD < CO c) r- I. C\j (Y) 00 0 (j) Lo 00 C\j o w-9 c) o-00o- C) 0No
cr ci C? c; o C? 9 C? ooC? 9o
co
< 't co 00 (c) - co 0 (D C\j 00 C') 00 Lo ý- 0) ýf "t o C\j C3) -* (C) (o Lo - (D o C\j Z-oo C\j 0 c) cr) -o-00o C\l 0 CD CD o CD c? o C; cooqc? ,o C) I
r, - LO (3) LO - lzt C\j CY) 0) CY) CD 0t 0 (. C) 0 (9) (D Nt ,t (Y) rý, CY) (3) (Y) C: ) (0 0 <- CD -o0o-o- CD o0C0 Lu o C? C; ,oC? o C? CD o c? oýC? C?
CY) 0 r- (D - r, C\j rl- OD C\j 0 0) CY) KT 0) o 0) -00N r- 0N0M-0
z c) o99- c) 0 C? 9oo C) 00 w 20099909990-099
w CD -t omNm Lo m
- CD --79009-- mobCD699099,0960 () I LLJ
mN (D m qq m r- cy) No
5Nw Lo mmmoo (D 0m (0 m
- C? cl C\l 090, o99ýoo 9 69 6 C? 99o, 9C? C) 6o
W0-M (D LO CY) M0q 'q: f P- N (D LO 0) CY) U') (Y) C) r- N C: ) 0 It r- N (D 0 00 00 llý o CD b
C) c) o C? o0C? C? ý* o C? C? 0 C? C? z
LU - CC) LO (D N CO C: > CY) r-- (0 C\J "T 0- cr (D r- CY) CY) (D CV) C) C\j (0 Lr) C\j CY) "t 00 0N00 c) 0T0-q- co q T- 9 C? Ci 9? 09C? 0 C? C/)
Ln 0) (C) LO (: Y) C: ) 00 CY) (. 0 cy) rý - CY) r- LL 't Cl) 1 00 co o co r- (D LO o 1- 0) m 0 o C? - o cy) - C? 0 c) o o C; 9 o c? o , CD c? C? C? o o 0 c?
"T cl) co o cy) P- Lo 'IT C\j - LO - cr 0 LO - C: ) cr) (C) 0 CO 'IT 0 'IT C\j C\j Ir - 0 0 o C) - q o 0 q - 0 0 o Z) 0 o - C5 9 Ci 9 C? C? C) 0 N r- o cy) LO (0 (D Lo o 0) (o (y) C) r- C) - 00 0) cy) Lo o (D o q- 0 q - o o 0 q 0 C\j , o C\j cy) T- q 0 ? , O ? q o d o q o o o 13-
ý (D C) r- CO (0 Lr) CO 0 ce) r, - LO 00 (0 r, - 00 C) r- LO :t ce) LO OD ýt 0) (D q r- C) C? o - 9 o - - C? o (D - o Cý
< 9 C? - C? 9 0 c; o 9 C? o ED
c\J o (D rý 't cy) OD c\j (o o - cy) c\j w C\' o OD cy) - M r- cy) C\j o o 0 -t m -1 0 0 9 ý C? 0 C? (D - - 0 q 0 - < 9 , 9 0 9 9 9 CD 6 6 0 9 0 0
0 N , LO ý 0 M (D m r, KT M 0 N N M 0 1- (D M - U) m (0 M Cl) w o o q o - M N O O - O - - - F- 0 z , .
0 .
0 I 0 0 9 0 9 9 6 6 0 0
>0ww Ir Lu Cr LL fr W LLJ (f) >< Q ý- < LIJ
-3 oWo>z<Z Lu <<=mT0 Ir LLJ Lu 0 cr 2m a- ca u) z Ff (. ) ýi cr- (-) m
C: 0
cz Cl) C: cz 0) 0
0
L>' o- :3 o 0
!E CD 0
(1) -Fu -0 > (D I- C3
- c (D
a) ý t-- (D
c E a) M,: " 0-'- E U) ý (1) c 0 C: -E -2 co 0
0) C)
cm c . -- >
C (Z E
(D
(1) c co >0 U) cz c 0 ý 0 cu U)
> 0E- CD- F
C) L
(D - .'
(1) C) C: ý5 ý5 :3 CD U) a) t'- Q)
a) 0c a) - - ý
o - E -E
cn
5 Q ca = cn :3Z E: " C) E (D
o
LU LLI v ir Lu Lu Lf) >< 0 ý! >5z<I MQEMWWM wz ý- 02 Ir co
0 0 r_
r_ :3 (D r_ (D CM
2' (1) (D 0- --- c) (D >
u) 00
E
>0< cr LLJ f- jr U- LU
-j o cr LIJ z
<<0
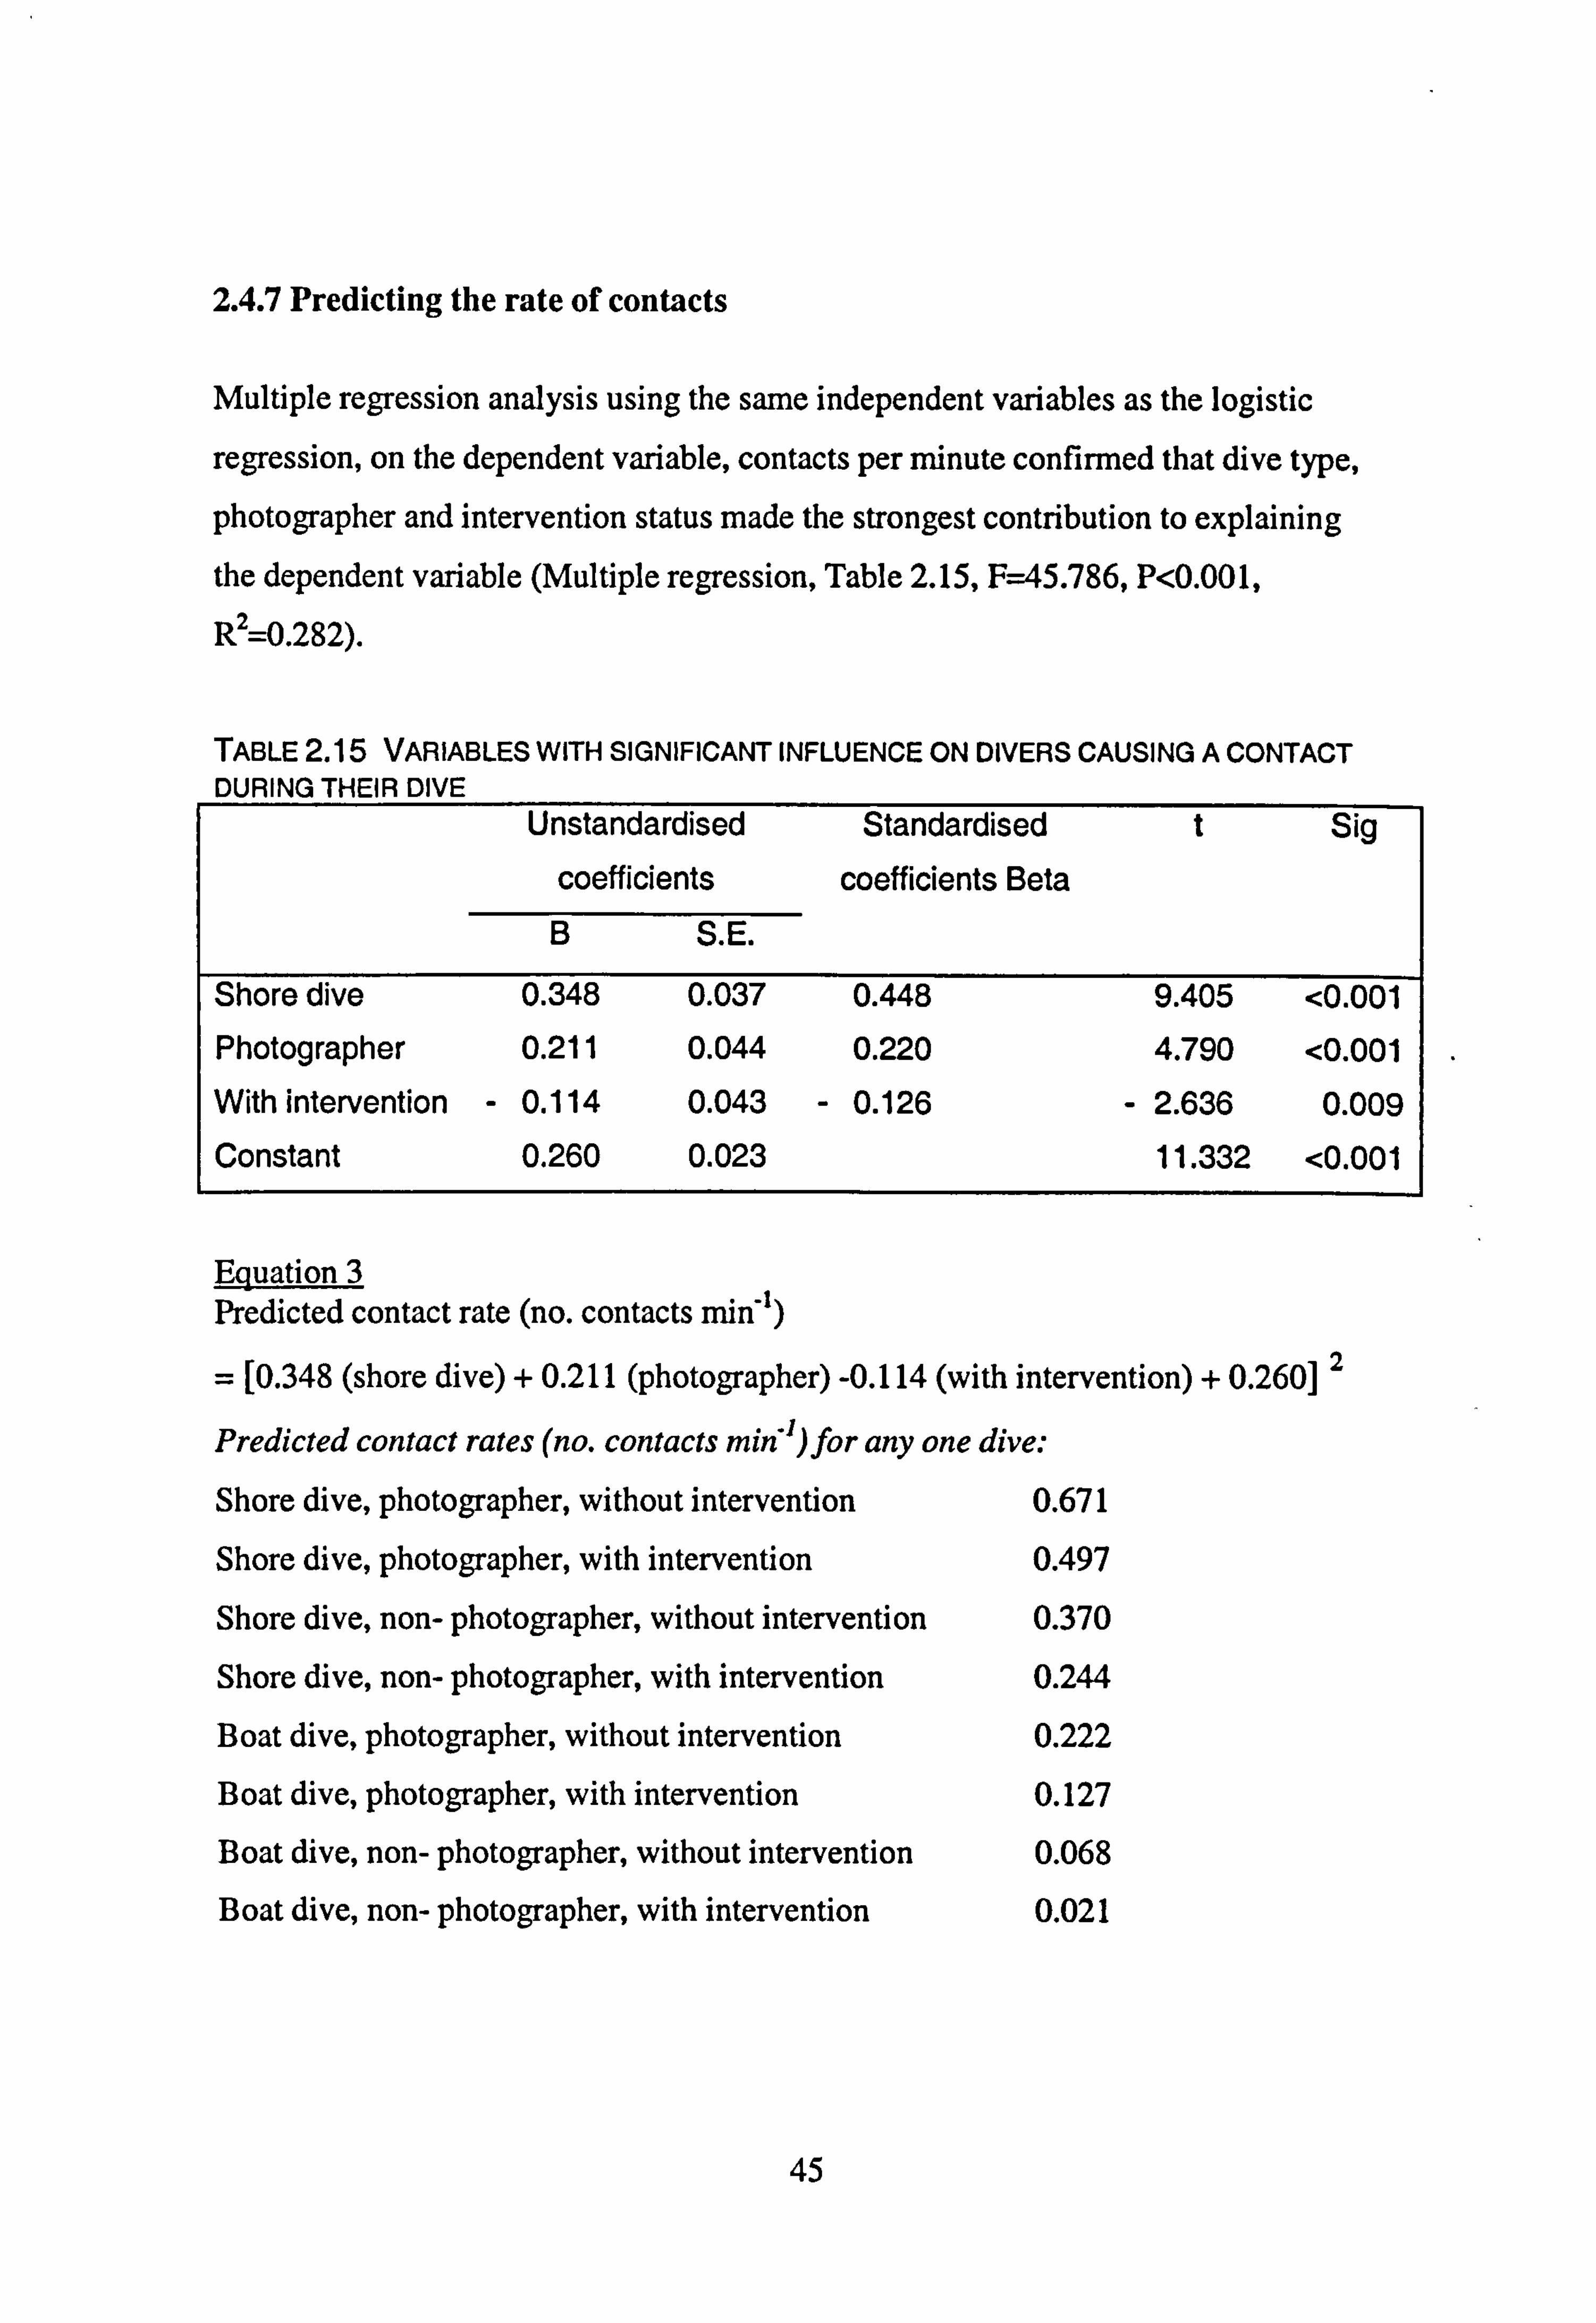
2.4.7 Predicting the rate of contacts
Multiple regression analysis using the same independent variables as the logistic
regression, on the dependent variable, contacts per minute confirmed that dive type,
photographer and intervention status made the strongest contribution to explaining
the dependent variable (Multiple regression, Table 2.15, F=45.786, P<0.001,
R2=0.282).
TABLE 2.15 VARIABLES WITH SIGNIFICANT INFLUENCE ON DIVERS CAUSING A CONTACT DURING THEIR DIVE
Unstandardised Standardised t Sig
coefficients coefficients Beta
B S. E.
Shore dive 0.348 0.037 0.448 9.405 <0.001 Photographer 0.211 0.044 0.220 4.790 <0.001 With intervention - 0.114 0.043 - 0.126 - 2.636 0.009 Constant 0.260 0.023 11.332 <0.001
Equation 3 Predicted contact rate (no. contacts min-)
= [0.348 (shore dive) + 0.211 (photographer) -0.114 (with intervention) + 0.260] 2
Predicted contact rates (no. contacts min")for any one dive:
Shore dive, photographer, without intervention 0.671
Shore dive, photographer, with intervention 0.497
Shore dive, non- photographer, without intervention 0.370
Shore dive, non- photographer, with intervention 0.244
Boat dive, photographer, without intervention 0.222
Boat dive, photographer, with intervention 0.127
Boat dive, non- photographer, without intervention 0.068
Boat dive, non- photographer, with intervention 0.021
45
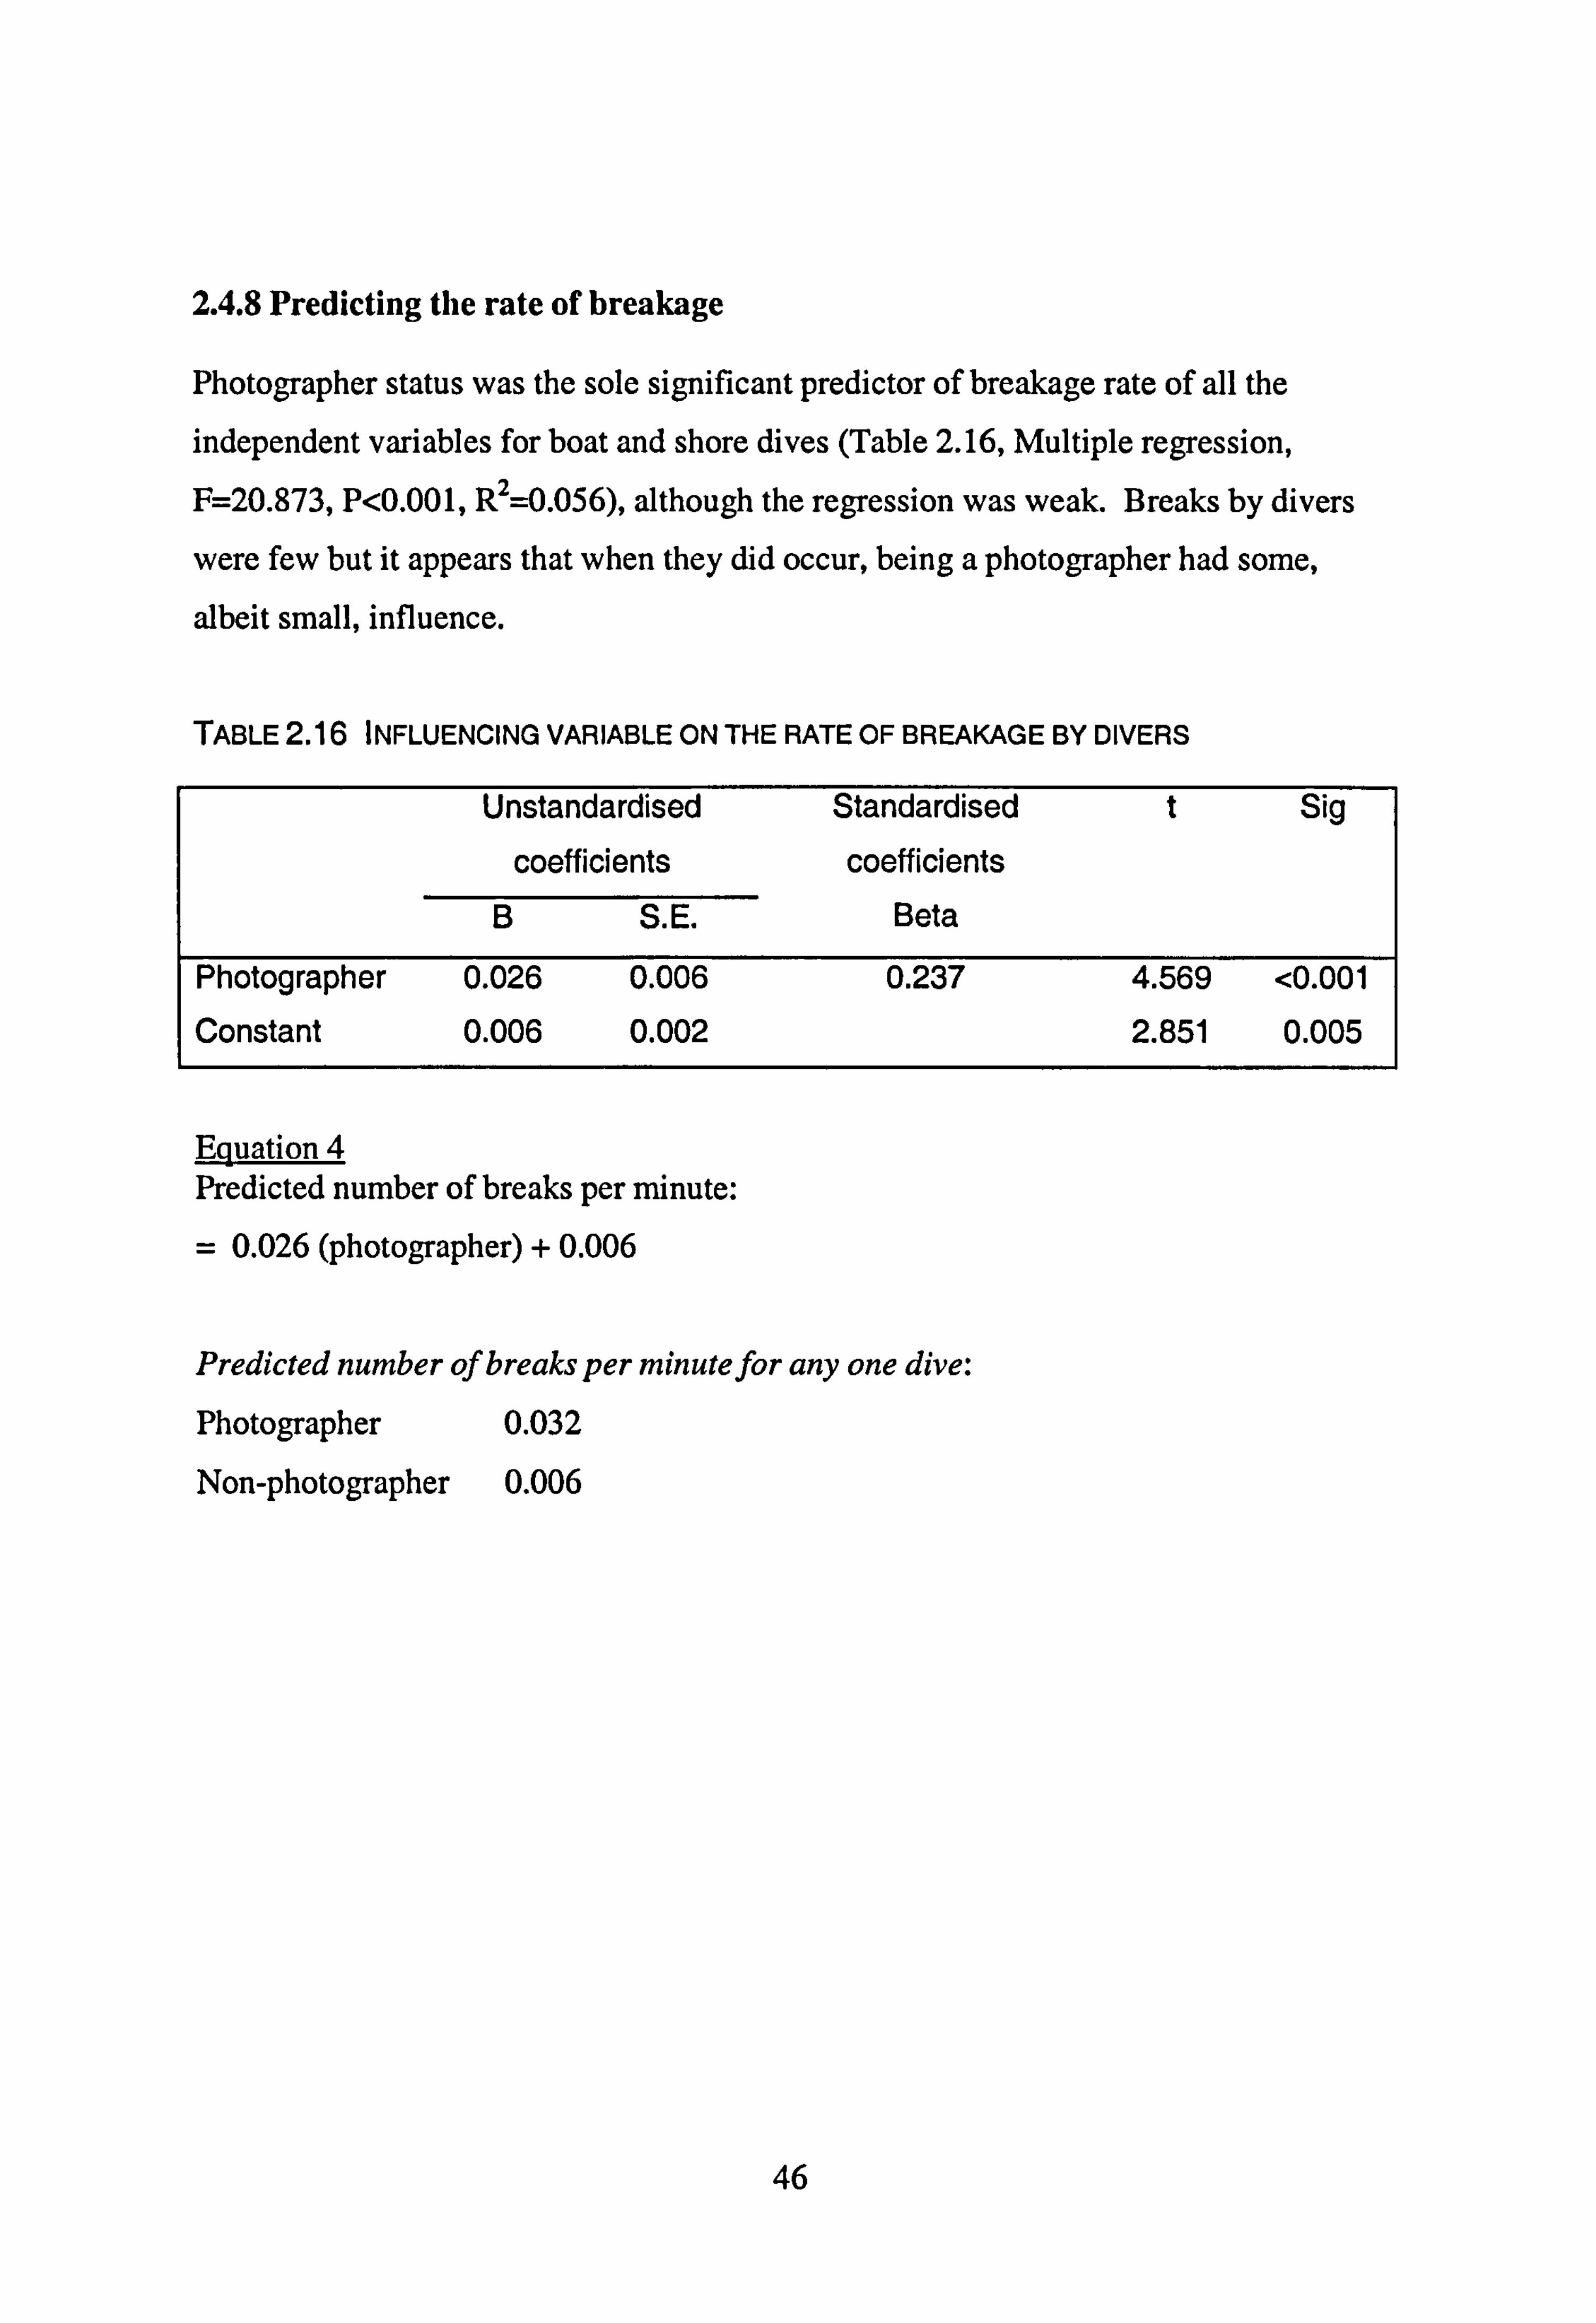
2.4.8 Predicting the rate of breakage
Photographer status was the sole significant predictor of breakage rate of all the
independent variables for boat and shore dives (Table 2.16, Multiple regression, F=20.873, P<0.001, R2=0.056), although the regression was weak. Breaks by divers
were few but it appears that when they did occur, being a photographer had some,
albeit small, influence.
TABLE2.16 INFLUENCING VARIABLE ON THE RATE OF BREAKAGE BY DIVERS
Unstandardised Standardised t Sig
coefficients coeff icients
B S. E. Beta
Photographer 0.026 0.006 0.237 4.569 <0.001 Constant 0.006 0.002 2.851 0.005
Equation 4 Predicted number of breaks per minute:
= 0.026 (photographer) + 0.006
Predicted number of breaks per minutefor any one dive:
Photographer 0.032
Non-photographer 0.006
46
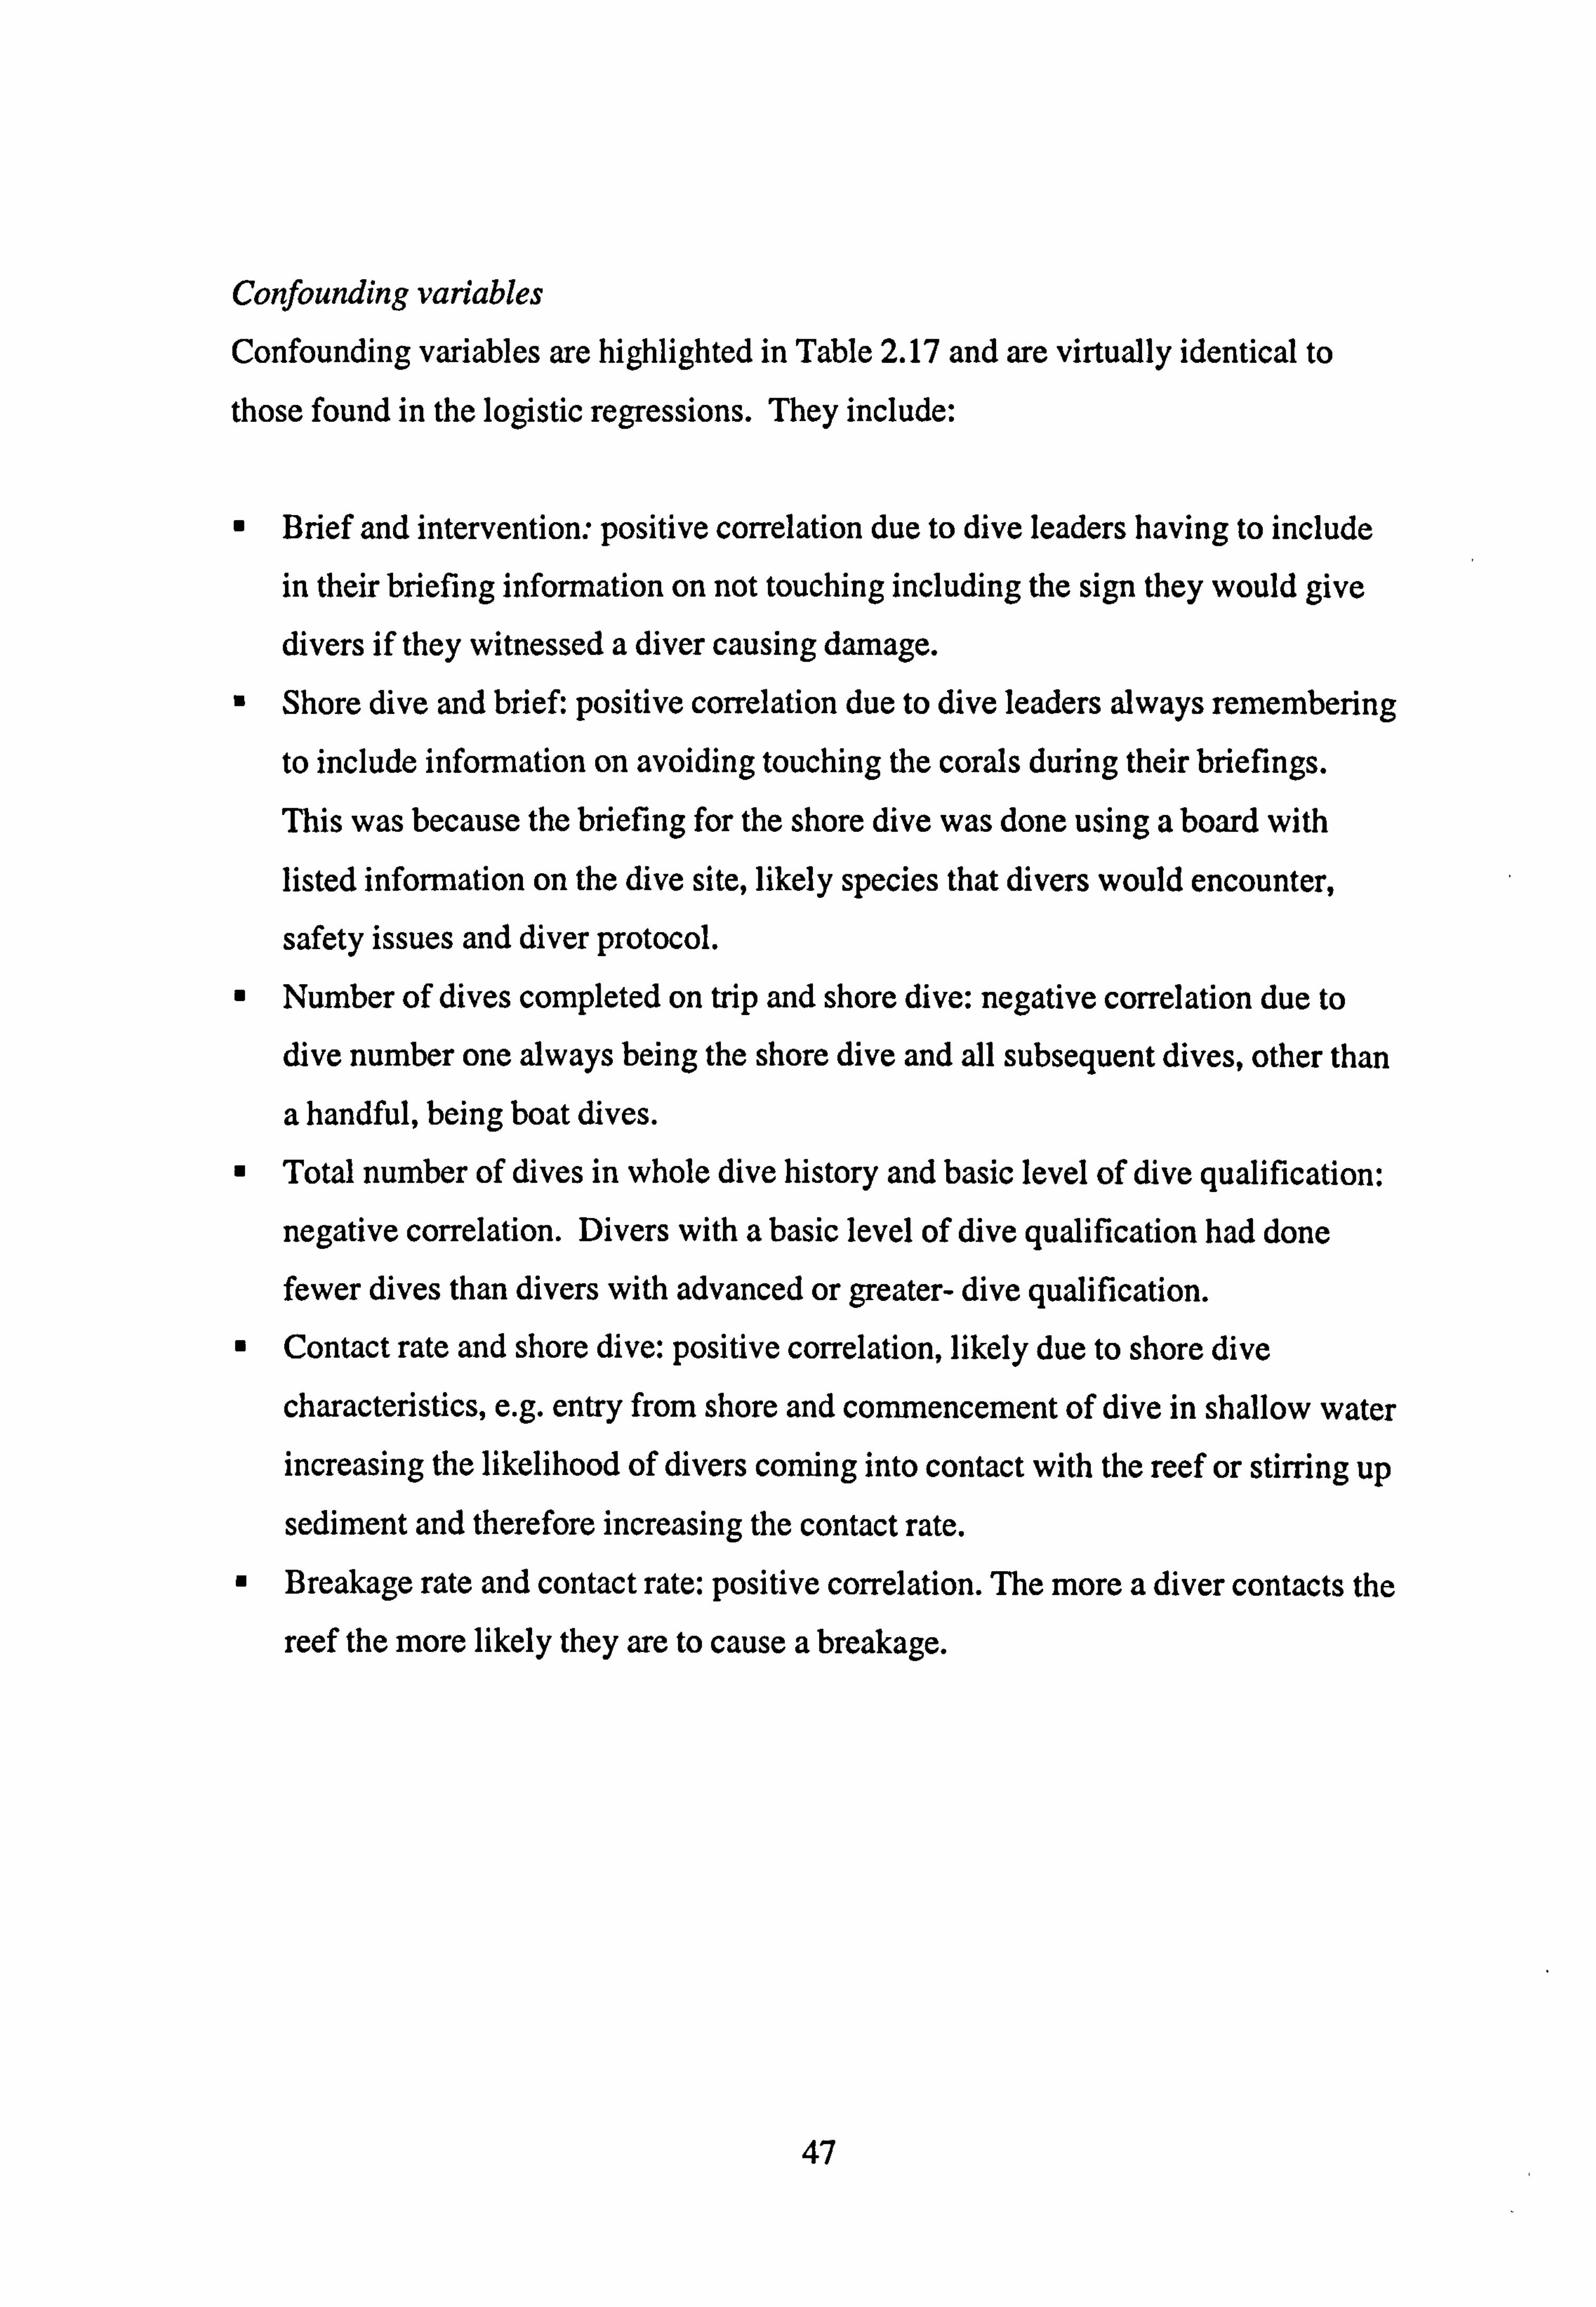
Confounding variables Confounding variables are highlighted in Table 2.17 and are virtually identical to
those found in the logistic regressions. They include:
m Brief and intervention: positive correlation due to dive leaders having to include
in their briefing information on not touching including the sign they would give divers if they witnessed a diver causing damage.
u Shore dive and brief: positive correlation due to dive leaders always remembering
to include information on avoiding touching the corals during their briefings.
This was because the briefing for the shore dive was done using a board with listed information on the dive site, likely species that divers would encounter,
safety issues and diver protocol. n Number of dives completed on trip and shore dive: negative correlation due to
dive number one always being the shore dive and all subsequent dives, other than
a handful, being boat dives.
n Total number of dives in whole dive history and basic level of dive qualification:
negative correlation. Divers with a basic level of dive qualification had done fewer dives than divers with advanced or greater- dive qualification.
m Contact rate and shore dive: positive correlation, likely due to shore dive
characteristics, e. g. entry from shore and commencement of dive in shallow water increasing the likelihood of divers coming into contact with the reef or stirring up
sediment and therefore increasing the contact rate. m Breakage rate and contact rate: positive correlation. The more a diver contacts the
reef the more likely they are to cause a breakage.
47
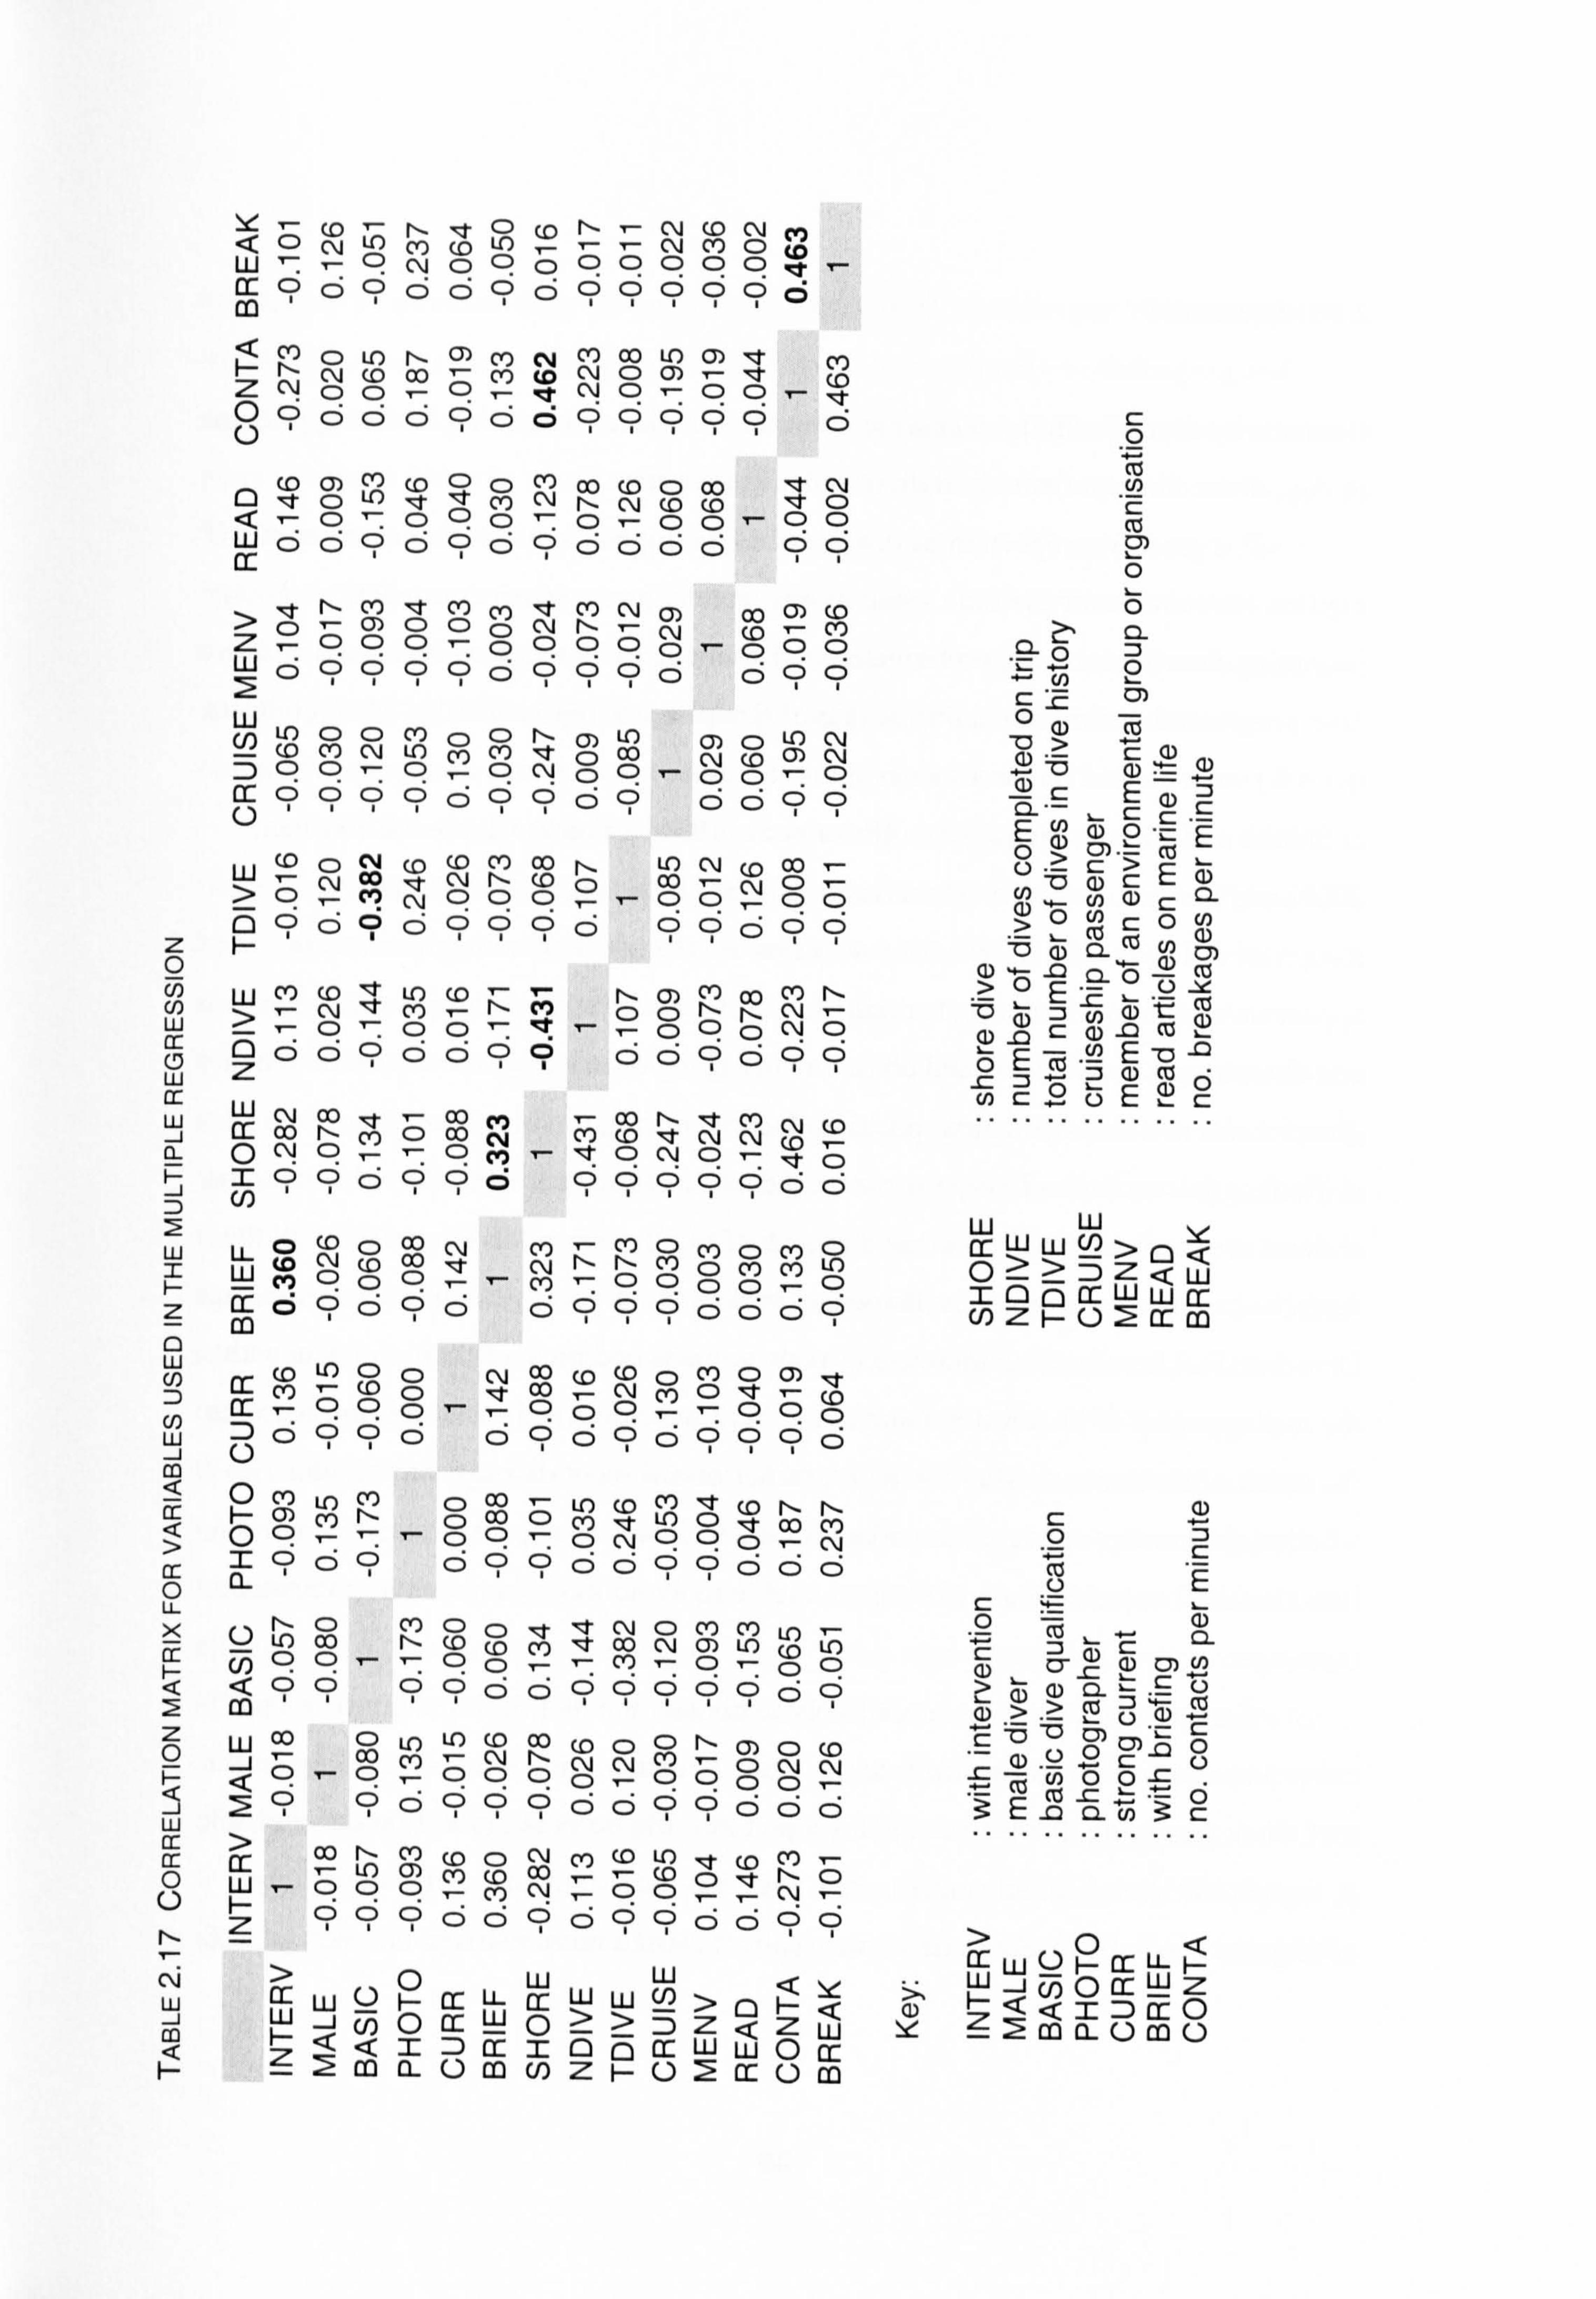
C\i w
ýe - (0 - r, - e CD (0 tý N (D CM M < CD cq Lir) M (0 LO --NM0 w-, 0 (-q 000 cý cý (: ý 00 %909009099999d Cß <M0 LO r', MM r4 MM LO Me CO ý- r- C\J (0 CD - CY) CO CIJ CD (» - 't (0 Z CM CD CD , CD - .4 CM C: ) - cý 9-e c) o ci CD CD g CD cs c? g CD CD CD c5
(c) 0) C') (D 0 C) (') OD co o 0c) 't C\l It 0 "t "t Cl) N I- C\j (D (c) Nt 0
<-oo0oo- (5 o-q0 LL, o C) 9o C3 Ir , c; 9 (:: ) oooC? C?
> 't r- Me CO CY) le CO N a) CO C» (0 (D -M C) CD CD CIJ r- - cq (D - CO Z, CD 00000 cý 0,0 cý cý 000 c5 c5 c5 9 c? c? C) (5 99
LU LO CD CD CO CD CD r- M U«) M (D LC) C\J (0 M CM LO CY) M xt C) CD C\J (0 M CM cý 9- (D - C: ) N0 cý 00-C: ) CD (D CD CD (D CD CD (D 9 C: ) C: ) CD CD
LU (C) c) CM (C) (C) (Y) 00 pý Lo C\j (. 0 oo ,
C\J 00 Kt N rý (D C: ) OD -NC: ) - ,m C\j 0-0o-0C: )
o cii o c? q C: ) Cý Cý
uj c) (c) q Lo (D -- C\j "t (Y) r- cf) 0- C) CD -t*
oo Cý o C5 6 C5 z LIJ
N 00 00 C4) (r 00 rý o 05 N 0 C\j '? -0 CS
T-99099c; U) LL (D CD CC) cm ý2 CM (0 OD e
cn C: ) CD CD - cs 9 CD 9 CD
(0 LO CD C: ) Ir CY) ý (0 C) CD CD C) CD 99 CD
0 CO LO m (» CY) P-
O(D---
Z: 9 c5 c. 5 0-
r- 0) CO 00 CO rý ob r- r-- cli - o0o C\j 0 o09oC? 9
- OD r-, e ce) CJ (0 m (D le N CM (D , 'e 0 C\' CD - `t (D C. D C. 5 0. C. D C. D C> CD
CY) C') 0 cy) o (Y) C) N r- CY) C) CY) CY) Lo CV) CD 0 CD 0,0
0 C) C: ) 0
C\j 00 (0 (D 0 (Y) 0 CF) 00 - C\l CY) 0 ý: t 0o0ý-0o
0909c1? 9
C) OC) ý LO (D C') ,, (o r-- N o 00 0 cy) "t LO 0 -t 00 co o9-oN9qo- C\j
o C? C? C) o C? ?0oo ý, C: ) c, ) (: ) CD e C'J C: ) Cý) CO LO - LO OD r, - (0 (0 CY) ýt OD NM LO (D L. 0 cý cý - cý C) ," CO - CD CD CD
<9C? CD CD c5 CD 9 CD c5 CD m9äC? LU OD CD Lf) LO (D CO (0 CD CD P- C» CD (D -. 1 00 m- clj r- C\j ci m- CD cm cm < cý cý - CD cý cý CD - cý cý 00- 29 9c59990ä990öo
>M t-- CO (0 C: ) CM cr) (0 LO e (0 CO - - U') C) (Y) (0 OD ,- (0 CD �t rý CD C: ) CD CD , CO CM - CD CD -- C'*, j - 0 ci c5 009C: ) 99 CD CD CD 0
>0ww< fl: W L) f- a: U- ir LU LU U) >< LU (n 0 tr W0ý: >5Z<Zw k-«mmcrm03mwwom 2: 2m 0- 0m0Z ýf 02 tr 0m
r_ 0
0
0
CL
r- F c) cm 0 (D 7ý
-0 > (D -
- r- (D (D
0- ý (1) r- r- C, 'i-- E- E (D MZ(, c
>
- (n c: (D r
(D
Q) >0 U)
(lö r0 cn (D CI» c3)
0-
0 r_ G) -0 (lö "
- E- -cö -l') E- -o CO -c2 Z (D ö
LU LU v Er UJ LU U) >0< < LLI
1: 00 CE UJ w cr- u) Z k- 02 tr m
c C)
0
E
.0 cz C) 0- Q) a) cr C: T) > -
c > Ca =3
L5 --a - C) . 1) " C))
(t
C: . - 0)
-0 a) .20c 0
0 00 E 0c - - co c:
>0< Cc ui Cr LL F. - LU
-i U) o (r Wz <<m5mo :E co a- c) m C)
2.5 DISCUSSION
Contacts by divers with the reef were common but varied according to dive type, time
of day, diver characteristics and dive leader intervention.
The greatest proportion of contacts and the highest contact rate came within
the first ten minutes of the dive when divers were adjusting their equipment and becoming familiar with the underwater environment. Contact rate decreased as the
dive progressed, a similar finding to that of Rouphael & Inglis (2001). Most contacts (8 1.4%) were caused by fin kicks as found by other observations on divers at Sharm.
el Sheikh and Eilat in the Red Sea (Prior et al., 1995; Zakai & Chadwick-Furman,
2002) and Eastern Australia (Roberts & Harriott, 1994; Harriott et al., 1997;
Rouphael & Inglis, 2001). Reasons why fins are the cause of so many contacts
appear to be due to swimming technique, incorrect weighting and ignorance. Fins
add extra length to the diver and consequently bring divers closer to the reef. When
divers swim in a non-horizontal position due to carrying too much weight or lack of
skill, their fins are more likely to contact the reef or raise sediment. My observations
showed that sediment was raised in almost half of all cases of diver contact with the
reef, but because the event was happening behind the diver it generally went unseen. Divers in St. Lucia seemed unaware of their impacts and most of their contacts with
the reef appeared to be unintentional (81.2%). Interestingly, the distribution between
the result of the contact, whether major, minor or sediment damage was similar
whether the contact appeared intended or not. Contrary to expectations, divers who intentionally contacted the reef seemed unable to avoid the most damaging impact,
breakage.
Camera users were far more likely to contact the reef during their dive and
cause a breakage than non-camera users, often whilst holding onto or kneeling on the
reef when steadying themselves to take a picture. Medio et al., (1997) and Rouphael
& Inglis (2001) also found camera users to be the most damaging, the latter study
noting that specialist underwater photographers caused more damage on average (1.6
49
breaks per 10 minutes) than divers without cameras (0.3 breaks per 10 minutes). In
my study, camera users, whether specialist or not were equally as damaging and on
average, caused 3.8 contacts and 0.3 breaks per 10 minutes respectively compared to divers without cameras who averaged 2.3 contacts and 0.1 breaks per 10 minutes. These results parallel Rouphael and Inglis's (2001) results with non-camera users having an 81% lower breakage rate than camera users. In Prior et al. 's (1995) study the difference in damage done to corals between camera users and non-camera users
was thought to be a function of a greater proportion of the men using cameras
compared to women, however my study found no such trend.
I also found that divers who were cruise ship passengers were significantly
more likely to break the coral and marginally more likely to contact the reef than non-
cruise ship passengers. Cruise-ship passengers may be diving on a more 'non-
specialist' level than land based-visitors and diving was usually but one of several
off-ship activities compared to it being a main holiday activity. They may therefore
not be taking it as seriously, not diving as often and be less skilled. However, I found
that diver experience in terms of dive qualification and number of dives logged in
total dive history did not appear to be linked to contact rate. This supports research
by Harriott et al. (1997) who found no significant difference between total number of
contacts and experience (measured as less than or more than 100 dives), or dive
qualification. However, an earlier study by Roberts & Harriott (1994) found that
divers with further training (Advanced and above) had fewer than half the number of
uncontrolled contacts compared to divers with basic training although the total
sample size for that study was small (n=30, Roberts & Harriott, 1994). The fact that
all cruiseship divers only spent one day in St. Lucia also meant that my observations
of them included the compulsory first dive from shore and one boat dive at another
site. As I found shore dives to increase the likelihood of a diver contacting the reef
this may have influenced the results albeit marginally.
The only factor that I found to reduce diver damage in St. Lucia was dive-
leader intervention underwater. Contrary to previous research by Medio et al. (1997)
50
who found that briefing divers prior to the dive on their behaviour and how it can damage the reef reduced contact levels, I found that briefing divers - using the
technique mentioned above - in St. Lucia had no such effect. Medio et al. (1997)
found that contact rate per 7 minute observation period was reduced by 71% from 1.4
to 0.4 contacts after a single 45-minute environmental awareness briefing and a few .
minutes in-water demonstration showing divers what they could and could not touch.,
My test of a much shorter briefing, given by dive leaders added at most a couple of
minutes to the length of their usual briefing. This did not reduce contact rate or the
probability of a diver breaking living substrate. However dive leader intervention was highly effective, reducing average contacts from 11.6 to 2.4 per 40minute dive
(including shore dives), and from 7.5 to 2.4 contacts for boat dives.
Differences in type of briefing given may in part account for the non-
significant effect of a briefing alone on contact rates found in this study. The short briefing given by dive leaders was a more realistic commitment for a dive company
than the hour-long exercise mounted by Medio et al. (1997), but in isolation was insufficient to reduce diver contacts with the reef. My results indicate that dive
companies need to ensure dive leaders brief divers fully and more importantly should intervene when they see divers damaging the reef. Comments to me from divers in St.
Lucia included that they disliked seeing other divers, including dive leaders damaging
the reef. This reflects badly on dive leaders and their company, so leaders must demonstrate the correct behaviour at all times, take on the responsibility of telling
visitors how to avoid damaging the reef and be ready to intervene if they see damaging behaviour. Often, dive leaders are reluctant to approach divers and
criticise their behaviour. They feel that it is not their job or that they are not in a
position to do so and in some cases, may believe that it will reduce their earnings in
terms of gratuities. However, my discussions with divers showed that many
appreciate dive leader intervention whether to improve their own diving skills, or
those of others so that their dive was not spoilt. This request to see greater policing
of divers' behaviour is not exclusive to my study and other researchers have found
51
that people are concerned with the lack of control of diver behaviour (Mundet &
Ribera, 2001).
In shallow water, typical of shore dives, dive leaders can prevent divers
swimming close to the bottom by ensuring that they swim on the surface until the
depth is great enough before making their descent. As I found in my study, contact
rates and the probability of a contact occurring were greater on shore than boat dives,
largely because divers swam across shallow sandy areas. Divers also tend to mimic dive leader behaviour. In St. Lucia, dive leaders often stopped in the sand and divers
in the group tended to copy them, resulting in a lot of direct contact with sand and the
kicking up of sediment next to corals. Dive leaders can do much by example. By
staying far enough from the reef so that their fins do not stir up sediment or contact
corals and by avoiding touching or holding onto any part of the reef they can
encourage similar behaviour from tourists. Even more important is dive leader vigilance during night dives. I found
night dives resulted in more than twice as many diver contacts with the reef than
during the day, averaging 40 contacts per forty-minute dive during the night
compared to 18 during the day. The reason is likely in part due to reduced visibility
at night. Divers tend to keep much closer to the reef at night and focus their attention
on small things like coral polyps, crabs or starfish. Darkness also makes reading
gauges more difficult and holding a torch makes diving more complicated than in the
day. The torch illuminates only a few square meters of reef, making it harder for a
diver to avoid contacts and reducing the likelihood that they will see the effect of
their contacts or those of other divers. Reduced visibility also meant that I had more
difficulty observing the divers so my estimate of contact rate is conservative.
Encouraging divers to stay well away from the reef and making them aware of their
increased likelihood of contacting the reef could help reduce impacts. Knowing
divers are more prone to coming into contact with the reef at night, dive leaders need
to supervise divers more closely and dive groups may have to be reduced in order that
such supervision is feasible.
52
Although diver impacts can be reduced by education and dive leader
intervention underwater, the end result of damaged coral may be unavoidable if large
numbers of divers are using an area of reef. In St. Lucia, minor damage and the
raising of sediment was widespread (79.8% and 49.0% of contacts respectively)
whilst the most obvious contact, breakage of substrate, was perpetrated by a minority (4.1%). This supports Talge's (1991) study of 206 divers in the Florida Keys who found that 90% of divers had one or more physical interactions with the reef but only 2% damaged corals. The minor damage and re-suspension of sediment by most divers may seem trivial but it may compound existing stresses from other human
activities, which, according to Nystr6m et al. (2000), could undermine the resilience
of reef ecosystems. Direct contact with corals and other reef organisms can abrade their protective
layer of tissue, but the implications of this are unclear. A laboratory study in Florida
simulated diver damage by experimentally touching, with hands or fins, twelve
species of coral once per week for 10 weeks (Talge, 1992). Although she detected no lasting influence on eleven of the species after 3,6 and 11 months of follow-up
observations, popular sites in St. Lucia and elsewhere receiving upwards of 10,000
dives per year may have corals being touched much more often than in Talge's
experiments. Hall (2001) showed that tissue damage rendered corals more
susceptible to colonisation by algae, which could then act as a sediment trap (see also Walker & Ormond, 1982). Damaged corals were also more likely to be infected by
pathogens or other invading organisms and had a higher risk of mortality (Hall,
2001). Hawkins et al. (1997) implicate coral disease, facilitated by diver-inflicted
lesions on massive corals, in effecting the shift from massive to branching coral dominance in Bonairean dive sites.
Sediment particles in the water decrease light penetration, necessary for the
corals' symbiotic algae that provide the corals with energy through photosynthesis.
Particles that settle may also abrade the coral tissue leaving them open to infection as
noted above. In the literature, sediment pollution is widely reported to reduce coral
53
growth, reproduction and ultimately survival (Visser, 1992; Hodgson, 1993; Hawkins
& Roberts, 1994; Carias, 1998; Cox et al., 2000; Nemeth & Sladek Nowlis, 2001).
Sladek Nowlis et al. (1997) reported that sediment pollution was an important cause
of coral death in St. Lucia. Corals subjected to continuous sediment pollution use their energy to rid the colony of the particles instead of using their energy for growth
and reproduction (Richmond, 1996; Dodge et al., 1997; Rogers, 1990). Divers who
re-suspend sediment could therefore exacerbate an existing sediment pollution
problem. At sites that are heavily used, Hawkins & Roberts (1992) suggest that these
stresses may be rendering the reef ecosystem less able to deal with bigger stressors
such as hurricanes, storms and disease. Above a certain threshold of use, estimated at between four and six thousand dives per year, damage levels may increase rapidly (Dixon et al., 1993, Hawkins & Roberts, 1997). This has been seen in the Red Sea
where diving intensities of approximately five to six thousand dives per site per year
showed significant loss of coral cover and high frequencies of colony damage (Riegl
& Velimirov, 199 1; Prior et al., 1995). Similarly, at Eilat in Israel, Zakai &
Chadwick-Furman (2002) reported a strong relationship between diver numbers and
proportion of damaged corals where percentage of diver-damaged coral colonies at low-use levels (4000 dives yr") was 8% compared to 66% at high-use levels (more
than 30,000 dives yr-1). Although Eilat's estimated annual dive frequencies of more than 150,000 dives are higher than St. Lucia's (estimated at 137,000 dives per annum,
see chapter 3), 82,000 of all dives are in the Soufri6re Marine Management Area.
One site in particular, Anse Chastanet receives around 28,000 dives per year. I conclude that scuba divers cause damage to coral reefs. While user fees
levied on divers can help pay for management, until now, few protected areas do
more to manage diver behaviour than post notices urging divers not to touch or
remove anything from the reef. More active management is needed and it is evident from this study that short briefings alone are insufficient to reduce damage rates. However, simple measures implemented by dive companies could greatly reduce
54
impacts. They include dive leader intervention underwater when divers contact the
reef, leading by example in keeping fins and equipment clear of the reef, and extra
vigilance with camera users, on night dives and at the beginning of the dive. Size of dive group will influence the ability of dive leaders to perform their supervisory role
so smaller groups are better for the reef, and are preferred by divers in any case (see
Chapter 5).
2.6 REFERENCES
Bell, P. R. F. 1992. Eutrophication and coral reefs: Some examples in the Great Barrier Reef lagoon. Water Research 26: 553-568.
Carias, E. C. C. 1998. Guidelines for a study on constructions in mangrove swamp formations. Interciencia 23: 275-28 1.
Ceballos-Lascurdin, H. 1993. Ecotourism as a Worldwide Phenomenon. In: Lindberg, K., & D. E. Hawkins. (eds), Ecotourism: A guidefor Planners and Managers. The Ecotourism Society, North Bennington, VT, 175 pp.
CIA. Central Intelligence Agency. The World Factbook 2002 www. cia. gov/cia/publications/factbook/geos/st. html
Cox, R., Atkinson, R. K., Bear, B. R., Brandriss, M. E., Chokel, C. B., Comstock, J. C., Gutmann, E. D., Interess, L. B., Schildgen, T. F., Teplitzky, S. J., & M. P. Willis. 2000. Changes in a fringing reef complex over a thirty-year period: Coral loss and lagoon infilling at Mary Creek, St. John, U. S. Virgin Islands. Bulletin ofMarine Science 66: 269-277.
Dignam, D. 1990. Scuba gaining among mainstream travellers. Tour and Travel News, March 1990.
Dixon, J. A., Fallon Scura, L. & T. van't Hof. 1993. Meeting ecological and economic goals: Marine parks in the Caribbean. Ambio 22: 117-125.
Dodge, R. E. & J. R. Vaisnys. 1997. Coral populations and growth patterns: responses to dredging and turbidity associated with dredging. Journal of Marine Research 35: 715-730.
55
Driml, S. 1994. Protectionfor Profit. Economic and Financial Values of the Great Barrier Reef World Heritage Area and Other Protected Areas. Great Barrier Reef Marine Park Authority, Research publication no. 35, Townsville, 83 pp.
Dytharn, C. 1999. Choosing and Using Statistics: A Biologist's Guide. Blackwell Science Ltd., UK, 218 pp.
Fernandes, L. 1995. Integrating Economic, Environmental and Social Issues in an Evaluation of Saba Marine Park, Netherlands Antilles, Caribbean Sea. Honblue, Honolulu, USA, 60 pp.
Garrabou, J., Sala, E., Arcas, A. & M. Zabala. 1998. The impact of diving on rocky sublittoral communities: A case study of a Bryozoan population. Conservation Biology 12: 302-312.
Guzmdn, H. M. & I. Holst. 1993. Effects of chronic oil-sediment pollution on the reproduction of the Caribbean reef coral Siderastrea Siderea. Marine Pollution Bulletin 26: 276-282.
Hall, V. R. 2001. The response of Acropora hyacinthus and Montipora tuberculosa to three different types of colony damage: scraping injury, tissue mortality and breakage. Journal of Experimental Marine Biology and Ecology 264: 209-223.
Harriott, V. J., Davis, D. & S. A. Banks. 1997. Recreational diving and its impact in marine protected areas in Eastern Australia. Ambio 26: 173-179.
Hawkins, J. P. & C. M. Roberts. 1992. Effects of recreational SCUBA diving on fore- reef slope communities of coral reefs. Biological Conservation 62: 171-178.
Hawkins, J. P. & C. M. Roberts. 1993. Effects of recreational diving on coral reefs. Trampling of reef flat communities. Joumal ofApplied Ecology 30: 25-30.
Hawkins, J. P. & C. M. Roberts. 1994. The growth of coastal tourism in the Red Sea: Present and future effects on coral reefs. Ambio 23: 503-508.
Hawkins, J. P. & C. M. Roberts. 1997. Estimating the carrying capacity of coral reefs for scuba diving. In: Proceedings of the Eighth International Coral Reef Symposium, Smithsonian Tropical Research Institute, Balboa, Panama 2: 1923-1926.
Hawkins, J. P., Roberts, C. M., Van't Hof, T., De Meyer, K, Tratalos, J. & C. Aldam. 1999. Effects of recreational scuba diving on Caribbean coral and fish communities. Conservation Biology 13: 888-897.
56
Hodgson, G. 1993. Sedimentation damage to coral reefs. In: Ginsburg, R. S. (ed. ) 1994. Proceedings of the Colloquium on Global Aspects of Coral Reefs: Health, Hazards and History, 1993, RSMAS, Miami, pp. 298-303.
Koop, K., Booth, D., Broadbent, A., Brodie, J., Bucher, D., Capone, D., Coll, J., Dennison, W., Erdmann, M., HarTison, P., Hoegh-Guldberg, 0., Hutchings, P., Jones, G. B., Larkum, A. W. D., O'Neil, J., Steven, A., Tentori, E., Ward, S., Williamson, J. & D. Yellowlees. 2001. ENCORE: The effect of nutrient enrichment on coral reefs. Synthesis of results and conclusions. Marine Pollution Bulletin 42: 91-120.
Medio, D., Ormond, R. F. G. & M. Pearson. 1997. Effect of briefings on rates of damage to corals by scuba divers. Biological Conservation 79: 91-95.
Mundet, L. & L. Ribera. 2001. Characteristics of divers at a Spanish resort. Tourism Management 22: 501-5 10.
Muthiga, N. A. & T. R. McClanahan. 1997. The effect of visitor use on the hard coral communities of the Kisite Marine Park, Kenya. In: Proceedings of the Eighth International Coral Reef Symposium, Smithsonian Tropical Research Institute, Balboa, Panama 2: 1879-1882.
Negri, A. P., L. D. Smith, N. S. Webster & A. J. Heyward. 2002. Understanding ship- grounding impacts on a coral reef. potential effects of anti-fouling paint contamination on coral recruitment. Marine Pollution Bulletin 44: 111-117.
Nemeth, R. S. & J. S. Nowlis. 2001. Monitoring the effects of land development on the near-shore reef environment of St. Thomas, USVI. Bulletin ofMarine Science 69: 759-775.
Nystr6m, M., Folke, C. & F. Moberg. 2000. Coral reef disturbance and resilience in a human-dominated environment. Trends in Ecology and Evolution 15: 413-417.
Orams, M. 1999. Marine Tourism: Development, Impacts and Management. Routledge, London, 115 pp.
Prior, M., Ormond, R., Hitchen, R., & C. Wormald. 1995. The impact of natural resources of activity tourism: A case study of diving in Egypt. International Journal of Environmental Studies 48: 201-209.
Richmond, R. H. 1996. Effects of coastal runoff on coral reproduction. Biological Conservation 76: 211.
Riegl, B. & B. Velimirov. 1991. How many damaged corals in Red Sea reef systems? A quantitative survey. Hydrobiologia 216/217: 249-256.
57
Roberts, L. & V. J. Harriott. 1994. Recreational scuba diving and its potential for environmental impact in a marine reserve. In: Bellwood, 0., Choat, H. and N. Saxena (eds) Recent Advances in Marine Science and Technology 1994. James Cook University of North Queensland, Townsville, Australia, pp. 695-704.
Rogers, C. S. 1990. Responses of coral reef organisms to sedimentation. Marine Ecology Progress Series 62: 185-202.
Rouphael, T. & G. Inglis. 1995. The Effects of Qualified Recreational SCUBA Divers on Coral Reefs. CRC Reef Research Centre Technical Report No. 4, Townsville, Australia; CRC Reef Research Centre, 39 pp.
Rouphael, A. B. 1997. The Temporal and Spatial Patterns of Impact Caused by SCUBA Diving in Coral Reefs, and the Human and Site Specific Characteristics nat Influence Viese Patterns. PhD Thesis, James Cook University of North Queensland, Townsville, Australia.
Rouphael, A. B. & G. J. Inglis. 1997. Impacts of recreational scuba diving at sites with different reef topographies. Biological Conservation 82: 329-336.
Rouphael, A. B. & G. J. Inglis. 2001. "Fake only photographs and leave only footprints"?: An experimental study of the impacts of underwater photographers on coral reef dive sites. Biological Conservation 100: 281-287.
Sladek Nowlis, J., Roberts, C. M., Smith, A. H. & E. Siirila. 1997. Human-enhanced impacts of a tropical storm on nearshore coral reefs. Ambio 26: 515-521.
SMMA. Soufriere Marine Management Area, Soufri6re, St. Lucia, West Indies. www. smma. org. Ic
Spalding, M. D., Ravilious, C. & E. P. Green. 2001. WorldAtlas of Coral Reefs. Prepared at the UNEP World Conservation Monitoring Centre. University of California Press, Berkeley, USA, 424 pp.
Tabata, R. S. 1992. Scuba diving holidays. In: Weiler, B. & C. M. Hall (eds). Special Interest Tourism, Belhaven Press, London, UK, pp. 171-184.
Talge, H. 199 1. Impact of Recreational Divers on Scleractinian Corals of the Florida Keys. M. Sc. thesis, University of South Florida, St. Petersburg, USA, 92 pp.
Talge, H. 1992. Impact of recreational divers on sclertinian corals at Looe Key, Florida. In: Proceedings of the Seventh International Coral Reef Symposium, Guam, 1992,2: 1077-1082.
58
Tilmant, J. T. & G. P. Schmahl. 1981. A comparative analysis of coral damage on recreationally used reefs within Biscayne National Park, Florida. In: Proceedings of the Fourth International Coral Reef Symposium, University of the Philippines, Quezon City, Philippines, pp. 187-192.
Tratalos, J. A. & T. J. Austin. 2001. Impacts of recreational SCUBA diving on coral communities of the Caribbean island of Grand Cayman. Biological Conservation 102: 67-75.
Visser, N. 1992. Environmental impacts of tourism on the Kenya coast. Industry and Environment 15: 42-52
Walker, D. I. & R. F. G. Ormond. 1982. Coral death and phosphate pollution at Aqaba, Red Sea. Marine Pollution Bulletin 13: 21-25.
WTTC: World Travel and Tourism Council, 2002. Saint Lucia Travel & Tourism: A World of Opportunity, WTTC, London, UK, 28pp. http: //www. wttc. org/measure/PDF/Saint%20Lucia. pdf
Zakai, D. & N. E. Chadwick-Furman. 2002. Impacts of intensive recreational diving on reef corals at Eilat, northern Red Sea. Biological Conservation 105: 179-187.
59
Chapter 3: Snorkeler behaviour on coral reefs
3.1 ABSTRACT
Tourism, combined with the increased interest in the environment and activity-based holidays is intensifying the use of coral reefs worldwide. Snorkeling tops the list of
common activities because it is cheap and easy to do. Its accessibility and popularity however, may be detrimental to reefs. Despite this, few studies exist on snorkelers
and their impacts. I observed 180 snorkelers on their snorkel trips in St. Lucia noting
all their contacts with the reef and their outcomes. Few (20.6%) snorkelers contacted
the reef, averaging 0.05 contacts min'i compared to studies on divers, but the higher
number of snorkelers than divers in heavily used sites brings their impacts to similar levels. The highest rates of contact (up to 1.10 contacts min-) occurred at the beginning of the snorkeling activity and snorkelers using a camera caused more damage and had more than twice as many contacts as non camera users (mean of 0.12
versus 0.04 contacts min-). Giving snorkelers a briefing did not significantly reduce their contact with the reef but wearing a life-vest reduced mean contact rates from
0.06 to 0.003 contacts min-'. Contact rates were similar whether snorkelers were being guided or not. Protruding, branching and delicate reef invertebrates are more
susceptible to, and shallow depths increase the likelihood of, snorkeler damage.
Managing areas to reduce impacts by snorkelers requires either restricting access to
sites with breakable life forms and shallow areas of reef, or supervision in situ. Visitors should be told how to reduce their impacts and the consequences to marine life if they do not.
60
3.2 INTRODUCTION
Snorkeling is a popular and easy way to observe the underwater world. It can be
done by anyone with a mask and snorkel and basic swimming proficiency, unlike
scuba diving, which requires training and expensive equipment. Because of this,
snorkeler numbers probably far exceed diver numbers although statistics do not exist to prove this. The rising trend in activity based holidays (Goodhead & Johnson,
1996) and people's increased interest in the environment (Ceballos-Lascurdin, 1993),
mean that growing numbers of people go snorkeling every year. Snorkeling is concentrated in areas of warm, clear water with interesting
things to see, so it is no wonder that tropical coral reefs, which thrive in these
conditions and support a vast array of species have become favourite destinations for
snorkelers. An estimated 4 million people visit the Florida reefs annually (Florida
Keys National Marine Sanctuary, 2003) and approximately 1.6 million visitors travel
to or through the Great Barrier Reef Marine Park each year (Harriott, 2002). Reefs
are however, sensitive to human disturbance which has led to their decline worldwide (Spalding et al., 2001) and yet little is known of the effect of snorkelers.
Nearly 60% of the earth's coral reefs are threatened by human activity (Bryant
et al., 1998), the key forms of which include global warming (Wilkinson, 1998),
overfishing and destructive fishing practices, pollution and other activities associated
with coastal development (Pastorok & Bilyard, 1985; Guzman & Holst, 1993; Sladek
Nowlis et al., 1997; MacKinnon, 1998; Makoloweka, 1998; Nemeth & Nowlis, 2001)
and tourism (Beekhuis, 198 1; Visser & Njuguna, 1992; Price et al., 1998; Hall, 200 1;
Mills, 200 1). While reefs provide billions of people and hundreds of countries with food, tourism revenue, coastal production, and new medications (worth about US$375 billion) each year, they are among the least monitored and protected habitats
in the world (Bryant et al., 1998).
Research indicates that corals already under stress are less resilient to other
stresses. In St. Thomas, stress from sedimentation resulting from shoreline development may have led to the decline in living coral through a secondary effect of
61
bleaching (Nemeth & Nowlis, 2001). Bleached corals have also been found to have
lower coral tissue regeneration and increased mortality rates (Meesters & Bak, 1993).
Thus although snorkeling may seem a benign activity, it could be adding stress to
reefs and contributing to their decline. It is therefore important to find out what
effect snorkelers have on reefs but studies on snorkelers are few and have
concentrated on benthic studies rather than direct observation of snorkeler behaviour.
Reefs that are emergent and therefore in shallow water and exposed at low
tide are vulnerable to damage by people walking on them. In Australia, live coral
cover on reef flats decreased from 41 to 8% in just 18 experimental traverses
(Woodland & Hooper, 1977). Walkers also re-suspend sediment and this likely
causes additional stress to the reef (Neil, 1990). In the US Virgin islands, monitoring
of 50 marked corals at a shallow reef used by snorkelers over a7 month period
showed that only 10 out of 50 were left undisturbed (Rogers, 1988). Certain coral forms are also more susceptible to damage than others. Branching corals, for
example, are easily broken, and at intensively used snorkel sites in the Maldives
snorkelers were responsible for breaking 17% of them and damaging 7% of total
coral cover in one month (Allison, 1996). Despite their susceptibility to breakage,
certain species of branching coral grow faster than other forms such as the massive
corals. Impacts from divers therefore may cause a shift in reef community structure. This has been reported in the Caribbean island of Bonaire, where impacts from divers
in heavily dived areas are thought to have caused the loss of massive corals at the
expense of faster growing branching corals (Hawkins et al., 1999).
Qualitative observations in the Maldives report that snorkelers break corals as
they kick or stand on coral colonies (Allison, 1996) and that wave motion and
snorkelers joining already standing snorkelers amplify this damage. Allison also
noted that snorkelers who appeared ill-at-ease broke corals more often than
competent snorkelers. He quantified snorkeler damage by measuring recently broken
corals along transects and compared this with spatial distribution of snorkeling
activity and found a close correlation between breakage and intensity of snorkeling
62
activity. However, to quantify whether physical damage to coral reefs is due to
anchors, boat groundings, swells, careless snorkelers or other causes is difficult
(Tilmant & Schmahl, 1981; Rogers, 1988), and the only method that ensures correct
attribution to damage is to use direct observations. I have not found any studies on
snorkeler behaviour that used direct observation despite its importance.
Observations of divers report a link between the beginning of a dive, being
male and camera use with increased levels of scuba diver damage (Roberts &
Harriott, 1994; Prior et al., 1995; Harriott et al., 1997; Medio et al., 1997; Rouphael
& Inglis, 1995,200 1; Zakai & Chadwick-Furman, 2002). What is not known is
whether these same trends apply to snorkelers. Damage to the reef by divers has been
reduced by giving divers a briefing (Medio et al., 1997), however my studies on divers found that if the briefing was given by non-scientifically trained local staff (in
comparison to Medio's study) it had no such effect (Chapter 2). 1 found that dive
leaders had to intervene with divers who were damaging the reef in order to reduce diver damage. Many companies organising snorkel trips give their guests a briefing
but we do not know of its effect on their behaviour. Also, snorkelers, unlike divers,
are not constrained by dive tables and can therefore spend longer and go more often in the water. This increases the potential for cumulative impact above that of divers
if their behaviour is as damaging to reefs as that of divers. The extent of snorkeler impact to reefs therefore needs to be measured to understand the scale of the problem
and if snorkelers are damaging reefs, ways must be found to reduce this.
I used direct observation to study snorkelers using coral reefs in the eastern
Caribbean island of St. Lucia. I aimed to determine what factors influenced their behaviour and interaction with the reef. I compared (1) supervised versus independent trips, (2) use of a life vest versus none, and (3) education in the form of a briefing given by local staff warning snorkelers to avoid touching or kicking any
corals, versus a briefing without the warning. In light of my findings, I consider the implications of expected increases in
snorkeler numbers using reefs worldwide and suggest ways to manage this activity.
63
3.3 METHODS
I observed 180 snorkelers (89 men, 91 women) in St. Lucia at six sites (Fig. 3.1 Anse
Cochon, n=6; Grand Caille, n=6; Jalousie, n=50; Trou Diable, n=17; Anse Chastanet,
n=67 and Jalousie-Hilton, n=34) and interviewed 169 of them, over a period of 14
weeks, between June and October 2001. These included snorkelers on guided
organised trips that were taken by boat from Anse Chastanet resort beach to one of
six sites (Fig. 3.1) and people snorkelling independently from shore. Iobservedthe
latter from two beaches located at Anse Chastanet and Jalousie-Hilton resorts (Fig. 3.1). Snorkelers at both sites entered the water closest to a roped-off area of
reef. I positioned myself at those entry points so as to be able to start my
observations as soon as a snorkeler entered the water. Immediately after snorkelers
exited the water I approached them and asked if they would allow me to interview
them. The interview data used here is limited to snorkeler experience (whether it was their first time snorkeling), whether they were members of an environmental group
and/or whether they read articles on marine life. Other interview data was used in
Chapters 4 and 5. Those not interviewed were refusals, children or unable to
understand the questionnaire. Once I had finished my interview I would observe the
next snorkeler that approached the snorkel site. At each snorkel site, prior to my observations, I took underwater visibility and
current readings using the methods described in Chapter 2, and throughout my
observations, made notes on fish. Collecting these data gave me credibility if asked
what I was doing and minimised any effect of my presence on the behaviour of
snorkelers.
64
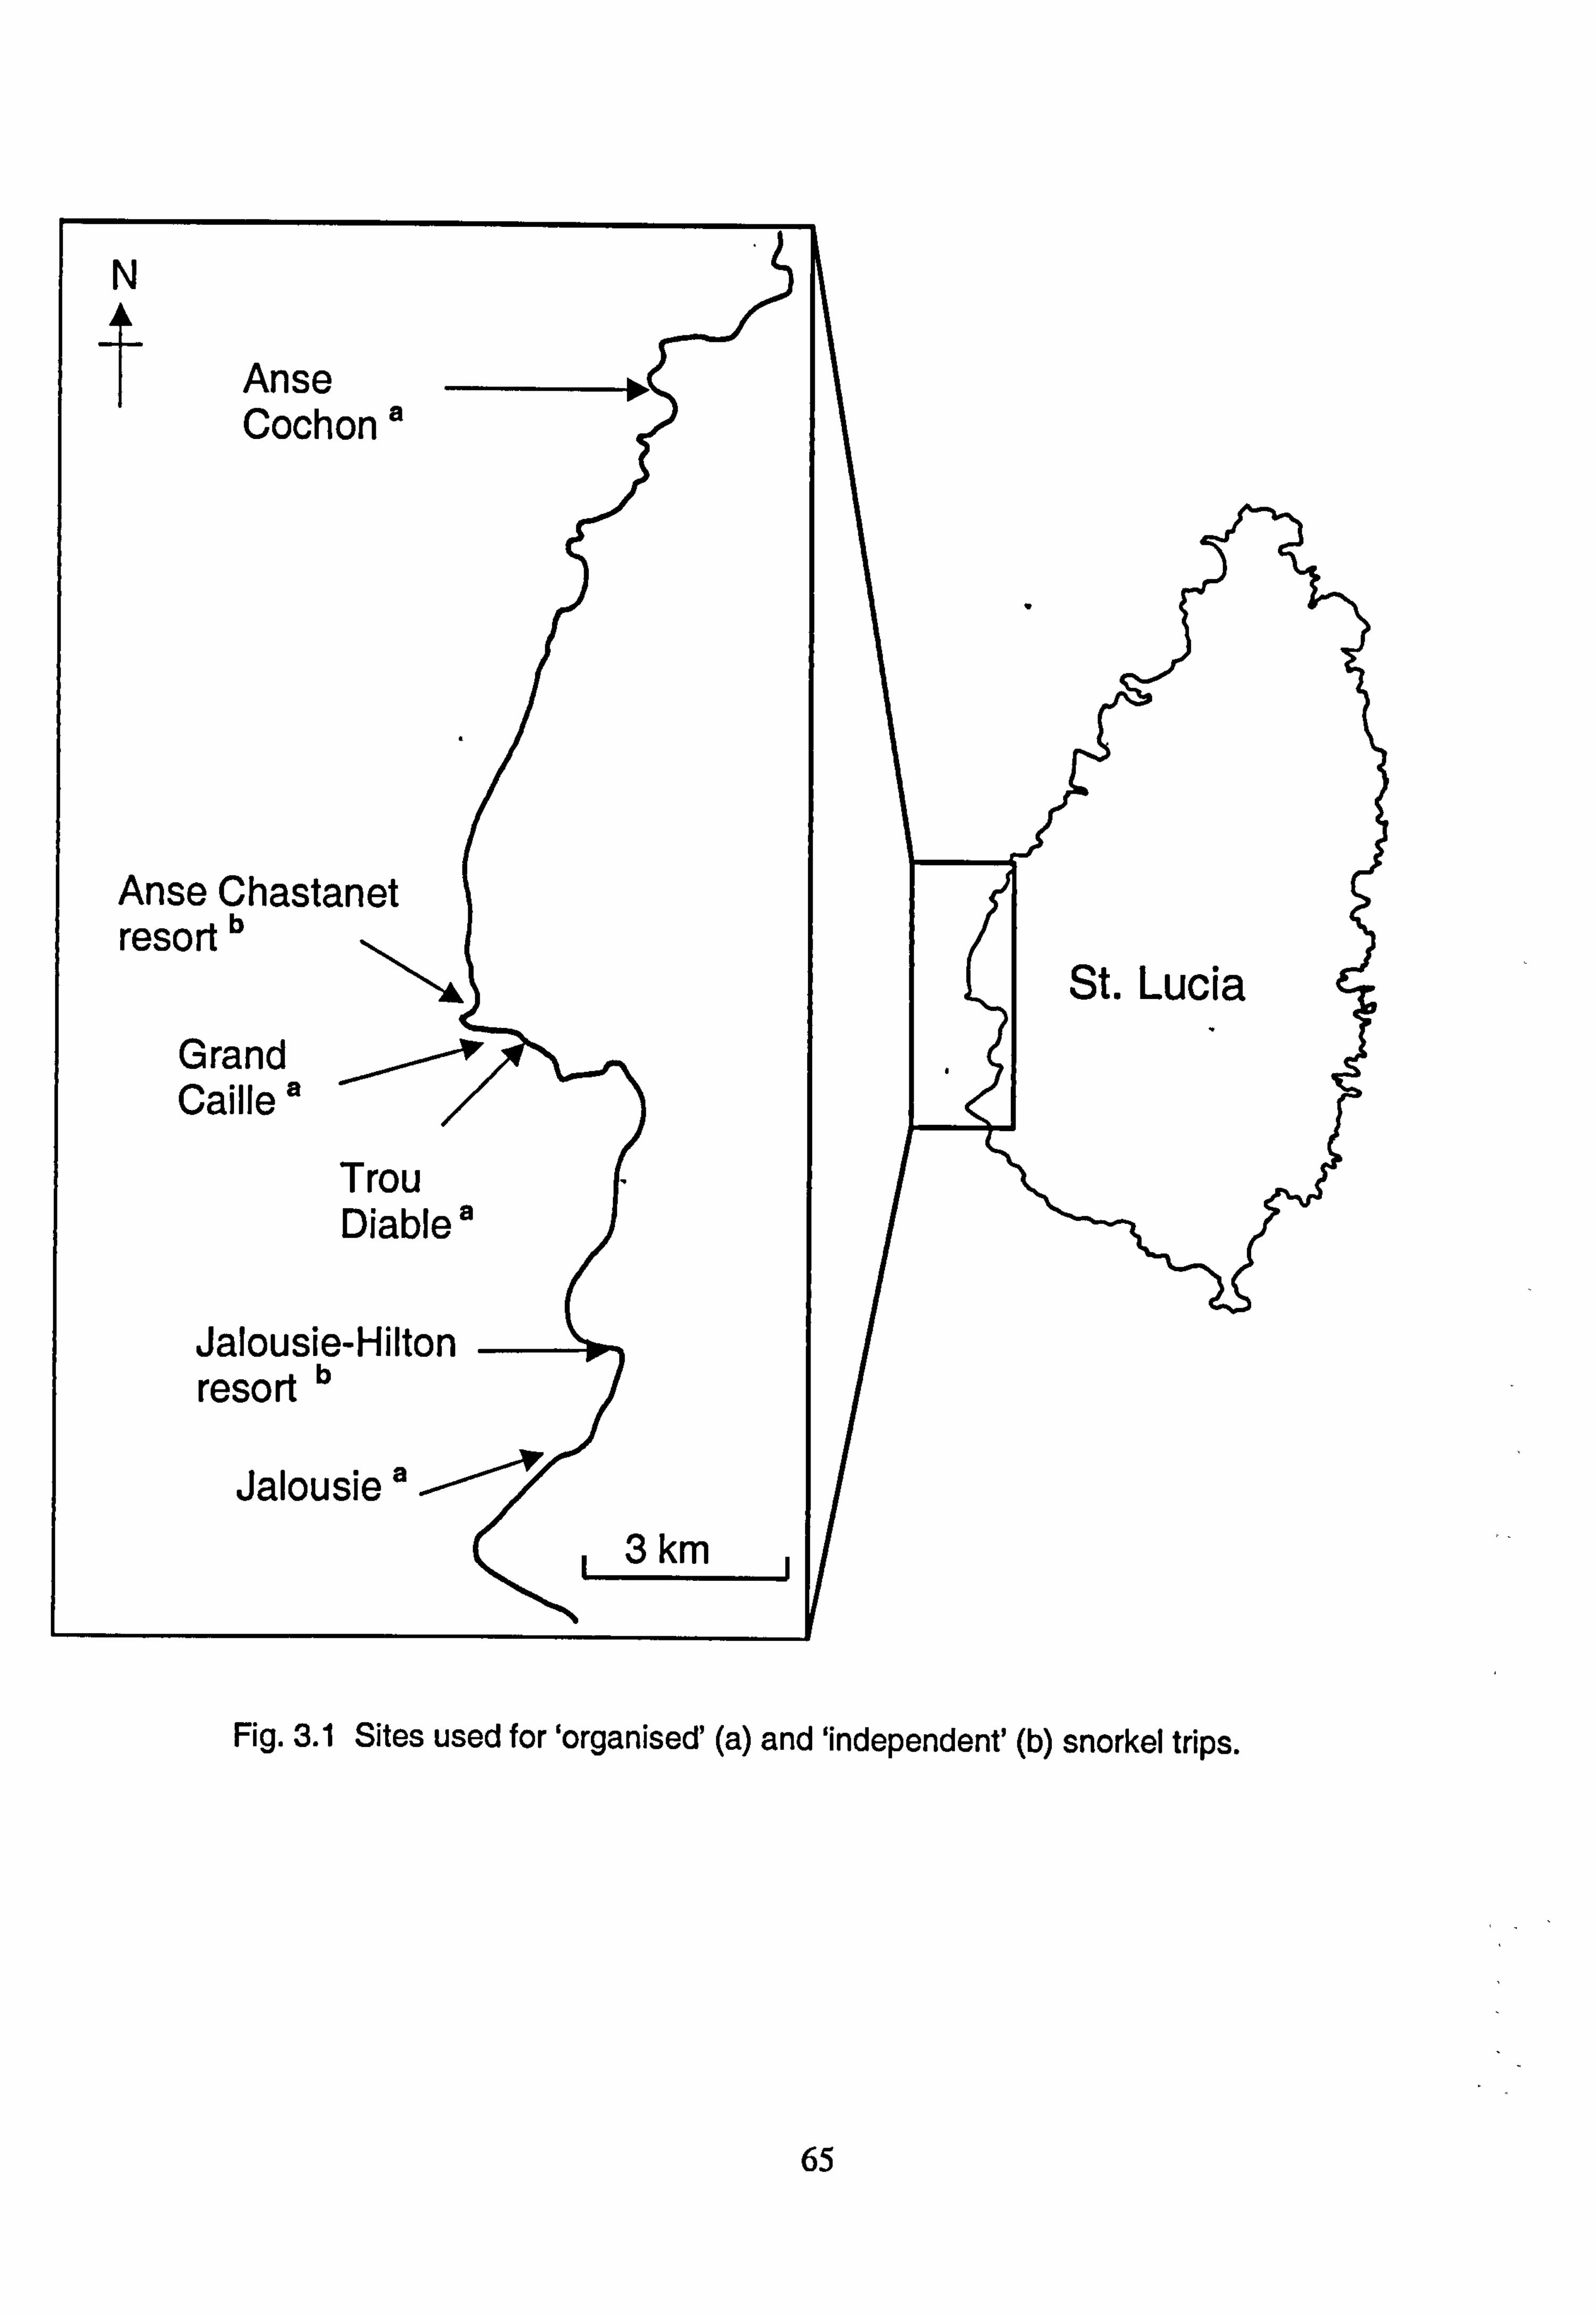
Fig. 3.1 Sites used for 'organised' (a) and 'independent' (b) snorkel trips.
65
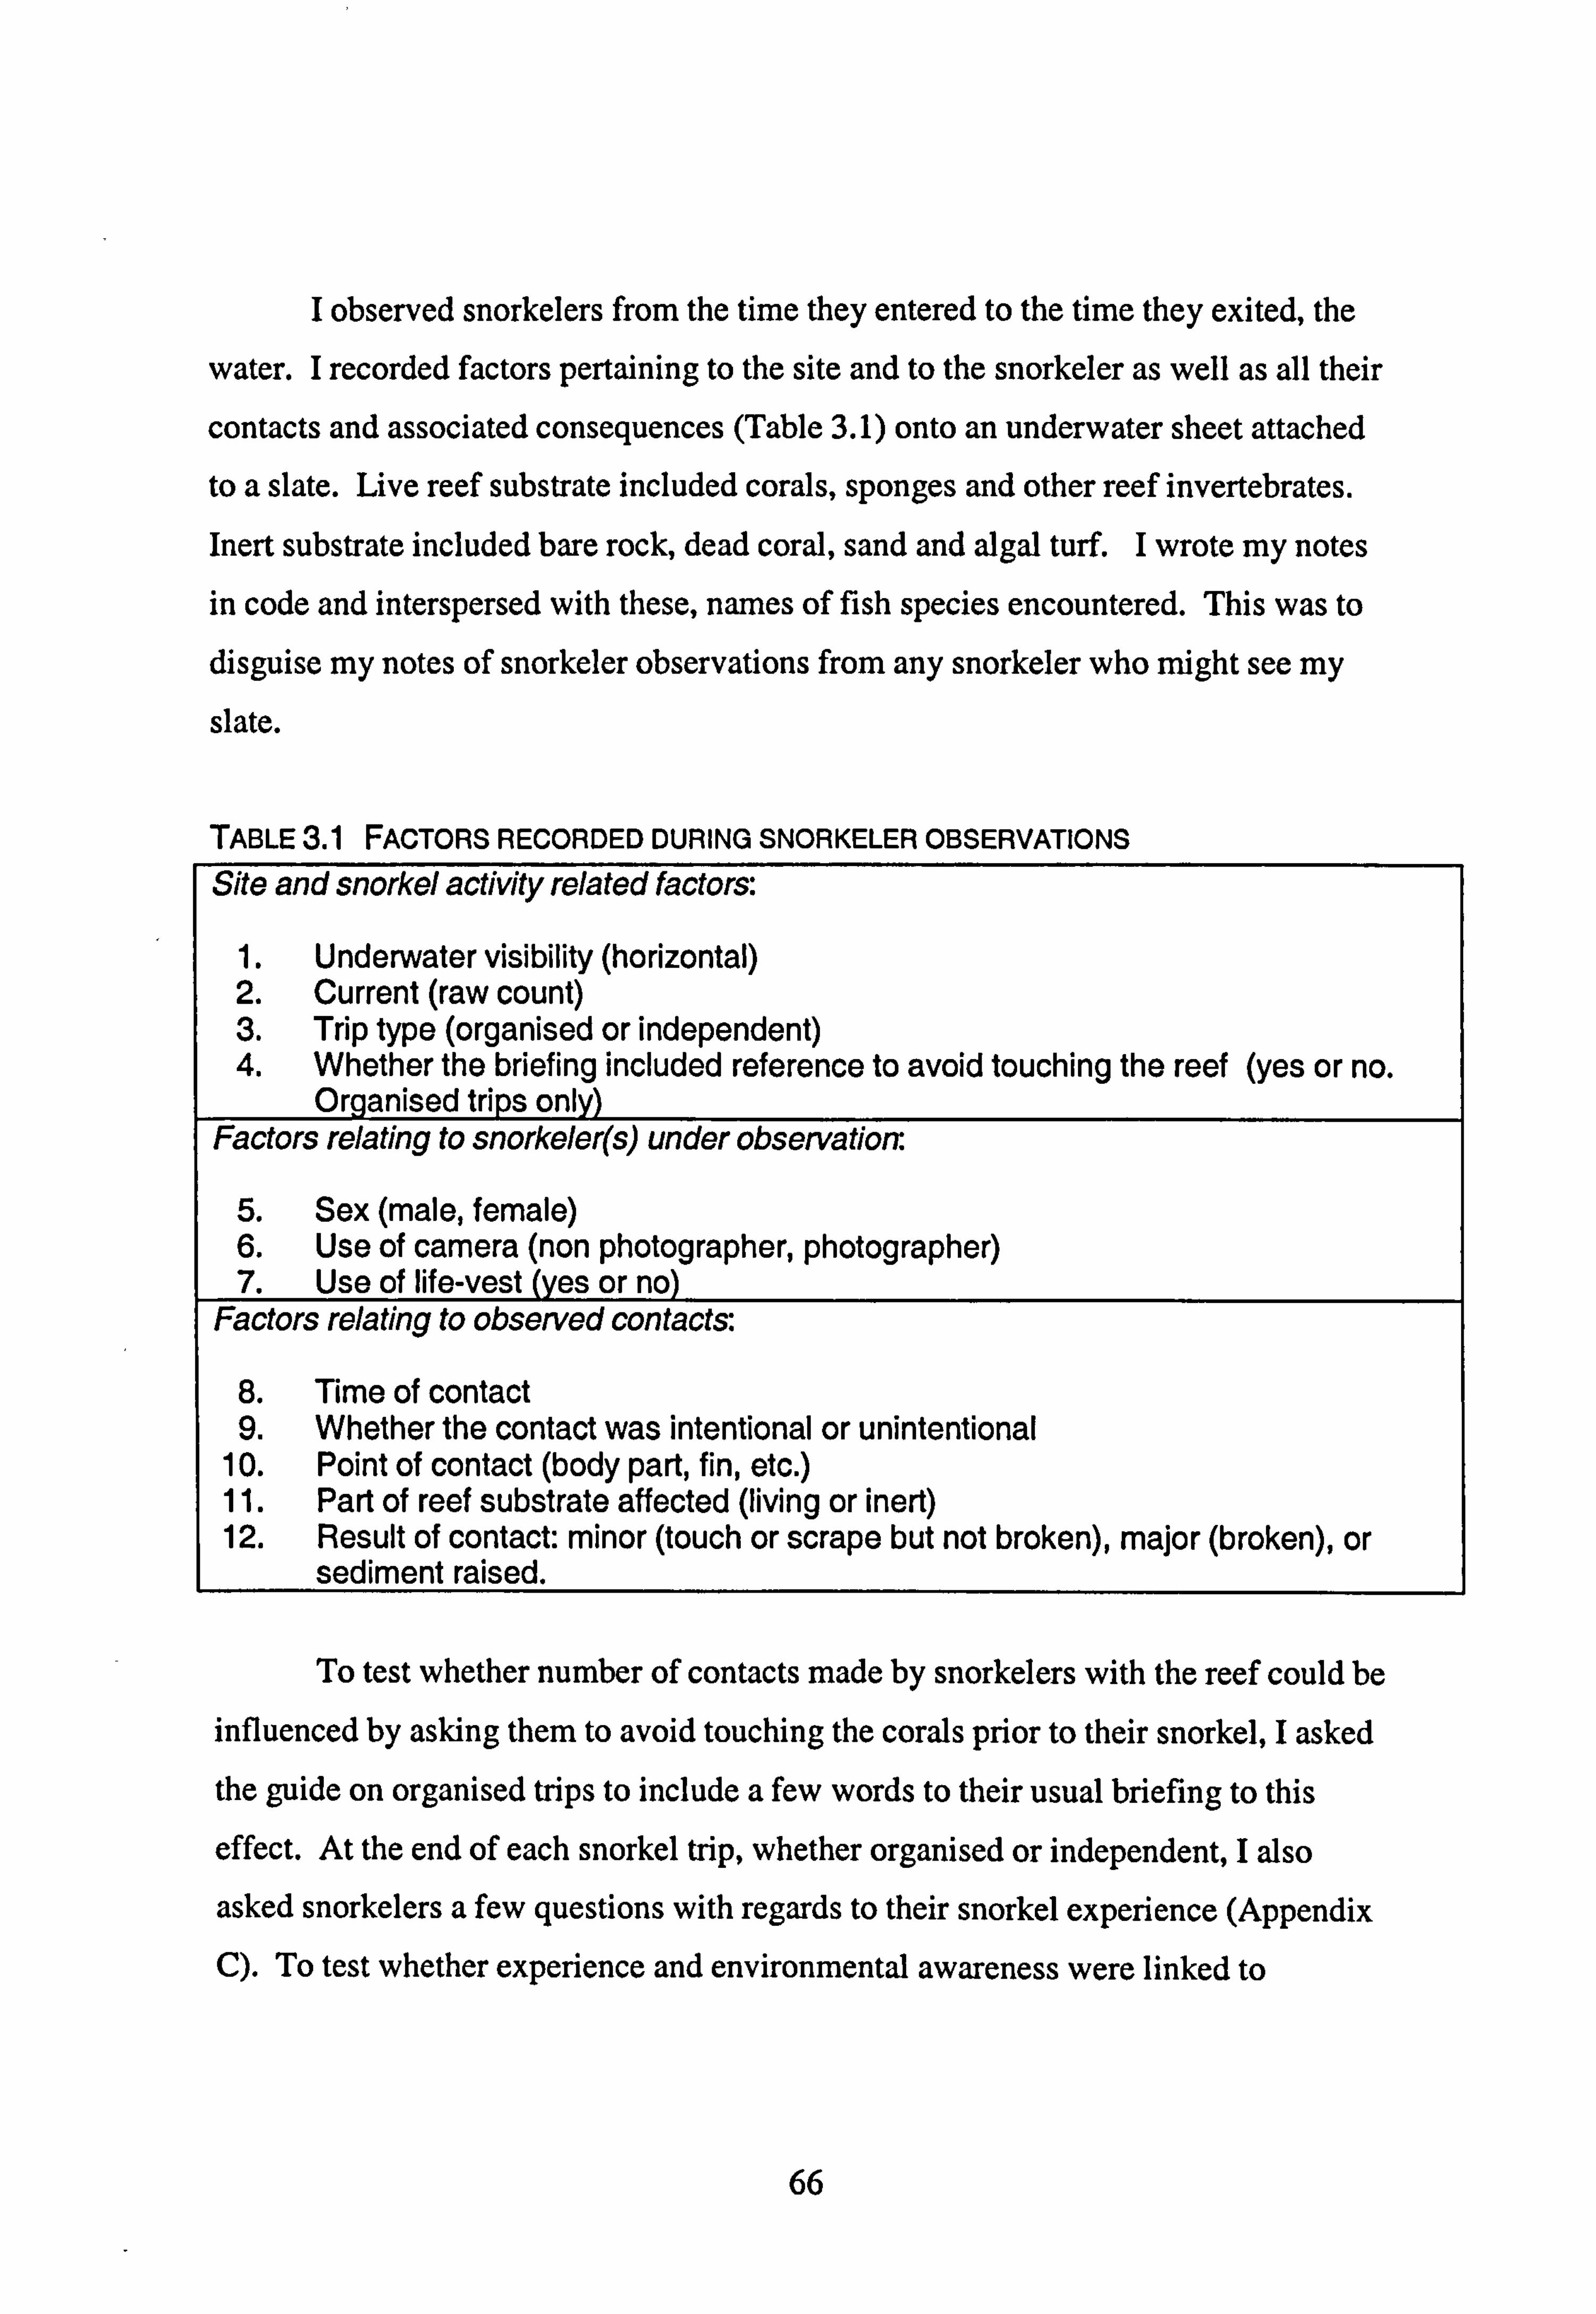
I observed snorkelers from the time they entered to the time they exited, the
water. I recorded factors pertaining to the site and to the snorkeler as well as all their
contacts and associated consequences (Table 3.1) onto an underwater sheet attached to a slate. Live reef substrate included corals, sponges and other reef invertebrates.
Inert substrate included bare rock, dead coral, sand and algal turf. I wrote my notes in code and interspersed with these, names of fish species encountered. This was to disguise my notes of snorkeler observations from any snorkeler who might see my
slate.
TABLE 3.1 FACTORS RECORDED DURING SNORKELER OBSERVATIONS
and snorkel activity related factors:
1. Underwater visibility (horizontal) 2. Current (raw count) 3. Trip type (organised or independent) 4. Whether the briefing included reference to avoid touching the reef (yes or no.
Orqanised trips onlv) to snorkeler(s) under observation:
5. Sex (male, female) 6. Use of camera (non photographer, photographer) 7. Use of life-vest (yes or no) actors relatina to observed contacts:
B. Time of contact 9. Whether the contact was intentional or unintentional
10. Point of contact (body part, fin, etc. ) 11. Part of reef substrate affected (living or inert) 12. Result of contact: minor (touch or scrape but not broken), major (broken), or
sediment raised.
To test whether number of contacts made by snorkelers with the reef could be
influenced by asking them to avoid touching the corals prior to their snorkel, I asked the guide on organised trips to include a few words to their usual briefing to this
effect. At the end of each snorkel trip, whether organised or independent, I also
asked snorkelers a few questions with regards to their snorkel experience (Appendix
To test whether experience and environmental awareness were linked to
66
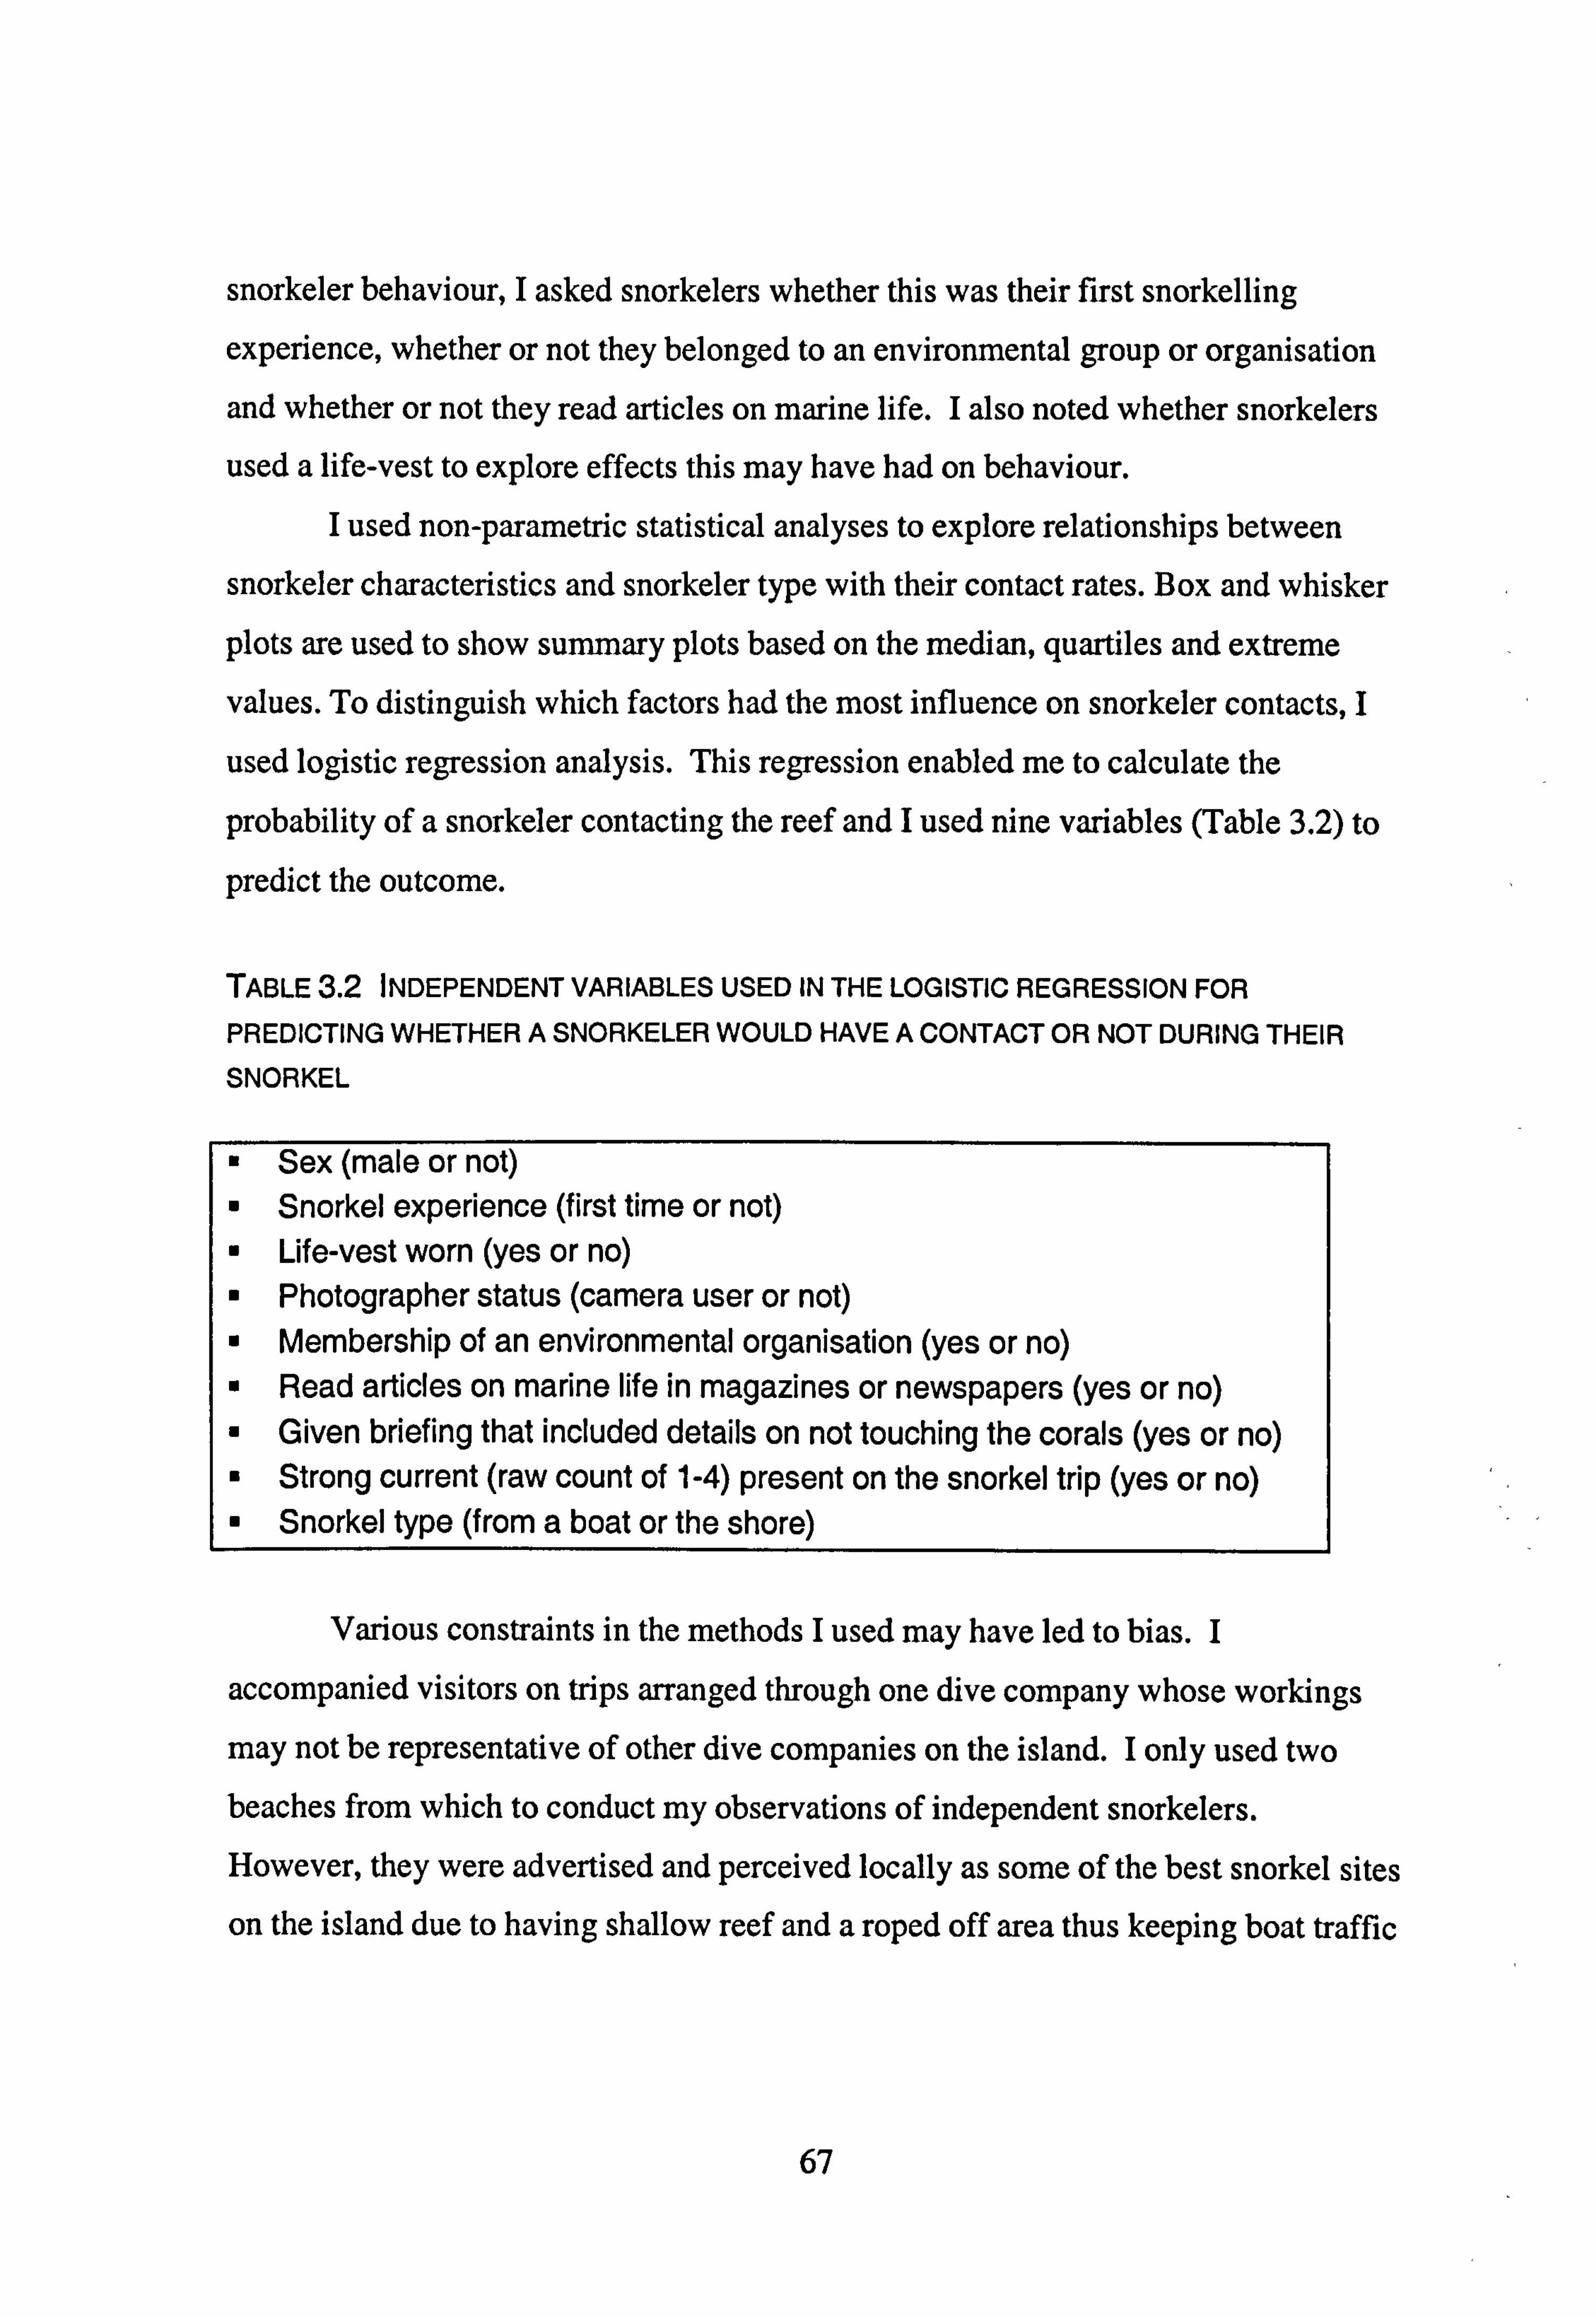
snorkeler behaviour, I asked snorkelers whether this was their first snorkelling
experience, whether or not they belonged to an environmental group or organisation
and whether or not they read articles on marine life. I also noted whether snorkelers
used a life-vest to explore effects this may have had on behaviour. I used non-parametric statistical analyses to explore relationships between
snorkeler characteristics and snorkeler type with their contact rates. Box and whisker
plots are used to show summary plots based on the median, quartiles and extreme
values. To distinguish which factors had the most influence on snorkeler contacts, I
used logistic regression analysis. This regression enabled me to calculate the
probability of a snorkeler contacting the reef and I used nine variables (Table 3.2) to
predict the outcome.
TABLE3.2 INDEPENDENT VARIABLES USED IN THE LOGISTIC REGRESSION FOR
PREDICTING WHETHER A SNORKELER WOULD HAVE A CONTACT OR NOT DURING THEIR
SNORKEL
Sex (male or not) Snorkel experience (first time or not) Life-vest worn (yes or no)
" Photographer status (camera user or not) " Membership of an environmental organisation (yes or no) " Read articles on marine life in magazines or newspapers (yes or no) " Given briefing that included details on not touching the corals (yes or no) " Strong current (raw count of 1-4) present on the snorkel trip (yes or no) " Snorkel type (from a boat or the shore)
Various constraints in the methods I used may have led to bias. I
accompanied visitors on trips arranged through one dive company whose workings
may not be representative of other dive companies on the island. I only used two
beaches from which to conduct my observations of independent snorkelers. However, they were advertised and perceived locally as some of the best snorkel sites
on the island due to having shallow reef and a roped off area thus keeping boat traffic
67
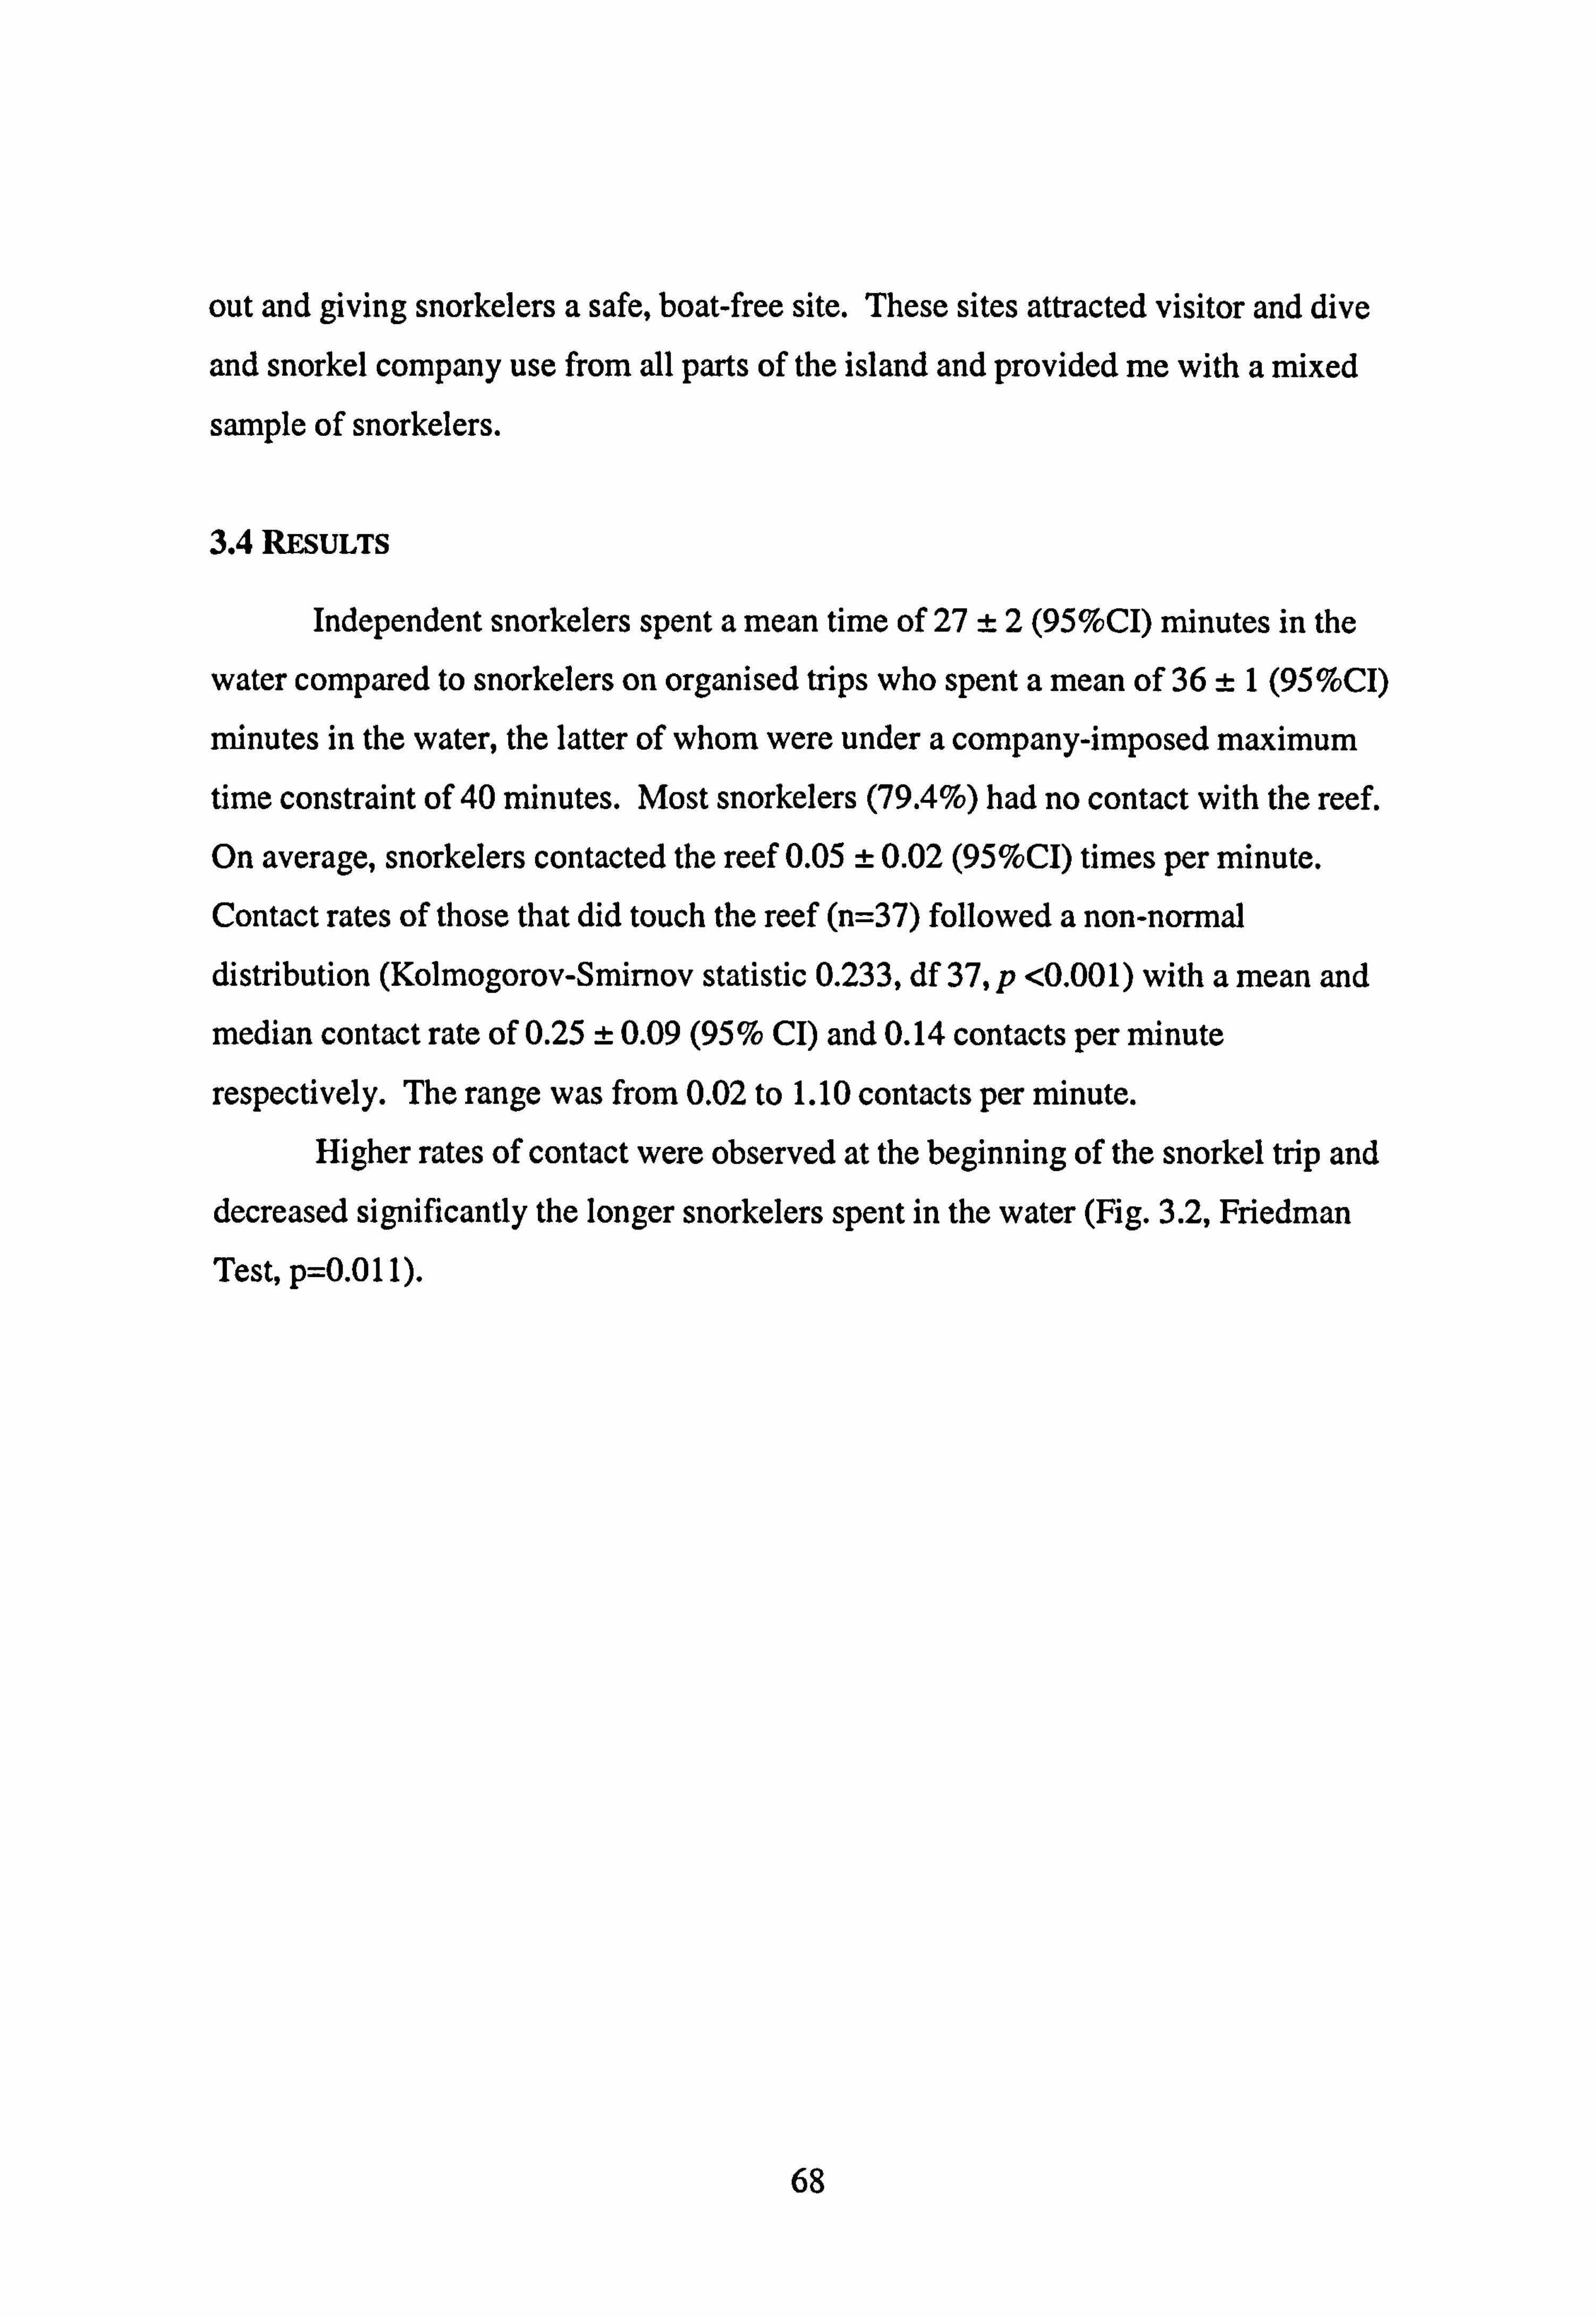
out and giving snorkelers a safe, boat-free site. These sites attracted visitor and dive
and snorkel company use from all parts of the island and provided me with a mixed
sample of snorkelers.
3.4 RiEsuLTs
Independent snorkelers spent a mean time of 27 ±2 (95%CI) minutes in the
water compared to snorkelers on organised trips who spent a mean of 36 ±1 (95%CI)
minutes in the water, the latter of whom were under a company-imposed maximum
time constraint of 40 minutes. Most snorkelers (79.4%) had no contact with the reef. On average, snorkelers contacted the reef 0.05 ± 0.02 (95%CI) times per minute. Contact rates of those that did touch the reef (n=37) followed a non-normal distribution (Kolmogorov-Smimov statistic 0.233, df 37, p <0.001) with a mean and
median contact rate of 0.25 ± 0.09 (95 % CI) and 0.14 contacts per minute
respectively. The range was from 0.02 to 1.10 contacts per minute. Higher rates of contact were observed at the beginning of the snorkel trip and
decreased significantly the longer snorkelers spent in the water (Fig. 3.2, Friedman
Test, P=0.01 1).
68
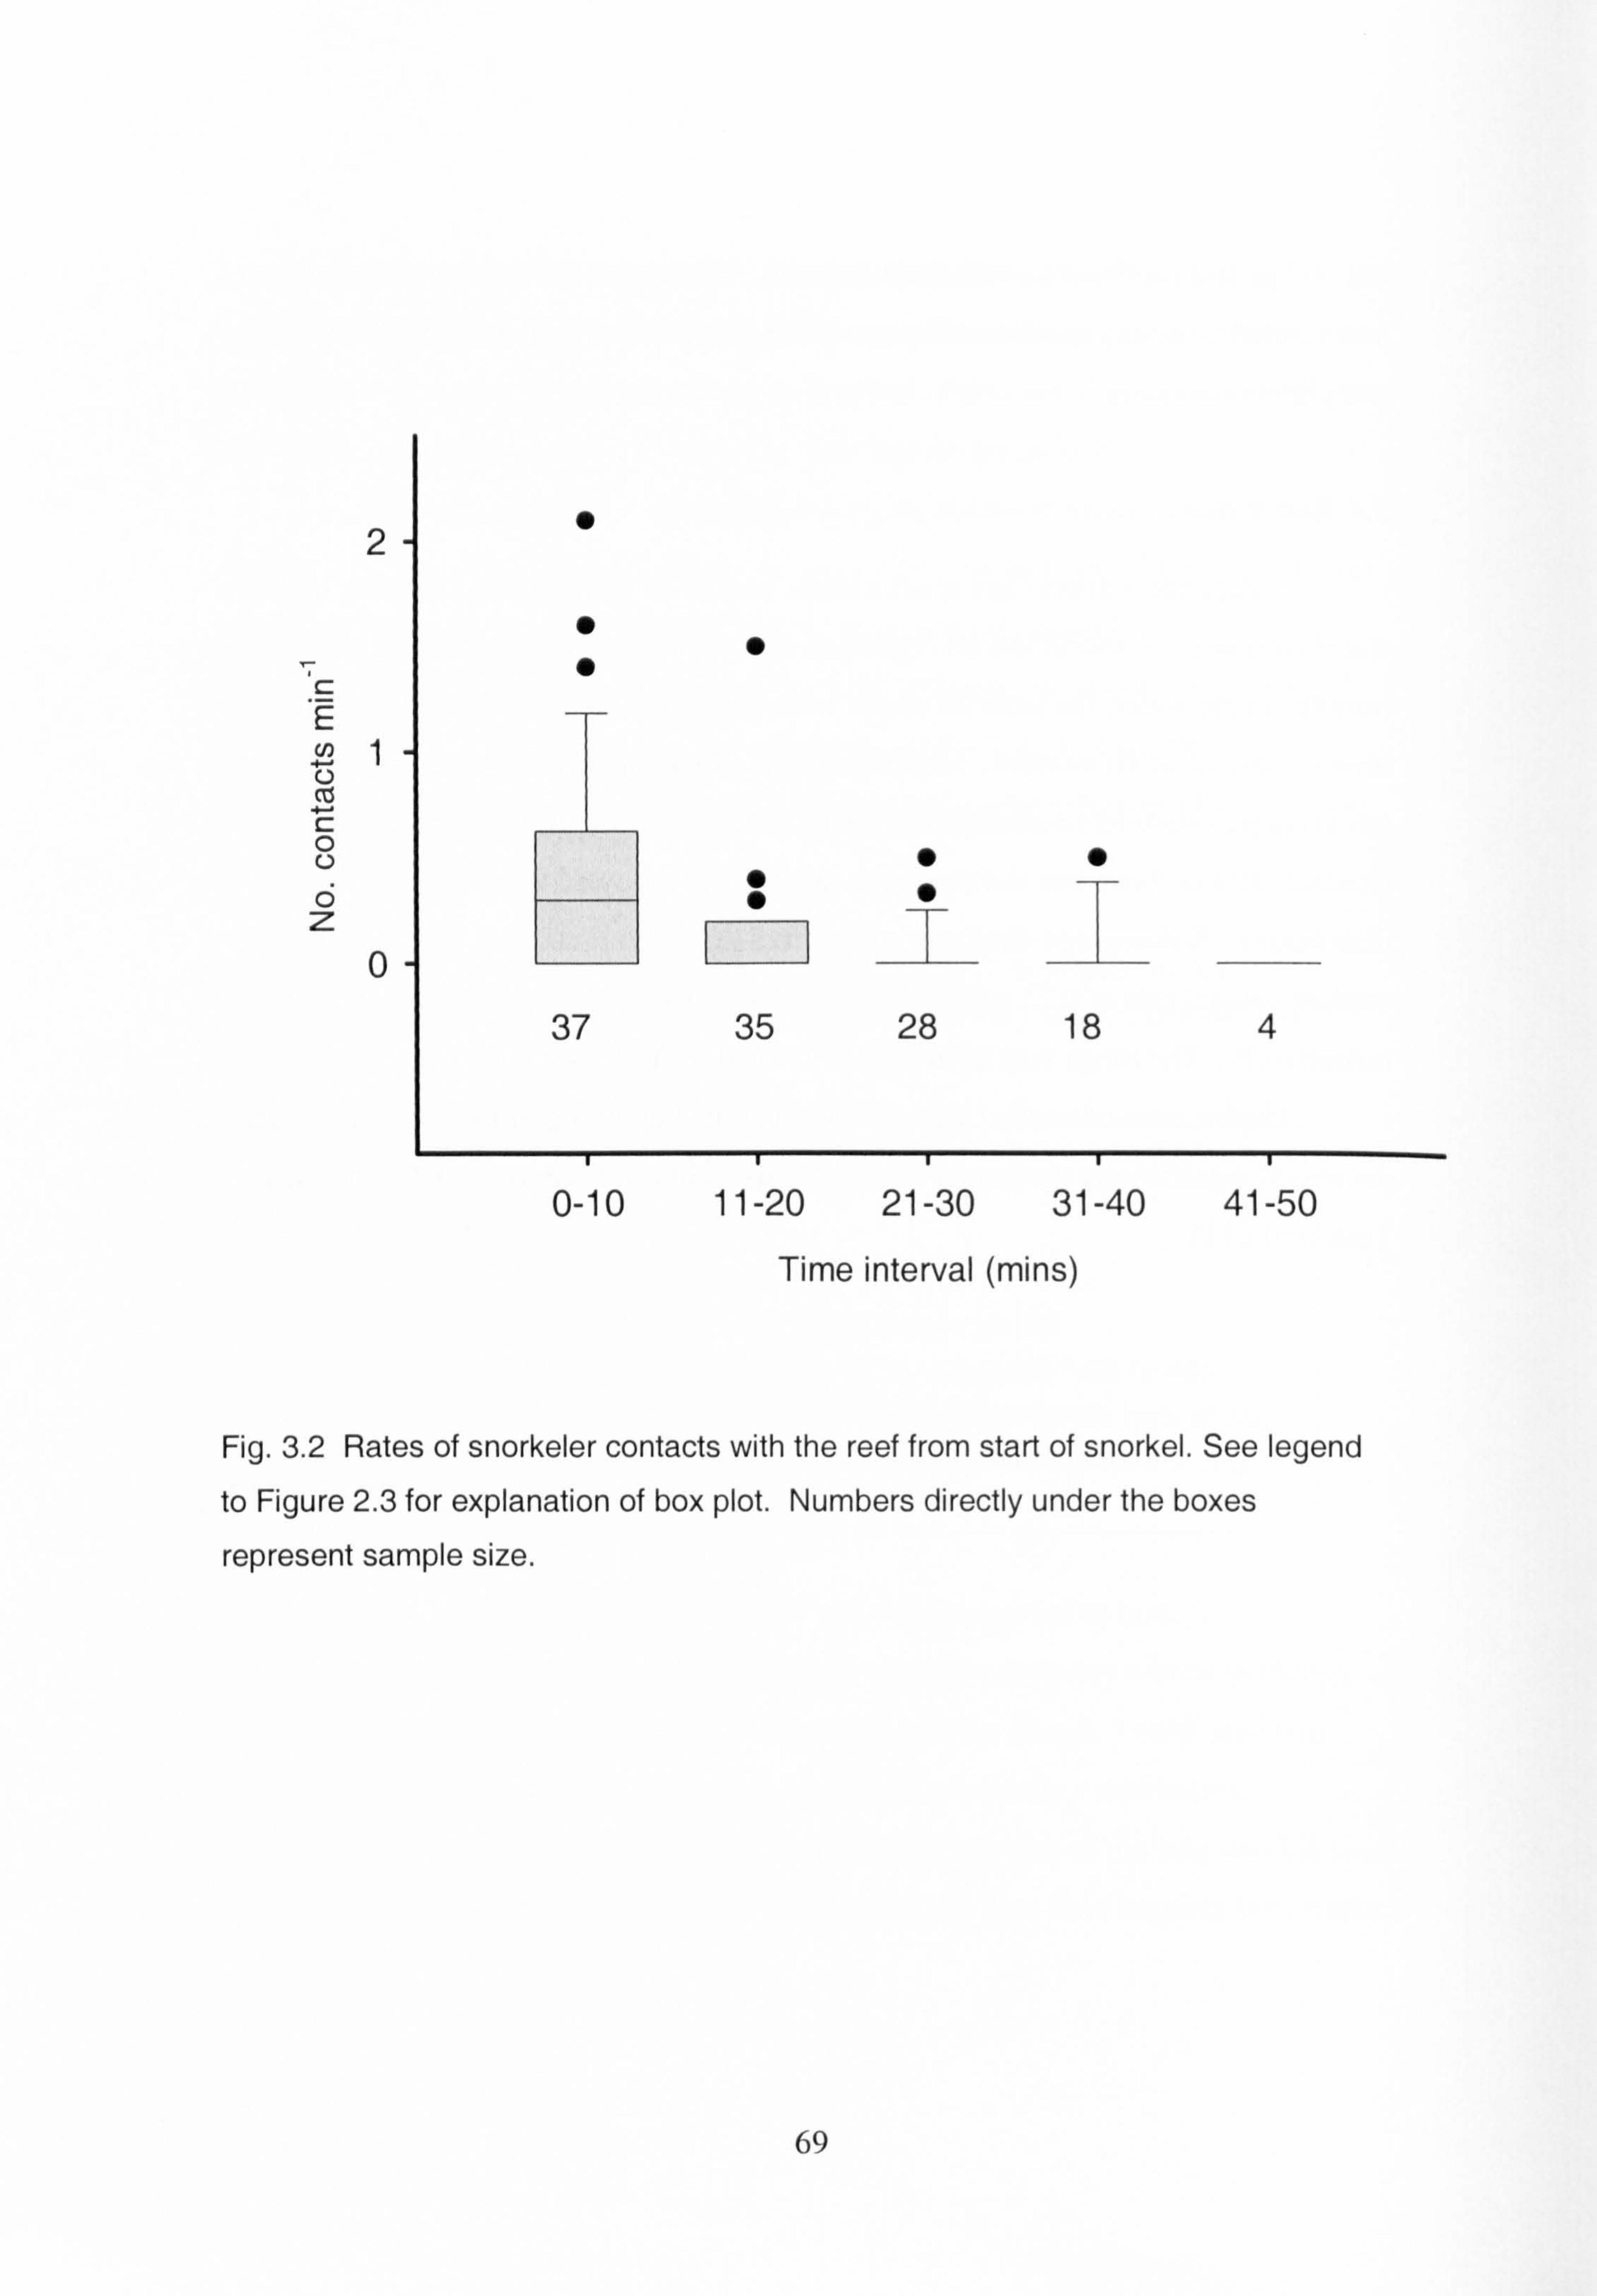
2
C:
E
C. ) cz 0 0 0 z
0
Time interval (mins)
Fig. 3.2 Rates of snorkeler contacts with the reef from start of snorkel. See legend
to Figure 2.3 for explanation of box plot. Numbers directly under the boxes
represent sample size.
69
0-10 11-20 21-30 31-40 41-50
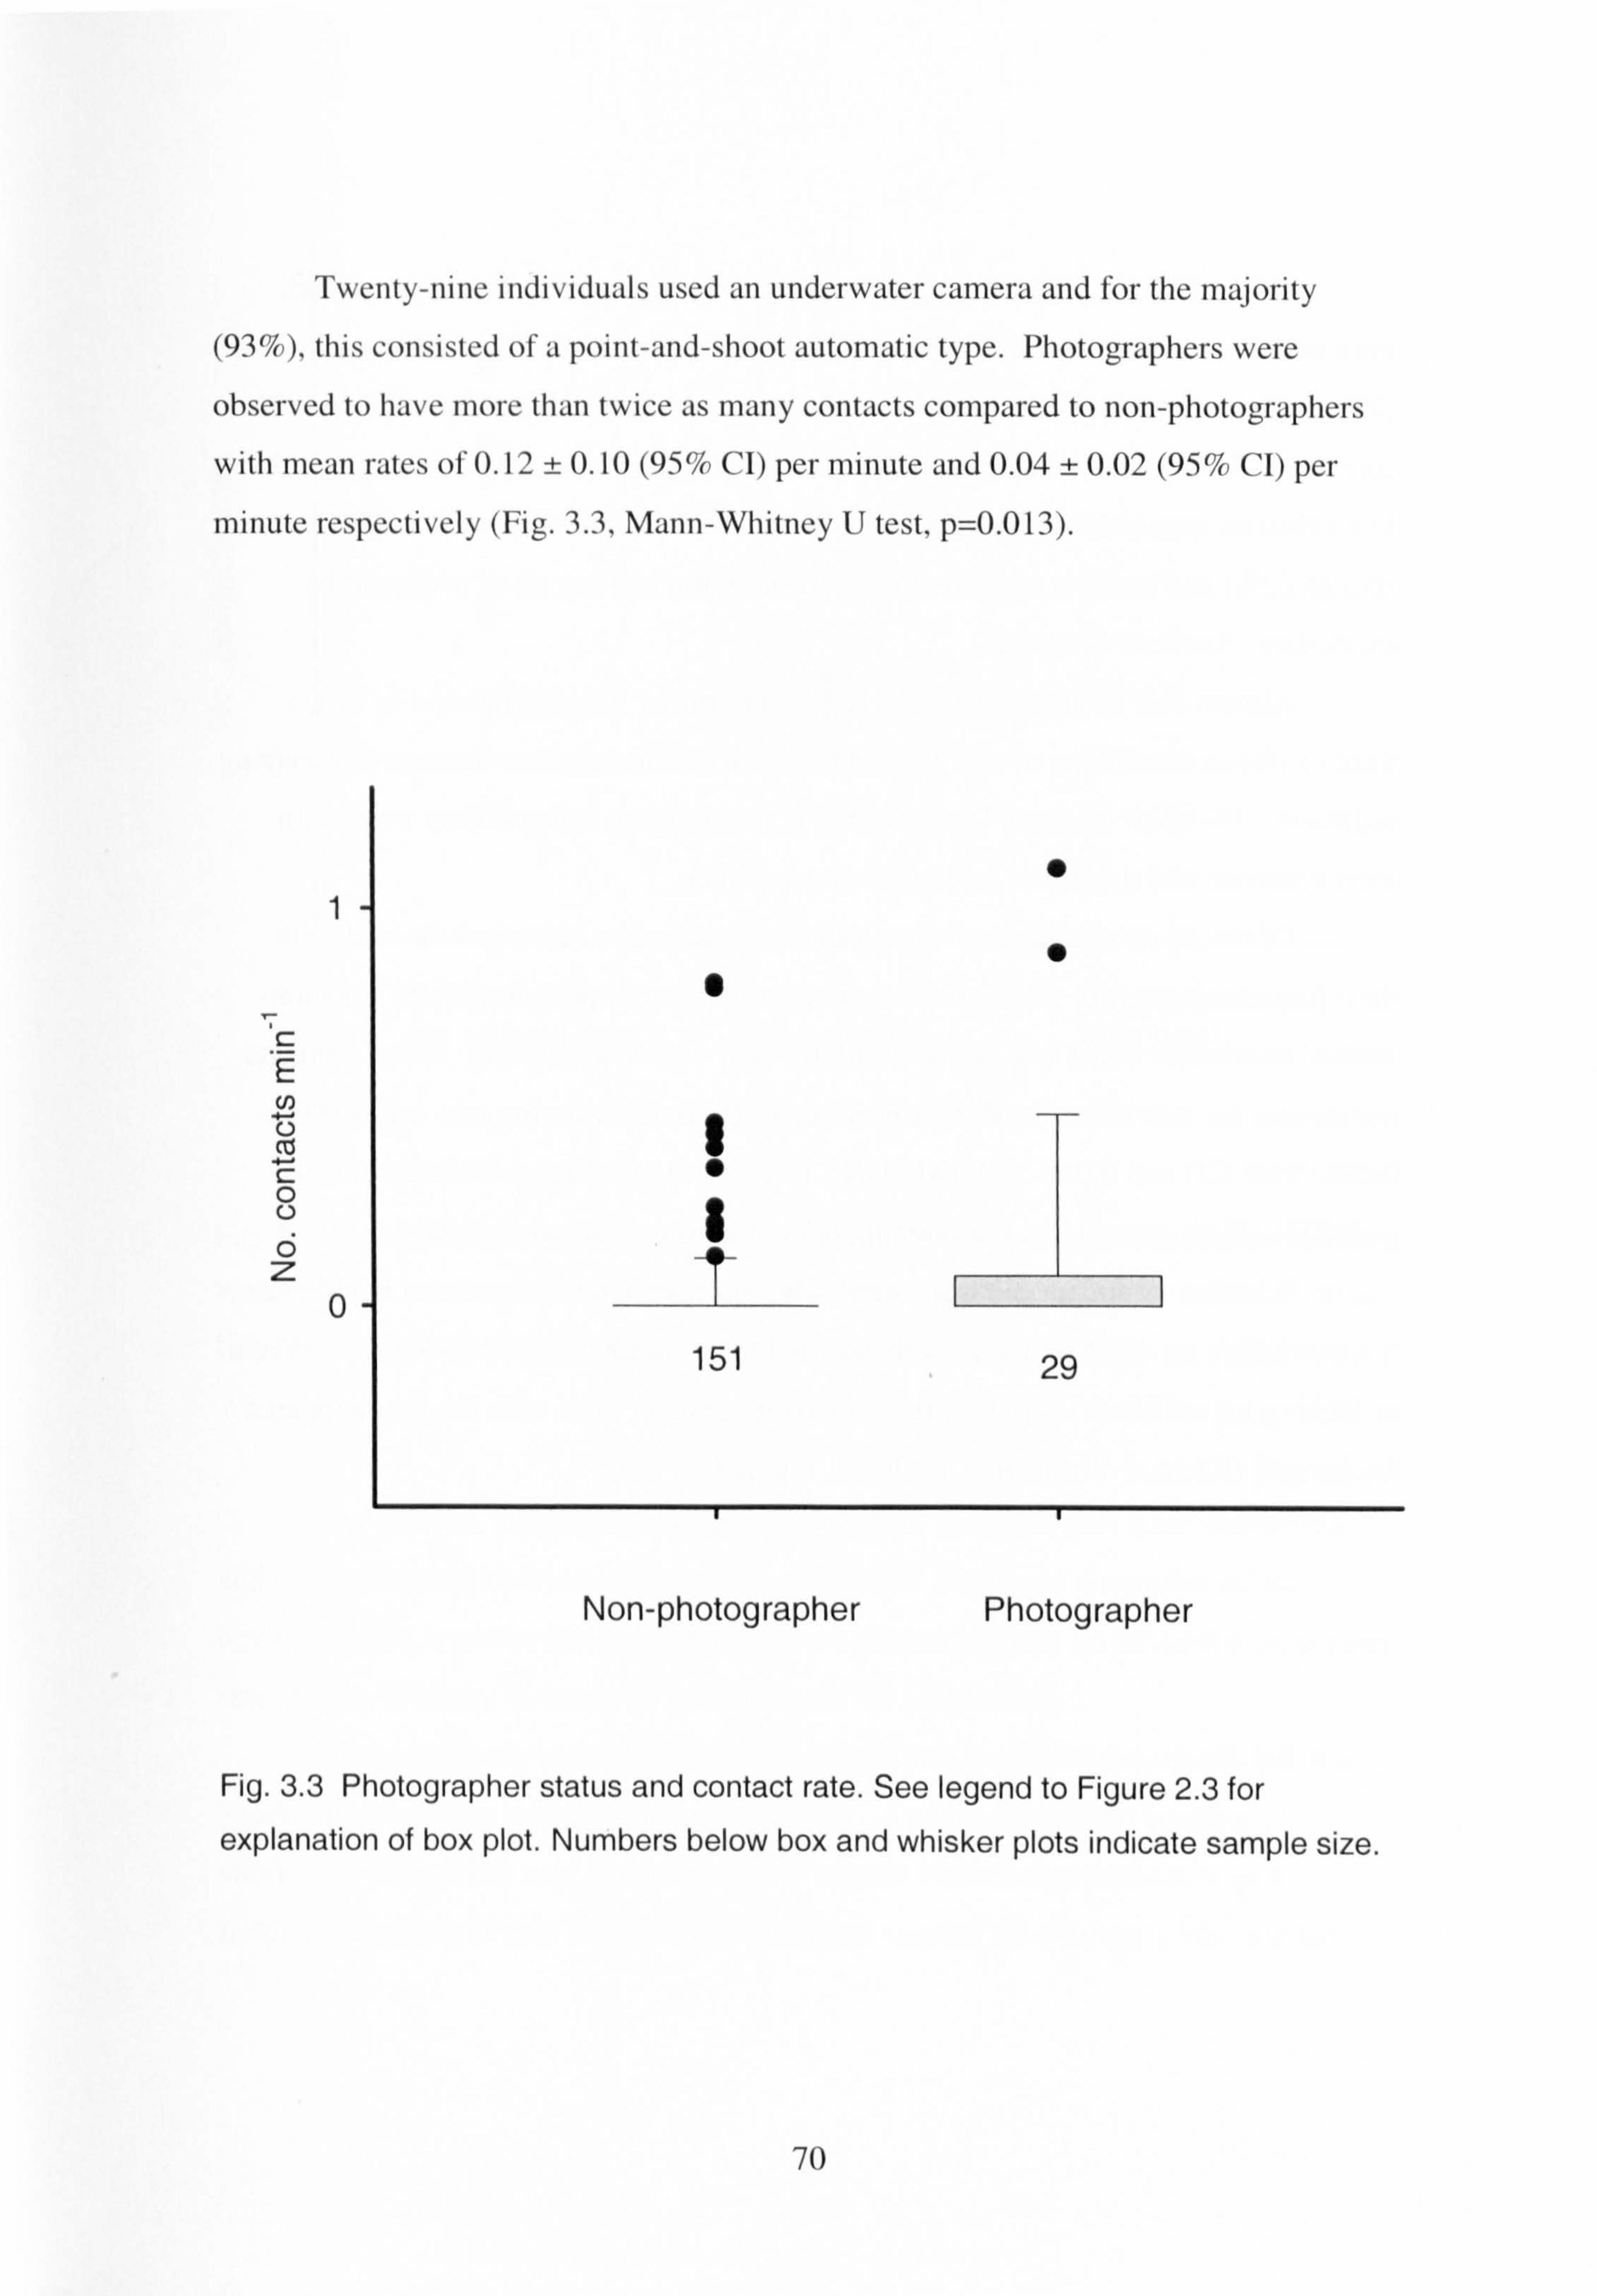
Fwenty-nine individuals used an underwater camera and for the majority (93%), this consisted of a point-and-shoot automatic type. Photographers were
observed to have more than twice as many contacts compared to ri on-photograp hers
with mean rates ol'O. 12 ± 0.10 (95% CI) per minute and 0.04 ± 0.02 (95% CI) per
minute respectively (Fig. 3.3, Mann-Whitney U test, p=0.013).
c E U)
cz
c 0
0 z
0
Non-photographer Photographer
Fig. 3.3 Photographer status and contact rate. See legend to Figure 2.3 for
explanation of box plot. Numbers below box and whisker plots indicate sample size.
70
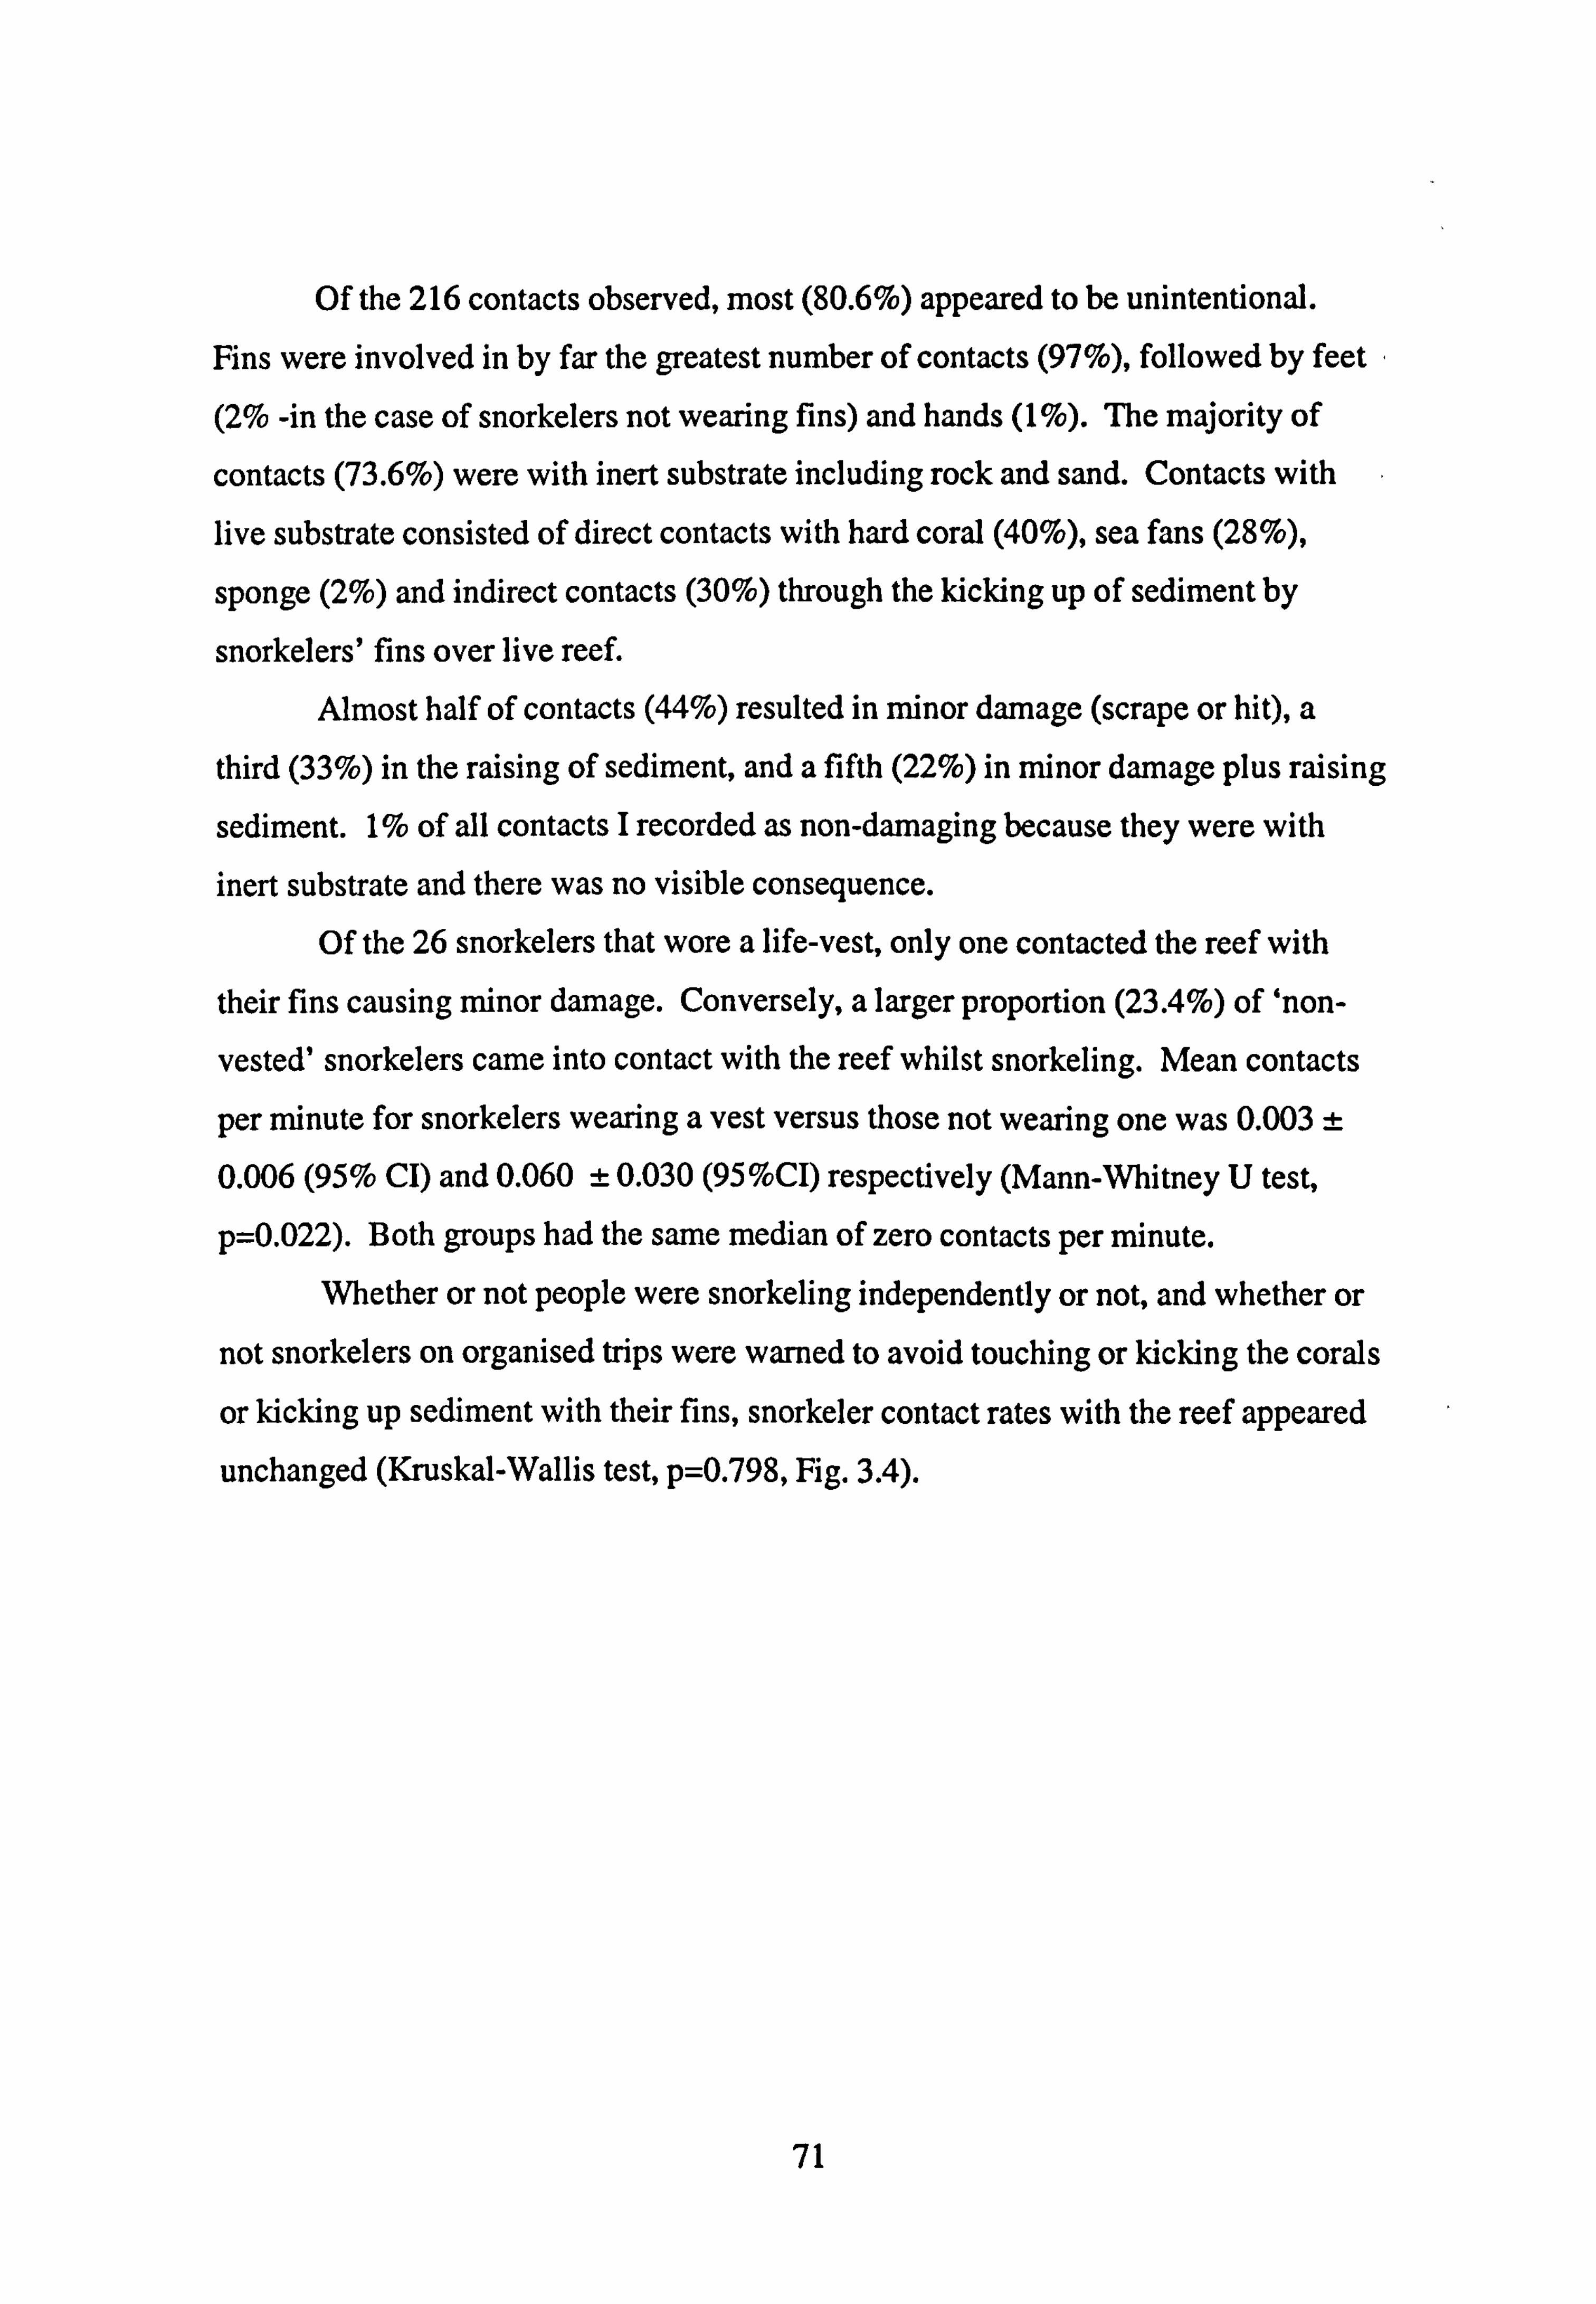
Of the 216 contacts observed, most (80.6%) appeared to be unintentional. Fins were involved in by far the greatest number of contacts (97%), followed by feet
(2% -in the case of snorkelers not wearing fins) and hands (1%). The majority of
contacts (73.6%) were with inert substrate including rock and sand. Contacts with live substrate consisted of direct contacts with hard coral (40%), sea fans (28%),
sponge (2%) and indirect contacts (30%) through the kicking up of sediment by
snorkelers' fins over live reef. Almost half of contacts (44%) resulted in minor damage (scrape or hit), a
third (33%) in the raising of sediment, and a fifth (22%) in minor damage plus raising
sediment. 1% of all contacts I recorded as non-damaging because they were with inert substrate and there was no visible consequence.
Of the 26 snorkelers that wore a life-vest, only one contacted the reef with
their fins causing minor damage. Conversely, a larger proportion (23.4%) of 'non-
vested' snorkelers came into contact with the reef whilst snorkeling. Mean contacts
per minute for snorkelers wearing a vest versus those not wearing one was 0.003 :t 0.006 (95% CI) and 0.060 ± 0.030 (95%CI) respectively (Mann-Whitney U test,
p=0.022). Both groups had the same median of zero contacts per minute.
Whether or not people were snorkeling independently or not, and whether or
not snorkelers on organised trips were warned to avoid touching or kicking the corals
or kicking up sediment with their fins, snorkeler contact rates with the reef appeared
unchanged (Kruskal-Wallis test, p=0.798, Fig. 3.4).
71
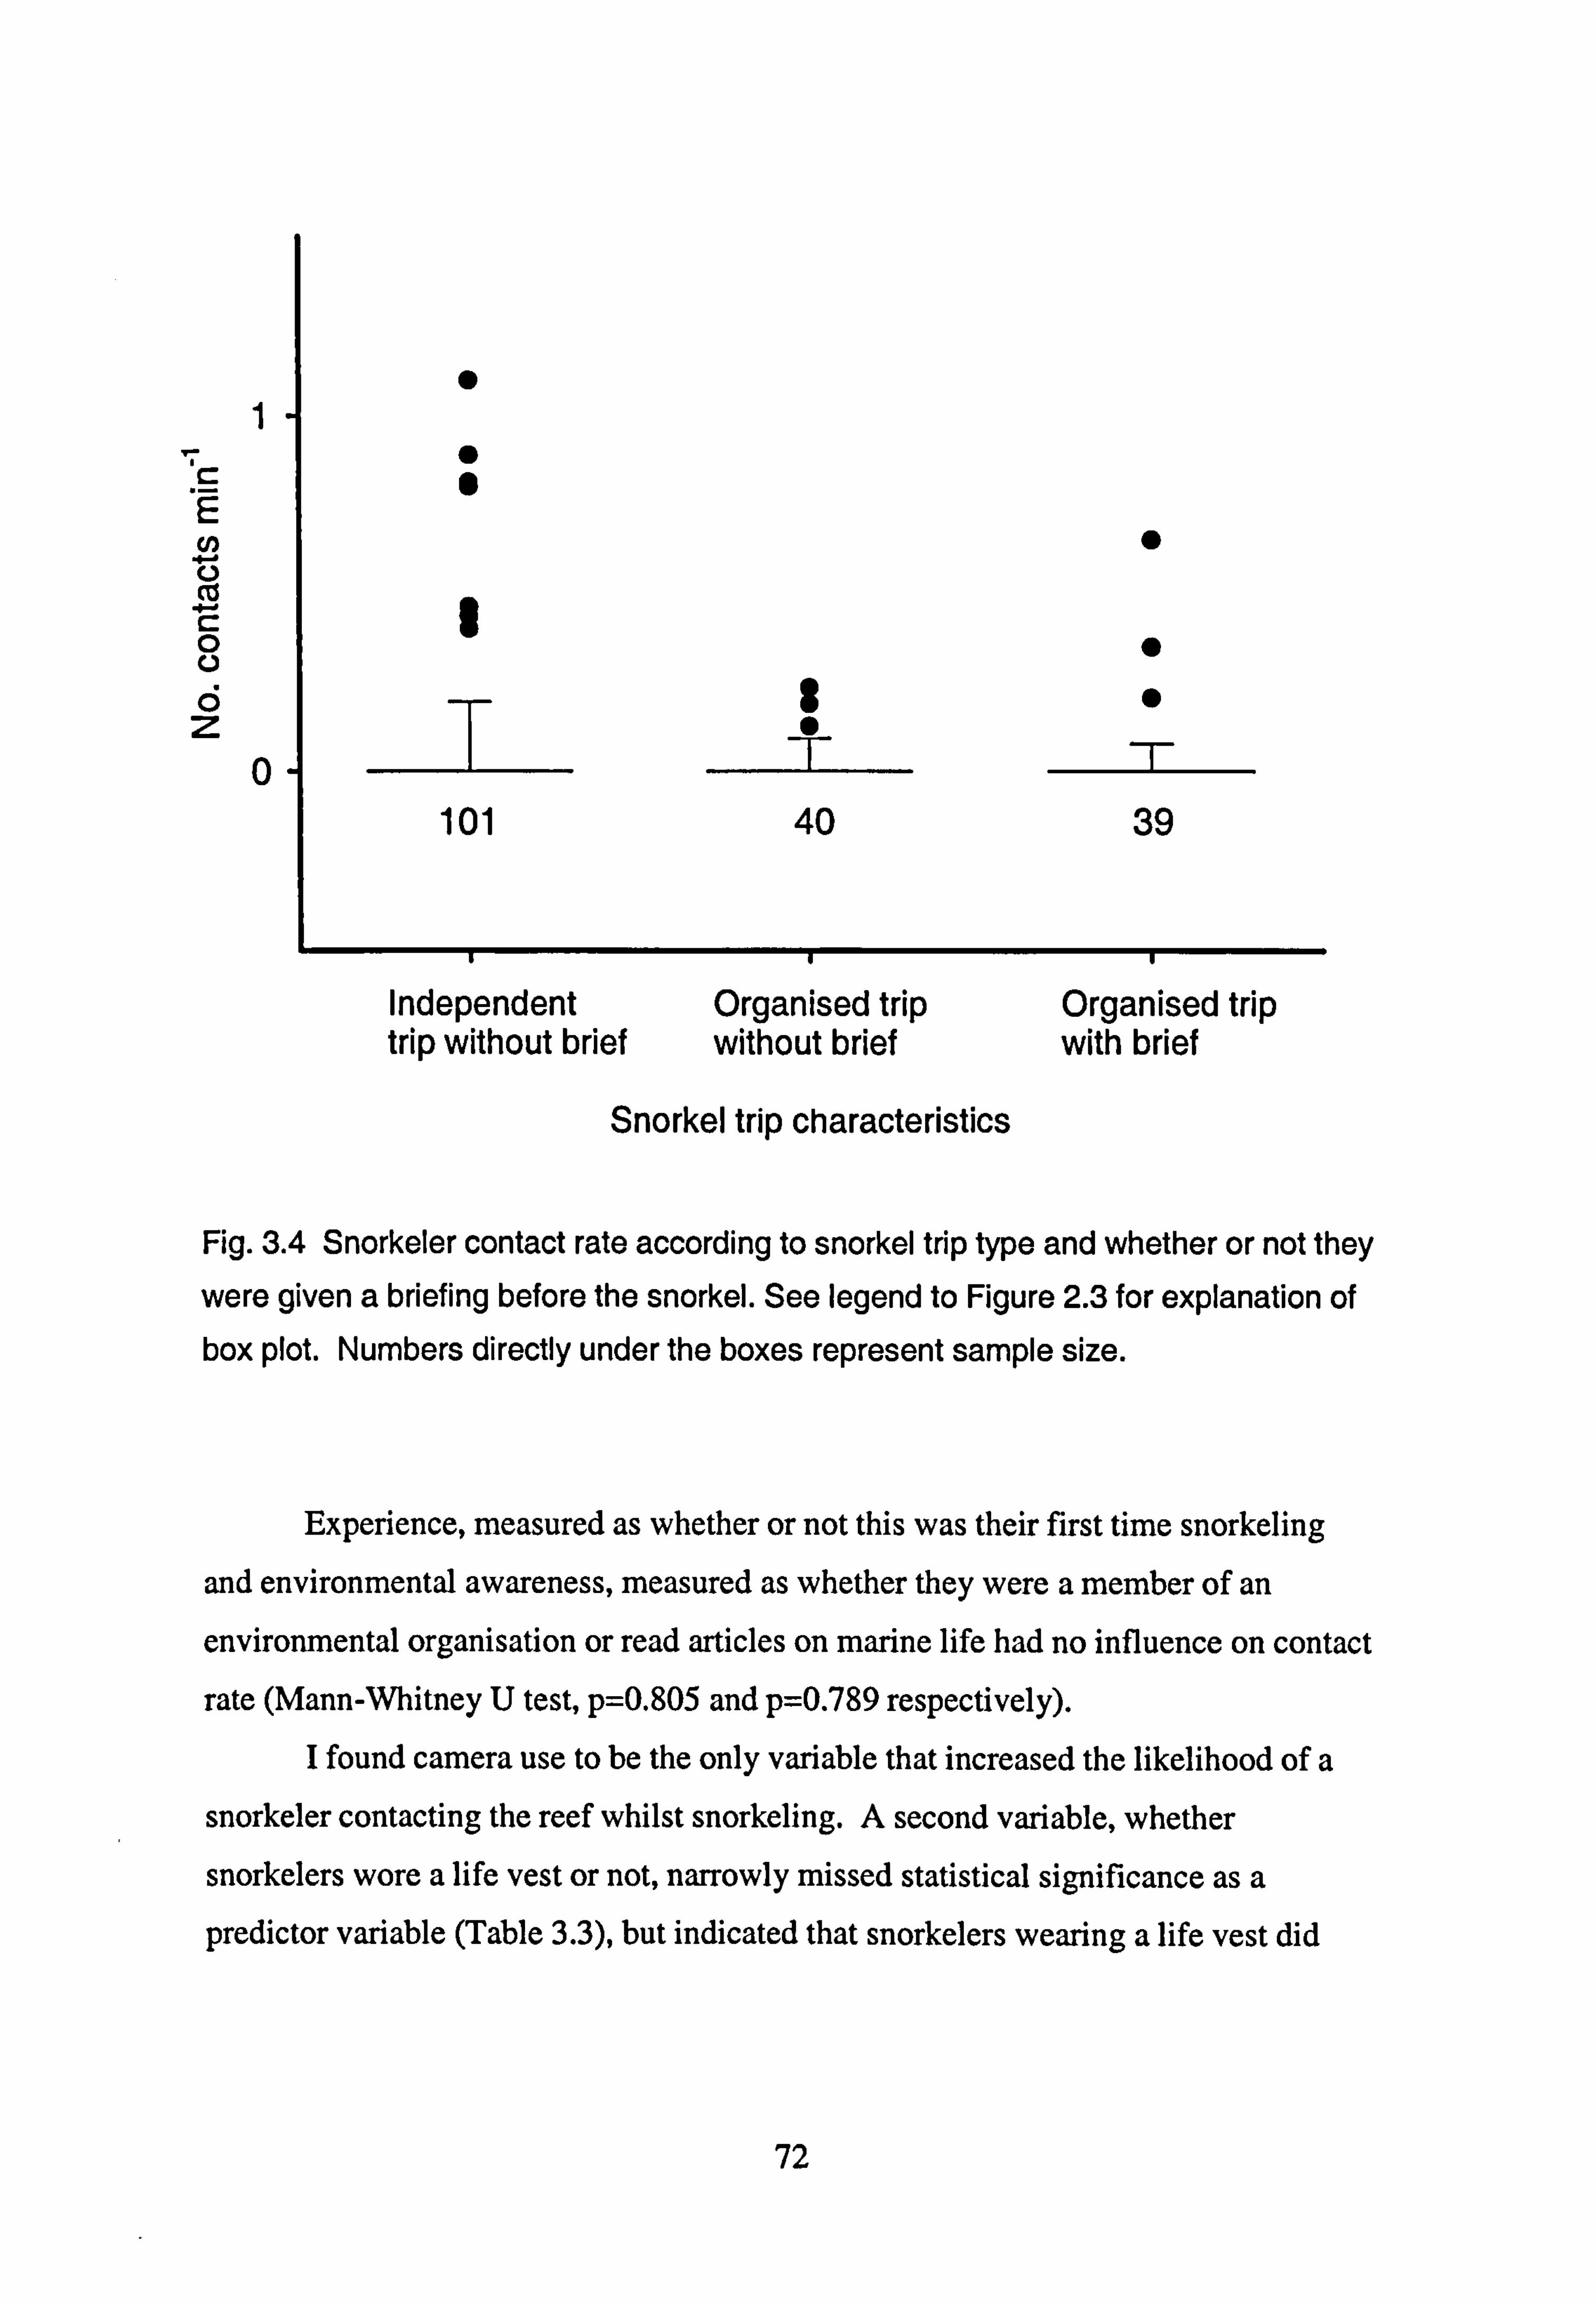
E Cl) cis
0
C. )
0 z
0
Snorkel trip characteristics
Fig. 3.4 Snorkeler contact rate according to snorkel trip type and whether or not they
were given a briefing before the snorkel. See legend to Figure 2.3 for explanation of box plot. Numbers directly under the boxes represent sample size.
Experience, measured as whether or not this was their first time snorkeling
and environmental awareness, measured as whether they were a member of an
environmental organisation or read articles on marine life had no influence on contact
rate (Mann-Whitney U test, p=0.805 and p=0.789 respectively). I found camera use to be the only variable that increased the likelihood of a
snorkeler contacting the reef whilst snorkeling. A second variable, whether
snorkelers wore a life vest or not, narrowly missed statistical significance as a predictor variable (Table 3.3), but indicated that snorkelers wearing a life vest did
72
Independent Organised trip Organised trip trip without brief without brief with brief
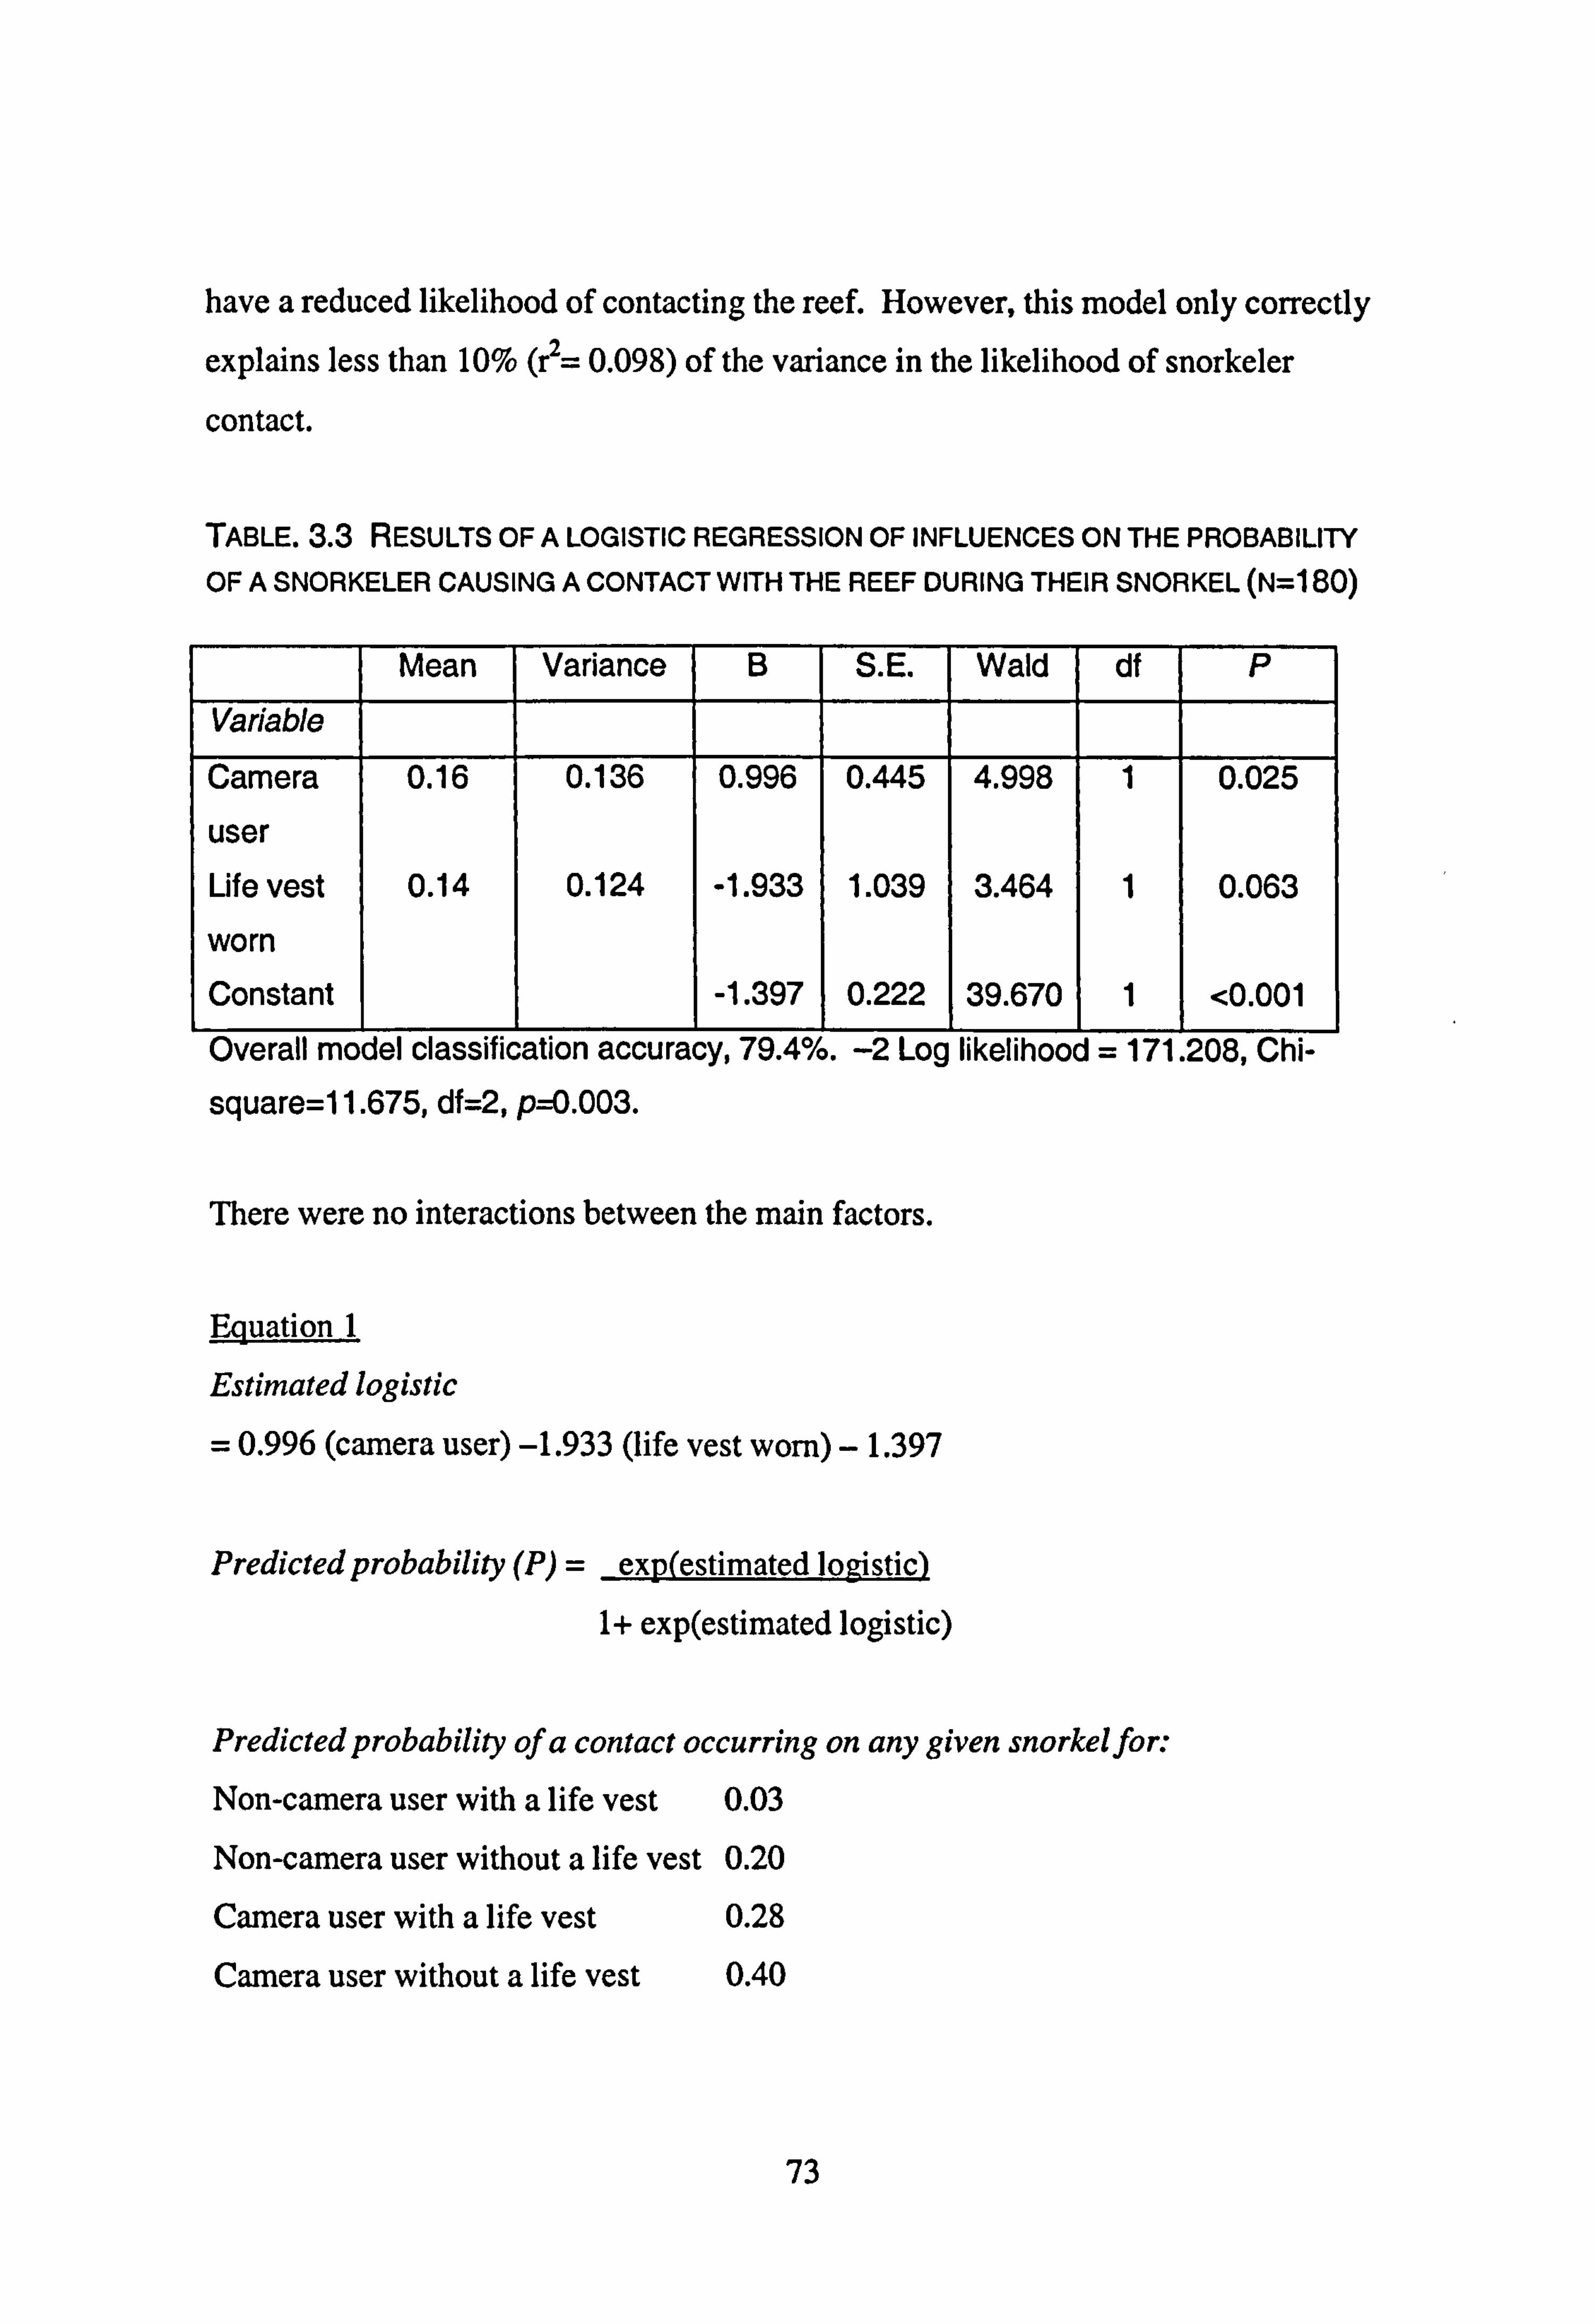
have a reduced likelihood of contacting the reef. However, this model only correctly
explains less than 10% (r2= 0.098) of the variance in the likelihood of snorkeler
contact.
TABLE. 3.3 RESULTS OF A LOGISTIC REGRESSION OF INFLUENCES ON THE PROBABILITY
OF A SNORKELER CAUSING A CONTACT WITH THE REEF DURING THEIR SNORKEL (N=l 80)
Mean Variance B S. E. Wald df p
Variable
Camera 0.16 0.136 0.996 0.445 4.998 1 0.025
user Life vest 0.14 0.124 -1.933 1.039 3.464 1 0.063
worn Constant -1.397 0.222 1 39.670 1 <0.001 Uverall model classitication accuracy, 79.4%. -2 Log likelihood = 171.208, (; hi-
square=1 1.675, df=2, p=0.003.
There were no interactions between the main factors.
FAuation I Estimated logistic
= 0.996 (camera user) -1.933 (life vest wom) - 1.397
Predicted probability (P) = exl? (estimatedlogistic)
1+ exp(estimated logistic)
Predicted probability of a contact occurring on any given snorkelfor.
Non-camera user with a life vest 0.03 Non-camera user without a life vest 0.20
Camera user with a life vest 0.28
Camera user without a life vest 0.40
73
3.5 DISCUSSION
My observations of snorkelers in St. Lucia showed them to be less damaging to the
reef compared to divers, however the higher number of snorkelers compared to divers
means that their cumulative impacts may still be significant. Fewer than a quarter of snorkelers (21 %) compared to 74% of divers (Chapter
2), contacted the reef during their excursion. In common with studies on divers
(Chapter 2; Roberts & Harriott, 1994; Prior et al., 1995; Harriott et al., 1997;
Rouphael & Inglis, 2001; Zakai & Chadwick-Furman, 2002), increased damage was
positively related to the beginning of the excursion and use of a camera. Snorkelers kicked the reef and raised sediment with their fins, mostly when
adjusting their equipment or when they stopped swimming and were vertical in the
water. Their mean contact rate with the reef was, however, a fifth of the rate I found
for divers (0.05 versus 0.25 contacts per minute), but similar to divers in that most
contacts (8 1 %) appeared to be unintentional. The ratio of snorkeler contacts with inert versus live substrate (3: 1) was different to that of divers (1: 2). This is probably due to sites having less coral at the depths in which snorkelers swam (1-5m)
compared to the average depths that divers used (1-25m), rather than because
snorkelers were more conscious than divers of whether their fins were touching the
reef. Divers and snorkelers have degraded reefs in the Red Sea and the Indo-Pacific,
where shallow reef flats reach the surface at low tide (Spalding et al., 2001), breaking
in particular, branching coral species (Hawkins & Roberts, 1992; Allison, 1996;
Rouphael & Inglis, 1997,2001). In contrast, coral reefs in the Caribbean tend to be
non-emergent and therefore deeper. A widespread outbreak of white band disease in
the mid-1980s in the Caribbean (Bythell & Sheppard, 1993) also resulted in the
virtual elimination of branching corals, many of which were in shallower depths.
Wearing a life vest significantly reduced snorkeler contact rate with the reef when tested as a bivariate comparison with a Mann-Whitney U test, and narrowly missed being a significant variable in the likelihood of a snorkeler contacting the reef. Although life vests kept snorkelers at the surface, it did not prevent snorkelers from
74
contacting marine life if it was within reach of their fins. As I found with divers,
camera use significantly increased the probability of a contact with the reef and
giving a briefing had no influence on reducing contacts. The logistic regression only
correctly explained 10% of the variance in the likelihood of snorkeler contact though,
so other factors not measured, such as depth or species composition, have had an influence.
Although only a small proportion of snorkelers came into contact with the
reef, their total impacts were comparable to those of divers because at some sites there were many more snorkelers than divers (Table 3.4). If I compare estimates of
snorkeler and diver numbers at these sites and calculate the total number of contacts likely to occur from each snorkeler or diver per excursion, we can see that snorkeler impacts are significant. Heavy use by divers at Anse Chastanet means that despite
over a hundred contacts being inflicted by snorkelers every day, diver contacts far
exceed these at over 600.
Some operators expressed concern over the degradation at Anse Cochon and Anse Chastanet, and suggested that dive and snorkel activities were in part to blame.
In 1997, Anse Chastanet was the focal point of a disease outbreak called plague that killed 7% of the reef's coral (Nugues, 2002). Research in Bonaire also suggests that
sites exposed to divers are more susceptible to disease (Hawkins et al., 1999). It is
interesting therefore that the popular site Anse Chastanet, which is one of the most heavily dived and snorkeled sites in St. Lucia, was also the site of a disease outbreak.
Despite education in the form of briefings supplemented with visual materials, and information on marine biology being reported as one of the most effective ways
to reduce diver impacts (Medio et al., 1997; Townsend, 2000), 1 have found that a
short briefing given by local staff had no such effect. With divers I found that leaders
had to intervene when they saw a diver damaging the reef, and snorkelers may need
the same kind of supervision.
75
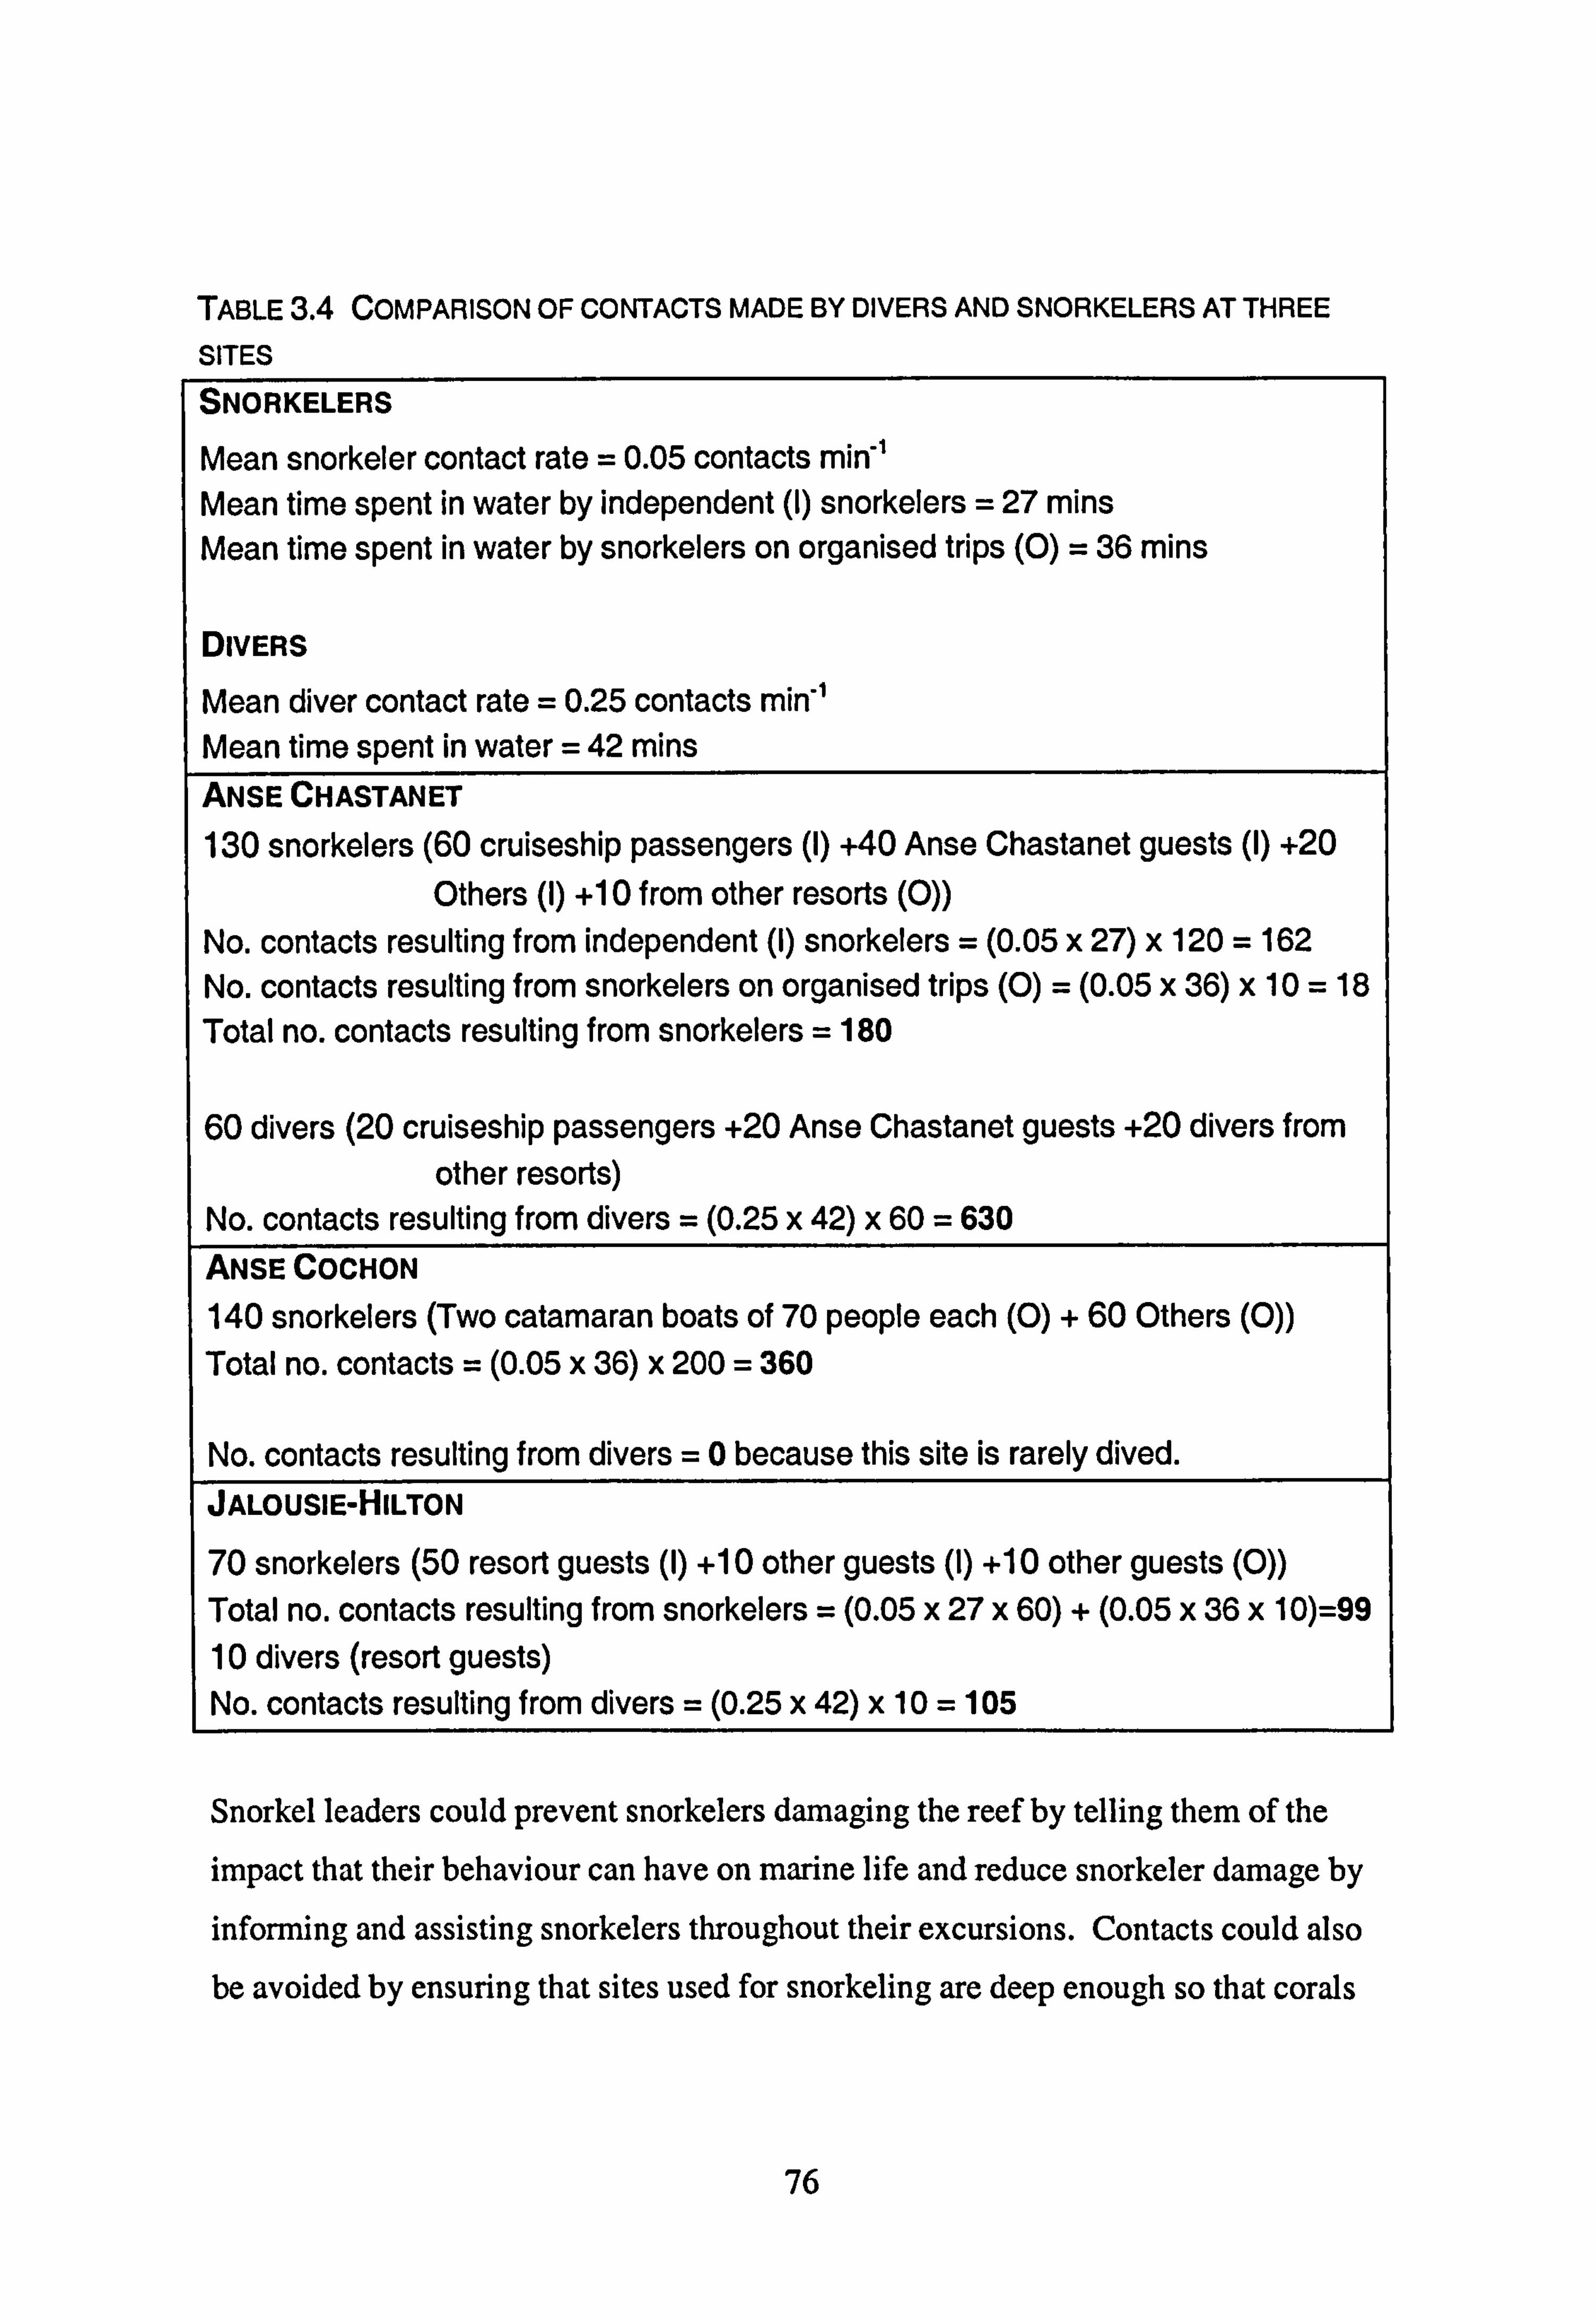
TABLE 3.4 COMPARISON OF CONTACTS MADE BY DIVERS AND SNORKELERS AT THREE
SITES SNORKELERS
Mean snorkeler contact rate = 0.05 contacts min-' Mean time spent in water by independent (1) snorkelers = 27 mins Mean time spent in water by snorkelers on organised trips (0) = 36 mins
DIVERS
Mean diver contact rate = 0.25 contacts min" Mean time spent in water = 42 mins ANSE CHASTANET
130 snorkelers (60 cruiseship passengers (1) +40 Anse Chastanet guests (1) +20 Others (1) +10 from other resorts (0))
No. contacts resulting from independent (1) snorkelers = (0.05 x 27) x 120 = 162 No. contacts resulting from snorkelers on organised trips (0) = (0.05 x 36) x 10 = 18 Total no. contacts resulting from snorkelers = 180
60 divers (20 cruiseship passengers +20 Anse Chastanet guests +20 divers from other resorts)
No. contacts resulting from divers = (0.25 x 42) x 60 = 630 ANSE COCHON
140 snorkelers (Two catamaran boats of 70 people each (0) + 60 Others (0)) Total no. contacts = (0.05 x 36) x 200 = 360
No. contacts resulting from divers =0 because this site is rarely dived. JALOUSIE-HILTON
70 snorkelers (50 resort guests (1) +10 other guests (1) +10 other guests (0)) Total no. contacts resulting from snorkelers = (0.05 x 27 x 60) + (0.05 x 36 x1 0)=99 10 divers (resort guests) No. contacts resulting from divers = (0.25 x 42) x 10 = 105
L_ I
Snorkel leaders could prevent snorkelers damaging the reef by telling them of the
impact that their behaviour can have on marine life and reduce snorkeler damage by
informing and assisting snorkelers throughout their excursions. Contacts could also be avoided by ensuring that sites used for snorkeling are deep enough so that corals
76
are out of reach of snorkelers' fins, i. e. approximately 2.5 to 3m minimum. Where
tides affect depth, restrictions on when snorkelers could use the reef may be needed. For sites that are used by independent snorkelers and where enforcement of
regulations may be impractical or impossible, buoys could be used to mark areas to be used.
It was evident from my interviews with visitors that they were eager to learn
more about the marine environment and many asked for the provision of information
on marine life (Chapter 5). They also asked for floating platforms. These would
enable swimmers to rest without having to stand on the reef. Providing walkways
and floating pontoons localises coral damage due to trampling and has been adopted by certain hotels in the Ras Mohammed National Park, Egypt (Ormond et al., 1997).
The walkways have proved effective in decreasing coral damage although large
constructions, such as the 40x4Om pontoon reported in Ormond et al., (1997),
resulted in bleaching of the coral beneath, most likely due to shading.
What is clear is that increasing numbers of snorkelers worldwide will be
visiting coral reefs and unless their behaviour is modified, whether by education,
restrictions, supervision or some combination of these, their impacts will add to other
stresses on the reefs, and lead to their decline.
3.6 REFERENCES
Allison, W. R. 1996. Snorkeler darnage to reef corals in the Maldive Islands. Coral Reefs 15: 215-218.
Beekhuis, J. 1981. Tourism in the Caribbean: Impacts on the economic, social and natural environments. Ambio 10: 325-331.
Berg, H., 6hman, M. C., Trodng, S. & 0. Lind6n. 1998. Environmental economics of coral reef destruction in Sri Lanka. Ambio 27: 627-634.
Bryant, D., Burke, L., J. McManus & M. Spalding. 1998. Reefs at Risk. A Map- Based Indicator of Threats to the World's Coral Reefs. World Resources Institute, Washington DC. 56 pp.
77
Bythell, J. & C. Sheppard. 1993. Mass mortality of Caribbean shallow corals. Marine Pollution Bulletin 26: 296-297.
Cesar, H. 1996. Economic Analysis of Indonesian Coral Reefs. World Bank. Coral Reef Rehabilitation and Management (COREMAP). 96 pp.
Ceballos-Lascurdin, H. 1993. Ecotourism as a worldwide phenomenon. In: Lindberg, K. and D. E. Hawkins (eds), Ecotourism: A Guidefor Planners and Managers. The Ecotourism Society, North Bennington, VT. 175 pp.
Driml, S. 1994. Protectionfor Profit. Economic and Financial Values of the Great Barrier Reef World Heritage Area and Other Protected Areas. Great Barrier Reef Marine Park Authority, Research publication no. 35, Townsville. 83 pp.
Hall, C. M. 2001. Trends in ocean and coastal tourism: the end of the last frontier? Ocean & Coastal Management 44: 601-618.
Harriott, W., Davis, D. & S. A. Banks. 1997. Recreational diving and its impact in marine protected areas in Eastern Australia. Ambio 26: 173-179.
Harriott, V. J. 2002. Marine Tourism Impacts and Their Management on the Great Barrier Reef. CRC Reef Research Centre Technical Report No. 46. CRC Reef Research Centre, Townsville, Australia. 41 pp.
Harvell, C. D., Kim, K., Burkholder, J. M., Colwell, R. R., Epstein P. R., Grimes, D. J., Hofmann, E. E., Lipp, E. K., Osterhaus, A. D. M. E., Overstreet, R. M., Porter, J. W., Smith G. W. & G. R. Vasta. 1999. Emerging marine diseases - climate links and anthropogenic factors. Science 285: 1505-1510.
Hawkins, J. P. & C. M. Roberts, 1992. Effects of recreational SCUBA diving on fore- reef slope communities of coral reefs. Biological Conservation 62: 171-178.
Hawkins, J. P., Roberts, C. M., van't Hof, T., de Meyer, K., Tratalos, J. & C. Aldam. 1999. Effects of recreational scuba diving on Caribbean coral and fish communities. Conservation Biology 13: 888-897.
Hughes, T. P. & J. H. Connell, 1999. Multiple stressors on coral reefs: A long-term perspective. Limnology and Oceanogaphy 44: 932-940.
Inglis, G. J., Johnson V. I. & F. Ponte, 1999. Crowding norms in marine settings: A case study of snorkeling on the Great Barrier Reef. Environmental Management 24: 369-381.
78
MacKinnon, N. 1998. Destructive fishing practices in the Asia-Pacific Region. In: Hatziolos, M. E., Hooten, A. J. & M. Fodor. (eds), 1998. Coral Reefs: Challenges and Opportunitiesfor Sustainable Management. Proceedings of an Associated Event of the Fifth Annual World Bank Conference on Environmentally and Socially Sustainable Development. The World Bank, Washington, D. C. 224 pp.
Makoloweka, S. 1998. Destructive fishing with dynamite. In: Hatziolos, M. E., Hooten, A. J. & M. Fodor (eds. ). 1998. Coral Reefs: Challenges and Opportunities for Sustainable Management. Proceedings of an Associated Event of the Fifth Annual World Bank Conference on Environmentally and Socially Sustainable Development. The World Bank, Washington, D. C. 224 pp.
Medio, D., Ormond, R. F. G. & M. Pearson. 1997. Effect of briefings on rates of damage to corals by scuba divers. Biological Conservation 79: 91-95.
Meesters, E. H. & R. P. M. Bak. 1993. Effects of coral bleaching on tissue regeneration potential and colony survival. Marine Ecology Progress Series 96: 189- 198.
NE11s, AR 2001. St. Vincent and the Grenadines. Marine Pollution Bulletin 42: 1208-1220.
Morgenstern, H. L. 1999. Clouds over the coral. Impact of human habitat and tourism on the coral reefs of the Florida Keys. The Environmental Magazine, March 1999.
Nemeth, R. S. & J. S. Nowlis. 2001. Monitoring the effects of land development on the near-shore reef environment of St. Thomas, USVI. Bulletin of Marine Science 69: 759-775.
Nugues, M. M. 2002. Impact of coral disease outbreak on coral communities in St. Lucia: What and how much has been lost? Marine Ecology Progress Series 229: 61- 71.
Ormond, R., Hassan, 0., Medio, D., Pearson, M. & M. Salem. 1997. Effectiveness of coral protection programmes in the Ras Mohamed National Park, Egyptian Red Sea. Proceedings of the Eighth International Coral Reef Symposium. 2: 1931-1936. Smithsonian Tropical Research Institute, Balboa, Panama.
Pastorok, R. A. & G. R. Bilyard. 1985. Effects of pollution on coral reef. Marine Ecology Progress Series 21: 175-189.
Plathong, S., Inglis, G. J. & M. E. Huber. 2000. Effects of self-guided snorkeling trails on corals in a tropical marine park. Conservation Biology 14: 1821-1830.
79
Price, A. R. G., Roberts, C. M. & J. P. Hawkins, 1998. Recreational use of coral reefs in the Maldives and Caribbean: 242-260. In: Milner-Gulland E. J. & R. Mace, 1998 Conservation of Biological Resources, Blackwell Science Ltd., University Press, Cambridge, UK, 404 pp.
Prior, M., Ormond, R, Hitchen, R. & C. Wormald. 1995. The impact of natural resources of activity tourism: A case study of diving in Egypt. International Journal of Environmental Studies 48: 201-209.
Riopelle, J. M. 1995. The economic valuation of coral reefs: a case study of West Lombok, Indonesia. Thesis, Dalhousie University, Halifax. In: Cesar, H. 1996. Economic Analysis of Indonesian Coral Reefs. World Bank. Coral Reef Rehabilitation and Management (COREMAP). 96 pp.
Roberts, L. & V. J. Harriott. 1994. Recreational scuba diving and its potential for environmental impact in a marine reserve. In: Bellwood, 0., Choat, H. & N. Saxena (eds). 1994. Recent advances in marine science and technology 1994, pp. 695-704.
Rogers, C. S. 1988. Damage to coral reefs in Virgin Islands National Park and Biosphere Reserve from recreational activities. In: Proceedings of the Sixth International Coral Reef Symposium, Australia 2: 405-410.
Rouphael, T. & G. Inglis. 1995. The Effects of Qualified Recreational SCUBA Divers on Coral Reefs. CRC Reef Research Centre Technical Report No. 4, Townsville, Australia; CRC Reef Research Centre, 39 pp.
Rouphael, A. B. & G. J. Inglis. 1997. Impacts of recreational scuba diving at sites with different reef topographies. Biological Conservation 82: 329-336.
Rouphael, A. B. & G. J. Inglis. 2001. "Fake only photographs and leave only footprints"?: An experimental study of the impacts of underwater photographers on coral reef dive sites. Biological Conservation 100: 281-287.
Sladek Nowlis, J., Roberts, C. M., Smith, A. H. & E. Siirila. 1997. Human-enhanced contacts of a tropical storm on nearshore coral reefs. Ambio 26: 515-521.
Spalding, M. D., Ravilious, C. & E. P. Green. 2001. WorldAtlas of Coral Reefs. Prepared at the UNEP World Conservation Monitoring Centre. University of California Press, Berkeley, USA, 424 pp.
Tilmant, J. T. & G. P. Schmahl. 1981. A comparative analysis of coral damage on recreationally used reefs within Biscayne National Park, Florida. In: Proceedings of The Fourth International Coral Reef Symposium, University of the Phillippines, Quezon City, Phillippines, pp. 187-192.
80
Tilmant, J. T. 1987. Impacts of Recreational Activities on Coral Reefs. In: Salvat, B. (ed. ). Human Impacts on Coral Reefs: Facts and Recommendations. Antenne Museum E. P. H. E., French Polynesia, pp. 195-214.
Townsend, C. 2000. The Effects of Environmental Education on the Behaviour of Scuba Divers: A Case Study From the British Virgin Islands. MSc thesis, University of Greenwich, UK. 92 pp.
Vanclay, F. M. 1988. Tourist Perceptions of the Great Barrier Reef. Research Publication no. 38. The Great Barrier Reef Marine Park Authority, Townsville, Australia. 103 pp.
Visser, N. 1992. Environmental impacts of tourism on the Kenya coast. Industry and Environment 15: 42-52.
Visser, N. & S. Njuguna, 1992. Environmental impacts of tourism on the Kenya coast. UNEP Industry and Environment July - December 1992.
Westmacott, S., Pet-Soede, L. & H. Cesar. 2000. Assessment of the Socio-Economic Impacts of the 1998 Coral Reef Bleaching in the Indian Ocean. Report prepared for CORDIO programme, Coral Reef Degradation in the Indian Ocean. Resource Analysis, Zuiderstraat, The Netherlands. 149 pp.
Wilkinson, C. (ed. ) 1998. Status of Coral Reefs of the World., 1998. Global Coral Reef Monitoring Network. Australian Institute of Marine Science, Townsville, Australia. 184 pp.
Williams, I. D. & NN. C. Polunin. 2000. Differences between protected and unprotected reefs of the western Caribbean in attributes preferred by dive tourists. Environmental Conservation 27: 382-391.
Zakai, D. & N. E. Chadwick-Furman. 2002. Impacts of intensive recreational diving on reef corals at Eilat, northern Red Sea. Biological Conservation 105: 179-187.
81
Chapter 4: Economic benefits of coral reef tourism
and maximising the potential for tourists to fund
management of marine protected areas
4.1 ABSTRACT
Cheaper travel and increased interest in nature is making marine environments,
particularly coral reefs, more accessible and popular with holidaymakers. The
financial and employment gains are significant. In the present study on St. Lucia, the
nine existing dive companies in 2001 employed over a hundred people, with St.
Lucians taking up 71% of managerial and 97% of water sports staff positions. Dive
companies collectively spent US$1.4million on salaries that year. I estimated
revenues by questioning 786 scuba divers and snorkelers. Tourists in 2000 spent
approximately US$7.3million on diving and snorkeling tours, nearly half of which (US$3.5m) was attributable to tours taken within its marine protected area (MPA).
Forty four percent of my sample said they visited St. Lucia because of the existence
of the MPA and over 90% were willing to pay more than the stated fees of US$4 for a diver's daily fee, US$12 for a diver's annual fee and US$1 for a snorkeler's daily fee.
Using the maximum amount that 75% or 50% of visitors were willing to pay would increase annual revenue by 128% or 62% respectively. This would bring park
revenue from fees to US$41,550 and US$58,475 respectively, representing 52% and 73% of the total management budget. Such increases in revenue could pay for higher
management standards and support the park's conservation efforts. MPAs help
manage and protect reefs, and attract tourists, but need financial support. This study
shows that MPAs could harness more of the potential income that tourists are
prepared to pay, thereby paying for a greater proportion of management costs, and
revenues from fees could help MPAs categorised as 'paper-parks' to become fully
functioning MPAs.
82
4.2 INTRODUCTION
Many developing countries rely on their natural resources to support a tourism
industry for economic gain (Pearce, 1989). Tourism ranks among the most important
industries globally, with international tourist arrivals numbering 693 million in 2001
(WTO, 2002). According to the World Travel and Tourism Council (WTTC, 2002),
travel and tourism is forecast to contribute 3.6% in 2002 to global Gross Domestic
Product (GDP) equivalent to US$1,195 billion, rising in nominal terms to US$ 2,271
billion (3.8% of total) by 2012. The travel and tourism industry is estimated to
provide 198 million jobs worldwide or 7.8% of total employment and by 2012 is
expected to rise to 8.5% (WTTC, 2002).
Nature tourism is a sub-sector of the tourism industry which uses natural
areas, landscapes, wildlife and flora and has existed in practice if not in name for
decades (Fennell, 1999). Both nature tourism and its low impact form 'eco-tourism',
which aims to contribute to the maintenance of species and habitats (Goodwin, 1996),
have grown over the past decade. This has in part been due to increased and
affordable jet travel, greater accessibility to remote places, nature and travel documentaries, and the rising interest in conservation and environmental matters (Ceballos-Lascurdin, 1993). The fastest growth within tourism has been marine and
coastal tourism (Hall, 2001) with coral reef recreation in the tropics increasing due to
technical advances in equipment and boats, in addition to reasons given above (Orams, 1999).
Coastal tourism is a mainstay of the Sri Lankan economy, and contributes
about US$ 200 million per year to it. Sri Lanka's reefs are worth an estimated net
annual tourist-value of US$214,000 per krný (Berg et al., 1998). In the Caribbean, the island of Bonaire generated an estimated total gross revenue of US$ 23.2 million in
1991 through dive-based tourism (Dixon et al. 1993), while another island in the Caribbean, Saba (11 km2 and population 1,200), was estimated to generate US$2
million per year (Fernandes, 1995). Riopelle (1995) studied reef-related tourism on West Lombok and found a total net present value of benefit from divers and
83
snorkelers of US$ 23.5 million. In Australia, tourism in the Great Barrier Reef area
generated an estimated US$ 682 million for the year 1991-2 (Driml, 1994).
However, along with money, social opportunities and new infrastructure,
tourism often brings social disorganisation (Britton, 1977; Rodenburg, 1980),
congestion and environmental degradation (NEller & Auyong, 199 1; Lindberg &
Hawkins, 1993). Maximising revenue without threatening the integrity of the natural
resources is a complicated challenge, particularly so when considering implications
of an expanding coastal tourism industry. Infrastructure supporting such activities is
often detrimental to the surrounding environment, and this is particularly pertinent to
coral reefs which are often in close proximity to the coast where development is
concentrated. An eleven-fold expansion in Egypt's coastal tourism was predicted to
exacerbate problems associated with in-filling of shore habitat to create land,
sedimentation and over-fishing for marine curios (Hawkins & Roberts, 1994).
Similarly developments in Eilat, Israel and Jordan were concentrated in coastal areas
alongside reefs. Such developments often result in additional problems of chemical
pollution, waste water and sewage, all of which are known to damage reef habitat
(Walker & Ormond, 1982; Koop et al., 2001; Nemeth & Nowlis, 2001; Negri et al., 2002).
With the expansion of coastal tourism comes the inevitable increase in diver
and snorkeler numbers, whose activities can be damaging to corals as reported in
Chapters 2 and 3.
The need for reef management is evident. Some of this management has been
through the establishment of marine protected areas (MPAs). Although not widely
established until the 1970s and 1980s, MPAs have been useful in helping to conserve
reef resources including fish stocks since the early 20th century (Badalamenti et al., 2000). Globally, some 660 MPAs exist that incorporate reefs (Spalding et al., 2001).
Despite this, in many MPAs, protection has not been realised due to lack of finance
and/or management (Kelleher et al., 1995). They are known as 'paper parks', because they have legal status but are not enforced (Spalding et al., 2001).
84
In recent years, some protected areas have successfully covered part of their
costs by charging user fees (Dixon et al., 1993) although for most, financial support from tourists is not enough (Balinford et al., in prep; Lee & Han, 2002). Saba and Bonaire marine parks in the Caribbean are among the few which, through user fees,
have become self-financing with tourists paying for management of park resources (Dixon et al., 1993; D. Kooistra, pers comm. ). For many others this is not the case. In
Costa Rica for example, less than one percent of the national parks' 1992 budget
came from entrance fees (Dixon & van't Hof, 1997). What is questionable is whether MPAs are capturing the full potential for tourist funding (Green & Donnelly, 2003).
Studies addressing the amounts visitors are willing to pay for their experience of a
protected area suggest that many would be willing to pay more (Dixon & van't Hof,
1994; Walpole et al., 2001; Lee & Han, 2002). A 1992 visitor survey in Bonaire
showed that 80% would be willing to pay at least US$20 for access to the marine
park, double the amount that was being charged at the time (Dixon et al., 1994).
Similarly, recreational use values of five National Parks in South Korea showed that
visitors were willing to pay between six and seventeen times the current fee of US 83
cents (Lee & Han, 2002).
Despite providing financial gain, tourism can be a volatile industry exposed to
external forces, both natural, such as hurricanes and earthquakes, and man-made such
as wars and terrorist attacks. Recurrent wars have inhibited tourist development in
Sudan, Yemen and Ethiopia/Eritrea (Hawkins & Roberts, 1994). The kidnapping of 21 divers from the island of Sipadan by terrorists in 2000 caused tourist numbers to
the island to drop 60-100 percent in the subsequent six months (Musa, 2002). The
2002 bomb attack in Bali will also inevitably have repercussions on tourist activity. Protected areas dependent on tourism revenue need to build resources to survive
periods of financial difficulty. Part of this includes correctly pricing entrance fees so that maximum gain from tourists is achieved.
I explore the issues of financial gain from tourism and the potential for
tourists to pay for management of a protected area in the Caribbean Island of St.
85
Lucia. Tourism represents an important economic contributor to St. Lucia,
accounting in 2001 for an estimated 53% of the island's GDP (WTTC, 2002).
Annual visitor arrivals have doubled over the last decade and in 2000 numbered more
than 700,000 with 64% arriving by cruiseship (St. Lucia government statistics, 2002).
Part of St. Lucia's priorities in tourism development is to target niche markets and diversify the tourist product (Ministry of Tourism and Civil Aviation, St. Lucia
2002). One such niche considered ready for expansion is marine-based tourism
directly linked to the coral reefs that fringe the island, in particular diving and
snorkeling. The growth of these activities in St. Lucia is reflected in marketing by
the island's hotels and resorts, many of which offer diving and snorkelling packages
through their own water-sports section or through a local dive company.
Management of the island's coral reefs began in 1995 with the establishment
of the Soufriare Marine Management Area (SMMA) covering 1 lkm of the western
coast. By 2001, the SMMA was estimated to be financed 33% by diver fees, 3% by
snorkeler fees, 62% by yacht fees and 2% from donations (SMMA data, 2001).
However, to finance the desired level of management additional economic support is
necessary (Kai Wulf, pers. comm. ). Anecdotal evidence suggests that the most
popular and certainly the most advertised dive sites are within the SMMA.
Determining whether user fees to these sites could be increased, and if so by how
much, is an obvious first step towards solving the present problem. Financial and economic values of a resource highlighting the costs and
benefits of uses have been used successfully in various protected areas in the world. These include, among others, the Great Barrier Reef Marine Park, the Tasmanian
Wilderness World Heritage Area, the Wet Tropics World Heritage Area and Kakadu
National Park in Australia (Driml, 1994), Bonaire Marine Park in the Netherlands
Antilles, Buckoo Reef in Tobago, Key Largo National Marine Sanctuary in Florida
(Dixon & Sherman, 1990) and the Marine Reserve of Apo Island in the Philippines
(Vogt, 1997). In St. Lucia, no information has so far been gathered on the financial
and economic values of the island's marine managed area, in terms of diving and
86
snorkeling, even though the coral reefs are part of its natural capital used for
economic development and hence they are vital to the country's dive and snorkel tourism industry. Through this case study, I illuminate some of the economic benefits of reef-based tourism for a developing country, and evaluate the potential of
that tourism to support adequate resource protection. Using information from visitors
and dive companies, I investigate benefits in terms of revenue directly attributed to diving and snorkeling activities, and in terms of number of people employed. Contingent Valuation Method (CVM) surveys have been used in coastal protected
area studies to obtain information on people's maximum willingness to pay for stated
preferences (Dixon et al., 1994; Kontogianni et al., 2001; Walpole et al., 2001; Arin
& Kramer, 2002; Mathieu et al., 2002; Park et al., 2002). Although contingent
valuation methods have in the past been seen as inferior to behavioural methods, the
methods have now proved to be no less reliable (Haab & McConnell, 2002). Unless
the values of St. Lucia's reefs are properly appreciated it is likely that predicted increases in pressures associated with visitor use, development and the plethora of
stresses resulting from a growing population and economy may result in their gradual deterioration potentially culminating with their eventual loss.
4.3 METHODS
I contacted all nine dive companies in St. Lucia and surveyed a sample of divers and
snorkelers over two sampling periods. Period 1 was from December 2000 to March
2001 and Period 2 from July to October 2001.1 conducted a CVM survey of divers
and snorkelers to examine their maximum willingness to pay for marine park fees and
the effect this would have on revenue generation. I used open-ended questions to ask
them whether they would pay more than the current fee of US$4 or US$12 per day or
per year respectively, or the snorkeler fee of US$I per day, and if so, by how much. Surveys were carried out using three questionnaires, one (Questionnaire 2, Appendix
B) for divers during Period 1 and two during Period 2 (one with divers and
87
snorkelers, Questionnaire 3, Appendix C and one with dive companies, Questionnaire
4, Appendix D). Both divers and snorkelers were interviewed at Anse Chastanet
Resort and an additional sample of snorkelers was interviewed at Jalousie-Hilton
Resort (Fig. 3.1, Chapter 3). After a dive I interviewed the same divers that I had
previously chosen by stratified selection for my underwater observation studies (Chapter 2). Similarly, I interviewed the same snorkelers that I had already observed (Chapter 3).
During Period 1,1 investigated visitors' holiday choices and expenditure
patterns. I interviewed 459 visitors (Questionnaire 2, Appendix B) asking them
questions about reasons for their visit, prior visitation, length and place of stay. I
sought information on their diving and snorkelling activities on the island including
whether they required rental equipment and noted their previous coral reef
experiences. I also asked questions on their spending including total holiday cost,
amount spent on travel, diving, tours and meals as well as country of residence and
age. To determine their exposure to environmental issues, particularly with regard to
marine life, I asked whether or not they belonged to an environmental group or read
articles on marine life.
In Period 2,1 interviewed 327 visitors (Questionnaire 3, Appendix C) and asked them to give a score for fish life, coral life, underwater visibility and their
overall satisfaction with the site they had just dived or snorkeled at (scores were: 5
very good, 4= good, 3= average, 2= poor, 1= very poor and 0= no opinion). I also
asked how the existence of the marine park had influenced their decision to visit the
island. I then gave respondents details on existing and planned programs of the
SMMA before asking them what was the maximum amount they would be willing to
pay for access to marine park sites, explaining that revenues would go to support improved management. To explore their attitudes regarding spending of revenues from fees towards SMMA programs, I asked them to give a score to six proposed
programs according to their view of importance. As in Period 1,1 assessed
88
respondents' exposure to environmental issues. Lastly, I asked them to state their
household income level.
During Period 21 also questioned (Questionnaire 4, Appendix D) either the
owner or manager of nine of the ten dive companies (one was closed for
refurbishment) on the island about their business and clientele. Questions included
number of years they had been in business, whether they were affiliated to a hotel and how much of the business was St. Lucian owned. I also asked whether they had a
retail store, what percentage of their sales were derived from diving and snorkelling (versus equipment rental and retail sales) and whether they sold packages offshore
and through whom. I asked how many full and part-time employees they had and
where they were from, how much was spent on salaries and overall dive shop annual income and profit. I also enquired as to how many divers and snorkelers they sold
trips to per year, the mean number of trips taken per visitor per trip to St. Lucia,
average package value per customer and what sites they used for these activities. The overall refusal rate for both sampling periods was less than 3% for
visitors and 0% for dive companies.
4.4 REsuLTs
4.4.1 Visitor characteristics
Respondents' country of residence was similarly distributed over both study periods
with most respondents residing in America (6 1 %), followed by the UK (23 %),
Germany (4%) and twelve other countries each with less than 1%. Roughly equal
numbers of men and women were interviewed (53% and 47% respectively) and the
mean and median age group was 40-49yrs.
Most respondents (95.6%) were visiting St. Lucia for a holiday, with a
minority (4.4%) visiting for work purposes. Over a third (34.4%) stated their main
reason for visiting St. Lucia was to dive or snorkel on the reef. The remainder
89
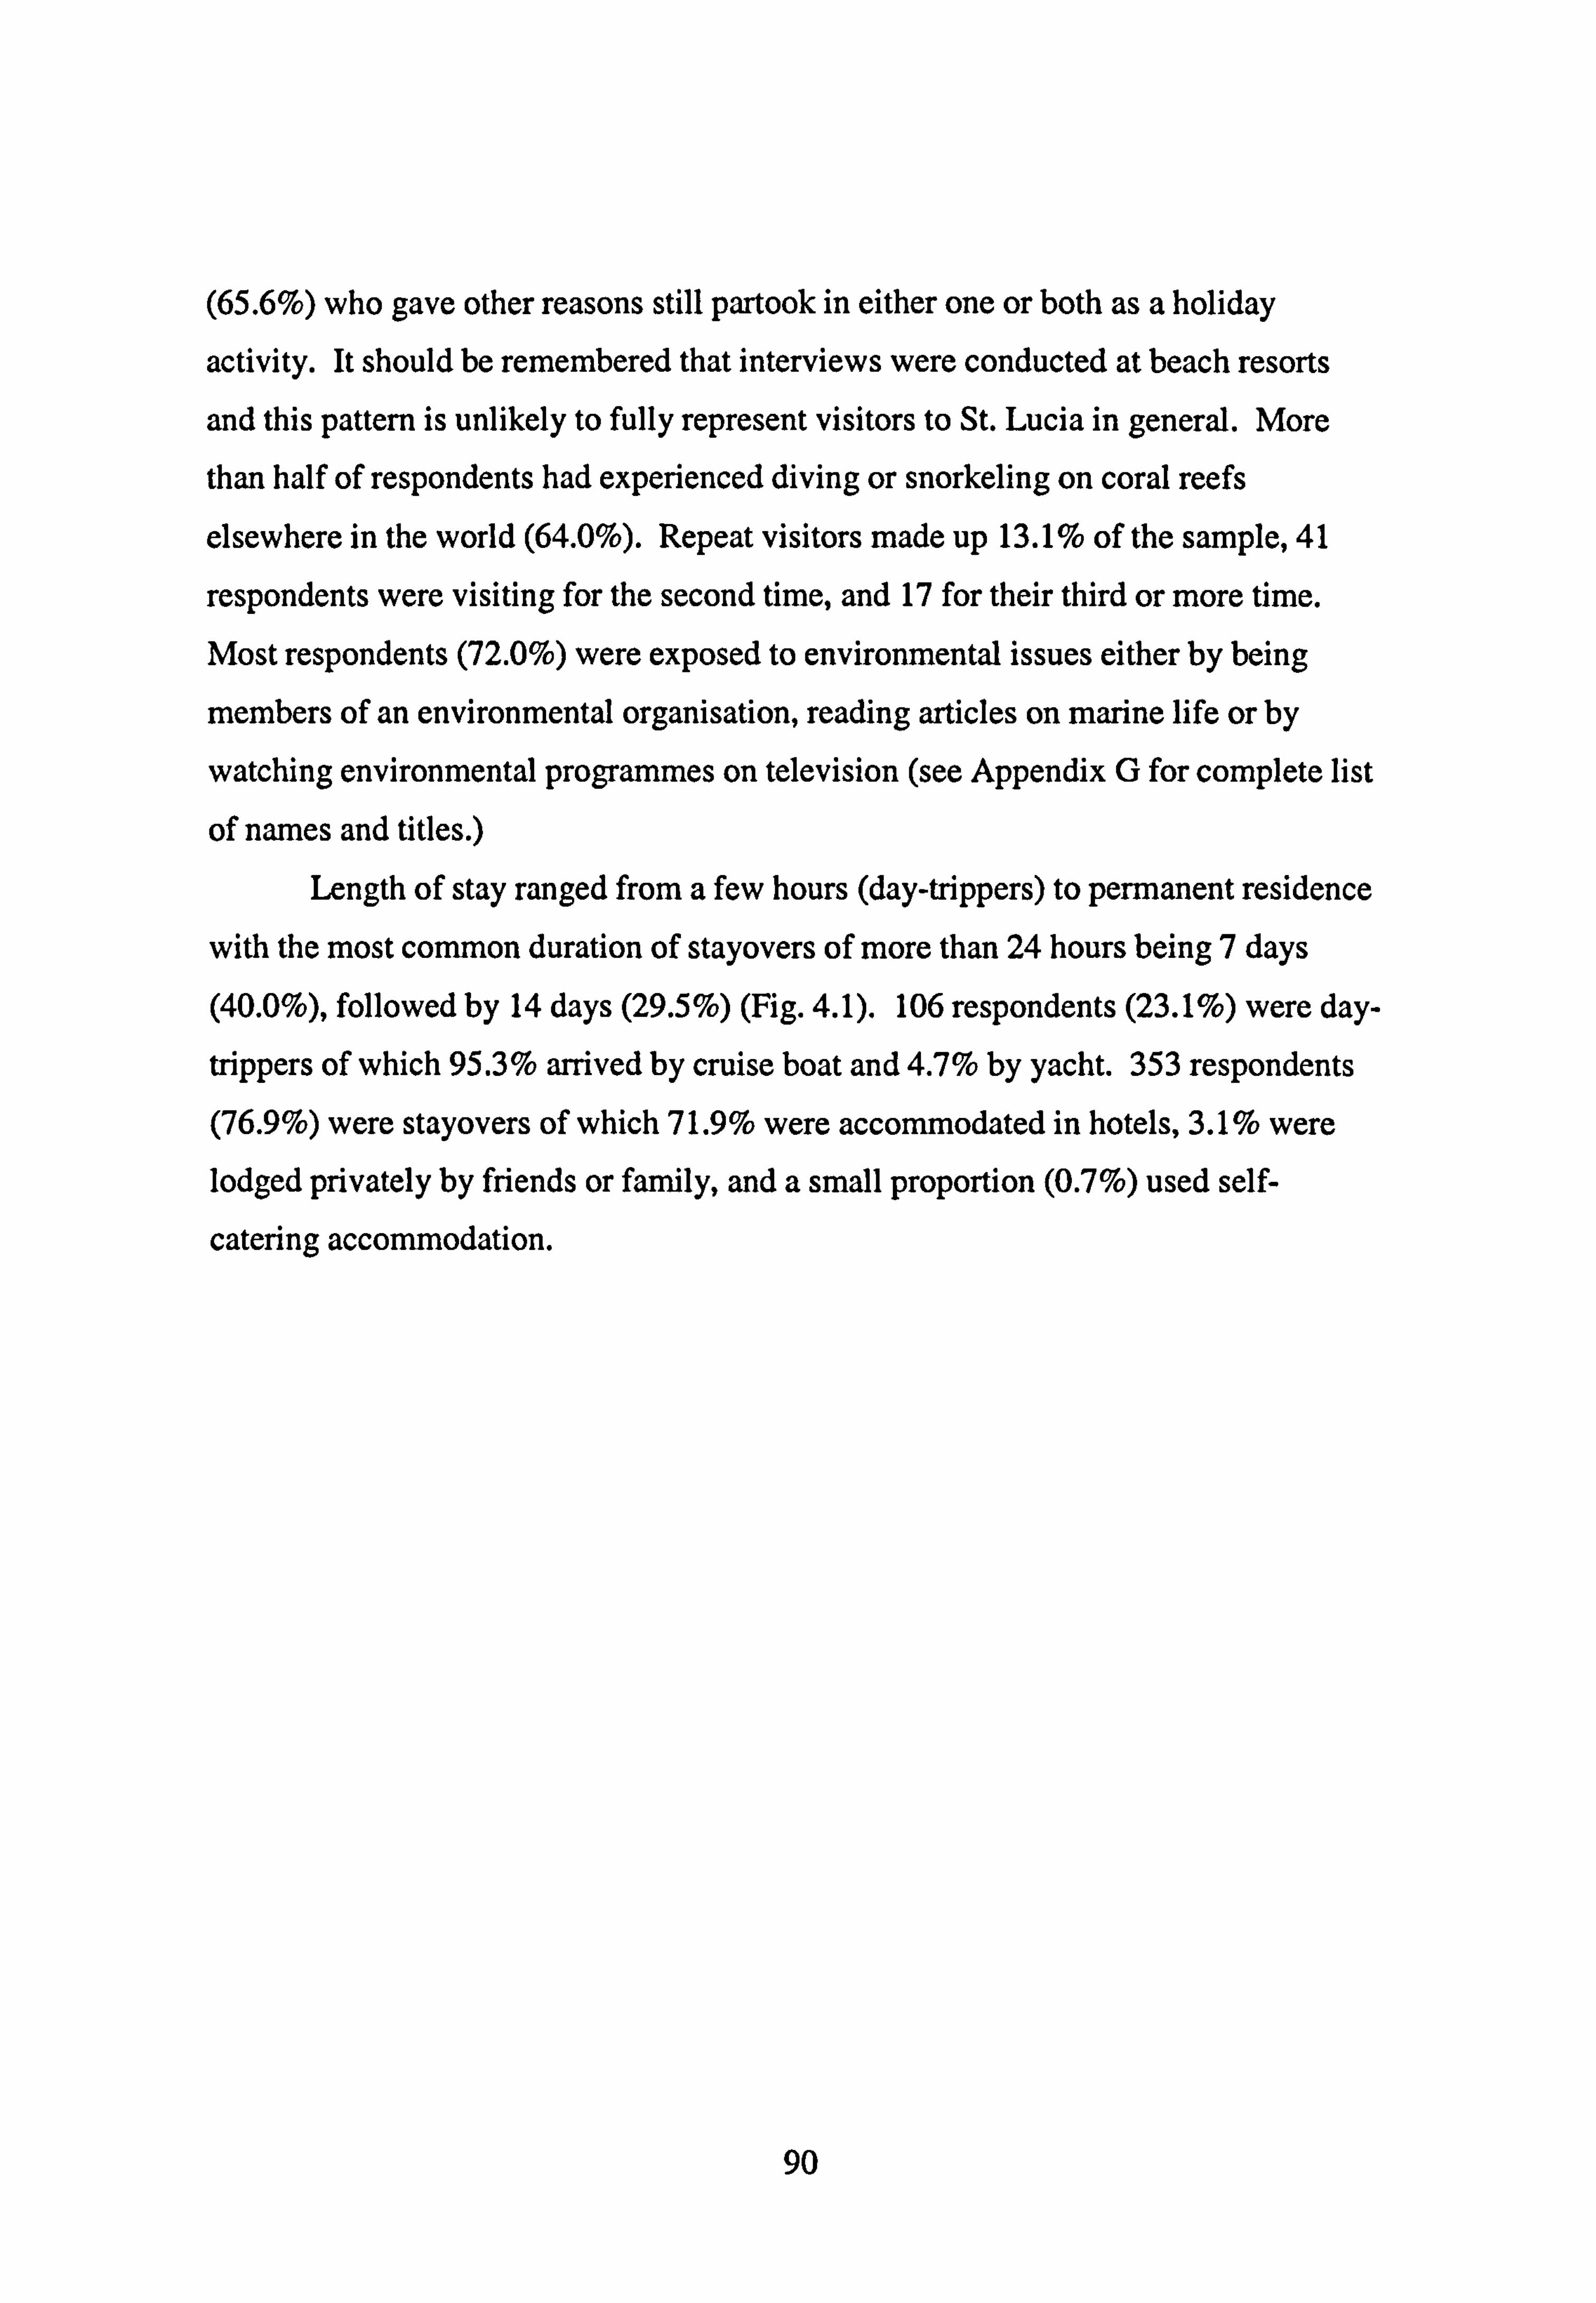
(65.6%) who gave other reasons still partook in either one or both as a holiday
activity. It should be remembered that interviews were conducted at beach resorts
and this pattern is unlikely to fully represent visitors to St. Lucia in general. More
than half of respondents had experienced diving or snorkeling on coral reefs
elsewhere in the world (64.0%). Repeat visitors made up 13.1% of the sample, 41
respondents were visiting for the second time, and 17 for their third or more time. Most respondents (72.0%) were exposed to environmental issues either by being
members of an environmental organisation, reading articles on marine life or by
watching environmental programmes on television (see Appendix G for complete list
of names and titles. )
Length of stay ranged from a few hours (day-trippers) to pen-nanent residence
with the most common duration of stayovers of more than 24 hours being 7 days
(40.0%), followed by 14 days (29.5%) (Fig. 4.1). 106 respondents (23.1%) were day-
trippers of which 95.3% arrived by cruise boat and 4.7% by yacht. 353 respondents (76.9%) were stayovers of which 71.9 % were accommodated in hotels, 3.1 % were lodged privately by friends or family, and a small proportion (0.7%) used self-
catering accommodation.
90
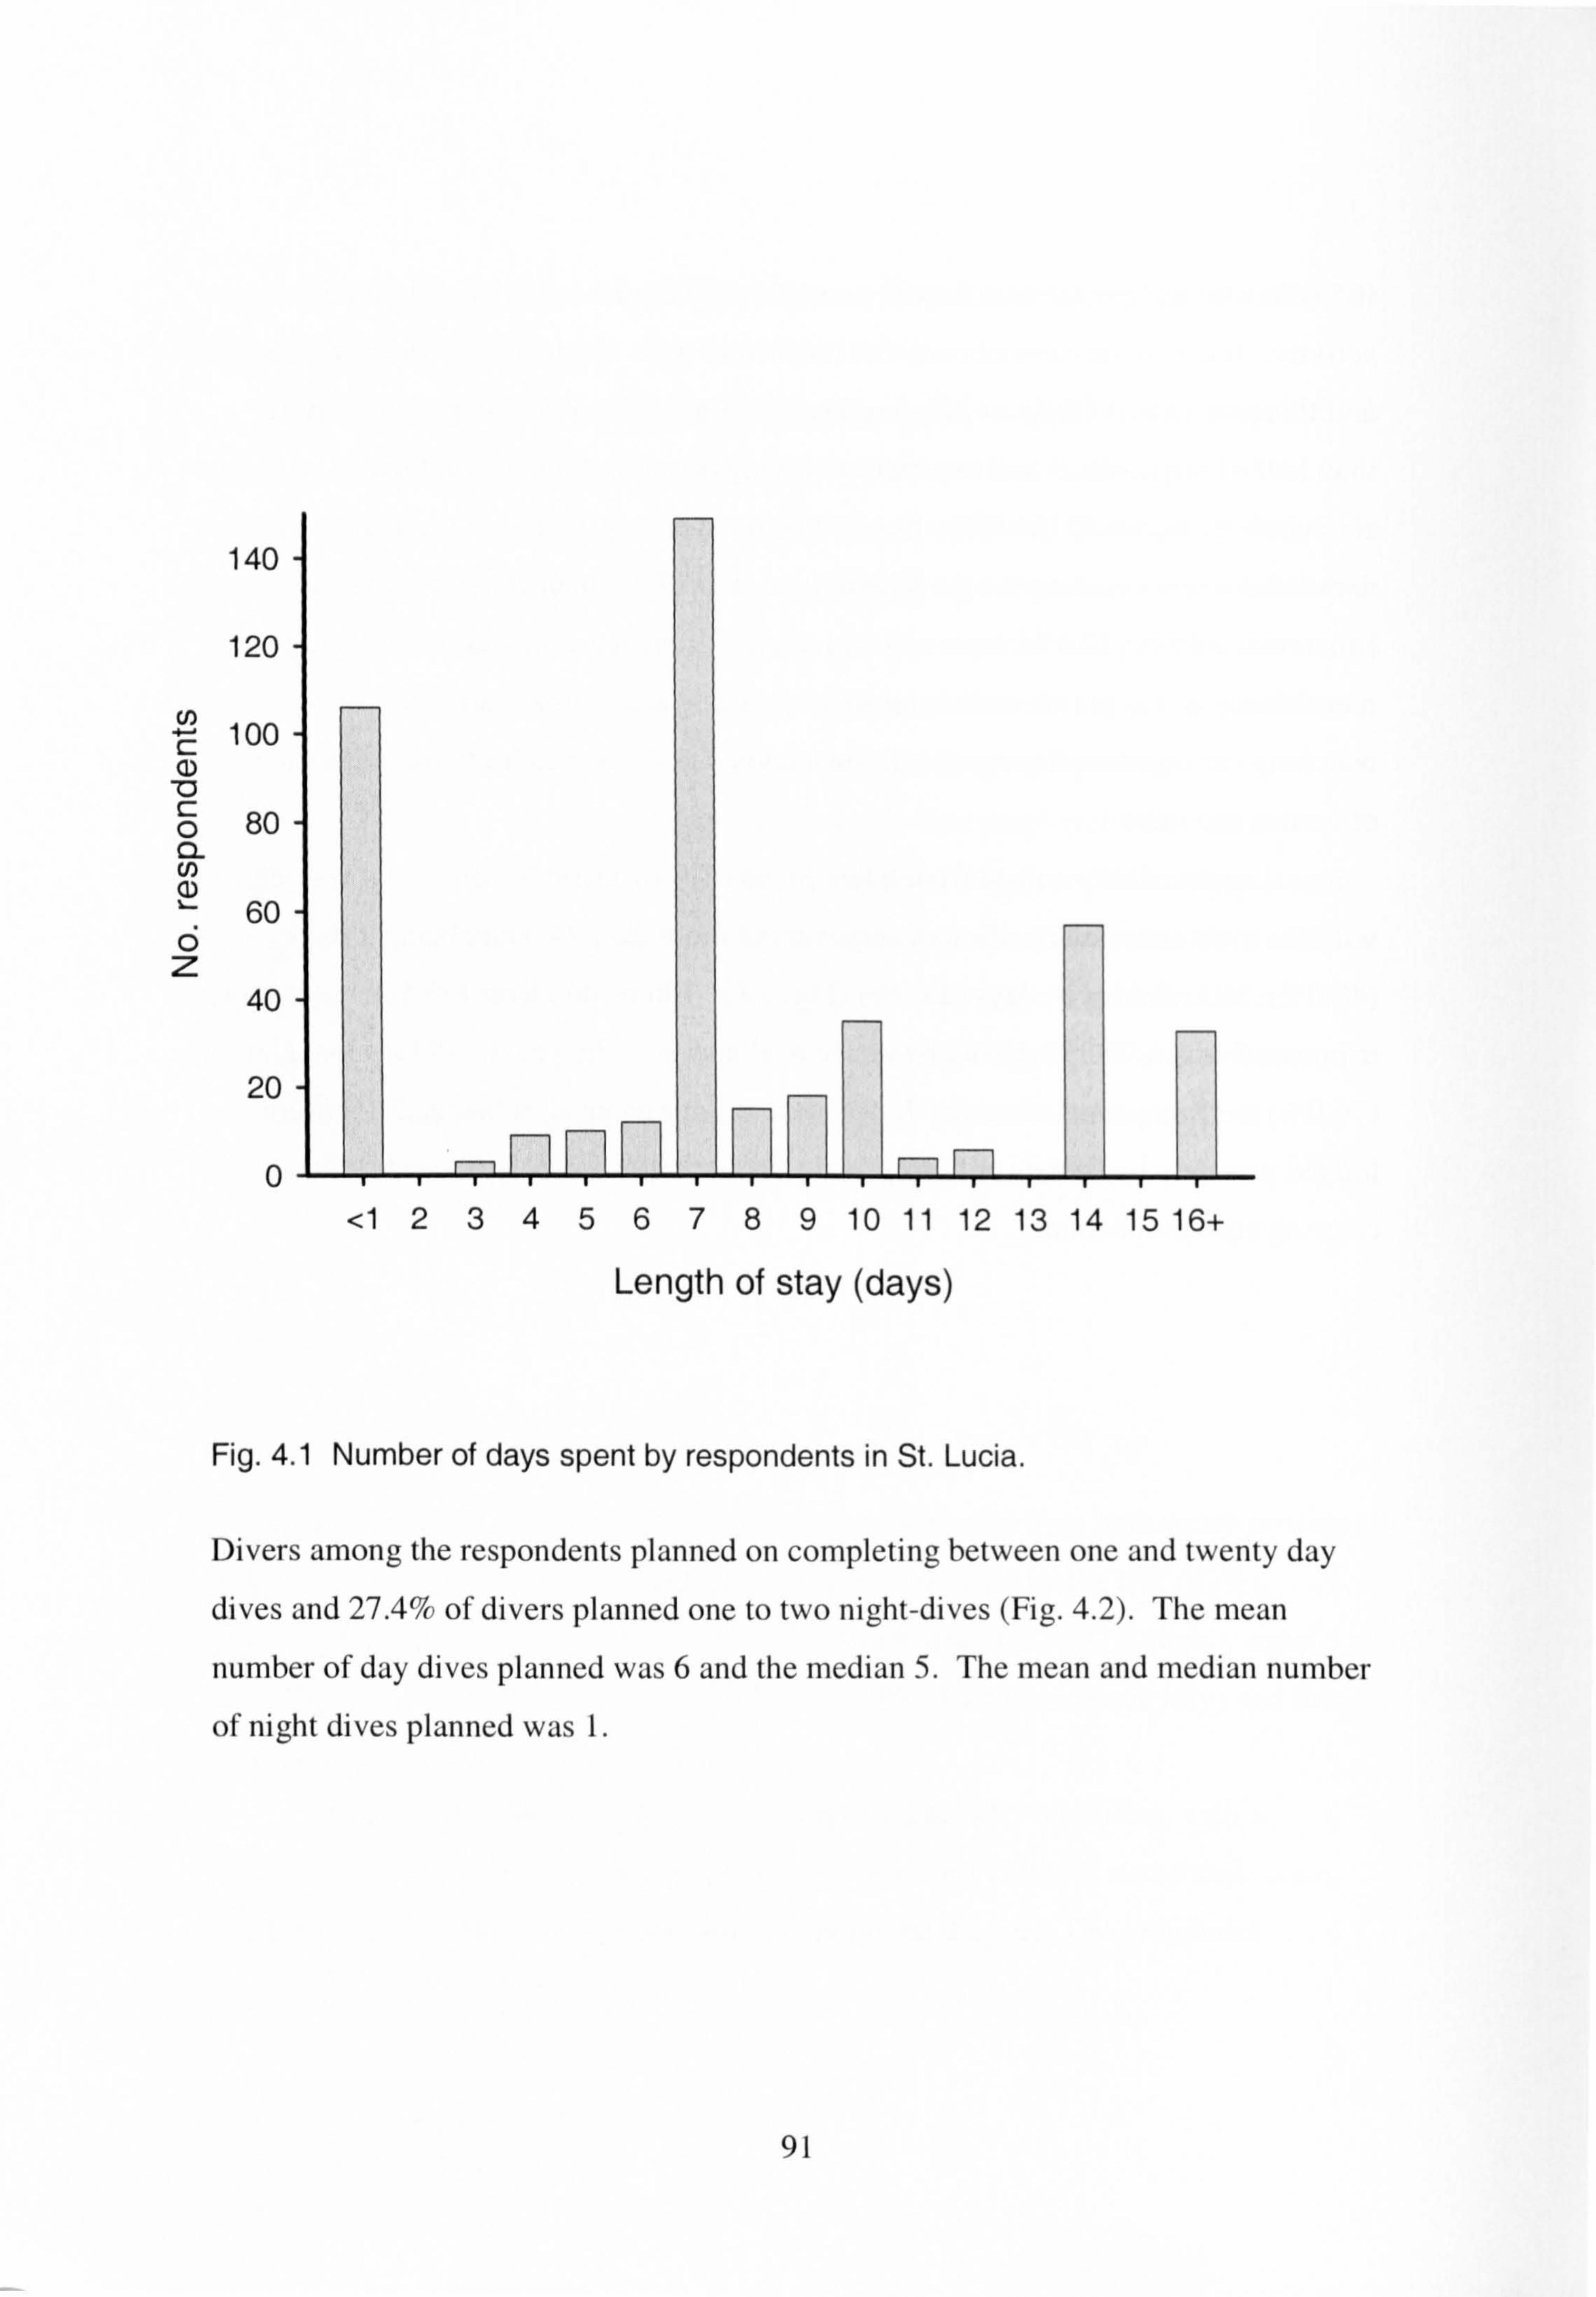
140
120
100
-0 r_ 0 80 0- (n
uu
40
20
0
Length of stay (days)
Fig. 4.1 Number of days spent by respondents in St. Lucia.
Divers among the respondents planned on completing between one and twenty day
dives and 27.4% of divers planned one to two night-dives (Fig. 4.2). The mean
number of day dives planned was 6 and the median 5. The mean and median number
of night dives planned was 1.
91
<1 23456789 10 11 12 13 14 15 16+
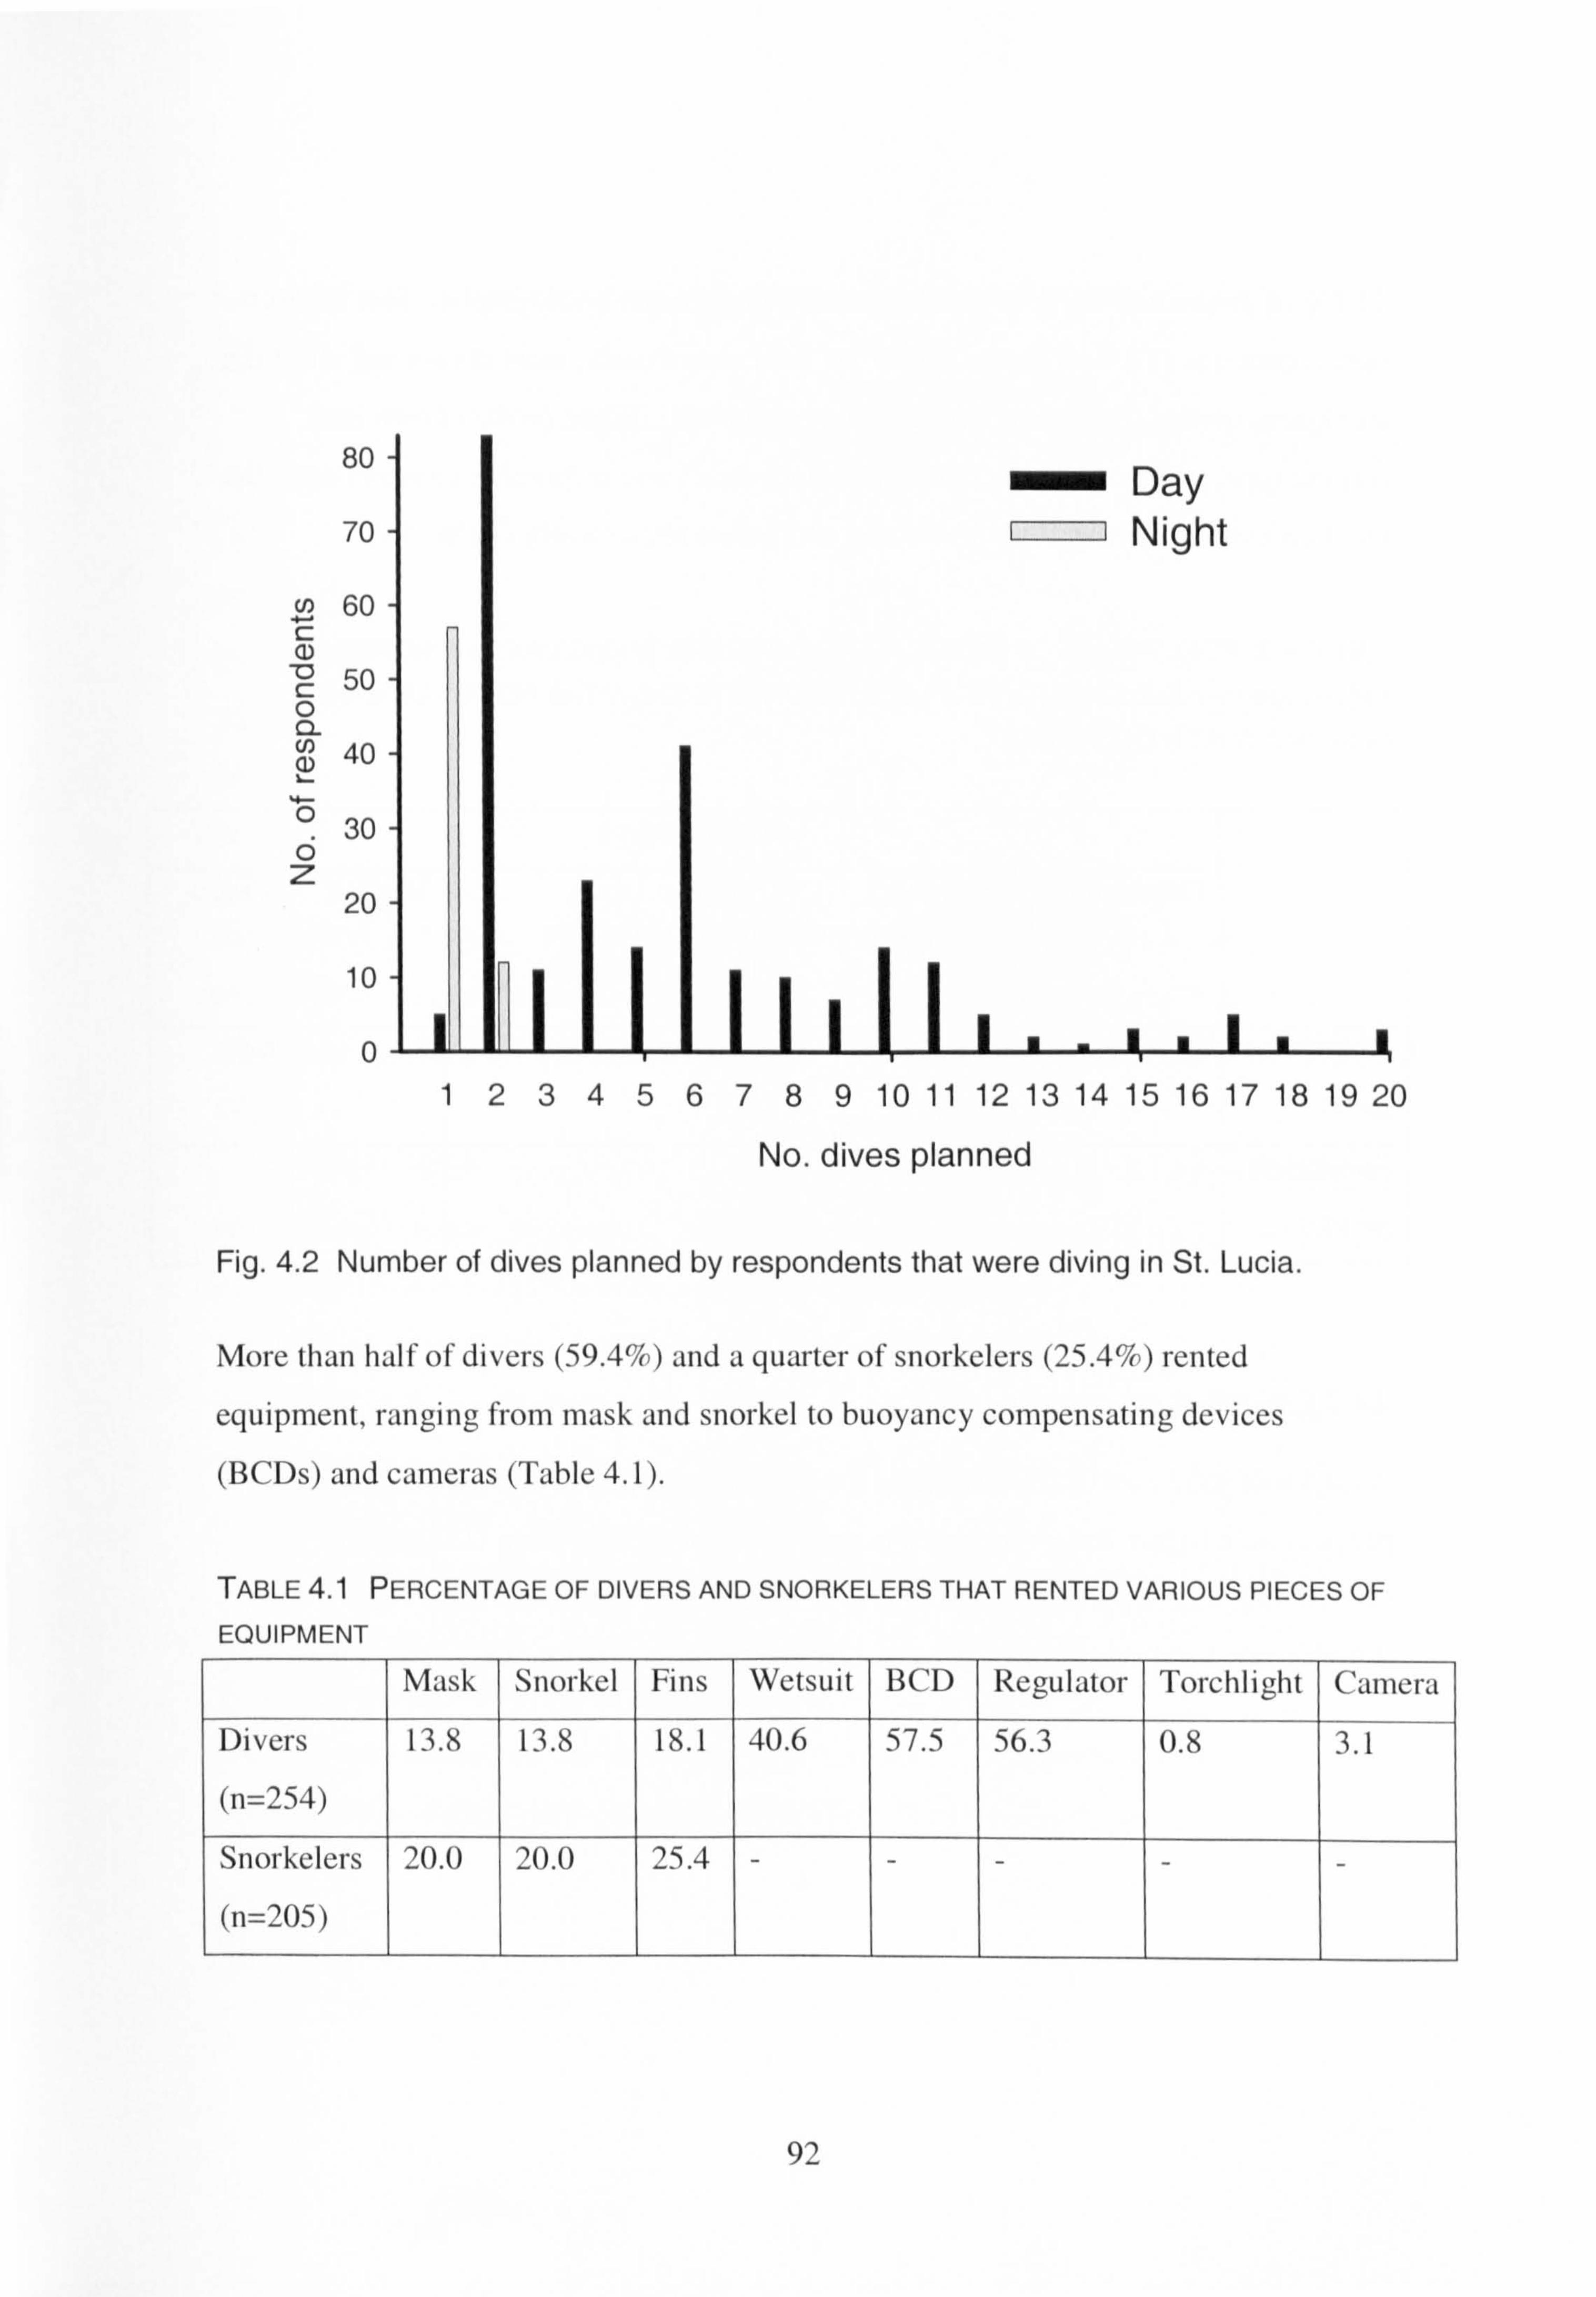
80
70
60
50 c 0 40
30 0 z
20
10
0
No. dives planned
Fig. 4.2 Number of dives planned by respondents that were diving in St. Lucia.
More than half ot'divers (59.4(/(, ) and a quarter of snorkelers (25.417c) rented
equipment, ranging fi-orn mask and snorkel to buoyancy compensating devices
(BCDs) and cameras (Table 4.1).
TABLE 4.1 PERCENTAGE OF DIVERS AND SNORKELERS THAT RENTED VARIOUS PIECES OF
EQUIPMENT
Mask Snorkel Fins Wetsuit BCD Regulator Torchlight Camera
Divers 13.8 13.8 18.1 40.6 57.5 56.3 0.8 3.1
(n=254)
Snorkelers 20.0 20.0 25.4 - - - - (n=205)
92
123456789 10 11 12 13 14 15 16 17 18 19 20
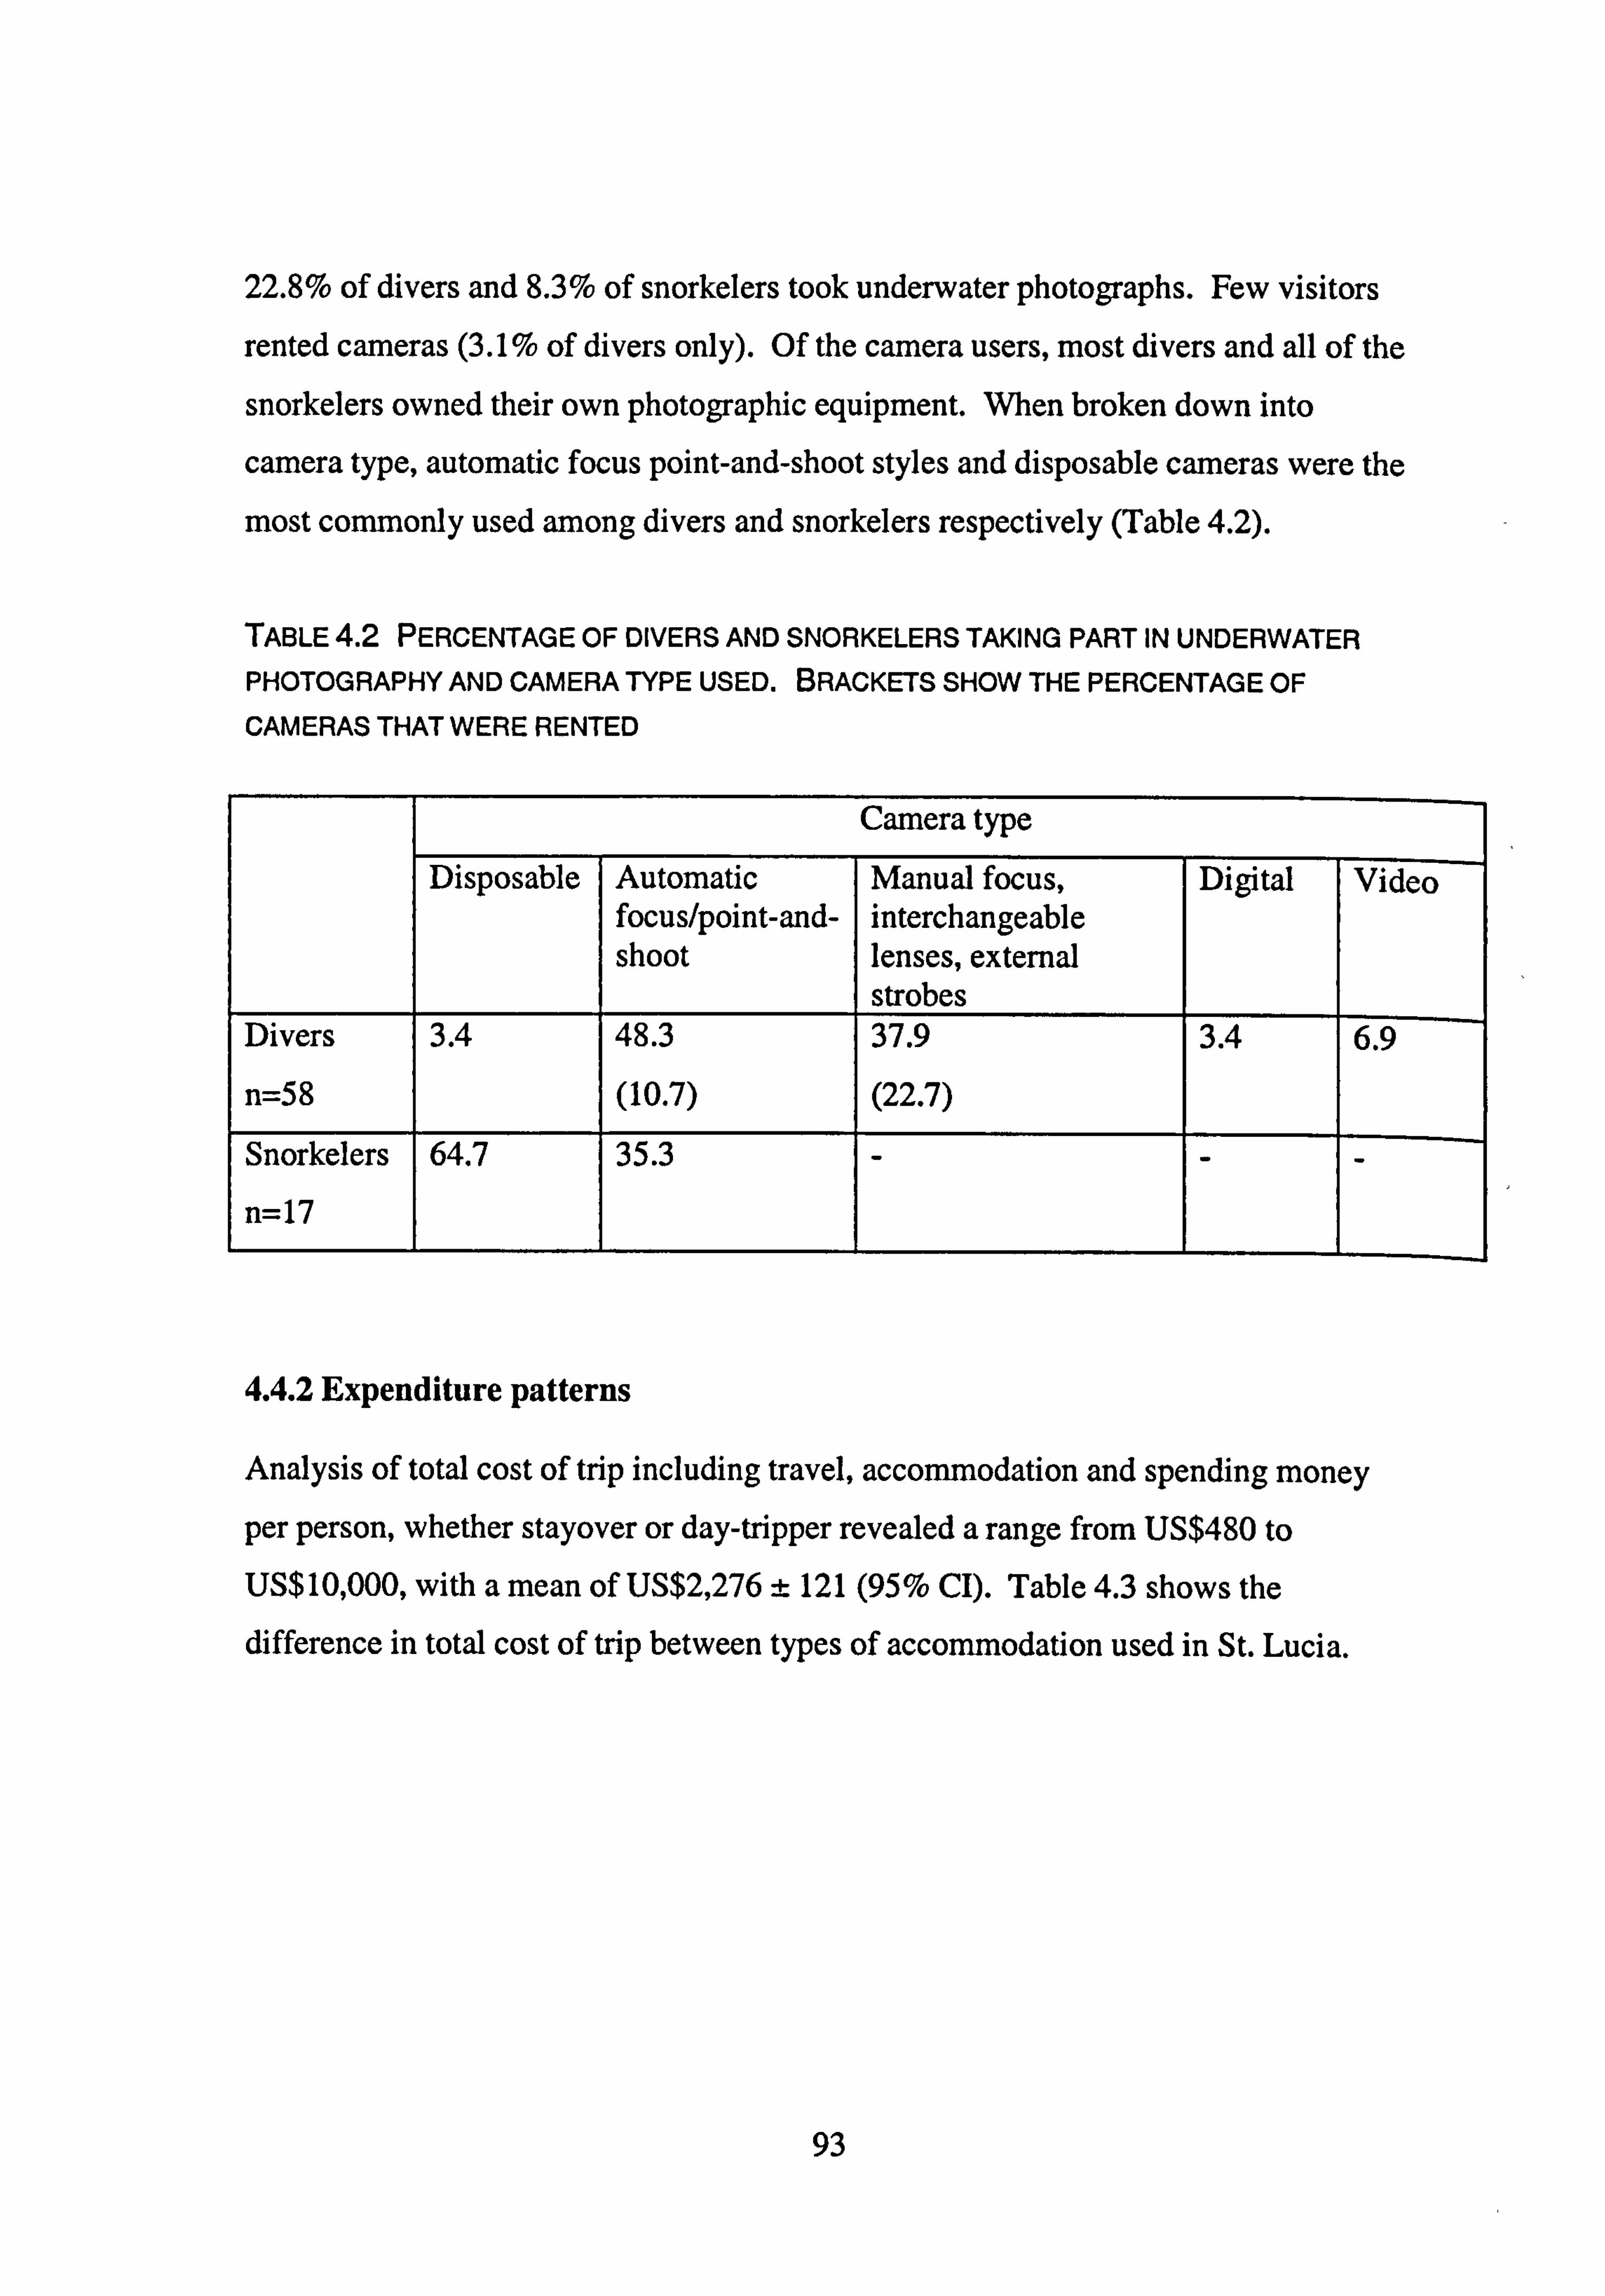
22.8% of divers and 8.3% of snorkelers took underwater photographs. Few visitors
rented cameras (3.1 % of divers only). Of the camera users, most divers and all of the
snorkelers owned their own photographic equipment. When broken down into
camera type, automatic focus point-and-shoot styles and disposable cameras were the
most commonly used among divers and snorkelers respectively (Table 4.2).
TABLE 4.2 PERCENTAGE OF DIVERS AND SNORKELERS TAKING PART IN UNDERWATER
PHOTOGRAPHY AND CAMERA TYPE USED. BRACKETS SHOW THE PERCENTAGE OF
CAMERAS THAT WERE RENTED
Carnera type
Disposable Automatic Manual focus, Digital Video focus/point-and- interchangeable shoot lenses, external
strobes Divers 3.4 48.3 37.9 3.4 6.9
n=58 (10.7) (22.7)
Snorkelers 64.7 35.3 - - n=17
4.4.2 Expenditure patterns
Analysis of total cost of trip including travel, accommodation and spending money per person, whether stayover or day-tripper revealed a range from US$480 to
US$ 10,000, with a mean of US$2,276 ± 121 (95% Cl). Table 4.3 shows the
difference in total cost of trip between types of accommodation used in St. Lucia.
93
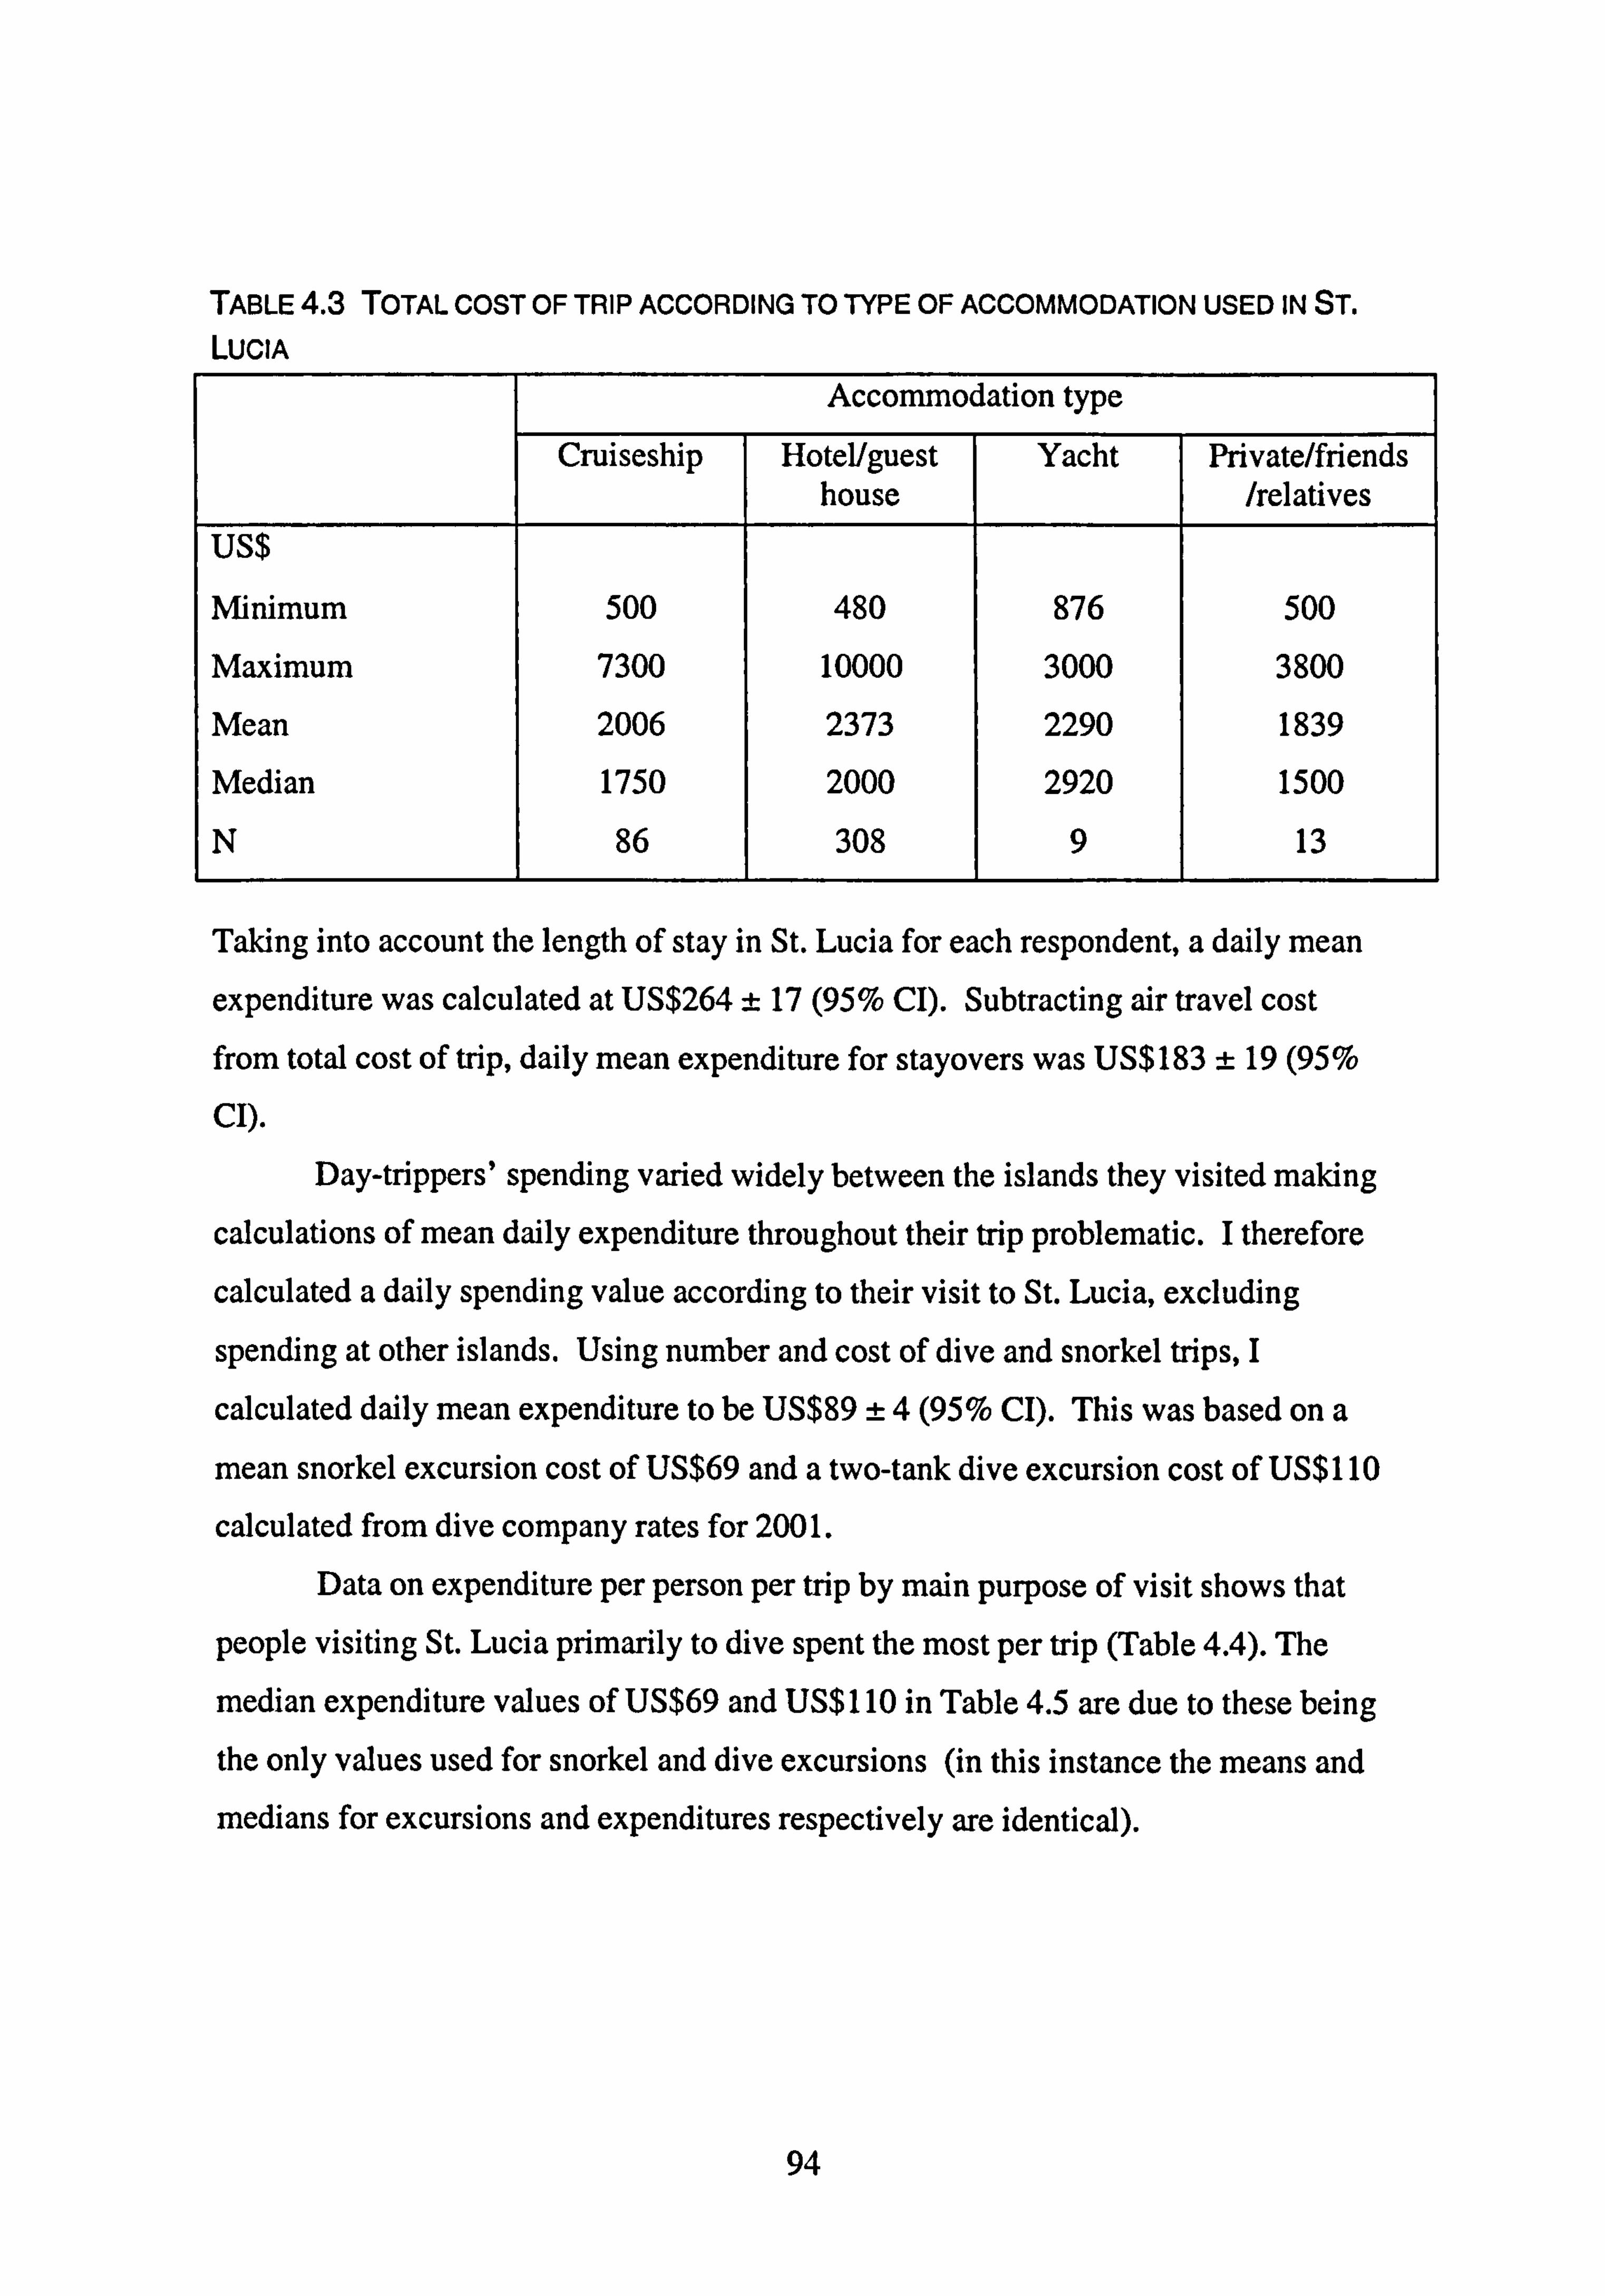
TABLE 4.3 TOTAL COST OF TRIP ACCORDING TO TYPE OF ACCOMMODATION USED IN ST. LUCIA
Accommodation type
Cruiseship Hotel/guest Yacht Private/friends house /relatives
US$
Minimum 500 480 876 500
Maximum 7300 10000 3000 3800
Mean 2006 2373 2290 1839
Median 1750 2000 2920 1500
N 86 308 9 13
Taking into account the length of stay in St. Lucia for each respondent, a daily mean
expenditure was calculated at US$264 ± 17 (95% Q. Subtracting air travel cost from total cost of trip, daily mean expenditure for stayovers was US$183 ± 19 (95%
CI). Day-trippers' spending varied widely between the islands they visited making
calculations of mean daily expenditure throughout their trip problematic. I therefore
calculated a daily spending value according to their visit to St. Lucia, excluding
spending at other islands. Using number and cost of dive and snorkel trips, I
calculated daily mean expenditure to be US$89 ±4 (95% Q. This was based on a
mean snorkel excursion cost of US$69 and a two-tank dive excursion cost of US$I 10
calculated from dive company rates for 2001.
Data on expenditure per person per trip by main purpose of visit shows that
people visiting St. Lucia primarily to dive spent the most per trip (Table 4.4). The
median expenditure values of US$69 and US$I 10 in Table 4.5 are due to these being
the only values used for snorkel and dive excursions (in this instance the means and
medians for excursions and expenditures respectively are identical).
94
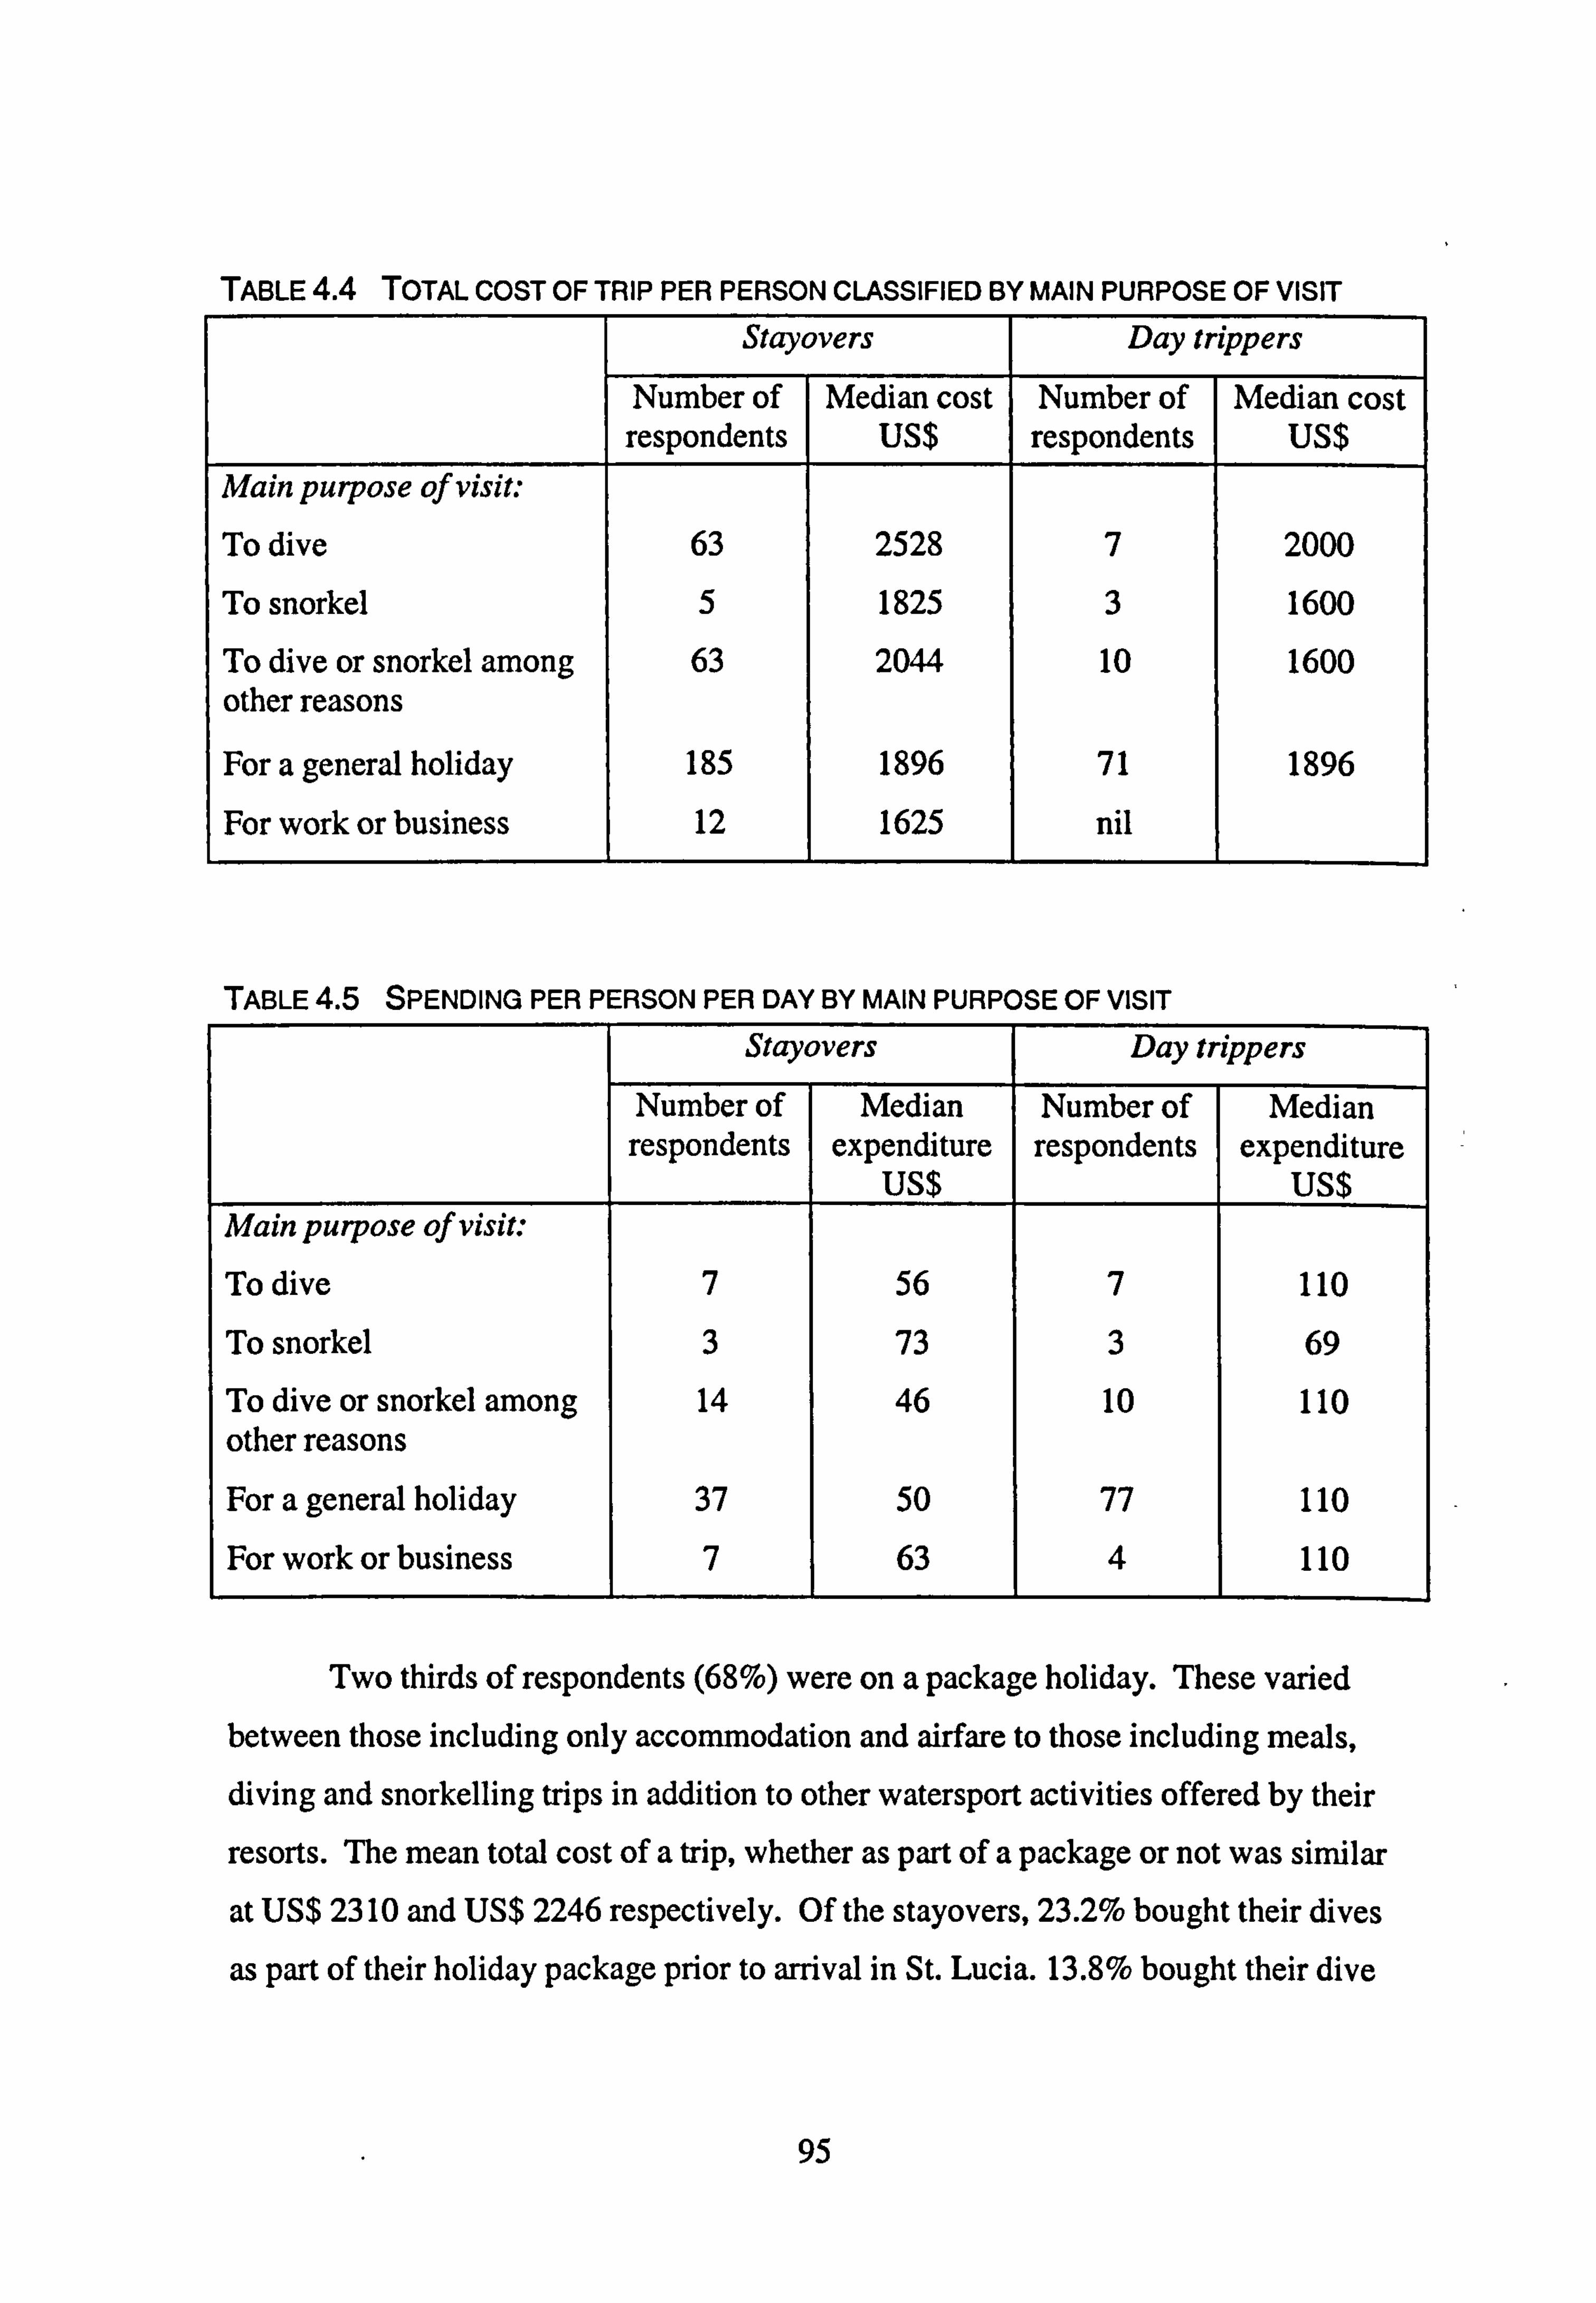
TABLE4.4 TOTAL COST OF TRIPPER PERSON CLASSIFIED BY MAIN PURPOSE OF VISIT Stayovers Day trippers
Number of Median cost Number of Median cost respondents US$ respondents US$
Main purpose of visit: To dive 63 2528 7 2000
To snorkel 5 1825 3 1600
To dive or snorkel among 63 2044 10 1600 other reasons
For a general holiday 185 1896 71 1896
For work or business 12 1625 nil
TABLE 4.5 SPENDING PER PERSON PER DAY BY MAIN PURPOSE OF VISIT
Stayovers Day trippers
Number of Median Number of Median respondents expenditure respondents expenditure
US$ US$ Main purpose of visit. -
To dive 7 56 7 110
To snorkel 3 73 3 69
To dive or snorkel among 14 46 10 110 other reasons
For a general holiday 37 50 77 110
For work or business 63 4 110
Two thirds of respondents (68%) were on a package holiday. These varied between those including only accommodation and airfare to those including meals, diving and snorkelling trips in addition to other watersport activities offered by their
resorts. The mean total cost of a trip, whether as part of a package or not was similar at US$ 23 10 and US$ 2246 respectively. Of the stayovers, 23.2% bought their dives
as part of their holiday package prior to arrival in St. Lucia. 13.8% bought their dive
95
package on arrival directly from the diving company. The remainder bought
individual dive trips, usually on a daily basis. All cruiseship visitors arranged dive
and snorkel trips through their ship's on-board excursion office.
4.4.3 The SMMA and visitor's willingness to pay fees
139 (43.7%) respondents said they visited St. Lucia because of the existence of the
marine park with proportionally more divers (50.3%) than snorkelers (37.9%) doing
so. A small proportion of divers (11.4%) and snorkelers (16.6%) did not know of the
existence of the marine park prior to their visit. At the time of the research, marine park fees were US$4 and US$12 per diver
(daily and annual fee respectively) and US$I per snorkeler (daily fee available only). Over 90% of divers and snorkelers were willing to pay more than the stated daily and
annual fees (Fig. 4.3). Seventy five percent of divers were willing to pay at least
US$6 for a daily fee, and 50% US$7. Seventy five percent of divers were willing to
pay at least US$20 for an annual fee and 50% US$30. Seventy five percent of
snorkelers (and up to 91.5%) were willing to pay at least US$2 per day, double the
current fee and 50% US$4. Although an annual fee is currently not available to
snorkelers due to a perceived lack of demand and uneconomical returns (Kai Wulf,
pers. comm. ), 40.5% of respondents said they would like such an option. Seventy
five percent were willing to pay at least US$ 10 for it, and 50% US$20.
96
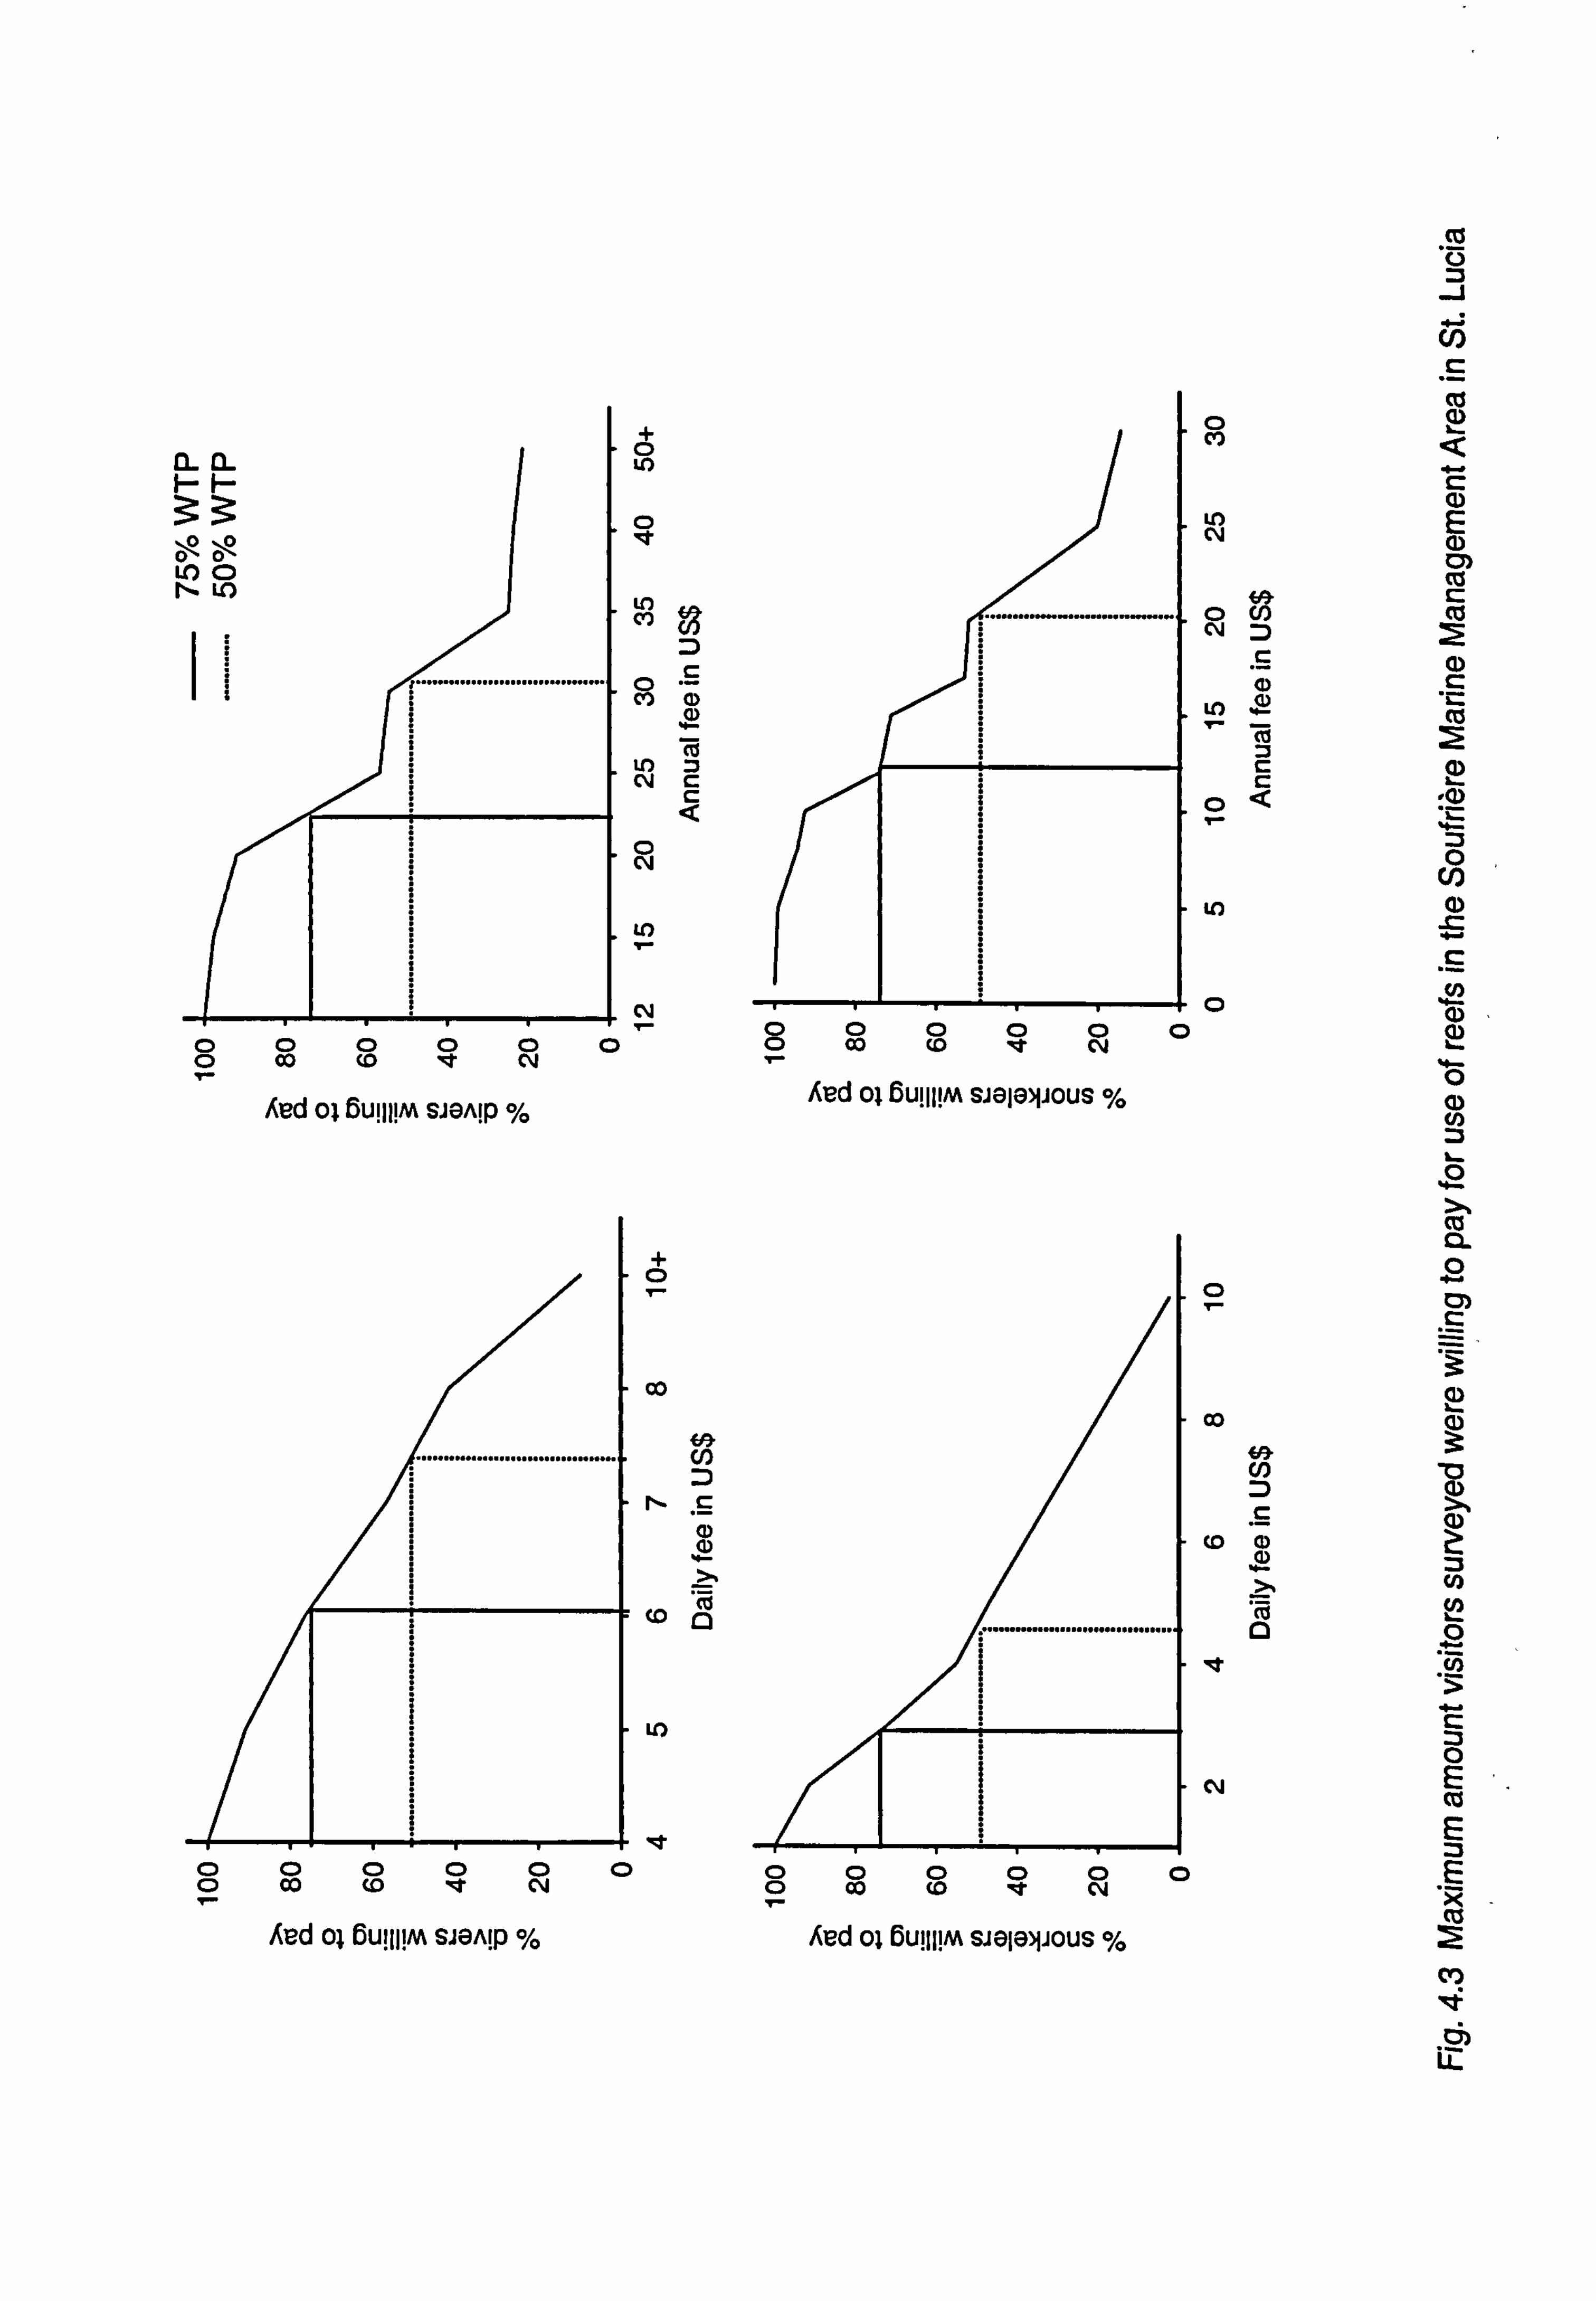
C I. C
C L
r
C) 0 C) 00 0 CC) (D I-T 04
Aed 01 6UIII! M SJeAlp %
.0 LO
LO EI
cl r CI) (D
-2 cu
to = CM c
C cli
CM
. co
4a cn
(D
CC) im
LO
0 cl
Lf) N
0 C'4
4) Lo
LO
+0 0
0
00
CC) cl)
04
cu 0 :3
CO
c
cts
cz c cu
ca
4- 0 (D
CO C)L
(0)
CIII. 2 CO
:3 0 E cri E :3 E .. q cu z
cr)
000000 0 Co (0 le C\i
Äud ol 6u111! m sieleijous
co co It C\l
hed 01 BUIIJIM SJGAIP %
00000 0 Co Co CY
At, d ol ßulil! m sieleljous %
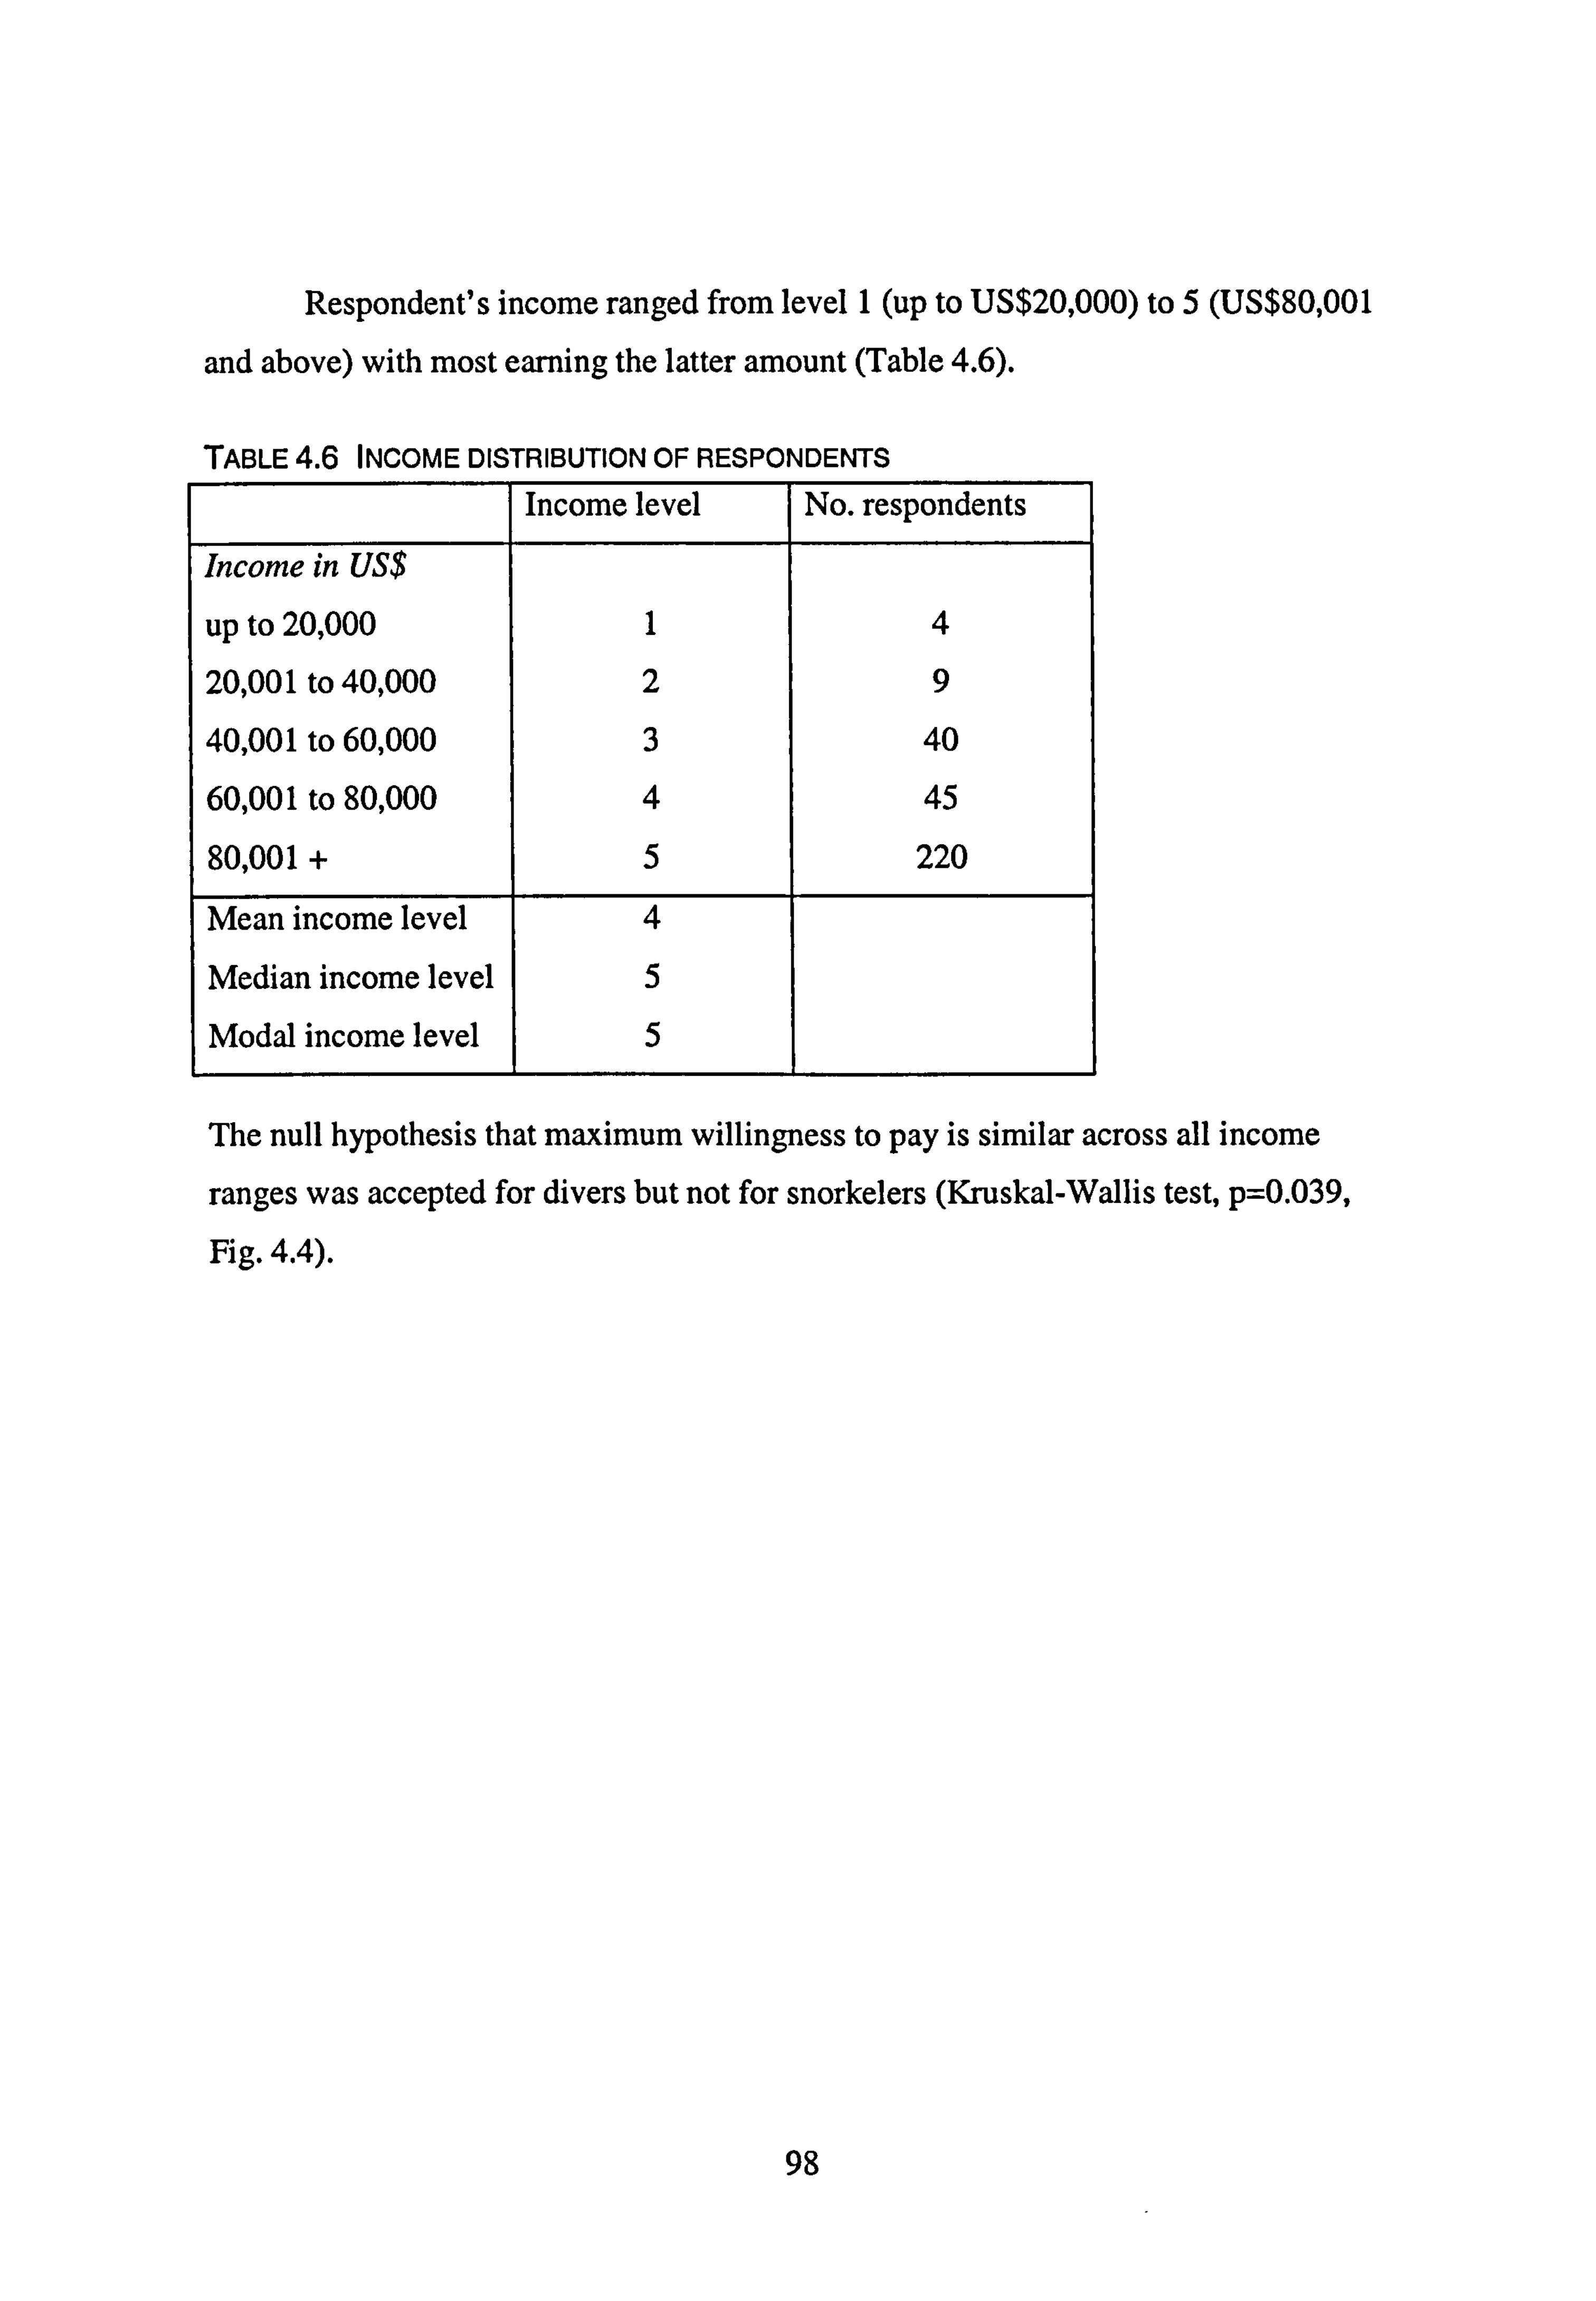
Respondent's income ranged from level 1 (up to US$20,000) to 5 (US$80,001
and above) with most earning the latter amount (Table 4.6).
TABLE 4.6 INCOME DISTRIBUTION OF RESPONDENTS
Income level No. respondents
Income in US$
up to 20,000 1 4
20,001 to 40,000 2 9
40,001 to 60,000 3 40
60,001 to 80,000 4 45
80,001+ 5 220
Mean income level 4
Median income level 5
Modal income level 5
The null hypothesis that maximum willingness to pay is similar across all income
ranges was accepted for divers but not for snorkelers (Kruskal-Wallis test, p=0.039,
Fig. 4.4).
98
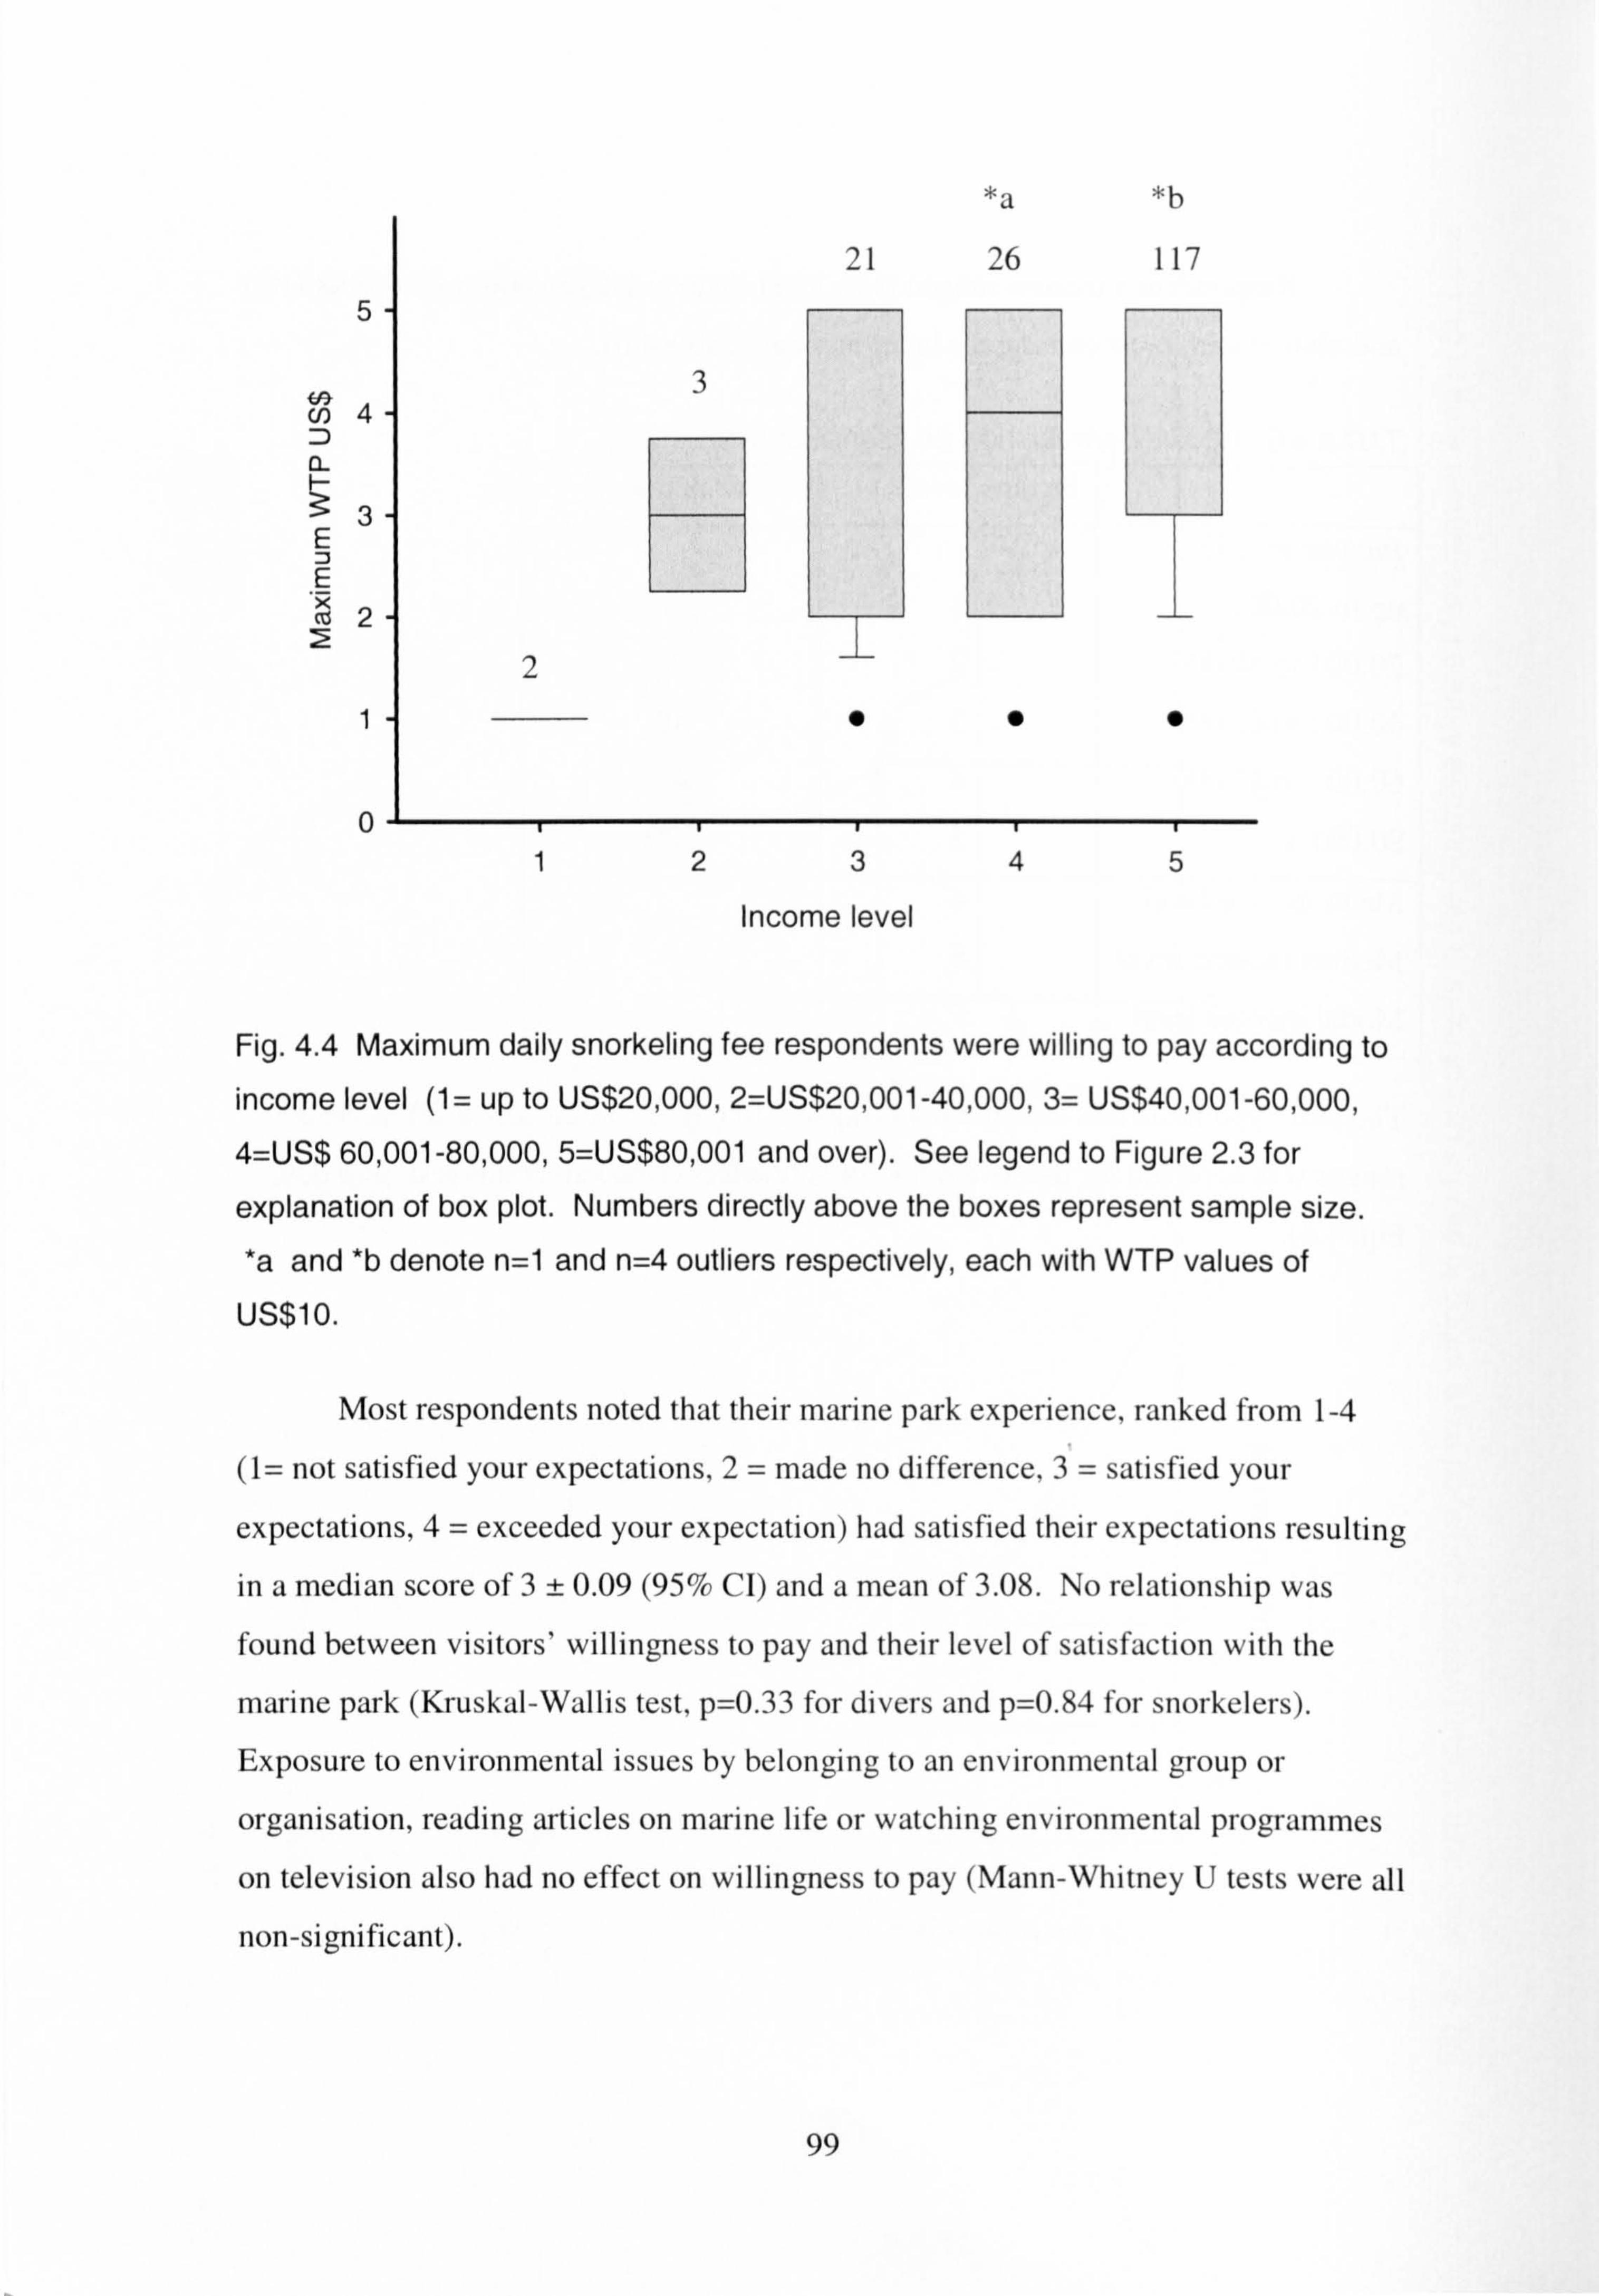
Fig. 4.4 Maximum daily snorkeling fee respondents were willing to pay according to income level (1 = up to US$20,000,2=US$20,001-40,000,3= US$40,001-60,000,
4=US$ 60,001-80,000,5=US$80,001 and over). See legend to Figure 2.3 for
explanation of box plot. Numbers directly above the boxes represent sample size. *a and *b denote n=1 and n=4 outliers respectively, each with WTP values of US$1 0.
Most respondents noted that their marine park experience, ranked from 1-4
(1= not satisfied your expectations, 2= made no difference, 3= satisfied your
expectations, 4= exceeded your expectation) had satisfied their expectations resulting
in a median score of 3±0.09 (95% CI) and a mean of 3.08. No relationship was found between visitors' willingness to pay and their level of satisfaction with the
marine park (Kruskal-Wallis test, p=0.33 for divers and p=0.84 for snorkelers). Exposure to environmental issues by belonging to an environmental group or
organisation, reading articles on marine life or watching environmental programmes
on television also had no effect on willingness to pay (Mann-Whitney U tests were all
non-significant).
99
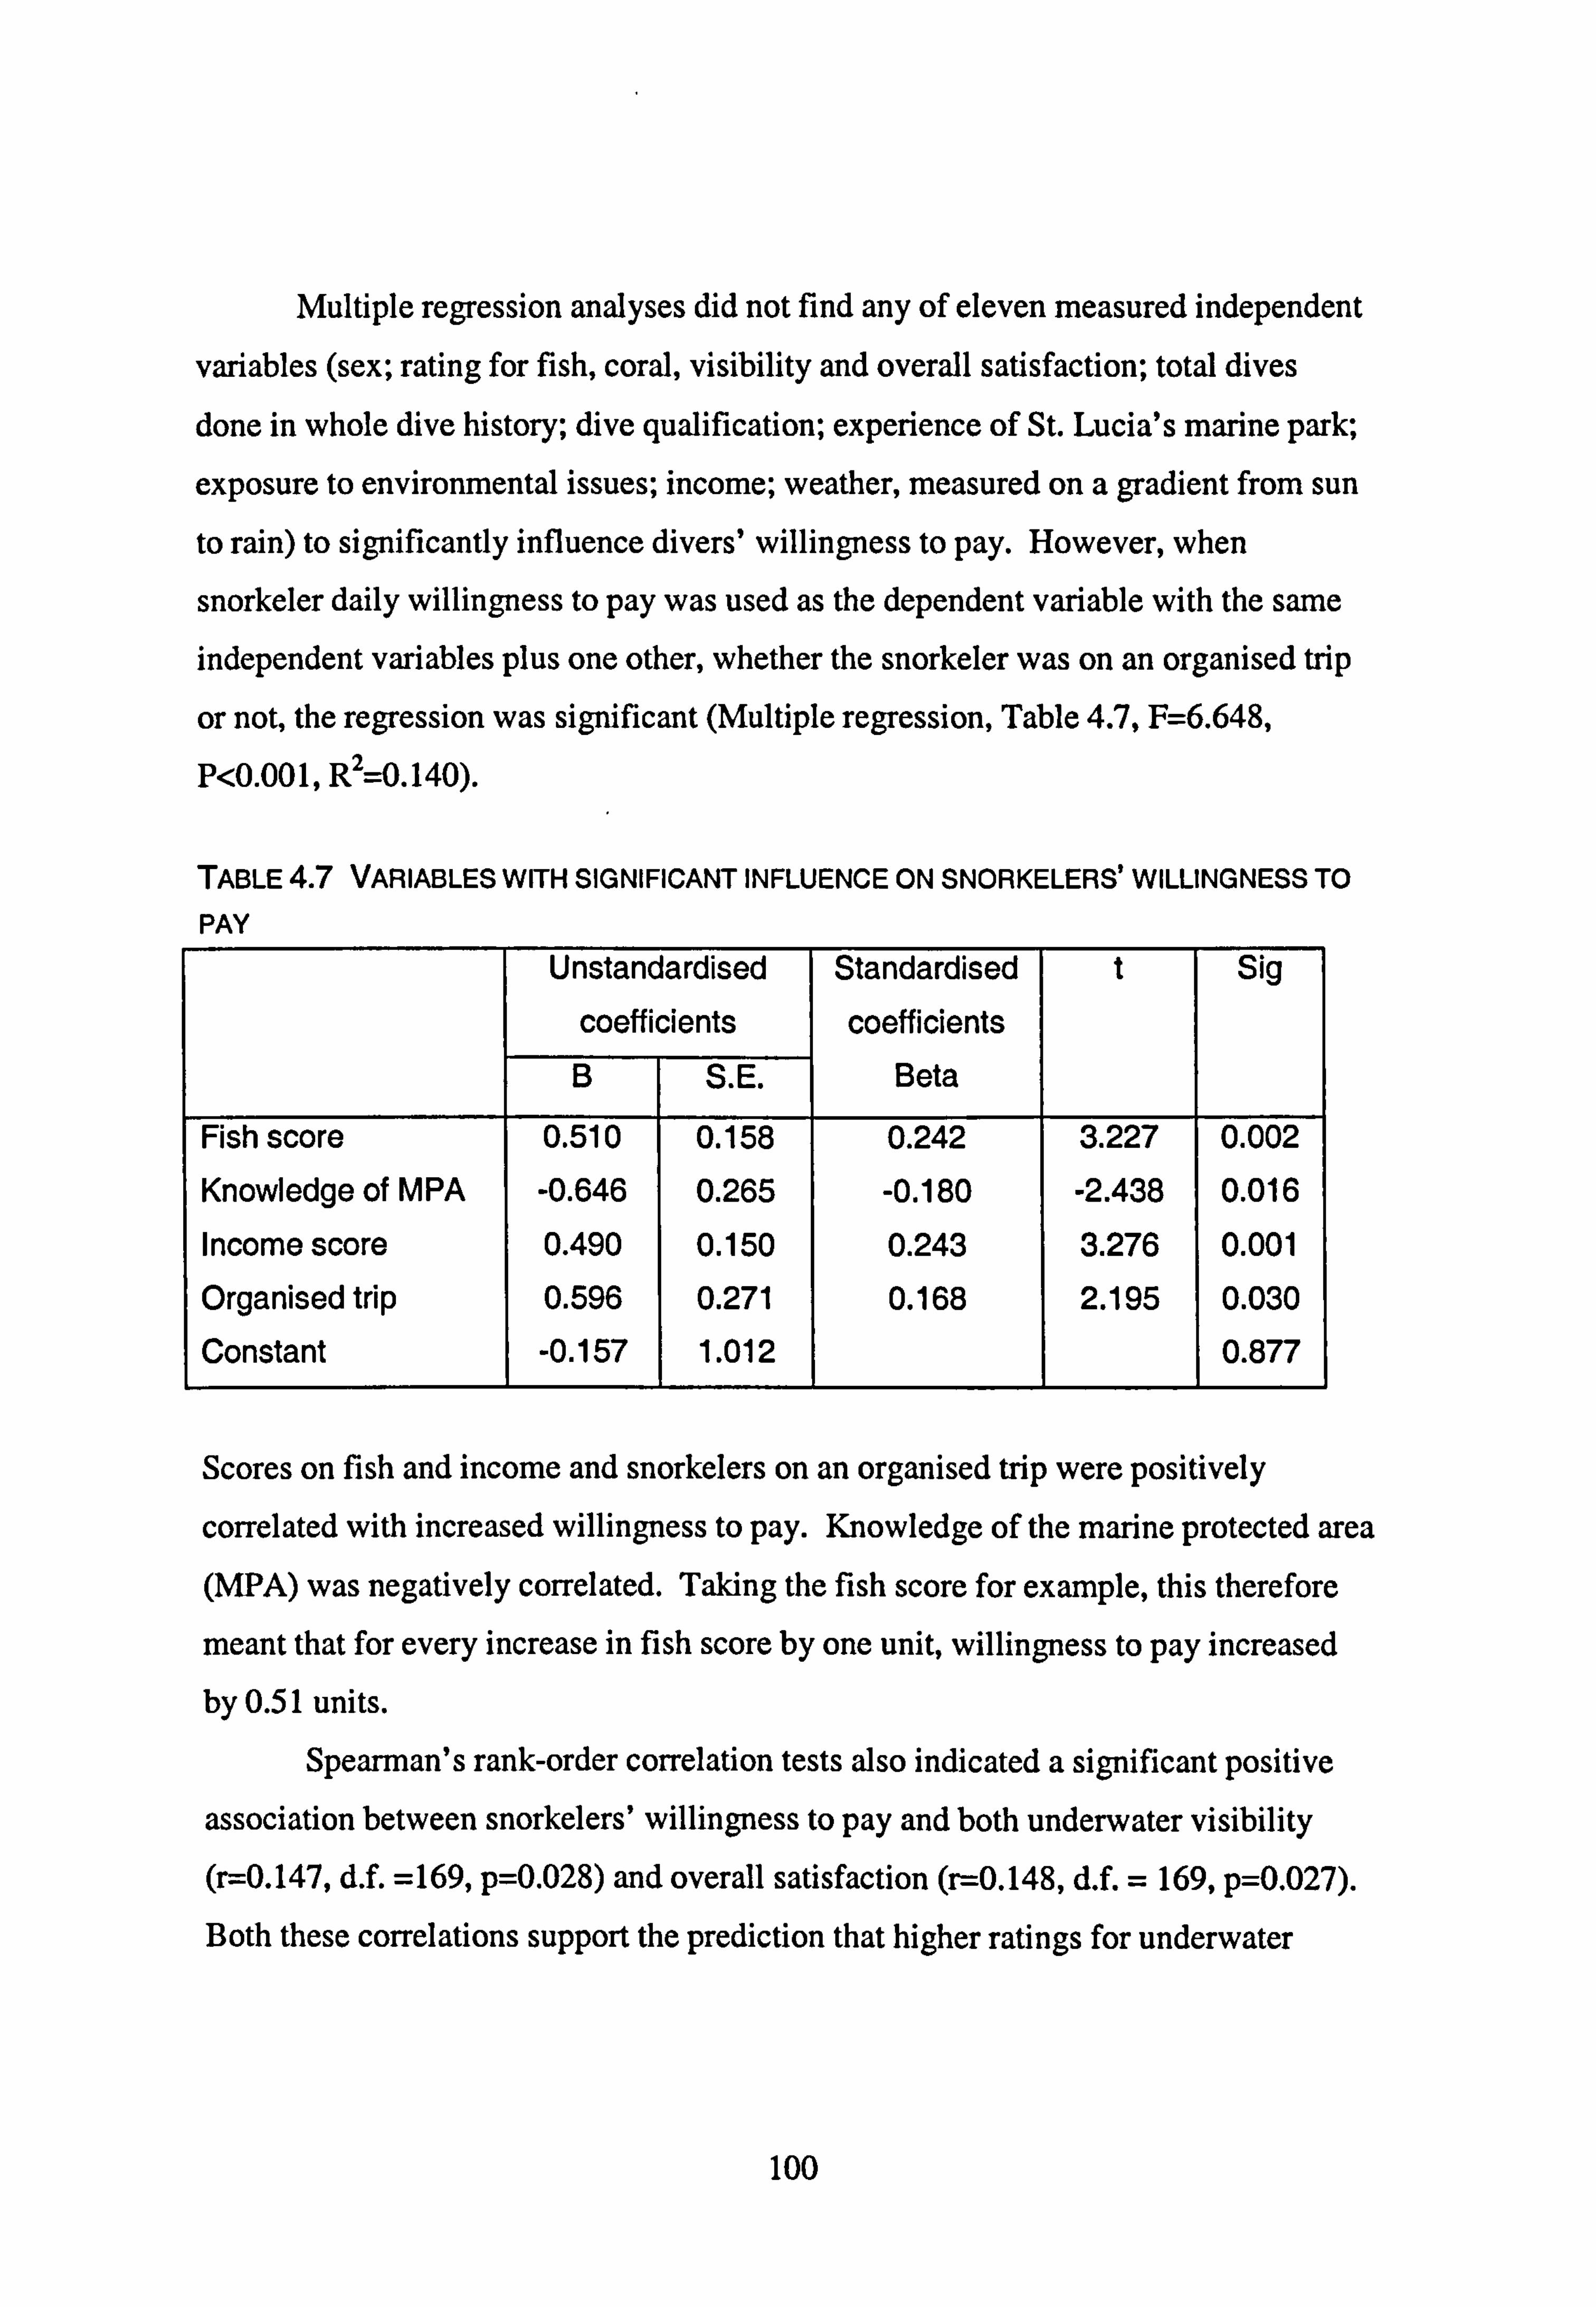
Multiple regression analyses did not find any of eleven measured independent
variables (sex; rating for fish, coral, visibility and overall satisfaction; total dives
done in whole dive history; dive qualification; experience of St. Lucia's marine park;
exposure to environmental issues; income; weather, measured on a gradient from sun
to rain) to significantly influence divers' willingness to pay. However, when
snorkeler daily willingness to pay was used as the dependent variable with the smne
independent variables plus one other, whether the snorkeler was on an organised trip
or not, the regression was significant (Multiple regression, Table 4.7, F=6.648,
P<0.001, R2--0.140).
TABLE 4.7 VARIABLES WITH SIGNIFICANT INFLUENCE ON SNORKELERS' WILLINGNESS TO
PAY
Unstandardised
coeff icients
Standardised
coefficients
t Sig
B S. E. Beta
Fish score 0.510 0.158 0.242 3.227 0.002
Knowledge of MPA -0.646 0.265 -0.180 -2.438 0.016
Income score 0.490 0.150 0.243 3.276 0.001
Organised trip 0.596 0.271 0.168 2.195 0.030
Constant -0.157 1.012 0.877
Scores on fish and income and snorkelers on an organised trip were positively correlated with increased willingness to pay. Knowledge of the marine protected area (MPA) was negatively correlated. Taking the fish score for example, this therefore
meant that for every increase in fish score by one unit, willingness to pay increased
by 0.51 units. Spearman's rank-order correlation tests also indicated a significant positive
association between snorkelers' willingness to pay and both underwater visibility (r--O. 147, d. f. = 169, p=0.028) and overall satisfaction (r--O. 148, d. f. = 169, p=0.027). Both these correlations support the prediction that higher ratings for underwater
100
visibility and overall satisfaction would correlate with higher willingness to pay
values, but they account for only 2% (r2=0.02 for each) of the variability in maximum
willingness to pay. This leaves 98% of the variability still to be accounted for by
other variables. Divers' and snorkelers' willingness to pay daily fees were also positively
correlated with their willingness to pay their respective annual fees (Spearman's
rank-order correlation, r--0.527, d1=172, p<0.001 and r--0.568, d1=104, p<0.001
respectively). Thus, those divers and snorkelers willing to pay more for daily fees
were also willing to pay more for annual fees.
When respondents were asked to give proposed SMMA programs a score
according to whether they thought it important (1= not important, 10-- very important), high scores with a median of 8 were recorded for all but two programs. Sharing information and experiences with other marine parks got a slightly lower
score (median 7.5) and increasing facilities for users of the marine park such as developing snorkel trails received the lowest score (median 5). These differences
were significant (Fig. 4.5, Kruskal-Wallis Test, p<0.001) meaning that I could reject the null hypothesis of identical medians for each of the marine park programs.
101
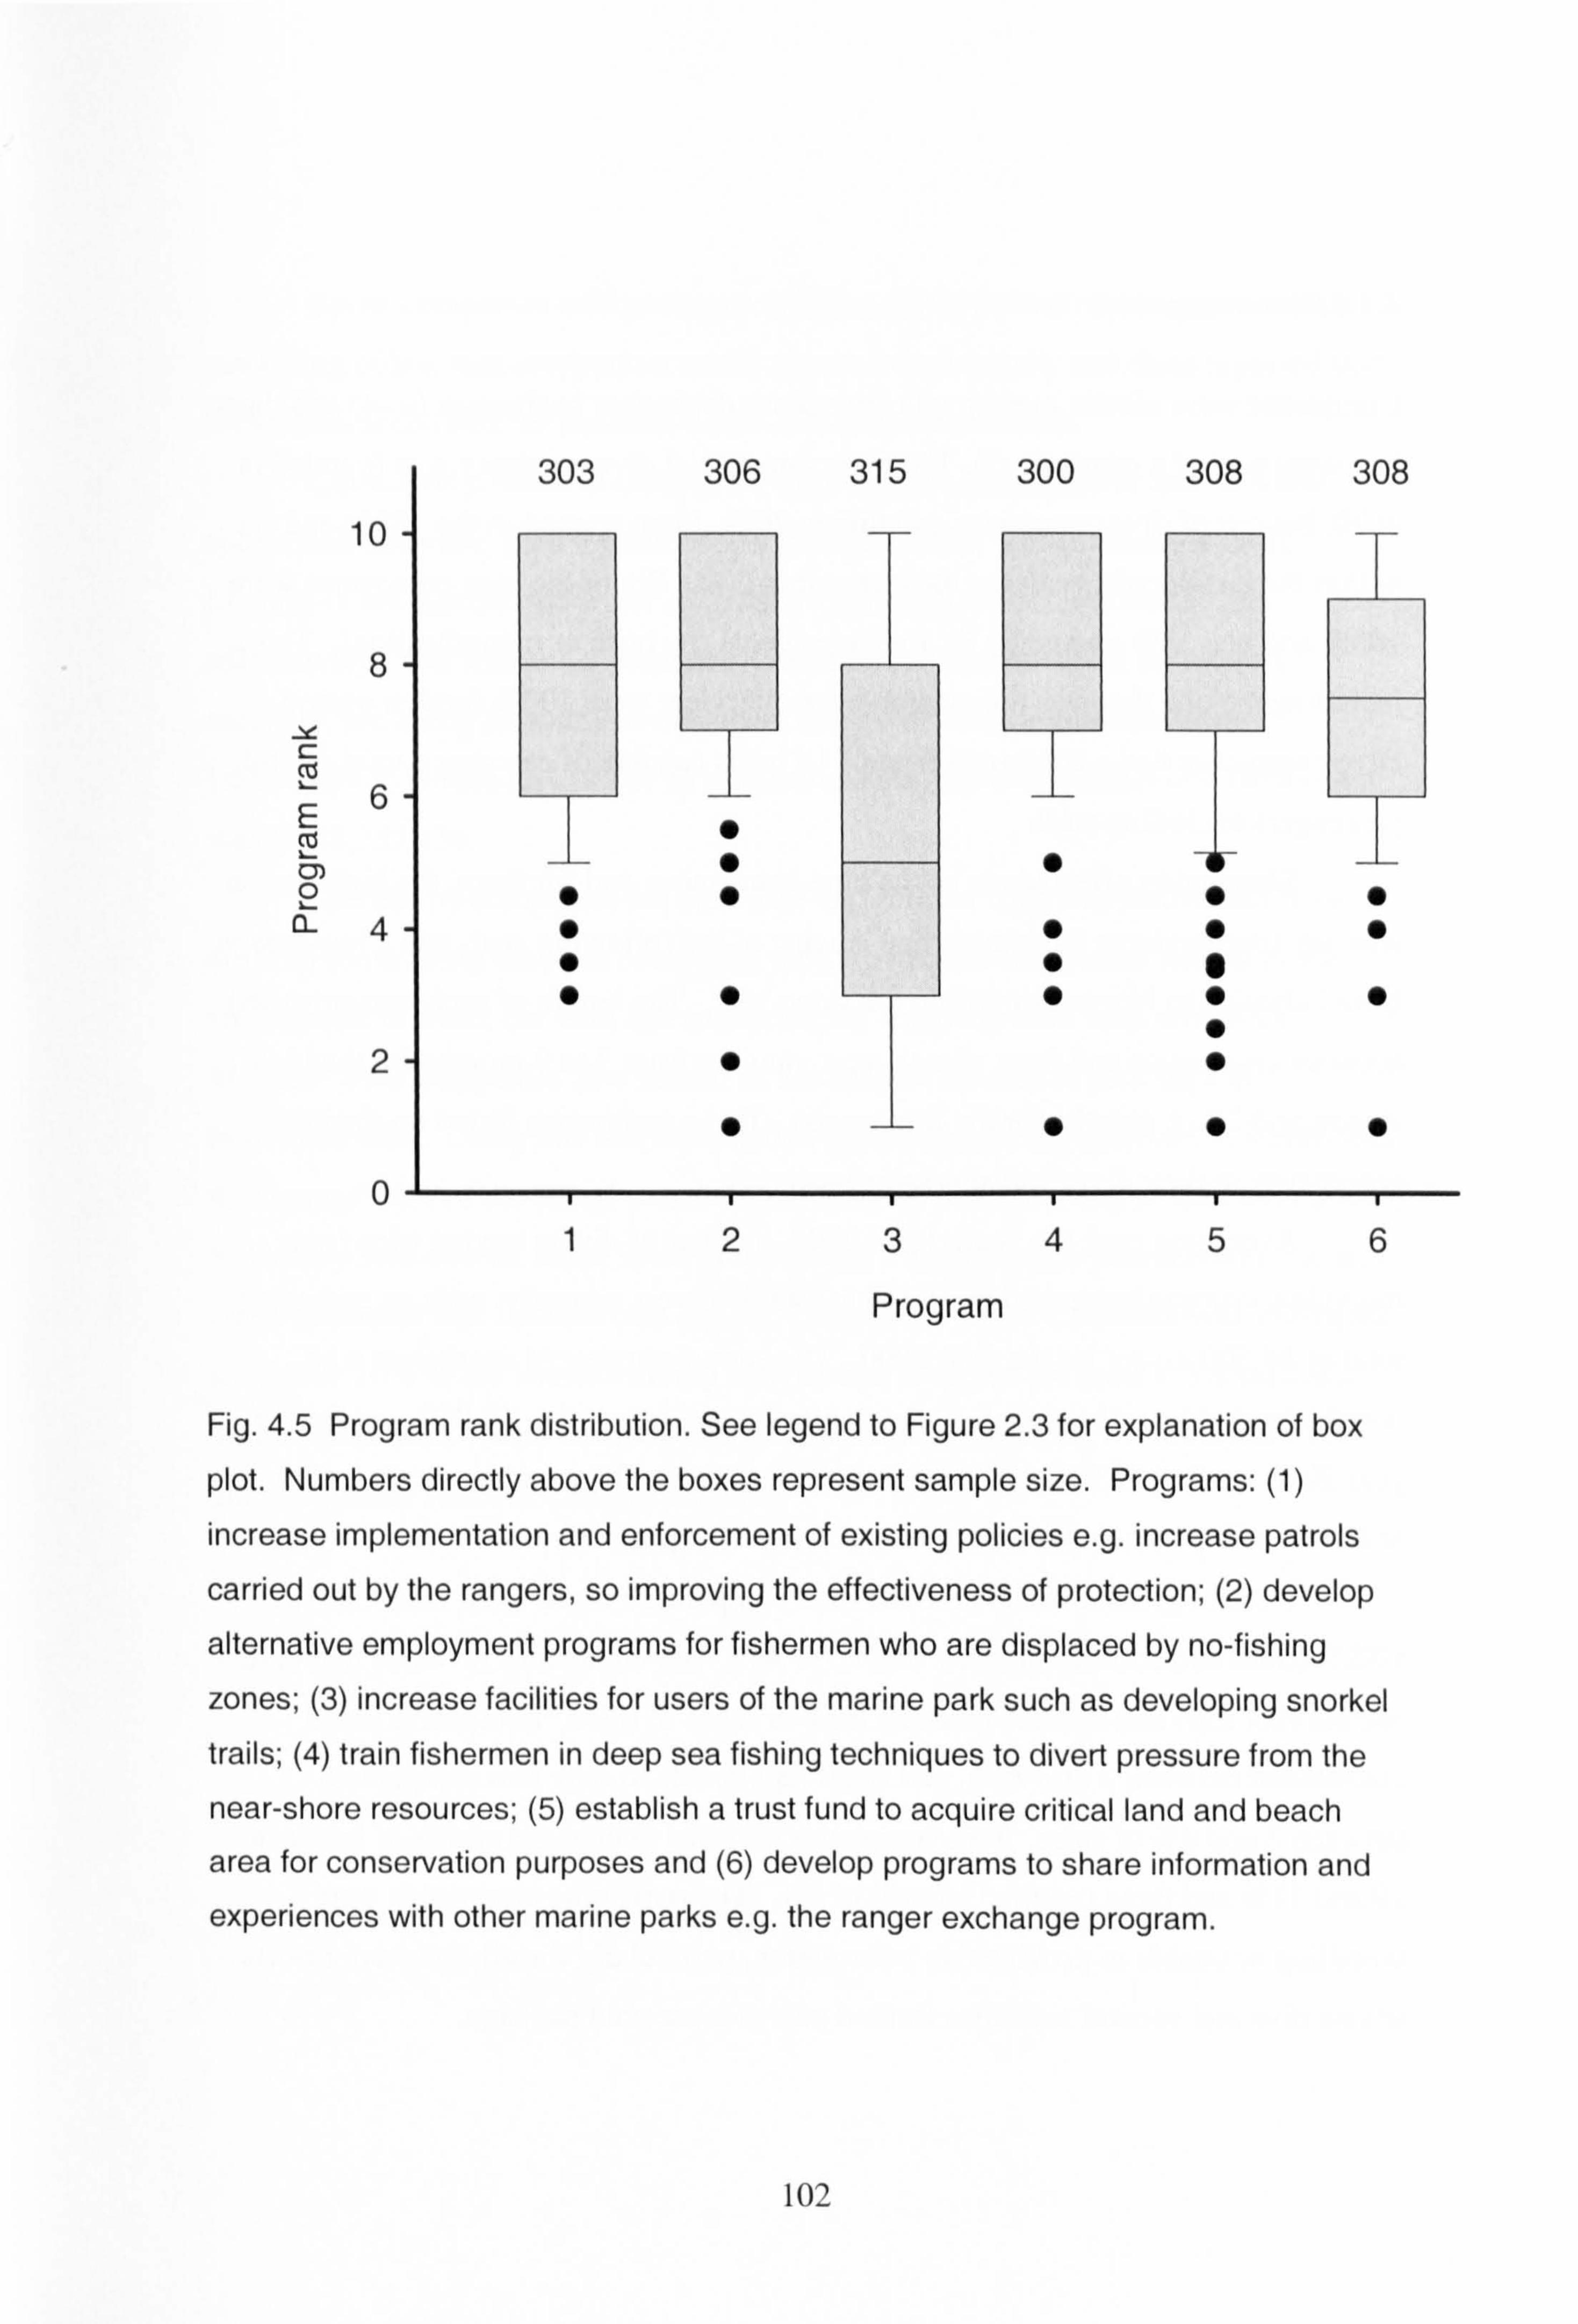
303 306
10
8
cm 0 a- 4- 0
2
0 1 2
315 300
S
S S S
0
3
Program
308
.
S . . .
.
308
T
-T-
0
56
Fig. 4.5 Program rank distribution. See legend to Figure 2.3 for explanation of box
plot. Numbers directly above the boxes represent sample size. Programs: (1)
increase implementation and enforcement of existing policies e. g. increase patrols
carried out by the rangers, so improving the effectiveness of protection; (2) develop
alternative employment programs for fishermen who are displaced by no-fishing
zones; (3) increase facilities for users of the marine park such as developing snorkel trails; (4) train fishermen in deep sea fishing techniques to divert pressure from the
near-shore resources; (5) establish a trust fund to acquire critical land and beach
area for conservation purposes and (6) develop programs to share information and experiences with other marine parks e. g. the ranger exchange program.
102
4.4.4 Dive companies
Companies were almost evenly split between independent businesses (n=4) and those
that were part of a resort (n=5). The first commercial dive company was founded in
1970, but out of dive companies existing in 2001, three opened in the 1980s and six
within the last decade, with the most recent in 2000. Six of the nine companies were 100% and one 51% owned by St. Lucia residents (by birth or naturalisation). Three,
including the one that was not available for interview were 100% foreign owned. Dive companies had a combined fleet of 18 boats capable of carrying a total of 357
passengers excluding staff. Seasonality affected six of the nine companies, and for them, the high season
was any time between November and August of the following year, and a low season from February to November within the same year. The length of each season varied between companies and from year to year, ranging from 3 to 9 months for the high
season and 2 to 6 months for the low season. Tbree companies found no distinct
seasonality in their diver and snorkeler business.
Averaging over the years 1999-2000, number of divers buying trips from
individual companies ranged from 450 to 14,000 divers annually, with an estimated
total of 34,500 divers for the year 2000. The annual number of snorkelers who
bought snorkel trips through dive companies ranged from 50 to 28,000, and for the
year 2000 totalled 32,900 (all companies collectively). The median number of dive
and snorkel trips taken per customer was 4 and 1 respectively.
Annual gross revenue between dive companies ranged from US$3,500 to
US$700,000 and collectively was US$1,597,413. Six companies revealed that dive
and snorkel trips and courses made up 80% or more of sales. Equipment rental
contributed between 3 and 20%, and retail (applicable to only two companies) between 2 and 8% of sales. Two companies revealed annual net profits of between
29 and 31% and three reported a profit of 0%. The remaining companies were
unwilling or unable to provide this information, particularly the all-inclusive resorts
whose dive and snorkel activities formed part of a pre-paid package.
103
Seven companies sold packages offshore either through their own hotel or
marketing office, tour companies, travel agents or web pages, and three reported that
these sales accounted for between 0 and 25% of gross revenue. Collectively, the dive companies employed 14 management and 96 water
sports staff full-time, plus 9 water sports staff part-time. The percentage of St.
Lucians in managerial and water sports staff positions was 71.4% and 97.1%
respectively. The remainder were non-Caribbean. Amounts spent on salaries
annually, including all staff and managers ranged between companies from
US$16,095 to US$551,81 1. For all nine companies, the total annual cost in salaries
was US$1,357,136.
Site use by companies for their dive and snorkel trips was distributed from
north to south along the west coast (Fig. 4.6). In general companies tended to use
sites closest to them, but with one exception, all routinely used sites within the
SMMA. Dive companies also submit to the SMMA records of dive trips to
individual sites. Using this and information gathered from my interviews, I estimated that around 60% of the island's total diving activity was occurring at sites within the SMMA, which also included some of the island's most popular snorkel sites, namely Anse Chastanet and Jalousie (see Fig 3.1, Chapter 3). Anse Chastanet was estimated to receive 20% of the island's diving activity and is one of the most advertised and
used snorkel sites. Anse Cochon, 6km north of the SMMA (Fig 3.1, Chapter 3) is
another locally renowned snorkeling area.
104
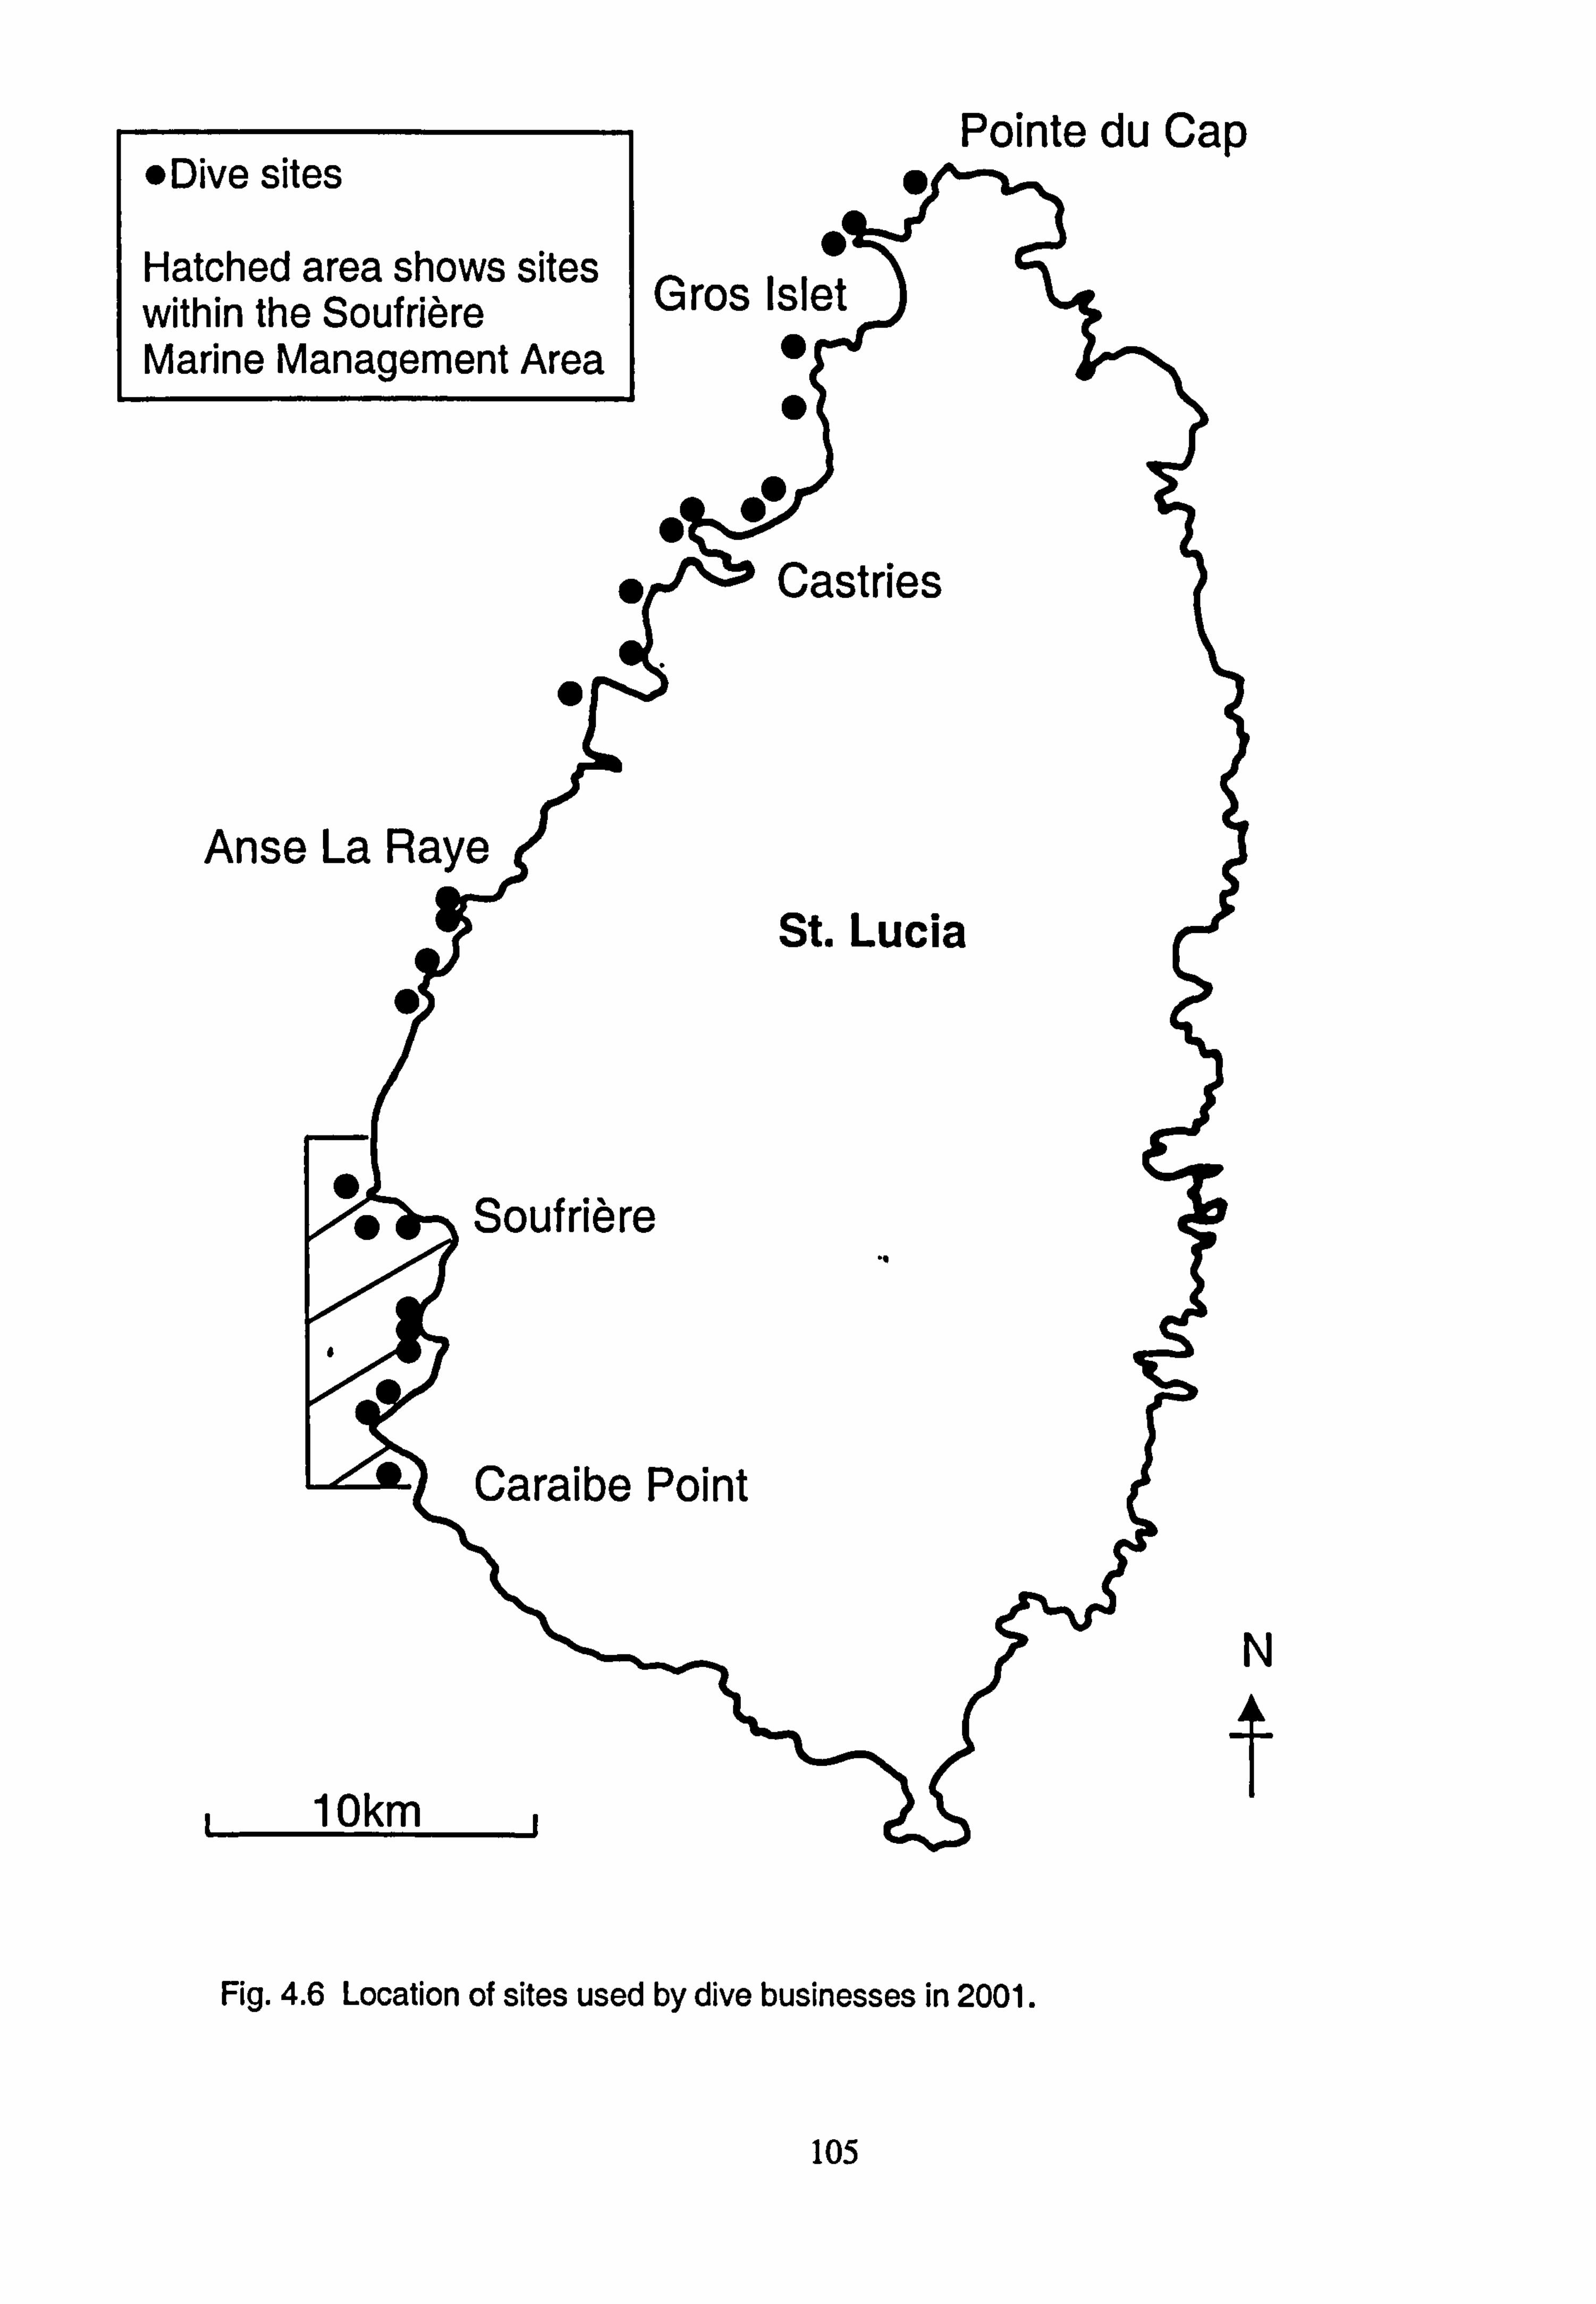
*Dive sites
Hatched area shows sites within the Soufri6re Marine Management Area
0
Anse La Raye
Soufrie're
Caraibe Point
11 Okm I
Fig. 4.6 Location of sites used by dive businesses in 2001.
Gros Islet 0 r- 0
Castries
Pointe du Cap
St. Lucia
.
105
Anecdotal evidence and personal observations indicated times when several boats,
including those with a capacity of over seventy people, were using this site
simultaneously resulting in over a hundred snorkelers in the water. During
interviews, some operators voiced their concerns regarding the high use of Anse
Chastanet and Anse Cochon sites reporting that the reefs in these areas were being
degraded and over used. Comments from visitors diving and snorkeling on Anse
Chastanet reef varied. Some described it as amazing, and others, particularly those
returning to the same site after between one and twenty two years, noted that the
corals appeared fewer and looked dead. One visitor noted the loss of branching
corals of the species Madracis mirabilis, commonly known as the yellow pencil
coral, which they said had ten years previously occurred in patches of several square
meters.
4.5 DisCUSSION
Reef tourism is a valuable business. Tourists spend significant amounts in order to
dive and snorkel on St. Lucia's coral reefs and for many, these activities are their
prime motivation for choosing to holiday there. The marine park was also significant
in visitors' decisions to visit St. Lucia but it is clear that the park is not maximising
the financial benefits that visitors could bring to it. This study shows that in St. Lucia,
park user fees could be increased and in so doing pay for improved management. By
calculating the financial gain derived from visitors and dive companies we can put a
value on coral reefs directly attributable to reef tourism and thus highlight the value
of conserving and managing the resources on which that tourism industry depends.
Although St. Lucia has no statistics on numbers of people taking part in reef- based activities, its financial significance is clear from diver and snorkeler
expenditures. I estimate that reef tours and marine park fees alone contributed some US$7.3 million in 2000. Using the information on site use by dive companies, I
estimate that roughly half of this revenue (US$3.5 million) comes from dive and
106
snorkel trips done within the marine park. Dive and snorkel businesses also benefit.
In St. Lucia, most of these businesses are St. Lucian owned and collectively employ a
workforce of over a hundred people. In addition the hotel and restaurant industry that
caters to visitors, employs some 17,3 82 people or I I% of the total population (St.
Lucia government statistics, 2001). Central government also derives revenues from
hotel occupancy (US$8.5 million) and travel taxes (US$936,000) as well as reporting
an annual visitor expenditure of US$108 million. The median cost of trip per person to St. Lucia in 2000 was US$2000. This
compares with other visitor expenditures on marine related holidays. Visitors that
participated in whale shark tours in Belize spent a median of US$1,500 in total on
their trip and 15% of these visitors spent more than US$3,000 (Graham, 2002). A
survey of readers of Skin Diver Magazine in 1991 reported that divers spent an
average of US$3,150 per dive trip (Skin Diver, 1991 Subscriber Survey).
Stayovers in St. Lucia spent more than day-trippers, spending a median of US$172 per day compared to US$69 spent by cruiseship passengers. This backs up
research in Dominica, an island 150km north of St. Lucia, which found the median
expenditure per person per day for stayovers was US$65 compared to cruise
passengers US$ 36 (Westbrook et al., 1997). In the Philippines, overnight visitors to
coral reefs at Apo Island spent US$20 per person per night compared to visitors
coming for a few hours who spent US$5 per person per day (White, Vogt & Arin,
2000). Despite the lower expenditure of day-trippers arriving by cruiseship, this type
of holiday has significantly increased since the early 1980s and is set to continue
growing (CLIA, 2002).
Cruise Lines International Association (CLIA) who represent 23 cruiselines
and the majority of whose customers originate from the United States and Canada
reported an increase in beds from 41,073 in 1981 to over 170,000 in 2001. They also
plan to add 42 new ships to their fleet by 2006 (CLIA, 2002). The dominant world destination is the Caribbean region which accounted for 47% of total world capacity
placement in 2002 (CLIA, 2002). Cruiseship passenger arrivals to St. Lucia have
107
more than doubled since the early 1990s to almost 500,000 in 2000 (St. Lucia
goverment statistics, 2002).
Similarly, package holidays have, over the years increased and are now the
major form of vacation, (Wood & House, 1991 cited in G6ssling, 1999). More than
half (68%) of respondents interviewed in the present study bought their holiday as a
package. Although the total holiday cost, whether package or not, was the same for
respondents, it is likely that non-package holidays resulted in greater financial
benefits to the St. Lucian economy. Package holidays are renowned for problems
associated with 'leakage'. Significant proportions, sometimes up to 80%, of revenue is repatriated due to expenditures on tourism-related imports and services, foreign
ownership of businesses, or overseas credit loans (G6ssling, 1999). In Bonaire,
visitors who purchased packages typically made few additional expenditures during
their stay (Scura & van't Hof, 1993; Westbrook et al., 1997). Expenditure by visitors
to Bonaire over and above packages, was as low as US$275 per person per average 6-
day stay (Dixon, Scura & van't Hof, 1993).
Estimates of the leakage rate in St. Lucia range from 45% in 1978, to 61% for 1986 (Wilkinson, 1997 cited in UK CEED, 1998). The increase in cruiseship activity
and development of all-inclusive resorts, where all or most guest services are included in one pre-paid holiday package price may aggravate the problem of leakage, both in St. Lucia (UK CEED, 1998) and the Caribbean in general (NEller &
Auyong, 199 1). In addition, there may be an increase in conflict between visitors and local communities, who often perceive that all-inclusive resorts exclude them from
tourism benefits.
The environment plays an important role in attracting tourists. Coral reefs and
marine parks are particularly valuable resources and attractions. Many visitors to St.
Lucia showed an interest in environmental issues, with almost three-quarters
surveyed either belonging to an environmental organisation or reading articles on marine life and many (possibly up to 86%) knowing that St. Lucia had a marine park.
108
Nearly half (44%) of those interviewed said they visited St. Lucia because of its
marine park, demonstrating the value of marketing protected areas for economic gain. For the marine park in St. Lucia, part of the economic gain from visitors
comes in the form of user fees but these appeared to be lower than what most visitors
were willing to pay. More than 90% of divers and snorkelers interviewed were
willing to pay above the current daily and annual fees for the SMMA.
Revenue from diver fees in 2001 was US$71,675 and from snorkeling was US$5,400. Adding the revenue from yacht mooring fees and donations brings total
revenue for 2001 to US$80,139. This is below the US$98,016 which, according to
the MPA manager, is required to cover minimum park management standards (Kai
Wulf, pers. comm. ). An additional US$17,877 is therefore needed. This could come
from increasing user fees to levels that 75% of visitors interviewed in this study were
willing to pay. A daily diver fee of US$6, an annual diver fee of US$20 and a daily
snorkeler fee of US$2 would increase revenue by approximately US$15,900. The
diver willingness to pay levels are similar to those found by Dixon, Scura and van't Hof (1994) who note that 80% of divers were willing to pay at least US$20/diver/year
and 48% would be willing to pay at least US$30/diver/year. If levels in St. Lucia's
marine park were set at what 50% of visitors were willing to pay, US$7/diver/day,
US$30/diver/year and US$4/snorkeler/day, the increase would be in the region of
US$32,800 per year. This would bring the total park revenue close to the
US$140,000 estimated by Wulf that would pay for ideal management standards (Kai
Wulf, pers. comm. ). These calculations do not include the potential revenue that
could be gained from an annual snorkeling fee, which as my results show, was an
option 41% of visitors to the park would have liked and for which a third were
willing to pay US$20.
Anecdotal evidence from this work in St. Lucia, and work by others
elsewhere, suggests that visitors would be willing to pay higher fees so long as they
could see where the money was going (Davis & Tisdell, 1998; Spash, 2000;
Lindberg, 2001). In this study many visitors wanted information on the biological
109
aspects of the reef and marine park projects. Willingness to pay was not correlated
with respondents' satisfaction with marine-park experience, probably because the
majority were satisfied by what they saw. Nor were the two factors used to measure
exposure to environmental issues, belonging to an environmental group or
organisation and reading or watching programs on marine life related to willingness
to pay, probably because most visitors showed an interest in the environment. Income level also had no influence on willingness to pay except in the instance of
snorkelers, where those in the lowest income bracket were willing to pay the least.
However, most visitors were in the highest income bracket, which may have masked
underlying trends.
Results from the multiple regression reinforced the indication that snorkelers'
willingness to pay was positively influenced by their income as well as another influencing variable, fish life. The higher the scores given for fish life, the higher the
willingness to pay. Other research has found divers to particularly appreciate
abundant and diverse fish (Williams & Polunin, 2000; Rudd & Tupper, 2002).
Snorkelers' willingness to pay was also positively correlated with better scores for
underwater visibility and overall satisfaction. Research has also found that divers
expect, value and place importance on clear water (reviewed in Tabata, 1992). Both
fish life and water quality are amenable to improvement by park management (Kelleher & Kenchington, 1992), suggesting again that parks add value to reef assets.
Snorkelers on organised trips were also willing to pay more than those
snorkeling independently. It is likely that people willing to pay for a snorkel trip will
have an increased tendency to pay towards other things associated with this activity
which in this case, consisted of marine park fees. The regression model only
explained 14% of the variance however, and this means that other variables not
measured are probably having a greater influence. Further research looking for those
likely influencing variables would be useful to try and explain more of visitors'
willingness to pay fees.
110
What many visitors did express, was their objection to paying for an 'annual'
fee when they were only staying a few weeks and were unlikely to be revisiting the
island within the next 12 months. However, this is more of a marketing problem than
a cost problem since my data show most visitors are willing to pay above the current fees. Replacing 'annual' with 'multiple day, valid for 12 months' for example, may
resolve this issue.
Implementing and increasing fees could decrease visitation. A study of
visitors to Komodo National Park in Indonesia suggested that a five-fold increase in
fees from US$0.87 to US$4 would result in only a 20% decline in visitation (Walpole
et al., 2001). Research by Walpole et al. (2001) and others indicated that demand
was relatively insensitive to price (Mundet & Ribera, 2001), although their studies had low starting fees of between US$0.87 and US$2.2. In Costa Rica, an increase in
tourist fees from US$1.25 to US$15.00 in 1994 for visiting National parks may have
contributed to the 47% decrease in visitation by non-residents (Laarman &
Gregersen, 1996) but resulted in a five-fold increase in revenues (Dixon & van't Hof,
1997). Both those studies highlighted the importance of disseminating information
and preparing the tourism sector, tourists and residents for fee systems and any
potential increases in fees. Asking tourists their attitudes and preferences with
regards to marine-park issues also helps reveal where improvements to a marine park
could be made. CVM has been widely criticised because of the hypothetical questions that are
used to elicit answers (hypothetical questions yield hypothetical answers) and biases
linked to survey design and cognition (Hoehn & Randall, 1987; Schkade & Payne,
1994; Sagoff, 1998). However, in my survey I carried out all the interviews
personally, giving people the same information on the current management of the
marine park and what their fees paid for. I also told people what their additional
money would pay for and, as they had already paid a fee and experienced the reefs, the scenario that I presented them with was more realistic than some other CVM
studies. The people I interviewed had a good idea of where their money would be
III
going and had a first-hand experience of what it would be paying for. There has also been debate on the elicitation process, with dichotomous choice being preferred and
endorsed by science compared to the open-ended question method (Boyle & Bishop,
1988; Ready et al., 1996). However, recent literature suggests that both methods are truth revealing (Haab & McConnell, 2002).
When I asked visitors to score the various proposed SMMA programs
according to importance, only two received median scores of less than 8. One was
sharing information and experiences with other marine parks, which got a median
score of 7.5, and the other was increasing facilities for users of the marine park such
as developing snorkel trails which received a median score of 5. The SMMA
proposed to share information and experiences by running a ranger exchange
program involving parks throughout the Caribbean. Some visitors thought that using the worldwideweb would be a cheaper means of sharing information that did not
require rangers to incur travel and living costs elsewhere. However, this is unlikely to be as effective as hands-on experience. Rangers accompanying each other on
patrols and looking at each other's working methods are able to experience and see at first hand which methods are most effective and how to achieve the best results.
Increasing facilities for users received the lowest score. This is interesting
because it is one of the only things directly targeted toward tourists. Many visitors disliked the idea of snorkel trails suggesting that it would lead to overcrowding and
spoil the naturalness of the area. Certainly research in the Great Barrier Reef has
shown that snorkel trails localise damage to that area and immediate surrounds,
particularly near interpretative signs (Plathong et al., 2000). Concentrating damage to
certain areas may be helpful though, if it means other areas are left intact.
Despite the obvious financial benefits from reef tourism, there remains a long-
standing problem of distribution i. e. the rich get richer and the poor can't get a share (Cater & Goodall, 1992). Not everyone benefits from tourism and the losers are
capable of undermining tourism and conservation efforts including management
plans such as MPAs. One of the most significant barriers to community involvement
112
in tourism is the lack of financing which limits communities' opportunities to
participate in tourism ventures (Wells, 1997). Communication between protected area
management and the local population and involving local populations in conservation
efforts is also of paramount importance (Wells, 1997; Nepal, 2002). Community
involvement could be improved with ventures through park management authorities
for example. Fee systems can be used to gather revenue from users but prices need to
be set so that optimum financial gain is achieved. If set too low, administrative costs
may exceed fee receipts; if set too high, visitor numbers may drop. Community trust
funds are another tool that could spread some of the benefits from tourism more
equitably. In the case of marine parks, such funds could compensate fishers after
hurricanes, pay for repairs and maintenance of fishing equipment, pay for re-training
programs and offer low cost loans. Benefits could even be linked to compliance with
regulations such as no-fishing areas. Marine parks also need to acknowledge that
tourism is a fickle source of income that can evaporate at the hint of trouble. They
therefore need a buffer. If one assumes that the demand for tourism is cyclical it will follow the country's economy and in the case of St. Lucia, will follow the economy
of the United States and Europe where most of St. Lucia's tourists come from. In
years when tourist numbers and revenues are high, then a portion of NTA revenues
could be set aside to compensate for potentially lower visitation in the future. In
years when demand for tourism is low, this investment could be drawn from to cover
running costs. At present there does not seem to be enough slack in tourist willingness to pay
for such funds or investments. However, there may be a case for being able to charge
a premium for high quality sites. A study of two Red Sea diving resort areas by
Medio (1996) found that limiting and regulating access and development reduced damage to, and maintained quality of, coral reefs. Consequently, tourist businesses in
one area were able to charge almost double what they charged in the other area,
which allowed unlimited reef use for tourism and fishing as well as unrestricted
coastline development. This illustrates the necessity of applying other tools such as
113
access restrictions in addition to user fees. In the Medes Islands protected area, Mallorca, over-use and impoverishment of their marine ecosystem led to the decrease
in its value as a tourist attraction and the introduction of a US$2.2 dive permit in
1990 to reduce visitor demand (Mundet & Ribera, 2001). However, this was not
enough to conserve their marine ecosystem and in 1995, the number of dives allowed in the protected area was set at 450 per day. In response to this, dive clubs diversified
site use by taking beginners and advanced courses to sites outside the protected area. This approach could be used in St. Lucia to alleviate diving and snorkeling pressure from some of its most popular sites.
For countries whose economies rely on coral reef tourism such as St. Lucia,
Saba, Bonaire, the Maldives and the Seychelles, continued existence and growth of their industries requires a high quality underwater environment. This only comes from management, control of development and controlled use of the resources. The
establishment of MPAs and the charging of fees to use protected areas for recreation
and commercial purposes can go a long way to providing the funds necessary to finance such protection. As this study shows, the vast majority of reef users are
willing to pay such fees and in many cases are willing to pay much more than is
currently being asked. If MPAs were to harness more of the potential income from
visitors, a greater proportion of management costs could be met and for some,
moving from 'paper-parks' to becoming fully functioning MPAs would be realised.
114
4.6 REFERENCES
Arin, T. & R. A. Kramer. 2002. Divers' willingness to pay to visit marine sanctuaries: an exploratory study. Ocean and Coastal Management 45: 171-183.
Badalamenti, F., Ramos, A. A., Voultsiadou, E., Sdnchez Lizaso, J. L., D'Anna, G., Pipitone, C. Mas, J., Fernandez, J. A. R., Whitmarsh, D. & S. Riggio. 2000. Cultural and socio-economic impacts of Mediterranean marine protected areas. Environmental Conservation 27: 110-125.
Balmford, A., Gravestock, P., Hockley, N., McClean, C. J. & C. M. Roberts. In prep. The worldwide costs of marine conservation.
Berg, H., 6hman, M. C., Trodng, S. & 0. Linddn. 1998. Environmental economics of coral reef destruction in Sri Lanka. Ambio 27: 627-634.
Boyle, K. J. & R. C. Bishop. 1988. Welfare measurements using contingent valuation: a comparison of techniques. American Journal ofAgricultural Economics 70: 20-28.
Britton, R. A. 1977. Making tourism more supportive of small-state development: the case of St. Vincent. Annals of Tourism Research 4: 268-278.
Bryant, D., Burke, L., McManus, J. & M. Spalding. 1998. Reefs at Risk. A Map- Based Indicator of Threats to the World's Coral Reefs. Washington, D. C.: World Resources Institute, 56 pp.
Cater, E. & B. Goodall. 1992. Must Tourism Destroy its Resource Base? In: Mannion, A. M. and S. R. Gowlby (eds) 1992. Environmental Issues in the 1990s. John Wiley and Sons Ltd., Chichester, UK, pp. 309-324.
Ceballos-Lascurdin, H. 1993. Ecotourism as a Worldwide Phenomenon. In: Lindberg, K. & D. E. Hawkins (eds), Ecotourism: A Guidefor Planners and Managers. The Ecotourism. Society, North Bennington, VT, 175 pp.
Cesar, H. 1996. Economic Analysis of Indonesian Coral Reefs. World Bank. Coral Reef Rehabilitation and Management (COREMAP), 96 pp.
CIA: Central Intelligence Agency. 2002. The World Factbook 2002. http: //www. cia. gov/cia/publications/factbook/geos/st. htrffl#People
CLIA Cruise lines International Association http: //www. cruising. org/press/overview/lýnLoverview. cfm#c2
115
Davis, D. & C. A. Tisdell. 1998. Tourist levies and willingness to pay for a whale shark experience. Tourism Economics 5: 161-174.
Dixon, J. A. & P. B. Sherman. 1990. Economics of Protected Areas: A New Look at Benefits and Costs. Earthscan publications Ltd., London, UK, 234 pp.
Dixon, J. A., Scura, L. F. & T. van't Hof. 1993. Meeting ecological and economic goals: marine parks in the Caribbean. Ambio 22: 117-125.
Dixon, J. A., Scura, L. F. & T. van't Hof. 1994. Ecology and Microeconomics as 'Joint Products': The Bonaire Marine Park in the Caribbean. In: Perrings, C. A., Mdler, K. -G., Folke, C., Holling, C. S. & B. -O. Jansson (eds). 1994. Biodiversity Conservation: Problems and Policies, pp. 120-138.
Dixon, J. A. & T. van't Hof. 1997. Conservation pays big dividends in Caribbean. Forum for Applied Research and Public Policy, 43-48.
Driml, S. 1994. Protectionfor Profit. Economic and Financial Values of the Great Barrier Reef World Heritage Area and Other Protected Areas. Great Barrier Reef Marine Park Authority, Research publication no. 35, Townsville, 83 pp.
Fennell, D. A. 1999. Ecotourism: An Introduction. Routeledge, London, 315 pp.
Fernandes, L. 1995. Integrating Economic, Environmental and Social Issues in an Evaluation of Saba Marine Park, N. A., Caribbean Sea. Honolulu, USA. 60 pp.
Goodwin, H. 1996. In pursuit of ecotourism. Biodiversity and Conservation 5: 277- 291.
Graham, R. 2002. Pilot Survey Results on Demographics and Attitudes of Tourists Participating in Whale Shark Tours in Belize. Report by the University of York, UK, 6 pp.
Green, E. & R. Donnelly. 2003. Recreational scuba diving in Caribbean marine protected areas: Do the users pay? Ambio 32: 140-144.
Haab, T. C. & K. E. McConnell. 2002. Valuing Environmental and Natural Resources. Edward Elgar Publishing Limited, Cheltenham, Gloucestershire, 326 pp.
Hall, C. M. 2001. Trends in Ocean and coastal tourism: the end of the last frontier? Ocean and Coastal Management 44: 601-618.
Hawkins, J. P. & C. M. Roberts, 1994. The growth of coastal tourism in the Red Sea: present and future effects on coral reefs. Ambio 23: 503-508.
116
Hawkins, J. P., Roberts, C. M., van't Hof, T., de Meyer, K., Tratalos, J. & C. Aldam. 1999. Effects of recreational scuba diving on Caribbean coral and fish communities. Conservation Biology 13: 888-897.
Hoehn, J. P. & A. Randall. 1987. A satisfactory benefit cost indicator from contingent valuation. Journal of Environmental Economics and Management 14: 226-247.
Kelleher, G., Bleakley, C. & S. Wells. 1995. A Global Representative System of Marine Protected Areas. Volume 1L The International Bank for Reconstruction and Development/ The World Bank, Washington, USA, 93 pp.
Kelleher, G. & R. Kenchington. 1992. Guidelinesfor Establishing Marine Protected Areas. IUCN, Gland, Switzerland, 80 pp.
Kontogianni, A., Skourtos, M. S., Landford, I. H., Bateman, I. J. & S. Georgiou. 2001. Integrating stakeholder analysis in a non-market valuation of environmental assets. Ecological Economics 37: 123-138.
Koop, K., Booth, D., Broadbent, A., Brodie, J., Bucher, D., Capone, D., Coll, J., Dennison, W., Erdmann, M., Harrison, P., Hoegh-Guldberg, 0., Hutchings, P., Jones, G. B., Larkum, A. W. D., O'Neil, J., Steven, A., Tentori, E., Ward, S., Williamson, J. & D. Yellowlees. 2001. ENCORE: The effect of nutrient enrichment on coral reefs. Synthesis of results and conclusions. Marine Pollution Bulletin 42: 91-120.
Laarman, J. G. & H. M. Gregersen. 1996. Pricing policy in nature-based tourism. Tourism Management 17: 247-254.
Lee, C. & S. Han. 2002. Estimating the use and preservation values of national parks' tourism resources using a contingent valuation method. Tourism Management 23: 531-540.
Lindberg, K. 200 1. Protected Area Visitor Fees: Overview. http: //www, ecotourism. orglpdf/protareavisfees-country. pdf
Lindberg, K. & D. E. Hawkins (eds. ). 1993. Ecotourism: A Guidefor Planners and Managers. The Ecotourism Society, VT, 175 pp.
Mathieu, L., Langford, I. H. & W. Kenyon. In press. Valuing Marine Parks in a Developing Country: A Case Study of Seychelles. 32 pp.
117
Medio, D. 1996. Sustainable Tourism Development in the Ras Mohamed National Park, Egypt. In: Swanson, T. M. Ugalde, C. F. & R. A. Luxmore. Survey of Wildlife Management Regimesfor Sustainable Utilization. World Conservation Monitoring Centre, Cambridge.
Nfiller, M. L. & J. Auyong. 1991. Coastal zone tourism. A potent force affecting environment and society. Marine Policy 15: 75-99.
Mundet, L. & L. Ribera. 2001. Characteristics of divers at a Spanish resort. Tourism Management 22: 501-5 10.
Musa, G. 2002. Sipadan: a scuba-diving paradise: an analysis of tourism impact, diver satisfaction and tourism management. Tourism Geographies 4: 195-209.
Negri, A. P., L. D. Smith, N. S. Webster & A. J. Heyward. 2002. Understanding ship- grounding impacts on a coral reef: potential effects of anti-fouling paint contamination on coral recruitment. Marine Pollution Bulletin 44: 111-117.
Nemeth, R. S. & J. S. Nowlis. 2001. Monitoring the effects of land development on the near-shore reef environment of St. Thomas, USVI. Bulletin of Marine Science 69: 759-775.
Nepal, S. K. 2002. Involving indigenous peoples in protected area management: comparative perspectives from Nepal, Thailand, and China. Environmental Management 30: 748-763.
Orams, M. 1999. Marine Tourism: Development, Impacts and Management. Routledge, London, 115 pp.
Park, T., Bowker, J. M. & V. R. Leeworthy. 2002. Valuing snorkeling visits to the Florida Keys with stated and revealed preference models. Journal of Environmental Management 65: 301-312.
Pearce, D. 1989. Tourist Development. Second edition. Addison Wesley Longman Limited, Harlow, 341 pp.
Plathong, S., Inglis, G. J. & M. E. Huber. 2000. Effects of self-guided snorkeling trails on corals in a tropical marine park. Conservation Biology 14: 1821-1830.
Ready, R. C., Buzby, J. C. & D. Hu. 1996. Differences between continuous and discrete contingent value estimates. Land Economics 72: 397-411.
118
Riopelle, J. M. 1995. The Economic Valuation of Coral Reefs: A Case Study of West Lombok, Indonesia. Thesis, Dalhousie University, Halifax. In: Cesar, H. 1996. Economic Analysis of Indonesian Coral Reefs. World Bank. Coral Reef Rehabilitation and Management (COREMAP), 96 pp.
Rodenburg, E. E. 1980. The effects of scale in economic development. Tourism in Bali. Annals of Tourism Research 7: 177-196.
Rouphael, A. B. & G. J. Inglis. 1997. Impacts of recreational scuba diving at sites with different reef topographies. Biological Conservation 82: 329-336.
Rudd, M. A. & M. H. Tupper. 2002. The impact of Nassau grouper size and abundance on scuba diver site selection and MPA economics. Coastal Management 30: 133-151.
Sagoff, M. 1998. Aggregating and deliberation in valuing environmental public goods: A look beyond contingent pricing. Ecological Economics 24: 213-230.
Schkade, D. A. & J. W. Payne. 1994. How people respond to contingent valuation questions: A verbal protocol analysis of willingness to pay for an envirorunental regulation. Journal of Environmental Economics and Management 26: 88-109.
Skin Diver Magazine. 1991.1991 Subscriber Survey. Petersen Publishing, Los Angeles, USA. In: Tabata, R. S. 1992. Hawaii's Recreational Dive Industry and Use of Nearshore Dive Sites. Sea Grant Marine Economics Report, Contribution No. 98, Ocean Resources branch, Department of Business, Economic Development and Tourism, State of Hawaii. Honolulu: Sea Grant College Program, University of Hawaii at Manoa, July 1992,54 pp.
Spalding, M. D., Ravilious, C. & E. P. Green. 2001. WorldAtlas of Coral Reefs. Prepared at the UNEP World Conservation Monitoring Centre. University of California Press, Berkeley, USA, 424 pp.
Spash, C. L. 2000. Assessing the benefits of improving coral reef biodiversity: The contingent valuation method, pp. 40-54. In: Cesar, H. S. J. (ed. ). 2000. Collected Essays on the Economics of Coral Reefs. CORDIO, Kalmar, Sweden, 244 pp.
St. Lucia Government Statistics. 2002. Tourism by Numbers. The Government Statistics Department, Castries, Saint Lucia, W. I. http: //www. stats. gov. lc/tousum. htm
119
Tabata, R. S. 1992. Hawaii's Recreational Dive Industry and Use of Nearshore Dive Sites. Sea Grant Marine Economics Report. Contribution No. 98, Ocean Resources Branch, Department of Business, Economic Development and Tourism, State of Hawaii. Honolulu: Sea Grant College Program, University of Hawaii at Manoa, July 1992,54 pp.
Tratalos, J. A. & T. J. Austin. 2001. Impacts of recreational SCUBA diving on coral communities of the Caribbean island of Grand Cayman. Biological Conservation 102: 67-75.
UK CEED (UK Centre for Economic and Environmental Development). 1998. An Assessment of the Environmental Impacts of Tourism in St. Lucia. Report for British Airways and British Airways Holidays, Report 5/98. UK CEED, Cambridge, 112 pp.
Vogt, H. 1997. The economic benefits of tourism in the marine reserve of Apo Island, Philippines. In: Proceedings of the Eighth International Coral Reef Symposium. Smithsonian Tropical Research Institute, Balboa, Panama, 2: 2101-2104.
Walker, D. I. & R. F. G. Ormond. 1982. Coral death from sewage and phosphate pollution at Aqaba, Red Sea. Marine Pollution Bulletin 13: 21-25.
Walpole, M. J., Goodwin, H. J. & K. G. R. Ward. 2001. Pricing policy for tourism in protected areas: lessons from Komodo National Park, Indonesia. Conservation Biology 15: 218-227.
Wells, M. P. 1997. Economic Perspectives on Nature Tourism, Conservation and Development. Departmental working paper No. 55, Environmental economics series Pollution and Environmental Economics Division of the World Bank.
Westbrook, T., Mendelssohn, G. & P. G. H. Evans. 1997. Stayover Visitor Survey 1995-1996. Project report No. 6. "Integrating Conservation With Ecotourism in Dominica". European community project no. B7-5040-24. Ecosystems Ltd, Brussels, 49 pp.
Westbrook, T., Mendelssohn, G. & P. G. H. Evans. 1997. Cruise Ship Survey 1995- 1996. Project report No. 7. "Integrating Conservation With Ecotourism in Dominica". European community project no. B7-5040-24. Ecosystems Ltd, Brussels, 26 pp.
White, A. T., Vogt, H. P. & T. Arin. 2000. Philippine coral reefs under threat: the economic losses caused by reef destruction. Marine Pollution Bulletin 40: 598-605.
120
Wilkinson, P. 1997. 'St. Lucia'. In: Tourism Policy and Planning: Case Studies From the Commonwealth Caribbean. New York: Cognizant Communication Corporation: 79-106.
Williams, I. D. & NN. C. Polunin. 2000. Differences between protected and unprotected reefs of the western Caribbean in attributes preferred by dive tourists. Environmental Conservation 27: 382-391.
Wood, K., & S. House, 1991. The good tourist. - A worldwide guidefor the green traveller. Mandarin, London. In: G6ssling, 1999. Ecotourism: A Means to Safeguard Biodiversity and Ecosystem Functions? Ecological Economics 29: 303- 320.
WTO: World Tourism Organisation. 2002. Tourism Highlights 2002,7pp. http: //www. world-tourism. org/markeLresearch/facts&figures/latest-data/ Mje. %20Highlights%202002%20INGLES. pdf
WTTC: World Travel and Tourism Council. 2002. Saint Lucia Travel & Tourism: A World of Opportunity, WTTC, London, UK, 28pp. http: //www. wttc. org/measure/PDF/Saint%20Lucia. pdf
Zakai, D. & N. E. Chadwick-Furman. 2002. Impacts of intensive recreational diving on reef corals at Eilat, northern Red Sea. Biological Conservation 105: 179-187.
121
Chapter 5: Relationships between tourist perceptions
and measured attributes of coral reefs
5.1 ABSTRACT
Coral reef tourism relies on the health of reefs and the marine life that they support. The relationships between visitor attitudes and environmental quality are complex
and variable and little is known of the reliability of visitor perceptions of
environmental attributes. 789 tourists were interviewed over two sample periods and
asked about their motivations for visiting St. Lucia's reefs, their perceptions of reef
attributes including fish and coral life, underwater visibility, garbage and crowding,
their best and worst experiences on their reef trip and what would have improved
their reef visit. Measurements were made of fish life, coral life, underwater visibility
and garbage at the different sites to compare with visitor perceptions. 85.0% of
visitors rated viewing marine life as their number one motivation for diving or
snorkeling in St. Lucia. 88% of divers in sample Period 1 cited marine life as
providing the highlight of their trip and 52.4% of divers and snorkelers; interviewed in
Period 2 said that marine life had given them the most enjoyment. Tourists were discerning of relative abundance of small (<25cm) and large fish (25+cm) and levels
of underwater visibility and garbage but not skilled enough to differentiate marine life
abundance between the different sites. Negative experiences in St. Lucia related to
equipment problems or personal difficulties (33%), poor underwater visibility (14%)
and seeing damaged coral (14%). Remaining factors included poor weather or water
conditions and seeing other divers damaging the reef. Similarly negative factors most
cited in Period 2 were dead or damaged coral (15.4%), garbage (13.3%), boat traffic
noise and pollution (11.2%). Remaining factors, each representing less than 9% of
answers, included a lack of fish and diversity of fish, poor underwater visibility and
122
crowding. In general, tourists wanted more information on the marine life of the area (51.9%), better infrastructure (30.4%), better service (15.2%) and removal of garbage (2.5%). These results highlight the importance of reef quality to tourists, and the need for monitoring and regulating the use of reef resources for the benefit and long-term
sustainability of reef-dependent industries.
5.2 INTRODUCTION
Environmental quality is important for tourism. Relationships between the two are
complex but certain levels of quality are necessary for tourism to thrive (Ayala, 1996;
Gregory, 1999; Bhat, 2003; CAST, 2003). The degradation of marine ecosystems
can result in economic loss that in turn could cause the eventual collapse of those industries dependent on marine resources. Coral reef tourism obviously relies on
reefs and the life that they support. Various reef attributes can directly enhance or detract from visitors' enjoyment. It is in the interest of countries and businesses that
generate economic gains from reef tourism to manage and monitor activities and development, at sea and on land, that may negatively impact upon reefs.
Reef attributes and conditions play an important role in visitor perception in
the Caribbean (Williams & Polunin, 2000), South East Asia (Musa, 2002) and Australia (Vanclay, 1988; Inglis et al., 1999; Kim & Lee, 2000). Sediment pollution is a problem detrimental to both the environment and tourist activities. It reduces fish
abundance and diversity (Richardson & Jowett, 2001). It reduces the light available for corals to use for photosynthesis and coral must expend energy to remove it
(Rogers, 1990), energy which could otherwise be used for growth and reproduction
and other functions. Sediment thus decreases the growth, abundance and species diversity of corals (Acevedo & Morelock, 1988) and in some instances, sediment kills
corals (Sladek Nowlis et al., 1997; Nemeth, 2001). Reduced light also means poor
visibility and good visibility is among the most important underwater attributes for
123
tourists (Tabata, 1992). Most often, logging, agriculture, dredging, construction and
other human activities that expose soils are the cause of excessive sediment in
waterways and eventually the marine environment (reviewed in Marsh, 1992). In
Bacuit Bay, Philippines, logging was predicted to cause sediment pollution that
would severely limit the viability of the local fisheries and dive tourism businesses
(Hodgson & Dixon, 2000). Over 10 years, the predicted gross revenues from logging
were US$8.6 million, compared to US$6.2 million from fishing and US$13.9 million from tourism, industries incompatible with logging. By 1996, after a ban on logging,
a survey of the area showed that corals and much of the forest had recovered and that
tourism had flourished. However, over-fishing decreased the size and number of the
most highly valued fish.
Size, abundance and diversity of fish are other attributes that divers
particularly appreciate (Williams & Polunin, 2000) and divers that have seen higher
quality coral receive greater satisfaction than those who have seen poorer examples (Vanclay, 1988). Estimates of economic losses at diving destinations due to the 1997-98 mass bleaching event range from US$2-19 million in regions of the Indian
Ocean (Westmacott et al., 2000) and US$1.5 million in El Nido, the Philippines
(Cesar, 2000).
Tourists are also concerned about crowding, over-development, noise and litter (Musa, 2002). For some, experiencing nature in a natural, unstructured way, is
the most important motivational factor for their trip (Kim & Lee, 2000). Experience
seems to influence whether visitors find crowding an issue (Inglis, 1999) with more
experienced divers for example preferring fewer people and less infrastructure.
Investigations on diver preferences for various environmental attributes began in the late seventies (see Tabata, 1989) but none have compared perceived attributes with
objective measures of them on reefs. Here, I use quantitative data on fish and corals,
underwater visibility, sediment load and garbage and compare them with tourists'
perceptions of them. Revealing the relationship between tourist perceptions and actual measurements of those attributes will help managers understand the
124
motivations and sensitivities of tourists. It may also shed light on the importance of
visitor education and the relevance of monitoring and managing reef resources for
their many benefits.
5.3 METHODS
Over two sampling periods, the first from December 2000 to mid March 2001 and the
second from July to October 2001,1 embedded questions pertaining to tourists'
perceptions of St. Lucia's reefs within three questionnaires that I used to interview
divers and snorkelers (Chapters 2,3 and 4). 1 used a mixture of open-ended and
closed questions. For closed questions I used Likert Scales and each scale had an
option of 'no opinion/don't know'. Less than 2% of questionnaires were incomplete
or refused. In Period II interviewed 214 divers using Questionnaire I (Appendix A),
beginning by asking visitors to state the highlight and low-point of their dive. I asked
them to rate 'numbers of fish', 'small fish', 'big fish', 'different types of fish',
'amount of living coral' and 'underwater visibility' (I = very poor to 5= very good). I
then asked how their ratings of those factors compared to their expectations (1= a lot
less than expected to 5= a lot more than expected). I asked visitors whether they had
noticed damaged coral, and if so, what kind as well as how much sediment and litter
they saw (I=none to 4= a lot), then whether that damaged coral, sediment, litter and
number of divers in their dive group had affected their enjoyment of the dive (1=
decreased enjoyment a lot to 5= increased enjoyment a lot). Visitors stated their
overall satisfaction with their dive (1= very dissatis ed to 4= ver satisfied) and I fY
used this as the dependent variable in a multiple regression to test whether measured factors, including underwater visibility, number of divers in group, weather, current, fish abundance, fish diversity and hard coral cover had any significant influence on divers' satisfaction. I also used an open-ended question to ask them whether anything
particular to the marine environment would have improved their dive experience.
125
I completed questionnaire 2 (Appendix B) during Period 1 with 206 of the
same divers that I had observed (Chapter 2) and with whom I had completed
questionnaire 1 (Appendix A), and randomly approached another 245 visitors at Anse
Chastanet resort. I began by asking what their main reason for visiting St. Lucia was
and to rate their three main motivations for diving or snorkeling on the island
(1=most important to 3= least important) from a list of options. Those included: 'to
view marine life in its natural environment', 'for the enjoyment of diving or
snorkeling itself', 'to be with friends or relatives', 'for the adventure / fun', 'for
photography', 'for being active out-of-doors', and 'other'. Visitors then rated the importance of 'lots of fish', 'big fish', 'different types of fish', 'lots of living coral', 'different types of coral', 'particular species' and if so, what kind, 'clear water' and 'trash free sites' to their dive or snorkel (1 = not important at all to 5= very important). I asked snorkelers how many people were in their immediate vicinity during their time in the water, whether this was too many or about right, and asked divers and snorkelers about their overall satisfaction with their diving or snorkeling in
St. Lucia (I =very dissatisfied to 5= very satisfied). Then using open-ended
questions, I asked them to state what they had enjoyed most and least about St.
Lucia's marine environment and what would improve their experience. Lastly I
asked whether they had visited any other coral reefs in the world and to state which,
according to them, were the best and worst and why. To compare diver and snorkeler perceptions of reef attributes, I completed
Questionnaire 3 (Appendix C) with 150 divers and 180 snorkelers immediately after their dive or snorkel trip during Period 2. They were asked to rate 'fish life', 'coral
life', 'underwater visibility' and 'overall satisfaction' for the site they had just visited (I =very poor to 5=very good). I asked whether the marine park had influenced them
to visit St. Lucia and how the experience of the park measured up to their
expectation. To compare visitor perceptions of fish and coral attributes with scientifically
measured data on fish and coral I used fish counts and coral cover measurements
126
collected by J. P. Hawkins and C. M. Roberts. They counted fish using an adaptation
of the stationary point visual census technique (Bohnsack and Bannerot, 1986) at 5
and 10m depths. During 15-minute intervals, they estimated size (total length to
nearest cm) and number of non-cryptic reef species (Table 5.1) within or passing through an imaginary lOm-diameter vertical cylinder 5 or 10m high depending on
what depth they were at. The location of each cylinder for fish counts was separated by the next by at least 10m. Five to six counts were made at nine of the dived sites (Site nos. 1,3,4,6,7,8,9,11 and 12) and two of the snorkeled sites (Site nos. 13 and 14) (see Table 5.2 for complete list of sites). Within the same cylinders J. P. Hawkins
and C. M. Roberts also measured percentage cover of hard corals and live substrate (this included hard and soft corals, fans, sponges, gorgonians, octocorals, zoanthids, tunicates, algae, anemones and hydroids). To compare visitors' perceptions of
underwater visibility with measured data, I took daily secchi disc readings at sites
where I was observing tourists (for method see Chapter 2). Sediment trap data
collected by C. K. Schelten at five sites (Site nos. 6,8,9,11 and 12) were used to
compare visitors' perception of sediment pollution with measured data. Spearman's
Rank Order Correlation coefficients were used because my data were non-normally distributed.
Dive and snorkel trips were distributed between fourteen sites (Table 5.2).
127
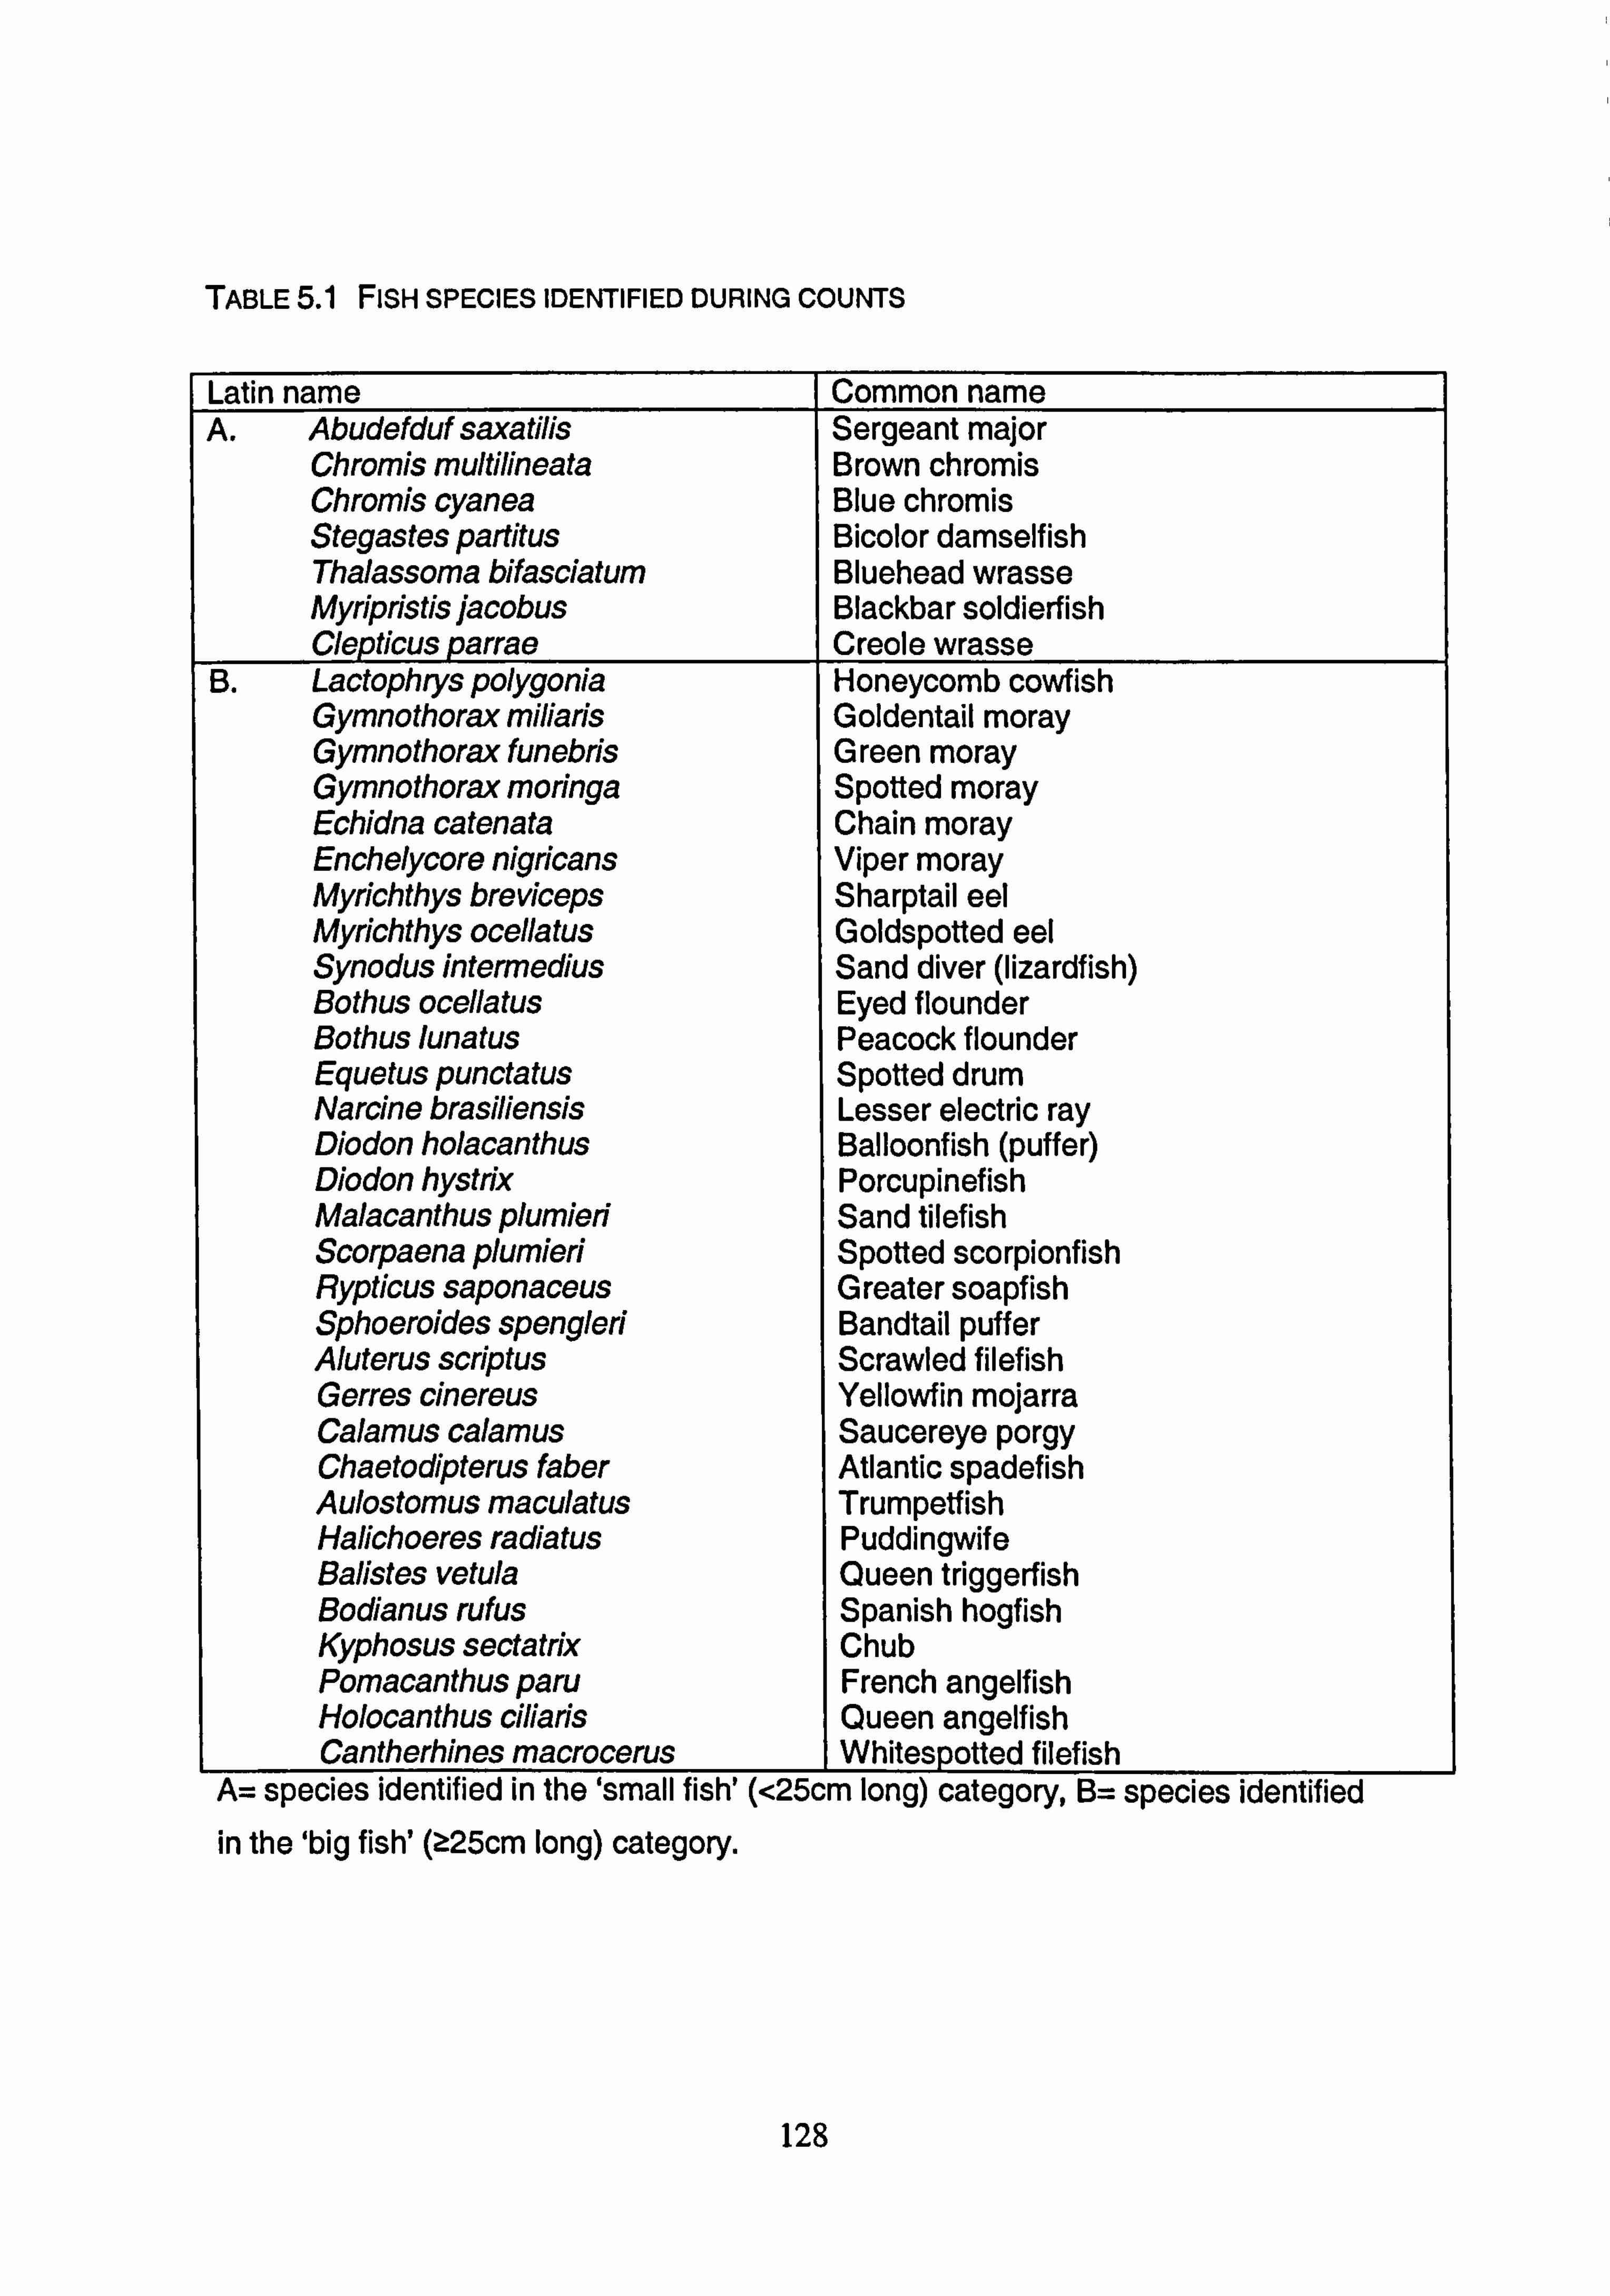
TABLE 5.1 FISH SPECIES IDENTIFIED DURING COUNTS
Latin name Common name A. Abudefduf saxatilis Sergeant major
Chromis multiflneata Brown chromis Chromis cyanea Blue chromis Stegastes partitus Bicolor damselfish Thalassoma bifasciatum Bluehead wrasse Myripfistis jacobus Blackbar soldierfish Clepticus Parrae Creole wrasse
B. Lactophrys polygonia Honeycomb cowfish Gymnothorax miliaris Goldentail moray Gymnothorax funebris Green moray Gymnothorax moringa Spotted moray Echidna catenata Chain moray Enchelycore nigricans Viper moray Myrichthys breviceps Sharptail eel Myrichthys ocellatus Goldspotted eel Synodus intermedius Sand diver (lizardfish) Bothus ocellatus Eyed flounder Bothus lunatus Peacock flounder Equetus punctatus Spotted drum Narcine brasiliensis Lesser electric ray Diddon holacanthus Balloonfish (puffer) Diodon hystrix Porcupinefish Malacanthus plumieri Sand tilefish Scorpaena plumieri Spotted scorpionfish Rypticus saponaceus Greater soapfish Sphoeroides spengleri Bandtail puffer Aluterus scriptus Scrawled filefish Gerres cinereus Yellowfin mojarra Calamus calamus Saucereye, porgy Chaetodipterus faber Atlantic spadefish Auldstomus maculatus Trumpeff ish Halichoeres radiatus Puddingwife Bafistes vetula Queen triggerfish Bodianus rufus Spanish hogfish Kyphosus sectatrix Chub Pomacanthus paru French angelfish Holocanthus ciflaris Queen angelfish Cantherhines macrocerus Whitespotted filefish
A= species identified in the'small fish' (<25cm long) category, B= species identified in the 'big fish' (2: 25cm long) category.
128
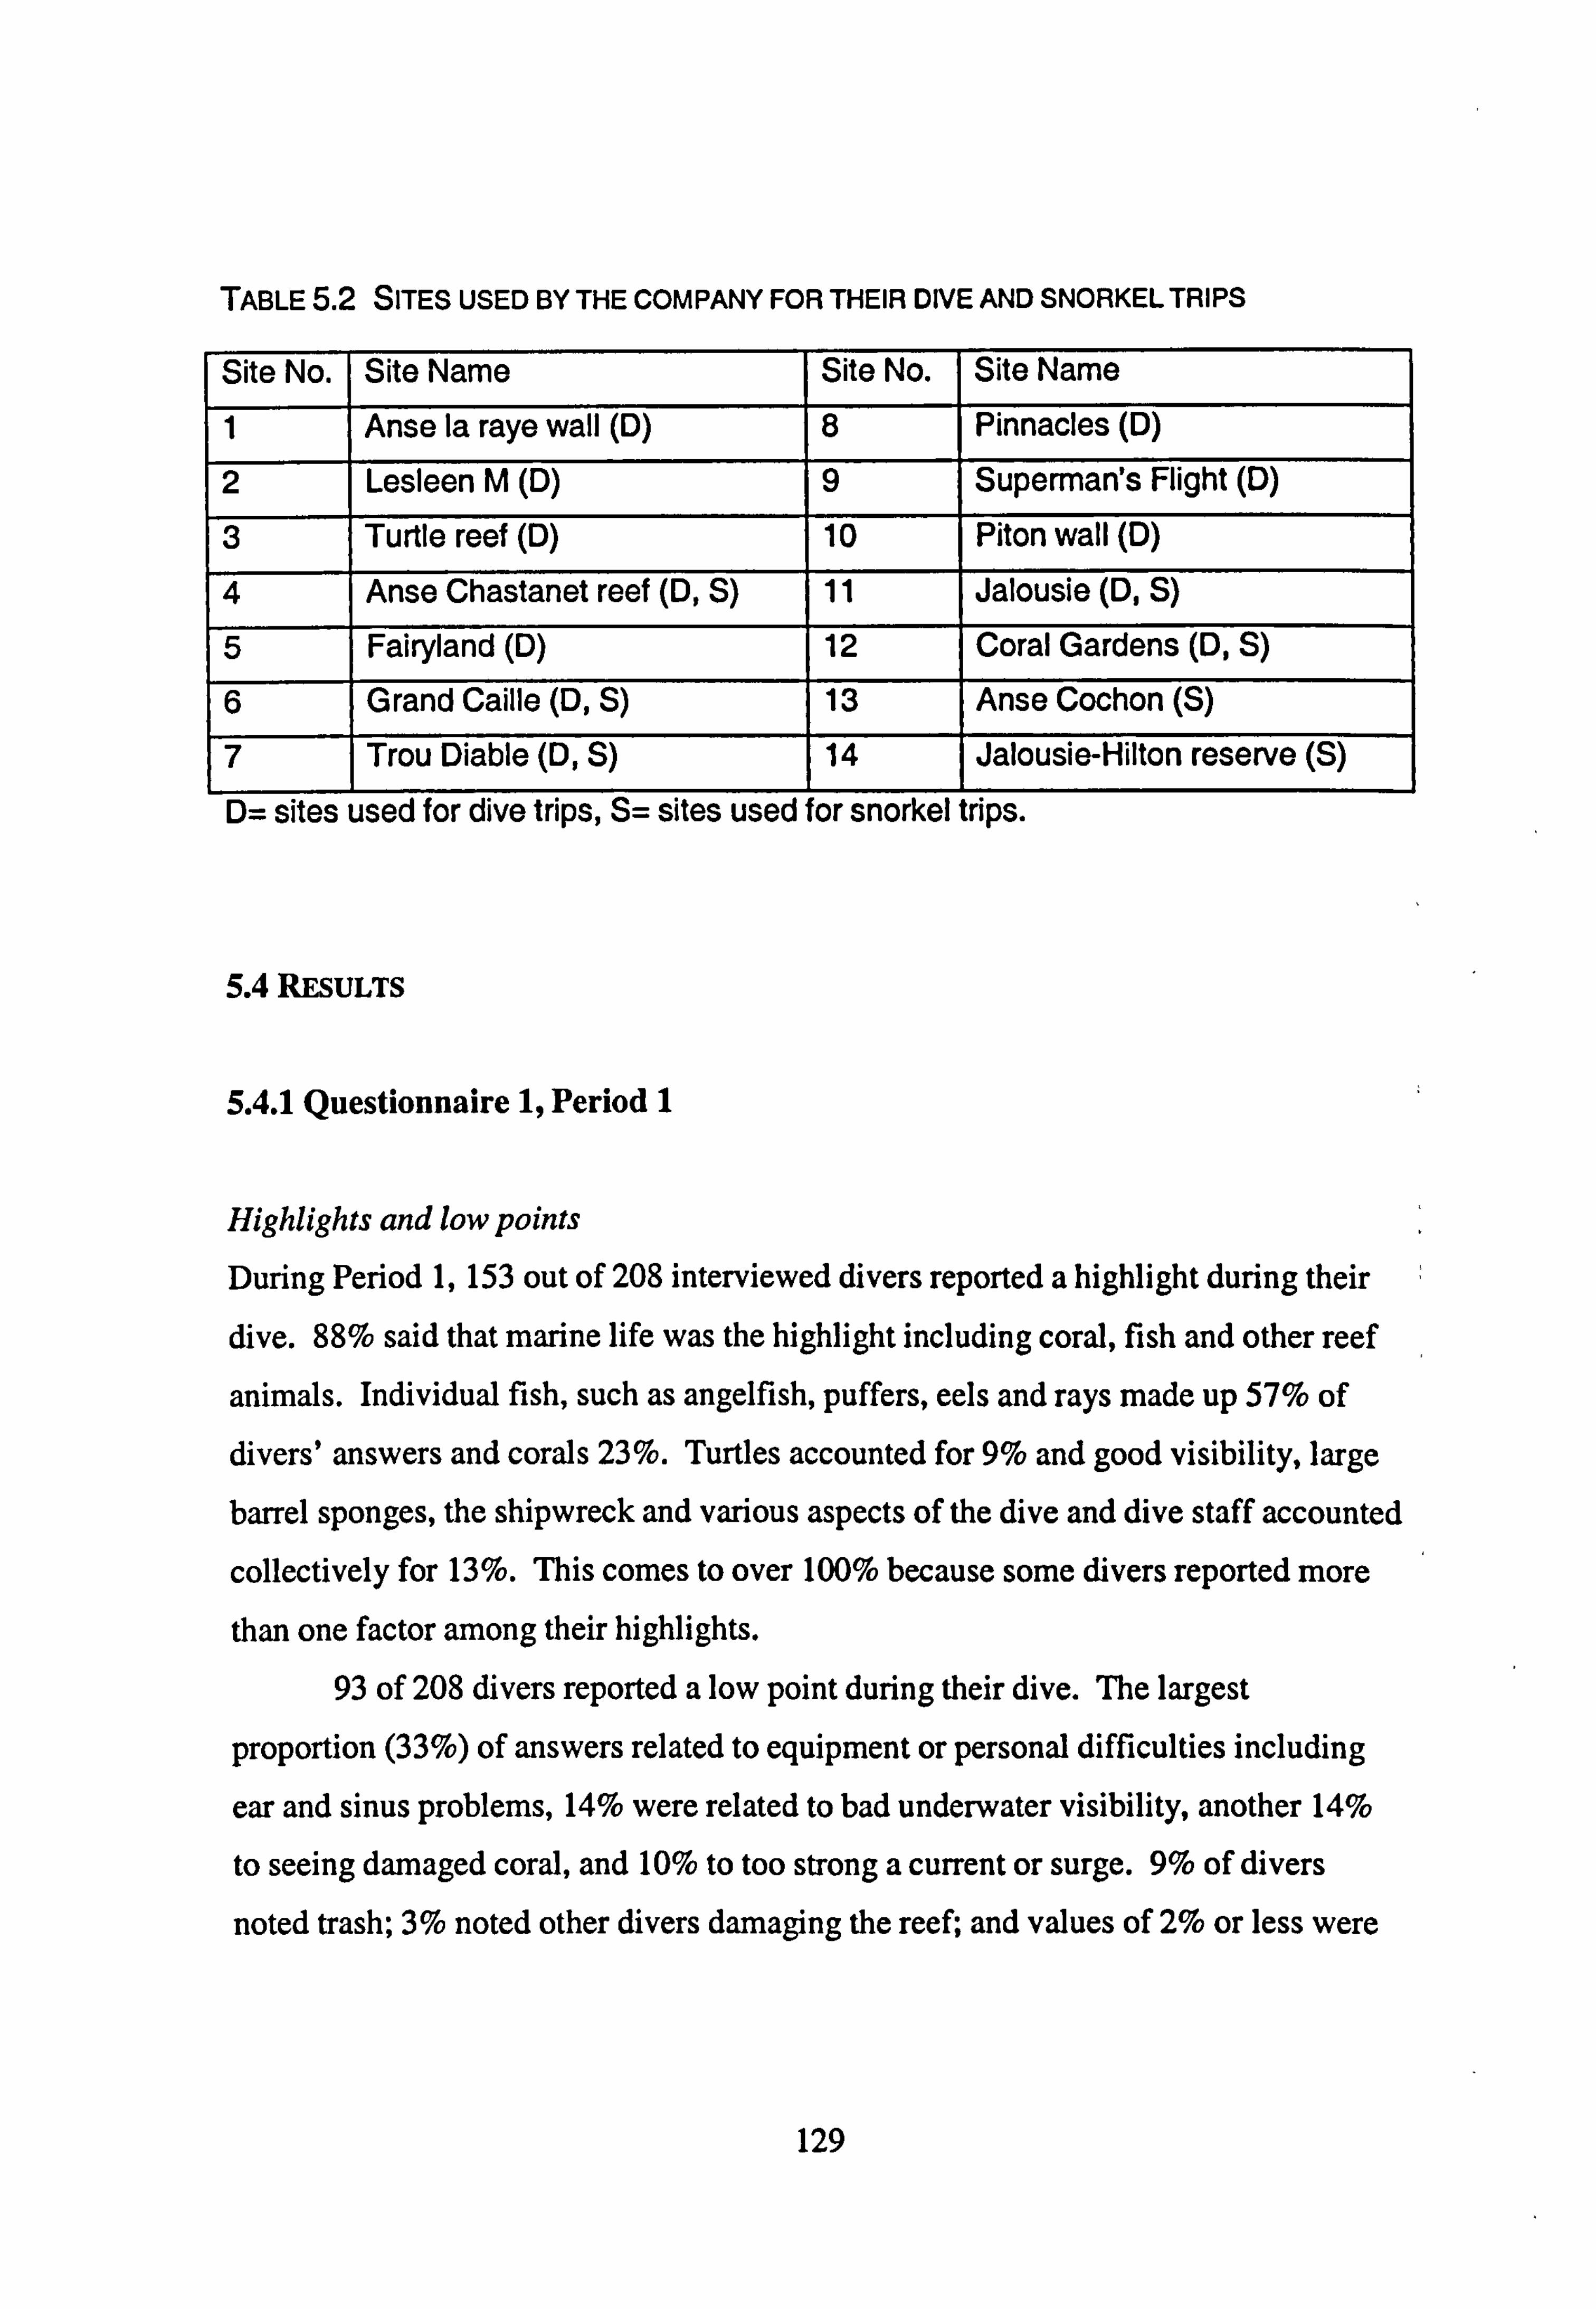
TABLE5.2 SITES USED 13Y THE COMPANY FOR THEIR DIVE AND SNORKEL TRIPS
Site No. Site Name Site No. Site Name
1 Anse la raye wall (D) 8 Pinnacles (D)
2 Lesleen M (D) 9 Superman's Flight (D)
3 Turtle reef (D) 10 Piton wall (D)
4 Anse Chastanet reef (D, S) 11 Jalousie (D, S)
5 Fairyland (D) 12 Coral Gardens (D, S)
6 Grand Caille (D, S) 13 Anse Cochon (S)
7 Trou Diable (D, S) 14 Jalousie-Hilton reserve (S)
D= sites used for dive trips, S= sites used for snorkel trips.
5.4 REsuLTs
5.4.1 Questionnaire 1, Period I
Highlights and low points
During Period 1,153 out of 208 interviewed divers reported a highlight during their
dive. 88% said that marine life was the highlight including coral, fish and other reef
animals. Individual fish, such as angelfish, puffers, eels and rays made up 57% of divers' answers and corals 23%. Turtles accounted for 9% and good visibility, large
barrel sponges, the shipwreck and various aspects of the dive and dive staff accounted
collectively for 13%. This comes to over 100% because some divers reported more
than one factor among their highlights.
93 of 208 divers reported a low point during their dive. The largest
proportion (33%) of answers related to equipment or personal difficulties including
ear and sinus problems, 14% were related to bad underwater visibility, another 14%
to seeing damaged coral, and 10% to too strong a current or surge. 9% of divers
noted trash; 3% noted other divers damaging the reef-, and values of 2% or less were
129
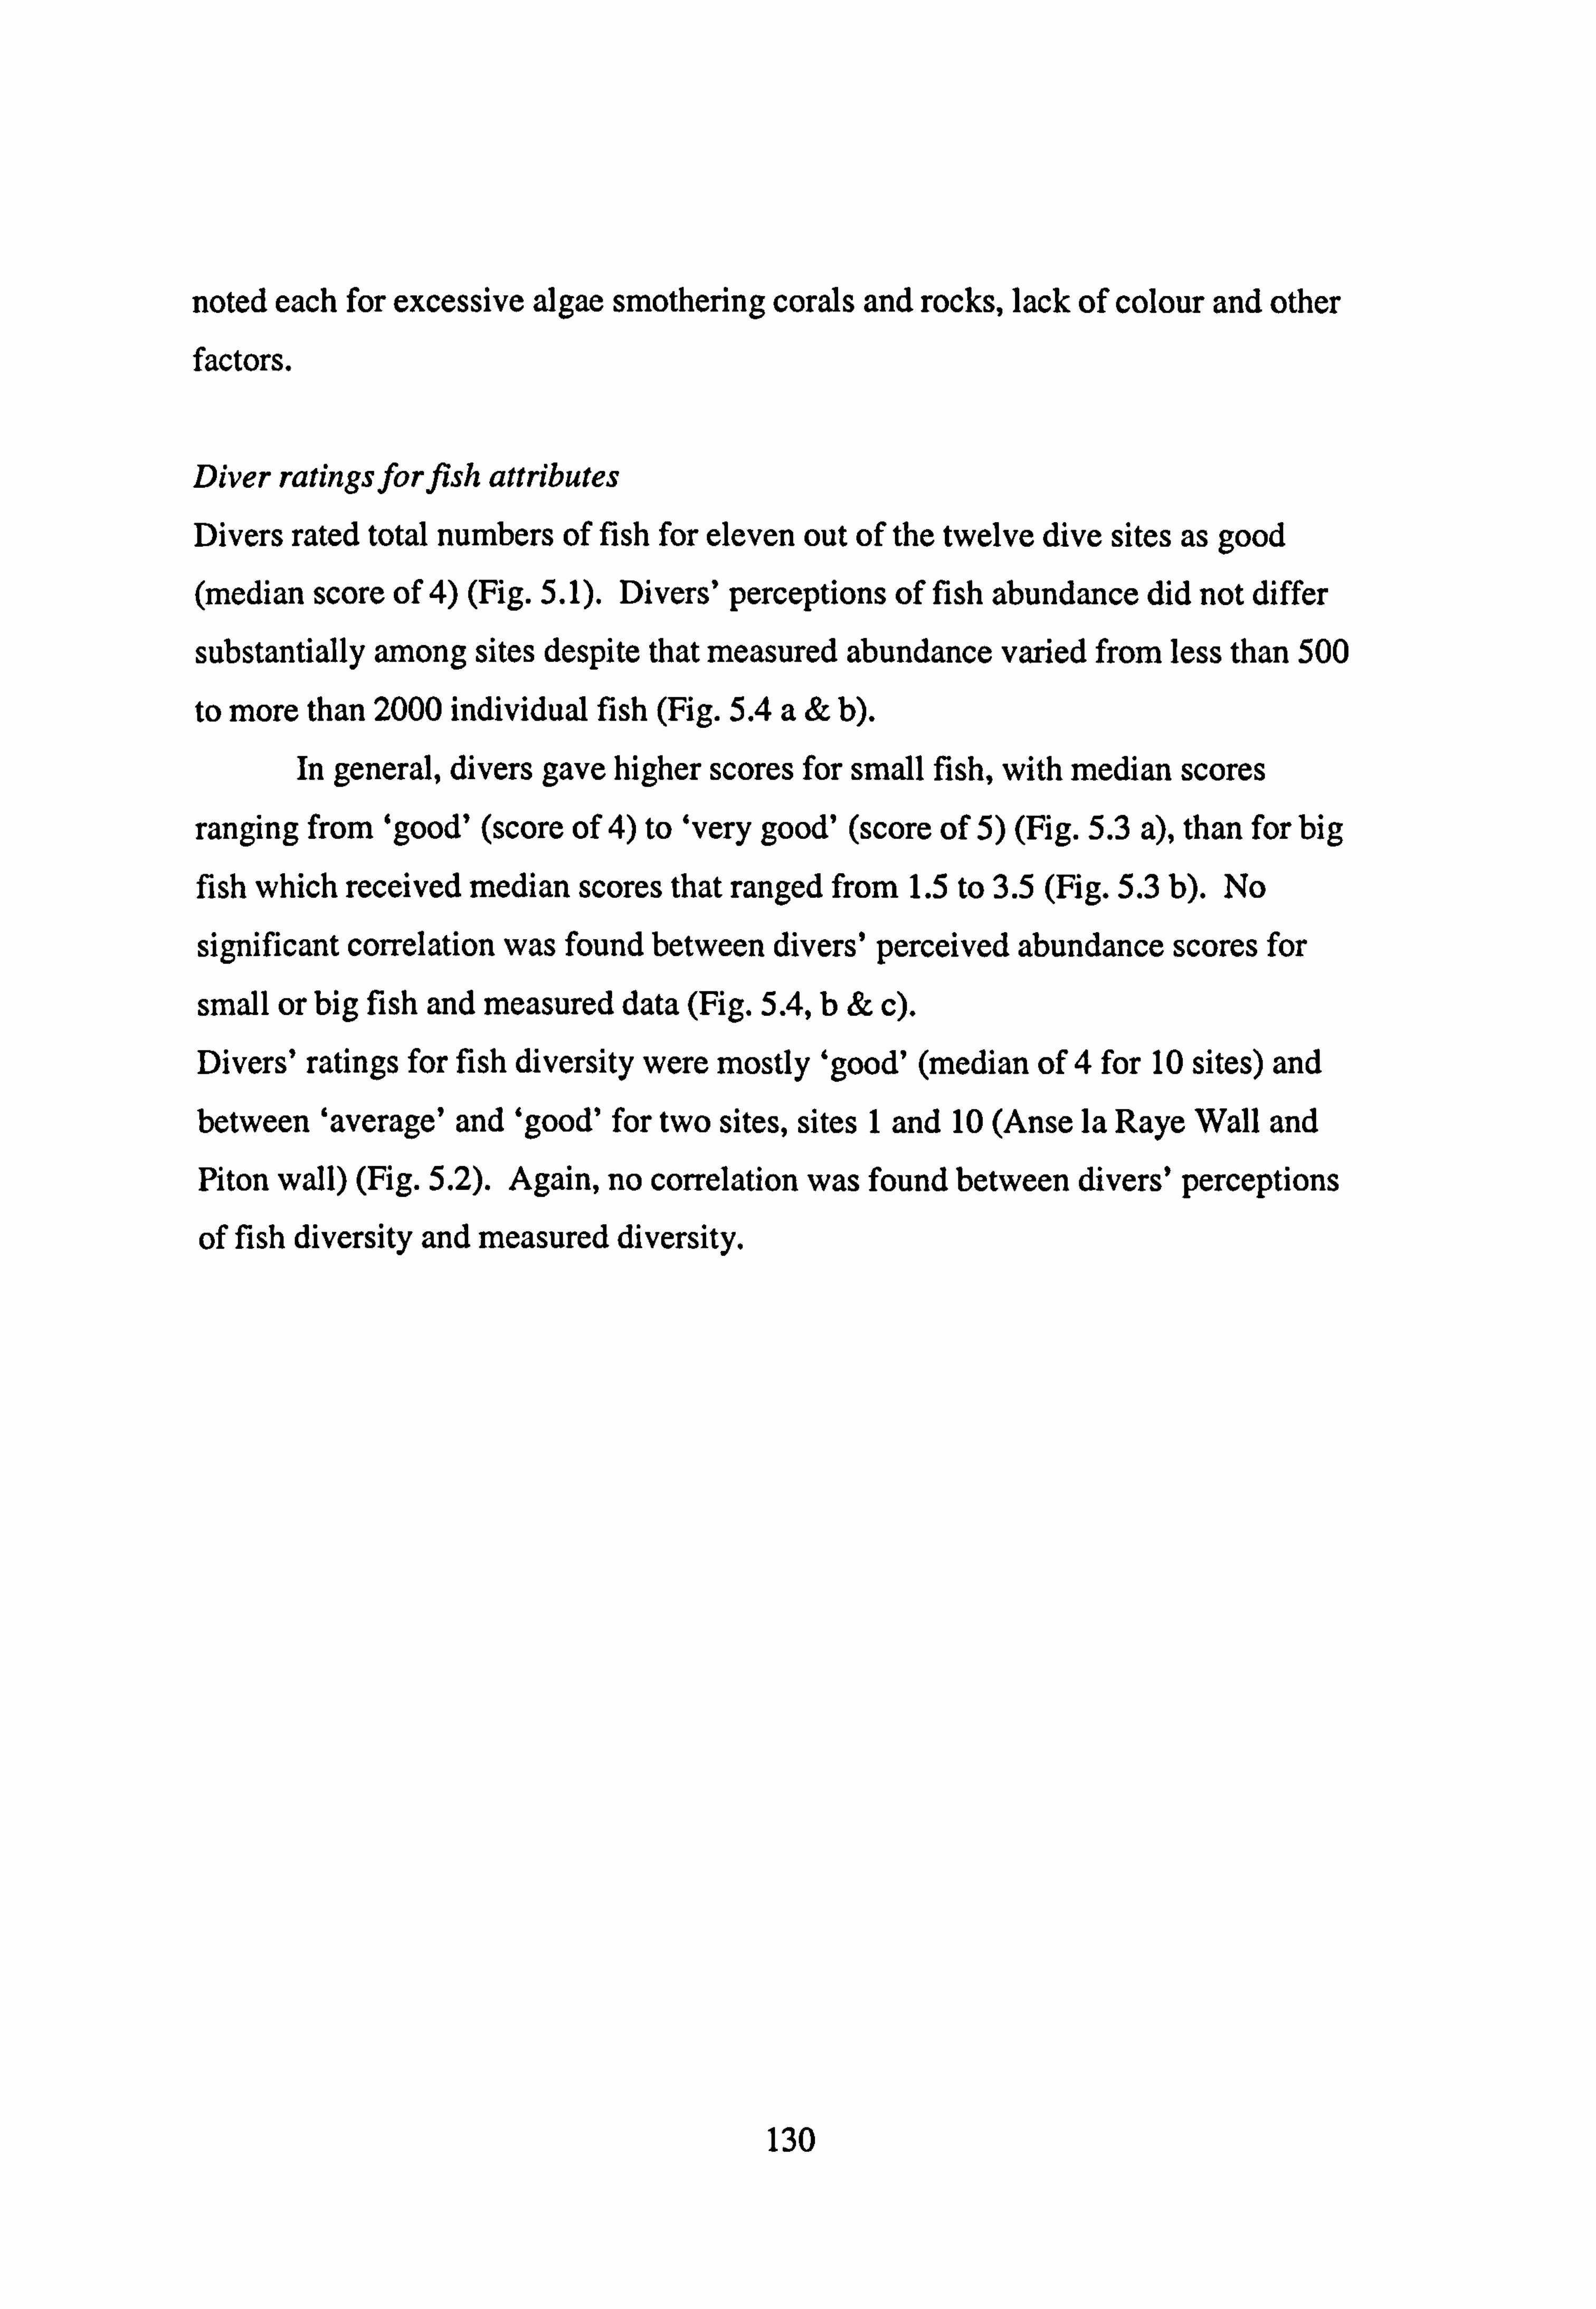
noted each for excessive algae smothering corals and rocks, lack of colour and other factors.
Diver ratingsforfish attributes
Divers rated total numbers of fish for eleven out of the twelve dive sites as good (median score of 4) (Fig. 5.1). Divers' perceptions of fish abundance did not differ
substantially among sites despite that measured abundance varied from less than 500
to more than 2000 individual fish (Fig. 5.4 a& b).
In general, divers gave higher scores for small fish, with median scores
ranging from 'good' (score of 4) to 'very good' (score of 5) (Fig. 5.3 a), than for big
fish which received median scores that ranged from 1.5 to 3.5 (Fig. 5.3 b). No
significant correlation was found between divers' perceived abundance scores for
small or big fish and measured data (Fig. 5.4, b& c). Divers' ratings for fish diversity were mostly 'good' (median of 4 for 10 sites) and between 'average' and 'good' for two sites, sites I and 10 (Anse la Raye Wall and Piton wall) (Fig. 5.2). Again, no correlation was found between divers' perceptions
of fish diversity and measured diversity.
130
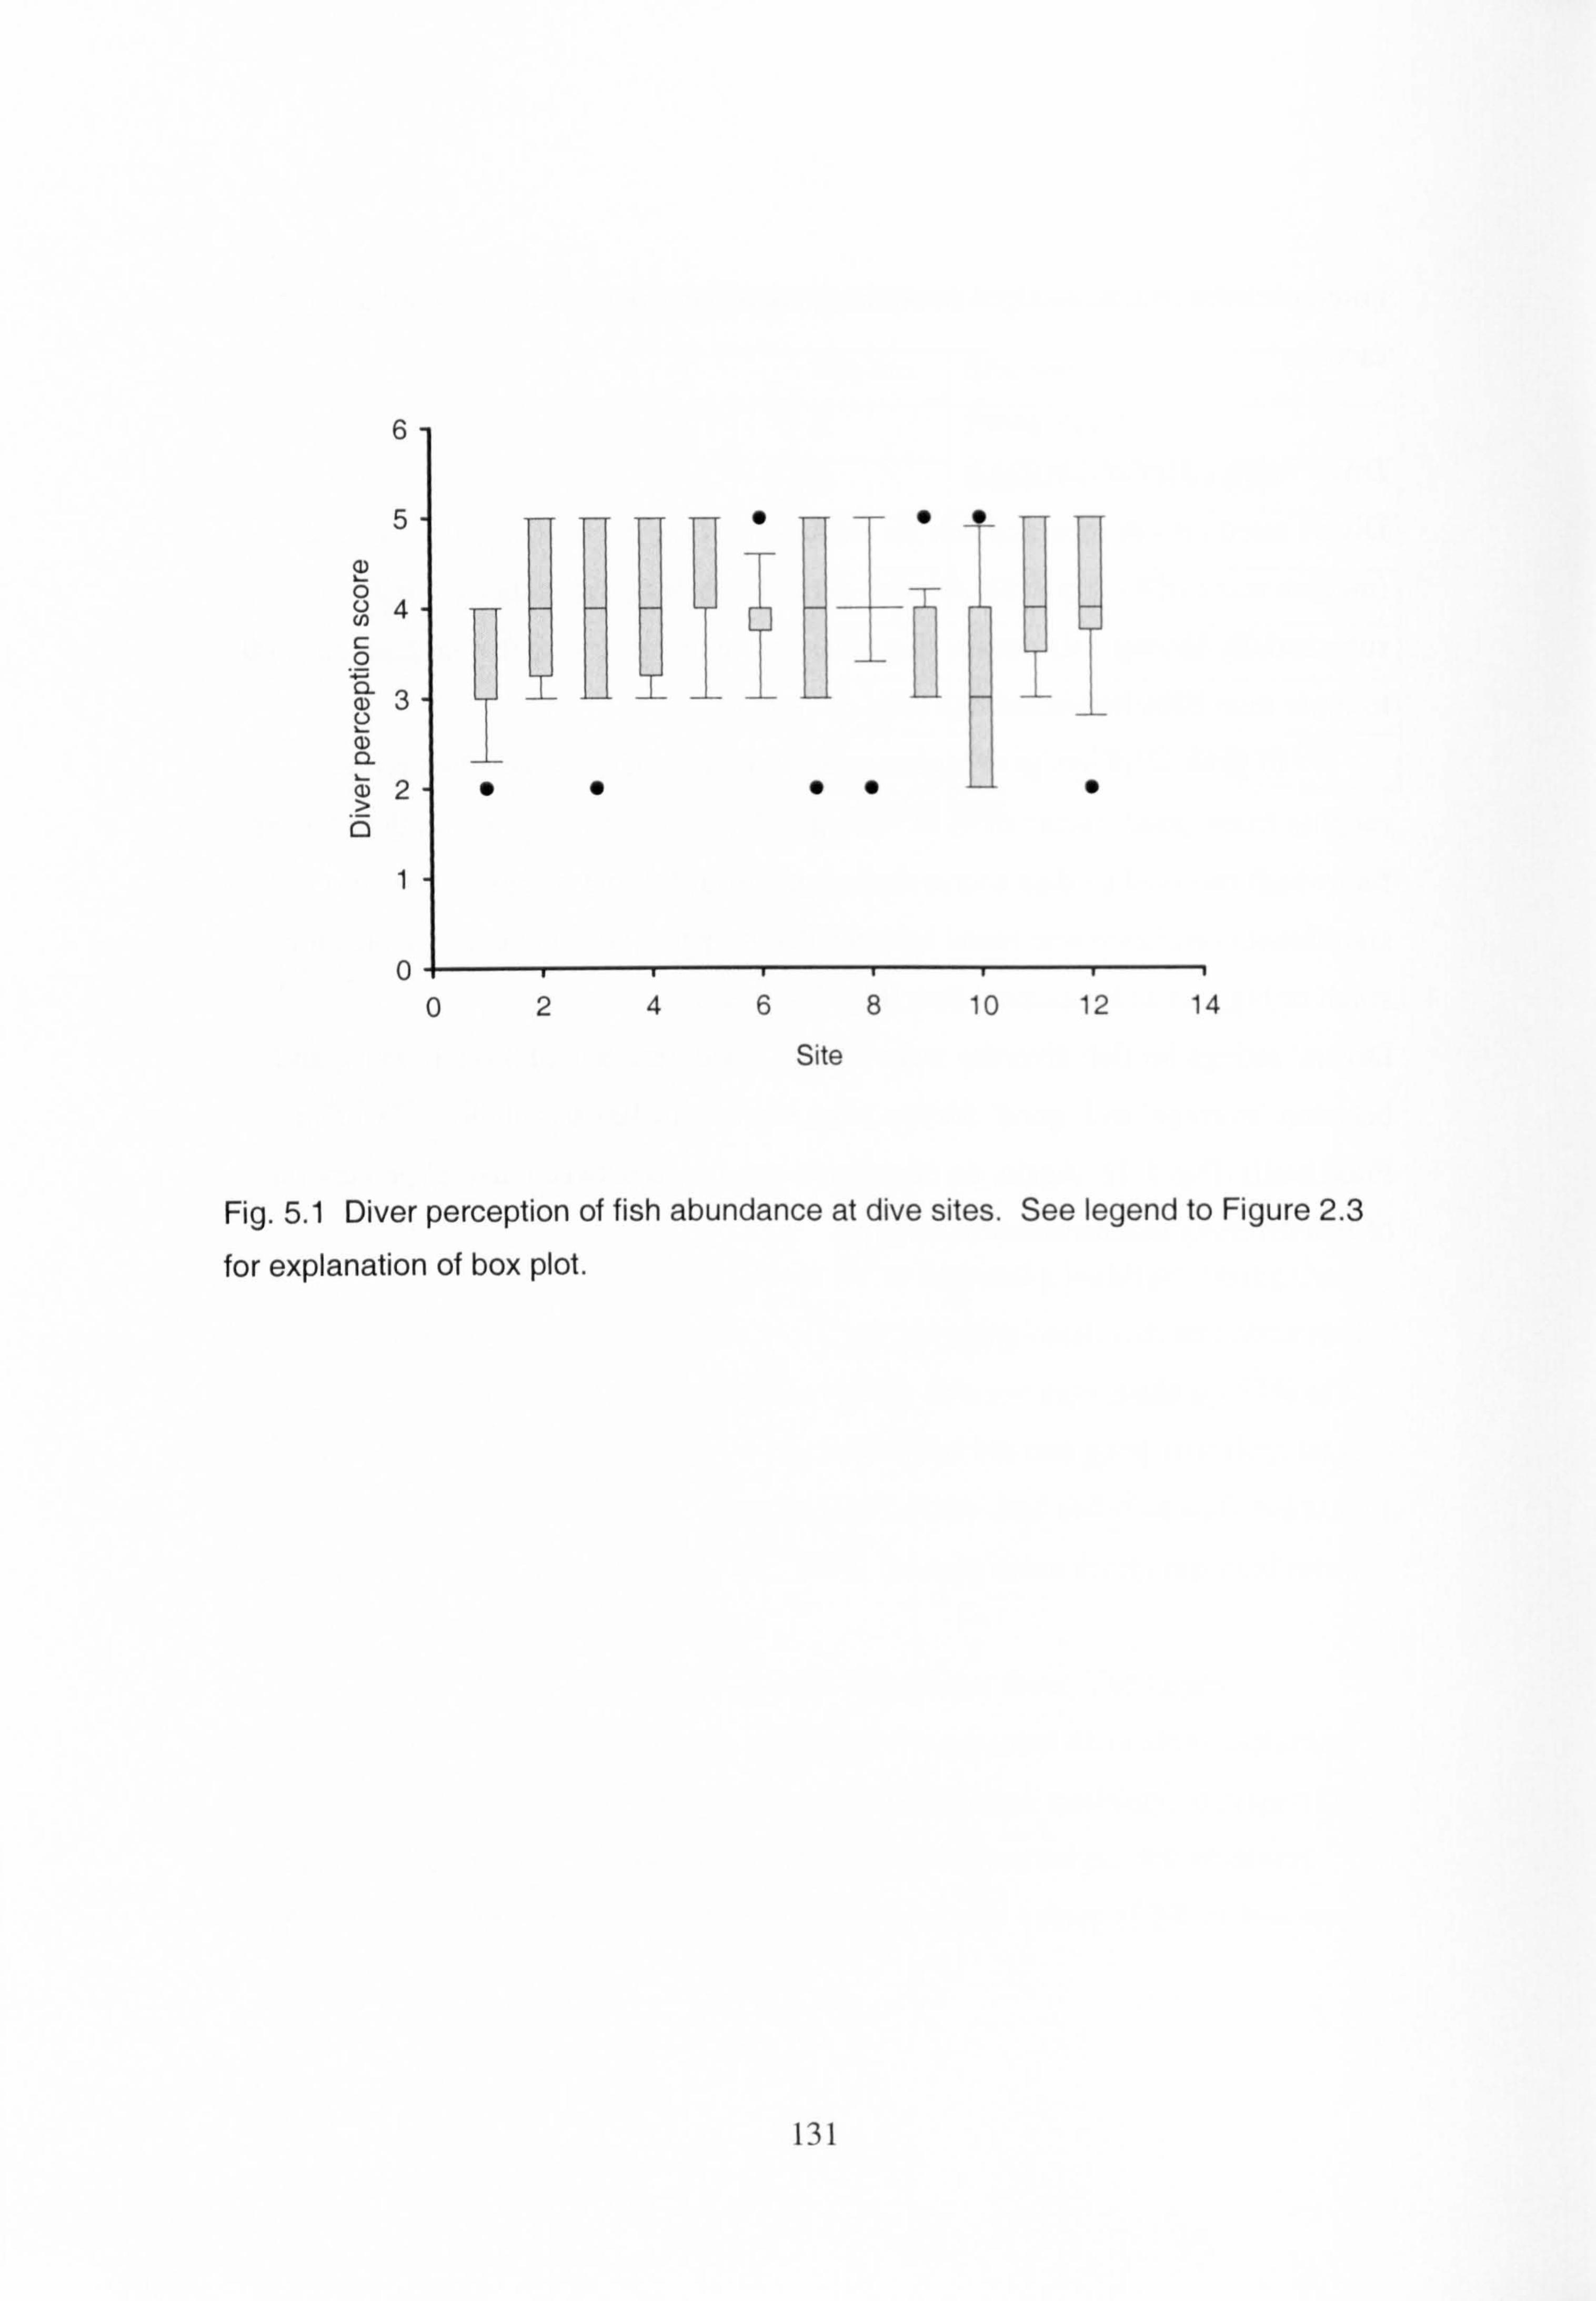
6
5
0 04 r (1) II
II 0 II aH w3
S"
0
1
10 12 14
Fig. 5.1 Diver perception of fish abundance at dive sites. See legend to Figure 2.3
for explanation of box plot.
131
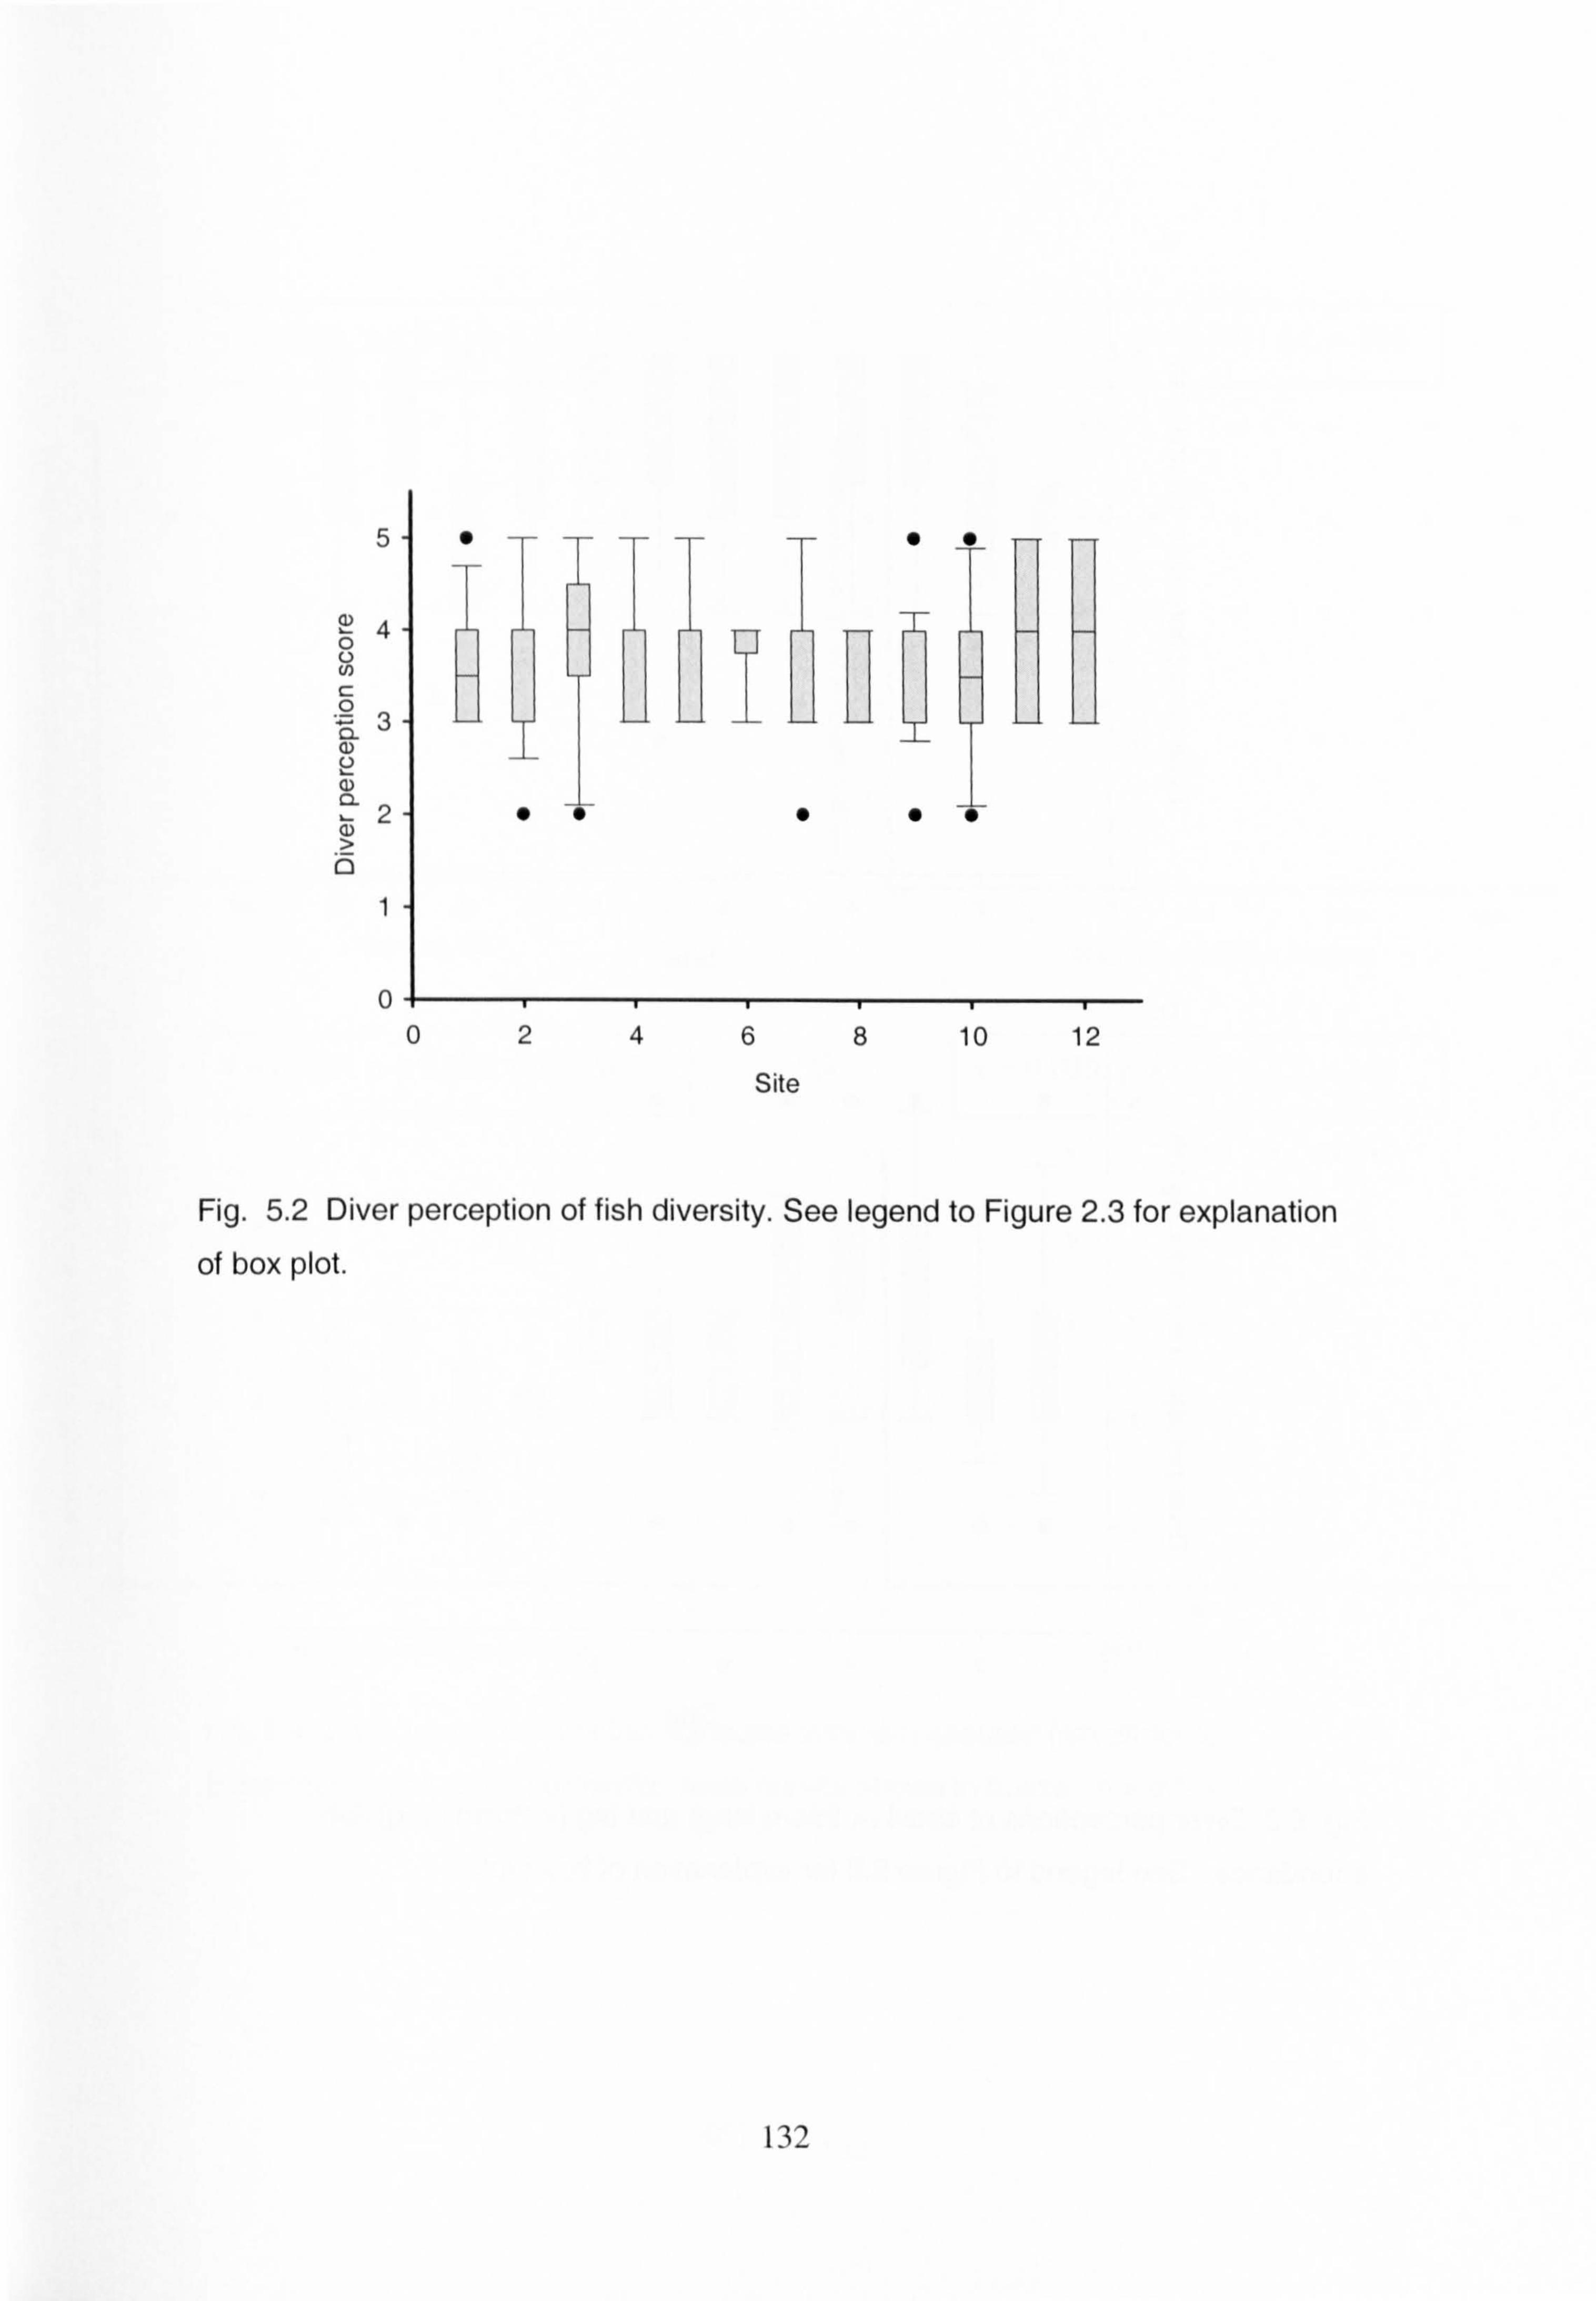
Fig. 5.2 Diver perception of fish diversity. See legend to Figure 2.3 for explanation
of box plot.
132
a.
LA
CO
E
0-
068 10 12
Site b.
5- .... I
. S S S I I-
0 0 26 10 12
Site
Fig. 5.3 Diver perceptions of small (< 25cm long) and big (2: 25cm long) fish
abundance. See legend to Figure 2.3 for explanation of box plot.
133
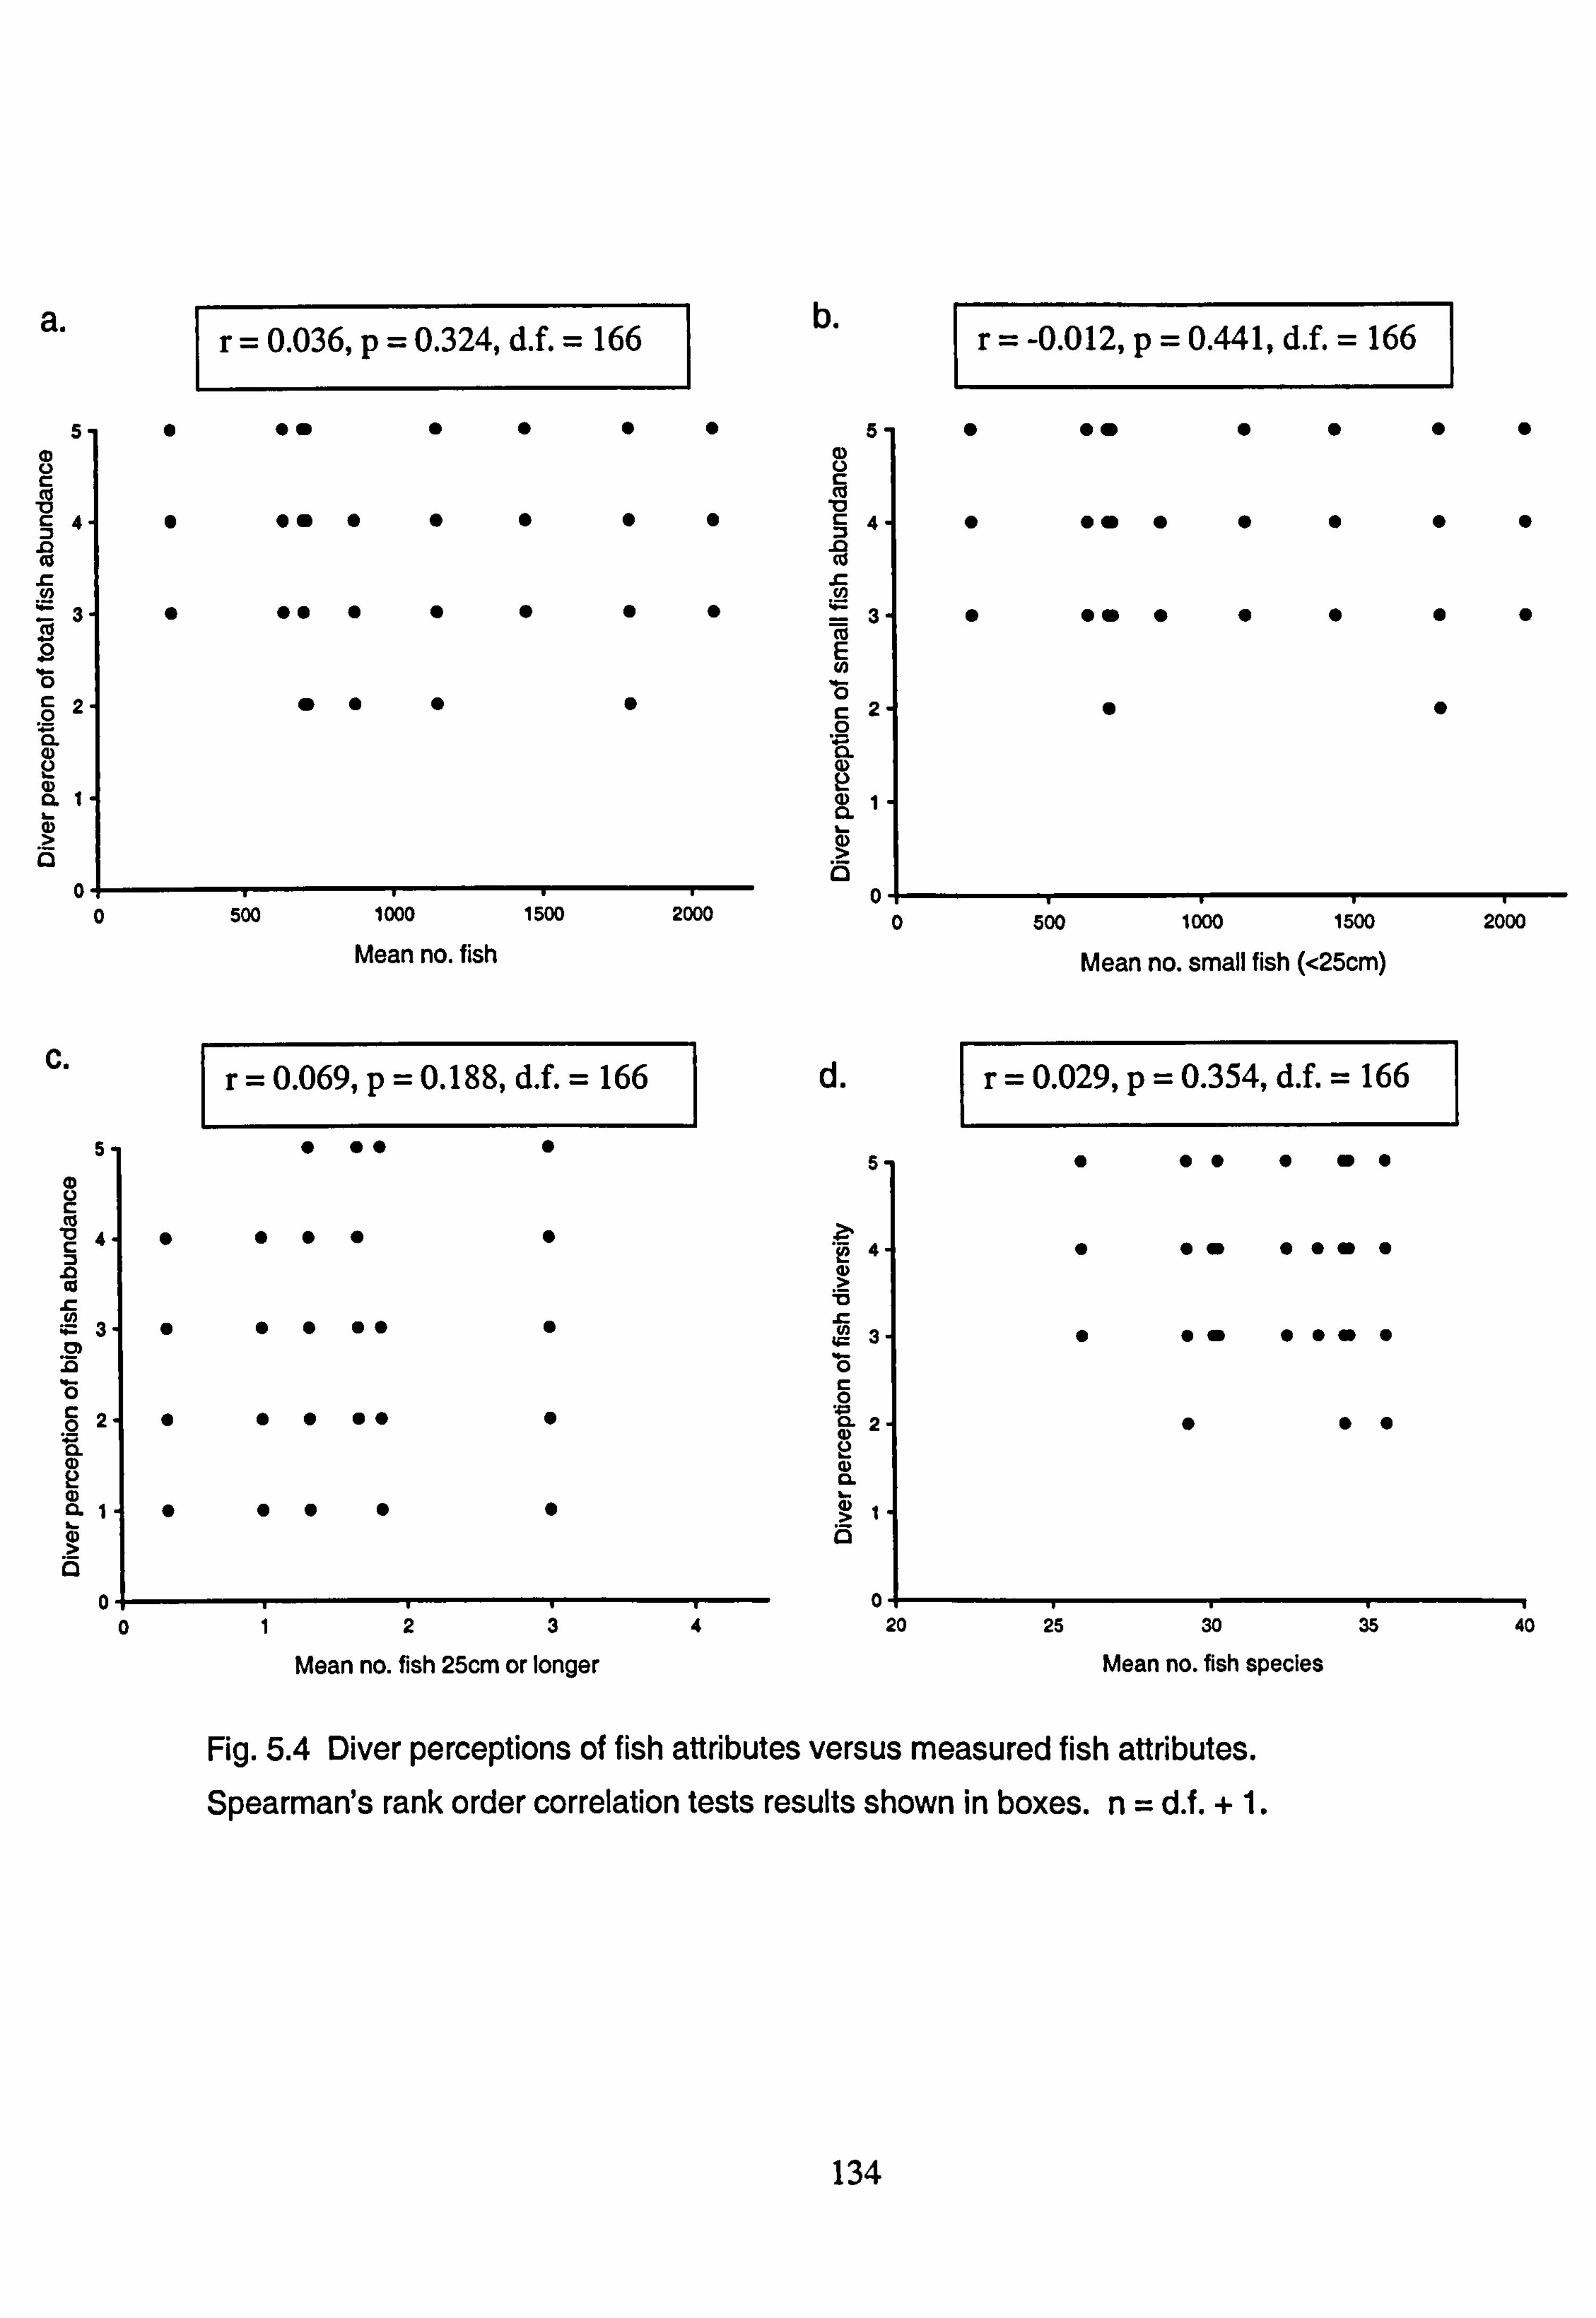
a.
C.
5
0 M
.0 Co
0 2-
(D
01 0
0.036, p=0.324, d. f. = 166 b.
5 C) C. ) C CC
(C
(I,
CC E Co 0 c2 0
a) 4) 1 CL
0
d
5
*Co
0 CL
9) 2 Q
500 1000 1500
Mean no. small fish (<25cm)
0.029, p=0.354, dI 166
I--Ir- 10"I 2 20 25
ýO
Mean no. fish 25cm or longer Mean no. fish species
Fig. 5.4 Diver perceptions of fish attributes versus measured fish attributes. Spearman's rank order correlation tests results shown in boxes. n=d. f. + 1.
134
2000
40
500 1000 1500 2000 Mean no. fish
-0.012, p=0.441, d. f. 166
0.069, p=0.188, dl = 166
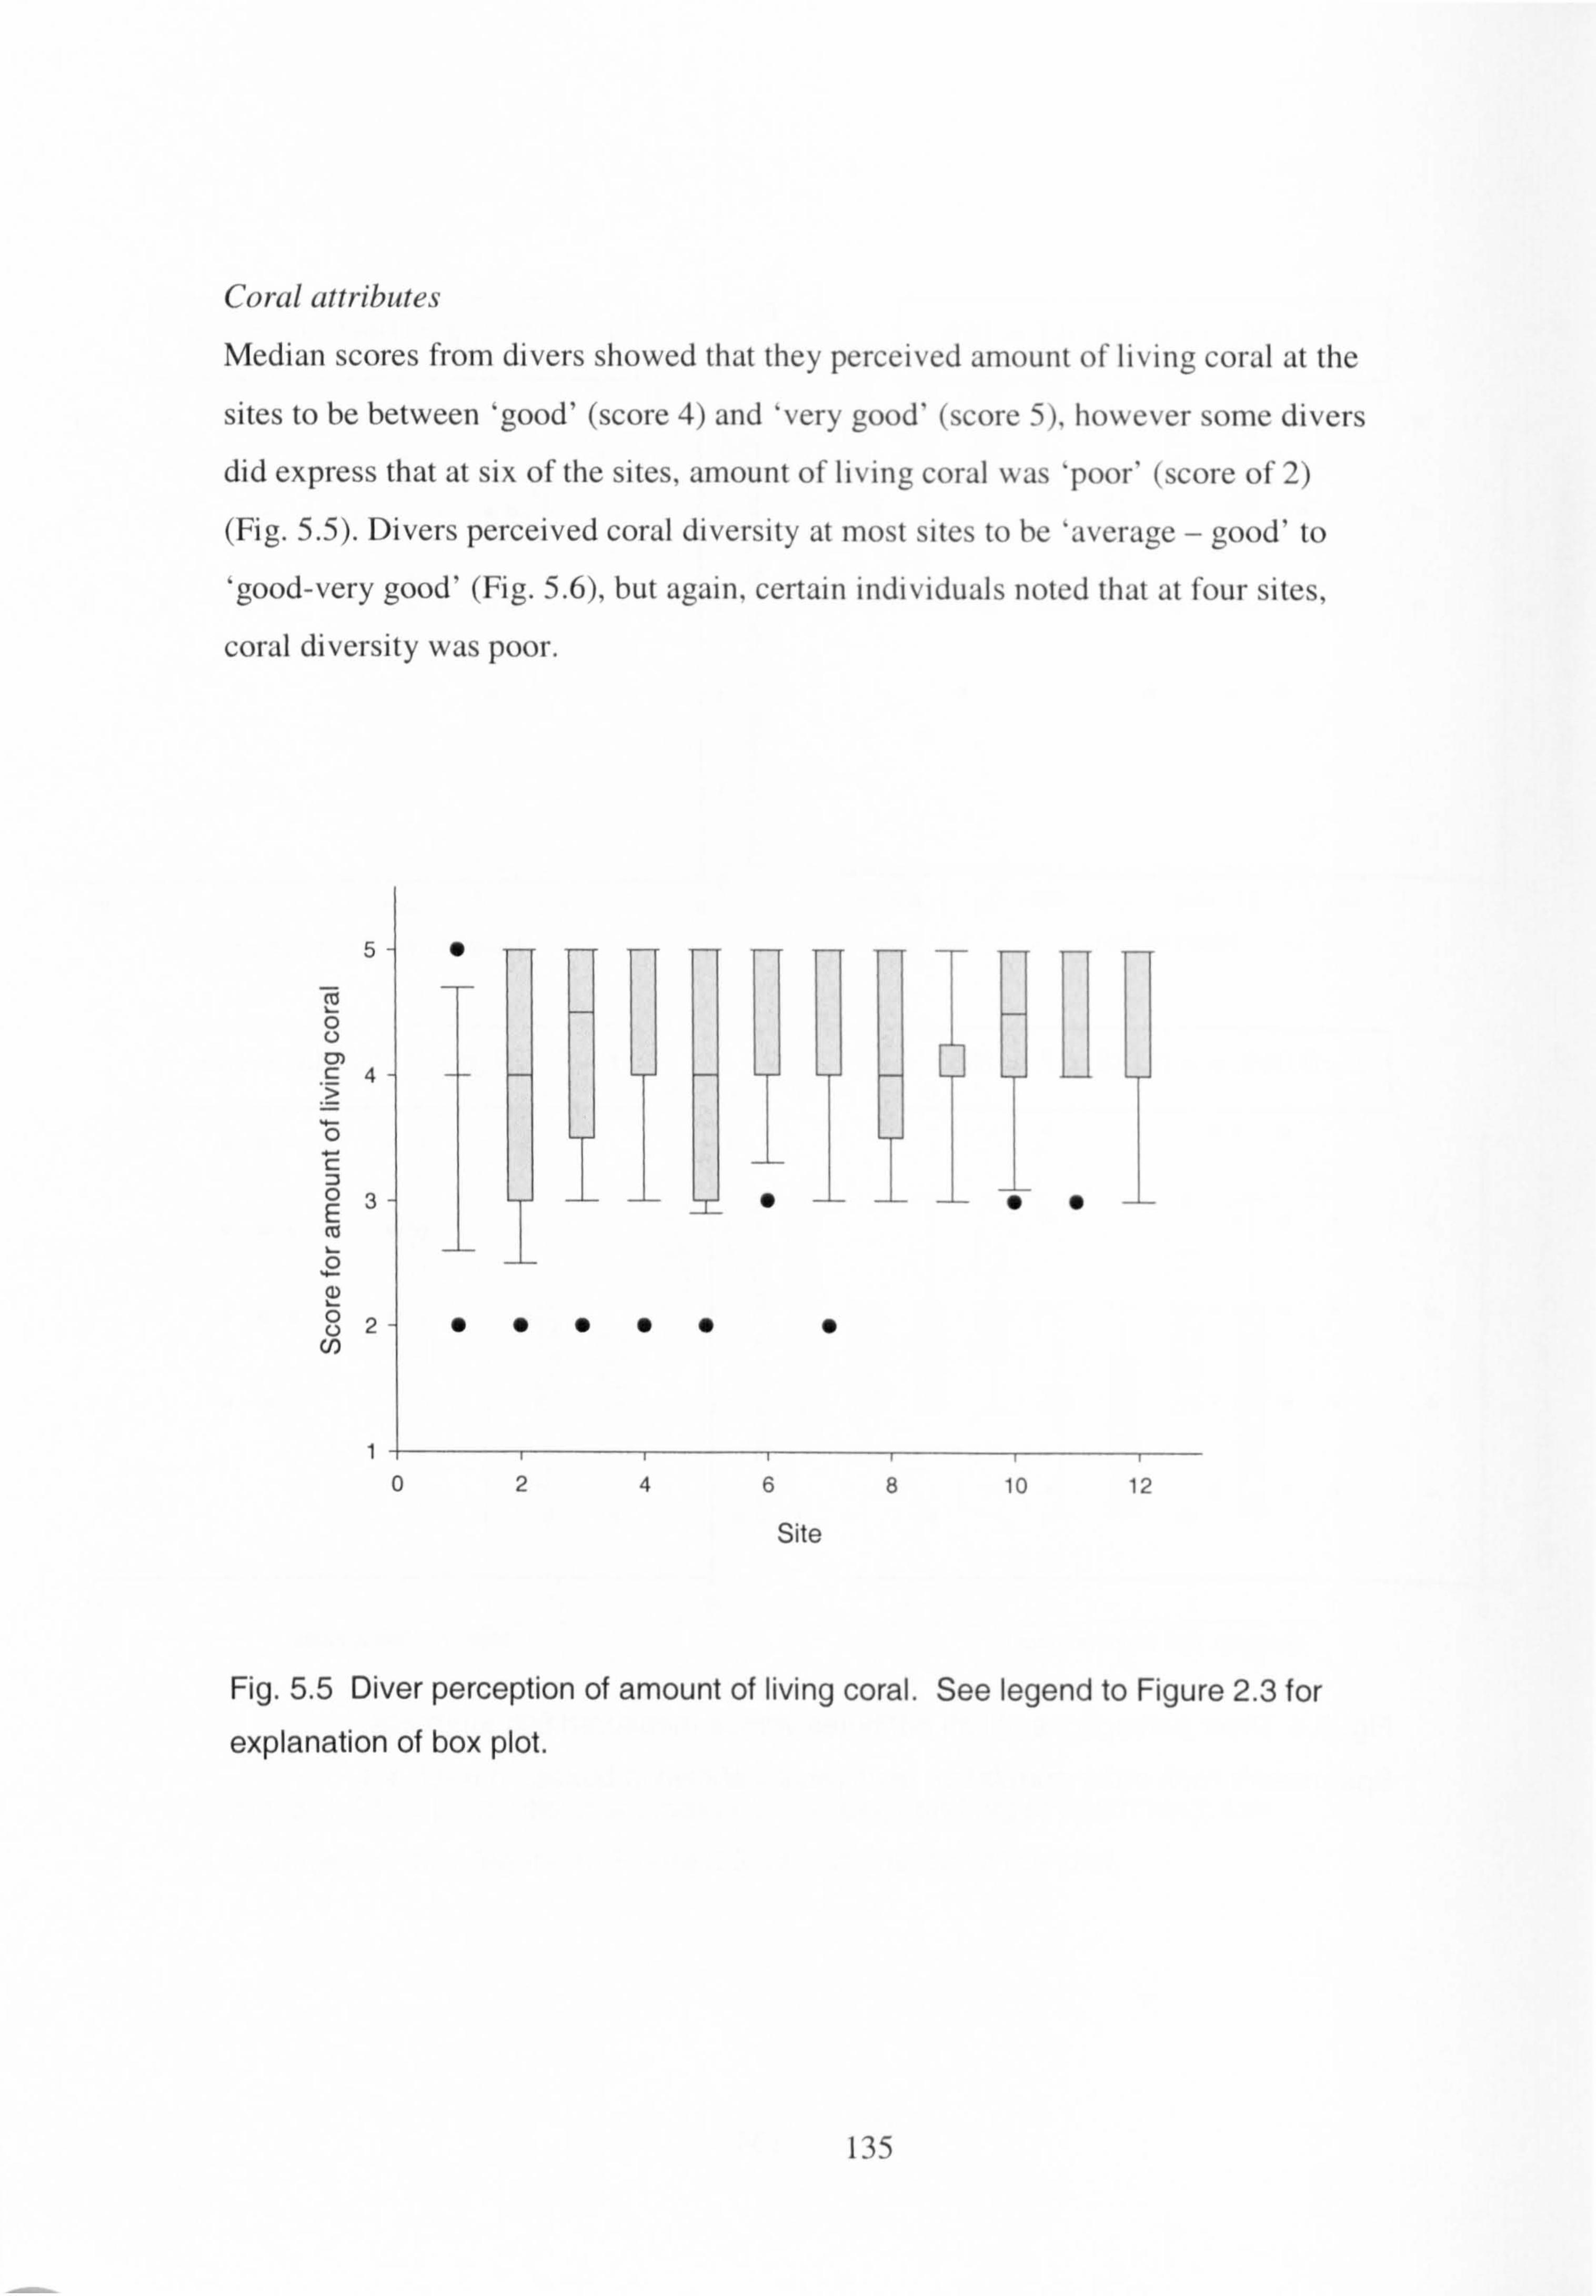
Coral attributes Median scores from divers showed that they perceived amount of living coral at the
sites to be between 'good' (score 4) and 'very good' (score 5), however some divers
did express that at six of the sites, amount of living coral was 'poor' (score of 2)
(Fig. 5.5). Divers perceived coral diversity at most sites to be 'average - good' to
'good-very good' (Fig. 5.6), but again, certain individuals noted that at four sites,
coral diversity was poor.
5S
.C
0 E cu
0 00000
024 8 10 12
Site
Fig. 5.5 Diver perception of amount of living coral. See legend to Figure 2.3 for
explanation of box plot.
135
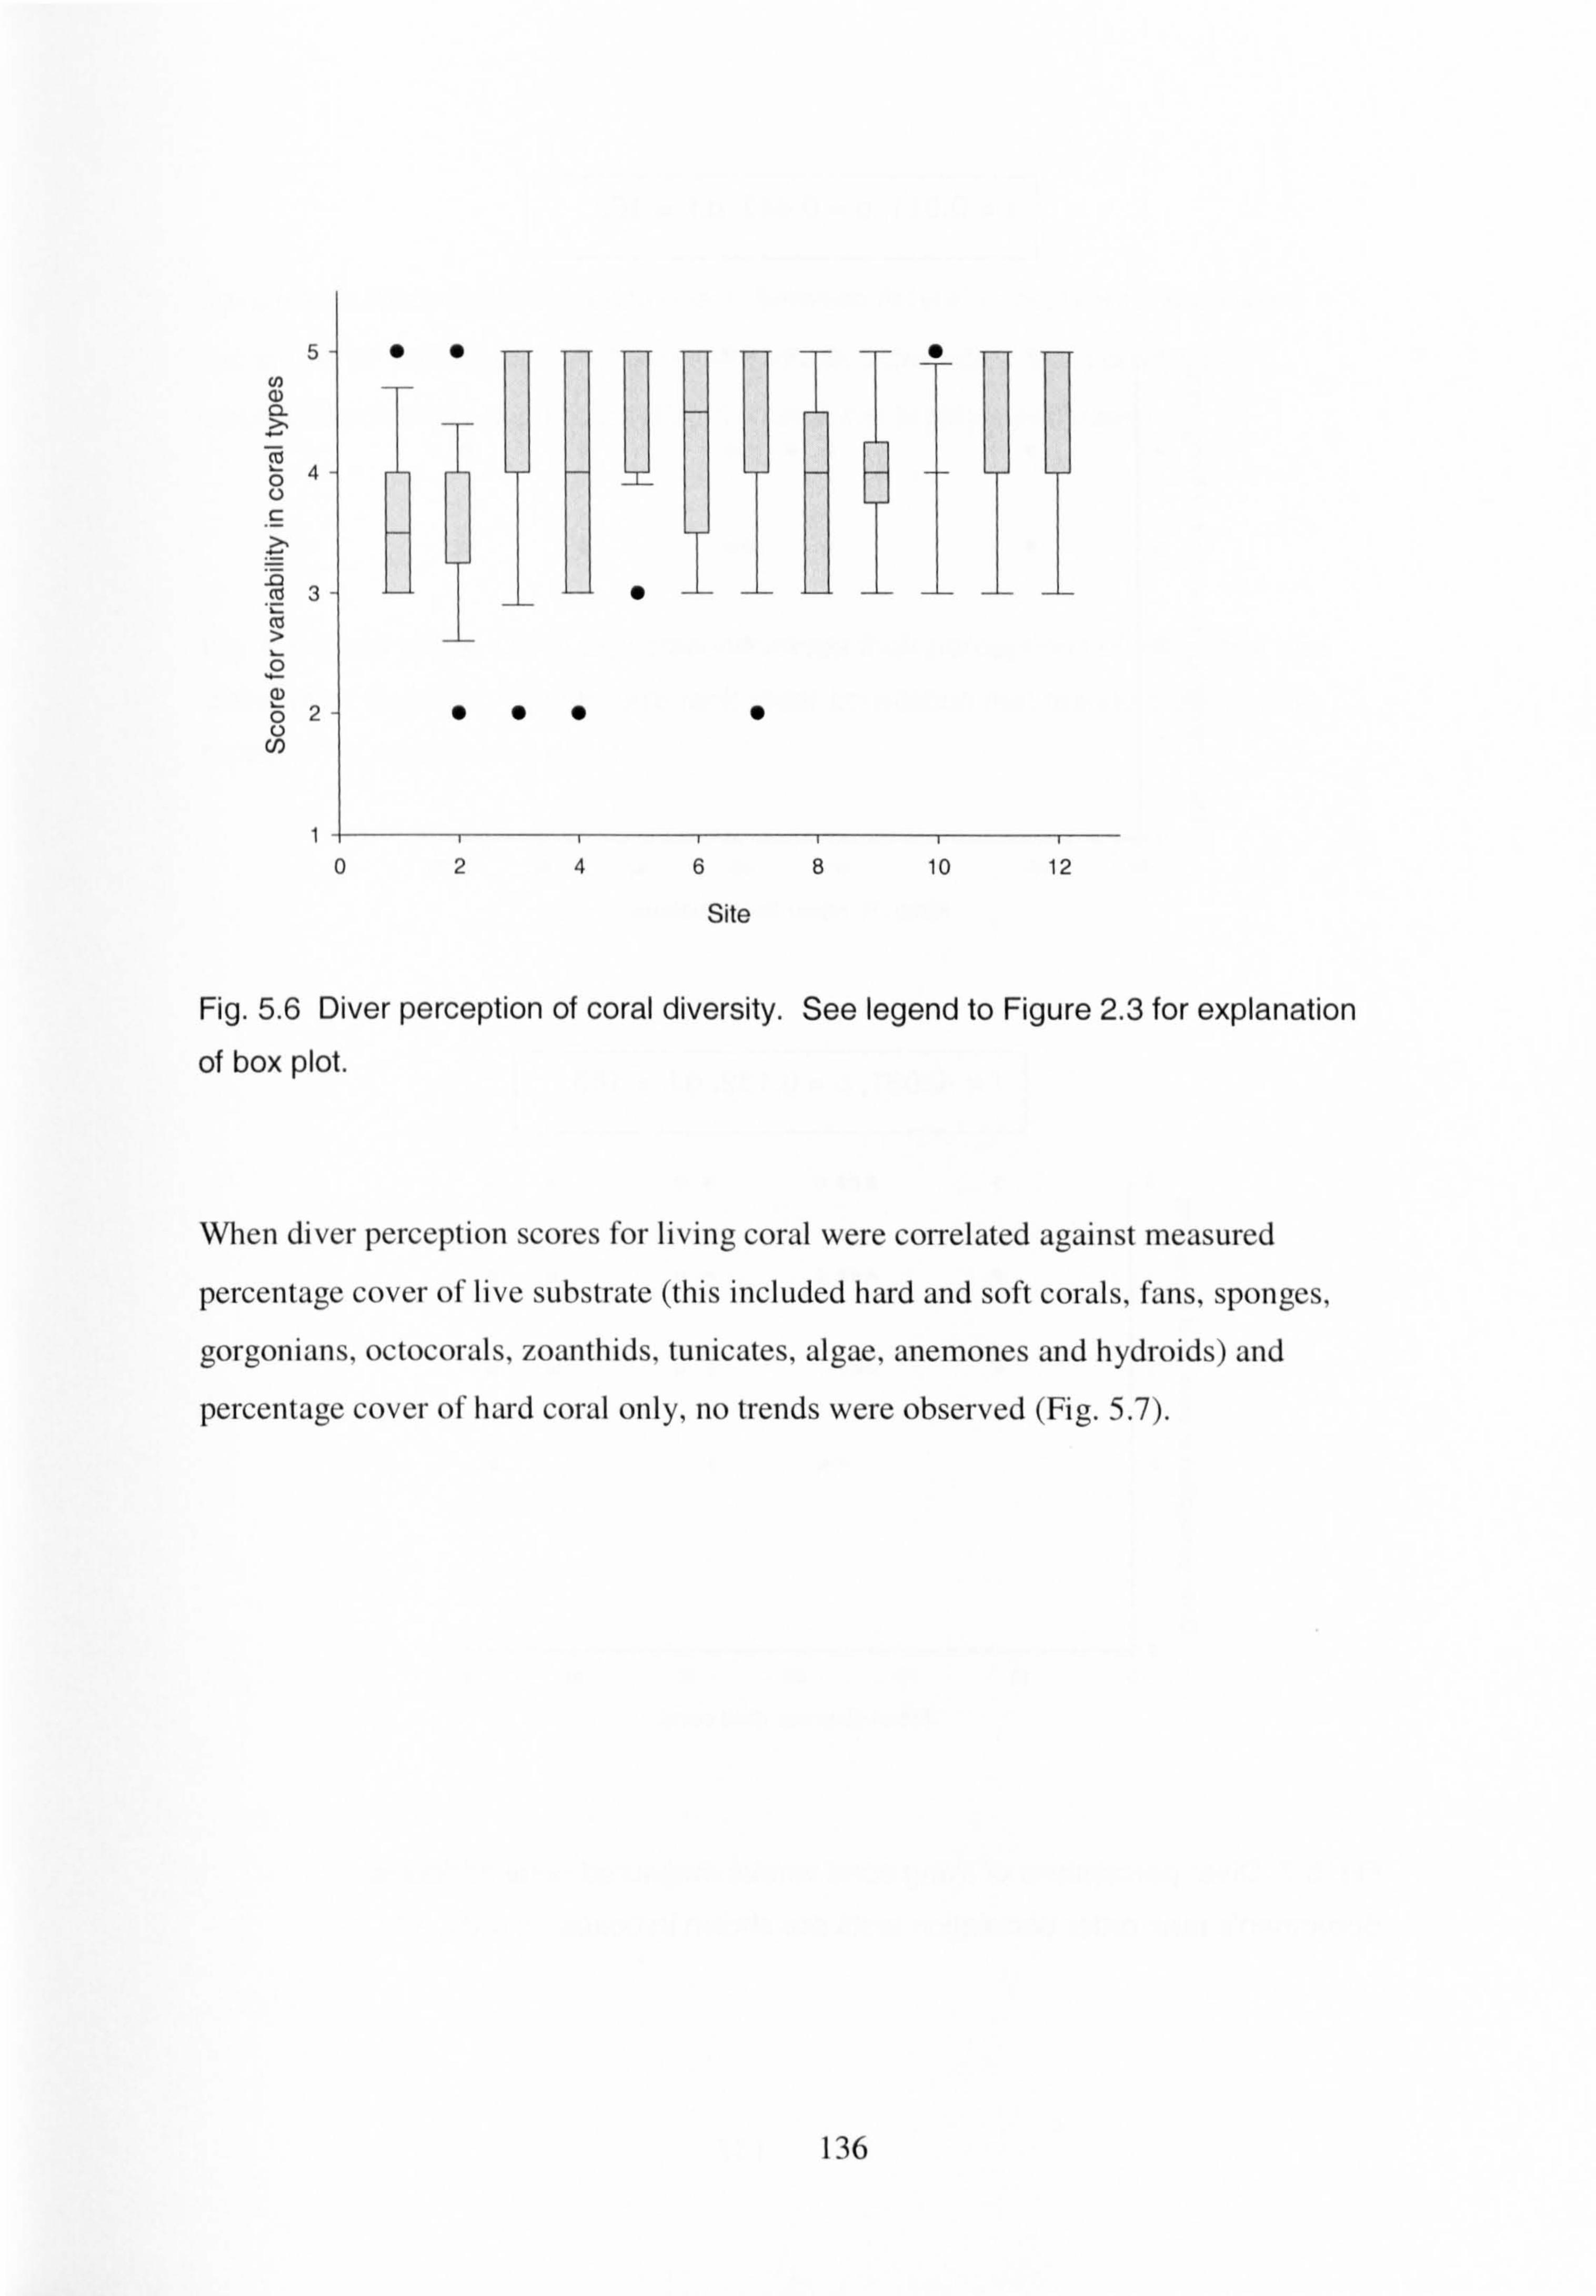
100 =7 T= T-T =T r-r --r- 0
6 10 12
Site
Fig. 5.6 Diver perception of coral diversity. See legend to Figure 2.3 for explanation
of box plot.
When diver perception scores for living coral were correlated against measured
percentage cover oflive substrate (this included hard and soft corals, fans, sponges,
gorgonians, octocorals, zoanthids, tunicates, algae, anemones and hydroids) and
percentage cover ofliard coral only, no trends were observed (Fig. 5.7).
136
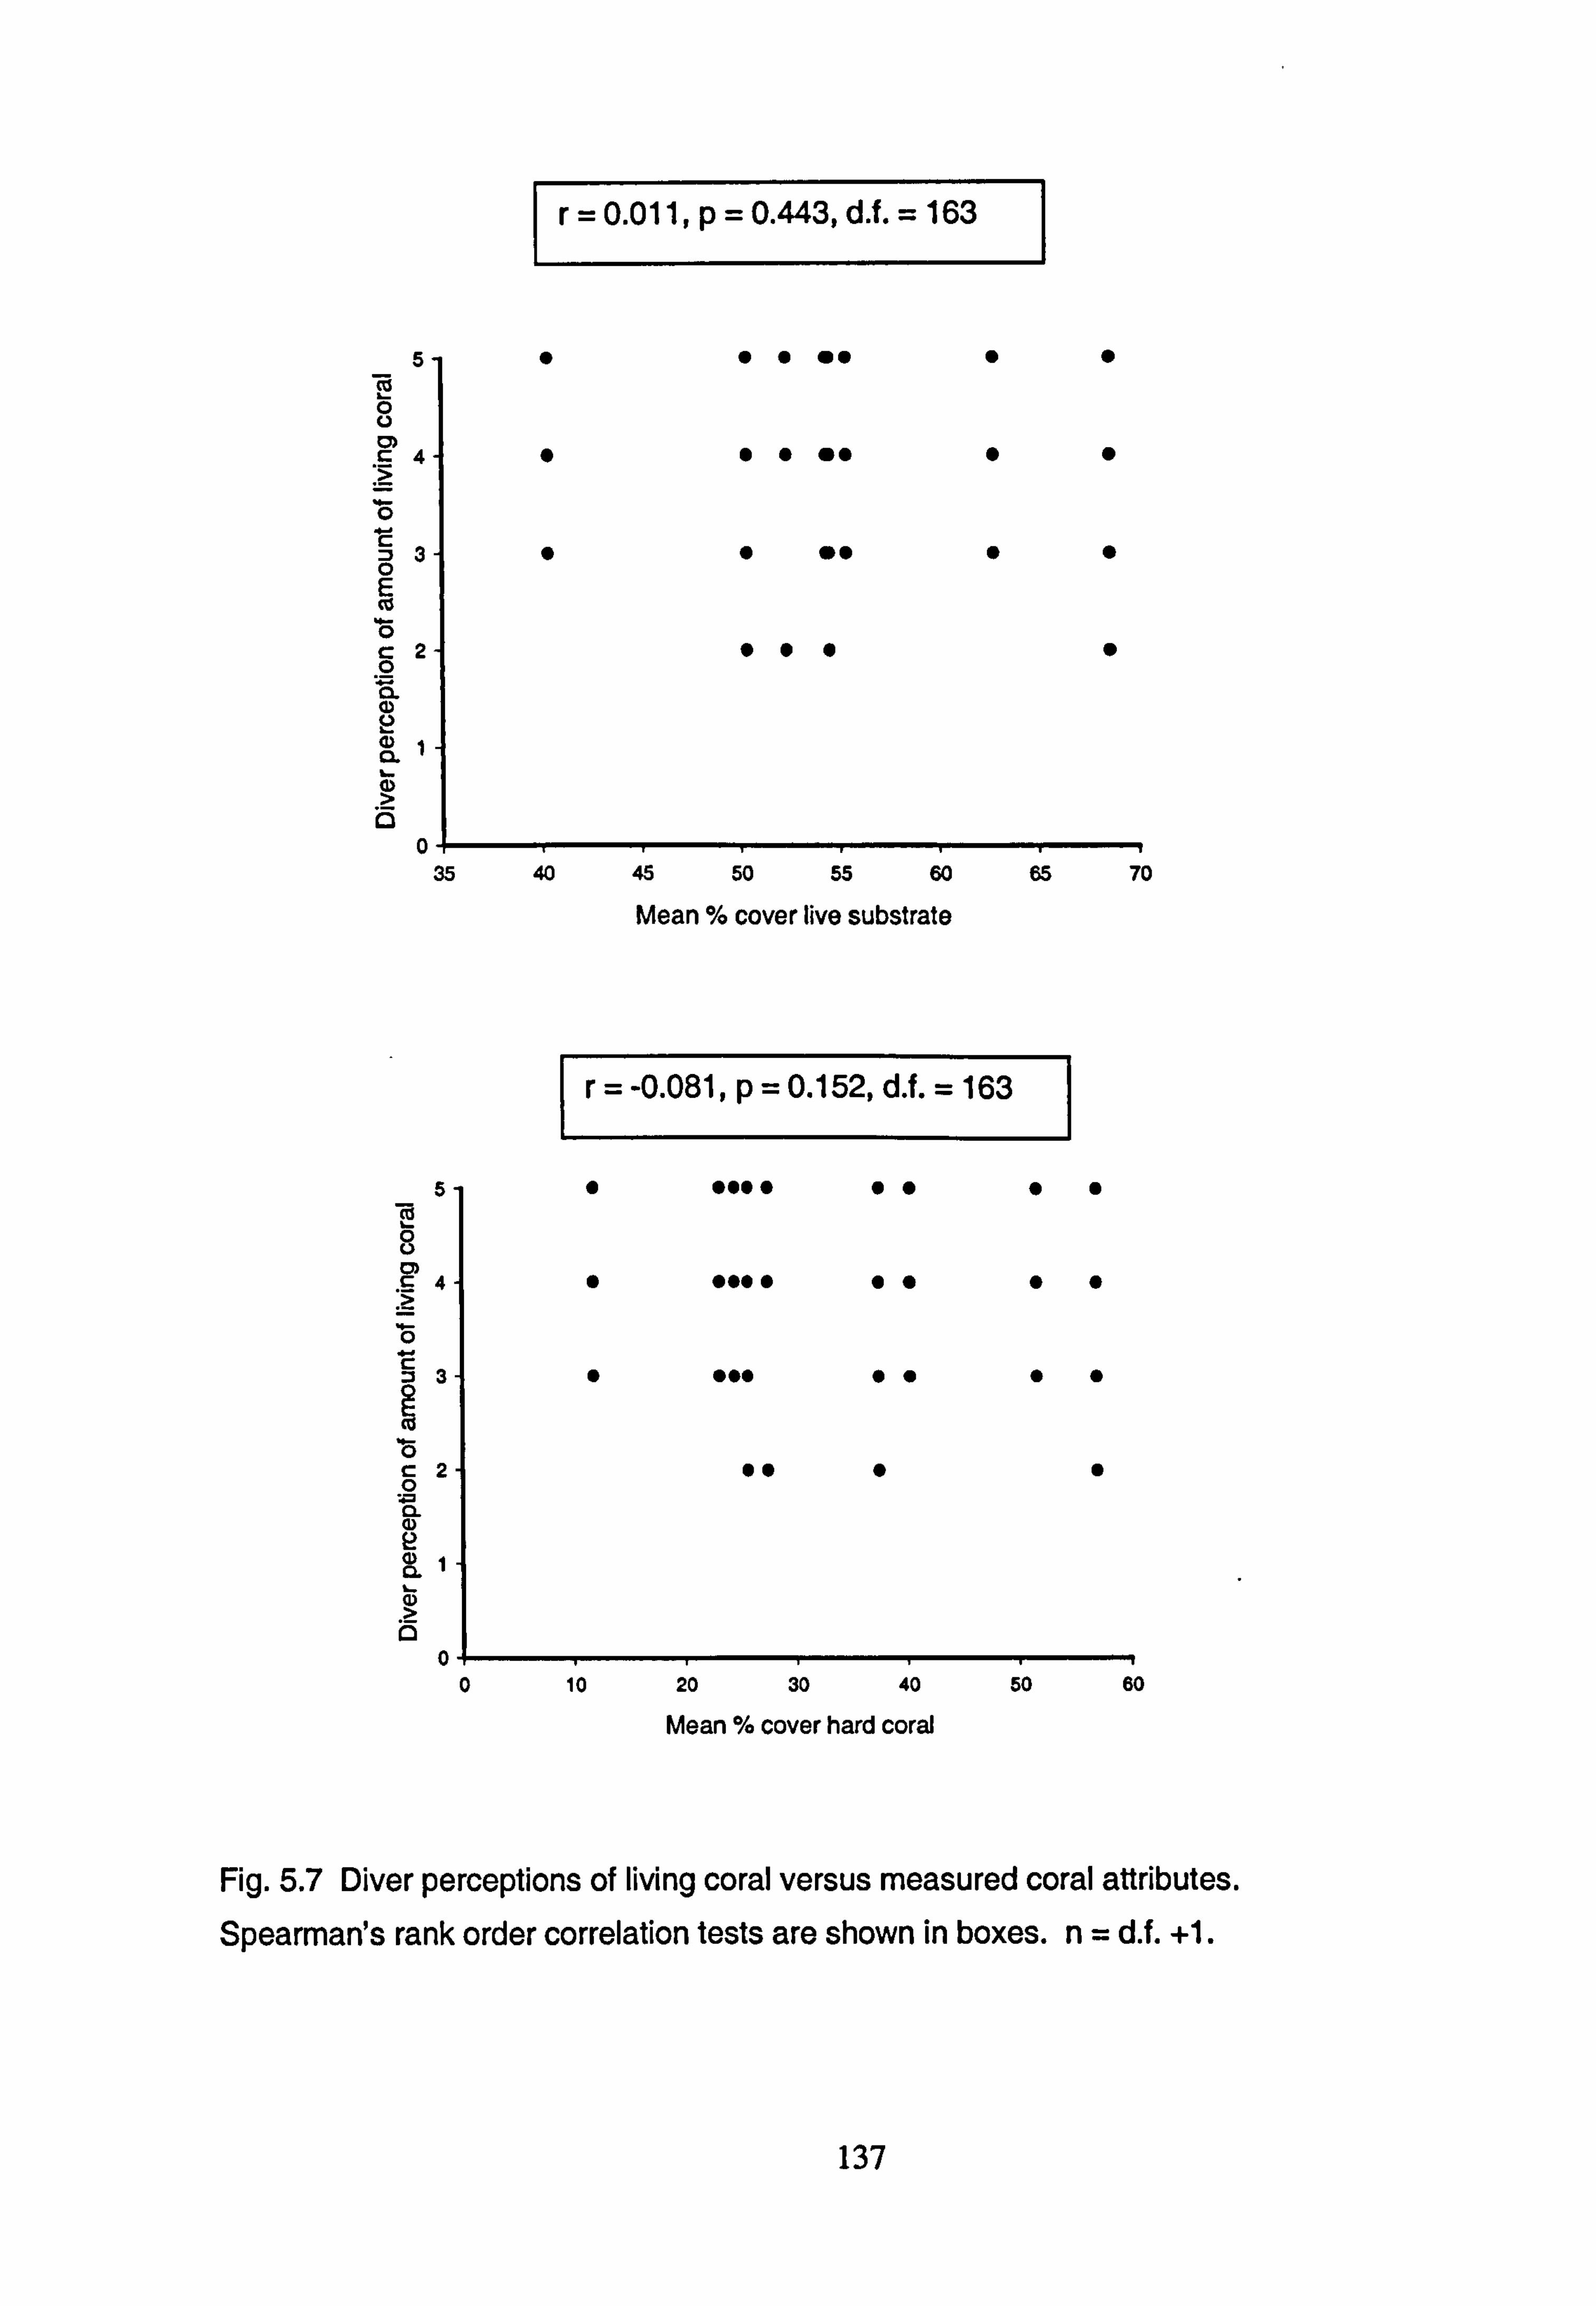
1 0.011, p=0.443, d. f. = 163 1
5 i5
0 C 0 E
0 c2 0 0.
(D CL
cl) >
0
1 -0.081, p=0.152, d. f. = 163 1
5
8 C)
>
0 C
z a 0 '. M CL
(D CL
a) >
01 0
Fig. 5.7 Diver perceptions of living coral versus measured coral attributes. Spearman's rank order correlation tests are shown in boxes. n=d. f. +1.
137
0! 35 40 45 50 55 60 65 70
Mean % cover live substrate
10 20 30 40 50 60 Mean % cover hard coral
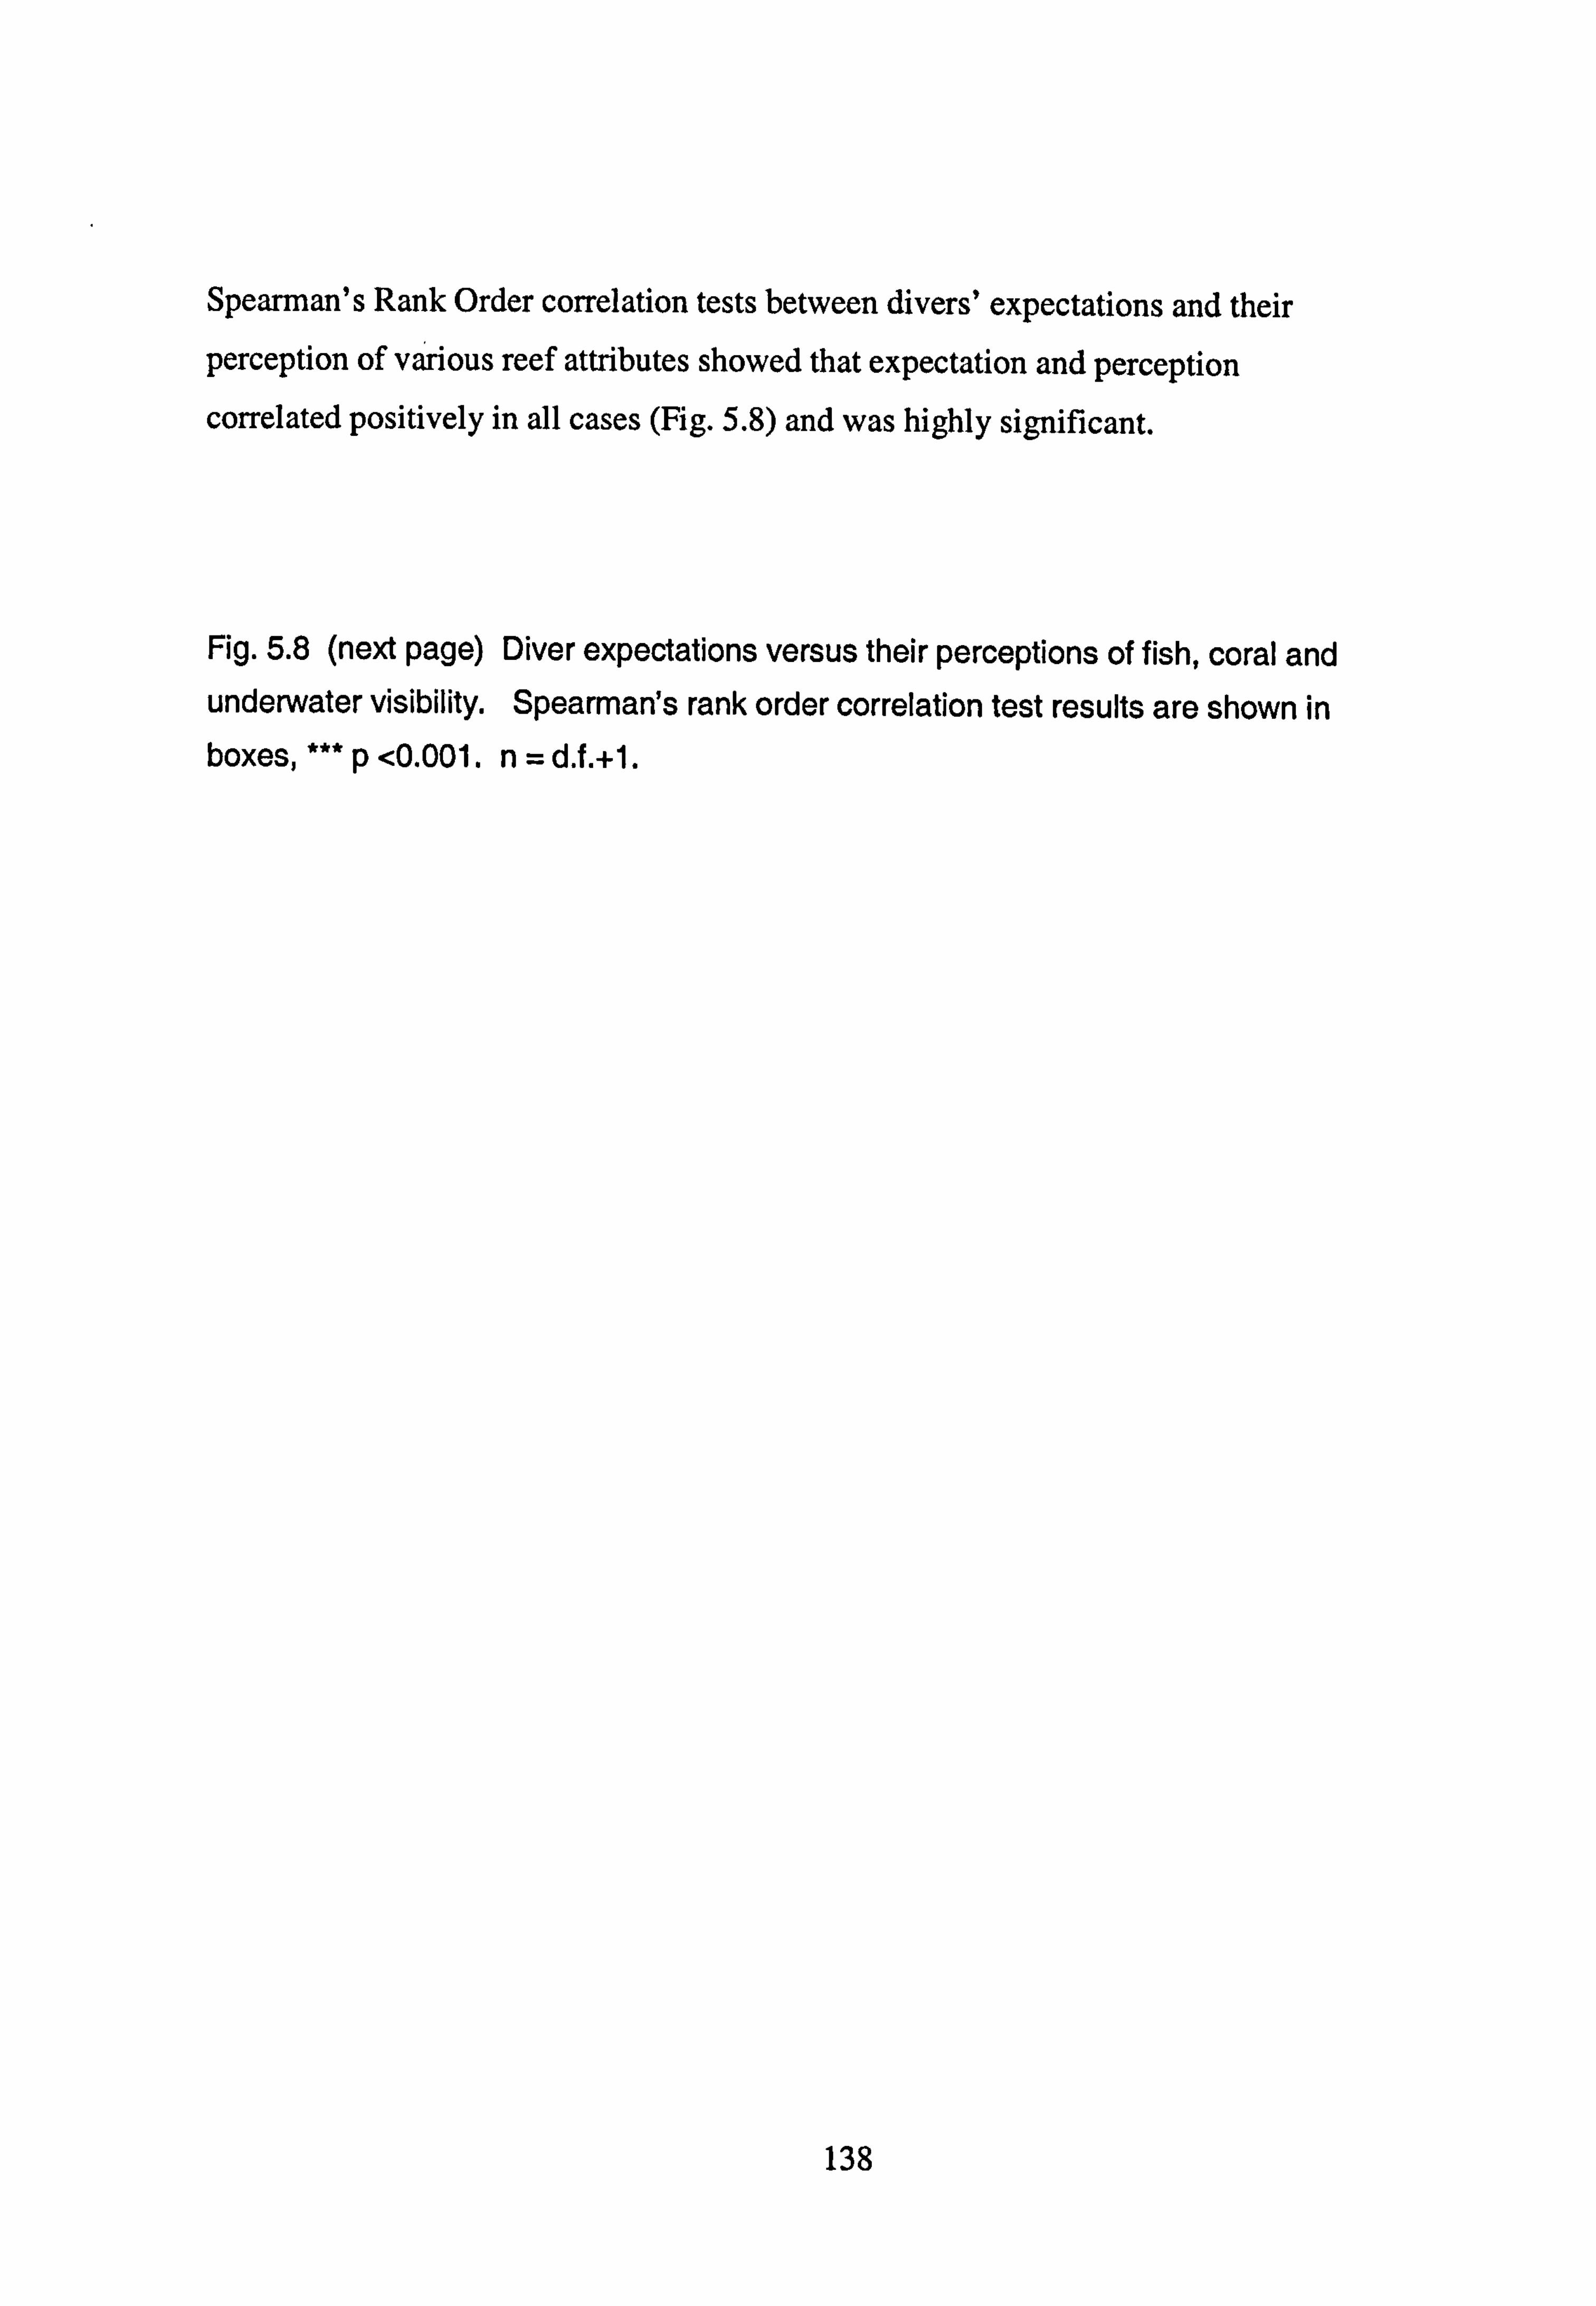
Spearman's Rank Order correlation tests between divers' expectations and their
perception of various reef attributes showed that expectation and perception correlated positively in all cases (Fig. 5.8) and was highly significant.
Fig. 5.8 (next page) Diver expectations versus their perceptions of fish, coral and underwater visibility. Spearman's rank order correlation test results are shown in boxes, *** p <0.001. n=d. f. +1.
138
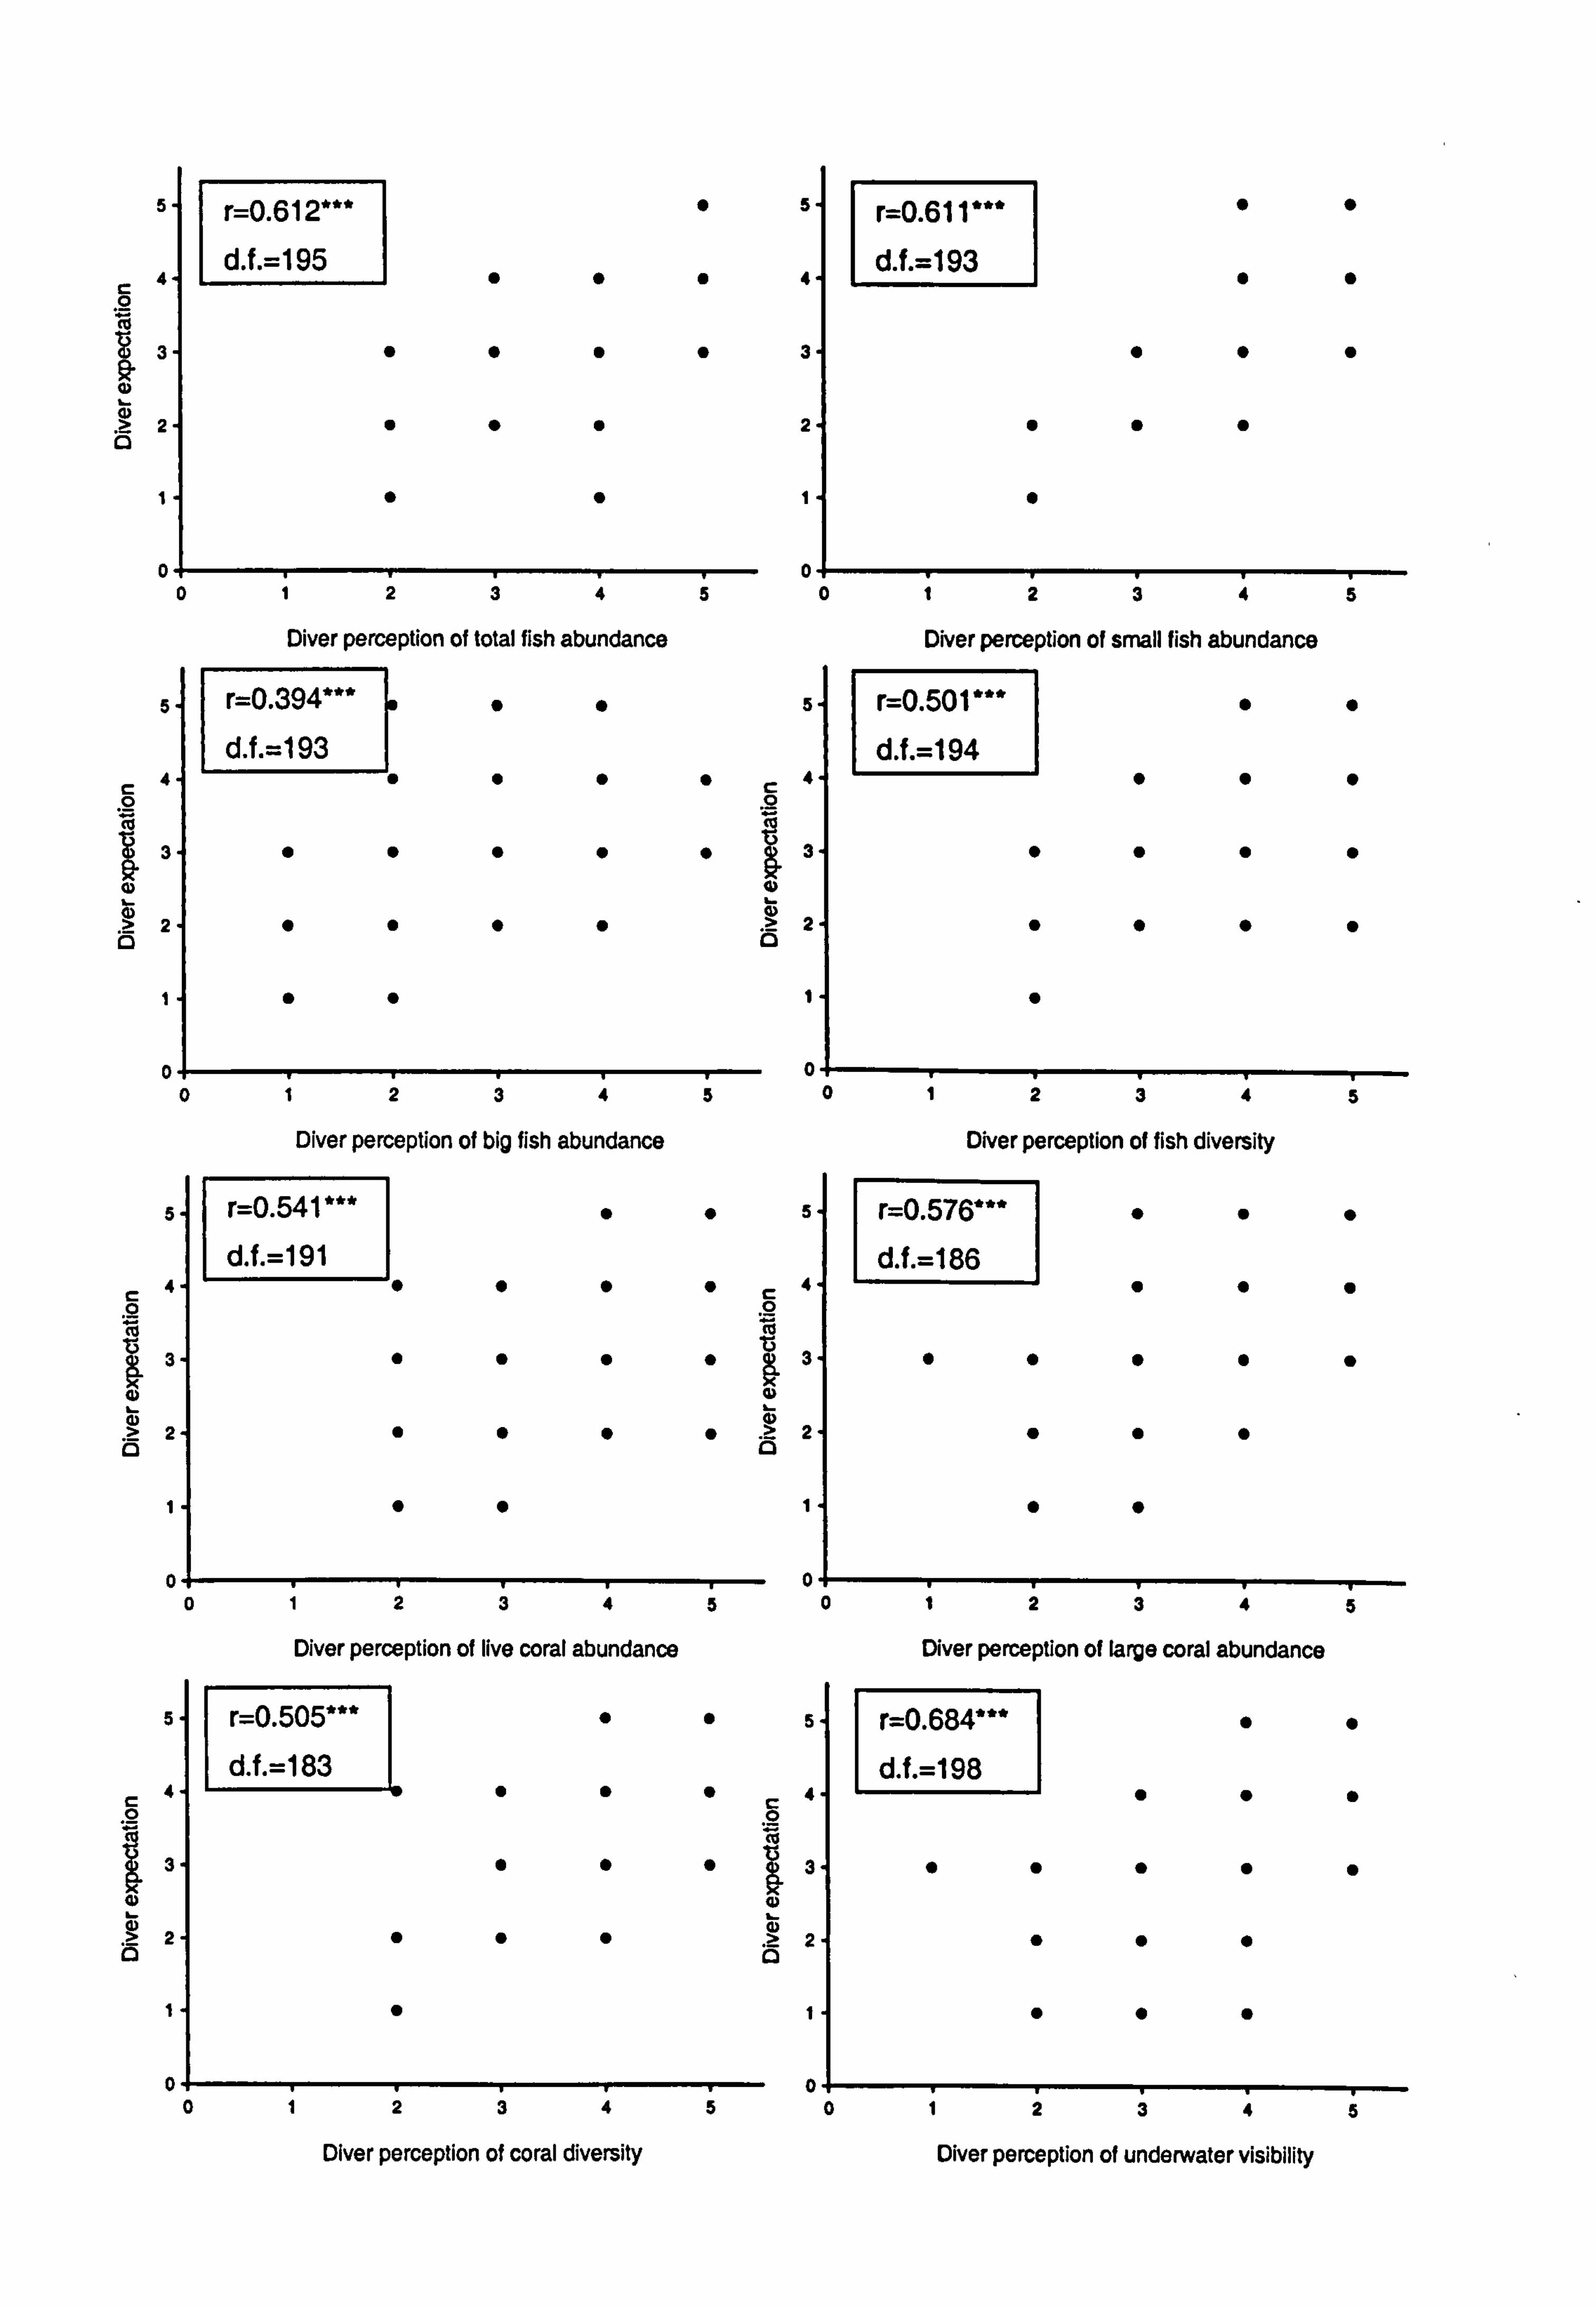
5- r=0.612*** 5- r=0.61 1 *** 0
4- d. f. =195 4- d. f. =193
33
2- 2-
0.0- 0240i
Diver perception of total fish abundance Diver perception of small fish abundance
5- r=0.394*** 5- r=0.501***
d. f. =1 93 d. f. =194 4- 4-
.2 .2
33
2- 2-
0 0. 0i301i
Diver perception of big fish abundance Diver perception of fish diversity
S. r=0.541 *** 005. r=0.576*** d. f. =191 d. f. =186
4- 4- .2
33
2- 2
0001
Diver perception of live coral abundance Diver perception of large coral abundance
S. r=0.505*** 5. r4.684*** d. f. =1 83 d. f. =198
C4C4 .2 .2 Ca
33
2- 2
01 01
0104 Diver perception of coral diversity Diver perception of underwater visibility
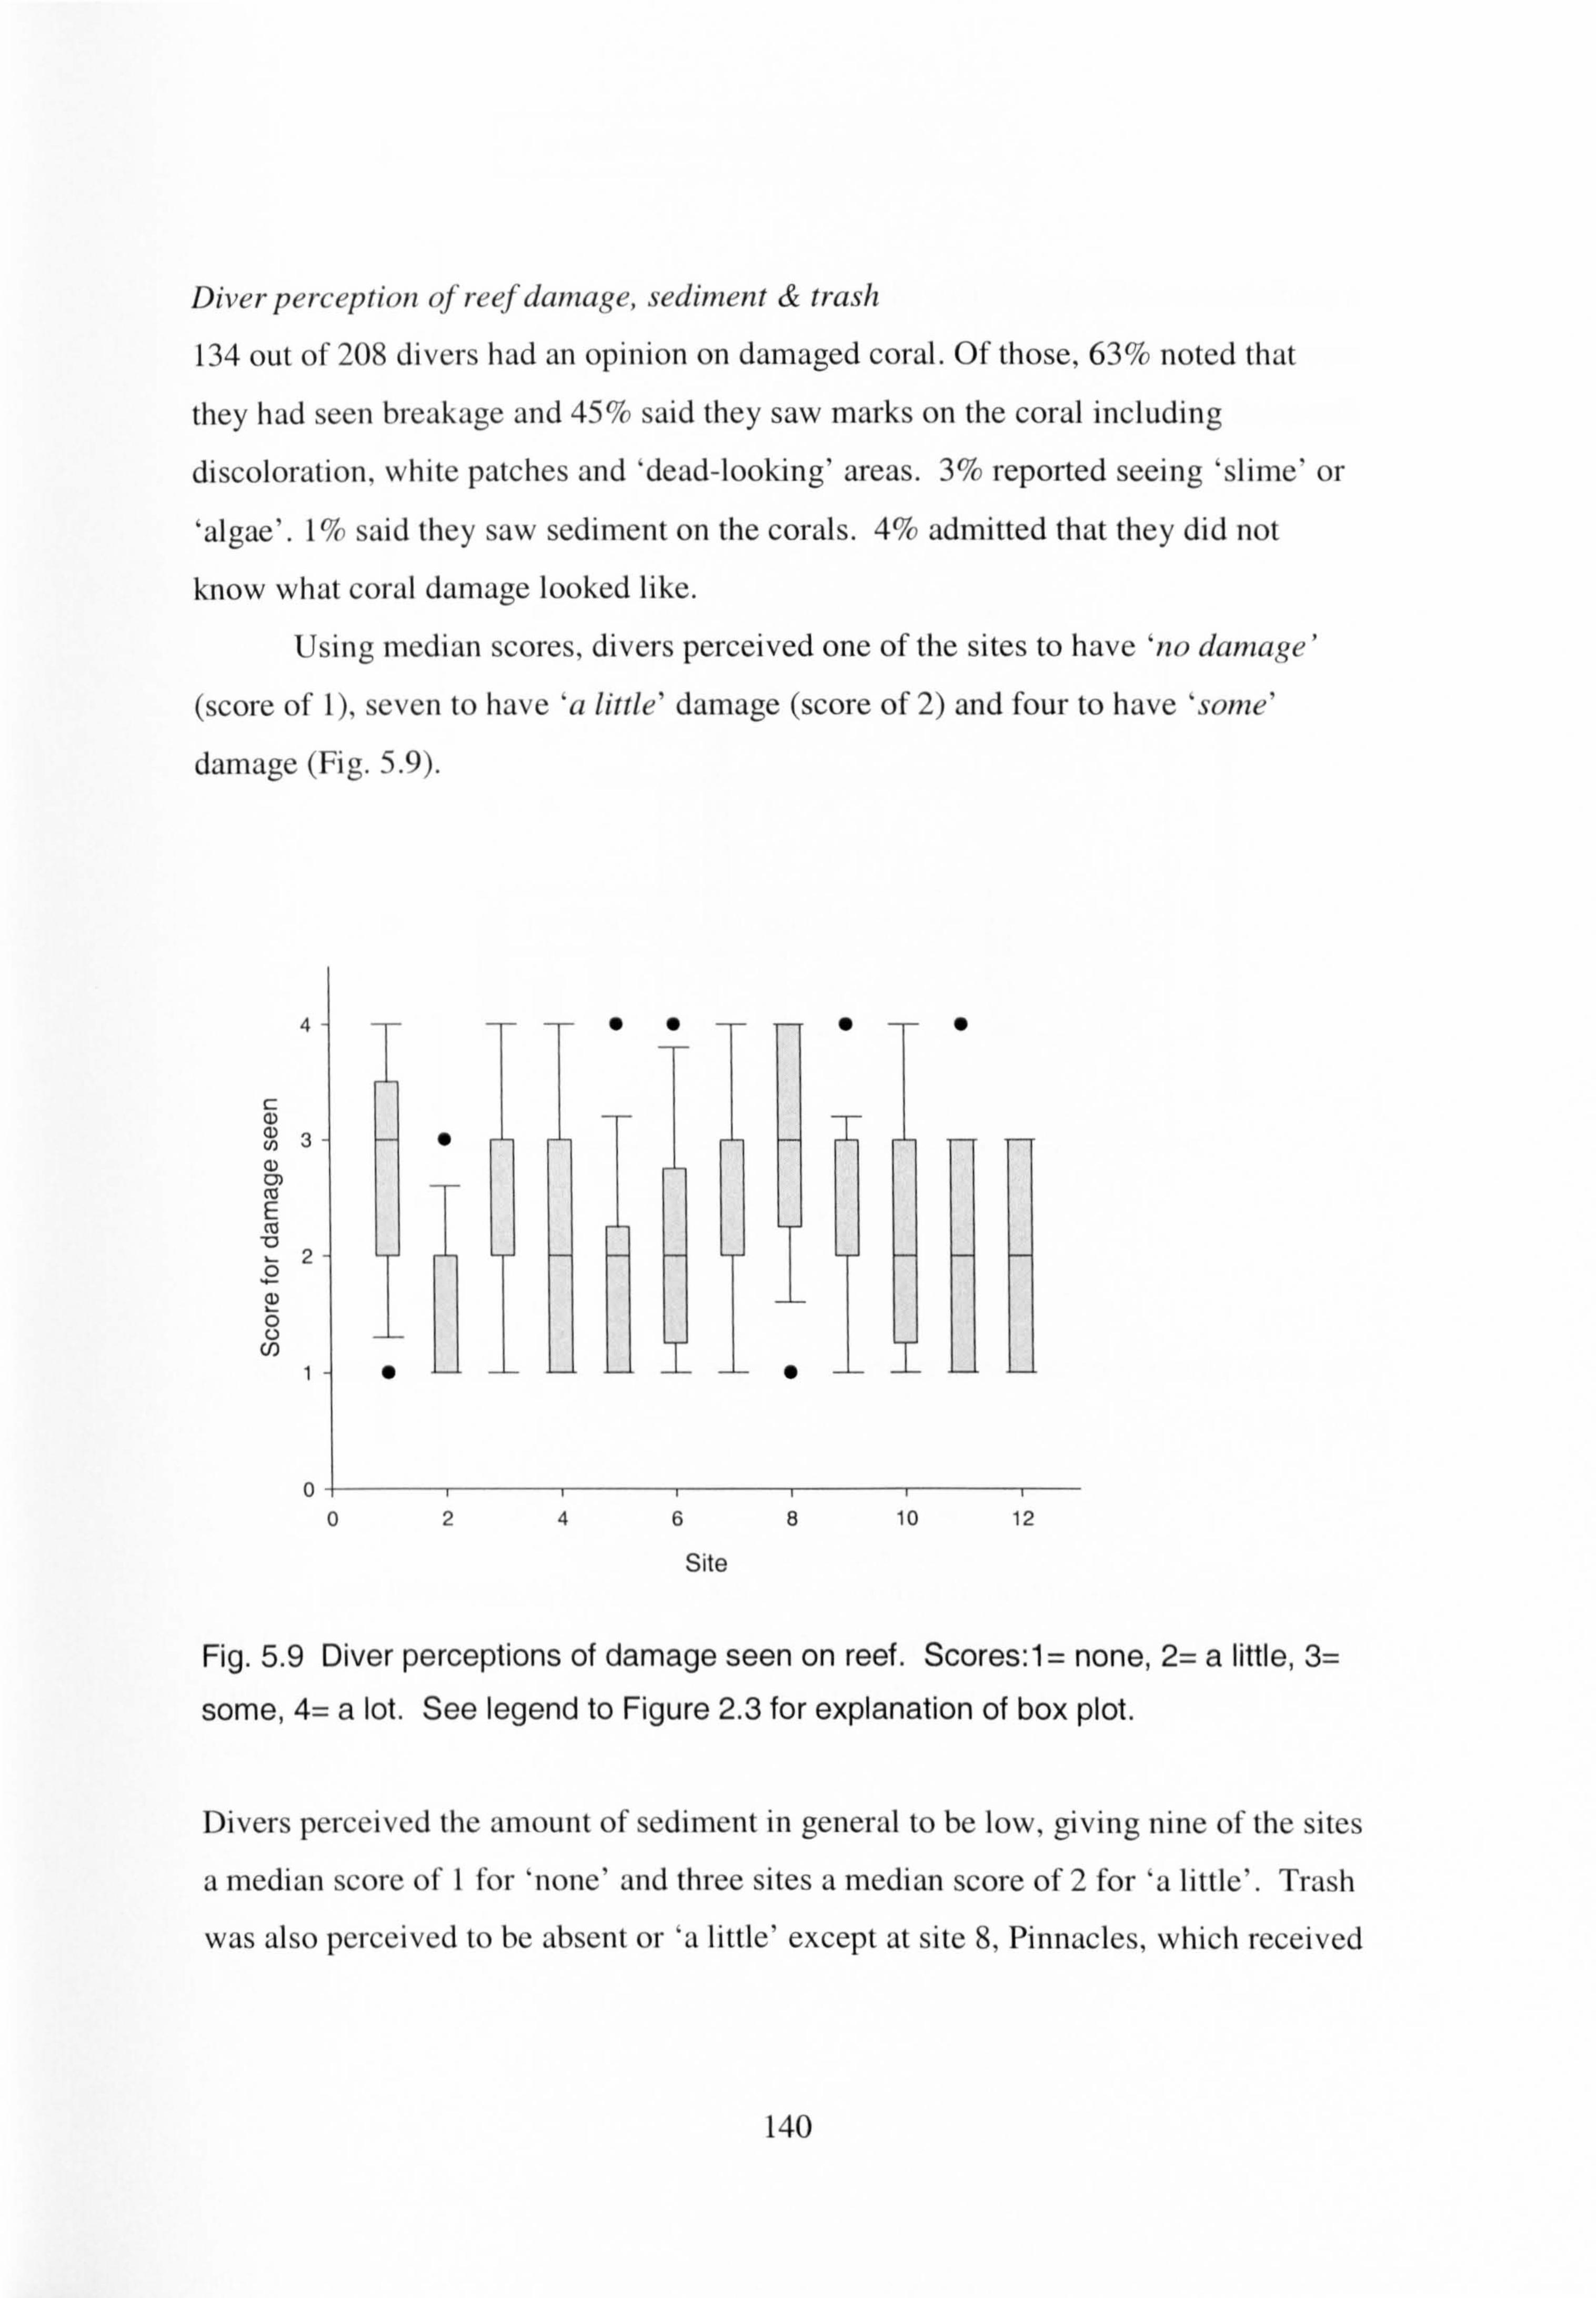
Diver perception qfreef daniage, sediment & trash
134 out of 208 divers had an opinion on damaged coral. Of those, 63% noted that
they had seen breakage and 45% said they saw marks on the coral including
discoloration, white patches and 'dead-looking' areas. 3% reported seeing 'slinle' or
'algae'. I(/(, said they saw sediment on the corals. 4% admitted that they did not
know what coral damage looked like.
Using median scores, divers perceived one of the sites to have 'no dainage'
(score of 1), seven to have 'a little' damage (score of 2) and four to have 'solne'
damage (Fig. 5.9).
TT*ýTF* U)
co I cu
0
iII 02468 10 12
Site
Fig. 5.9 Diver perceptions of damage seen on reef. Scores: 1= none, 2= a little, 3=
some, 4= a lot. See legend to Figure 2.3 for explanation of box plot.
Divers perceived the amount of sediment in general to be low, giving nine of the sites
a median score of I for 'none' and three sites a median score of 2 for 'a little'. Trash
was also perceived to be absent or 'a little' except at site 8, Pinnacles, which received
140
a median score of 3 (Fig. 5.10). After interviewing divers, it became apparent that
some were mistaking the common spaghetti worm Eupol-vinnia crassicornis for
discarded fishing line.
ýr
C : o
CL
68 10 12
Site
Fig. 5.10 Divers' perception of trash. See legend to Figure 2.3 for explanation of box plot.
Although divers' perception of sediment was not correlated to measured data
(Fig. 5.11, a), their perception of trash was (Fig. 5.11, b).
141
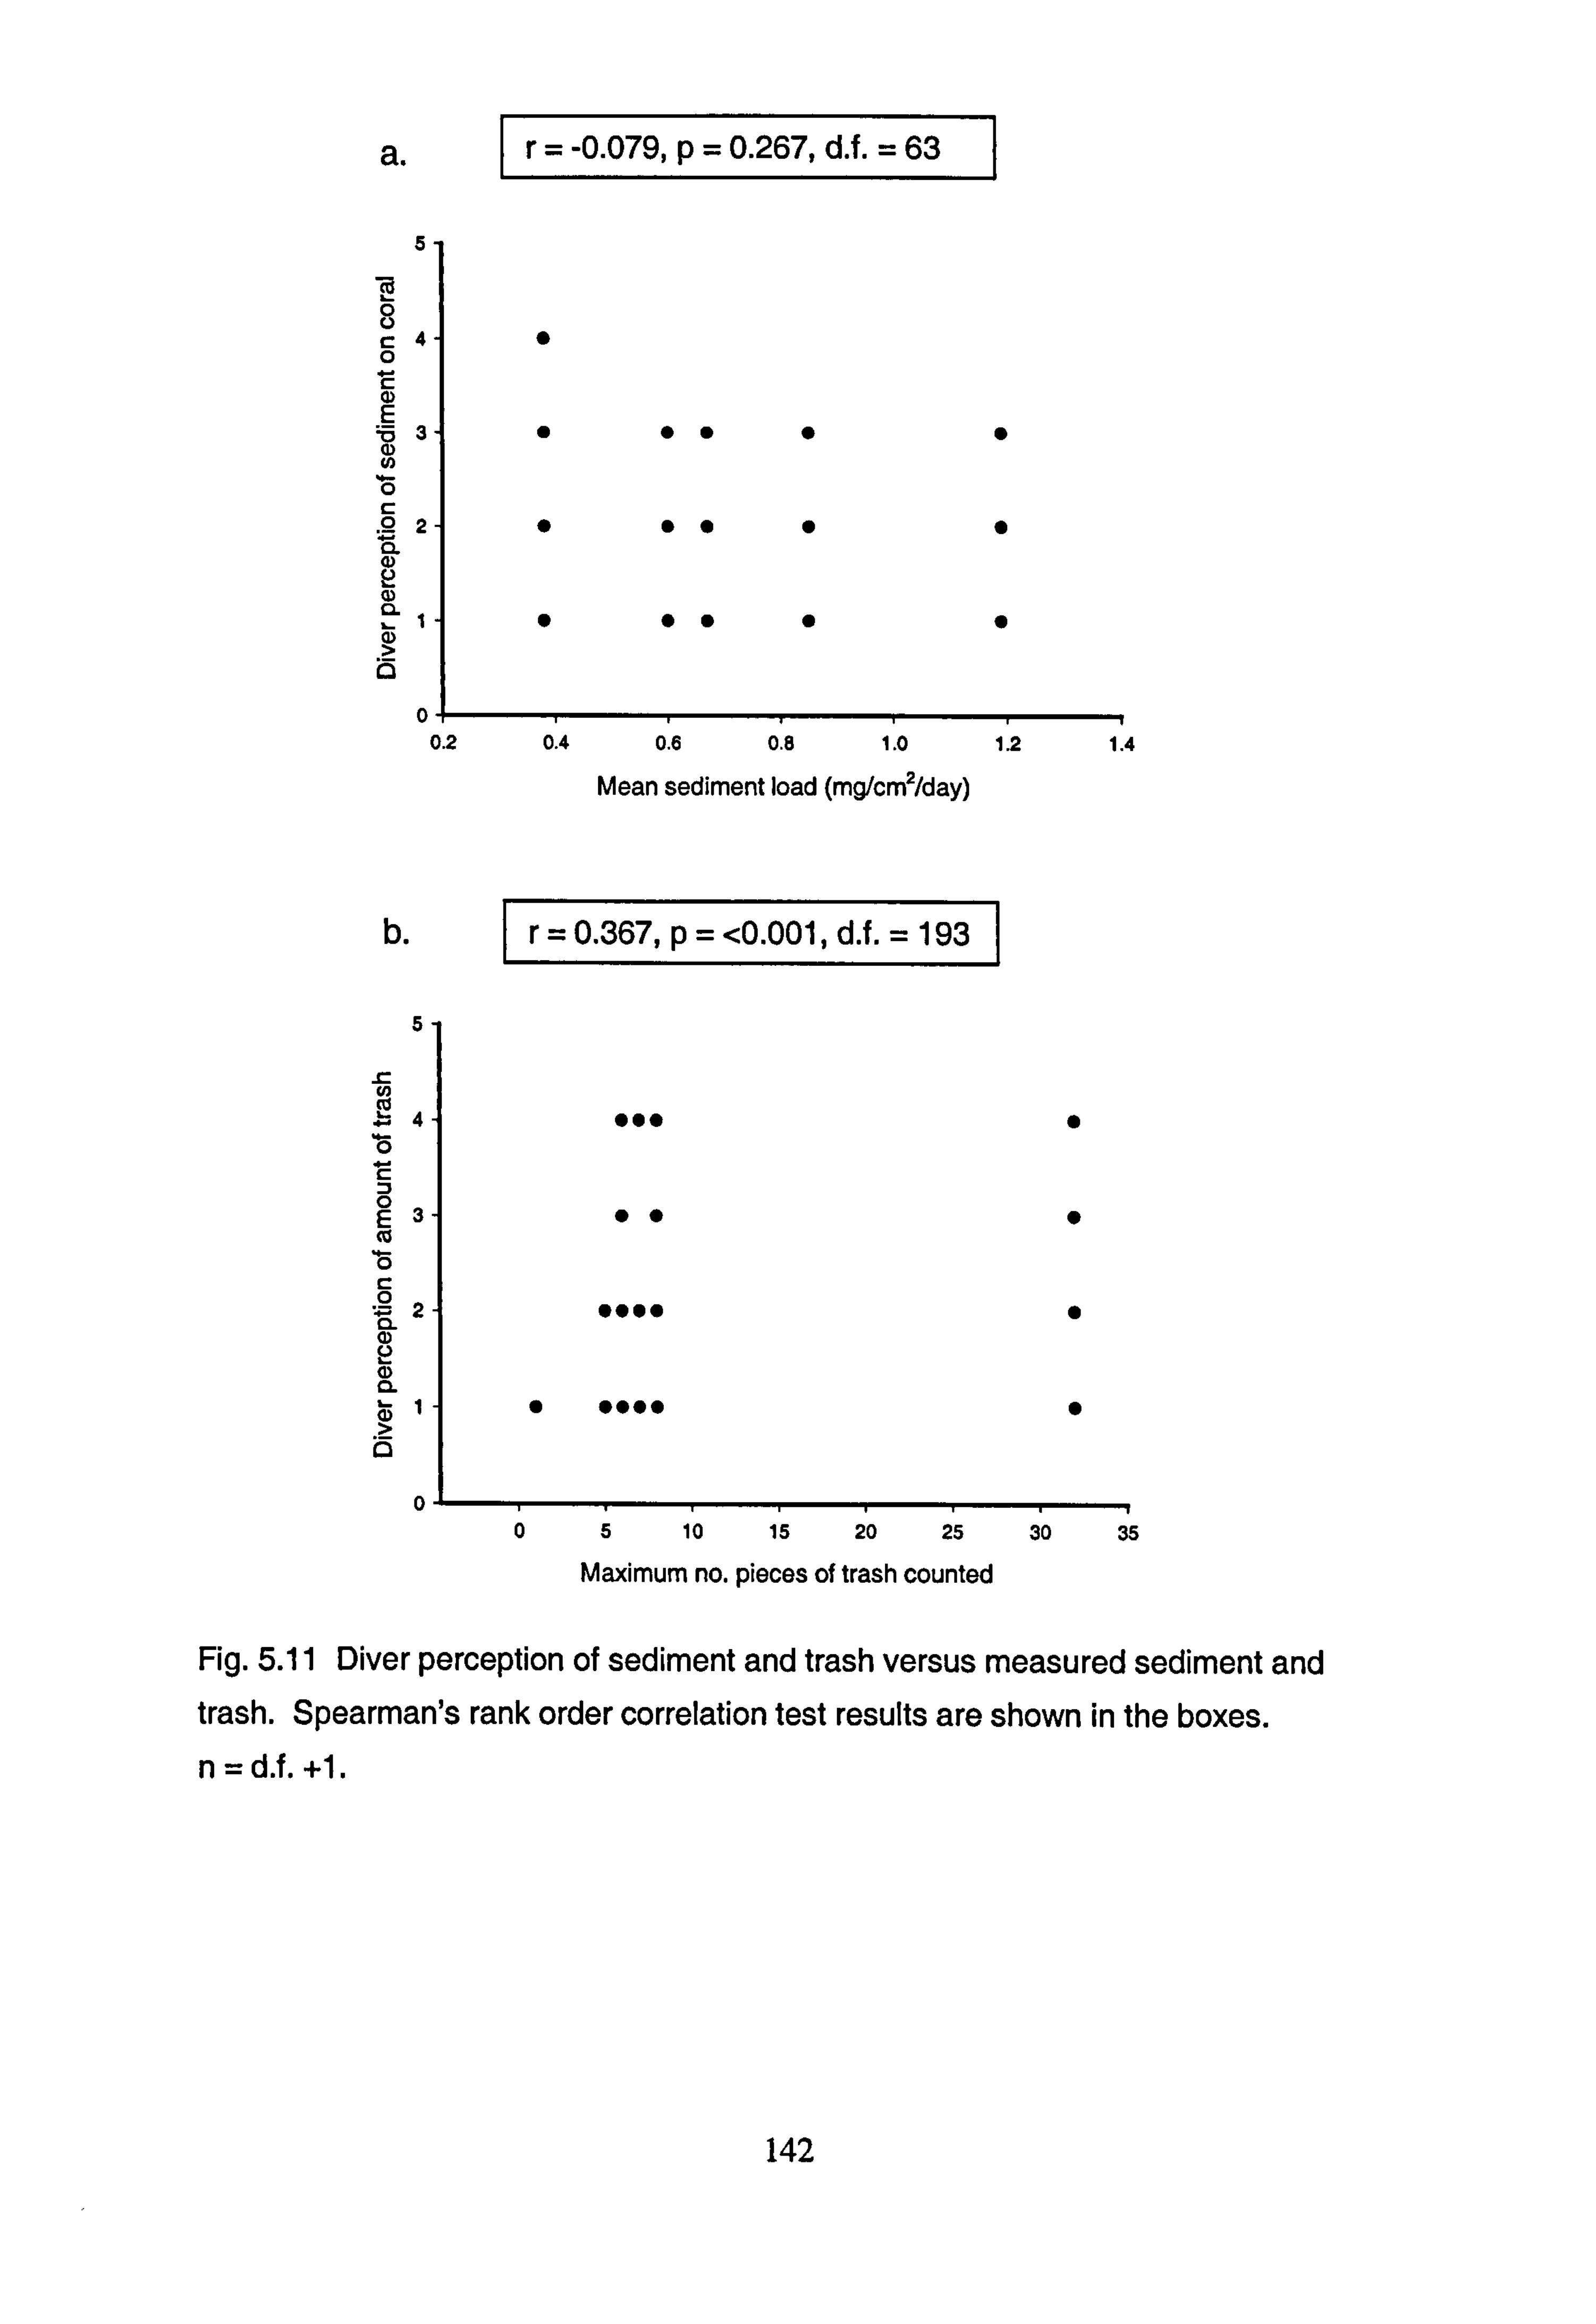
-0.079, p=0.267, d. f. = ! 6,: 3:: ]
5 la
02
a
0.367, p= <0.001, d. f. = 1937]
5
m u)
0 E3 (0
0 "; = CL (D Q 0
a 0
Fig. 5.11 Diver perception of sediment and trash versus measured sediment and trash. Spearman's rank order correlation test results are shown in the boxes.
n=d. f. +1.
142
0! 0.2 0.4 0.6 0.8 1.0 1.2 1.4
Mean sediment load (mg/cm2/day)
05 10 15 20 25 30 35 Maximum no. pieces of trash counted
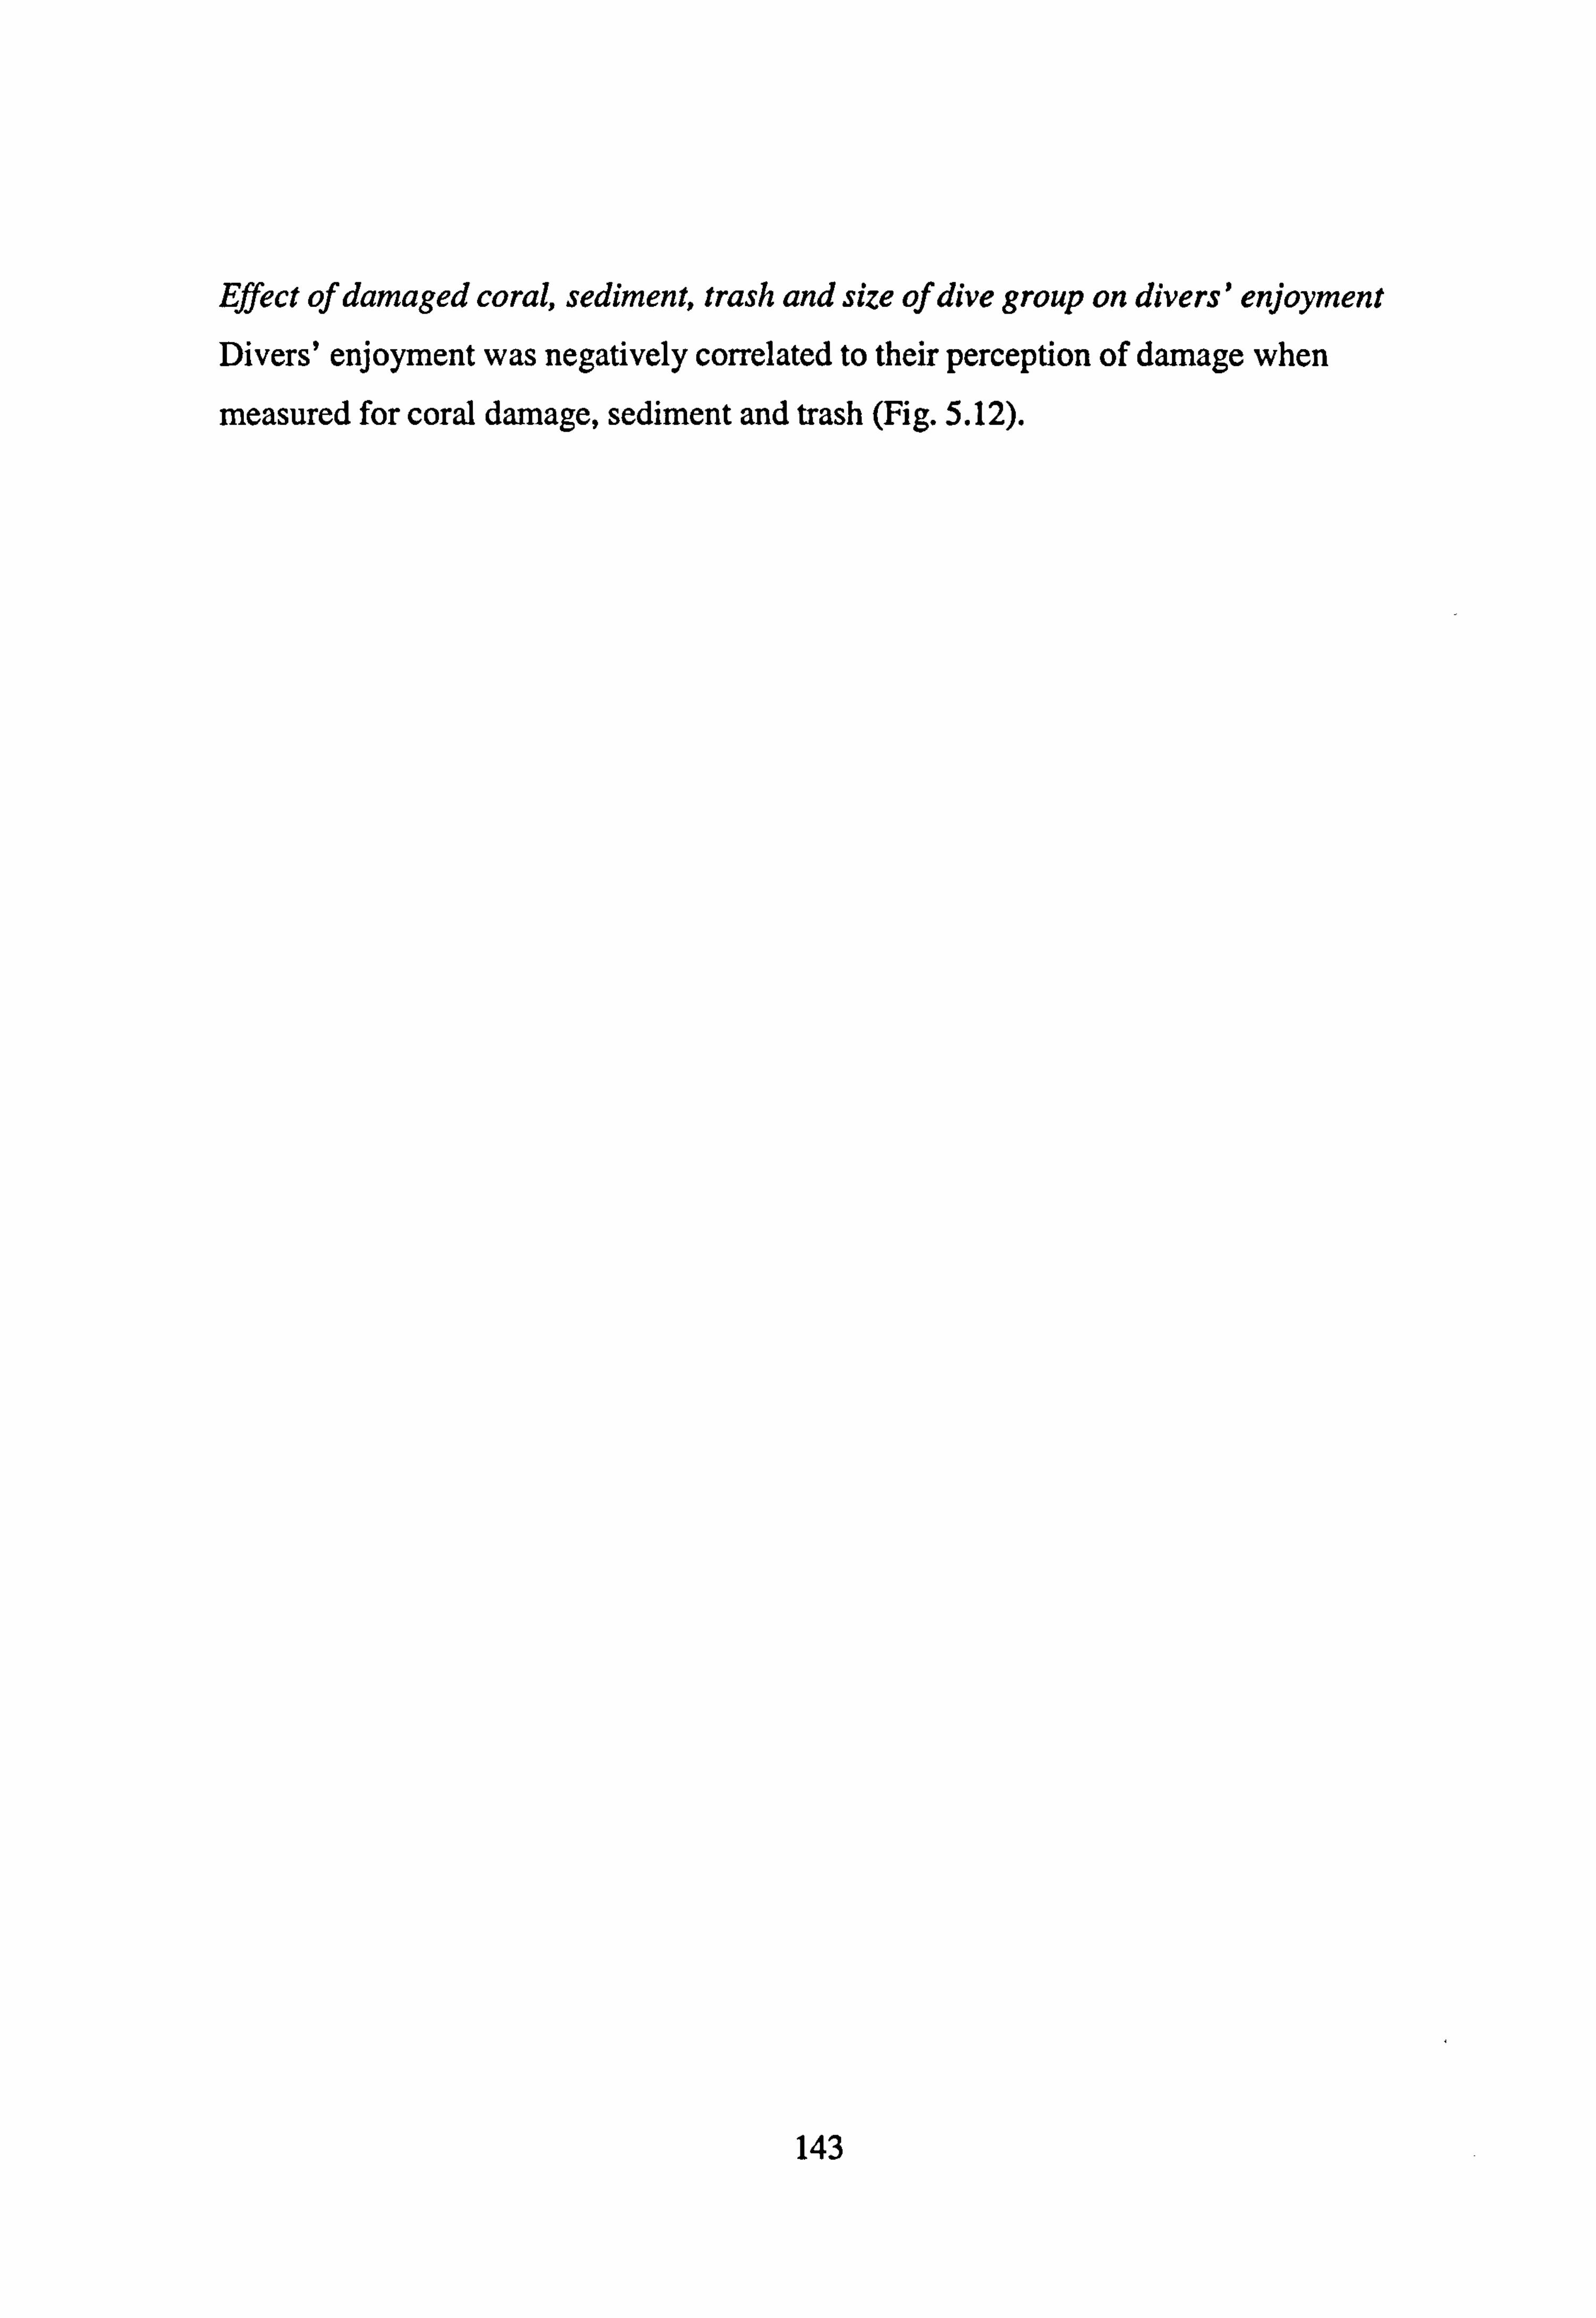
Effect of damaged coral, sediment, trash and size of dive group on divers' enjoyment Divers' enjoyment was negatively correlated to their perception of damage when
measured for coral damage, sediment and trash (Fig. 5.12).
143
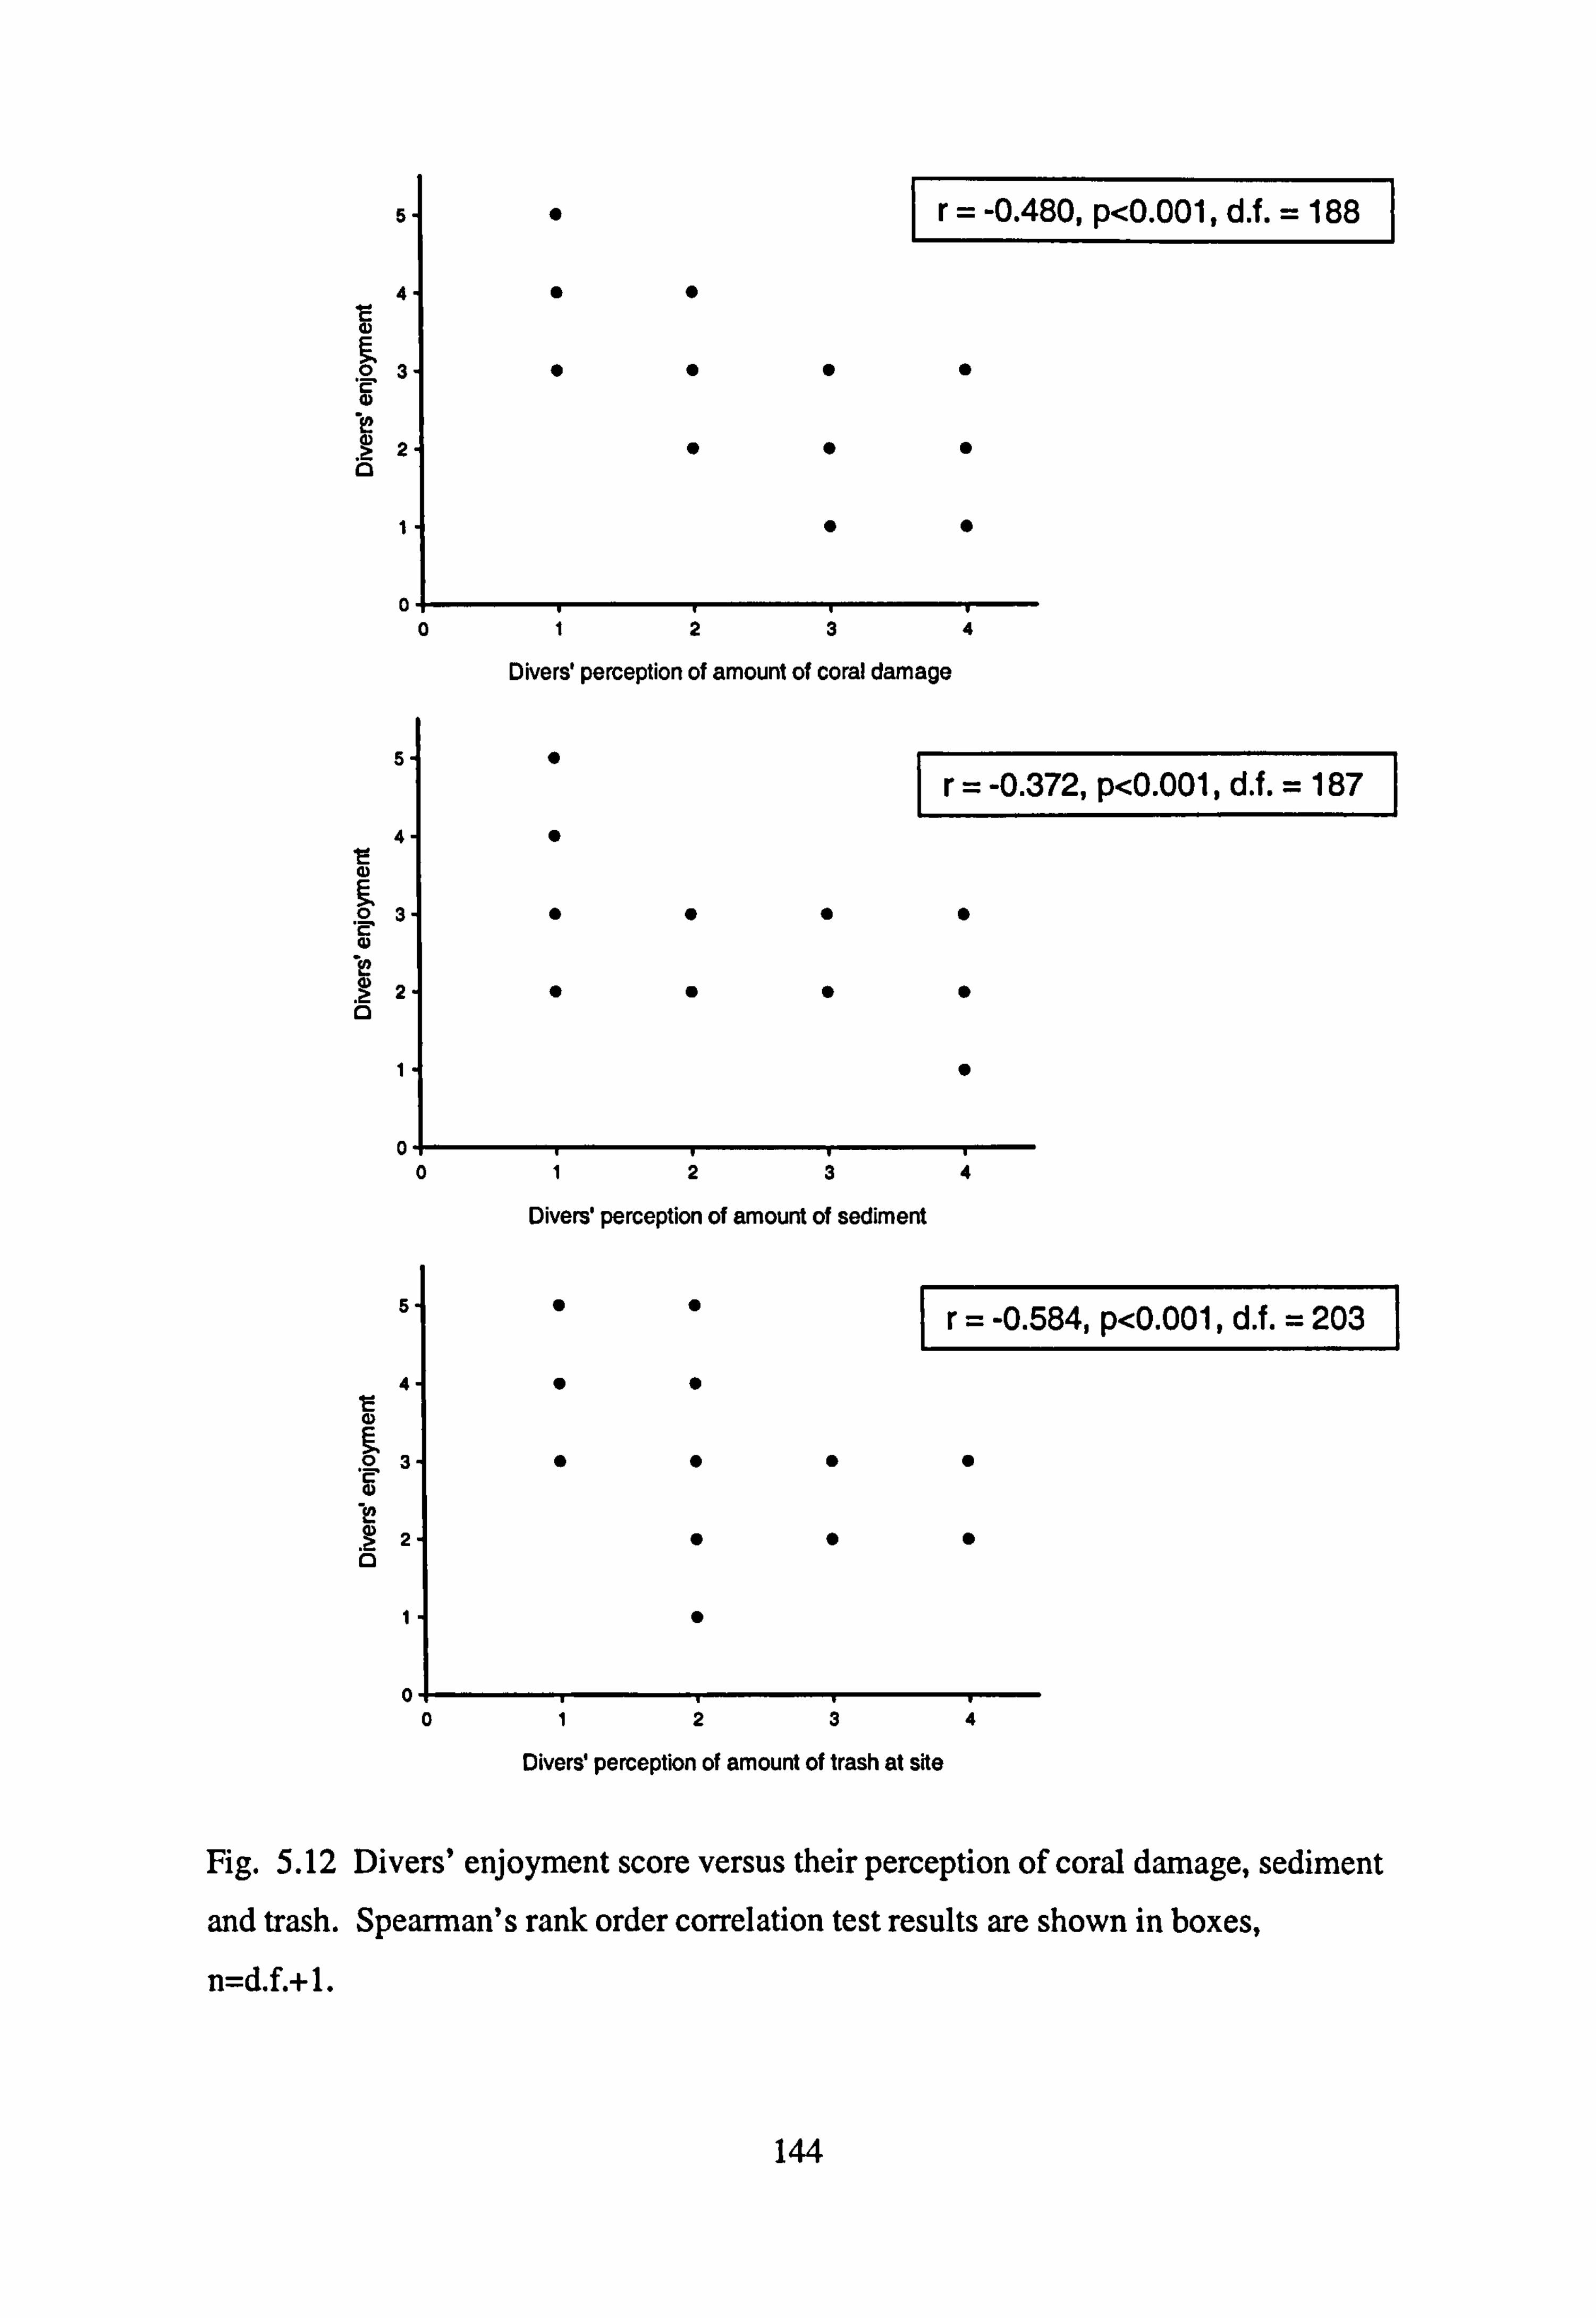
5
4
2
I
5
0 .F CD
1
5
4
2
I
1 -0.480, p<0.001, d.
-0.372, p<0.001, d. f. = 187
-0.584, p<0.001, d. f. = 203
Fig. 5.12 Divers' enjoyment score versus their perception of coral damage, sediment
and trash. Spearman's rank order correlation test results are shown in boxes,
n=d. L+ 1.
144
0 0134
Divers' perception of amount of coral damage
1
Divers' perception of amount of sediment
0! I 014 Divers! perception of amount of trash at site
Divers' enjoyment was significantly negatively correlated with dive group size (Fig.
5.13, Spearman's rank correlation test, r= -0.555, p<0.001, d. f. = 207). For some
divers however, groups of 6 still decreased their enjoyment a little and yet for others,
a group of more than 15 divers made no difference to their enjoyment.
-0.555, p<0.001, d. f. = 207
5S LIIIII1-H S
45 H-IJjH SSS
C cl) E >3 55 0 LIIIIILI-H SSS
cl)
(D
11 4ý 0iI
05 10 15 20
Number of divers in group
Fig. 5.13 Divers' enjoyment versus dive group size. See legend to Figure 2.3 for
explanation of box plot.
Underwater visibility Divers' scores for underwater visibility generally fell into the 'average' and 'good'
categories with only sites 2, Lesleen M, the only wreck dive and 3, Turtle reef,
receiving a substantial number of 'poor' scores (Fig. 5.14).
145
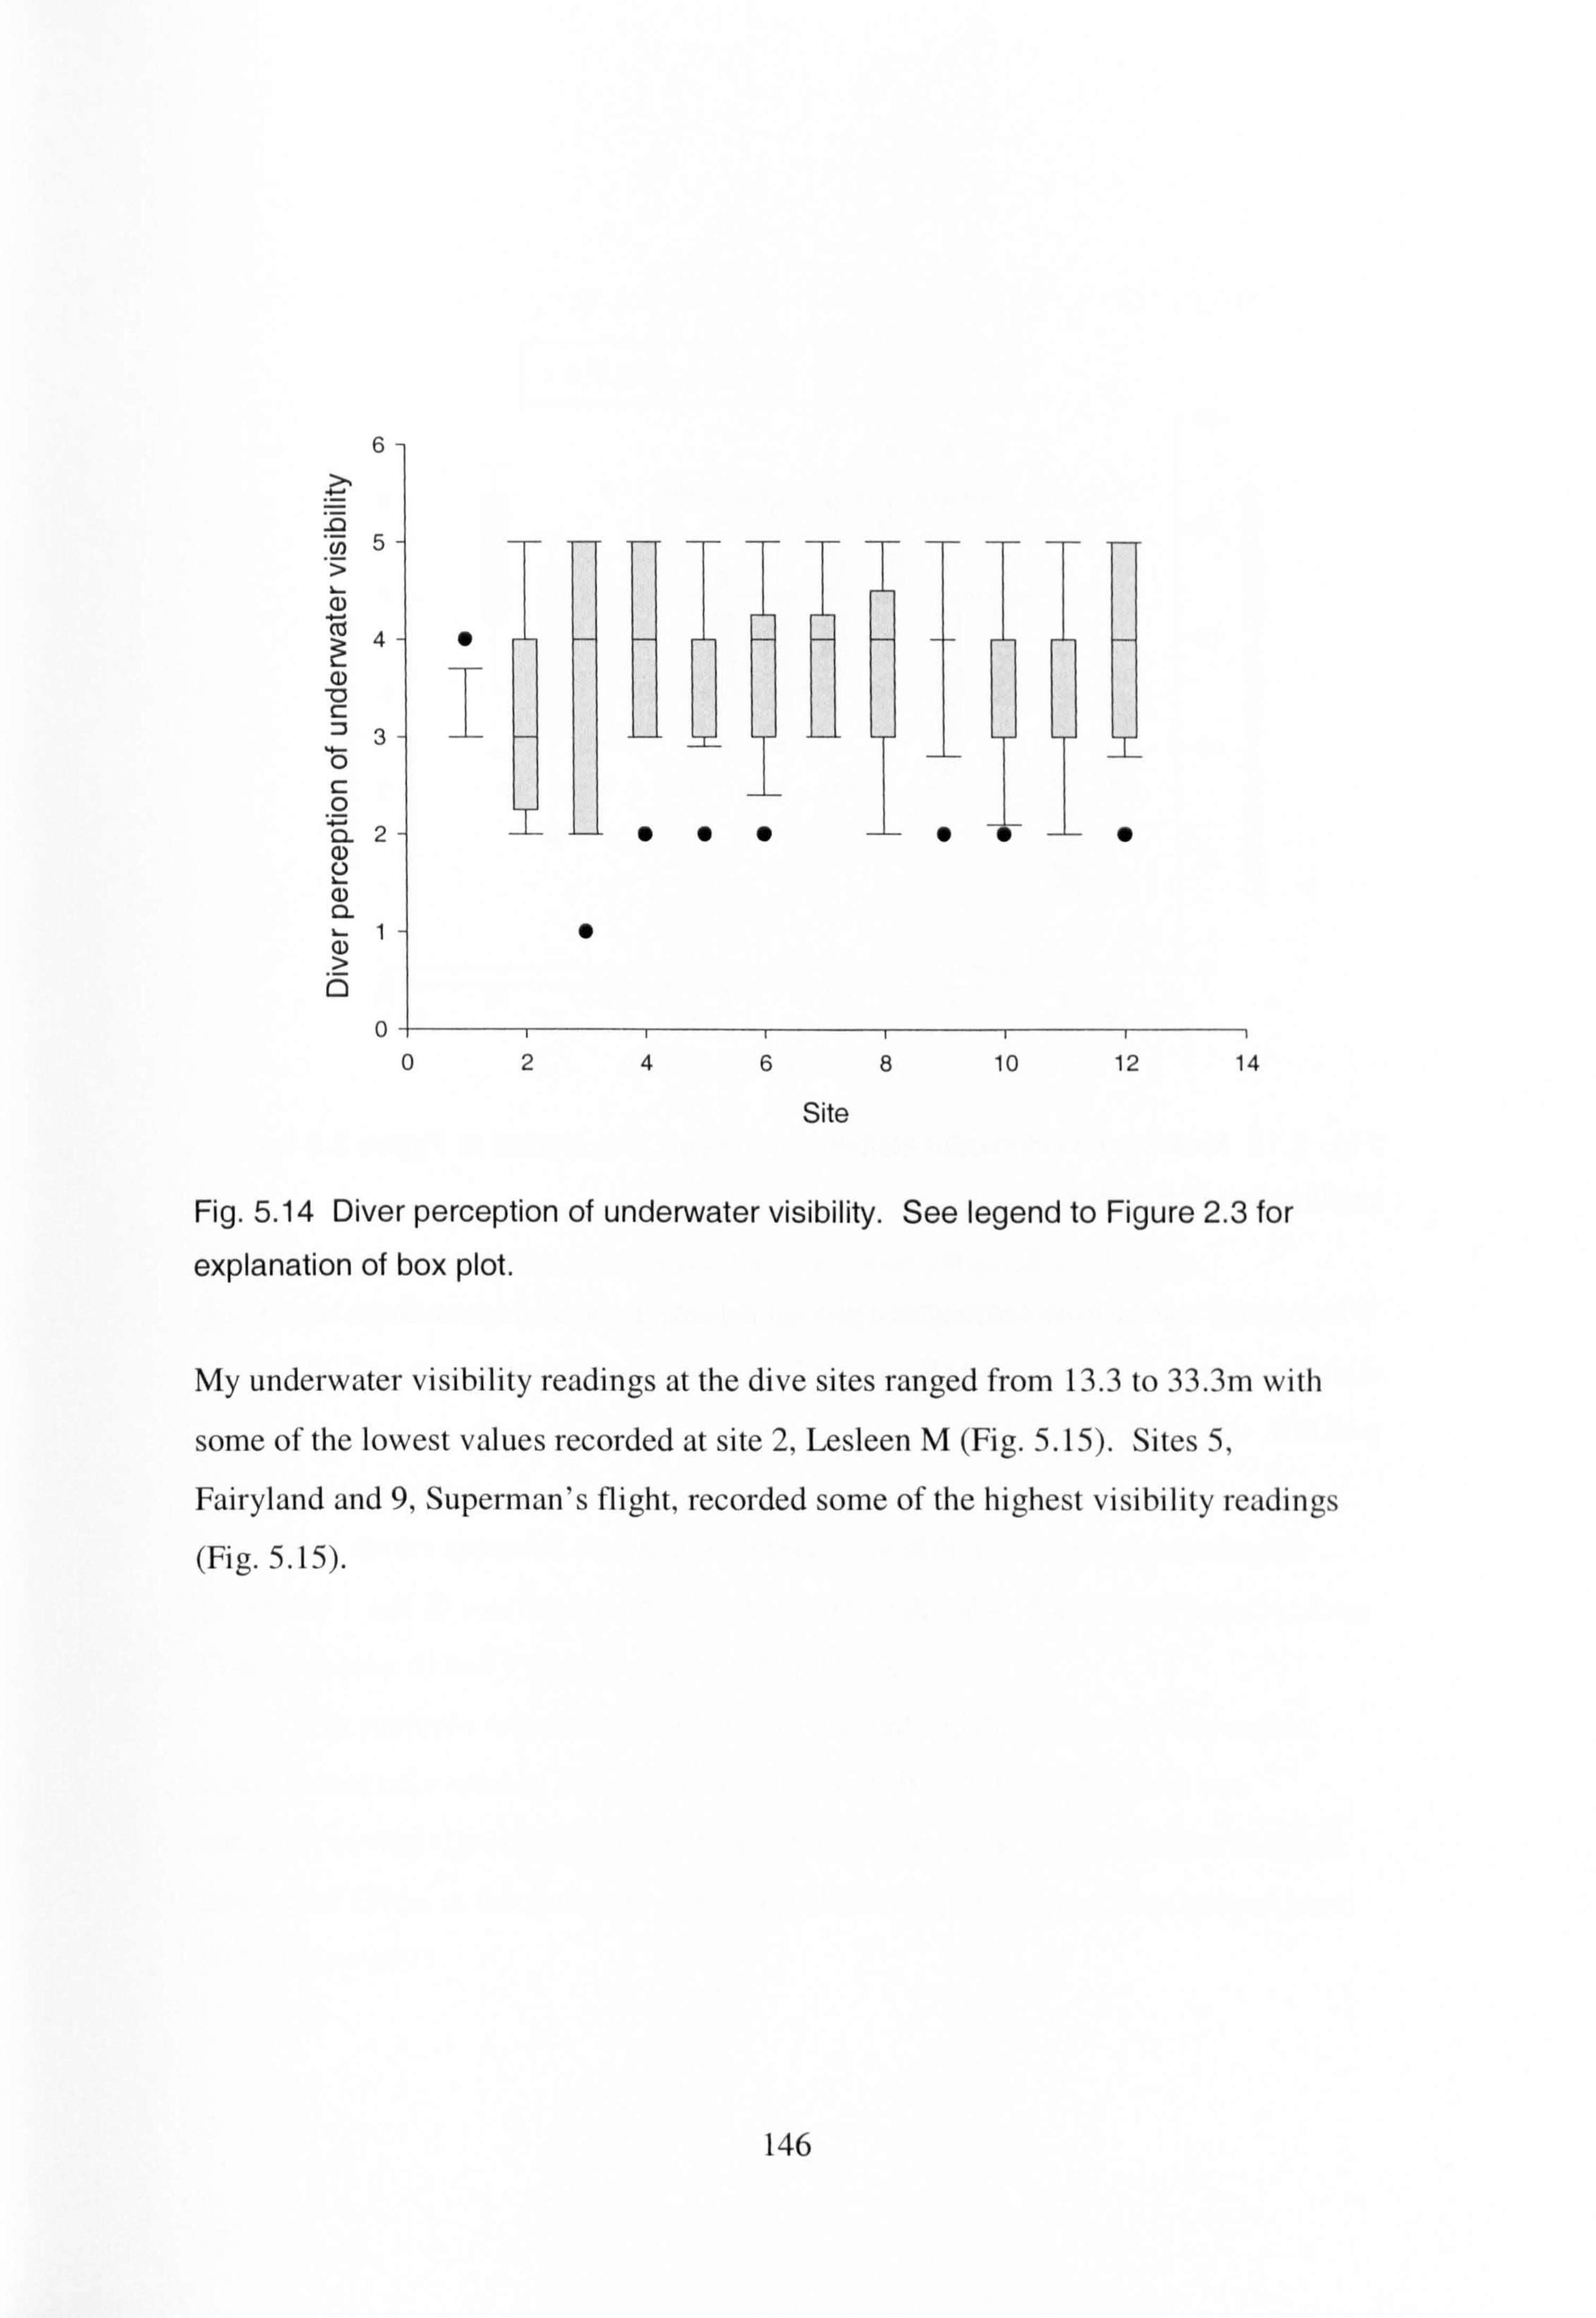
6 >'
-0 U) 5
76 4
_0 3
C: 0
0
0 8 10 12 14
Site
Fig. 5.14 Diver perception of underwater visibility. See legend to Figure 2.3 for
explanation of box plot.
My underwater visibility readings at the dive sites ranged from 13.3 to 33.3rn with
some of the lowest values recorded at site 2, Lesleen M (Fig. 5.15). Sites 5,
Fairyland and 9, Superman's flight, recorded some of the highest visibility readings (Fig. 5.15).
146
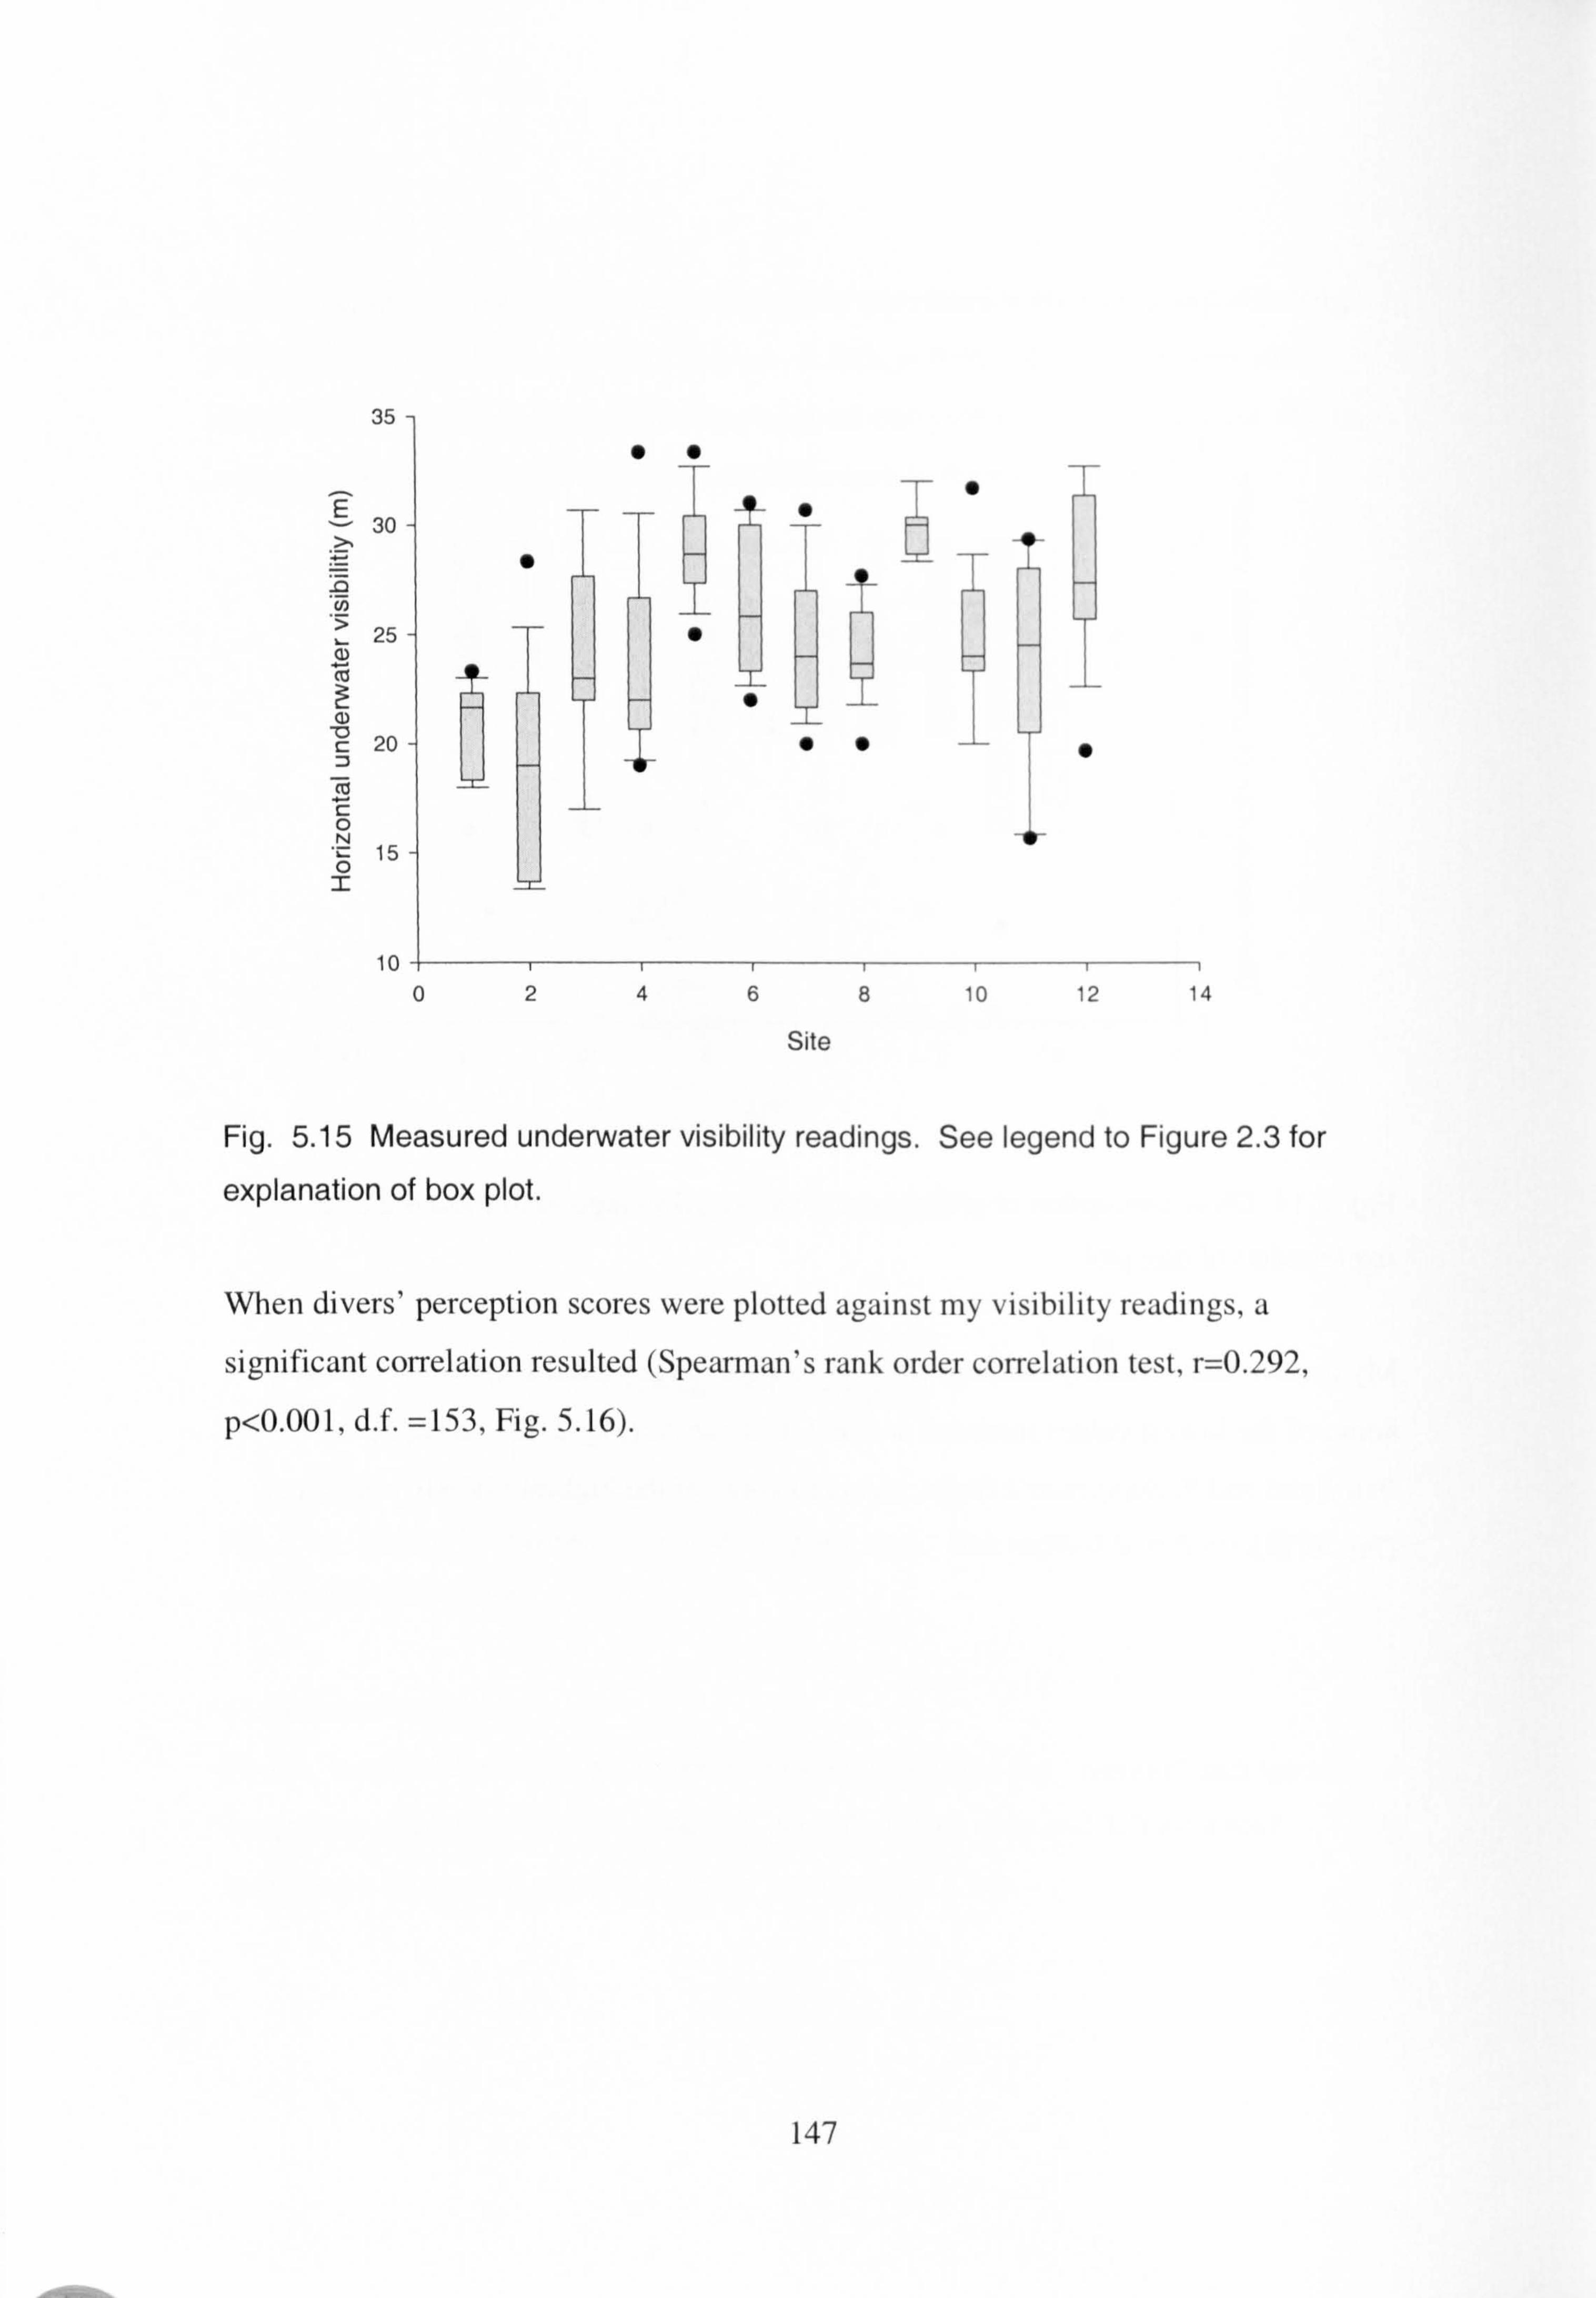
15 ]
10 iIIII 02468 10 12 14
Site
Fig. 5.15 Measured underwater visibility readings. See legend to Figure 2.3 for
explanation of box plot.
When divers' perception scores were plotted against my visibility readings, a
significant correlation resulted (Spearman's rank order correlation test, r=0.292,
p<0.001, d. f. =153, Fig. 5.16).
147
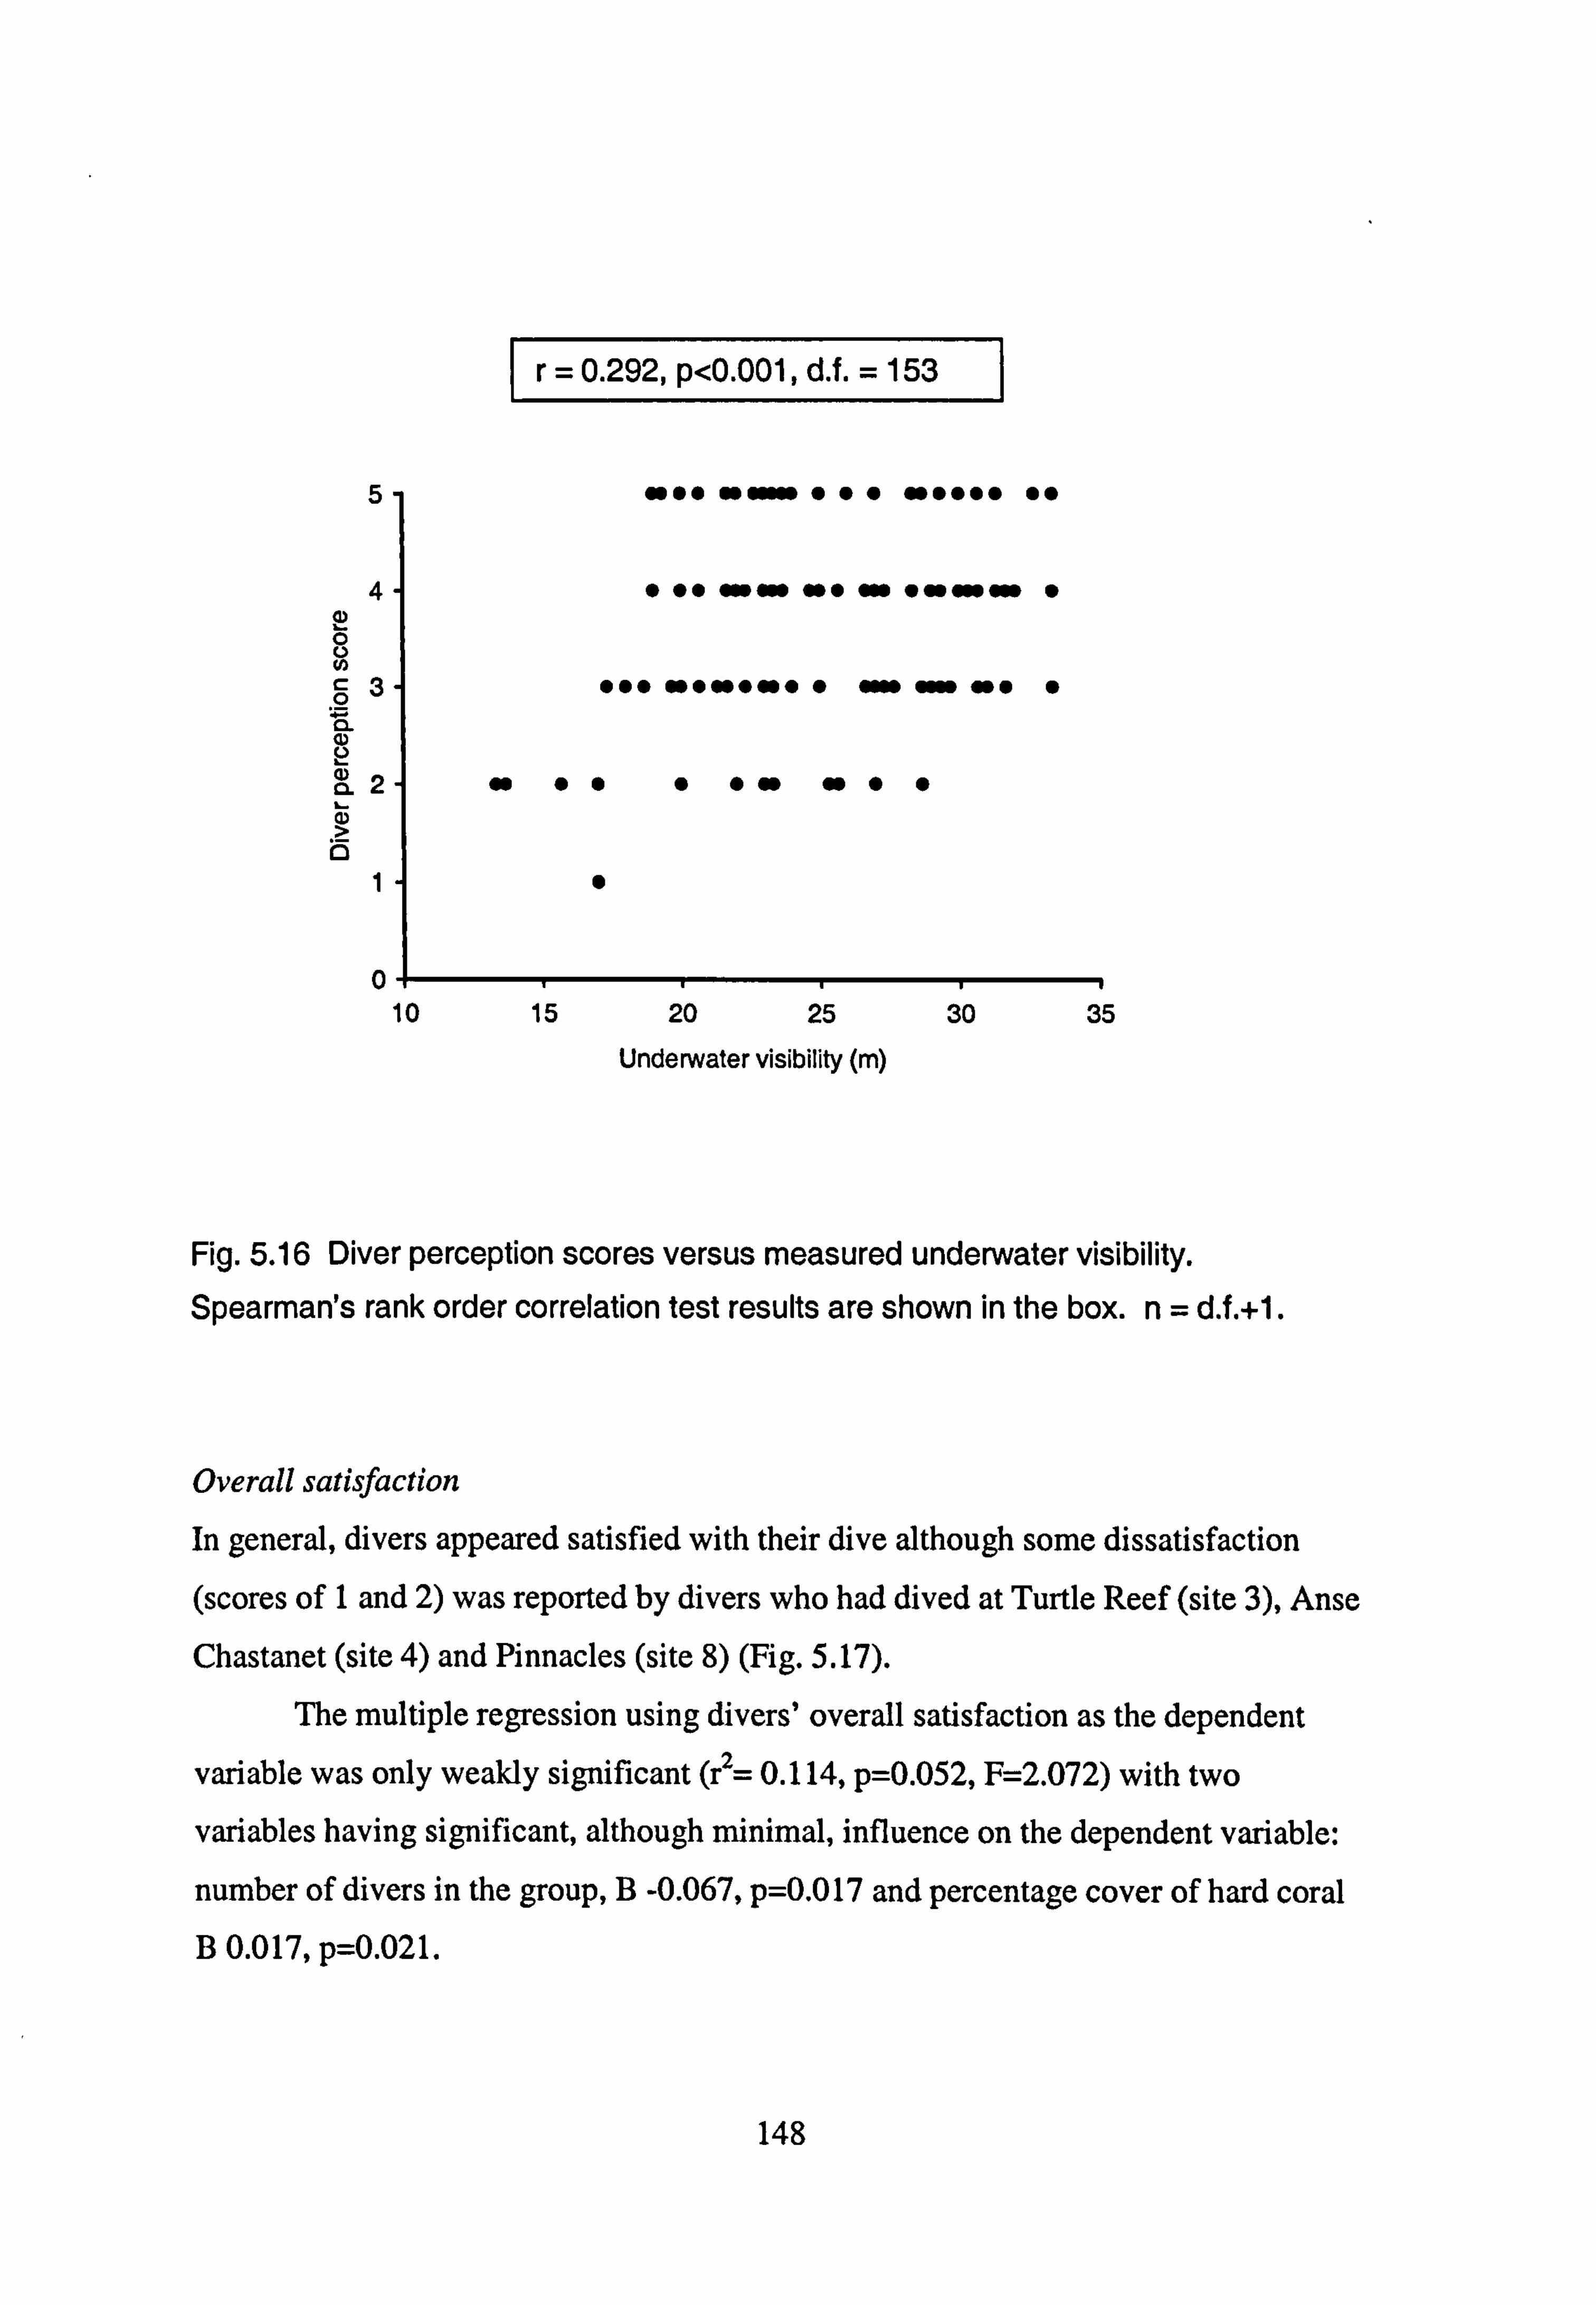
1 0.292, p<0.001, d. f. = 153
(D
we* ftý 000 400000 00
41 0 00 mm »0 m ommew 0
31 000"040*"** 0 CL
CD >
0 11 0
10 15 20 25 ýo
35
Underwater visibility (m)
Fig. 5.16 Diver perception scores versus measured underwater visibility. Spearman's rank order correlation test results are shown in the box. n= OA.
Overall satisfaction
In general, divers appeared satisfied with their dive although some dissatisfaction
(scores of I and 2) was reported by divers who had dived at Turtle Reef (site 3), Anse
Chastanet (site 4) and Pinnacles (site 8) (Fig. 5.17).
The multiple regression using divers' overall satisfaction as the dependent
variable was only weakly significant (r2= 0.114, p=0.052, F=2.072) with two
variables having significant, although minimal, influence on the dependent variable:
number of divers in the group, B -0.067, p=0.017 and percentage cover of hard coral B 0.017, p=0.021.
148
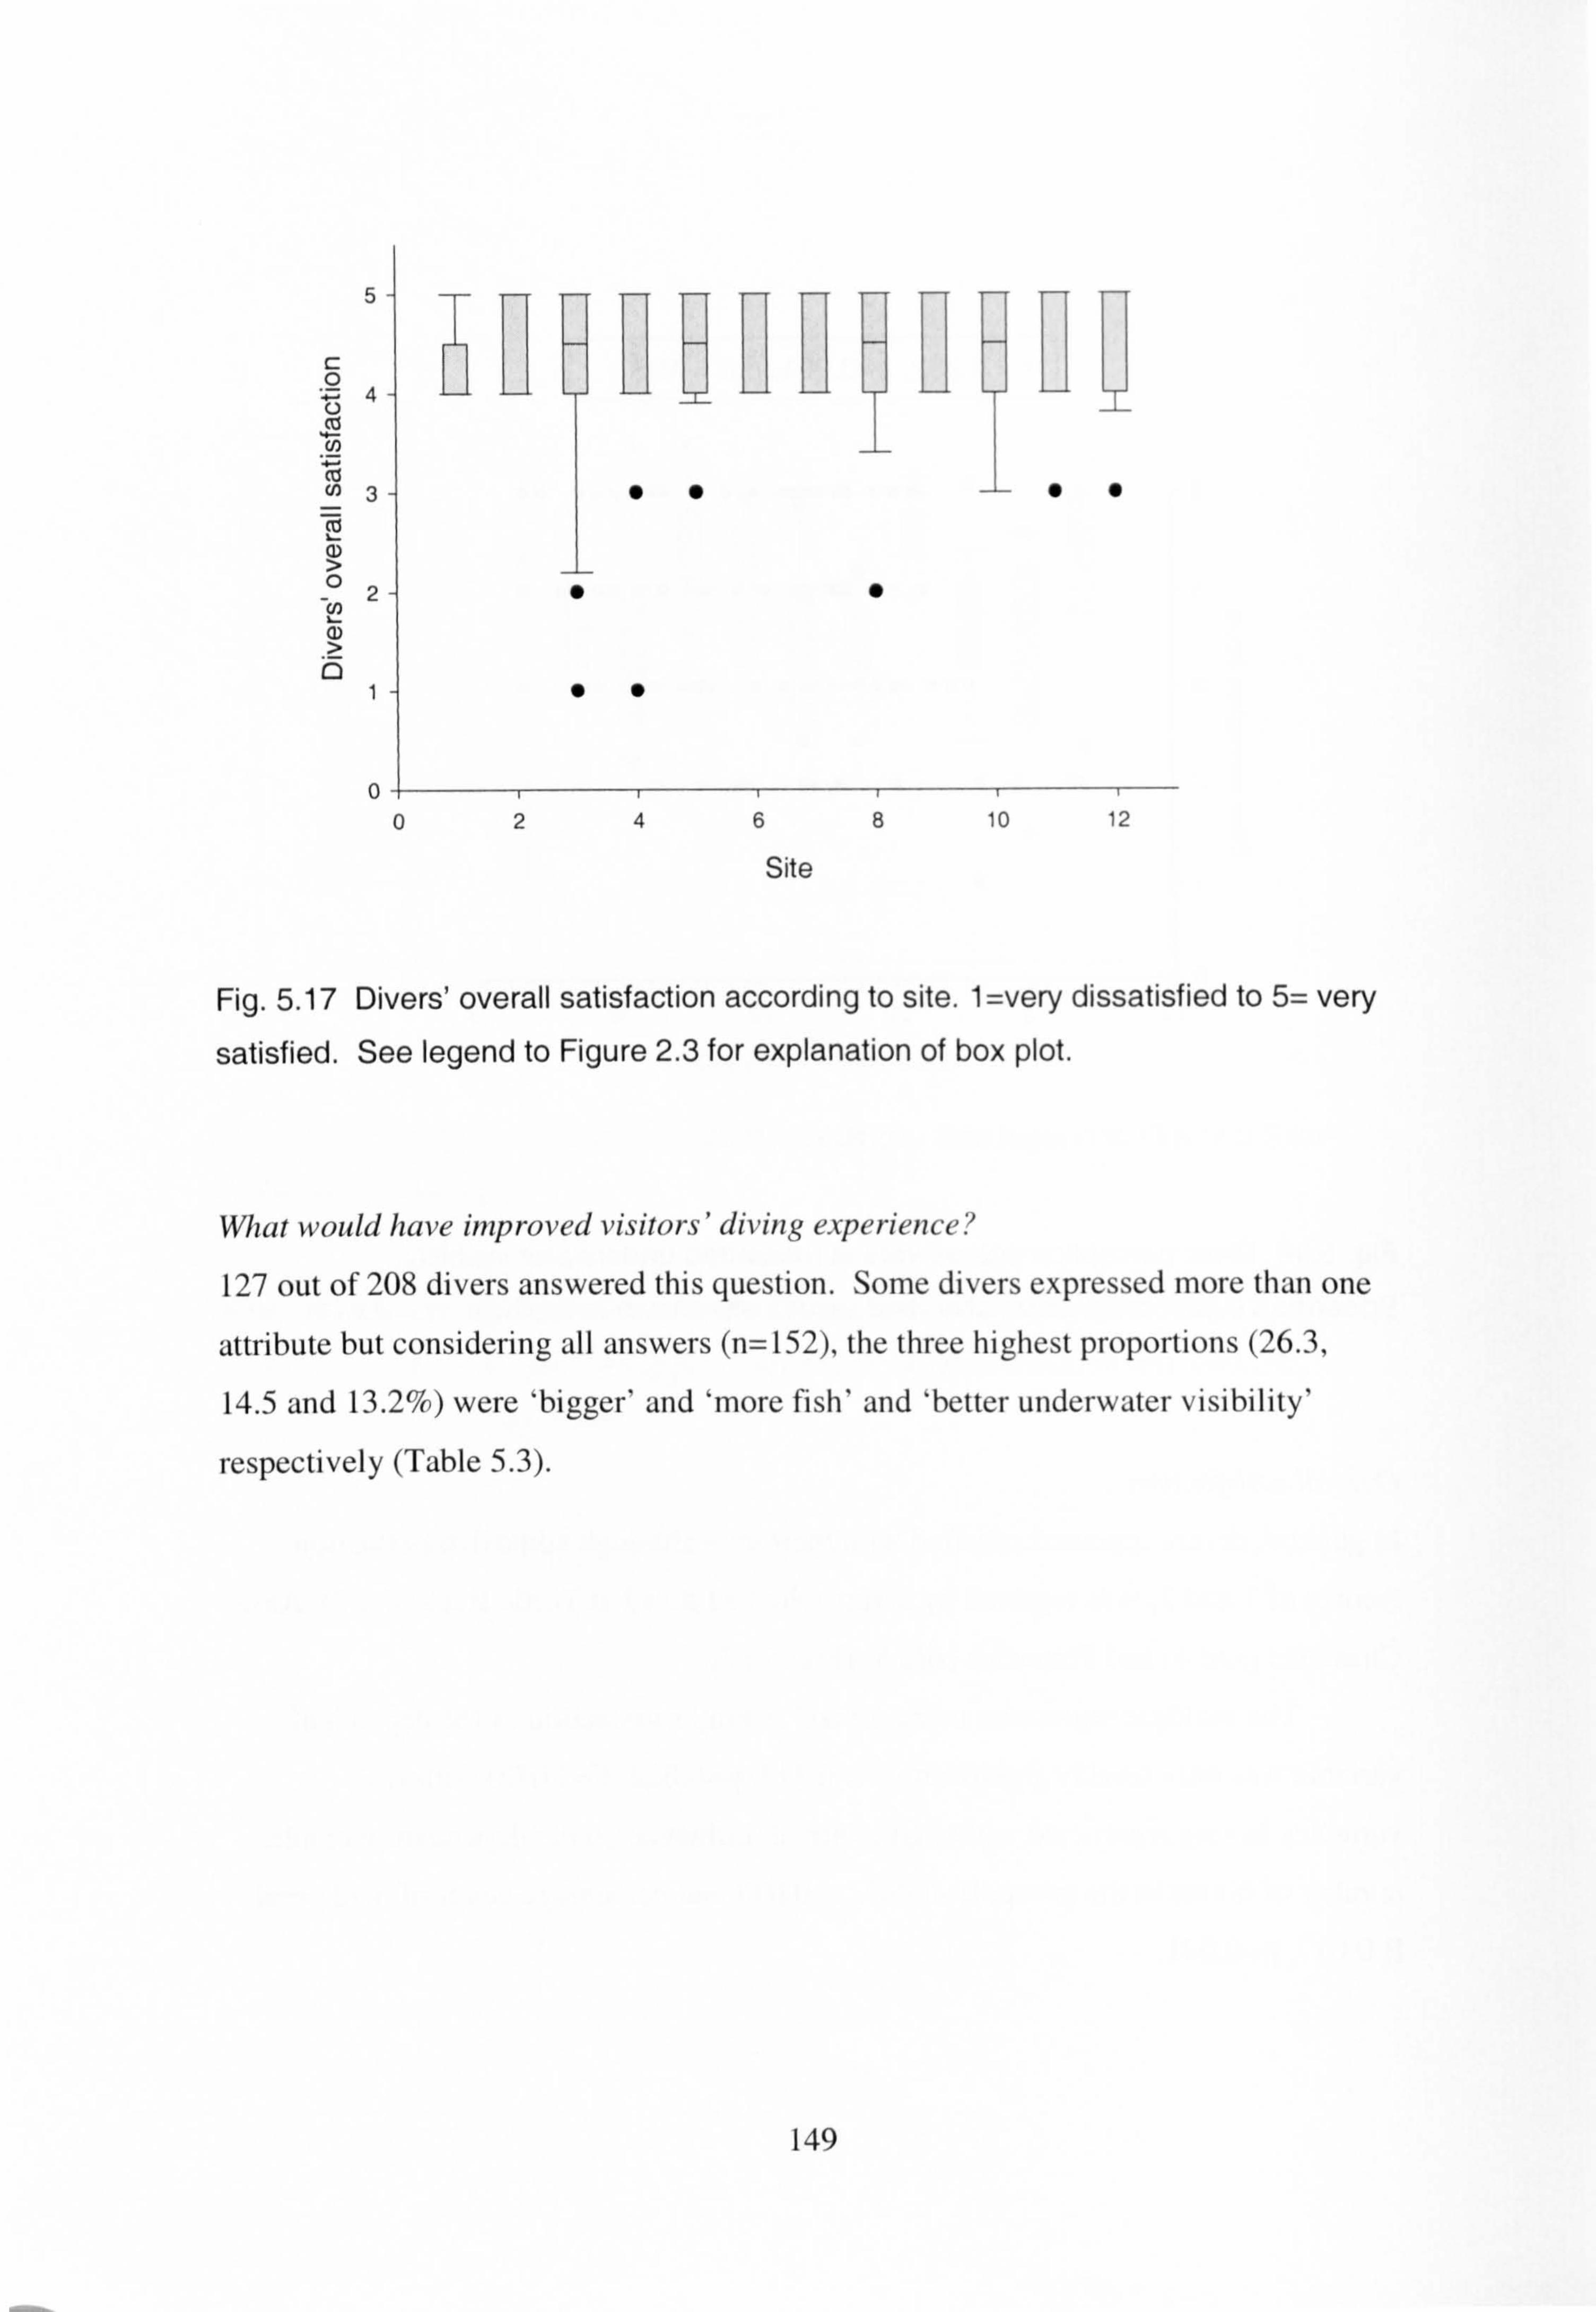
5
L' U Li uL iu
0)
0 0 2468 10 12
Site
Fig. 5.17 Divers' overall satisfaction according to site. 1 =very dissatisfied to 5= very
satisfied. See legend to Figure 2.3 for explanation of box plot.
What would have improved visitors' diving experience?
127 out of 208 divers answered this question. Some divers expressed more than one
attribute but considering all answers (n=152), the three highest proportions (26.3,
14.5 and 13.2%) were 'bigger' and 'more fish' and 'better underwater visibility'
respectively (Table 5.3).
149
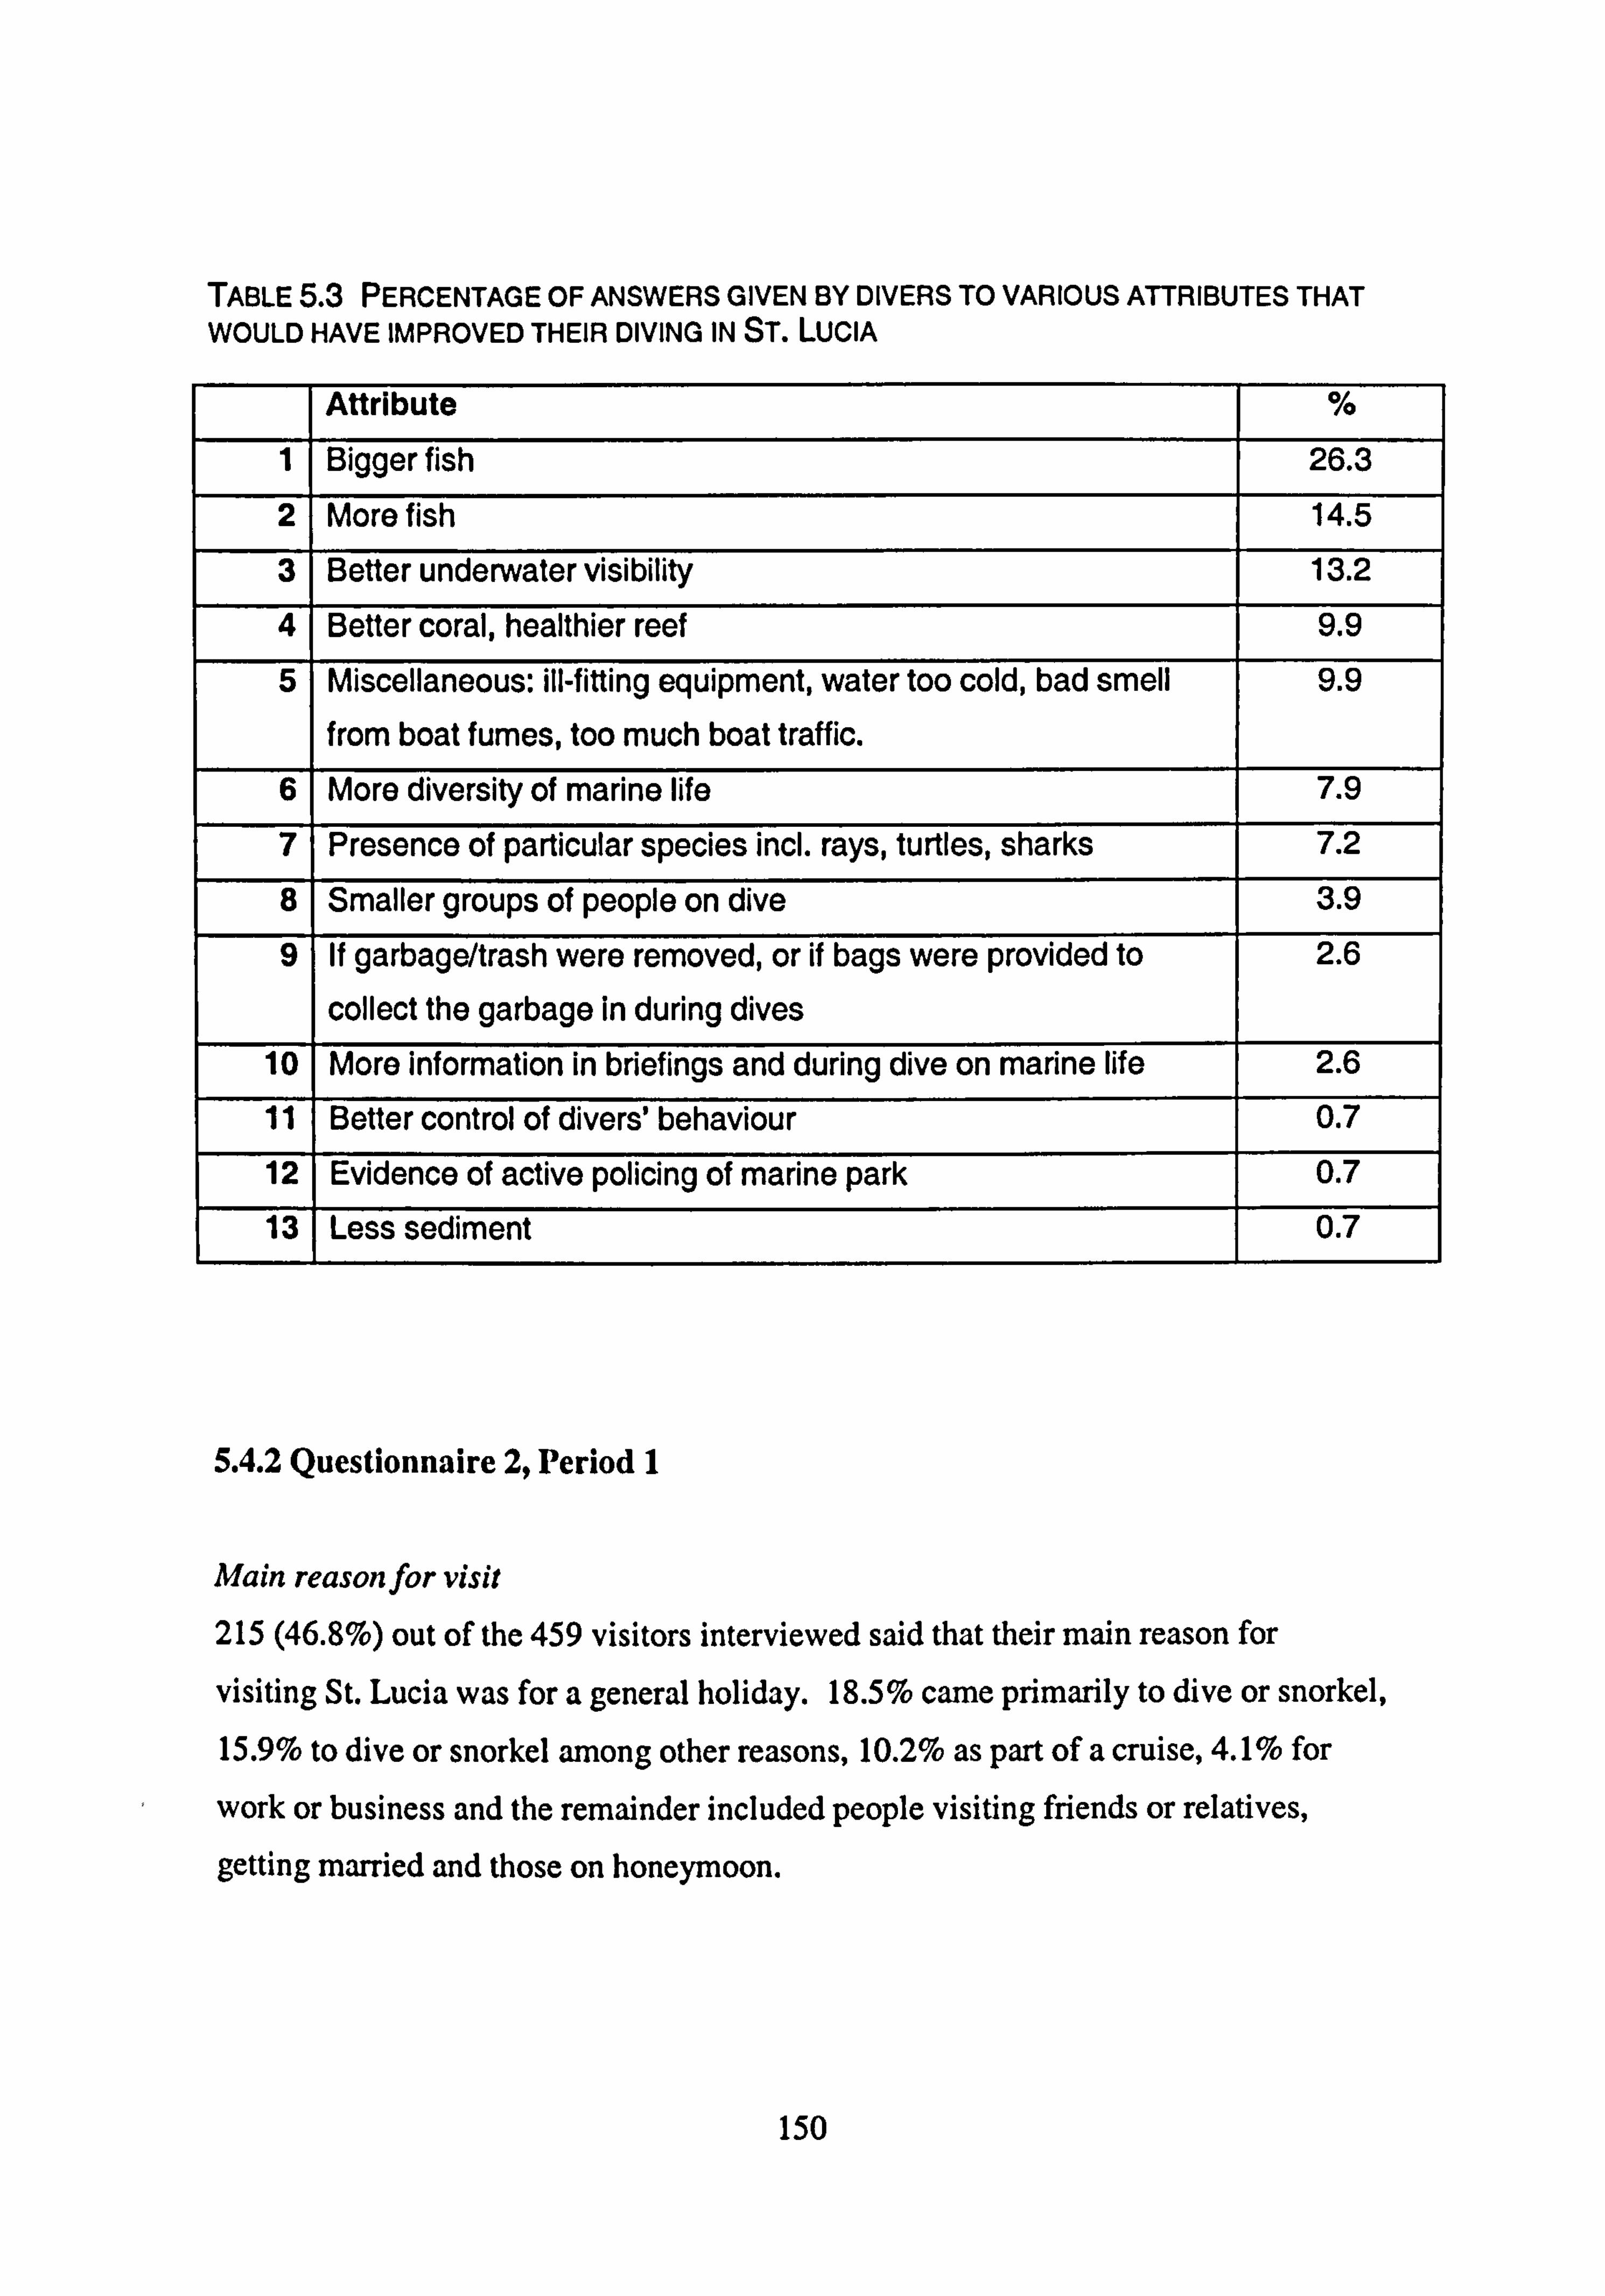
TABLE 5.3 PERCENTAGE OF ANSWERS GIVEN BY DIVERS TO VARIOUS ATTRIBUTES THAT WOULD HAVE IMPROVED THEIR DIVING IN ST. LUCIA
Attribute %
1 Bigger fish 26.3
2 More fish 14.5
31 Better underwater visibility 13.2
4 Better coral, healthier reef 9.9
5 Miscellaneous: ill-fitting equipment, water too cold, bad smell from boat fumes, too much boat traffic.
9.9
6 More diversity of marine life 7.9
7 Presence of particular species incl. rays, turtles, sharks 7.2
8 Smaller groups of people on dive 3.9
9 If garbagettrash were removed, or if bags were provided to
collect the garbage in during dives
2.6
10 More information in briefings and during dive on marine life 2.6
11 Better control of divers' behaviour 0.7
12 Evidence of active policing of marine park 0.7
13 1 Less sediment 0.7
5.4.2 Questionnaire 2, Period 1
Main reasonfor visit 215 (46.8%) out of the 459 visitors interviewed said that their main reason for
visiting St. Lucia was for a general holiday. 18.5% came primarily to dive or snorkel, 15.9% to dive or snorkel among other reasons, 10.2% as part of a cruise, 4.1 % for
work or business and the remainder included people visiting friends or relatives,
getting married and those on honeymoon.
150
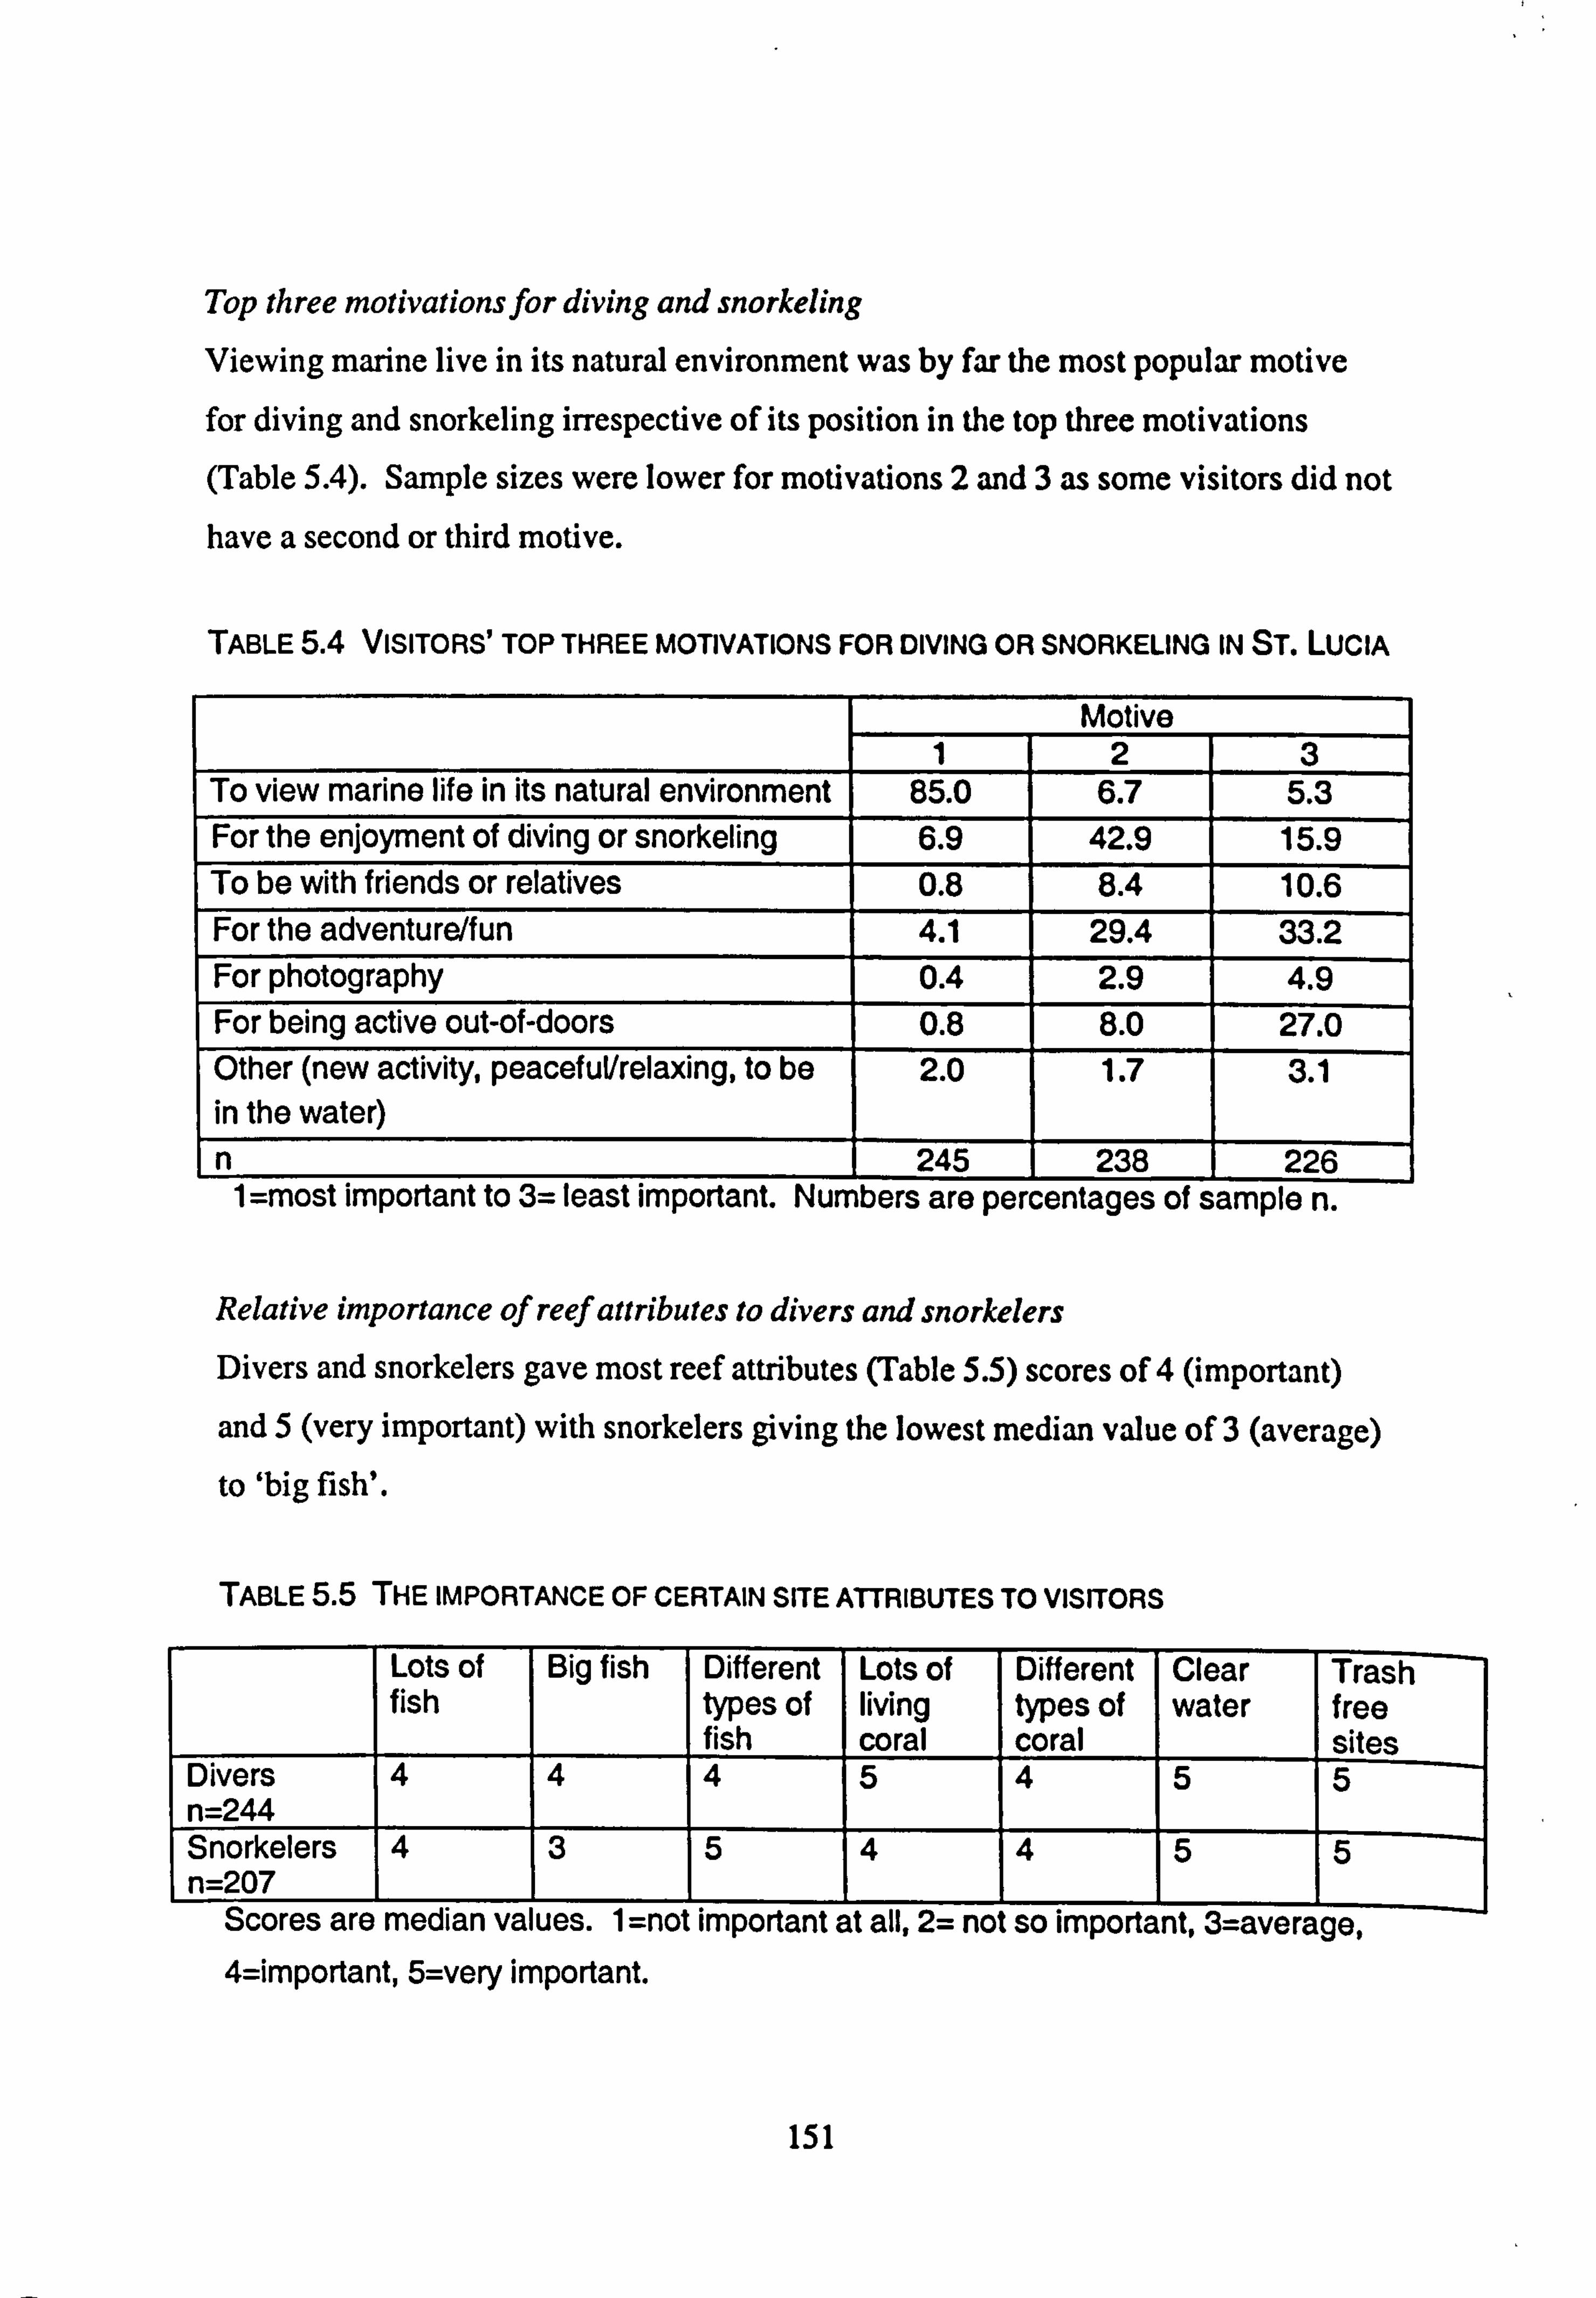
Top three motivationsfor diving and snorkeling
Viewing marine live in its natural environment was by far the most popular motive for diving and snorkeling irrespective of its position in the top three motivations (Table 5.4). Sample sizes were lower for motivations 2 and 3 as some visitors did not have a second or third motive.
TABLE 5.4 VISITORS'TOP THREE MOTIVATIONS FOR DIVING OR SNORKELING IN ST. LuclA
Motive 1 2 3
To view marine life in its natural environment 85.0 6.7 5.3 For the enjoyment of diving or snorkeling 6.9 42.9 15.9 To be with friends or relatives 0.8 8.4 10.6 For the adventurelfun 4.1 29.4 33.2 For photography 0.4 2.9 4.9 For being active out-of-doors 0.8 8.0 27.0 Other (new activity, peaceful/relaxing, to be in the water) _
2.0 1.7 3.1
n 245 226 1 =most important to 3= least important. Numbers are percentages of sample n.
Relative importance of reef attributes to divers and snorkelers Divers and snorkelers gave most reef attributes (Table 5.5) scores of 4 (important)
and 5 (very important) with snorkelers giving the lowest median value of 3 (average)
to 'big fish'.
TABLE 5.5 THE IMPORTANCE OF CERTAIN SITE ATTRIBUTES TO visrrORS
Lots of Big fish Different Lots of Diff erent Clear Trash fish
I types of living types of water f ree fish coral coral sites
Divers 41 4 T 5 4 5 5 n=244 Snorkelers 4 31 5 14 4 5 n=207
1 1
scores are meclian values. 1 =not important at all, 2= not so important, 3=average, 4=important, 5=very important.
151
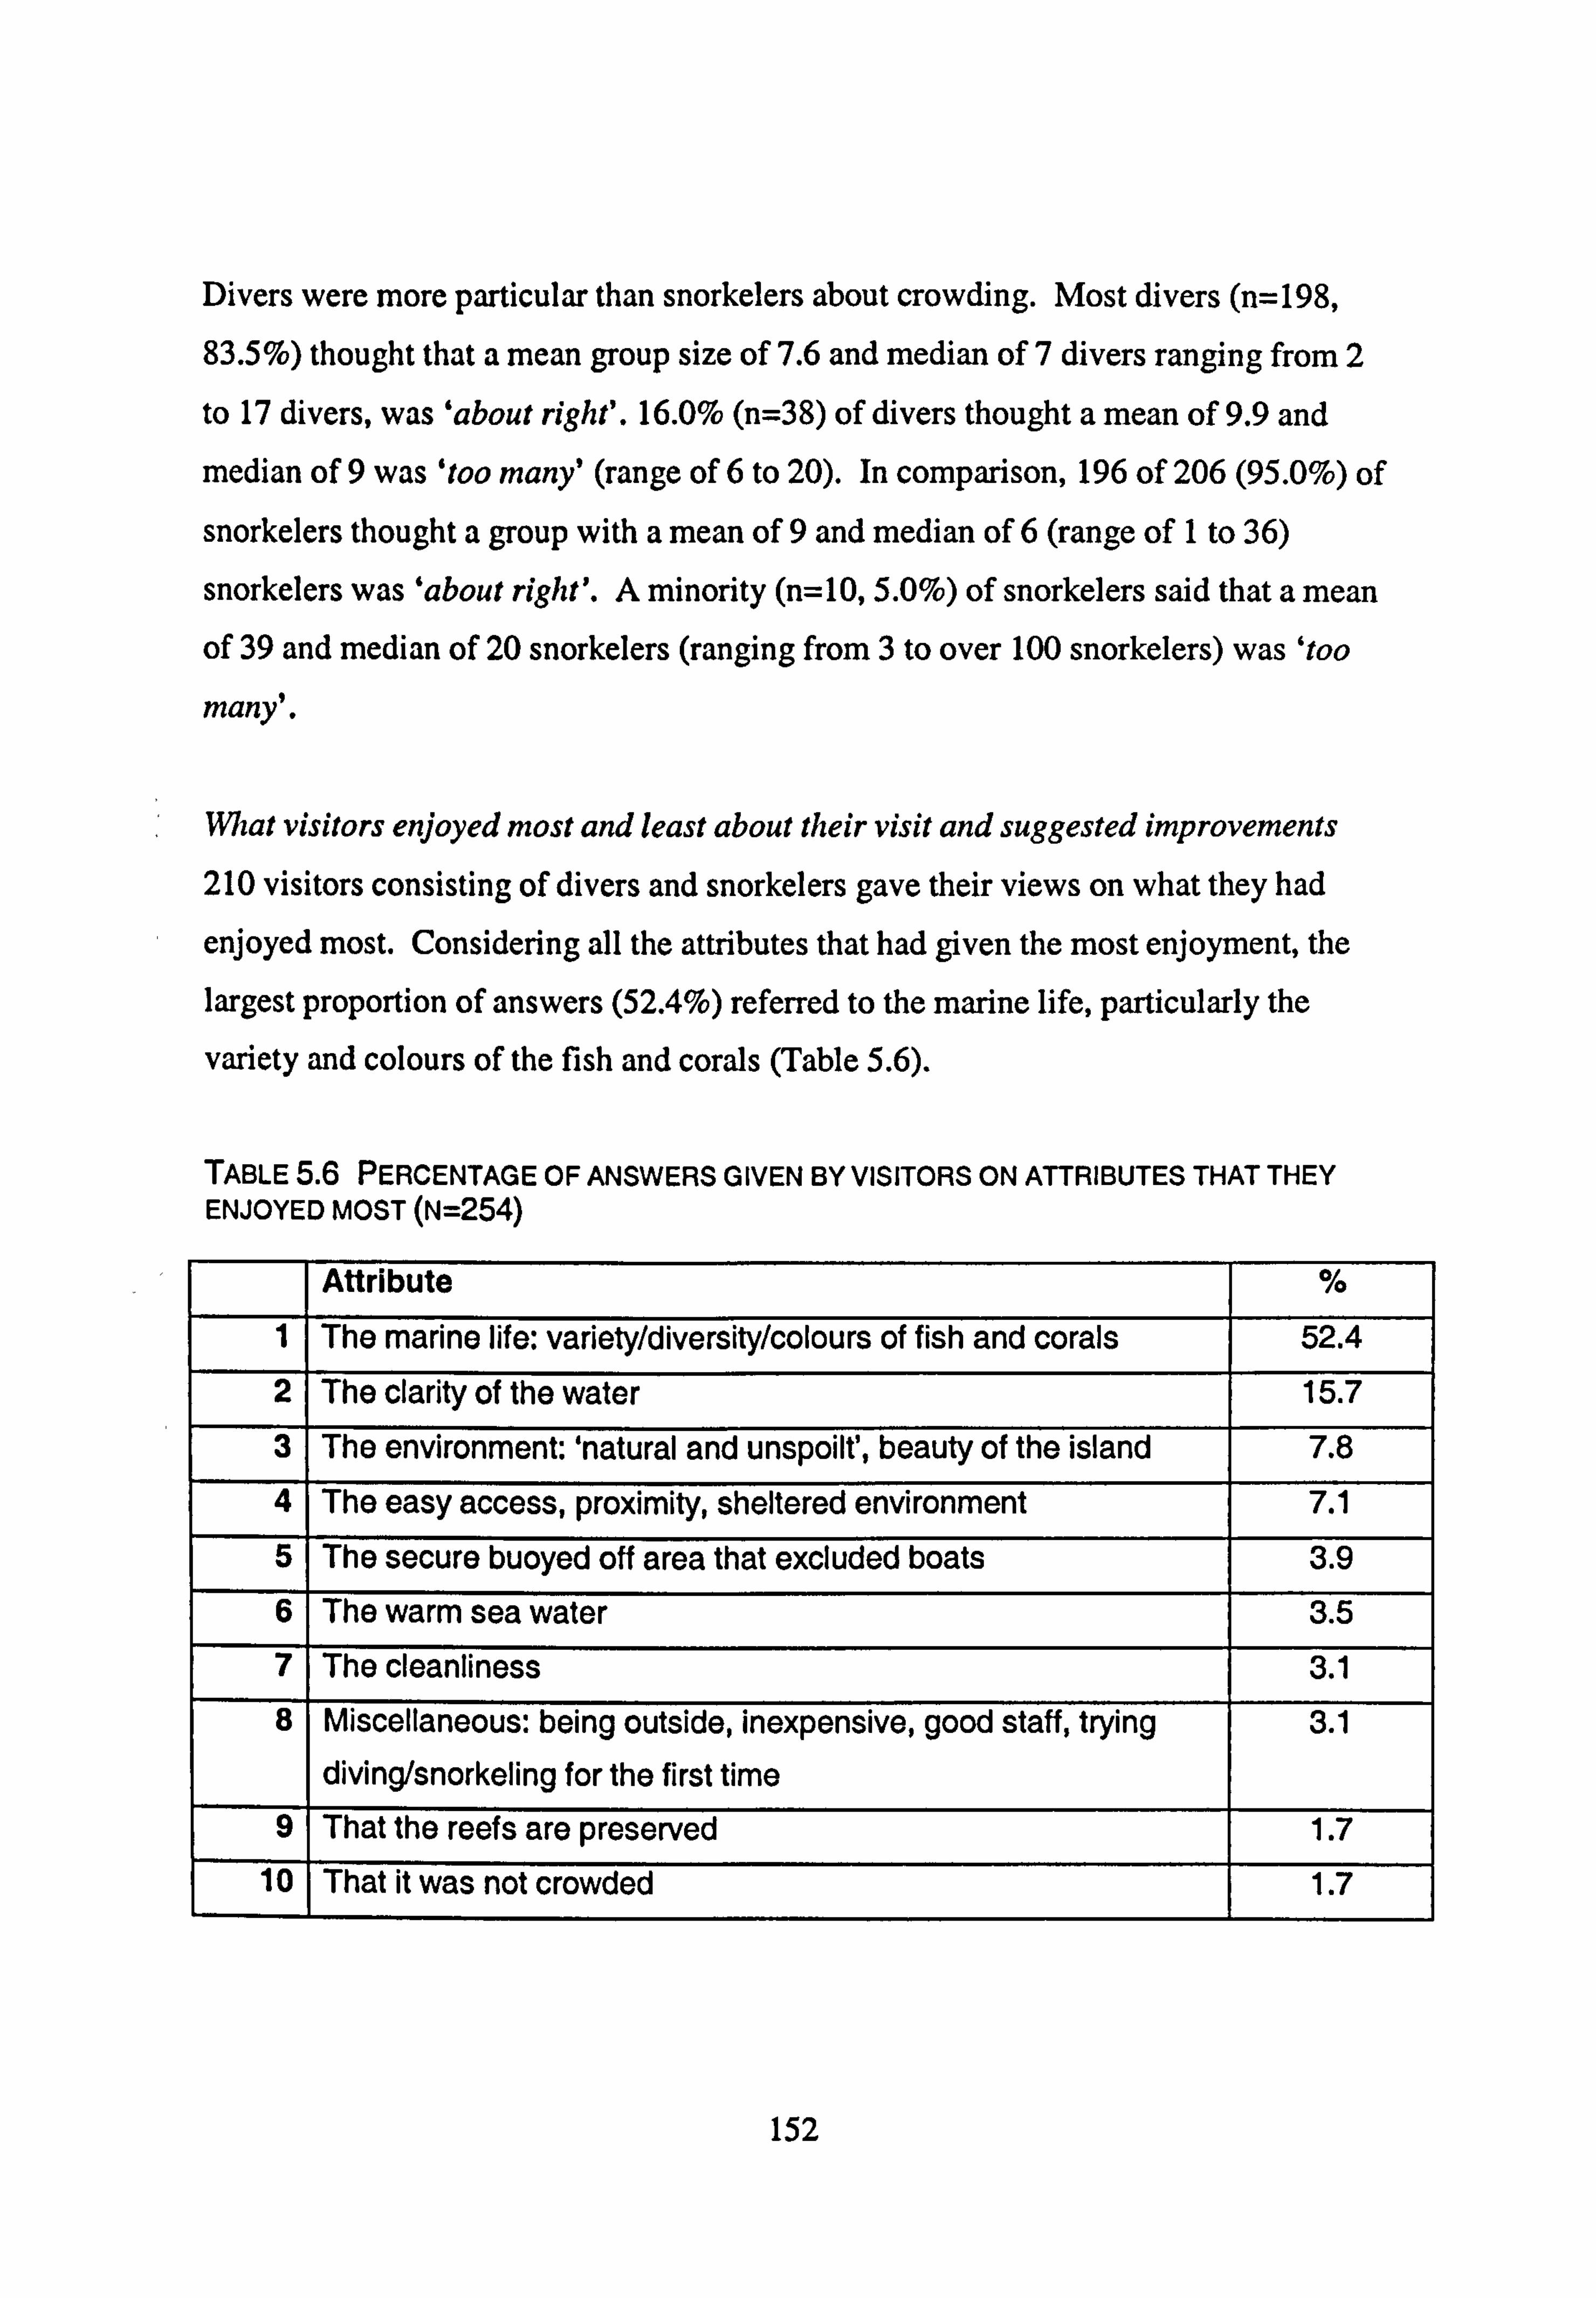
Divers were more particular than snorkelers about crowding. Most divers (n=198,
83.5%) thought that a mean group size of 7.6 and median of 7 divers ranging from 2
to 17 divers, was 'about right. 16.0% (n=38) of divers thought a mean of 9.9 and
median of 9 was 'too many' (range of 6 to 20). In comparison, 196 of 206 (95.0%) of
snorkelers thought a group with a mean of 9 and median of 6 (range of 1 to 36)
snorkelers was 'about right'. A minority (n=10,5.0%) of snorkelers said that a mean
of 39 and median of 20 snorkelers (ranging from 3 to over 100 snorkelers) was 'too
many'.
Mat visitors enjoyed most and least about their visit and suggested improvements
210 visitors consisting of divers and snorkelers gave their views on what they had
enjoyed most. Considering all the attributes that had given the most enjoyment, the
largest proportion of answers (52.4%) referred to the marine life, particularly the
variety and colours of the fish and corals (Table 5.6).
TABLE5.6 PERCENTAGE OF ANSWERS GIVEN BY VISITORS ON ATTRIBUTES THAT THEY ENJOYED MOST (N=254)
Attribute %
1 The marine life: variety/diversity/colours of fish and corals 52.4
2 The clarity of the water 15.7
3 The environment: 'natural and unspoilt', beauty of the island 7.8
4 The easy access, proximity, sheltered environment 7.1
5 The secure buoyed off area that excluded boats 3.9
6 The warm sea water 3.5 7 The cleanliness 3.1 8 Miscellaneous: being outside, inexpensive, good staff, trying
diving/snorkeling for the first time
3.1
9 That the reefs are preserved 1.7 10 That it was not crowded 1.7
152
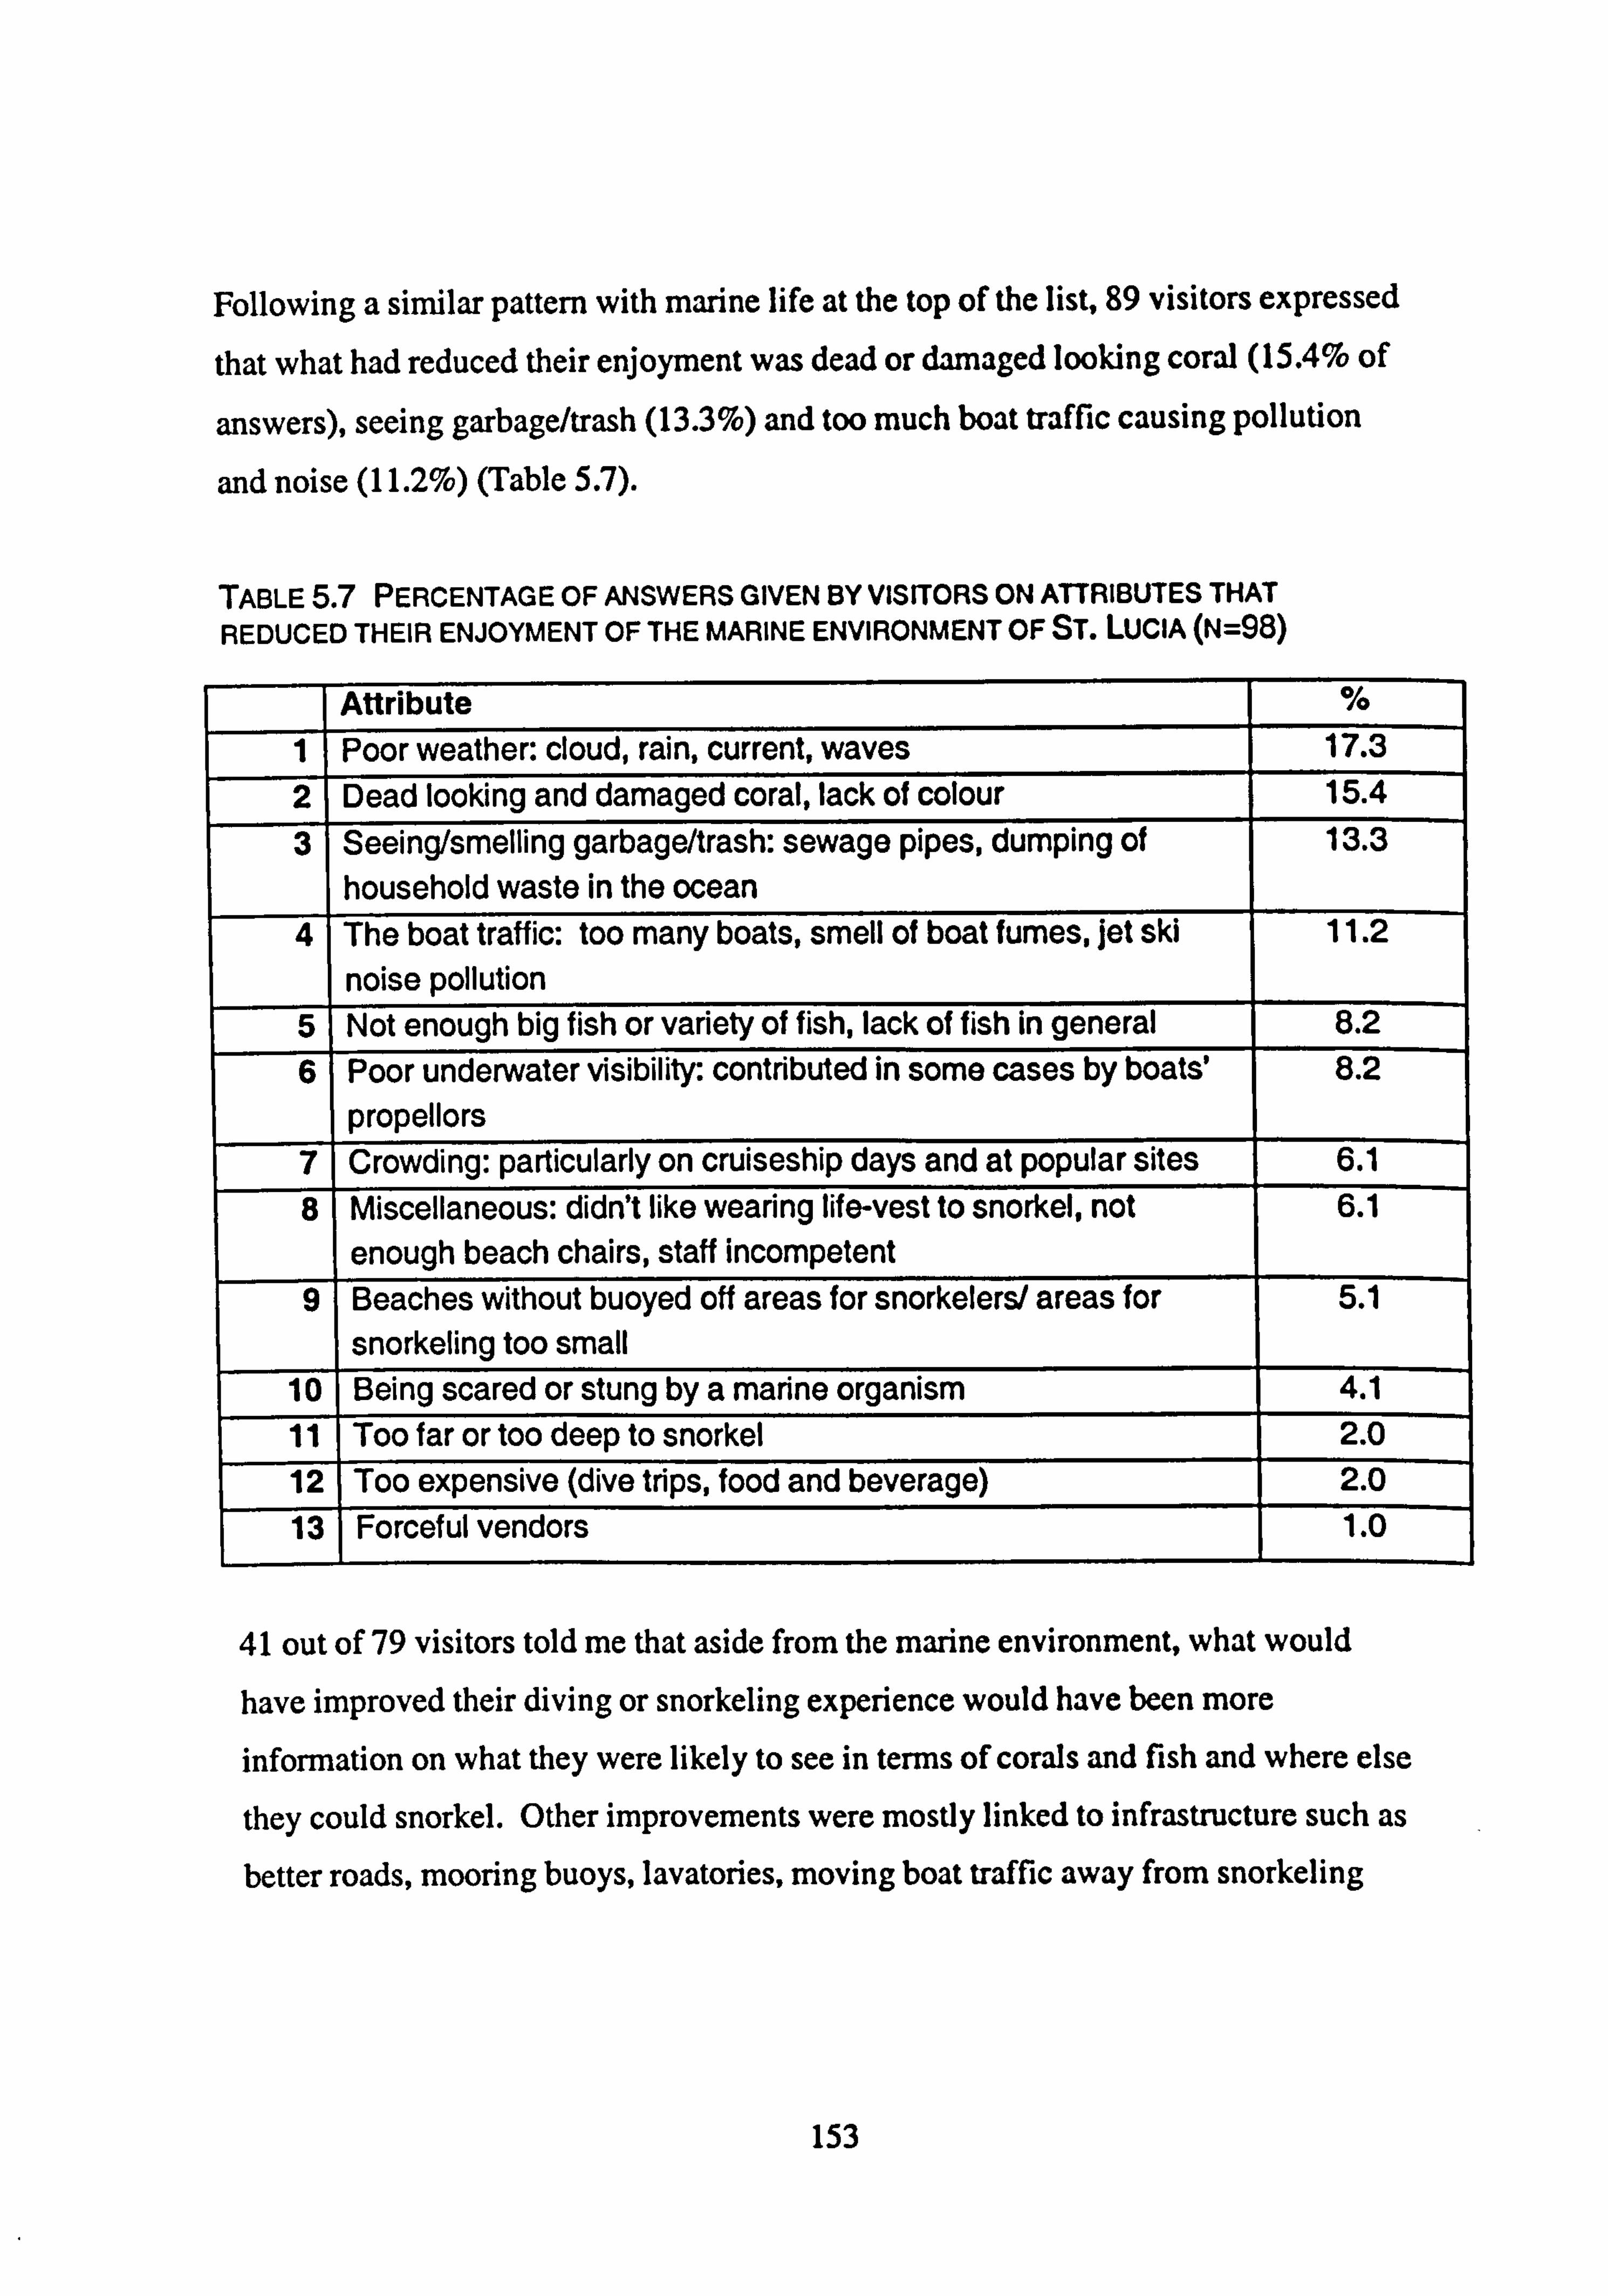
Following a similar pattern with marine life at the top of the list, 89 visitors expressed
that what had reduced their enjoyment was dead or damaged looking coral (15.4% of
answers), seeing garbage/trash (13.3%) and too much boat traffic causing pollution
and noise (11.2%) (Table 5.7).
TABLE5.7 PERCENTAGE OF ANSWERS GIVEN BY VISITORS ON ATTRIBUTES THAT REDUCED THEIR ENJOYMENT OF THE MARINE ENVIRONMENT OF ST. LUCIA (N=98)
Attribute % 1 Poor weather: cloud, rain, current, waves 17.3 2 Dead looking and damaged coral, lack of colour 15.4 3 Seeing/smelling garbage/trash: sewage pipes, dumping of
household waste in the ocean
13.3
4 The boat traffic: too many boats, smell of boat fumes, jet ski noise pollution
11.2
5 Not enough big fish or variety of fish, lack of fish in general 8.2 6 Poor underwater visibility: contributed in some cases by boats'
propellors
8.2
7 Crowding: particularly on cruiseship days and at popular sites 6.1 8 Miscellaneous: didn't like wearing life-vest to snorkel, not
enough beach chairs, staff incompetent 6.1
9 Beaches without buoyed off areas for snorkelers/ areas for
snorkeling too small 5.1
10 1 Being scared or stung by a marine organism 4.1 11 Too far or too deep to snorkel 2.0 12 Too expensive (dive trips, food and beverage) 2.0 13 Forceful vendors 1.0
41 out of 79 visitors told me that aside from the marine environment, what would
have improved their diving or snorkeling experience would have been more
information on what they were likely to see in terms of corals and fish and where else
they could snorkel. Other improvements were mostly linked to infrastructure such as
better roads, mooring buoys, lavatories, moving boat traffic away from snorkeling
153
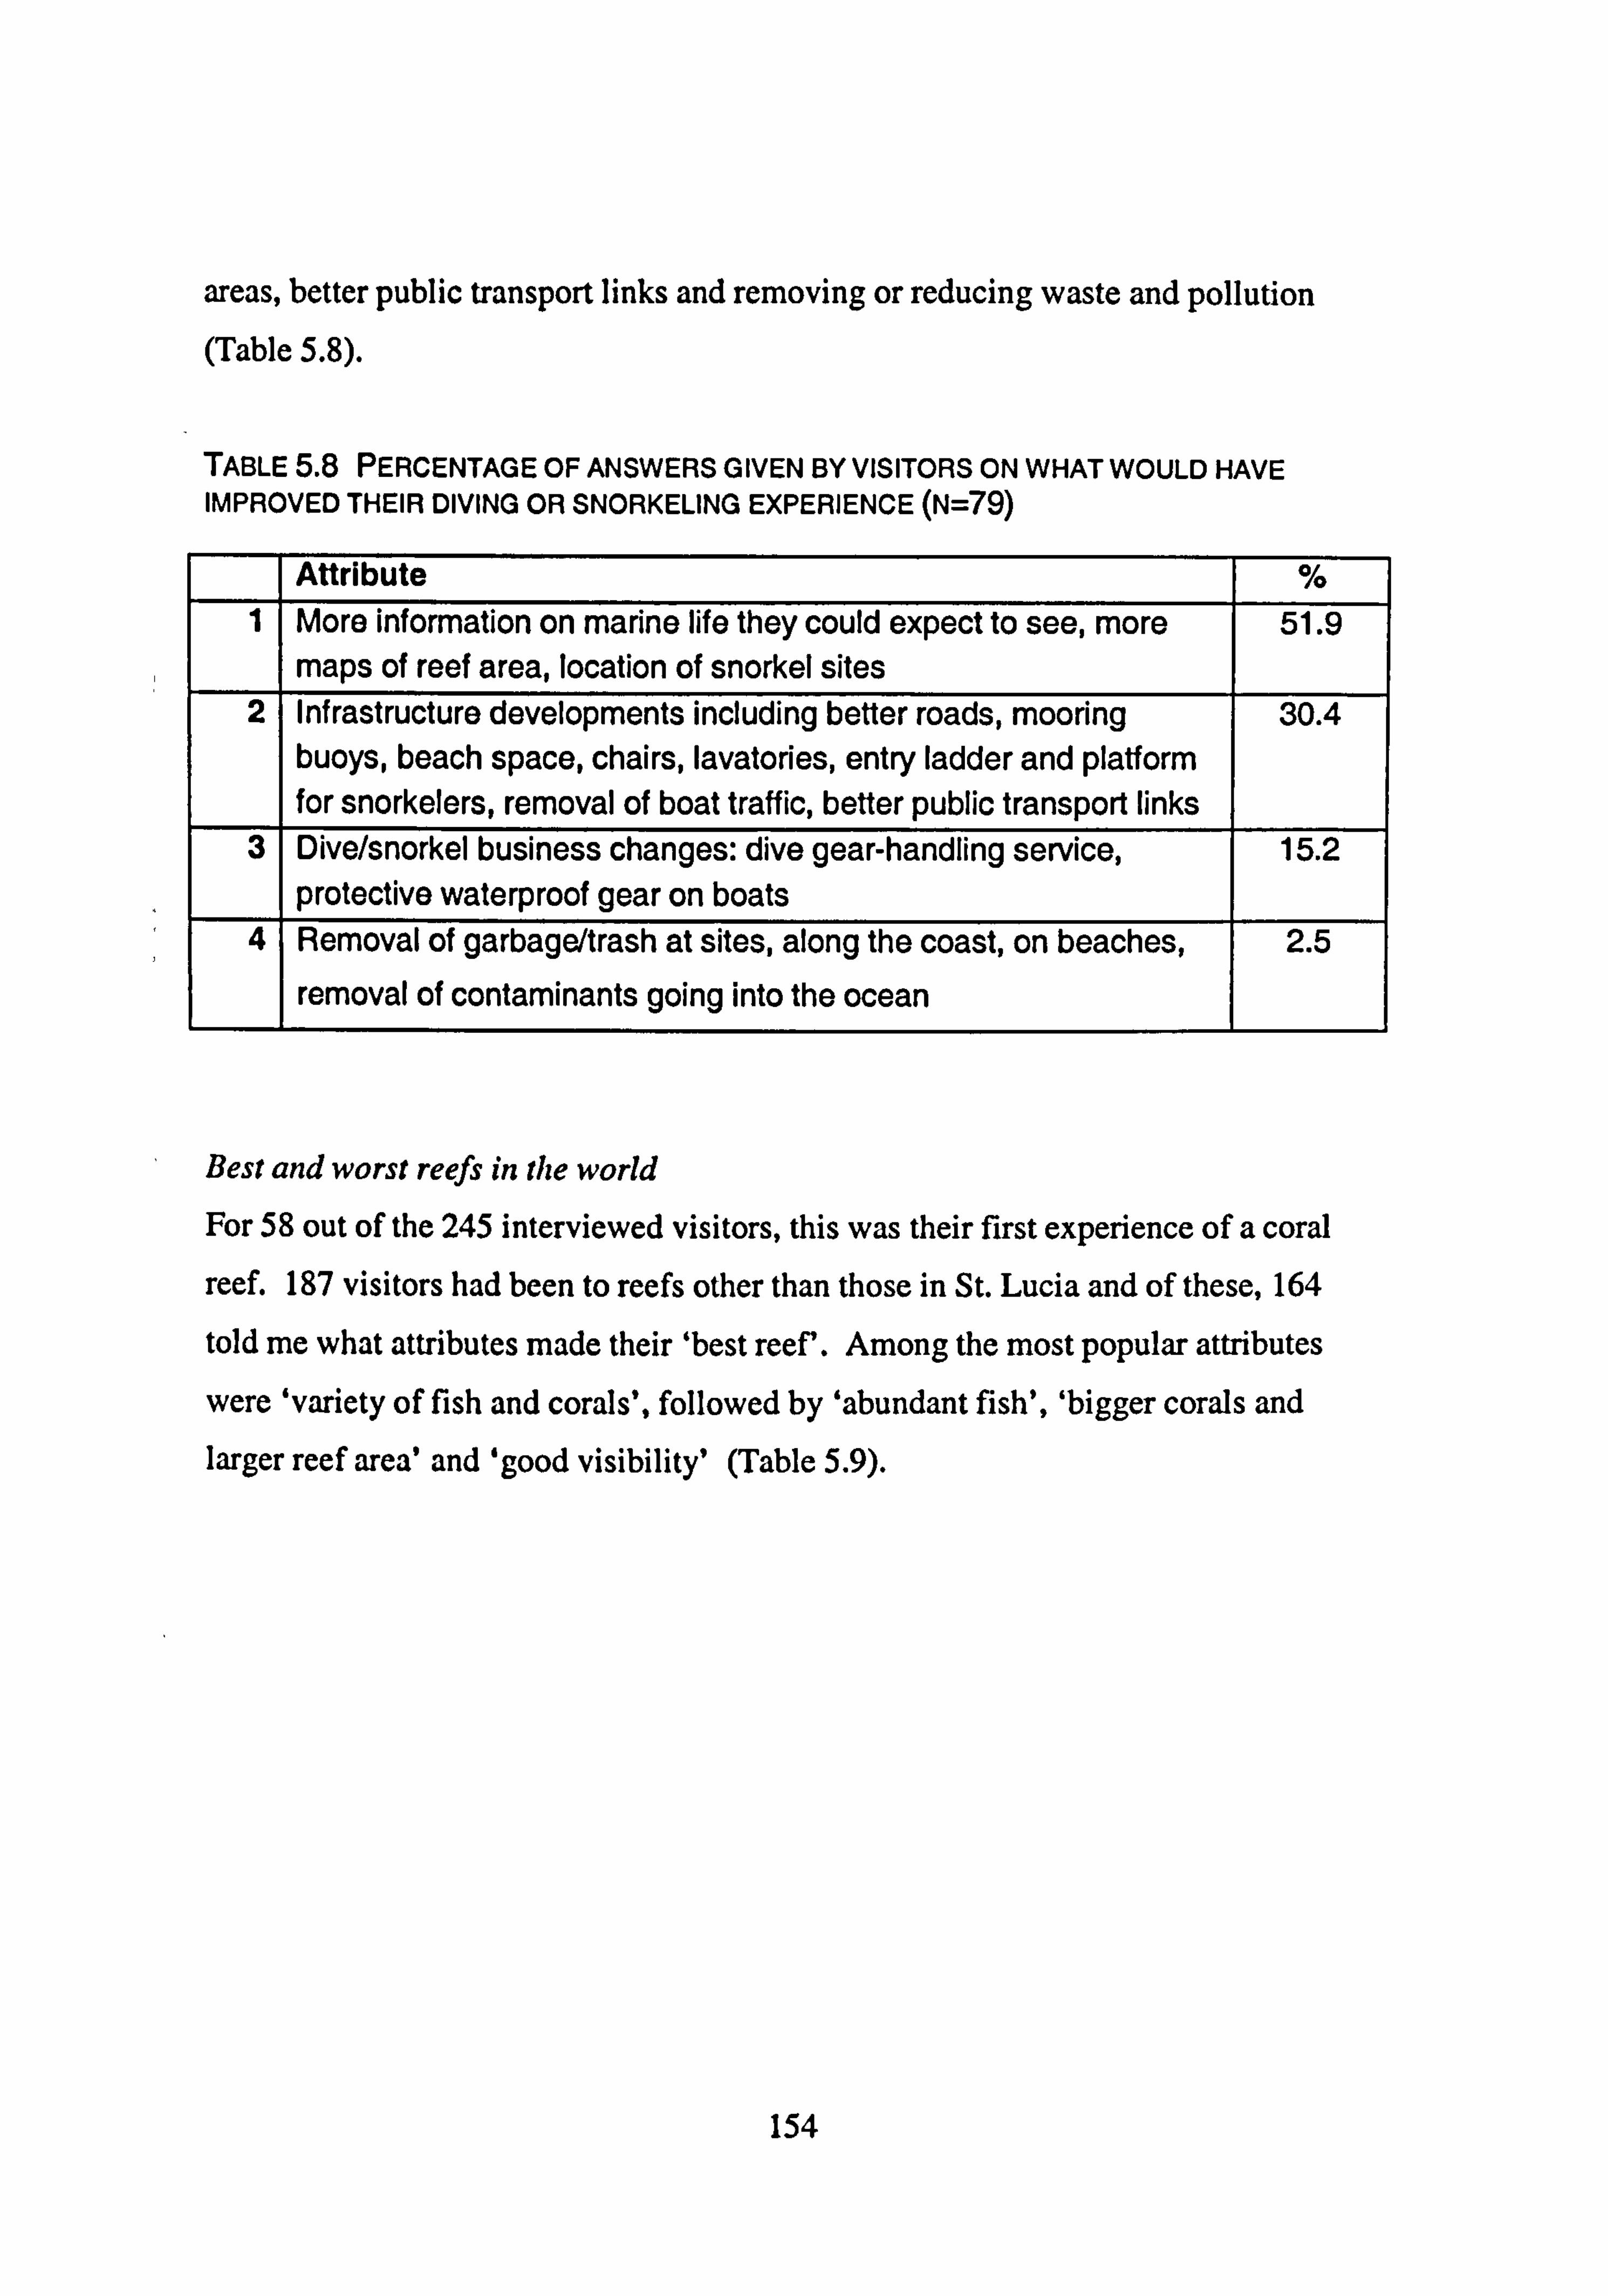
areas, better public transport links and removing or reducing waste and pollution (Table 5.8).
TABLE5.8 PERCENTAGE OF ANSWERS GIVEN BY VISITORS ON WHAT WOULD HAVE IMPROVED THEIR DIVING OR SNORKELING EXPERIENCE (N=79)
Attribute % 1 More information on marine life they could expect to see, more 51.9
maps of reef area, location of snorkel sites 2 Infrastructure developments including better roads, mooring 30.4
buoys, beach space, chairs, lavatories, entry ladder and platform for snorkelers, removal of boat traffic, better public transport links
3 Dive/snorkel business changes: dive gear-handling service, 15.2 protective waterproof gear on boats
4 Removal of garbage/trash at sites, along the coast, on beaches, 2.5
removal of contaminants going into the ocean
Best and worst reefs in the world For 58 out of the 245 interviewed visitors, this was their first experience of a coral
reef. 187 visitors had been to reefs other than those in St. Lucia and of these, 164
told me what attributes made their 'best reef. Among the most popular attributes
were 'variety of fish and corals', followed by 'abundant fish', 'bigger corals and larger reef area' and 'good visibility' (Table 5.9).
154
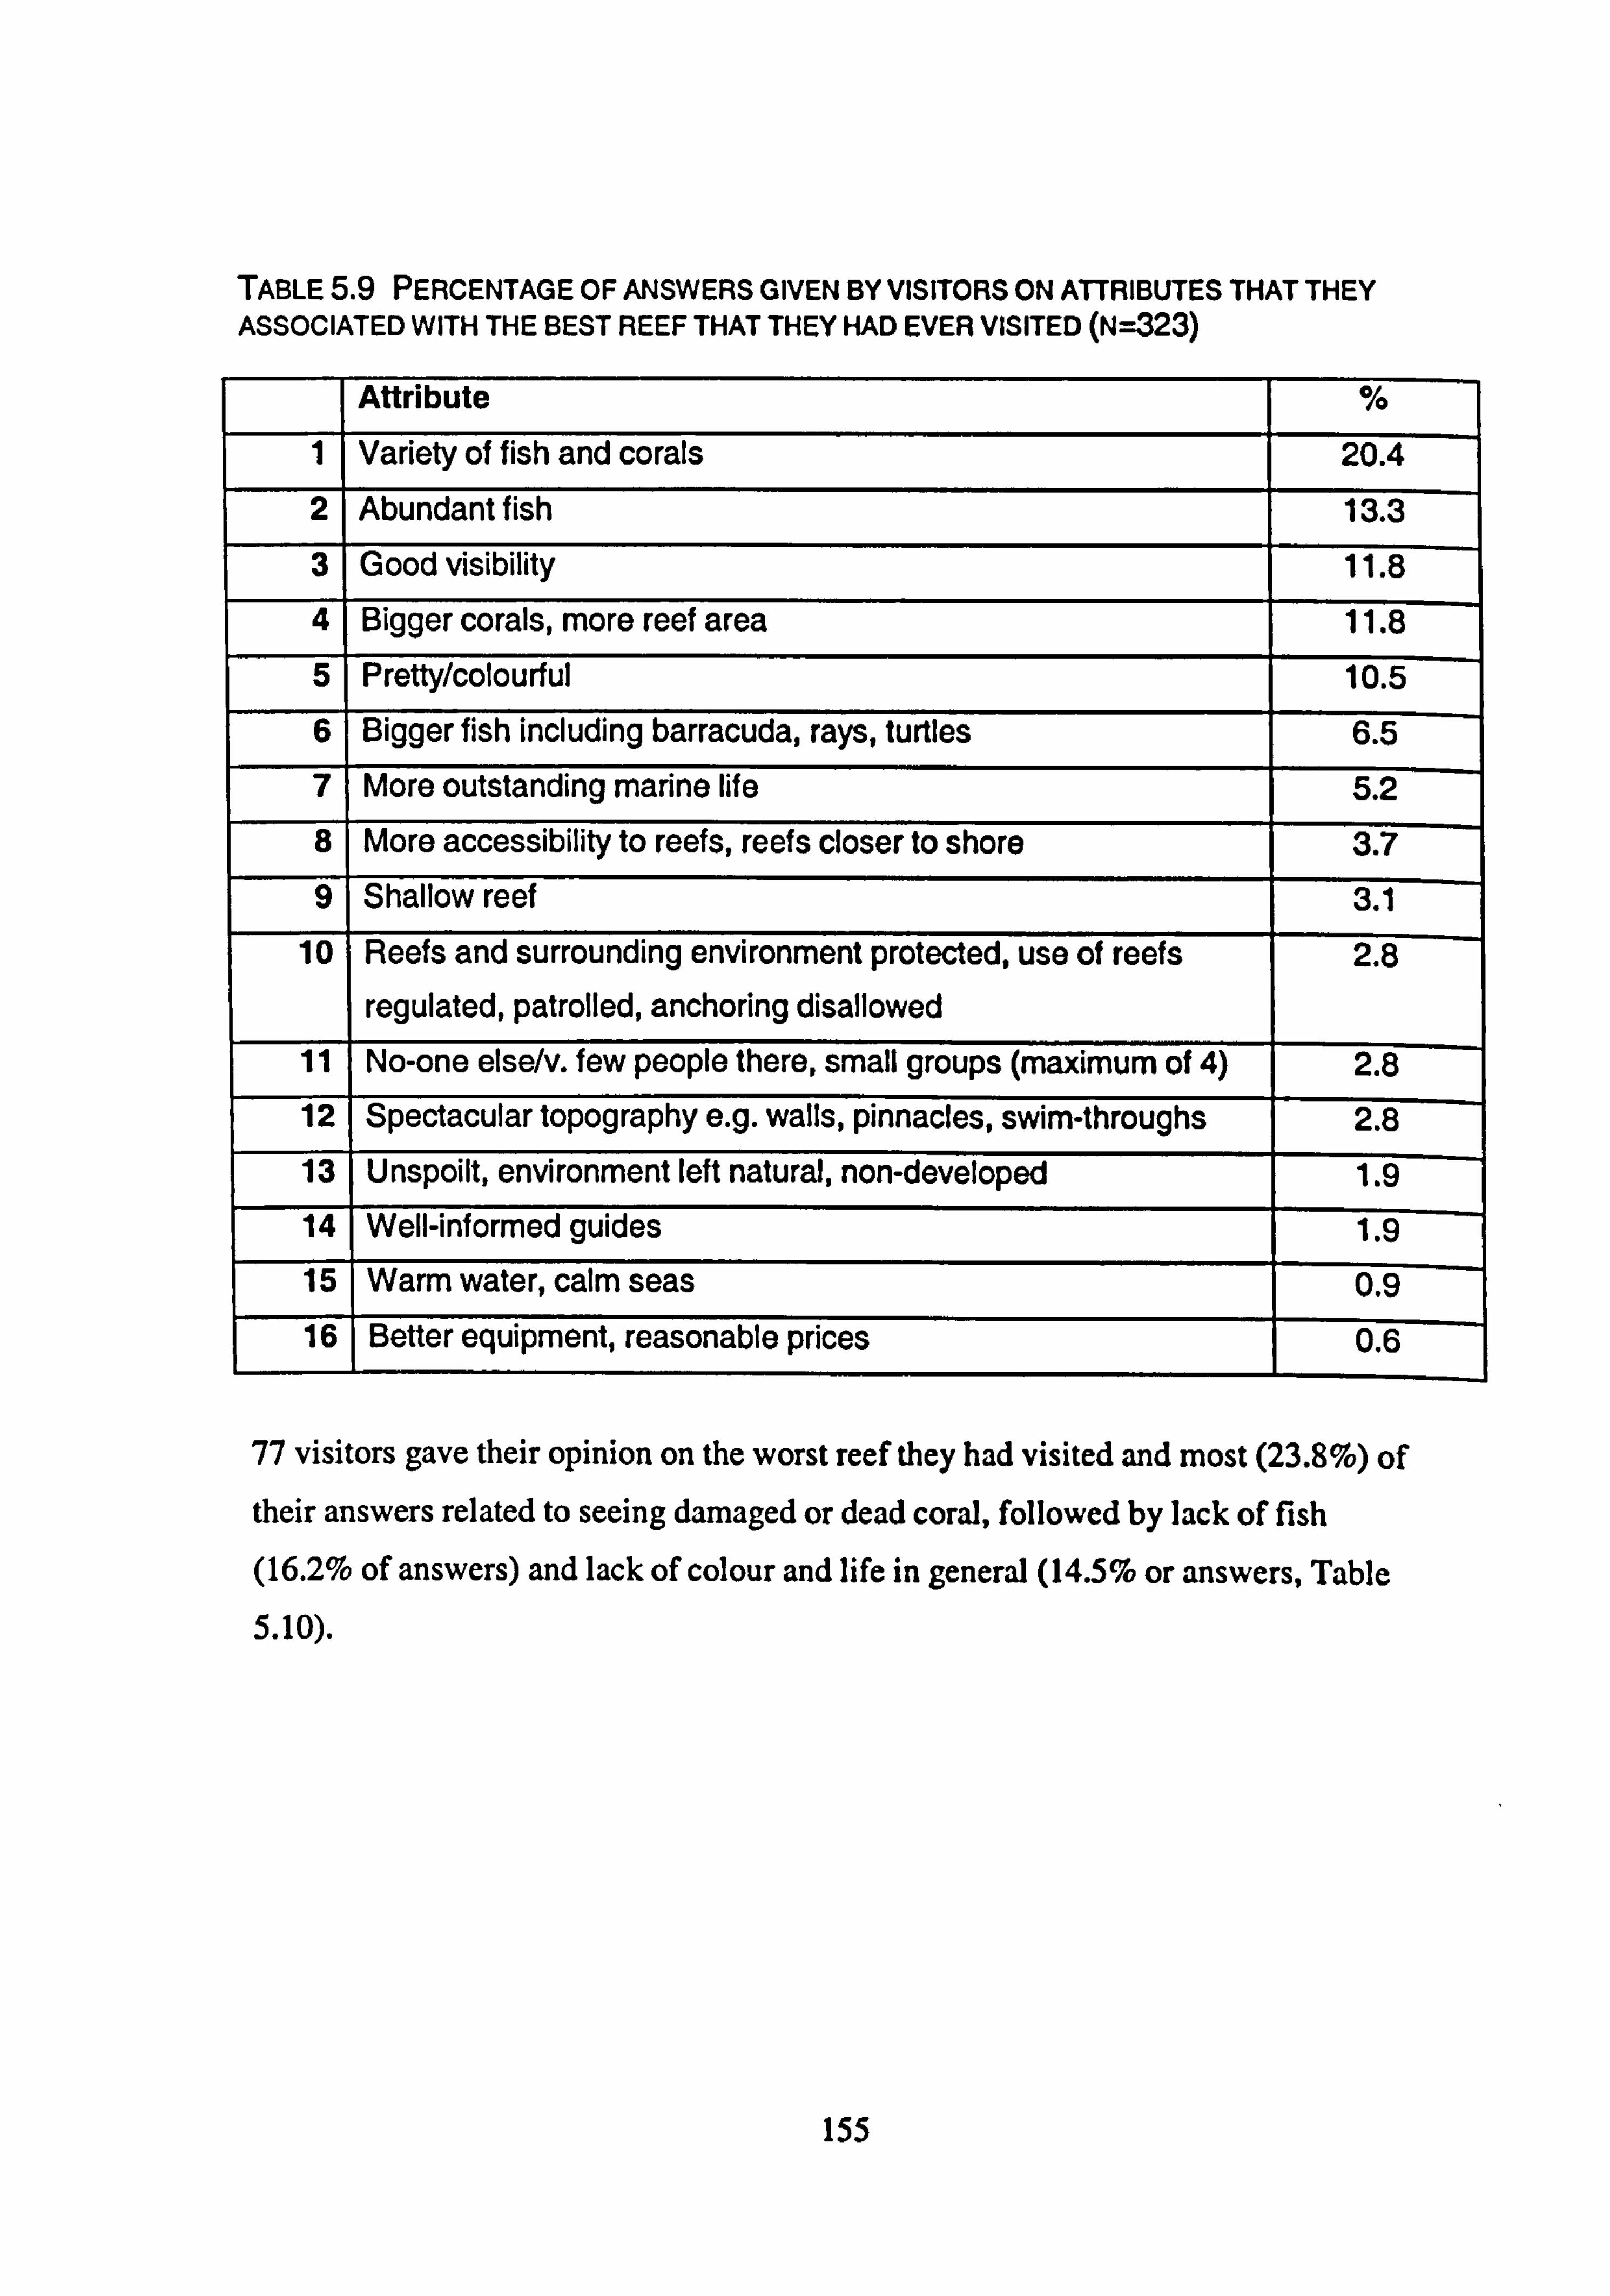
TABLE5.9 PERCENTAGE OF ANSWERS GIVEN BY VISITORS ON ATTRIBUTES THAT THEY ASSOCIATED WITH THE BEST REEF THAT THEY HAD EVER VISITED (N=323)
Attribute %
1 Variety of fish and corals 20.4
2 Abundantfish 13.3
31 Good visibility 11.8
4 Bigger corals, more reef area 11.8
5 Pretty/colourful 10.5
6 Bigger fish including barracuda, rays, turtles 6.5
71 More outstanding marine life 5.2 8 More accessibility to reefs, reefs closer to shore 3.7 9 Shallow reef 3.1
10 Reefs and surrounding environment protected, use of reefs regulated, patrolled, anchoring disallowed
2.8
11 No-one else/v. few people there, small groups (maximum of 4) 2.8 12 Spectacular topography e. g. walls, pinnacles, swim-throughs 2.8 13 Unspoilt, environment left natural, non-developed 1.9 14 1 Well-informed guides 1.9 15 Warm water, calm seas 0.9 16 Better equipment, reasonable prices 0.6
77 visitors gave their opinion on the worst reef they had visited and most (23.8%) of their answers related to seeing damaged or dead coral, followed by lack of fish
(16.2% of answers) and lack of colour and life in general (14.5% or answers, Table
5.10).
155
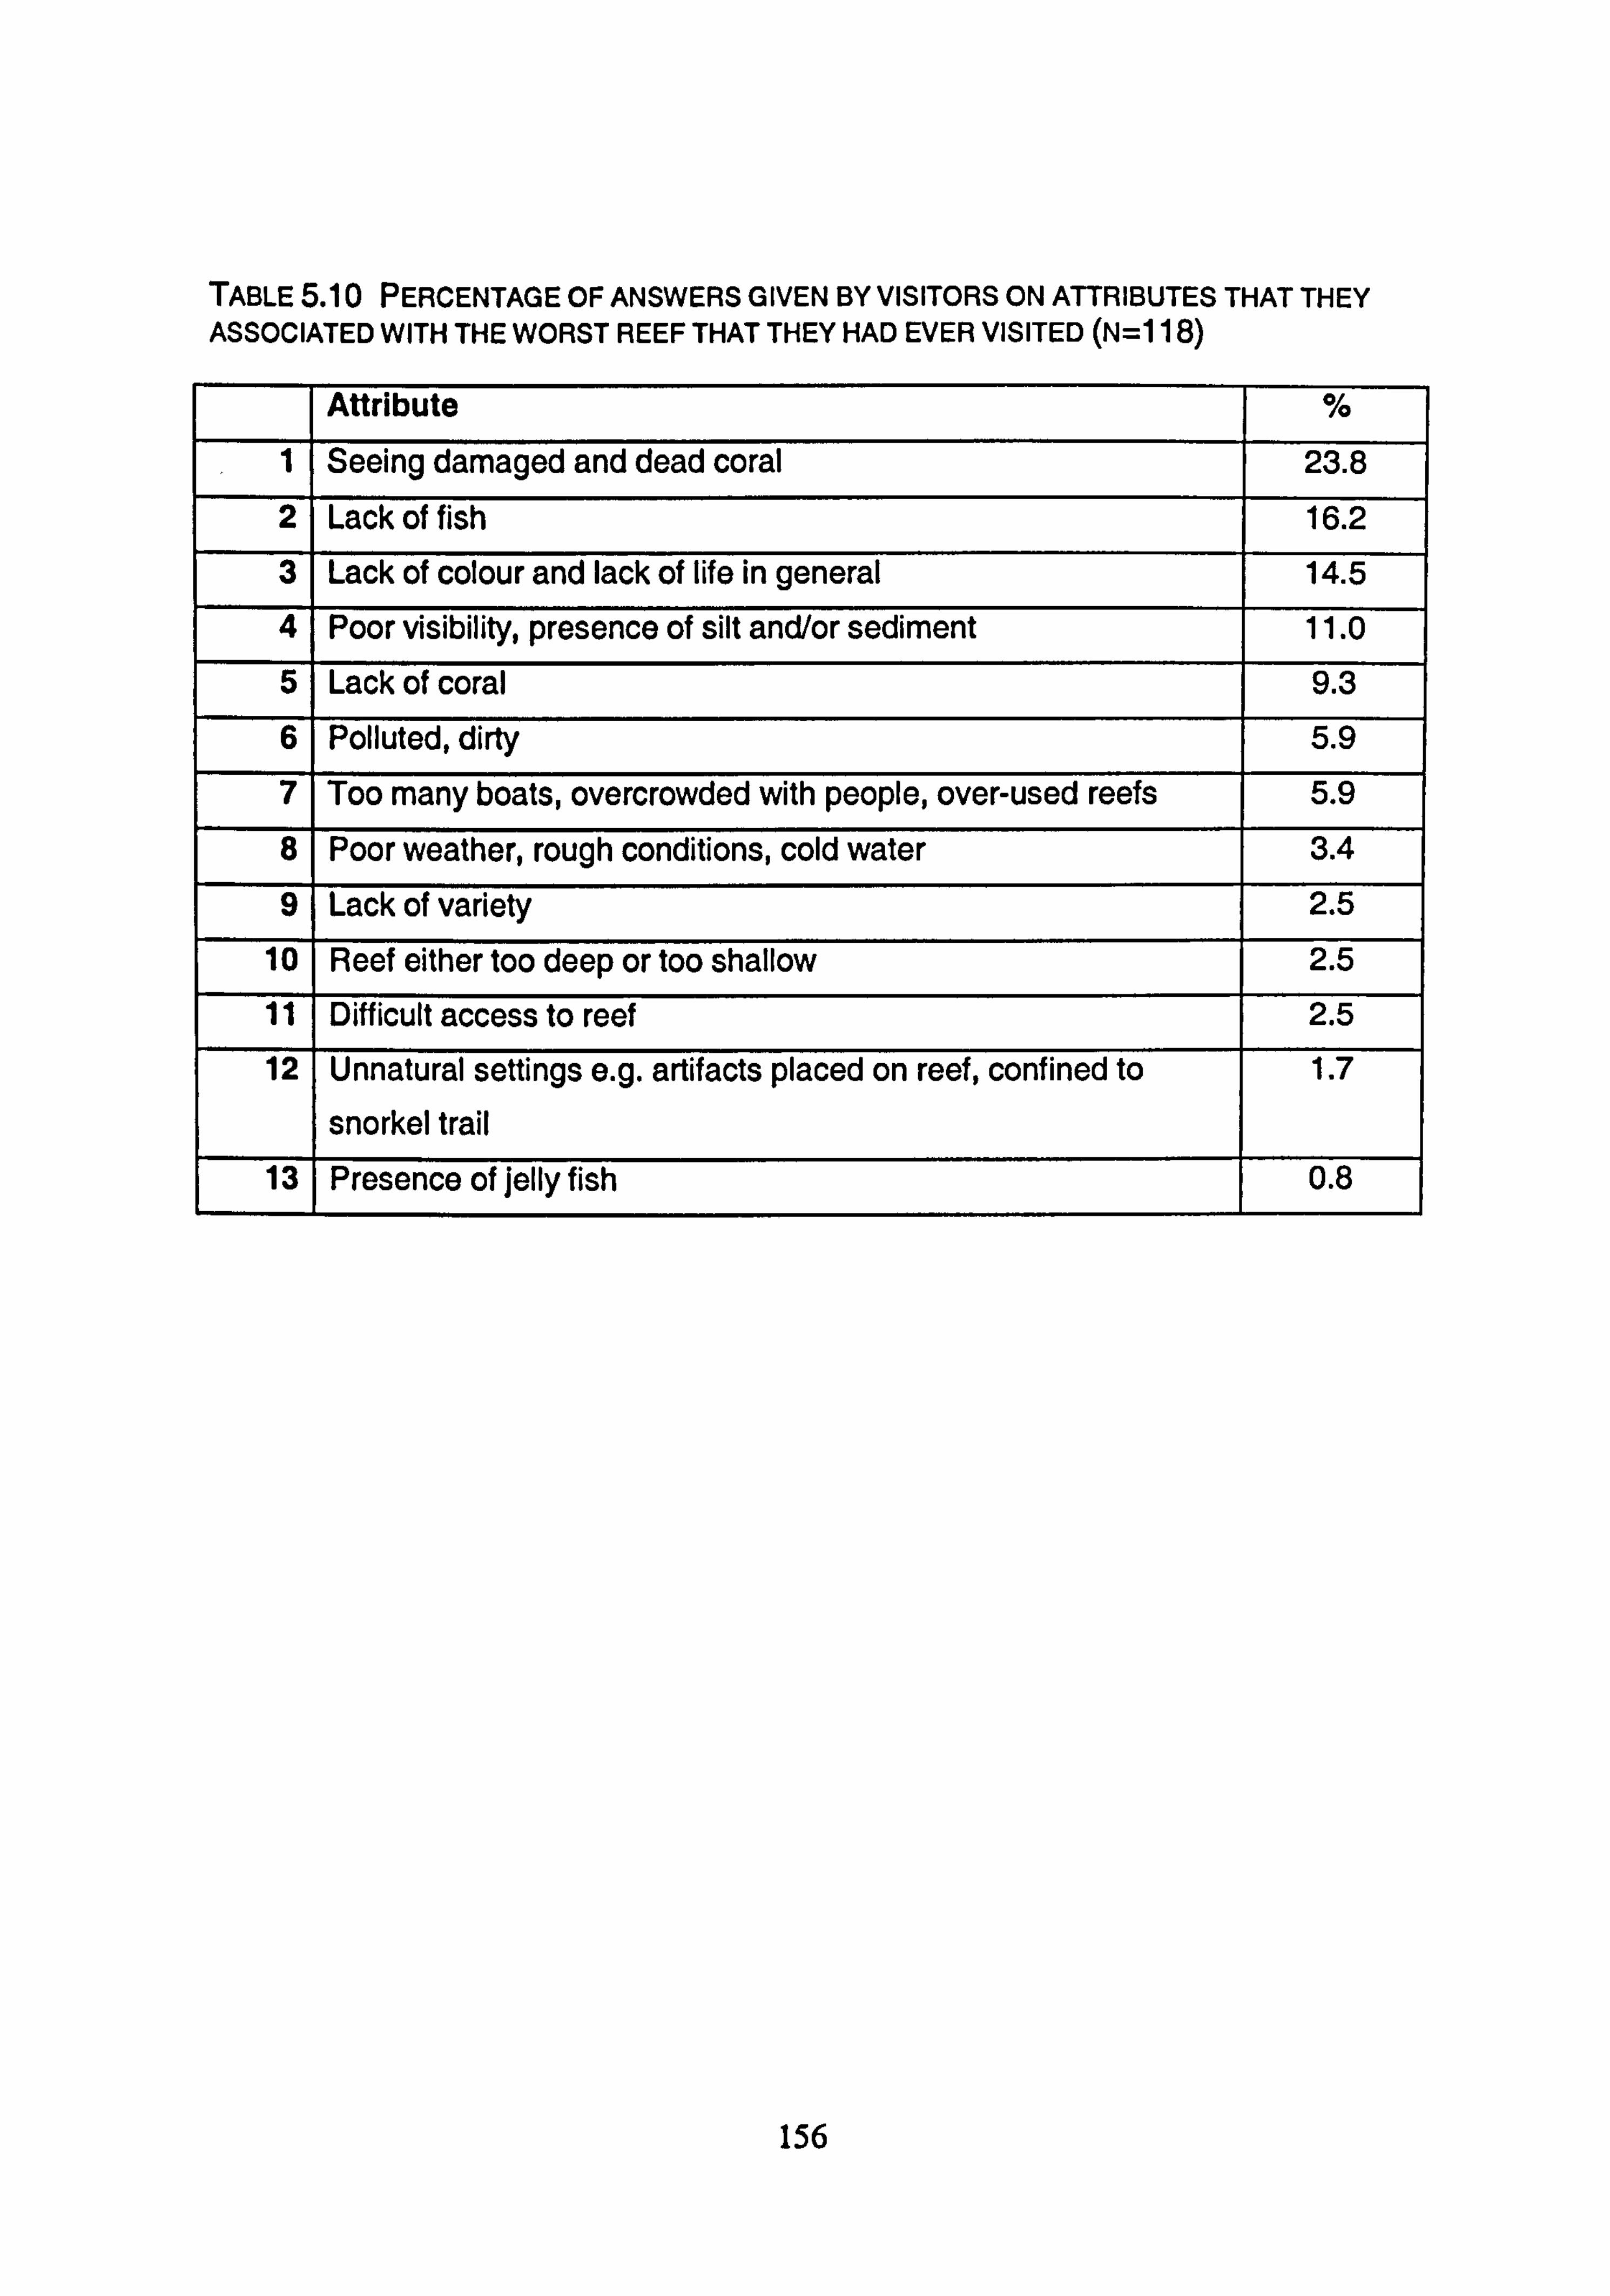
TABLE5.10 PERCENTAGE OF ANSWERS GIVEN BY VISITORS ON ATTRIBUTES THAT THEY ASSOCIATED WITH THE WORST REEF THAT THEY HAD EVER VISITED (N=l 18)
Attribute %
1 Seeing damaged and dead coral 23.8
2 Lack of fish 16.2
31 Lack of colour and lack of life in general 14.5
41 Poor visibility, presence of silt and/or sediment 11.0
5 Lack of coral 9.3
6 Polluted, dirty 5.9
7 Too many boats, overcrowded with people, over-used reefs 5.9
81 Poor weather, rough conditions, cold water 3.4
9 Lack of variety 2.5
10 Reef either too deep or too shallow 2.5
11 Difficult access to reef 2.5
12 Unnatural settings e. g. artifacts placed on reef, confined to
snorkel trail
1.7
13 Presence of jelly fish 0.8
156
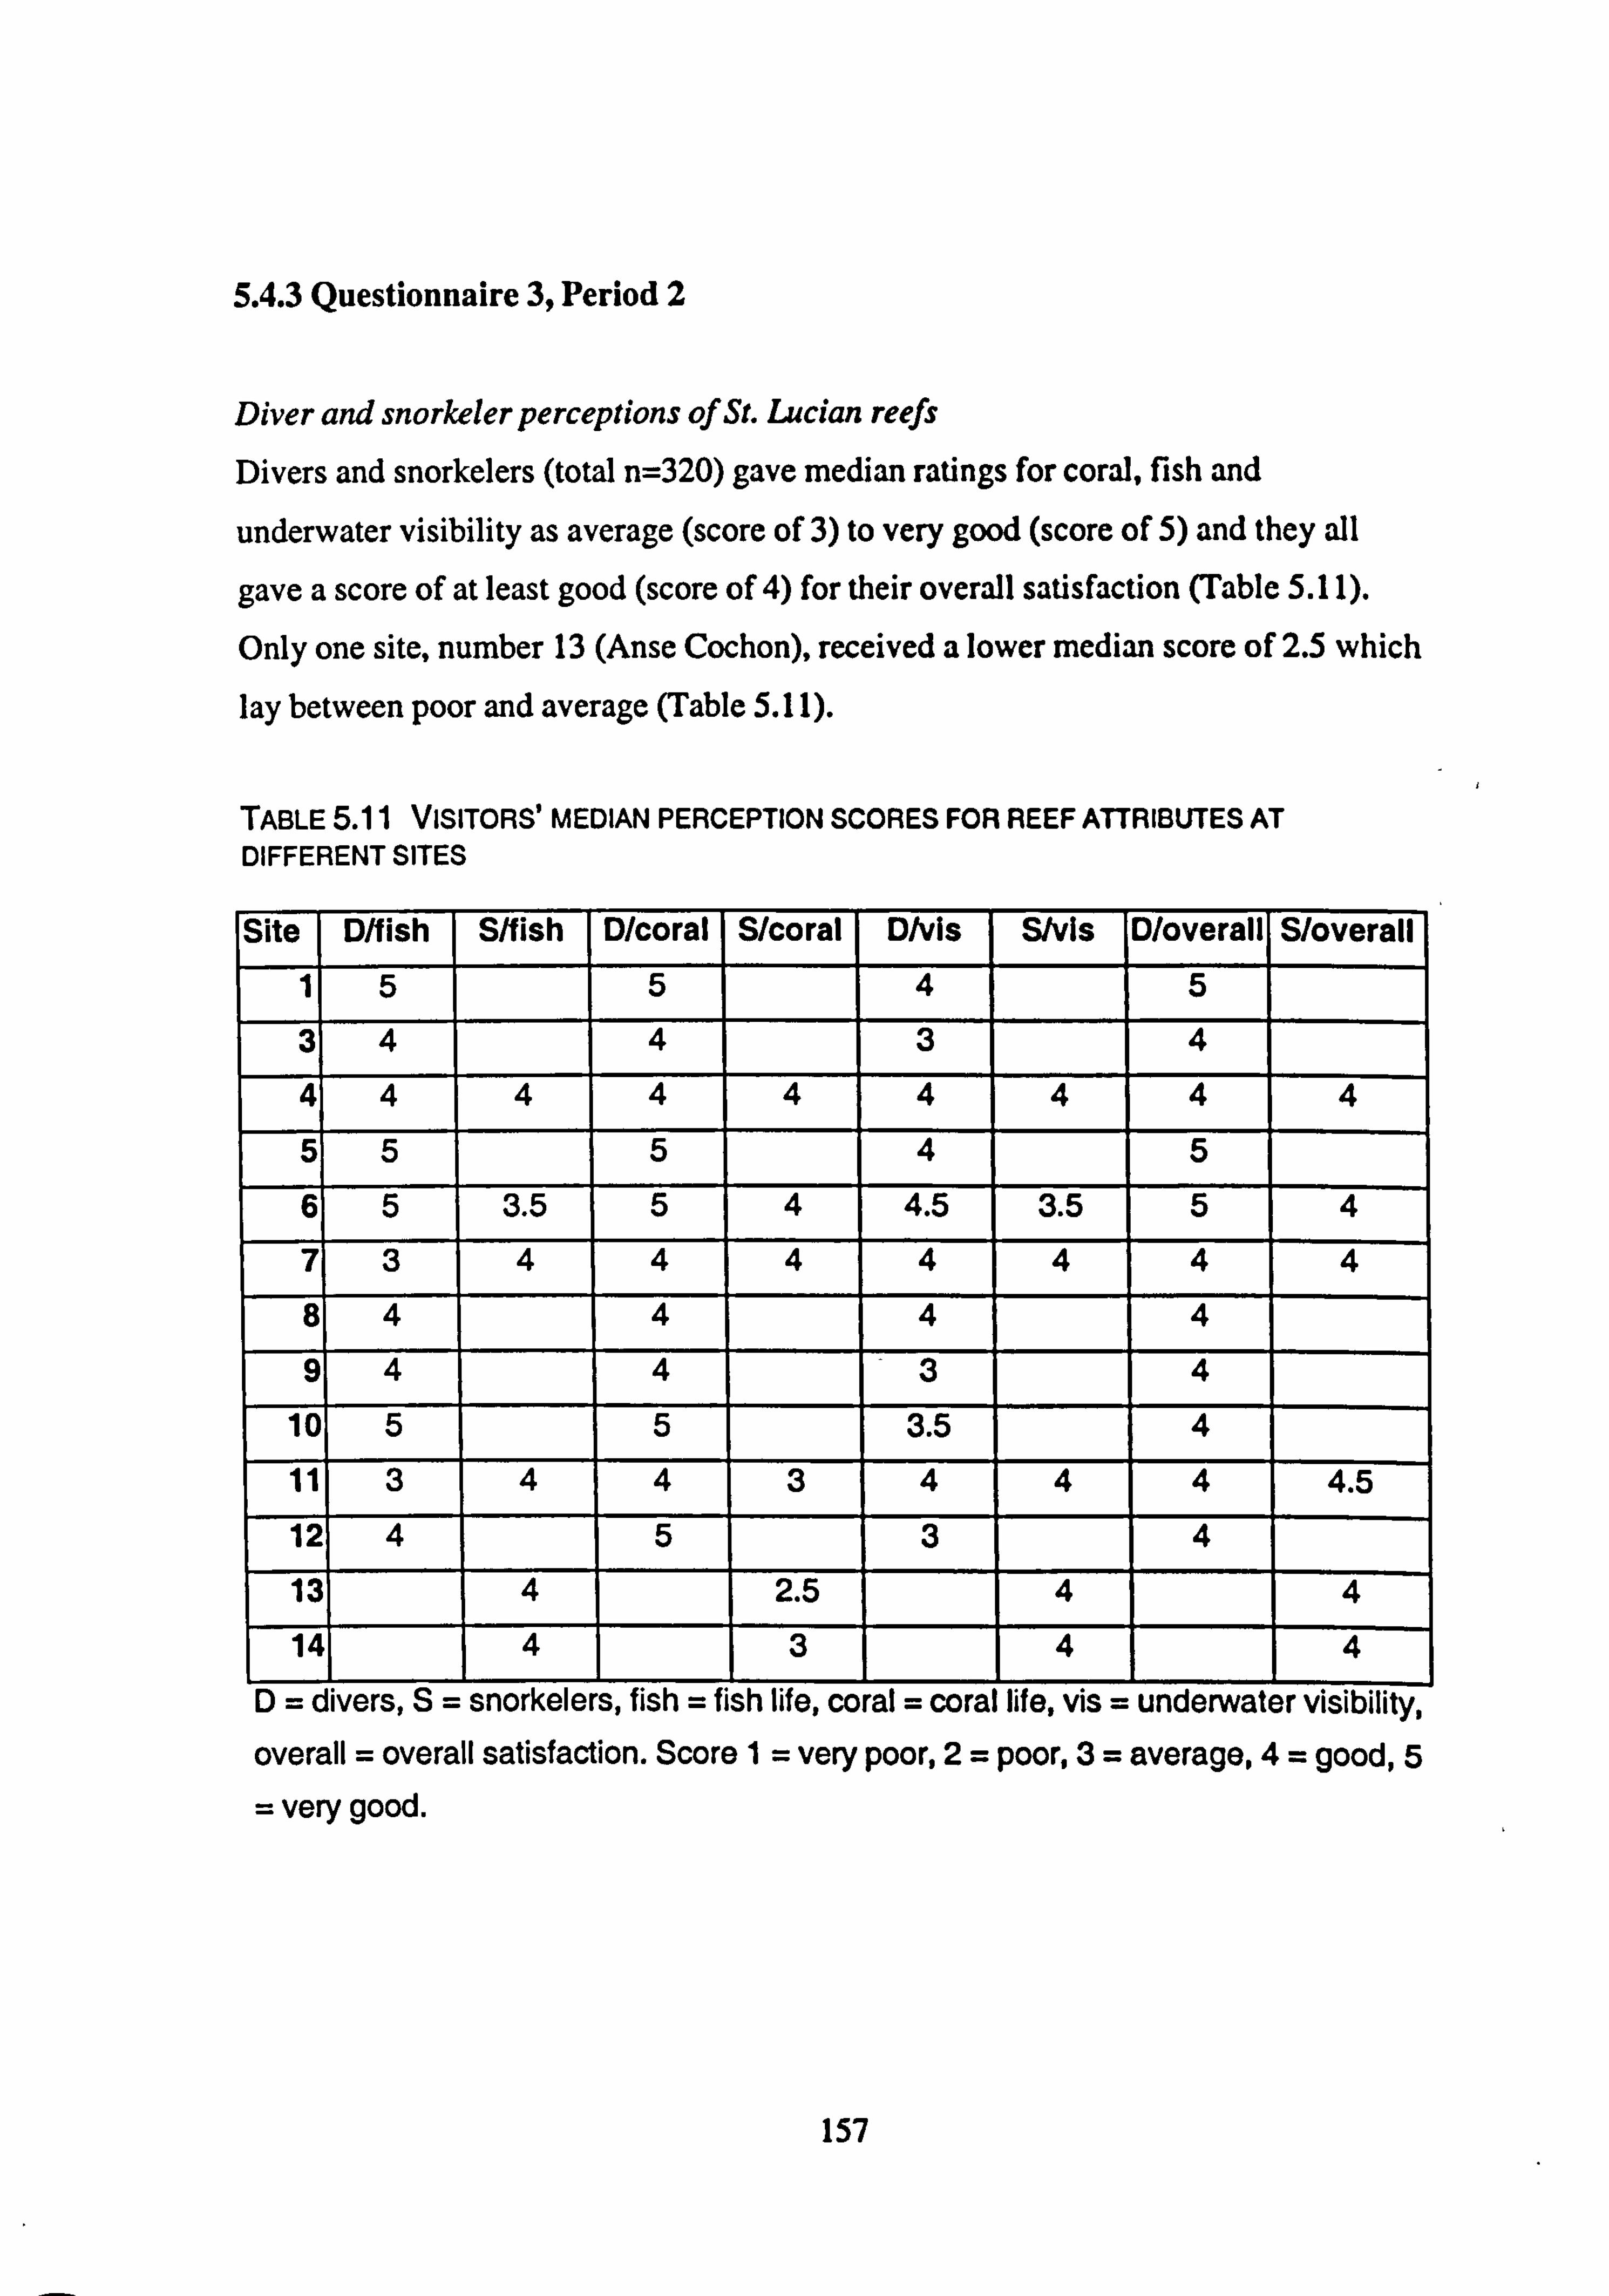
5.4.3 Questionnaire 3, Period 2
Diver and snorkeler perceptions of St. Lucian reefs
Divers and snorkelers (total n=320) gave median ratings for coral, fish and
underwater visibility as average (score of 3) to very good (score of 5) and they all
gave a score of at least good (score of 4) for their overall satisfaction (Table 5.11).
Only one site, number 13 (Anse Cochon), received a lower median score of 2.5 which lay between poor and average (Table 5.11).
TABLE5.11 VISITORS' MEDIAN PERCEPTION SCORES FOR REEF ATTRIBUTES AT DIFFERENT SITES
Site I D/f ish Stfish D/coral S/coral D/vis SMS D/overall S/overall
11 5 5 4 5
3 4 4 3 4
4 4 4 4 4 4 4 4 4
5 5 5 4 5
61 5 3.5 5 4 4.5 3.5 5 4
7 3 4 4 4 4 4 4 4
8 4 4 4 4
9 4 4 3 4
10 15 5 3.5 4
Il l3 4 4 3 4 4 4 4.5
12 14 5 3 4
13 4 2.5 4 4
14 4 3 4 4
D= divers, S= snorkelers, fish = fish life, coral = coral life, vis underwater visibility, overall = overall satisfaction. Score 1= very poor, 2= poor, 3 average, 4= good, 5
= very good.
157
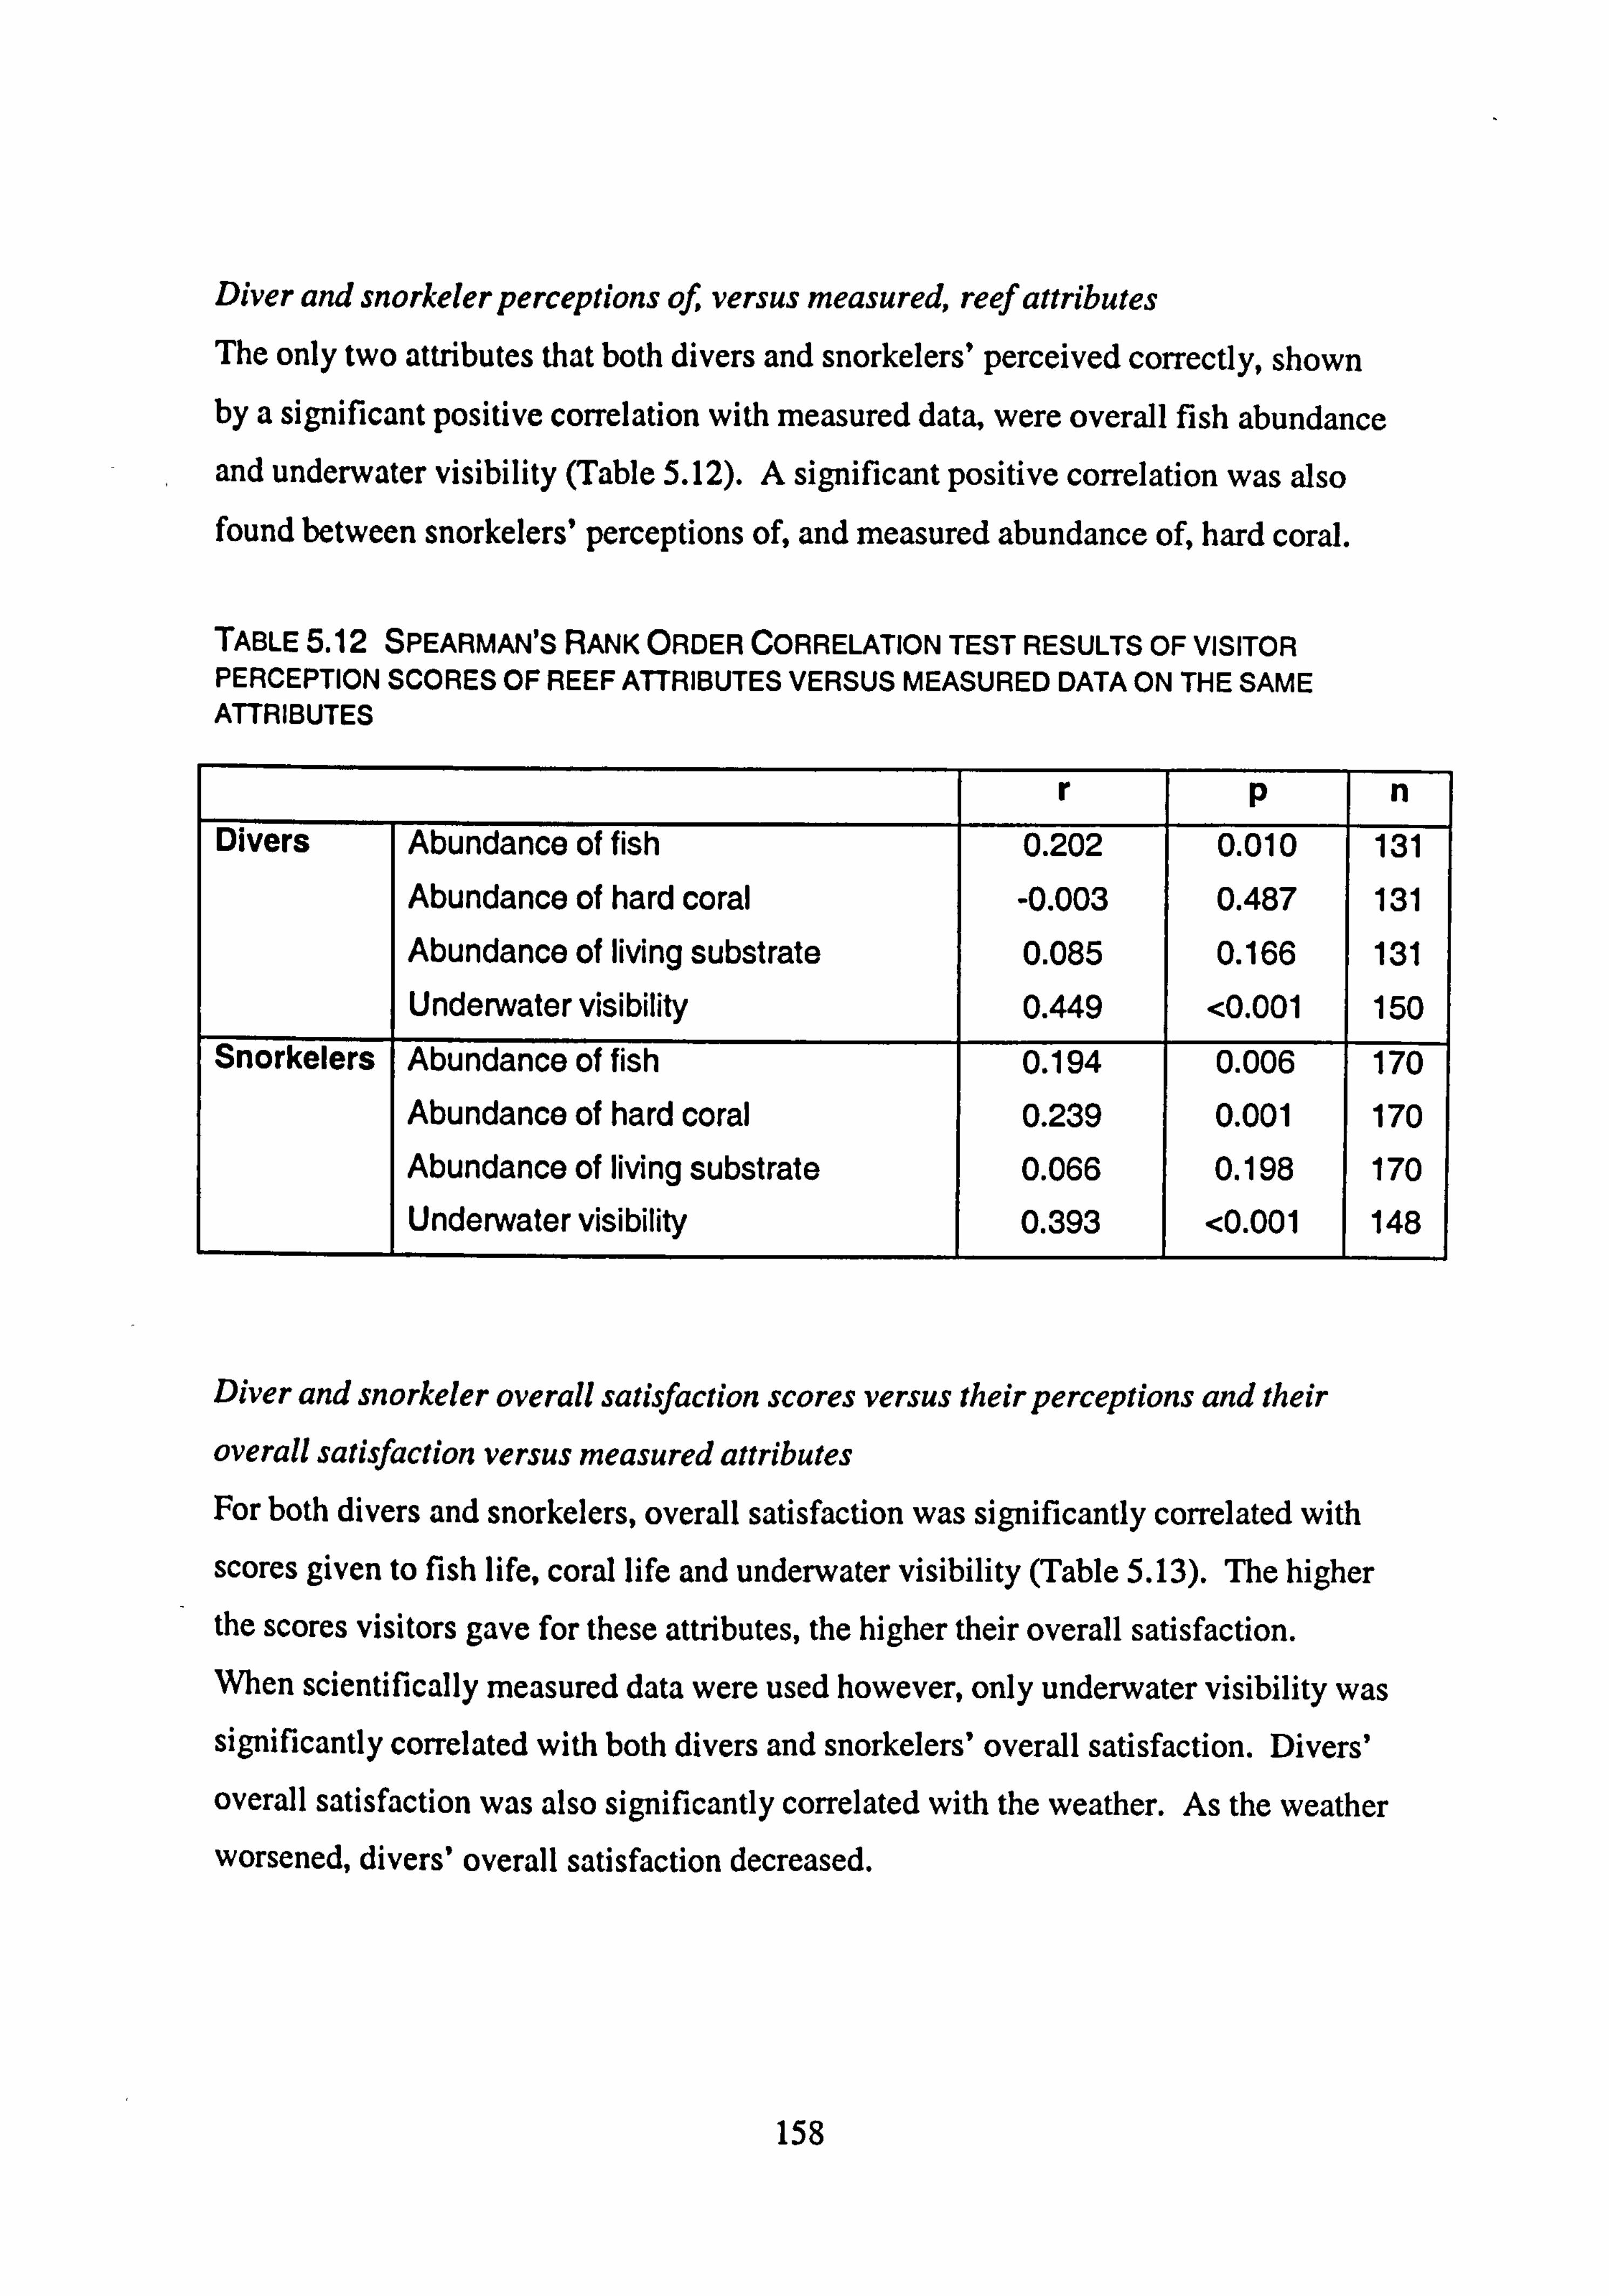
Diver and snorkeler perceptions of, versus measured, reef attributes The only two attributes that both divers and snorkelers' perceived correctly, shown by a significant positive correlation with measured data, were overall fish abundance and underwater visibility (Table 5.12). A significant positive correlation was also found between snorkelers' perceptions of, and measured abundance of, hard coral.
TABLE 5.12 SPEARMAN'S RANK ORDER CORRELATION TEST RESULTS OF VISITOR PERCEPTION SCORES OF REEF ATTRIBUTES VERSUS MEASURED DATA ON THE SAME ATTRIBUTES
r p n Divers Abundance of fish 0.202 0.010 131
Abundance of hard coral -0.003 0.487 131 Abundance of living substrate 0.085 0.166 131 Underwater visibility 0.449 <0.001 150
Snorkelers Abundance of fish 0.194 0.006 170 Abundance of hard coral 0.239 0.001 170 Abundance of living substrate 0.066 0.198 170 Underwater visibility 0.393 <0.001 148
Diver and snork-eler overall satisfaction scores versus their perceptions and their
overall satisfaction versus measured attributes For both divers and snorkelers, overall satisfaction was significantly correlated with scores given to fish life, coral life and underwater visibility (Table 5.13). The higher
the scores visitors gave for these attributes, the higher their overall satisfaction. When scientifically measured data were used however, only underwater visibility was significantly correlated with both divers and snorkelers' overall satisfaction. Divers'
overall satisfaction was also significantly correlated with the weather. As the weather worsened, divers' overall satisfaction decreased.
158
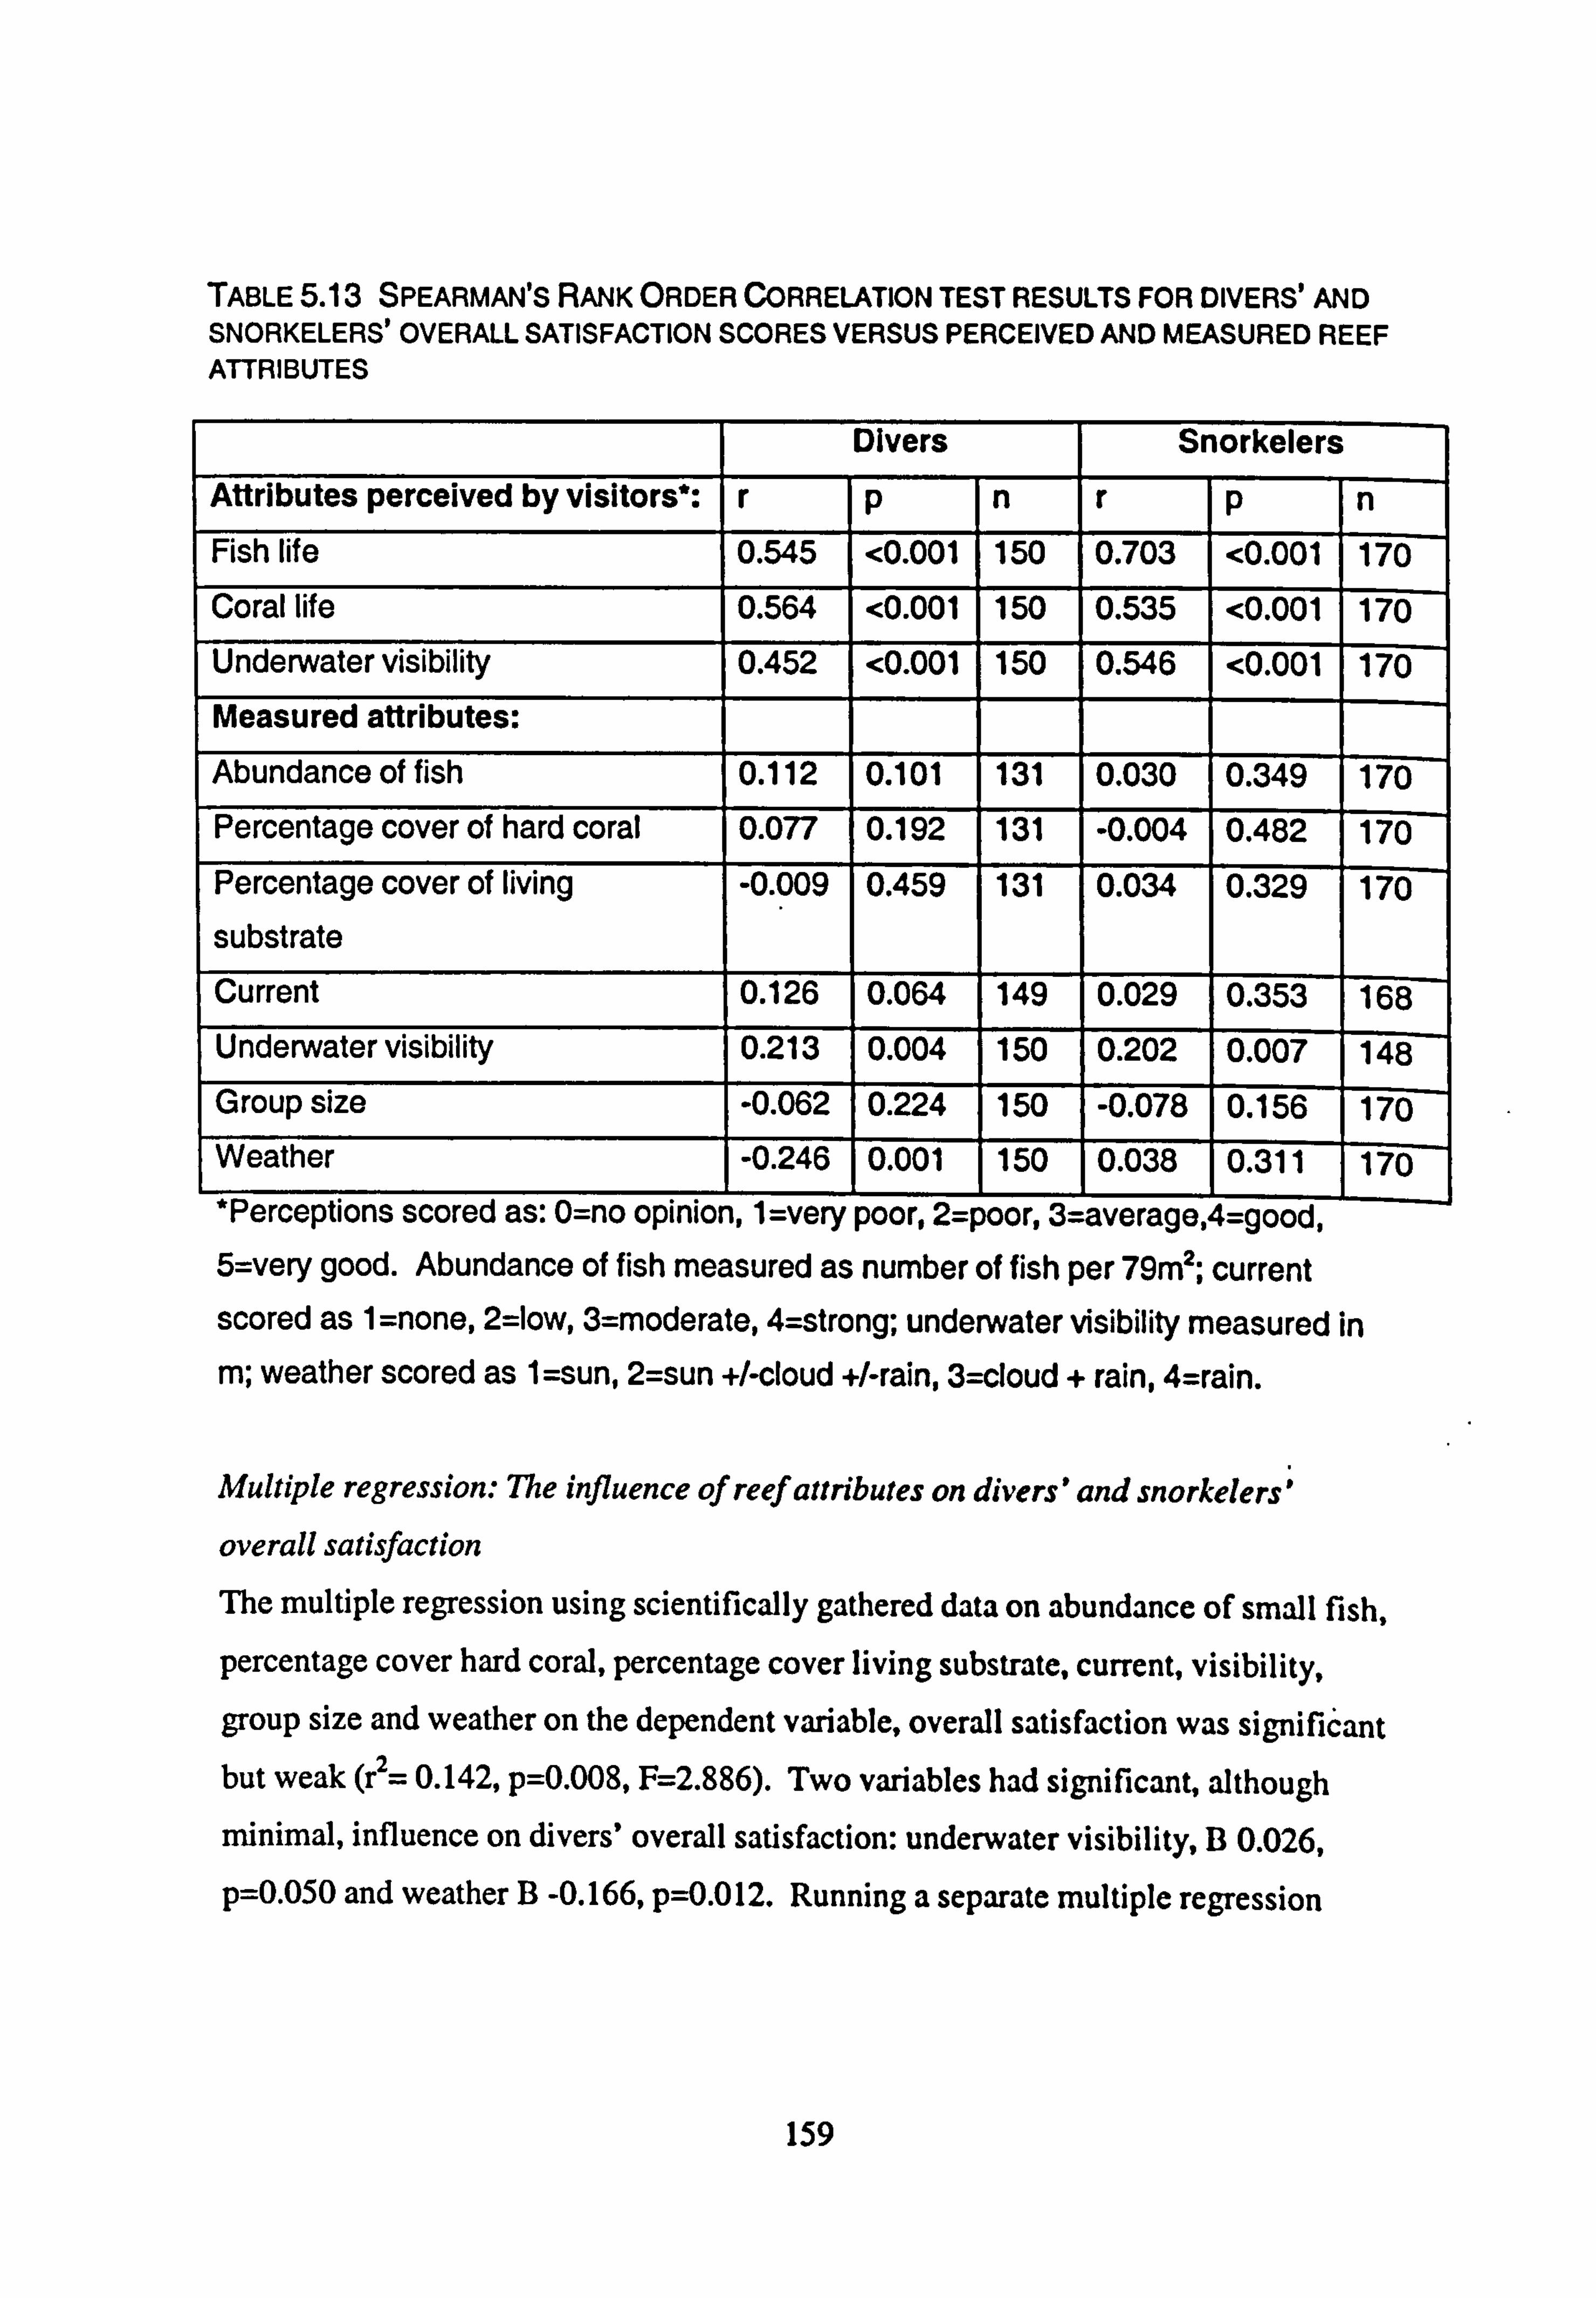
TABLE 5.13 SPEARMAN'S RANK ORDER CORRELATION TEST RESULTS FOR DIVERS'AND SNORKELERS' OVERALL SATISFACTION SCORES VERSUS PERCEIVED AND MEASURED REEF ATTRIBUTES
Divers Snorkelers
Attributes perceived by visitors*: r p n r P n Fish life 0.545 <0.001 150 0.703 <0.001 170 Coral life 0.564 <0.001 150 1 0.535 <0.001 170 Underwater visibility 0.452 <0.001 150 0.546 <0.001 170 Measured attributes: Abundance of fish 0.112 0.101 131 0.030 0.349 170 Percentage cover of hard coral 0.077 0.192 131 1 -0.004 0.482 170 Percentage cover of living
substrate -0.009 0.459 131 0.034 0.329 170
Current 0.126 0.064 149 0.029 0.355- 76-8
Underwater visibility 0.213 0.004 150 0.202 0.057- 14-8 Group size -0.062 0.224 150-] -0.078 0.156 170 Weather -0.246 10.001 150 1 -6.03 170 *Perceptions scored as: O=no opinion, 1 =very poor, 2=poor, 3=average, 4=good-, 5=very good. Abundance of fish measured as number of fish per 79M2; current scored as 1 =none, 2=low, 3=moderate, 4=strong; underwater visibility measured in
m; weather scored as 1 =sun, 2=sun +/-cloud +/-rain, 3=cloud + rain, 4=rain.
Multiple regression: The influence of reef attributes on divers' and snork-elers;
overall satisfaction The multiple regression using scientifically gathered data on abundance of small fish,
percentage cover hard coral, percentage cover living substrate, current, visibility,
group size and weather on the dependent variable, overall satisfaction was significant but weak (r2= 0.142, p=0.008, F=2.886). Two variables had significant, although
minimal, influence on divers' overall satisfaction: underwater visibility, B 0.026,
p=0.050 and weather B -0.166, p=0.012. Running a separate multiple regression
159
using the same independent variables against overall satisfaction was non-significant (r2= 0.052, p=0.37 1, F= 1.094).
MPA issues
When asked whether or not their decision to come to St. Lucia had been positively influenced by the existence of the marine park, 65 (38.2%) out of the 170 snorkelers
said that it had. 28 out of the remaining 105 snorkelers that said that the marine park hadn't influenced their decision specified that they did not know the marine park
existed prior to arriving on the island.
When divers were asked the same question, 75 (50.3%) out of 150 said that
the marine park had influenced them, and 74 said not. One person did not answer. Of the 75 that answered yes, 7 said that the marine park was the main or only reason for their visit. 17 of the 74 that said they did not know the park existed.
5.5 DISCUSSION
For most tourists, marine life and the quality of the environment are paramount to
their coral reef experience. They were central to tourists' motivations for diving and
snorkeling in St. Lucia, they directly affected their enjoyment of it and they
contributed to their best and worst experiences of reefs elsewhere in the world. Despite the quality of marine life being so important, tourists were not good at
distinguishing differences in fish abundance and diversity or abundance of living
coral among sites. What divers were able to correctly perceive was the lower
abundance of large (ý: 25cm) versus small (<25cm) fish, measures of underwater
visibility and levels of garbage. Tourists consistently regarded fish and coral life as the most important site
attributes and they dominated their answers about what had made a particular reef the best they had ever visited. Similar findings have been reported from elsewhere. A
160
study in Malaysia found that 'marine life', 'easy access and unlimited dives' and
$marine environment' contributed to 68.1 % of the best aspects of divers' experiences
(Musa, 2002). Another study in Spain reported that over 90% of divers' responses
included the 'rich marine life of area' among five principal reasons for choosing the
Medes Islands as a diving place (Mundet & Ribcra, 2001). In Australia, visitors to
the Great Barrier Reef thought visual beauty (scenic beauty and variety of fish and
coral) the most important element of their recreational experience (AGBMcNair,
1995). Similarly, Davis a al. (1997) reported on the Australian whale shark tourism
industry and noted that the three most important factors that increased visitors'
enjoyment were 'being close to nature', 'seeing large animals' and 'many different
types of marine life'. In Jamaica, divers preferred to see fish and other large animal
attributes rather than benthic life such as algae or coral (Williams & Polunin, 2000).
Despite the large emphasis that visitors put on the quality and quantity of
marine life this study shows that their perceptions do not always reflect reality. In
fact, visitors scored most sites highly for fish and coral attributes and their
perceptions of them met their expectations. Their perceptions, however, did not
correlate well with actual coral cover, live substrate cover, fish abundance and diversity and sediment load at the various sites. Fish abundance, for example, varied by an order of magnitude across some sites and yet divers' perceptions varied little.
It may be that the scientifically gathered data differed from conditions present on the
day visitors dived or snorkeled a particular site, but it is more likely that as long as a
certain number of fish were present, visitors were satisfied. Some visitors said that they were not aware of any sediment even though at
some sites it was widespread. In those cases, it appeared that visitors did not notice
or look for sediment because their attention was focused on the fish and invertebrates.
Another point is that the tourists interviewed in this study were not exposed to the full
range of sites in existence in St. Lucia. Certain sites were excluded from dive
companies' itineraries because they were already heavily impacted by sediment, poor
visibility or were less aesthetically pleasing. Had visitors gone to those sites with
161
heavy sediment loads leading to poor visibility, reduced coral cover and marine life,
the relationships between their perceptions and scientifically measured attributes may have been more pronounced.
Divers' perceptions of coral damage, sediment, trash and crowding in St.
Lucia affected the quality of their experience. The more coral damage, sediment and trash they saw, the less they enjoyed their dive. A study of divers in Costa Rica
showed that 24.8% considered the quality of the sites to be bad and noted 'broken
coral colonies', 'strong currents and poor visibility' and the relatively 'low abundance
of big fish' among their main reasons for their answer (Jim6nez, 1997). In my study,
visitors' enjoyment was significantly reduced the bigger the group of people
participating in the activity and differed between divers and snorkelers. The number
of participants which divers reported as being too many (median of 9) was much lower than that for snorkelers (median of 20). Crowding has been reported by many to be of concern to visitors interviewed, including resorts in Spain (Mundet & Ribera,
2001), Malaysia (Musa, 2002) and the Caribbean (Rudd & Tupper, 2002). The
Caribbean study indicated that older divers (more than 30 years old) would be willing to pay US$ 10 more per dive than younger divers to dive in a small groups of 3-7
divers than in groups of 8-14 divers. In Australia, experienced scuba divers preferred fewer people and less infrastructure whilst novices with little experience of diving or
snorkeling regarded the presence of other people and infrastructure as more
acceptable (Inglis et al. 1999).
Many visitors in my first sample period (51.9%) wanted more information on the marine life they were likely to see and on sites to visit and this was the most
popular request from visitors on what would have improved their diving or snorkeling
experience. The request for additional tourist information and interpretative facilities
has been reported by others in Spain and Malaysia (Mundet & Ribera, 2001; Musa,
2002). Businesses could disseminate more information on the local marine life,
whether through their dive and snorkel briefings or by putting up notice-boards,
162
leaflets, posters or selling species' identification cards and posters. This would likely
increase visitors' enjoyment and feed back into businesses' profits. Marine parks are a major attraction: 50.3% of divers and 38.2% of snorkelers interviewed said that the existence of the park had influenced their decision to visit St. Lucia. A few visitors (2.8% of answers) associated protection of the environment by regulations and enforcement with their most-enjoyed and best reef experiences (2.8% of answers). Evidence of active policing of the marine park and removal of
garbage were attributes that would have improved the diving and snorkeling for
visitors in St. Lucia (3% of answers combining questionnaires I and 2). A study on the Great Barrier Reef in Australia (AGBMcNair, 1994) showed that visitors
expressed a strong desire to preserve the reef from damage, both from tourists
themselves and pollution, to ensure future visitors would be able to share their
enjoyment of its beauty. With such management, destinations can both attract and satisfy visitor expectations and enjoyment. Countries relying on reef tourism could benefit greatly from setting up marine parks and ensuring that pollution problems are addressed.
Marine parks allow fish stocks to recover from fishing pressure leading to
more and older, thus larger, fish (e. g. Roberts & Polunin 1991,1993; Attwood 1994; Bohnsack, 1998; Halpern & Warner 2002; Gell & Roberts, 2003). In the Leigh Marine Reserve in New Zealand, twenty years or so after fishing was banned, densities of fishable sized bream, Pagrus auratus, reached 5.8-8.7 times higher in the
reserve compared to fished areas nearby (Babcock et al. 1999). In the Apo Island
reserve in the Philippines, densities of large predatory reef fish increased 7-fold after 11 years of protection (Russ & Alcala, 1996). Five years after the inception of St. Lucia's marine managed area where four areas were designated 'no-take' zones, commercial fish biomass increased four fold inside the marine reserves and three fold in adjacent fishing grounds. Catches by artisanal fishers increased by between 46%
and 90%, depending on the type of gear the fishers used (Gell & Roberts, 2003).
163
Visitors in this study perceived the much lower abundance of large versus
small fish. Although fishing in eight of the dived sites in the SMMA has been
prohibited since 1995, fish stocks are still recovering after severe over exploitation
that occurred prior to the inception of the park. St. Lucia's reefs have typically few
large fish and a greater number of small fish. The length of time required for a fish
population to recover after exploitation varies with the species according to their
longevity (Roberts et al. 2001). In the Merritt Island National Wildlife Refuge at Cape Canaveral, Florida, fish originating from the reserve that supplied adjacent
areas as trophy fish began exceeding the size of trophy fish caught elsewhere after 9
years for spotted sea trout (longevity 15 years), 27 years for red drum (longevity 35
years), and 31 years for black drum (longevity 35 years) (Roberts et al. 2001). Fish
in the SMMA therefore probably need longer than they have been given so far in
order to attain larger sizes. 'Bigger fish' and 'more fish' were the two most popular
attributes suggested that would have improved visitors' diving experience in St.
Lucia. MPAs could therefore serve to both replenish and enhance fish stocks both
within and adjacent to 'no-take' areas as has been shown in St. Lucia (Roberts et al, 2001), and improve visitor experiences within the park.
A study in another part of the Caribbean, the Turks and Caicos Islands,
showed that an increase in Nassau grouper abundance and/or mean size would add
value to the dive experience because most divers held preferences for viewing more fish and larger fish (Rudd & Tupper, 2002) and would be willing to pay more for
small group dives when big fish were present. This study suggests that in many cases, as long as reefs are not visibly
damaged, and support plentiful fish life, they will be adequate to satisfy most visitors. Visitors cannot be relied on to identify more subtle differences in natural resource
attributes that were measured in this study. However, quality does matter, illustrated
by the fact that St. Lucia dive businesses already avoided certain sites because of degradation. Visitors are particularly sensitive to coral damage, underwater visibility,
garbage and crowding. It is therefore in businesses' and countries' interests to
164
manage their reefs and land practices that negatively affect the marine environment. People will pay more for higher quality sites, small groups and to see bigger fish, and demand good water clarity. Today the easy accessibility to information means
reputations, whether good or bad, have the potential to travel far. To ensure
sustainability of reef tourism, the quality of reef resources must be maintained.
5.6 REFERENCES
Acevedo, R. J. & J. Morelock. 1988. Effects of terrigenous sediment on coral reef zonation in South-Westem Puerto Rico. Sixth International Coral Reef Symposium, Townsville, Australia, pp. 189-194.
AGBMcNair. 1994. Report of Scoping Study on Community Attitudes Towards Wilderness-Based Recreation on the Great Barrier Reef Volme 2: Design of Measurement Approach. Report prepared for the Great Barrier Reef Marine Park Authority. pp. 1-10.
AGB McNair. 1995. Recreation Use and Management Issuesfor the Great Barrier Reef Marine Park, National Survey of Community Attitudes 1995. Report prepared for the Great Barrier Reef Marine Park Authority. pp. 1-7 1.
Attwood, C. G. & B. A. Bennett. 1994. Variation in dispersal of GaIjocn (Coracinus capensis) (Teleostei: Coracinidae) from a marine reserve. Canadian Journal of Fisheries and Aquatic Science 51: 1247-1257.
Ayala, H. 1996. Resort ecotourism: A paradigm for the 21"' century. 7he Cornell Hotel and Restaurant Administration Quarterly 37: 54-6 1.
Babcock, R. C., Kelly, S., Shears, N. T., Walker, J. W. & TJ. Willis. 1999. Changes in community structure in temperate marine reserves. Marine Ecology Progress Series 189: 125-134.
Bhat, M. B. 2003. Application of non-market valuation to the Florida Keys marine reserve management. Journal of Environmental Management 67: 315-325.
Bohnsak, J. A. & S. P. Bannerot. 1986. A Stationary Visual Census Techniquefor Quantitatively Assessing Community Structures of Coral Reef Fishes. National Oceanic and Atmospheric Administration Technical Report, National Marine Fisheries Service: 41, Miami, 15 pp.
165
Bohnsack, J. A. 1998. Application of marine reserves to reef fisheries management. Australian Journal of Ecology 23: 298-304.
CAST (Caribbean Alliance for Sustainable Tourism), Puerto Rico. www. sidsnet. org/successtories/2. html
Cesar, H. 2000. Impacts of the 1998 Coral Bleaching Event on Tourism in El Nido, Philippines. Report prepared for the Coastal Resources Center Coral Bleaching initiative, University of Rhode Island, 21 pp.
Davis, D., Banks, S., Birtles, A., Valentine, P. & M. Cuthill. 1997. Whale sharks in Ningaloo Marine Park: managing tourism in an Australian marine protected area. Tourism Management 18: 259-27 1.
Gell F. R. & C. M. Roberts. 2003.77ze Fishery Effects ofMarine Reserves and Fishery Closures. WWF-US, 1250 24th Street, NW, Washington, DC 20037, USA, 89 pp.
Gregory, M. R. 1999. Plastics and South Pacific island shores: environmental implications. Ocean& Coastal Management 42: 603-615.
Halpern, B. S. & R. R. Warner. 2002. Marine reserves have rapid and lasting effects. Ecology Letters 5: 361-366.
Hodgson, G. & J. A. Dixon. 1992. Sedimentation Damage to Marine Resources: Environmental and Economic Analysis, pp. 421-445. In: Marsh, J. B. (ed. ). 1992. Resources and Environment in Asia's Marine Sector. Taylor & Francis, New York.
Hodgson, G. & J. A. Dixon. 2000. El Nido Revisited: Ecotourism, Logging and Fisheries. In: Cesar, H. S. J. (ed. ). Collected Essays on the Economics of Coral Reefs. CORDIO, Department for Biology and Environmental Sciences, Kalmar University, Sweden, pp. 55-68.
Inglis, G. J., Johnson, V. I. & F. Ponte. 1999. Crowding norms in marine settings: a case study of snorkeling on the Great Barrier Reef. Environmental Management 24: 369-381.
Jim6nez, C. E. 1997. Corals and coral reefs of Culebra Bay, Pacific Coast of Costa Rica: Anarchy in the reef. In: Proceedings of the Eighth International Coral Reef Symposium. Smithsonian Tropical Research Institute, Balboa, Panamaj: 329-334.
Kim, E&D. Lee. 2000. Japanese tourists' experience of the natural environments in North QLD Region - Great Barrier Reef experience. Journal of Travel & Tourism Marketing 9: 93-114.
166
Marsh, J. B. (ed. ). 1992. Resources and Environment in Asia's Marine Sector. Taylor & Francis, New York.
Mundet, L. & L. Ribera. 2001. Characteristics of divers at a Spanish resort. Tourism Management 22: 501-5 10.
Musa, G. 2002. Sipadan: a SCUBA-diving paradise: an analysis of tourism impact, diver satisfaction and tourism management. Tourism Geographies 4: 195-209.
Nemeth, R. S. 2001. Monitoring the effects of land development on the near-shore reef environment of St. Thomas, USVI. Bulletin of Marine Science 69: 759-775.
Richardson, J. & I. G. Jowett. 2001. Effects of sediment on fish communities in East Cape streams, North Island, New Zealand. New Zealand Journal of Marine and Freshwater Research 36: 431-442.
Roberts, C. M., Bohnsack, J. A., Gell, F., Hawkins, J. P. & R. Goodridge. 2001. Effects of marine reserves on adjacent fisheries. Science 294: 1920-1923.
Roberts, C. M. & N. V. C. Polunin. 199 1. Are marine reserves effective in management of reef fisheries? Reviews in Fish Biology and Fisheries 1: 65-9 1.
Roberts, C. M. & NN. C. Polunin. 1993. Effects of marine reserve protection on northern Red Sea fish populations. Proceedings of the Seventh International Coral Reef Symposium, Guam, 2: 969-977.
Rogers, C. S. 1990. Responses of coral reefs and reef organisms to sedimentation. Marine Ecology Progress Series 62: 185-202.
Rudd, M. A. & M. H. Tupper. 2002. The impact of Nassau grouper size and abundance on scuba diver site selection and MPA economics. Coastal Management 30: 133-151.
Russ, G. R. & A. C. Alcala. 1996. Marine reserves: rates and patterns of recovery and decline of large predatory fish. Ecological Applications 6: 947-96 1.
Sladek Nowlis, J., Roberts C. M., Smith, A. H. & E. Siirila. 1997. Human-enhanced impacts of a tropical storm on nearshore coral reefs. Ambio 26: 515-521.
Tabata, R. S. 1989. The use of nearshore dive sites by recreational dive operators in Hawaii. Coastal Zone: 2865-2876.
167
Tabata, R. S. 1992. Hawaii's Recreational Dive Industry and Use offearshore Dive Sites. Sea Grant Marine Economics Report, UH Sea Grant College Program, Honolulu, Hawaii, 54 pp.
Vanclay, F. M. 1988. Tourist Perceptions of the Great Barrier Reef. Report to the Great Barrier Reef Marine Park Authority, Townsville, 103 pp.
Westmacott, S., Pet-Soede, L. & H. Cesar. 2000. Assessment of the Socio-Economic Impacts of the 1998 Coral Reef Bleaching in the Indian Ocean. Report prepared for the CORDIO programme Coral Reel Degradation in the Indian Ocean, 149 pp.
Williams, I. & NN. C. Polunin. 2000. Differences between protected and unprotected reefs of the western Caribbean in attributes preferred by dive tourists. Environmental Conservation 27: 382-391.
168
Chapter 6: Management of coral reef tourism
6.1 ABSTRACT
For many countries, tourism is a profitable industry and its growth is encouraged. However, planning for, and management of tourism and its negative impacts has
generally not kept pace with its development. Coral reef tourism is a case in point. Rapid expansion in reef tourism and associated infrastructure has, in many instances,
been coupled with degradation of coral reefs. To date, reef management has typically
involved establishing marine protected areas (MPAs). Some MPAs provide mooring buoys to reduce damage to reefs from anchoring. These measures, although beneficial, are insufficient to control tourism impacts to reefs or enable reefs to
accommodate expansion in visitor numbers. MPAs need to employ additional control
measures including restricting visitor numbers to sensitive sites, spreading visitor load over sites more equally and requiring tourist businesses to supervise visitors
closely in the water to ensure that their behaviour does not damage reefs. Small
islands, due to their size, cannot afford to degrade, let alone lose, their coral reefs. The case study of St. Lucia, West Indies, is used to illustrate how management of reef
tourism could be adapted to reduce visitor impacts to the reefs, make fuller use of the
country's marine resources and accommodate a growing tourism industry. If diver
behaviour is strictly controlled, sites could potentially accommodate between 14,000
dives each per year, representing revenues from dive trips to tour businesses of US$560,000 per site per year. Without visitor management, site capacities for divers
will remain at lower levels and furthermore, with continued reef degradation from
visitors and pollution, some sites may become unusable for reef tourism. This could
impose a cost of between US$160,000 to US$280,000 per site per year, underlining
the importance of managing visitor behaviour and reef degrading pollutants.
169
6.2 INTRODUCTION
While tourism is one of the world's most successful industries (WTTC, 2002) and
worldwide international arrivals, numbering at almost 700 million in 2000, continue
to grow at an average rate of 7% annually (WTO, 2002), it is also an environmentally
damaging one (Shah et al., 1997; G6ssling, 2000; Becken, 2002). Many countries
want to develop tourism for economic benefits but they fail to plan its management
adequately, often resulting in detrimental consequences for their social and biological
environment (Britton, 1977; Rodenburg, 1980; Miller & Auyong, 1991; Lindberg &
Hawkins, 1993).
Coral reefs are increasingly exploited for tourism, particularly scuba diving
and snorkeling (Orams, 1999). The economic benefits from tourism, together with
other services provided by reefs, including coastal protection and provision of food,
are worth about US$375 billion each year (Costanza et al., 1997). Despite their
value, over half of the world's reefs are potentially threatened by human activity
ranging from coastal development, destructive fishing practices, over-exploitation of
resources and pollution (Bryant et al., 1998). Management strategies must encompass
these anthropogenic threats if they are to protect reef resources effectively. Managing
visitor behaviour and use of reefs is an important aspect. This chapter examines the
different aspects of visitor management and identifies strategies that could facilitate a
growth in tourism whilst preserving the integrity of the reef environment.
6.3 MANAGING CORAL REEFS FOR TOURISM
6.3.1 Marine protected areas and carrying capacity estimates
Marine protected areas (MPAs) are a means of managing uses of reefs and
approximately 660 have been set up around the world to protect reefs and the species
they support (Spalding et al, 2001). Some MPAs are partially or fully funded by
visitors paying a fee to use reefs in the protected area. Current typical visitor
170
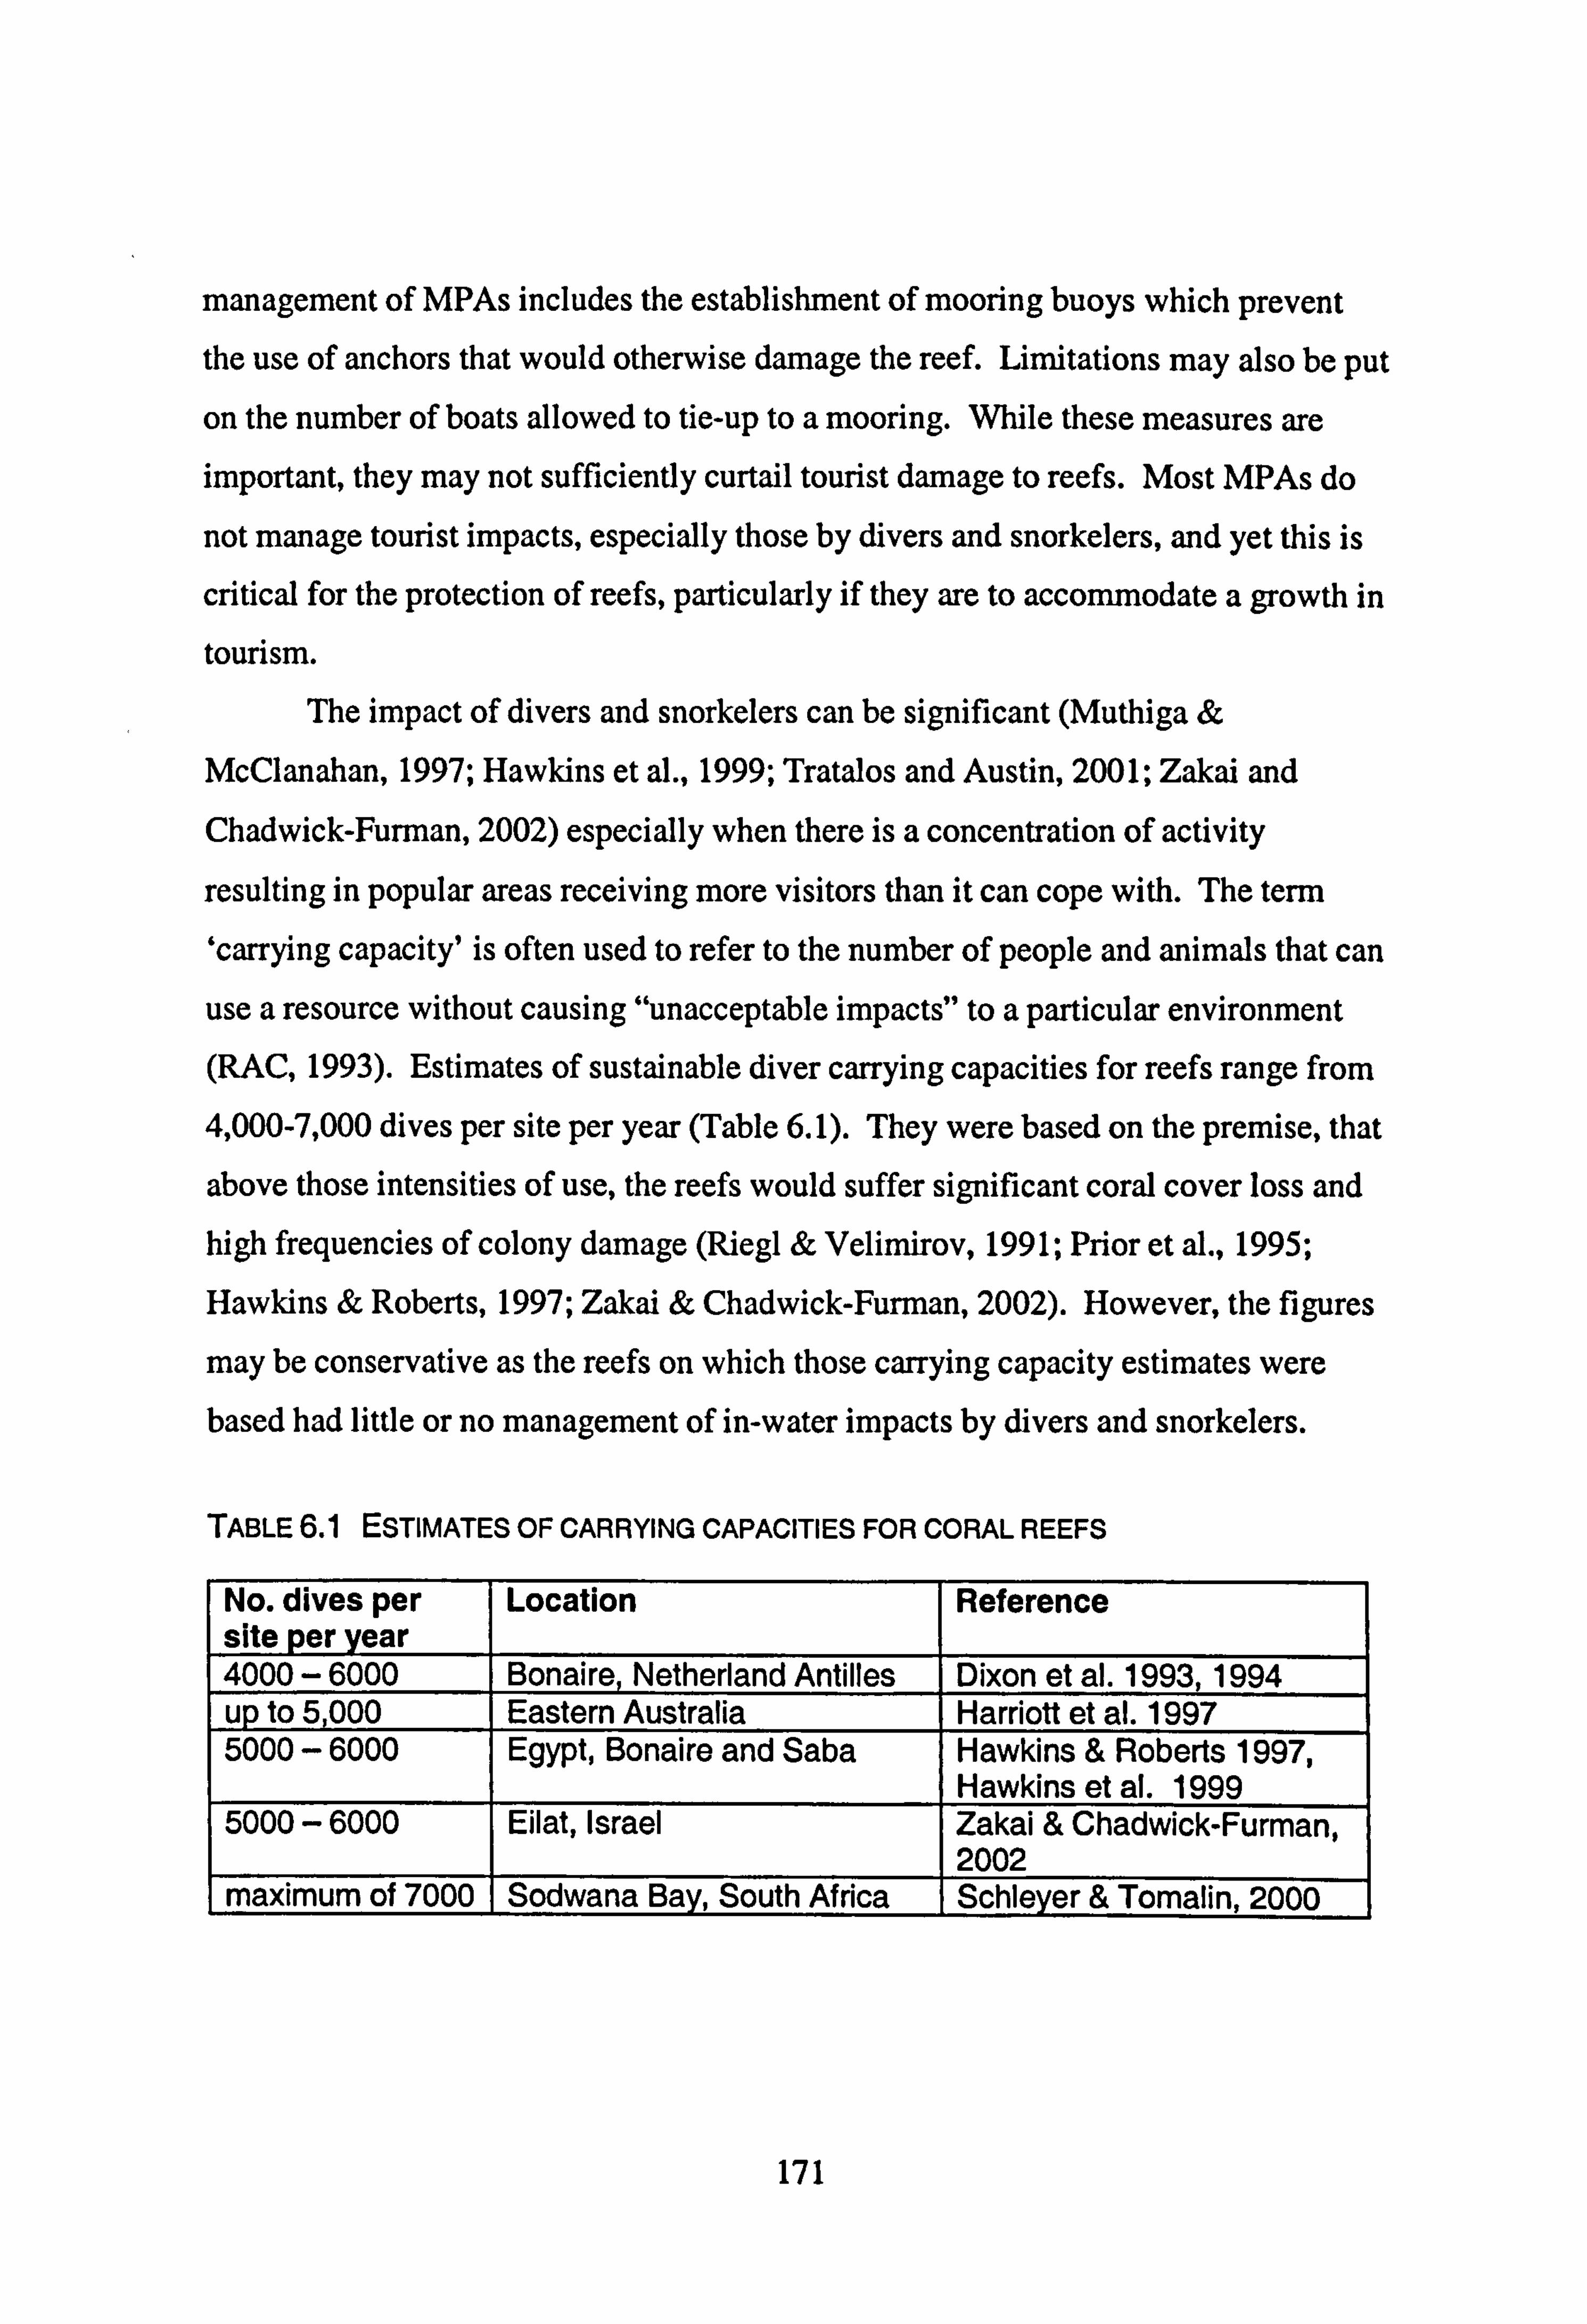
management of MPAs includes the establishment of mooring buoys which prevent the use of anchors that would otherwise damage the reef. Limitations may also be put
on the number of boats allowed to tie-up to a mooring. While these measures are important, they may not sufficiently curtail tourist damage to reefs. Most MPAs do
not manage tourist impacts, especially those by divers and snorkelers, and yet this is
critical for the protection of reefs, particularly if they are to accommodate a growth in
tourism. The impact of divers and snorkelers can be significant (Muthiga &
McClanahan, 1997; Hawkins et al., 1999; Tratalos and Austin, 2001; Zakai and Chadwick-Funnan, 2002) especially when there is a concentration of activity
resulting in popular areas receiving more visitors than it can cope with. The term 6carrying capacity' is often used to refer to the number of people and animals that can
use a resource without causing "unacceptable impacts" to a particular environment (RAC, 1993). Estimates of sustainable diver carrying capacities for reefs range from
4,000-7,000 dives per site per year (Table 6.1). They were based on the premise, that
above those intensities of use, the reefs would suffer significant coral cover loss and high frequencies of colony damage (Riegl & Velimirov, 1991; Prior et al., 1995;
Hawkins & Roberts, 1997; Zakai & Chadwick-Funnan, 2002). However, the figures
may be conservative as the reefs on which those carrying capacity estimates were
based had little or no management of in-water impacts by divers and snorkelers.
TABLE 6.1 ESTIMATES OF CARRYING CAPACITIES FOR CORAL REEFS
No. dives per site per year
Location Reference
4000 -6000 Bonaire, Netherland Antilles Dixon et al. 1993,1994 up to 5,000 Eastern Australia Harriott et al. 1997 5000 -6000 Egypt, Bonaire and Saba Hawkins & Roberts 1997,
Hawkins et al. 1999 5000- 6000 ilat, Israel Zakai & Chadwick-Furman,
2002 maximum of 7000 Sodwana Bay, South Africa Schleyer & Tomalin, 2000
171
The carrying capacity of reefs for tourism is variable and dependent on other
factors including: location of the reef in relation to other human activities and
development, the type of activity the reef is being used for, and reef structure and
composition (Salm, 1986; Clark, 1991; Harriott et al., 1997; Schleyer & Tomalin,
2000; Zakai & Chadwick-Furman, 2002). Carrying capacity will be influenced by
the level of damaging activities and impacts present. Sites close to human settlement
are often subjected to extractive activities including fishing and mining, and pollution
from household, industrial and agricultural activities. A site being used to teach
people how to dive is likely to receive more damage than if it is used by qualified
divers, and if a site is being used by both divers and snorkelers, then impacts are
likely to be greater. Reefs may be subjected to trampling and anchoring (Woodland &
Hopper, 1977; Davis, 1977; Kay & Liddle, 1989; Visser & Njuguana, 1992; Hawkins
& Roberts, 1993; Rajasuriya et al., 1995), in addition to impacts caused by swimming
divers and snorkelers. Other factors that may affect the rate at which a reef is
impacted by users include the use of a camera (Rouphael & Inglis, 2001; Chapters 2
and 3), if dives are done from shore rather than by boat and if night dives are carried
out at the site (Chapter 2). Impacts will also vary according to the reef species
present. Branching corals for example, have been found to be more susceptible than
others to damage by divers (Rouphael & Inglis, 1997; Garrabou et al., 1998).
6.3.2 Choosing the tourism market
Countries need to identify the kind of tourism they wish to promote and the
type of tourist they wish to cater for. Destinations are constantly evolving and
characteristics of tourists and the destinations' environments are also changing. As.
illustrated by Butler's tourist destination cycle (Butler, 1980), initial explorers are few, restricted by lack of access, facilities, and local knowledge. As facilities and
awareness grow the area becomes more popular and attracts increasing numbers of
visitors. As'levels of carrying capacity, measured as environmental factors such as
water and air quality, physical factors such as transportation and accommodation, and
172
social factors such as crowding or resentment by the local population are reached, the
rate of increasing tourist numbers drops. Visitors may then find other areas more
attractive and holiday elsewhere. Examples of where tourism development has
followed this route can be found in parts of East Africa and its Island States. In the 1990's income from tourism dropped dramatically (40% in Kenya for example),
partly due to environmental degradation caused by increased flows of organic wastes
and nutrients, and inappropriate agricultural methods exacerbating run-off and
siltation problems (Shah et al., 1997). Therefore, visitor perceptions can change over
time, depending on which stage of the tourist destination cycle the country, or region, is in.
Instead of going for the mass tourism option, countries can opt for lower
numbers of high-paying guests or high-value tourism which may help break the
cycle. The Seychelles has adopted this policy and has regulated tourist development
to include a range of accommodations including guest houses at US$40 per night, to
bungalows such as those on Fr6gate Island at US$1955 per night (G6ssling et al.,
2002). The Seychelles realised that to attract wealthy visitors they needed to
maintain a high quality environment and accordingly put half of their land under
protection. However, despite those protective measures being implemented there are
still problems including marine curio collecting and over-exploitation of reef fish,
that need to be addressed (Gbssling et al., 2002). This highlights the importance of
monitoring reef resources and implementing educational programs that convey to
people the justification for regulating the use and extraction of reef resources. The
Maldives specifically target the up-market tourist (Inskeep, 1992) and the
government encourages resorts to upgrade themselves to attract a higher-level of
tourist clientele. The Mauritian government also promoted selective tourism,
targeting affluent visitors, and resisted charter flight operations that catered to the
masses of lower-spending tourists (Ramsamy, 1992).
Small islands, such as those in the Seychelles and the Caribbean have limited
resources that they cannot afford to lose to unregulated tourism development or other
173
activities that damage their natural environment. Such islands are in a perfect
situation to profit from high value, low-volume tourism development. As resources become scarce, the value of good quality sites increases and regions can charge a
premium for them (Medio, 1996 in Wells, 1997). It is therefore in a country's interest to control any form of development or activity, including that associated with tourism and other activities that may impact negatively on the environment.
6.3.3 Management options for reef tourism
To alleviate the pressures of reef tourism, options for management include:
establishing mooring buoys, walkways or pontoons; implementing user fees;
regulating use of sites; alternative and additional site creation; supervision and
education of visitors; building control and sanitation and coral reef monitoring. These options are described below.
Mooring buoys
Mooring buoys have been used successfully to reduce, and where anchoring is not
allowed, eliminate any further anchor damage to corals. At some parks, including
Saba and Bonaire in the Netherlands Antilles, every dive site has its own mooring buoy and only one boat is allowed to use a mooring at a time. However, this system does not prevent boats from dropping divers and snorkelers off at a site and returning
to pick them up without using a mooring. Management therefore needs other tools in
addition to moorings to regulate use of sites. A charge can be levied on moorings to help finance their maintenance and pay towards marine park management costs. In
the British Virgin Islands, mooring fees are US$1.85 per foot length of boat per day,
increasing to US$2.75 per foot length of boat per day after the first day (British
Virgin Islands Port Authority, 2003). In Hawaii, mooring fees are US$1.75 per foot
length of boat per day (Ko Olina Marina, 2003).
174
Walkways and pontoons Walkways help localise coral damage by trampling to a given area and have been
used successfully in the Ras Mohammed National Park, Egypt (Ormond et al., 1997).
Many pontoons are distributed throughout the Great Barrier Reef in Australia giving
snorkelers a place to rest instead of standing on the reef.
Fees
Marine parks can charge a fee to divers and snorkelers wishing to visit sites within
the protected area. The Hol Chan Marine Reserve and Half Moon Caye in Belize
charge between US$2.50 and US$5.00 per visitor per day; the Fernando de Noronha
Marine Park in Brazil charges US$4.25 per visitor per day; the British Virgin Islands
charges divers US$1 per day; Bonaire Marine Park charges US$10 per diver per year;
Saba Marine Park charges US$3.00 per dive and US$3.00 per week for snorkelers (Lindberg, 2001). In the Medes Islands protected area of Spain, spread over an area
of 21.5 hectares, divers are charged a fee of US$2.2 per dive (Mundet & Ribera,
200 1). These fees typically represent less than 1% of the total trip cost and studies
suggest that fees could be increased without leading to siginificant reductions in
visitation rates (Dixon, Scura & van't Hof, 1994; Walpole et al., 2001; Lee & Han,
2002).
Limiting the number o divers and snorkelers allowed to use a site Although not widely adopted, site limits have been used to address problems of
crowding and environmental degradation. On the island of Sipadan (16.4 hectares),
the Malaysian authorities have enforced a limit of 100 divers allowed to dive on the island's reefs per day (Musa, 2002). In the Medes Islands, the government has set a limit of 450 dives per day (Mundet & Ribera, 2001). Where reef use is spread over larger areas, a tradeable permit system may be a more appropriate and effective means to control numbers of visitors (Cumberbatch, 2000). To implement such a scheme, dive carrying capacity for each site must be determined. The corresponding
175
number of tradable permits are then issued to dive operators, which in total allow
exactly the decided dive levels at each site, during the specified period for which
permits are valid. As permits are in limited supply they obtain a scarcity value and
any business can sell their excess permits to another business.
Increasing the number o sites availablefor diving and snorkeling !f
Opening up and using new sites for divers and snorkelers can alleviate pressure from
heavily used sites. Other options include sinking ships for wreck diving and artificial
reef construction (Chua & Chou, 1994; Wilhelmsson et al., 1998; Mead & Black,
1999), although consideration of the impact of these options on the marine
environment would need to be addressed.
Education and in-water supervision
Briefings alone are insufficient to reduce visitors damaging the reef (see Chapters 2
and 3). Rates of contact and damage can be greatly reduced if all dive and snorkel
leaders supervise their clients to prevent them from damaging the reef by intervening
as soon as they see damaging behaviour. Groups of visitors will therefore have to be
small enough to allow leaders to provide adequate supervision.
Building control and sanitation regulations
Strict building controls have been introduced in the Maldives and Mauritius limiting
room numbers, tree cutting, height of structures and enforcing sewage treatment
plants to be constructed for larger resorts (Ramsamy, 1992; Inskeep, 1992). Policies
such as these work particularly well for small islands where the impact of mass
tourism, and the development associated with it, would be environmentally
unsustainable.
176
Implementing a monitoring program Monitoring of reef resources, environmental parameters, and human activities enables trends and changes within the reef environment to be revealed. Scientific research facilitates the understanding of the impacts human activity has on resources and it
also provides managers with a tool to assess the efficacy of management actions. In
the process, research may also reveal new parameters or processes that need to be
monitored and areas that need to be further researched. Information gathered from
monitoring programs can also be used to educate the public so that they too can better
understand and support management initiatives.
Programs monitoring the status of coral reefs have been implemented
worldwide (Burke et al., 2002) and need not be entirely conducted by scientific staff. Volunteers are now supplementing more rigorous scientific monitoring efforts. Coral
reef monitoring programs have been developed for tour operators, recreational divers
and other volunteer groups wishing to plan reef survey programs, collect data, train local participants and ensure quality control (Musso & Inglis, 1998).
Monitoring should, if possible, be conducted over the long-term. In Florida,
all national marine sanctuaries that contain coral reefs have ongoing monitoring
programs (NOAA, 2003). Although monitoring programs provide information on
coral reef communities which can be used to effectively manage human impacts,
many places lack effective management strategies (Tissot & Brosnan, 2002).
Problems arise from poor communication and liaison between science, management
and policy. Efficient management requires integration, cooperation and collaboration
among the public and government. Integrating education with monitoring programs is key to achieving this.
6.4 THE CASE STUDY OF ST. LUCIA
Coral reefs in the eastern Caribbean island of St. Lucia are important assets for fishing and tourism (VMC, 2002). In Soufri&e, a town on the south west coast,
177
conflict has existed since the 1980s between fishers and tourist businesses, and there has been concern over declining reef fish catches and reef health (Gell & Roberts,
2002). After several years of discourse and ineffectual legislation set up to protect
some of the reefs in the vicinity of Soufri6re, the government approved a proposal put forward by a committee, in consultation with stakeholders, to establish a marine and
coastal resource management area. The Soufriere Marine Management Area
(SMMA) was officially launched in 1995. It covers 1 lkrn of coast (Fig. 2.1, Chapter
2), extends 100m. from the shore and is divided into zones. The zones include marine
reserves where all extractive uses are forbidden but diving is allowed, fishing priority
areas where recreation is allowed but fishing takes precedence, yacht mooring areas
where recreation is allowed in tandem with mooring, and multiple use areas where all uses are permitted.
Since the SMMA's inception, commercial fish biomass has increased four fold inside the marine reserves and three fold in adjacent fishing grounds (Roberts et
al., 2001; Gell et al., in prep). However, despite the success of the SMMA, the
quality of St. Lucia's reefs has declined. Reefs in the SMMA, and one area 7km
north of it, have shown a decrease in coral cover from an average of 40 ± 1.2 %
(mean ± standard error) in 1995 to 31 ± 1.0 % (mean ± standard error) in 2001
(Schelten, 2002). Another study which sampled at a larger scale showed that the
average coral cover at 15m depth from ten sites within the SMMA was 37%, and
ranged from 17 to 55 ± 3.7 % (± standard error) in 1995 (Hawkins & Roberts,
unpublished data). By 2002, the average coral cover had dropped to 27%, with a
range of 12.5 to 45.5 ± 3.6 % (± standard error) (Hawkins & Roberts, unpublished data). Coral cover loss was correlated with sediment pollution levels (Schelten,
2002). A higher loss of 27% was found in areas of high sediment, compared to a loss
of 19% in low sediment areas. Household and other waste has also affected sites,
such as at the 'Pinnacles' site, where divers have noticed excessive garbage (see
Chapter 5) and reported other negative aspects including coral damage (e. g. broken
and dead looking pieces of coral) and poor underwater visibility. Underwater
178
visibility is directly affected by levels of suspended sediment. Tourists in St. Lucia, including divers and snorkelers, cause damage to the reef by kicking or knocking into it and stirring up sediment which then settles on the corals (see Chapters 2 and 3). Thus, the combined impacts from visitors and pollution could affect the scope for
tourism growth by degrading sites to a point of unusability. The moorings within the SMMA are of two types. Those for dive and snorkel
boats and those designated for yachts. Yachts are charged a fee according to their
size and length of stay, ranging from US$ 10 for vessels of 35ft or less for a stay of up to two days, to US$25 for vessels of over 65ft staying for up to seven days. The
revenue that yacht mooring fees contribute to total park revenue, including diver fees
and donations, fluctuates from year to year. Between 1995 and 2000, yearly revenue from yacht mooring fees represented between 35 and 66% of total revenue, and
averaged 52%. Yacht fees in 2001 totalled US$50,000, representing 62% of all SMMA revenue collected (SMMA data, 2001). Yacht fees in St. Lucia are low
compared to the British Virgin Islands (BVI Port Authority, 2003) and Hawaii (Ko
Olina Marina, 2003), where for a vessel of 35ft, fees would range from US$61 to 65
per day compared to US$10 in the SMMA. A fee system is also in place for divers
and snorkelers. Divers in St. Lucia are charged US$4 per day or US$12 per year and
snorkelers US$1 per day. Between 1995 to 2000, yearly revenue from diver fees
represented between 33 and 65% of total park revenue and averaged 48%. In2001,
snorkeler fees were introduced and revenue from those in combination with diver
fees, contributed some 36% of total park revenue (SMMA data, 2001). Compared to
other Caribbean destinations, these fees are of similar magnitude but other marine
parks in the world manage to have much higher fees such as in the Philippines, where
parks charge anything from US$1 to US$50 per person per entry (Lindberg, 2001).
Studies in St. Lucia show that most visitors are willing to pay more than that being
asked (Chapter 4). If the park charged what 75% of visitors were willing to pay, the daily and annual fee for divers would be US$6 and US$20 respectively, and the daily
snorkeler fee would be US$2. Those fees would represent an increase in park
179
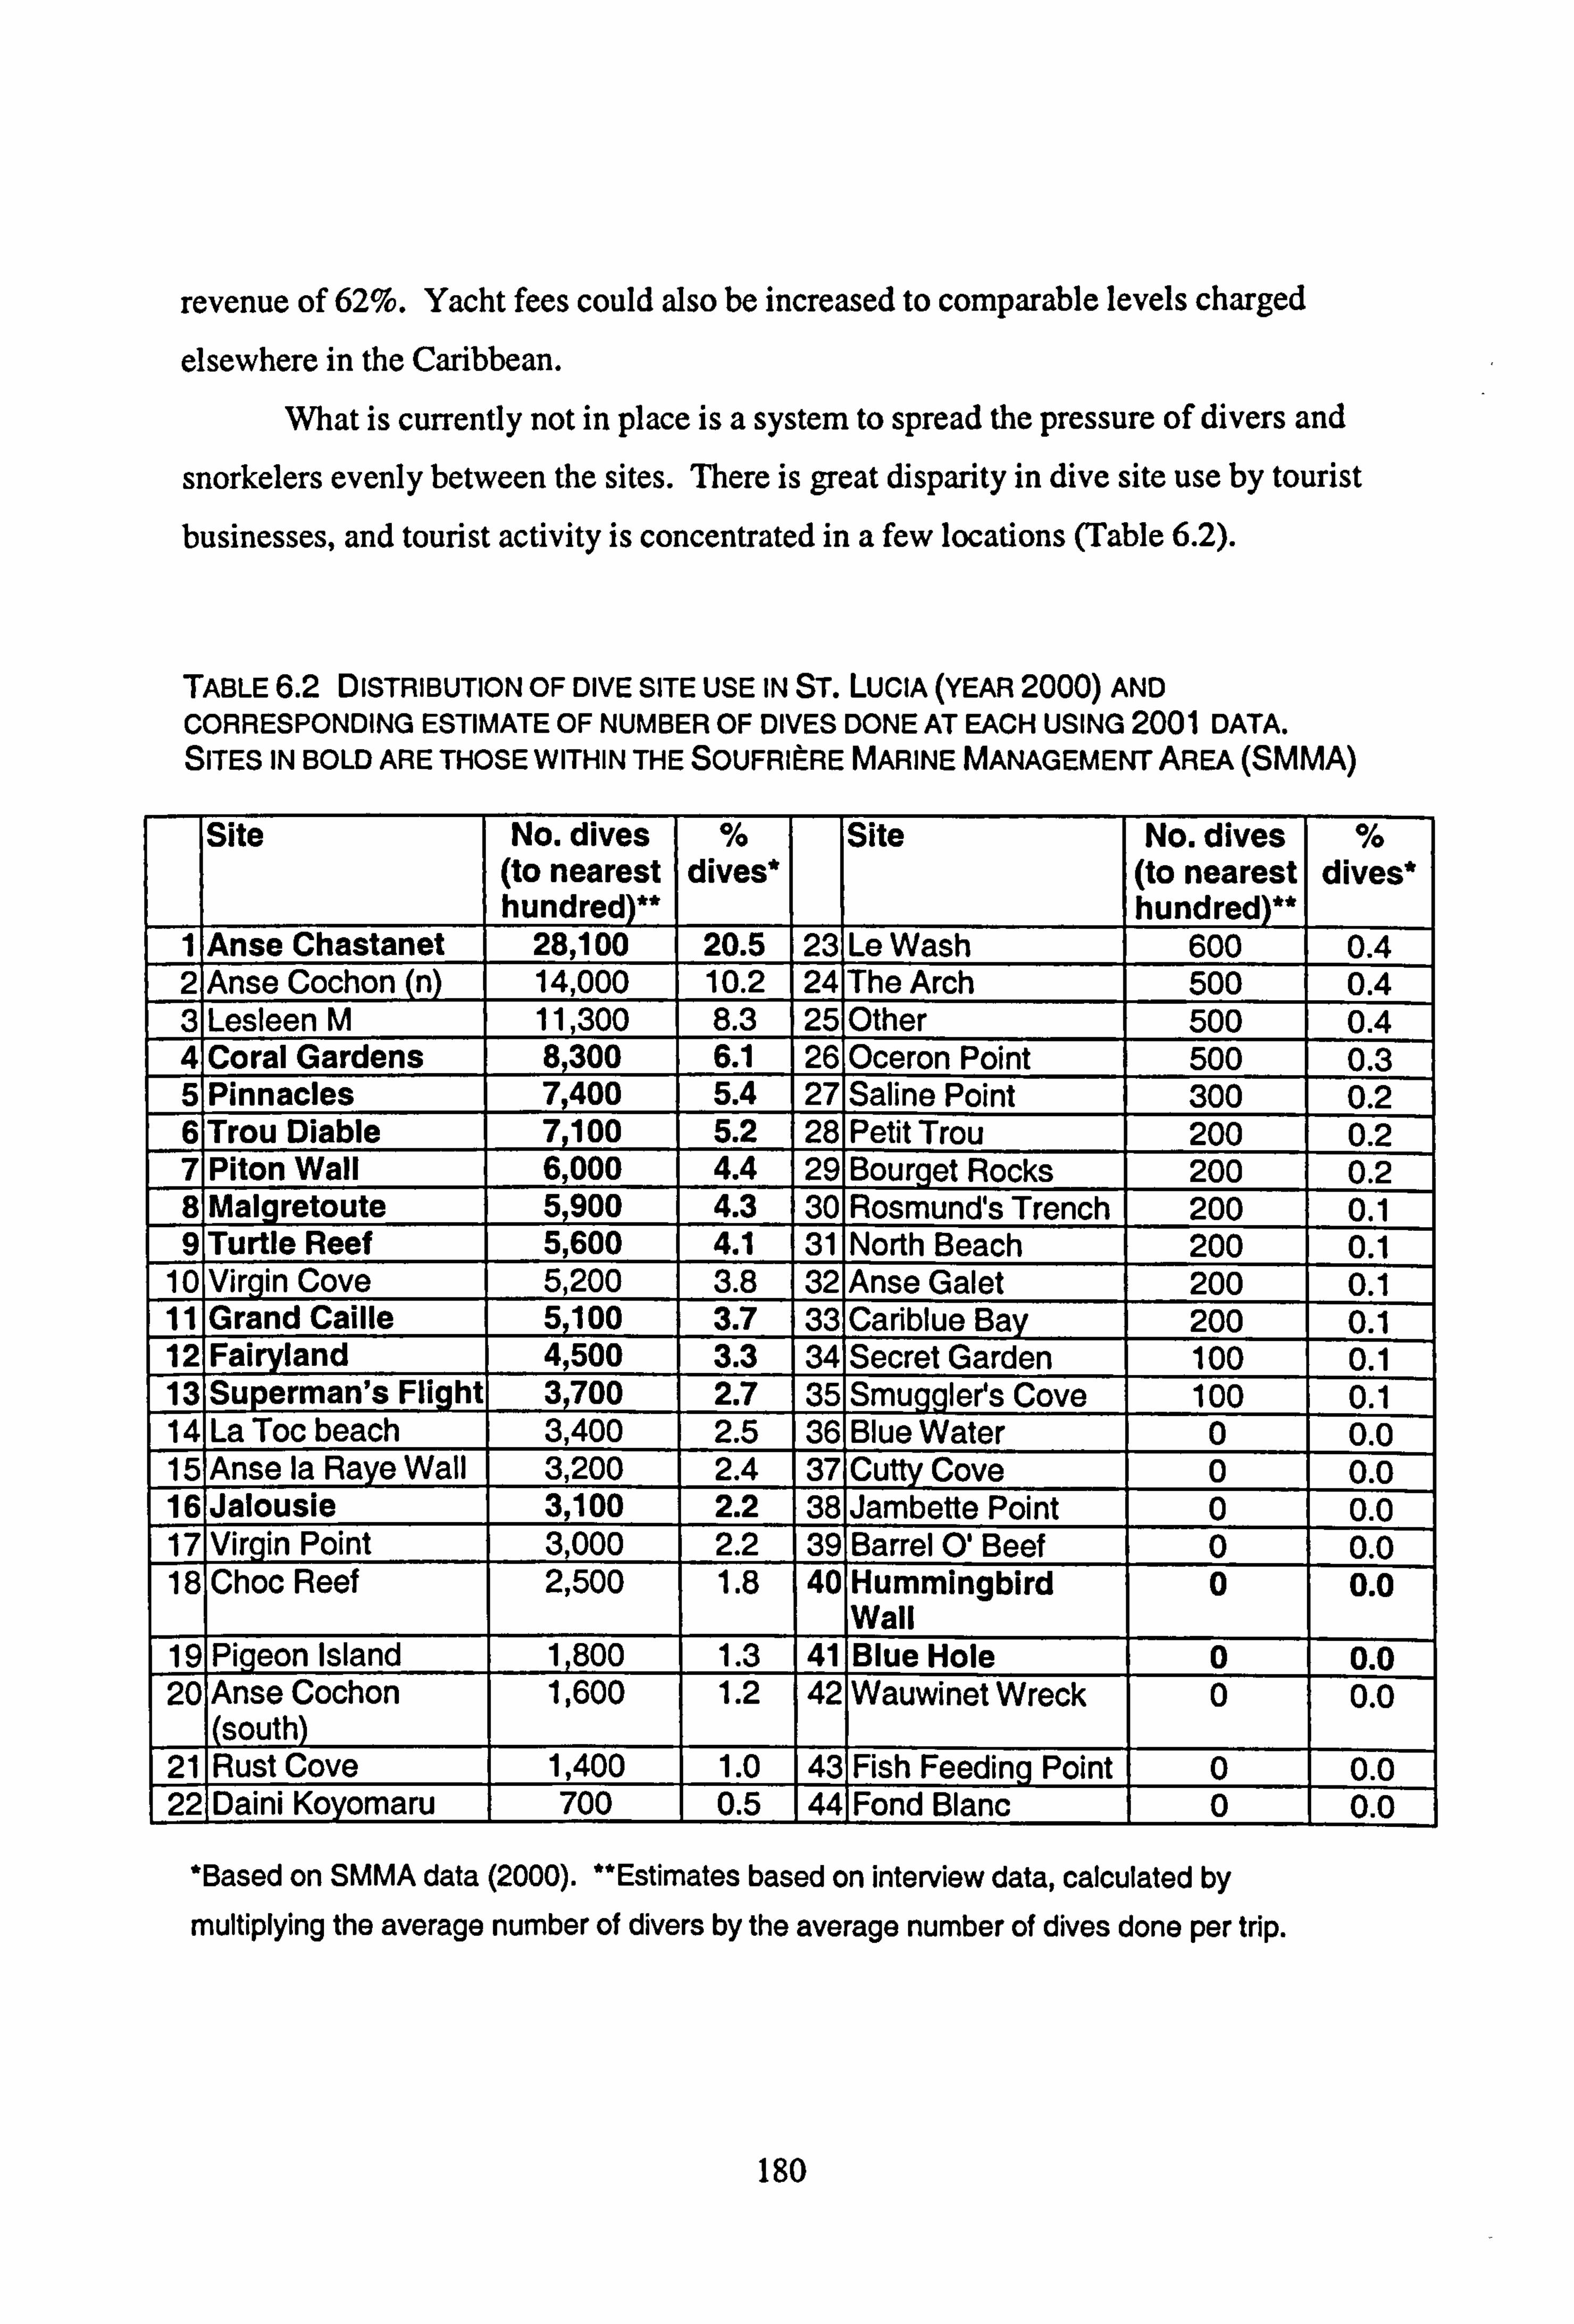
revenue of 62%. Yacht fees could also be increased to comparable levels charged
elsewhere in the Caribbean.
What is currently not in place is a system to spread the pressure of divers and
snorkelers evenly between the sites. There is great disparity in dive site use by tourist businesses, and tourist activity is concentrated in a few locations (Table 6.2).
TABLE 6.2 DISTRIBUTION OF DIVE SITE USE IN ST. LUCIA (YEAR 2000) AND CORRESPONDING ESTIMATE OF NUMBER OF DIVES DONE AT EACH USING 2001 DATA. SITES IN BOLD ARE THOSE WITHIN THE SOUFRILRE MARINE MANAGEMENT AREA (SMMA)
Site No. dives (to nearest hundred)**
% dives*
Site No. dives (to nearest hundred)**
% dives*
1 Anse Chastanet 28,100 20.5 23 Le Wash 600 0.4 2, Anse Cochon (n) 14,000 10.2 24, The Arch 500 0.4 3 Lesleen M 11,300 8.3 251 0ther 500 0.4
_ 4 Coral Gardens 8,300 6.1 261 0ceron Point 500 0.3 _ _5
Pinnacles 7,400 5.4 271 Saline Point 300 0.2 6 Trou Diable 7,100 5.2 281 Petit Trou 200 0.2 7 Piton Wall 6,000 4.4 291 Bourget Rocks 200 0.2
_ 8 Malgretoute 5,900 4.3 30 Rosmund's Trench 200 0.1 9 Turtle Reef 5,600 4.1 31 North Beach 200 0.1
10 Virgin Cove 5,200 3.8 32 Anse Galet 200 0.1 I 11 Grand Caille 5,100 3.7 33 Cariblue Bay 200 0.1 12 Fairyland 4,500 3.3 34 Secret Garden 100 0.1 13 Superman's Fligh 3,700 2.7 35. Sm5qqlees Cove 100 0.1 14 La Toc beach 3,400 2.5 361 BlueWater 0 0.0 15 Anse la RaVe Wall 3,200 2.4 37 1Cuttv Cove 0 0.0 16 Jalousie 3,100 2.2 38 1Jambette Point 0 0.0 17 Virgin Point 3,000 2.2 39 1Barrel O'Beef 0 0.0 18 Choc Reef 2,500 1.8 40 IHummingbird
Wall 0 0.0
19 Piqeon Island 1,800 1.3 41 1 Blue Hole 0 0.0 20 Anse Cochon
(south) 1,600 1.2 42 1Wauwinet Wreck 0 0.0
21 -
Rust Cove 1,400 1.0 Feeding Point 0 0.0 r22 IDaini Koyomaru 1 700 1 0.5
, 44 1Fond Blanc 0 -1 -0.0
*Based on SMMA data (2000). "Estimates based on interview data, calculated by
multiplying the average number of divers by the average number of dives done per trip.
ISO
In 2000, six sites received more than half of all dives (50.3%) and one site in
particular, Anse Chastanet received 20.5%. Using the most recent 2001 data obtained from my interviews with dive operators (Chapter 4), the total number of dives done in
St. Lucia was estimated at 137,000 dives per annum. If one assumes that site use followed the same distribution as in 2000, approximately 84,800 of all dives would have been done at sites within the SMMA, with 28,000 dives done at Anse Chastanet
alone. For the year 2001, the number of dives at most sites was within researchers'
estimates of carrying capacity set at between 4,000 to 7000 dives per site per year, but some sites exceeded these values by a lot. Five sites had above the maximum of 7,000 dives per site per year suggested by Schleyer & Tornalin (2000) and the most
popular site, Anse Chastanet, received four times the maximum recommended
capacity. Based on interviews with divers and dive businesses (Chapter 5), certain sites
appeared to have exceeded their carrying capacity, particularly in terms of crowding
and aesthetics, for example Anse Cochon and Anse Chastanet. Sites with visibly
damaged corals and coral rubble are less attractive to divers (Vanclay, 1988;
Westmacott et al., 2000) and visitors to St. Lucia's sites did not like seeing broken or
dead corals (Chapter 5). Jameson et al. (1999) proposed that management action was
required if sites consisted of 4% or greater of broken coral colonies, or if the
percentage cover of coral rubble equalled or exceeded 3%.
6.4.1 Management options for St. Lucia's reef-tourism
Preventing the degradation of St. Lucia's remaining reefs is paramount if the islands'
reef-tourism is to survive and expand. Management needs to include a combination
of previously mentioned strategies, and three options with the greatest potential for
reducing in-water tourism impacts are outlined below.
181
Managing reef users' behaviour
Briefings, in conjunction with dive leader intervention with divers seen to be
damaging the reef, have been found to reduce diver contact rates with the reef by half
for boat dives, and by two-thirds for both boat and shore dives (Chapter 2).
Companies taking visitors on tours to the reef should therefore ask their staff to give
briefings and tell people that leaders will approach them if they are seen to be
damaging the reef, and that if they continue to damage the reef, they will be asked to
end their dive. If dive leaders intervened when they saw their clients damaging the
reef, they could reduce contact rates significantly and sites within the SMMA may be
able to withstand use greater than the maximum carrying capacity estimate of 7000.
If one assumes dive leader intervention could reduce contact rates by a half to two-
thirds, carrying capacity could be increased to 14,000 and possibly withstand use of
up to 21,000 dives per site per year in well-regulated areas. These estimates do not
include impacts to the reefs from other sources, and therefore a precautionary
approach would be to use the lower carrying capacity estimate of 14,000 dives per
site per year or less.
Increasing the number q dive sites )f
All dive and snorkel sites in the SMMA are effectively adjacent to one another, or
adjacent to zones being used for other activities. Increasing the number of dives sites
within the SMMA is therefore unlikely to be an option unless zones such as yacht
mooring areas, were to be closed and opened up for divers and snorkelers. However,
areas along the coast to the south and north of the SMMA may have reef areas that
could be used. This option would have associated costs, including the installation of
further mooring buoys, necessary to avoid damage to the reefs by anchoring.
Increasing the number of sites available for diver and snorkeler use could
accommodate visitors from the more heavily used sites within the SMMA, therefore
releasing some of the visitor pressure. The wreck Lesleen M, is popular with divers
and was the third most-dived site in 2000 (Table 6.2). Creating another or several
182
more artificial reefs may be a good method to provide more of this type of dive. This
would require detailed research to determine how feasible such an operation would be
and would depend on the environmental impacts of creating such sites and identification of appropriate sites.
Some sites are being degraded by sediment pollution (Sladek Nowlis et al., 1997; Schelten, 2002), and as a consequence, are no longer being used by dive
companies. Examples include Hummingbird wall and Bat Cave, both of which are in
the SMMA. Given that sites in the SMMA are already being intensively dived, and
that the number of sites in the SMMA cannot be increased, the loss of Hummingbird
wall and Bat Cave comes at a cost in terms of overall scope for growth of the island's
reef tourism. Using theoretical carrying capacity estimates that range from 4000 to
7000 dives per year (Table 6.1) and an average cost of US$40 per dive (using St.
Lucia's dive business prices in 2001), the cost of sediment pollution per site per year
could range from US$160,000 to US$280,000. That cost is conservative because it
does not include other foregone income to businesses reaped from providing
transport, accommodation or other goods and services associated with visitors staying in St. Lucia. At present, the inability to use sites affected by sediment pollution does
not present a problem because other sites can be used. However, if St. Lucia is to
expand its tourism industry, the number of dive and snorkel sites will have to increase
once the present sites reach their carrying capacity limits. Not being able to use sites because of sediment pollution could result in significant economic losses and prevent further expansion of the island's reef tourism.
More equal distribution of divers and snorkelers among sites
In 2001,137,000 dives occurred, spread over approximately 42 sites. If these dives had been distributed equally, this would have amounted to 3,262 dives per site,
which is well below the recommended carrying capacities. However, over 60% of dives in 2001 were done in the SMMA, divided primarily between 11 sites, which
equates to 7,473 dives per SMMA site, per year if divided equally. This is just above
183
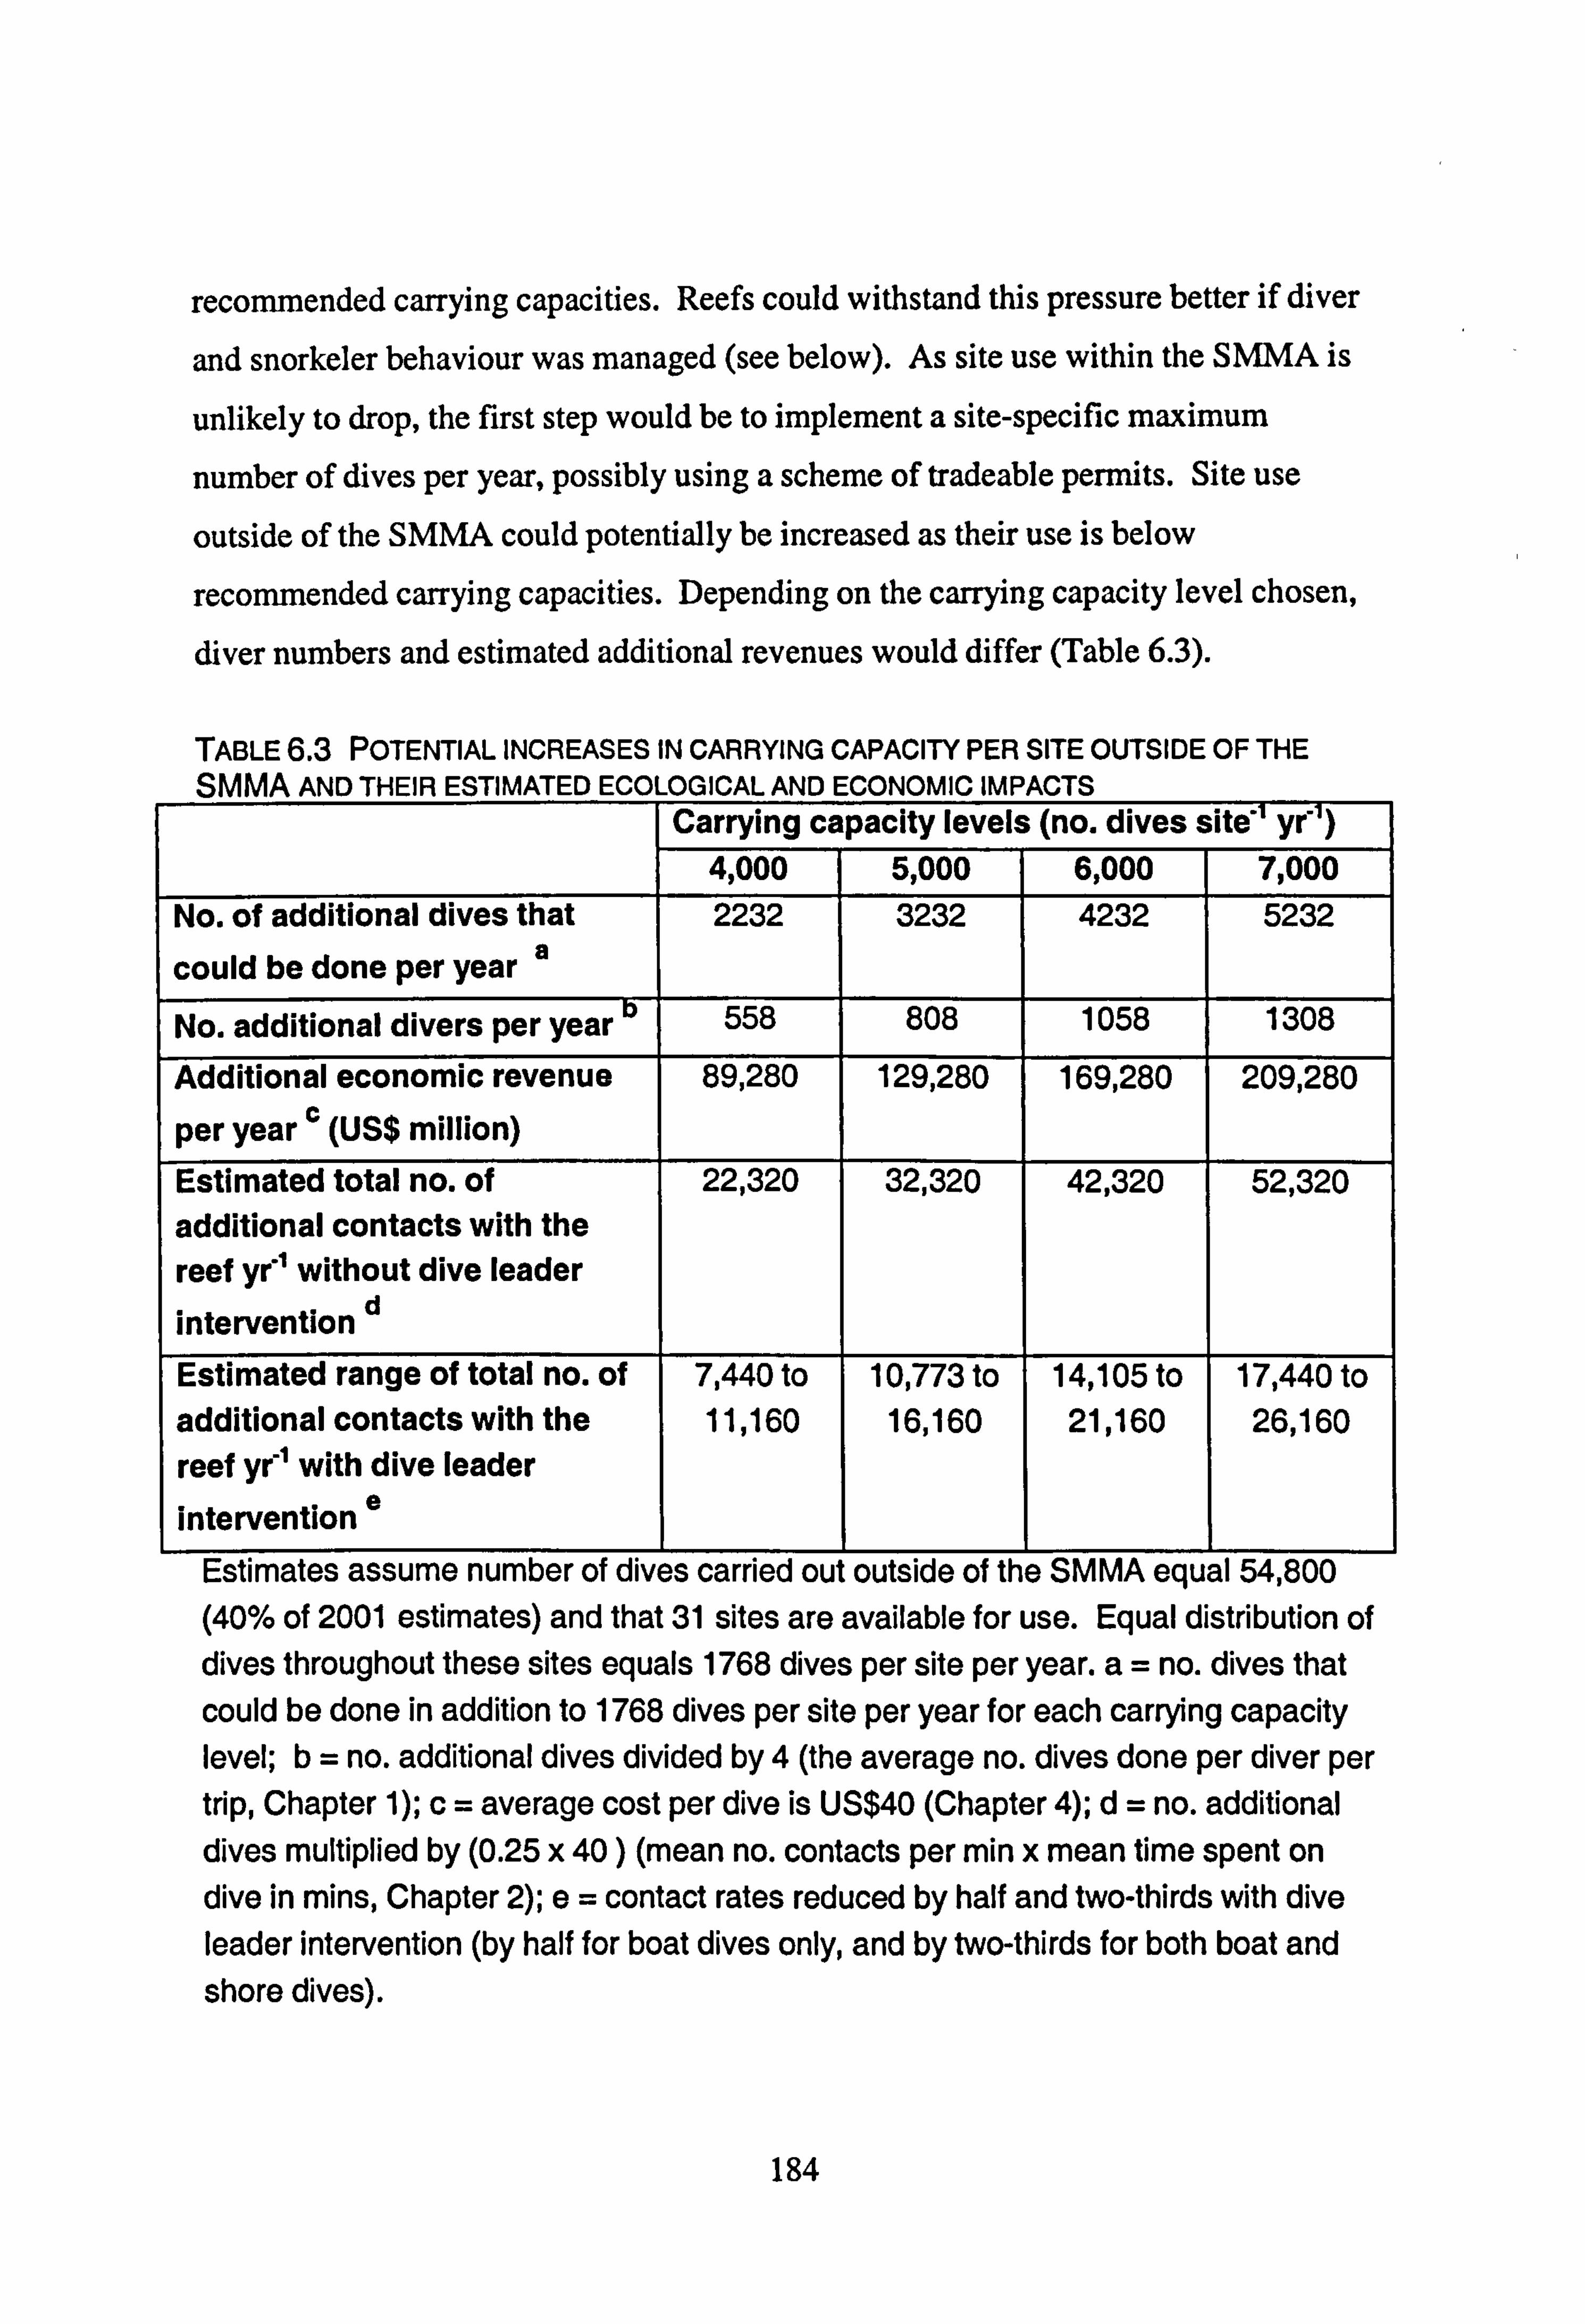
recommended carrying capacities. Reefs could withstand this pressure better if diver
and snorkeler behaviour was managed (see below). As site use within the SMMA is
unlikely to drop, the first step would be to implement a site-specific maximum
number of dives per year, possibly using a scheme of tradeable permits. Site use
outside of the SMMA could potentially be increased as their use is below
recommended carrying capacities. Depending on the carrying capacity level chosen,
diver numbers and estimated additional revenues would differ (Table 6.3).
TABLE 6.3 POTENTIAL INCREASES IN CARRYING CAPACITY PER SITE OUTSIDE OF THE SMMA AND THEIR ESTIMATED ECOLOGICAL AND ECONOMIC IMPACTS
Carrying capacity levels (no. dives site" yr') 4,000 5,000 6,000 7,000
No. of additional dives that 2232 3232 4232 5232
could be done per year a ' year b No. additional divers per 558 808 1058 1308
Additional economic revenue 89,280 129,280 169,280 209,280
per year c (US$ million) Estimated total no. of 22,320 32,320 42,320 52,320 additional contacts with the reef ye" without dive leader intervention d
Estimated range of total no. of 7,440 to 10,773 to 14,105 to 17,440 to additional contacts with the 11,160 16,160 21,160 26,160 reef yr' with dive leader intervention e
Estimates assume number of dives carried out outside of the SMMA equal 54,800 (40% of 2001 estimates) and that 31 sites are available for use. Equal distribution of dives throughout these sites equals 1768 dives per site per year. a= no. dives that could be done in addition to 1768 dives per site per year for each carrying capacity level; b= no. additional dives divided by 4 (the average no. dives done per diver per trip, Chapter 1); c= average cost per dive is US$40 (Chapter 4); d= no. additional dives multiplied by (0.25 x 40 ) (mean no. contacts per min x mean time spent on dive in mins, Chapter 2); e= contact rates reduced by half and two-thirds with dive leader intervention (by half for boat dives only, and by two-thirds for both boat and shore dives).
184
An increase in the number of divers, and therefore dives, would result in-
further reef damage, the magnitude of which would depend on the presence or
absence of diver-intervention measures, and on other pressures related to human
activities. Pressures could act individually or synergistically with diver pressure thus
reducing a site's ability to withstand particular carrying capacities. To predict the impact of increased dives, detailed records of numbers and distribution
of users, including snorkelers, are required, however no such data are currently
available. Companies should also take into account the fact that crowding may become a problem, which could prevent them from expanding to the maximum
potential carrying capacities at individual sites. Crowding is an issue that has already detracted from visitors' enjoyment of St. Lucia's reefs, particularly so for divers
(Chapter 5).
A summary of options for managing St. Lucia's reef tourism is shown
overleaf (Table 6.4).
185
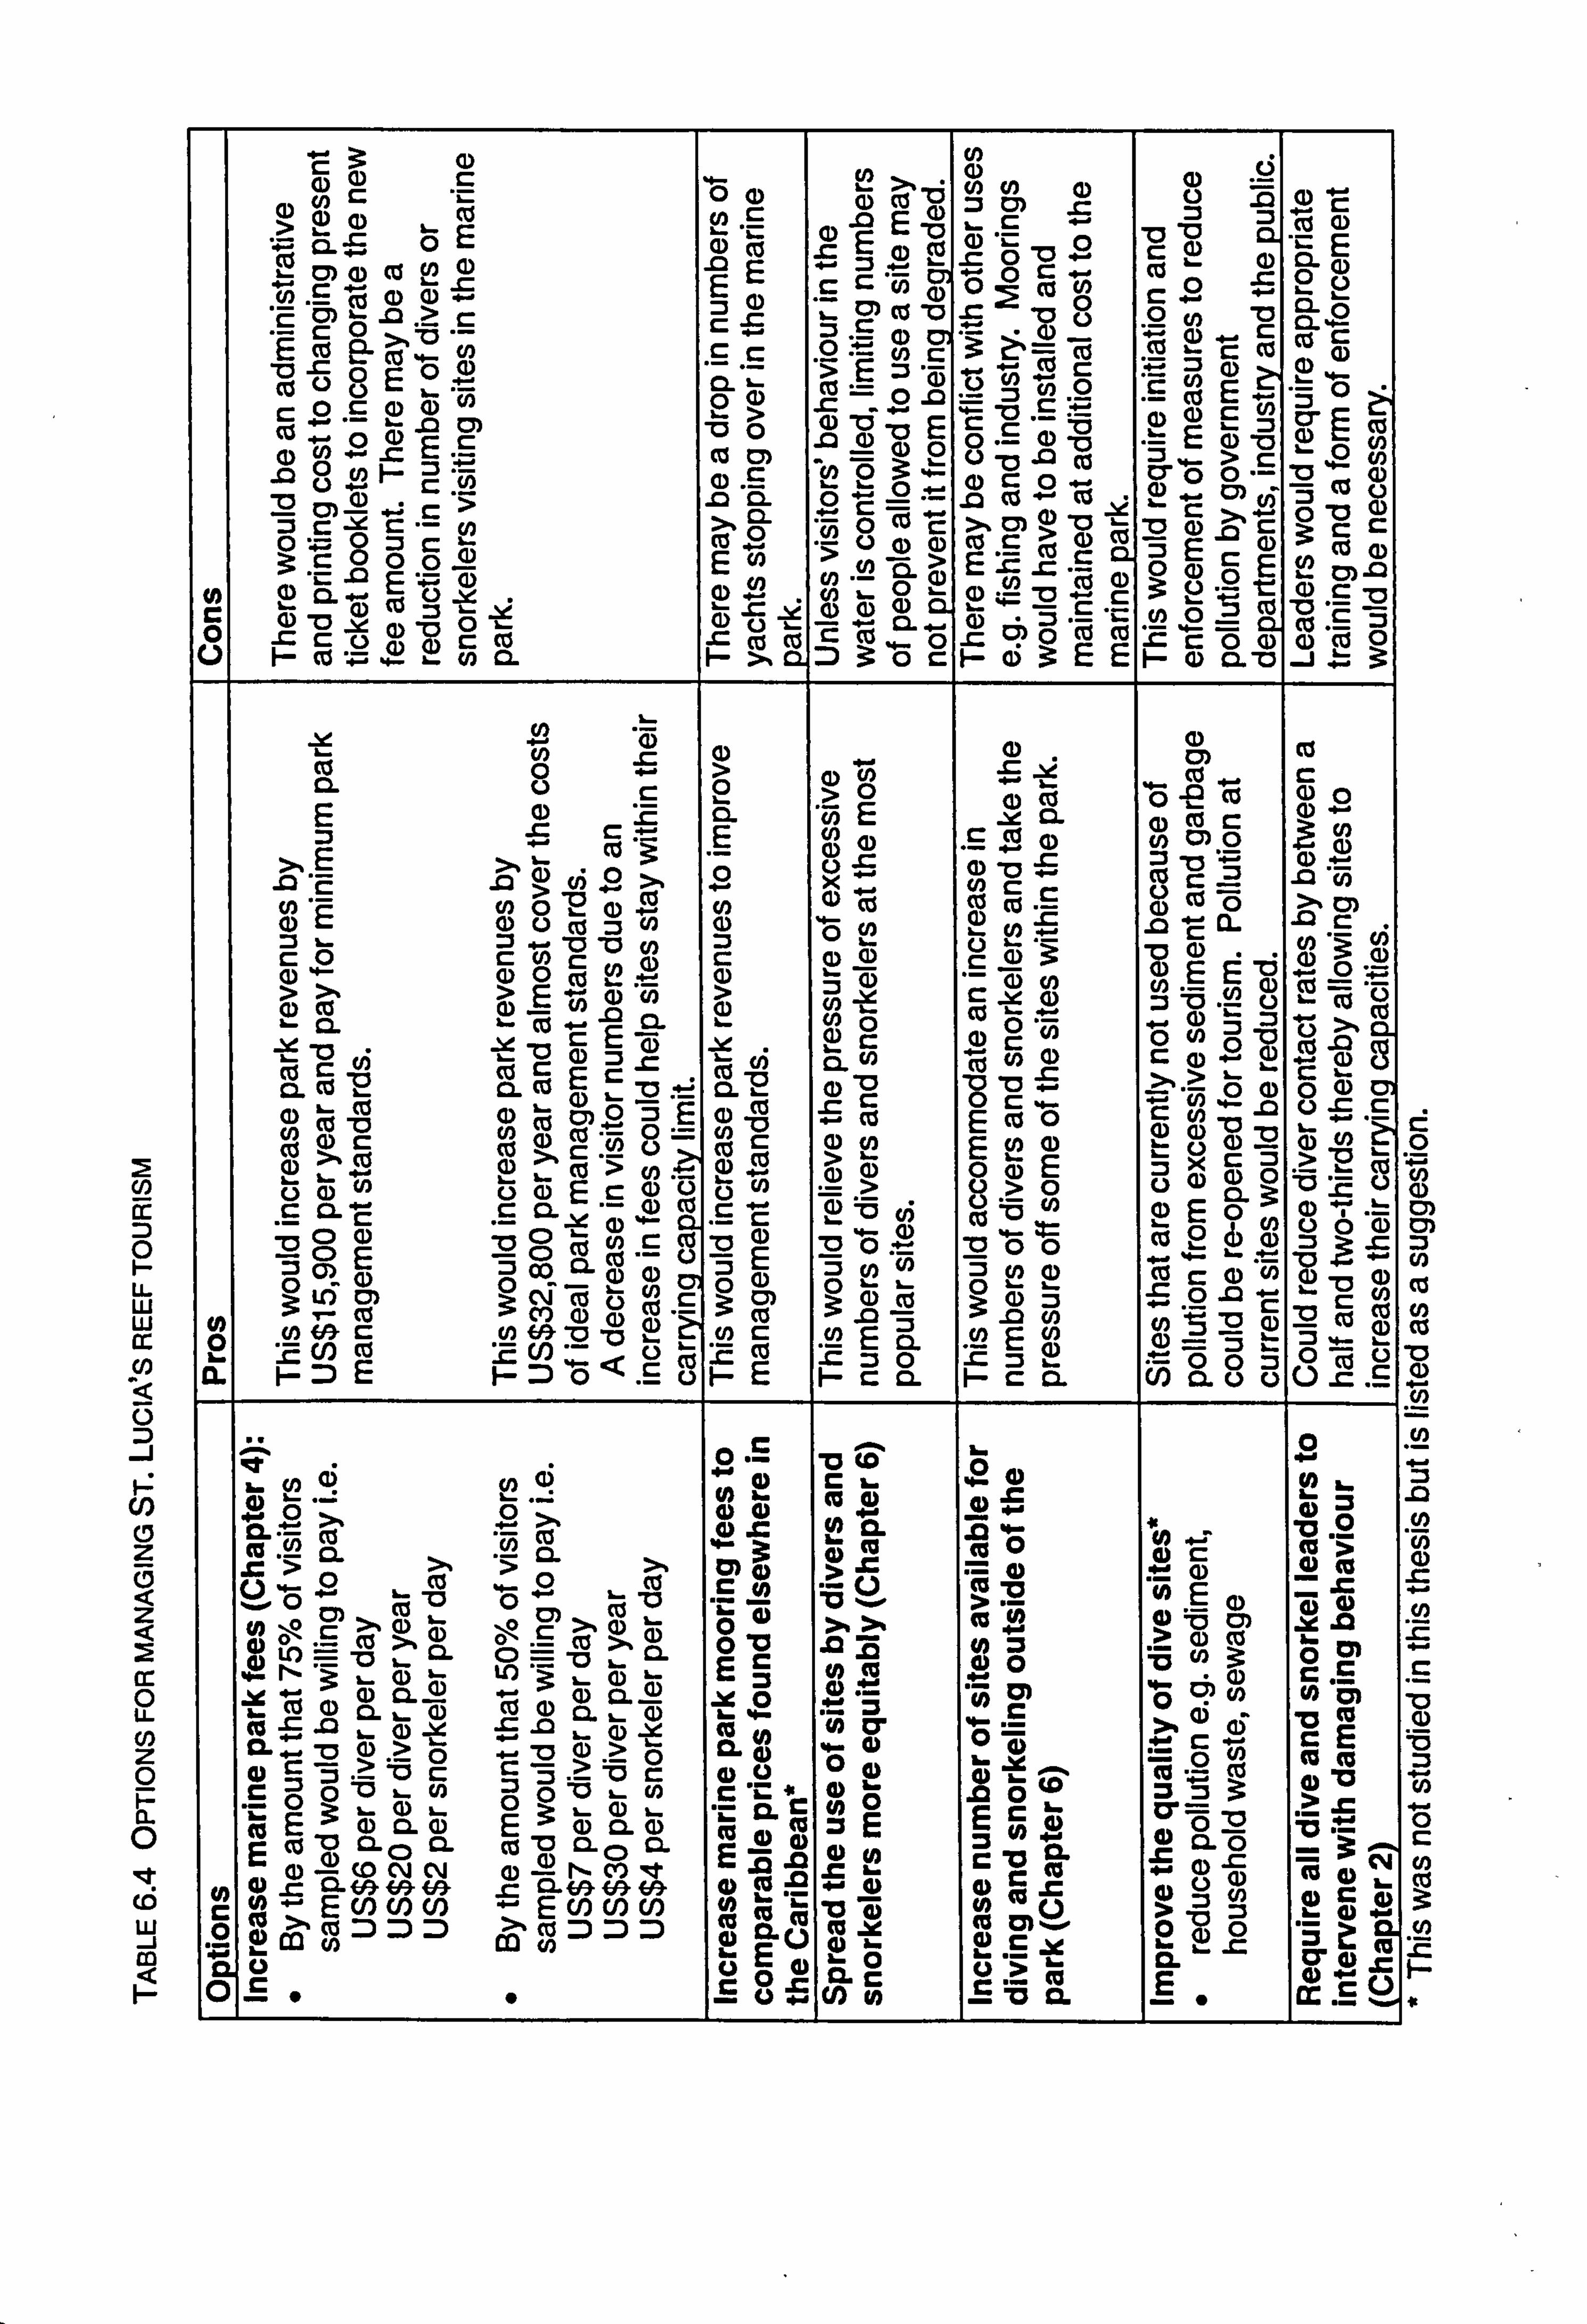
2 U) cc 0
LLI uj
C/) 0 z 0 z
W 0 LL (1) z 0
0
It c. 6 LU -j m
(0 r- (D (D (D > %r_ 0'- E w -M (D (0 (0 (D
(D (D
E ID E 0' .
'a' 0 0c0 ý -- ß_ M rn
0 0 (0 ýmE -E- .00 (0 :3 :2
Qýc AO 22 c» A r- >
-2 -; = 0Z r- 5000 (D
0 c2. *ý (D 0
+Z 4- ß_ CO CL
e5 0 (D
E :3 (D r -.
5
C. C Z: c2- h- (D > cm c:
(0 0 Co E (0 (D
-12 Cö (Z ý- >, c2..
E2 -, v (D Co
k- Cr, a U) (1) cm (Z «a E- 0 cm 0 :2 U) r *5; E 23 a5 (D (0 . -- 00
-0 E G) ID
"C0 0- n0 - .- CJ 00 >
0-U> 0.0 0" cn L- (D e) G) CL
-E z5 ci ý Z) ý: '*0 E
0 cn 0)
0 M0 «0 ý -0c- 02 (0 U) 0 m *0 C) : ý2 -0 22, = -ca (Z r =
(0 .0
z5
-0 L- :2 c '0 0. E 0 cj 00 -0 0 r- 0 m cu CU - >, CMO-oe Co c>0 cö E=-cur-c1 M -ia 2 -0 ýr .- 0' -5 .2= a Co (0
F- ei EE
C) 72
(U b.. (D
0 cý 4- 2 CI) *ýr- (D
. Co = 0 U) (Z E
0 (D r- (n &- :3 E0 -0 :3ý> Cy 00
a) 1- V00 r-
-0 5EC 0 (D 0E ýc 2 -ü 1-- Co (0 0
:a c2.
F-- 0 (2. -00
9) -0-
c CD- (D
"- CL 0 CL ý CU r- U) (D
cr 9 cö 0) (X "0 cn
ýc r_ c: Co (D
T r» m 0 c: «a *F tu
-, Di
ý1
Co 0 > (DO (D m -ý2
c3) Co
Co c
L- >0 0 tu ý C) 2 (D0
(D Z] m C- CL
(n -2 92. C (U ti-,
r- (0 CM 0 U)
E >% " m l? vi 0 -Ij - 0 m 0 x 0m (0 c
Z] -0 r- Co c: 0=
.2 (0 0,2 0 öE a) CJ (n 0 (D 0 0 Co Q (D CL
c0 r- U) r- (D r- 00
« - 0 « a E2 0 CO 5 >, >E- G) Co a) >
h- 5 Z JL,
. - a (1) r- -'4 0
09ý , m (0 .- in U) 0 :1 -0 -M .2:! 2
-a ci co cö 0- CO CL E -ö
0 (0 %. _ 0 (D r
CO "ý 0 v) (D
. - ,0"Z 0 cn :30
Co - 0 >% Cl
0cE r- O - '0 « > k' CL 0 CL (U 2 a) " (Z
0 cm 0 :3E 2 C L cö
(D «a (D M c: ýW
aý 0 r- ý E Co 0 -- 0 (D
-E tun) -0 C u) 0 a) U ci Z- c
Co :20 . - Cö u) 0- (U Co >, r- . - 2ý >
(n (0 C
0 Co (D fA > b-
20 E > '2 - Co Cö (0
E > - 0m
>0 L (D 0
CL ý. ' CL ý c: ci .- 0) (U ýe 0) ý- Cl . E- c c: -
- r_ (D c 3 U) b».
a (0 cu 00 E k (0 (D - =
o6 «rD - . c3 (D 0 Co -0 C: ) �a in r- CD - C: ) - 'u
-a 0 0 «a 'ö «a 00 - 0
'. 6 u)
5 Co E 131 g) 0(! CL C) 0 75 E (D :3 E2 :3 12 0 (Z c: 0 (0 m (D -" U) LO CY) cy (0 c
0 CI) (D 3: c3)
(Z (D Co
m 0 ß_ (D :3 = C) Z:
« r
0 (a r_ (n ia M0 ig) 27 -Z - . - 0 r- In Ea cn
An E 'n (n 5 T3 Q) 9) = 75 " :3 ý6- Z 2 k. . - 1 0 :E cö E -Z5 <. E (0 M
F-- E mZ0 0 :3 L 00" 0
0 -ýU- ci
qe
, Ei 0A *W 4) (0
r- a. - a) b- .-2 . _: J. 0 >, 0 >ý : t-
0 a- 0) 0 12 -00 _ CL Cö D CD. >
. 0 M
j2 >
, > > e%, 0 (0 -0 (Z
-0- CY) C) r- 0
> :a CJ Co «Ui E
Co :: m ID o m
Co) >2 r >% (D 0m >% gý " (D (D r 0
* :: >
*- 0 (D b cm (0
bit m 4) 0. (ö >,
K- 0. 4) LO =- -0 - CL C ýE -0 0 0
E 12 72 0
00 . 2: (1)
10 w ý: b- 0 01
(D (D «
3 ö Cö (D 0.1.. G) 0 (D 0. -
16. -4- . - 0
r_ 9) 6 2r ý
-0 r_
CL: ý: -0 (1) > -0 2: 0 4) c: Z :3-
0.4) 4- 0 4) 11- x
- -r tu Co
V r 0 Co 00M . i: 00 (D
E E (1) 4) Co 0 ZE
j2 0 E :r 0 cr = 0
> CL 0 0-0 Co "3 '0"- 0' 2- C) E0 A E E- cm
0 m (0 cm cm CD r, e2 e 0 -c
0- te c2. ja v> Qqý 0 MM . " M *.. 0 C Co
0 Co m (D 00 (n
001.. r
r- 0ý-E cn (n (n 0E cn cn m > - r_ - 0 tu tu cu «a Z 0 0
0M Z 9
-a :3 -0 2 tu *- 0 , cö :D :D :D >ý 0 :D- DZ 0 Mo m omo E m -he 2. -
-0 0 r- he h. 20 i2 CL cr n 0 0
ýE 0 0 so 0 CL
S :a CL CL (L) m 4)
,0 -. 0 1.
e .2 (D cm C»
Co Co cu
0
. Co
M
cn
6.5 CONCLUSION
Managers of coral reefs need to implement a mixture of regulatory measures
to maximise benefits from tourism whilst maintaining the quality of the resource. There needs to be a much more careful allocation of numbers of divers and snorkelers
to sites, and sites need to be matched with activities based on their ability to absorb damage resulting from them. Training dives for example, should only be allowed at
sites without corals or other susceptible life forms. Management options should include a combination of tourist-impact amelioration measures such as: provision of
moorings, walkways and pontoons; limitations on numbers of people allowed at sites
over a given period; closer supervision of divers and snorkelers, and increasing sites
available for use. Fees from divers and snorkelers in addition to yacht mooring fees
could meet the cost of implementing reef management measures. Fees are currently low compared to overall trip costs or what people are willing to pay, and yacht
mooring costs are lower in St. Lucia than elsewhere in the Caribbean. Diver,
snorkeler and yacht mooring fees could be increased, particularly if regions are
attracting a higher-paying clientele.
St. Lucia, like other small islands, has a growing tourism industry based on its
reefs. With the growing quest for natural and unspoilt coral reefs, these islands are in
a prime position to benefit from marketing their product to the high-value tourist. By
adopting the management options outlined in this chapter, in combination with tighter
regulations of other, often land-based, activities that affect the marine environment,
countries could protect their coral reefs whilst simultaneously accommodating an
expansion in their tourism industry.
187
6.6 REFERENCES
Becken, S. 2002. Analysing international tourist flows to estimate energy use associated with air travel. Journal of Sustainable Tourism 10: 114-13 1.
Britton, R. A. 1977. Making tourism more supportive of small-state development: the case of St. Vincent. Annals of Tourism Research 4: 268-278.
Bryant, D., Burke, L. McManus, J. & M. Spalding. 1998. Reefs at Risk. A Map- Based Indicator of Threats to the World's Coral Reefs. Washington, D. C.: World Resources Institute, 56 pp.
Burke, L., Selig, E. & M. Spalding. 2002. Reefs at Risk in Southeast Asia. World Resources Institute, Washington, USA, 72 pp.
Butler, R. W. 1980. The concept of a tourist area cycle of evolution: implications for
management of resources. Canadian Geographer 24: 5-12.
BVI: British Virgin Islands Ports Authority. 2003. http: //www. bviports. org/newpagel2. htm
Chua, C. Y. Y. & L. M. Chou. 1994. The use of artificial reefs in enhancing fish
communities in Singapore. Hydrobiologia 285: 177-187.
Clark, J. R. (ed. ). 199 1. Carrying Capacity: A Status Report on Marine and Coastal Parks and Reserves. Report prepared by the participants of the Third International Seminar on Coastal and Marine Parks and Protected Areas, Miami, Florida and Costa Rica, 11 May-5 June. In: Davis, D. & V. J. Harriott. Sustainable tourism development or a case of loving a special place to death? In: Harrison, L. C. & W. Husbands. (eds). 1996. Practicing Responsible Tourism: International Case Studies in Tourism Planning, Policy, and Development. John Wiley & Sons, Inc., NY, USA, 590 pp.
Costanza, R., Arge, R. d', Groot, R. de, Farber, S., Grasso, M., Hannon, B., Limburg, K., Naeem, S., O'Neill, R. V., Paruelo, J., Raskin, R. G., Sutton, P. & M. van den Belt. 1997. The value of the world's ecosystem services and natural capital. Nature 387: 253-260.
Cumberbatch, C. A. N. 2000. Using Economic Instruments to Manage the Impacts of Recreational Scuba Diving in Marine Protected Areas: An Authentic 'Eco-Eco' Approach. M. Sc. dissertation, University of York, UK, 79 pp.
Davis, G. E. 1977. Anchor damage to a coral reef on the coast of Florida. Biological Conservation 11: 29-34.
188
Dixon, J. A., Scura, L. F. & T. van't Hof. 1993. Meeting ecological and economic goals: marine parks in the Caribbean. Ambio 22: 117-125.
Dixon, J. A., Scura, L. F. & T. van't Hof. 1994. Ecology and Microeconomics as 'Joint Products': The Bonaire Marine Park in the Caribbean. In: Perrings, C. A., Maler, K. -G., Folke, C., Holling, C. S. & B. -O. Jansson (eds). 1994. Biodiversity Conservation: Problems and Policies, Kluwer Academic Publishers, The Netherlands, pp. 120-138.
Garrabou, J., Sala, E., Arcas, A. & M. Zabala. 1998. The impact of diving on rocky sublittoral communities: A case study of a Bryozoan population. Conservation Biology 12: 302-312.
Gell, F. R. & C. M. Roberts. 2002. The Fishery Effects of Marine Reserves and Fishery Closures. WWF-US, 1250 24 th Street, NW, Washington, DC 20037, USA.
Gell, F. R., Roberts, C. M., Hubert, P., Hawkins, J. P., Goodridge, R., Oxenford, H. A., Joseph, W. & S. N. George. In prep. a. The rate and trajectory of recovery of fishes adjacent to marine reserves.
Gell, F. R., Roberts, C. M., Hawkins, J. P., Goodridge, R. & H. A. Oxenford. In prep. b. The effects of marine reserves on reef fish populations and catch composition.
G6ssling, S. 2000. Sustainable tourism development in developing countries: some aspects of energy use. Journal of Sustainable Tourism 8: 410-425.
G6ssling, S., Borgstr6m Hansson, C., H6rstmeier, 0. & S. Saggel. 2002. Ecological footprint analysis as a tool to assess tourism sustainability. Ecological Economics 43: 199-211.
Harriott, V. J., Davis, D. and S. A. Banks. 1997. Recreational diving and its impacts in marine protected areas in eastern Australia. Ambio 26: 173-179.
Hawkins, J. P., & C. M. Roberts. 1993. Effects of recreational diving on coral reefs. Trampling of reef flat communities. Joumal ofApplied Ecology 30: 25-30.
Hawkins, J. P. & C. M. Roberts. 1997. Estimating the carrying capacity of coral reefs for scuba diving. Proceedings of the Eighth International Coral Reef Symposium 2: 1923-1926. Smithsonian Tropical Research Institute, Balboa, Panama.
Hawkins, J. P., Roberts, C. M., Van't Hof, T., de Meyer, K., Tratalos, J. & C. Aldam. 1999. Effects of recreational scuba diving on Caribbean coral and fish communities. Conservation Biology 13: 888-897.
189
Inskeep, E. 1992. Sustainable tourism development in the Maldives and Bhutan. Industry and Environment 15: 31-36.
Jameson, S. C., Ammar, M. S. A., Saadalla, E., Mostafa, H. M. & B. Riegl. 1999. A coral damage index and its application to diving sites in the Egyptian Red Sea. Coral Reefs 18: 333-339.
Kay, A. M. & M. J. Liddle. 1989. Impact of human trampling in different zones of a coral reef flat. Environmental Management 13: 509-520.
Ko Olina Marina. 2003. http: //www. koolinamarina. com/slips. htm
Lee, C. & S. Han. 2002. Estimating the use and preservation values of national parks' tourism resources using a contingent valuation method. Tourism Management 23: 531-540.
Lindberg, K. & D. E. Hawkins (eds. ). 1993. Ecotourism: A Guidefor Planners and Managers. The Ecotourism Society, VT, 175 pp.
Lindberg, K. 200 1. Protected Area Visitor Fees: Country Review. Document prepared for the "Generating Revenue Through Ecotourism for Marine Protected Areas in Belize", conducted by The International Ecotourism Society and Programme for Belize, 30 pp.
Mead, S. & K. Black. 1999. A multipurpose, artificial reef at Mount Maunganul Beach, New Zealand. Coastal Management 27: 355-365.
Medio, D. 1996. Sustainable Tourism Development in the Ras Mohamed National Park, Egypt. In: Swanson, T. M. Ugalde, C. F. & R. A. Luxmore. Survey of Wildlife Management Regimesfor Sustainable Utilization. World Conservation Monitoring Centre, Cambridge.
Miller, M. L. & J. Auyong. 1991. Coastal zone tourism. A potent force affecting environment and society. Marine Policy 15: 75-99.
Mundet, L. & L. Ribera. 2001. Characteristics of divers at a Spanish resort. Tourism Management 22: 501-5 10.
Musa, G. 2002. Sipadan: a SCUBA-diving paradise: an analysis of tourism impact, diver satisfaction and tourism management. Tourism Geographies 4: 195-209.
190
Muthiga, N. A. & T. R., McClanahan. 1997. The effect of visitor use on the hard coral communities of the Kisite Marine Park, Kenya. In: Proceedings of the Eighth International Coral Reef Symposium, Smithsonian Tropical Research Institute, Balboa, Panama 2,1879-1882.
NOAA: National Oceanic and Atmospheric Administration. 2003. http: //www. sanctuaries. nos. noaa. gov/scied/habitat/research. html
Orams, M. 1999. Marine Tourism: Development, Impacts and Management. Routledge, London, 115 pp.
Ormond, R., Hassan, 0., Medio, D., Pearson, M. & M. Salem. 1997. Effectiveness of coral protection programmes in the Ras Mohamed National Park, Egyptian Red Sea. Proceedings of the Eighth International Coral Reef Symposium, Smithsonian Tropical Research Institute, Balboa, Panama 2: 1931-1936.
Prior, M., Ormond, R., Hitchen, R. & C. Wormald. 1995. The impact of natural resources of activity tourism: A case study of diving in Egypt. International Journal of Environmental Studies 48: 201-209.
RAC: Resource Assessment Commission. 1993. The Carrying Capacity Concept and Its Application to the Management of Coastal Zone Resources. Information paper No. 8. Canberra Coastal Zone Inquiry, Australian Government Publishing House. In: Davis, D. & V. J. Harriott. 1996. Sustainable Tourism Development or a Case of Loving a Special Place to Death? pp. 422-444. In: Harrison, L. C. and W. Husbands (eds). Practicing Responsible Tourism: International Case Studies in Tourism Planning, Policy, and Development. John Wiley & Sons, Inc., NY. 590 pp. Rajasuriya, A., Ranjith, M. W., De Silva, N. & M. C. Ohman. 1995. Coral reefs of Sri Lanka: human disturbance and management issues. Ambio 24: 428-437.
Ramsamy, S. 1992. Tourism development and the environment at island destinations: the example of Mauritius. Industry and Environment 15: 37-41.
Riegl, B. & B. Velmirov. 1991. How many damaged corals in Red Sea reef systems? A quantitative survey. Hydrobiologia 216/217: 249-256.
Roberts, C. M., Bohnsack, J. A., Gell, F., Hawkins, J. P. & R. Goodridge. 2001. Effects of marine reserves on adjacent fisheries. Science 294: 1920-1923.
Rodenburg, E. E. 1980. The effects of scale in economic development. Tourism in Bali. Annals of Tourism Research 7: 177-196.
Rouphael, A. B., and G. J. Inglis. 1997. Impacts of recreational scuba diving at sites with different reef topographies. Biological Conservation 82: 329-336.
191
Rouphael, A. B., & G. J. Inglis. 2001. "rake only photographs and leave only footprints"?: An experimental study of the impacts of underwater photographers on coral reef dive sites. Biological Conservation 100: 281-287.
Salm, RN. 1986. Coral reefs and tourist carrying capacity: the Indian Ocean experience. UNEP Industry and Environment Jan-Mar: 11-14.
Schelten, C. 2002. The Impacts of Multiple Stresses on the Replenishment of Coral Communities. PhD thesis, Environment Department, University of York, York, UK. 320 pp.
Schleyer, M. H. & 13J. Tomalin. 2000. Damage on South African coral reefs and an assessment of their sustainable diving capacity using a fisheries approach. Bulletin of Marine Science 67: 1025-1042.
Shah, N. J., Linden, 0., Lundin, C. G. & R. Johnstone. 1997. Coastal management in Eastern Africa: status and future. Ambio 26: 227-234.
Sladek Nowlis, J., Roberts, C. M., Smith, A. H. & E. Siirila. 1997. Human-enhanced impacts of a tropical storm on nearshore coral reefs. Ambio 26: 515-521.
Spalding, M. D., Ravilious, C. & E. P. Green. 2001. WorldAtlas of Coral Reefs. Prepared at the UNEP World Conservation Monitoring Centre. University of California Press, Berkeley, USA, 424 pp.
Tissot, B. N. & D. M. Brosnan. 2002. Long term coral reef monitoring programs: working towards a synthesis of science, management and policy, pp. 89-92. In: Best, B., Pomeroy, R. & C. Balboa (eds). Implicationsfor Coral Reef Management and Policy: Relevant Findingsfrom the 9th International Coral Reef Symposium, U. S. Agency for International Development, Washington, D. C., 115 pp.
Tratalos, J. A. & T. J. Austin. 2001. Impacts of recreational SCUBA diving on coral communities of the Caribbean island of Grand Cayman. Biological Conservation 102: 67-75.
Vanclay, F. M. 1988. Tourist Perceptions of the Great Barrier Reef. Report to the Great Barrier Reef Marine Park Authority, Townsville, Australia, 103 pp.
Visser, N. & S. Njuguana. 1992. Environmental impacts of tourism on the Kenya coast. Industry and Environment 15: 42-52.
Walpole, M. J., Goodwin, H. J. & K. G. R. Ward. 2001. Pricing policy for tourism in protected areas: lessons from Komodo National Park, Indonesia. Conservation Biology 15: 218-227.
192
Wells, M. P. 1997. Economic Perspectives on Nature Tourism, Conservation and Development. Departmental working paper No. 55, Environmental economics series Pollution and Environmental Economics Division of the World Bank.
Westmacott, S., Pet-Soede, L. & H. Cesar. 2000. Assessment of the Socio-Economic Impacts of the 1998 Coral Reef Bleaching in the Indian Ocean. Report prepared for the CORDIO programme Coral Reel Degradation in the Indian Ocean, 149 pp.
Wilhelmsson, D., Ohma, M. C., Stdhl, H. & Y. Shlesinger. 1998. Artificial reefs and dive tourism in Eilat, Israel. Ambio 27: 764-766.
Woodland, D. J. & J. N. A. Hooper. 1977. The effect of human trampling on coral reefs. Biological Conservation 11: 1-4.
WTTC: World Travel and Tourism Council, 2002. Saint Lucia Travel & Tourism: A World of Opportunity, WTTC, London, UK, 28pp. http: //www. wttc. org/measure/PDF/Saint%20Lucia. pdf
WTO: World Tourism Organisation, 2002. Tourism Highlights 2002,7pp. http: //www. world-tourism. org/market-research/facts&figures/latest. -data/ Mje. %20Highlights%202002%20INGLES. pdf
Zakai, D. & N. E. Chadwick-Furman. 2002. Impacts of intensive recreational diving
on reef corals at Eilat, northern Red Sea. Biological Conservation 105: 179-187.
193
Chapter 7: General discussion
The aims of this thesis were to: (1) determine the damage that divers and snorkelers inflicted on reefs and whether
visitor, dive/ snorkel leader, or site characteristics could be used as predictors of damage;
(2) determine the economic gains from dive and snorkel tourism for the country's
tourism industry, for the dive and snorkel companies and for the marine park, and
whether visitors would be willing to pay more to use sites within the marine park
than they were currently paying; (3) determine whether the quality of the reef environment affected visitor
appreciation and how visitor perception of reef quality compared with biological
and physical attributes measured by professional ecologists;
and (4) use the information derived from the above to estimate the capacity of different
reef sites for diving and snorkeling.
The degree to which these aims were achieved is discussed below.
7.1 PREDICTING DAMAGE TO REEFS
Observations of divers and snorkelers swimming on St. Lucia's reefs indicated that
damage by diving or snorkeling could be predicted from diver and snorkeler, dive and
site characteristics (Chapters 2 and 3). Trends found linking increased damage levels
with the beginning of dive or snorkel excursions and use of a camera were similar to
other observation studies done on reefs elsewhere. Despite the similarity between
divers and snorkelers in more frequent contacts with the reef occurring early on during their dive or snorkel excursion, the underlying behaviours that produce this
194
pattern are different for the two groups. Divers spent their first few minutes adjusting their equipment, and on shore dives, they had to swim over reef in shallow water,
which brought them closer to the sea floor. In contrast to divers, snorkelers have less
equipment to deal with and so most of their contacts are most likely due to walking
across the reef in shallow water until it is deep enough to swim. This research also revealed that higher levels of diver damage were recorded
at night versus diving in the day, and on shore versus boat dives. It should be noted that the site used for shore and night diving in St. Lucia however, had reef formations
starting at a depth of 2-3m and divers endeavoured to drop below the surface of the
water even in these shallow depths, which necessarily brought them close to the reef. It is possible that diver contact with the reef on those dives could therefore be higher
than expected for shore diving elsewhere if reefs are at greater depths.
This study is also among the few, if not the first, to quantify snorkeler damage. Snorkelers who wore a life vest had virtually no contacts with the reef since the inflated vests kept them on the surface of the water and snorkelers overall had
generally far fewer contacts with the reef than divers. However, the popularity of
certain sites for snorkeling means that damage by snorkelers at these sites could equal that of a few divers (Chapter 3). Many of St. Lucia's reefs are in relatively deep
water and certainly not exposed at low tide, and so snorkeler contacts with the reef
were mostly minimal. Reefs elsewhere in the world, which are in shallow water,
such as those in the Indo-Pacific, are more likely to be trampled by snorkelers. Total
impact by snorkelers on reefs would probably be greater than observed here for St.
Lucia, since I recorded mainly impacts from swimming and none from snorkelers
walking on reef. Although briefing by dive leaders has been cited as one of the most effective
ways of reducing diver damage to reefs, my research indicated that if briefings were
given by local staff, whether to divers or snorkelers, it had no such effect (Chapters 2
and 3). It is possible that if briefings had been more detailed, visitors would have
been more careful, but given the time constraints by which most tour businesses
195
operate, it appears that briefings alone are insufficient to make any difference. If
transport to a dive site is sufficiently long, and boat engine noise pem-lits, briefings
can be given effectively on the boat. Extended periods spent talking with visitors,
giving them information on marine life and how the latter might be affected by their
impacts can only be beneficial. In Medio et al. 's (1997) study, there was opportunity
to do this (boat journeys were typically over 30mins), and divers spent the entire
week diving on the reeL After receiving a full briefing once, shorter briefings were
carried out. However, for many companies, new divers arrive daily, sites are much
closer, boats are too noisy and schedules too tight. In such cases, extra vigilance and
intervention by group leaders is necessary (Chapter 2). Only then can visitors'
behaviour be noticed and dealt with. In fact, comments from visitors that I
interviewed indicated that they had not been aware of their impacts to the reef and
certainly did not mind being asked to change their behaviour in order to reduce their
damage to the reef. Visitors even reported enjoying their dives less because they saw
other divers damaging the reef (Chapter 5). Intervention and management of visitors
would therefore reduce damage to the reef and ensure that visitors' experience of the
reef was not spoilt by the behaviour of others.
7.2 THE SOCIO-ECONOMIC IMPACT OF DIVE AND SNORKEL TOURISM
The socio-economic value and importance of St. Lucia's reefs was apparent from the
considerable revenue reaped from reef tours by dive and snorkel businesses and the
fact that most jobs within those businesses were being done by St. Lucians (Chapter
4). The value of reefs in St. Lucia's marine protected area was highlighted by what
visitors were willing to pay to visit them and by the fact that almost half of visitors
said the presence of the protected area influenced their decision to visit the island.
What also became apparent was that the fees to visit sites in the protected area were
probably too low. My interviews with divers and snorkelers showed that virtually all
of them would be willing to pay above the current fee. The fees could probably be
196
raised substantially without causing a noticeable reduction in visitor numbers to those
sites. However, even if numbers were reduced, this could have a positive effect due
to fewer people visiting the sites resulting in less pressure and associated impacts.
Fewer divers may also make it easier to keep within the theoretical carrying capacity (Chapter 6).
7.3 VISITOR PERCEPTIONS OF REEF ATTRIBUTES
The ecological quality of the reef, represented by fish and coral, and physical
parameters affected visitors' appreciation of it. The most important motive for divers
and snorkelers was seeing marine life and despite St. Lucia having few large animals,
visitors still enjoyed their visit to the reef (Chapter 5). This is probably because the
sites they were taken to were of good enough quality, apart from a handful of sites
that stood out as being particularly polluted with garbage or with a lot of damaged
coral (Chapter 5). Although visitors' recollections of certain things, such as numbers
of fish and amount of coral in general were not accurate, they were aware of different
sizes of fish, water clarity and garbage. One problem with comparing people's
perceptions of, for example, numbers of fish with measurements taken by scientists of fish numbers is that we are comparing things of different magnitude. One is an
overall impression of a site with respect to fish, and the other is a very precise
measurement. Bearing this in mind, we should therefore not expect to always find
that the two are linked, and that we should consider alternative methods. The results from this study, however, indicate that marine park managers and tourist businesses
could put more effort into informing visitors about the marine life that is present. They could explain why certain sites might have more damaged coral or sediment
than others and thereby justify why certain restrictions or controls are in place. Local
communities and authorities could also be targeted to reduce garbage and waste
entering the marine environment. In addition, government agencies and planning
197
authorities could be alerted as to how their activities affect the quality of the marine
environment, and the tourism which depends on it.
7.4 CARRYING CAPACITIES OF ST. LuciA'S REEFS
The spread of diving and snorkeling activity on St. Lucia's reefs is currently heavily
biased towards sites within the marine park compared to those outside (Chapter 6).
There are also two sites within the park that are particularly popular with dive
companies, due to their close proximity to resorts, and therefore easy access, and/or
due to marketing. As a result, tourists coming to St. Lucia strive to visit these sites.
One site, Anse Chastanet, received 20% of all diving activity over the period of the
study, amounting to about 28,000 dives per year. This was well above theoretical
carrying capacity suggested by other researchers (Chapter 6). Carrying capacities
could be increased if dive leader intervention measures (Chapter 2) were adopted,
possibly increasing the maximum theoretical values of 7,000 dives per site per year
by 2-3 fold. Similar intervention by snorkel leaders could raise the carrying
capacities of snorkeling sites.
Clearly, sites exposed to additional pressures, such as sediment pollution from
nearby rivers, organic or chemical waste from human settlement, agriculture and
industry, and sites that have suffered from disease or storm damage, may require
lower carrying capacities to be set.
7.5 CONCLUSION AND IMPLICATIONS FOR MANAGEMENT
The information on dive site use throughout St. Lucia (Chapter 6) shows that certain
sites are far more popular than others. This together with evidence of tourist impacts
to reefs (Chapters 2 and 3) and visitors' and dive business members' perceptions of them (Chapter 5), indicate that some of St. Lucia's reefs are probably being degraded
because of over-use and damage by tourists and pollution from other human
198
activities. Management of St. Lucia's reefs therefore needs to take intý account the
various impacts to the marine environment and act on them. St. Lucia's marine
protected area is a popular attraction with visitors and these same visitors could help fund more of the management costs if user fees (Chapter 4) and yacht mooring fees
were increased (Chapter 6). Management strategies include increased visitor supervision, limitations put
on the number of divers and snorkelers allowed to use any one site over a given time
and establishment of new sites so as to increase the number of sites available for
tourism. Enforcement of regulations would necessarily require increased patrolling
and monitoring by marine park staff and funding for this could come from increased
user and mooring fees (Chapters 4 and 6).
Other negative impacts, including sediment and garbage pollution which
reduce the aesthetics of the reefs and detract from visitors' enjoyment, could be
reduced by improving waste treatment and garbage disposal.
The quality of the marine environment is important to both tourists and
residents and impacts that reduce reef quality could affect the viability of industries
that rely on that resource. Tourists contribute substantially to St. Lucia's economy and could potentially contribute more to funding the management and protection of its marine resources. A combination of managing visitor behaviour, site use, land-
based activities, public education and enforcement of marine park regulations could help make St. Lucia's reef-tourism a long-term, profitable and sustainable venture.
199
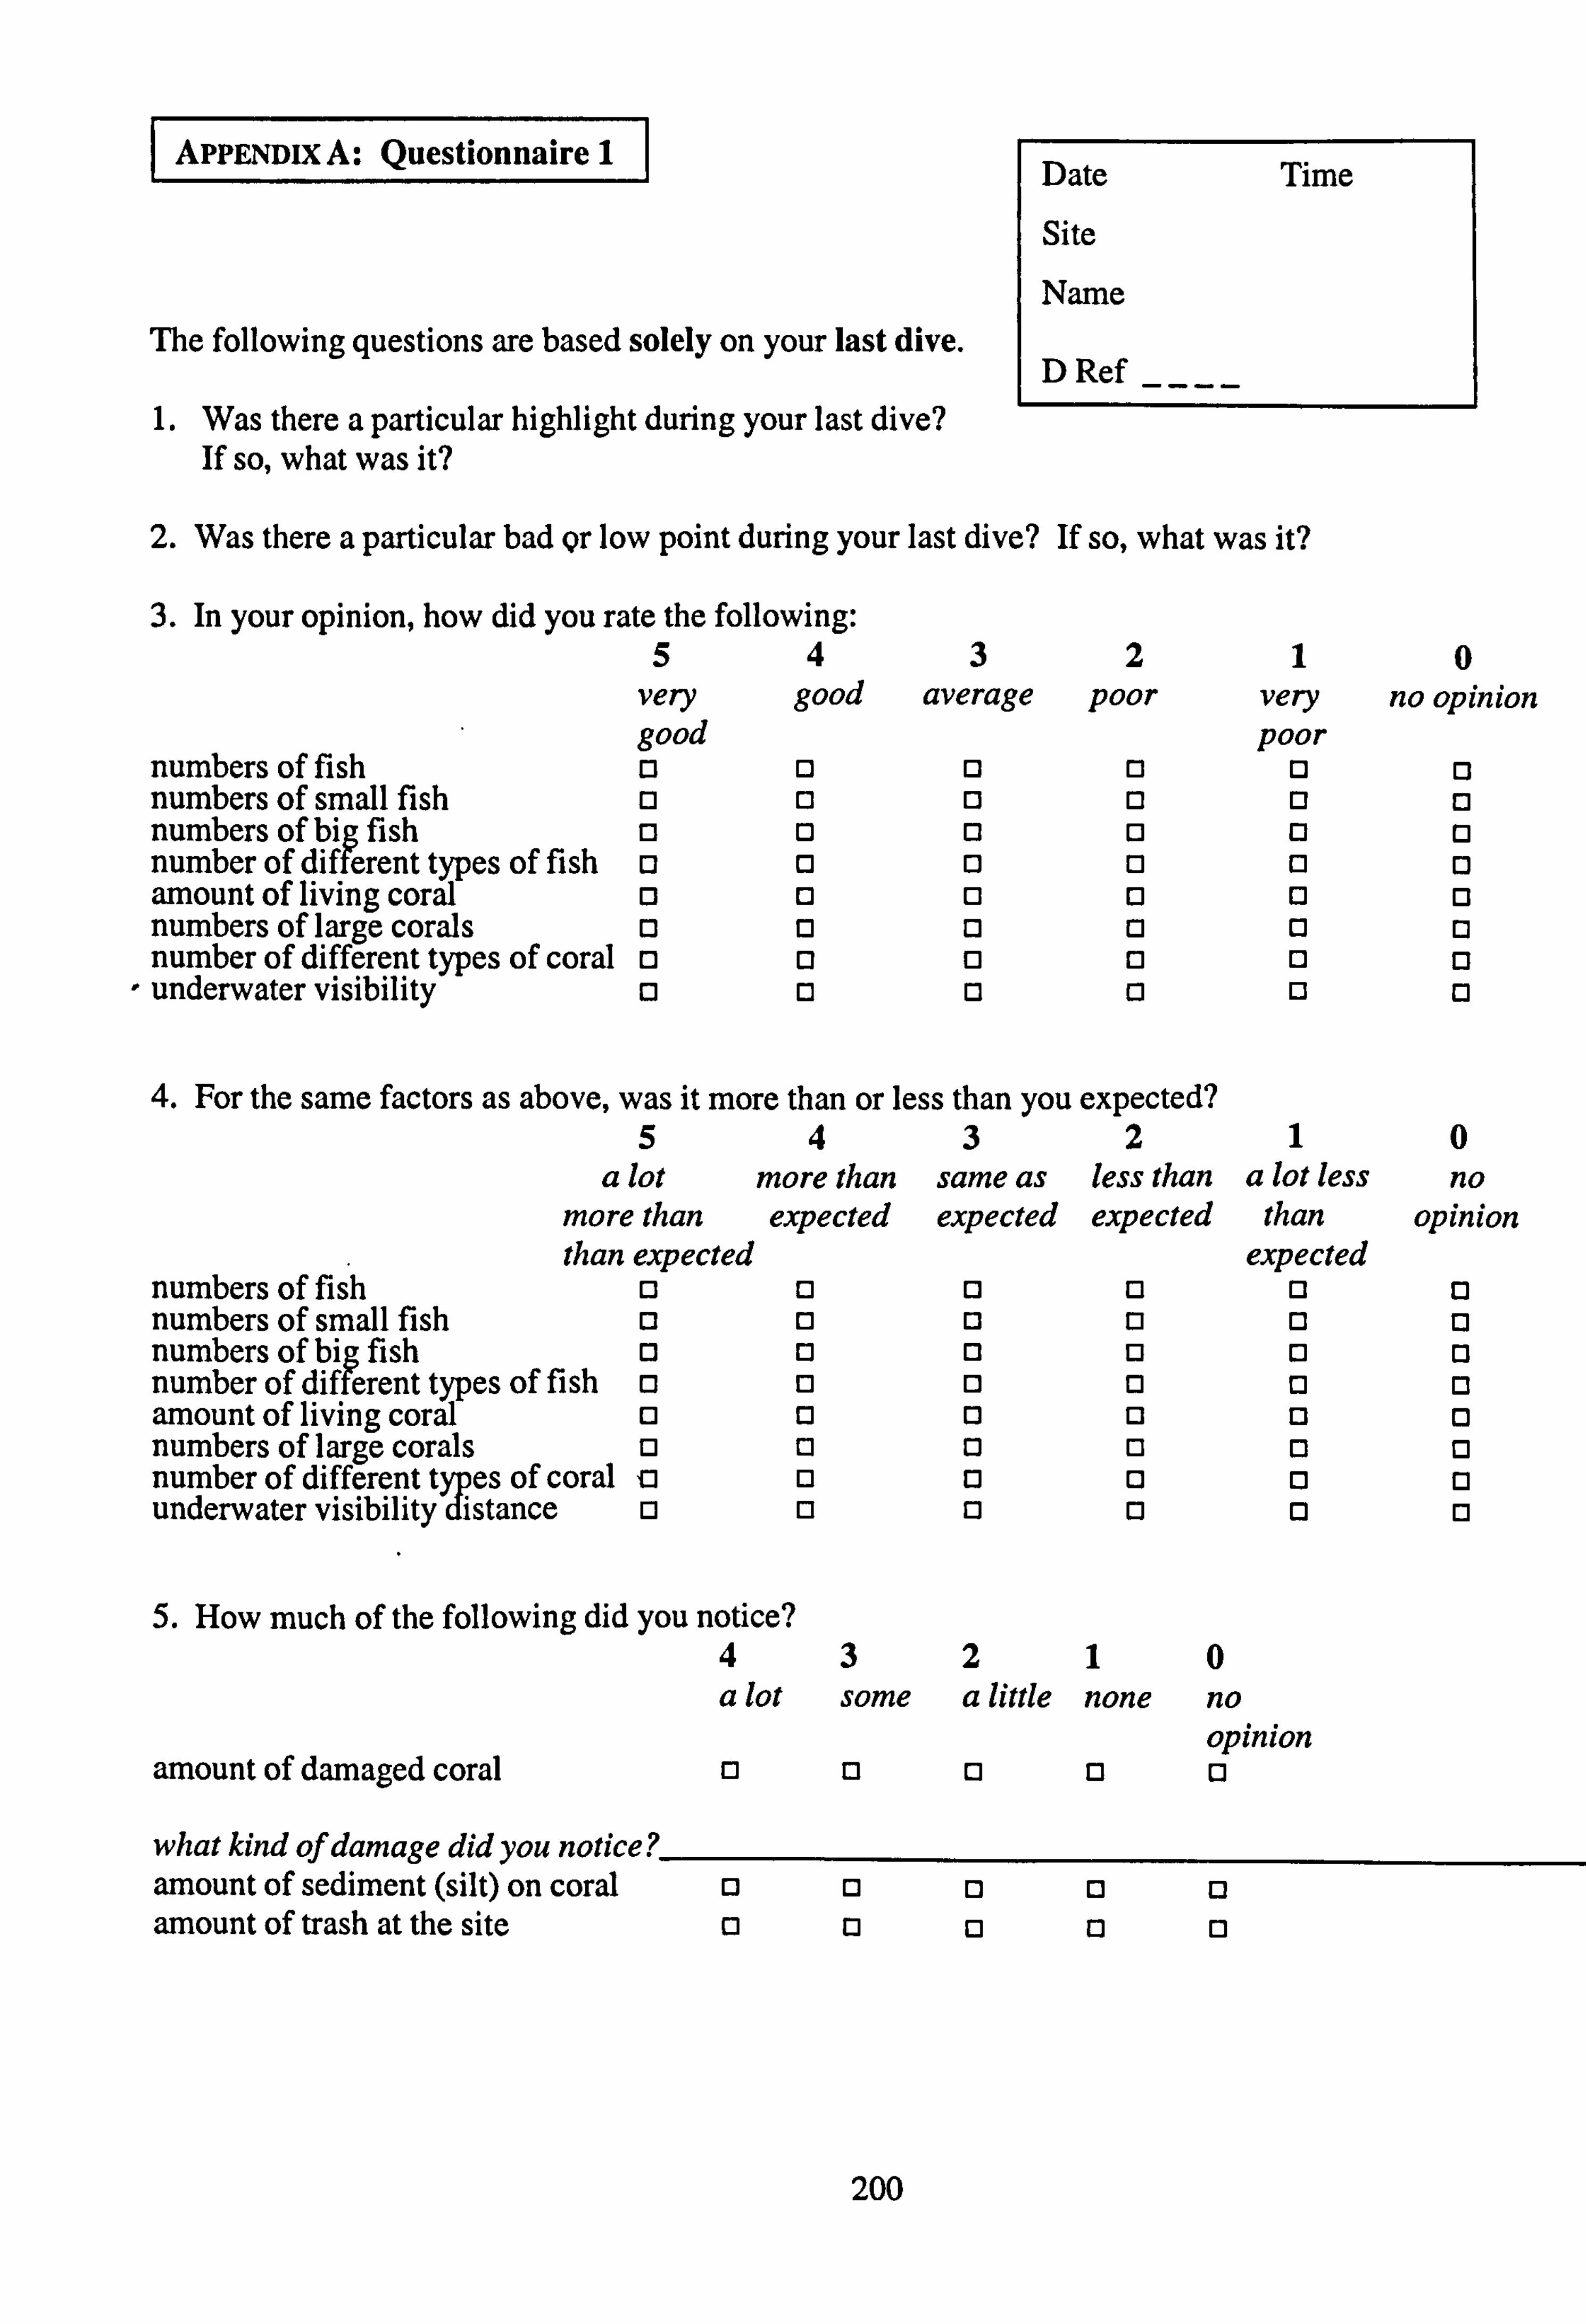
I APPENDIX A: Questionnair
The following questions are based solely on your last dive.
1. Was there a particular highlight during your last dive? If so, what was it?
Date Time
Site
Name
D Ref
2. Was there a particular bad gr low point during your last dive? If so, what was it?
3. In your opinion, how did you rate the following: 5 4 3 2 1 0
very good average poor very no opinion good poor
numbers of fish 13 13 13 13 1: 1 13
numbers of small fish 13 13 13 1: 3 13 13
numbers of big fish 13 0 0 13 0 13
number of different types of fish 13 13 0 0 0 13
amount of living coral C3 13 13 0 0 13
numbers of large corals 13 13 13 C] 13 E3
number of different types of coral 0 13 13 13 13 13
underwater visibility 13 13 1: 3 13 13 13
4. For the same factors as above, was it more than or less than you expected? 5 4 3 2 1 0
a lot more than same as less than a lot less no more than expected expected expected than opinion than expected expected
numbers of fish 13 13 13 13 13
numbers of small fish 11 13 13 0 1: 3 13
numbers of big fish 0 13 13 13 0
number of different types of fish C3 13 13 0 13
amount of living coral 13 0 13 13 13 13
numbers of large corals 0 13 0 13 0 Cl
number of different types of coral V -
0 0 13 13 0 distance 0 underwater visibility 13 13 0 13 13
5. How much of the following did you notice? 43210 a lot some a little none no
opinion amount of damaged coral 13 0 13 13 13
what kind of damage did you notice 2 amount of sediment (silt) on coral 13 13 13 13 E3 amount of trash at the site 0 13 13 0 13
200
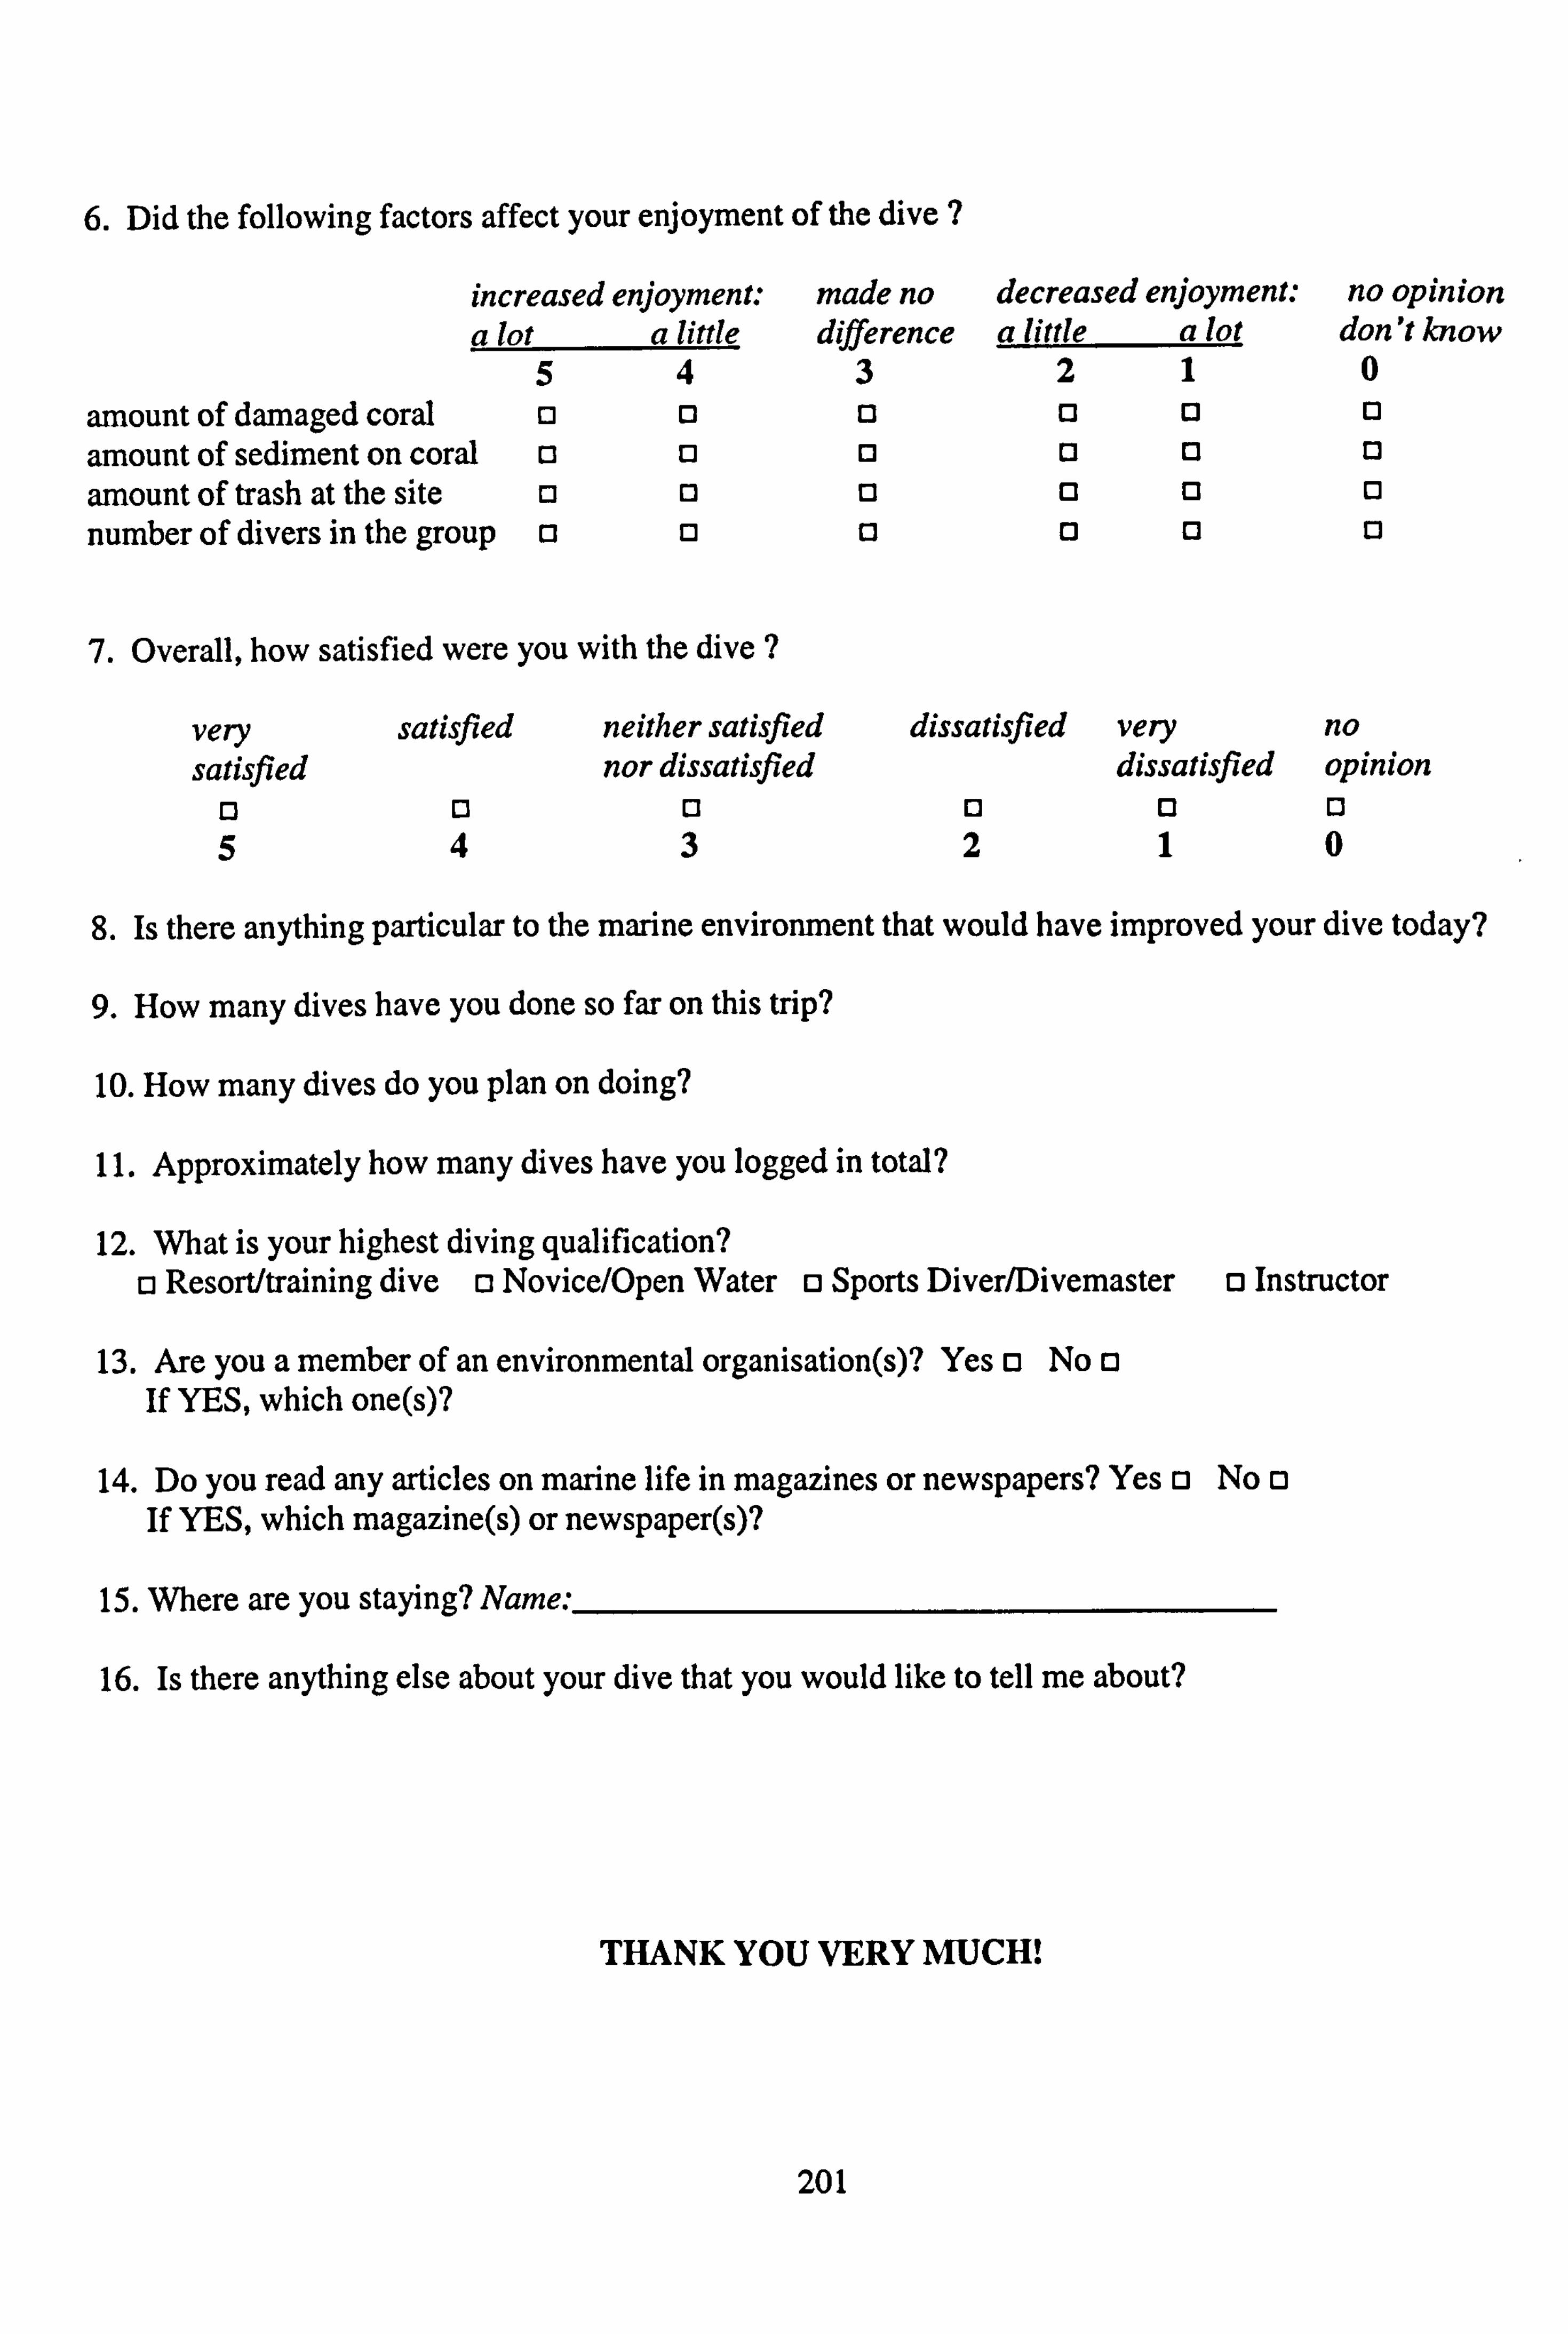
6. Did the following factors affect your enjoyment of the dive
increased enjoyment: made no decreased enjoyment: no opinion a lot a little difference a little a lot don't know
5 4 32 1 0 amount of damaged coral 13 13 13 13 13 13
amount of sediment on coral 1: 3 13 13 (3 13 13
amount of trash at the site 13 13 13 13 13 13
number of divers in the group C3 13 13 0 13 13
7. Overall, how satisfied were you with the dive ?
very satisfied neither satisfled dissatisfied very no satisfied nor dissatisfied dissatis:, fled opinion
13 [3 13 0 13 1: 3
54 3 2 1 0
8. Is there anything particular to the marine environment that would have improved your dive today?
9. How many dives have you done so far on this trip?
10. How many dives do you plan on doing?
11. Approximately how many dives have you logged in total?
12. What is your highest diving qualification? c3 Resort/training dive o Novice/Open Water o Sports Diver/Divemaster c3 Instructor
13. Are you a member of an environmental organisation(s)? Yes c3 No c3 If YES, which one(s)?
14. Do you read any articles on marine life in magazines or newspapers? Yes 13 No 13 If YES, which magazine(s) or newspaper(s)?
15. Where are you staying? Name:,
16. Is there anything else about your dive that you would like to tell me about?
THANK YOU VERY MUCH!
201
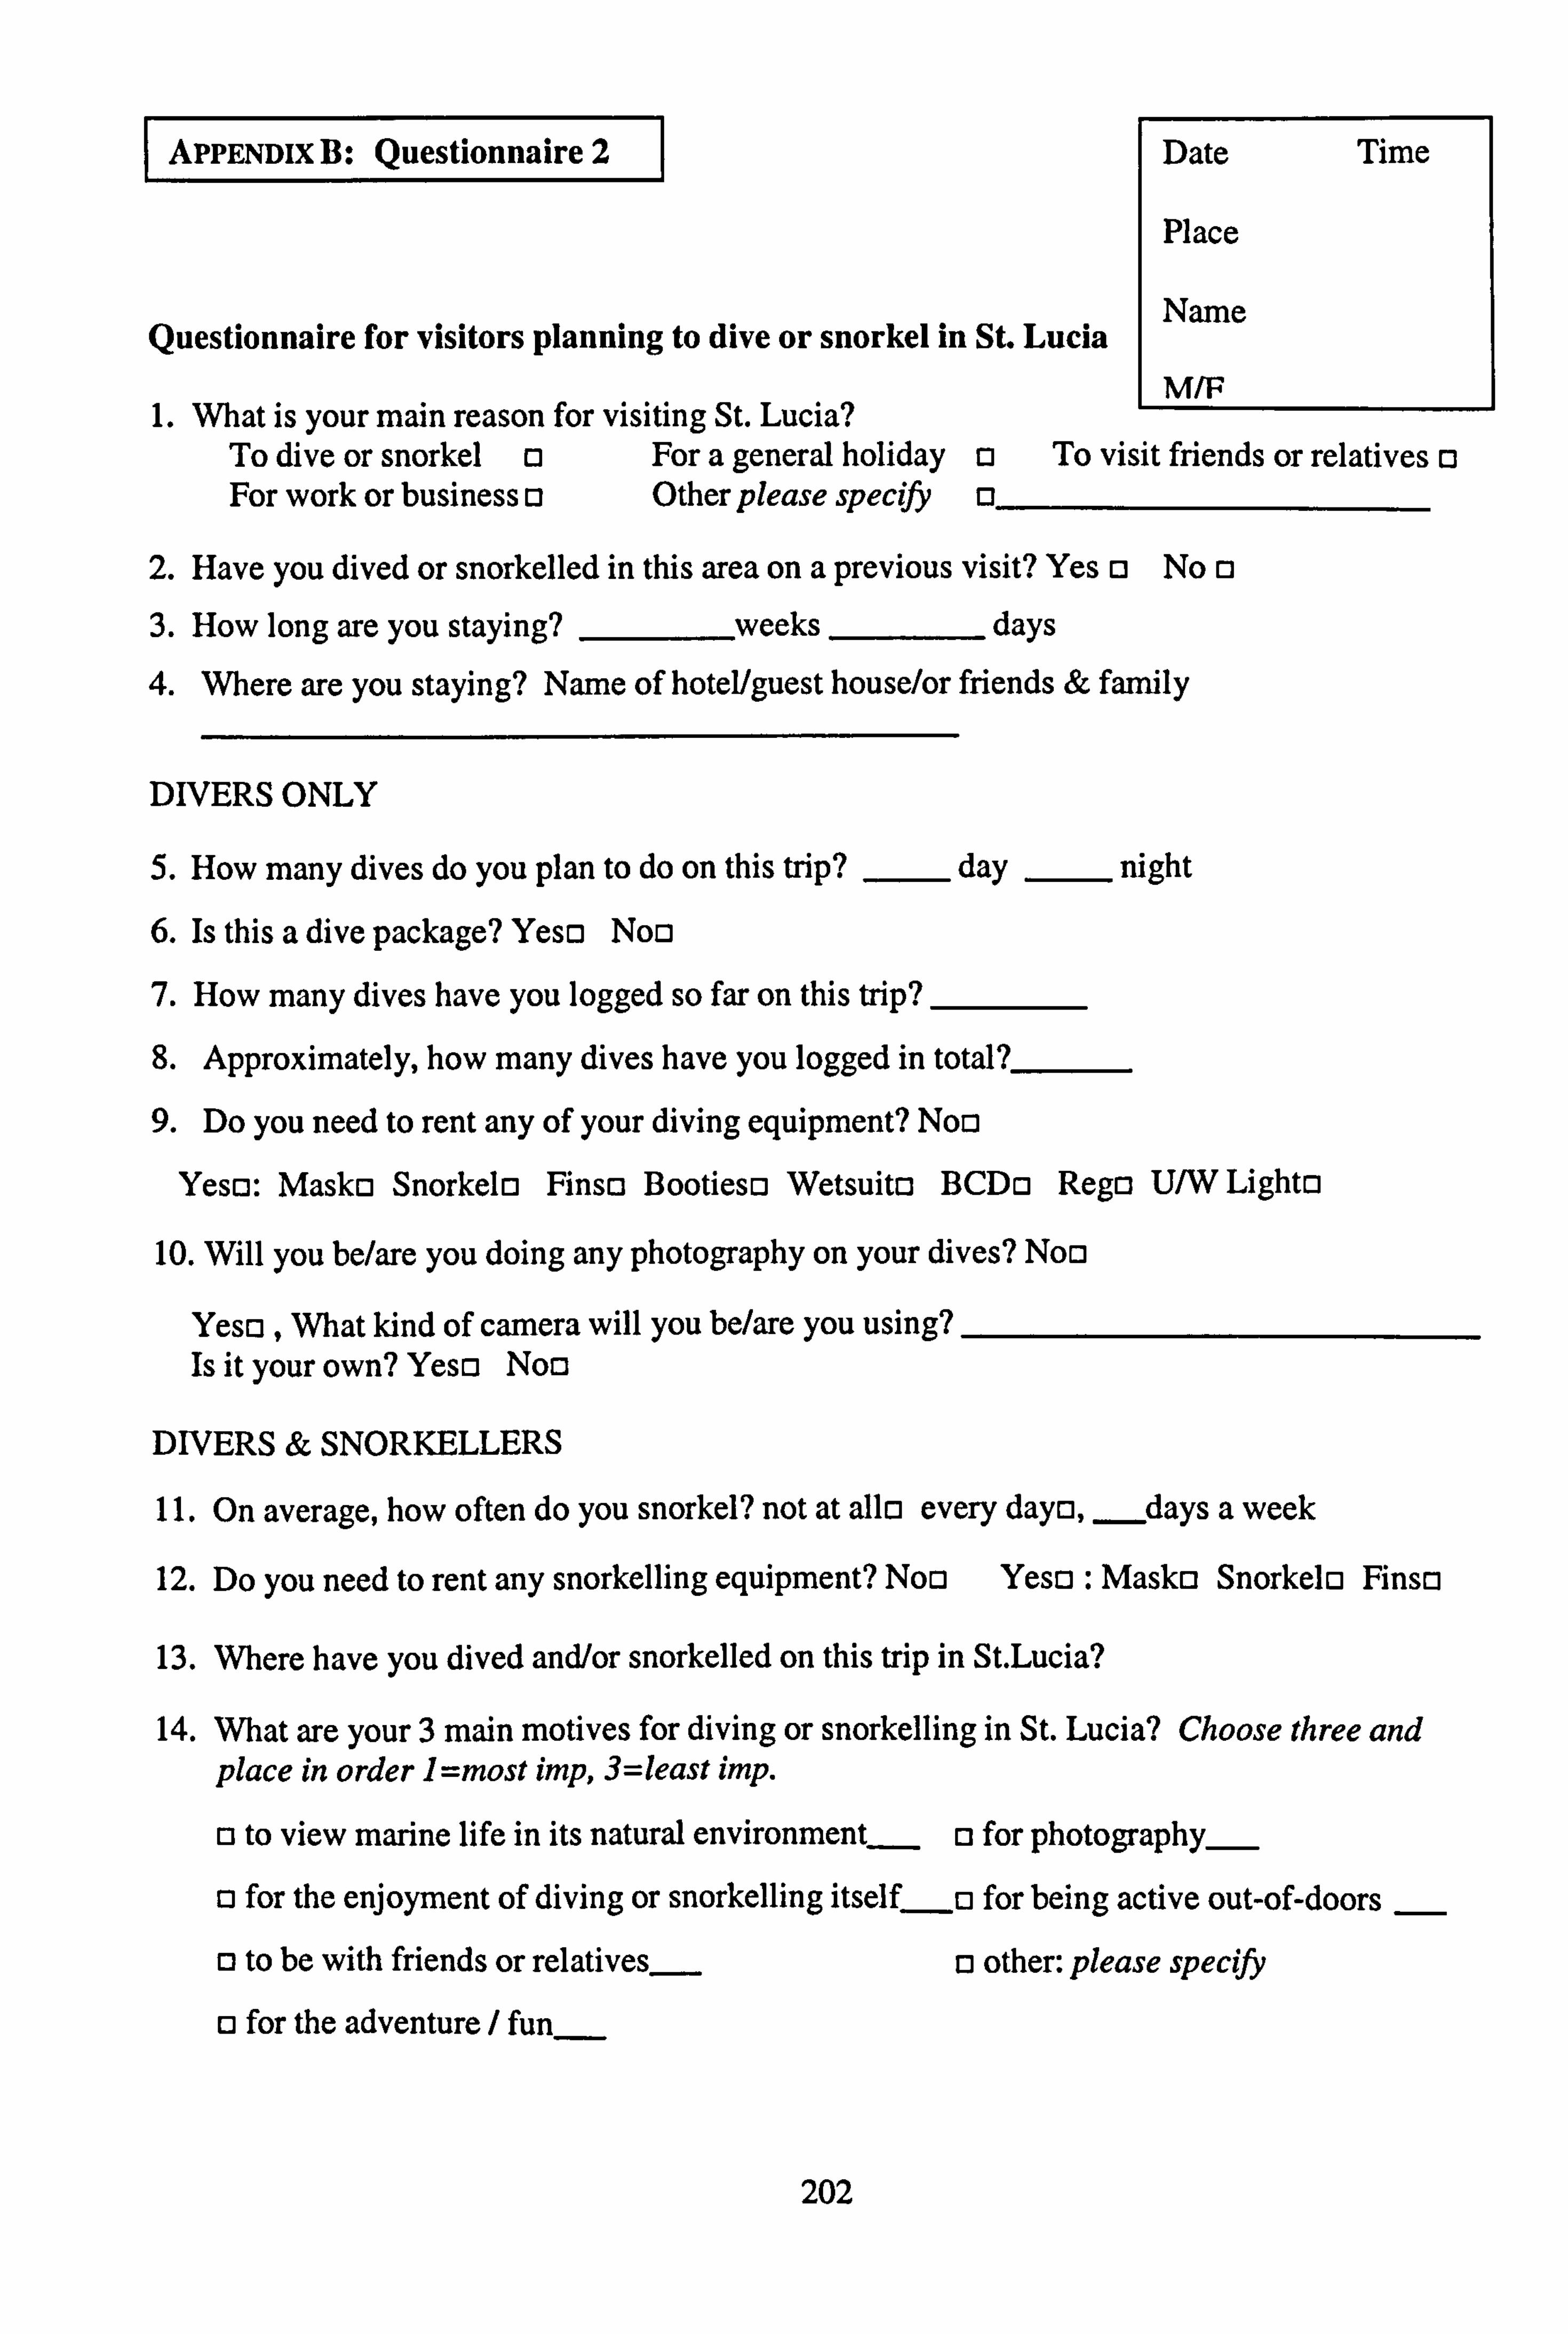
I APPENDixB: Questionnaire 21
Questionnaire for visitors planning to dive or snorkel in St. Lucia
1. What is your main reason for visiting St. Lucia? To dive or snorkel c3 For a general holiday For work or business o Other please specify
Date Time
Place
Name
MIF
13 To visit friends or relatives (3 13
2. Have you dived or snorkelled in this area on a previous visit? Yes o No 0 3. How long are you staying? -------ýweeks -
days
4. Where are you staying? Name of hotel/guest house/or friends & family
DIVERS ONLY
5. How many dives do you plan to do on this trip? - day
- night
6. Is this a dive package? Yeso Noo
7. How many dives have you logged so far on this trip?
8. Approximately, how many dives have you logged in total? - 9. Do you need to rent any of your diving equipment? Noo
Yeso: Masko Snorkelo Finso Bootieso Wetsuito BCDo Rego U/W Lighto
10. Will you be/are you doing any photography on your dives? Noo
Yeso , What kind of camera will you be/are you using? Is it your own? Yeso Noo
DFVERS & SNORKELLERS
11. On average, how often do you snorkel? not at allci every dayo, days a week
12. Do you need to rent any snorkelling equipment? Noo Yeso : Masko Snorkelo Finso
13. Where have you dived and/or snorkelled on this trip in St. Lucia?
14. What are your 3 main motives for diving or snorkelling in St. Lucia? Choose three and place in order I =most imp, 3=least imp.
13 to view marine life in its natural environmentý_ 13 for photography-
c3 for the enjoyment of diving or snorkelling itself-ri for being active out-of-doors
13 to be with friends or relatives- o other: please specify
c3 for the adventure / fun
202
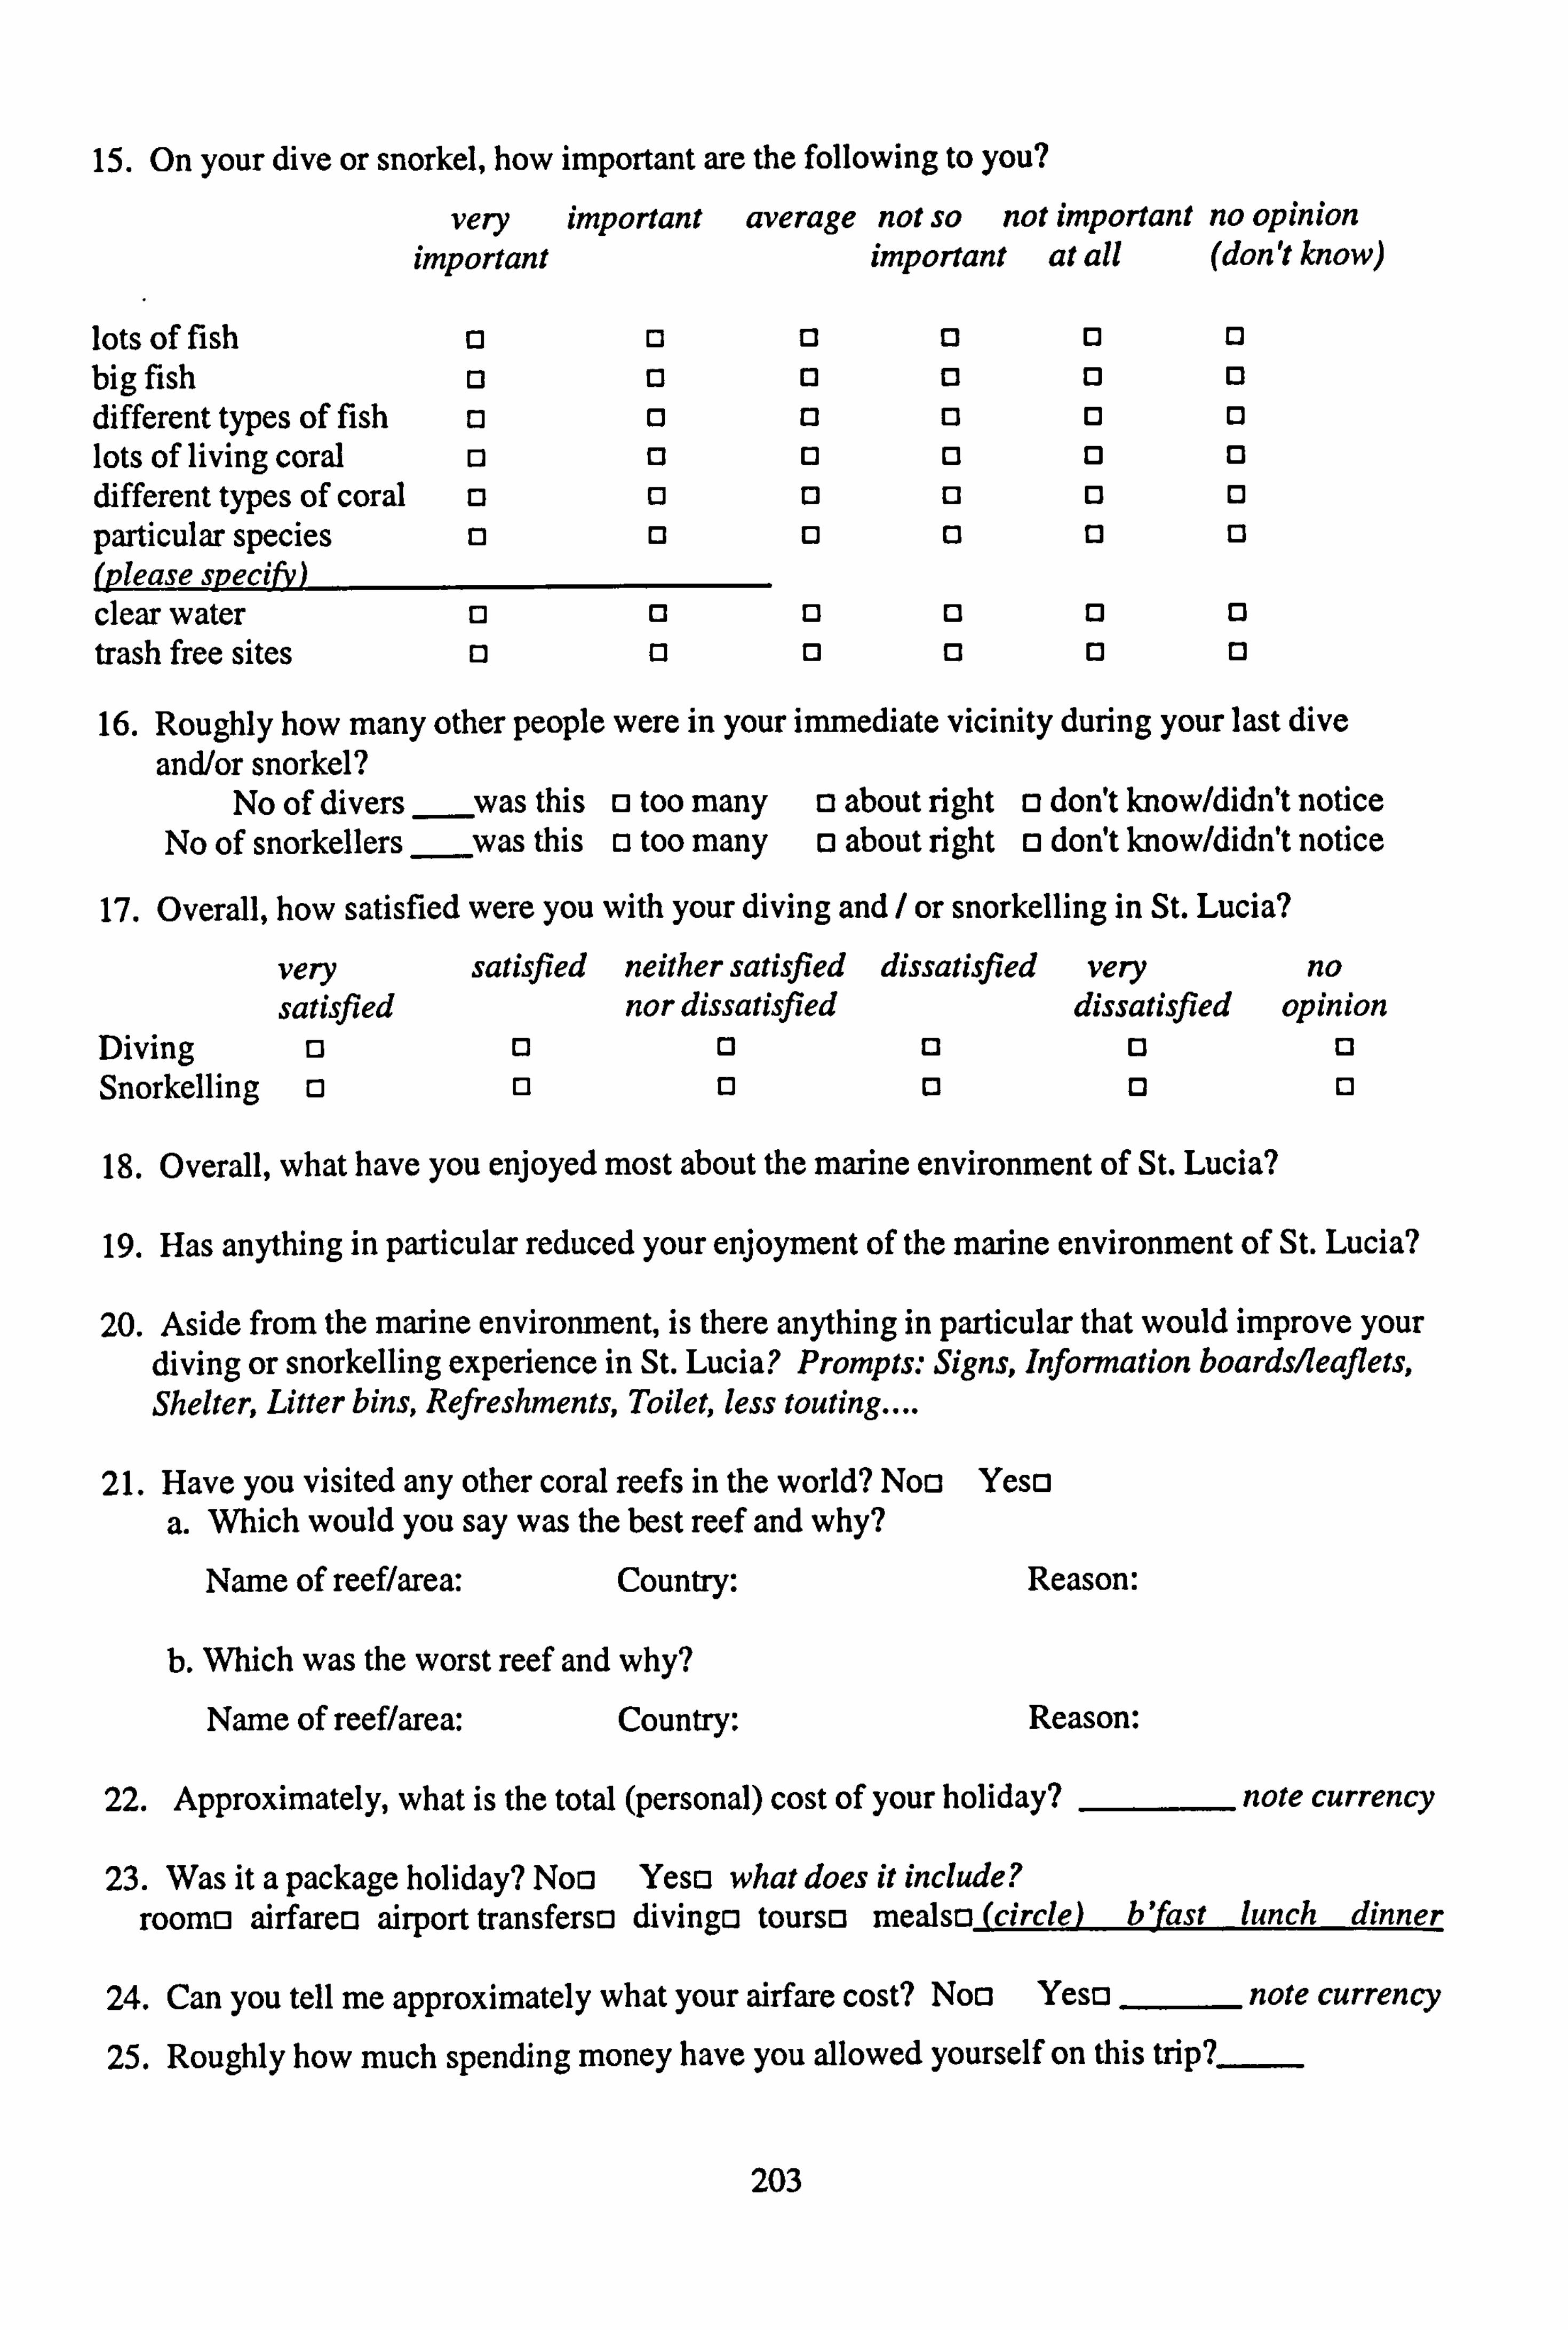
15. On your dive or snorkel, how important are the following to you?
very important average not so not important no opinion important important at all (don't know)
lots of fish 13 13
big fish 13 13
different types of fish 13 13
lots of living coral 1: 1 0 different types of coral 13 13
particular species 13 13
(121ease specify) clear water 13 0
trash free sites 13 13
13 13 13 13 13 0 13 13 0 13 13 13 13 13 13 13 0 13 13 13 13 0 0 13
13 13 13 13 13 13 13 13
16. Roughly how many other people were in your immediate vicinity during your last dive and/or snorkel?
No of divers ___yas
this o too many o about right o don't know/didn't notice No of snorkellers was this 13 too many c3 about right o don't know/didn't notice
17. Overall, how satisfied were you with your diving and / or snorkelling in St. Lucia?
very satisfied neither satisfied dissatisfied very no satisfied nor dissatisfied dissatisfied opinion
Diving 13 13 13 13 13 0 Snorkelling 13 13 13 (3 13 13
18. Overall, what have you enjoyed most about the marine environment of St. Lucia?
19. Has anything in particular reduced your enjoyment of the marine environment of St. Lucia?
20. Aside from the marine environment, is there anything in particular that would improve your diving or snorkelling experience in St. Lucia? Prompts: Signs, Information boardsl7eaflets, Shelter, Litter bins, Refreshments, Toilet, less touting....
21. Have you visited any other coral reefs in the world? Noo Yeso a. Which would you say was the best reef and why?
Name of reef/area: Country: Reason:
b. VyWch was the worst reef and why? Name of reef/area: Country: Reason:
22. Approximately, what is the total (personal) cost of your holiday? - note currency
23. Was it a package holiday? Noo Yeso what does it include? roomo airfareo airport transferso divingo tourso mealso (circle) Wast lunch dinner
24. Can you tell me approximately what your airfare cost? Noo Yeso - note currency
25. Roughly how much spending money have you allowed yourself on this trip? -
203
26. What is your country of residenceZ 27. Please tick the age category that applies to you
o under 20 c3 30-39 13 50-59 o20-29 c3 40-49 (3 60 or above
28. Are you a member of an environmental group or organisation? Noo Yeso which one(s)?
29. Do you read any articles on marine life in magazines or newspapers? Noo Yeso which magazine(s) or newspaper(s)?
30. Is there anything else about your diving or snorkelling that you would like to tell me about?
Thank you very much!
204
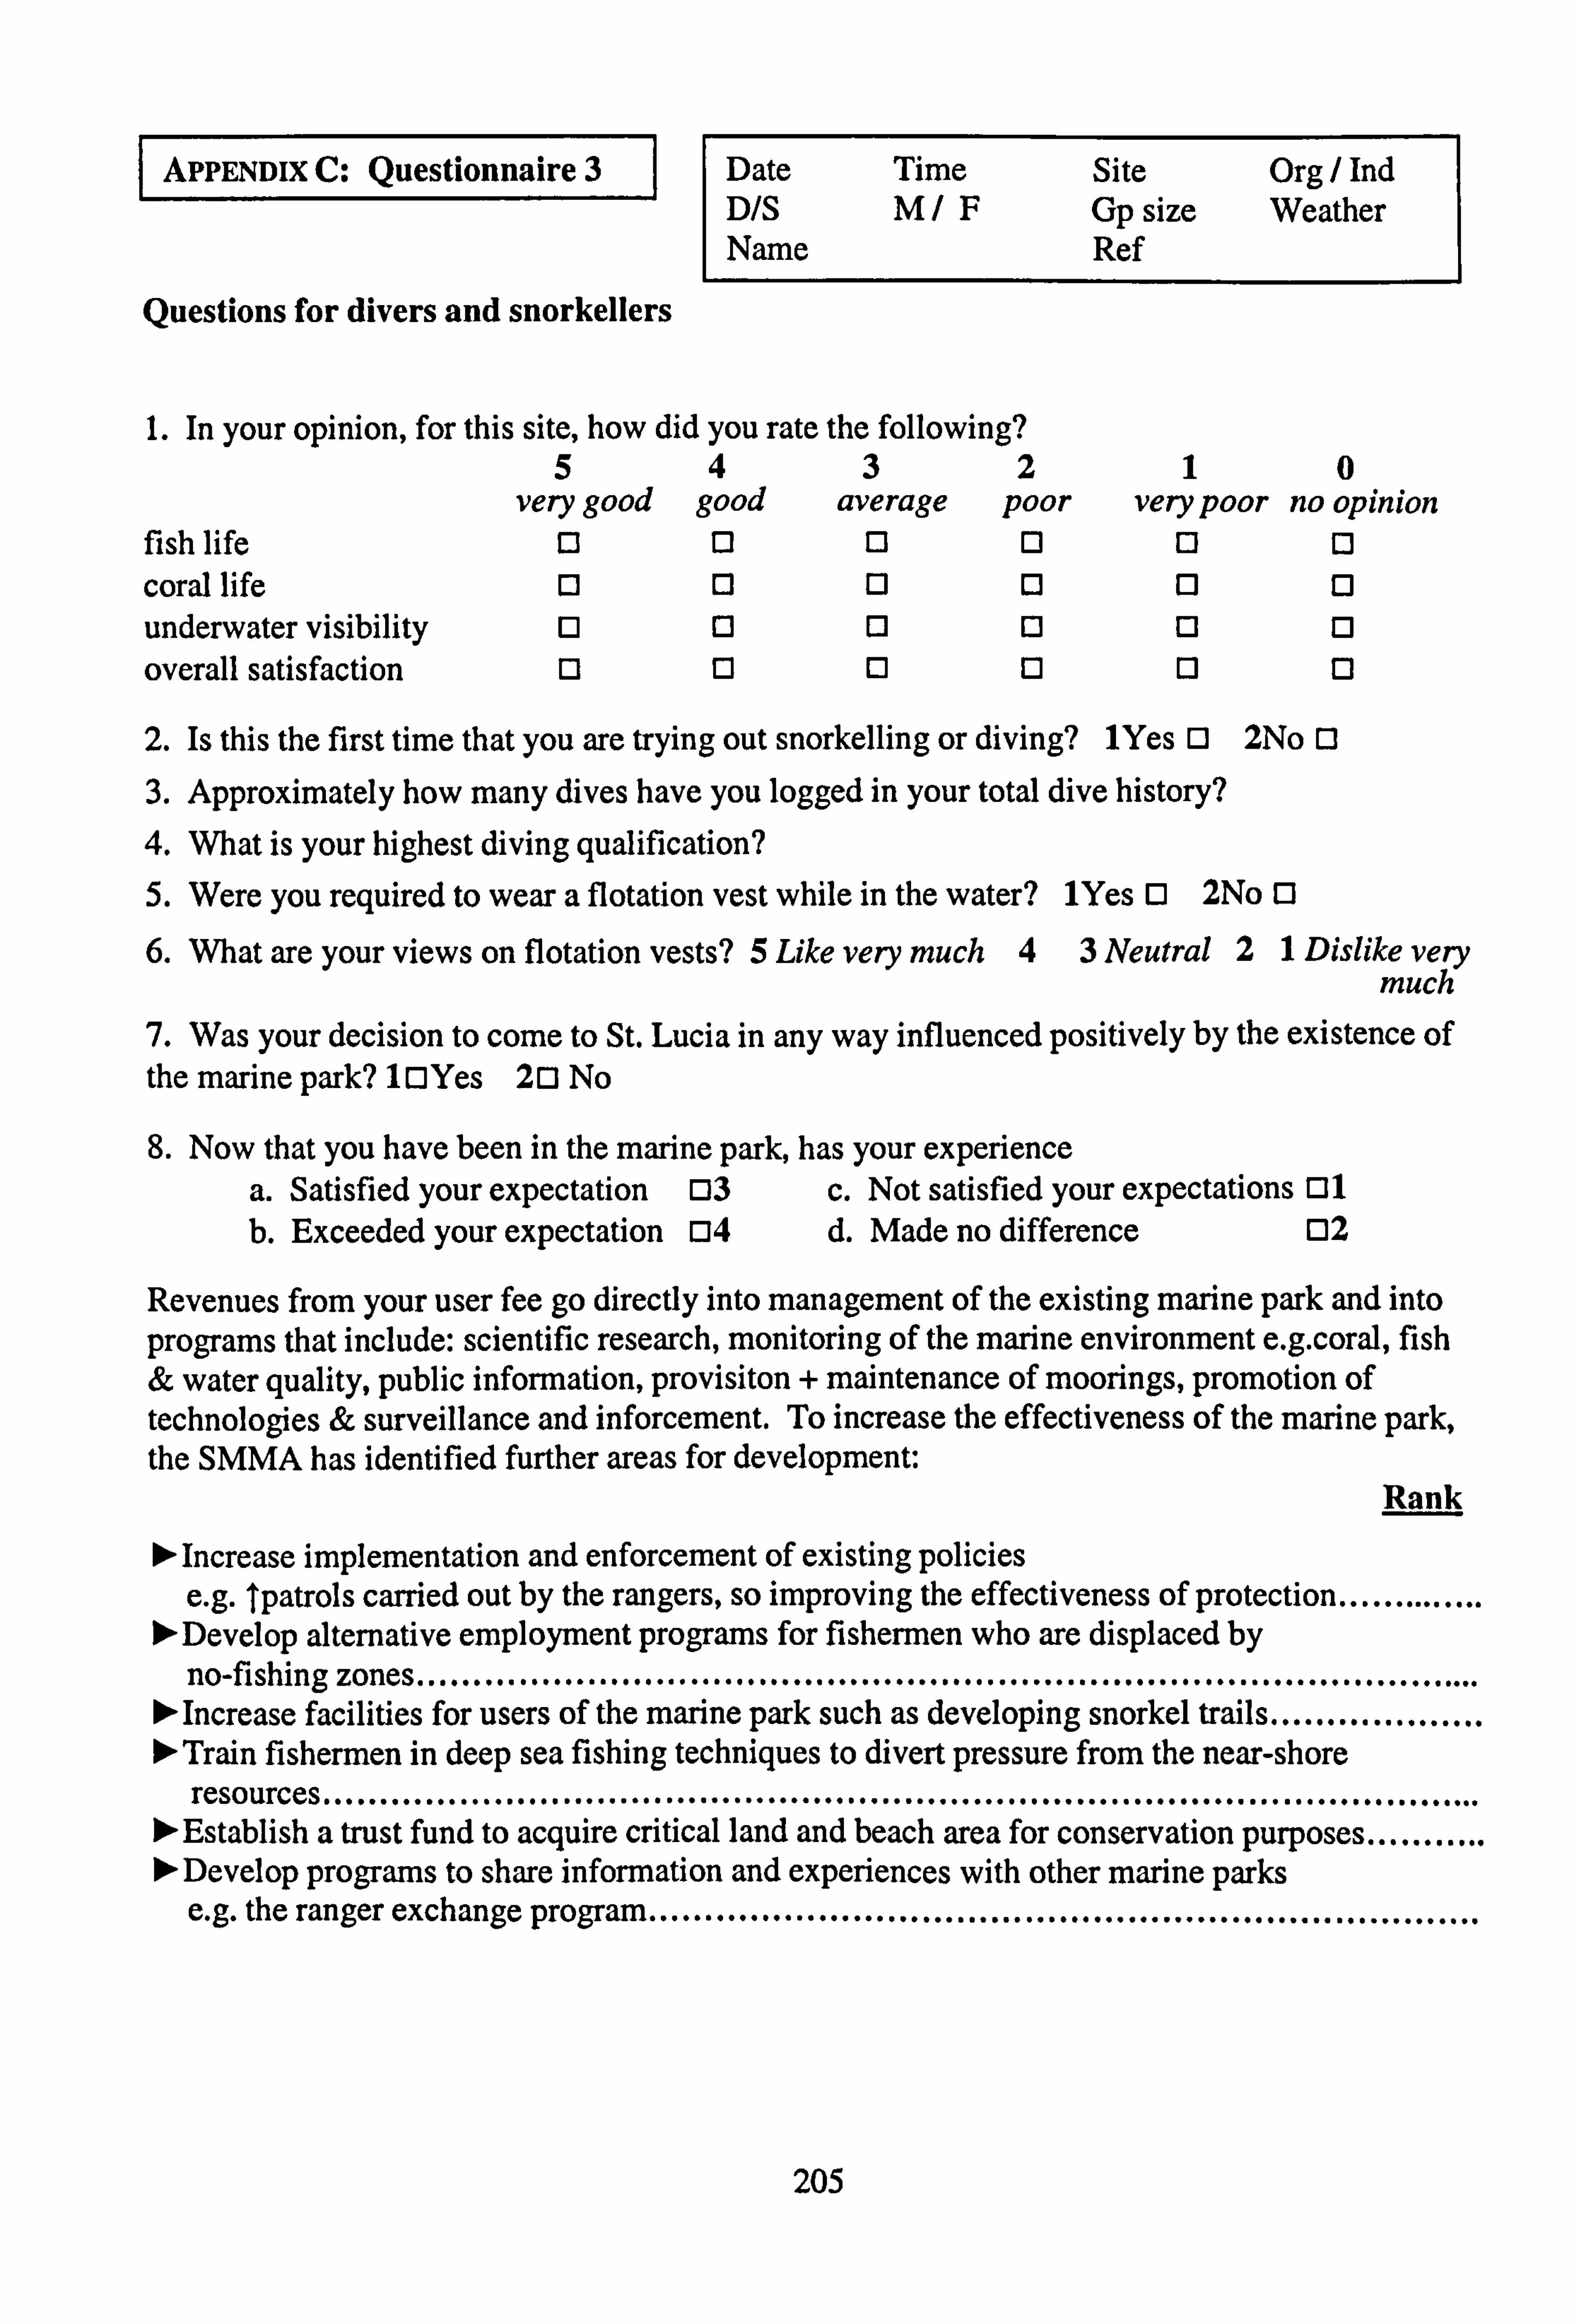
APPENDIX C: Question-nai-re3 Date Time Site Org / Ind D/S M/F Gp size Weather Name Ref
Questions for divers and snorkellers
1. In your opinion, for this site, how did you rate the following? 5 4 3 2 1 0
verY good good average poor very poor no opinion fish life 11 13 11 0 1: 1 0 coral life 0 13 0 underwater visibility 11 11 11 overall satisfaction 13 11 11 0
2. Is this the first time that you are trying out snorkelling or diving? 1Yes 13 2No o 3. Approximately how many dives have you logged in your total dive history?
4. What is your highest diving qualification? 5. Were you required to wear a flotation vest while in the water? 1Yes 0 2No 0
6. What are your views on flotation vests? 5 Like very much 43 Neutral 21 Dislike very much
7. Was your decision to come to St. Lucia in any way influenced positively by the existence of the marine park? IC]Yes 2ONo
8. Now that you have been in the marine park, has your experience a. Satisfied your expectation 133 c. Not satisfied your expectations ill b. Exceeded your expectation 1: 34 d. Made no difference [12
Revenues from your user fee go directly into management of the existing marine park and into programs that include: scientific research, monitoring of the marine environment e. g. coral, fish & water quality, public information, provisiton + maintenance of moorings, promotion of technologies & surveillance and inforcement. To increase the effectiveness of the marine park, the SMMA has identified further areas for development:
Rank 10- Increase implementation and enforcement of existing policies
e. g. Tpatrols carried out by the rangers, so improving the effectiveness of protection .............. 00- Develop alternative employment programs for fishermen who are displaced by no-fishing zones .............................................................................................. 10- Increase facilities for users of the marine park such as developing snorkel trails ................... Do- Train fishermen in deep sea fishing techniques to divert pressure from the near-shore resources ...................................................................................................... 00- Establish a trust fund to acquire critical land and beach area for conservation purposes ........... 00- Develop programs to share information and experiences with other marine parks e. g. the ranger exchange program .........................................................................
205
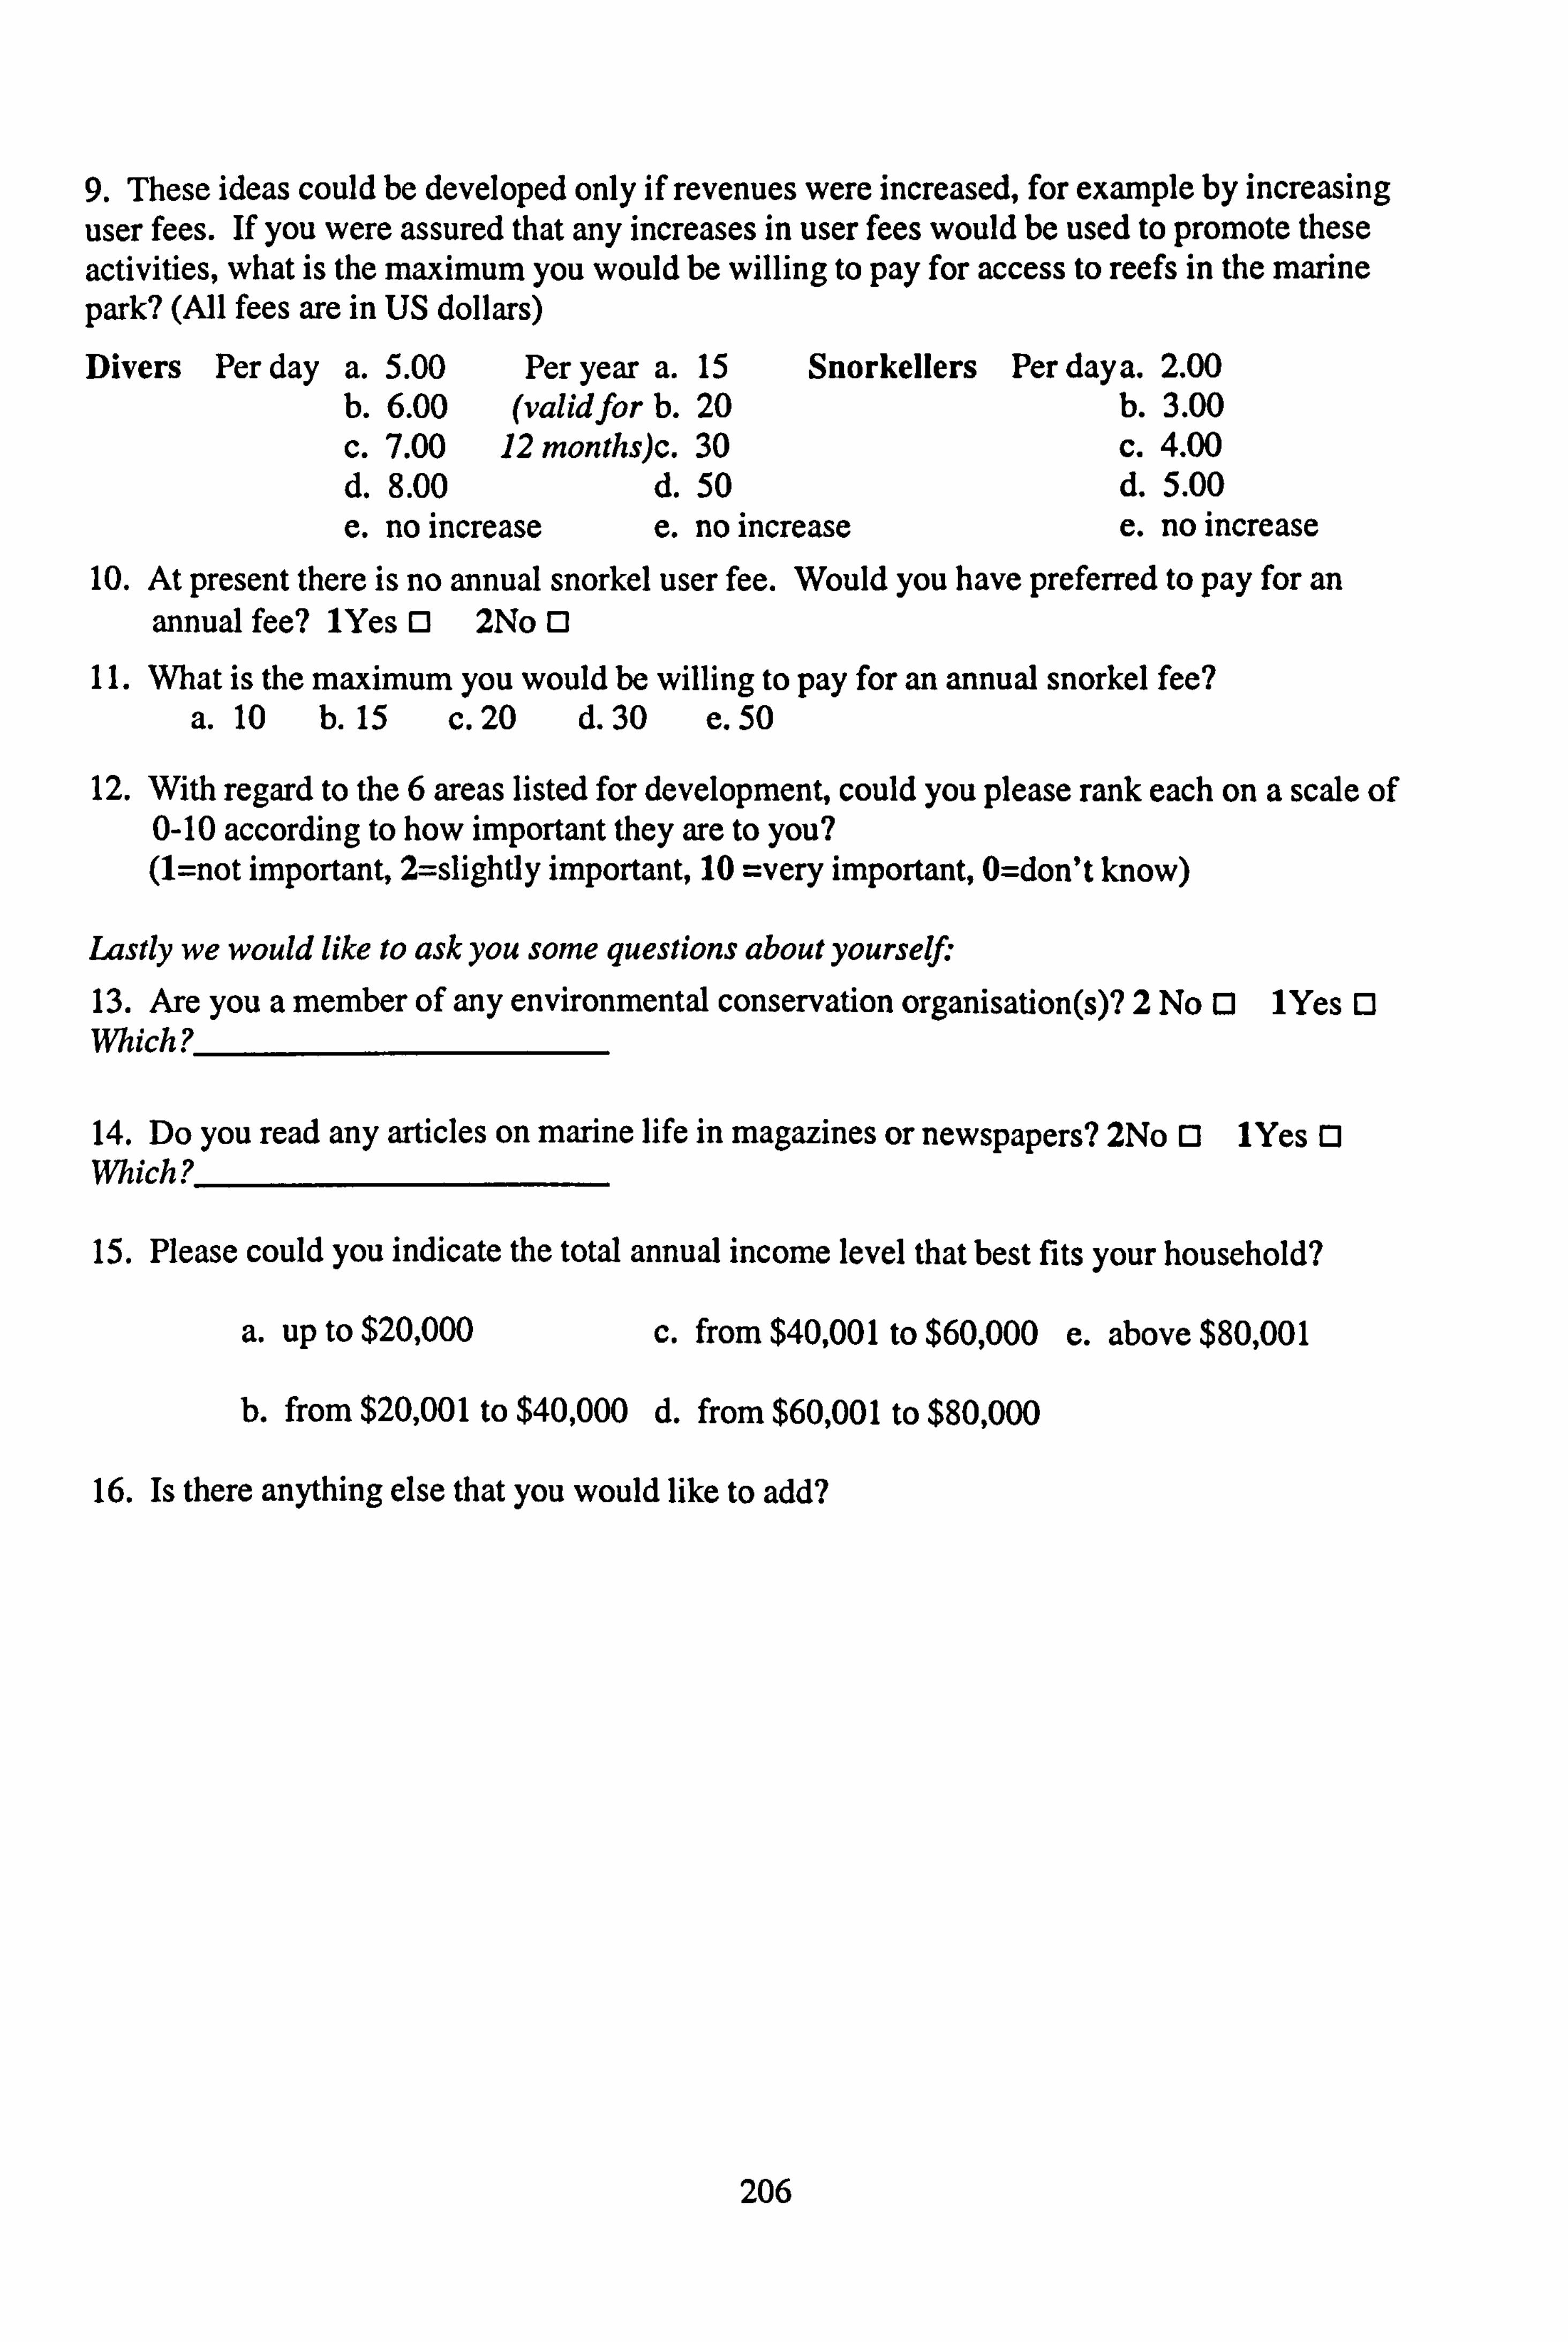
9. These ideas could be developed only if revenues were increased, for example by increasing user fees. If you were assured that any increases in user fees would be used to promote these activities, what is the maximum you would be willing to pay for access to reefs in the marine park? (All fees are in US dollars)
Divers Per day a. 5.00 Per year a. 15 Snorkellers Per daya. 2.00 b. 6.00 (validfor b. 20 b. 3.00 c. 7.00 12 months)c. 30 c. 4.00 d. 8.00 d. 50 d. 5.00 e. no increase e. no increase e. no increase
10. At present there is no annual snorkel user fee. Would you have preferred to pay for an annual fee? 1Yes 11 2No 11
11. What is the maximum you would be willing to pay for an annual snorkel fee? a. 10 b. 15 c. 20 d. 30 e. 50
12. With regard to the 6 areas listed for development, could you please rank each on a scale of 0-10 according to how important they are to you? (1=not important, 2=slightly important, 10 =very important, O=don't know)
Lastly we would like to ask you some questions about yourseýr. 13. Are you a member of any environmental conservation organisation(s)? 2 No 0 1Yes [3 VMich 2
14. Do you read any articles on marine life in magazines or newspapers? 2No 13 1Yes 0 Mich 7
15. Please could you indicate the total annual income level that best fits your household?
a. up to $20,000 c. from $40,001 to $60,000 e. above $80,001
b. from $20,001 to $40,000 d. from $60,001 to $80,000
16. Is there anything else that you would like to add?
206
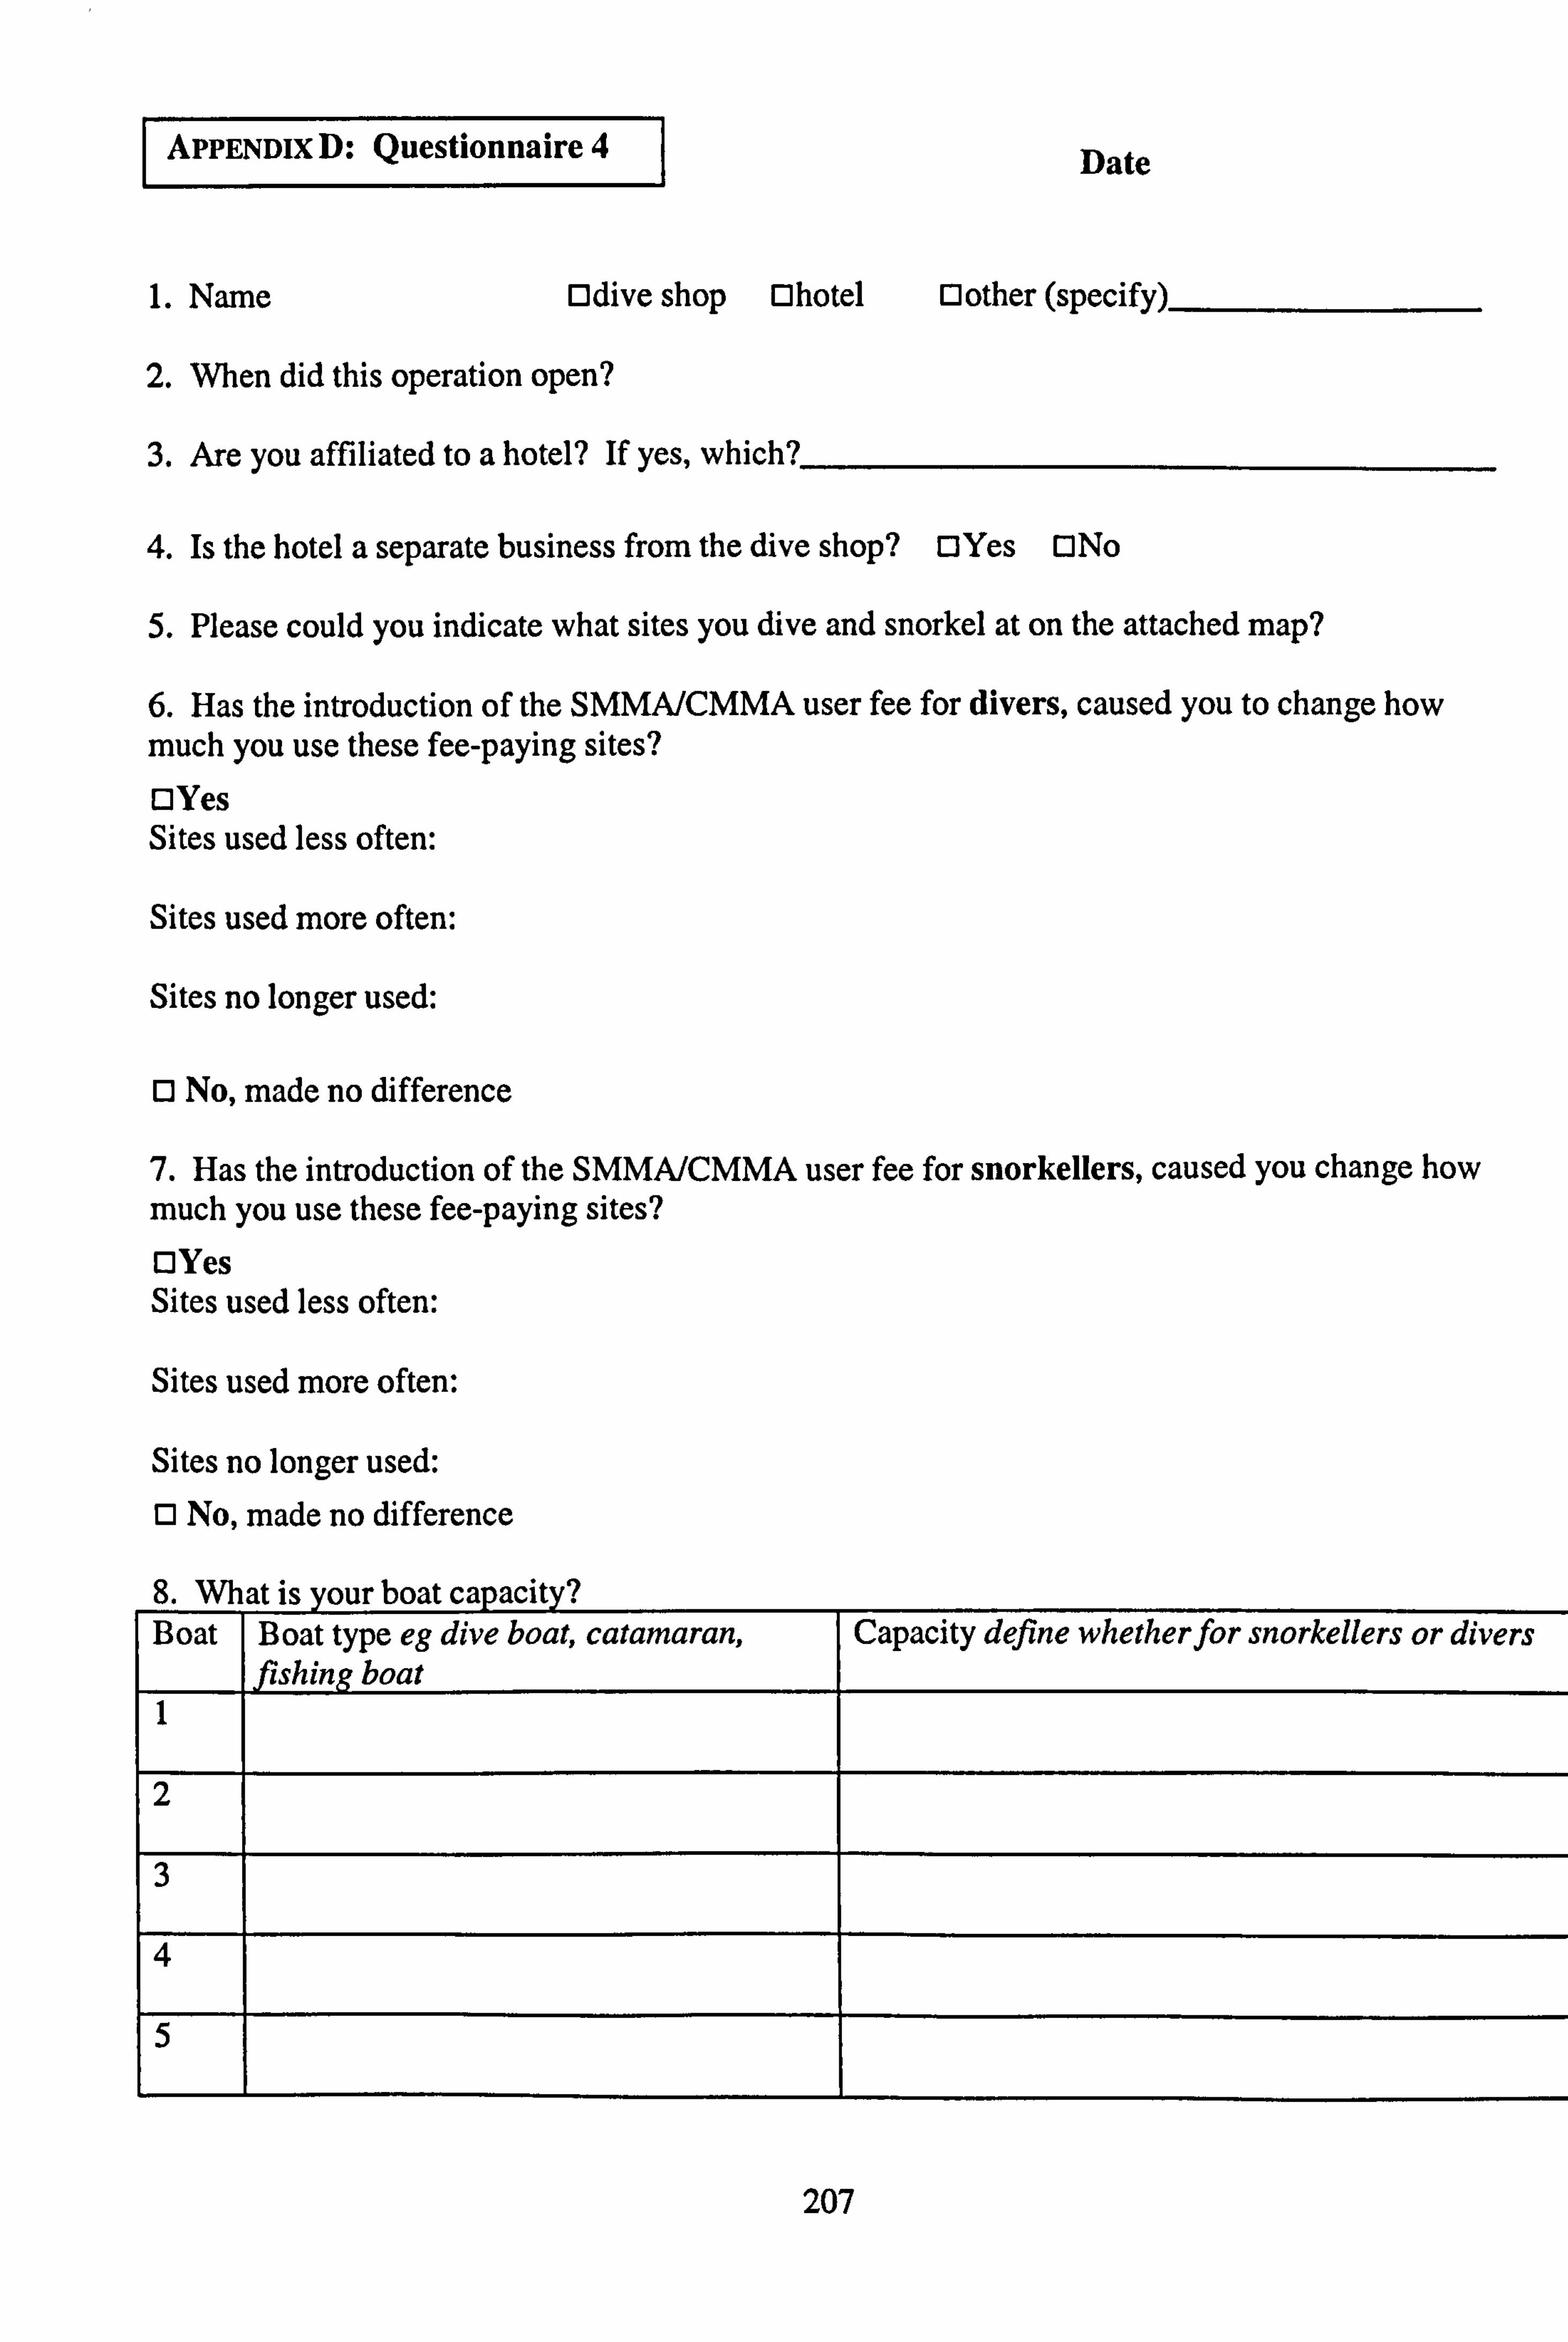
I APPENDix D: Questionnaire 41 Date
1. Name Odive shop Ohotel 0 other (specify)
2. When did this operation open?
3. Are you affiliated to a hotel? If yes, which?
4. Is the hotel a separate business from the dive shop? OYes ONo
5. Please could you indicate what sites you dive and snorkel at on the attached map?
6. Has the introduction of the SMMA/CMMA user fee for divers, caused you to change how much you use these fee-paying sites? E]Yes Sites used less often:
Sites used more often:
Sites no longer used:
11 No, made no difference
7. Has the introduction of the SMMA/CMMA user fee for snorkellers, caused you change how much you use these fee-paying sites? 13Yes Sites used less often:
Sites used more often:
Sites no longer used: 11 No, made no difference
R. What iq vonr hoat canacitv? Boat Boat type eg dive boat, catamaran,
oat Capacity define whetherfor snorkellers or divers
1
2
1 3
5
207
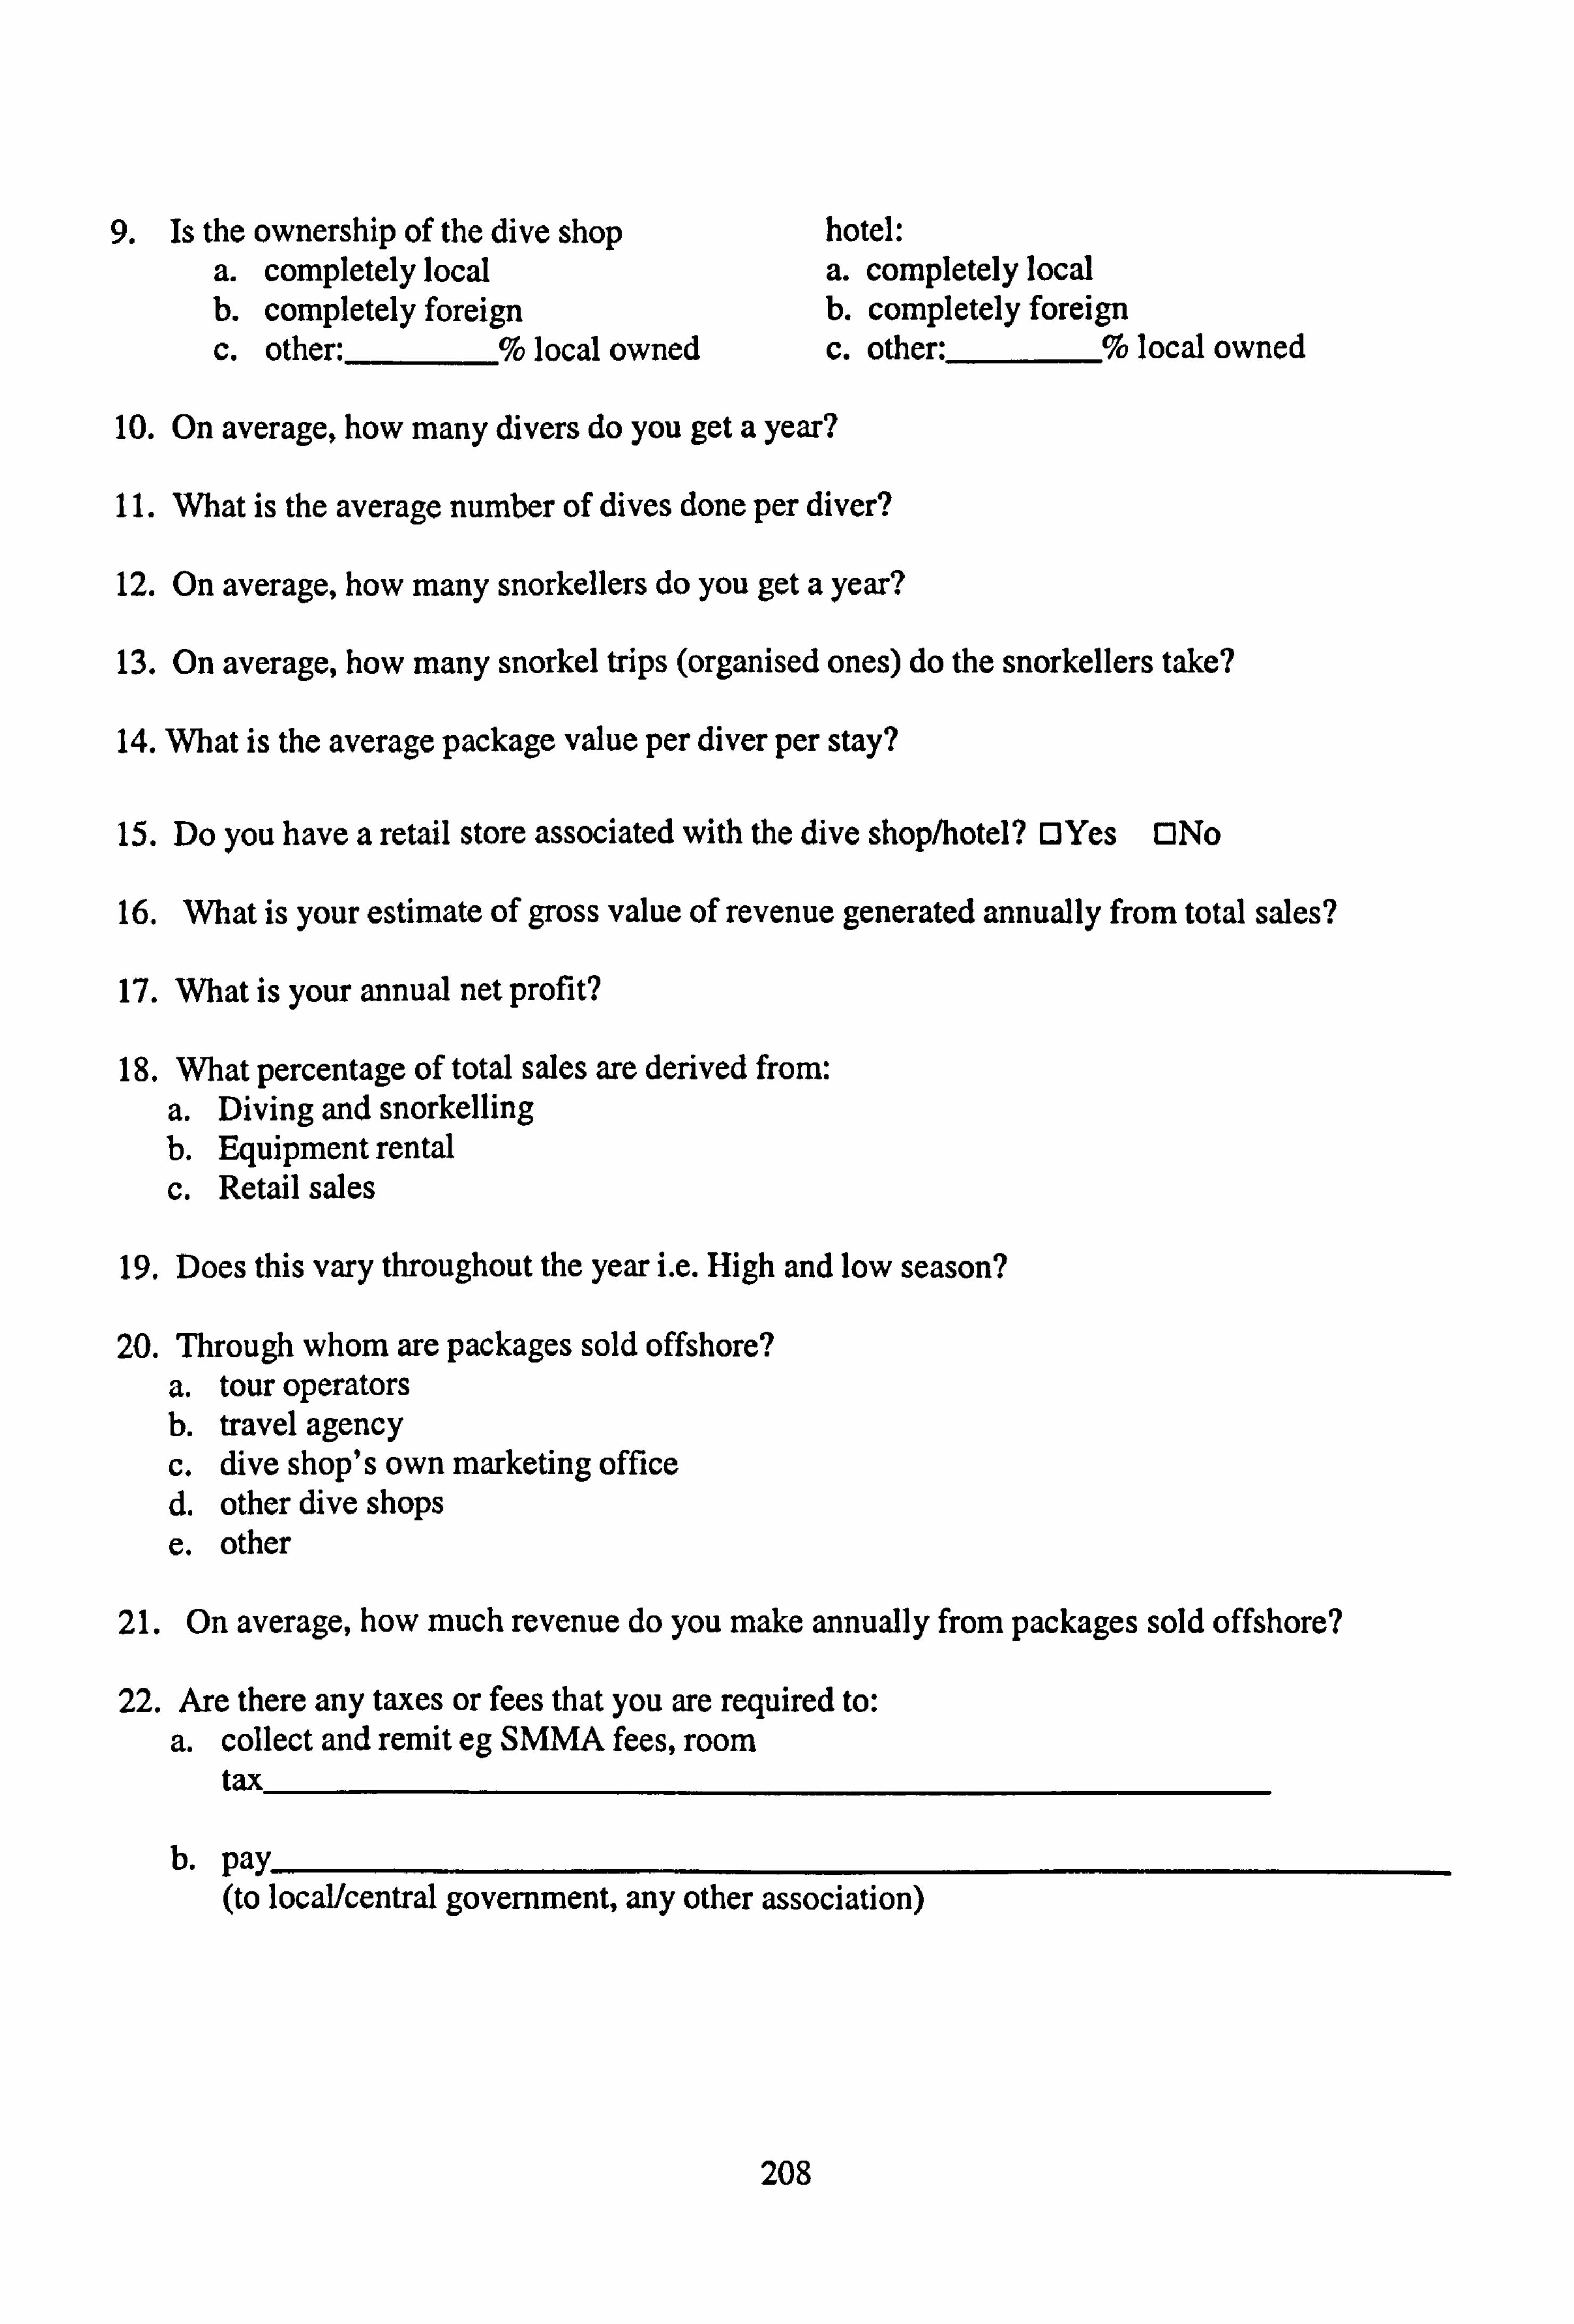
9. Is the ownership of the dive shop hotel: a. completely local a. completely local b. completely foreign b. completely foreign c. other: _%
local owned c. other: ___7o local owned
10. On average, how many divers do you get a year?
11. What is the average number of dives done per diver?
12. On average, how many snorkellers do you get a year?
13. On average, how many snorkel trips (organised ones) do the snorkellers take?
14. What is the average package value per diver per stay?
15. Do you have a retail store associated with the dive shop/hotel? OYes ONo
16. What is your estimate of gross value of revenue generated annually from total sales?
17. What is your annual net profit?
18. What percentage of total sales are derived from: a. Diving and snorkelling b. Equipment rental c. Retail sales
19. Does this vary throughout the year i. e. High and low season?
20. Tbrough whom are packages sold offshore? a. tour operators b. travel agency C. dive shop's own marketing office d. other dive shops e. other
21. On average, how much revenue do you make annually from packages sold offshore?
22. Are there any taxes or fees that you are required to: a. collect and remit eg SMMA fees, room
tax
nav (to local/central government, any other association)
208
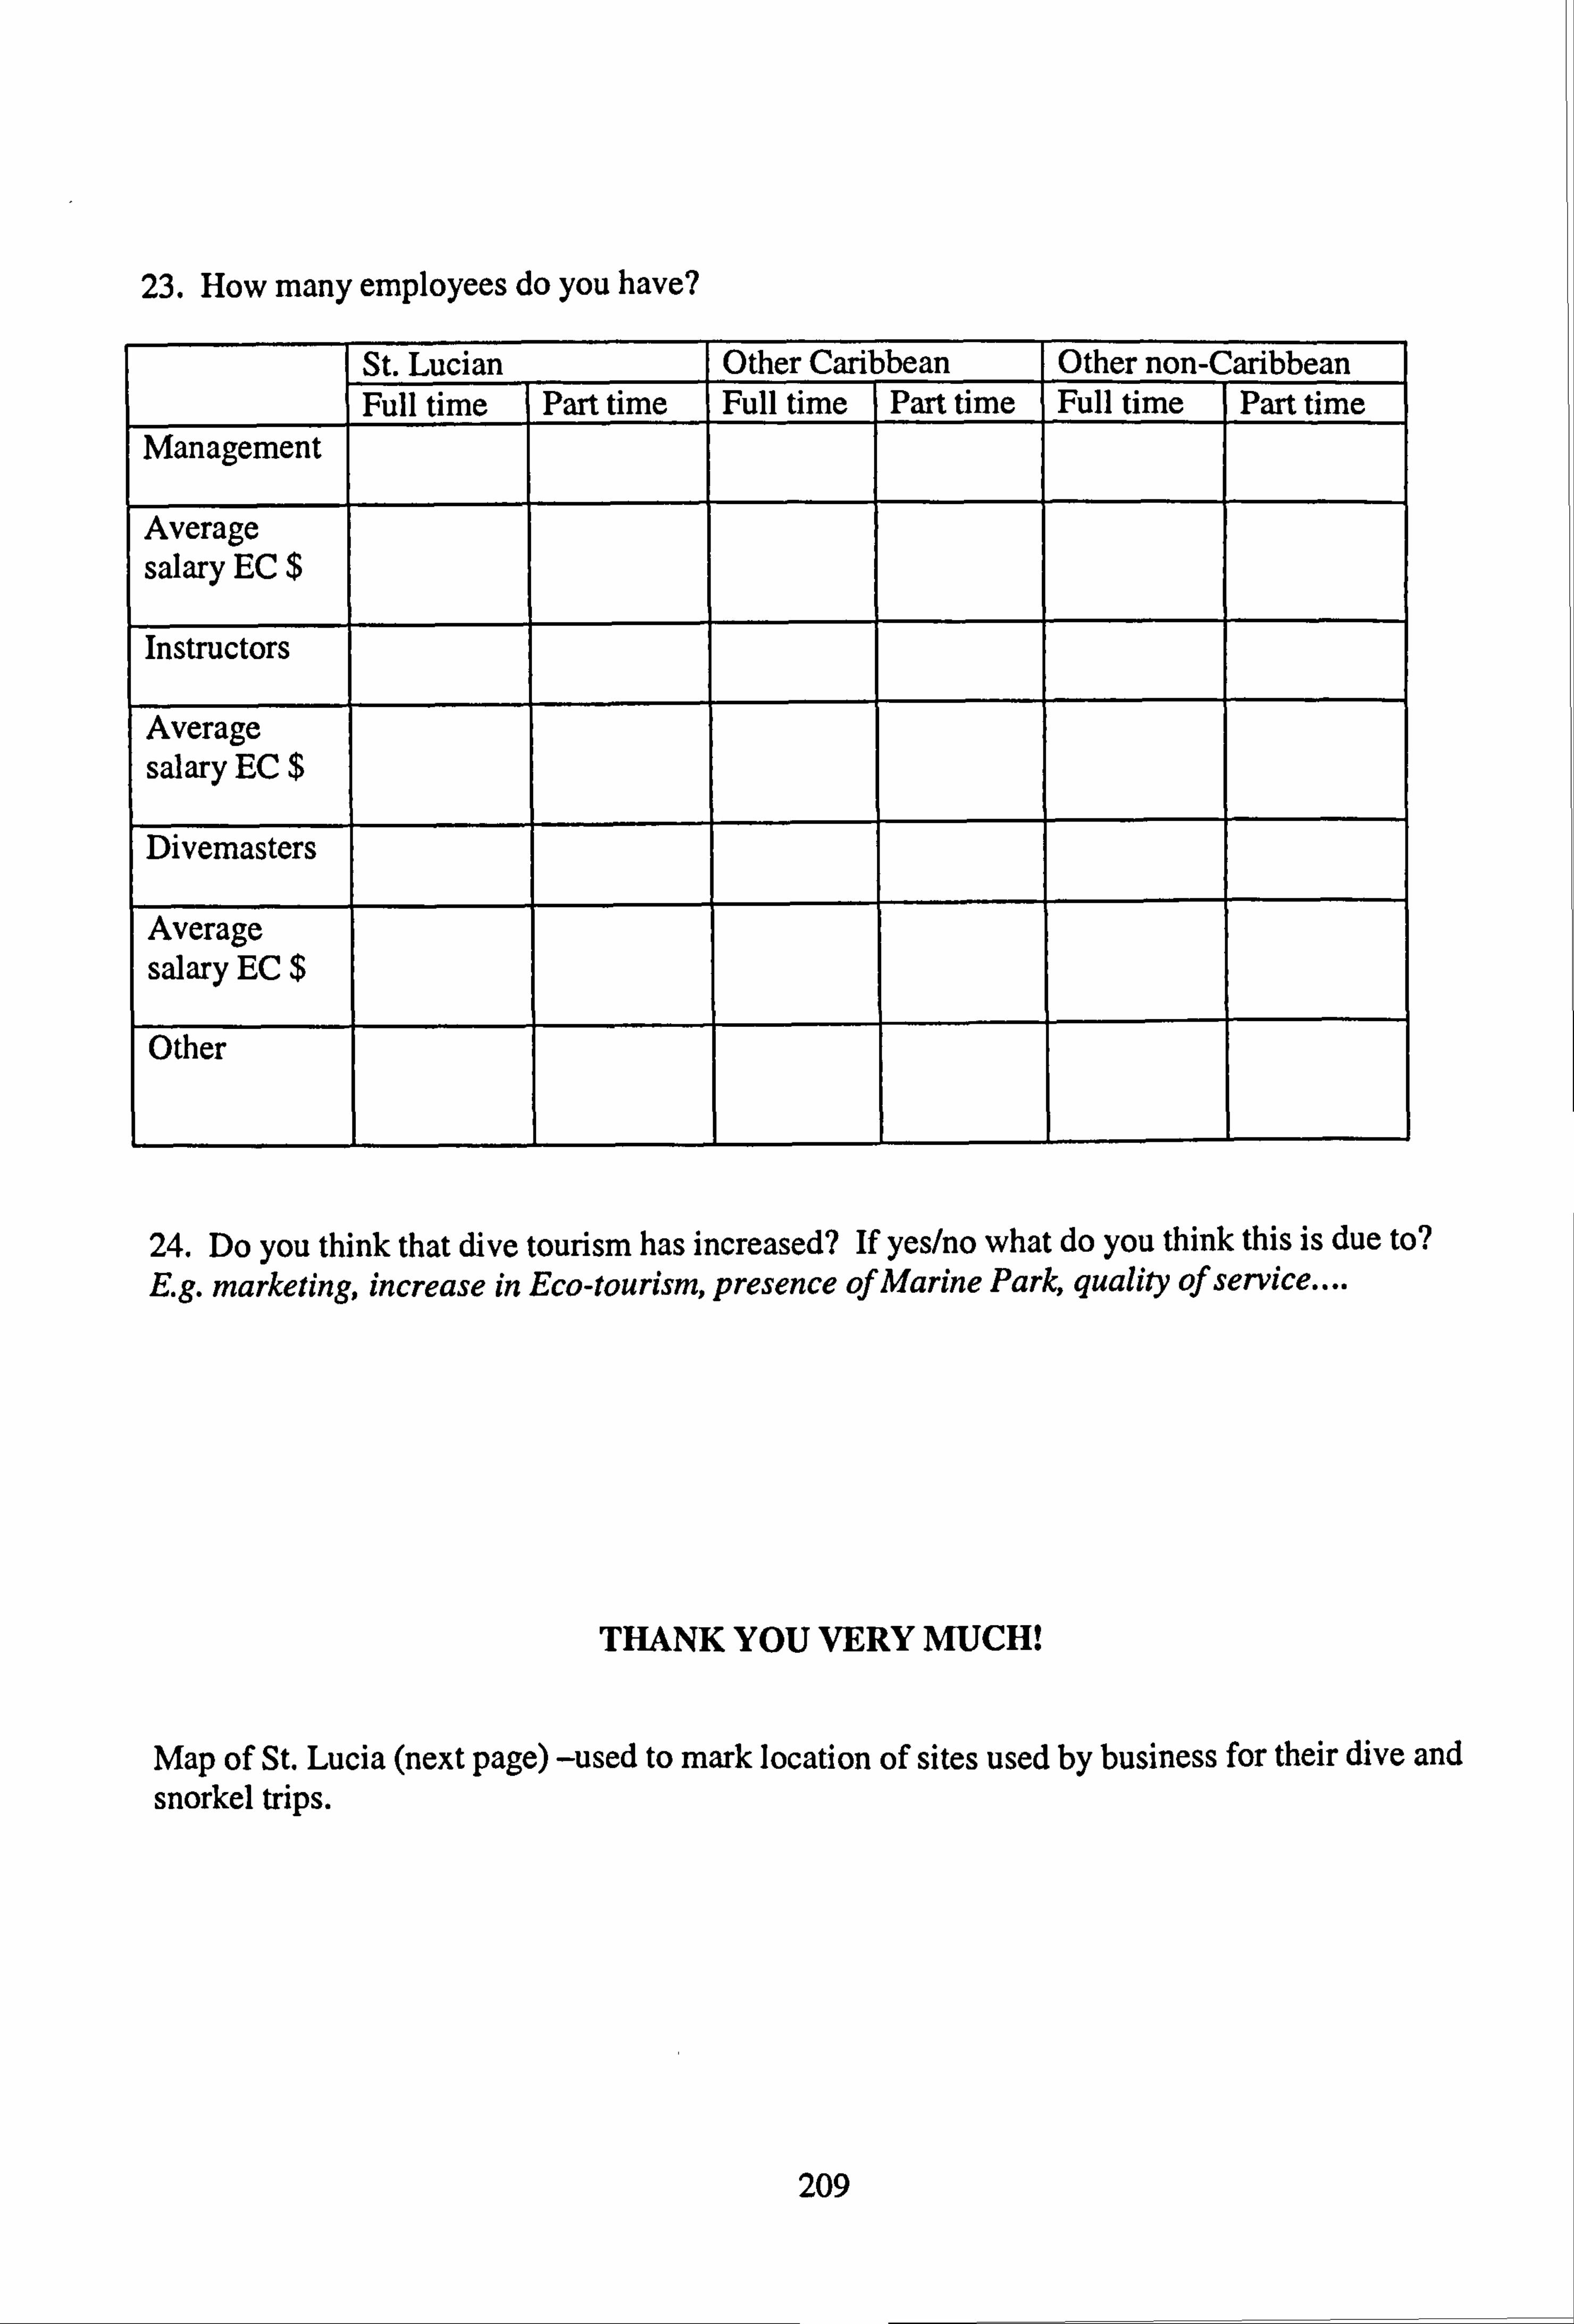
23. How many employees do you have?
St. Lucian Other Caribbean Other non-Caribbean _ Full time Part time Full time Part time Full time Part time
Management
Average salary EC $
Instructors
Average salary EC $
Divernasters
Average salary EC $
Other
24. Do you think that dive tourism has increased? If yes/no what do you think this is due to? Eg. marketing, increase in Eco-tourism, presence of Marine Park, quality of service....
THANK YOU VERY MUCH!
Map of St. Lucia (next page) -used to mark location of sites used by business for their dive and snorkel trips.
209
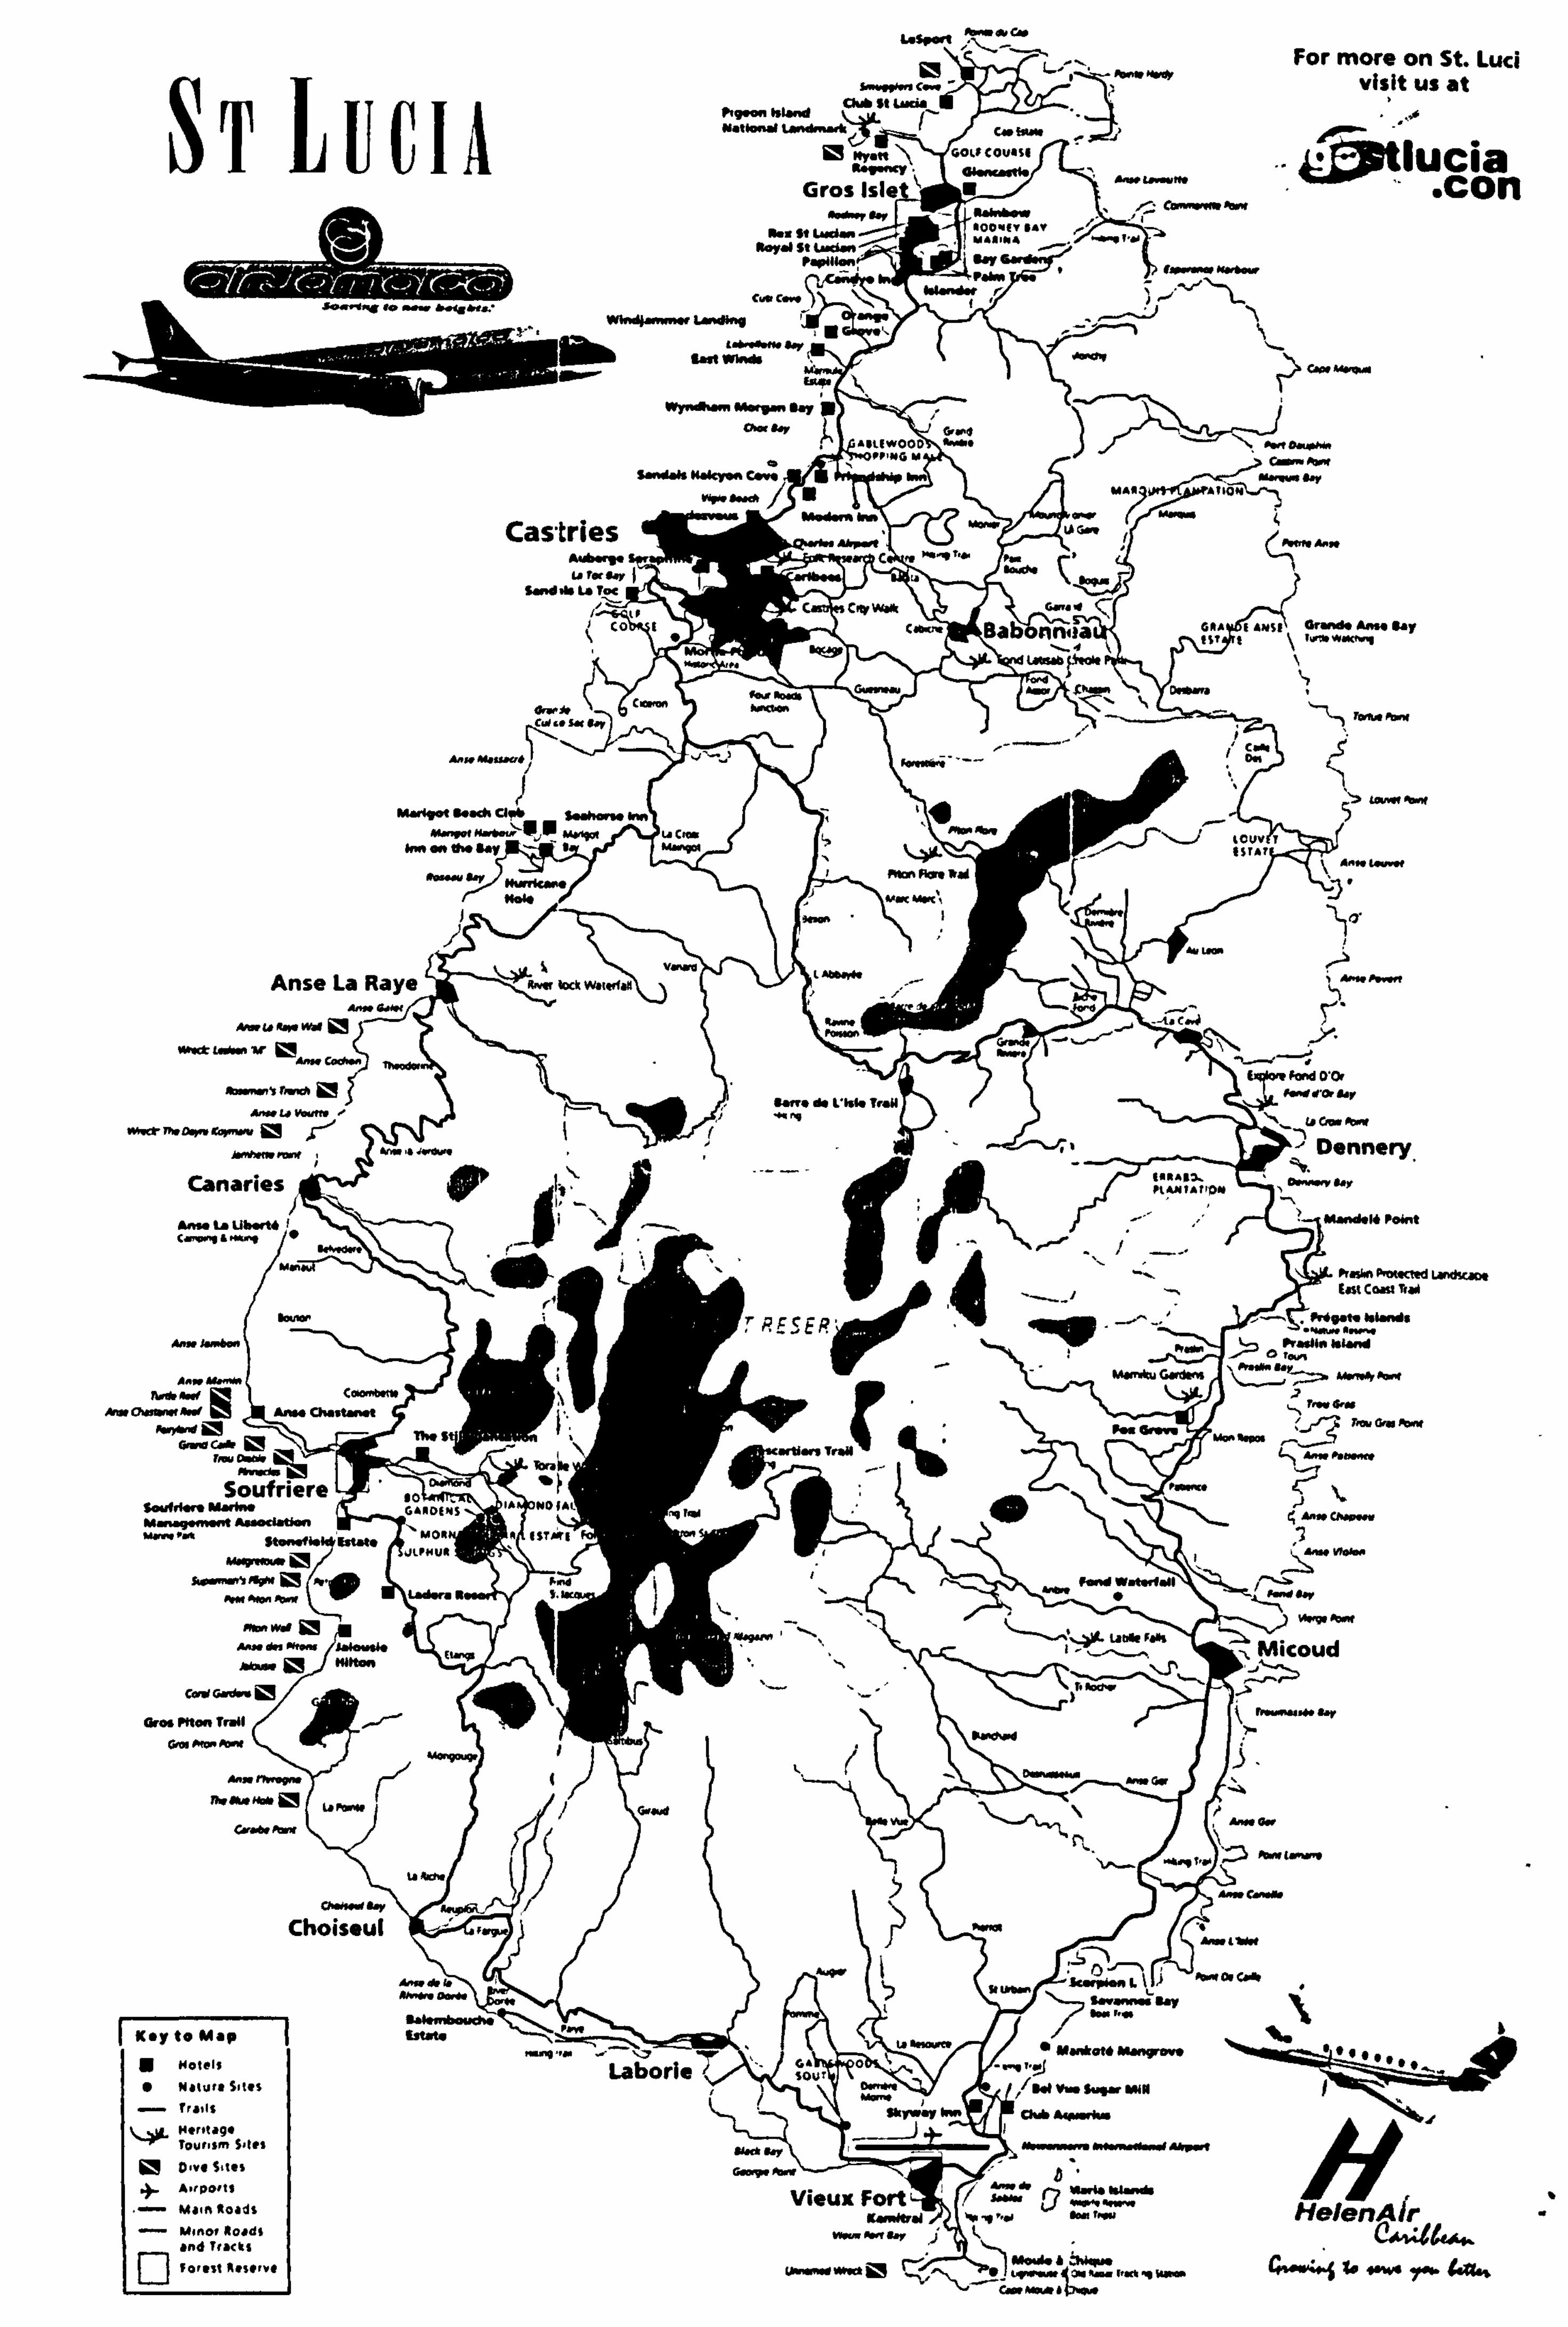
For more on St. Lud
ChA st vis
I it us at
0 -f A*--- - ST LUCIA
13 'Y., GOOCOV411 jý; Wlucia Gloottear". Gros Isle M
-con Nkw- V _4ý C-It- Ila. C_ C_
I. M. W. ,
7,
I- -MIR
Lý OR, 01ýftb ,0 -4V
C4 CAR- I-
MR.
Castries Aft-1 AW-" C Ur. ow I
S-d. k L. T- CRY VAA
CO I C_ OR. to
A. so 41-ft A- lMy a nnqja tP 4
C_ Dý C_
C 161- A-,
Ro, _1
C- tcuv T 1- th. CRY M-. " I STAI
I fmclo, Fl- lRd
94.10
V_ Lbt, 4o
Anse La Raye R WIR ftlollfl
ýUftw, ltlw
Pond 010,
9-. do LIM. T, "
Dennory. Canaries
&-&A Ubrt&
Pl. " NMCNd Ld. ý [at cclast T"w
TPESEP
lAwrftGartRns W"A-
A- Chtotttý - 1w. Iwo Too. S P" G-
a Cft -V viov F_ý T_ 1. 'o-oll
%ý Soufriere I" 5OUlrqoR, ̀R Rud" Gý. Df I- ROM
NTW A- Ch- Assodatilors "_Oý
..... '1
11
5--EK! , -.;
"
J`_ I-, F. " W~R1l ý5 Lado,, R a 1.
wa 1: 1
- d0t ý Amw". 11ý"_ ', Ubk Fft _: t. . Micoud
COW Gd- 7-'
or- 10.0.4 ?_
rt-ý
C_O_ý
D-
_C_ Choiseul
Lk R- W C. * Aý- to -
11- L 9-Y
I
W. Y_, I Wft-
G. 0 Laborle7 sairs I /1 0- 1/30 v- 5"R, IMN
Polls Sk le- Ck& 44RAk.
Hillt. g. 1 r7 6 A, eP* to Vieux Fort 1
Ma. a *,, ads W 0- 1- elenAir
El Lot-oo toollo
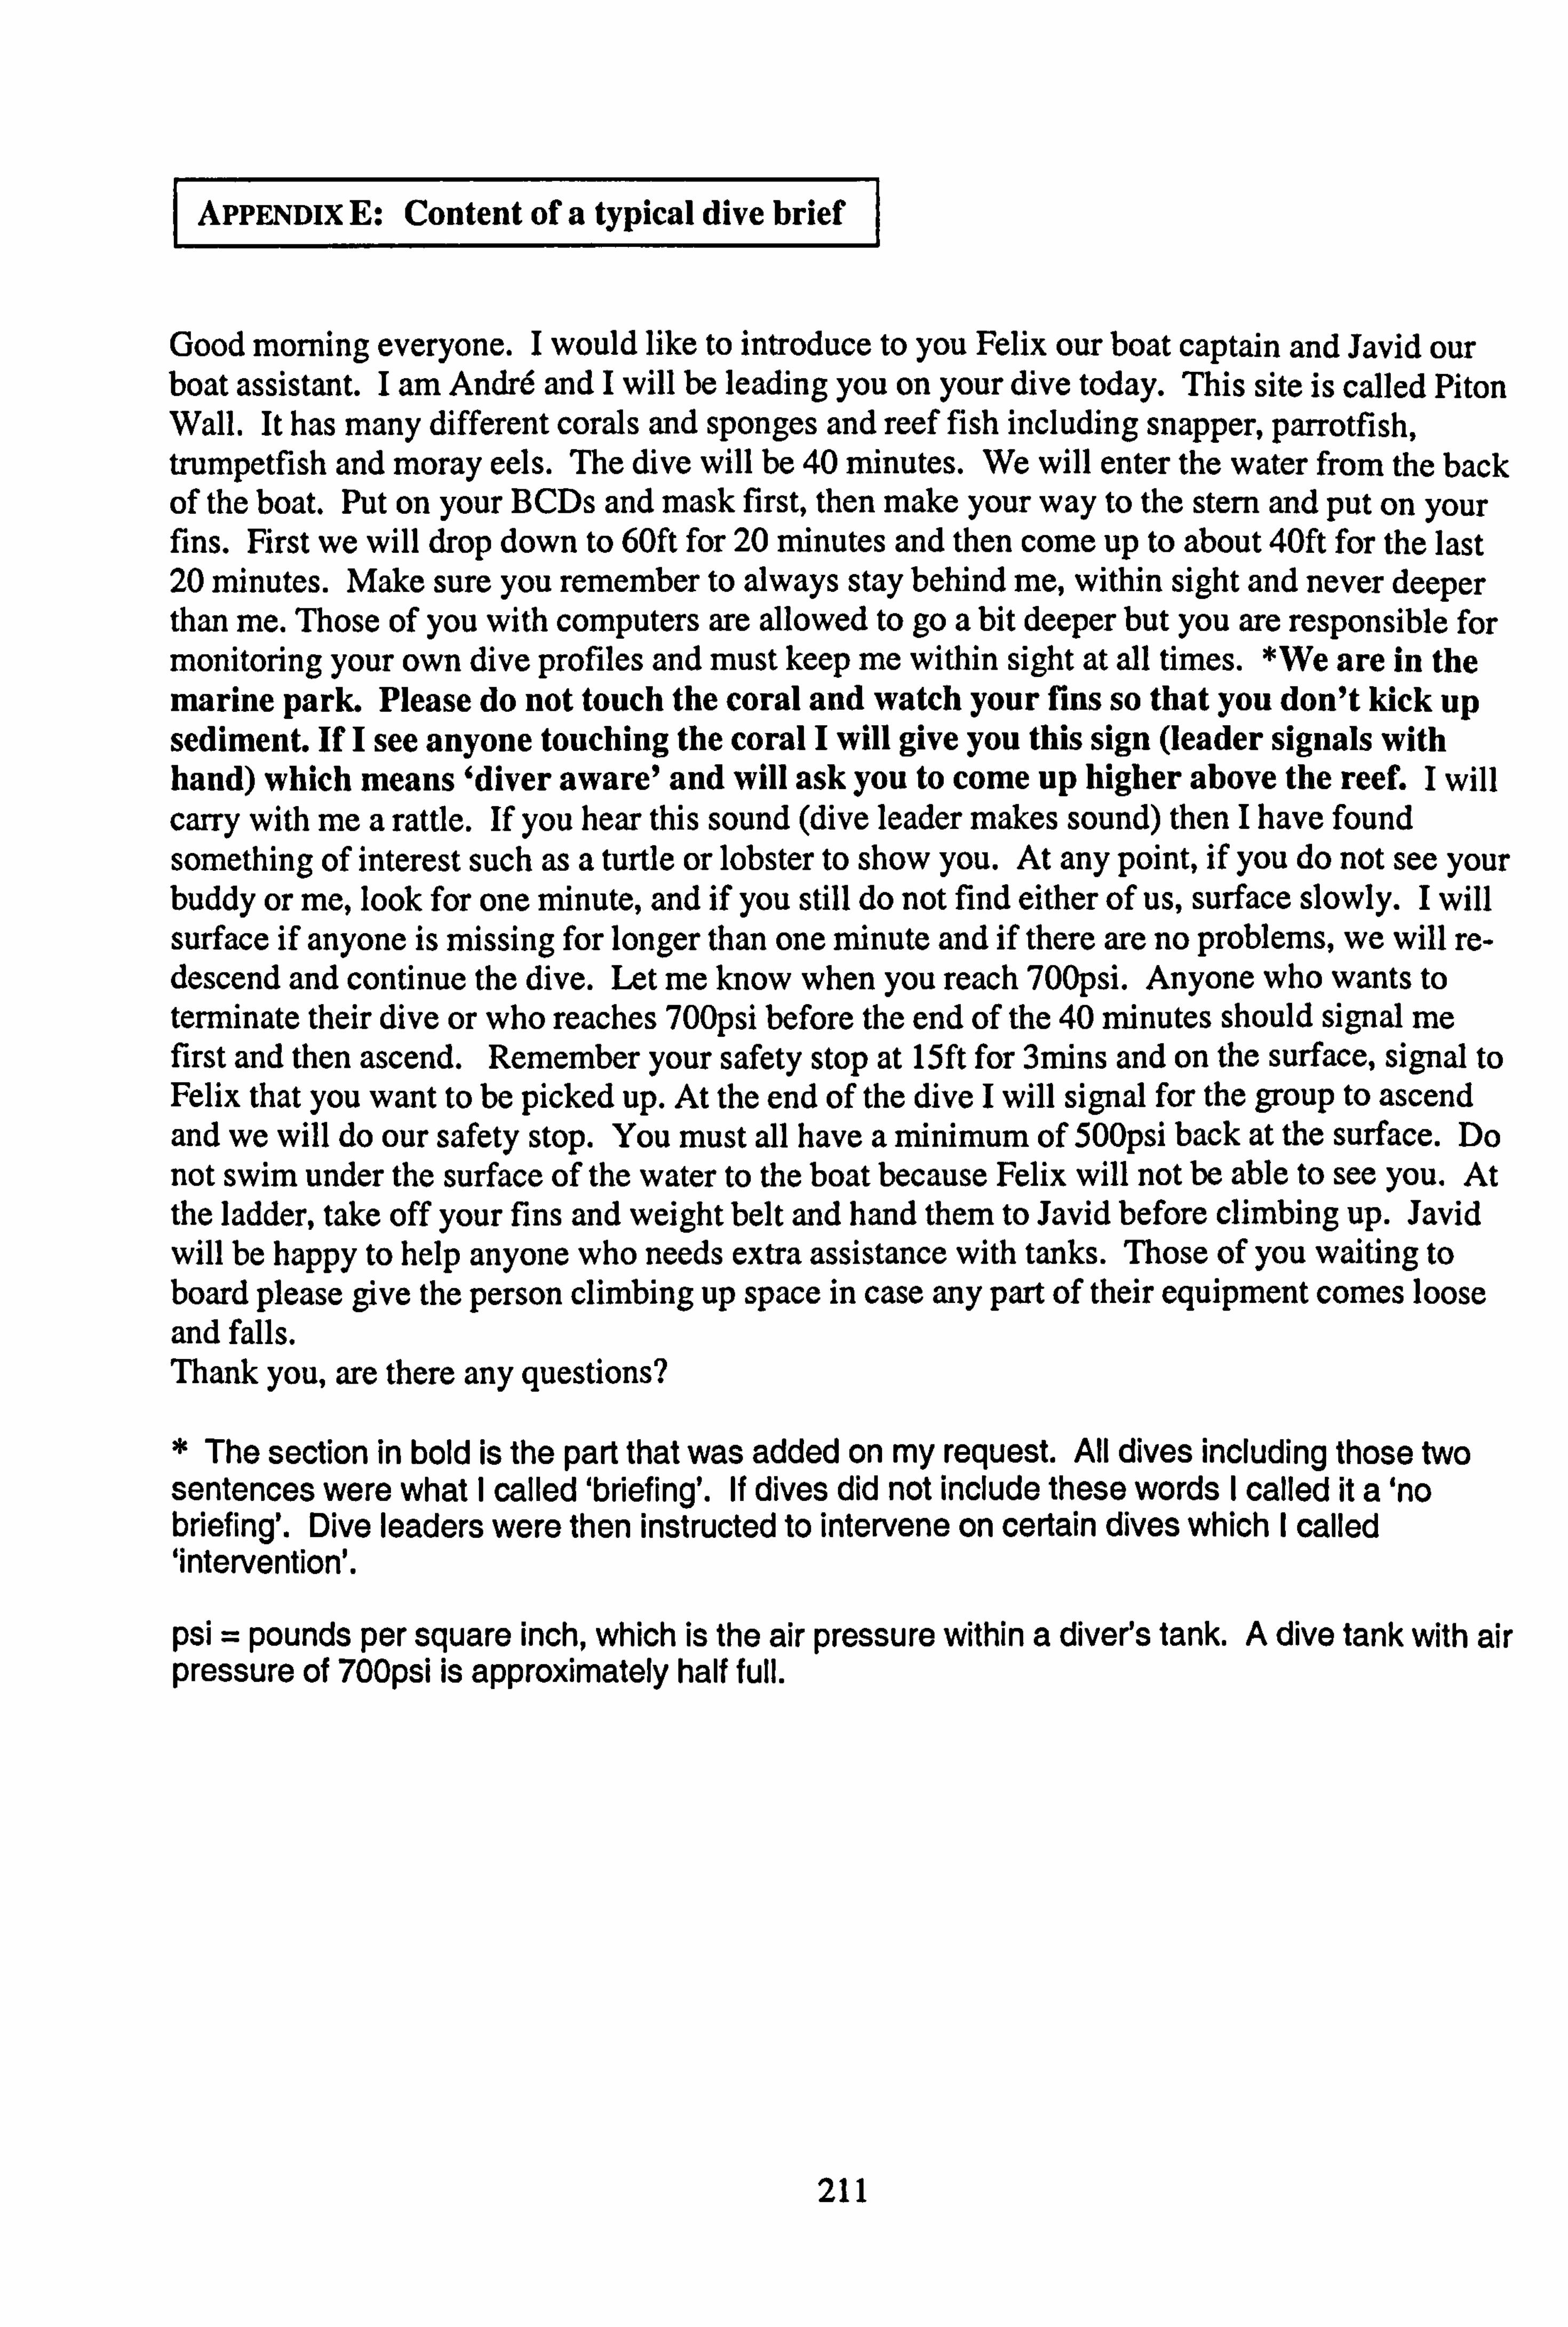
I APPENDix E: Content of a typical dive ýbrief
Good morning everyone. I would like to introduce to you Felix our boat captain and Javid our boat assistant. I am Andr6 and I will be leading you on your dive today. This site is called Piton Wall. It has many different corals and sponges and reef fish including snapper, parrotfish, trumpetfish and moray eels. The dive will be 40 minutes. We will enter the water from the back of the boat. Put on your BCDs and mask first, then make your way to the stem and put on your fins. First we will drop down to 60ft for 20 minutes and then come up to about 40ft for the last 20 minutes. Make sure you remember to always stay behind me, within sight and never deeper than me. Those of you with computers are allowed to go a bit deeper but you are responsible for monitoring your own dive profiles and must keep me within sight at all times. *We are in the marine park. Please do not touch the coral and watch your fins so that you don't kick up sediment. If I see anyone touching the coral I will give you this sign (leader signals with hand) which means 'diver aware' and will ask you to come up higher above the reef. I will carry with me a rattle. If you hear this sound (dive leader makes sound) then I have found something of interest such as a turtle or lobster to show you. At any point, if you do not see your buddy or me, look for one minute, and if you still do not find either of us, surface slowly. I will surface if anyone is missing for longer than one minute and if there are no problems, we will re- descend and continue the dive. Let me know when you reach 700psi. Anyone who wants to terminate their dive or who reaches 700psi before the end of the 40 minutes should signal me first and then ascend. Remember your safety stop at l5ft for 3mins and on the surface, signal to Felix that you want to be picked up. At the end of the dive I will signal for the group to ascend and we will do our safety stop. You must all have a minimum of 500psi back at the surface. Do not swim under the surface of the water to the boat because Felix will not be able to see you. At the ladder, take off your fins and weight belt and hand them to Javid before climbing up. Javid will be happy to help anyone who needs extra assistance with tanks. Those of you waiting to board please give the person climbing up space in case any part of their equipment comes loose and falls. Thank you, are there any questions?
* The section in bold is the part that was added on my request. All dives including those two sentences were what I called 'briefing'. If dives did not include these words I called it a'no briefing'. Dive leaders were then instructed to intervene on certain dives which I called 'intervention'.
psi = pounds per square inch, which is the air pressure within a diver's tank. A dive tank with air pressure of 700psi is approximately half full.
211
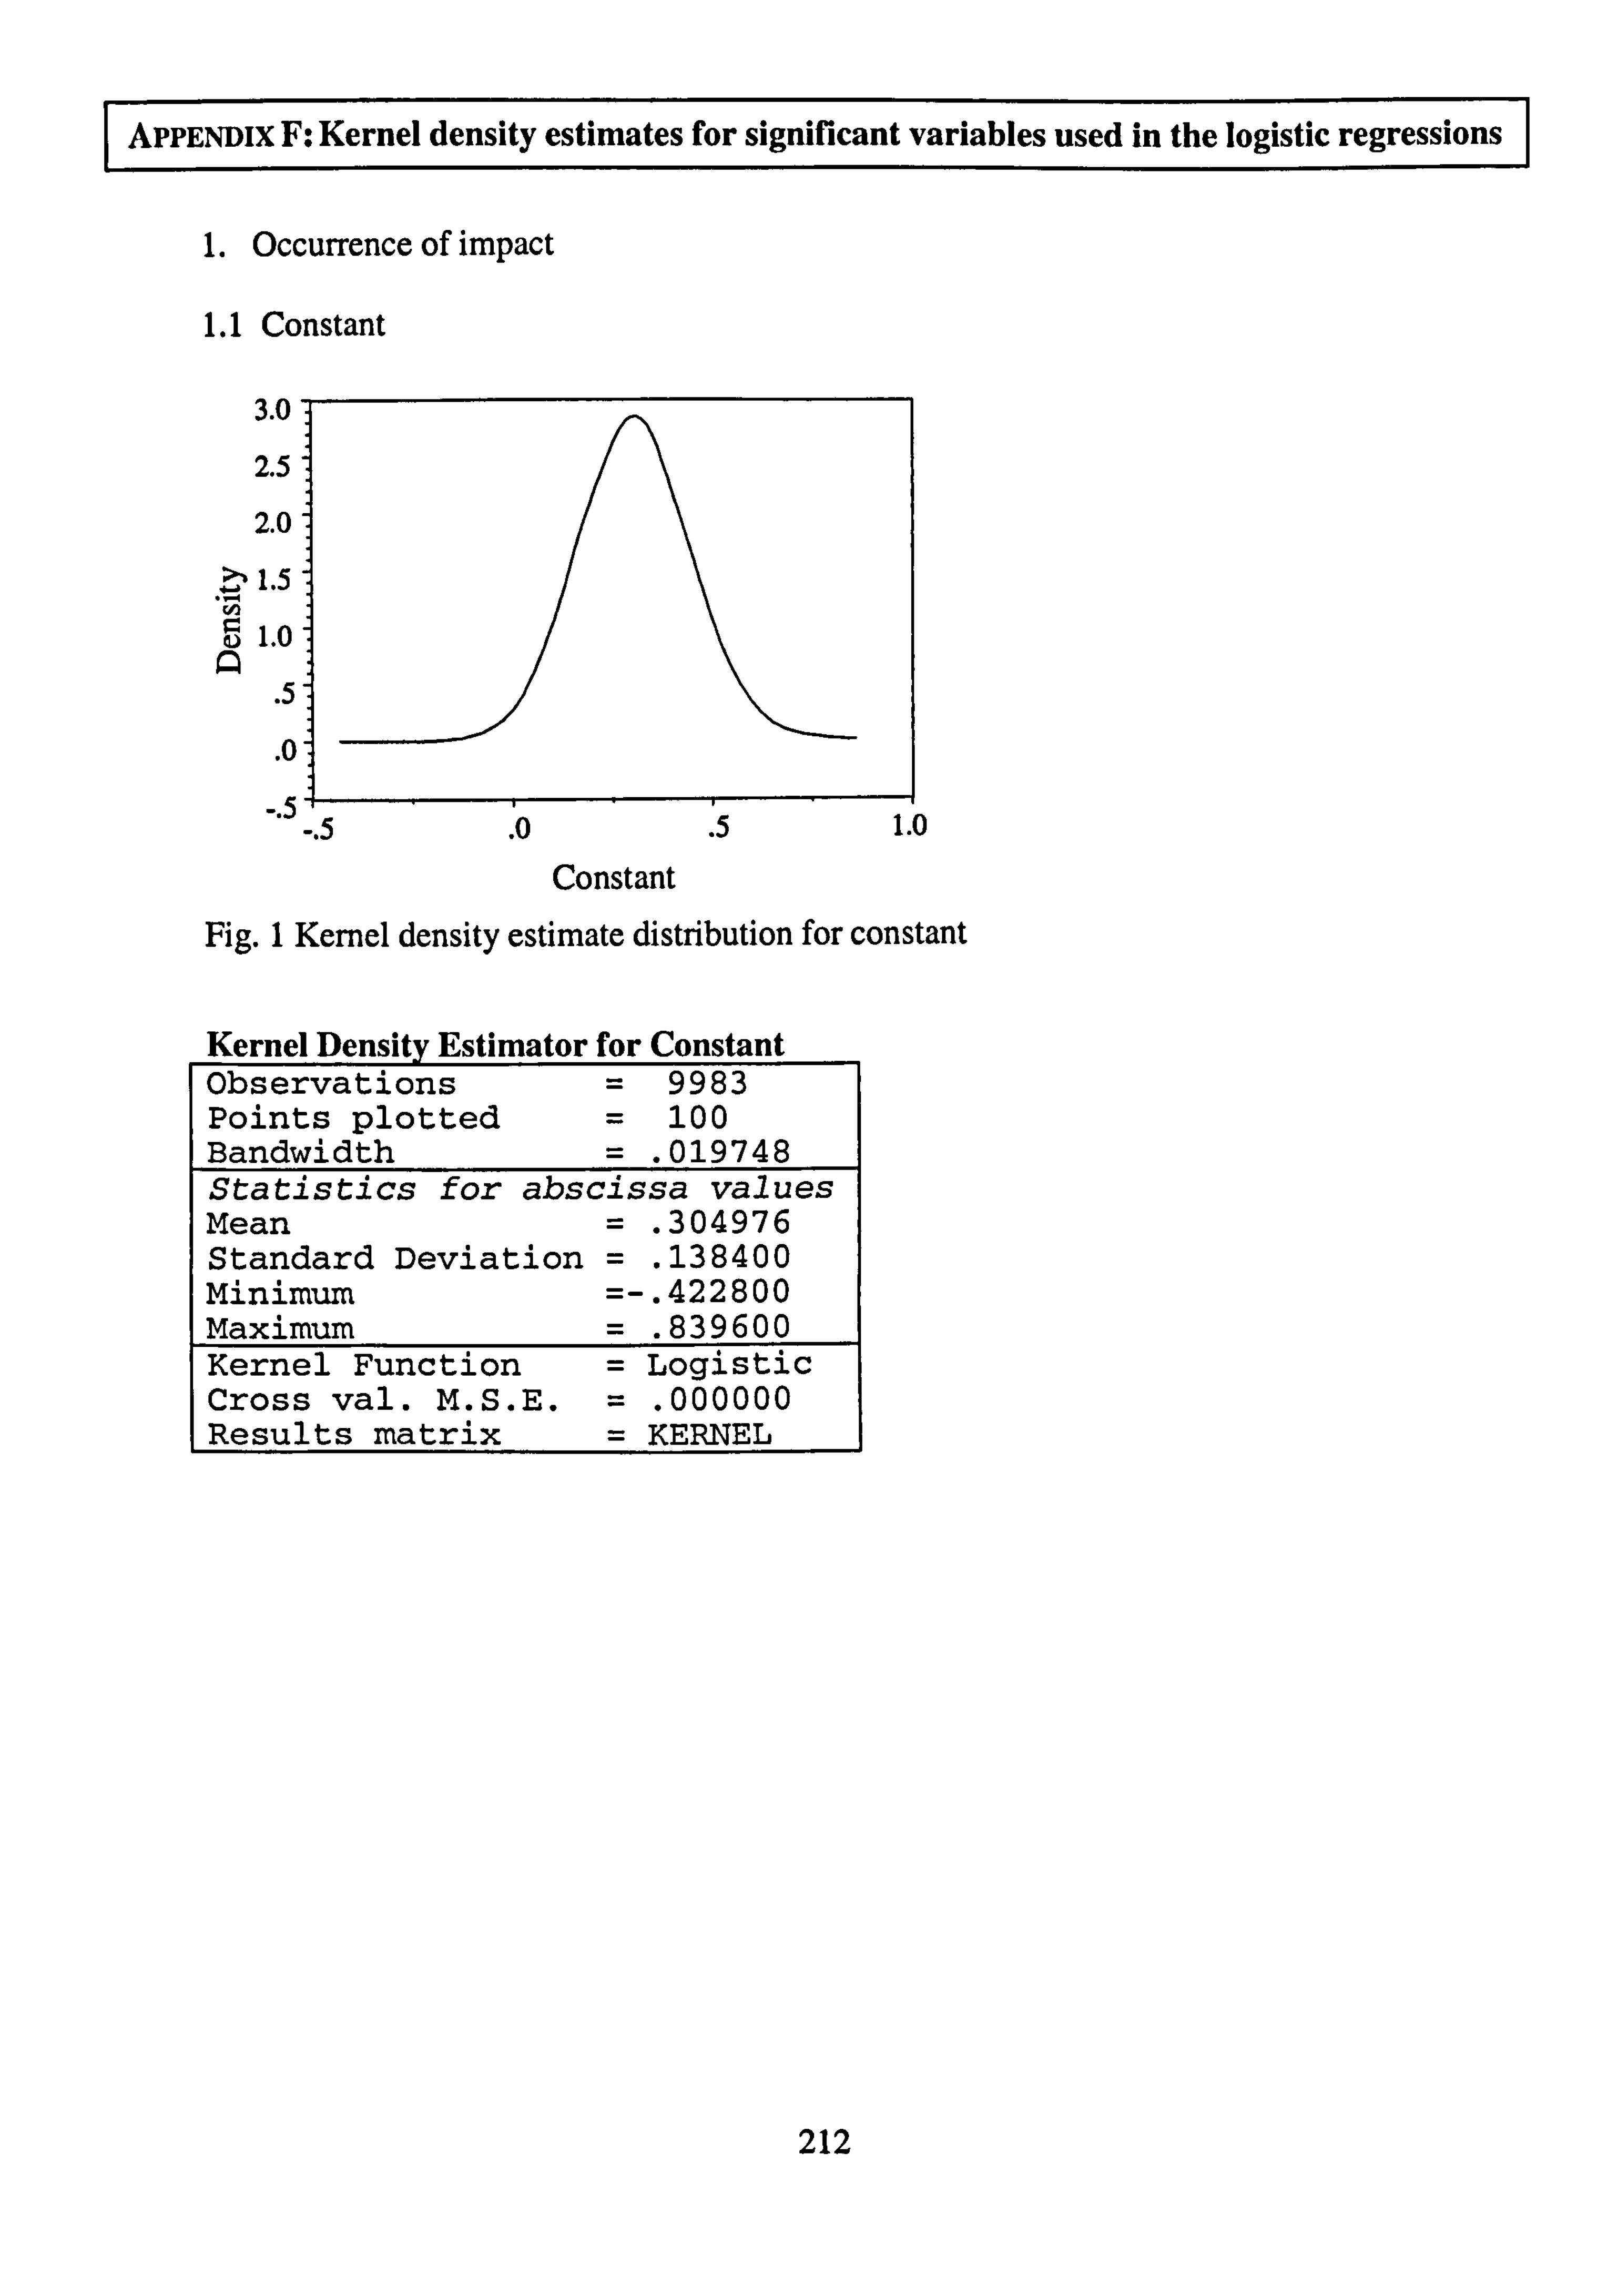
APPENDix F: Kernel density estimates for significant variables used in the logistic regressions
1. Occurrence of impact
1.1 Constant
3.0
2.5
2.0
1.5
1.0
.5
-. 5
Constant
Fig. I Kernel density estimate distribution for constant
Kernel Densitv Estimator for Uonstant Observations Points plotted Bandwidth
= 9983 = 100 = . 019748
Statistics for abscissa values Mean = . 304976 Standard Deviation = . 138400 Minimum =-. 422800 Maximum = . 839600 Kernel Function = Logistic Cross val. M. S. E. = . 000000 Results matrix = KERNEL
212
1.0
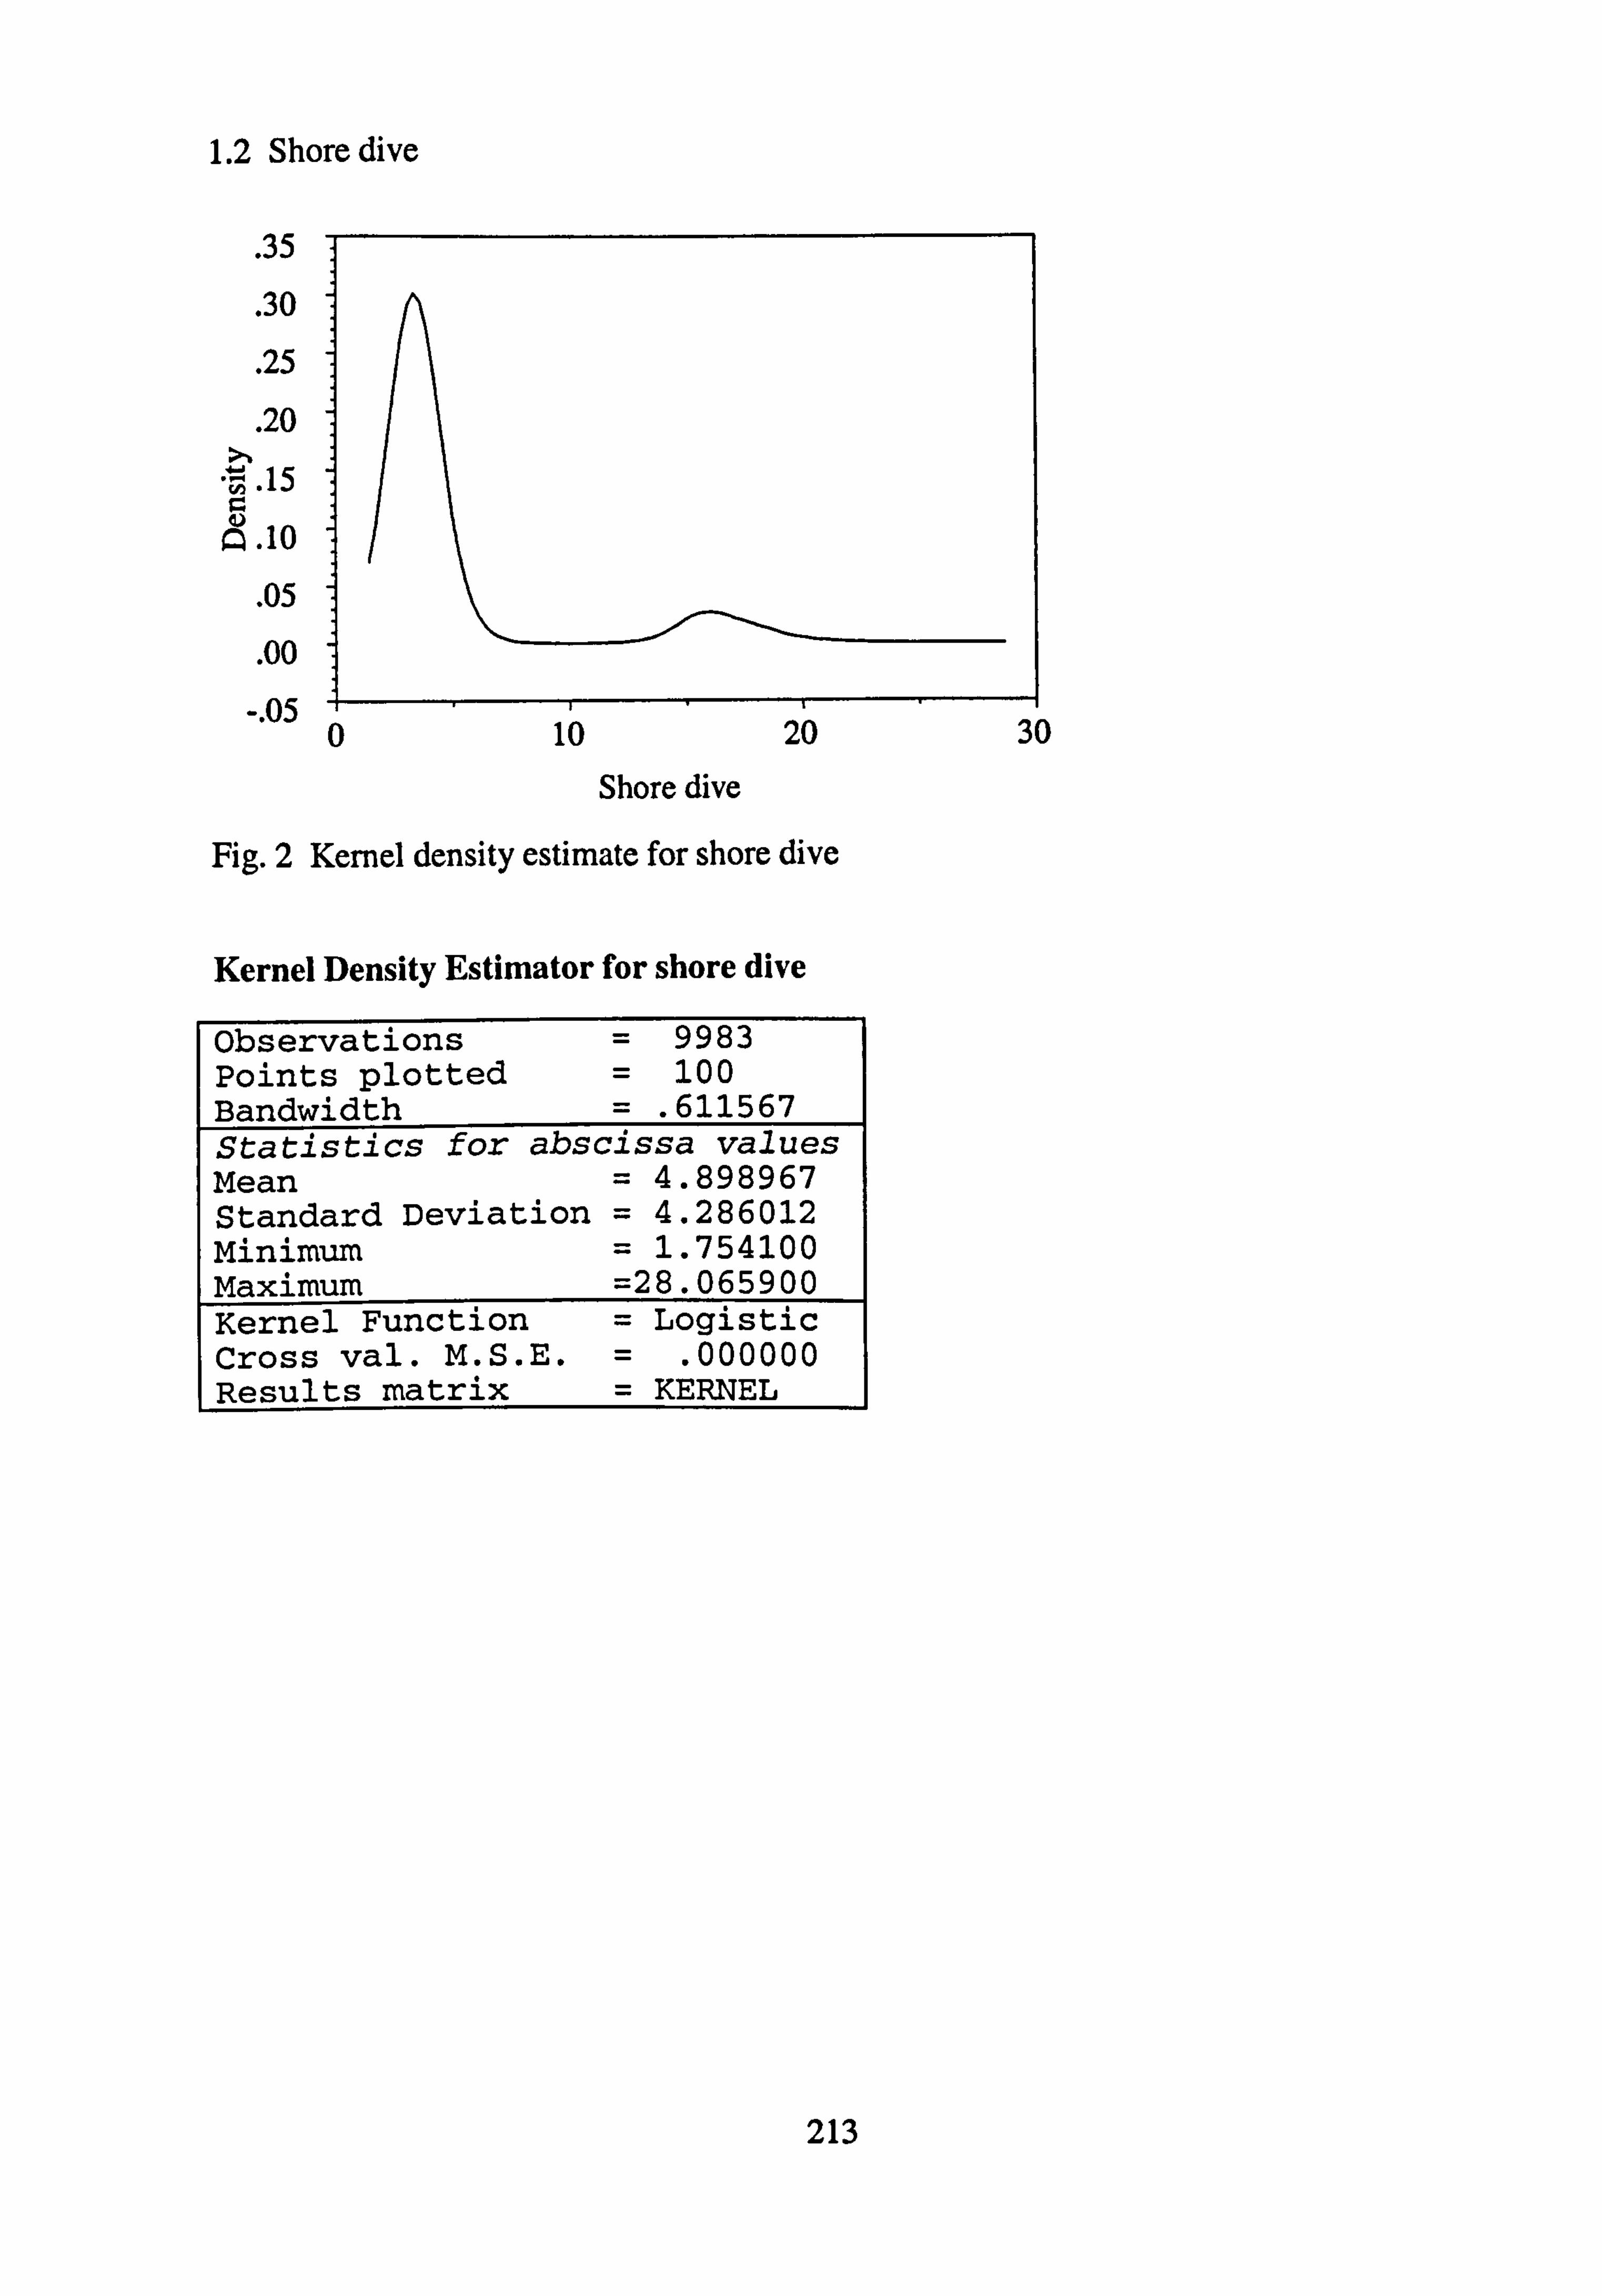
1.2 Shore dive
. 35
. 30
. 25
. 20
�,. 15
10
. 05
. 00
-. 05 0
Shore dive
Fig. 2 Kernel density estimate for shore dive
Kernel Density Estimator for shore dive
Observations Points plotted Bandwidth
= 9983 = 100 = . 611567
Statistics fox- abscissa values Mean = 4.898967 Standard Deviation = 4.286012 Minimum = 1.754100 Maximum =28.065900 Kernel Function = Logistic Cross val. M. S. E. = . 000000 Results matrix = KERNEL
213
iv Zu iv
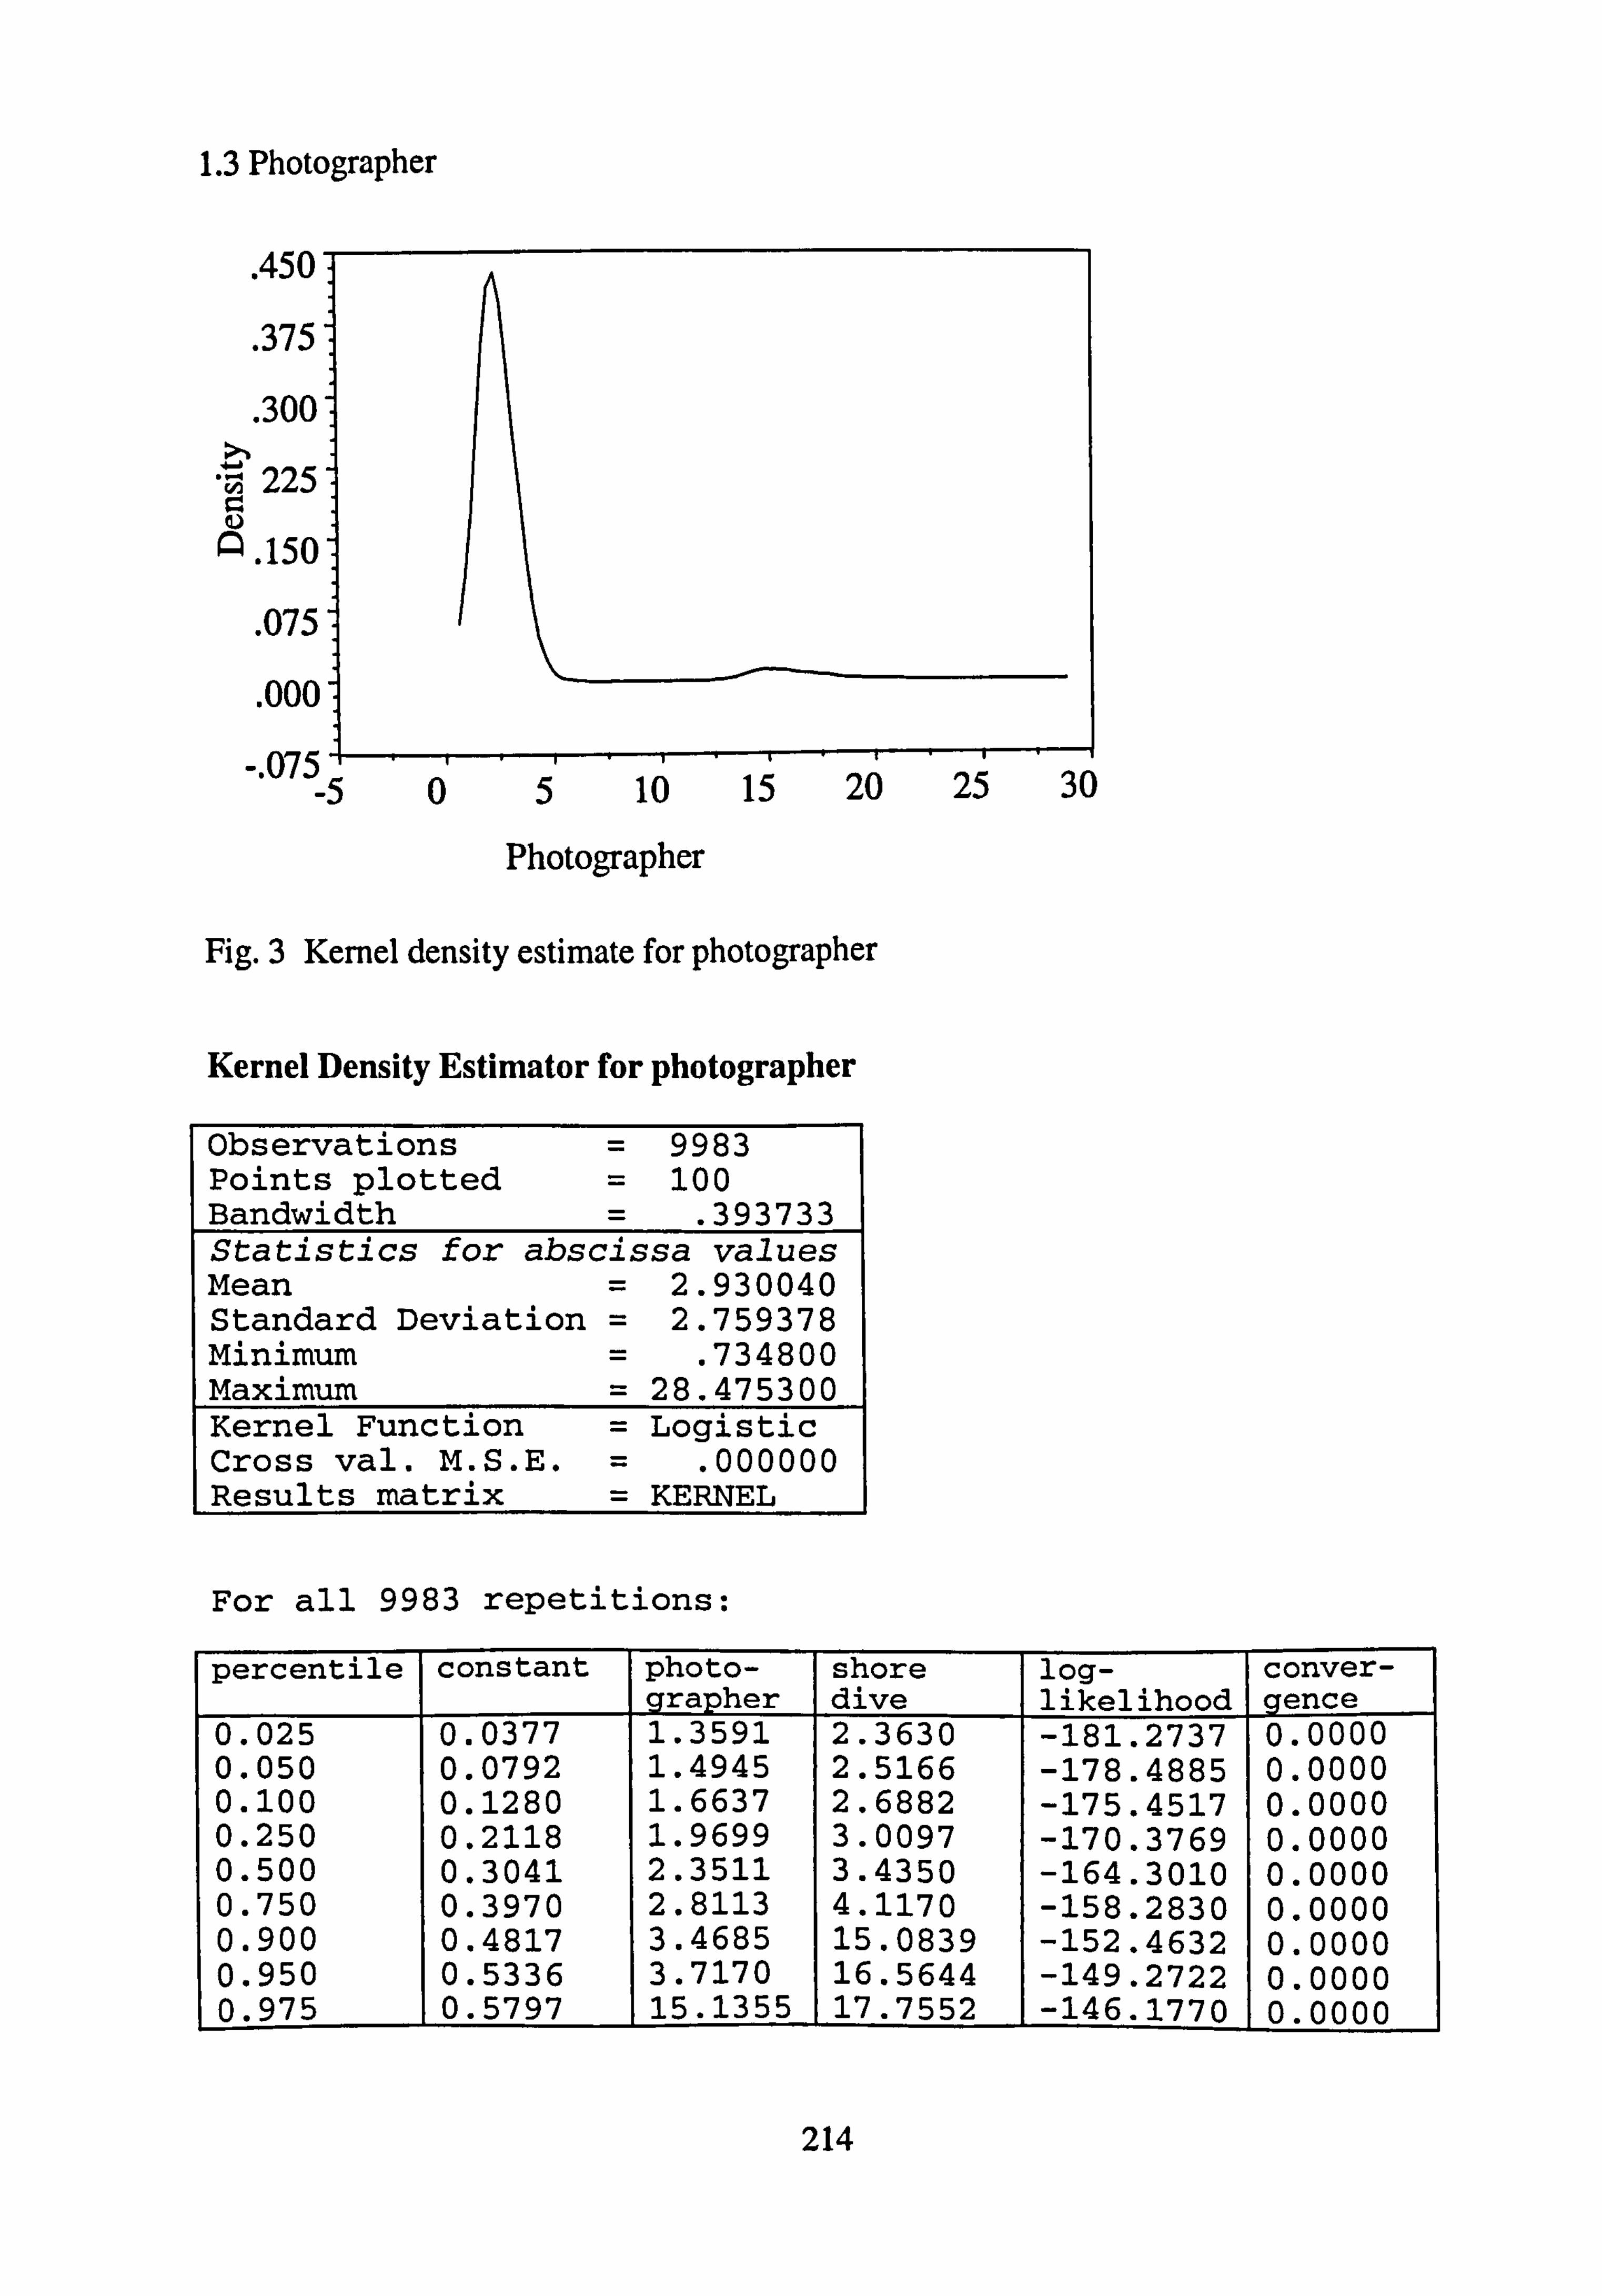
1.3 Photographer
. 450-
. 375
. 300-
225'
. 150'
. 075:
. 0007
-. 075 ̀ 5 lu 11 LU 1. Z) .1u
Photographer
Fig. 3 Kernel density estimate for photographer
Kernel Density Estimator for photographer
Observations = Points plotted = Bandwidth
9983 100
. 393733 Statistics for abscissa values Mean 2.930040 Standard Deviation 2.759378 Minimum * 734800 Maximum 28.475300 Kernel Function Logistic Cross val. M. S. E. . 000000 Results matrix KERNEL
For all 9983 repetitions:
percentile constant photo- grapher
shore dive
log- likelihood
conver- gence
0.025 0.0377 1.3591 2.3630 -181.2737 0.0000 0.050 0.0792 1.4945 2.5166 -178.4885 0.0000 0.100 0.1280 1.6637 2.6882 -175.4517 0.0000 0.250 0.2118 1.9699 3.0097 -170.3769 0.0000 0.500 0.3041 2.3511 3.4350 -164.3010 0.0000 0.750 0.3970 2.8113 4.1170 -158.2830 0.0000 0.900 0.4817 3.4685 15.0839 -152.4632 0.0000 0.950 0.5336 3.7170 16-5644 -149-2722 0.0000 0.975 0.5797 15.1355 17.7552 -146.1770 0.0000
214
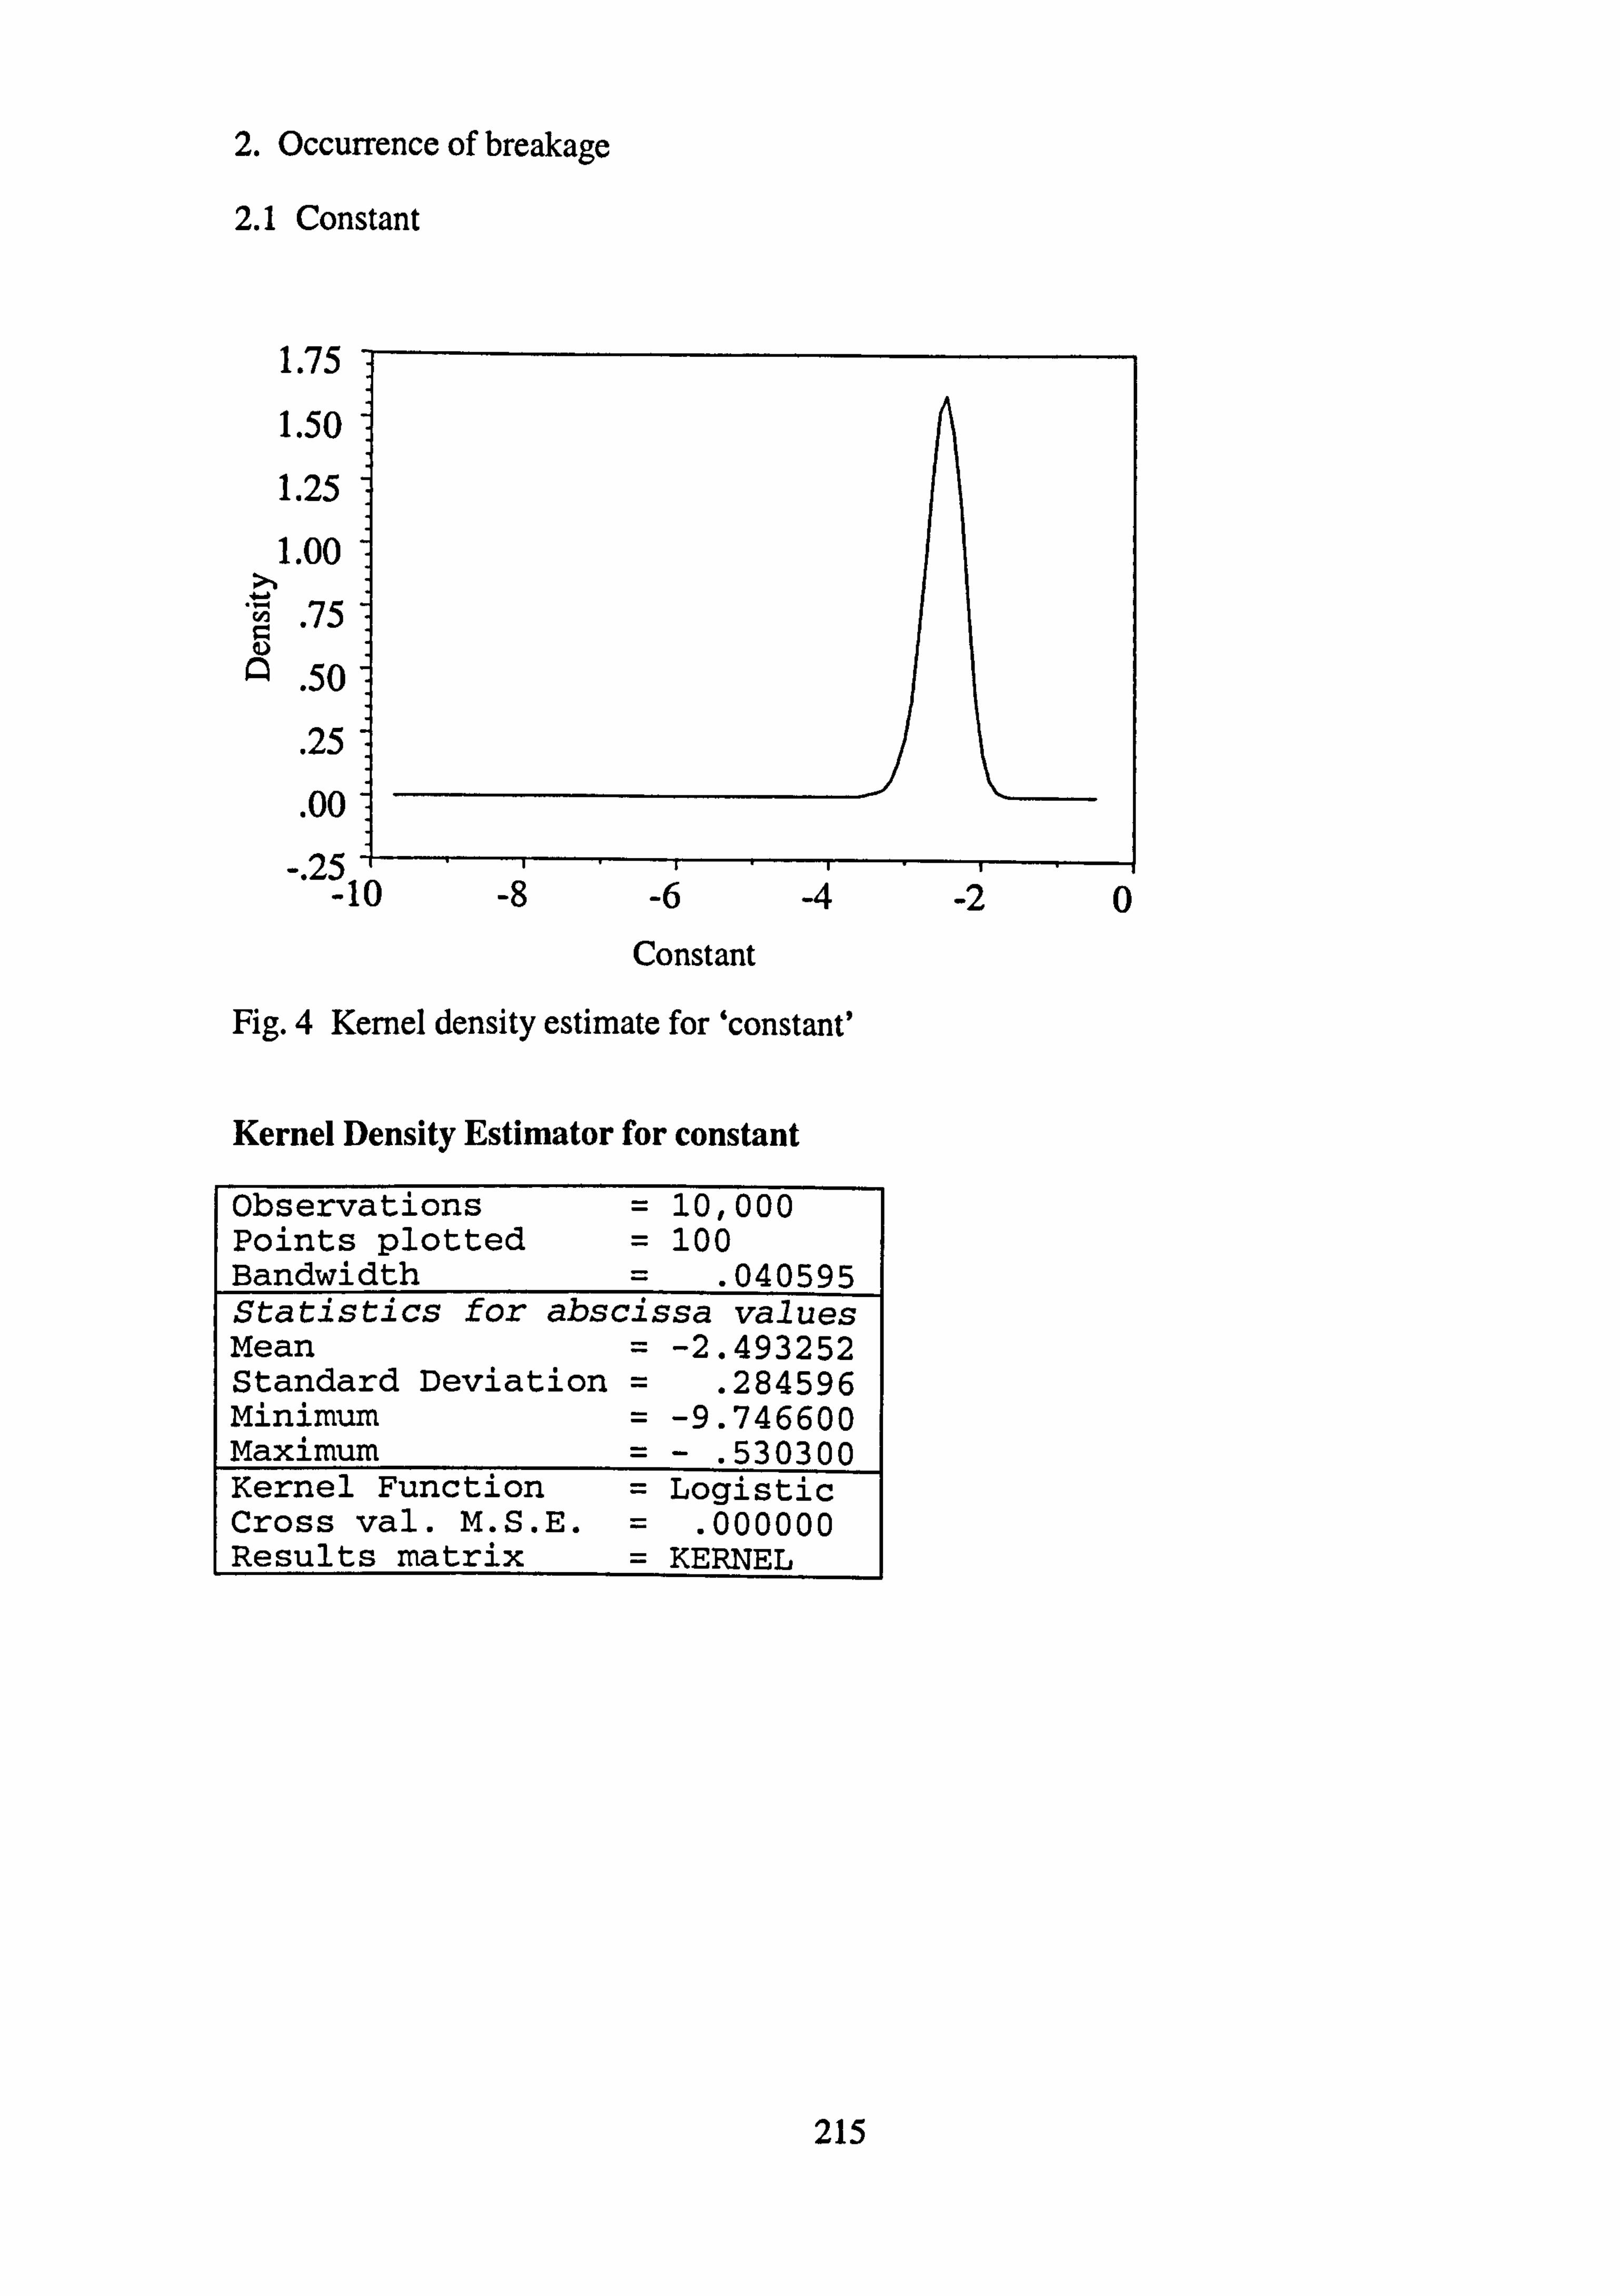
2. Occurrence of breakage
2.1 Constant
1.75
1.50
1.25
1.00
. 75
. 50
. 25
. 00
-. 25-- 10
Constant
Fig. 4 Kernel density estimate for 'constant'
Kernel Density Estimator for constant
Observations Points plotted Bandwidth
= 10,000 = 100
. 040595 St: at: istics for abscissa values Mean = -2.493252 Standard Deviation = . 284596 Minimum = -9.746600 Maximum =- . 530300 Kernel Function = Logistic Cross val. M. S. E. . 000000
lResults matrix KERNEL
215
-0 -0
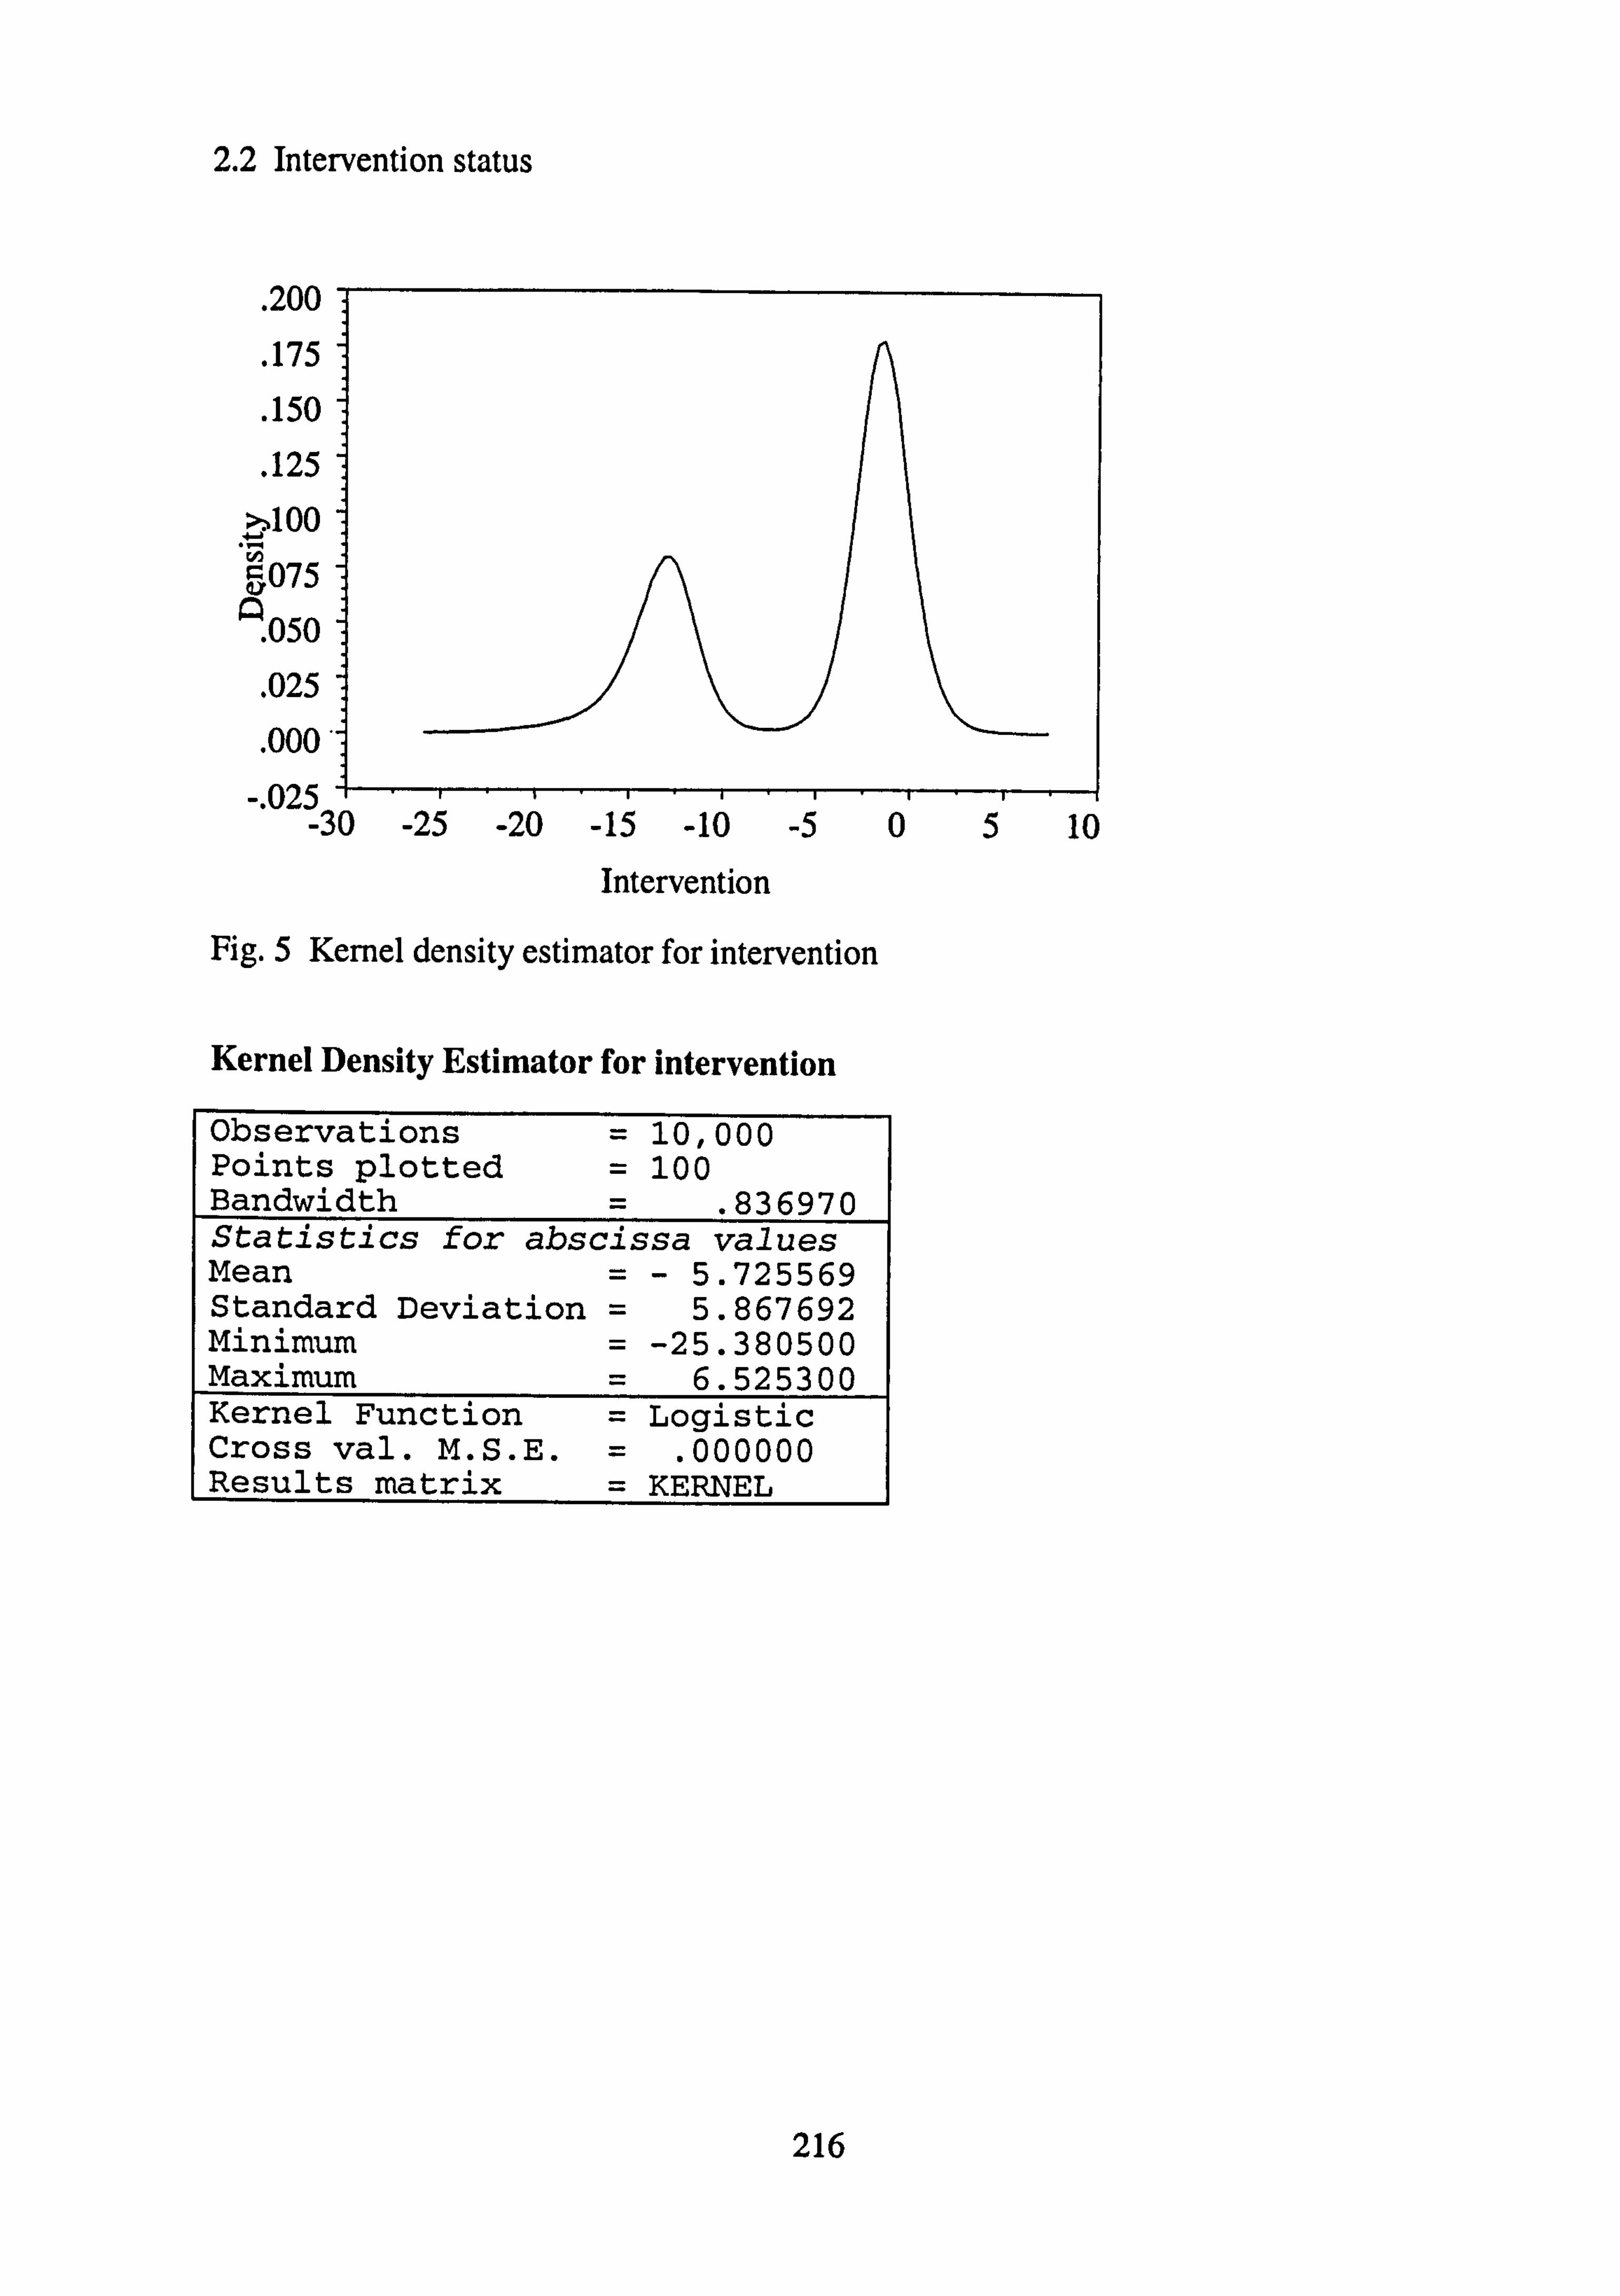
2.2 Intervention status
. 20C
. 175
. 15C
. 125
4:, 100
GA
075 Z
. 050
. 025
-.
o00
. OZ, -j -30 -2: ) -Zu _ID -lu - _n u -3 lu
Intervention
Fig. 5 Kernel density estimator for intervention
Kernel Density Estimator for intervention
observations Points plotted Bandwidth
= 10,000 = 100
. 836970 Statistics for abscissa values Mean = - 5.725569 Standard Deviation = 5.867692 Minimum = -25.380500 Maximum 6.525300 Kernel Function Logistic Cross val. M. S. E. . 000000 Results matrix KERNEL
216
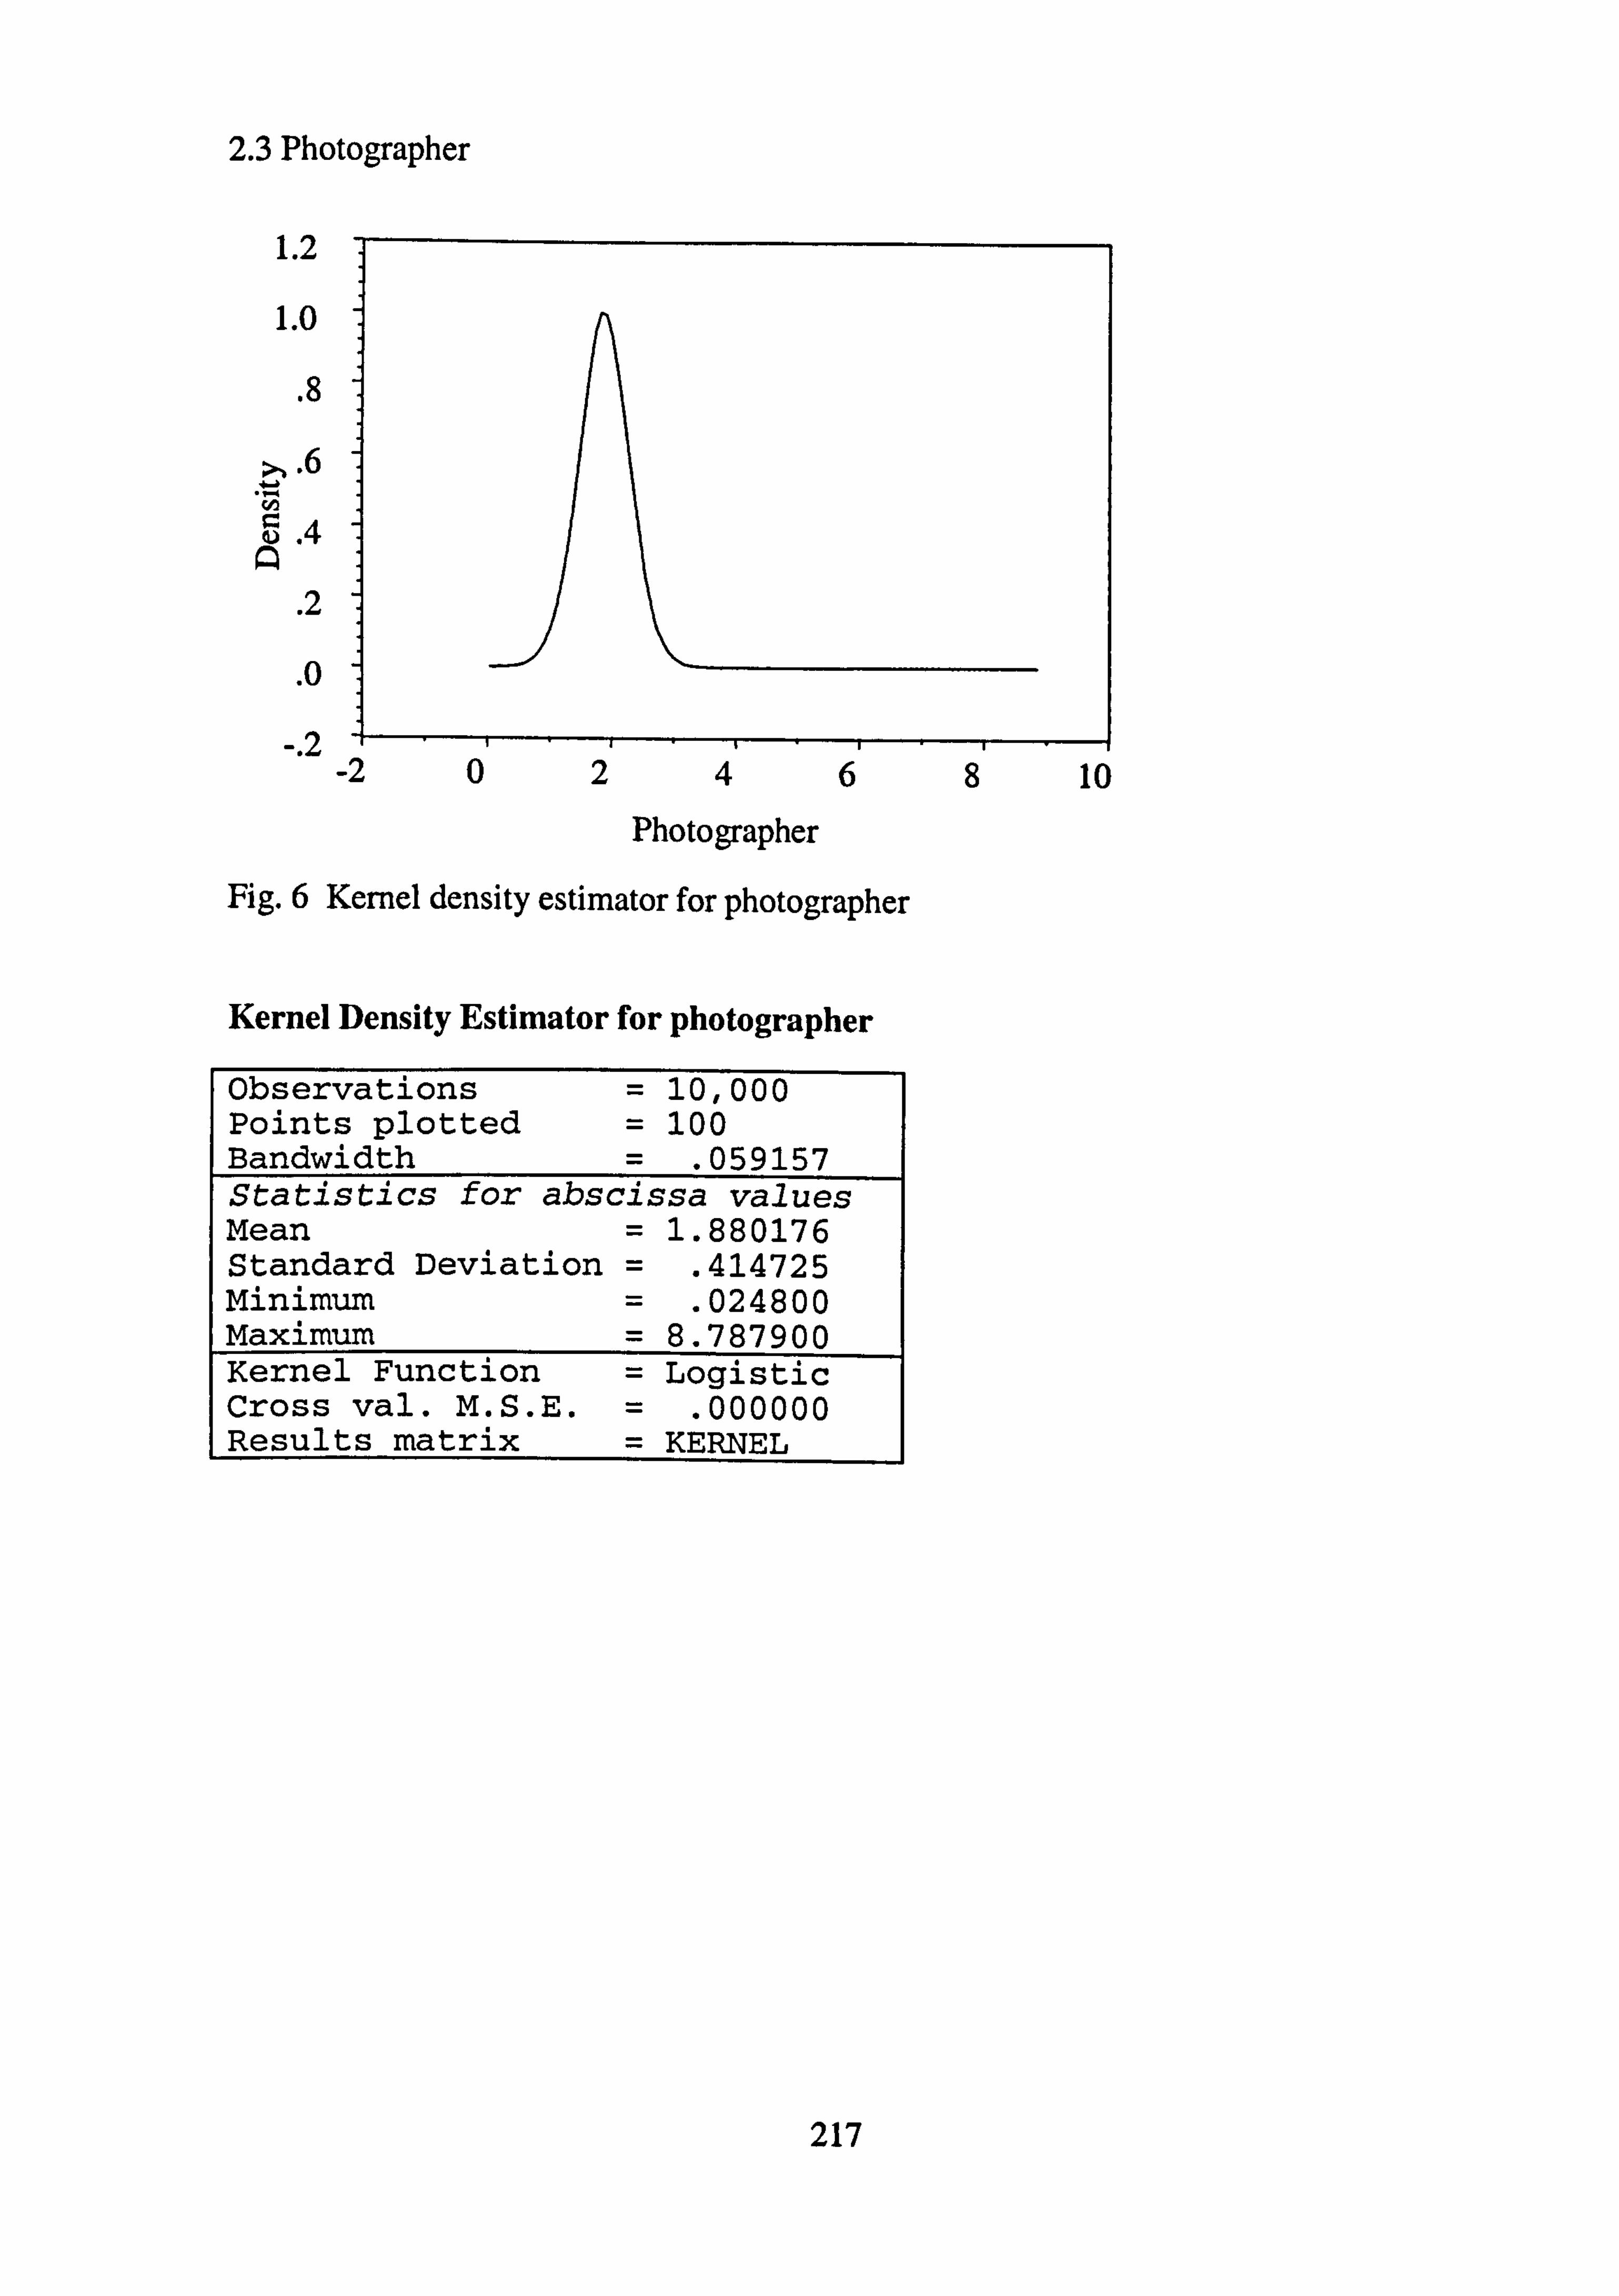
2.3 Photographer
1.2
1.0
.8
.6
Photographer
Fig. 6 Kernel density estimator for photographer
Kernel Density Estimator for photographer
Observations Points plotted Bandwidth
= 10,000 = 100 = . 059157
Statistics for abscissa values Mean = 1.880176 Standard Deviation = . 414725 Minimum . 024800 Maximum = 8.787900 Kernel Function = Logistic Cross val. M. S. E. . 000000 Results matrix KERNEL
217
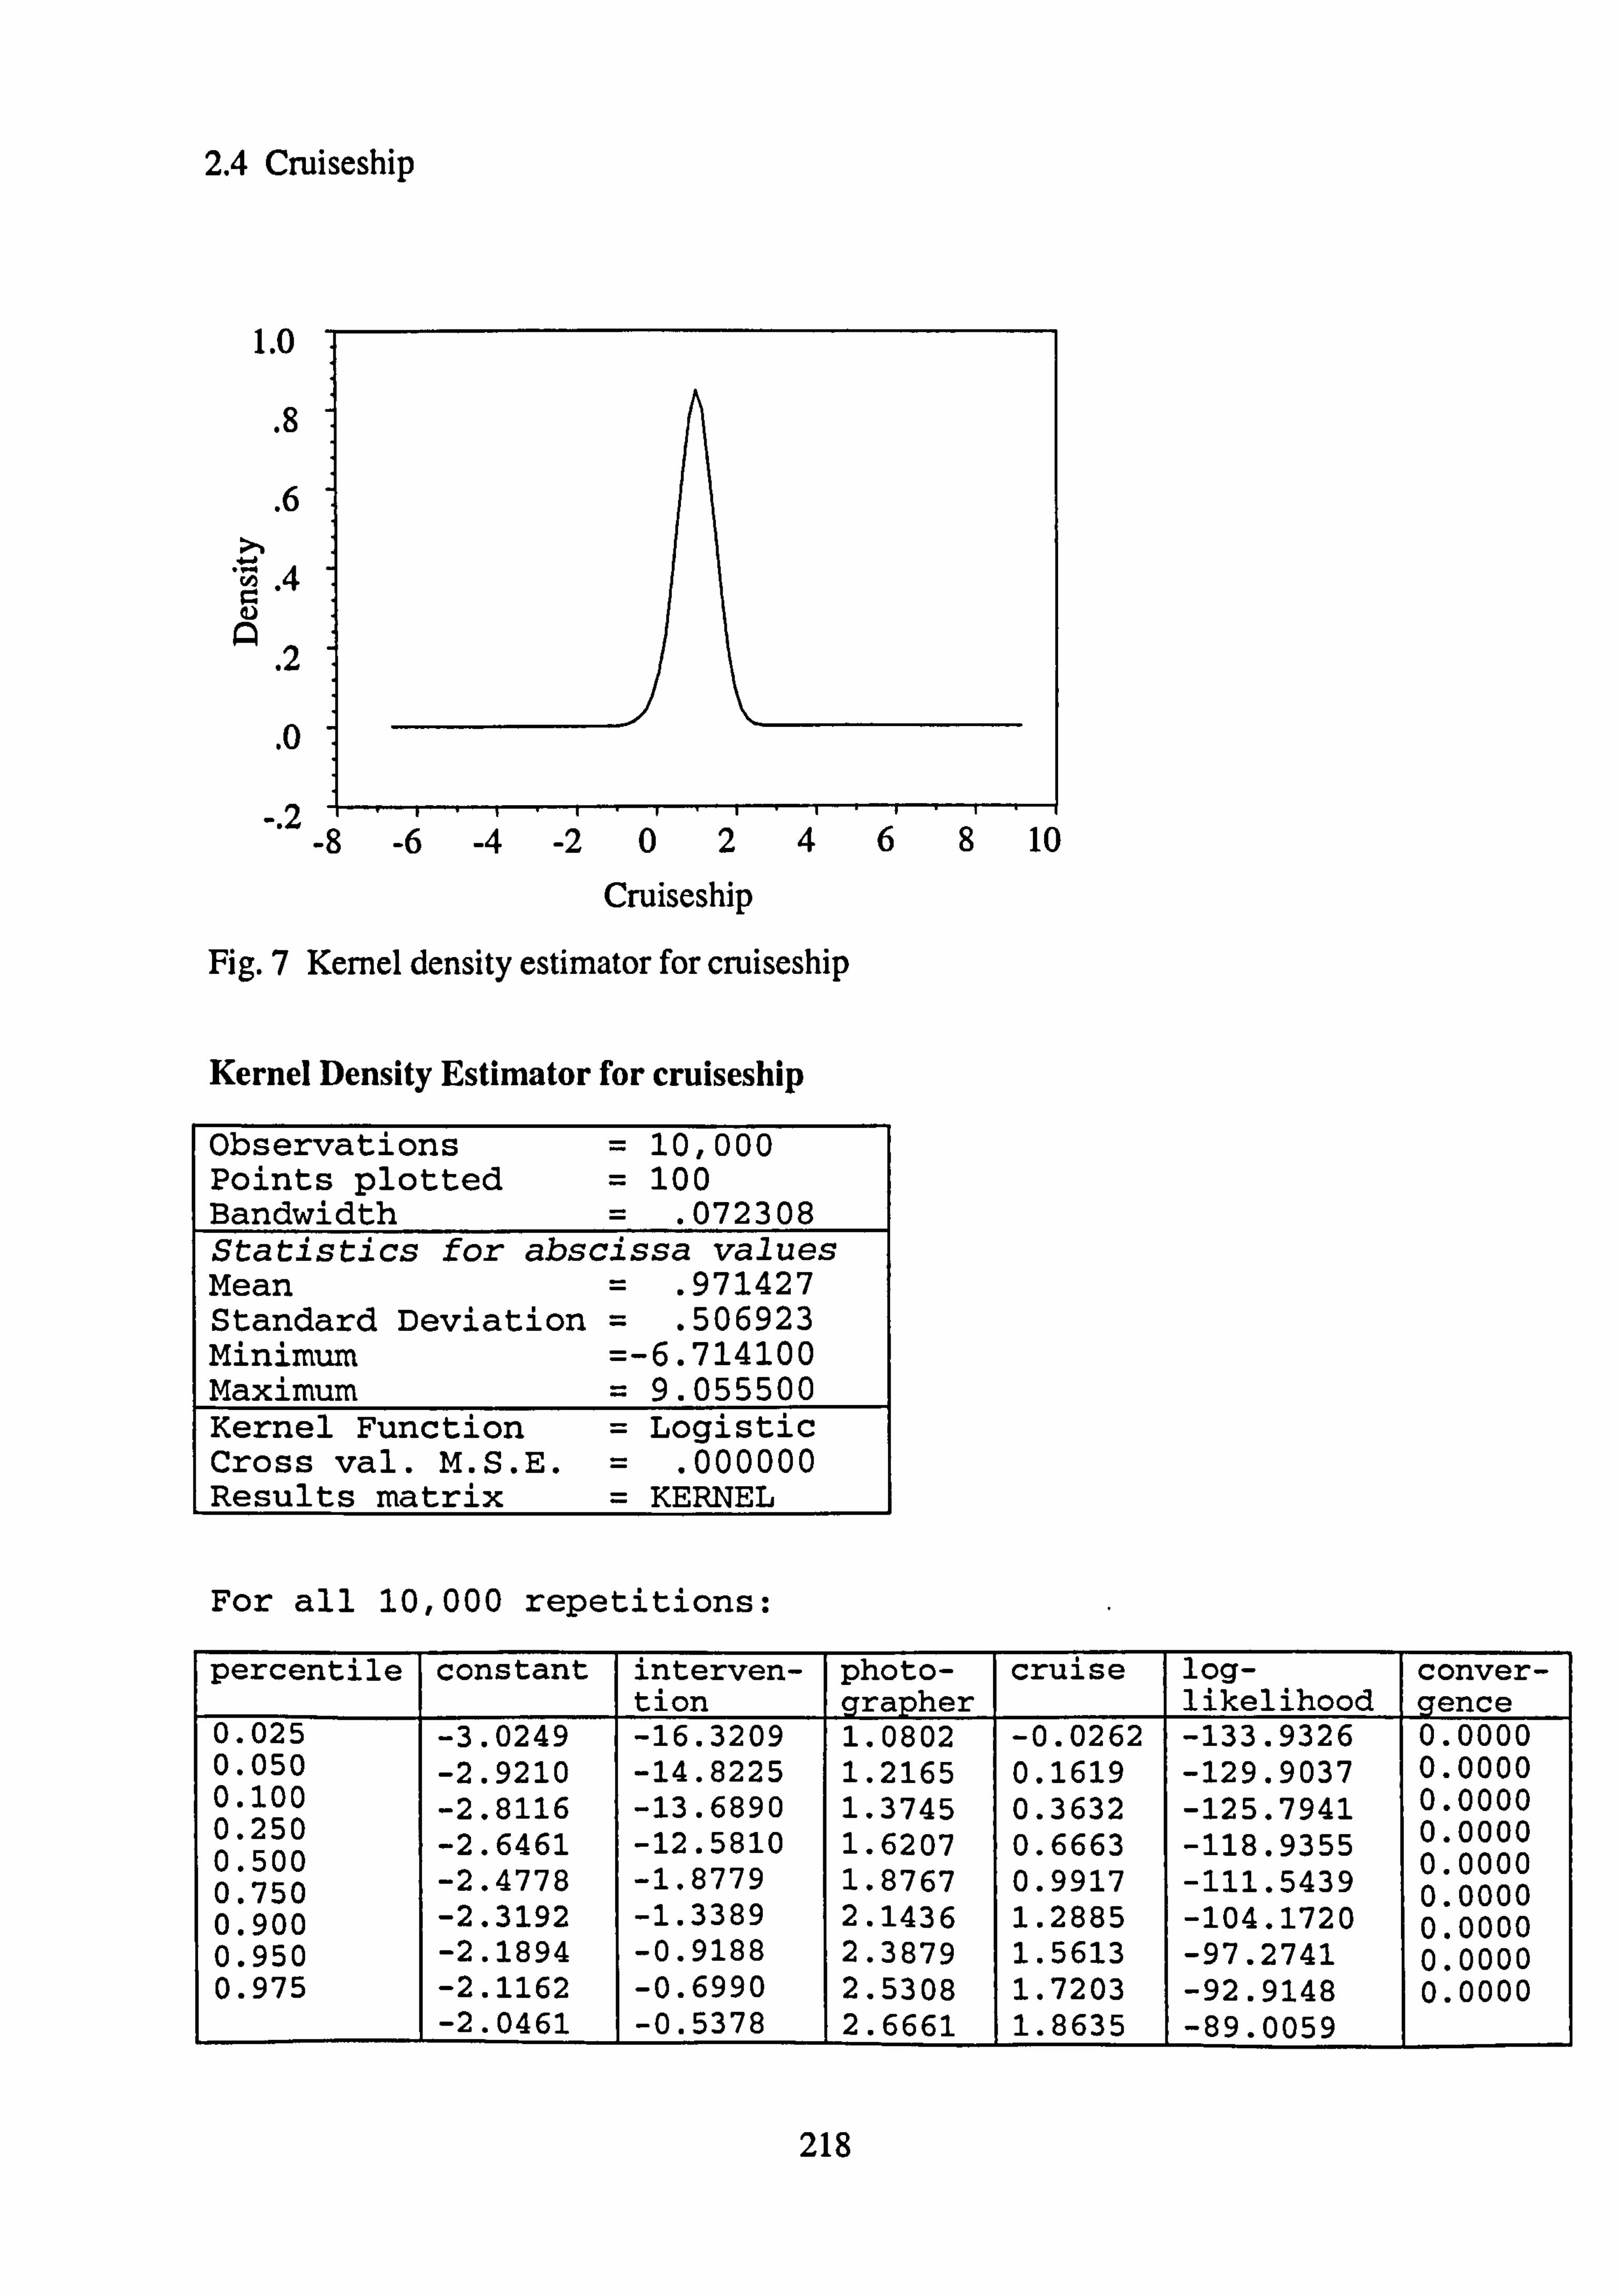
2.4 Cruiseship
1.0
.8
.6
A
2
.0
-. 2 -8 -() uZ405 lu
Cruiseship
Fig. 7 Kernel density estimator for cruiseship
Kernel Density Estimator for cruiseship
Observations Points plotted Bandwidth
= 10,000 = 100 = . 072308
Statistics for abscissa values Mean = . 971427 Standard Deviation = . 506923 Minimum =-6.714100 Maximum = 9.055500 Kernel Function = Logistic Cross val. M. S. E. = . 000000 Results matrix = KERNEL
For all 10,000 repetitions:
percentile constant interven- tion
photo- grapher
cruise log- likelihood
conver- gence
0.025 -3.0249 -
-16.3209 1.0802 -0.0262 -133.9326 0.0000 0.050
-2.9210 -14.8225 1.2165 0.1619 -129.9037 0.0000 0.100
-2.8116 -13.6890 1.3745 0.3632 -125.7941 0.0000
0.250 -2.6461 -12.5810 1.6207 0.6663 -118.9355
0.0000 0.500 0.750 -2.4778 -1.8779 1.8767 0.9917 -111.5439
0.0000 0.0000
0.900 -2.3192 -1.3389 2.1436 1.2885 -104.1720 0.0000 0.950 -2.1894 -0.9188 2.3879 1.5613 -97.2741 0.0000 0.975 -2.1162 -0.6990 2.5308 1.7203 -92.9148 0.0000
-2.0461 -0.5378 2.6661 1.8635 -89.0059
218
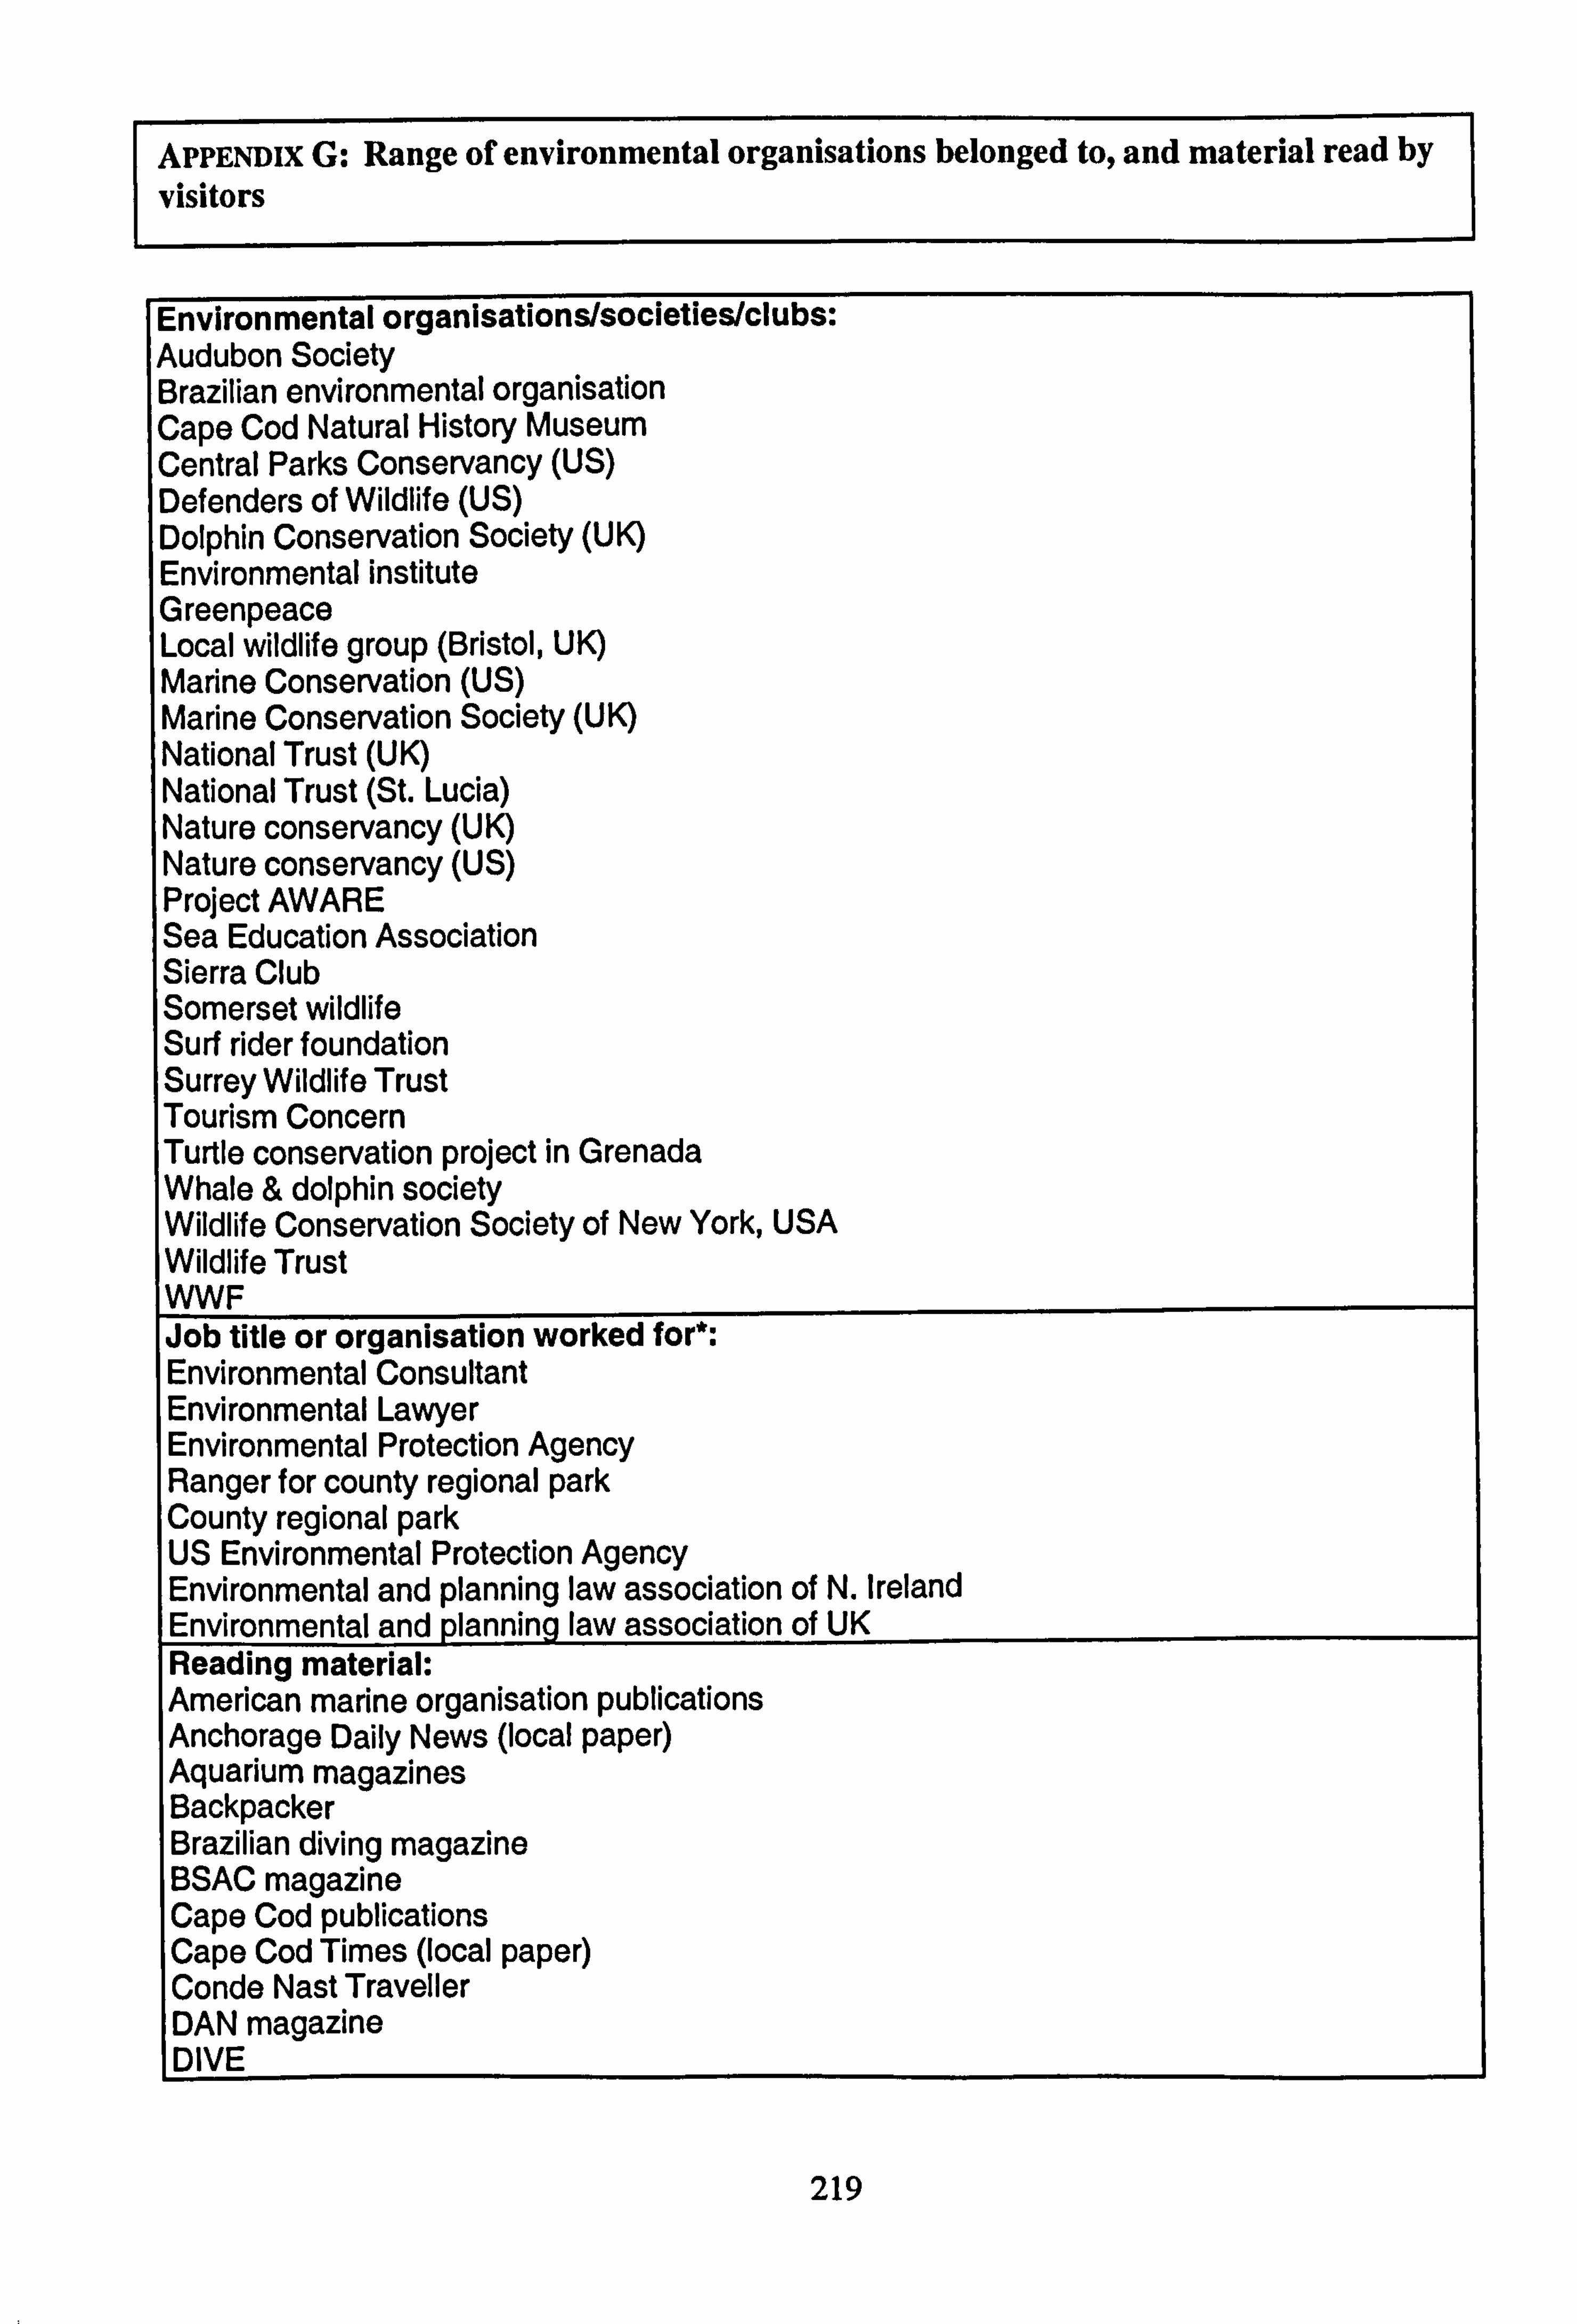
APPENDix G: Range of environmental organisations belonged to, and material read by
visitors
Environmental organisationstsocietiestclubs: Audubon Society Brazilian environmental organisation Cape Cod Natural History Museum Central Parks Conservancy (US) Defenders of Wildlife (US) Dolphin Conservation Society (UK) Environmental institute Greenpeace Local wildlife group (Bristol, UK) Marine Conservation (US) Marine Conservation Society (UK) National Trust (UK) National Trust (St. Lucia) Nature conservancy (UK) Nature conservancy (US) Project AWARE Sea Education Association Sierra Club Somerset wildlife Surf rider foundation Surrey Wildlife Trust Tourism Concern Turtle conservation project in Grenada Whale & dolphin society Wildlife Conservation Society of New York, USA Wildlife Trust WWF Job title or organisation worked for*: Environmental Consultant Environmental Lawyer Environmental Protection Agency Ranger for county regional park County regional park US Environmental Protection Agency Environmental and planning law association of N. Ireland Environmental and planning law association of UK Reading material: American marine organisation publications Anchorage Daily News (local paper) Aquarium magazines Backpacker Brazilian diving magazine BSAC magazine Cape Cod publications Cape Cod Times (local paper) Conde Nast Traveller DAN magazine DIVE
219
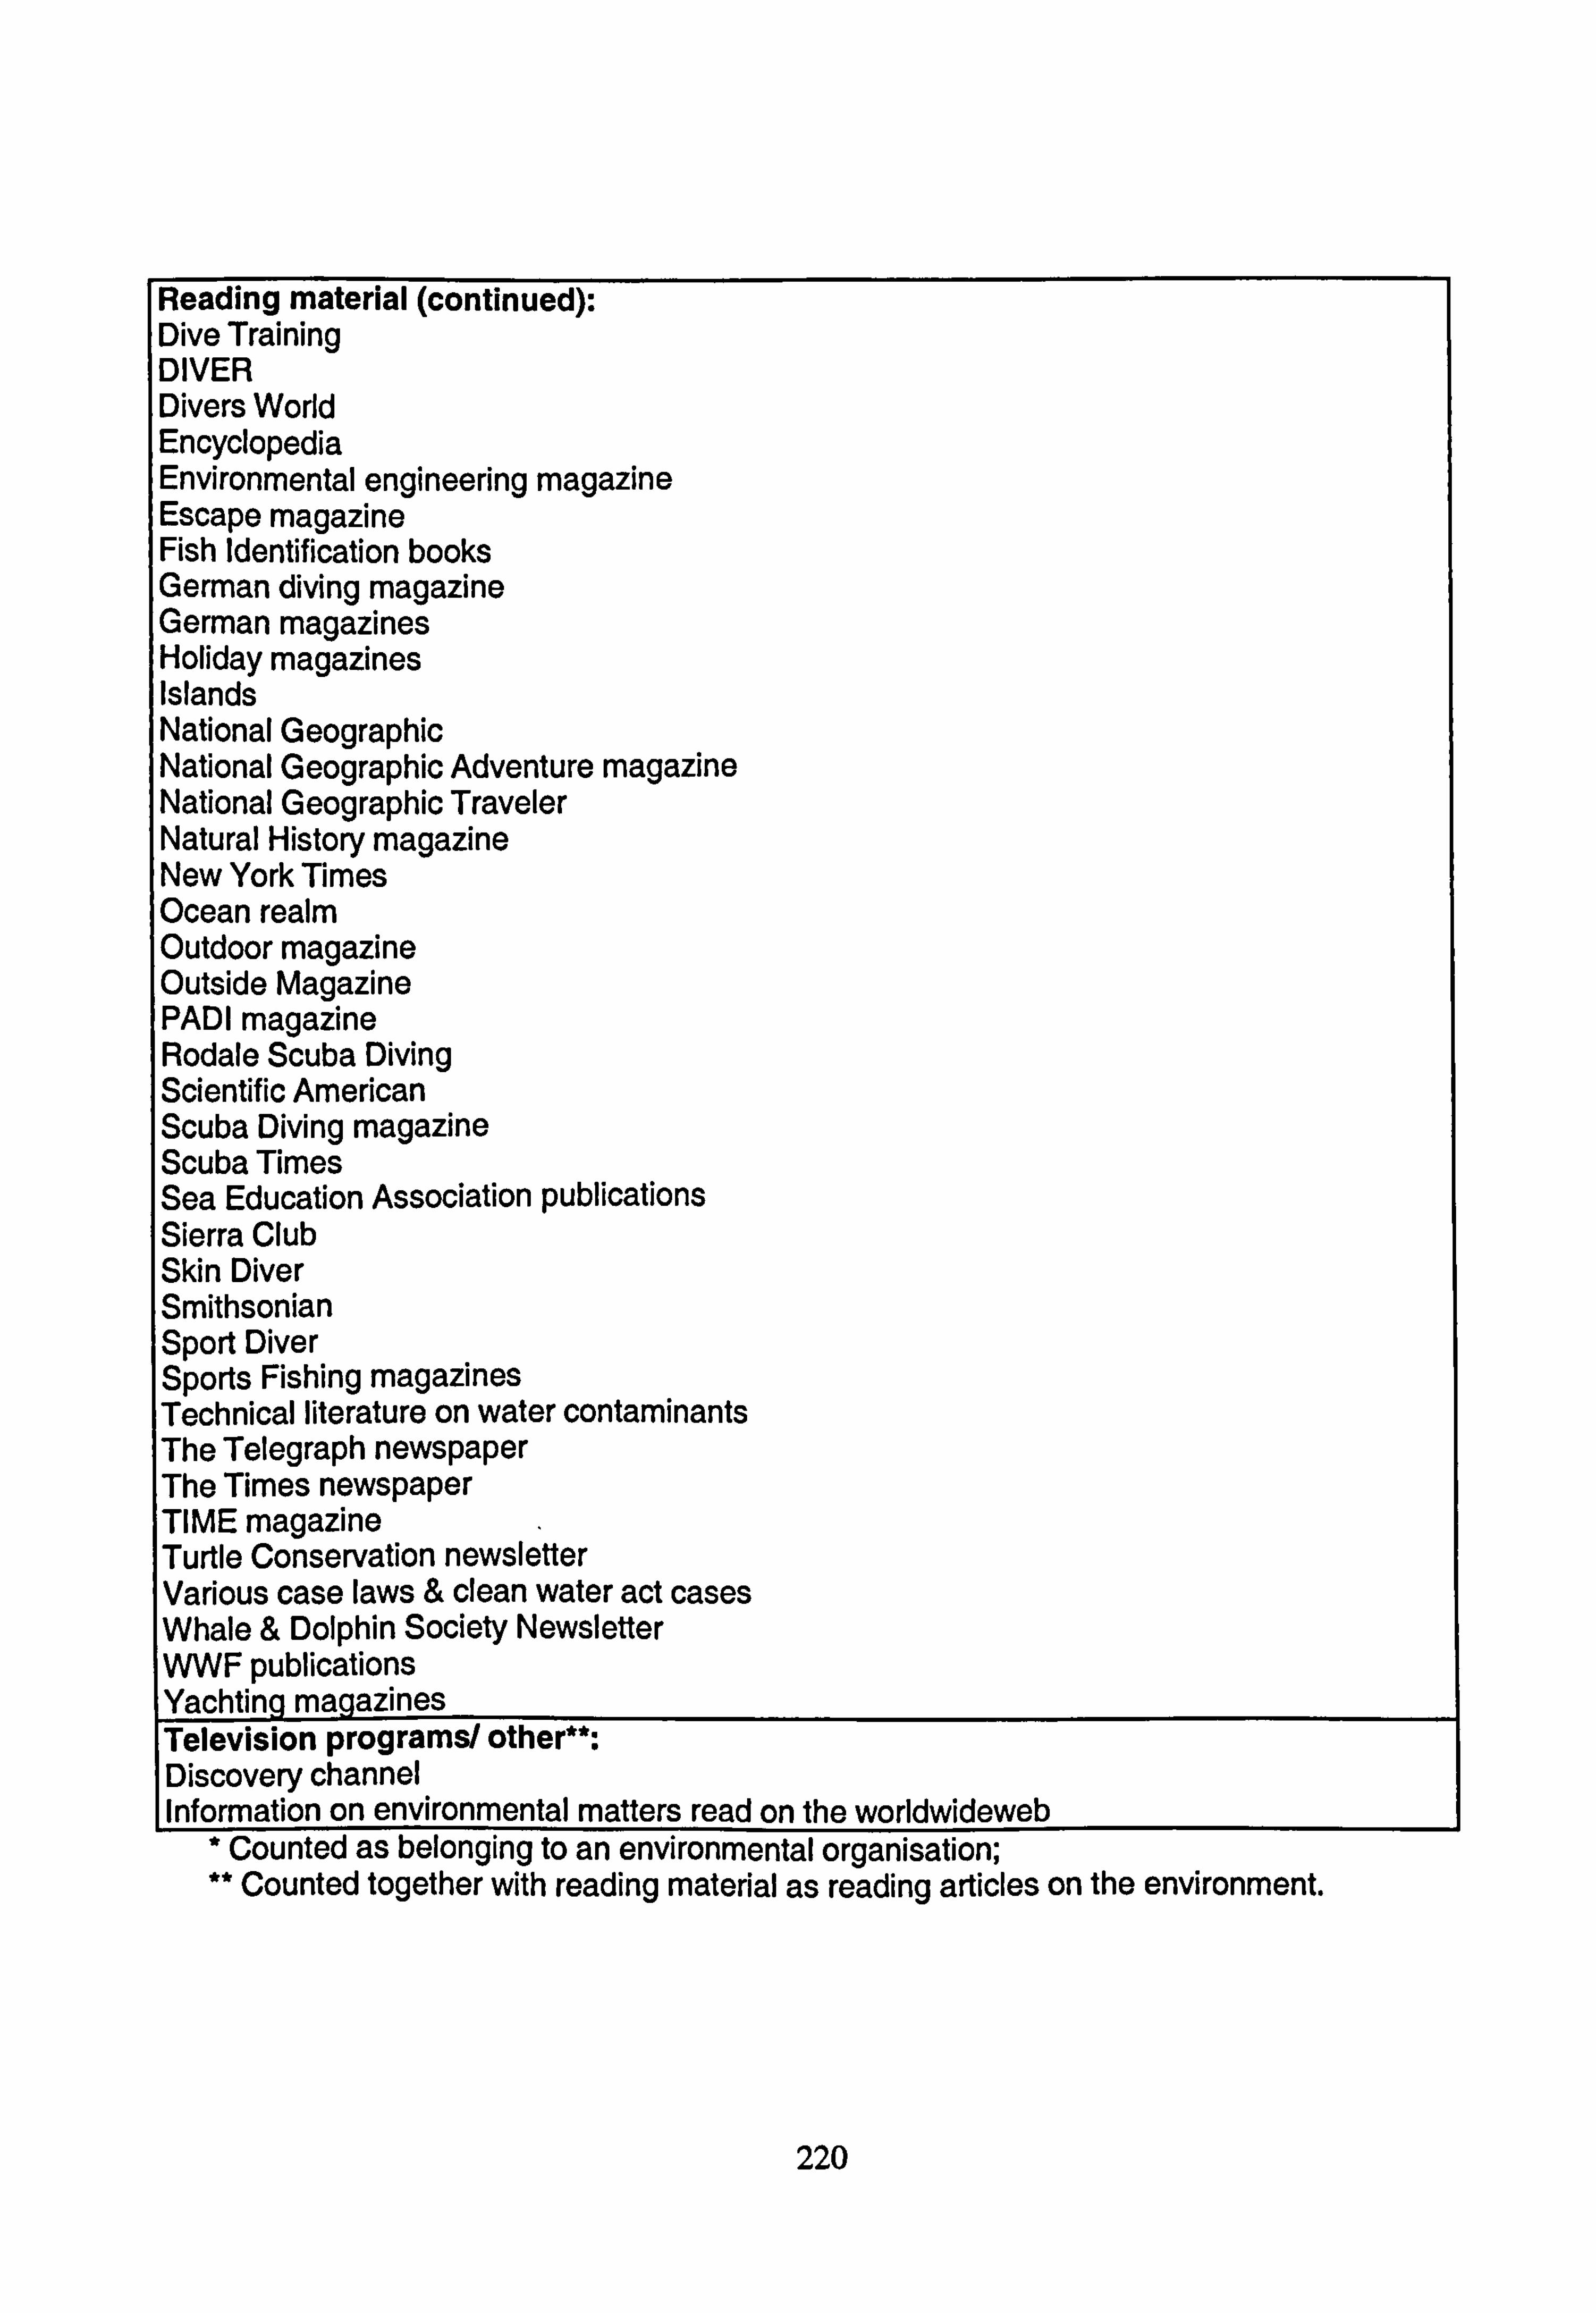
Reading material (continued): Dive Training DIVER Divers World Encyclopedia Environmental engineering magazine Escape magazine Fish Identification books German diving magazine German magazines Holiday magazines Islands National Geographic National Geographic Adventure magazine National Geographic Traveler Natural History magazine New York Times Ocean realm Outdoor magazine Outside Magazine PADI magazine Rodale Scuba Diving Scientific American Scuba Diving magazine Scuba Times Sea Education Association publications Sierra Club Skin Diver Smithsonian Sport Diver Sports Fishing magazines Technical literature on water contaminants The Telegraph newspaper The Times newspaper TIME magazine Turtle Conservation newsletter Various case laws & clean water act cases Whale & Dolphin Society Newsletter WWF publications Yachting magazines Television programs/ other": Discovery channel Information on environmental matters read on the worldwideweb
* Counted as belonging to an environmental orqanisation; ** Counted together with reading material as reading articles on the environment.
220
Related Documents


