Ecological and life-history traits predict bee species responses to environmental disturbances Neal M. Williams a, * , Elizabeth E. Crone b , T’ai H. Roulston c , Robert L. Minckley d , Laurence Packer e , Simon G. Potts f a Department of Entomology, University of California, One Shields Ave., Davis, CA 96616, United States b Wildlife Biology Program, University of Montana, Missoula, MT 59812, United States c Department of Environmental Sciences, University of Virginia/Blandy Experimental Farm, 400 Blandy Farm Lane, Boyce, VA 22620, United States d Department of Biology, University of Rochester, Rochester, NY 14627, United States e Department of Biology, York University, 4700 Keele St., Toronto, ON, Canada M3J 1P3 f Centre for Agri-Environmental Research, School of Agriculture, Policy and Development, University of Reading, Reading, RG6 6AR, UK article info Article history: Received 11 August 2009 Received in revised form 9 March 2010 Accepted 21 March 2010 Available online 24 April 2010 Keywords: Anthropogenic disturbance Bees Functional traits Landscape change Life-history response guilds abstract The ability to predict the responses of ecological communities and individual species to human-induced environmental change remains a key issue for ecologists and conservation managers alike. Responses are often variable among species within groups making general predictions difficult. One option is to include ecological trait information that might help to disentangle patterns of response and also provide greater understanding of how particular traits link whole clades to their environment. Although this ‘‘trait-guild” approach has been used for single disturbances, the importance of particular traits on general responses to multiple disturbances has not been explored. We used a mixed model analysis of 19 data sets from throughout the world to test the effect of ecological and life-history traits on the responses of bee species to different types of anthropogenic environmental change. These changes included habitat loss, fragmen- tation, agricultural intensification, pesticides and fire. Individual traits significantly affected bee species responses to different disturbances and several traits were broadly predictive among multiple distur- bances. The location of nests – above vs. below ground – significantly affected response to habitat loss, agricultural intensification, tillage regime (within agriculture) and fire. Species that nested above ground were on average more negatively affected by isolation from natural habitat and intensive agricultural land use than were species nesting below ground. In contrast below-ground-nesting species were more negatively affected by tilling than were above-ground nesters. The response of different nesting guilds to fire depended on the time since the burn. Social bee species were more strongly affected by isolation from natural habitat and pesticides than were solitary bee species. Surprisingly, body size did not consistently affect species responses, despite its importance in determining many aspects of individuals’ interaction with their environment. Although synergistic interactions among traits remain to be explored, individual traits can be useful in predicting and understanding responses of related species to global change. Ó 2010 Elsevier Ltd. All rights reserved. 1. Introduction Ecologists and environmental scientists often need to monitor and predict how communities might respond to environmental disturbance, change over landscape gradients or vary among differ- ent habitats. However, this task is fraught with uncertainty for many reasons. For many taxa, we know little about critical popula- tion dynamic variables, physiological tolerances, ecological con- straints, or long-term and indirect effects (Davidson et al., 1984; Roemer, 2002). One useful approach toward removing uncertainty in how species respond would be to incorporate widely-available information about their biology and look for consistent responses within groups that share traits (Henle et al., 2004). Such an ap- proach would help ecologists to predict general patterns that could be applied to a range of related taxa and provide a mechanistic link between disturbances and patterns of response within communi- ties. As such, it would also be of clear conservation value when land managers and stakeholders face decisions associated with landscape or global changes and how these might impact commu- nities or particular species of conservation concern. In recent years, ecologists have identified key population, life- history and ecological attributes that influence how species re- spond to landscape changes such as habitat loss and fragmenta- tion. Population demographic variables (e.g., intrinsic growth rate, variation in population size) are expected to directly 0006-3207/$ - see front matter Ó 2010 Elsevier Ltd. All rights reserved. doi:10.1016/j.biocon.2010.03.024 * Corresponding author. Tel.: +1 530 752 9358. E-mail address: [email protected] (N.M. Williams). Biological Conservation 143 (2010) 2280–2291 Contents lists available at ScienceDirect Biological Conservation journal homepage: www.elsevier.com/locate/biocon

Welcome message from author
This document is posted to help you gain knowledge. Please leave a comment to let me know what you think about it! Share it to your friends and learn new things together.
Transcript

Biological Conservation 143 (2010) 2280–2291
Contents lists available at ScienceDirect
Biological Conservation
journal homepage: www.elsevier .com/locate /b iocon
Ecological and life-history traits predict bee species responsesto environmental disturbances
Neal M. Williams a,*, Elizabeth E. Crone b, T’ai H. Roulston c, Robert L. Minckley d, Laurence Packer e,Simon G. Potts f
a Department of Entomology, University of California, One Shields Ave., Davis, CA 96616, United Statesb Wildlife Biology Program, University of Montana, Missoula, MT 59812, United Statesc Department of Environmental Sciences, University of Virginia/Blandy Experimental Farm, 400 Blandy Farm Lane, Boyce, VA 22620, United Statesd Department of Biology, University of Rochester, Rochester, NY 14627, United Statese Department of Biology, York University, 4700 Keele St., Toronto, ON, Canada M3J 1P3f Centre for Agri-Environmental Research, School of Agriculture, Policy and Development, University of Reading, Reading, RG6 6AR, UK
a r t i c l e i n f o
Article history:Received 11 August 2009Received in revised form 9 March 2010Accepted 21 March 2010Available online 24 April 2010
Keywords:Anthropogenic disturbanceBeesFunctional traitsLandscape changeLife-history response guilds
0006-3207/$ - see front matter � 2010 Elsevier Ltd. Adoi:10.1016/j.biocon.2010.03.024
* Corresponding author. Tel.: +1 530 752 9358.E-mail address: [email protected] (N.M. W
a b s t r a c t
The ability to predict the responses of ecological communities and individual species to human-inducedenvironmental change remains a key issue for ecologists and conservation managers alike. Responses areoften variable among species within groups making general predictions difficult. One option is to includeecological trait information that might help to disentangle patterns of response and also provide greaterunderstanding of how particular traits link whole clades to their environment. Although this ‘‘trait-guild”approach has been used for single disturbances, the importance of particular traits on general responsesto multiple disturbances has not been explored. We used a mixed model analysis of 19 data sets fromthroughout the world to test the effect of ecological and life-history traits on the responses of bee speciesto different types of anthropogenic environmental change. These changes included habitat loss, fragmen-tation, agricultural intensification, pesticides and fire. Individual traits significantly affected bee speciesresponses to different disturbances and several traits were broadly predictive among multiple distur-bances. The location of nests – above vs. below ground – significantly affected response to habitat loss,agricultural intensification, tillage regime (within agriculture) and fire. Species that nested above groundwere on average more negatively affected by isolation from natural habitat and intensive agriculturalland use than were species nesting below ground. In contrast below-ground-nesting species were morenegatively affected by tilling than were above-ground nesters. The response of different nesting guilds tofire depended on the time since the burn. Social bee species were more strongly affected by isolation fromnatural habitat and pesticides than were solitary bee species. Surprisingly, body size did not consistentlyaffect species responses, despite its importance in determining many aspects of individuals’ interactionwith their environment. Although synergistic interactions among traits remain to be explored, individualtraits can be useful in predicting and understanding responses of related species to global change.
� 2010 Elsevier Ltd. All rights reserved.
1. Introduction
Ecologists and environmental scientists often need to monitorand predict how communities might respond to environmentaldisturbance, change over landscape gradients or vary among differ-ent habitats. However, this task is fraught with uncertainty formany reasons. For many taxa, we know little about critical popula-tion dynamic variables, physiological tolerances, ecological con-straints, or long-term and indirect effects (Davidson et al., 1984;Roemer, 2002). One useful approach toward removing uncertaintyin how species respond would be to incorporate widely-available
ll rights reserved.
illiams).
information about their biology and look for consistent responseswithin groups that share traits (Henle et al., 2004). Such an ap-proach would help ecologists to predict general patterns that couldbe applied to a range of related taxa and provide a mechanistic linkbetween disturbances and patterns of response within communi-ties. As such, it would also be of clear conservation value whenland managers and stakeholders face decisions associated withlandscape or global changes and how these might impact commu-nities or particular species of conservation concern.
In recent years, ecologists have identified key population, life-history and ecological attributes that influence how species re-spond to landscape changes such as habitat loss and fragmenta-tion. Population demographic variables (e.g., intrinsic growthrate, variation in population size) are expected to directly

N.M. Williams et al. / Biological Conservation 143 (2010) 2280–2291 2281
determine changes in abundance and mediate extinction risk (e.g.,Pimm et al., 1993; Settele and Poethke, 1996; Fagan et al., 1999).Although population dynamic traits provide species-level mecha-nisms for why species may decline, many such traits are difficultto measure and their relation to population decline or extinctionappears to be variable. For example, population stability and dis-persal negatively correlate with extinction risk for some speciesbut show no relation or even positive relation in others (reviewedin Henle et al. (2004)). The use of ecological variables offers a valu-able alternative to assessing demographic variables that has beenexplored mostly in the context of habitat loss and fragmentation(McKinney, 1997; Davies et al., 2000; Zayed et al., 2004; Kolband Diekmann, 2005; Cane et al., 2006; Devictor et al., 2008). Eco-logical and behavioral traits are usually consistent among popula-tions of a species, are often easier to assess than populationdemographic variables, and are associated with various environ-mental variables of interest. For example, traits, such as body size,that determine the spatial scale at which the organisms perceivetheir environment and govern access to resources of various kinds(mineral nutrients, prey items, nest sites, pollinators, e.g., Lavoreland Garnier, 2002; Stoks and McPeek, 2003; Larsen et al., 2005;Petchey and Gaston, 2006) affect species turnover among habitats,along environmental gradients or between regions (Mason et al.,2007). These same sorts of traits are likely to determine the sensi-tivity of species to anthropogenic disturbance (Lavorel and Garnier,2002; Goulson et al., 2005; Larsen et al., 2005; Rundlöf et al., 2008;Jauker et al., 2009; Moretti et al., 2009).
Identifying common life-history or ecological traits that affectthe sensitivity of species to environmental change may allow forgreater insight into community responses beyond simple changesin species richness. If such traits commonly determine species re-sponses to disturbance, then we should expect not only speciesloss following disturbance, but specific shifts in community orguild composition. Furthermore, if the traits that determine speciesresponse to environmental change or disturbance positively corre-late with those that determine functional importance, then func-tional trait composition and overall ecosystem function may alsochange dramatically (Lavorel and Garnier, 2002; Larsen et al.,2005; Petchey and Gaston, 2006).
In this paper, we examine how species in one monophyleticgroup of ecologically and economically important organisms, thebees, respond to different types of disturbance using data from19 studies worldwide. Pollinators, including bees, are a keystonegroup thought to be threatened by human disturbance (Biesmeijeret al., 2006; NRC-USA, 2007). Between 62% and 75% of floweringplants rely on animal pollinators for sexual reproduction (Burd,1994; Ashman et al., 2004), an estimated 76% of crop species usedby humans benefit in production from animal pollination, (mostlyby insects) (Klein et al., 2007), and globally pollination services areestimated to be worth €153 billion a year (Gallai et al., 2009). Weuse bees not only because of their functional importance, but alsobecause they vary in multiple ecological and life-history traits.
Like other taxa, bees’ sensitivity to environmental change,including anthropogenic disturbance, is likely to depend on traitsthat determine species mobility, access to and requirements fornesting and forage resources, or physiological tolerance. We se-lected a set of such life-history and ecological traits that are thuslikely to affect responses to habitat change and that could be as-signed reliably from the literature, or measured directly among di-verse taxa. Traits included body size, nest location, method of nestconstruction, sociality and trophic specialization. We then testedwhether these traits significantly affected the response of speciesto five common environmental disturbances. We predicted thatthe analyses including specific traits might reveal general responsepatterns that depend on life-history or ecological characteristics ofbee species. Such patterns would not always be visible when the
entire bee community was compared before and after thedisturbance.
We selected disturbances recognized as among those stronglyaffecting animal populations and biodiversity globally includinghabitat loss, agricultural intensification (Green et al., 2005; Fischerand Lindenmayer, 2007; Kleijn et al., 2009) and grazing. We alsochose several disturbances likely to affect bees because of theirecology and association with flowers and cultivated plant popula-tions. These included fire, tilling and pesticide use (Gels et al.,2002; Shuler et al., 2005).
Our analysis differs importantly from some recent studies thathave explored the role of functional traits in how species respondto disturbance in that we use individual species as replicates inmixed model analyses. Past studies have either pooled abundanceacross multiple species that share a common trait, or examinedchanges in species richness for groups with a specified trait (Mor-etti et al., 2009; Winfree et al., 2009; Williams unpublished). How-ever, pooling species with the same life-history traits might maskgeneral responses. For example, if most trophic specialists de-creased in response to fire but one abundant species increased,numbers of the abundant species could obscure declines of theothers. In contrast, our approach enables us to address how, onaverage, species with specific traits respond to disturbance of var-ious types.
2. Methods
2.1. Choice of studies
Our analysis included 19 studies from throughout the world(Fig. 1, Appendix A). In all cases, the disturbance studied was asso-ciated with humans and the response was of populations and com-munities of bees. Data sets were obtained based on a search ofpublished studies and also from individuals willing to share data,over 90% of it from published work. Our analysis required spe-cies-level abundance data associated with discrete disturbancetypes. Some studies estimated abundance from sampled speci-mens, others recorded visitation rates to flowers. Because methodswere consistent among all sites within a study each metric pro-vides an unbiased assessment of disturbance effect. We refer toabundance throughout the paper. Taxonomic identities of all beespecies were required so that we could associate specific life-his-tory data to disturbance type. We included only data sets for whichsampling method and effort was standardized and consistentamong all levels of disturbance.
2.2. Disturbance classification
Five types of non-exclusive disturbance were evaluated, habitatfragmentation/loss, agricultural intensification, pesticide use, till-age, and fire. For most studies we used the categories identifiedby the original authors. For some studies, the disturbance catego-ries of the original authors were simplified so that they could be in-cluded with others in our comparisons. In all cases thesedesignations were made a priori and by individuals who did notcarry out the analysis. For example, six agro-forestry categoriesidentified by Klein et al. (2002) were re-categorized to high, med-ium, and low based on discussion with the lead author. Habitatloss/fragmentation was coded in two ways, depending on the met-rics presented by the original authors: (1) as isolation which wasmeasured as the distance to the nearest patch of natural or semi-natural habitat as defined in the original studies, or (2) the propor-tion of natural or semi-natural habitat surrounding the study sitesbased on the radius used in the original study. Thus the spatialscale at which fragmentation was assessed varied among studies.

Fig. 1. Map of studies included in our analysis. Numbers correspond to those in Appendix A, which contains study details.
Table 1Traits and character states used in analyses.
Trait States Definition
Body size Continuous Measured as inter-tegular-distance (ITD) the distancebetween the nearest edges of thetegulae (plates covering the wingbases). Only data for femaleswere used in final analysis.a
Nest location Above ground Above ground species includedall nest types, from cavity nestslike those of the honey bee totunnels burrowed into wood.
Below ground
Nestconstruction
Rent Renters construct nests withinexisting tunnels or other cavitiesregardless of nest location.Excavators dig or bore thechamber/tunnel within existingsubstrate.
Excavate
Lecty Specialists = oligoleges Trophic specialization defined bythe range of pollen speciescollected by females andconsumed by offspring. SeeAppend B for completedescription.
Generalists = polyleges
Sociality Solitary Social species included eusocialas well as semi-social species.Social
2282 N.M. Williams et al. / Biological Conservation 143 (2010) 2280–2291
We analyzed the effects of agricultural intensification, first, by cod-ing intensification for the most and least disturbed level withineach study, and second, by comparing effects of tilling and spray-ing explicitly. We coded tillage as tilled vs. no-till farming (e.g.,Shuler et al., 2005) and pesticide use as farms that used only inor-ganic pesticides (high) vs. farms that either used organic or no pes-ticides (low). We used two separate comparisons for analyzing fireimpacts based on the time since the burn event: unburned vs. re-cent (<5 years old) and old (>20 years) burns. Vegetation succes-sion and other factors are likely to make recent vs. older burnedsites very different habitats for pollinators (Moretti et al., 2009).
To test bee response generally to disturbance of all types, wefirst categorized each site in each study as relatively disturbed orundisturbed, and compared how each ecological and life-historytrait affected the response of bee species to disturbance. In eachdisturbance category, the ‘‘disturbed” vs. ‘‘un-disturbed” sites wereas follows: most isolated vs. closest to natural habitat, relativelyintensive vs. organic or less-intensive agricultural management,high pesticide inputs vs. organic or no-spray, tilled vs. no-till,burned vs. unburned, suburban vs. rural (Zanette et al., 2005; Win-free et al., 2007), landfill or garbage dump vs. native vegetation(Rust et al., 2003; Kelly et al. unpublished) and grazed vs. ungrazedtemperate forest (Vazquez and Simberloff, 2002, 2003).
Others were considered solitary.
a Inter-tegular measurements for bumble bees were based on samples ofworkers.
2.3. TraitsTo explore the effect of life-history and ecological traits (hereaf-ter referred to as traits) on bee responses to different types of dis-turbance, we compiled life-history and ecological data for allspecies reported in each study. Among all studies, this effort in-cluded 613 bee taxa excluding cleptoparasites. Cleptoparasiteswere excluded because major traits such as nest location, nest con-struction and trophic specialization are dictated by their hosts.Cleptoparasite responses are thus not independent of those of theirhosts. From these data we considered five traits that varied amongbees, that might result in differential responses to any of our dis-turbance variables, and that were assignable to all or most beesin the various datasets. Prior to analysis we reduced the numberof character states for each trait to allow more species and studiesto be included in the analysis (Table 1, Appendix B).
We estimated body size by measuring inter-tegular distance(ITD) from pinned specimens (Cane, 1987) and used this metricin analysis. Information on other traits was compiled from the pri-mary literature, from the Catalogue of Hymenoptera (Krombeinet al., 1979) or from Bees of the World (Michener, 2000). If pub-lished data were unavailable, we relied on a consensus of expertopinion or inferred trait data based on phylogeny (e.g., all speciesof Lasioglossum (Evylaeus) nest below ground). Species weredropped from the analysis where traits could not be assignedunambiguously (Table 3 provides final sample sizes for individualanalyses). All traits were assigned based on data independent ofthe studies included in our analysis.

Table 2Correlations between life-history traits across taxa, with bootstrapped P-values, andN = number of pair-wise complete observations for each test.
Traits Correlation P-value N
Female ITD Above 0.128 0.039 271Female ITD Rent 0.101 0.112 270Female ITD Social 0.008 0.900 285Female ITD Oligolectic �0.053 0.440 245Above Rent 0.731 <0.001 429Above Social 0.001 0.987 428Above Oligolectic �0.143 0.013 303Rent Social 0.301 <0.001 416Rent Oligolectic �0.094 0.105 295Social Oligolectic �0.245 <0.001 296
Female ITD = body size, Above = nests made above ground, Rent = nests occupyexisting cavities or holes.
N.M. Williams et al. / Biological Conservation 143 (2010) 2280–2291 2283
2.4. Analyses
We analyzed relationships between bee traits, disturbance andbee abundance using generalized linear mixed-effects models. Fol-lowing Ricketts et al. (2008), models were of the general formE(A) = eb0ebX ? ln[E(A)] = b0 + bX, where E(A) refers to the expectedabundance of each species in each treatment, b are the regressioncoefficients, and X the predictor variables. In general, the exponen-tial relationship means coefficients refer to proportional changes inabundance, which allowed us to account for differences in unitsamong the studies (see Ricketts et al., 2008). Because abundancewas 0 for some species in either the disturbed or undisturbed state,we ln[A + 0.5] transformed abundance variables, so the exponen-tial relationship is approximate. Residuals of fitted models werevisually inspected, and all were approximately normal, i.e., uni-modal and symmetric. All analyses were performed in R v.2.7.0software (R Development Core Team, R: A Language and Environ-ment for Statistical Computing, R Foundation for Statistical Com-puting, Vienna (2004).R Development Core Team, 2004).
We first fit models without bee traits to estimate the overall ef-fects of each disturbance type on bee abundance for all disturbancetypes that were represented in at least three studies. Isolation wascoded as distance from natural/semi-natural habitat, loss of semi/natural habitat was examined as the proportion non-natural(0 = 100% natural, 1 = 0% natural) surrounding the study site, andcategorical disturbance variables were coded 0 for the less dis-turbed category (e.g., less intensive farming, unburned, untilled,low-pesticide), and 1 for the more disturbed category. In additionto disturbance (a fixed effect), these models included study as afixed effect (to account for different sampling units across studies;Ricketts et al., 2008), and the disturbance x study interaction, sitenested within study, and bee species as random effects. The distur-bance x study term accounted for the expected random variation inthe effect of disturbances among studies. The site-within-studyrandom effect accounted for expected differences in abundanceof species at different sampling locations. The species effect was in-cluded to account for species-associated variation that might havemasked interpretation of the traits of interest. By using a randomeffect we acknowledge that species responses to disturbance willvary in some unknown way rather than focusing on mean effectsof a species for each study, which is not the goal of our paper. In57 of 613 taxa were reported to morpho-species rather than to spe-cies; we refer to these as species throughout. Morpho-species wereonly included if traits could be assigned unambiguously. Individualrecords in the analysis were abundances of each bee species, so thecoefficients describing effects of disturbance are interpreted as theaverage proportional change in abundance among species. Thus,we weighted rare and common species equally because we wereinterested in estimating the influence of particular traits on spe-cies’ responses.
We tested whether life-history and ecological traits mediatedbee responses to each disturbance type by modifying the abovemodels to include trait as a new predictor variable and the interac-tions between traits and disturbance. A significant effect of life-his-tory or ecological trait on bee responses to a particular disturbanceis indicated by a significant interaction coefficient in the model.We were not able to obtain data on every trait for each species,so we could not look at traits simultaneously in multiple regressionor other multivariate analyses. Therefore, we analyzed effects ofeach trait, in turn, in separate models including all species forwhich we had data for the trait of interest. We calculated the cor-relation between pairs of traits across species and all studies as arough measure of the extent to which these traits can be evaluatedindependently in our data base (Table 2). For example, perfect cor-relation between above-ground nesting and sociality would indi-cate that all species that nested above ground were also social. In
our data set, renting significantly correlated with nesting aboveground, and with sociality; therefore, interpretation of renting inour final analysis should be interpreted in parallel with nest loca-tion. Similarly, there was a strong tendency for specialist species tobe solitary, so we cannot unambiguously separate these traiteffects.
In agricultural landscapes worldwide, honey bees (Apis melli-fera) are often managed for crop pollination. More colonies areused in areas with more intensive agriculture; thus, the presenceof honey bees might diminish our ability to detect the role of traitsheld by honey bees on the general response of all bees to distur-bance. For example social species other than honey bees might re-spond negatively to more intensive agriculture, but with honeybees included in the analysis the effect of sociality on responsemight be nullified. To test whether the observed responses of beesin agricultural landscapes could be due to managed honey bees, were-ran tests of isolation, agricultural intensity, tilling and pesticideuse excluding A. mellifera. The effect of removal on the outcome ofanalysis might also depend on dominance of honey bee records inthe analysis. For example, if honey bees composed 50% of the re-cords for above-ground nesting species in an analysis, removingthem would likely produce a greater change in outcome than ifthey represented only 2% of such records. We therefore also lookedfor a relation between proportion of records that were honey beesand the magnitude of change in the coefficient. We did not findsuch an effect consistently in the data set.
3. Results
From all studies we included 613 total bee species, 159 nestedabove ground and 307 below ground, 125 were renters and 329excavators, 362 were generalists and 37 specialists, and 90 weresocial and 414 solitary.
Among all species and all disturbances, bees tended to be lessabundant in disturbed areas (Table 3, All disturbances). The spe-cific disturbance types we examined all tended to decrease theabundance of bees (Table 3, Main effects column), although whenall species were analyzed together only the effect of isolation onabundance was marginally statistically significant (P < 0.10). Beeabundance tended to decline noticeably but non-significantly inareas with higher-intensity agriculture (Table 3, agriculture inten-sity, pesticide use). However, responses to proportion natural hab-itat in the landscape and to tilling were variable among beespecies.
As expected, this substantial variation in response to distur-bance among species partly reflects significant differences in re-sponse among species with different life-history or ecologicaltraits. Across all disturbances, abundances of above-ground-nest-ing species were, on average, six times more reduced by

Table 3Effects of different disturbances on bee abundance (main effect) and effect of life-history traits on bee responses to these disturbances.
Disturbance Life-history traits
Main effects Body size (mm)
nS Coef.a SE v2 P nT Coef. SE v2 P nT
All disturbances 19 �0.19 0.11 3.3 0.068 613 0.04 0.05 0.9 0.352 333Isolation (km) 6 �0.41 0.21 3.3 0.068 79 0.26 0.15 2.9 0.087 40Proportion natural habitat 3 �0.33 0.87 0.0 >0.999 183 �0.07 0.10 0.6 0.441 133Agricultural intensity 8 �0.19 0.16 1.2 0.264 314 �0.03 0.10 0.1 0.758 191Pesticide use 6 �0.22 0.17 1.7 0.196 155 0.66 1.08 0.0 >0.999 79Tilled fields 7 �0.12 0.36 0.0 >0.999 161 �0.22 0.51 0.2 0.672 83Fire-old 3 �0.06 0.13 1.5 0.223 138 0.15 0.12 1.7 0.198 66Fire-recent 3 �0.07 0.34 0.1 0.771 138 �0.09 0.12 0.6 0.447 66
Disturbance Nesting location (1 = above ground, 0 = below) Nest construction (1 = rent, 0 = construct)
Coef. SE v2 P nT Coef. SE v2 P nT
All disturbances �0.16 0.04 16.6 <0.001 468 �0.18 0.04 20.1 <0.001 455Isolation (km) 0.02 0.09 0.1 0.780 61 �0.02 0.06 0.1 0.802 58Proportion natural habitat 0.06 0.10 0.4 0.511 137 �0.11 0.10 1.1 0.288 138Agricultural intensity �0.11 0.08 1.9 0.169 234 �0.04 0.09 0.2 0.629 234Pesticide use �0.03 0.22 0.0 >0.999 118 0.09 0.23 0.0 0.879 120Tilled fields 0.66 0.31 4.2 0.041 124 0.56 0.34 2.5 0.116 126Fire-old 0.12 0.06 3.7 0.053 105 0.01 0.07 0.0 0.884 101Fire-recent �0.06 0.06 1.0 0.306 105 �0.03 0.07 0.1 0.721 101
Disturbance Sociality (1 = social, 0 = solitary) Trophic specialization/lecty (1 = oligo, 0 = poly)
Coef. SE v2 P nT Coef SE v2 P nT
All disturbances �0.09 0.05 4.0 0.047 507 �0.05 0.07 0.6 0.457 400Isolation (km) �0.17 0.08 4.8 0.029 66 �0.01 0.13 0.0 0.911 60Proportion natural habitat 0.39 0.10 13.9 <0.001 133 �0.26 0.11 5.3 0.022 153Agricultural intensity 0.20 0.10 3.6 0.056 245 �0.24 0.13 3.6 0.058 211Pesticide use �0.81 0.20 15.2 <0.001 133 0.17 0.37 0.6 0.422 82Tilled fields 0.82 0.31 6.7 0.010 139 �1.81 0.60 9.0 0.003 85Fire-old �0.10 0.12 0.8 0.382 119 0.10 0.11 0.8 0.361 44Fire-recent 0.18 0.11 2.7 0.099 119 �0.19 0.11 1.0 0.308 44
a Coefficients for main effect of each disturbance and for interactions between disturbance type (rows) and life-history traits (columns). Significant coefficients forinteractions (in bold) indicate that this trait affected bees response to the specific type of disturbance. Positive coefficient values indicate bee species with the trait coded as 1are more abundant in disturbed areas. Oligo = oligolectic. nS = # studies, nT = # species (taxa).
2284 N.M. Williams et al. / Biological Conservation 143 (2010) 2280–2291
disturbance than those of bees nesting below ground (Table 3,Fig. 2A). Likewise renters responded 4.5 times more strongly to dis-turbance than did excavators (Fig. 2B) and social species 17% morestrongly than solitary species (Fig. 2C). In contrast, small-bodiedspecies compared to large-bodied species and specialists comparedto generalists did not differ significantly in their overall response todisturbance (Table 3, Fig. 2D and E).
Two traits, nest location and sociality, affected species’ re-sponses across multiple disturbance types. Above-ground-nestingspecies were nine times more strongly affected than below-ground-nesting species by overall agricultural intensification(Fig. 3A). This effect became stronger and significant when honeybees were removed from the analysis (Table 4). If honey bees wereremoved from the analysis, above-ground nesters also respondedmore negatively than did below-ground nesters to isolation fromsemi-natural habitats (Table 4). The abundance of above-groundnesters decreased on average 47% as isolation increased from 0to 1 km. Below-ground nesters decreased in abundance by 25%over the same distance. Only below-ground nesting bees werestrongly affected by tilling (Fig. 3B). Below-ground nesting beeswere not significantly affected by fire, whereas above-ground nest-ers were 15% less abundant after recent burns, and 8% more abun-dant in sites with older burns, relative to unburned sites (Fig. 3C).Social bee species were more strongly affected than solitary spe-cies by isolation and pesticide use (Fig. 4a and b). In response topesticides, social species showed a 70% reduction in abundanceon average compared to a 29% increase by solitary species. In con-trast, social species were 3.6 times less affected by overall agricul-tural intensification and almost 5 times less affected by tilling(Fig. 4). When honey bees were removed from the analysis, the
magnitude of the difference in response to agricultural intensityremained (social species were about 5 times less affected), butthe difference was no longer significant probably due in part to re-duced power of the analysis (Table 4).
Other traits had a less consistent effect on species responsesacross disturbance types, but some effects were striking and sug-gest an underlying mechanism for how the disturbance affects spe-cies with particular traits. Small-bodied bee species were affectedmore strongly than large-bodied bee species to isolation, indicatinga role for dispersal capability (Table 3). This effect disappeared ifhoney bees were removed from the analysis (Table 4). Specialiststended to be more strongly affected than generalists by overallagricultural intensification and tilling, suggesting that suitable flo-ral resources needed by specialists may have been absent or scarcein such conditions (Fig. 5). The effect of tilling was not significantafter honey bees were removed from the analysis (Table 4). Renterswere more negatively affected than excavators by isolation.
4. Discussion
Across multiple disturbances and taxa, bees generally were lessabundant in response to anthropogenic disturbance. This result isconsistent with that of a recent meta-analysis of bee response tomultiple disturbance types (Winfree et al., 2009), including habitatloss, agricultural intensification, logging, grazing, fire pesticide useand tillage. Like in that study, however, responses to individual dis-turbance types were modest and showed great variation whenpooled among all bee species independent of ecological or life-his-tory traits. Among the diverse study systems and taxa we included

Fig. 2. Mean ± se relative abundances of species with different ecological and life-history traits in undisturbed and disturbed sites. Means were calculated among alldisturbance types. The value for the undisturbed condition is scaled to a mean of one so that disturbed values change relative to this value. Body size response was calculatedfor inter-tegular spans in the smallest middle and largest third of species.
N.M. Williams et al. / Biological Conservation 143 (2010) 2280–2291 2285
in this study, some traits consistently predicted how bees re-sponded to specific disturbances. These results underscore the pre-dictive power of life-history traits in environmental assessments.The results also allowed us to identify those traits that were rela-tively uninformative for predicting response to single disturbancesand to disturbance in general. This information helps to guide morecareful investigation of the links between informative life-historytraits, population dynamic variables and the mechanisms by whichspecies interact with their environment.
4.1. Trait-specific effects
Nesting location and sociality were especially predictive, and theassociated responses confirmed biologically reasonable expecta-
tions. For example, above-ground nesters were more strongly af-fected than below-ground nesters by agricultural intensificationexcluding tillage. Most species that build nests above-ground con-struct them in perennial grass, forb or shrub stems, or in dead woodthat would tend to be removed by more intensive agricultural prac-tices. As a result, nesting substrates for these species are limitedthrough intensification whereas suitable substrate for ground-nest-ing species, such as in soil at field margins and in fields themselves(Mathewson, 1968; Kim et al., 2006), is available throughout agri-culturally dominated landscapes. The parallel result for isolationfrom natural or semi-natural habitat is likely driven by the samemechanisms and makes sense given that all studies of isolation thatwe included were carried out in agricultural landscapes. Thecontrasting response by above-ground-nesting species to tillage
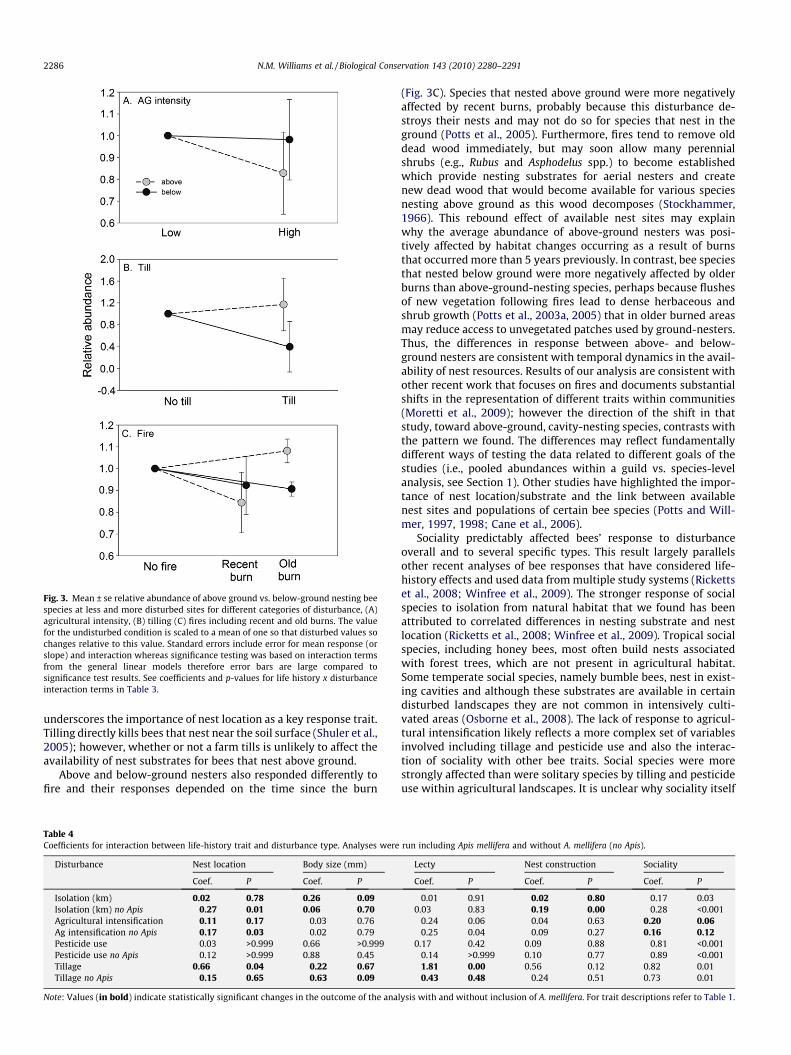
Fig. 3. Mean ± se relative abundance of above ground vs. below-ground nesting beespecies at less and more disturbed sites for different categories of disturbance, (A)agricultural intensity, (B) tilling (C) fires including recent and old burns. The valuefor the undisturbed condition is scaled to a mean of one so that disturbed values sochanges relative to this value. Standard errors include error for mean response (orslope) and interaction whereas significance testing was based on interaction termsfrom the general linear models therefore error bars are large compared tosignificance test results. See coefficients and p-values for life history x disturbanceinteraction terms in Table 3.
2286 N.M. Williams et al. / Biological Conservation 143 (2010) 2280–2291
underscores the importance of nest location as a key response trait.Tilling directly kills bees that nest near the soil surface (Shuler et al.,2005); however, whether or not a farm tills is unlikely to affect theavailability of nest substrates for bees that nest above ground.
Above and below-ground nesters also responded differently tofire and their responses depended on the time since the burn
Table 4Coefficients for interaction between life-history trait and disturbance type. Analyses were
Disturbance Nest location Body size (mm)
Coef. P Coef. P
Isolation (km) 0.02 0.78 0.26 0.09Isolation (km) no Apis �0.27 0.01 0.06 0.70Agricultural intensification �0.11 0.17 �0.03 0.76Ag intensification no Apis �0.17 0.03 �0.02 0.79Pesticide use �0.03 >0.999 0.66 >0.999Pesticide use no Apis �0.12 >0.999 0.88 0.45Tillage 0.66 0.04 �0.22 0.67Tillage no Apis �0.15 0.65 �0.63 0.09
Note: Values (in bold) indicate statistically significant changes in the outcome of the ana
(Fig. 3C). Species that nested above ground were more negativelyaffected by recent burns, probably because this disturbance de-stroys their nests and may not do so for species that nest in theground (Potts et al., 2005). Furthermore, fires tend to remove olddead wood immediately, but may soon allow many perennialshrubs (e.g., Rubus and Asphodelus spp.) to become establishedwhich provide nesting substrates for aerial nesters and createnew dead wood that would become available for various speciesnesting above ground as this wood decomposes (Stockhammer,1966). This rebound effect of available nest sites may explainwhy the average abundance of above-ground nesters was posi-tively affected by habitat changes occurring as a result of burnsthat occurred more than 5 years previously. In contrast, bee speciesthat nested below ground were more negatively affected by olderburns than above-ground-nesting species, perhaps because flushesof new vegetation following fires lead to dense herbaceous andshrub growth (Potts et al., 2003a, 2005) that in older burned areasmay reduce access to unvegetated patches used by ground-nesters.Thus, the differences in response between above- and below-ground nesters are consistent with temporal dynamics in the avail-ability of nest resources. Results of our analysis are consistent withother recent work that focuses on fires and documents substantialshifts in the representation of different traits within communities(Moretti et al., 2009); however the direction of the shift in thatstudy, toward above-ground, cavity-nesting species, contrasts withthe pattern we found. The differences may reflect fundamentallydifferent ways of testing the data related to different goals of thestudies (i.e., pooled abundances within a guild vs. species-levelanalysis, see Section 1). Other studies have highlighted the impor-tance of nest location/substrate and the link between availablenest sites and populations of certain bee species (Potts and Will-mer, 1997, 1998; Cane et al., 2006).
Sociality predictably affected bees’ response to disturbanceoverall and to several specific types. This result largely parallelsother recent analyses of bee responses that have considered life-history effects and used data from multiple study systems (Rickettset al., 2008; Winfree et al., 2009). The stronger response of socialspecies to isolation from natural habitat that we found has beenattributed to correlated differences in nesting substrate and nestlocation (Ricketts et al., 2008; Winfree et al., 2009). Tropical socialspecies, including honey bees, most often build nests associatedwith forest trees, which are not present in agricultural habitat.Some temperate social species, namely bumble bees, nest in exist-ing cavities and although these substrates are available in certaindisturbed landscapes they are not common in intensively culti-vated areas (Osborne et al., 2008). The lack of response to agricul-tural intensification likely reflects a more complex set of variablesinvolved including tillage and pesticide use and also the interac-tion of sociality with other bee traits. Social species were morestrongly affected than were solitary species by tilling and pesticideuse within agricultural landscapes. It is unclear why sociality itself
run including Apis mellifera and without A. mellifera (no Apis).
Lecty Nest construction Sociality
Coef. P Coef. P Coef. P
�0.01 0.91 �0.02 0.80 �0.17 0.030.03 0.83 �0.19 0.00 �0.28 <0.001�0.24 0.06 �0.04 0.63 0.20 0.06�0.25 0.04 �0.09 0.27 0.16 0.120.17 0.42 0.09 0.88 �0.81 <0.001�0.14 >0.999 0.10 0.77 �0.89 <0.001�1.81 0.00 0.56 0.12 0.82 0.01�0.43 0.48 �0.24 0.51 0.73 0.01
lysis with and without inclusion of A. mellifera. For trait descriptions refer to Table 1.

Fig. 4. Mean responses of social and solitary species to different disturbances, (A) isolation from semi-natural habitat, (B) agricultural intensity (C) tillage (D) pesticide use.Values are mean ± se relative abundance among species at disturbed and undisturbed sites. Mean for the less disturbed condition is scaled to 1 so that disturbed values showchanges relative to this value. Standard errors include error for mean response (or slope) and interaction whereas significance testing was based on interaction terms from thegeneral linear models therefore error bars are large compared to significance test results. See coefficients and p-values for life history x disturbance interaction terms inTable 3.
N.M. Williams et al. / Biological Conservation 143 (2010) 2280–2291 2287
should affect bees’ sensitivity to tilling independent of other traitslike the nest location that directly affect response to tilling. Manyof the social species included in our analysis were also ground-nesting; however, ground-nesting was not significantly correlatedwith sociality (Table 2). The greater sensitivity of social species topesticides matches the effect found by Winfree et al. (2009). Sensi-tivity of social species may be relatively acute because coloniesessentially bioaccumulate pesticides and experience exposure atgreater doses for longer periods. This occurs because: (1) foragersreturn with pollen and nectar that they transfer among individualsthrough social feeding and incorporate into the nest itself; (2) col-onies are active for longer periods than individual solitary femalesand thus integrate exposure to toxins over more of the active sea-son, (3) queens in particular feed upon resources collectedthroughout the year – from the fall to late summer, (4) foragersfrom the same colony visit different floral resources which maylead to contact with toxins over a wider area and from moresources and (5) some species exploit mass flowering crops exten-sively (Westphal et al., 2003), and recruit to concentrated re-sources (Apis spp.), which then become traps when sprayed.Together these factors may increase total exposure per colonycompared to single nests of solitary species.
Of the traits we included, body size showed surprisingly littleconsistency in its influence on the response of bee species to dis-turbance. Body size is correlated with foraging flight distance(Gathmann and Tscharntke, 2002; Greenleaf et al., 2007) and sowould be expected to strongly influence the scale over which beescan access resources and their ability to recolonize disturbed sites.Thus, larger species should be less affected by isolation (e.g. Kleinet al., 2008), but in our analysis, once honey bees were removedthey were not. Body size also negatively correlates with population
size, intrinsic growth rate and temporal fluctuations in populationsize in some species (Henle et al., 2004), all of which increase sen-sitivity to habitat loss. Although body size has been identified asimportant for determining responses to landscape change in othertaxa, there are opposing predictions of its effects (Henle et al.,2004) and it is perhaps not surprising that we too found no clearoverall effect. Small-bodied species also require fewer resourcesto produce offspring than do large-bodied species and so may bebetter able to maintain population sizes in disturbed or degradedhabitats. Such an effect might counteract the reduced recoloniza-tion ability of smaller-bodied species. Other recent studies of theeffect of body size on response of bees to fragmentation and habi-tat loss have contrasting results (Cane et al., 2006; Winfree et al.,2007; Klein et al., 2008).
4.2. Trait correlations and variable response
In this study, we analyzed each trait separately as though it wasnot constrained by other traits in the analysis when, in reality, spe-cies represent mosaics of traits that are not biologically indepen-dent. We chose this approach because not all traits wereavailable for all taxa, and analyzing trait pairs in combinationwould have substantially reduced sample size for many analyses.Nonetheless, we acknowledge that variation in one trait amongspecies may reduce the mean effect of another trait on responseto disturbance. For example, large-bodied species may be trophicgeneralists or specialists, nest above-ground or below-ground,and be solitary or social. In a study of urban fragmentation, Caneet al. (2006) found that trophic specialist bees generally declinedmore strongly than trophic generalist bees as fragment sizedecreased; however, the only trophic specialist that nested
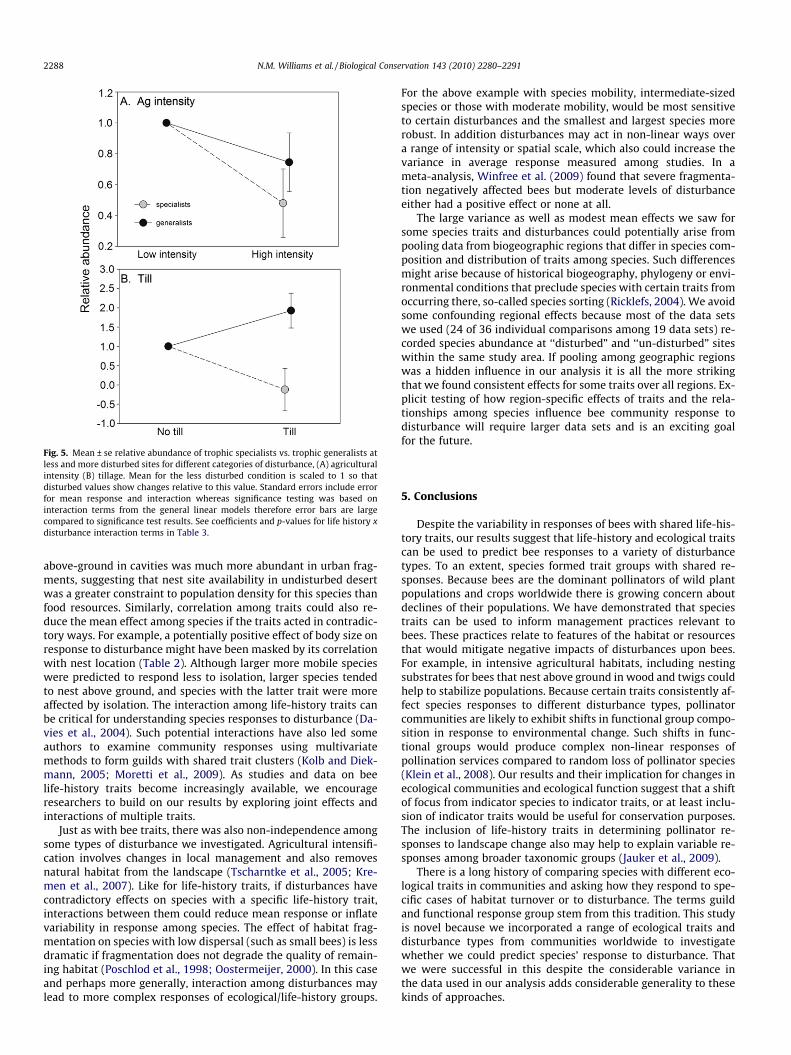
Fig. 5. Mean ± se relative abundance of trophic specialists vs. trophic generalists atless and more disturbed sites for different categories of disturbance, (A) agriculturalintensity (B) tillage. Mean for the less disturbed condition is scaled to 1 so thatdisturbed values show changes relative to this value. Standard errors include errorfor mean response and interaction whereas significance testing was based oninteraction terms from the general linear models therefore error bars are largecompared to significance test results. See coefficients and p-values for life history xdisturbance interaction terms in Table 3.
2288 N.M. Williams et al. / Biological Conservation 143 (2010) 2280–2291
above-ground in cavities was much more abundant in urban frag-ments, suggesting that nest site availability in undisturbed desertwas a greater constraint to population density for this species thanfood resources. Similarly, correlation among traits could also re-duce the mean effect among species if the traits acted in contradic-tory ways. For example, a potentially positive effect of body size onresponse to disturbance might have been masked by its correlationwith nest location (Table 2). Although larger more mobile specieswere predicted to respond less to isolation, larger species tendedto nest above ground, and species with the latter trait were moreaffected by isolation. The interaction among life-history traits canbe critical for understanding species responses to disturbance (Da-vies et al., 2004). Such potential interactions have also led someauthors to examine community responses using multivariatemethods to form guilds with shared trait clusters (Kolb and Diek-mann, 2005; Moretti et al., 2009). As studies and data on beelife-history traits become increasingly available, we encourageresearchers to build on our results by exploring joint effects andinteractions of multiple traits.
Just as with bee traits, there was also non-independence amongsome types of disturbance we investigated. Agricultural intensifi-cation involves changes in local management and also removesnatural habitat from the landscape (Tscharntke et al., 2005; Kre-men et al., 2007). Like for life-history traits, if disturbances havecontradictory effects on species with a specific life-history trait,interactions between them could reduce mean response or inflatevariability in response among species. The effect of habitat frag-mentation on species with low dispersal (such as small bees) is lessdramatic if fragmentation does not degrade the quality of remain-ing habitat (Poschlod et al., 1998; Oostermeijer, 2000). In this caseand perhaps more generally, interaction among disturbances maylead to more complex responses of ecological/life-history groups.
For the above example with species mobility, intermediate-sizedspecies or those with moderate mobility, would be most sensitiveto certain disturbances and the smallest and largest species morerobust. In addition disturbances may act in non-linear ways overa range of intensity or spatial scale, which also could increase thevariance in average response measured among studies. In ameta-analysis, Winfree et al. (2009) found that severe fragmenta-tion negatively affected bees but moderate levels of disturbanceeither had a positive effect or none at all.
The large variance as well as modest mean effects we saw forsome species traits and disturbances could potentially arise frompooling data from biogeographic regions that differ in species com-position and distribution of traits among species. Such differencesmight arise because of historical biogeography, phylogeny or envi-ronmental conditions that preclude species with certain traits fromoccurring there, so-called species sorting (Ricklefs, 2004). We avoidsome confounding regional effects because most of the data setswe used (24 of 36 individual comparisons among 19 data sets) re-corded species abundance at ‘‘disturbed” and ‘‘un-disturbed” siteswithin the same study area. If pooling among geographic regionswas a hidden influence in our analysis it is all the more strikingthat we found consistent effects for some traits over all regions. Ex-plicit testing of how region-specific effects of traits and the rela-tionships among species influence bee community response todisturbance will require larger data sets and is an exciting goalfor the future.
5. Conclusions
Despite the variability in responses of bees with shared life-his-tory traits, our results suggest that life-history and ecological traitscan be used to predict bee responses to a variety of disturbancetypes. To an extent, species formed trait groups with shared re-sponses. Because bees are the dominant pollinators of wild plantpopulations and crops worldwide there is growing concern aboutdeclines of their populations. We have demonstrated that speciestraits can be used to inform management practices relevant tobees. These practices relate to features of the habitat or resourcesthat would mitigate negative impacts of disturbances upon bees.For example, in intensive agricultural habitats, including nestingsubstrates for bees that nest above ground in wood and twigs couldhelp to stabilize populations. Because certain traits consistently af-fect species responses to different disturbance types, pollinatorcommunities are likely to exhibit shifts in functional group compo-sition in response to environmental change. Such shifts in func-tional groups would produce complex non-linear responses ofpollination services compared to random loss of pollinator species(Klein et al., 2008). Our results and their implication for changes inecological communities and ecological function suggest that a shiftof focus from indicator species to indicator traits, or at least inclu-sion of indicator traits would be useful for conservation purposes.The inclusion of life-history traits in determining pollinator re-sponses to landscape change also may help to explain variable re-sponses among broader taxonomic groups (Jauker et al., 2009).
There is a long history of comparing species with different eco-logical traits in communities and asking how they respond to spe-cific cases of habitat turnover or to disturbance. The terms guildand functional response group stem from this tradition. This studyis novel because we incorporated a range of ecological traits anddisturbance types from communities worldwide to investigatewhether we could predict species’ response to disturbance. Thatwe were successful in this despite the considerable variance inthe data used in our analysis adds considerable generality to thesekinds of approaches.
N.M. Williams et al. / Biological Conservation 143 (2010) 2280–2291 2289
Acknowledgements
This paper was prepared as part of NCEAS working group‘‘Restoring an ecosystem service to degraded landscapes: nativebees and crop pollination” organized by NMW and C. Kremenand funded by NSF Grant DEB-0072909. We thank our co partici-pants in the working group. S. Cunningham, I. Steffan-Dewenter,A.-M. Klein, R. Winfree, D. Vazquez, B. Gemmill-Herren providedadditional data on bee abundance from their published work. Somedata on bee life-history traits were provided by T. Griswold and F.Vivallo and S. Roberts. The Natural History Museum, London, UKand Smithsonian Institution, Washington DC, USA provided accessto some bee specimens from which we assessed body size. L. Sci-ullo helped measure some of the bees used in our analyses. R. Win-free provided valuable comments on the manuscript. SGP was alsosupported by the Integrated Project ALARM (Assessing Large-scaleenvironmental Risks for biodiversity with tested Methods,www.alarmproject.net) within the European Union’s Sixth Frame-work Program (Contract Number: GOCE-CT-2003-506675).
Appendix A
See Table A1.
Appendix B
Trait categorization for bees. Description of each trait withexplanation of its purported role in response to environmental dis-
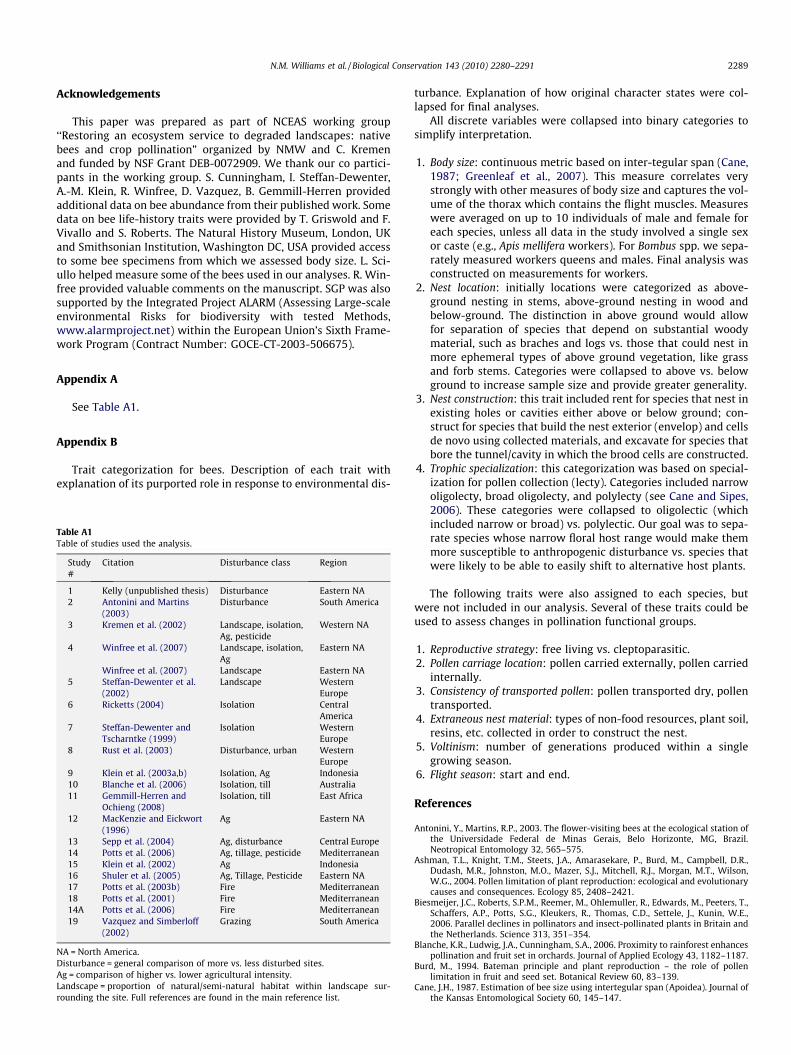
Table A1Table of studies used the analysis.
Study#
Citation Disturbance class Region
1 Kelly (unpublished thesis) Disturbance Eastern NA2 Antonini and Martins
(2003)Disturbance South America
3 Kremen et al. (2002) Landscape, isolation,Ag, pesticide
Western NA
4 Winfree et al. (2007) Landscape, isolation,Ag
Eastern NA
Winfree et al. (2007) Landscape Eastern NA5 Steffan-Dewenter et al.
(2002)Landscape Western
Europe6 Ricketts (2004) Isolation Central
America7 Steffan-Dewenter and
Tscharntke (1999)Isolation Western
Europe8 Rust et al. (2003) Disturbance, urban Western
Europe9 Klein et al. (2003a,b) Isolation, Ag Indonesia10 Blanche et al. (2006) Isolation, till Australia11 Gemmill-Herren and
Ochieng (2008)Isolation, till East Africa
12 MacKenzie and Eickwort(1996)
Ag Eastern NA
13 Sepp et al. (2004) Ag, disturbance Central Europe14 Potts et al. (2006) Ag, tillage, pesticide Mediterranean15 Klein et al. (2002) Ag Indonesia16 Shuler et al. (2005) Ag, Tillage, Pesticide Eastern NA17 Potts et al. (2003b) Fire Mediterranean18 Potts et al. (2001) Fire Mediterranean14A Potts et al. (2006) Fire Mediterranean19 Vazquez and Simberloff
(2002)Grazing South America
NA = North America.Disturbance = general comparison of more vs. less disturbed sites.Ag = comparison of higher vs. lower agricultural intensity.Landscape = proportion of natural/semi-natural habitat within landscape sur-rounding the site. Full references are found in the main reference list.
turbance. Explanation of how original character states were col-lapsed for final analyses.
All discrete variables were collapsed into binary categories tosimplify interpretation.
1. Body size: continuous metric based on inter-tegular span (Cane,1987; Greenleaf et al., 2007). This measure correlates verystrongly with other measures of body size and captures the vol-ume of the thorax which contains the flight muscles. Measureswere averaged on up to 10 individuals of male and female foreach species, unless all data in the study involved a single sexor caste (e.g., Apis mellifera workers). For Bombus spp. we sepa-rately measured workers queens and males. Final analysis wasconstructed on measurements for workers.
2. Nest location: initially locations were categorized as above-ground nesting in stems, above-ground nesting in wood andbelow-ground. The distinction in above ground would allowfor separation of species that depend on substantial woodymaterial, such as braches and logs vs. those that could nest inmore ephemeral types of above ground vegetation, like grassand forb stems. Categories were collapsed to above vs. belowground to increase sample size and provide greater generality.
3. Nest construction: this trait included rent for species that nest inexisting holes or cavities either above or below ground; con-struct for species that build the nest exterior (envelop) and cellsde novo using collected materials, and excavate for species thatbore the tunnel/cavity in which the brood cells are constructed.
4. Trophic specialization: this categorization was based on special-ization for pollen collection (lecty). Categories included narrowoligolecty, broad oligolecty, and polylecty (see Cane and Sipes,2006). These categories were collapsed to oligolectic (whichincluded narrow or broad) vs. polylectic. Our goal was to sepa-rate species whose narrow floral host range would make themmore susceptible to anthropogenic disturbance vs. species thatwere likely to be able to easily shift to alternative host plants.
The following traits were also assigned to each species, butwere not included in our analysis. Several of these traits could beused to assess changes in pollination functional groups.
1. Reproductive strategy: free living vs. cleptoparasitic.2. Pollen carriage location: pollen carried externally, pollen carried
internally.3. Consistency of transported pollen: pollen transported dry, pollen
transported.4. Extraneous nest material: types of non-food resources, plant soil,
resins, etc. collected in order to construct the nest.5. Voltinism: number of generations produced within a single
growing season.6. Flight season: start and end.
References
Antonini, Y., Martins, R.P., 2003. The flower-visiting bees at the ecological station ofthe Universidade Federal de Minas Gerais, Belo Horizonte, MG, Brazil.Neotropical Entomology 32, 565–575.
Ashman, T.L., Knight, T.M., Steets, J.A., Amarasekare, P., Burd, M., Campbell, D.R.,Dudash, M.R., Johnston, M.O., Mazer, S.J., Mitchell, R.J., Morgan, M.T., Wilson,W.G., 2004. Pollen limitation of plant reproduction: ecological and evolutionarycauses and consequences. Ecology 85, 2408–2421.
Biesmeijer, J.C., Roberts, S.P.M., Reemer, M., Ohlemuller, R., Edwards, M., Peeters, T.,Schaffers, A.P., Potts, S.G., Kleukers, R., Thomas, C.D., Settele, J., Kunin, W.E.,2006. Parallel declines in pollinators and insect-pollinated plants in Britain andthe Netherlands. Science 313, 351–354.
Blanche, K.R., Ludwig, J.A., Cunningham, S.A., 2006. Proximity to rainforest enhancespollination and fruit set in orchards. Journal of Applied Ecology 43, 1182–1187.
Burd, M., 1994. Bateman principle and plant reproduction – the role of pollenlimitation in fruit and seed set. Botanical Review 60, 83–139.
Cane, J.H., 1987. Estimation of bee size using intertegular span (Apoidea). Journal ofthe Kansas Entomological Society 60, 145–147.

2290 N.M. Williams et al. / Biological Conservation 143 (2010) 2280–2291
Cane, J.H., Sipes, S., 2006. Floral specialization by bees: analytical methods and arevised lexicon for oligolecty. In: Waser, N.M., Ollerton, J. (Eds.), Plant-PollinatorInteractions: From Specialization to Generalization. University of Chicago Press,Chicago, IL, pp. 99–122.
Cane, J.H., Minckley, R.L., Kervin, L.J., Roulston, T.H., Williams, N.M., 2006. Complexresponses within a desert bee guild (Hymenoptera: Apiformes) to urban habitatfragmentation. Ecological Applications 16, 632–644.
Davidson, D.W., Inouye, R.S., Brown, J.H., 1984. Granivory in a desert ecosystem:experimental evidence for indirect facilitation of ants by rodents. Ecology 65,17801786.
Davies, K.F., Margules, C.R., Lawrence, J.F., 2000. Which traits of species predictpopulation declines in experimental forest fragments? Ecology 81, 1450–1461.
Davies, K.F., Margules, C.R., Lawrence, J.F., 2004. A synergistic effect puts rare,specialized species at greater risk of extinction. Ecology 85, 265–271.
Devictor, V., Julliard, R., Jiguet, F., 2008. Distribution of specialist and generalistspecies along spatial gradients of habitat disturbance and fragmentation. Oikos117, 507–514.
Fagan, W.F., Meir, E., Moore, J.L., 1999. Variation thresholds for extinction and theirimplications for conservation strategies. American Naturalist 154, 510–520.
Fischer, J., Lindenmayer, D.B., 2007. Landscape modification and habitatfragmentation: a synthesis. Global Ecology and Biogeography 16, 265–280.
Gallai, N., Salles, J.M., Setelle, J., Vaissiere, B.E., 2009. Economic valuation of thevulnerability of world agriculture confronted to pollinator decline. EcologicalEconomics 68, 810–821.
Gathmann, A., Tscharntke, T., 2002. Foraging ranges of solitary bees. Journal ofAnimal Ecology 71, 757–764.
Gels, J.A., Held, D.W., Potter, D.A., 2002. Hazards of insecticides to the bumble beesBombus impatiens (Hymenoptera: Apidae) foraging on flowering white clover inturf. Ecotoxicology 95, 722–728.
Gemmill-Herren, B., Ochieng, A.O., 2008. Role of native bees and natural habitats ineggplant (Solanum melongena) pollination in Kenya. Agriculture Ecosystems &Environment 127, 31–36.
Goulson, D., Hanley, M.E., Darvill, B., Ellis, J.S., Knight, M.E., 2005. Causes of rarity inbumblebees. Biological Conservation 122, 1–8.
Green, R.E., Cornell, S.J., Scharlemann, J.P.W., Balmford, A., 2005. Farming and thefate of wild nature. Science 307, 550–555.
Greenleaf, S.S., Williams, N.M., Winfree, R., Kremen, C., 2007. Bee foraging rangesand their relationship to body size. Oecologia 153, 589–596.
Henle, K., Davies, K.F., Kleyer, M., Margules, C.R., Settele, J., 2004. Predictors ofspecies sensitivity to fragmentation. Biodiversity and Conservation 13, 207–251.
Jauker, F., Deikötter, T., Schwarzbach, F., Wolters, V., 2009. Pollinator dispersal in anagricultural matrix: opposing responses of wild bees and hoverflies tolandscape structure and distance from main habitat. Landscape Ecology 24,547–555.
Kim, J., Williams, N.M., Kremen, C., 2006. Effects of cultivation and proximity tonatural habitat on ground-nesting native bees in California sunflower fields.Journal of the Kansas Entomological Society, 79:309–320.
Kleijn, D., Kohler, F., Báldi, A., Batáry, P., Concepción, E.D., Clough, Y., Díaz, M.,Gabriel, D., Holzschuh, A., Knop, E., Kovács, A.A., Marshall, E.J.P., Tscharntke, T.,Verhulst, J.J., 2009. On the relationship between farmland biodiversity and land-use intensity in Europe. Proceedings of the Royal Society B 276, 903–909.
Klein, A.-M., Steffan-Dewenter, I., Buchori, D., Tscharntke, T., 2002. Effects of land-use intensity in tropical agroforestry systems on coffee flower-visiting and trap-nesting bees and wasps. Conservation Biology 16, 1003–1014.
Klein, A.-M., Steffan-Dewenter, I., Tscharntke, T., 2003a. Fruit set of highland coffeeincreases with diversity of pollinating bees. Proceedings of the Royal Society ofLondon Series B-Biological Sciences 270, 955–961.
Klein, A.-M., Steffan-Dewenter, I., Tscharntke, T., 2003b. Pollination of Coffeacanephora in relation to local and regional agroforestry management. Journal ofApplied Ecology 40, 837–845.
Klein, A.M., Vaissiere, B.E., Cane, J.H., Steffan-Dewenter, I., Cunningham, S.A.,Kremen, C., Tscharntke, T., 2007. Importance of pollinators in changinglandscapes for world crops. Proceedings of the Royal Society B-BiologicalSciences 274, 303–313.
Klein, A.-M., Cunningham, S.A., Bos, M., Steffan-Dewenter, I., 2008. Advances inpollination ecology from tropical plantation crops. Ecology 89, 935–943.
Kolb, A., Diekmann, M., 2005. Effects of life-history traits on responses of plantspecies to forest fragmentation. Conservation Biology 19, 929–938.
Kremen, C., Williams, N.M., Thorp, R.W., 2002. Crop pollination from native bees atrisk from agricultural intensification. Proceedings of the National Academy ofSciences of the United States of America 99, 16812–16816.
Kremen, C., Williams, N.M., Aizen, M.A., Gemmill-Herren, B., LeBuhn, G., Minckley,R.L., Packer, L., Potts, S.G., Roulston, T.H., Steffan-Dewenter, I., Vazquez, D.P.,Winfree, R., Adams, L.D., Crone, E.E., Greenleaf, S.S., Keitt, T.H., Klein, A.-M.,Regetz, J., Ricketts, T.H., 2007. Pollination and other ecosystem servicesproduced by mobile organisms: a conceptual framework for the effects ofland-use change. Ecology Letters 10, 299–314.
Krombein, K.V., Hurd, P.D., Smith, D.R., Burks, B.D., 1979. Catalog of Hymenoptera inAmerica North of Mexico. Smithsonian Institution Press, Washington, DC.
Larsen, T.H., Williams, N.M., Kremen, C., 2005. Extinction order and alteredcommunity structure rapidly disrupt ecosystem functioning. Ecology Letters8, 538–547.
Lavorel, S., Garnier, E., 2002. Predicting changes in community composition andecosystem functioning from plant traits: revisiting the Holy Grail. FunctionalEcology 16, 545–556.
MacKenzie, K., Eickwort, G.C., 1996. Diversity and abundance of bees(Hymenoptera: Apoidea) foraging on highbush blueberry (Vacciniumcorymbosum L) in central New York. Journal of the Kansas EntomologicalSociety 69, 185–194.
Mason, N.W.H., Lanoiselee, C., Mouillot, D., Irz, P., Argillier, C., 2007. Functionalcharacters combined with null models reveal inconsistency in mechanisms ofspecies turnover in lacustrine fish communities. Oecologia 153, 441–452.
Mathewson, J.A., 1968. Nest construction and life history of the Eastern cucurbitbee, Peponapis pruinosa (Hymenoptera: Apoidea). Journal of the KansasEntomological Society 41, 255–261.
McKinney, M.L., 1997. Extinction vulnerability and selectivity: Combiningecological and paleontological views. Annual Review of Ecology andSystematics 28, 495–516.
Michener, C.D., 2000. Bees of the World. Johns Hopkins University Press, Baltimore,MD, USA.
Moretti, M., de Bello, F., Roberts, S.P.M., Potts, S.G., 2009. Taxonomical vs. functionalresponses of bee communities to fire in two contrasting climatic regions.Journal of Animal Ecology 78, 98–108.
NRC-USA, 2007. Status of Pollinators in North America. The National AcademiesPress, Washington, DC, USA.
Oostermeijer, J.G.B., 2000. Population viability analysis of the rare Gentianapneumonanthe: importance of genetics, demography, and reproductivebiology. In: Young, A.G., Clarke, G.M. (Eds.), Genetics, Demography andViability of Fragmented Populations. Cambridge University Press, Cambridge,UK, pp. 313–334.
Osborne, J.L., Martin, A.P., Shortall, C.R., Todd, A.D., Goulson, D., Knight, M.E., Hale,R.J., Sanderson, R.A., 2008. Quantifying and comparing bumblebee nestdensities in gardens and countryside habitats. Journal of Applied Ecology 47,784–792.
Petchey, O.L., Gaston, K.J., 2006. Functional diversity: back to basics and lookingforward. Ecology Letters 9, 741–758.
Pimm, S.L., Diamond, J., Reed, T.M., Russell, G.J., Verner, J., 1993. Times to extinctionfor small populations of large birds. Proceedings of the National Academy ofSciences of the United States of America 90, 10871–10875.
Poschlod, P., Kiefer, S., Tränkle, U., Fischer, S., Bonn, S., 1998. Plant species richnessin calcareous grasslands as affected by dispersability in space and time. AppliedVegetation Science 1, 75–90.
Potts, S.G., Willmer, P.G., 1997. Abiotic and biotic factors influencing nest-siteselection by Halictus rubicundus, a ground nesting halictine bee. EcologicalEntomology 22, 319–328.
Potts, S.G., Willmer, P.G., 1998. Compact housing in built-up areas: spatialpositioning of nests in aggregations of a ground-nesting bee. EcologicalEntomology 23, 427–432.
Potts, S.G., Dafni, A., Ne’eman, G., 2001. Pollination of a core flowering shrub speciesin Mediterranean phrygana: variation in pollinator diversity, abundance andeffectiveness in response to fire. Oikos 92, 71–80.
Potts, S.G., Vulliamy, B., Dafni, A., Ne’eman, G., O’Toole, C., Roberts, S., Willmer, P.,2003a. Response of plant-pollinator communities to fire: changes in diversity,abundance and floral reward structure. Oikos 101, 103–112.
Potts, S.G., Vulliamy, B., Dafni, A., Ne’eman, G., O’Toole, C., Roberts, S., Willmer, P.,2003b. Linking bees and flowers: How do floral communities structurepollinator communities? Ecology 84, 2628–2642.
Potts, S.G., Vulliamy, B., Roberts, S., O’Toole, C., Dafni, A., Ne’Eman, G., Willmer, P.,2005. Role of nesting resources in organising diverse bee communities in aMediterranean landscape. Ecological Entomology 30, 78–85.
Potts, S.G., Petanidou, T., Roberts, S., O’Toole, C., Hulbert, A., Willmer, P., 2006. Plant-pollinator biodiversity and pollination services in a complex Mediterraneanlandscape. Biological Conservation 129, 519–529.
R Development Core Team, 2004. R: A Language and Environment for StatisticalComputing, R Foundation for Statistical Computing, Vienna.
Ricketts, T.H., 2004. Tropical forest fragments enhance pollinator activity in nearbycoffee crops. Conservation Biology 18, 1262–1271.
Ricketts, T.H., Regetz, J., Steffan-Dewenter, I., Cunningham, S.A., Kremen, C.,Bogdanski, A., Gemmill-Herren, B., Greenleaf, S.S., Klein, A.-M., Mayfield,M.M., Morandin, L.A., Ochieng, A., Viana, B.F., 2008. Landscape effects oncrop pollination services: are there general patterns? Ecology Letters 11,499–515.
Roemer, G.W., 2002. Golden eagles, feral pigs, and insular carnivores: How exoticspecies turn native predators into prey. Proceedings of the National Academy ofSciences of the United States of America 99, 791–796.
Rundlöf, M., Nilsson, H., Smith, H.G., 2008. Interacting effects of farming practiceand landscape context on bumble bees. Biological Conservation 141, 417–426.
Rust, R.W., Vaissiere, B.E., Westrich, P., 2003. Pollinator biodiversity and floralresource use in Ecballium elaterium (Cucurbitaceae) a Mediterranean endemic.Apidologie 34, 29–34.
Sepp, K., Mikk, M., Mand, M., Truu, J., 2004. Bumblebee communities as an indicatorfor landscape monitoring in the agri-environmental programme. Landscape andUrban Planning 67, 173–183.
Settele, J., Poethke, H.J., 1996. Towards demographic vulnerability categories ofbutterflies. In: Setelle, J., Margules, C.R., Poshchlod, P., Henle, K. (Eds.), SpeciesSurvival in Fragmented Landscapes. Kluwer, Dordrecht, pp. 282–289.
Shuler, R., Roulston, T.H., Farris, G., 2005. Farming practices influence wildpollinator populations on squash and pumpkin. Journal of EconomicEntomology 98, 790–795.
Steffan-Dewenter, I., Tscharntke, T., 1999. Effects of habitat isolation on pollinatorcommunities and seed set. Oecologia 121, 432–440.

N.M. Williams et al. / Biological Conservation 143 (2010) 2280–2291 2291
Steffan-Dewenter, I., Munzenberg, U., Burger, C., Thies, C., Tscharntke, T., 2002.Scale-dependent effects of landscape context on three pollinator guilds. Ecology83, 1421–1432.
Stockhammer, K.A., 1966. Nesting habits and life cycle of a sweat bee, Augochlorapura. Journal of the Kansas Entomological Society 39, 157–192.
Stoks, R., McPeek, M.A., 2003. Predators and life histories shape Lestes damselflyassemblages along a freshwater habitat gradient. Ecology, 84:1576–1587.
Tscharntke, T., Klein, A.-M., Kruess, A., Steffan-Dewenter, I., Thies, C., 2005.Landscape perspectives on agricultural intensification and biodiversity -ecosystem service management. Ecology Letters 8, 857–874.
Vazquez, D.P., Simberloff, D., 2002. Ecological specialization and susceptibility todisturbance: Conjectures and refutations. American Naturalist 159, 606–623.
Vazquez, D.P., Simberloff, D., 2003. Changes in interaction biodiversity induced byan introduced ungulate. Ecology Letters 6, 1077–1083.
Westphal, C., Steffan-Dewenter, I., Tscharntke, T., 2003. Mass floweringcrops enhance pollinator densities at a landscape scale. Ecology Letters 6,961–965.
Winfree, R., Griswold, T., Kremen, C., 2007. Effect of human disturbance on beecommunities in a forested ecosystem. Conservation Biology 21, 213–223.
Winfree, R., Aguilar, R., Vazquez, D.P., LeBuhn, G., Aizen, M.A., 2009. A meta-analysisof bees’ response to anthropogenic disturbance. Ecology 90, 2068–2076.
Zanette, L.R.S., Martins, R.P., Riberio, S.P., 2005. Effects of urbanization onNeotropical wasp and bee assemblages in a Brazilian metropolis. Landscapeand Urban Planning 71, 105–121.
Zayed, A., Roubik, D.W., Packer, L., 2004. Use of diploid male frequency data as anindicator of pollinator decline. Proceedings of the Royal Society of London SeriesB-Biological Sciences 271, S9–S12.
Related Documents