Ecogeographical gradients in plumage coloration among Australasian songbird clades Nicholas R. Friedman 1,2 * and Vladim ır Reme s 1 1 Department of Zoology and Laboratory of Ornithology, Faculty of Science, Palack y University, 17. listopadu 50, 77146 Olomouc, Czech Republic, 2 Biodiversity and Biocomplexity Unit, Okinawa Institute of Science and Technology Graduate University, 1919-1 Tancha, Onna-son, Okinawa, Japan *Correspondence: Nicholas R. Friedman, Department of Zoology and Laboratory of Ornithology, Faculty of Science, Palack y University, 17. listopadu 50, 77146 Olomouc, Czech Republic. E-mail: [email protected] ABSTRACT Aim Animal coloration often shows high degrees of evolutionary lability, producing variation among species that is easily apparent. This variation may produce consistent geographical patterns as species converge on adaptive phenotypes in similar environments. Some such geographical patterns in colour variation have been recently predicted as a response to the light environment in different habitats. Others like Gloger’s rule – the negative relationship between brightness and humidity – have long been observed but still demand explanation. Finally, the conventional wisdom that tropical birds are more colourful remains largely untested. Location Australia, New Guinea. Methods Here, we compared plumage coloration across two families of Australian birds (Meliphagidae, n 5 97 species; Acanthizidae, n 5 40 species) in a combined spatial and phylogenetic framework. We assessed the extent to which environmental variables extracted from species ranges explain variation in colour traits, while correcting for the autocorrelation inherent in spatially structured data using extensive simulations. Results We found several strong effects of environment on plumage coloration. Inland species with ranges marked by high aridity and temperature seasonality showed greater colour span among acanthizids, and greater saturation among meliphagids. Gloger’s rule was supported in both clades, but more strongly for dorsal plumage. The most consistent correlate in this relationship was vegetation: birds in regions with more vegetation had markedly darker plumage. Ornament hue showed no significant associations with vegetation or climate. Main conclusions Birds living close to the equator were not more colourful, but species inhabiting arid regions were. Species may respond to the shorter and less predictable breeding seasons of arid environments by evolving increased ornamentation. The consistent relationship we observed between vegetation and dorsal brightness supports a primary role for countershading and background matching in Gloger’s rule. Keywords Biogeography, bird coloration, climate, comparative methods, Gloger’s rule, sexual selection. V C 2016 John Wiley & Sons Ltd DOI: 10.1111/geb.12522 http://wileyonlinelibrary.com/journal/geb 261 Global Ecology and Biogeography, (Global Ecol. Biogeogr.) (2017) 26, 261–274 RESEARCH PAPER

Welcome message from author
This document is posted to help you gain knowledge. Please leave a comment to let me know what you think about it! Share it to your friends and learn new things together.
Transcript

Ecogeographical gradients in plumagecoloration among Australasian songbirdclades
Nicholas R. Friedman1,2* and Vladim�ır Reme�s1
1Department of Zoology and Laboratory of
Ornithology, Faculty of Science, Palack�y
University, 17. listopadu 50,
77146 Olomouc, Czech Republic,2Biodiversity and Biocomplexity Unit,
Okinawa Institute of Science and Technology
Graduate University, 1919-1 Tancha,
Onna-son, Okinawa, Japan
*Correspondence: Nicholas R. Friedman,
Department of Zoology and Laboratory of
Ornithology, Faculty of Science, Palack�yUniversity, 17. listopadu 50, 77146 Olomouc,
Czech Republic.
E-mail: [email protected]
ABSTRACT
Aim Animal coloration often shows high degrees of evolutionary lability,
producing variation among species that is easily apparent. This variation may
produce consistent geographical patterns as species converge on adaptive
phenotypes in similar environments. Some such geographical patterns in
colour variation have been recently predicted as a response to the light
environment in different habitats. Others like Gloger’s rule – the negative
relationship between brightness and humidity – have long been observed but
still demand explanation. Finally, the conventional wisdom that tropical birds
are more colourful remains largely untested.
Location Australia, New Guinea.
Methods Here, we compared plumage coloration across two families of
Australian birds (Meliphagidae, n 5 97 species; Acanthizidae, n 5 40 species) in
a combined spatial and phylogenetic framework. We assessed the extent to
which environmental variables extracted from species ranges explain variation
in colour traits, while correcting for the autocorrelation inherent in spatially
structured data using extensive simulations.
Results We found several strong effects of environment on plumage
coloration. Inland species with ranges marked by high aridity and temperature
seasonality showed greater colour span among acanthizids, and greater
saturation among meliphagids. Gloger’s rule was supported in both clades, but
more strongly for dorsal plumage. The most consistent correlate in this
relationship was vegetation: birds in regions with more vegetation had
markedly darker plumage. Ornament hue showed no significant associations
with vegetation or climate.
Main conclusions Birds living close to the equator were not more colourful,
but species inhabiting arid regions were. Species may respond to the shorter
and less predictable breeding seasons of arid environments by evolving
increased ornamentation. The consistent relationship we observed between
vegetation and dorsal brightness supports a primary role for countershading
and background matching in Gloger’s rule.
Keywords
Biogeography, bird coloration, climate, comparative methods, Gloger’s rule,
sexual selection.
VC 2016 John Wiley & Sons Ltd DOI: 10.1111/geb.12522
http://wileyonlinelibrary.com/journal/geb 261
Global Ecology and Biogeography, (Global Ecol. Biogeogr.) (2017) 26, 261–274
RESEARCHPAPER

INTRODUCTION
Understanding how organisms come to differ from one
another across space is a key goal of biogeography (Lomolino
et al., 2006). While simple principles of thermoregulation
often underlie geographical variation in body shape and size
(Bergmann, 1847; Allen, 1877), the causes of geographical
patterns in animal coloration appear to be more complex.
Coloration has many functions, from cryptic camouflage to
seemingly extravagant visual signals. The strength and opti-
mum of selection on each of these roles may be expected to
vary spatially among habitats due to differences in breeding
behaviour, climate or lighting conditions (see Th�ery, 2006;
and also other chapters in Hill & McGraw, 2006a,b).
It is a commonly held assumption that birds in the tropics
are more colourful (Wilson & Von Neumann, 1972). Previ-
ous studies have suggested that the appearance of a latitudi-
nal gradient in elaborate coloration may be based on
gradients in species richness rather than coloration (Bailey,
1978; Dalrymple et al., 2015), but the idea is remarkably per-
sistent. Other sexually selected traits like sexual size dimor-
phism and sexual dichromatism appear to be at best weakly
associated with latitude or climate (Badyaev & Hill, 2003;
Friedman et al., 2009; Dale et al., 2015; Friedman & Reme�s,
2016). In general, few studies have focused on the macroeco-
logical distribution of sexually selected traits (Dunn et al.,
2001; Mac�ıas-Ord�o~nez et al., 2014). As such, it remains
largely unclear how sexually selected traits differ spatially and
in relation to climate, and thus how the selection that
produces them should differ between geographical regions
(Cardillo, 2002; Friedman & Reme�s, 2016). While the funda-
mental principles that govern sexual selection may be the
same in each region, the distribution of resulting phenotypes
is likely to vary (Podos, 2014). Some researchers have pre-
dicted that environmental productivity should increase the
density of individuals (and thus potential mates and/or com-
petitors) and so increase the occurrence of polygyny (Verner
& Willson, 1966). Alternatively, regions with highly seasonal
climates may increase breeding synchrony and thus also
increase the intensity of sexual selection (Emlen & Oring,
1977; overview in Friedman & Reme�s, 2016). In either case
we might expect to see a greater degree of elaboration in spe-
cies inhabiting those regions. Studies are needed that test
whether the degree of elaborate coloration of species differs
with latitude, and explore which environmental variables
might explain such a gradient.
Animal signals often vary in response to environmental
variables that affect the medium of communication in such a
manner that signal efficacy is maintained (Wilczynski &
Ryan, 1999). For example, bird songs often match the acous-
tic properties of their habitat (Morton, 1975; Boncoraglio &
Saino, 2007). Similarly, bird coloration is expected to differ
between species in different habitats, as the conspicuousness
of each colour varies depending on the ambient spectrum of
light (Th�ery, 2006). While red ornaments may be particularly
conspicuous in dense forests illuminated by a spectrum
biased towards longer wavelengths, yellow ornaments may be
more conspicuous in open deserts (Endler, 1993). Indeed, a
study of Australian birds by McNaught & Owens (2002)
found a significant relationship between species habitat type
and both brightness and hue. Species in closed habitats were
observed to have darker plumage with longer-wavelength
hues.
Much of the attention to geographical variation in colora-
tion has focused on Gloger’s rule, in which animals tend to
be more darkly pigmented in humid environments (Gloger,
1833). This pattern often explains considerable plumage vari-
ation among avian populations and subspecies (Zink &
Remsen, 1986; VanderWerf, 2012). The potential functional
explanations for this pattern have included thermoregulation,
parasite defence and camouflage (Burtt, 1981; Zink &
Remsen, 1986; Burtt & Ichida, 2004). While little support has
materialized for thermoregulatory explanations, it remains
unclear which of the other hypotheses may best explain
Gloger’s rule (Cowles, 1958; but see West & Packer, 2002).
Few studies have explored this pattern in a modern biogeo-
graphical or phylogenetic framework, and these have largely
focused on mammals (Stoner et al., 2003; Kamilar & Bradley,
2011; Santana et al., 2012). Most promisingly, Kamilar &
Bradley (2011) found a relationship between dorsal pelage
brightness and evapotranspiration in primates, hinting at a
prominent role for crypsis.
Here we examine two diverse and closely related passerine
families, the honeyeaters (Meliphagidae) and Australasian
warblers (Acanthizidae), which are endemic to Australasia, a
region with a great diversity of climatic regimes. Focusing on
these clades allows us to test for consistent patterns in char-
acter evolution among closely related species without the
added complexity of averaging across many idiosyncratic
regions and clades (Gaston et al., 2008). Honeyeaters (Meli-
phagidae) tend to be socially monogamous and sexually
monochromatic, and most rely almost exclusively on nectar
or other sugary exudates. They are notoriously pugnacious
defenders of these ephemeral resources, excluding even inter-
specific rivals (Higgins & Peter, 2001; Low, 2014). In con-
trast, Australasian ‘warblers’ and allies (Acanthizidae) are
primarily insectivorous, and some exhibit year-round terri-
toriality either in pairs or cooperatively (Hall, 1974; Higgins
& Peter, 2002). In this way the feeding and breeding habits
of species from both families do not easily fit to the expecta-
tions generated from ornithological research in the northern
temperate zone. Moreover, past studies of elaborate colora-
tion in birds have been aimed predominantly at the contrast
between temperate North America and the Neotropics (Bai-
ley, 1978; Mac�ıas-Ord�o~nez et al., 2014). Thus our model
clades provide an excellent opportunity to test the generality
of biogeographical rules (Blackburn & Gaston, 1998).
In this study we aimed to describe and explain the geo-
graphical variation in plumage coloration among two fami-
lies of Australian bird species. We quantified the degree of
elaborate coloration to test predictions of (1) a latitudinal
trend in the degree of elaborate coloration, and (2) a positive
N. R. Friedman and V. Reme�s
262 Global Ecology and Biogeography, 26, 261–274, VC 2016 John Wiley & Sons Ltd

relationship to productivity and seasonality, possibly linked
to sexual selection. We quantified colour characters repre-
senting the hue of ornamental plumage to (3) test predic-
tions that ornaments are tuned to enhance conspicuousness
in their light environment. Lastly, we quantified plumage
brightness to (4) test predictions that high humidity or
ground cover are associated with dark coloration.
METHODS
Measurements
We examined vouchered museum specimens of Meliphagidae
and Acanthizidae at the Australian National Wildlife Collec-
tion (ANWC), and we include here data on all species for
which both phylogenetic and spatial data were available
(excluding Pachycare flavogriseum; Meliphagidae, 97 species
out of 184 recognized; Acanthizidae, 40 species out of 64 rec-
ognized; Clements et al., 2015). Due to the prevalence of sex-
ual monochromatism in honeyeaters and thornbills, we chose
to focus on the extent of male elaboration rather than dou-
bling our sampling effort to include female plumage. We
sampled five male specimens, preferentially selecting individ-
uals in breeding condition; as breeding seasons vary consider-
ably (Higgins & Peter, 2001), this was assessed based on skull
ossification, testis enlargement and feather wear.
We used reflectance spectrometry to measure plumage col-
oration, employing an Avantes AvaSpec-2048 spectrometer
equipped with an AvaLight-XE pulsed xenon light source.
Measurements were standardized between each specimen
using a WS-2 white reference, and included reflectance values
for the range of 300–700 nm (i.e. including the ultraviolet
portion of the spectrum). For each specimen, we measured
12 plumage patches located on the belly, breast, cheek,
crown, flank, mantle, primaries, rump, tail, throat and wing
coverts (Fig. S1 in the Supporting Information). We meas-
ured each patch in triplicate, then averaged and smoothed
the resulting reflectance spectra in ‘pavo’ (Maia et al., 2013).
To compare these colours in the context of the avian visual
system, we estimated receptor stimulus values using methods
described in Vorobyev et al. (1998). Much of the easily
observed variation in avian visual systems occurs at a single
site on the SWS1 opsin gene, some species exhibiting greater
violet sensitivity (VS) and others exhibiting greater ultravio-
let sensitivity (UVS; Wilkie et al., 2000; €Odeen & Hastad,
2003). As honeyeaters have been described as having the VS
allele ( €Odeen & Hastad, 2010), we used photoreceptor sensi-
tivities from an average VS visual system to model coloration
in this study. However, interspecific variation in photorecep-
tor sensitivity has been observed in a closely related family,
Maluridae (€Odeen et al., 2012). Consequently, whenever pos-
sible we chose to use colour metrics that lacked explicit vis-
ual modelling to avoid combining plumage reflectance and
receiver perception into a single character (see Friedman &
Reme�s, 2015). We placed each colour measurement in a col-
our space described by receptor stimulus values (Stoddard &
Prum, 2008), but calculated additional variables describing
its hue, saturation and brightness using metrics that do not
explicitly model the receiver’s visual system (see equations in
Friedman & Reme�s, 2015).
To summarize the extent of plumage elaboration across
many independent body regions, we used two measures
describing the average chromatic contrast among patches (col-
our span; Endler & Mielke, 2005) and the volume of colour
space occupied by a polygon including all patches (colour vol-
ume; Stoddard & Prum, 2008). As an estimate of overall col-
our elaboration, these measurements have the advantage of
increasing with the number and saturation of colours (e.g. a
red, blue and yellow bird would be described as more colour-
ful than a red and blue bird). However, a drawback is that
elaboration is underestimated for uniformly colourful birds
(e.g. a uniformly red bird would be described as equally col-
ourful as a uniformly brown bird). To mitigate this issue, we
included a second measure of overall elaboration, the degree
of plumage saturation (or colour purity) averaged across all
feather patches. This measure represents the ratio of the maxi-
mum to minimum reflectance values for a patch.
We calculated the hue of each species most saturated
feather patch to quantify the colour of species ornaments. To
describe these ornamental patches, we used Endler’s segment
classification method; this approach summarizes hue varia-
tion on two axes: short wavelength to mid wavelength (here-
after MS Hue), and mid wavelength to long wavelength (LM
Hue). In addition, we quantified brightness for each patch as
the sum of reflectance measurements in 1-nm bins across the
reflectance spectrum. We averaged these values for all
patches, and for dorsal and ventral patches in particular.
Spatial and phylogenetic analysis
For Acanthizidae, we used phylogenetic data from Gardner
et al. (2010), which were inferred using maximum likelihood
(ML) analysis of five mitochondrial and four autosomal loci.
While not all acanthizid taxa were sampled across every
locus, nearly all have data from at least one mitochondrial
marker and one nuclear intron. For Meliphagidae, we used
phylogenetic data from Joseph et al. (2014), which were
inferred using ML analysis of four mitochondrial and four
autosomal loci. For both ML trees, we estimated time-
calibrated branch lengths using penalized likelihood analysis
in ‘ape’ with published divergence estimates (produced in
BEAST; Drummond et al., 2012; Paradis, 2013).
We estimated average climate variables for each species’
range using range maps available from BirdLife (BirdLife
International & NatureServe, 2011) as analysed using the R
package ‘raster’ (Hijmans, 2015). We included the following
climatic and geographical variables: midpoint latitude, eleva-
tion, mean annual temperature, temperature seasonality
(standard deviation 3 100), mean annual precipitation, pre-
cipitation seasonality (coefficient of variation among monthly
means; Hijmans et al., 2005), net primary productivity (Running
et al., 2004) and actual evapotranspiration (Mu et al., 2011).
We also included data on humidity (9 a.m. average; Kriticos
Spatial gradients in plumage coloration
Global Ecology and Biogeography, 26, 261–274, VC 2016 John Wiley & Sons Ltd 263

et al., 2012) and an average of yearly maximum normalized dif-
ference vegetation index (NDBI) from 1982 to 2002 (Tucker
et al., 2010) As many climatic variables are correlated, we
reduced their dimensionality using principal components analysis
in ‘vegan’ (Oksanen et al., 2015). This resulted in two principal
components (PCs) that included 62% of the observed variance,
with positive values of PC1 representing more arid habitats with
less vegetation and positive values of PC2 representing hotter
lowland habitats (Fig. 1a). Phylogenetic signal was very low for
climate variables (k 5 0.09), and phylogenetic correction of PCA
scores had virtually no effect (R2 5 1.00 compared with the
uncorrected score; Revell, 2009). Despite this reduction in
dimensionality, it is clear that Australasian habitats include varia-
tion beyond these axes, and it is of interest which particular cli-
mate variables best explain variation in trait values across this
region. Consequently, we report results from analyses involving
both the climate PCs and the individual climate variables.
To describe spatial variation in colour, we averaged these
traits across species for each cell in a 0.5� grid overlaid on
the Australasian region using SAM (Spatial Analysis in Mac-
roecology; hereafter ‘gridded’ data; Diniz-Filho et al., 2008).
We examined spatial correlations between distributions of
trait values and climate variables using a spatially lagged
regression model in ‘spdep’ (Bivand & Piras, 2015). We
tested the efficacy of this approach by estimating Type I error
rates using gridded data from simulated characters. We
repeated the above spatial analyses using 100 characters
simulated under a Brownian motion (BM) model with a rate
parameter similar to those estimated from empirical data
(r2 5 0.05; Harmon et al., 2008). We calculated the Type I
error rate for each environmental predictor as the percentage
of simulated characters that were significantly (a 5 0.05) cor-
related with it across space. These initial tests showed dis-
tressing Type I error rates (65–85%) for spatial analyses that
were present even when correcting for spatial autocorrelation.
This autocorrelation of ecology and historical biogeography
is a common issue in macroecology (Tello & Stevens, 2012;
Warren et al., 2014). To avoid the pitfalls of this issue, we
conducted our primary analyses on species data in a frame-
work that combines correction for both phylogenetic and
spatial relationships (Freckleton & Jetz, 2009). Using this
model, we estimated k (the phylogenetic effect parameter)
and U (the spatial effect parameter) for each pair of response
and predictor variables (Tables S1 & S2). To mitigate any
potential effects arising from the autocorrelation issues
described above, we report the effect size distributions of cor-
relations between BM-simulated characters and each predic-
tor used in this study. These simulations indicated a more
acceptable Type I error rate of 5–20% for the methods used
in this study (Freckleton & Jetz, 2009), which we improve by
focusing on effects that exceed the 95% confidence interval
of the simulated null distribution.
We compared colour characters against each predictor vari-
able using an R script available upon request from and kindly
provided by R. Freckleton. From the resulting linear models,
we calculated effect size from the standardized regression
coefficient (b), as a means to assess the effect of each predic-
tor on the trait. We considered an effect to be ‘observable’ if
b was outside the simulated null distribution and its standard
error interval did not include 0; we considered an effect to be
‘strong’ if b was greater than 0.5 or less than 20.5.
RESULTS
Plumage elaboration
In comparisons across meliphagid species, colour span was not
related to climate to an extent greater than null expectations
(i.e. all standardized regression coefficients were within the
simulated distributions; Fig. 2). However, meliphagid species in
arid inland regions with sparse vegetation showed greater aver-
age colour saturation (Fig. 2). This relationship was supported
most confidently in relationships between saturation and pre-
cipitation and our climate PC1, but was also observed to a
weaker extent for temperature seasonality, vegetation, produc-
tivity and humidity. We found no relationship between latitude
and either colour span or average saturation in Meliphagidae.
Gridded saturation data showed the lowest average saturation
in inland Australia and the lowlands of New Guinea, and the
highest saturation values in south-western Australia (Fig. S1).
In comparisons across acanthizid species, colour span was
greater for species inhabiting southern lowland regions. This
relationship was supported most confidently in a strong rela-
tionship between colour span and climate PC1, and relation-
ships with latitude and elevation (Figs 1a & 2). However, we
also observed weaker support for associations with precipita-
tion, AET and climate PC2. Gridded averages of colour span
had the highest values in Australia’s inland grasslands, but had
the lowest in the lowlands of New Guinea (Fig. S1). In contrast,
average colour saturation in Acanthizidae only showed observ-
able relationships with climate PC1, NDVI and latitude (Fig. 2).
Hue
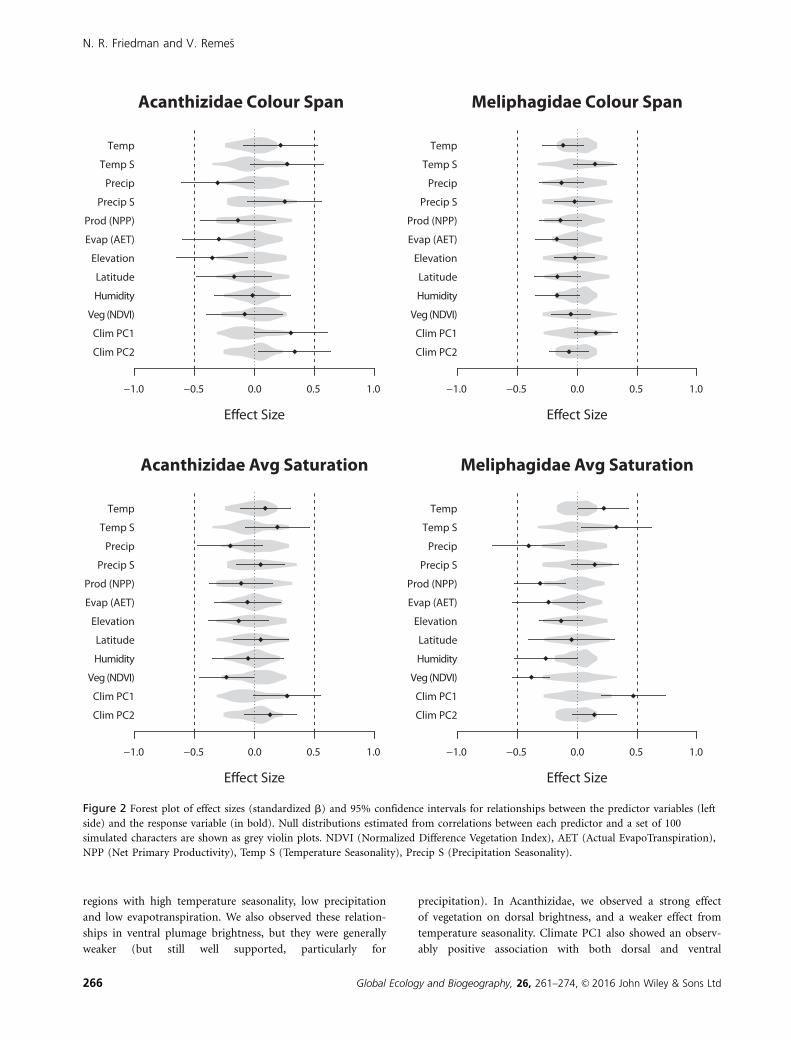
We did not observe any relationship in either Meliphagidae
or Acanthizidae between ornamental hue variables and envi-
ronmental variables that exceeded null expectations (Fig. 3).
We observed weak effects of several environmental predictors
on meliphagid MS Hue, but these relationships were within
null expectations (Figs 1b & 3). However, gridded data
showed meliphagid species exhibiting redder ornamental plu-
mage on average in the highly vegetated regions of coastal
and upland Australia (Fig. S2).
Brightness
We found strong negative relationships between brightness
and precipitation for both dorsal and ventral plumage
patches in Meliphagidae: brighter birds live in dry regions
(Figs 1c & 4). In contrast, we observed no such relationship
in Acanthizidae (Fig. 4). In Meliphagidae, we observed
strong effects of three environmental predictors and one of
the principal components (PC1) on dorsal brightness.
Meliphagid species had lighter dorsal plumage in warm
N. R. Friedman and V. Reme�s
264 Global Ecology and Biogeography, 26, 261–274, VC 2016 John Wiley & Sons Ltd

0.3 0.4 0.5 0.6 0.7
0.00
0.05
0.10
0.15
0.20
0.25
Latitude (Midpoint)
Aca
nthi
zida
elo
g Co
lour
Spa
n
−0.5 0.0 0.5
−0.
50.
00.
5
Climate PCA
PC1
PC2
Temp
Temp SPrecip
Precip S
NPP
AET
Altitude
Latitude
Humidity
NDVI
a
b
0.600.420.240.060
033667210081344
c
Vegetation (NDVI)
Mel
ipha
gida
eO
rnam
ent M
S H
ue
Peak NDVI
AnnualPrecipitation
Ann. Precipitation (mm)
Mel
ipha
gida
eD
orsa
l Bri
ghtn
ess
0 1000 2000 3000 4000
510
1520
d
e
f
−40 −30 −20 −10
−3.8
−3.4
−3.0
−2.6
Figure 1 Results of a principal components analysis describing average climate in species ranges (a). Distribution of exemplar predictor
variables across Australia and New Guinea (b, c). Plots comparing average climate and latitude of species ranges to plumage coloration
(d–f). These show species trait values and climate parameters estimated from ranges (large dots), with ancestral states and relationships
(small black dots and thin lines, respectively) also estimated using ‘phytools’ (Revell, 2012). In this context, the black lines are meant to
evoke comparison of trait values among sister species and clades. Thick red lines denote regression models from analyses correcting for
both phylogenetic and spatial relatedness.
Spatial gradients in plumage coloration
Global Ecology and Biogeography, 26, 261–274, VC 2016 John Wiley & Sons Ltd 265
regions with high temperature seasonality, low precipitation
and low evapotranspiration. We also observed these relation-
ships in ventral plumage brightness, but they were generally
weaker (but still well supported, particularly for
precipitation). In Acanthizidae, we observed a strong effect
of vegetation on dorsal brightness, and a weaker effect from
temperature seasonality. Climate PC1 also showed an observ-
ably positive association with both dorsal and ventral
Acanthizidae Colour Span
Effect Size
−1.0 −0.5 0.0 0.5 1.0
Meliphagidae Colour Span
Effect Size
−1.0 −0.5 0.0 0.5 1.0
Acanthizidae Avg Saturation
Effect Size
−1.0 −0.5 0.0 0.5 1.0
Meliphagidae Avg Saturation
Effect Size
−1.0 −0.5 0.0 0.5 1.0
Clim PC2
Clim PC1
Veg (NDVI)
Humidity
Latitude
Evap (AET)
Prod (NPP)
Precip S
Precip
Temp S
Temp
Elevation
Clim PC2
Clim PC1
Veg (NDVI)
Humidity
Latitude
Evap (AET)
Prod (NPP)
Precip S
Precip
Temp S
Temp
Elevation
Clim PC2
Clim PC1
Veg (NDVI)
Humidity
Latitude
Evap (AET)
Prod (NPP)
Precip S
Precip
Temp S
Temp
Elevation
Clim PC2
Clim PC1
Veg (NDVI)
Humidity
Latitude
Evap (AET)
Prod (NPP)
Precip S
Precip
Temp S
Temp
Elevation
Figure 2 Forest plot of effect sizes (standardized b) and 95% confidence intervals for relationships between the predictor variables (left
side) and the response variable (in bold). Null distributions estimated from correlations between each predictor and a set of 100
simulated characters are shown as grey violin plots. NDVI (Normalized Difference Vegetation Index), AET (Actual EvapoTranspiration),
NPP (Net Primary Productivity), Temp S (Temperature Seasonality), Precip S (Precipitation Seasonality).
N. R. Friedman and V. Reme�s
266 Global Ecology and Biogeography, 26, 261–274, VC 2016 John Wiley & Sons Ltd

brightness. Acanthizid species had brighter dorsal and ventral
plumage in arid regions with low humidity and little vegeta-
tion. Using gridded data, meliphagid species were lighter on
average in Australia’s inland regions, and darker in New
Guinea’s lowlands (Fig. S3). We observed a similar spatial
pattern among acanthizid species.
DISCUSSION
Plumage elaboration, climate and sexual selection
Conventional wisdom that birds are more colourful in the
tropics was not supported in this study (Fig. 2). Most studies
of latitudinal variation in sexually selected traits have focused
Acanthizidae Colourful LM Hue
Effect Size
−1.0 −0.5 0.0 0.5 1.0
Meliphagidae Colourful LM Hue
Effect Size
−1.0 −0.5 0.0 0.5 1.0
Acanthizidae Colourful MS Hue
Effect Size
−1.0 −0.5 0.0 0.5 1.0
Meliphagidae Colourful MS Hue
Effect Size
−1.0 −0.5 0.0 0.5 1.0
Clim PC2
Clim PC1
Veg (NDVI)
Humidity
Latitude
Evap (AET)
Prod (NPP)
Precip S
Precip
Temp S
Temp
Elevation
Clim PC2
Clim PC1
Veg (NDVI)
Humidity
Latitude
Evap (AET)
Prod (NPP)
Precip S
Precip
Temp S
Temp
Elevation
Clim PC2
Clim PC1
Veg (NDVI)
Humidity
Latitude
Evap (AET)
Prod (NPP)
Precip S
Precip
Temp S
Temp
Elevation
Clim PC2
Clim PC1
Veg (NDVI)
Humidity
Latitude
Evap (AET)
Prod (NPP)
Precip S
Precip
Temp S
Temp
Elevation
Figure 3 Forest plot of effect sizes (standardized b) and 95% confidence intervals for relationships between the predictor variables (left
side) and the response variable (in bold). Null distributions estimated from correlations between each predictor and a set of 100
simulated characters are shown as grey violin plots. NDVI (Normalized Difference Vegetation Index), AET (Actual EvapoTranspiration),
NPP (Net Primary Productivity), Temp S (Temperature Seasonality), Precip S (Precipitation Seasonality).
Spatial gradients in plumage coloration
Global Ecology and Biogeography, 26, 261–274, VC 2016 John Wiley & Sons Ltd 267

on a contrast between the Nearctic and the Neotropics (e.g.
Mac�ıas-Ord�o~nez et al., 2014). Such studies of birds are compli-
cated by the effects of migratory behaviour and life history,
which often lead to sexual dichromatism in temperate-breeding
species (Bailey 1978; Friedman et al., 2009). Honeyeaters and
thornbills provide a unique test for an effect of latitude on
elaboration in that no species are long-distance migrants (some
exhibit partial migration, diurnal or nomadic movements) and
few species are sexually dichromatic (Gregory, 2016; Higgins
et al., 2016). In the absence of these confounding variables,
there appears to be little evidence that species evolve more
elaborate coloration due to conditions near the equator. If they
Acanthizidae Dorsal Brightness
Effect Size
−1.0 −0.5 0.0 0.5 1.0
Meliphagidae Dorsal Brightness
Effect Size
−1.0 −0.5 0.0 0.5 1.0
Acanthizidae Ventral Brightness
Effect Size
−1.0 −0.5 0.0 0.5 1.0
Meliphagidae Ventral Brightness
Effect Size
−1.0 −0.5 0.0 0.5 1.0
Clim PC2
Clim PC1
Veg (NDVI)
Humidity
Latitude
Evap (AET)
Prod (NPP)
Precip S
Precip
Temp S
Temp
Elevation
Clim PC2
Clim PC1
Veg (NDVI)
Humidity
Latitude
Evap (AET)
Prod (NPP)
Precip S
Precip
Temp S
Temp
Elevation
Clim PC2
Clim PC1
Veg (NDVI)
Humidity
Latitude
Evap (AET)
Prod (NPP)
Precip S
Precip
Temp S
Temp
Elevation
Clim PC2
Clim PC1
Veg (NDVI)
Humidity
Latitude
Evap (AET)
Prod (NPP)
Precip S
Precip
Temp S
Temp
Elevation
Figure 4 Forest plot of effect sizes (standardized b) and 95% confidence intervals for relationships between the predictor variables (left
side) and the response variable (in bold). Null distributions estimated from correlations between each predictor and a set of 100
simulated characters are shown as grey violin plots. NDVI (Normalized Difference Vegetation Index), AET (Actual EvapoTranspiration),
NPP (Net Primary Productivity), Temp S (Temperature Seasonality), Precip S (Precipitation Seasonality).
N. R. Friedman and V. Reme�s
268 Global Ecology and Biogeography, 26, 261–274, VC 2016 John Wiley & Sons Ltd

do, we should expect to see more reports of elaborate subspe-
cies or sister taxa nearer the equator.
Instead, we found that plumage elaboration was greater for
species in arid climates marked by high temperature season-
ality, low precipitation and sparse vegetation (Figs 1a & 2).
For meliphagids, we observed this as an increase in overall
plumage saturation, whereas in acanthizids we observed this
as an increase in colour span (i.e. contrast). It remains
unclear why one clade should show exaggerated saturation
and the other contrast, and further study of the functions of
coloration in each clade is warranted. Overall, variation in
these colour traits could be explained by a relationship
between aridity and the intensity of sexual selection, leading
to increased plumage elaboration in the arid and semi-arid
zones, which show low precipitation and high variability (see
Botero & Rubenstein, 2012). This could occur if breeding
Figure 5 An illustration of Gloger’s rule using the three species of the genus Gavicalis. Each species is shown in an example photo on the
left with a single dorsal patch highlighted in white, and is overlaid onto its distributional range. Average annual rainfall for that range is
indicated on the right, and phylogenetic relationships are indicated at left.
Spatial gradients in plumage coloration
Global Ecology and Biogeography, 26, 261–274, VC 2016 John Wiley & Sons Ltd 269

events are synchronized around pulses of rainfall (McGilp,
1924; Keast & Marshall, 1954). From the highly variable cli-
mate of inland Australia, we might predict that high breeding
synchrony has led to greater competition for mates and thus
more elaborate plumage. While species accounts of thornbills
and other acanthizids describe breeding as occurring in most
months, many inland species show seasonal peaks associated
with heavy rainfall (Higgins & Peter, 2002). Many honeyeat-
ers enjoy a relatively consistent food source in the overlap-
ping flowering periods of nectar-providing plants, but often
show seasonality in their breeding that is roughly similar to
acanthizids (Law et al., 2000; Higgins & Peter, 2001).
Dependence of sexually selected traits on climate variabili-
ty has been reported in other Australian taxa. In superb
fairy-wrens (Malurus cyaneus), more males moult into breed-
ing plumage early and thus compete for mates in wetter
years (Cockburn et al., 2008; see also Reudink et al., 2014).
In arid environments with unpredictable rainfall, males must
scramble to attain and display their breeding condition in
time to take advantage of pulses of wet weather (Serventy &
Marshall, 1957). Under these harsh conditions, elaborate plu-
mage may be frequently gained if its condition dependence is
accentuated (Cockburn et al., 2008), or if it otherwise enables
individuals to make the most of the short opportunity to
breed (L. Joseph, pers. comm.). It is worthy of note that
many of the colourful patches observed on arid-adapted spe-
cies have colours typically associated with carotenoid pig-
mentation mechanisms that have often been implicated in
condition-dependent signalling systems (e.g. Epthianura spp.;
Hill & McGraw, 2006a). Observational studies are needed to
investigate the role of climate variability in species breeding
behaviour and its consequences for sexual selection, particu-
larly among arid and semi-arid endemics (e.g. Keast, 1968).
If there is greater variation in mating success among species
with opportunistic breeding cycles, we predict that compara-
tive studies in other clades should also show variation in
ornamentation along a gradient in aridity rather than
latitude.
Hue and light environment
In a landmark paper, Endler (1993) showed that the ambient
light environment differs between open and canopied habi-
tats, and predicted that forest understorey species would be
most conspicuous when adorned with red or orange colours.
Since then, many studies have examined the role of the light
environment in shaping avian display behaviours (Endler &
Thery, 1996; Uy & Endler, 2004; Gomez & Th�ery, 2007).
Among these, McNaught & Owens (2002) examined the
hypothesis of an influence of light environment on the plu-
mage of Australian species. They found a greater frequency
of colourful (i.e. hue; sensu Endler, 1990) birds in closed hab-
itats, but a greater frequency of bright birds in open habitats.
Here we focus on colour span (i.e. contrast), but describe a
similar pattern of higher average span and saturation in the
semi-arid zone where open habitats are more common. In
most cases, inland acanthizids achieved greater contrast by
exhibiting bright yellow plumage (with the conspicuous
exception of the redthroat, Pyrrholaemus brunneus). However,
these colourful patches were not red or orange in forest-
dwelling acanthizids, but absent altogether (Higgins & Peter,
2002). This suggests that differences exist in the degree of
elaboration, and not the colour, of visual signals in
Acanthizidae.
Our results do not lend support to the hypothesis that
ornament colour evolves to match the optimum for the habi-
tat’s light environment. However, our study has several limi-
tations that prevent us from rejecting this hypothesis. First,
we assume that light environment correlates with forest
cover. As Endler (1993) describes, there should be consider-
able variation in ambient light among the different microha-
bitats of a single forest. Indeed, some birds take advantage of
this variation by displaying preferentially under favourable
lighting conditions (Endler & Thery, 1996; Uy & Endler,
2004). However, it is worth noting that much of this varia-
tion in lighting conditions should be absent in inland grass-
land or desert habitats. To adequately test the light
environment hypothesis, comparative studies are needed that
relate plumage coloration to measurements of background
colours and ambient light spectra for each species (e.g. Del-
hey et al., 2013). It is unclear whether (1) there have been
few such attempts to test this hypothesis due to the practical
difficulties of comparing the conspicuousness of birds’ colo-
ration in the context of a heterogeneous light environment,
or (2) the results of such tests are frequently negative (e.g.
Shultz & Burns, 2013) and thus under-reported. Meta-analy-
ses are needed to assess the weight of evidence for the role of
the light environment in driving the evolution of visual sig-
nals in terrestrial organisms.
Gloger’s rule: precipitation or ground cover?
The presence of a relationship between climate and animal
coloration is well established; however, the process underly-
ing this pattern is less clear. In its original conception,
humidity was identified as the driver of geographical gra-
dients in plumage brightness (Gloger, 1833). In this study,
we found no evidence for a negative relationship between
humidity and plumage brightness. Humidity had no measur-
able effect on plumage brightness in Meliphagidae, and a
positive effect on brightness in Acanthizidae only for ventral
plumage. In contrast, precipitation showed a strongly nega-
tive effect on brightness in Meliphagidae: brighter birds live
in arid regions (Fig. 4; Fig. 5). We interpret this to suggest
that precipitation plays a greater role than humidity in defin-
ing the climate–brightness gradient observed among animals.
We observed that among acanthizids, vegetation was the
strongest predictor of a species’ plumage brightness (Fig. 4).
Furthermore, acanthizids often live in riparian habitats,
which may vary in vegetation on a smaller scale than was
measured in this study. Consequently, we find it plausible
that the role of precipitation and humidity here may be in
N. R. Friedman and V. Reme�s
270 Global Ecology and Biogeography, 26, 261–274, VC 2016 John Wiley & Sons Ltd

controlling the extent of vegetation, and indeed these varia-
bles are typically correlated (Nightingale & Phinn, 2003).
Future studies should employ phylogenetic path analysis
methods to further disentangle the effects of these variables
(von Hardenberg & Gonzalez-Voyer, 2013).
As discussed by Zink & Remsen (1986), the more marked
relationship with climate for dorsal versus ventral plumage is
a challenge for precipitation-related explanations for Gloger’s
rule. Whether mediated by parasite abundance or other fac-
tors, precipitation-related mechanisms for Gloger’s rule must
explain why this effect is greater in dorsal plumage. We pro-
pose two such explanations here.
1. Countershading is extremely common among animals,
and mechanisms for maintaining it are deeply embedded in
vertebrates’ genetic architecture for melanin biosynthesis
(Hoekstra, 2006; Manceau et al., 2011). Thus, selection for
darker or lighter coloration may act most readily on alleles
that more greatly affect dorsal coloration, whether such selec-
tion is the result of predation or precipitation. Alternatively,
continued selection for countershading could maintain the
difference in brightness between dorsal and ventral patches,
either as a means of reducing self-shadowing or otherwise
contributing to camouflage (see Ruxton et al., 2004; Row-
land, 2009; Kamilar, 2009).
2. Ventral feather patches may be more often involved in sig-
nalling functions, in part because they can be more easily
hidden from predators (Gomez & Th�ery, 2007). This would
add more noise to relationships between climate and ventral
plumage than dorsal plumage (e.g. if ventral plumage varies
between conspicuous colours that differ in brightness).
Among Australian fairy-wrens and grasswrens (Maluridae),
plumage brightness evolves most rapidly on ventral feather
patches for females but on ventral and some dorsal patches
for males (Friedman & Reme�s, 2015). This may suggest that
ventral patches are under weaker selection for background
matching, and are thus free to vary. Alternatively, natural
and sexual selection pressures may be variable, leading to dif-
ferent colour optima among species. In either case, there
remains a strong role for background matching in the main-
tenance of Gloger’s rule.
CONCLUSIONS
As in Dalrymple et al. (2015), we found no support for a
positive relationship between plumage elaboration and lati-
tude: birds were not more colourful in the tropics. However,
we did find evidence that meliphagids and acanthizids inhab-
iting arid regions had more contrasting and more saturated
plumage, respectively (Fig. 2). We also found no evidence
that species ornaments were tuned to different hues in differ-
ent habitats (Fig. 3). Lastly, we observed strong evidence in
support of Gloger’s rule, highlighting the role of precipitation
and/or vegetation in animal coloration.
By averaging species data across local assemblages (grid
cells), we found many spatial distributions that imply rela-
tionships between species traits and their local environment,
but also a Type I error rate approaching 80%. This suggests
that for any particular clade it may be quite common to
observe spatial trait–environment relationships. These are
readily produced due to spatial and phylogenetic autocorrela-
tion, and as such do not necessarily represent convergent
adaptation to similar environments. Comparative methods
that correct for phylogeny and space together with compari-
son against null expectations allowed us to test for correlated
evolution between species plumage traits and their environ-
ment (Freckleton & Jetz, 2009). However, methods are
needed to disentangle the effects of niche conservatism and
historical biogeography from spatial relationships between
traits and the environment.
Our results suggest that selection for elaborate coloration
may be greater in arid regions. Further studies are needed
that examine how different climate regimes affect the
strength and direction of sexual selection. While researchers
are dismantling the temperate zone bias that has afflicted
behavioural ecology (Mac�ıas-Ord�o~nez et al., 2014), the tem-
perate/tropical duality is likely to be an over-simplification.
We can learn a great deal from Australia’s arid and semi-arid
zones, which have existed for millions of years as a cradle of
biodiversity and crucible of evolution (Byrne et al., 2008).
ACKNOWLEDGEMENTS
We thank L. Joseph, R. Palmer, and the staff of the ANWC for
their invaluable support and hospitality during N.R.F.’s work at
the collection. L. Joseph and E. Economo, as well as two anony-
mous referees, kindly contributed to improving this manu-
script. This study was supported by the European Social Fund
and the state budget of the Czech Republic (project no.
CZ.1.07/2.3.00/30.0041) and Palack�y University (IGA
PrF_2016_004). N.R.F. was supported by subsidy funding to
OIST.
REFERENCES
Allen, J.A. (1877) The influence of physical conditions in the
genesis of species. Radical Review, 1, 108–140.
Badyaev, A.V. & Hill, G.E. (2003) Avian sexual dichromatism
in relation to phylogeny and ecology. Annual Review of
Ecology, Evolution, and Systematics, 34, 27–49.
Bailey, S.F. (1978) Latitudinal gradients in colors and pat-
terns of passerine birds. The Condor, 80, 372–381.
Bergmann, K.G.L.C. (1847) Ueber die Verhaltnisse der War-
meokonomie der Thiere zu ihrer Grosse. Gottinger Studien,
3, 595–708.
BirdLife International & NatureServe. (2011) Bird species dis-
tribution maps of the world. BirdLife International and
NatureServe, Cambridge.
Bivand, R. & Piras, G. (2015) Comparing implementations
of estimation methods for spatial econometrics. Journal of
Statistical Software, 63, 1–36.
Blackburn, T.M. & Gaston, K.J. (1998) Some methodological
issues in macroecology. The American Naturalist, 151,
68–83.
Spatial gradients in plumage coloration
Global Ecology and Biogeography, 26, 261–274, VC 2016 John Wiley & Sons Ltd 271

Boncoraglio, G. & Saino, N. (2007) Habitat structure and the
evolution of bird song: a meta-analysis of the evidence for
the acoustic adaptation hypothesis. Functional Ecology, 21,
134–142.
Botero, C.A. & Rubenstein, D.R. (2012) Fluctuating environ-
ments, sexual selection and the evolution of flexible mate
choice in birds. PloS One, 7, e32311.
Burtt, E.H. (1981) The adaptiveness of animal colors. Bio-
Science, 31, 723–729.
Burtt, E.H. & Ichida, J.M. (2004) Gloger’s rule, feather-
degrading bacteria, and color variation among song spar-
rows. The Condor, 106, 681–686.
Byrne, M., Yeates, D.K., Joseph, L., Kearney, M., Bowler, J.,
Williams, M.A.J., Cooper, S., Donnellan, S.C., Keogh, J.S.,
Leys, R., Melville, J., Murphy, D.J., Porch, N. & Wyrwoll,
K.H. (2008) Birth of a biome: insights into the assembly
and maintenance of the Australian arid zone biota. Molecu-
lar Ecology, 17, 4398–4417.
Cardillo, M. (2002) The life-history basis of latitudinal diver-
sity gradients: how do species traits vary from the poles to
the equator? Journal of Animal Ecology, 71, 79–87.
Clements, J.F., Schulenberg, T.S., Iliff, M.J., Roberson, D.,
Fredericks, T.A., Sullivan, B.L. & Wood, C.L. (2015) The
eBird/Clements checklist of birds of the world: v.2015. Avail-
able at: http://www.birds.cornell.edu/clementschecklist/
download/
Cockburn, A., Osmond, H.L. & Double, M.C. (2008)
Swingin’ in the rain: condition dependence and sexual
selection in a capricious world. Proceedings of the Royal
Society B: Biological Sciences, 275, 605–612.
Cowles, R.B. (1958) Possible origin of dermal temperature
regulation. Evolution, 12, 347–357.
Dale, J., Dey, C., Delhey, K., Kempenaers, B. & Valcu, M.
(2015) The effects of life-history and social selection on
male and female plumage coloration. Nature, 527, 367–370.
Dalrymple, R.L., Kemp, D.J., Flores-Moreno, H., Laffan, S.W.,
White, T.E., Hemmings, F.A., Tindall, M.L. & Moles, A.T.
(2015) Birds, butterflies and flowers in the tropics are not
more colourful than those at higher latitudes. Global Ecol-
ogy and Biogeography, 24, 1424–1432.
Delhey, K., Hall, M., Kingma, S.A. & Peters, A. (2013)
Increased conspicuousness can explain the match between
visual sensitivities and blue plumage colours in fairy-wrens.
Proceedings of the Royal Society B: Biological Sciences, 280,
20121771.
Diniz-Filho, J.A.F., Rangel, T.F.L.V.B. & Bini, L.M. (2008)
Model selection and information theory in geographical
ecology. Global Ecology and Biogeography, 17, 479–488.
Drummond, A.J., Suchard, M.A., Xie, D. & Rambaut, A.
(2012) Bayesian phylogenetics with BEAUti and the BEAST
1.7. Molecular Biology and Evolution, 29, 1969–1973.
Dunn, P.O., Whittingham, L.A. & Pitcher, T.E. (2001) Mating
systems, sperm competition, and the evolution of sexual
dimorphism in birds. Evolution, 55, 161–175.
Emlen, S.T. & Oring, L.W. (1977) Ecology, sexual selection,
and the evolution of mating systems. Science, 197, 215–223.
Endler, J.A. (1990) On the measurement and classification of
colour in studies of animal colour patterns. Biological Jour-
nal of the Linnean Society, 41, 315–352.
Endler, J.A. (1993) The color of light in forests and its impli-
cations. Ecological Monographs, 63, 1–27.
Endler, J.A. & Mielke, P.W. (2005) Comparing entire colour
patterns as birds see them. Biological Journal of the Linnean
Society, 86, 405–431.
Endler, M. & Thery, J.A. (1996) Interacting effects of lek
placement, display behavior, ambient light, and color pat-
terns in three Neotropical forest-dwelling birds. The Ameri-
can Naturalist, 148, 421–452.
Freckleton, R.P. & Jetz, W. (2009) Space versus phylogeny:
disentangling phylogenetic and spatial signals in compara-
tive data. Proceedings of the Royal Society B: Biological Sci-
ences, 276, 21–30.
Friedman, N.R. & Reme�s, V. (2015) Rapid evolution of elab-
orate male coloration is driven by visual system in Austra-
lian fairy-wrens (Maluridae). Journal of Evolutionary
Biology, 28, 2125–2135.
Friedman, N.R. & Reme�s, V. (2016) Global geographic pat-
terns of sexual size dimorphism in birds: support for a lati-
tudinal trend? Ecography, 39, 17–25.
Friedman, N.R., Hofmann, C.M., Kondo, B. & Omland, K.E.
(2009) Correlated evolution of migration and sexual
dichromatism in the New World orioles (Icterus). Evolu-
tion, 63, 3269–3274.
Gardner, J.L., Trueman, J.W.H., Ebert, D., Joseph, L. &
Magrath, R.D. (2010) Phylogeny and evolution of the Meli-
phagoidea, the largest radiation of Australasian songbirds.
Molecular Phylogenetics and Evolution, 55, 1087–1102.
Gaston, K.J., Chown, S.L. & Evans, K.L. (2008) Ecogeograph-
ical rules: elements of a synthesis. Journal of Biogeography,
35, 483–500.
Gloger, C.L. (1833) Das Ab€andern der V€ogel durch Einfluss
des Klimas. August Schulz, Breslau.
Gomez, D. & Th�ery, M. (2007) Simultaneous crypsis and
conspicuousness in color patterns: comparative analysis of
a Neotropical rainforest bird community. The American
Naturalist, 169, S42–S61.
Gregory, P. (2016) Thornbills (Acanthizidae). Handbook of
the birds of the world (ed. by J. del Hoyo, A. Elliott, J. Sar-
gatal, D.A. Christie and E. de Juana). Lynx Edicions,
Barcelona.
Hall, B.P. (1974) Birds of the Harold Hall Australian expedi-
tions, 1962–1970: a report on the collections made for the
British Museum (Natural History). British Museum, London.
von Hardenberg, A. & Gonzalez-Voyer, A. (2013) Disentan-
gling evolutionary cause–effect relationships with phyloge-
netic confirmatory path analysis. Evolution, 67, 378–387.
Harmon, L.J., Weir, J.T., Brock, C.D., Glor, R.E. &
Challenger, W. (2008) GEIGER: investigating evolutionary
radiations. Bioinformatics, 24, 129–131.
Higgins, P.J. & Peter, J.M. (eds) (2001) Handbook of Austra-
lian, New Zealand, and Antarctic birds, Vol. 5: tyrant- fly-
catchers to chats. Oxford University Press, Melbourne.
N. R. Friedman and V. Reme�s
272 Global Ecology and Biogeography, 26, 261–274, VC 2016 John Wiley & Sons Ltd

Higgins, P.J. & Peter, J.M. (eds) (2002) Handbook of Austra-
lian, New Zealand, and Antarctic birds, Vol. 6: pardalotes to
shrike-thrushes. Oxford University Press, Melbourne.
Higgins, P., Christidis, L., Ford, H. & Bonan, A. (2016) Hon-
eyeaters (Meliphagidae). Handbook of the birds of the world
(ed. by J. del Hoyo, A. Elliott, J. Sargatal, D.A. Christie and
E. de Juana). Lynx Edicions, Barcelona.
Hijmans, R.J. (2015) raster: geographic data analysis and mod-
eling. R package version 2.3-40. Available at: http://CRAN.
R-project.org/package5raster
Hijmans, R.J., Cameron, S.E., Parra, J.L., Jones, P.G. & Jarvis,
A. (2005) Very high resolution interpolated climate surfa-
ces for global land areas. International Journal of Climatol-
ogy, 25, 1965–1978.
Hill, G.E. & McGraw, K.J. (2006a) Bird coloration, Vol. 1:
mechanisms and measurements. Harvard University Press,
Cambridge, MA.
Hill, G.E. & McGraw, K.J. (2006b) Bird coloration, Vol. 2:
function and evolution. Harvard University Press, Cam-
bridge, MA.
Hoekstra, H.E. (2006) Genetics, development and evolution
of adaptive pigmentation in vertebrates. Heredity, 97,
222–234.
Joseph, L., Toon, A., Ny�ari, A.S., Longmore, N.W., Rowe,
K.M.C., Haryoko, T., Trueman, J. & Gardner, J.L. (2014) A
new synthesis of the molecular systematics and biogeogra-
phy of honeyeaters (Passeriformes: Meliphagidae) high-
lights biogeographical and ecological complexity of a
spectacular avian radiation. Zoologica Scripta, 43, 235–248.
Kamilar, J.M. & Bradley, B.J. (2011) Interspecific variation in
primate coat colour supports Gloger’s rule. Journal of Bio-
geography, 38, 2270–2277.
Keast, A. (1968) Moult in birds of the Australian dry country
relative to rainfall and breeding. Journal of Zoology, 155,
185–200.
Keast, J.A. & Marshall, A.J. (1954) The influence of drought
and rainfall on reproduction in Australian desert birds. Pro-
ceedings of the Zoological Society of London, 124, 493–499.
Kriticos, D.J., Webber, B.L., Leriche, A., Ota, N., Macadam,
I., Bathols, J. & Scott, J.K. (2012) CliMond: global high
resolution historical and future scenario climate surfaces
for bioclimatic modelling. Methods in Ecology and Evolu-
tion, 3, 53–64.
Law, B., Mackowski, C., Schoer, L. & Tweedie, T. (2000)
Flowering phenology of myrtaceous trees and their relation
to climatic, environmental and disturbance variables in
northern New South Wales. Austral Ecology, 25, 160–178.
Lomolino, M.V., Riddle, B.R. & Brown, J.H. (2006) Biogeog-
raphy, 3rd edn. Sinauer Associates, Sunderland, MA.
Low, T. (2014) Where song began: Australia’s birds and how
they changed the world. Penguin Group Australia,
Melbourne.
McGilp, J.N. (1924) Seasonal influences on the breeding of
native birds. Emu, 24, 154.
Mac�ıas-Ord�o~nez, R., Machado, G. & Macedo, R.H. (2014)
Macroecology of sexual selection: large-scale influence of
climate on sexually selected traits. Sexual selection: perspec-
tives and models from the Neotropics (ed. by R.H. Macedo
and G. Machado), pp. 1–32. Academic Press, San Diego,
CA.
McNaught, M.K. & Owens, I.P.F. (2002) Interspecific varia-
tion in plumage colour among birds: species recognition
or light environment? Journal of Evolutionary Biology, 15,
505–514.
Maia, R., Eliason, C.M., Bitton, P.P., Doucet, S.M. &
Shawkey, M.D. (2013) pavo: an R package for the analysis,
visualization and organization of spectral data. Methods in
Ecology and Evolution, 4, 906–913.
Manceau, M., Dominigues, V.S., Mallarino, R. & Hoekstra,
H.E. (2011) The developmental role of agouti in color pat-
tern evolution. Science, 331, 1062–1065.
Morton, E.S. (1975) Ecological sources of selection on avian
sounds. The American Naturalist, 109, 17–34.
Mu, Q., Zhao, M. & Running, S.W. (2011) Improvements to
a MODIS global terrestrial evapotranspiration algorithm.
Remote Sensing of Environment, 115, 1781–1800.
Nightingale, J.M. & Phinn, S.R. (2003) Assessment of rela-
tionships between precipitation and satellite derives vegeta-
tion condition within South Australia. Australian
Geographical Studies, 41, 180–195.€Odeen, A. & Hastad, O. (2003) Complex distribution of avian
color vision systems revealed by sequencing the SWS1 opsin
from total DNA. Molecular Biology and Evolution, 20, 855–861.€Odeen, A. & Hastad, O. (2010) Pollinating birds differ in
spectral sensitivity. Journal of Comparative Physiology A,
196, 91–96.
Oksanen, J., Blanchet, F.G., Kindt, R., Legendre, P., Minchin,
P.R., O’hara, R.B., Simpson, G.L., Solymos, P., Stevens,
M.H.H. & Wagner, H. (2015) vegan: community ecology
package. R package version 2.3-0. Available at: http://CRAN.
R-project.org/package5vegan
Paradis, E. (2013) Molecular dating of phylogenies by likeli-
hood methods: a comparison of models and a new infor-
mation criterion. Molecular Phylogenetics and Evolution, 67,
436–444.
Podos, J. (2014) Signal selection and the evolution of vocal
mating signals: lessons from Neotropical songbirds. Sexual
selection: perspectives and models from the Neotropics (ed.
by R.H. Macedo and G. Machado), pp. 341–363. Academic
Press, San Diego, CA.
Reudink, M.W., McKellar, A.E., Marini, K.L.D., McArthur,
S.L., Marra, P.P. & Ratcliffe, L.M. (2014) Inter-annual vari-
ation in American redstart (Setophaga ruticilla) plumage
colour is associated with rainfall and temperature during
moult: an 11-year study. Oecologia, 178, 161–173.
Revell, L.J. (2012) phytools: an R package for phylogenetic
comparative biology (and other things). Methods in Ecology
and Evolution, 3, 217–223.
Running, S.W., Nemani, R.R., Heinsch, F.A., Zhao, M.,
Reeves, M. & Hashimoto, H. (2004) A continuous satellite-
derived measure of global terrestrial primary production.
BioScience, 54, 547.
Spatial gradients in plumage coloration
Global Ecology and Biogeography, 26, 261–274, VC 2016 John Wiley & Sons Ltd 273

Santana, S.E., Lynch Alfaro, J. & Alfaro, M.E. (2012) Adapt-
ive evolution of facial colour patterns in Neotropical pri-
mates. Proceedings of the Royal Society B: Biological
Sciences, 279, 2204–2211.
Serventy, D.L. & Marshall, A.J. (1957) Breeding periodicity in
Western Australian birds: with an account of unseasonal
nestings in 1953 and 1955. Emu, 57, 99–126.
Shultz, A.J. & Burns, K.J. (2013) Plumage evolution in relation
to light environment in a novel clade of Neotropical tanagers.
Molecular Phylogenetics and Evolution, 66, 112–125.
Stoddard, M.C. & Prum, R.O. (2008) Evolution of avian plu-
mage color in a tetrahedral color space: a phylogenetic
analysis of New World buntings. The American Naturalist,
171, 755–776.
Stoner, C.J., Caro, T.M. & Graham, C.M. (2003) Ecological
and behavioral correlates of coloration in artiodactyls: sys-
tematic analyses of conventional hypotheses. Behavioral
Ecology, 14, 823–840.
Tello, J.S. & Stevens, R.D. (2012) Can stochastic geographical
evolution re-create macroecological richness–environment
correlations? Global Ecology and Biogeography, 21, 212–223.
Th�ery, M. (2006) Effects of light environment on color com-
munication. Bird coloration, Vol. 1: mechanisms and meas-
urements (ed. by G.E. Hill and K.J. McGraw), pp.148–173.
Harvard University Press, Cambridge, MA.
Tucker, C.J., Pinzon, J. & Brown, M. & GIMMS/GSFC/NASA.
(2010) ISLSCP II GIMMS Monthly NDVI, 1981-2002.
ISLSCP initiative II collection (ed. by F.G. Hall, G. Collatz,
B. Meeson, S. Los, E. Brown de Colstoun and D. Landis).
Oak Ridge National Laboratory Distributed Active Archive
Center, Oak Ridge, TN.
Uy, J.A.C. & Endler, J.A. (2004) Modification of the visual
background increases the conspicuousness of golden-collared
manakin displays. Behavioral Ecology, 15, 1003–1010.
Warren, D.L., Cardillo, M., Rosauer, D.F. & Bolnick, D.I.
(2014) Mistaking geography for biology: inferring proc-
esses from species distributions. Trends in Ecology and Evo-
lution, 29, 572–580.
West, P.M. & Packer, C. (2002) Sexual selection, temperature,
and the lion’s mane. Science, 297, 1339–1343.
Wilczynski, W. & Ryan, M.J. (1999) Geographic variation in
animal communication systems. Geographic diversification
of behavior: an evolutionary perspective (ed. by S.A. Foster
and J. Endler), pp. 234–261. Oxford University Press,
Oxford.
Wilkie, S.E., Robinson, P.R., Cronin, T.W., Poopalasundaram,
S., Bowmaker, J.K. & Hunt, D.M. (2000) Spectral tuning of
avian violet- and ultraviolet-sensitive visual pigments. Bio-
chemistry, 39, 7895–7901.
Wilson, M.F. & Von Neumann, R.A. (1972) Why are Neo-
tropical birds more colorful than North American birds?
The Avicultural Magazine, 78, 141–147.
VanderWerf, E.A. (2012) Ecogeographic patterns of morpho-
logical variation in elepaios (Chasiempis spp.): Bergmann’s,
Allen’s, and Gloger’s rules in a microcosm. Ornithological
Monographs, 73, 1–34.
Verner, J. & Willson, M.F. (1966) The influence of habitats
on mating systems of North American passerine birds.
Ecology, 47, 143–147.
Vorobyev, M., Osorio, D., Bennett, A.T.D., Marshall, N.J. &
Cuthill, I.C. (1998) Tetrachromacy, oil droplets and bird
plumage colours. Journal of Comparative Physiology A, 183,
621–633.
Zink, R.M. & Remsen, J.V. (1986) Evolutionary processes and
patterns of geographic variation in birds. Current Ornithol-
ogy, 4, 1–69.
SUPPORTING INFORMATION
Additional supporting information may be found in the
online version of this article at the publisher’s web-site:
Figure S1 Illustration of feather patch locations measured in
this study.
Figure S2 Chloropleth maps of gridded data for measures of
overall ornamentation in Acanthizidae and Meliphagidae.
Figure S3 Chloropleth maps of gridded data for measures of
ornamental patch hue in Acanthizidae and Meliphagidae.
Figure S4 Chloropleth maps of gridded data for measures of
plumage brightness in Acanthizidae and Meliphagidae.
Table S1 Jointly estimated phylogenetic and spatial
correction parameters for phylogenetic least squares models
comparing colour variables with environmental variables.
Table S2 Maximum likelihood values for phylogenetic and
spatial signal parameters optimized simultaneously for
response and predictor variables.
BIOSKETCHES
Nicholas R. Friedman is a post-doctoral fellow at the
Okinawa Institute of Science and Technology. His
research focuses on the history of trait evolution in
birds, the proximate mechanisms underlying this his-
tory and the ways that behaviour and ecology shape it.
Vladim�ır Reme�s is an associate professor of zoology at
Palack�y University in Olomouc. His research focuses
on the evolutionary ecology of birds, especially on
large spatial and temporal scales. More information is
available at http://www.zoologie.upol.cz/remes.
Editor: Maria Dornelas
N. R. Friedman and V. Reme�s
274 Global Ecology and Biogeography, 26, 261–274, VC 2016 John Wiley & Sons Ltd
Related Documents