ECO-DRIVING FOR TRANSIT April 2016 A White Paper from the National Center for Sustainable Transportation Yanzhi Ann Xu, Hanyan Ann Li, Haobing Liu, Michael O. Rodgers, and Randall Guensler Georgia Institute of Technology, School of Civil and Environmental Engineering

Welcome message from author
This document is posted to help you gain knowledge. Please leave a comment to let me know what you think about it! Share it to your friends and learn new things together.
Transcript
ECO-DRIVINGFORTRANSIT
April2016 AWhitePaperfromtheNationalCenterforSustainableTransportation
YanzhiAnnXu,HanyanAnnLi,HaobingLiu,MichaelO.Rodgers,andRandallGuensler
GeorgiaInstituteofTechnology,SchoolofCivilandEnvironmentalEngineering

AbouttheNationalCenterforSustainableTransportationTheNationalCenterforSustainableTransportationisaconsortiumofleadinguniversitiescommittedtoadvancinganenvironmentallysustainabletransportationsystemthroughcutting-edgeresearch,directpolicyengagement,andeducationofourfutureleaders.Consortiummembersinclude:UniversityofCalifornia,Davis;UniversityofCalifornia,Riverside;UniversityofSouthernCalifornia;CaliforniaStateUniversity,LongBeach;GeorgiaInstituteofTechnology;andUniversityofVermont.Moreinformationcanbefoundat:ncst.ucdavis.edu.DisclaimerThecontentsofthisreportreflecttheviewsoftheauthors,whoareresponsibleforthefactsandtheaccuracyoftheinformationpresentedherein.ThisdocumentisdisseminatedunderthesponsorshipoftheUnitedStatesDepartmentofTransportation’sUniversityTransportationCentersprogram,intheinterestofinformationexchange.TheU.S.Governmentassumesnoliabilityforthecontentsorusethereof.NordoesthecontentnecessarilyreflecttheofficialviewsorpoliciesoftheU.S.Government.Thisreportdoesnotconstituteastandard,specification,orregulation.AcknowledgmentsThisstudywasfundedbyagrantfromtheNationalCenterforSustainableTransportation(NCST),supportedbyUSDOTthroughtheUniversityTransportationCentersprogram.TheauthorwouldliketothanktheNCSTandUSDOTfortheirsupportofuniversity-basedresearchintransportation,andespeciallyforthefundingprovidedinsupportofthisproject.TheauthorswouldliketothankreviewersattheCaliforniaAirResourcesBoard,GeorgiaRegionalTransportationAuthority,andPedalLogicLPforprovidingcommentsonpreliminaryversionsofthiswhitepaper.

Eco-DrivingforTransitANationalCenterforSustainableTransportationWhitePaper
April2016
Yanzhi(Ann)Xu,GeorgiaInstituteofTechnology,SchoolofCivilandEnvironmentalEngineering
Hanyan(Ann)Li,GeorgiaInstituteofTechnology,SchoolofCivilandEnvironmentalEngineering
HaobingLiu,GeorgiaInstituteofTechnology,SchoolofCivilandEnvironmentalEngineering
MichaelO.Rodgers,GeorgiaInstituteofTechnology,SchoolofCivilandEnvironmentalEngineering
RandallGuensler,GeorgiaInstituteofTechnology,SchoolofCivilandEnvironmentalEngineering

[pageleftintentionallyblank]

i
TABLEOFCONTENTSEXECUTIVESUMMARY....................................................................................................................ii
Introduction....................................................................................................................................1
LiteratureReview...........................................................................................................................3
Data................................................................................................................................................7
Methodology..................................................................................................................................8
Eco-drivingCycleDevelopment..................................................................................................9
ImplementationofEco-drivingCycleModification..................................................................12
FuelandEmissionsAnalysis.....................................................................................................17
Results..........................................................................................................................................20
Eco-drivingScenario.................................................................................................................20
CNGFleetPurchaseScenario...................................................................................................22
Eco-drivingwithCNGFleetPurchaseScenario........................................................................23
OverallComparisonandDiscussion.........................................................................................24
Conclusions...................................................................................................................................29
AppendixI.....................................................................................................................................31
KalmanFiltering........................................................................................................................31
SplineDataInfillProcess..........................................................................................................31
GISNetworkMapping..............................................................................................................32
Engine-offIdentification...........................................................................................................33
BreakingGPSDataintoTripsforEco-DrivingAnalysis.............................................................35
DataProcessingResults............................................................................................................35
AppendixII....................................................................................................................................40
AppendixIII...................................................................................................................................42
References....................................................................................................................................44

ii
Eco-drivingforTransit
EXECUTIVESUMMARYEco-drivinghassignificantpotentialtoreducefuelconsumptionandemissionsfromtransitoperations.Analyseswereconductedof68thousandmilesofreal-worldoperationsdatafrom26buses,collectedfromlocaltransitserviceprovidedbytheMetropolitanAtlantaRapidTransitAuthority(MARTA),andexpressbusserviceprovidedbytheGeorgiaRegionalTransportationAuthority(GRTA).Theanalysisutilizedsecond-by-secondoperationsdatacollectedviaglobalpositioningsystem(GPS)devicesfrombusesoperatedbythesetransitagencies.Theresearcherssimulatedtheimplementationoftransiteco-drivingstrategies,basedonthemodalemissionsmodelingframeworkemployedbytheMOtorVehicleEmissionSimulator(MOVES)designedtoreduceengineloadandemissions.Thisalgorithmseekstominimizefuelconsumptionbylimitinginstantaneousvehiclespecificpower(VSP),whilemaintainingaveragespeedandconservingtotaldistance.Fuelconsumptionandfuel-cycleemissionswerecomparedacrossthemonitoreddrivingcyclesandtheirmodifiedeco-drivingcycles.Thesavingsfromeco-drivingwerealsocomparedagainstexpectedfuelandemissionsreductionsviaconversionofthetransitfleetstocompressednaturalgas(CNG),whichisanotherpopularfuelconservationstrategy.Thetransiteco-drivingstrategyshoweda5%reductioninfuelconsumptionandfuelcyclegreenhousegas(GHG)emissionsforMARTA’s508-busfleet(~35%diesel/65%CNG),anda7%reductioninfuelconsumptionforGRTA’s166-busdieselfleet.Thefuelsavingstranslatetoabout300,000gallonsofdieselfuelequivalentperyearforMARTAand55,000gallonsofdieselperyearforGRTA.Eco-drivingwasalsoshowntoreducefueluseandemissionsforCNGfleets.Eco-drivingtrainingcanreadilybeimplementedifspeed/accelerationactivityismonitored.Becauseeco-drivingdoesnotrequiresignificantcapitalinvestmentitisapotentiallyverycost-effectivestrategyforlocalandexpressbustransitoperations.

1
IntroductionTransitagenciesarealwaysseekingopportunitiestoconservefuel(whichtypicallyprovidessimultaneousemissionsreductions)toloweroperatingcosts.Strategiesrangefrommakingwisenewvehiclepurchasedecisions,suchasalternativepropulsion/fuelbuses,tomakingoperationalimprovements,suchasimplementinganti-idlepoliciesandeco-drivingtraining.Eachemissionsreductionalternativeoffersdifferentreturn-on-investment(ROI),dependinguponthelocalconditionsandoperationalcharacteristicsofeachagency.Furthercomplicatingtheevaluationisthefactthatemissionsreductionsfromstrategiesarenotnecessarilyadditive.Inselectingasetofemissionsreductionstrategiestoimplement,transitagenciesneedtoevaluatemultipleoptionssimultaneously,underagency-specificoperatingcharacteristics.Thispaperfocusesontransitfuelandemissionssavingsfromeco-drivingfortwotransitagencies.Theanalysesinthisreportarebaseduponreal-worldoperationsdatacollectedfromtheMetropolitanAtlantaRapidTransitAuthority(MARTA),alocaltransitagency,andtheGeorgiaRegionalTransportationAuthority(GRTA),whichprovidesregionalexpressbusservices.Thepotentialreductionsinfuelconsumptionarederivedfromoperationalimprovementsachievedthroughdriverbehaviormodification,predominantlylimitingvehicleaccelerationratesandtopspeeds.Thepotentialbenefitsarequantifiedusinganeweco-drivingalgorithmdevelopedforthisproject.Theanalysesextendbeyondfuelconsumptionandtailpipeemissions.Anyreductioninfuelconsumptionatthevehiclealsoreducesfuelconsumptionandemissionsalongtheentirefuelchain:harvestingfuelfeedstocks,refiningandprocessingthefeedstocksintofuels,anddistributingthefuels.Theanalysesthatfollowwillreport“pump-to-wheel”(occurringatthevehicle)fuelconsumption,greenhousegas(GHG)emissions,andcriteriapollutantemissionsand“well-to-wheel”GHGandcriteriaairpollutantemissions(associatedwiththeentirefuelchain).Inadditiontooperationalimprovements,suchaseco-driving,transitagencieshavealsoshownincreasinginterestinthedeploymentofalternativefuelbusesasastrategytolowertotalfuelcosts(TCRP,2010).Compressednaturalgas(CNG)isaparticularlypopularchoiceofalternativefuel,especiallyinlightofrecentdecreasesinCNGpricesduetoincreasedfrackingactivity.Asof2014,morethan10,000busesintheUnitedStatesarerunningonCNG,comparedtoabout4,000hybriddieselbuses(NationalTransitDatabase,2014).Therefore,thisprojectevaluateseco-drivingasastand-alonestrategy,butthesavingsfromeco-drivingisalsoputintoperspectivebyindependentlyandsimultaneouslyevaluatingfuelandemissionssavingsfromconvertingtheexitingfleetstoCNG.Thepaperfirstprovidesaliteraturereviewoneco-driving,asafuelconsumptionandemissionscontrolstrategyfortransitoperations.Thecollectionofthedataemployedinthisstudyisthendescribedandsummarystatisticsofthedataarepresented.Thedevelopmentoftheeco-drivingalgorithmusedintheanalysisofpotentialbenefitsisthenoutlined.Thisalgorithmwouldbeusedtotraindriversandassesstheironroadperformanceofeco-drivinginterventions
2
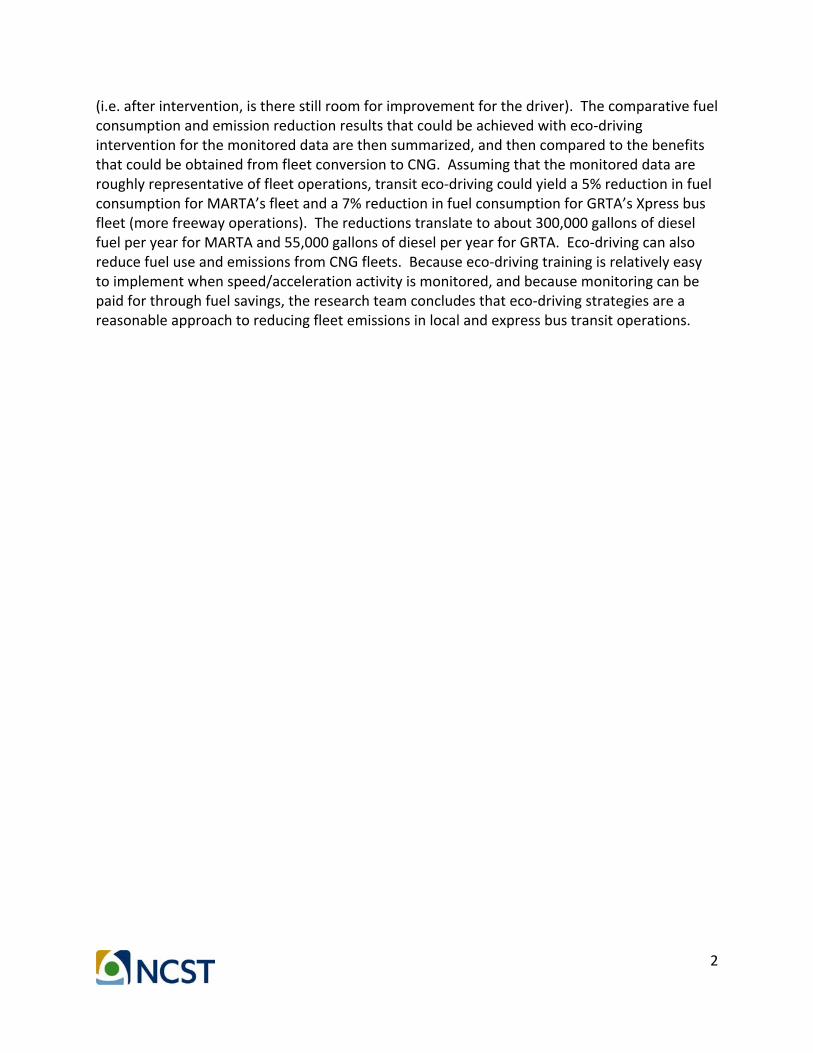
(i.e.afterintervention,istherestillroomforimprovementforthedriver).Thecomparativefuelconsumptionandemissionreductionresultsthatcouldbeachievedwitheco-drivinginterventionforthemonitoreddataarethensummarized,andthencomparedtothebenefitsthatcouldbeobtainedfromfleetconversiontoCNG.Assumingthatthemonitoreddataareroughlyrepresentativeoffleetoperations,transiteco-drivingcouldyielda5%reductioninfuelconsumptionforMARTA’sfleetanda7%reductioninfuelconsumptionforGRTA’sXpressbusfleet(morefreewayoperations).Thereductionstranslatetoabout300,000gallonsofdieselfuelperyearforMARTAand55,000gallonsofdieselperyearforGRTA.Eco-drivingcanalsoreducefueluseandemissionsfromCNGfleets.Becauseeco-drivingtrainingisrelativelyeasytoimplementwhenspeed/accelerationactivityismonitored,andbecausemonitoringcanbepaidforthroughfuelsavings,theresearchteamconcludesthateco-drivingstrategiesareareasonableapproachtoreducingfleetemissionsinlocalandexpressbustransitoperations.

3
LiteratureReviewEco-drivingtrainingiswell-knownasafeasiblestrategytodecreasefuelconsumptionandemissions.Itisgenerallyacceptedthateco-drivingencompassesthefollowingdrivingtactics(IntelligentEnergyEurope,2013):anticipatingtraffic,limitinghighspeedoperations,avoidinghardacceleration,shiftingtothehighestavailablegearrpmwillallow,maintainingasteadyspeed,andlimitingidling.Existingstudieshaveevaluatedthebenefitsofeco-drivingthroughreal-worldimplementation,throughsimulatedvehicleactivitydata,orthroughacombinationofboth.Inreal-worldimplementations,theobservedfuelsavingsrangefrom2%to14%(BarthandBoriboonsomsin,2009;Beusen,etal.,2009;Dib,etal.,2014;Ho,etal.,2015;Rutty,etal.,2013;StrömbergandKarlsson,2013;TransportCanada,2004;Wåhlberg,2007;Zarkadoula,etal.,2007).Inaddition,Rolim,etal.(2014)reportedthatdriverswithinstantin-cabvoicefeedbackshowedmuchmorereductionsinhardaccelerationscomparedtodriverswhoonlyreceivedin-classeco-drivingtraining,althoughtheactualfuelsavingsfromthesetwoeco-drivingstrategiescomparedtoabaselineconditionwasnotreported.Estimatedeco-drivingbenefitsthroughsimulatedvehicledataexhibithighervariabilitythanthebenefitsobservedinreal-worldimplementation,rangingfrom8%toabout35%infuelsavingsandCO2reduction(BarthandBoriboonsomsin,2009;Mensing,etal.,2014;QianandChung,2011;SuzdalevaandNagy,2011).Eco-drivingstudiesbasedonsimulationshavedevisedarangeofdrivingstrategiestorepresenttheimplementationofeco-drivingobjectives.Inmoststudies,eco-drivingstrategiesarerealizedthroughmodifyingvehiclespeedand/oracceleration.BarthandBoriboonsomsin(2009)devisedadynamiceco-drivingsystemthroughwhichdriversareprovidedwithsuggestedspeedsbasedonaveragetrafficspeedandlevel-of-service(LOS)forthefreewaysectiononwhichthevehiclewasoperating.Mensing,etal.(2013)createdanumericalmodelofthevelocitytrajectoryofavehicleoperatingaccordingtoeco-drivingprinciplesandreal-lifetrafficconstraints.Usingsimulatedtrafficdata,QianandChung(2011)evaluatedfuelconsumptionandCO2emissionsofeco-drivingbyreducingthemaximumaccelerationratesby10%and20%insimulation.SuzdalevaandNagy(2011)developedadata-basedBayesianapproachtoidentifyandmodifythespeedtooptimizefuelconsumptionforconventionalvehicles.However,allofthesealgorithmsweredesignedforlight-dutyvehicles.Table1summarizestheresultsfromthevarietyofstudiesidentifiedandreviewedinthisresearcheffort.

4
Table1.SummaryofEco-DrivingBenefitResearch
Source VehicleType
BeforeData
AfterData Methodology TimeScope FuelSavings/CO2Reduction
/PollutantReduction
BarthandBoriboonsomsin,2009
Light-dutyvehicles
Real-worldvehicleactivitydata
Simulatedvehicleactivitydataandreal-worldvehicleactivitydata
Staticrecommendedspeedtodrivers;Simulationmodelingtoolsandreal-worldvehicleexperimentation
3probevehiclesonfreewaysSeptember2005,May2006,andMarch2007
Fuelsavings:13%(real-world),37%(simulated)CO2
reduction:12%(real-world),-35%(simulated)Savingsdependoncongestion
Beusen,etal.,2009
Light-dutyvehicles
Real-worldvehicleactivitydata
Real-worldvehicleactivitydata
Four-hourtraining;10drivers;Atleast100kmofdrivingpermonth
Twomonthsofdatacollection:10monthsfor10driversduringreal-lifeconditions,monitoredweekly
Fuelsaving:5.8%withlargedifferencesbetweenindividuals
Dib,etal.,2014 EV
Real-worldvehicleactivitydata
Real-worldvehicleactivitydata
ParticipantsdroveEVinfixedroute.Energycomparisonweremadebeforeandafterecotraining
N/A Fuelsavings:14%forEV
Ho,etal.,2015
Light-dutyvehicles
Real-worldvehicleactivitydata
Real-worldvehicleactivitydata
116participants;Classroomtraining
Pre-testofdrivers;30to45mintrainingsessions;Re-testdriversrightaftertraining
Fuelsavingandcarbonemissions:inexcessof10%
Mensing,etal.,2014
Light-dutyvehicles
Simulatedvehicleactivitydata
Simulatedvehicleactivitydatabasedontheoptimizationmethod
Simulatingaconventionalpassengervehicle;Applyingoptimizationmethodstoachieveecologicallyandeconomicallyoptimalvehicleoperations
N/A
EconomiccycleFuelsaving:2.5L/100kmCO2
reduction:31.9%NOXreduction:16.4%
EcologiccycleFuelsaving:2.3L/100kmCO2
reduction:26.8%NOXreduction:54.5%

5
Source VehicleType
BeforeData
AfterData Methodology TimeScope FuelSavings/CO2Reduction
/PollutantReductionHCreduction:7.4%
QianandChung,2011
Light-dutyvehicles
Simulatedvehicleactivitydata
Simulatedvehicleactivitydata
Trafficmicro-simulationmodel;Differenttrafficcondition,penetrationratesofeco-drivers,andaccelerationrates
N/A
Scenariosofheavycongestionand25%penetrationimpactstrafficandenvironmentalperformancenegatively;Moderateandsmoothaccelerationsaves11%fuelwithoutmajorincreaseintraveltime
Rutty,etal.,2013
Light-dutyvehicles
Real-worldvehicleactivitydata
Real-worldvehicleactivitydata
11gasolinevehicles,4hybridvehicles;40kmperdayGoal-directedfeedback
Post-trainingdatacollection:1monthTraining:1monthPost-trainingdatacollection:1month
Fuelsavings:0.48Lpergasolinevehicleperday;0.3LperhybridvehicleperdayCO2
reduction:1.1kgpergasolinevehicleperday;0.6kgperhybridvehicleperday.Baselinedatanotreported
StrömbergandKarlsson,2013 Buses
Real-worldvehicleactivitydata
Real-worldvehicleactivitydata
54busdrivers,dividedinto3groups:control,eco-drivingfeedbackonly,andeco-drivingfeedbacksupplementedwithtraining
Baseline:3weeksTestperiod:3weeks
6.8%reductioninfuelconsumptionbetweentheeco-drivinggroupsandcontrolgroup;nosignificantdifferencebetweenthetwoeco-drivinggroups
SuzdalevaandNagy,2011
Light-dutyvehicles
Real-worldvehicleactivitydata
Simulatedvehicleactivitydata
Bayesianapproachtoidentifyandmodifythespeedinordertooptimizefuelconsumption
N/A Fuelsavings:8.2%overall
TransportCanada,2004
Light-dutyvehicles
Real-worldvehicleactivitydata
Real-worldvehicleactivitydata
Approximately1,000corporateemployeeswereidentified;Training,2-hourclassroomand2-houron-road
Pre-testofdrivers;4-hourtraining;Re-testdriversafteroneyear
Fuelsavings:5.5%overall
Wåhlberg,2007 Buses Real-worldvehicleactivity
Real-worldvehicleactivity
Phase1:practicaleco-drivingtraining;247trained 2000to2003
Trainingprovided2%fuelreduction;

6
Source VehicleType
BeforeData
AfterData Methodology TimeScope FuelSavings/CO2Reduction
/PollutantReductiondata data driversvs.147untrained
drivers;Phase2:28buseswereequippedwithfeedbackdevices
feedbackprovidedanother2%fuelreduction
Zarkadoula,etal.,2007 Buses
Real-worldvehicleactivitydata
Real-worldvehicleactivitydata
3drivers,2buses;Fixed15kmrouteTrainingseminar
Pre-training1.5months;Post-training2months
Fuelsavings:10.2%duringtraining,4.35%inactualcondition

7
DataToevaluatethepotentialemissionsandfuelconsumptionsassociatedwitheco-drivingfortransitoperationsintheAtlantametropolitanarea,second-by-secondtransitoperationsdatawerecollectedfromlocaltransitoperationsandregionalexpressbuses.Forlocaltransitoperations,MetropolitanAtlantaRapidTransitAuthority(MARTA)operationsdatawerecollectedon13busesfor381days(June28,2004toOct24,2005)usingtheGeorgiaTech(GT)TripDataCollector(Ogle,etal.,2006).Forexpressbuses,datawerecollectedviaspotsampling(typicallytwotothreedaydeploymentsbetweenAugust6,2013andMarch3,2014).QstarzBT-Q1000eXGPSloggersweretemporarilyinstalledonGeorgiaRegionalTransportationAuthority(GRTA)expressbusesinthissamplingeffort.Inall,second-by-secondreal-worldtransitoperationsdatawerecollectedformorethan68thousandmilesfromfrom26buses.TheGPSdataunderwentqualityassurance/qualitycontrol(QA/QC)andpostprocessingbeforebeingusedintheanalyses.First,aninitialscreeningwasperformedtoremovetripsshorterthanone-minuteanddatapointswithinvalidlatitudeandlongitudeinformation.Second,speedvaluesweretreatedwithaKalmanfilteralgorithmtoreplacelow-validityGPSspeeds(typicallyatlowspeedsandinurbanstreetcanyons)withlocation-inferredspeed,usingasplinealgorithmtofillindatagaps.Afterthesedataprocessingsteps,thedatawereoverlaidonbaseGISmapstoidentifythetypeoffacility(i.e.freeway,non-freeway,oroff-network)onwhichabuswasoperatingforeachsecondofthedrivingrecord.Distinguishingbetweenfreewayfromnon-freewayoperationsisanimportantstepforsubsequentanalysisbecausetheeco-drivingstrategiesforfreewaysandnon-freewaysdiffersubstantially.Theonroadandoff-networkdistinctionisusedtoidentifyandeliminateextendedidle.BecauseneithertheGTTripDataCollectornortheQstarzGPSloggershadtheabilitytodetectwhethertheenginewason,whichwouldrequireanoilpressuresensor(Xu,etal.,2013a)oron-boarddiagnostics(OBD)connection,therewasnofeasiblewaytodeterminewhetherabuswasidlingwhenthespeedvalueswerenearzero.Assuch,theteamelectedtoignorethepotentialbenefitsofidlereductioninthispaper.Somejurisdictionsassumethatbusesshouldnotidleformorethan10minutesonroad,andshouldnotidleformorethan30secondsoff-network.DifferentidlespeedcutpointsaresetforMARTAandGRTAoperationsgiventhedifferencesindeviceprecisionlevels(Xu,etal.,2013b).Nevertheless,idlereductionisanotherviablestrategythatcanbeimplmenetedtoreduceemissions(Shancita,etal.,2014;Xu,etal.,2013a).Finally,tripfilesrecordedbythedatacollectiondeviceswerebrokenintotripsegments,separatedbygapsindataattripends,andwheregapsresultedfrommissingdata.Onlythosetripsegmentslongerthan30secondswithanaveragespeedof5milesperhour(mph)orgreaterwereretainedforsubsequenteco-drivinganalysis.Table2summarizesthefinalanalyticaldataset.Step-by-stepdescriptionsofthedataprocessingproceduresareprovidedinAppendixI.
8
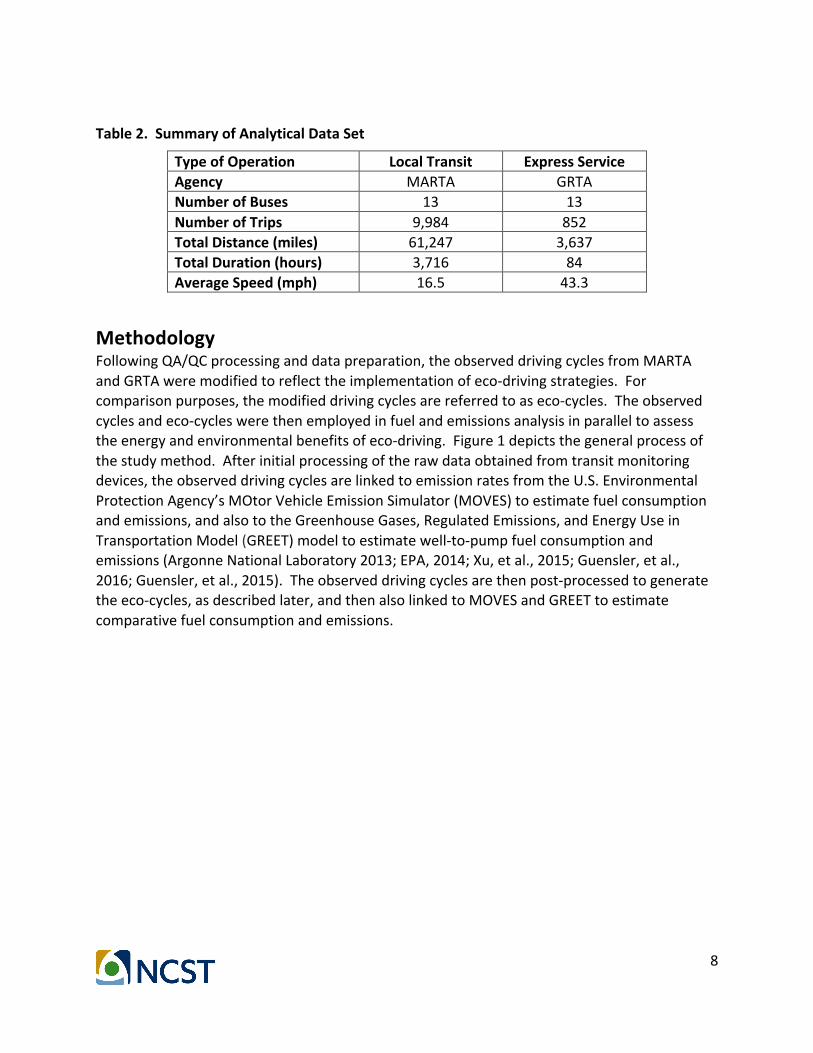
Table2.SummaryofAnalyticalDataSet
TypeofOperation LocalTransit ExpressServiceAgency MARTA GRTANumberofBuses 13 13NumberofTrips 9,984 852TotalDistance(miles) 61,247 3,637TotalDuration(hours) 3,716 84AverageSpeed(mph) 16.5 43.3
MethodologyFollowingQA/QCprocessinganddatapreparation,theobserveddrivingcyclesfromMARTAandGRTAweremodifiedtoreflecttheimplementationofeco-drivingstrategies.Forcomparisonpurposes,themodifieddrivingcyclesarereferredtoaseco-cycles.Theobservedcyclesandeco-cycleswerethenemployedinfuelandemissionsanalysisinparalleltoassesstheenergyandenvironmentalbenefitsofeco-driving.Figure1depictsthegeneralprocessofthestudymethod.Afterinitialprocessingoftherawdataobtainedfromtransitmonitoringdevices,theobserveddrivingcyclesarelinkedtoemissionratesfromtheU.S.EnvironmentalProtectionAgency’sMOtorVehicleEmissionSimulator(MOVES)toestimatefuelconsumptionandemissions,andalsototheGreenhouseGases,RegulatedEmissions,andEnergyUseinTransportationModel(GREET)modeltoestimatewell-to-pumpfuelconsumptionandemissions(ArgonneNationalLaboratory2013;EPA,2014;Xu,etal.,2015;Guensler,etal.,2016;Guensler,etal.,2015).Theobserveddrivingcyclesarethenpost-processedtogeneratetheeco-cycles,asdescribedlater,andthenalsolinkedtoMOVESandGREETtoestimatecomparativefuelconsumptionandemissions.

9
Figure1.MethodologyFlowChart
Eco-drivingCycleDevelopmentThebasicapproachtoeco-drivingistolimitenginepowerdemandsoastoconservefuelandreduceemissions.Powerdemandisanon-linearfunctionofspeedandacceleration;hence,managingengineloadistypicallyaccomplishedbymanagingtopspeeds(forwindresistance)andaccelerationrates(forallloadparameters).Engineloadisalsohighduringluggingoperations(accelerationfromthestopline),sominimizingstopandgoactivityisagoalofeco-driving.However,becauseengineloadinvolvestheproductofspeedandacceleration,itisevenmoreimportanttoensurethathardaccelerationconditionsdonotoccuratmoderateandhighspeedoperations.Asindicatedintheliteraturereview,avarietyofemissionratemodelshavebeendevelopedtopredictemissionsfromheavy-dutyvehicleoperations.Modelsthatpredictemissionsasafunctionofoperatingmode(speed/accelerationconditions)arecommonlyknownas“modalmodels.”Thesemodalmodelsrangefromhigh-resolutionengineloadmodelsthatpredictsecond-by-secondemissionsasafunctionofpredictedinstantaneousengineload(Barth,etal.,1996;Feng,etal.,2007;Guensler,etal.,2005),tomodelsthatpredictsecond-by-secondemissionrates(oraverageemissionratesforaroadway)asafunctionofsomesurrogateforengineload.Thewiderangeinpotentialbenefitseco-drivingnotedintheliteraturearisesinpartfromtheapplicationofawiderangeofmodelingapproaches.Theeco-drivingstrategy(i.e.optimalchangeindrivingcycletoachieveemissionsreductions)isthereforeadirectfunctionofthemodelemployedintheanalysis.Theeco-drivinganalysesreportedinthisstudyemploythemodalemissionsmodelingframeworkintheU.S.EPA’sMOVESmodel.TheMOVESmodelusesscaledtractivepower(STP)asasurrogateforengineload,whereSTPisafunctionofvehiclespeed,acceleration,andvehiclemass.MOVESemploysabinningapproach,suchthathigherSTPvalueswithinspecific

10
operatingspeedbinsarelinkedtohigherfuelconsumption,CO2emissions,andcriteriapollutantemissions.Figure2presentsthefuelrateformodelyear(MY)2010transitbusesofeachoperatingmodebin(definedbyspeedandSTPranges)extractedfromMOVES.HighspeedsandhardaccelerationsatmoderateorhighspeedspushtheonroadactivityintohigherSTPvaluesandyieldhigherfuelconsumptionandemissions.Indevelopingthestrategytogenerateeco-cyclesforusewithMOVES,thegoalistomodifyeachvehicle’strajectorytominimizeactivityinhigherSTPbins,whilepreservingaveragespeedandtotaldistance.
Figure2.FuelRate(MJ/h)foreachOperatingModeBinfor2010MYTransitBuses(MOVES2014Output)
ThisstudyproposesanewmethodforoptimizingeachvehicletrajectoriesbaseduponthestructureoftheMOVESSTPoperatingmodebins.Themethodologyconservescycledistance,maintainsoverallaveragespeed,butpreventsinstantaneousSTPfromincreasingsignificantlybysettingaccelerationlimitswithineachMOVESspeedgrouping.STPiscalculatedas:
𝑆𝑇𝑃 = !!𝑣 + !
!𝑣! + !
!𝑣! + !
!𝑎𝑐𝑐 + 𝑔 ∗ sin𝜃 𝑣(1)
0 1000 2000 3000 4000 5000 6000
Brake Idle
STP <0 STP 0-3 STP 3-6 STP 6-9
STP 9-12 STP ≥12 STP <0
STP 0-3 STP 3-6 STP 6-9
STP 9-12 STP 12-18 STP 18-24 STP 24-30
STP ≥30 STP <6
STP 6-12 STP 12-18 STP 18-24 STP 24-30
STP ≥30
Spee
d 1-
25 m
ph
Spee
d 25
-50
mph
Sp
eed ≥5
0 m
ph
FuelRate(MJ/h)

11
where:A=therollingresistancecoefficient(kWs/m)B=therotationalresistancecoefficient(kWs2/m2)C=theaerodynamicdragcoefficient(kWs3/m3)m=vehiclemass(metrictonnes)M=fixedmassfactor(unitless)v=instantaneousvehiclevelocityattimet(m/s)a=instantaneousvehicleacceleration(m/s2)g=gravitationalaccelerationwiththevalue9.8(m/s2)θ=roadgrade(radiansordegrees,asrequiredbythesincalculationalgorithm)
A,B,C,andMarefixedparametersforeachvehicletypemodeledinMOVES.Thevaluescanbefoundin“sourceusetype”tableintheMOVESdatabase(providedinAppendixII).Forsimplification,alloftheanalysesinthisreportassumezeroroadgrade(sin𝜃 = 0).STPincreasesmonotonicallywithspeedandacceleration.Thefirststepintheeco-drivingprocessistosetaSTPlimitvalue(STPL).Foreachspeed𝑣,theaccelerationlimitaccLthatpreventSTPfromexceedingSTPLis:
𝑎𝑐𝑐! =!"#!!!"
− !!
− !!
𝑣 − !!
𝑣! (2)FromtheMOVESoperatingmodeclassification,eachspeedlevelincludesdifferentSTPlevels.BasedtheSTPcategories(seeTable11),wecansetSTPLtodifferentlevels:STPL-1=30,STPL-2=24,STPL-3=18,STPL-4=12,STPL-5=9,STPL-6=6,andSTPL-7=3.FromSTPL-1toSTPL-7,foragivenspeed,theaccelerationlimitbecomesmorestringent,asillustratedinFigure3.

12
Figure3.AccelerationLimitforeachSpeedLevelateachSTPLimitLevel
TheprincipleofthecomputationalmethodistoreadeachsecondofvehicleactivityandadjusttheaccelerationratedownwardwhentheSTPreachesorexceedstheSTPL.TheaccelerationrateisadjusteddownwardenoughtolowertheSTPofthenextdatapointtothemedianvalueoftheSTPrangethatmeetstheSTPlimit.Forexample,iftheSTPlimitissetasSTPL-4=12,whenSTPreachesorexceeds12,theaccelerationwillbeadjusteddownwarduntilthecalculatedSTPforthatdatapointequals10.5(themedianSTPvalueforthe9to12STPbin,whichmeetstheSTPL).ItisimportanttosetappropriateSTPlimitsbydrivingcycle.Iftherulesaretoolenient,theruleswillnotsignificantlyfuelconsumptionandemissions.However,iftherulesaretoostringent,theaveragespeedofthetracewillbesignificantlylower,whichmaybedifficultfordriverstoaccept.Furthermore,areductioninaveragespeedleadstoincreaseddrivingtime,offsettingsomeofthefuelandemissionssavings.Inthisstudy,theresearchteamestablisheddifferentSTPlimitsbyroadtypeandspeedafteriterativetesting.TheresultingSTPlimitsaresummarizedinTable3.
Table3.STPLimitsforLocalRoadsandFreewaysEmployedinThisAnalysis
RoadType SpeedLevel STPLimit
LocalRoad0~25mph <=625~50mph <=6>=50mph <=6
Freeway0~25mph <=625~50mph <=9>=50mph <=12
ImplementationofEco-drivingCycleModificationToimplementtheeco-drivingstrategy,threeiterativestepsappliedtoeachvehicletrajectory:
1 MaintainingStatusQuo:WhentheSTPoforiginalcycledoesn’treachorexceedSTPL,nomodificationofthecycleisrequired.Thenextdatapointintheeco-cycleisthesameasthedatapointfromtheoriginalcycle.
2 Smoothing:WhentheSTPoforiginalcyclereachesorexceedstheSTPL,theacceleration
rateisadjusteddownwardsuchthattheresultingSTPforthedatapointequalsthemedianvaluefortheSTPbinthatdoesnotexceedtheSTPlimit.Becausetheaccelerationratedecreases,thespeedofthenextdatapointintheeco-cyclewillbeslightlylowerthanthespeedforthatpointintheoriginalcycle.TheaccelerationratesforsubsequentpointsinthecyclearealsosettoachievethemedianSTPvalueforthat

13
STPbin.Smoothingofaccelerationcontinuesuntilthespeedofeco-cyclematchesthatoftheoriginalcycle.
3 ConservationofDistance:Oncethespeedofeco-cycleandoriginalcyclealign,the
distancecoveredbytheeco-cycleislessthanthatoftheoriginalcycle(duetotheimplementationofloweraccelerationrates).Toconservedistancetraveled,theeco-cyclecruisespeedisextendeduntilthedistancetraversedbytheeco-cyclematchesthatoftheoriginalcycle.Thisstepassumesthatthevehicleisnotlimitedbythepresenceofaslower-movingvehicleinitspath.
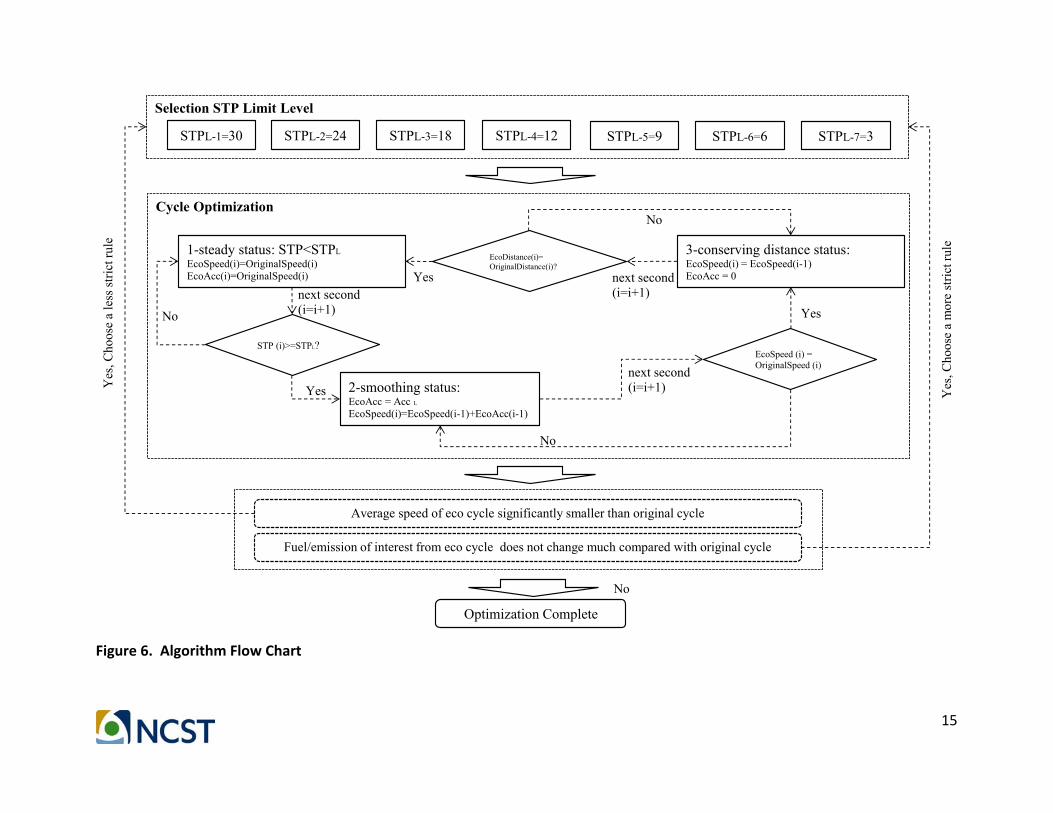
Figure4illustratestheresultsofthethreestepsappliedtoshortdrivingcycle.Inthisfigure,theinitialtrajectoriesofecoandoriginalcycleareexactlythesame(statusquo)becausetheearlyportionofthecycledoesnotexceedSTPL.OncetheSTPLisexceeded,smoothingbeginsandtheaccelerationratesoftheeco-cycleissetlowerthanthoseobserved.Smoothingisnormallyfollowedconservationofdistancetoensurethatthevehicletraversesthesamedistanceintheeco-cycleasintheobservedcycle.Anexampleofanobservedcycleanditscorrespondingeco-cycleispresentedinFigure5.Themodifiedeco-cyclesmoothedthesharpacceleration,especiallyduringhighspeedoperations.Figure6providesthefullflowchartdescribingtheimplementationoftheeco-drivingalgorithmanditerationprocesses.
Figure4.Eco-cycleExample
0
20
40
60
80
1 4 7 10 13 16 19 22 25 28 31 34 37 40 43 46 49 52 55 58 61 64 67 70 73 76 79 82 85 88 91 94 97 100 103 106 109 112 115 118 121 124 127 130
Spee
d (m
ph)
Time (second)
Original Cycle Eco Cycle
Smoothing
Maintaining Status Quo
Conservation of Distance
Maintaining Status Quo (time not in sync)
Start point STP>=STP L
Speed(eco)= Speed(original)
Distance(eco)= Distance(original)

14
Figure5.ExampleofanObservedCycleandCorrespondingEco-cycle
15
Figure6.AlgorithmFlowChart
Cycle Optimization
1-steady status: STP<STPLEcoSpeed(i)=OriginalSpeed(i)EcoAcc(i)=OriginalSpeed(i)
STP (i)>=STPL?
next second(i=i+1)No
2-smoothing status:EcoAcc = Acc L
EcoSpeed(i)=EcoSpeed(i-1)+EcoAcc(i-1)
Yes
EcoSpeed (i) = OriginalSpeed (i)next second
(i=i+1)
Yes
No
3-conserving distance status:EcoSpeed(i) = EcoSpeed(i-1)EcoAcc = 0
EcoDistance(i)= OriginalDistance(i)?
next second(i=i+1)
Yes
No
Selection STP Limit Level
STPL-1=30 STPL-2=24 STPL-3=18 STPL-4=12 STPL-5=9 STPL-6=6 STPL-7=3
Average speed of eco cycle significantly smaller than original cycle
Fuel/emission of interest from eco cycle does not change much compared with original cycle
No
Optimization Complete
Yes
, Cho
ose
a le
ssst
rict r
ule
Yes
, Cho
ose
a m
ore
stric
t rul
e
16
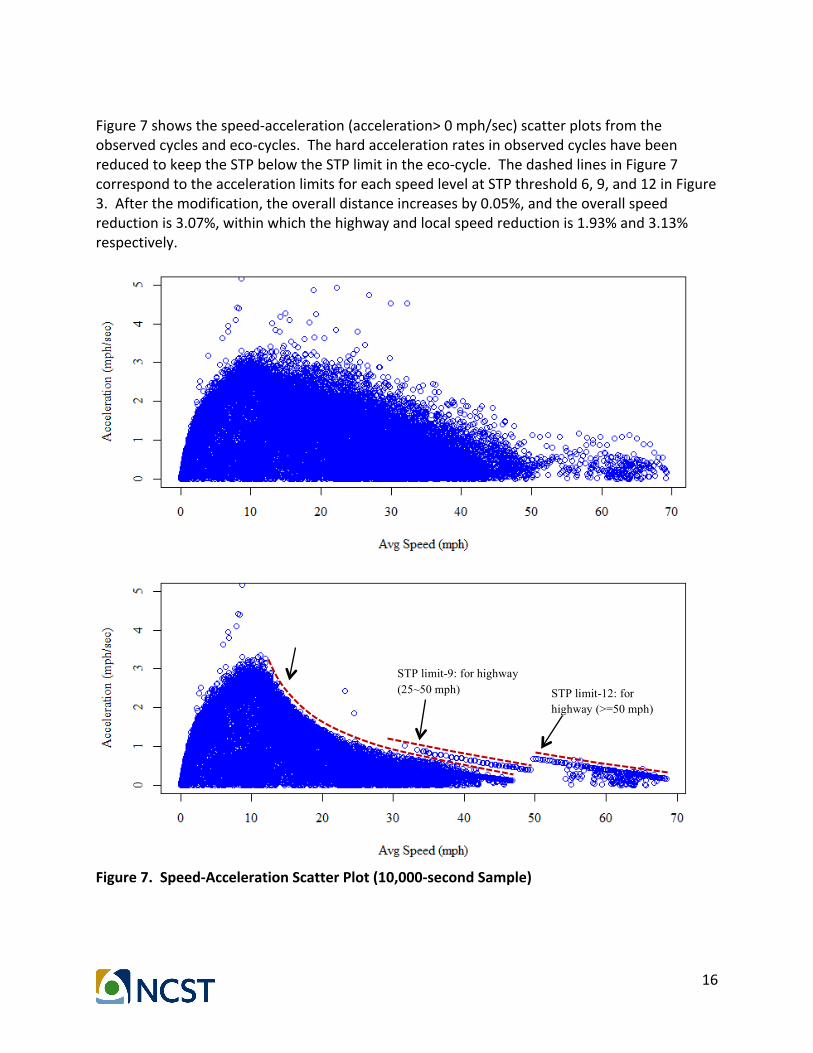
Figure7showsthespeed-acceleration(acceleration>0mph/sec)scatterplotsfromtheobservedcyclesandeco-cycles.ThehardaccelerationratesinobservedcycleshavebeenreducedtokeeptheSTPbelowtheSTPlimitintheeco-cycle.ThedashedlinesinFigure7correspondtotheaccelerationlimitsforeachspeedlevelatSTPthreshold6,9,and12inFigure3.Afterthemodification,theoveralldistanceincreasesby0.05%,andtheoverallspeedreductionis3.07%,withinwhichthehighwayandlocalspeedreductionis1.93%and3.13%respectively.
Figure7.Speed-AccelerationScatterPlot(10,000-secondSample)
STP limit-12: for highway (>=50 mph)
STP limit-9: for highway (25~50 mph)

17
FuelandEmissionsAnalysisThegoalofthefuelandemissionsanalysisistoassesstheimpactoftheeco-drivingandotherfuelsavingstrategiesatthetransitagencylevel.Todoso,real-worldoperationsdatacollectedfromMARTAandGRTAbusesareusedandapplicablefuelconsumptionandemissionratesareappliedasiftheentirefleetexperiencestheobservedoperatingconditions.ToprovideafaircomparisonbetweendieselandCNG,weevaluatedthefullfuelcycle(i.e.well-to-wheelemissions)followingtheapproachedadoptedintheFuelandEmissionsCalculatorforTransitFleets(Xu,etal.,2015).Pump-to-wheelemissionswereestimatedusingMOVES-Matrix(Guensler,etal.,2015),amulti-dimensionalemissionratelookuptablederiveddirectlyfrommillionsofMOVESemissionraterunsforAtlanta.ThedetailedsettingsfortheMOVESrunsarelistedinAppendixIII.Well-to-pumpemissionswereestimatedusingtheGREETmodel(ArgonneNationalLaboratory,2015).Toestimatetheemissionsandfuelconsumptionsfortheentirefleet,fleetsizeandannualmileageinformationwastakenfromtheNationalTransitDatabase(NTD)(2014).TheNTDdoesnotprovideinformationofoperatingmileageondifferentroadtypes,butdoesdifferentiatebetweenrevenueandnon-revenue(alsoknownasdeadhead)mileage.Therefore,proportionsoffreewayandnon-freewaymileagewereestimatedseparatelyforrevenueanddeadheadoperations,usingspatialanalysisinArcGIS(detailsareprovidedinAppendixI).Table4summarizesthepump-to-wheelemissionratesforlocaltransitserviceandTable5summarizesthepump-to-wheelemissionratesforexpressbusservice.Well-to-pumpemissions(emissionstoharvestfeedstock,processfeedstockintofuel,anddeliverfueltothepump)wereestimatedforthepredictedpump-to-wheelfuelconsumption.

18
Table4.Pump-to-wheelEmissionRatesforLocalTransitBasedforMARTABuses
Fuel DutyCycle Revenue/Deadhead RoadType Duration
(seconds)
Avg.Speed(mph)
Distance(miles)
EmissionRate(g/mile/vehicle;MJ/mile/vehicleforfuel)
HC CO NOx PM2.5 CO2 GHGs Fuel
Diesel(E
xisting)
Observed Deadhead
Local 4,545,040 16.9 21,390 1.72 6.27 16.54 1.07 2,142 2,142 29.1Freeway 301,994 54.7 4,591 0.68 3.42 9.25 0.46 1,341 1,341 18.2
RevenueLocal 19,090,668 16.5 87,424 1.72 6.27 16.54 1.07 2,142 2,142 29.1Freeway 172,750 54 2,589 0.68 3.42 9.25 0.46 1,341 1,341 18.2
Eco
DeadheadLocal 4,686,687 16.4 21,344 1.82 6.49 16.02 1.01 2,032 2,032 27.6Freeway 310,210 53.8 4,636 0.69 3.53 9.07 0.47 1,327 1,327 18.0
RevenueLocal 19,711,963 16.0 87,463 1.82 6.49 16.02 1.01 2,032 2,032 27.6Freeway 178,599 52.7 2,613 0.69 3.53 9.07 0.47 1,327 1,327 18.0
CNG(E
xisting)
Observed Deadhead
Local 4,545,040 16.9 21,390 24.80 15.45 11.28 0.05 2,104 2,682 35.6Freeway 301,994 54.7 4,591 7.33 9.52 7.71 0.08 1,237 1,407 21.0
RevenueLocal 19,090,668 16.5 87,424 24.80 15.45 11.28 0.05 2,104 2,682 35.6Freeway 172,750 54.0 2,589 7.33 9.52 7.71 0.08 1,237 1,407 21.0
Eco
DeadheadLocal 4,686,687 16.4 21,344 23.61 14.06 10.81 0.04 2,003 2,553 33.9Freeway 310,210 53.8 4,636 7.42 9.48 7.43 0.07 1,203 1,375 20.4
RevenueLocal 19,711,963 16.0 87,463 23.61 14.06 10.81 0.04 2,003 2,553 33.9Freeway 178,599 52.7 2,613 7.42 9.48 7.43 0.07 1,203 1,375 20.4
CNG(N
ew)
Observed Deadhead
Local 4,545,040 16.9 21,390 3.32 6.00 1.93 0.00 1,975 2,054 33.5Freeway 301,994 54.7 4,591 0.73 2.99 1.31 0.00 1,161 1,178 19.7
RevenueLocal 19,090,668 16.5 87,424 3.32 6.00 1.93 0.00 1,975 2,054 33.5Freeway 172,750 54.0 2,589 0.73 2.99 1.31 0.00 1,161 1,178 19.7
Eco
DeadheadLocal 4,686,687 16.4 21,344 3.05 5.00 1.70 0.00 1,879 1,952 31.8Freeway 310,210 53.8 4,636 0.78 3.11 1.27 0.00 1,129 1,148 19.1
RevenueLocal 19,711,963 16.0 87,463 3.05 5.00 1.70 0.00 1,879 1,952 31.8Freeway 178,599 52.7 2,613 0.78 3.11 1.27 0.00 1,129 1,148 19.1

19
Table5.Pump-to-wheelEmissionRatesforExpressServiceBasedforGRTABuses
Fuel DutyCycle
Revenue/Deadhead
RoadType
Duration(seconds)
Avg.Speed(mph)
Distance(miles)
EmissionRate(g/mile/vehicle;MJ/mile/vehicleforfuel)
HC CO NOx PM2.5 CO2 GHGs Fuel
Diesel(E
xisting)
Observed Deadhead
Local 143,802 32.2 1,285 0.59 2.41 9.56 0.50 1,891 1,892 25.7Freeway 123,346 59.6 2,041 0.37 1.82 7.33 0.29 1,523 1,523 20.7
RevenueLocal 87,694 20.3 494 0.89 3.04 11.36 0.60 2,139 2,140 29.0Freeway 225,294 55.6 3,482 0.39 1.88 7.41 0.30 1,525 1,526 20.7
Eco
DeadheadLocal 160,670 28.5 1,271 0.72 2.86 8.31 0.43 1,543 1,544 20.9Freeway 126,231 58.2 2,042 0.37 1.92 6.78 0.27 1,430 1,430 19.4
RevenueLocal 92,628 18.9 486 1.01 3.40 10.41 0.53 1,847 1,849 25.1Freeway 228,780 54.7 3,476 0.39 1.97 6.85 0.28 1,427 1,428 19.4
CNG(N
ew)
Observed Deadhead
Local 143,802 32.2 1,285 2.23 5.89 1.86 0.00 1,738 1,791 29.4Freeway 123,346 59.6 2,041 0.74 2.87 1.37 0.00 1,270 1,287 21.5
RevenueLocal 87,694 20.3 494 3.12 6.31 2.04 0.00 1,988 2,063 33.7Freeway 225,294 55.6 3,482 0.83 3.08 1.38 0.00 1,281 1,301 21.7
Eco
DeadheadLocal 160,670 28.5 1,271 2.00 4.65 1.33 0.00 1,478 1,525 25.0Freeway 126,231 58.2 2,042 0.72 2.72 1.25 0.00 1,160 1,177 19.7
RevenueLocal 92,628 18.9 486 2.77 4.86 1.58 0.00 1,736 1,802 29.4Freeway 228,780 54.7 3,476 0.79 2.87 1.25 0.00 1,165 1,184 19.7

20
ResultsInthissection,wepresentfuelandemissionsresultsforthreescenarios.Scenario1evaluatestheimplementationoftheeco-drivingcycleswiththeexistingfleet.Scenario2evaluatesthepurchaseofnewCNGvehiclestoreplacetheexistingfleet.Scenario3combinesthetwostrategiesandimplementseco-drivingwithanewCNGfleetpurchase.Thesescenariosarecomparedagainstthebaselinescenariocomprisedofobserveddrivingbehavior,asrevealedthroughtheGPSdatasamples,andexistingfleetandannualmileage(seeTable6).Table7summarizestheannualfuelusageandfuelcycleemissionsofMARTAandGRTAgiventheexistingfleetanddrivingbehavior.Thisisthebasescenarioagainstwhichtheaforementionedthreescenarioswillbecompared.Amongairpollutants,weonlypresentNOxandPM2.5becauseheavy-dutyvehicleshaverelativelylowHCandCOemissions.
Table6.MileageandFleetInformation(NationalTransitDatabase,2014;GRTA,2015)
TransitAgency
AnnualMileage
(1,000Miles)
DeadheadingPercent(%)
NumberofBuses
CNGFleetPercent(%)
MARTA 25,850 12 508 69GRTA 4,701 44 166 0
Table7.AnnualOn-roadFuelConsumptionandFuelCycleEmissionsofBaseScenario
TransitAgency
Fuel(1,000GGE)
GHGs(metrictons)
NOx(metrictons)
PM2.5(metrictons)
MARTA 7,226 81,233 371 10.5GRTA 859 9,511 41 1.9
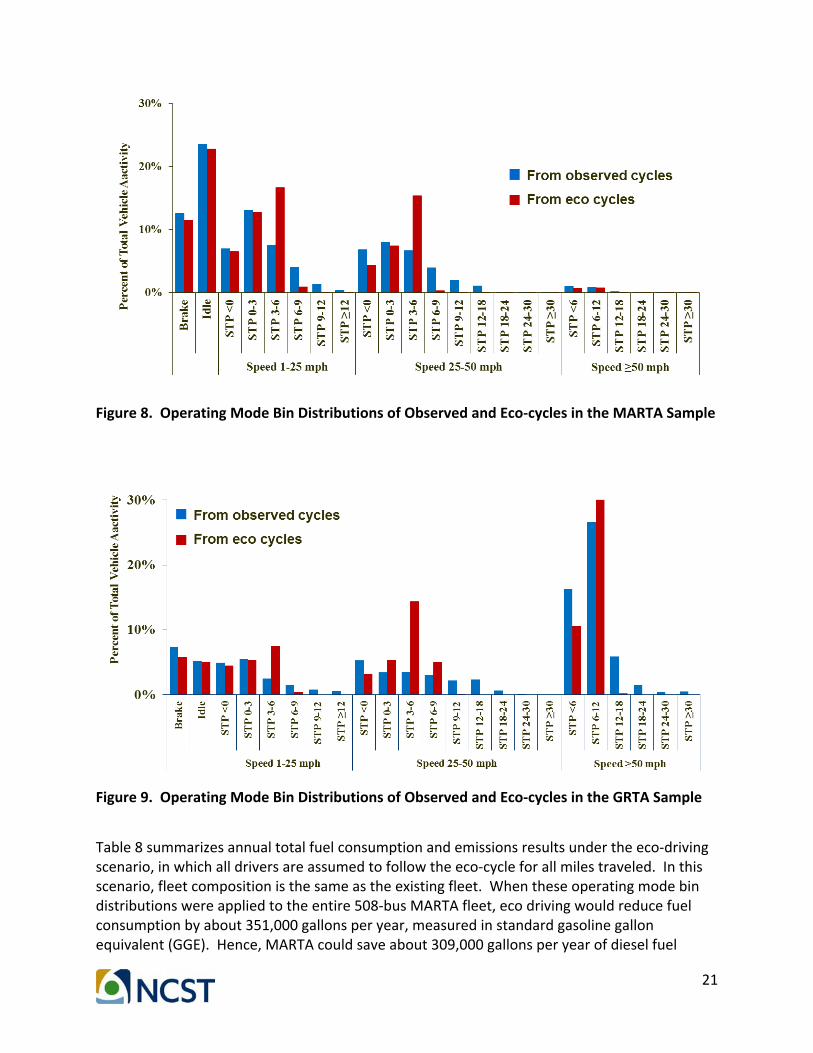
Eco-drivingScenarioThespeedandaccelerationmodificationsdescribedintheMethodologysectionresultedinashiftofoperationmodebindistributions.AsshowninFigure8fortheMARTAsampleandFigure9fortheGRTAsample,mostofoperationpointswithhighSTPvalueshavebeenadjusteddownwardtolowerSTPvaluesbylimitingtheaccelerationrate.
21
Figure8.OperatingModeBinDistributionsofObservedandEco-cyclesintheMARTASample
Figure9.OperatingModeBinDistributionsofObservedandEco-cyclesintheGRTASample
Table8summarizesannualtotalfuelconsumptionandemissionsresultsundertheeco-drivingscenario,inwhichalldriversareassumedtofollowtheeco-cycleforallmilestraveled.Inthisscenario,fleetcompositionisthesameastheexistingfleet.Whentheseoperatingmodebindistributionswereappliedtotheentire508-busMARTAfleet,ecodrivingwouldreducefuelconsumptionbyabout351,000gallonsperyear,measuredinstandardgasolinegallonequivalent(GGE).Hence,MARTAcouldsaveabout309,000gallonsperyearofdieselfuel

22
equivalentgiventhehigherenergycontentofdiesel.TheMARTAfuelsavingstranslatestoanannualreductionofabout3,930metrictons(5%)infuelcyclecarbondioxideequivalent(CO2e)emissions.Intermsofcriteriaairpollutants,eco-drivingimplementationintheMARTAfleetwouldreduceannualNOxemissionsby14metrictons(4%),andannualPM2.5emissionsby0.8metrictons(7%).FortheGRTAfleet,annualfuelsavingsamountedtoabout63,000GGEs.Thistranslatestoasavingsofabout55,000gallonsofdieselfuelperyeara7%reduction.GreenhousegasCO2eemissionsarealsoreducedbyabout700metrictonsperyear.NOxreductionswouldamountto2metrictons(5%),andtheannualPM2.5reductionswouldbe0.1metrictons(7%)peryear.
Table8.Eco-drivingScenarioAnnualFuelConsumptionandFuelCycleEmissions
TransitAgency
Fuel(1,000GGE)
GHGs(metrictons)
NOx(metrictons)
PM2.5(metrictons)
MARTA 6,875 77,304 356 9.8GRTA 796 8,809 39 1.7
CNGFleetPurchaseScenarioInthishypotheticalscenario,MARTAandGRTAareassumedtoreplacetheirexistingdieselbuseswithnewCNGbuses(modelyear2015).MARTAisassumedtoretaintheirexistingCNGbuses,sothisstrategyaffects31%ofthefleet(seeFigure10andTable6).TheagedistributionsoftheexistingfleetsaresummarizedinFigure10forMARTAandFigure11forGRTA.TheCNGscenarioassumednochangesintheexistingdrivingstyle.
Figure10.AgeDistributionofCurrentMARTAMixedDieselandCNGFleet
26%
1%
15%
8%
16%
23%
11%
0%
10%
20%
30%
2010
2009
2008
2007
2006
2005
2004
2003
2002
2001
2000
CNG
34%
60%
6%
0%
20%
40%
60%
80%
2010
2009
2008
2007
2006
2005
2004
2003
2002
2001
2000
Diesel
23
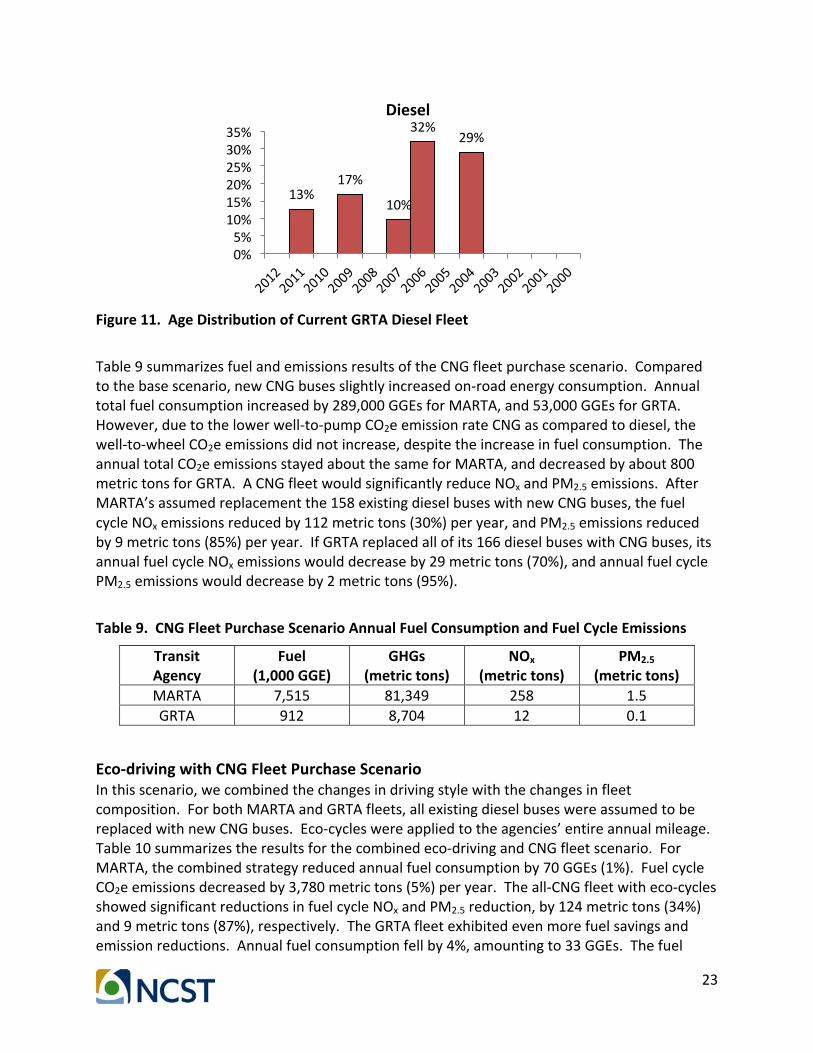
Figure11.AgeDistributionofCurrentGRTADieselFleet
Table9summarizesfuelandemissionsresultsoftheCNGfleetpurchasescenario.Comparedtothebasescenario,newCNGbusesslightlyincreasedon-roadenergyconsumption.Annualtotalfuelconsumptionincreasedby289,000GGEsforMARTA,and53,000GGEsforGRTA.However,duetothelowerwell-to-pumpCO2eemissionrateCNGascomparedtodiesel,thewell-to-wheelCO2eemissionsdidnotincrease,despitetheincreaseinfuelconsumption.TheannualtotalCO2eemissionsstayedaboutthesameforMARTA,anddecreasedbyabout800metrictonsforGRTA.ACNGfleetwouldsignificantlyreduceNOxandPM2.5emissions.AfterMARTA’sassumedreplacementthe158existingdieselbuseswithnewCNGbuses,thefuelcycleNOxemissionsreducedby112metrictons(30%)peryear,andPM2.5emissionsreducedby9metrictons(85%)peryear.IfGRTAreplacedallofits166dieselbuseswithCNGbuses,itsannualfuelcycleNOxemissionswoulddecreaseby29metrictons(70%),andannualfuelcyclePM2.5emissionswoulddecreaseby2metrictons(95%).
Table9.CNGFleetPurchaseScenarioAnnualFuelConsumptionandFuelCycleEmissions
TransitAgency
Fuel(1,000GGE)
GHGs(metrictons)
NOx(metrictons)
PM2.5(metrictons)
MARTA 7,515 81,349 258 1.5GRTA 912 8,704 12 0.1
Eco-drivingwithCNGFleetPurchaseScenarioInthisscenario,wecombinedthechangesindrivingstylewiththechangesinfleetcomposition.ForbothMARTAandGRTAfleets,allexistingdieselbuseswereassumedtobereplacedwithnewCNGbuses.Eco-cycleswereappliedtotheagencies’entireannualmileage.Table10summarizestheresultsforthecombinedeco-drivingandCNGfleetscenario.ForMARTA,thecombinedstrategyreducedannualfuelconsumptionby70GGEs(1%).FuelcycleCO2eemissionsdecreasedby3,780metrictons(5%)peryear.Theall-CNGfleetwitheco-cyclesshowedsignificantreductionsinfuelcycleNOxandPM2.5reduction,by124metrictons(34%)and9metrictons(87%),respectively.TheGRTAfleetexhibitedevenmorefuelsavingsandemissionreductions.Annualfuelconsumptionfellby4%,amountingto33GGEs.Thefuel
13%17%
10%
32%29%
0%5%10%15%20%25%30%35%
Diesel

24
cycleemissionsinCO2e,NOx,andPM2.5decreasedby1,628(17%),30(73%),and2(96%)metrictons,respectively.
Table10.CNGandEco-drivingScenarioAnnualFuelConsumptionandFuelCycleEmissions
TransitAgency
Fuel(1,000GGE)
GHGs(metrictons)
NOx(metrictons)
PM2.5(metrictons)
MARTA 7,156 77,453 246 1.3GRTA 826 7,884 11 0.1
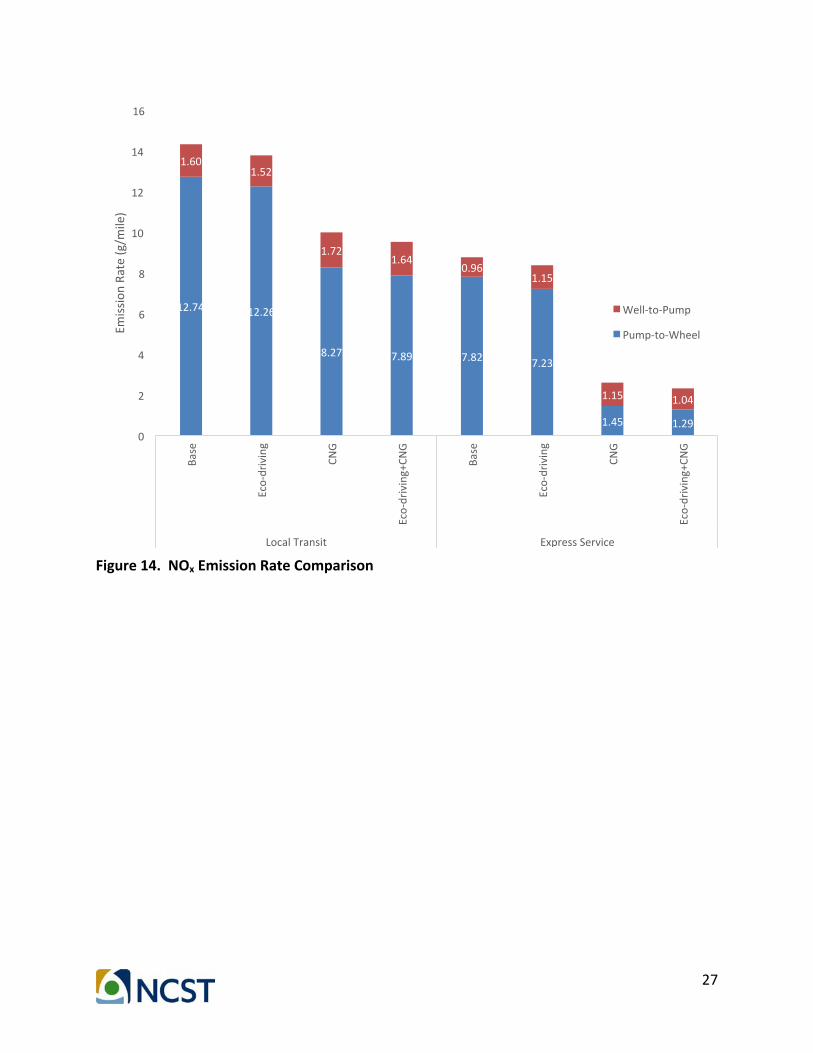
OverallComparisonandDiscussionThereductionsinfuelconsumptionandfuelcycleemissionspresentedinthispaperreflecteachagency’sfleetsizeandextentofoperations.Inthissection,theresultsarepresentedonapermilebasis,whichwillshedlightongeneralizedfuelandemissionsimpactsforlocalandexpressservices.Figure12throughFigure15providecomparisonsacrossscenariosandoperationtypesforfueleconomy,fuelcycleCO2e,NOx,andPM2.5emissionrates,respectively.Ingeneral,eco-drivingismoreeffectiveinexpressservice,improvingfueleconomyby8%,thanlocaltransitservicewherethefueleconomyimprovementis5%.Eco-drivingreducesmorefuelcycleCO2eemissionsthantheCNGfleetpurchase.Combiningeco-drivingwithnewCNGfleetpurchasecanprovideaddedbenefitsinfuelcycleenergysavingsandemissionsreduction.InthecaseoffuelcycleCO2eemissionsinexpressbusservice,thereductionachievedbythecombinedCNGandeco-drivingstrategyismorethanthesumofreductionsachievedbytheeco-drivingscenarioandCNGfleetpurchasescenario.Thisshowsthateco-drivingcanbeespeciallyeffectiveasafuelconservingstrategyforagenciesthatprovideexpressservicewithaCNGfleet.IntermsofNOxandPM2.5,theadditionalemissionsreductionfromeco-drivinginaCNGfleetismarginal,sinceaCNGfleetalreadyhasverylowNOxandPM2.5emissions.

25
Figure12.FuelEconomyComparisonacrossScenariosandTypesofOperation
3.6 3.8 3.4 3.6
5.55.9
5.25.7
0
1
2
3
4
5
6
7
Base
Eco-driving
CNG
Eco-driving+CN
G
Base
Eco-driving
CNG
Eco-driving+CN
G
LocalTransit ExpressService
FuelEcono
my(m
iles/GG
E)

26
Figure13.CO2eEmissionRateComparison
2.47 2.35 2.44 2.33
1.59 1.48 1.38 1.25
0.670.64
0.700.67
0.430.40 0.47
0.43
0
0.5
1
1.5
2
2.5
3
3.5
Base
Eco-driving
CNG
Eco-driving+CN
G
Base
Eco-driving
CNG
Eco-driving+CN
G
LocalTransit ExpressService
EmissionRa
te(kg/mile)
Well-to-Pump
Pump-to-Wheel
27
Figure14.NOxEmissionRateComparison
12.74 12.26
8.27 7.89 7.82 7.23
1.45 1.29
1.601.52
1.721.64
0.961.15
1.15 1.04
0
2
4
6
8
10
12
14
16
Base
Eco-driving
CNG
Eco-driving+CN
G
Base
Eco-driving
CNG
Eco-driving+CN
G
LocalTransit ExpressService
EmissionRa
te(g/m
ile)
Well-to-Pump
Pump-to-Wheel

28
Figure15.PM2.5EmissionRateComparison
0.360.33
0.03 0.03
0.330.30
0.05
0.05
0.03 0.02
0.070.07
0.02 0.020
0.05
0.1
0.15
0.2
0.25
0.3
0.35
0.4
0.45
Base
Eco-driving
CNG
Eco-driving+CN
G
Base
Eco-driving
CNG
Eco-driving+CN
G
LocalTransit ExpressService
EmissionRa
te(g/m
ile)
Well-to-Pump
Pump-to-Wheel

29
ConclusionsThispaperevaluatedpotentialfuelandemissionssavingsfromtheimplementationofeco-drivinginAtlanta’sMARTAlocaltransitandGRTAexpressbusfleets.Theanalysesemployedreal-worldoperationsdatacollectedfromthesetwofleetsasbaselineoperatingconditions,andeco-drivingdutycyclesdevelopedthroughaspeedandaccelerationmodificationalgorithm.Theeco-drivingalgorithmsreducefuelconsumptionandemissionsbylimitingengineload,asindicatedbySTPintheMOVESmodelingscheme,whilestillconservingtotaldistanceandaveragespeed.Thebenefitsoftheeco-drivingstrategywerecomparedtoCNGfleetconversion,anotherpopulartransitfuelreductionstrategy.Thesimultaneouseffectsofeco-drivingandCNGfleetpurchasewerealsoassessed.Changesintotalannualfuelconsumptionandemissionsforthethreestrategieswerecomparedforthetwoagencies,aswellasfuelandemissionratesonaper-milebasis.AssumingtheexistingfleetcompositionofMARTAandGRTA,eco-drivingcanreducefuelconsumptionby5%inlocaltransitservice,and7%inexpressbusservice.Althoughthepercentagedecreaseislargerfortheexpressbusfleet(freewaybenefitsarelarge),theactualfuelsavingsperyearisgreaterforbusesinthelocalMARTAfleetgiventhenumberofmilesdrivenperbuseachday.Bycomparison,anewCNGfleetwouldslightlyincreasefuelconsumption,albeitkeepingthefuelcycleCO2eemissionsaboutthesameasthebaselineconditions.Eco-drivingwasalsofoundtobeaneffectivestrategyforreducingfuelconsumptionandemissionsforCNGfleets.FortheGRTAexpressbusservice,eco-drivingconservedalargerpercentageoffuelinthehypotheticalCNGfleetthanintheexistingdieselfleet.Eco-drivingcanproveaverycost-effectivestrategyfortransitagenciesseekingtoreducefuelconsumptionandemissions.Forexample,thefuelsavingsthatGRTAcanachieveamounttoabout55,000gallonsofdiesel,translatingtoabout$132,000inannualfuelsavings(about$800/bus/year),assumingadieselfuelpriceof$2.40/gallon.ForMARTA’smixedCNGanddieselfleet,fuelsavingsfromeco-drivingamountedtoabout300,000gallonsofdieselfuelequivalent(85,200gallonsofdieselfuelplus252,500gasolinegallonsequivalentofCNG)peryear.Assumingadieselpriceof$2.40/gallon($0.63/liter)andaCNGpriceof$1.20pergasolinegallonequivalent(Skelton,2015),thecostsavingsfortheMARTAfleetamounttotranslatingtoabout$720,000inannualfuelsavings,or$1,000/bus/year.Unlikethepurchaseofanalternativefuelbusfleet,eco-drivingdoesnotrequiresignificantcapitalinvestment.Oncebusesarebeingmonitored,eco-drivingiseasytoimplement,requiringonlydevelopmentofdriverreports,trainingandfeedback.Basedontheresearchteam’spriorexperiencewithfleetmonitoring(Xuetal.,2013a),preliminarycostestimatesshowthatimplementingeco-drivingwouldcostanagencyabout$650/bus/year,inclusiveofequipment,communications,driverincentives,anddataanalysis.Forfleetsthatarenotcurrentlymonitoringtransitspeed/accelerationactivity,thefuelsavingsissufficienttopayforsuchmonitoring.Notonlywillfleetmonitoringenablereal-timefeedbacktodrivers,whichhasbeenshowntoprovideaddedfuelsavingsthanin-classtraining(Rolim,etal.,2014),butitwill

30
alsoprovideancillarybenefits,suchasassetmanagement,on-timeperformanceassessment,anddriversafetyassessment.Theeco-drivingalgorithmdevelopedforthisstudyutilizesthemodalmodelingframeworkofU.S.EPA’sMOVESmodel.Theadvantagesarethree-fold.First,MOVESisnotcomputationallydemanding,andthereforecanbeusedinreal-timeornear-real-timedrivingadvisingforfutureapplications.Second,usingtheMOVESframeworkallowsaunifiedplatformforfuelandemissionsestimation.Third,MOVESistheU.S.EPA’sapprovedmodelforregulatoryuse.However,thedisadvantageintheanalyticalapproachisthatthealgorithmislimitedbyuncertaintiesandemissionsaveraginginherentintheMOVESmodel,especiallythoserelatedtothelackofresolutionforhigh-speed,high-poweroperatingmodebinsforheavy-dutyvehicles.Theanalysespresentedinthispaperserveasapointofdeparturefordebatingthebenefitsofeco-drivingfortransitoperations,andtheinitialassessmentofbenefitsappearsignificantandarelikelytobeverycost-effective.Infuturework,theauthorsplantoexpanddatacollectiontoallMARTAandGRTAroutes,andrefinetheeco-drivingalgorithmusinghigh-fidelityvehiclesimulationmodels.

31
AppendixIDataQAQCProceduresGPSpositionandspeedtracescollectedfrommovingtransitvehiclesunderwentaseriesofQA/QCandpostprocessingroutinestoensuredatavalidity,accuracy,andcontinuity,beforeusingthedataintheemissionsanalysisdescribedinthispaper.ThedataprocessingproceduresincludedKalmanfilteringtoeliminateproblematicdatapoints,splinefittingtoinfillmissingdata,mappingofdatatoroadways,identificationofoff-networkactivity,eliminationofparkedvehicledata(parkedvehicleinnon-idleconditions),andtreatmentoflargedatagaps.Eachprocessisdescribedindetailbelow,andsummaryfiguresdescribeanydatalossesateachprocessingstep.
KalmanFilteringThequalityofanyGPSdatastronglydependsonGPSsignalcondition,whichisafunctionofnumberofsatellitesandpositionaldilutionofprecision(PDOP)values.AlthoughGPSreceiversemployproprietarydatafilteringalgorithmsintheirembeddedchipsetfirmwaretohelpcorrectdataon-the-flypriortodeliverytotheuser,itisstillnecessarytofurtherprocessthedata.TheproprietaryGPSchipsetfilteringalgorithmsdonotidentifyandeliminatealldataoutliers,ascanbeseeninrandomerrorsintheGPSoutputdatastream.ThemodifieddiscreteKalmanfilteralgorithmisprovedtoeffectivelyenhanceitscapabilityofcontrollingGPSrandomerrors(Jun,etal.,2005).TheKalmanfilterisusedtocorrecttheGPSspeedwiththeKalmanGainMatrixandthedifferencebetweentheestimatedandthemeasuredspeeds.TheKalmanGainMatrixisgeneratedbasedontheGPSqualitycriteria,thenumberofsatellitesandPDOPvalues.Ifthenumberofsatellitesisbelow4andthePDOPisabove8,thequalityofthespeedisdeterminedtobepoor;therefore,estimatedspeedvaluesareusedinplaceofmeasuredGPSspeedvalues.Consideringthedataavailability,themodifieddiscreteKalmanfilteralgorithmisimplementedtoMARTAoperationsdatatominimizetherandomerrorsfromGPSloggers.TheKalmanfilterroutinewasnotimplementedonGRTAdataduetothelackofGPSparametersprovidedbytheQstarzdataloggers.
SplineDataInfillProcessMissingsegmentsexistsinalmostallthetripfilesduetovariousfactors,suchasobstructionandsignalinterference.Missingsegmentsofshortdurationcanbereasonablyinterpolatedtogenerateacontinuousspeedprofileforemissionmodeling.Acubicsplinealgorithmisimplementedforallofthetripfilestointerpolatemissingsegmentsofnolongerthanthreeseconds.Ifthegapofthemissingsegmentisnolongerthanthreeseconds,i.e.,singlesecondortwoorthreeconsecutivesecondsaremissing,thissegmentwillbecandidatesegmentstobesplined;otherwise,segmentslongerthan3secondsarenotsplinedorfurtherusedformodelingbecauseinterpolatingsuchlongmissingsegmentsmaybeinaccurateorunreliableifthevehicleisnotinasteadycruisemode.Tosplineinfillamissingsegment,sixgoodspeeds(i.e.,speedwascollectedsuccessfully)areneeded;threesecondsbeforethestartmissingsegmentbutnoearlierthan10seconds,andthreesecondsafterendofthemissingsegmentbutnolaterthan10seconds.Ifsufficientgoodspeeddatacannotbefoundwithinthe20secondswrappingthecandidatesegment,thissegmentisidentifiedasmissingandisnotsplineinfilled.

32
GISNetworkMappingFacility Type Toidentifythefacilitytypeonwhichthevehicleisoperating,theGISshapefileofrestrictedroadways(highwaysandfreeways)isused.Twostepsareconductedtoidentifywhetherthetracesareonrestrictedhighwayorunrestrictedarterial:Step1:OverlayGPSDatawiththeRestrictedRoadwayLayerA72-footbufferiscreatedforeachcenterlineoftherestrictedroadwayoneachdirection.Thisbufferlayeristhenoverlaidwiththeoperationsdatatoidentifytheportionsoftracesrunningonrestrictedhighways.Figure16illustratesthefacilitytypeidentificationprocess.
Figure16.ExampleofFacilityTypeIdentification
Step2:FilterRoadwayClassificationResultsThedirectprocessingofGPStracescanleadtoincorrectidentificationoffacilitytypeundercertainconditions.Forexamplewhenabusonanarterialpassesbeneathafreeway,viaan
33
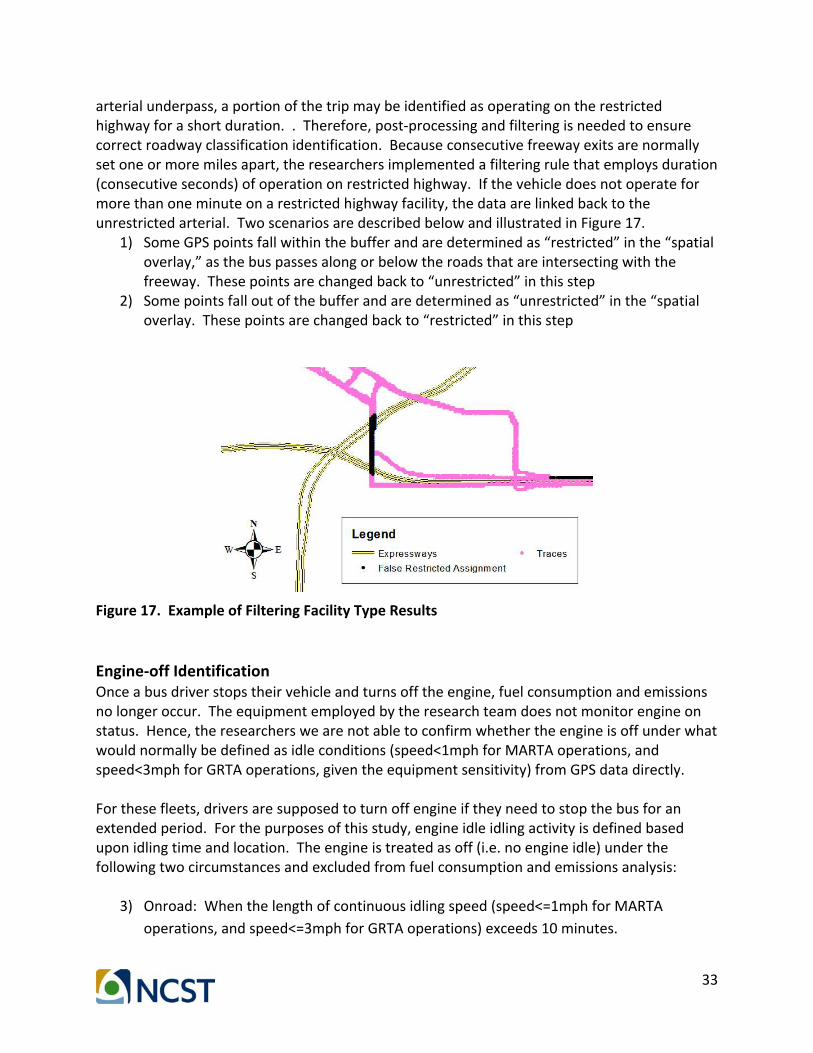
arterialunderpass,aportionofthetripmaybeidentifiedasoperatingontherestrictedhighwayforashortduration..Therefore,post-processingandfilteringisneededtoensurecorrectroadwayclassificationidentification.Becauseconsecutivefreewayexitsarenormallysetoneormoremilesapart,theresearchersimplementedafilteringrulethatemploysduration(consecutiveseconds)ofoperationonrestrictedhighway.Ifthevehicledoesnotoperateformorethanoneminuteonarestrictedhighwayfacility,thedataarelinkedbacktotheunrestrictedarterial.TwoscenariosaredescribedbelowandillustratedinFigure17.
1) SomeGPSpointsfallwithinthebufferandaredeterminedas“restricted”inthe“spatialoverlay,”asthebuspassesalongorbelowtheroadsthatareintersectingwiththefreeway.Thesepointsarechangedbackto“unrestricted”inthisstep
2) Somepointsfalloutofthebufferandaredeterminedas“unrestricted”inthe“spatialoverlay.Thesepointsarechangedbackto“restricted”inthisstep
Figure17.ExampleofFilteringFacilityTypeResults
Engine-offIdentificationOnceabusdriverstopstheirvehicleandturnsofftheengine,fuelconsumptionandemissionsnolongeroccur.Theequipmentemployedbytheresearchteamdoesnotmonitorengineonstatus.Hence,theresearcherswearenotabletoconfirmwhethertheengineisoffunderwhatwouldnormallybedefinedasidleconditions(speed<1mphforMARTAoperations,andspeed<3mphforGRTAoperations,giventheequipmentsensitivity)fromGPSdatadirectly.Forthesefleets,driversaresupposedtoturnoffengineiftheyneedtostopthebusforanextendedperiod.Forthepurposesofthisstudy,engineidleidlingactivityisdefinedbaseduponidlingtimeandlocation.Theengineistreatedasoff(i.e.noengineidle)underthefollowingtwocircumstancesandexcludedfromfuelconsumptionandemissionsanalysis:
3) Onroad:Whenthelengthofcontinuousidlingspeed(speed<=1mphforMARTAoperations,andspeed<=3mphforGRTAoperations)exceeds10minutes.

34
4) OffNetwork:Whenthelengthofcontinuousidlingspeed(speed<=1mphforMARTAoperations,andspeed<=3mphforGRTAoperations)exceeds30seconds.
Toassesstheengineoffthreshold,theresearchersexamined35engine-offoperationswithidlingdurationbetween10and15minutes,and35identifiedengine-onoperationswithidlingdurationbetween5and10minutes.Theseengine-offoperationstypicallyoccurredinremoteparkinglotlocations(notMARTAmaintenanceyards)orinthemiddleofaroadway.IntheexampleshowninFigure18(b),thebusstayedatthelocationoftheleftandrightredmarkerfor845and690seconds,respectively,andthenheadedintorevenueservice.ThereisnoreasontobelievethatthebusidledforthatperiodinviolationofMARTAoperationspolicy(althoughadrivermayhavedoneso),sotheactivitywasconsideredtobeanenginestopandtripendlocation.IntheexampleshowninFigure18(b),thebusstoppedinthemiddleofthestreetfor855seconds.Thison-streetlocationwasneitheratabusstopnoranintersection.Thereisnowaytoknowwhatthebuswasdoingatthismid-streetlocation.Thedelaymayhaveresultedfromroadconstruction,thedrivermayhaveparkedthevehicletousearestroom,orthedrivermayhavestoppedforsomeotherreason.Inanycase,thereisnoreasontobelievethatthebuswasidlingfor855secondsinviolationoftransitagencypolicyan.Forthepurposesoftheanalysis,thelocationwasdeemedatripendandengineofflocation.Neitherofthetwoscenariosdescribedabovearepartregularbusserviceactivity.Withoutevidencetothecontrary(monitoringofengineonstatus),activityattheselocationsarenotidentifiedasextendedidleactivityandarethereforeexcludedfromtheassessmentofeco-drivingforMARTArevenueoperations.Ontheotherhand,forthelocationsadjacenttoexistingbusstops,asshowninFigure19,,andwherethestopdurationsareshorterthan10minutes,thestopisdeemedpartofregularrevenueoperationsandbecomespartoftheeco-drivingassessment.
(a) (b)
Figure18.ExampleofIdentifiedEngine-OffConditions(ParkingLotsandMidblock)

35
(a) (b)
Figure19.ExampleofEngine-OnCondition(TransitStops)
BreakingGPSDataintoTripsforEco-DrivingAnalysisThedataprocessingroutinesdescribedaboveidentifytripendlocations,wheretheengineispresumedtohavebeenturnedoff.Inaddition,therearestillgapsinthedatastreamwheretheresearchteamdidnotallowthesplinefunctiontoinfilldata.Thesestoplocationsanddatagapswereusedtobreakthemonitoreddataintotripsforeco-drivinganalysis.However,someofthetripsthatresultfromthedataprocessingareveryshort,typicallyassociatedwithchoppyperiodsofGPSdataloss.Toensuretripqualityandapplicability,tripswereincludedintheanalysisonlyif:1)thelengthofcycleislongerthan30seconds;and2)theaveragespeedofthecycleisgreaterthan5mph.
DataProcessingResultsFigure20andFigure21summarizethedataprocessingproceduresfortheMARTAandGRTAdata,respectively.Figure22andFigure23showthegeographiccoverageofMARTAandGRTAoperationsasreflectedinthefinalanalyticaldataset.

36
Figure20.ProcessingstepsforMARTAdata

37
Figure21.ProcessingstepsforGRTAdata

38
Figure22.GeographicCoverageofMARTABusRoutes

39
Figure23.GeographicCoverageofGRTABusRoutes

40
AppendixIIMOVESBackground
Table11.DefinitionsofSTPOperatingModeBinsinMOVES
Operating Mode ID Operating Mode Scaled Tractive
Power Vehicle Speed Vehicle Acceleration
Description (STPt, skW) (vt, mph) (a, mph/sec)
0 Deceleration/Braking at ≤ -2.0 OR (at < -1.0
AND at-1 <-1.0 AND at-2 <-1.0)
1 Idle -1.0 ≤ vt < 1.0 Any
11 Coast STPt< 0 0 ≤ vt < 25 Any
12 Cruise/Acceleration 0 ≤ STPt< 3 0 ≤ vt < 25 Any
13 Cruise/Acceleration 3 ≤ STPt< 6 0 ≤ vt < 25 Any
14 Cruise/Acceleration 6 ≤ STPt< 9 0 ≤ vt < 25 Any
15 Cruise/Acceleration 9 ≤ STPt< 12 0 ≤ vt < 25 Any
16 Cruise/Acceleration 12 ≤ STPt 0 ≤ vt < 25 Any
21 Coast STPt< 0 25 ≤ vt < 50 Any
22 Cruise/Acceleration 0 ≤ STPt< 3 25 ≤ vt < 50 Any
23 Cruise/Acceleration 3 ≤ STPt< 6 25 ≤ vt < 50 Any
24 Cruise/Acceleration 6 ≤ STPt< 9 25 ≤ vt < 50 Any
25 Cruise/Acceleration 9 ≤ STPt< 12 25 ≤ vt < 50 Any
27 Cruise/Acceleration 12 ≤ STPt< 18 25 ≤ vt < 50 Any
28 Cruise/Acceleration 18 ≤ STPt< 24 25 ≤ vt < 50 Any
29 Cruise/Acceleration 24 ≤ STPt< 30 25 ≤ vt < 50 Any
30 Cruise/Acceleration 30 ≤ STPt 25 ≤ vt < 50 Any
33 Cruise/Acceleration STPt< 6 50 ≤ vt Any
35 Cruise/Acceleration 6 ≤ STPt< 12 50 ≤ vt Any
37 Cruise/Acceleration 12 ≤ STPt<18 50 ≤ vt Any
38 Cruise/Acceleration 18 ≤ STPt< 24 50 ≤ vt Any
39 Cruise/Acceleration 24 ≤ STPt< 30 50 ≤ vt Any
40 Cruise/Acceleration 30 ≤ STPt 50 ≤ vt Any

41
Table12.STPParametersfromMOVES2014
Source Rolling Rotating Drag SourceMass FixedMassSourceType TypeID Term Term Term Metric Factor
Name ID A B C Tonnes MIntercityBus 41 1.29515 0 0.00371491 19.5937 17.1TransitBus 42 1.0944 0 0.00358702 16.556 17.1

42
AppendixIIIMOVESInputSettingsGeneralsettingsarelistedbelow,andthespecificsettingsarelistedinTable13.• Region:
o FultonCounty,Georgia• CalendarYear:
o 2015• Month:
o January
• DateandTime:o Weekday,7:00-8:00AM
• I/MStrategy:o Default2015I/MstrategyfromMOVES2014
• Meteorology(defaultvaluedeterminedbytimeandregionfromMOVES):o Temperature:30Fo Humidity:75%
• FuelSupplyandFuelFormulation:o DefaultwinterfuelsupplyandfuelsharefromMOVES
• SourceType:o Transitbus(sourcetypeID=42)forMARTAlocaltransitbuseso Intercitybus(sourcetypeID=41)forGRTAexpressbuses
• 23Links:o Togenerateanemissionrateforamodeofoperation,eachlinkisassigned100%
fractionofoneoperatingmodebino Timeisscaledtoonehourofoperationusinglinklengthandlinkaveragespeed

43
Table13.EmissionRateswithSpecificSettings
TypeofOperation ScenarioSetting FuelType AgeDistribution Cycle
LocalTransit
Currentfleet,currentdrivingstyle
DieselandCNG
CurrentMARTAfleetagedistribution(Figure10) Observed
DrivingCycleNewfleet,currentdrivingstyle CNG Age=0
Currentfleet,eco-driving
DieselandCNG
CurrentMARTAfleetagedistribution(Figure10)
Eco-cycle
Newfleet,eco-driving CNG Age=0
ExpressBusService
Currentfleet,currentdrivingstyle Diesel
CurrentGRTAfleetagedistribution(Figure11) Observed
DrivingCycleNewfleet,currentdrivingstyle CNG Age=0
Currentfleet,eco-driving Diesel
CurrentGRTAfleetagedistribution(Figure11)
Eco-cycle
Newfleet,eco-driving CNG Age=0

44
ReferencesArgonneNationalLaboratory.(2013).TheGreenhouseGases,RegulatoryEmissions,andEnergyUseinTransportation(GREET)Model.RetrievedNovember13,2015from:https://greet.es.anl.gov/
Barth,M.,An,F.,Norbeck,J.,&Ross,M.(1996).ModalEmissionsModeling:APhysicalApproach.TransportationResearchRecord:JournaloftheTransportationResearchBoard,(1520),81-88.
Barth,M.,&Boriboonsomsin,K.(2009).EnergyandEmissionsImpactsofaFreeway-basedDynamicEco-drivingSystem.TransportationResearchPartD:TransportandEnvironment,14(6),400-410.
Beusen,B.,Broekx,S.,Denys,T.,Beckx,C.,Degraeuwe,B.,Gijsbers,M.,&Panis,L.I.(2009).Usingon-boardLoggingDevicestoStudytheLonger-termImpactofanEco-drivingCourse.TransportationResearchPartD:TransportandEnvironment,14(7),514-520.
Dib,W.,Chasse,A.,Moulin,P.,Sciarretta,A.,andCorde,G.(2014).OptimalEnergyManagementforanElectricVehicleinEco-drivingApplications.ControlEngineeringPractice,29,299-307.
Feng,C.,R.Guensler,&M.Rodgers(2007).“TransitBusLoad-BasedModalEmissionRateModelDevelopment.”U.S.EnvironmentalProtectionAgency,OfficeofResearchandDevelopment,Washington,DC,EPA/600/R-07/106.
Gallivan,F.,&Grant,M.(2010).CurrentPracticesinGreenhouseGasEmissionsSavingsfromTransit(No.ProjectJ-7,TopicSH-09).
Guensler,R.,Liu,H.,Xu,Y.,&Rodgers,M.(2015).MOVES-MATRIX:Setup,Implementation,andApplication.CRC-25:RealWorldEmissionsWorkshop.March22-25,2015.LongBeach,California.
Guensler,R.H.Liu,X.Xu,Y.Xu,&M.Rodgers(2016).“MOVES-Matrix:Setup,Implementation,andApplication.”95thAnnualMeetingoftheTransportationResearchBoard.Washington,DC.January2016.
Guensler,R.,S.Yoon,C.Feng,H.Li,andJ.Jun(2005)."Heavy-DutyDieselVehicleModalEmissionModel(HDDV-MEM):Volume1:ModalEmissionModelingFramework.Volume2:ModalComponentsandOutputs."U.S.EnvironmentalProtectionAgency,Washington,DC,EPA/600/R-05/090.
Ho,S.H.,Wong,Y.D.,&Chang,V.W.C.(2015).WhatCanEco-drivingDoforSustainableRoadTransport?PerspectivesfromaCity(Singapore)Eco-drivingProgramme.SustainableCitiesandSociety,14,82-88.

45
Jun,J.,Guensler,R.,&Ogle,J.(2006).SmoothingMethodsDesignedtoMinimizetheImpactofGPSRandomErroronTravelDistance,Speed,andAccelerationProfileEstimates.TransportationResearchRecord:JournaloftheTransportationResearchBoard,1972,141–150
Mensing,F.,Bideaux,E.,Trigui,R.,&Tattegrain,H.(2013).Trajectoryoptimizationforeco-DrivingTakingintoAccountTrafficConstraints.TransportationResearchPartD:TransportandEnvironment,18,55-61.
Mensing,F.,Bideaux,E.,Trigui,R.,Ribet,J.,&Jeanneret,B.(2014).Eco-driving:AnEconomicorEcologicDrivingStyle?TransportationResearchPartC:EmergingTechnologies,38,110-121.
NationalTransitDatabase.(2014).AnnualDatabase:RevenueVehicleInventory.Retrievedfrom:http://www.ntdprogram.gov/
Ogle,J.,Guensler,R.,&Elango,V.(2005).Georgia'sCommuteAtlantaValuePricingProgram:RecruitmentMethodsandTravelDiaryResponseRates.TransportationResearchRecord:JournaloftheTransportationResearchBoard,(1931),28-37.
Qian,G.&Chung,E.(2011).EvaluatingEffectsofEco-drivingatTrafficIntersectionsBasedonTrafficMicro-simulation.AustralianTransportResearchForum2011Proceedings,Adelaide,Australia.
Rolim,C.,Baptista,P.,Duarte,G.,Farias,T.,andShiftan,Y.(2014).QuantificationoftheImpactsofEco-drivingTrainingandReal-timeFeedbackonUrbanBusesDriver'sBehaviour.TransportationResearchProcedia,3,70-79.
Rutty,M.,Matthews,L.,Andrey,J.,&DelMatto,T.(2013).Eco-driverTrainingwithintheCityofCalgary’sMunicipalFleet:MonitoringtheImpact.TransportationResearchPartD:TransportandEnvironment,24,44-51.
Saynor,B.(2011).ECOWILLDeliverable6.1:GuidelinesforDeliveringShort-DurationEco-drivingTrainingCourses.IntelligentEnergyEurope.Retrievedfrom:http://www.ecodrive.org/download/internal_documents/Deliverables/ecowill_deliverable_61_guidelines_for_delivering_dhort_duration_ecodriving_courses.pdf
Shancita,I.,Masjuki,H.H.,Kalam,M.A.,Fattah,I.R.,Rashed,M.M.,&Rashedul,H.K.(2014).Areviewonidlingreductionstrategiestoimprovefueleconomyandreduceexhaustemissionsoftransportvehicles.EnergyConversionandManagement,88,794-807.
Skelton,I.(2015)NaturalGasVehicleOverview.Presentedatthe2015AirandWasteManagementAssociationSouthernSectionAnnualMeetingandTechnicalConference.Retrievedfromhttp://www.awma-ss2015conference.com/wp-content/uploads/2015/09/5-Skelton-AGL-NGV-Presentation-for-AWMA-August-2015.pdfonMarch8,2016.

46
Strömberg,H.K.,andKarlsson,I.M.(2013).Comparativeeffectsofeco-drivinginitiativesaimedaturbanbusdrivers–Resultsfromafieldtrial.TransportationResearchPartD:TransportandEnvironment,22,28-33.
Suzdaleva,E.,&Nagy,I.(2014).Data-basedSpeed-limit-respectingEco-drivingSystem.TransportationResearchPartC:EmergingTechnologies,44,253-264.
TransportCanada(2004).FuelSense:MakingFleetandTransitOperationsMoreEfficient(CaseStudy24).UrbanTransportationShowcaseProgram:CaseStudiesinSustainableTransportation.CityofEdmonton,Alberta,Canada.July2004.Retrievedfrom:http://data.tc.gc.ca/archive/media/documents/programs/cs24e_fuelsense.pdf
Xu,Y.,Gbologah,F.E.,Lee,D.Y.,Liu,H.,Rodgers,M.O.,&Guensler,R.L.(2015).AssessmentofAlternativeFuelandPowertrainTransitBusOptionsUsingReal-worldOperationsData:Life-cycleFuelandEmissionsModeling.AppliedEnergy,154,143-159.
Xu,Y.,Elango,V.,Guensler,R.,&Khoeini,S.(2013a).IdleMonitoring,Real-TimeIntervention,andEmissionReductionsfromCobbCounty,Georgia,SchoolBuses.TransportationResearchRecord:JournaloftheTransportationResearchBoard,(2340),59-65.
Xu,Y.,Guensler,R.,&Rodgers,M.(2013b).SensitivityofEmissionsPredictionsBasedonGlobalPositioningSystem-basedCycleDataandAssumptionsofIdleCutpoints.Air&WasteManagementAssociation’s106thAnnualConferenceandExhibition,Chicago,IL.June25-28,2013.
Wåhlberg,A.E.(2007).Long-termeffectsoftrainingineconomicaldriving:Fuelconsumption,accidents,driveraccelerationbehaviorandtechnicalfeedback.InternationalJournalofIndustrialErgonomics,37(4),333-343.
Zarkadoula,M.,Zoidis,G.,&Tritopoulou,E.(2007).TrainingUrbanBusDriverstoPromoteSmartDriving:AnoteonaGreekEco-drivingPilotProgram.TransportationResearchPartD:TransportandEnvironment,12(6),449-451.
Related Documents