Journal of VLSI Signal Processing 32, 135–145, 2002 c 2002 Kluwer Academic Publishers. Manufactured in The Netherlands. Echocardiographic Image Sequence Segmentation and Analysis Using Self-Organizing Maps MOZART L. SIQUEIRA, JACOB SCHARCANSKI AND PHILIPPE O.A. NAVAUX Federal University of the Rio Grande do Sul, ∗ Porto Alegre, Brazil Received April 30, 2001; Revised October 3, 2001; Accepted November 19, 2001 Abstract. This paper presents a new approach for echocardiographic image sequence segmentation and a practical application of the results. The proposed method uses the self-organizing maps to approximate the probability density function of the image patterns. The map is post-processed, by the k-means clustering algorithm, in order to detect groups of neurons whose weights are similar. Each segmented image of the sequence is generated by correlating its pixels and clusters found in the map. The image sequence segmented was used to measure fetal heart structures. To refine the measurements we used a border detection technique based on the least-means squares error. The segmentation procedure was validated successfully by physicians. Keywords: echocardiography image sequence, self-organizing map, measurements of the fetal heart, segmentation 1. Introduction Nowadays, image acquisition systems are used by physicians for the early detection of a number of dis- eases. Within this context, fetal echocardiography rep- resents an important tool for the detection of congenital fetal heart defects. An impressive number of about 8 to 10 per 1000 babies are born in the south of Brazil with cardiac problems, which could be treated if detected in advance [1]. Images of the fetal heart are acquired by a transducer, freely maneuverable, which maps the heart structure through the ultrasound reflection on the in- ternal structures, and generate a video sequence of the heart movements. Although the ultrasound image re- veal many details of the heart structure, non-specialists usually have difficulty in interpreting these informa- tion. The segmentation of such images can help the operators to analyze these exams. Image segmentation is broadly used in a variety of images, e.g. natural images, multi-spectral images and medical images. The segmentation aims at identifying ∗ web: http://www.inf.ufrgs.br/∼segime regions, whose properties are similar according to some criteria. The segmented images are easier to deal with, because they are simplified versions of the originals which preserve their main features. Thus, it is possible to automatically obtain measurements from these seg- mented images, such as distances, areas and volumes. In the specific case of echocardiographic image sequences, segmentation can help a non-specialist to detect and diagnose congenital heart defects, and bet- ter define important structures that are not easily visible in the original image. Sometimes, based on such anal- ysis, physicians may suspect of specific diseases, and suggest accurate examinations in a pregnant woman. Besides, automatic measurements (e.g. intraventricu- lar septum width, or volume of cavities) can also be used to identify possible fetal diseases. Although ultrasound images present a lot of information, they are severely contaminated by speckle noise [2]. This noise corrupts the borders of anatomi- cal structures, making it difficult to perform the seg- mentation task. Another problem concerning fetal echocardiography is its non-stationarity—the result- ing image depends on the transducer position, on the

Welcome message from author
This document is posted to help you gain knowledge. Please leave a comment to let me know what you think about it! Share it to your friends and learn new things together.
Transcript

Journal of VLSI Signal Processing 32, 135–145, 2002c© 2002 Kluwer Academic Publishers. Manufactured in The Netherlands.
Echocardiographic Image Sequence Segmentation and AnalysisUsing Self-Organizing Maps
MOZART L. SIQUEIRA, JACOB SCHARCANSKI AND PHILIPPE O.A. NAVAUXFederal University of the Rio Grande do Sul,∗ Porto Alegre, Brazil
Received April 30, 2001; Revised October 3, 2001; Accepted November 19, 2001
Abstract. This paper presents a new approach for echocardiographic image sequence segmentation and a practicalapplication of the results. The proposed method uses the self-organizing maps to approximate the probability densityfunction of the image patterns. The map is post-processed, by the k-means clustering algorithm, in order to detectgroups of neurons whose weights are similar. Each segmented image of the sequence is generated by correlatingits pixels and clusters found in the map. The image sequence segmented was used to measure fetal heart structures.To refine the measurements we used a border detection technique based on the least-means squares error. Thesegmentation procedure was validated successfully by physicians.
Keywords: echocardiography image sequence, self-organizing map, measurements of the fetal heart,segmentation
1. Introduction
Nowadays, image acquisition systems are used byphysicians for the early detection of a number of dis-eases. Within this context, fetal echocardiography rep-resents an important tool for the detection of congenitalfetal heart defects. An impressive number of about 8 to10 per 1000 babies are born in the south of Brazil withcardiac problems, which could be treated if detected inadvance [1]. Images of the fetal heart are acquired by atransducer, freely maneuverable, which maps the heartstructure through the ultrasound reflection on the in-ternal structures, and generate a video sequence of theheart movements. Although the ultrasound image re-veal many details of the heart structure, non-specialistsusually have difficulty in interpreting these informa-tion. The segmentation of such images can help theoperators to analyze these exams.
Image segmentation is broadly used in a variety ofimages, e.g. natural images, multi-spectral images andmedical images. The segmentation aims at identifying
∗web: http://www.inf.ufrgs.br/∼segime
regions, whose properties are similar according to somecriteria. The segmented images are easier to deal with,because they are simplified versions of the originalswhich preserve their main features. Thus, it is possibleto automatically obtain measurements from these seg-mented images, such as distances, areas and volumes.
In the specific case of echocardiographic imagesequences, segmentation can help a non-specialist todetect and diagnose congenital heart defects, and bet-ter define important structures that are not easily visiblein the original image. Sometimes, based on such anal-ysis, physicians may suspect of specific diseases, andsuggest accurate examinations in a pregnant woman.Besides, automatic measurements (e.g. intraventricu-lar septum width, or volume of cavities) can also beused to identify possible fetal diseases.
Although ultrasound images present a lot ofinformation, they are severely contaminated by specklenoise [2]. This noise corrupts the borders of anatomi-cal structures, making it difficult to perform the seg-mentation task. Another problem concerning fetalechocardiography is its non-stationarity—the result-ing image depends on the transducer position, on the

136 Siqueira, Scharcanski and Navaux
fetus position and on the tissue composition betweenthe fetus and the transducer [3].
In order to reduce these problems, some segmenta-tion techniques based on neural networks have beenproposed [4–6]. Sussner [4] proposes a backpropaga-tion network, whose inputs are the mean gray value,variance and texture parameters retrieved from the localgray-level co-occurrence matrix (contrast, entropy andhomogeneity), for detecting the borders of the left ven-tricle. A similar network is described by Dahmer [5],were a backpropagation network is used to classify anentire fetal heart image into tissue and cavity. Thisapproach uses the same parameters: mean, variance,contrast, entropy and homogeneity. Similar to Poli andValli in [6], who proposed a neural architecture basedin Hopfield approach to segment medical images in 2Dand 3D.
Self-organizing maps (SOM) are successfully usedin a variety of applications, especially concerning im-age segmentation [7] and data mining [8]. This paperproposes the use of self-organizing maps [9], post-processed by the k-means clustering algorithm, forfetal echocardiographic image segmention. After thelearning phase, a clustering algorithm is used to groupneurons whose weights are similar in feature space.Parameters used in [4, 5] are analyzed and the most sig-nificant, according to the Bhattacharyya distance [10],are chosen—i.e. mean and variance.
The following section describes the image sequencesused in this work, and the most important anatomi-cal structures appearing in them. Section 3 discussesthe features that are extracted from these echocar-diographic images, showing the most representativeones, and makes considerations about performanceand processing time. Section 4 presents the pro-posed model; the neural network and the clusteringphase are explained. Section 5 discusses the perfor-mance of the proposed model, comparing it withtraditional segmentation methods. Section 6 presentsmeasurement results of intraventricular septum andventricle width for those sequences. These measure-ments may indicate the presence of congenital heartproblems. Finally, we present some final remarks atSection 7.
2. Echocardiographic Image Sequences
Echocardiography represents a quick and safe way toacquire images from the fetal heart. These images arestored as video sequences, and may be divided in many
Figure 1. Structures present in the four chamber view.
frames for individual processing. Based on these framesequences, physicians can diagnose different heart dis-eases. There are different standard views of the fe-tal heart, and each of them emphasizes some specificstructure. Among them, the four chamber view is themost complete. In the four chamber view it is possibleto check many structures at the same time and detectalmost two thirds of the known congenital heart dis-eases [11]. Figure 1 is an example of a fetal echocar-diography frame in the four chamber view. This fig-ure shows the region of interest, where the heart isplaced. It is possible to detect the main structures inthis view. These structures are: Left Ventricle (LV);Right Ventricle (RV); Left Atrium (LA); Right Atrium(RA); Tricuspid Valve (TV); Mitral Valve (MV); Mod-erator Band (MB); Intraventricular Septum (S); andDescending Aorta (DAo).
Some diseases are characterized by the displacementof certain heart structures, or by their abnormal sizeor shape. For example, the Ebstein’s abnormality con-sists of the displacement of the Tricuspid valve, makingthe Right Ventricle become smaller. Another commonproblem is the hypertrophy of the Septum [12].
3. Feature Selection
Feature selection plays an important role in the echocar-diographic image analysis. With feature selection tech-niques it is possible to reduce the dimensionality of theproblem, making image analysis more efficient. Theselection of features should be based on the separa-bility of the classes. The features that promote higherclass separability are the most significant, and shouldbe chosen to segment the image.
There are different methods to evaluate the class sep-arability. One common technique is the Bhattacharyyadistance, described by Fukunaga [10]. This distancewas designed to measure the total overlap area of twoprobability functions. The smaller the overlapping area,the higher is the Bhattacharyya distance. Equation 1

Echocardiographic Image Sequence Segmentation 137
Figure 2. (a) Original image; (b) mean; (c) variance; (d) entropy;(e) contrast; (f ) homogeneity.
describes the Bhattacharyya distance.
B = − ln∫ ∞
−∞
√p(x/w1)p(x/w2) dx (1)
Features previously used to classify blocks andsegment echocardiographic images, include the meangray-level, variance, entropy, contrast and homogene-ity [4, 5]. The last three features are extracted from thelocal gray-level co-occurrence matrix. Figure 2 illus-trates these features and their occurrence in an echocar-diography.
The separability between the classes was measuredfor each combination of features. Using only the mean,we achieved 7.673 of separability. Using the variance,the separability was 0.290. Contrast, entropy and ho-mogeneity presented 0.270, 0.211 and 0.189, respec-tively. This shows that the mean gray value is the mostsignificant feature among the five available. Using twofeatures, i.e. combining mean and variance, we ob-tained 12.507. On the other hand, combining meanand contrast we obtained 11.741. Using three features,the highest class separability value (i.e. 13.396) wasachieved by mean, contrast and entropy. It should be no-ticed that class separability was increase by 4.834 whenusing two, instead of one feature; and it was increasedonly by 0.889 when using three features, instead of two.Table 1 presents these results.
It is clear that class separability is similar for two orfor three features, and also that contrast, homogeneityand entropy require the calculation of local gray-levelco-occurrence matrices. Therefore, we chose mean and
Table 1. Bhattacharyya inter-class distances for different features.
Feature Bhattacharyya distance
Mean 7.673
Variance 0.290
Contrast 0.270
Entropy 0.211
Homogeneity 0.189
Mean and variance 12.507
Mean, contrast and entropy 13.396
variance as inputs to train our neural net for echocar-diographic image sequence segmentation.
4. Our Proposed Approach
The proposed model uses the self-organizing map(SOM), defined by Kohonen [9], to segment echocar-diographic image sequences. This network providesan unsupervised approach to extract patterns from un-known data and organize them in groups, accordingto their similarities. The similarity criterion adoptedby the self-organizing map is the Euclidean distance.Each neuron from the network is able to represent, ina compact way, a set of similar patterns.
The network must be trained to represent the mostfrequent samples. In order to avoid human interferencein the process, the samples are randomly chosen witha sliding window. The user just specifies the numberof samples, which must be enough to cover the entirearea of interest. The samples are extracted from someimages of the sequence, chosen randomly, as Fig. 3shows.
During the training phase, neurons tend to agglom-erate into different groups, according to the probabilitydensity function of pattern occurrence, Fig. 4. For thisreason, SOM is used for clustering in different applica-tions [8, 13]. Although each neuron in the network can
Figure 3. Process of choosing samples randomly.

138 Siqueira, Scharcanski and Navaux
Figure 4. Training phase and generation of the clustered map bySOM.
be considered as a center, better results can be achievedby grouping neighboring neurons in the featurespace.
For this reason, this paper proposes the applicationof a clustering method on the trained SOM, in a post-processing phase. The method to detect the clusters isthe well known K-means algorithm [14]. This method,applied to the SOM, analyses the weights of the neu-rons, and increases the distances among neurons be-longing to different clusters (inter-cluster distance).Thus, after clustering, the neurons are regrouped into areduced set of clusters. This set represents significantgroups in the map, the Fig. 5 show an example of atrained map post-processed by K-means.
The segmentation of each image of the sequence isdone after SOM clustering. The neural network detectsthe representative regions of the images, and identi-fies such regions on the entire image sequence. A slid-ing window moves through each image, extracting itsfeatures (mean and variance) and passing them to thenetwork. The winner neuron is found and the pixel onthe resulting image receives its label. This situation isillustrated in Fig. 6.
Figure 5. Post-processing phase by K-means.
Figure 6. Segmentation process.
Figure 7. Classification of the segmented image. (a) Originalimage; (b) segmented image.
Physicians are interested in the detection of thecavity and tissue regions in echocardiographic im-ages. So it is necessary to identify which segmentscorrespond to these regions. It is known that cavityregions absorb more ultrasound waves than tissueregions. As result, pixels representing cavity havedarker gray levels, whereas pixels representing tissueshave brighter gray levels. The regions whose pixelshave darker gray levels are considered as cavity, andthe others regions are considered tissue. This situationis illustrated in Fig. 7.
However, to classify the image in only two regionsusing the pixel gray levels may cause loss of importantinformation about the heart structures. The mostadequate segmentation depends on the application.For example, to measure the intraventricular septumwidth, the 2-clusters segmented sequence was consid-ered adequate. However, the images segmented usingmore clusters are better to visualize some less evidentheart structures.
The following section discusses the results obtainedby the application of the proposed method to echocar-diographies.
5. Sequence Segmentation Experimental Results
The proposed model has been evaluated in echocar-diographic image sequences, and compared with thek-means method directly applied to each image.The images have been pre-processed through his-togram equalization and the median filter. The criterionadopted to compare these techniques is the medical vi-sual evaluation. Figure 8 shows a subset of the imagescontained in the sequence: Figure 8(a) shows the heartat the instant maximum of systole, when the heart iscontracted and both valves are open; Figure 8(b) showsthe heart in an intermediate moment between systoleand diastole; and Fig. 8(c) shows the heart at the instant
Echocardiographic Image Sequence Segmentation 139
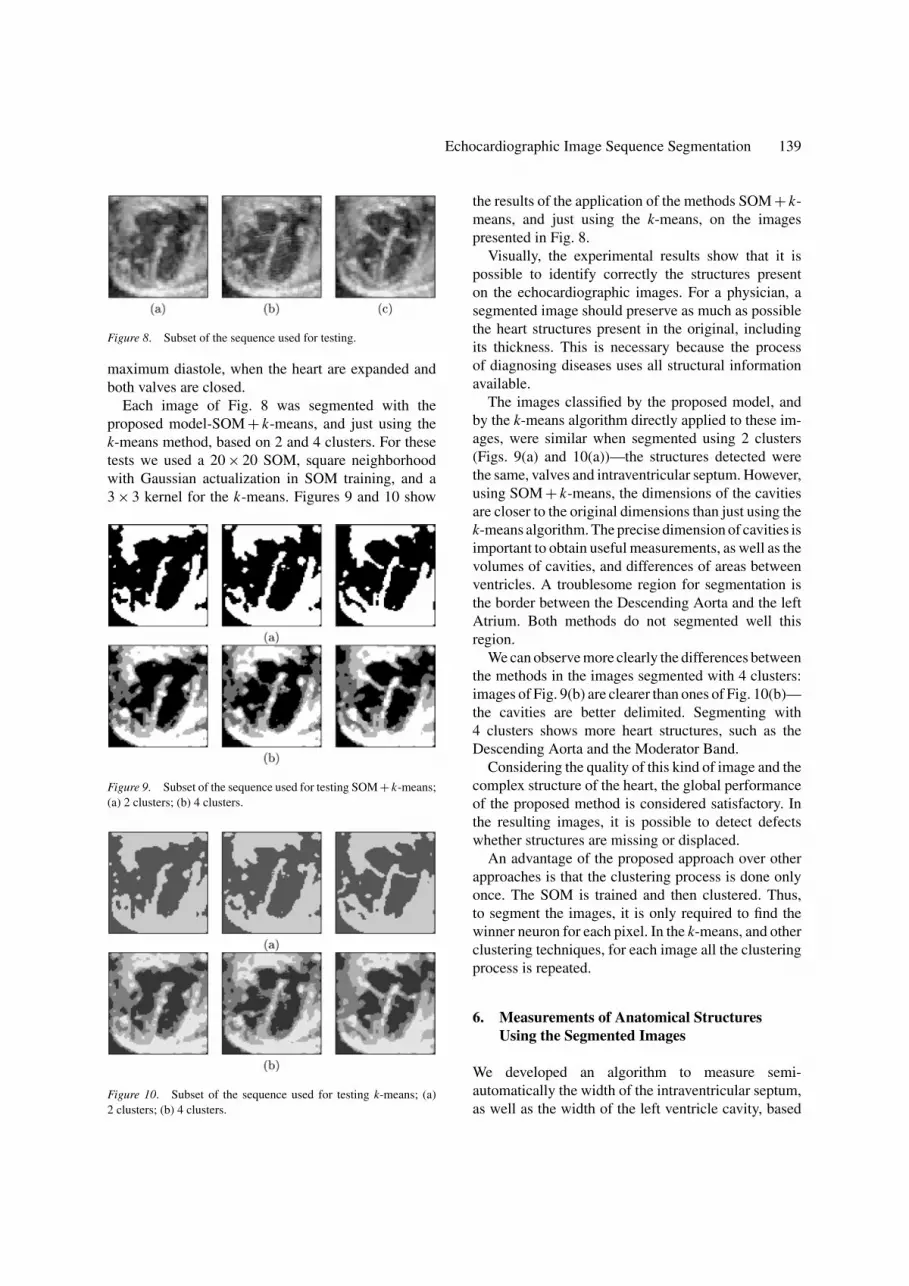
Figure 8. Subset of the sequence used for testing.
maximum diastole, when the heart are expanded andboth valves are closed.
Each image of Fig. 8 was segmented with theproposed model-SOM + k-means, and just using thek-means method, based on 2 and 4 clusters. For thesetests we used a 20 × 20 SOM, square neighborhoodwith Gaussian actualization in SOM training, and a3 × 3 kernel for the k-means. Figures 9 and 10 show
Figure 9. Subset of the sequence used for testing SOM + k-means;(a) 2 clusters; (b) 4 clusters.
Figure 10. Subset of the sequence used for testing k-means; (a)2 clusters; (b) 4 clusters.
the results of the application of the methods SOM + k-means, and just using the k-means, on the imagespresented in Fig. 8.
Visually, the experimental results show that it ispossible to identify correctly the structures presenton the echocardiographic images. For a physician, asegmented image should preserve as much as possiblethe heart structures present in the original, includingits thickness. This is necessary because the processof diagnosing diseases uses all structural informationavailable.
The images classified by the proposed model, andby the k-means algorithm directly applied to these im-ages, were similar when segmented using 2 clusters(Figs. 9(a) and 10(a))—the structures detected werethe same, valves and intraventricular septum. However,using SOM + k-means, the dimensions of the cavitiesare closer to the original dimensions than just using thek-means algorithm. The precise dimension of cavities isimportant to obtain useful measurements, as well as thevolumes of cavities, and differences of areas betweenventricles. A troublesome region for segmentation isthe border between the Descending Aorta and the leftAtrium. Both methods do not segmented well thisregion.
We can observe more clearly the differences betweenthe methods in the images segmented with 4 clusters:images of Fig. 9(b) are clearer than ones of Fig. 10(b)—the cavities are better delimited. Segmenting with4 clusters shows more heart structures, such as theDescending Aorta and the Moderator Band.
Considering the quality of this kind of image and thecomplex structure of the heart, the global performanceof the proposed method is considered satisfactory. Inthe resulting images, it is possible to detect defectswhether structures are missing or displaced.
An advantage of the proposed approach over otherapproaches is that the clustering process is done onlyonce. The SOM is trained and then clustered. Thus,to segment the images, it is only required to find thewinner neuron for each pixel. In the k-means, and otherclustering techniques, for each image all the clusteringprocess is repeated.
6. Measurements of Anatomical StructuresUsing the Segmented Images
We developed an algorithm to measure semi-automatically the width of the intraventricular septum,as well as the width of the left ventricle cavity, based

140 Siqueira, Scharcanski and Navaux
Figure 11. Manual measurements made by an expert: (a) ventricle;(b) intraventricular septum.
on the proposed segmentation model. The analysis ofthe variability of these width measurements indicatethe presence of congenital heart defects, like the hy-pertrophy of the intraventricular septum [12], causedby the existence of diabetes in the mother. These areamong the most popular measurements utilized in fetalechocardiographic image analysis.
In general, experts in fetal cardiology measure theseptum and/or the ventricle width when the fetal heartis in its maximum diastole. These measurements areoften based on the heart position immediately below themitral valve. A manual ventricle width measurement isshown in Fig. 11(a). The width of the intraventricularseptum is shown in Fig. 11(b).
Our algorithm implements the procedure describedabove, and it is intended to be used as a validation ofour segmentation method, as well as to provide physi-cians with a tool for extracting information from fetalechocardiographies.
Our first results were affected by ventricle internalwall discontinuities, which usually occur in these im-ages. According to physicians, these irregularities,
Figure 12. Results obtained for sequence 1.
Figure 13. Results obtained for sequence 2.
Figure 14. Results obtained for sequence 3.
which are called trabeculations, must not interfere withmeasurements. The solution adopted to reduce thelocation error of the ventricle internal walls will bediscussed in the subsection 6.1.
Figures 12–14 present the results obtained with threedifferent echocardiographic image sequences. For eachsequence, three sample frames are shown. The framesof the first sequence are shown in Fig. 12, which has14 images in total. The frames of the second and thirdsequences are shown in Figs. 13 and 14, and have 70and 60 frames in total, respectively. In each one of thosefigures, the original frames are presented as the set a,and the processed frames, as well as the measurementsobtained using our approach, are shown as the set b.
For the sake of clarity, the width measurements ob-tained for the ventricle and intraventricular septum aredisplayed in gray values, but the images were in factsegmented in two regions, i.e. the cavities are displayedas black and tissue as white.

Echocardiographic Image Sequence Segmentation 141
Figure 15. Plots of the results obtained for sequence 1.
Figure 16. Plots of the results obtained for sequence 2.
Figure 17. Plots of the results obtained for sequence 3.
Figures 15–17 show plots of the measured widthsof the three sequences, frame-by-frame. In those plots,part a shows the ventricle widths, and part b shows themeasured intraventricular septum widths. We adopted“pixels” as a standard unit for all frame measurements.The axis x represent the frame positions in the se-quences, and the axis y represent the measured width in
each frame. Such information is relevant to physicians,because it allows to evaluate the fetal heart dynamicsbased on the ventricular and intraventricular septumwidth variability.
Our method requires little user interaction. Thewidth measurement algorithm starts at a pixel in-formed by the user, indicating the location of the

142 Siqueira, Scharcanski and Navaux
Table 2. Evaluation of the measurements for sequence 1.
Septum width (pixels) Ventricle width (pixels)Image positionin the sequence Expert Our method Variation Expert Our method Variation
05 10 10 – 39 43 10.25%
07 8 8 – 40 41 2.43%
09 9 9 – 39 41 5.12%
11 10 9 10% 39 41 5.12%
13 9 9 – 40 41 2.43%
Means 9.2 9 2.17% 39.4 40.6 3.04%
Table 3. Evaluation of the measurements for sequence 2.
Septum width (pixels) Ventricle width (pixels)Image positionin the sequence Expert Our method Variation Expert Our method Variation
02 10 11 10% 41 42 2.43%
04 8 10 25% 44 45 2.27%
06 9 11 22.22% 44 43 2.27%
08 9 11 22.22% 43 40 6.97%
10 9 11 22.22% 43 42 2.32%
Means 9 10.8 20% 43 42.4 1.39%
Table 4. Evaluation of the measurements for sequence 3.
Septum width (pixels) Ventricle width (pixels)Image positionin the sequence Expert Our method Variation Expert Our method Variation
03 9 10 11.11% 44 44 –
04 10 10 – 40 42 5%
08 10 11 10% 41 41 –
09 10 10 42 41 2.38%
18 9 9 – 44 43 2.27%
Means 9.6 10 4.16% 42.2 42.2 –
intraventricular border in one particular frame of thesequence. However, it proceeds without user interac-tion, and estimates the border locations in the otherframes of the sequence. This interactive feature was de-signed to provide a better control and sense of securityfor the physician operating the system.
Our experimental results have been validated byexperts in fetal cardiology. Tables 2–4 present theirevaluation (i.e. manual width measurements), as wellas the measurement variability and mean width val-ues. It is a common practice to have width mea-surements obtained from just one image (i.e. frame),
corresponding to one maximum diastole in a sequence.For this work, the physicians have chosen five im-ages with maximum diastole from each sequence,and their manual measurements were compared withthe measurements obtained by our technique (i.e.the width measurements are made available for allframes of a sequence, after the user provides initial-ization). An advantage of our technique over the ex-perts’ analysis is the possibility of using the meanmeasured widths, obtained from selected images ina sequence, which improves measurement precision.These data can also be used to make other important

Echocardiographic Image Sequence Segmentation 143
measurements, such as ventricle volume and cavityarea.
Despite of ventricle border irregularities, our seg-mentation technique has showed reliable results. Thedifference between experts and our technique is con-sistent with differences found usually between experts.
6.1. Border Modeling and Tracking Technique
We model the border of a particular region of the im-age using a curve fitted by a least-means squared errortechnique. In this case, the least-means squared errorestimation helps us to select the curve that best fits thepixels located at the border of the ventricle wall.
Figure 18 shows a set of pixels, corresponding to anirregular part of the wall border. Each pixel is identifiedby its (x, y) coordinate pair. In order to model thatpart of border by a curve, and reduce the noise effecton measurements, we use the following second-ordermodel:
x = c0 + c1 y + c2 y2 (2)
where x and y are the border pixel coordinates, andc0, c1 and c2 are the curve model parameters. In orderto estimate the curve parameters that minimizes themean-squared error of the pixel locations with respectto those specified by the curve model (i.e. for each ycoordinate, the curve model estimates the x coordi-nate) the following linear algebraic equation system isresolved:
n∑
yi∑
y2i∑
yi∑
y2i
∑y3
i∑y2
i
∑y3
i
∑y4
i
c0
c1
c2
=
∑xi∑yi xi∑y2
i xi
(3)
Figure 18. Irregular part of the wall border.
Figure 19. Application of least-means square on the borders.
where n is the number of pixels. To resolve thislinear algebraic equation system we used the Gaussianelimination method [15].
The user informs the number of adjacent lines, and aseed point on the septum border, which is central to theborder region to be tracked in all frames. The borderpixels are fitted by a curve, as described above, and themean distance to the ventricle border is calculated. Theborder is tracked in the subsequent frames looking atthe set of border pixels that is closest to those found inthe previous frame.
Figure 19 shows the local border shape approxima-tion resultant from our technique. Figure 19(b) showsthe measurements without modeling the borders, andFig. 19(c) shows the same image with the boarderadjusted by the least-means squares error technique.
7. Concluding Remarks
This paper proposes a method for segmenting echocar-diographic image sequences using the self-organizingmap, post-processed by a clustering algorithm. Theneural network is used for detecting the most signifi-cant regions on the sample patterns extracted randomlyfrom the images.
An analysis of the features suggested by otherauthors for this kind of image, i.e. mean gray value,variance, entropy, contrast and homogeneity, showsthat the last three are not significant enough to be usedin the segmentation process. Besides, the quantizationof such features requires the computation of the localgray-level co-occurrence matrix, increasing the totalprocessing time.
The results achieved by the proposed method are bet-ter than the results of the direct application of a clus-tering algorithm, like the k-means on the images—theheart structures are correctly located and the cavitiesdimension are more defined. The good performance ofthe proposed method shows that the samples acquiredby random sampling have been enough to train thenetwork.

144 Siqueira, Scharcanski and Navaux
Based on the segmented images, it is possible tocheck whether the heart structures are present, and ifthey are in the correct position. Images segmented withthe proposed approach are suitable for different mea-surements. For example, the measurement of the intra-ventricular septum width produced satisfactory results.The experimental results indicate that our proposedmethod presents a performance comparable to man-ual measurements made on the same images. In thefuture, we intend to investigate further if the proposedmethod can be improved to obtain other measurementsof anatomical structures. Also, we plan to investigateif it could be used for color image segmentation, usingdifferent features.
Acknowledgments
We would like to thank Dr. Paulo Zielinsky andDr. Stelamares Luchese (Institute of Cardiology of RioGrande do Sul, Porto Alegre, Brazil) for their usefulcomments, and for the image sequences.
References
1. C. Firpo, “Estudo Evolutivo do Comportamento do SeptumPrimum Durante a Vida Intra-Uterina e Sua Relacao Com aPresenca de Extra-Sıstoles Atriais No Feto,” Master’ Thesis,CPGMP—Federal University of Rio Grande do Sul, PortoAlegre, Brazil, 1995, pp. 1–73.
2. C.B. Burckhardt, “Speckle in Ultrasound B-Mode Scans,” IEEETransactions on Sonics and Ultrasonics, vol. 25, 1978, pp. 1–6.
3. K.L. Reed and J.R. McCurdy, “Basic Technique of FetalEchocardiography,” Semin Ultrasound CT, MRI, 1993.
4. M. Sussner, Th. Budil, and G. Porenta, “Segmentation andEdge-Detection of Echocardiograms using Artificial NeuronalNetworks,” in Proceedings of International Conference EANN,1995.
5. A. Dahmer, “Segmentacao de Imagens Ecocardiograficas Uti-lizando Redes Neurais e Medidas de Textura,” Master’ Thesis,CPGCC—Federal University of Rio Grande do Sul, PortoAlegre, Brazil, 1998, pp. 1–100.
6. R. Poli and G. Valli, “Optimum Segmentation of Medical Imageswith Hopfield Neural Networks,” Technical Report, School ofComputer Science of University of Birmingham, 1995.
7. J. Moreira and L. da F. Costa, “ Neural-Based Color ImageSegmentation and Classification Using Self-Organizing Maps,”in Proceedings of SIBGRAPI, Caxambu, Brazil, 1996, pp. 47–54.
8. J. Vesanto, “Data Mining Techniques Based on the Self-Organizing Map,” Master’s Thesis, Department of EngineeringPhysics and Mathematics of Helsinki University of Technology,Espoo, Finland, 1997, pp. 1–63.
9. T. Kohonen, “The Self-Organizing Map,” in Proceedings of theIEEE, New York, USA, 1990, pp. 1464–1480.
10. K. Fukunaga, Statistical Pattern Recognition, San Diego,California: Academic Press, 1990.
11. J.C. Huhta and K.M. Rotondo, “Fetal Echocardiography,” inProceedings of Seminars in Roentgenology, vol. 26, 1991, pp. 5–11.
12. P. Zielinsky, “Malformacoes Cardıacas Fetais: Diagnostico eConduta,” in Arquivo Brasileiro de Cardiologia, Porto Alegre,Brazil, 1998.
13. N.W. Campbell, B.T. Thomas, and T. Troscianko, “Seg-mentation of Natural Images Using Self-Organizing FeatureMaps,” in Proceedings of British Machine Vision Conference,London: British Machine Vision Association, Edinburgh, 1996,pp. 223–232.
14. M. Sonka, V. Hlavac, and R. Boyle, Image Processing, Analysisand Machine Vision, Pacific Grove: PWS Publishing, 1998.
15. C.D. Moraes, Calculo Numerico Computacional: Teoria ePratica, Sao Paulo, Brazil: Atlas, 1989.
Mozart Lemos de Siqueira is Master student on Computer Sci-ence in the Informatics Institute at Federal University of Rio Grandedo Sul. He received the B.Sc. degree on Computer Science fromLutheran University of Brazil, in 1998. His current research includeimage processing and neural [email protected]
Jacob Scharcanski has a Ph.D. degree in Systems Design Engineer-ing (University of Waterloo, 1993), a M.Sc. degree in Computer Sci-ence (1984) and a B.Eng. in Electrical Engineering (1981), both fromthe Federal University of Rio Grande do Sul (Brazil). His main areasof interest are image processing and analysis, information retrieval,pattern recognition and industrial automation. Dr. Scharcanski wasa Post-Doctoral Fellow at the Pulp and Paper Centre, University ofToronto, working on simulation of paper forming using neural net-works, and on the analysis and interpretation of paper formation.Also, he was a Post-Doctoral Fellow at the Communications Group,Department of Electrical and Computer Engineering, University ofToronto, working on image processing and analysis. Currently, he isan Associate Professor at the Institute of Informatics, Federal Univer-sity of Rio Grande do Sul, Porto Alegre, RS, Brazil. He authored andco-authored more than 60 publications in Journals and Conferences,

Echocardiographic Image Sequence Segmentation 145
and has led to innovations in paper structural analysis by combinationof image analysis and statistical [email protected]
Philippe Olivier Alexandre Navaux is Professor in the InformaticsInstitute at the Federal University of Rio Grande do Sul. He received
the B.Sc. degree on Engineering from Federal University of RioGrande do Sul, Brazil, in 1970, the M.S. on Physics from the FederalUniversity of Rio Grande do Sul, Brazil, in 1973, and his Ph.D.on Computer Science from the Ensimag, University of Grenoble,France, in 1979. His current research include computer architecture,performance evaluation, and parallel and distributed [email protected]
Related Documents