i ECHO Quality Assurance Prepared for: U.S. Environmental Protection Agency Enforcement Targeting Data and Division Office of Compliance 1200 Pennsylvania Avenue, NW Washington, D.C. 20460 Prepared by: Eastern Research Group, Inc. 14555 Avion Parkway Suite 200 Chantilly, VA 20151-1102 February 2, 2017

Welcome message from author
This document is posted to help you gain knowledge. Please leave a comment to let me know what you think about it! Share it to your friends and learn new things together.
Transcript

i
ECHO Quality Assurance
Prepared for:
U.S. Environmental Protection Agency Enforcement Targeting Data and Division
Office of Compliance 1200 Pennsylvania Avenue, NW
Washington, D.C. 20460
Prepared by:
Eastern Research Group, Inc. 14555 Avion Parkway
Suite 200 Chantilly, VA 20151-1102
February 2, 2017

ii
This page is intentionally blank
iii
CONTENTS
Page
1. INTRODUCTION .................................................................................................................... 1
2. PROJECT MANAGEMENT ...................................................................................................... 2
2.1 Project Organization and Responsibilities .............................................................. 2
2.2 Project Records ....................................................................................................... 3
2.3 Assessment of QAPP Implementation .................................................................... 4
2.4 Project Status Reports for Management ................................................................. 5
3. PROJECT DESCRIPTION AND OBJECTIVES ............................................................................. 6
3.1 Problem Definition/Background ............................................................................. 6
3.2 Project Description .................................................................................................. 7
4. QUALITY CRITERIA, VERIFICATION, AND REPORTING .......................................................... 9
4.1 Quality Criteria and Verification ............................................................................ 9
4.2 Quality Reporting.................................................................................................. 14
5. SOFTWARE DEVELOPMENT AND TESTING PROCEDURES .................................................... 15
5.1 Unit Testing .......................................................................................................... 15
5.2 Integration Testing ................................................................................................ 15
5.3 System Testing ...................................................................................................... 15
5.4 User Acceptance Testing ...................................................................................... 16
5.5 Automated Regression Testing ............................................................................. 16
5.6 Source Code Review and Documentation ............................................................ 17
5.7 ECHO Static Content ............................................................................................ 17
5.8 ECHO Support ...................................................................................................... 17
6. REFERENCES ...................................................................................................................... 19
Appendix A: FORMAL TEST CASE EXAMPLE

iv
LIST OF TABLES
Page
Table 3-1. Key Products and Milestones .........................................................................................8
Table 4-1. Quality Specifications and Verification Methods for ECHO .......................................10
LIST OF FIGURES
Page
Figure 2-1. Project-Level QA Organization ....................................................................................3
Figure 4-1. Known Issues Task Management Process for ERG Development/Sprint Task
Board ..................................................................................................................................14

February 2, 2017
Page 1 of 24
1. INTRODUCTION
EPA’s Enforcement and Compliance History Online (ECHO) site is a primary EPA vehicle for
providing environmental compliance and enforcement data to the public and to government
employees. Following ECHO’s launch in 2002, demand has increased for access to
environmental compliance and enforcement data. In addition, the breadth of information and the
types of entities requesting the information have expanded. ECHO users include the general
public, regulated entities, non-governmental organizations, press, all levels of government
regulators, and academic researchers. ECHO supports the agency’s “Improve Transparency”
enforcement goal. ECHO was modernized in 2013 and 2014 and now operates more efficiently.
In addition to providing enforcement and compliance data to the public, ECHO provides access
to data analysis and program management tools. ECHO must continue to grow in utility, improve
in performance, operate reliably and efficiently, and stay relevant.
ERG is supporting EPA by conducting the following tasks:
Providing operation and maintenance support for all interfaces and associated
reports, including public ECHO features and restricted ECHO features (ECHO
Gov);
Web design, development, and documentation of new ECHO and ECHO Gov
web queries and reports; and
Developing and maintaining ECHO data tables; extraction, transformation, and
loading (ETL) flows; and web services.
This document details the quality specifications and verification methods used to assure
ECHO’s quality, and is responsive to all applicable elements of EPA Requirements for Quality
Assurance Project Plans QA/R-5 (EPA, 2001). The organization of this document is as follows:
Section 2 Project Management
Section 3 Project Description and Objectives
Section 4 Quality Criteria, Verification, and Reporting
Section 5 Software Development and Testing Procedures
Section 6 References

February 2, 2017
Page 2 of 24
2. PROJECT MANAGEMENT
This section addresses project management, including:
Project organization and responsibilities;
Project records; and
Assessment of the implementation of the ECHO Quality Assurance Project Plan
(QAPP) (ERG, 2016).
2.1 Project Organization and Responsibilities
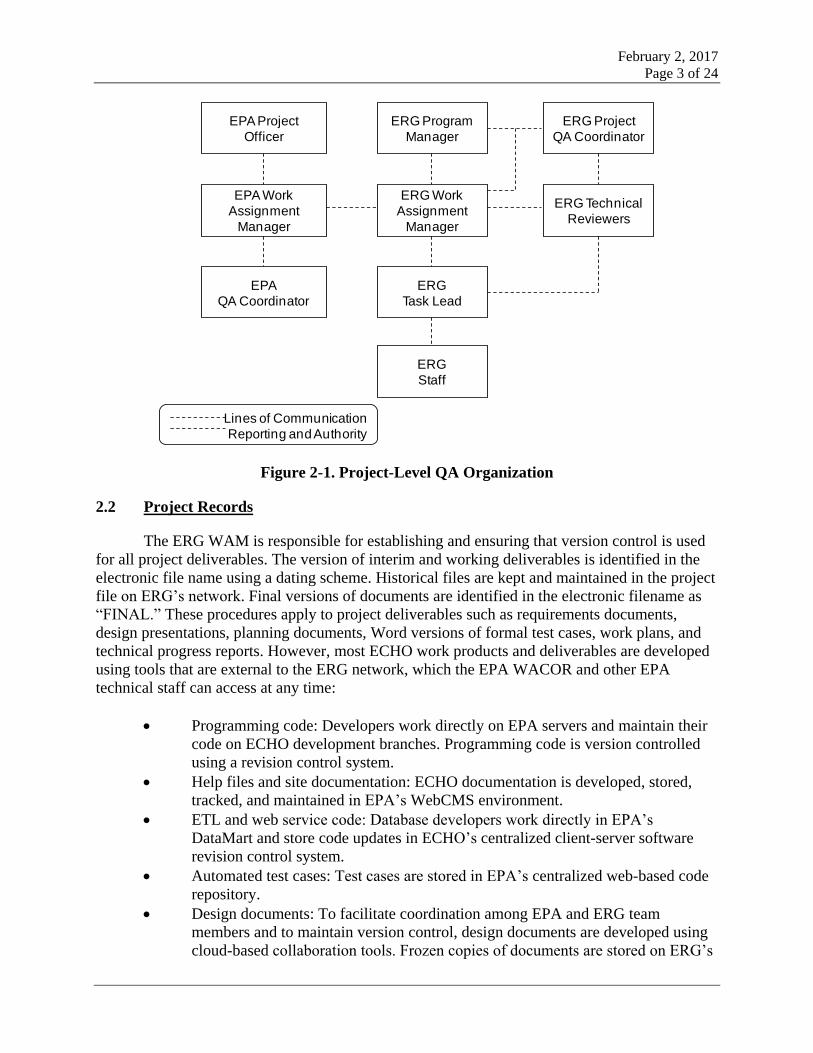
Project Organization is depicted in Figure 2-1, for staff with program management and
technical responsibilities and those with QA/QC roles. It shows the relationship and lines of
authority, reporting, and communication among all project participants, including those from
EPA.
The ERG WAM is the principal contact for the EPA Work Assignment Contracting
Officer’s Representative (WACOR) on project issues, deliverables, and schedule. The ERG
WAM is responsible for:
Ensuring that the quality of work, schedule, and budget meet the requirements of
the ECHO project;
Providing technical direction to ERG staff and managing the daily activities on
the project;
Maintaining the official, approved QAPP;
Obtaining appropriate technical review of all deliverables and ensuring
deliverables conform to EPA’s technical review requirements; and
Keeping the Project QA Coordinator and the Program Manager advised of any
quality problems that arise.
ERG’s Project QA Coordinator is responsible for ensuring that the requirements of the
ECHO QAPP are implemented and documented. The Project QA Coordinator works with the
ERG WAM in developing and executing QA activities throughout the project, including review
of the QAPP, data review, software testing, and results reporting. The Project QA Coordinator
also ensures that the ERG WAM is obtaining appropriate technical review of all deliverables.
ERG’s development team provides technical support for all programming, web
development, and deployment activities. ERG’s database analysts provide support for database,
ETL, and web service development and maintenance. ERG project staff also support software
and data quality testing and documentation.
February 2, 2017
Page 3 of 24
ERG Project
QA Coordinator
ERG Technical
Reviewers
ERG Program
Manager
ERG Work
Assignment
Manager
ERG
Task Lead
ERG
Staff
EPA Project
Officer
EPA Work
Assignment
Manager
EPA
QA Coordinator
Lines of Communication
Reporting and Authority
Figure 2-1. Project-Level QA Organization
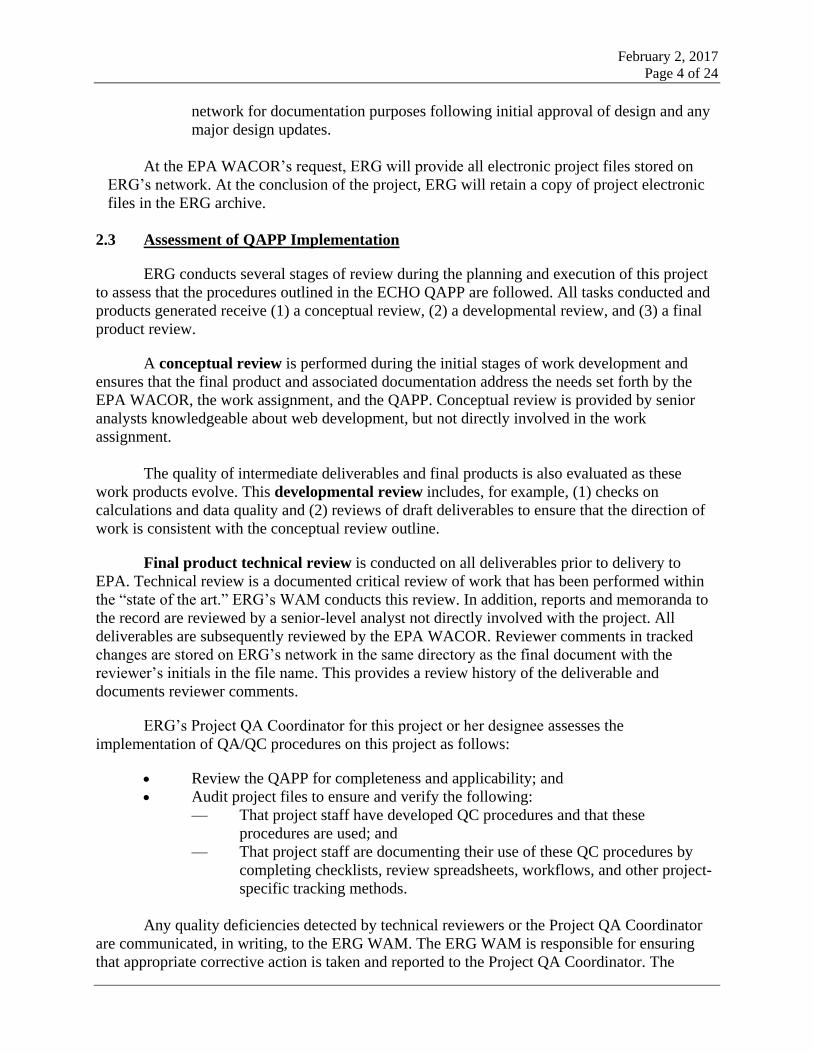
2.2 Project Records
The ERG WAM is responsible for establishing and ensuring that version control is used
for all project deliverables. The version of interim and working deliverables is identified in the
electronic file name using a dating scheme. Historical files are kept and maintained in the project
file on ERG’s network. Final versions of documents are identified in the electronic filename as
“FINAL.” These procedures apply to project deliverables such as requirements documents,
design presentations, planning documents, Word versions of formal test cases, work plans, and
technical progress reports. However, most ECHO work products and deliverables are developed
using tools that are external to the ERG network, which the EPA WACOR and other EPA
technical staff can access at any time:
Programming code: Developers work directly on EPA servers and maintain their
code on ECHO development branches. Programming code is version controlled
using a revision control system.
Help files and site documentation: ECHO documentation is developed, stored,
tracked, and maintained in EPA’s WebCMS environment.
ETL and web service code: Database developers work directly in EPA’s
DataMart and store code updates in ECHO’s centralized client-server software
revision control system.
Automated test cases: Test cases are stored in EPA’s centralized web-based code
repository.
Design documents: To facilitate coordination among EPA and ERG team
members and to maintain version control, design documents are developed using
cloud-based collaboration tools. Frozen copies of documents are stored on ERG’s
February 2, 2017
Page 4 of 24
network for documentation purposes following initial approval of design and any
major design updates.
At the EPA WACOR’s request, ERG will provide all electronic project files stored on
ERG’s network. At the conclusion of the project, ERG will retain a copy of project electronic
files in the ERG archive.
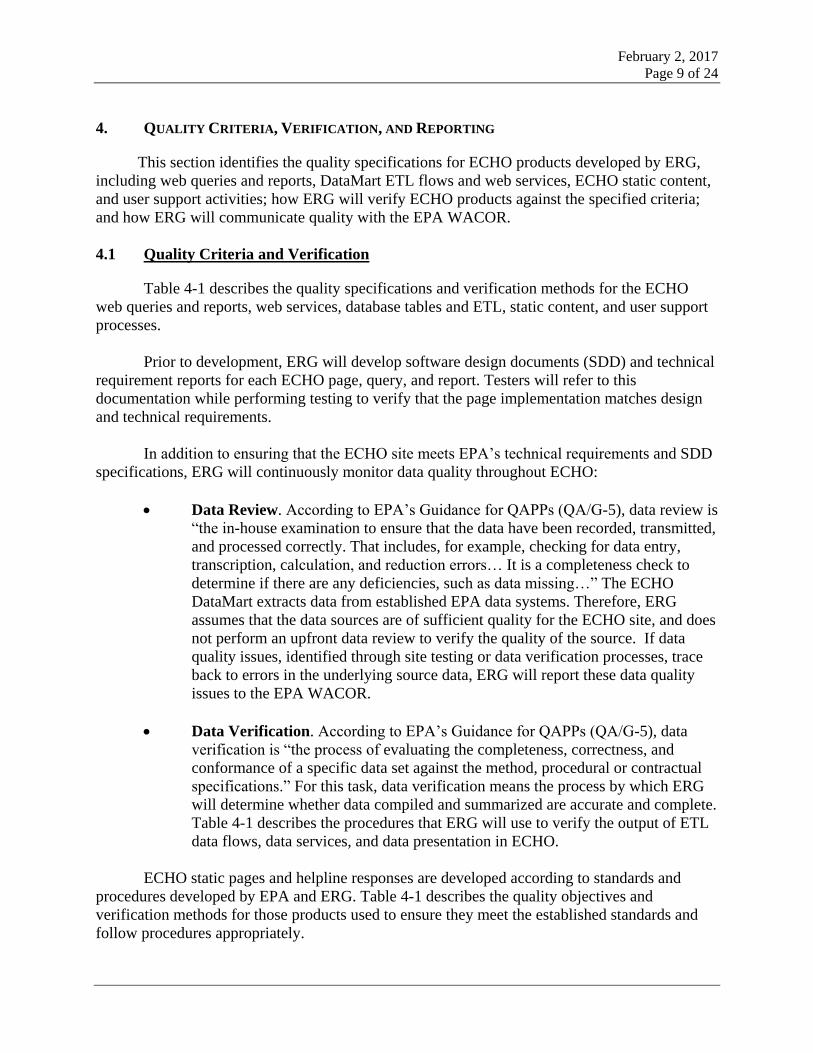
2.3 Assessment of QAPP Implementation
ERG conducts several stages of review during the planning and execution of this project
to assess that the procedures outlined in the ECHO QAPP are followed. All tasks conducted and
products generated receive (1) a conceptual review, (2) a developmental review, and (3) a final
product review.
A conceptual review is performed during the initial stages of work development and
ensures that the final product and associated documentation address the needs set forth by the
EPA WACOR, the work assignment, and the QAPP. Conceptual review is provided by senior
analysts knowledgeable about web development, but not directly involved in the work
assignment.
The quality of intermediate deliverables and final products is also evaluated as these
work products evolve. This developmental review includes, for example, (1) checks on
calculations and data quality and (2) reviews of draft deliverables to ensure that the direction of
work is consistent with the conceptual review outline.
Final product technical review is conducted on all deliverables prior to delivery to
EPA. Technical review is a documented critical review of work that has been performed within
the “state of the art.” ERG’s WAM conducts this review. In addition, reports and memoranda to
the record are reviewed by a senior-level analyst not directly involved with the project. All
deliverables are subsequently reviewed by the EPA WACOR. Reviewer comments in tracked
changes are stored on ERG’s network in the same directory as the final document with the
reviewer’s initials in the file name. This provides a review history of the deliverable and
documents reviewer comments.
ERG’s Project QA Coordinator for this project or her designee assesses the
implementation of QA/QC procedures on this project as follows:
Review the QAPP for completeness and applicability; and
Audit project files to ensure and verify the following:
— That project staff have developed QC procedures and that these
procedures are used; and
— That project staff are documenting their use of these QC procedures by
completing checklists, review spreadsheets, workflows, and other project-
specific tracking methods.
Any quality deficiencies detected by technical reviewers or the Project QA Coordinator
are communicated, in writing, to the ERG WAM. The ERG WAM is responsible for ensuring
that appropriate corrective action is taken and reported to the Project QA Coordinator. The

February 2, 2017
Page 5 of 24
Project QA Coordinator will notify the ERG Program Manager if, at any time, she considers the
project to have quality deficiencies and they are not being remedied in a timely manner. Upon
notification, the ERG Program Manager will conduct a project review. If she concurs that the
work is deficient, she may issue a stop work order until the deficiencies are remedied. The ERG
WAM will be notified immediately should this occur.
ERG will include any reports of corrective actions in the project QA files. At any time or
at the end of the project or work assignment, the Program Manager or her designee may inspect
the project QA files.
2.4 Project Status Reports for Management
Monthly, ERG will electronically submit to the EPA WACOR and Project Officer a
progress report that documents the costs incurred and work performed during the previous
accounting period and work planned for the current accounting period. At the request of the EPA
WACOR, ERG will provide a description of QA activities conducted for major project
deliverables.

February 2, 2017
Page 6 of 24
3. PROJECT DESCRIPTION AND OBJECTIVES
This section defines the purpose of the project. Planned execution of the project is
detailed in the following sections:
Section 4 describes how ERG will implement quality control procedures during
ECHO operation and maintenance activities, development of ECHO queries and
reports, and development of data tables, ETL, and web services; and
Section 5 describes the software development and testing procedures for ECHO.
3.1 Problem Definition/Background
EPA’s Office of Compliance (OC) created and modernized ECHO to:
Increase public and government agency access to environmental compliance and
enforcement data;
Support the Agency’s “Improve Transparency” Enforcement Goal; and
Improve operation and maintenance efficiency of the ECHO website.
OC implemented ECHO modernization using a phased approach. The first phase of
modernized ECHO primarily replaced existing functionality. Continued development of ECHO
will build new tools and improve existing functionality based on user feedback and OC
priorities. The overall objectives of the ECHO project include:
Increase utility of ECHO by adding new data, query tools, and reports, including:
– Incorporating modern technology and off-the-shelf products to promote
cutting-edge data presentations, development and maintenance
efficiencies, Web 2.0 concepts (including support for future mobile reports
and applications), and ease of navigation;
– Maximizing data availability, transparency, and usability for each target
audience, unless otherwise prohibited. This means that all presented data
will be documented and available for download. Summary or calculated
data will have drill downs to see the underlying data in calculations, and
new web services will be built and documented to increase data usage;
– Providing additional search features and data to support stronger
inspection and enforcement targeting;
Maintain and improve performance levels; and
Ensure site operates reliably and efficiently, including:
– Maintaining interface with ECHO DataMart at the National Computing
Center (NCC);
– Minimizing operation and maintenance costs by using efficient code and
template design, including overall use of style sheets and web application
framework; and
– Implementing security best practices.

February 2, 2017
Page 7 of 24
3.2 Project Description
ERG supported EPA in modernizing the existing ECHO content and features, and
provided O&M support for the modernized site. ERG’s continued support of ECHO includes
adding functionality enhancements and providing O&M support. ERG’s support of ECHO
involves using several tools which are described in Error! Reference source not found.. More
information about the tasks that ERG will support is described below.
Tool QA Purpose
Enhanced wiki, issue tracking, and version
control repository system for software
development
Centralized bug and task tracking system.
Documentation of practices, procedures, and
instructions.
Centralized tool for tracking code changes.
Hybrid centralized and distributed version
control system.
Track historical changes made to source code
Web-based code repository Centralized repository for automated testing software.
Version control
Client-server software revision control system Centralized repository for ETL scripts.
Version control.
Automated software testing framework for
web applications
Runs ECHO test cases.
Detects functionality issues.
Extracts results and maintains a testing log.
Automated web service testing application Runs ECHO web service test cases.
Detects functionality issues.
Extracts results and maintains a testing log.
Web-based task management tool used to
support agile workflows
Manage and discuss issues and detailed tasks related
to project goals and milestones.
Allows EPA to communicate potential issues.
EPA’s content management system Built-in revision tracking.
Enforcement of roles (editing, publishing).
EPA’s automated website testing software Scans site content for broken links, spelling and
grammar errors, and accessibility issues.
Cloud-based customer service platform Macros for standardizing responses to common
questions.
Allows messages to be categorized and assigned.
Web-based spreadsheet app that allows ERG,
EPA, and other contractors to work
simultaneously
Built in revision history and review tracking
Operation and Maintenance Support: ERG will assist EPA in providing on-going
operation and maintenance support for all current and future ECHO and ECHO Gov interfaces
and associated reports, including the following types of tasks:
Implement enhancements and revisions to existing interfaces;
Perform regular testing for functionality, data quality, security, and accessibility;
Maintain current documentation, edit site content, and load documents onto
ECHO; and
Provide user support.

February 2, 2017
Page 8 of 24
Web Design, Development, and Documentation: ERG will support EPA in the design,
development, testing, and documentation of ECHO and ECHO Gov web queries and reports.
This task includes requirements gathering, design specifications and prototyping, integrated
development environment architecture support, programming, testing, documentation, and
deployment of new ECHO and ECHO Gov features. This task also includes coordination of
development activities with the EPA technical lead and other EPA contractors.
Development of Data Tables, ETL, and Web Services. This task covers DataMart
modifications and maintenance tasks needed to support existing ECHO and ECHO Gov tools,
including the following types of tasks:
Physical and logical design of data tables;
Development and documentation of ETL data flows to extract data from the
assigned source databases, transform the data, and load the data tables;
Support of ECHO mapping capabilities on the Oracle spatial and an ArcGIS
server;
Documentation and automation of regular data refreshes;
Development, deployment, and timely documentation of web services;
Identification and resolution of performance bottlenecks in ETL and web services;
and
Database tuning to improve performance and efficiency.
The key products ERG will produce and milestones for ECHO are listed in Table 3-1.
Table 3-1. Key Products and Milestones
Key Products and Milestones Date
New/updated code and associated Drupal database
updates.
Support for database, ETL data flows, and REST
Services.
As directed by EPA WACOR (typically every two
weeks)
Current record of automated test cases Upon request by the EPA WACOR
Annual log of usage for each interface Each November-December
Final response to user questions/feedback Within 48 business hours for 90% of questions
February 2, 2017
Page 9 of 24
4. QUALITY CRITERIA, VERIFICATION, AND REPORTING
This section identifies the quality specifications for ECHO products developed by ERG,
including web queries and reports, DataMart ETL flows and web services, ECHO static content,
and user support activities; how ERG will verify ECHO products against the specified criteria;
and how ERG will communicate quality with the EPA WACOR.
4.1 Quality Criteria and Verification
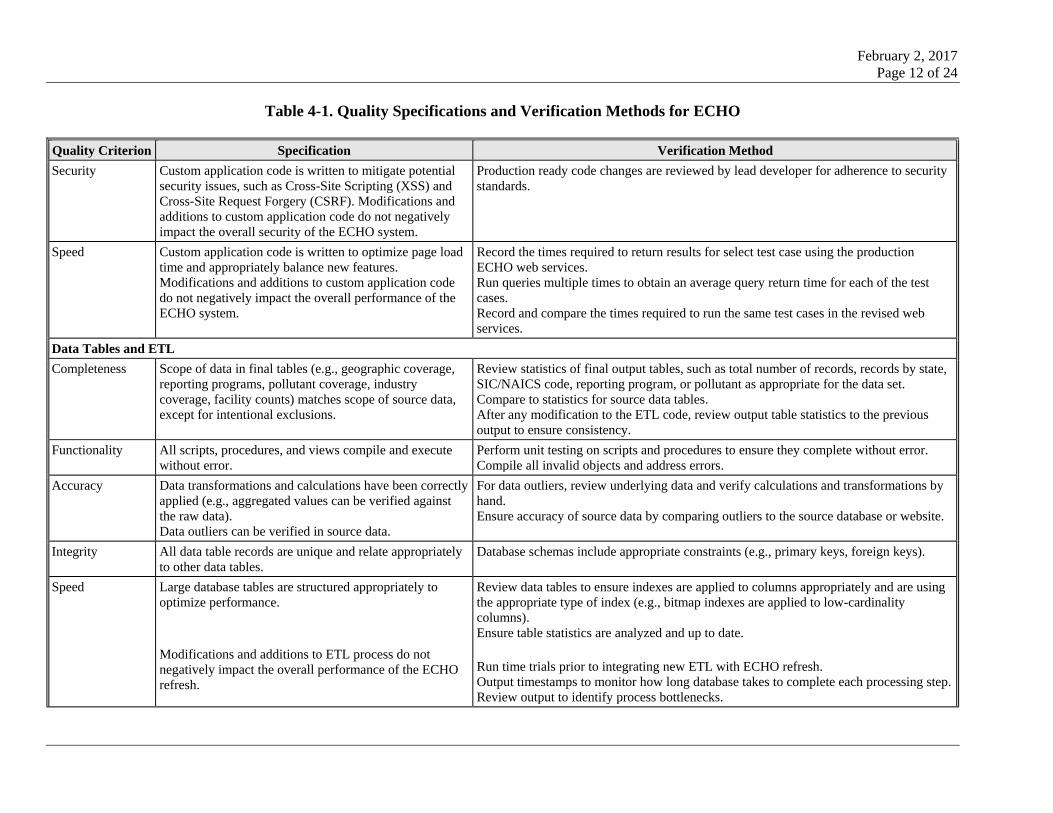
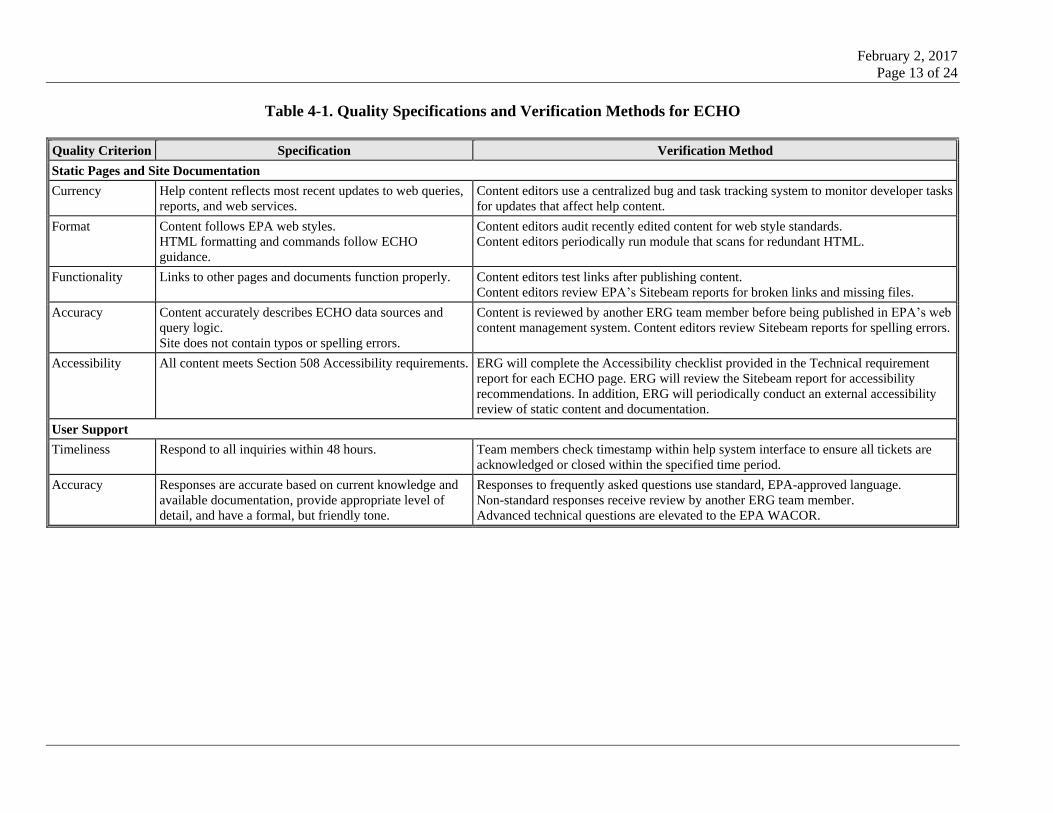
Table 4-1 describes the quality specifications and verification methods for the ECHO
web queries and reports, web services, database tables and ETL, static content, and user support
processes.
Prior to development, ERG will develop software design documents (SDD) and technical
requirement reports for each ECHO page, query, and report. Testers will refer to this
documentation while performing testing to verify that the page implementation matches design
and technical requirements.
In addition to ensuring that the ECHO site meets EPA’s technical requirements and SDD
specifications, ERG will continuously monitor data quality throughout ECHO:
Data Review. According to EPA’s Guidance for QAPPs (QA/G-5), data review is
“the in-house examination to ensure that the data have been recorded, transmitted,
and processed correctly. That includes, for example, checking for data entry,
transcription, calculation, and reduction errors… It is a completeness check to
determine if there are any deficiencies, such as data missing…” The ECHO
DataMart extracts data from established EPA data systems. Therefore, ERG
assumes that the data sources are of sufficient quality for the ECHO site, and does
not perform an upfront data review to verify the quality of the source. If data
quality issues, identified through site testing or data verification processes, trace
back to errors in the underlying source data, ERG will report these data quality
issues to the EPA WACOR.
Data Verification. According to EPA’s Guidance for QAPPs (QA/G-5), data
verification is “the process of evaluating the completeness, correctness, and
conformance of a specific data set against the method, procedural or contractual
specifications.” For this task, data verification means the process by which ERG
will determine whether data compiled and summarized are accurate and complete.
Table 4-1 describes the procedures that ERG will use to verify the output of ETL
data flows, data services, and data presentation in ECHO.
ECHO static pages and helpline responses are developed according to standards and
procedures developed by EPA and ERG. Table 4-1 describes the quality objectives and
verification methods for those products used to ensure they meet the established standards and
follow procedures appropriately.

February 2, 2017
Page 10 of 24
Table 4-1. Quality Specifications and Verification Methods for ECHO
Quality Criterion Specification Verification Method
Web Queries and Reports
Completeness Includes all appropriate search options, data fields and
records specified in the technical requirements.
Compare the page, query, and report elements to the list of elements specified in the
software design document (SDD).
Verify that all elements are displayed on the page as specified in the SDD.
Functionality Queries execute and pages load without error.
Behavior of user interface objects matches design
specifications.
Click all links, buttons, and other user interface controls.
Verify behavior matches SDD specifications.
Accuracy Search results reflect the underlying web services, apply
appropriate logic for selecting/interpreting service output,
and display service output in appropriate fields/columns.
All search criteria are captured in the web query’s service
call.
Compare values displayed in ECHO reports to results found by calling the web service
directly.
Confirm search criteria are displayed correctly on results pages.
For reports that use visual data displays, review the underlying data services to ensure
that the visual display is correctly capturing and interpreting the data.
Format Output format is appropriate for data type. Verify that the output format matches the SDD specifications.
Check high- and low-end numeric values for appropriate number of digits/decimals.
Speed ECHO queries perform at the same level or faster than
historic tests.
Record the times required to return results for select test case using the production
ECHO website.
Run queries multiple times to obtain an average query return time for each of the test
cases.
Record and compare the times required to run the same test cases in the revised website.
Security Information displayed on page matches the user role and
permissions.
Code complies with NCC security standards.
Use test user accounts to check user authorization and authentication on the site for
public and privileged roles. y
Test the ECHO login, site display, and secondary menus against the SDD specifications
for the different levels of access to ensure that the proper page elements and features are
displaying for each user type.
Submit all code to NCC security review prior to production deployments. Respond to
issues, as needed.
Accessibility All pages, queries, and reports meet Section 508
Accessibility requirements.
Complete the Accessibility checklist1 for each ECHO page, query, and report.
ERG accessibility experts will periodically conduct an external accessibility review of
new designs and features.
1 https://www.epa.gov/sites/production/files/2013-09/documents/eit-procurement-checklist.pdf

February 2, 2017
Page 11 of 24
Table 4-1. Quality Specifications and Verification Methods for ECHO
Quality Criterion Specification Verification Method
Browser
Compatibility
All pages, queries, and reports function consistently in
target browsers.
Test the ECHO site in Internet Explorer 9, 10 and 11, Chrome, and Firefox.
Address browser incompatibility issues according to priorities set by the EPA WACOR.
Test the ECHO site on desktop computers, and emulators representing laptops, tablets,
and smart phones.
Web Services/Site Data Quality
Completeness Service includes all input parameters for all search
options and output tags for all results.
Perform direct service calls using the list of parameters and expected inputs from the
SDD.
Verify output tags match the SDD list.
Accuracy Services correctly applies data transformations and
calculations.
Service correctly applies query criteria.
Verify that summary information and statistics accurately reflect the underlying detailed
data.
Service output contains data for all expected elements based on query criteria (e.g.,
service has RCRA IDs for all facilities if query specified “facility must have RCRA ID”).
Format Output format is appropriate for data type. Verify that the output format matches the SDD specifications.
Reasonableness Number of records returned by query matches
expectations established by legacy ECHO results and
historic tests.
Maximum and minimum values fall within the range of
reasonable results.
Compare search and query results to documented expected results from the legacy site
and results of previous test cases.
Test search results and reports against expectations established by team members
familiar with the underlying data and subject matter (e.g., industries or states expected to
return a large number of results). These expected results are documented in the formal
test cases.
Comparability Search results from one query (e.g., All Data Search) are
consistent with results generated from other queries in
ECHO (e.g., Summary information on a Detailed Facility
Report).
Trends reports show reasonable year-to-year variability.
Compare results for different reports in ECHO. For example, verify that compliance
status information on the facility search results is consistent with the Detailed Facility
Report.
Compare ECHO results to other web applications for consistency, such as Envirofacts,
TRI, and the DMR Pollutant Loading Tool.
Speed ECHO services perform at the same level or faster than
historic tests.
Record the times required to return results for select test case using the production
ECHO web services.
Run queries multiple times to obtain an average query return time for each of the test
cases.
Record and compare the times required to run the same test cases in the revised web
services.
Application Source Code
Readability Adheres to internal coding standards available to all
developers from the internal project wiki.
Production ready code changes are reviewed by lead developer for adherence to the code
quality standard. Standards are revised and expanded when appropriate.
February 2, 2017
Page 12 of 24
Table 4-1. Quality Specifications and Verification Methods for ECHO
Quality Criterion Specification Verification Method
Security Custom application code is written to mitigate potential
security issues, such as Cross-Site Scripting (XSS) and
Cross-Site Request Forgery (CSRF). Modifications and
additions to custom application code do not negatively
impact the overall security of the ECHO system.
Production ready code changes are reviewed by lead developer for adherence to security
standards.
Speed Custom application code is written to optimize page load
time and appropriately balance new features.
Modifications and additions to custom application code
do not negatively impact the overall performance of the
ECHO system.
Record the times required to return results for select test case using the production
ECHO web services.
Run queries multiple times to obtain an average query return time for each of the test
cases.
Record and compare the times required to run the same test cases in the revised web
services.
Data Tables and ETL
Completeness Scope of data in final tables (e.g., geographic coverage,
reporting programs, pollutant coverage, industry
coverage, facility counts) matches scope of source data,
except for intentional exclusions.
Review statistics of final output tables, such as total number of records, records by state,
SIC/NAICS code, reporting program, or pollutant as appropriate for the data set.
Compare to statistics for source data tables.
After any modification to the ETL code, review output table statistics to the previous
output to ensure consistency.
Functionality All scripts, procedures, and views compile and execute
without error.
Perform unit testing on scripts and procedures to ensure they complete without error.
Compile all invalid objects and address errors.
Accuracy Data transformations and calculations have been correctly
applied (e.g., aggregated values can be verified against
the raw data).
Data outliers can be verified in source data.
For data outliers, review underlying data and verify calculations and transformations by
hand.
Ensure accuracy of source data by comparing outliers to the source database or website.
Integrity All data table records are unique and relate appropriately
to other data tables.
Database schemas include appropriate constraints (e.g., primary keys, foreign keys).
Speed Large database tables are structured appropriately to
optimize performance.
Modifications and additions to ETL process do not
negatively impact the overall performance of the ECHO
refresh.
Review data tables to ensure indexes are applied to columns appropriately and are using
the appropriate type of index (e.g., bitmap indexes are applied to low-cardinality
columns).
Ensure table statistics are analyzed and up to date. Run time trials prior to integrating new ETL with ECHO refresh.
Output timestamps to monitor how long database takes to complete each processing step.
Review output to identify process bottlenecks.
February 2, 2017
Page 13 of 24
Table 4-1. Quality Specifications and Verification Methods for ECHO
Quality Criterion Specification Verification Method
Static Pages and Site Documentation
Currency Help content reflects most recent updates to web queries,
reports, and web services.
Content editors use a centralized bug and task tracking system to monitor developer tasks
for updates that affect help content.
Format Content follows EPA web styles.
HTML formatting and commands follow ECHO
guidance.
Content editors audit recently edited content for web style standards.
Content editors periodically run module that scans for redundant HTML.
Functionality Links to other pages and documents function properly. Content editors test links after publishing content.
Content editors review EPA’s Sitebeam reports for broken links and missing files.
Accuracy Content accurately describes ECHO data sources and
query logic.
Site does not contain typos or spelling errors.
Content is reviewed by another ERG team member before being published in EPA’s web
content management system. Content editors review Sitebeam reports for spelling errors.
Accessibility All content meets Section 508 Accessibility requirements. ERG will complete the Accessibility checklist provided in the Technical requirement
report for each ECHO page. ERG will review the Sitebeam report for accessibility
recommendations. In addition, ERG will periodically conduct an external accessibility
review of static content and documentation.
User Support
Timeliness Respond to all inquiries within 48 hours. Team members check timestamp within help system interface to ensure all tickets are
acknowledged or closed within the specified time period.
Accuracy Responses are accurate based on current knowledge and
available documentation, provide appropriate level of
detail, and have a formal, but friendly tone.
Responses to frequently asked questions use standard, EPA-approved language.
Non-standard responses receive review by another ERG team member.
Advanced technical questions are elevated to the EPA WACOR.

February 2, 2017
Page 14 of 24
4.2 Quality Reporting
ERG uses a web-based agile task management tool to track issues identified during
testing. Figure 4-1 illustrates the process that ERG uses to manage tasks on the ERG
Development/Sprint task board. Testers identify issues that impact the user interface or web
services and add descriptions of the issues to the Development/Sprint task board. The ERG task
lead reviews the Development/Sprint task board and prioritizes issues for developers to address
for the next development cycle. After developers have addressed the high priority issues, testers
retest the code and update the Development/Sprint task board accordingly.
Prior to deployment, ERG testers communicate the remaining known issues to the EPA
WACOR via the task management tool. The EPA WACOR determines whether the website is of
adequate quality for deployment. After the website is approved for deployment, the ERG testing
lead provides the final list of known issues to the EPA WACOR via the Known Issues task
board. Based on that board, ERG also summarizes the list of issues for posting on the public
ECHO website. ERG maintains a history, on ERG’s network, of test cases performed and their
results for each ECHO code deployment.
Tester adds card to To Do list or
Backlog list
Developer transitions card to
In Progress list
Developer transitions card to Ready for Testing
list
Tester reviews functionality in development environment
Tester transitions card to
Confirmed list
Tester reviews functionality in
staging environment
Tester archives card
Figure 4-1. Known Issues Task Management Process for ERG Development/Sprint Task
Board

February 2, 2017
Page 15 of 24
5. SOFTWARE DEVELOPMENT AND TESTING PROCEDURES
This section describes the ECHO architecture, development workflow, and testing and
maintenance procedures.
ERG performs the following types of testing on the calculation modules’ codes following
any major updates to the programming code:
Unit Testing;
Integration Testing;
System Testing;
User Acceptance Testing;
Automated Regression Testing; and
Source Code Review and Testing.
5.1 Unit Testing
Individual developers conduct unit testing as they code individual functions or blocks of
code. Although the developers do not generate a unit testing report and documentation, they are
required to confirm the following before releasing materials for integration testing:
Functional requirements are completely fulfilled for the pages in question;
Functionality of new functions and methods is documented; and
New code does not break any existing unit tests.
5.2 Integration Testing
The lead programmer conducts system testing by examining integrated units and
modules, grouped as appropriate. During integration testing, the lead programmer ensures that
the new code addition does not impact the stable code base and that all parts of the integrated
code function properly. The lead programmer alerts the developers of any bugs identified during
testing and the developers revise and retest the code. The lead programmer also reviews code to
ensure that it meets design specifications, as described in the SDD and technical requirements
report. These documents are drafted by ERG and reviewed and approved by EPA prior to
development.
5.3 System Testing
An ERG testing team conducts functional testing to verify that the code functions as
expected. The ERG testing team performs test cases to evaluate the website code against the
quality criteria described in Section 4. ERG testers communicate any issues to the ERG
programming team to identify and correct the source of the error. ERG retests code following
revisions. ERG testers also perform random monthly testing of searches and reports on ECHO’s
production site, and communicate any issues to the EPA WACOR in writing. Individual test
cases specify:
Scenarios users are expected to execute;
Values that should work in each scenario;

February 2, 2017
Page 16 of 24
Values that should return errors;
The appropriate error messages according to the type of value;
Output to be checked against expected values;
Levels of access to be tested; and
Any other relevant functional or technical specifications.
5.4 User Acceptance Testing
The ERG WAM coordinates with the EPA WACOR to determine when the website is of
adequate quality for user acceptance testing (UAT). The EPA WACOR coordinates UAT,
collects comments, and prioritizes comments to be addressed in future development cycles.
5.5 Automated Regression Testing
ERG testers maintain automated test cases and conduct automated testing procedures on a
regular basis to verify the ECHO front end interface as well as web services. Automated test
cases are maintained on centralized EPA repositories to assure version control. The results of
manual and automated front end and web service testing are documented on ERG’s local
network.
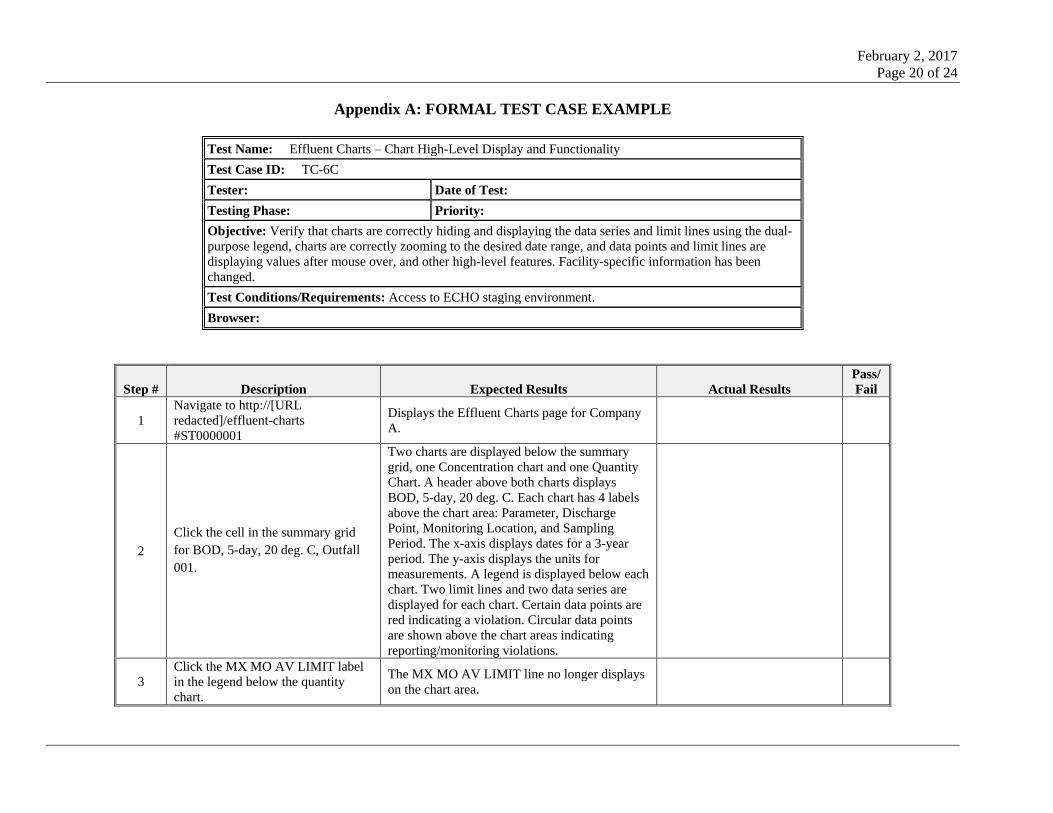
Front end test cases test ECHO features according to ERG’s current formal test cases (see
Appendix A for a formal front end test case example). Front end test cases are developed using
an automation framework and executed with custom VBA. Front end test cases produce a log file
containing test results, including any errors that occurred. Log files are maintained as
documentation. Testers review log files for errors, manually investigate and confirm the errors,
and report error details to the EPA WACOR.
Web service test cases verify all ECHO web services for data quality. Web service test
cases are developed based on ERG’s formal ECHO test cases, informal ECHO testing
knowledge, and historical issues identified during testing of the ECHO DataMart. ERG
maintains web service test cases using automated testing software. The web service test cases
produce testing result files that describe data quality issues. Testers manually review the results,
investigate any data quality errors, and report issues to the EPA WACOR. Documentation
describing web service test cases is maintained on ERG’s local network and on the ECHO
Development Wiki.
ERG conducts front end automated testing on the staging environment prior to requesting
NCC code reviews on ECHO or ECHO Lab (typically on a bimonthly basis). ERG also conducts
front end automated testing on echo.epa.gov after each software release, and within the ECHO
Lab environment after significant code merges.
ERG conducts web service automated test cases on a weekly basis, consistent with the
ECHO DataMart weekly refresh schedule. ERG reports issues immediately when they are
detected, and conducts bi-weekly quality review meetings with the EPA WACOR. At the quality
review meetings, ERG and EPA discuss issues that the automated test cases detect, as well as
new automated test cases to be developed.

February 2, 2017
Page 17 of 24
5.6 Source Code Review and Documentation
ERG developers include ‘developer comments’ in the source code. Source code also
adheres to internal coding standards to ensure code is reasonably self-documenting and readable.
Comments enable future developers to understand the purpose and flow of each module. The
ERG lead developer reviews all changes to source code to ensure that the ERG programming
team follows all coding standards and provides the appropriate level of detail in the
documentation embedded in the source code.
5.7 ECHO Static Content
New and updated content is drafted in EPA’s web content management system and
reviewed by the EPA WACOR prior to publication. Revisions are automatically saved to
facilitate comparison of previously published content.
ERG team members regularly review existing ECHO help pages and other
documentation to ensure that help content is consistent with new development during each code
release. ERG drafts and publishes minor updates accompanying code releases (e.g., adding or
modifying search results column descriptions). Content with substantial revisions is drafted for
review by an ERG Editor, and as appropriate, the EPA WACOR.
Content created in ECHO follows EPA web styles. Since ECHO maintains a separate
instance of Drupal from the EPA WebCMS, ERG developed a guidance page for creating ECHO
content to clarify site-specific standards, such as content organization and restrictions ERG
periodically reviews pages to make sure content, formatting, and organization are consistent with
EPA web style and ECHO guidance. The location of a new page within the site organization is
approved by the EPA WACOR before the content is drafted.
Site content is written by default in Filtered HTML text format, which restricts the types
of formatting and commands that can be used in HTML. However, the text format may be
upgraded to Advanced HTML to allow enhanced formatting and functionality. ERG developed a
function to scan the WebCMS database for unnecessary or redundant HTML. ERG periodically
runs the report to assess whether specific pages formatted in Advanced HTML can be
downgraded to Filtered HTML, and remove redundant code.
EPA maintains a subscription to Sitebeam, a software tool for automated website testing.
Sitebeam provides a suite of metrics that scan and provide feedback on usability and accessibility
features on web pages, including spelling and grammar, broken links, speed, accessibility
standards compliance, and search engine results. EPA provided two ERG team members access
to the Sitebeam website. ERG reviews the reports each month to identify and correct updated or
broken links, missing files, and spelling errors that may exist in ECHO. ERG also periodically
reviews other content and accessibility summaries and recommendations from the Sitebeam
reports.
5.8 ECHO Support
ERG manages ECHO’s technical user support services. Most support requests are
received through the Contact Us page in ECHO, with additional requests forwarded from the

February 2, 2017
Page 18 of 24
EPA WACOR. All messages sent through the ECHO Contact Us page are routed to Zendesk
customer service software. ERG responds to messages using Zendesk, and occasionally via
phone, upon request. ERG developed SOPs that are shared with all ERG team members (ERG,
2015). ERG will update the SOPs throughout the course of the project as needed.
ERG Support team members use macros within Zendesk to maintain and retrieve
responses to common questions. This feature enables ERG to write responses quickly and easily
with standard, EPA WACOR-approved language (e.g., login issues, historical data requests,
error reporting). Each non-standard response is reviewed by a second team member for accuracy,
clarity, and tone. Questions that cannot be answered by an ERG team member are elevated to the
EPA WACOR or specific EPA staff, as outlined in the ECHO Support SOPs.
ERG monitors Zendesk several times a day. ERG staff strive to respond to all messages
within 48 hours. Urgent messages, such as registration or site access issues and potential bugs,
are addressed as soon as possible (usually within 2 hours of receipt). If a particular response or
resolution will require additional time (e.g., to request input from an EPA subject matter expert),
ERG will provide acknowledgement to the commenter that the inquiry is in-progress.
Zendesk retains all messages and responses together as tickets. Zendesk allows tickets to
be quickly retrieved by organizing tickets by ECHO user name, category (customized by ECHO
topics), and other message metadata. Categories used to flag tickets by topic are described in the
ECHO Support SOPs. The complete message history enables ECHO help desk staff to better
respond to individual users and streamlines recordkeeping. ERG discusses feedback received
through the helpline and support requests forwarded by EPA with the EPA WACOR during
weekly status meetings. ERG reports the number of tickets received each month to the EPA
WACOR.
February 2, 2017
Page 19 of 24
6. REFERENCES
EPA, 2001. U.S. Environmental Protection Agency. EPA Requirements for Quality Assurance
Project Plans QA/R-5. EPA/240/B-01/003. Office of Environmental Information. March 2001.
EPA, 2002. U.S. Environmental Protection Agency. Guidance for Quality Assurance Project
Plans QA/G-5. EPA/240/R-02/009. Office of Environmental Information. March 2001.
ERG, 2016. Eastern Research Group, Inc. Quality Assurance Project Plan for ECHO Website.
September 2016.
February 2, 2017
Page 20 of 24
Appendix A: FORMAL TEST CASE EXAMPLE
Test Name: Effluent Charts – Chart High-Level Display and Functionality
Test Case ID: TC-6C
Tester: Date of Test:
Testing Phase: Priority:
Objective: Verify that charts are correctly hiding and displaying the data series and limit lines using the dual-
purpose legend, charts are correctly zooming to the desired date range, and data points and limit lines are
displaying values after mouse over, and other high-level features. Facility-specific information has been
changed.
Test Conditions/Requirements: Access to ECHO staging environment.
Browser:
Step # Description Expected Results Actual Results
Pass/
Fail
1
Navigate to http://[URL
redacted]/effluent-charts
#ST0000001
Displays the Effluent Charts page for Company
A.
2
Click the cell in the summary grid
for BOD, 5-day, 20 deg. C, Outfall
001.
Two charts are displayed below the summary
grid, one Concentration chart and one Quantity
Chart. A header above both charts displays
BOD, 5-day, 20 deg. C. Each chart has 4 labels
above the chart area: Parameter, Discharge
Point, Monitoring Location, and Sampling
Period. The x-axis displays dates for a 3-year
period. The y-axis displays the units for
measurements. A legend is displayed below each
chart. Two limit lines and two data series are
displayed for each chart. Certain data points are
red indicating a violation. Circular data points
are shown above the chart areas indicating
reporting/monitoring violations.
3
Click the MX MO AV LIMIT label
in the legend below the quantity
chart.
The MX MO AV LIMIT line no longer displays
on the chart area.
February 2, 2017
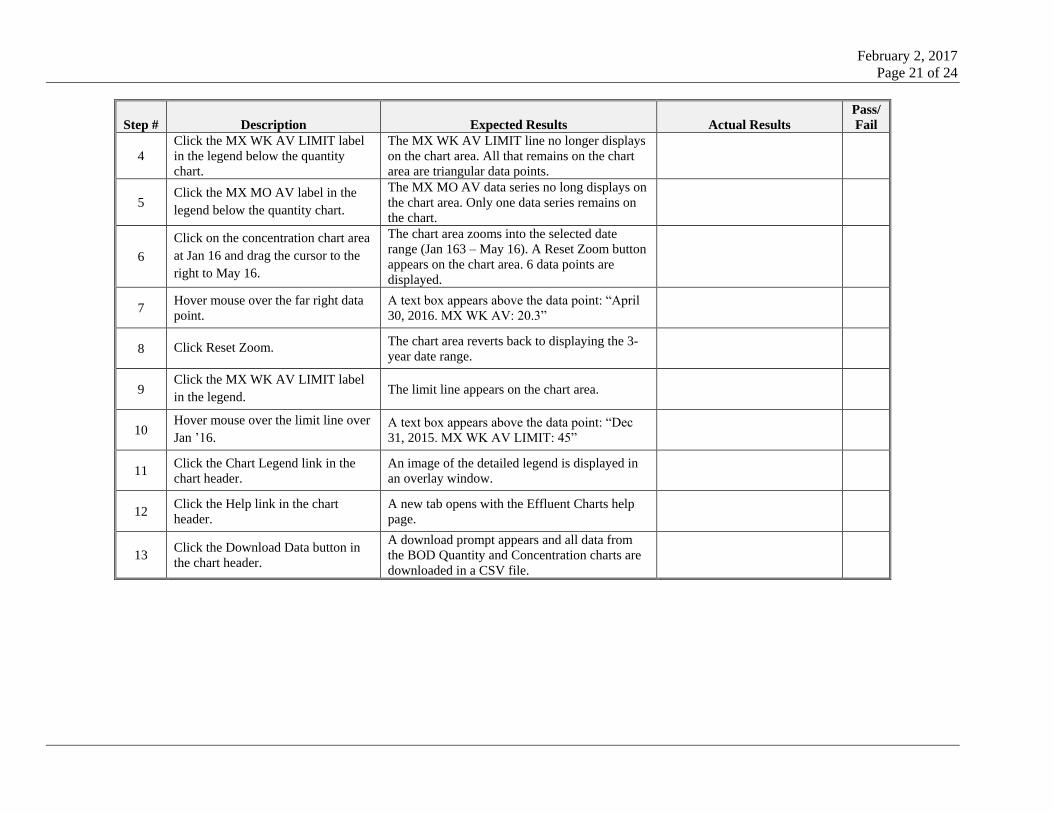
Page 21 of 24
Step # Description Expected Results Actual Results
Pass/
Fail
4
Click the MX WK AV LIMIT label
in the legend below the quantity
chart.
The MX WK AV LIMIT line no longer displays
on the chart area. All that remains on the chart
area are triangular data points.
5 Click the MX MO AV label in the
legend below the quantity chart.
The MX MO AV data series no long displays on
the chart area. Only one data series remains on
the chart.
6
Click on the concentration chart area
at Jan 16 and drag the cursor to the
right to May 16.
The chart area zooms into the selected date
range (Jan 163 – May 16). A Reset Zoom button
appears on the chart area. 6 data points are
displayed.
7 Hover mouse over the far right data
point.
A text box appears above the data point: “April
30, 2016. MX WK AV: 20.3”
8 Click Reset Zoom. The chart area reverts back to displaying the 3-
year date range.
9 Click the MX WK AV LIMIT label
in the legend. The limit line appears on the chart area.
10 Hover mouse over the limit line over
Jan ’16.
A text box appears above the data point: “Dec
31, 2015. MX WK AV LIMIT: 45”
11 Click the Chart Legend link in the
chart header.
An image of the detailed legend is displayed in
an overlay window.
12 Click the Help link in the chart
header.
A new tab opens with the Effluent Charts help
page.
13 Click the Download Data button in
the chart header.
A download prompt appears and all data from
the BOD Quantity and Concentration charts are
downloaded in a CSV file.
February 2, 2017
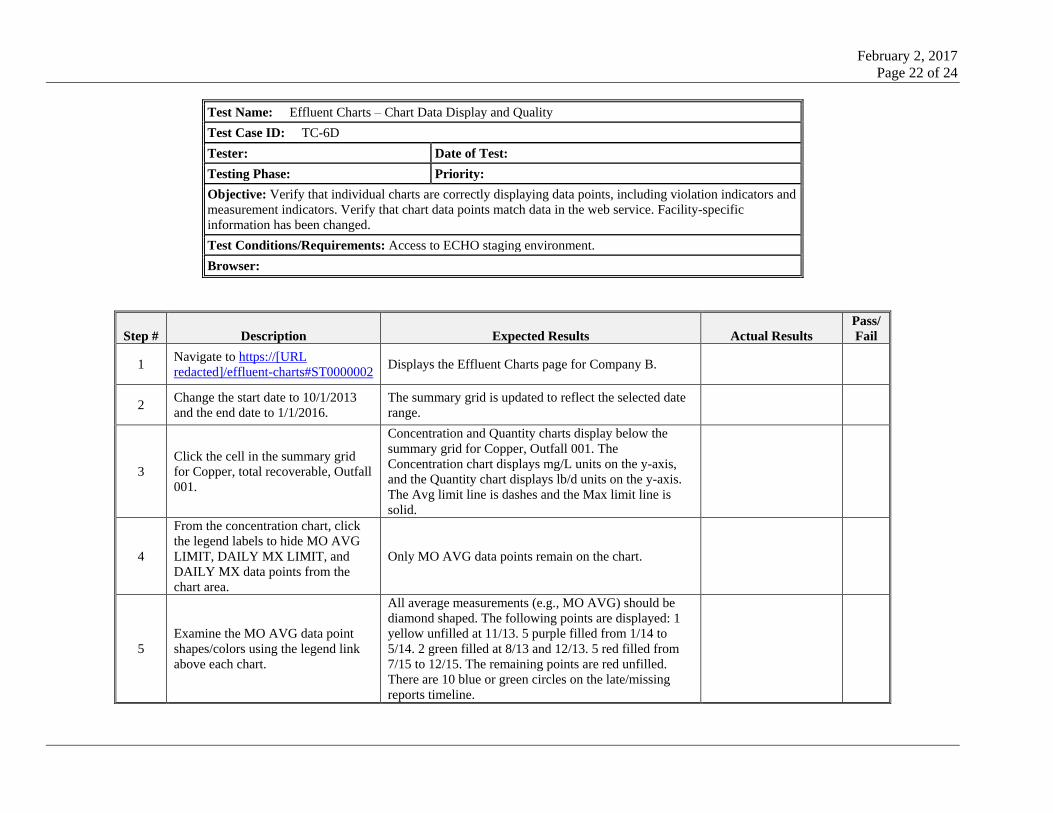
Page 22 of 24
Test Name: Effluent Charts – Chart Data Display and Quality
Test Case ID: TC-6D
Tester: Date of Test:
Testing Phase: Priority:
Objective: Verify that individual charts are correctly displaying data points, including violation indicators and
measurement indicators. Verify that chart data points match data in the web service. Facility-specific
information has been changed.
Test Conditions/Requirements: Access to ECHO staging environment.
Browser:
Step # Description Expected Results Actual Results
Pass/
Fail
1 Navigate to https://[URL
redacted]/effluent-charts#ST0000002 Displays the Effluent Charts page for Company B.
2 Change the start date to 10/1/2013
and the end date to 1/1/2016.
The summary grid is updated to reflect the selected date
range.
3
Click the cell in the summary grid
for Copper, total recoverable, Outfall
001.
Concentration and Quantity charts display below the
summary grid for Copper, Outfall 001. The
Concentration chart displays mg/L units on the y-axis,
and the Quantity chart displays lb/d units on the y-axis.
The Avg limit line is dashes and the Max limit line is
solid.
4
From the concentration chart, click
the legend labels to hide MO AVG
LIMIT, DAILY MX LIMIT, and
DAILY MX data points from the
chart area.
Only MO AVG data points remain on the chart.
5
Examine the MO AVG data point
shapes/colors using the legend link
above each chart.
All average measurements (e.g., MO AVG) should be
diamond shaped. The following points are displayed: 1
yellow unfilled at 11/13. 5 purple filled from 1/14 to
5/14. 2 green filled at 8/13 and 12/13. 5 red filled from
7/15 to 12/15. The remaining points are red unfilled.
There are 10 blue or green circles on the late/missing
reports timeline.
February 2, 2017
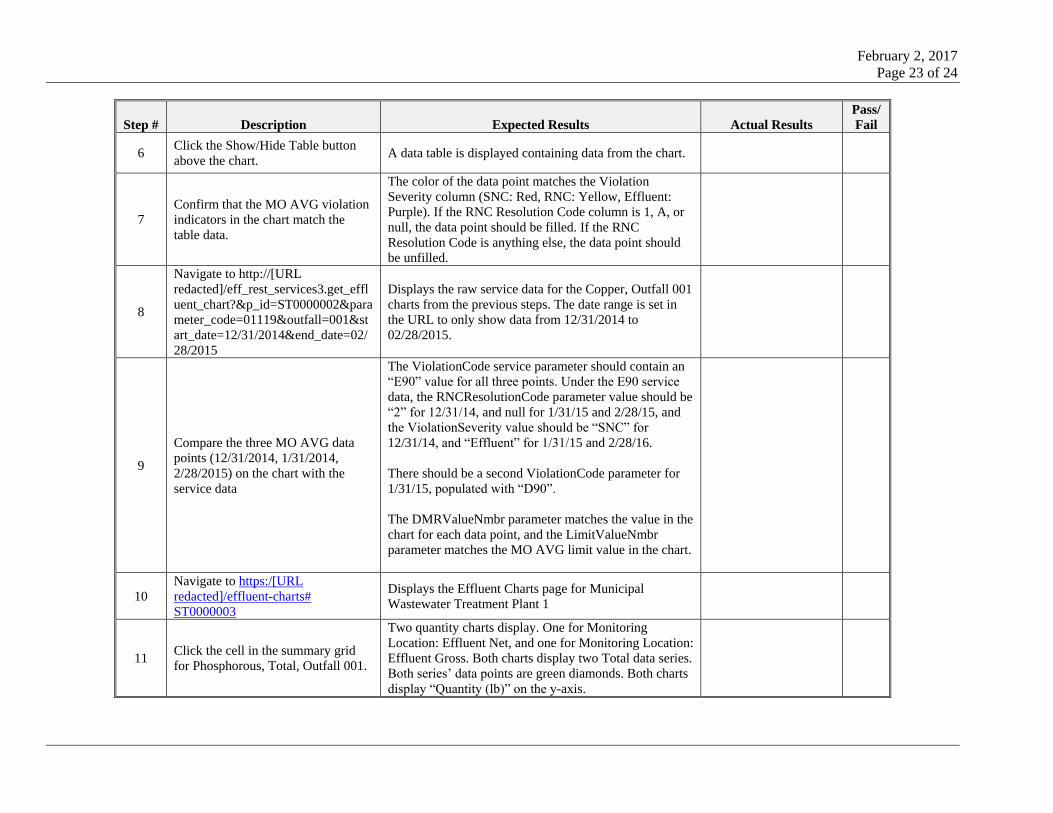
Page 23 of 24
Step # Description Expected Results Actual Results
Pass/
Fail
6 Click the Show/Hide Table button
above the chart. A data table is displayed containing data from the chart.
7
Confirm that the MO AVG violation
indicators in the chart match the
table data.
The color of the data point matches the Violation
Severity column (SNC: Red, RNC: Yellow, Effluent:
Purple). If the RNC Resolution Code column is 1, A, or
null, the data point should be filled. If the RNC
Resolution Code is anything else, the data point should
be unfilled.
8
Navigate to http://[URL
redacted]/eff_rest_services3.get_effl
uent_chart?&p_id=ST0000002
meter_code=01119&outfall=001&st
art_date=12/31/2014&end_date=02/
28/2015
Displays the raw service data for the Copper, Outfall 001
charts from the previous steps. The date range is set in
the URL to only show data from 12/31/2014 to
02/28/2015.
9
Compare the three MO AVG data
points (12/31/2014, 1/31/2014,
2/28/2015) on the chart with the
service data
The ViolationCode service parameter should contain an
“E90” value for all three points. Under the E90 service
data, the RNCResolutionCode parameter value should be
“2” for 12/31/14, and null for 1/31/15 and 2/28/15, and
the ViolationSeverity value should be “SNC” for
12/31/14, and “Effluent” for 1/31/15 and 2/28/16.
There should be a second ViolationCode parameter for
1/31/15, populated with “D90”.
The DMRValueNmbr parameter matches the value in the
chart for each data point, and the LimitValueNmbr
parameter matches the MO AVG limit value in the chart.
10
Navigate to https:/[URL
redacted]/effluent-charts#
ST0000003
Displays the Effluent Charts page for Municipal
Wastewater Treatment Plant 1
11 Click the cell in the summary grid
for Phosphorous, Total, Outfall 001.
Two quantity charts display. One for Monitoring
Location: Effluent Net, and one for Monitoring Location:
Effluent Gross. Both charts display two Total data series.
Both series’ data points are green diamonds. Both charts
display “Quantity (lb)” on the y-axis.

February 2, 2017
Page 24 of 24
Step # Description Expected Results Actual Results
Pass/
Fail
12 Click the cell in the summary grid
for pH, Outfall 001.
One concentration chart displays with one Min data
series and on Max. The Min data points are orange
downward-pointing triangles and the Min limit line is
solid. The chart displays “Concentration (SU)” on the y-
axis.
13
Navigate to https:// [URL
redacted]/effluent-
charts#ST0000004GU0020222
Displays the Effluent Charts page for Wastewater
Treatment Plant 2.
14 Click the All Pollutants-All Outfalls
cell in the summary grid
All available charts are displayed that have limit data,
effluent data, or violation data. Charts that do not have
any limit data, effluent data, or violation data are not
displayed, and there are no empty chart headers
displayed for these charts.
Related Documents