ISSN(Online): 2319-8753 ISSN (Print) : 2347-6710 International Journal of Innovative Research in Science, Engineering and Technology (A High Impact Factor, Monthly, Peer Reviewed Journal) Visit: www.ijirset.com Vol. 6, Issue 11, November 2017 Copyright to IJIRSET DOI:10.15680/IJIRSET.2017.0611088 21586 ECG Detection Using Controller Vaidehi Arun Dixit, Prof. P. R. Thorat ME Student, Savitribai Phule Women’s Engineering College, Marathwada University, Aurangabad, M.S, India Guide, Savitribai Phule Women’s Engineering College, Marathwada University, Aurangabad, M.S, India ABSTRACT: In this Paper the design of an ECG monitoring system based on ARM processor is presented. The new ECG system breaks the traditional medical care mode, and makes full use of ARM LPC2148 processor. The system can provide a useful approach for continuous heath monitoring.This Paper presents the implementation of an ECG Monitoring and Heart Rate Measurement System involving low cost amplifier, filter components coupled with a sophisticated microcontroller and LCD screen using the available resources in our college. This paper was successfully implemented and the output displayed was an ECG waveform on the CRO and Heart rate is counted by microcontroller for one minute and displayed on LCD. Our platform can be used for the long-term monitoring of elders' cardiovascular status with high accuracy, simplicity, and future expandability. Therefore, the platform can provide clinically meaningful information to doctors to reduce the harm caused by cardiovascular disease. KEYWORDS: ECG, ARM, CRO, LCD, TEMPERATURE SENSOR, HEART RATE SENSOR. I. INTRODUCTION Coronary artery disease, the restriction of blood flow to the heart, is the leading cause of death in the world. The chances of suffering a myocardial infarction are great and increase up to fifteen times after the first occurrence. During a heart attack, heart muscle is depraved of oxygen and will literally die if the artery remains blocked. The first few hours are critical in saving much of the dying heart muscle and preventing reason for critical delays in medical treatment is lack of early warning and patient unawareness permanent heart damage. Unfortunately, the symptoms vary and the most common.The Heart Acts as A Pump That Circulates Oxygen and Nutrient Carrying Blood Around the Body in Order to Keep It Functioning. Heart Pounds to Pump Oxygen-Rich Blood to Your Muscles and To Carry Cell Waste Products Away From Your Muscles. The human heart is an organ that pumps blood throughout the body via the circulatory system, supplying oxygen and nutrients to the tissues and removing carbon dioxide and other wastes."The tissues of the body need a constant supply of nutrition in order to be active, If the heart is not able to supply blood to the organs and tissues, they'll die." The heart circulates blood through two pathways: the pulmonary circuit and the systemic circuit.In the pulmonary circuit, deoxygenated blood leaves the right ventricle of the heart via the pulmonary artery and travels to the lungs, then returns as oxygenated blood to the left atrium of the heart via the pulmonary vein.In the systemic circuit, oxygenated blood leaves the body via the left ventricle to the aorta, and from there enters the arteries and capillaries where it supplies the body's tissues with oxygen. Deoxygenated blood returns via veins to the venae cavae, re-entering the heart's right atrium.Of course, the heart is also a muscle, so it needs a fresh supply of oxygen and nutrients, too, Phillips said.The cardiovascular system circulates blood from the heart to the lungs and around the body via blood vessels."After the blood leaves the heart through the aortic valve, two sets of arteries bring oxygenated blood to feed the heart muscle," he said. The left main coronary artery, on one side of the aorta, branches into the left anterior descending artery and the left circumflex artery. The right coronary artery branches out on the right side of the aorta.Blockage of any of these arteries can cause a heart attack, or damage to the muscle of the heart. a. Background A heart attack occurs when the blood supply to part of the heart muscle itself the myocardium is severely reduced or stopped.During a heart attack, heart muscle is depraved of oxygen and will literally die if the artery remains blocked. A

Welcome message from author
This document is posted to help you gain knowledge. Please leave a comment to let me know what you think about it! Share it to your friends and learn new things together.
Transcript

ISSN(Online): 2319-8753 ISSN (Print) : 2347-6710
International Journal of Innovative Research in Science, Engineering and Technology
(A High Impact Factor, Monthly, Peer Reviewed Journal)
Visit: www.ijirset.com Vol. 6, Issue 11, November 2017
Copyright to IJIRSET DOI:10.15680/IJIRSET.2017.0611088 21586
ECG Detection Using Controller
Vaidehi Arun Dixit, Prof. P. R. Thorat ME Student, Savitribai Phule Women’s Engineering College, Marathwada University, Aurangabad, M.S, India
Guide, Savitribai Phule Women’s Engineering College, Marathwada University, Aurangabad, M.S, India
ABSTRACT: In this Paper the design of an ECG monitoring system based on ARM processor is presented. The new ECG system breaks the traditional medical care mode, and makes full use of ARM LPC2148 processor. The system can provide a useful approach for continuous heath monitoring.This Paper presents the implementation of an ECG Monitoring and Heart Rate Measurement System involving low cost amplifier, filter components coupled with a sophisticated microcontroller and LCD screen using the available resources in our college. This paper was successfully implemented and the output displayed was an ECG waveform on the CRO and Heart rate is counted by microcontroller for one minute and displayed on LCD. Our platform can be used for the long-term monitoring of elders' cardiovascular status with high accuracy, simplicity, and future expandability. Therefore, the platform can provide clinically meaningful information to doctors to reduce the harm caused by cardiovascular disease. KEYWORDS: ECG, ARM, CRO, LCD, TEMPERATURE SENSOR, HEART RATE SENSOR.
I. INTRODUCTION
Coronary artery disease, the restriction of blood flow to the heart, is the leading cause of death in the world. The chances of suffering a myocardial infarction are great and increase up to fifteen times after the first occurrence. During a heart attack, heart muscle is depraved of oxygen and will literally die if the artery remains blocked. The first few hours are critical in saving much of the dying heart muscle and preventing reason for critical delays in medical treatment is lack of early warning and patient unawareness permanent heart damage. Unfortunately, the symptoms vary and the most common.The Heart Acts as A Pump That Circulates Oxygen and Nutrient Carrying Blood Around the Body in Order to Keep It Functioning. Heart Pounds to Pump Oxygen-Rich Blood to Your Muscles and To Carry Cell Waste Products Away From Your Muscles. The human heart is an organ that pumps blood throughout the body via the circulatory system, supplying oxygen and nutrients to the tissues and removing carbon dioxide and other wastes."The tissues of the body need a constant supply of nutrition in order to be active, If the heart is not able to supply blood to the organs and tissues, they'll die." The heart circulates blood through two pathways: the pulmonary circuit and the systemic circuit.In the pulmonary circuit, deoxygenated blood leaves the right ventricle of the heart via the pulmonary artery and travels to the lungs, then returns as oxygenated blood to the left atrium of the heart via the pulmonary vein.In the systemic circuit, oxygenated blood leaves the body via the left ventricle to the aorta, and from there enters the arteries and capillaries where it supplies the body's tissues with oxygen. Deoxygenated blood returns via veins to the venae cavae, re-entering the heart's right atrium.Of course, the heart is also a muscle, so it needs a fresh supply of oxygen and nutrients, too, Phillips said.The cardiovascular system circulates blood from the heart to the lungs and around the body via blood vessels."After the blood leaves the heart through the aortic valve, two sets of arteries bring oxygenated blood to feed the heart muscle," he said. The left main coronary artery, on one side of the aorta, branches into the left anterior descending artery and the left circumflex artery. The right coronary artery branches out on the right side of the aorta.Blockage of any of these arteries can cause a heart attack, or damage to the muscle of the heart.
a. Background
A heart attack occurs when the blood supply to part of the heart muscle itself the myocardium is severely reduced or stopped.During a heart attack, heart muscle is depraved of oxygen and will literally die if the artery remains blocked. A

ISSN(Online): 2319-8753 ISSN (Print) : 2347-6710
International Journal of Innovative Research in Science, Engineering and Technology
(A High Impact Factor, Monthly, Peer Reviewed Journal)
Visit: www.ijirset.com Vol. 6, Issue 11, November 2017
Copyright to IJIRSET DOI:10.15680/IJIRSET.2017.0611088 21587
heart attack is distinct from cardiac arrest, which is a sudden loss of heart function that usually occurs as a result of electrical disturbances of the heart rhythm. A heart attack can lead to cardiac arrest, but the latter can also be caused by other problems.
Fig 1: Clot in heart deprived of oxygen
ECG or Electrocardiogram is a representation of electrical events of Cardiaccycle. ECG provides valuable information about wide range of Cardiac disorder such as presence of inactive parts or an enlargement of heart muscle.ECG is the process of recording the electrical activity of the heart over a period of time using electrodes placed on the skin. The overall goal of performing electrocardiography is to obtain information about the structure and function of the heart. Heart Attacks are the major cause of death in the world today, particularly in India. The need to predict this is a major necessity for improving the countries healthcare sector. Accurate and precise prediction of the heart disease mainly depends on Electrocardiogram (ECG) data. Heart disease is a major life threatening disease that cause to death and it has a serious long term disability. The electrocardiogram (ECG) is the most important bio signal used by cardiologists for diagnostic purposes. The ECG signal provides key information about the electrical activity of the heart. The heart signals are taken from ECG, which is known as Electrocardiography. That the heart signals are picked by using electrodes in arms, leg, chest of our body. By using this signal heart disorder can be find out. Depending on the shape of the ECG waveform, find out the cardiac health. Time taken to recover from heart disease depends on patient’s severity. Nowadays, health care industry contain huge amount of health care data, which contain hidden information. The electrocardiogram (ECG) is the most important bio signal used by cardiologists for diagnostic purposes. The ECG signal provides key information about the electrical activity of signals. The aim of ECG signal processing is diverse and comprises the Improvement of measurement accuracy and reproducibility (when compared with manual measurements) and by taking out thesinformation is not readily available from the signal through visual assessment. ECG is composite from 5 waves - P, Q, R, S and T.the heart. The heart signals are taken from ECG, which is known as Electrocardiography.That the heart signals are picked by using electrodes in arms, leg, chest of our body. By usingthis signal heart disorder can be find out. Depend on the shape of the ECG waveform, findout the cardiac health. ECG signal readings and their analysis are carried out from signalprocessing.
b. Motivation
Electrocardiography is the process of recording the electrical activity of the heart over a period of time using electrodes placed on the skin. These electrodes detect the tiny electrical changes on the skin that arise from the heart muscle's electrophysiologic pattern depolarizing and repolarizing during each heartbeat. It is a very commonly performed cardiology test.In a conventional 12-lead ECG, ten electrodes are placed on the patient's limbs and on the surface of the chest. The overall magnitude of the heart's electricalpotential is then measured from twelve
ISSN(Online): 2319-8753 ISSN (Print) : 2347-6710
International Journal of Innovative Research in Science, Engineering and Technology
(A High Impact Factor, Monthly, Peer Reviewed Journal)
Visit: www.ijirset.com Vol. 6, Issue 11, November 2017
Copyright to IJIRSET DOI:10.15680/IJIRSET.2017.0611088 21588
different angles ("leads") and is recorded over a period of time (usually ten seconds). In this way, the overall magnitude and direction of the heart's electrical depolarization is captured at each moment throughout the cardiac cycle.The graph of voltage versus time produced by this noninvasive medical procedure is referred to as an electrocardiogram.During each heartbeat, a healthy heart has an orderly progression of depolarization that starts with pacemaker cells in the sinoatrial node, spreads out through the atrium, passes through the atrioventricular node down into the bundle of His and into the Purkinje fibers, spreading down and to the left throughout the ventricles. This orderly pattern of depolarization gives rise to the digital recording of ECGs and use on computers.
These are features of electrocardiograph characteristic ECG tracing. To the trained clinician, an ECG conveys a large amount of information about the structure of the heart and the function of its electrical conduction system. Among other things, an ECG can be used to measure the rate and rhythm of heartbeats, the size and position of the heart chambers, the presence of any damage to the heart's muscle cells or conduction system, the effects of cardiac drugs, and the function of implanted pacemakers.An electrocardiograph is a machine that is used to perform electrocardiography, and produces the electrocardiogram. The first electrocardiographs are discussed above and are electrically primitive compared to today's machines. Early electrocardiographs were constructed with analog electronics and the signal could drive a motor to print the signal on paper. Today, electrocardiographs use analog-to-digital converters to convert to a digital signal that can then be manipulated with digital electronics. This permits:
1. Safety features that include voltage protection for the patient and operator. Since the machines are powered by mains power, it is conceivable that either person could be subjected to voltage capable of causing death. Additionally, the heart is sensitive to the AC frequencies typically used for mains power (50 or 60 Hz).
2. Defibrillation protection. Any ECG used in healthcare may be attached to a person who requires defibrillation and the electrocardiograph needs to protect itself from this source of energy.
3. Electrostatic discharge is similar to defibrillation discharge and requires voltage protection up to 18,000 volts. 4. Additionally circuitry called the right leg driver can be used to reduce common-mode interference (typically
the 50/60 Hz mains power).
c. Necessity ECG reflects the state of cardiac heart and hence is like a pointer to the health conditions of a human being. ECG, if properly analyzed, can provides the information regarding various diseases related to heart. However, ECG being a non-stationary signal, the irregularities may not be periodic and may show up at different intervals. Clinical observation of ECG can hence take long hours and can be very tedious. Moreover, visual analysis cannot be relied upon. This calls for computer-based techniques for ECG analysis. Various contributions have been made in literature regarding beat detection and classification of ECG. Most of these use frequency or time domain representation of ECG signals. But the major problem faced by the coders is the vast variations in the morphologies of ECG signals. Moreover, consideration of the time constraints must be taken as well. Thus the basic objective is to come up with a simple method having less computational time without compromising with the efficiency.
This objective has motivated to search and experiment with various techniques. Overall effort have been taken to to minimize the computational time and maximize the efficiency.The electronics technology has entered almost in all aspects of day-to-day life, and the medical field is not exception for that. The need for well-equipped hospitals and diagnostic centers is increasing day by day as the people are becoming more conscious about their health problems. In biomedical fields special units are used, such as intensive care unit orcoronary care unit. All of these units are designed to offer the advantage of the low Nurse – Patient ratio and concentration of the equipment and the resources needed; to take care of critically ill or seriously injured units.
. d. Objectives
It is possible to detect the onset of a heart attack and eliminate patient error. Thepaper intends to benefit those at high risk and already receiving some form of surgical treatment. By
sensing the different parameters of body, the patient need not worry about device.

ISSN(Online): 2319-8753 ISSN (Print) : 2347-6710
International Journal of Innovative Research in Science, Engineering and Technology
(A High Impact Factor, Monthly, Peer Reviewed Journal)
Visit: www.ijirset.com Vol. 6, Issue 11, November 2017
Copyright to IJIRSET DOI:10.15680/IJIRSET.2017.0611088 21589
When the sensors detect a heart attack, it will alert and will automatically call for help. The goal is to provide early heart attack detection so that the patient will be given medical attention within the
first few critical hours, thus greatly improving his or her chances of survival.
II. LITERATURE SURVEY This section describes the work that has been done in the area of health monitoring systems. Jubadi et al.[1] has proposed heart rate monitoring alert via SMS. In this an alert system is used to monitor the heart beat rate of a patient. This heart rate measurement is based on the principle of photoplethysmography (PPG) technique. Then this PPG signal was processed using PIC16F87 microcontroller to check the heart beat rate per minute. An alert was given to medical experts or family members via SMS. With the help of this system doctors could monitor & diagnose patient’s condition continuously & could suggest them precautions if any. Saravanan designed remote patient monitoring system using computer communication networks through Bluetooth, WiFi, Internet Android Mobile. ECG, EMG, Pulse, BP, arterial oxygen saturation, blood glucose concentration & temperature signals were monitored. They had designed android Bluetooth API & constructed a simple peer-to-peer messaging system to work between two paired Bluetooth. The monitoring section receives data via Bluetooth, Wi-Fi & Internet. This system was mainly designed to send data to the doctor.
Purnima et al. [2] proposed health monitoring systems based on GSM &Zigbee technology. In this ECG, temperature & heart beat signals are continuously transmitted & monitored through Zigbee. A Zigbee node was connected to every patient monitoring system. The data are transmitted to the doctors PC via Zigbee as well as GSM technology is used to send data to doctor’s mobile.
Singh et al. [3] proposed wireless transmission system which is having a wireless sensor platform along with remote monitoring capability. They have designed sensor nodes for temperature & heart rate. This sensor data are wirelessly transmitted to the controller using RF transmitter & receiver module. This data is also wirelessly transmitted to the remote monitoring station.
Venugopal et al. [4] presented a centralized heart rate monitoring system. The data obtained from sensors of various patients are then transmitted over a WBAN and then this data is transmitted to the main location with the help of Wi-Fi.
Kiran Kumar et al. [5] developed health monitoring system using PSOC mixed signal. They developed data acquisition system to remotely monitor patient’s parameters like temperature, heart rate, blood oxygen saturation, blood pH level & ECG.
This section describes about the existing wearable ECG recording and monitoring systems found in the literature. The A-ECG signals are nowadays recorded by very small-size, lightweight, wearable devices (WD), which can continuously record A-ECG for many hours and even for many days. One such WD has been developed by V. Vaid and Lai et al. [6], [7] at the department of Electrical Engineering of IIT Bombay. A prototype of this WD which can record A-ECG from any one of the primary leads at a time .
Okada et al. [8] have developed a wearable ECG recorder for daily stress measurement of a portable electrocardiograph with the case open (left) and closed (right). The body is collapsible and made of plastic. The size is W44 x D17 x H58 mm and the weight is 45g including a battery and a memory card (1 GB). There are two switches (ON/OFF,START/STOP) and two light emitting diodes (LEDs). Green LED is an operation indicator, and red LED is a detection indicator. Red LED flashes when each R-wave is detected. The memory card and battery can be easily replaced. ECG and the acceleration data are recorded at 1 kHz sampling rate up to more than 24 hours.
After measurement, the memory card is dismounted, and the data are transferred to a personal computer (PC) for signal processing (off-line analysis). The system consists of a built-in four channel analog to digital converter, amplifiers (Burr-Brown INA326 and Texas Instruments OPA2335, 50 dB), a filter (0.1 - 100 Hz). 3-axis acceleration sensors (ST Microelectronics Co.), a microcomputer and a memory card. An acceleration sensor is used to monitor the subject’s posture and/or body movement simultaneously with ECG. The sensor has a full scale of ±2 G(gravitation in m/s2). This range is enough to measure an acceleration range of a body in daily life such as walks,

ISSN(Online): 2319-8753 ISSN (Print) : 2347-6710
International Journal of Innovative Research in Science, Engineering and Technology
(A High Impact Factor, Monthly, Peer Reviewed Journal)
Visit: www.ijirset.com Vol. 6, Issue 11, November 2017
Copyright to IJIRSET DOI:10.15680/IJIRSET.2017.0611088 21590
works, household tasks, etc. The microcomputer is AduC840 series (Analog Devices Inc.). An MMC (multi-media card) mobile type memory card is used. ECG and three acceleration data are buffered as binary data in RAM (random memory access) area of amicrocomputer. Buffered data are written in the memory card by a single block write-command every 512 bytes which is a block size of MMC mobile card. A 1 GB MMC mobile card can record four channel data (ECG and three accelerations) up to 27 hours with 1 kHz samplingspeed.
Park, Baiet al. [9] have developed an ultra-wearable, low power ECG monitoring system. Wearability is the most crucial issue in designing a wireless ECG monitoring system. Probably, none of the existing miniature sensing systems can be considered truly wearable in the strict sense, not just because they are still bulky but also because conventional ECG sensors can cause skin irritation. Therefore, authors have used QUASAR 's innovative ECG sensor and an ultracompact wireless sensor node (Eco) specially designed for wearable applications.Their system is equipped with 1 Mbps proprietary radio instead of IEEE 802.15.4, a very low power transceiver that consumes less than 10 mA in transmission mode (1 Mbps, 0 dBm) and 22mA in receiving mode; and USB, Ethernet and Wi-Fi connectivity. Thus, very important design issues like high throughput, ultra-low power and universal connectivity have been addressed. Due to innovative ECG and wireless sensors the quality of the recorded ECG signal is inherently superior, as shown in. Flow ever, the authors have not mentioned the use of accelerometer, if any, which is necessary for acquiring motion data.
A cellular phone based online ECG processing system for ambulatory and continuous detection has been developed by Chen et al. [10]. It aids cardiovascular disease CVD patientsto monitor their heart status and detect abnormalities in their normal daily life. This system is asolution to supplement the limitations in conventional clinic examination such as the difficulty in capturing rare events, off-hospital monitoring of patients' heart status and the immediate dissemination of physician's instruction to the patients. The Mobicare Cardio Monitoring System, shown in fig, consists of a cellular phone embedded with real time ECG processing. algorithms (MobiECG), a wireless ECG sensor, a web based server, a patients' database and a user interface. The wireless ECG sensor used in this system serves to capture one channel ECG, one 3D accelerometer signal and to transmit those signal data via Bluetooth to cell phones. The key role of MobiECG here is to works as a local processor to process data in real time. It receives ECG and accelerometer data from wireless ECG sensor via Bluetooth, filters the data, detects QRS complex, identifies Q onset and T offset, and calculates intensity of patient's body movement using obtained accelerometer data. A context-aware (patient's activity) ECG processing is carried out by MobiECG and it will send the abnormal ECG data over a cellular network (GPRS/3G) to hospitals or care centers to alarm physician only when it detects abnormal ECG signal telecommunication channel, no ECG data is sent out by MobiECG when abnormality is not detected.
A new wireless technology for tele-homecare purposes proposed by Fensliet al. [11] gives better possibilities for monitoring of vital parameters with wearable biomedicalsensors, and gives the patient the freedom to be mobile and still be under continuouslymonitoring and thereby to render better quality of patient care. They describe a new concept tor wireless and wearable electrocardiogram (ECG) sensor transmitting signals to a diagnostic station at the hospital, and this concept is intended for detecting rarely occurrences of cardiac arrhythmias and to follow up critical patients from their home while they are carrying out daily.
In [12] authors describe a method for the online classification of sleep/wake states based on cardiorespiratory signals produced by wearable sensors. The method was conceived in view of its applicability to a wearable sleepiness monitoring device, theHeally recording system. The method uses a fast Fourier transform as the main feature extraction tool and a feed forward.
Heallysystem (KoralewskiIndustrieElektronik, Celle, Germany). The Heally system is a portable recording system that uses an inductive belt sensor for measuring ribcage respiratory effort and gel electrodes for measuring ECG. Authors have chosen the sampling frequencies according to the requirements for digitalized PSG. The respiratory signal is sampled at 50 Hz and the l-lead ECG at 100 Hz. In addition, the Heally system offers the possibility to measure the EMG (recorded from the right shoulder muscle trapezius at 200 Hz) and EOG (recorded at 200 Hz) as reference. EOG was only measured during the night in order to not disturb the subjects too much during daily activities.
Placing wearable sensors in multiple body locations can be quite cumbersome when the user has to collect data on a daily basis or for longer periods of continuous monitoring. Thus, many approaches based on multiple

ISSN(Online): 2319-8753 ISSN (Print) : 2347-6710
International Journal of Innovative Research in Science, Engineering and Technology
(A High Impact Factor, Monthly, Peer Reviewed Journal)
Visit: www.ijirset.com Vol. 6, Issue 11, November 2017
Copyright to IJIRSET DOI:10.15680/IJIRSET.2017.0611088 21591
integrated sensor modalities have been proposed [13]-[17], since it is much more comfortable for the user to wear a single device. Moreover, incorporating multimodal information can yield additional physiological and environmental cues, such as heart rate, light, skin resistance, temperature, audio, global positioning system (GPS) location etc.
Therefore, Ming Li et al. [18] have proposed a multimodal physical activity recognitionsystem by fusing temporal and cepstral information, in which they have used multimodalwearable sensors [19]network utilizes heterogeneous sensors simultaneously, whichsend their measurements to aNokia N95 cell phone via Bluetooth. Flexible sensor measurement choices can include ECGsignals, accelerometer signals, heart rate, and blood oxygen levels as well as other vital signs.Furthermore, external sensor data are combined with data from the mobile phone s built-in sensors (GPS and accelerometer signal). Thus, the mobile phone can display and transmit the combined health record to a back-end server (e.g. Google Health Server) in real time. an integrated electrocardiogram (ECG) signal-processing scheme is proposed.Using a systematic wavelet transform algorithm, the signal-processing scheme can realizemultiple functions in real time, including baseline-drift removal, noise suppression, QRSdetection, heart beat rate prediction and classification, and clean ECG reconstruction. Utilizingthe novel low-cost hardware architecture, the scheme is implemented in ASICs with CMOS technology. The ECG signal processor chip achieves low area and power consumptions, and is highly suitable for wearable applications of long-term cardiac monitoring. Heart ToGo- a windows mobile smart phone-based wearable cardiovascular diseases (CVD) detection system; capable of performing real-time ECG acquisition and display, feature extraction, and beat classification has been developed in [20]. The system is capable of classifying the premature ventricular contraction (PVC) as well as generating the cardiac summary report consisting of the average, high, and low heart rate, and the total number of beats, as well as the number of normal and PVC beats, as shown in fig. Similar wearable recorders using varieties of sensors and supporting technologies have been reported in [21]-[24], In [25] authors have fused the heart rate and accelerometer data for activity assessment and classification. The authors have used ProeTEX (PROtective Electronic TEXtiles for emergency operators) that aims at demonstrating the suitability of wearable technologies to improve the safety, efficiency, and coordination of emergency operators, such as fire fighters or Civil Protection rescuers. The algorithm combines both features extracted from the signal of a tri-axialaccelerometer and one ECG lead. Microprocessors integrated in the garments detect the signal magnitude area of inertial acceleration, step frequency, trunk inclination, heart rate (HR), andHR trend in real time. The classifier uses these signals as inputs and classifies them to nineclasses: certain physical activities (walking, running, moving on site), intensities (intense, mild,or at rest) and postures (lying down, standing up). Specific classes have been identified as dangerous to the rescuer during operation, such as, “subject motionless lying down” or “subject resting with abnormal HR.
In [26] authors have categorized the physical activities (PAs) into low-level (e.g. lying,sitting, sit fidgeting, standing, stand fidgeting, playing wii, slow walking, brisk walking, andrunning) description and high-level (e.g. Eating a meal, Reading, Talking on Phone, Travel by walking and activities during exercises) descriptions, high-level descriptions may includevarious low-level physical activities simultaneously sitting can be observed in both homework and eating a meal categories, hence an automated monitoring system cannot determine whether the subject is doing his/her homework or having a meal when it detects the subject is sitting. In order to mitigate these ambiguities, authors have introduced the concept of latent topics in physical activities. It is hypothesized that each high level physical activity consists of a set of latent topics and each latent topic has a set of low-level physical activities.
In this section a comprehensive survey on various signal processing techniques commonlyused for A-ECG signals have been presented. These techniques include detecting thenoise/motion artifacts in A-ECG signals, cancellation of noise episodes from A-ECG/W-ECGsignals, extracting motion artifacts from A-ECG signals, classifying the physical/bodymovements of the subject, compressing the signals etc. using numerous tools like principalcomponent analysis (PCA), wavelet transform, adaptive filtering and many more.
For analyzing the ambulatory ECG signal in terms of motion artifacts or quantification, andfor that matter for any kind of automated ECG signal analysis, it is necessary to accuratelydetect the QRS complex. In this section, a comprehensive survey of QRS complex detectionmethods has been carried out. The QRS complex is the most prominent and peculiar segment ofan ECG signal. The detection of the QRS complex is the most important task in automated ECGsignal analysis. For the analysis of the A-ECG signals as mentioned above and for any kind ofautomated ECG signal analysis for that matter the pre-processing stage requires an accurate detection of QRS complex. For example, in [27]-[30] ST-T analysis is done after detection of QRwaves.

ISSN(Online): 2319-8753 ISSN (Print) : 2347-6710
International Journal of Innovative Research in Science, Engineering and Technology
(A High Impact Factor, Monthly, Peer Reviewed Journal)
Visit: www.ijirset.com Vol. 6, Issue 11, November 2017
Copyright to IJIRSET DOI:10.15680/IJIRSET.2017.0611088 21592
III. FLOW OF THE SYSTEM Nowadays, the volume of Electrocardiogram (ECG) recorded in hospitals is increasing as the people suffering from heart diseases are increasing at an alarming rate. The ECG is one of the medical equipment that can measure the heart rate, convert it into a signal and present the data on a piece of paper or on a monitor. An ECG is a recording of the electrical activity on the body surface generated by the heart. ECG measurement information is collected by electrodes placed at designated locations on the body. It is the best way to measure and diagnose abnormal rhythms of the heart , particularly abnormal rhythms caused by damage to the conductive tissue that carries electrical signals, or abnormal rhythms caused by electrolyte imbalances . In a Myocardial infarction (MI), the ECG can identify if the heart muscle has been damaged in specific areas, though not all areas of the heart are covered . The ECG cannot reliably measure the pumping ability of the heart, for which ultrasound-based (echocardiography) or nuclear medicine tests are used. It is possible to be in cardiac arrest with a normal ECG signal (a condition known as pulse less electrical activity).
Electro-cardiogram (ECG) is one of frequently used and accurate methods for measuring the heart rate. ECG is an expensive device and its use for the measurement of the heart rate only is not economical. Low-cost devices in the form of wrist watches are also available for the instantaneous measurement of the heart rate. Such devices can give accurate measurements but their cost is usually in excess of several hundred dollars, making them uneconomical. Most hospitals and clinics in the UK use integrated devices designed to measure the heart rate, blood pressure, and temperature of the subject. Although such devices are useful, their cost is usually high and beyond the reach of individuals. This paper describes the design of an ECG monitoring system which monitors
ECG and heart rate measurement system which measures the heart rate of the subject by Ag / Cl sticking electrode on the arms and then displaying the ECG on cathode ray oscilloscope (CRO) and heart rate on a text based LCD. The device has the advantage that it is microcontroller based and thus can be programmed to display various quantities, such as the normal, maximum and minimum rates over a period of time and so on.
Figure 2 represents flow diagram of our actual proposed system.

ISSN(Online): 2319-8753 ISSN (Print) : 2347-6710
International Journal of Innovative Research in Science, Engineering and Technology
(A High Impact Factor, Monthly, Peer Reviewed Journal)
Visit: www.ijirset.com Vol. 6, Issue 11, November 2017
Copyright to IJIRSET DOI:10.15680/IJIRSET.2017.0611088 21593
The flow diagram describes the overall process of the system.In the system the ECG electrodes are placed on the chest of the patient. 1.The values of the amplitude of the ECG waveform are compared with the standard amplitudes. 2.If the amplitude equals the standard values it can be concluded that the ECG is normal and displayed on the LCD. 3. Otherwise the ECG is abnormal and displayed on the LCD. 4. Temperature is measured by the temperature sensor LM35 and displayed on LCD. 5.Heart rate measured by heart rate sensor and displayed on LCD.
IV. PROPOSED SYSTEM ARCHITECTURE
Basically, the system consists of an Ag / Cl sticking electrode or a sensor,. The second stage is an Instrumentation amplifier (IA), which has a high gain (1000) .The output of IA, is passed through the low pass filter with a cut off frequency of 150Hz. The amplifier block is used to saturate the ECG signals to obtain square waveform. Cathode Ray Oscilloscope (CRO) is used to display the ECG. Microcontroller is used to perform the counting of pulses. LCD is used to display the heart rate. Design and Implementation of ECG Monitoring and Heart Rate Measurement System.
Fig 3: Block diagram of the ECG measuring and heart rate measurement system In this section we have defined briefly the hardware implementation of the system. The hardware implementation part describes briefly the ECG monitoring circuit system parts such as electrodes, instrumentation amplifier, low pass filter and non-inverting amplifier. The Figure below depicts the circuit diagram of the ECG monitoring and Heart rate measurement system.
V. PERFORMANCE ANALYSIS AND RESULTS
At the initial stage, the output of the instrumentation amplifier was not found proper as a result we have not found required gain value at the output of Instrumentation amplifier circuit, hence we simulated the instrumentation amplifier

ISSN(Online): 2319-8753 ISSN (Print) : 2347-6710
International Journal of Innovative Research in Science, Engineering and Technology
(A High Impact Factor, Monthly, Peer Reviewed Journal)
Visit: www.ijirset.com Vol. 6, Issue 11, November 2017
Copyright to IJIRSET DOI:10.15680/IJIRSET.2017.0611088 21594
circuit in electronics work bench and got the wave form with a gain of 1000. The output waveform of the instrument amplifier circuit in electronics work bench software can be depicted by using the design of instrumentation amplifier in electronic work bench software. The initial circuit of hardware of our system is instrumentation amplifier. The results of simulation of instrumentation amplifier using Electronic Work Bench Software helped us to choose the component values to be Implemented on the bread board. We could get the required output waveform, which was displayed on CRO successfully. The figure depicts the instrumentation amplifier output.
Fig 4 : Output of IA in Electronic work bench software
Fig 5 : ECG experimental set up on bread board

ISSN(Online): 2319-8753 ISSN (Print) : 2347-6710
International Journal of Innovative Research in Science, Engineering and Technology
(A High Impact Factor, Monthly, Peer Reviewed Journal)
Visit: www.ijirset.com Vol. 6, Issue 11, November 2017
Copyright to IJIRSET DOI:10.15680/IJIRSET.2017.0611088 21595
We could get the display of ECG waveform on CRO through electronic hardware implementation of our paper successfully. This can be seen by Figure , which shows an ECG signal acquired by the electrode on a CRO. Noise was reduced through implementation of a ground plane. Filtering technique attenuated unwanted noise to highlight the electrocardiogram signal.
In the software part, the tested code for the problem of processing the pulse input and displaying the analysis result in the form of ECG waveform and heart rate count was successfully burnt on the microcontroller. The output of heart rate count displayed is as shown in figure 5.
1. Amplitudes of normal ECG waves.
Table1Amplitudes of normal ECG waves.
P wave 0.25mV
R wave 1.60mV
Q wave 25% of R wave
T wave 0.1 to 0.5 mV
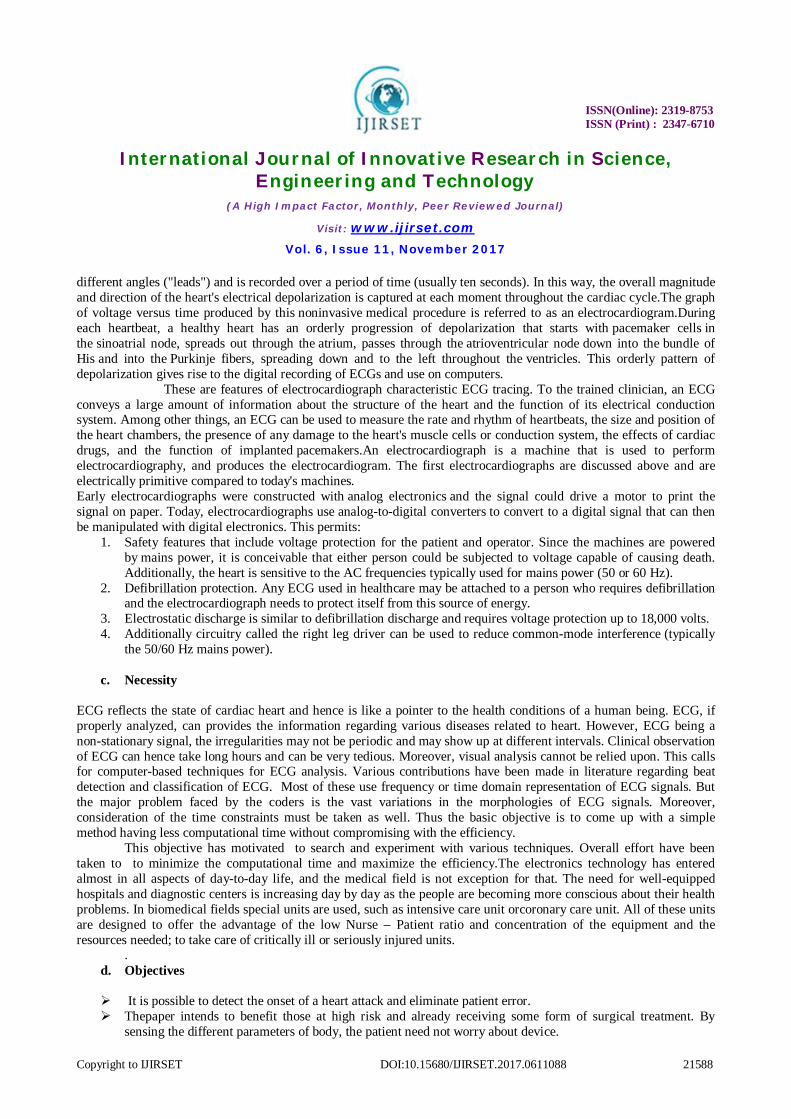
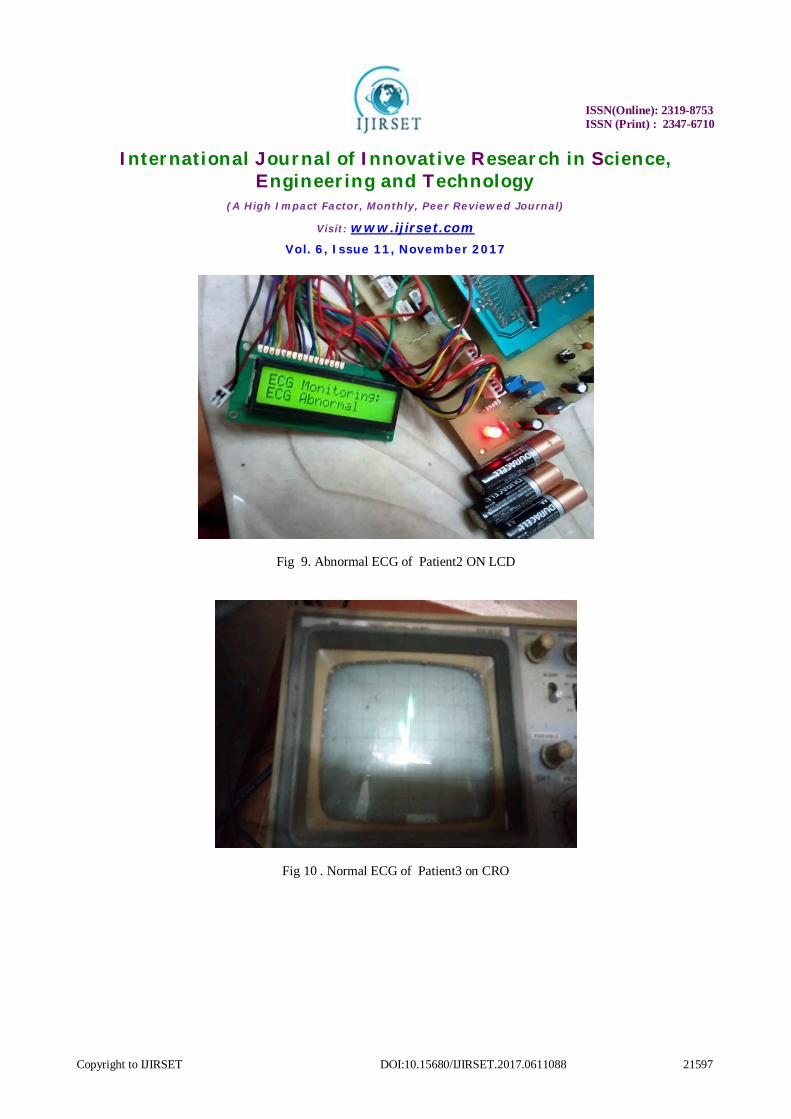
2. Results of System Implementation The actual test results after the implementation of the system are taken in the following section.The system is tested on the patients with normal and abnormal ECG along with this their heart rates and temperature are also taken into cosideration.
Fig 6 . Abnormal ECG of Patient1 on CRO

ISSN(Online): 2319-8753 ISSN (Print) : 2347-6710
International Journal of Innovative Research in Science, Engineering and Technology
(A High Impact Factor, Monthly, Peer Reviewed Journal)
Visit: www.ijirset.com Vol. 6, Issue 11, November 2017
Copyright to IJIRSET DOI:10.15680/IJIRSET.2017.0611088 21596
Fig 7. Abnormal ECG of Patient1 ON LCD
Fig 8 . Abnormal ECG of Patient2 on CRO
ISSN(Online): 2319-8753 ISSN (Print) : 2347-6710
International Journal of Innovative Research in Science, Engineering and Technology
(A High Impact Factor, Monthly, Peer Reviewed Journal)
Visit: www.ijirset.com Vol. 6, Issue 11, November 2017
Copyright to IJIRSET DOI:10.15680/IJIRSET.2017.0611088 21597
Fig 9. Abnormal ECG of Patient2 ON LCD
Fig 10 . Normal ECG of Patient3 on CRO

ISSN(Online): 2319-8753 ISSN (Print) : 2347-6710
International Journal of Innovative Research in Science, Engineering and Technology
(A High Impact Factor, Monthly, Peer Reviewed Journal)
Visit: www.ijirset.com Vol. 6, Issue 11, November 2017
Copyright to IJIRSET DOI:10.15680/IJIRSET.2017.0611088 21598
Fig 11. Normal ECG of Patient3ON LCD
Fig 12 . Normal ECG of Patient4 on CRO

ISSN(Online): 2319-8753 ISSN (Print) : 2347-6710
International Journal of Innovative Research in Science, Engineering and Technology
(A High Impact Factor, Monthly, Peer Reviewed Journal)
Visit: www.ijirset.com Vol. 6, Issue 11, November 2017
Copyright to IJIRSET DOI:10.15680/IJIRSET.2017.0611088 21599
Fig 13 . Normal ECG of Patient4ON LCD
VI. CONCLUSION
In this Paper the design of an ECG monitoring system based on ARM processor is presented. The new ECG system breaks the traditional medical care mode, and makes full use of ARM LPC2148 processor. The system can provide a useful approach for continuous heath monitoring.This Paper presents the implementation of an ECG Monitoring and Heart Rate Measurement System involving low cost amplifier, filter components coupled with a sophisticated microcontroller and LCD screen using the available resources in our college. This paper was successfully implemented and the output displayed was an ECG waveform on the CRO and Heart rate is counted by microcontroller for one minute and displayed on LCD. Our platform can be used for the long-term monitoring of elders' cardiovascular status with high accuracy, simplicity, and future expandability. Therefore, the platform can provide clinically meaningful information to doctors to reduce the harm caused by cardiovascular disease.
FUTURE SCOPE We can enhance the feature of the paper by enabling the transmission of ECG signals through mobiles, signal transmitters or internet. The future scope of the present work includes analyzing ECG signals using various advanced algorithms and also predicating cardiac abnormalities by observing characteristic.The future work also includes incorporating technologies such as Bluetooth, GPRS, GSM or Wi-Fi to these systems allows the wireless transmission to health or control centers.
REFERENCES [1] Warsuzarina Mat Jubadi, SitiFaridatulAisyahMohdSahak, “Heartbeat Monitoring Alert via SMS” 2009 IEEE Symposium on Industrial Electronics and Applications (ISIEA 2009), October 4-6, 2009, Kuala Lumpur, Malaysia. [2] Purnima, Puneet Singh, “Zigbee and GSM Based Patient Health Monitoring System”, Interntional Conference on Electronics and Communication System (IECS -2014). [3] Nishasingh, Sr. Asst. Prof. Ravi Mishra, “Microcontroller Based Wireless Temperature and Heart Beat Read-Out”, IOSR Journal of Engineering (IOSRJEN), (Jan. 2013), PP 01 -06. [4] Kala Venugopal, Amit Kumar, “Centralized Heart Rate Monitoring and Automated Message Alert System using WBAN”, International Journalof Scientific and Research Publications, Volume 3, Issue 9, September 2013 1 ISSN 2250-3153. [5] D.J.R.Kiran Kumar, NaliniKotnana, “Design and Implementation of Portable health monitoring system using PSOC mixed signal Array chip”,International Journal of Recent Technology and Engineering (IJRTE), ISSN: 2277-3878, Volume-1, Issue-3, august 2012.

ISSN(Online): 2319-8753 ISSN (Print) : 2347-6710
International Journal of Innovative Research in Science, Engineering and Technology
(A High Impact Factor, Monthly, Peer Reviewed Journal)
Visit: www.ijirset.com Vol. 6, Issue 11, November 2017
Copyright to IJIRSET DOI:10.15680/IJIRSET.2017.0611088 21600
[6] Vaid V (2003) A Silicon Locket for ECG Monitoring. Indian Institute of Technology Bombay,Powai,Mumbai. [7] Shojaei-Baghini M, Lai RK, Sharma DK (2005) A Low-Power and Compact Analog CMOSProcessinChip for Portable ECG Recorders. In Asian Solid State Circuit Conference,A-SSCC’05Hshinchu,Taiwan473-476. [8]Yosiho Okada, Yi-Tsuyoshi Yoto, Taka-Aki Suzuki, Toslrifumi Sugiura, et al.(2010) DevelopmentofaWearableECG Recorder for Measuring Daily Stress. Int. Conf. on InformationScienceandApplications(ICISA)Seoul,Koreap:1-5. [9]Chulsung Park, Pai H. Chou, Ying Bai, Robert Matthews, Andrew Hibbs (2006) An Ultra-Wearable WirelessLow Power ECG Monitoring System. Biomedical Circuits and SystemsConference(BioCAS2006)London,UKpg:241-244. [10]X Chen, CT Ho, ET Lim, TZ Kyaw (2007) Cellular Phone Based Online ECG Processing forAmbulatoryand Continuous Detection. Computers in Cardiology 2007, Durham,NC,USAp:653-656. [11]Fensli R, Gunnarson E, Gundersen T (2005) A Wearable ECG-recording System for Continuous Arrhythmia Monitoring in a Wireless Tele-Home-Care Situation. 18th IEEE SymposiumonComputerbasedMedicalSystemsp:407-412. [12]Karlen W, Mattiussi C, Floreano D (2009) Sleep and Wake Classifcation With ECG and Respiratory Effort Signals. IEEE Trans Biomed Circuits Syst 3: 71-78. [13] Lester J, Choudhury T, Borriello G (2006) A Practical Approach to Recognizing Physical Activities. Lecture Notes in Computer Science 3968: 1-16. [14] Lukowicz P, Junker H, Stager M, Von Buren T, Troster G (2002) Wear NET: A Distributed Multi-Sensor System for Context Aware Wearables. Lecture notes in computer science p: 361-370. [15] Pärkkä J1, Ermes M, Korpipää P, Mäntyjärvi J, Peltola J, et al. (2006) Activity classifcation using realistic data from wearable sensors. IEEE Trans Inf Technol Biomed 10: 119-128. [16]Ermes M1, Pärkka J, Mantyjarvi J, Korhonen I (2008) Detection of daily activities and sports with wearable sensors in controlled and uncontrolled conditions. IEEE Trans Inf Technol Biomed 12: 20-26. [17] Annavaram M, Medvidovic N, Mitra U, Narayanan S, Sukhatme G, et al.(2008) Multimodal sensing for pediatric obesity applications. International Workshop on Urban, Community, and Social Applications of Networked Sensing Systems (UrbanSense) Raliegh, NC, USA p: 21-25. [18] Ming Li, Rozgic´ V, Thatte G, Sangwon Lee, Emken BA, et al. ( 2010) Multimodal Physical Activity Recognition by Fusing Temporal and Cepstral Information. IEEE Transactions on Neural Systems and Rehabilitation Engineering 18: 1-11 [19]Liu X1, Zheng Y, Phyu MW, Zhao B, Je M, et al. (2011) Multiple functional ECG signal is processing for wearable applications of long-term cardiac monitoring. IEEE Trans Biomed Eng 58: 380-389. [20] Joseph Oresko J, Zhanpeng Jin, Jun Cheng, Shimeng Huang, Yuwen Sun, et al.( 2010) A Wearable Smartphone-Based Platform for Real-Time Cardiovascular Disease Detection Via Electrocardiogram Processing. IEEE Transactions on Information Technology in Biomedicine 14: 734-740. [21] Richard Fletcher R, Sarang Kulkarni (2010) Clip-on Wireless Wearable Microwave Sensor for Ambulatory Cardiac Monitoring. 32nd Annual International Conference of the IEEE EMBS (EMBC 2010) Buenos Aires,Argentina. [22]Jonathan Gallego, Diego Lemos, Gustavo A. Meneses, Alher Hernandez M (2010) Development of a Wearable Vital Signs Monitor for Healthcare. 32nd Annual International Conference of the IEEE EMBS (EMBC 2010) Buenos Aires, Argentina p: 6401-6404. [23] Figueiredo CP, Becher K, Hoffmann KP, Mendes PM (2010) Low Power Wireless Acquisition Module for Wearable Health Monitoring Systems. 32nd Annual International Conference of the IEEE EMBS (EMBC 2010) Buenos Aires, Argentina p: 704-707 [24]Sungkil Hwang, Michael Trakimas, Sameer Sonkusale (2010) A Low-Power Asynchronous ECG Acquisition System in CMOS Technology. 32nd Annual International Conference of the IEEE EMBS (EMBC 2010) Buenos Aires, Argentina [25]Curone D1, Tognetti A, Secco EL, Anania G, Carbonaro N, et al. (2010) Heart rate and accelerometer data fusion for activity assessment of rescuers during emergency interventions. IEEE Trans Inf Technol Biomed 14: 702-710. [26] Samuel Kim, Ming Li, Sangwon Lee, Urbashi Mitra, Adar Emken (2011) Modeling high-level descriptions of real-life physical activities using latent topic modeling of multimodal sensor signals. 33rd Annual International Conference of the IEEE EMBS (EMBC 2011), Boston, USA. [27]Pawar T1, Anantakrishnan NS, Chaudhuri S, Duttagupta SP (2007) Transition detection in body movement activities for wearable ECG. IEEE Trans Biomed Eng 54: 1149-1152 [28]Pawar T, Chaudhuri S, Duttagupta SP, Anantakrishnan NS (2006) Analysis of Ambulatory ECG Singal. 28th Annual International Conference of the IEEE EMBS (EMBC 2006) New York, USA p: 3094-309 [29]Pawar T1, Anantakrishnan NS, Chaudhuri S, Duttagupta SP (2007) Impact analysis of body movement in ambulatory ECG. Conf Proc IEEE Eng Med Biol Soc 2007: 5453-5456. [30] Pawar T1, Anantakrishnan NS, Chaudhuri S, Duttagupta SP (2008) Impact of ambulation in wearable-ECG. Ann Biomed Eng 36: 1547-1557
Related Documents