Alex Spiroglou, DipTA (ATAA) ECF Securities Derivatives Dept

Welcome message from author
This document is posted to help you gain knowledge. Please leave a comment to let me know what you think about it! Share it to your friends and learn new things together.
Transcript
��������������� � ��������������� � ��������������������������� ������������������������������������� ����������
Alex Spiroglou, DipTA (ATAA)ECF SecuritiesDerivatives Dept

Speaker BackgroundMr Spiroglou is working in the Derivatives Dept of Energon Capital Finance.Performing Advisory Derivatives Portfolio Management for a private client base,and also produces the “Daily Market Strategies” report , covering the commodities, equity, currency and fixed income markets based on quantitative, intermarket and technical criteria.He holds a Bsc in “Banking and International Finance” from City Univercity, LondonHe also has the following professional qualification titles :- Investment Management Certificate (U.K. Society of Investment Professionals)- Diploma in Technical Analysis (Australian Technical Analysts Association)- Market Maker Certificate (ADEX)- Client Consultant Certificate (ADEX)- Investment Consultant Certificate (HCMC)
If you interested in the Notes accompanying this Presentation , feel free to email me at : [email protected]
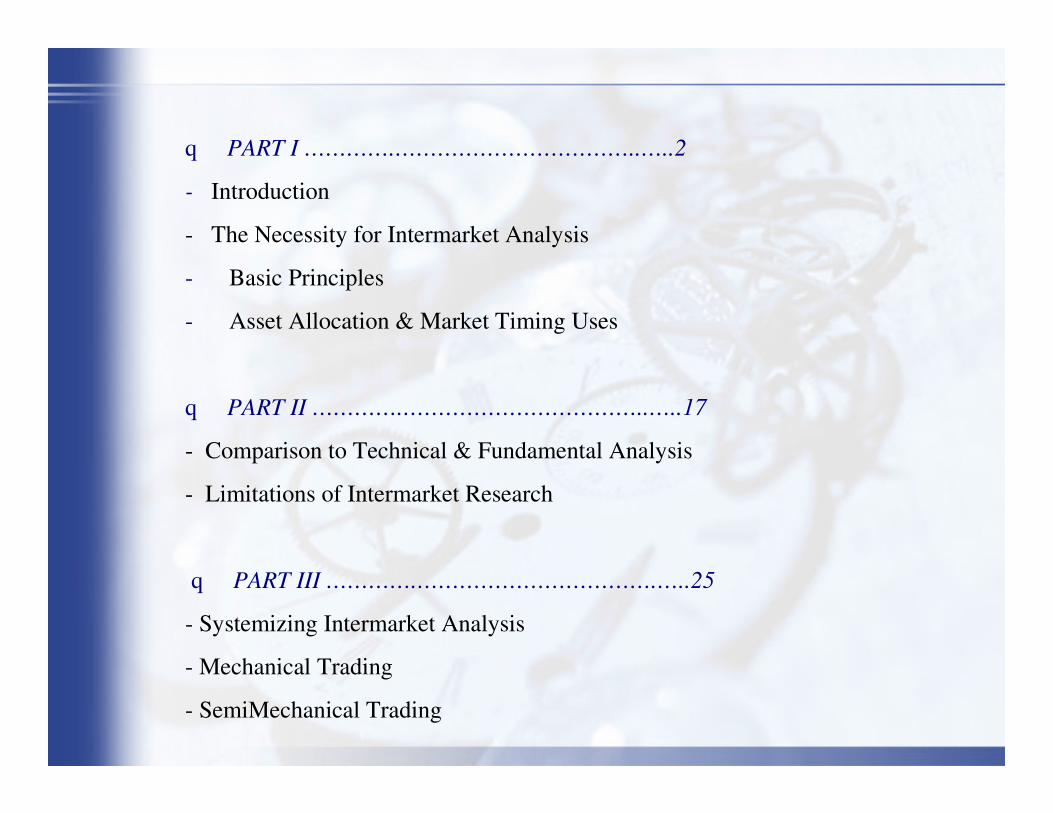
q PART I ………….……………………………..…..2
- Introduction
- The Necessity for Intermarket Analysis
- Basic Principles
- Asset Allocation & Market Timing Uses
q PART II ………….……………………………..…..17
- Comparison to Technical & Fundamental Analysis
- Limitations of Intermarket Research
q PART III ………….…………………………….…..25
- Systemizing Intermarket Analysis
- Mechanical Trading
- SemiMechanical Trading
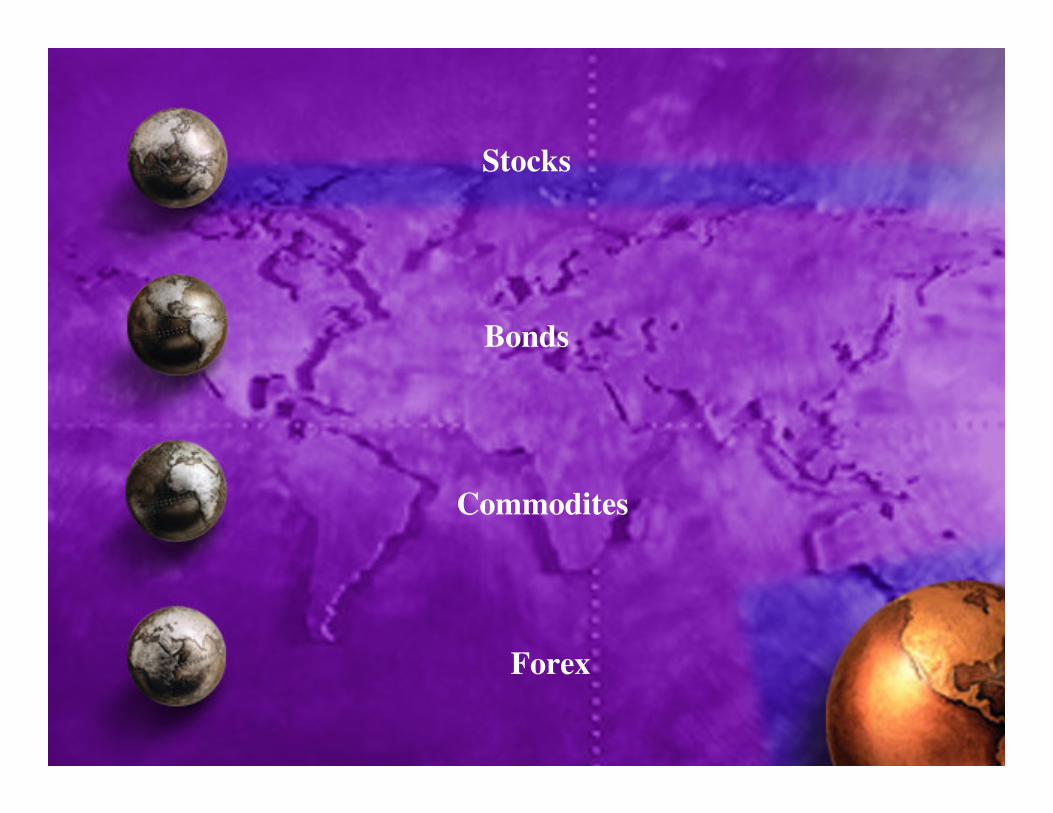
Stocks
Bonds
Commodites
Forex
� What is Intermarket Analysis ?
� What is the Markets’ Message ?
� Is it just another Theory ?
� Think like a Fundamentalist , Trade like a Tehnician
PART I (Introduction)
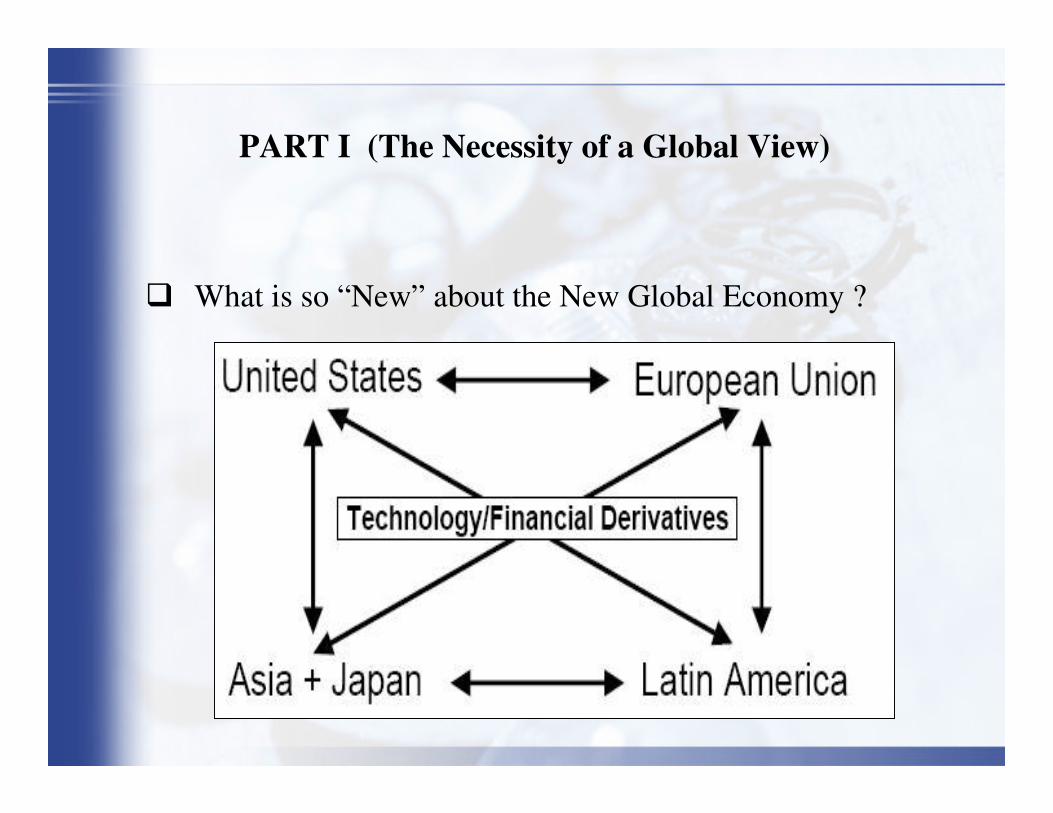
� What is so “New” about the New Global Economy ?
PART I (The Necessity of a Global View)
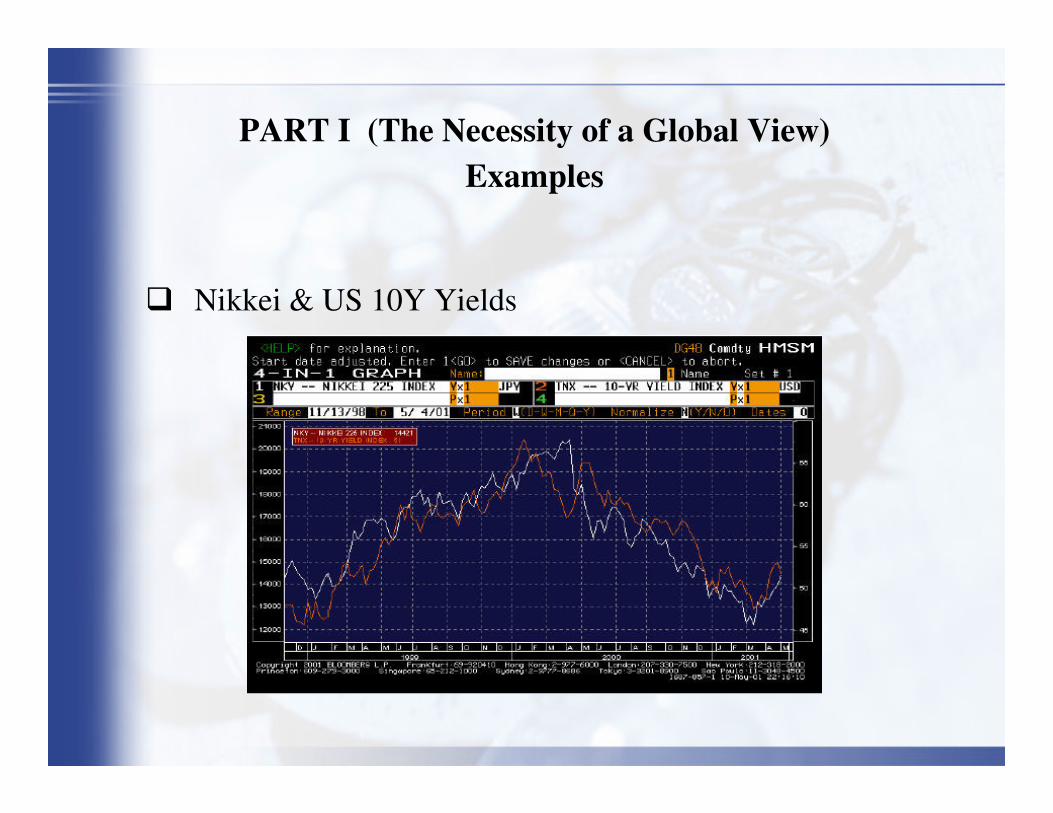
� Nikkei & US 10Y Yields
PART I (The Necessity of a Global View)Examples
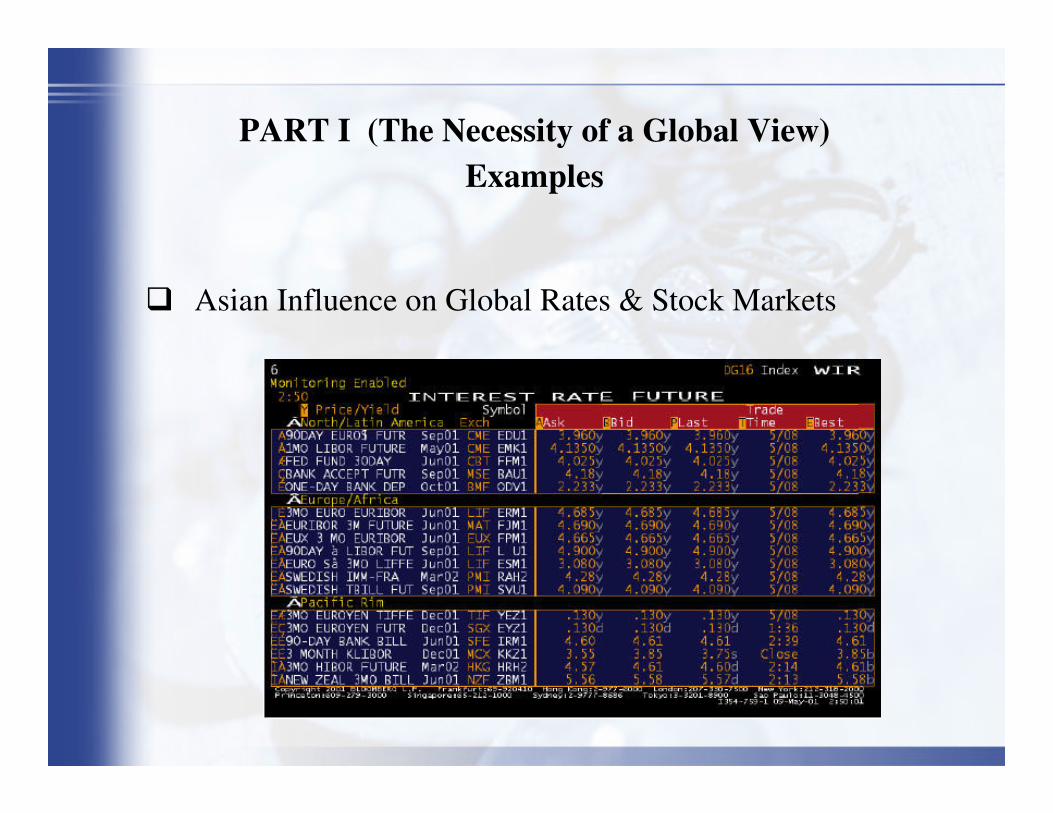
� Asian Influence on Global Rates & Stock Markets
PART I (The Necessity of a Global View)Examples
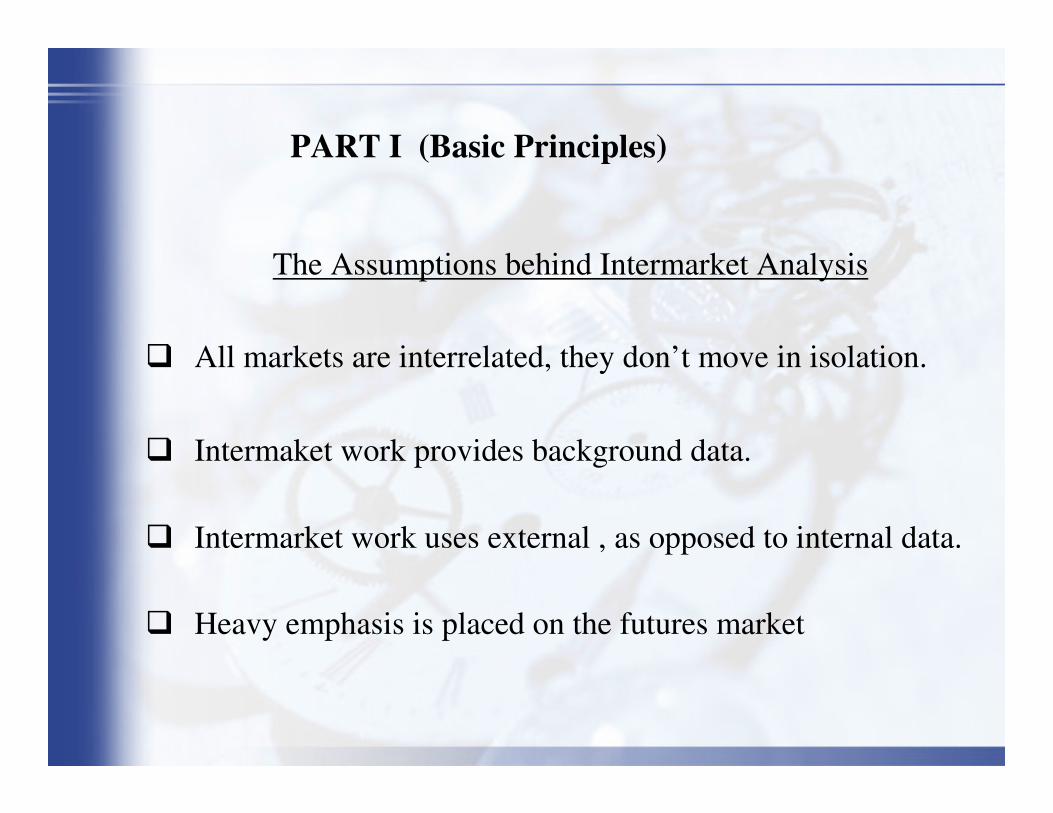
The Assumptions behind Intermarket Analysis
� All markets are interrelated, they don’t move in isolation.
� Intermaket work provides background data.
� Intermarket work uses external , as opposed to internal data.
� Heavy emphasis is placed on the futures market
PART I (Basic Principles)
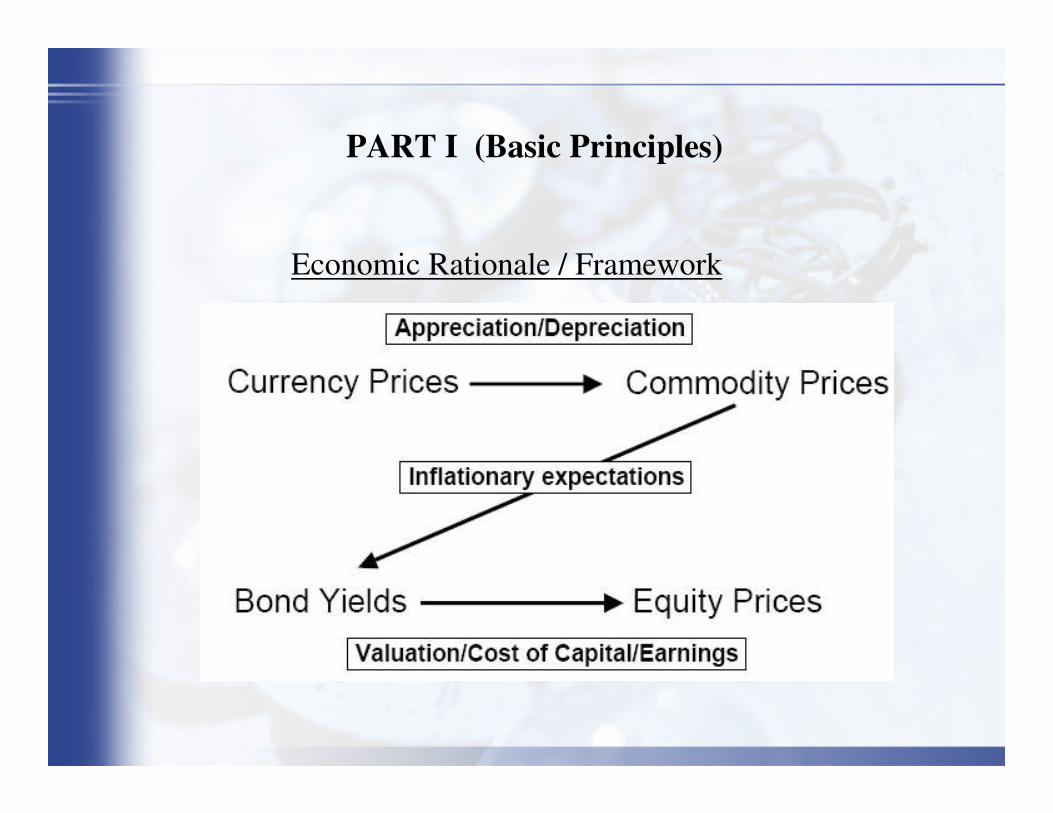
Economic Rationale / Framework
PART I (Basic Principles)
PART I (Basic Principles)
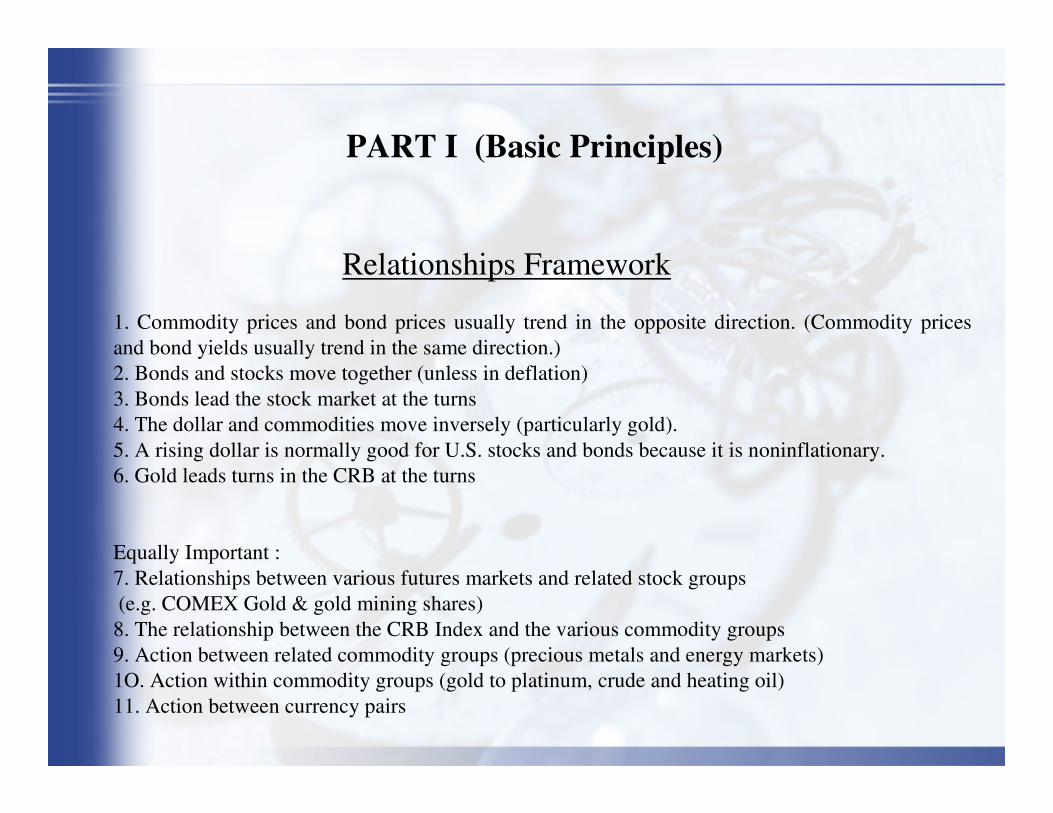
Relationships Framework
1. Commodity prices and bond prices usually trend in the opposite direction. (Commodity prices and bond yields usually trend in the same direction.) 2. Bonds and stocks move together (unless in deflation)3. Bonds lead the stock market at the turns4. The dollar and commodities move inversely (particularly gold).5. A rising dollar is normally good for U.S. stocks and bonds because it is noninflationary.6. Gold leads turns in the CRB at the turns
Equally Important :7. Relationships between various futures markets and related stock groups (e.g. COMEX Gold & gold mining shares)8. The relationship between the CRB Index and the various commodity groups 9. Action between related commodity groups (precious metals and energy markets)1O. Action within commodity groups (gold to platinum, crude and heating oil)11. Action between currency pairs

PART I (Basic Principles)Rising Bond Prices are Usually Good for Stock Prices
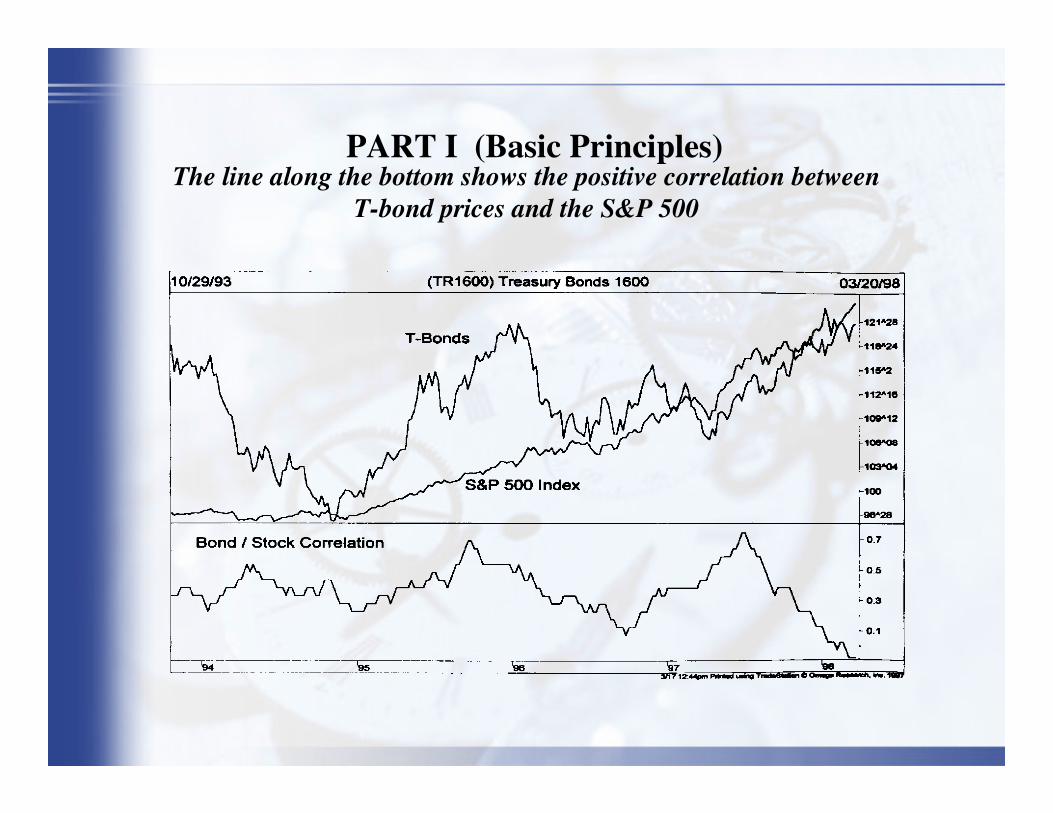
PART I (Basic Principles)The line along the bottom shows the positive correlation between
T-bond prices and the S&P 500
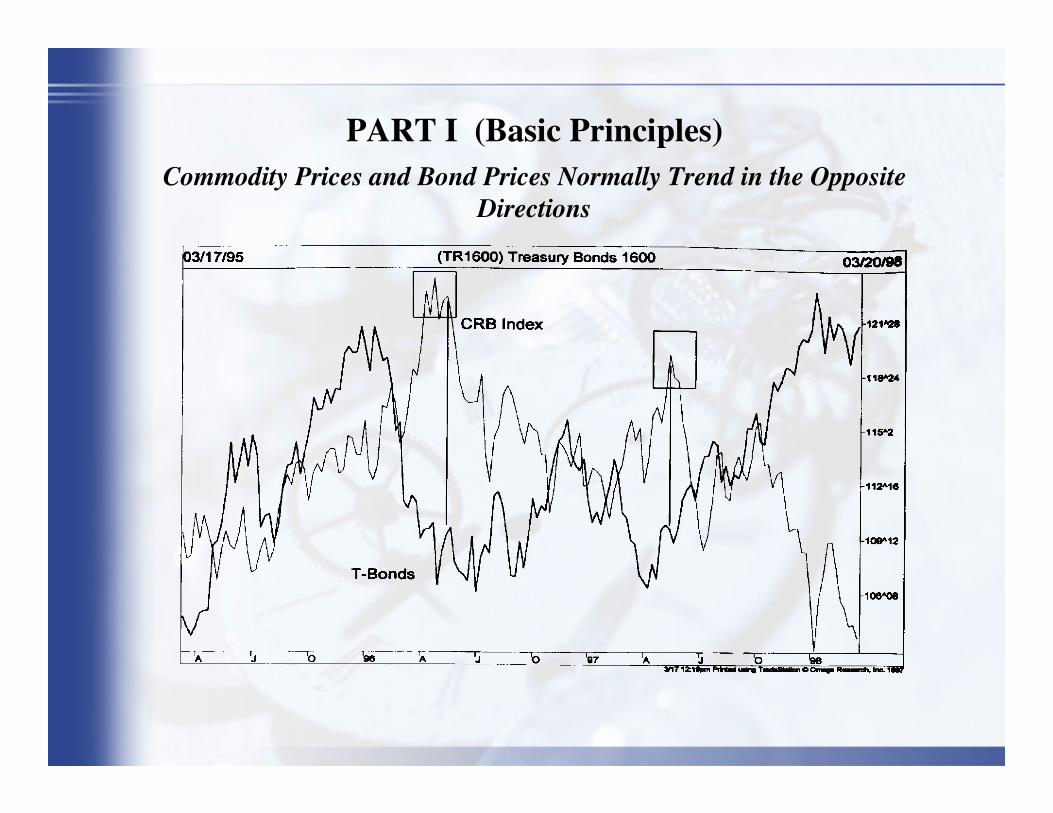
PART I (Basic Principles)Commodity Prices and Bond Prices Normally Trend in the Opposite
Directions
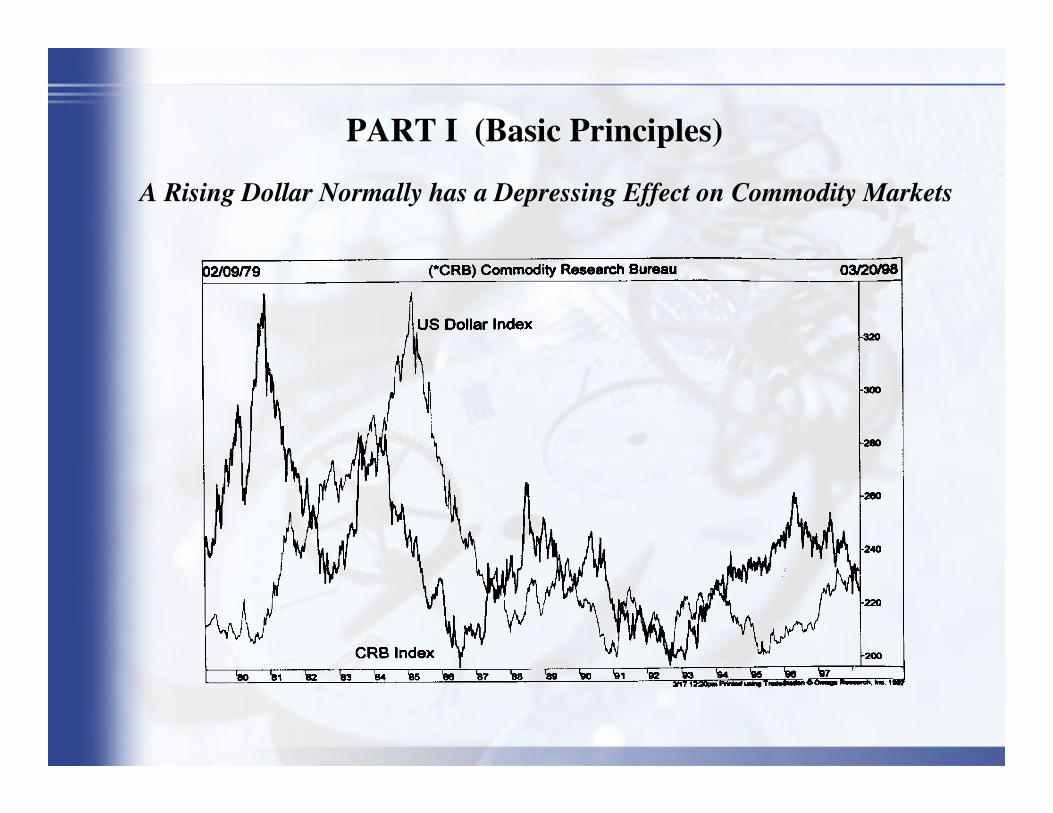
PART I (Basic Principles)
A Rising Dollar Normally has a Depressing Effect on Commodity Markets
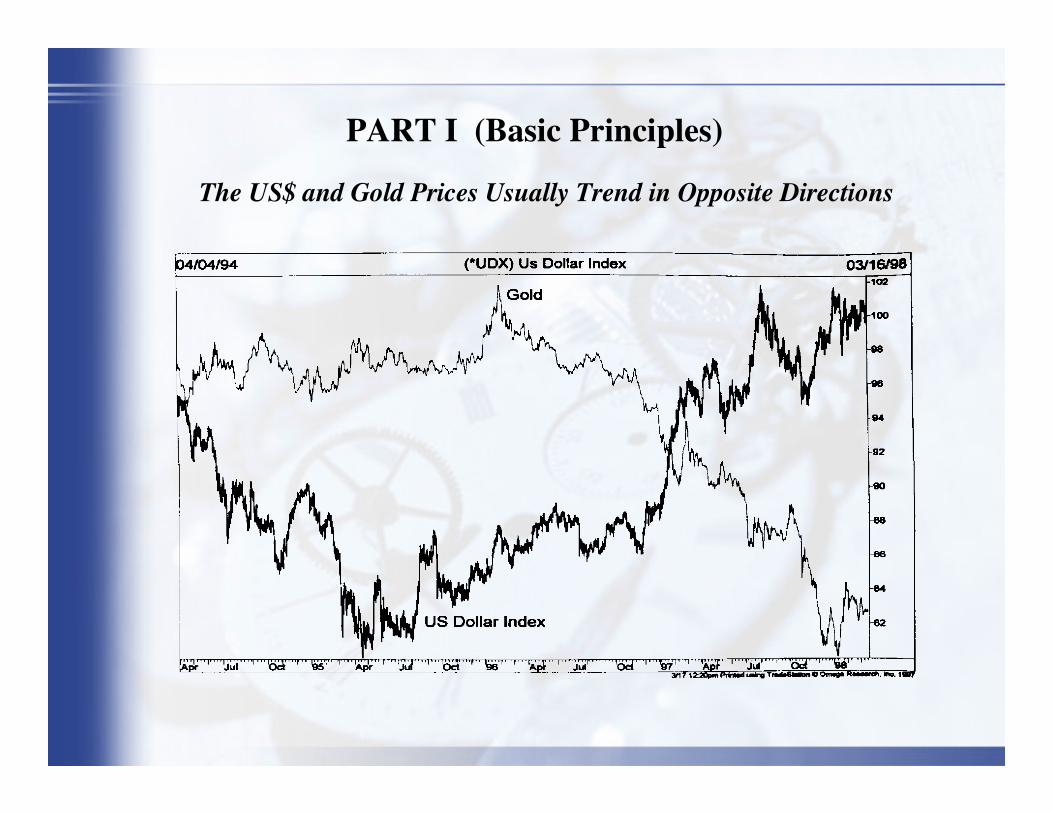
PART I (Basic Principles)
The US$ and Gold Prices Usually Trend in Opposite Directions
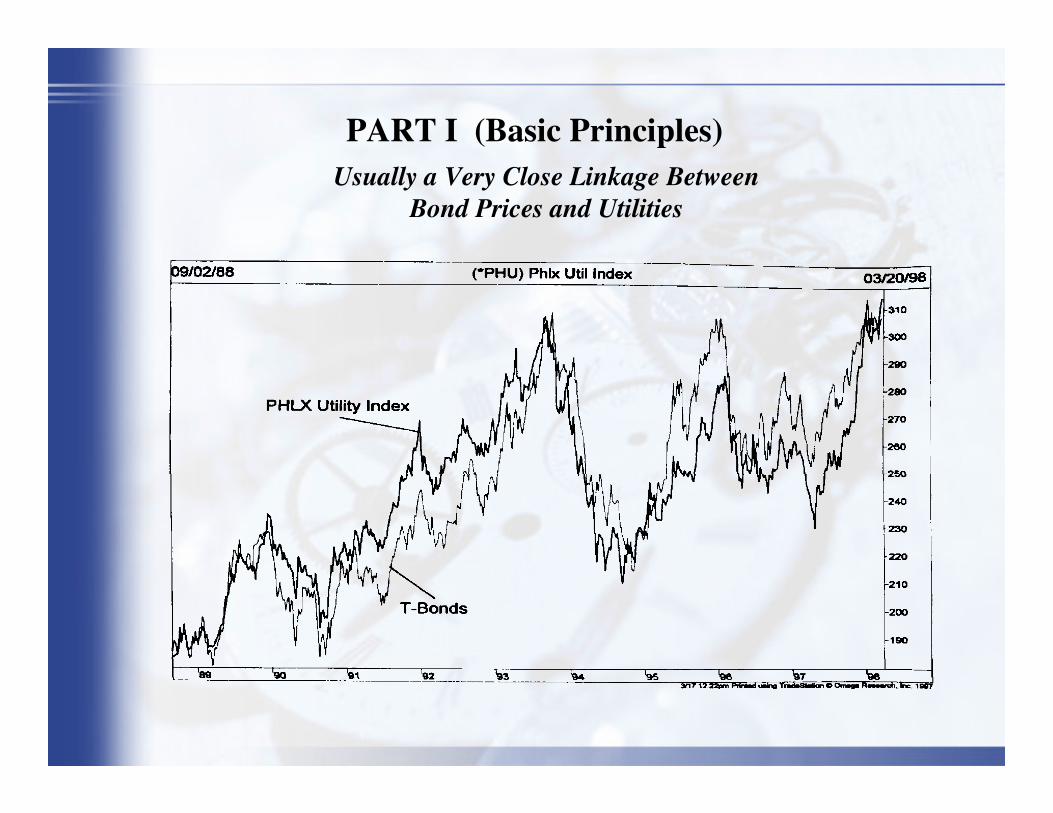
PART I (Basic Principles)Usually a Very Close Linkage Between
Bond Prices and Utilities

PART I (Basic Principles)
Chronological Framework

PART I ( Asset Allocation & Market Timing Uses)
Economic Forecasting
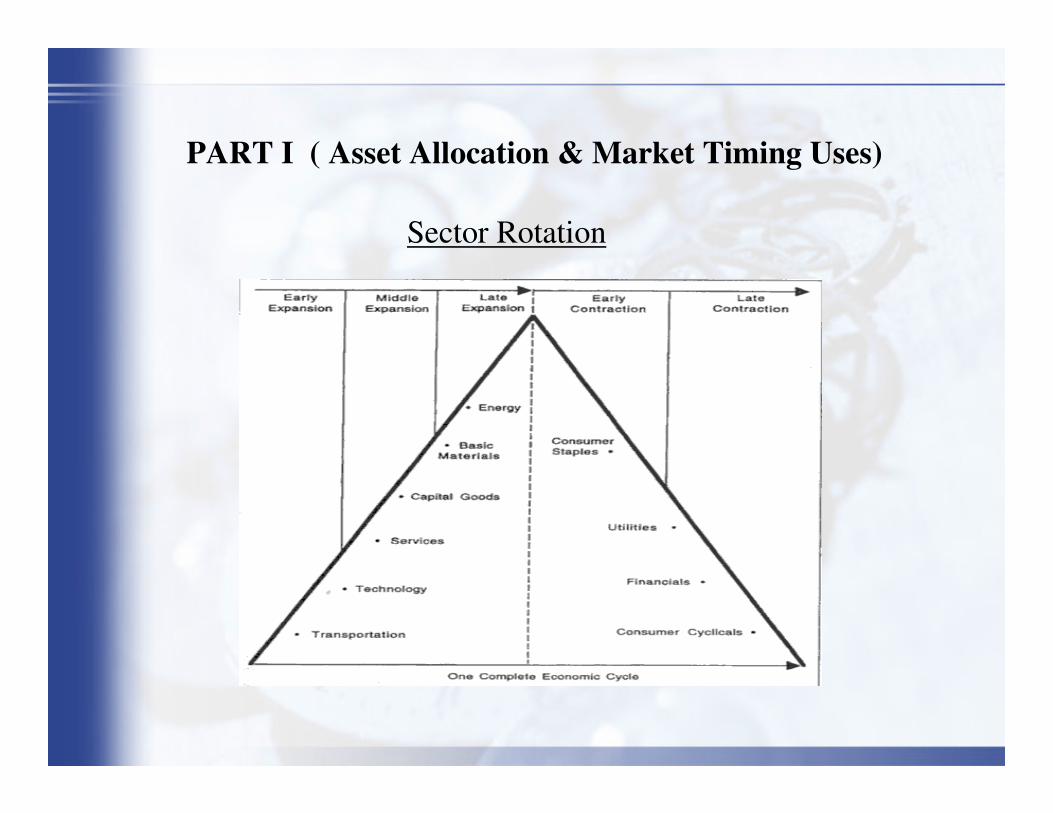
PART I ( Asset Allocation & Market Timing Uses)
Sector Rotation
PART I ( Asset Allocation & Market Timing Uses)
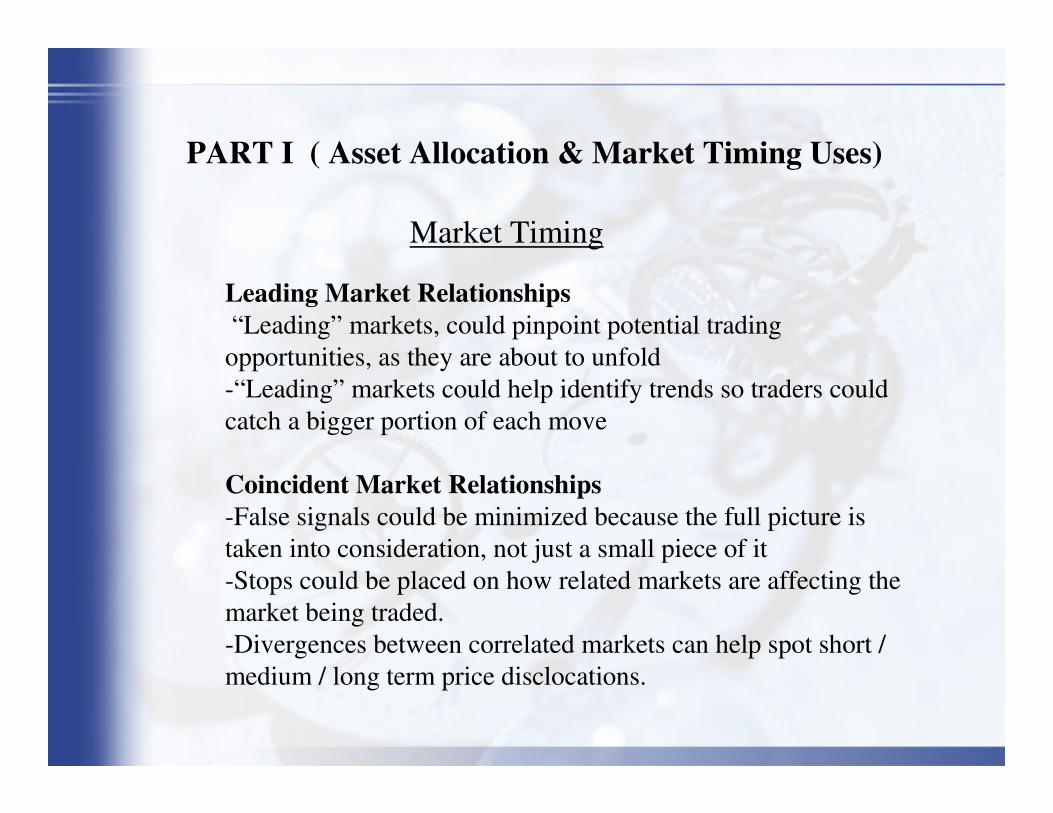
Market Timing
Leading Market Relationships“Leading” markets, could pinpoint potential trading
opportunities, as they are about to unfold-“Leading” markets could help identify trends so traders could catch a bigger portion of each move
Coincident Market Relationships-False signals could be minimized because the full picture is taken into consideration, not just a small piece of it-Stops could be placed on how related markets are affecting the market being traded.-Divergences between correlated markets can help spot short / medium / long term price disclocations.
PART I ( Asset Allocation & Market Timing Uses)
What other Strategies can be devised and Opportunities exploited ?
Ø Intermarket Spreads
Ø Intramarket Spreads
Ø Pairs Trading
PART II (Comparison to Single Market TA )
Single Market Technical analysis (on its own) is incomplete , as an exclusive technical focus is counter-productive. Reliance on price based indicators (solely) may limit our understanding of what drives the markets. In other words, by obsessing about price, we might be sacrificing deeper insight into the root causes of price behaviour.Intermarket Analysis - by turning the focus of the technical analyst outward instead of inward- provides a more rational understanding of technical forces at work in the marketplace. It is impossible to do intermarket work without understanding of the fundamental forces behind those moves.
By incorporating “exogenous” factors – say interest rates – we add a helpful causative dimension to our treatment.This way the timing logic takes into account not only price action – which can be deceptive – but some of the defining properties that help shape and determine price behaviour
PART II (Comparison to Fundamental Analysis )
� Transferable
� Global , not Local
� Market Driven
� Focal Points
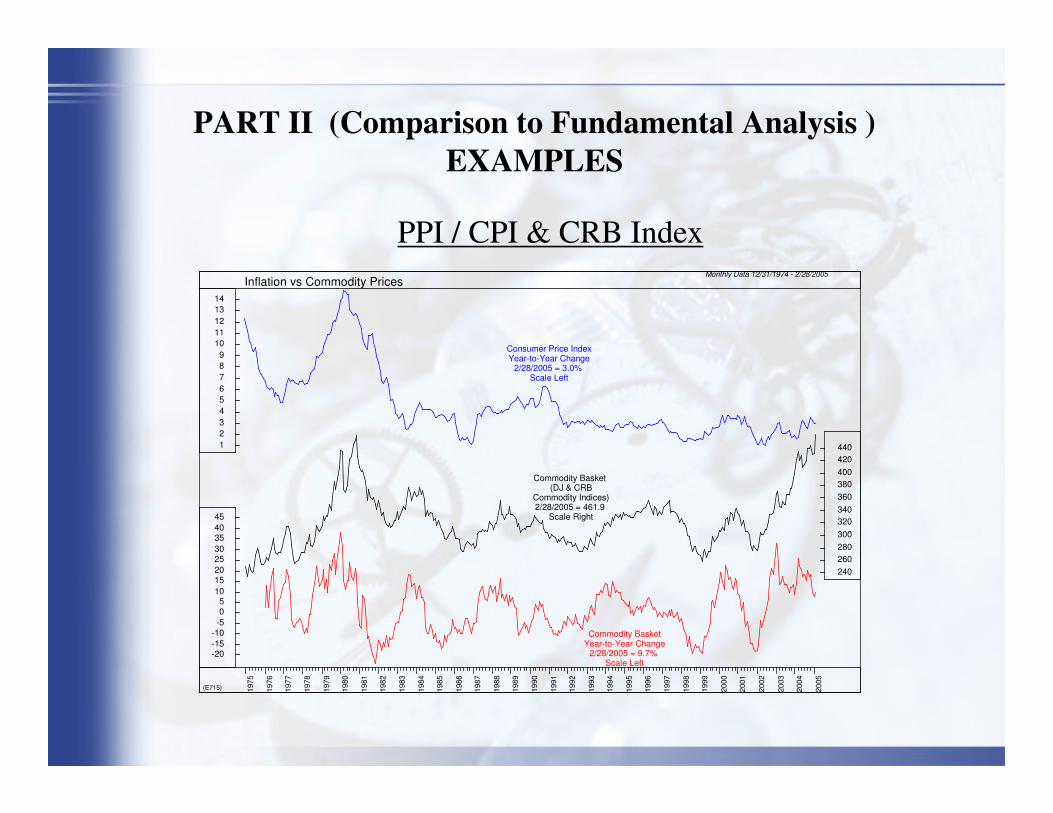
PART II (Comparison to Fundamental Analysis )EXAMPLES
(E715)
Monthly Data 12/31/1974 - 2/28/2005
Consumer Price IndexYear-to-Year Change
2/28/2005 = 3.0% Scale Left
123456789
1011121314
Commodity Basket (DJ & CRB
Commodity Indices)2/28/2005 = 461.9
Scale Right
240260280300320340360380400420440
Commodity BasketYear-to-Year Change
2/28/2005 = 9.7% Scale Left
-20-15-10-505
1015202530354045
1975
1976
1977
1978
1979
1980
1981
1982
1983
1984
1985
1986
1987
1988
1989
1990
1991
1992
1993
1994
1995
1996
1997
1998
1999
2000
2001
2002
2003
2004
2005
Inflation vs Commodity Prices
PPI / CPI & CRB Index
PART II (Limitations of Intermarket Research)
� Information Overflow
� Limited Historical Data
PART III ( Systemizing Intermarket Analysis )
� We have no choice
� Structure , Discipline & Risk Values
� Markets provide enormous amounts of information
� Our Competitors do it…
Why Systemize ?
PART III ( Systemizing Intermarket Analysis )
� Can be…
� Can be classified as…
� Can be used as…
� Can be used in…
Market Correlations…
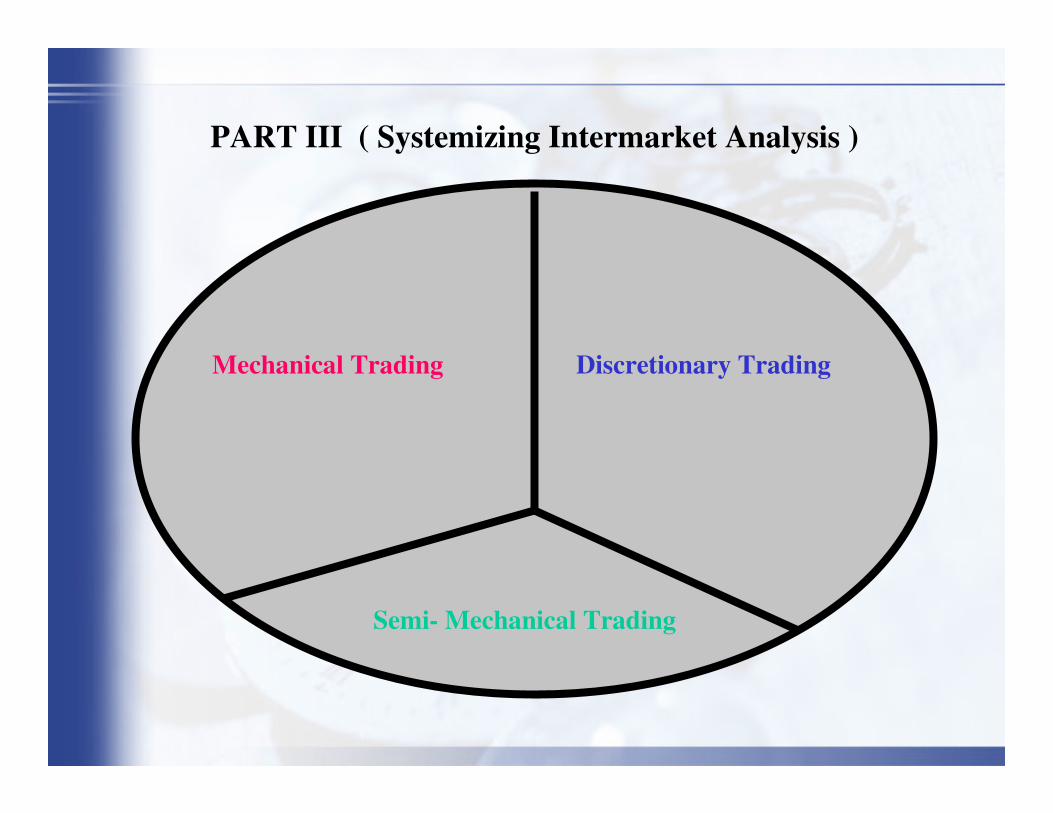
PART III ( Systemizing Intermarket Analysis )
Mechanical Trading Discretionary Trading
Semi- Mechanical Trading
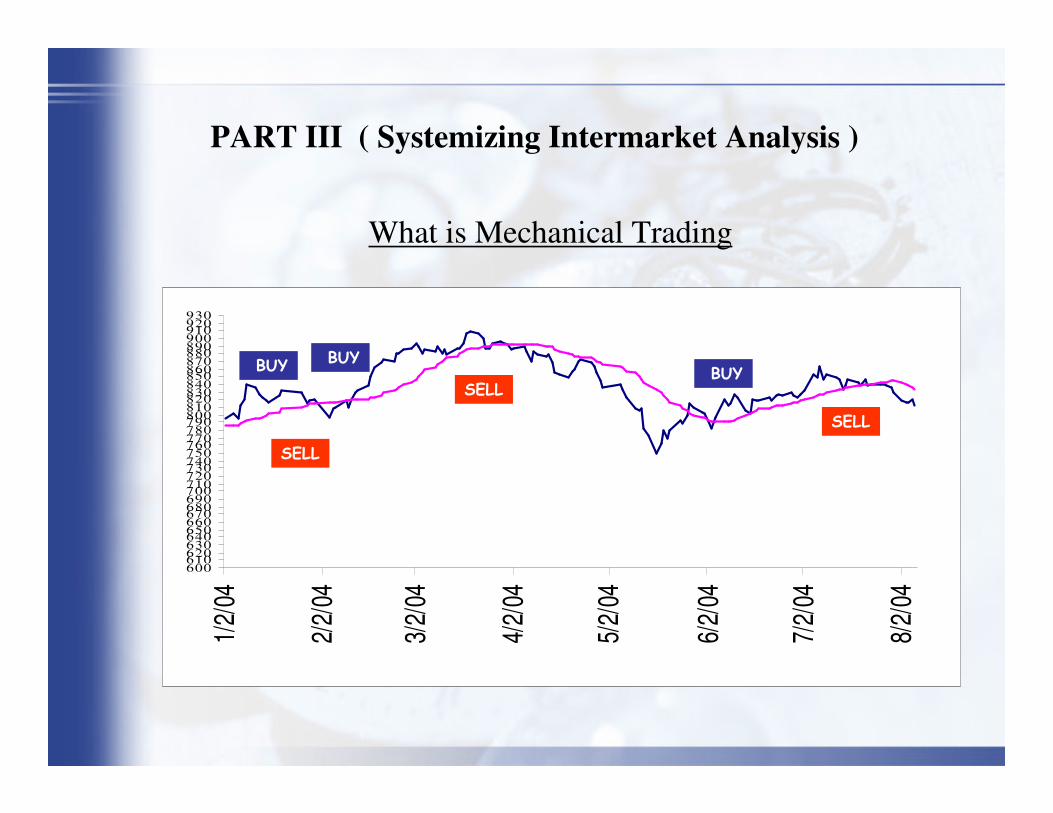
PART III ( Systemizing Intermarket Analysis )
What is Mechanical Trading
600610620630640650660670680690700710720730740750760770780790800810820830840850860870880890900910920930
1/2/
04
2/2/
04
3/2/
04
4/2/
04
5/2/
04
6/2/
04
7/2/
04
8/2/
04
������
� ���
� ���
� ���
���
PART III ( Systemizing Intermarket Analysis )
Why not go completely Mechanical ?
� Not everything can be modelled
� Experience cannot be “pigeon-holed”
� No (modelled) Strategy works across all time frames
� Systems are often over-optimised
PART III ( Systemizing Intermarket Analysis )
Semi – Mechanical Trading
The essence of the Semi-Mechanical Trading approach is not to “forecast” & predict the
future (unlike discretionary trading), but to objectively identify substantially different
average return / risk characteristics of the present.
Mechanical Entry / Exit Rules (signals) can be overiden and are usually combined with the
underlying technical picture in order to align our investment position with the specific
market characteristis that we identify at any given point in time.
Objective Models / Ranking Systems are devised (providing weight of the evidence) in
order to facilitate a disciplined yet flexible decision – making process.

PART III ( Systemizing Intermarket Analysis )Examples
ISM & the S&P 500
(S1100)
Monthly Data 7/31/1950 - 2/28/2005 (Log Scale)
B
S
B
S
B
S
B
S
B
S
B
S
B
S
B
S
B
S
B
S
B
S
B
S
B
S
B
S
B
S
B
S
B
S
B
S
B
Signals Generated When ISM Index:Declines by 7 Points = BuyRises by 22 Points = Sell
Profitable Trades: 78%Gain/Annum: 9.7%Buy-Hold Gain/Annum: 8.0%Latest Signal 7/31/2004 = 1101.72
1318233040526990
118155203267350459602790
103613591784
1318233040526990
118155203267350459602790
103613591784
Declining = Bullish
Rising =Bearish
333639424548525660657075818794
333639424548525660657075818794
Standard & Poor's 500 Stock Index
Source: Institute for Supply ManagementISM Report on BusinessInstitute for Supply Management Price Index
1955 1960 1965 1970 1975 1980 1985 1990 1995 2000 2005
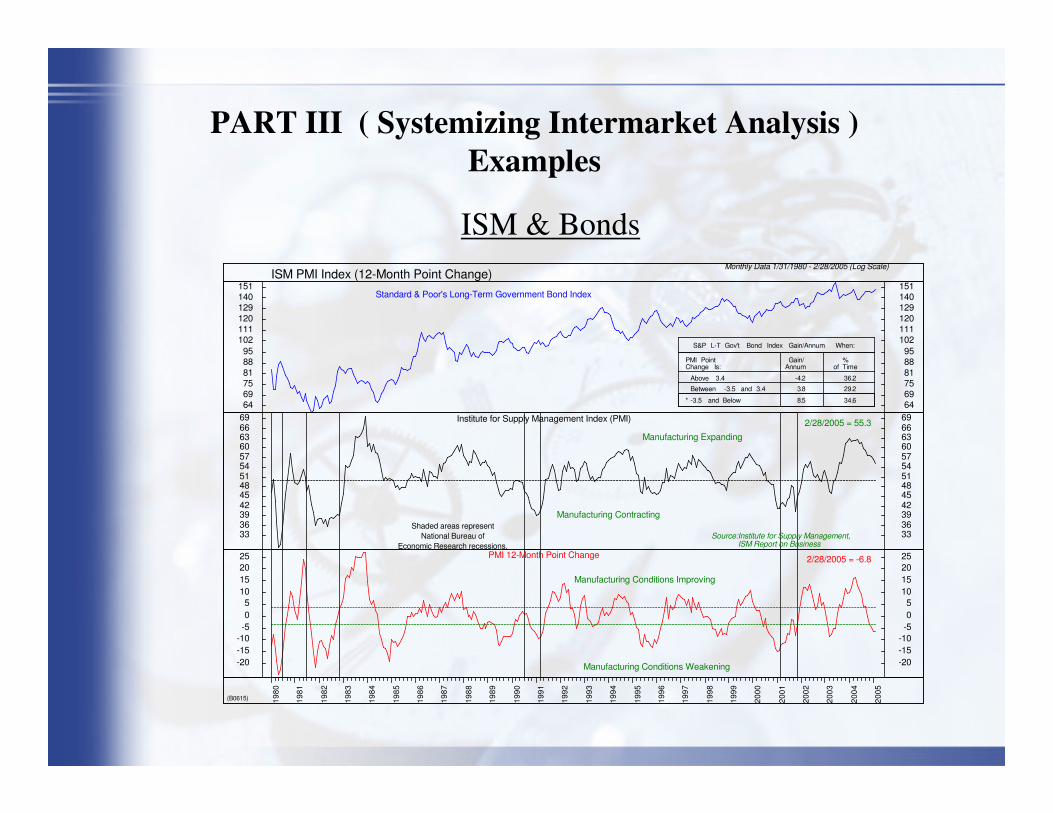
PART III ( Systemizing Intermarket Analysis )Examples
ISM & BondsMonthly Data 1/31/1980 - 2/28/2005 (Log Scale)
(B0615)
Standard & Poor's Long-Term Government Bond Index
S&P L-T Gov't Bond Index Gain/Annum When:
PMI Point Gain/ %Change Is: Annum of Time
Above 3.4 -4.2 36.2
Between -3.5 and 3.4 3.8 29.2
* -3.5 and Below 8.5 34.6646975818895
102111120129140151
646975818895
102111120129140151
Institute for Supply Management Index (PMI)
Shaded areas representNational Bureau of
Economic Research recessions.Source:Institute for Supply Management,
ISM Report on Business
2/28/2005 = 55.3
Manufacturing Expanding
Manufacturing Contracting
33363942454851545760636669
33363942454851545760636669
Manufacturing Conditions Improving
Manufacturing Conditions Weakening
2/28/2005 = -6.8PMI 12-Month Point Change
-20-15-10-505
10152025
-20-15-10-505
10152025
1980
1981
1982
1983
1984
1985
1986
1987
1988
1989
1990
1991
1992
1993
1994
1995
1996
1997
1998
1999
2000
2001
2002
2003
2004
2005
ISM PMI Index (12-Month Point Change)
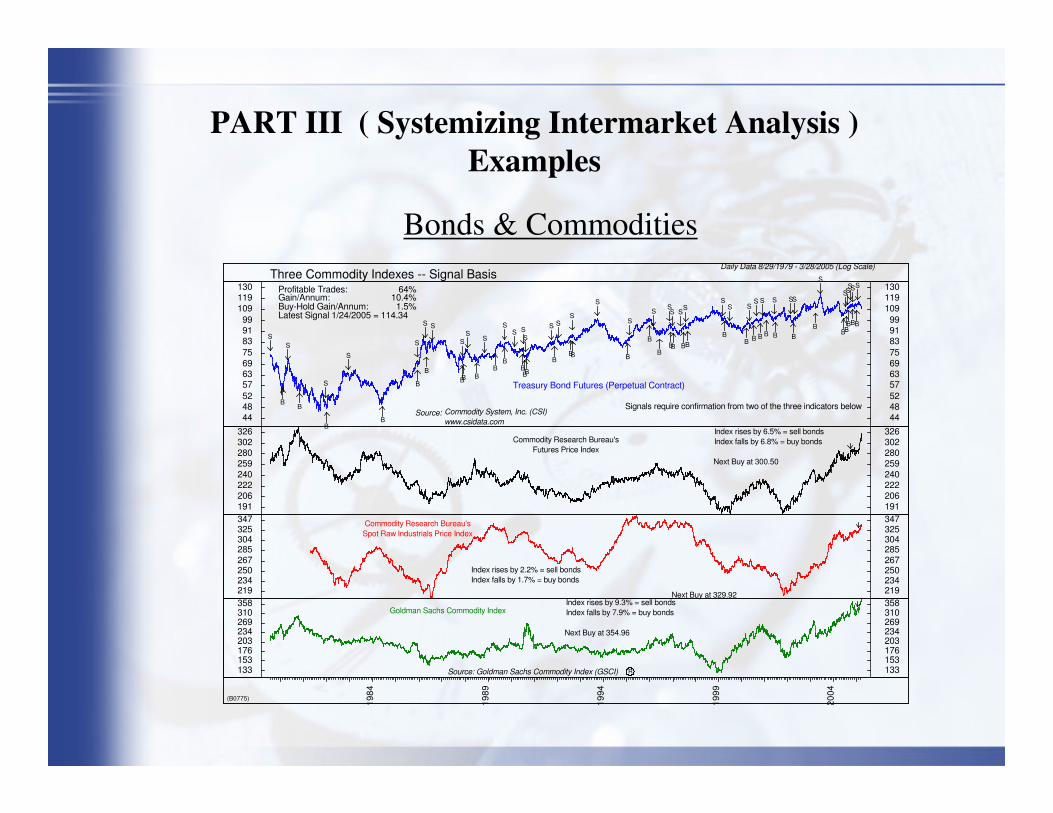
PART III ( Systemizing Intermarket Analysis )Examples
Bonds & Commodities
(B0775)
Daily Data 8/29/1979 - 3/28/2005 (Log Scale)
S
B
S
B
S
B
S
B
S
B
S
B
S
B
S
B
S
B
S
B
S
B
S
B
S
B
S
B
S
B
S
B
S
B
S
B
S
B
S
B
S
B
S
B
S
B
S
B
S
B
S
B
S
B
S
B
S
B
S
B
S
B
S
B
S
B
S
B
S
B
S
B
S
B
S
Treasury Bond Futures (Perpetual Contract)
Profitable Trades: 64%Gain/Annum: 10.4%Buy-Hold Gain/Annum: 1.5%Latest Signal 1/24/2005 = 114.34
Signals require confirmation from two of the three indicators belowSource: Commodity System, Inc. (CSI)
www.csidata.com44485257636975839199
109119130
44485257636975839199
109119130
Commodity Research Bureau'sFutures Price Index
Index rises by 6.5% = sell bondsIndex falls by 6.8% = buy bonds
Next Buy at 300.50
191206222240259280302326
191206222240259280302326
Commodity Research Bureau'sSpot Raw Industrials Price Index
Index rises by 2.2% = sell bondsIndex falls by 1.7% = buy bonds
Next Buy at 329.92219234250267285304325347
219234250267285304325347
Goldman Sachs Commodity IndexIndex rises by 9.3% = sell bondsIndex falls by 7.9% = buy bonds
Next Buy at 354.96
Source: Goldman Sachs Commodity Index (GSCI) R133153176203234269310358
133153176203234269310358
1984
1989
1994
1999
2004
Three Commodity Indexes -- Signal Basis
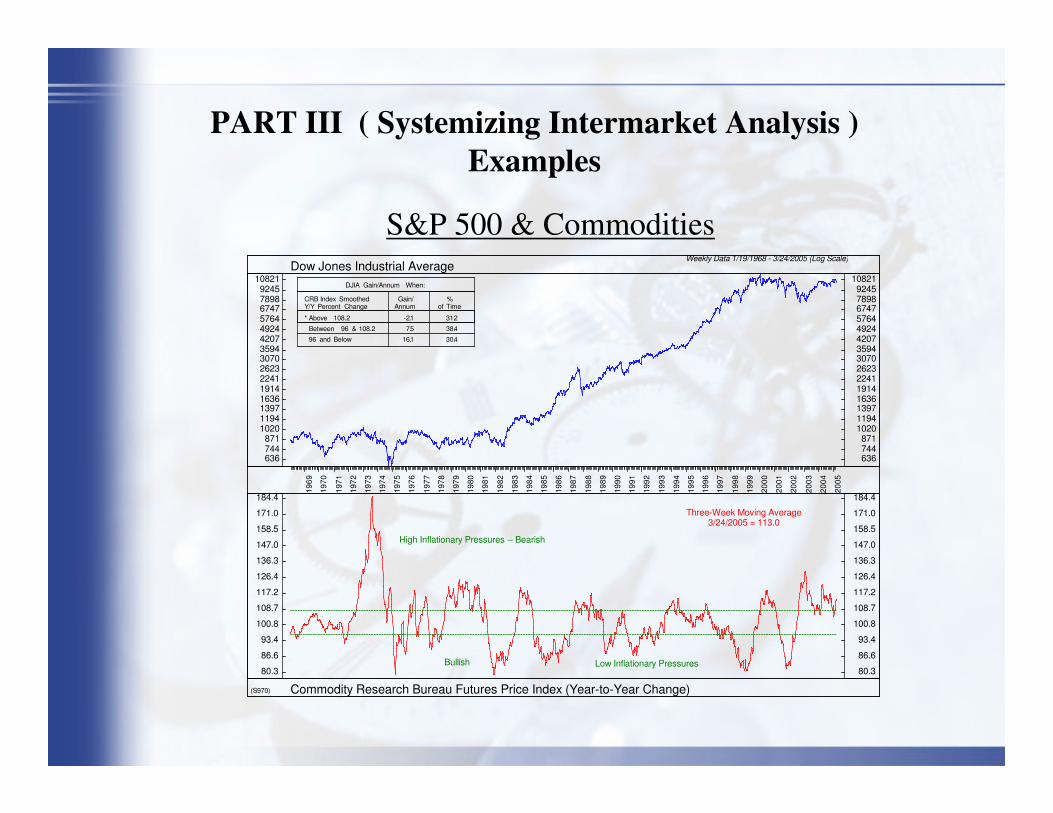
PART III ( Systemizing Intermarket Analysis )Examples
S&P 500 & CommoditiesWeekly Data 1/19/1968 - 3/24/2005 (Log Scale)
(S970)
DJIA Gain/Annum When:
CRB Index Smoothed Gain/ %Y/Y Percent Change Annum of Time
* Above 108.2 -2.1 31.2
Between 96 & 108.2 7.5 38.4
96 and Below 16.1 30.4
636744871
102011941397163619142241262330703594420749245764674778989245
10821
636744871
102011941397163619142241262330703594420749245764674778989245
10821
High Inflationary Pressures -- Bearish
Low Inflationary PressuresBullish
Three-Week Moving Average3/24/2005 = 113.0
80.3
86.6
93.4
100.8
108.7
117.2
126.4
136.3
147.0
158.5
171.0
184.4
80.3
86.6
93.4
100.8
108.7
117.2
126.4
136.3
147.0
158.5
171.0
184.4
1969
1970
1971
1972
1973
1974
1975
1976
1977
1978
1979
1980
1981
1982
1983
1984
1985
1986
1987
1988
1989
1990
1991
1992
1993
1994
1995
1996
1997
1998
1999
2000
2001
2002
2003
2004
2005
Commodity Research Bureau Futures Price Index (Year-to-Year Change)
Dow Jones Industrial Average
Concluding Remarks
“Although the scope of intemarket analysis is broad, forcing us to stretch our
imaginations and expand our vision, the potential benefit is well worth the
extra effort. I am excited about the prospects of intermarket analysis …. The
question is no longer whether or not we should take intermarket comparisons
into consideration, but rather how soon we should begin..”
John J. Murphy
Market Correlations…
NOTES
This presentation is largely informational and by no means exhaustive.
More advanced strategies (that have been developed based on the ideas pioneered by
Mr Murphy ) have not been presented as they are :
(i) beyond the scope of the presentation
(ii) are proprietary
Charts : Some charts are courtesy of Ned Davis Research
Commentary : parts of the presentation include excerpts of Mr. Murphy’s books
REFERENCES & RECOMMENDED READING
John J. Murphy “ Intermarket Technical Analysis ”
John J. Murphy “ Intermarket Analysis, Profiting from Global Market Relationships ”
Martin Pring “ The All –Season Investor ”
Murray Ruggiero “ Cybernetic Trading Strategies ”
Mark Boucher “ The Hedge Fund Edge ”
Ned Davis “ Being Right or Making Money”
Ned Davis “The Triumph of Contrarian Investing”
Geoffrey Moore “Leading Indicators for the 1990’s”
Stephen Leeb “ Market Timing for the Nineties ”
Marty Zweig “Winning on Wall Street ”
Timothy Hays : “ The Research Driven Investor “
George Dagnino “ Profiting in Bull or Bear Markets “
Related Documents


![[Derivatives Consulting Group] Introduction to Equity Derivatives](https://static.cupdf.com/doc/110x72/5525eed15503467c6f8b4b12/derivatives-consulting-group-introduction-to-equity-derivatives.jpg)

