EUROPEAN CENTRAL BANK MONTHLY BULLETIN EN 0112014 MONTHLY BULLETIN JANUARY 0112014 0212014 0312014 0412014 0512014 0612014 0712014 0812014 0912014 1012014 1112014 1212014

Welcome message from author
This document is posted to help you gain knowledge. Please leave a comment to let me know what you think about it! Share it to your friends and learn new things together.
Transcript

MONTHLY BULLET INJaNUarY
011201402120140312014041201405120140612014071201408120140912014101201411120141212014
EUrO
PEaN
CEN
TraL
BaN
K M
ONTH
LY B
ULLE
TIN
EN01
1201
4
MONTHLY BULLET INJaNUarY
011201402120140312014041201405120140612014071201408120140912014101201411120141212014
MONTHLY BULLET IN
JANUARY 2014
In 2014 all ECBpublications
feature a motiftaken from
the €20 banknote.

© European Central Bank, 2014
Address Kaiserstrasse 29
60311 Frankfurt am Main
Germany
Postal address Postfach 16 03 19
60066 Frankfurt am Main
Germany
Telephone +49 69 1344 0
Website http://www.ecb.europa.eu
This Bulletin was produced under the responsibility of the Executive Board of the ECB. Translations are prepared and published by the national central banks.
All rights reserved. Reproduction for educational and non-commercial purposes is permitted provided that the source is acknowledged.
The cut-off date for the statistics included in this issue was 8 January 2014.
ISSN 1561-0136 (print)
ISSN 1725-2822 (online)
EU catalogue number QB-AG-14-001-EN-C (print)
EU catalogue number QB-AG-14-001-EN-N (online)
3ECB
Monthly Bulletin
January 2014
EDITORIAL 5
ECONOMIC AND MONETARY DEVELOPMENTS
1 The external environment of the euro area 7
Box 1 Is weak credit holding back the economic recovery in the United States
and the United Kingdom? 10
Box 2 Latvia adopts the euro 16
2 Monetary and financial developments 19
Box 3 Developments in the international investment position of the euro area since
the outbreak of the financial crisis 23
3 Prices and costs 37
4 Output, demand and the labour market 43
Box 4 Business investment – signs of a modest recovery ahead 45
Box 5 To what extent has the current account adjustment in the stressed euro area
countries been cyclical or structural? 47
ARTICLES
Fifteen years of the ECB Survey of Professional Forecasters 55
Recent developments in excess liquidity and money market rates 69
Medium-term prospects for China’s economy and the internationalisation of the renminbi 83
EURO AREA STATISTICS S1
ANNEXES
Chronology of monetary policy measures of the Eurosystem I
Publications produced by the European Central Bank V
Glossary V I I
CONTENTS
4ECB
Monthly Bulletin
January 2014
ABBREVIATIONS
COUNTRIES LU Luxembourg
BE Belgium HU Hungary
BG Bulgaria MT Malta
CZ Czech Republic NL Netherlands
DK Denmark AT Austria
DE Germany PL Poland
EE Estonia PT Portugal
IE Ireland RO Romania
GR Greece SI Slovenia
ES Spain SK Slovakia
FR France FI Finland
HR Croatia SE Sweden
IT Italy UK United Kingdom
CY Cyprus JP Japan
LV Latvia US United States
LT Lithuania
OTHERS
BIS Bank for International Settlements
b.o.p. balance of payments
BPM5 IMF Balance of Payments Manual (5th edition)
CD certificate of deposit
c.i.f. cost, insurance and freight at the importer’s border
CPI Consumer Price Index
ECB European Central Bank
EER effective exchange rate
EMI European Monetary Institute
EMU Economic and Monetary Union
ESA 95 European System of Accounts 1995
ESCB European System of Central Banks
EU European Union
EUR euro
f.o.b. free on board at the exporter’s border
GDP gross domestic product
HICP Harmonised Index of Consumer Prices
HWWI Hamburg Institute of International Economics
ILO International Labour Organization
IMF International Monetary Fund
MFI monetary financial institution
NACE statistical classification of economic activities in the European Union
NCB national central bank
OECD Organisation for Economic Co-operation and Development
PPI Producer Price Index
SITC Rev. 4 Standard International Trade Classification (revision 4)
ULCM unit labour costs in manufacturing
ULCT unit labour costs in the total economy
In accordance with EU practice, the EU countries are listed in this Bulletin using the alphabetical order of the country names in the national languages.
5ECB
Monthly Bulletin
January 2014
EDITORIAL
Based on its regular economic and monetary analyses, the Governing Council decided at its meeting
on 9 January 2014 to keep the key ECB interest rates unchanged. Incoming information and analysis
have continued to confirm the Governing Council’s previous assessment. Underlying price pressures
in the euro area are expected to remain subdued over the medium term. In keeping with this picture,
monetary and credit dynamics remain subdued. At the same time, inflation expectations for the
euro area over the medium to long term are firmly anchored in line with the Governing Council’s
aim of maintaining inflation rates below, but close to, 2%. Such a constellation continues to suggest
that the euro area economy may experience a prolonged period of low inflation, to be followed by
a gradual upward movement towards inflation rates below, but close to, 2% later on. Against this
background, the Governing Council strongly emphasises that it will maintain an accommodative
monetary policy stance for as long as necessary, which will assist the gradual economic recovery
in the euro area. Accordingly, the Governing Council firmly reiterates the forward guidance that it
continues to expect the key ECB interest rates to remain at present or lower levels for an extended
period of time. As previously stated, this expectation is based on an overall subdued outlook for
inflation extending into the medium term, given the broad-based weakness of the economy and
subdued monetary dynamics. With regard to money market conditions and their potential impact
on the monetary policy stance, the Governing Council is monitoring developments closely and is
ready to consider all available instruments. Overall, the Governing Council remains determined to
maintain the high degree of monetary accommodation and to take further decisive action if required.
Regarding the economic analysis, real GDP in the euro area rose by 0.1%, quarter on quarter, in
the third quarter of 2013, following an increase of 0.3% in the second quarter. While developments
in industrial production data for October point to a weak start to the fourth quarter, survey-based
confidence indicators up to December have improved further from low levels, overall indicating
a continuation of the gradual recovery in economic activity. Looking at 2014 and 2015, output
is expected to recover at a slow pace, in particular owing to some improvement in domestic
demand supported by the accommodative monetary policy stance. Euro area economic activity
should, in addition, benefit from a gradual strengthening of demand for exports. Furthermore, the
overall improvements in financial markets seen since the summer of 2012 appear to be working
their way through to the real economy, as should the progress made on fiscal consolidation.
In addition, real incomes have benefited recently from lower energy price inflation. At the same
time, unemployment in the euro area remains high, and the necessary balance sheet adjustments in
the public and the private sector will continue to weigh on economic activity.
The risks surrounding the economic outlook for the euro area continue to be on the downside.
Developments in global money and financial market conditions and related uncertainties may
have the potential to negatively affect economic conditions. Other downside risks include higher
commodity prices, weaker than expected domestic demand and export growth, and slow or
insufficient implementation of structural reforms in euro area countries.
According to Eurostat’s flash estimate, euro area annual HICP inflation was 0.8% in December 2013,
compared with 0.9% in November. This outcome was broadly as expected and reflected lower
services price inflation. On the basis of prevailing futures prices for energy, annual inflation rates
are expected to remain at around current levels in the coming months. Over the medium term
underlying price pressures in the euro area are expected to remain subdued. At the same time,
inflation expectations for the euro area over the medium to long term continue to be firmly anchored
in line with the Governing Council’s aim of maintaining inflation rates below, but close to, 2%.

6ECB
Monthly Bulletin
January 2014
The risks to the outlook for price developments continue to be seen as broadly balanced over the
medium term, with upside risks relating to higher commodity prices, and stronger than expected
increases in administered prices and indirect taxes, and downside risks stemming from weaker than
expected economic activity.
Turning to the monetary analysis, data for November support the assessment of continued subdued
underlying growth in broad money (M3) and credit. Annual growth in M3 was broadly unchanged
at 1.5% in November, after 1.4% in October, following two consecutive declines in September
and August. Annual growth in M1 remained strong at 6.5%, reflecting a preference for liquidity,
although it was below the peak of 8.7% observed in April 2013. As in previous months, the
main factor supporting annual M3 growth was an increase in the MFI net external asset position,
which continued to reflect the increased interest of international investors in euro area assets.
The annual rate of change of loans to the private sector remained weak. The annual growth rate
of loans to households (adjusted for loan sales and securitisation) stood at 0.3% in November,
broadly unchanged since the beginning of 2013. The annual rate of change of loans to non-financial
corporations (adjusted for loan sales and securitisation) was -3.1% in November, following -3.0%
in October. Overall, weak loan dynamics for non-financial corporations continue to reflect their
lagged relationship with the business cycle, credit risk and the ongoing adjustment of financial and
non-financial sector balance sheets.
Since the summer of 2012 substantial progress has been made on improving the funding situation of
banks. In order to ensure an adequate transmission of monetary policy to the financing conditions
in euro area countries, it is essential that the fragmentation of euro area credit markets declines
further and that the resilience of banks is strengthened where needed. The ECB’s comprehensive
assessment will further support this confidence-building process. It will enhance the quality of
information available on the condition of banks and result in the identification and implementation
of necessary corrective actions. A timely implementation of further steps to establish a banking
union will help to restore confidence in the financial system.
To sum up, the economic analysis indicates that the euro area economy may experience a prolonged
period of low inflation, followed by a gradual upward movement towards inflation rates below, but
close to, 2% later on. A cross-check with the signals from the monetary analysis confirms this picture.
As regards fiscal policies, it is important not to unravel past efforts, but to sustain fiscal consolidation
over the medium term. Fiscal strategies should be in line with the fiscal compact and should
ensure a growth-friendly composition of consolidation which combines improving the quality and
efficiency of public services with minimising distortionary effects of taxation. When accompanied
by the decisive implementation of structural reforms, this will further support the gradual economic
recovery in the euro area and have a positive impact on public finances. Reforms in product and
labour markets, and a rigorous enactment of Single Market policies warrant particular focus to
improve the outlook for economic growth and to foster job creation in an environment of high
unemployment.
This issue of the Monthly Bulletin contains three articles. The first article, entitled “Fifteen years of
the ECB survey of professional forecasters”, reviews some key elements regarding the usefulness
of the survey as a source of information for the ECB’s monetary policy assessment. The second
article reviews the factors behind recent developments in excess liquidity and its impact on money
market rates. The third article presents medium-term prospects for China’s economy and discusses
issues related to the internationalisation of the renminbi.

7ECB
Monthly Bulletin
January 2014
The external
environment
of the euro area
ECONOMIC AND MONETARYDEVELOPMENTSECONOMIC AND MONETARY
DEVELOPMENTS
1 THE EXTERNAL ENVIRONMENT OF THE EURO AREA
The global economy remains on a gradual recovery path, albeit with regional differences. In major advanced economies, the recovery is gradually firming up, supported by accommodative policies. At the same time, growth in emerging market economies lost some of its former vigour, but remains strong overall. The latest survey indicators suggest robust global sentiment in the final quarter of 2013, with activity expected to gradually strengthen further in the course of 2014. Globalinflation and inflationary pressures remain contained.
1.1 GLOBAL ECONOMIC ACTIVITY AND TRADE
The global economic recovery is progressing at a gradual pace, underpinned by strengthening growth
momentum in most advanced economies. At the same time, following the Federal Open Market
Committee’s (FOMC) decision in December 2013 to “taper” its asset-purchasing programme,
uncertainty in global financial markets declined. This may further support global economic activity.
The latest survey indicators continue to point to robust business conditions in the fourth quarter
of 2013, with all indices remaining solidly in expansionary territory. Specifically, the Purchasing
Managers’ Index (PMI) for global all-industry output remained almost unchanged at 53.4 in the
final quarter of 2013 compared with the previous quarter. The resilience of the global all-industry
output PMI in December – which, at 54.0, stood close to its historical average – was driven by
a fairly strong reading in the manufacturing sector, while the index in the services sector eased
somewhat. Excluding the euro area, the all-industry output PMI also remained almost unchanged at
53.8 in the fourth quarter of 2013 (see Chart 1).
Forward-looking global indicators continue to hint at a gradual expansion of the world economy.
The new orders component of the global all-industry PMI (excluding the euro area) increased to
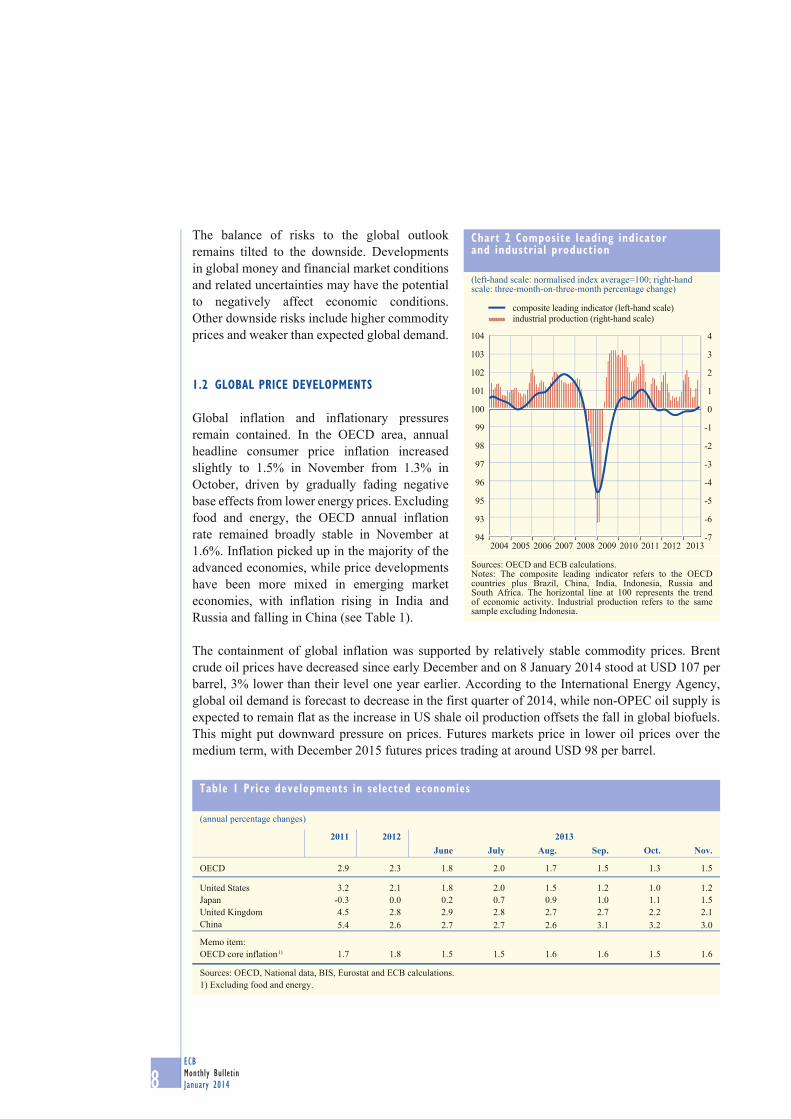
55.4 in December. Meanwhile, for October, the OECD’s composite leading indicator, designed to
anticipate turning points in economic activity relative to trend, signalled enhanced growth prospects
in most major OECD countries and a tentative positive change in momentum in large emerging
market economies, such as China, Russia and India (see Chart 2).
Global trade sustained momentum at the start of the fourth quarter of 2013, showing further signs of stabilisation after a prolonged period of muted growth. According to the CPB Netherlands Bureau of Economic Analysis, world imports of goods grew by 1.3% in October on a three-month-on-three-month basis, compared with 1.5% in September, reflecting considerably stronger growth in Asian emerging market economies and smaller increases in growth in the United States and Japan. Moreover, the global PMI for new manufacturing export orders remains in expansionary territory, despite a slight decrease in December, providing confirmation that the momentum of global trade is fairly positive. Yet the pace of recovery in global trade growth is likely to be modest in the near term and remain below the levels observed prior to the financial crisis.
Chart 1 Global PMI (excluding the euro area)
(seasonally adjusted monthly data)
25
30
35
40
45
50
55
60
65
25
30
35
40
45
50
55
60
65
2004 2005 2006 2007 2008 2009 2010 2011 2012 2013
PMI output: services
PMI output: manufacturing
PMI output: overall
Source: Markit.
8ECB
Monthly Bulletin
January 2014
The balance of risks to the global outlook
remains tilted to the downside. Developments
in global money and financial market conditions
and related uncertainties may have the potential
to negatively affect economic conditions.
Other downside risks include higher commodity
prices and weaker than expected global demand.
1.2 GLOBAL PRICE DEVELOPMENTS
Global inflation and inflationary pressures
remain contained. In the OECD area, annual
headline consumer price inflation increased
slightly to 1.5% in November from 1.3% in
October, driven by gradually fading negative
base effects from lower energy prices. Excluding
food and energy, the OECD annual inflation
rate remained broadly stable in November at
1.6%. Inflation picked up in the majority of the
advanced economies, while price developments
have been more mixed in emerging market
economies, with inflation rising in India and
Russia and falling in China (see Table 1).
The containment of global inflation was supported by relatively stable commodity prices. Brent crude oil prices have decreased since early December and on 8 January 2014 stood at USD 107 per barrel, 3% lower than their level one year earlier. According to the International Energy Agency,
global oil demand is forecast to decrease in the first quarter of 2014, while non-OPEC oil supply is
expected to remain flat as the increase in US shale oil production offsets the fall in global biofuels.
This might put downward pressure on prices. Futures markets price in lower oil prices over the
medium term, with December 2015 futures prices trading at around USD 98 per barrel.
Chart 2 Composite leading indicator and industrial production
(left-hand scale: normalised index average=100; right-hand scale: three-month-on-three-month percentage change)
-7
-6
-5
-4
-3
-2
-1
0
1
2
3
4
93
94
95
96
97
98
99
100
101
102
103
104
2004 2005 2006 2007 2008 2009 2010 2011 2012 2013
industrial production (right-hand scale)
composite leading indicator (left-hand scale)
Sources: OECD and ECB calculations.Notes: The composite leading indicator refers to the OECD countries plus Brazil, China, India, Indonesia, Russia and South Africa. The horizontal line at 100 represents the trend of economic activity. Industrial production refers to the same sample excluding Indonesia.
Table 1 Price developments in selected economies
(annual percentage changes)
2011 2012 2013June July Aug. Sep. Oct. Nov.
OECD 2.9 2.3 1.8 2.0 1.7 1.5 1.3 1.5
United States 3.2 2.1 1.8 2.0 1.5 1.2 1.0 1.2
Japan -0.3 0.0 0.2 0.7 0.9 1.0 1.1 1.5
United Kingdom 4.5 2.8 2.9 2.8 2.7 2.7 2.2 2.1
China 5.4 2.6 2.7 2.7 2.6 3.1 3.2 3.0
Memo item:
OECD core inflation 1) 1.7 1.8 1.5 1.5 1.6 1.6 1.5 1.6
Sources: OECD, National data, BIS, Eurostat and ECB calculations.
1) Excluding food and energy.

9ECB
Monthly Bulletin
January 2014
ECONOMIC AND MONETARYDEVELOPMENTS
The external
environment
of the euro area
Prices of non-energy commodities remained
broadly flat on average during December.
There was a decrease in cereal prices and an
increase in metal prices. In aggregate terms,
the price index for non-energy commodities
(denominated in US dollars) was about 7%
lower at the beginning of January than in the
same period a year earlier.
1.3 DEVELOPMENTS IN SELECTED ECONOMIES
UNITED STATES
In the United States, real GDP growth
accelerated in the third quarter of 2013.
According to the third and final estimate by
the Bureau of Economic Analysis, US real
GDP increased at an annualised rate of 4.1%
(1.0% quarter on quarter), up from 2.5% (0.6%
quarter on quarter) in the previous quarter.
Real GDP growth was higher than the 3.6%
increase reported in the second estimate, with the upward revision mostly being a result of stronger
than previously estimated gains in personal consumption expenditure and private fixed investment.
These two components, together with a sizeable positive contribution from inventory investment
of 1.7 percentage points, were the main drivers of growth in the third quarter. Public spending
increased slightly as reduced expenditure at the federal level was more than offset by higher
expenditure at the state and local levels. The contribution of net exports was slightly positive,
reflecting a more pronounced slowdown in import growth than that in export growth.
In the final quarter of 2013 growth may have been somewhat weaker owing to the adverse effects
of the temporary government shutdown and political brinkmanship surrounding the extension
of the debt limit in October. Moreover, the substantial acceleration of inventory growth in the
third quarter raises the prospect of a payback in the fourth quarter. Nevertheless, stronger than
expected high-frequency data on consumption, industrial production and housing starts up
to November point to an improvement in the underlying growth momentum of the economy.
The labour market has shown resilience, with the pace of job creation accelerating in the
Chart 3 Main developments in commodity prices
60
70
80
90
100
110
120
130
140
20
40
60
80
100
120
140
160
180
2008 2009 2010 2011 2012 2013
non-energy commodities (USD; index: 2010 = 100;
right-hand scale)
Brent crude oil (USD/barrel; left-hand scale)
Sources: Bloomberg and HWWI.
Table 2 Real GDP growth in selected economies
(percentage changes)
Annual growth rates Quarterly growth rates2011 2012 2013
Q12013
Q22013
Q32013
Q12013
Q22013
Q3
United States 1.8 2.8 1.3 1.6 2.0 0.3 0.6 1.0
Japan -0.4 1.4 -0.1 1.3 2.4 1.1 0.9 0.3
United Kingdom 1.1 0.3 0.7 2.0 1.9 0.5 0.8 0.8
China 9.3 7.7 7.7 7.5 7.8 1.5 1.9 2.2
Sources: National data, BIS, Eurostat and ECB calculations.Note: Data in italics refer to preliminary estimates.
10ECB
Monthly Bulletin
January 2014
first two months of the fourth quarter relative to the average in the third quarter and the unemployment
rate falling further to a five-year low of 7.0% in November. Moreover, consumer sentiment recovered
in late 2013, suggesting that the negative confidence effects from the temporary government
shutdown in October are likely to be short-lived. Finally, the bipartisan budget deal signed into law
by President Obama on 26 December, which aims to reduce the across-the-board public spending
cuts under the so-called sequester over the next two fiscal years, further diminishes the expected
near-term fiscal restraint, thereby supporting expectations of an acceleration in economic activity
in 2014. Although credit to the private sector has been relatively subdued in the recovery, there are
signs of a recent pick-up. Box 1 looks at credit to the private sector and its relationship with the
business cycle in the United States and the United Kingdom, with a view to assessing its impact on the
current recovery.
Annual CPI inflation went up by 0.2 percentage point to 1.2% in November, mostly reflecting base
effects related to energy price developments. Food price inflation remained subdued. Excluding
food and energy, inflation stood at 1.7% for the third consecutive month, remaining within the
tight range of between 1.6% and 1.8% that has prevailed since April. Looking ahead, considerable
slack in the economy, as well as subdued wage and input cost dynamics, suggest that inflation will
remain contained.
On 18 December the FOMC announced a modest reduction in the monthly pace of its
asset purchases (commonly referred to as “tapering”) of USD 10 billion to USD 75 billion,
starting from January 2014. The reduction will be divided equally between purchases of
mortgage-backed securities (from USD 40 billion to USD 35 billion) and longer-term Treasury
securities (from USD 45 billion to USD 40 billion), while a further reduction in purchases will be
conditional on the FOMC’s assessment of economic developments. At the same time, the FOMC
stated that “it likely will be appropriate to maintain the current target range for the federal funds
rate well past the time that the unemployment rate declines below 6.5%, especially if projected
inflation continues to run below the Committee’s 2% longer-run goal”, thereby reinforcing and
strengthening its forward guidance regarding the future path of interest rates in relation to the
formulations used since December 2012.
Box 1
IS WEAK CREDIT HOLDING BACK THE ECONOMIC RECOVERY IN THE UNITED STATES AND THE
UNITED KINGDOM?
The dynamics of credit to the non-financial private sector, defined as market and bank sources
of credit, tend to be closely associated with the business cycle, as economic downturns and
subsequent recoveries coincide with strong movements in the growth rate of credit to the private
sector.1 This box looks at regularities of credit and its relationship with the business cycle in two
of the euro area’s largest trading partners, the United States and the United Kingdom.
1 For evidence on the relationship between money/credit and the business cycle in the euro area, see the box entitled “Stylised facts of
money and credit over the business cycle”, Monthly Bulletin, ECB, October 2013.

11ECB
Monthly Bulletin
January 2014
ECONOMIC AND MONETARYDEVELOPMENTS
The external
environment
of the euro area
Credit to the non-financial private sector and the business cycle
Growth rates of real GDP and real credit to non-financial corporations (NFCs) and households
have historically been positively correlated in both the United States and the United Kingdom
(see Chart A). However, the correlation does not appear to be very tight, and in both countries
credit dynamics have been more volatile for the non-financial business sector than for the
household sector. During the current cycle, overall credit has been weak in both countries. As in
previous cycles and in line with the stylised facts for the euro area, corporate credit growth
slowed after household credit growth and economic activity. More recent dynamics suggest that
in the United States the growth of credit to NFCs has picked up, while credit to households may
be bottoming out. In the United Kingdom, credit growth in both sectors has stabilised in recent
quarters at very weak levels.
Correlations between real GDP and real credit growth at different leads and lags confirm that
credit growth is highly pro-cyclical in both countries. GDP growth appears to lead growth in
credit to NFCs, with the highest correlation between the two series being for a three-quarter
lead in the United States and a one-quarter lead in the United Kingdom. While GDP growth also
appears to lead household credit in the United States (by around one quarter), the series are more
coincidental in the United Kingdom. For the United Kingdom, the strongest correlation of GDP
growth with corporate credit (at 0.29 over the period 1967 to 2013) is much lower than with
household credit (at 0.54 over the same period), and also lower than the strongest correlations for
the United States (0.57 for NFCs and 0.56 for households over the period 1953 to 2013).
Chart A Dynamics of real GDP and credit
(year-on-year percentage changes)
real credit to NFCs
real credit to households
real GDP
a) United States b) United Kingdom
-10
-5
0
5
10
15
20
-10
-5
0
5
10
15
20
1985 1990 1995 2000 2005 2010-10
-5
0
5
10
15
20
25
30
-10
-5
0
5
10
15
20
25
30
1985 1990 1995 2000 2005 2010
Sources: Federal Reserve System, Haver Analytics and Office for National Statistics.Note: Real credit has been calculated using the GDP deflator and refers to market and bank sources of credit.

12ECB
Monthly Bulletin
January 2014
Comparison with previous cycles
A comparison of the ratio of market and bank sources of credit to GDP with previous cycles
helps to assess whether credit has been exceptionally weak in the current recovery. Chart B
points to slightly different situations in the two countries. In the United States, the ratio of credit
to the non-financial private sector to GDP declined from the end of the latest recession, and has
increased modestly since mid-2012. The ratio of household credit to GDP has been particularly
weak and continued to decline until the third quarter of 2013 with the ongoing adjustment in US
household balance sheets following the bursting of the housing bubble.2 In the United Kingdom,
by contrast, credit dynamics have been somewhat weaker than in previous recoveries but do not
stand out as having been exceptionally weak. In particular, market-based funding for NFCs has
developed relatively positively, suggesting that businesses have been more able than in previous
episodes to replace bank borrowing with other forms of finance. Overall, however, the ongoing
weakness of credit dynamics in the United Kingdom probably partly reflects the still fragile state
of the banking sector.
For businesses, it appears that the weakness in credit growth may not be a major factor holding
back the recovery in the two economies. Evidence from the composition of NFC financing
indicates that firms with access to the capital markets have been able to offset some of the sharp
drop in loans by issuing debt securities and – in the case of the United Kingdom – equities.
2 For more details, see the box entitled “How much progress has been achieved in household deleveraging in the United States?”,
Monthly Bulletin, ECB, November 2013.
Chart B Ratio of real credit to GDP, comparison with previous recoveries
(index: end of recession = 100; x-axis: quarters)
a) United States b) United Kingdom
70
80
90
100
110
120
130
70
80
90
100
110
120
130
-10 -8 -6 -4 -2 0 2 4 6 8 10 12 14 16 18 20
early 1990s
early 2000s
range of previous recoveries
average of previous cycles
current cycle
60
70
80
90
100
110
120
130
140
150
-8 -6 -4 -2 0 2 4 6 8 10 12 14 1660
70
80
90
100
110
120
130
140
150
early 1970s
early 1980s
early 1990s
average of previous cycles
current cycle
Sources: Federal Reserve System and ECB, Haver Analytics, Office for National Statistics and ECB.Notes: Zero marks the end of each recession. According to the National Bureau of Economic Research, there have been ten recessions in the United States since 1950, with the latest starting in the fourth quarter of 2007 and ending in the second quarter of 2009. According to the Economic Cycle Research Institute, there have been four recessions in the United Kingdom since 1960, with the latest being a double-dip recession starting in the first quarter of 2008 and ending in the first quarter of 2012.
13ECB
Monthly Bulletin
January 2014
ECONOMIC AND MONETARYDEVELOPMENTS
The external
environment
of the euro area
JAPAN
In Japan, the Cabinet Office’s second preliminary estimate of third-quarter GDP growth provided
further evidence of a slowdown in activity from the very buoyant rates of growth observed in the
first half of the year. Third-quarter GDP growth was revised down to 0.3% quarter on quarter
from 0.5%, largely owing to a smaller contribution from inventories. Latest survey data relating
to the fourth quarter point to a pick-up in economic activity. The Bank of Japan’s Tankan survey
continued to increase in December for large manufacturing and non–manufacturing firms,
indicating higher levels of business confidence. In addition, the manufacturing PMI remained
broadly stable in December at 55.2. However, the positive picture provided by the latest survey data
has to be tempered by the more modest increases recorded in hard data, such as those for industrial
production, which increased by 0.1% month on month in November.
Consumer price inflation continued to increase, reaching 1.5% year on year in November, up from
1.1% in October. Against the background of rising energy prices, owing to limitations in domestic
power supply and the past weakening of the Japanese yen, the gap between headline inflation and
inflation excluding food, beverages and energy remains large, with the latter standing at just 0.6% in
November (albeit up from 0.3%). Looking ahead, price dynamics will be affected by the contractual
wage increases to be negotiated in the spring. The Bank of Japan kept its target for the monetary
base unchanged at its December meeting.
UNITED KINGDOM
The United Kingdom has experienced robust economic growth in recent quarters. In the third
quarter of 2013 real GDP increased by 0.8%, driven by domestic demand. Some of the main
business and household survey indicators declined slightly in December, but the relatively high
level of the indicators suggests that growth remained robust in the fourth quarter. In the medium
term, however, the pace of growth is likely to slow somewhat. The relatively weak household real
US corporations have even bought back shares for a number of years, indicating little need
for external finance. This is also reflected in the financing gap of US businesses (i.e. capital
expenditures less internal funds and inventory valuation adjustment), which has been negative
since early 2009 and only recently started to close, indicating that the bulk of US NFCs have
sufficient cash to cover investments. On average, UK companies also have large cash balances,
although it cannot be ruled out that some firms face financing constraints.
Conclusion
Overall, although it is difficult to disentangle the causes and effects between credit and GDP
growth without resorting to more structural frameworks, the stylised facts presented in this box
show that credit dynamics have been relatively subdued during the recovery in the United States
and to a lesser extent also in the United Kingdom. As regards the household sector, credit is
still weak in both countries. However, recent balance sheet repair by households in the United
States together with rising housing and financial wealth in both countries should lead to better
fundamentals that will support private consumption. Turning to the business sector, non-financial
corporations in both countries seem to have been able to use market-based funding when loan
growth turned negative. More recently, business surveys have improved in the United Kingdom
and the United States. This, together with the comfortable cash balances held by US and UK
companies, suggests that the preconditions for an investment recovery are in place.

14ECB
Monthly Bulletin
January 2014
income dynamics and the ongoing need for private and public sector balance sheet adjustment
will continue to constrain domestic demand for some time, while prospects for export growth
remain subdued. At the same time, the labour market situation has continued to improve,
with full-time private sector employment growth in particular picking up in recent months.
The unemployment rate fell by 0.2 percentage point to 7.4% in the three months to October.
Buoyed by recent policy measures, both activity and price indicators for the housing market have
improved further.
Annual CPI inflation slowed further in November 2013 after decelerating markedly in October.
In November the headline inflation rate declined by 0.1 percentage point from October to 2.1%,
owing mainly to lower energy price and education services inflation. Looking ahead, it is expected
that inflationary pressures will remain moderate as inflation continues to be dampened by existing
spare capacity in labour and capital utilisation.
At its meeting on 9 January 2014 the Bank of England’s Monetary Policy Committee decided to
keep the policy rate at 0.5% and the size of its asset purchase programme at GBP 375 billion.
CHINA
In China, the latest indicators continue to point to robust but slightly weaker economic momentum.
Industrial production, fixed asset investment and import growth weakened slightly, but retail
sales and exports rebounded somewhat. Overall, this suggests that growth momentum is slowing
marginally as the effects of the mini-stimulus package implemented over the summer start to wane.
Turning to the monetary side, credit and loan growth remained steady at high levels. Nonetheless,
since the People’s Bank of China announced in its third-quarter monetary policy report that the
Chinese economy may have to go through an extended period of deleveraging, money and bond
market interest rates have generally trended upwards.
Annual CPI inflation declined slightly owing to a lower contribution from food prices and remains
well below the government’s 3.5% target. Inflation excluding food and energy remained stable and
continued to fluctuate between 1.3% and 1.9%, as it has done for two years. PPI inflation continued
to be negative in year-on-year terms.
In early December the Central Economic Work Conference, which set policy priorities for 2014,
emphasised the need to deal with imbalances that had built up in the economy, such as overcapacity
in a number of industries and burgeoning local government debt, inter alia by presenting a plan to
improve rural-urban labour mobility while supporting the ongoing urbanisation process (see also
the article entitled “Medium-term prospects for China’s economy and the internationalisation of the
renminbi” in this issue of the Monthly Bulletin).
1.4 EXCHANGE RATES
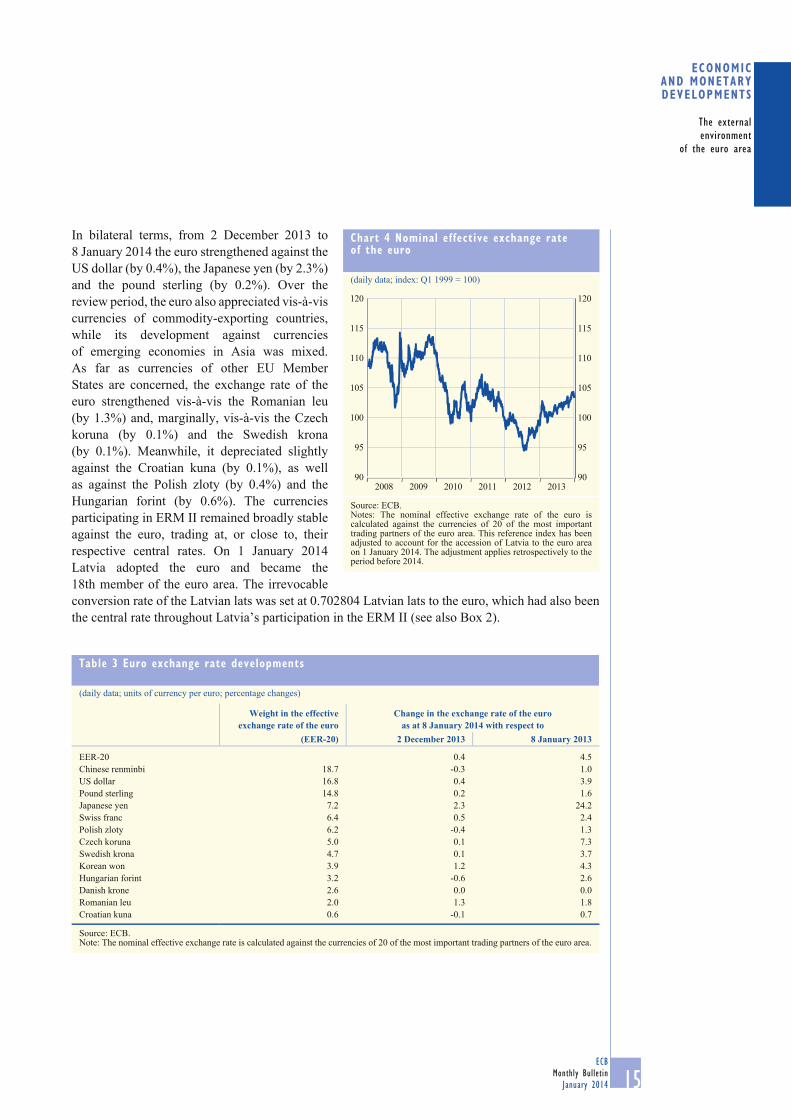
Over the past month, the euro has appreciated against the currencies of most of the euro area’s main
trading partners. On 8 January 2014 the nominal effective exchange rate of the euro, as measured
against the currencies of 20 of the euro area’s most important trading partners, stood 0.4% above
its level at the beginning of December and 4.5% above the level one year earlier (see Chart 4 and
Table 3). During that period, movements in exchange rates were largely related to developments in
interest rate expectations, as well as to adjustments in market expectations regarding the economic
outlook for the euro area relative to other major economies.
15ECB
Monthly Bulletin
January 2014
ECONOMIC AND MONETARYDEVELOPMENTS
The external
environment
of the euro area
In bilateral terms, from 2 December 2013 to
8 January 2014 the euro strengthened against the
US dollar (by 0.4%), the Japanese yen (by 2.3%)
and the pound sterling (by 0.2%). Over the
review period, the euro also appreciated vis-à-vis
currencies of commodity-exporting countries,
while its development against currencies
of emerging economies in Asia was mixed.
As far as currencies of other EU Member
States are concerned, the exchange rate of the
euro strengthened vis-à-vis the Romanian leu
(by 1.3%) and, marginally, vis-à-vis the Czech
koruna (by 0.1%) and the Swedish krona
(by 0.1%). Meanwhile, it depreciated slightly
against the Croatian kuna (by 0.1%), as well
as against the Polish zloty (by 0.4%) and the
Hungarian forint (by 0.6%). The currencies
participating in ERM II remained broadly stable
against the euro, trading at, or close to, their
respective central rates. On 1 January 2014
Latvia adopted the euro and became the
18th member of the euro area. The irrevocable
conversion rate of the Latvian lats was set at 0.702804 Latvian lats to the euro, which had also been
the central rate throughout Latvia’s participation in the ERM II (see also Box 2).
Chart 4 Nominal effective exchange rate of the euro
(daily data; index: Q1 1999 = 100)
90
95
100
105
110
115
120
90
95
100
105
110
115
120
2008 2009 2010 2011 2012 2013
Source: ECB.Notes: The nominal effective exchange rate of the euro is calculated against the currencies of 20 of the most important trading partners of the euro area. This reference index has been adjusted to account for the accession of Latvia to the euro area on 1 January 2014. The adjustment applies retrospectively to the period before 2014.
Table 3 Euro exchange rate developments
(daily data; units of currency per euro; percentage changes)
Weight in the effective exchange rate of the euro
Change in the exchange rate of the euroas at 8 January 2014 with respect to
(EER-20) 2 December 2013 8 January 2013
EER-20 0.4 4.5
Chinese renminbi 18.7 -0.3 1.0
US dollar 16.8 0.4 3.9
Pound sterling 14.8 0.2 1.6
Japanese yen 7.2 2.3 24.2
Swiss franc 6.4 0.5 2.4
Polish zloty 6.2 -0.4 1.3
Czech koruna 5.0 0.1 7.3
Swedish krona 4.7 0.1 3.7
Korean won 3.9 1.2 4.3
Hungarian forint 3.2 -0.6 2.6
Danish krone 2.6 0.0 0.0
Romanian leu 2.0 1.3 1.8
Croatian kuna 0.6 -0.1 0.7
Source: ECB.Note: The nominal effective exchange rate is calculated against the currencies of 20 of the most important trading partners of the euro area.

16ECB
Monthly Bulletin
January 2014
Box 2
LATVIA ADOPTS THE EURO
On 1 January 2014 Latvia adopted the euro and became the 18th member of the euro area.
The conversion rate between the Latvian lats and the euro was irrevocably fixed at 0.702804 lats
to the euro. This was the central rate of the Latvian lats throughout the country’s membership
of ERM II.
Latvia is a very small economy compared with the rest of the euro area. As such, the country’s
adoption of the euro will have no significant impact on the euro area’s aggregate macroeconomic
data (see the table).
Latvia’s population is around 2 million and its GDP accounts for about 0.2% of euro area GDP.
GDP per capita in purchasing power parity terms was slightly below 60% of the euro area
average in 2012.
Key economic characteristics of Latvia and the euro area
Reporting period Unit
Euro area excluding Latvia
Euro area including Latvia Latvia
Population and economic activityTotal population 2012 millions 333.2 335.2 2.0
GDP 2012 EUR billions 9,483.5 9,505.8 22.3
GDP per capita 2012 EUR thousands 28.5 28.4 10.9
GDP per capita (PPP) 2012 EA17=100 100.0 99.7 57.6
GDP (share of world GDP) 1) 2012 percentage 13.5 13.5 0.04
Value added by economic activity 2)
Agriculture, fishing, forestry 2012 percentage of total 1.7 1.7 5.0
Industry (including construction) 2012 percentage of total 25.0 25.0 25.7
Services (including non-market services) 2012 percentage of total 73.3 73.3 69.3
Monetary and financial indicators
Credit to the private sector 3) 2012 percentage of GDP 139.4 139.2 67.6
Stock market capitalisation 4) 2012 percentage of GDP 47.5 47.3 3.8
External trade
Exports of goods and services 5) 2012 percentage of GDP 45.8 45.9 61.6
Imports of goods and services 5) 2012 percentage of GDP 43.2 43.3 65.5
Current and capital account balance 6) 2012 percentage of GDP 1.4 1.4 0.5
Labour market 7)
Labour force participation rate Q2 2013 percentage 72.2 72.2 73.3
Unemployment rate Q3 2013 percentage 12.1 12.1 12.0
Employment rate Q2 2013 percentage 63.6 63.6 64.8
General government
Surplus (+) or deficit (-) 2012 percentage of GDP -3.7 -3.7 -1.3
Revenue 2012 percentage of GDP 46.3 46.2 35.1
Expenditure 2012 percentage of GDP 49.9 49.9 36.4
Gross debt outstanding 2012 percentage of GDP 92.7 92.6 40.6
Sources: Eurostat, IMF, European Commission, ECB and ECB calculations.1) GDP shares are based on a purchasing power parity (PPP) valuation of countries’ GDP.2) Based on nominal gross value added at basic prices.3) Comprises loans, holdings of securities other than shares and holdings of shares and other equities.4) Defined as the total outstanding amount of quoted shares excluding investment funds and money market fund shares issued by euro area/Latvian residents at market value.5) National accounts data for nominal trade in goods and services (includes intra-euro area trade).6) Balance of payments data. Euro area data are compiled on the basis of transactions with residents of countries outside the euro area (i.e. excluding intra-euro area flows). Data for Latvia include transactions with residents from the rest of the world (i.e. including transactions with the euro area).7) Refers to the working age population (aged between 15 and 64).

17ECB
Monthly Bulletin
January 2014
ECONOMIC AND MONETARYDEVELOPMENTS
The external
environment
of the euro area
In the years up to 2007 Latvia was one the EU’s fastest growing economies, but this growth
was accompanied by a build-up of sizeable macroeconomic imbalances. Adjustment began in
2007 and intensified a year later, on account of the global financial crisis. International lenders
provided support, and sizeable fiscal consolidation efforts followed in 2009 and 2010 under the
supervision of the EU and the IMF. Despite a strong fall in output, the budget deficit was reduced
from 9.8% in 2009 to 1.3% in 2012. A credible and frontloaded consolidation strategy, combined
with structural reforms, helped Latvia to keep its fixed exchange rate. A recovery began in the
last quarter of 2009, led by a strengthening in domestic demand and subsequently supported
by a rebound in exports on account of regained competitiveness. Latvia concluded a financial
assistance programme with the EU and the IMF in early 2012 and has already fully repaid the
loan received from the IMF. The public debt-to-GDP ratio rose from a very low level during the
economic crisis. Despite this increase, the public debt ratio stood at 41% in 2012, which was
significantly below the euro area average of 93% in the same year.
More recently, activity has been dynamic and real GDP grew by 4.1% year on year in the
third quarter of 2013. Developments in the labour market have also been positive, with the
unemployment rate standing at 12.0% in the third quarter of 2013, compared with its peak of
20.9% in the first quarter of 2010. However, over the last five years Latvia’s labour market has
suffered from a significant decline in the labour force, resulting from a large number of people
emigrating to search for work in other EU countries. In the third quarter of 2013 total employment
in Latvia was still around 20% below the level it was before the crisis. At the same time, the labour
force participation rate and the employment rate were slightly above the respective averages for
the euro area.
Latvia’s production structure is broadly similar to that of the euro area as a whole. In the Latvian
economy, industry (including construction) contributes around 26% to total value added.
The share of services is slightly lower, at around 70%, while the contribution of the agricultural
sector, at 5%, is somewhat above that of the euro area as a whole. Furthermore, Latvia is a very
open economy and the rest of the euro area is its key trading partner, accounting for around
30% of its total exports and 40% of its total imports. Other important trading partners include
Lithuania and Russia.
The country’s financial sector is heavily bank-based. Bank credit to the private sector amounted
to 68% of GDP in 2012. The banking system is fairly concentrated compared with other euro
area countries. Although it is dominated by Nordic banks, a number of mainly domestically
owned banks actively engage in providing financial services to non-residents. Non-resident
deposits comprised almost 50% of total deposits in the second half of 2013. Meanwhile, the
country’s non-banking financial sector is very small – its stock market capitalisation, at just
below 4% of GDP in 2012, is the lowest among the euro area countries.
In order to fully reap the advantages of the euro and to allow adjustment mechanisms to operate
efficiently within the enlarged currency area, Latvia needs to continue its reform efforts.
Economic policies should be geared towards ensuring the sustainability of the convergence
process and sustainable growth in the long term. Ensuring a low inflation environment is crucial
in that respect. In addition, the functioning of the labour market should be improved to allow it
to reach its full potential.
18ECB
Monthly Bulletin
January 2014
The Latvian authorities have publicly stated their goal to avoid pro-cyclical policies and
strengthen the quality of institutions, the business environment and governance to ensure the
stability and competitiveness of the economy. In addition, the authorities have announced a
commitment to fully comply with the Stability and Growth Pact and the fiscal compact on a
permanent basis, as well as to implement further structural reforms. The available toolkit of
micro and macro-prudential policies should be effectively used and enhanced, if necessary, in
order to limit risks stemming from, in particular, financial services provided to non-residents.
In the context of the stability-oriented monetary policy of the ECB, the fulfilment of and
long-term adherence to these commitments is essential to ensure that the economic environment
in Latvia is conducive to sustainable output and job creation in the medium and long term.

19ECB
Monthly Bulletin
January 2014
Monetary and
financial
developments
ECONOMIC AND MONETARYDEVELOPMENTS
2 MONETARY AND FINANCIAL DEVELOPMENTS
2.1 MONEY AND MFI CREDIT
Annual M3 growth stabilised in November 2013, supported by further monthly inflows into its most liquid components, in particular overnight deposits. Annual growth of M1 thus stabilised and remained the main contributor to annual M3 growth. On the counterpart side, annual growth in broad money continued to be supported by strong monthly increases in MFIs’ net external asset positions, in part reflecting the interest of international investors in euro area assets, and a reduction of longer-term financial liabilities. The annual rate of change in MFI lending to the private sector (adjusted for sales and securitisation) was broadly unchanged, although it remained in negative territory and thus a persistent drag on money creation. This stabilisation at negative levels is consistent with the state of the business cycle, amid weak demand and remaining supply constraints. MFI credit to general government declined, mirroring easing conditions in sovereign debt markets.
THE BROAD MONETARY AGGREGATE M3
The annual growth rate of M3 stabilised at 1.5% in November, after 1.4% in October (see Chart 5).
M3 flows were again driven solely by inflows into M1. As in October, November flows into the
narrow monetary aggregate M1 mirrored portfolio reallocations into overnight deposits, while other
short-term deposits and marketable instruments saw outflows that were driven by a search for yield
and reduced risk aversion.
On the component side, M1 remained the main contributor to annual M3 growth, despite the
stabilisation of its annual growth rate. The contribution of other short-term deposits (M2 minus M1)
stabilised in negative territory, while that of marketable instruments (M3 minus M2) remained
strongly negative. The net outflows from M3 instruments with a higher remuneration than those in
M1 continue to signal a search for yield by the money-holding sector, resulting in shifts of funds
from higher-yielding instruments within M3
towards less liquid, riskier assets outside M3.
On the counterpart side, money creation
continued to be supported by further significant
increases in MFIs’ net external asset positions
in November, resulting in part from the interest
of international investors in euro area assets.
Moreover, substantial negative flows from
longer-term financial liabilities, in particular
moderate outflows from longer-term deposits,
were also supportive of M3 growth. By contrast,
strong negative flows in credit to the private
sector and, albeit to a lesser extent, in credit
to general government, driven by net sales
of domestic government bonds by MFIs in
some stressed countries in November, reduced
money growth.
The volume of euro area MFIs’ main assets
contracted further in November, continuing the
deleveraging observed since spring 2012. The
Chart 5 M3 growth
(percentage changes; adjusted for seasonal and calendar effects)
-2
0
2
4
6
8
10
12
14
-2
0
2
4
6
8
10
12
14
1999 2001 2003 2005 2007 2009 2011 2013
M3 (six-month annualised growth rate)
M3 (three-month centred moving average
of the annual growth rate)
M3 (annual growth rate)
Source: ECB.

20ECB
Monthly Bulletin
January 2014
month-on-month decline reflects decreases in all main asset classes, with sizeable net redemptions
of loans to the private sector in some stressed countries. Euro area MFIs’ reliance on the provision
of liquidity by the Eurosystem decreased further in November, thus continuing the declining trend
observed since August 2012.
MAIN COMPONENTS OF M3
As regards the components of M3, the annual growth rate of M1 stabilised at 6.5% in
November 2013, after 6.6% in October. Strong annual M1 growth continued to be driven by
substantial inflows into overnight deposits, thus underlining the strong preference for liquidity
displayed by the money-holding sector over past quarters, as well as the return of confidence in
euro area assets among international investors.
By contrast, an increased interest of the money-holding sector in obtaining higher yields by
investing in riskier assets has left its mark on developments observed in other M3 instruments.
Accordingly, the annual growth rate of short-term deposits other than overnight deposits (M2 minus
M1) declined to -1.5% in November, down from -1.2% in October. This reflected a further sharp
decline in the annual growth rate of short-term time deposits (i.e. deposits with an agreed maturity
of up to two years), to -6.8% in November, after -6.6% in October. By contrast, the annual growth
of short-term savings deposits (i.e. deposits redeemable at notice of up to three months) remained in
positive territory in November, although falling to 3.1%, from 3.5% in October.
The annual growth rate of marketable instruments (M3 minus M2) remained negative, standing at
-16.2% in November, after -17.9% in October. This reflected negative rates of annual growth in the
money-holding sector’s holdings of money market fund shares/units and repurchase agreements,
as well as in its holdings of short-term MFI debt securities. The continuous outflows from money
market fund shares/units are a consequence of the relative unattractiveness of these instruments in
a low interest rate environment, in particular after the further reduction of policy rates and declines
in government bond yields in a number of euro area countries. The persistently negative growth rate
of net issuance of short-term debt securities reflects the reduced funding needs of euro area MFIs in
the context of balance sheet adjustments and a robust development of their deposit base.
The annual growth rate of M3 deposits – which include repurchase agreements and represent
the broadest component of M3 for which a timely sectoral breakdown is available – decreased
to 2.7% in November, from 2.9% in October. The decline was driven mainly by a moderation of the
annual growth of M3 deposits held by financial intermediaries other than insurance corporations
and pension funds, as well as by households. In November, by contrast, M3 deposits held by non-
financial corporations continued to increase at a robust annual growth rate (6.6%).
MAIN COUNTERPARTS OF M3
The annual growth rate of MFI credit to euro area residents decreased further in November,
to -1.4%, from -1.0% in October. This mainly reflected a marked decline in the annual growth
of credit to the general government sector, which decreased to -0.6%, from 0.8% in the previous
month. The growth in credit to the private sector also slowed down in November, standing at -1.6%,
after -1.4% in October.
The slower annual growth of credit to general government in November was due mainly to net sales
of government securities, partly reflecting a continuation of the easing conditions in the euro area
sovereign debt markets and an interest in this asset class by other investors.
21ECB
Monthly Bulletin
January 2014
Monetary and
financial
developments
ECONOMIC AND MONETARYDEVELOPMENTS
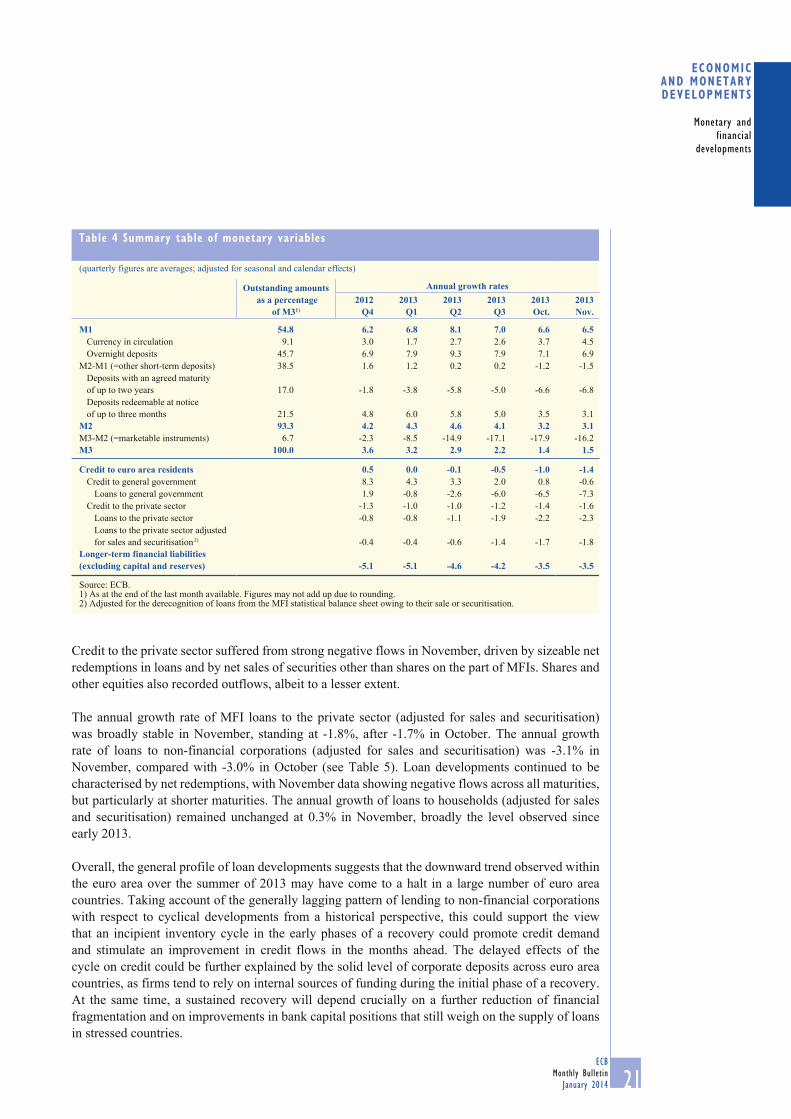
Credit to the private sector suffered from strong negative flows in November, driven by sizeable net
redemptions in loans and by net sales of securities other than shares on the part of MFIs. Shares and
other equities also recorded outflows, albeit to a lesser extent.
The annual growth rate of MFI loans to the private sector (adjusted for sales and securitisation)
was broadly stable in November, standing at -1.8%, after -1.7% in October. The annual growth
rate of loans to non-financial corporations (adjusted for sales and securitisation) was -3.1% in
November, compared with -3.0% in October (see Table 5). Loan developments continued to be
characterised by net redemptions, with November data showing negative flows across all maturities,
but particularly at shorter maturities. The annual growth of loans to households (adjusted for sales
and securitisation) remained unchanged at 0.3% in November, broadly the level observed since
early 2013.
Overall, the general profile of loan developments suggests that the downward trend observed within
the euro area over the summer of 2013 may have come to a halt in a large number of euro area
countries. Taking account of the generally lagging pattern of lending to non-financial corporations
with respect to cyclical developments from a historical perspective, this could support the view
that an incipient inventory cycle in the early phases of a recovery could promote credit demand
and stimulate an improvement in credit flows in the months ahead. The delayed effects of the
cycle on credit could be further explained by the solid level of corporate deposits across euro area
countries, as firms tend to rely on internal sources of funding during the initial phase of a recovery.
At the same time, a sustained recovery will depend crucially on a further reduction of financial
fragmentation and on improvements in bank capital positions that still weigh on the supply of loans
in stressed countries.
Table 4 Summary table of monetary variables
(quarterly figures are averages; adjusted for seasonal and calendar effects)
Outstanding amounts as a percentage
of M31)
Annual growth rates2012
Q42013
Q12013
Q22013
Q32013Oct.
2013Nov.
M1 54.8 6.2 6.8 8.1 7.0 6.6 6.5Currency in circulation 9.1 3.0 1.7 2.7 2.6 3.7 4.5
Overnight deposits 45.7 6.9 7.9 9.3 7.9 7.1 6.9
M2-M1 (=other short-term deposits) 38.5 1.6 1.2 0.2 0.2 -1.2 -1.5
Deposits with an agreed maturity
of up to two years 17.0 -1.8 -3.8 -5.8 -5.0 -6.6 -6.8
Deposits redeemable at notice
of up to three months 21.5 4.8 6.0 5.8 5.0 3.5 3.1
M2 93.3 4.2 4.3 4.6 4.1 3.2 3.1M3-M2 (=marketable instruments) 6.7 -2.3 -8.5 -14.9 -17.1 -17.9 -16.2
M3 100.0 3.6 3.2 2.9 2.2 1.4 1.5
Credit to euro area residents 0.5 0.0 -0.1 -0.5 -1.0 -1.4Credit to general government 8.3 4.3 3.3 2.0 0.8 -0.6
Loans to general government 1.9 -0.8 -2.6 -6.0 -6.5 -7.3
Credit to the private sector -1.3 -1.0 -1.0 -1.2 -1.4 -1.6
Loans to the private sector -0.8 -0.8 -1.1 -1.9 -2.2 -2.3
Loans to the private sector adjusted
for sales and securitisation 2) -0.4 -0.4 -0.6 -1.4 -1.7 -1.8
Longer-term financial liabilities (excluding capital and reserves) -5.1 -5.1 -4.6 -4.2 -3.5 -3.5
Source: ECB.1) As at the end of the last month available. Figures may not add up due to rounding.2) Adjusted for the derecognition of loans from the MFI statistical balance sheet owing to their sale or securitisation.
22ECB
Monthly Bulletin
January 2014
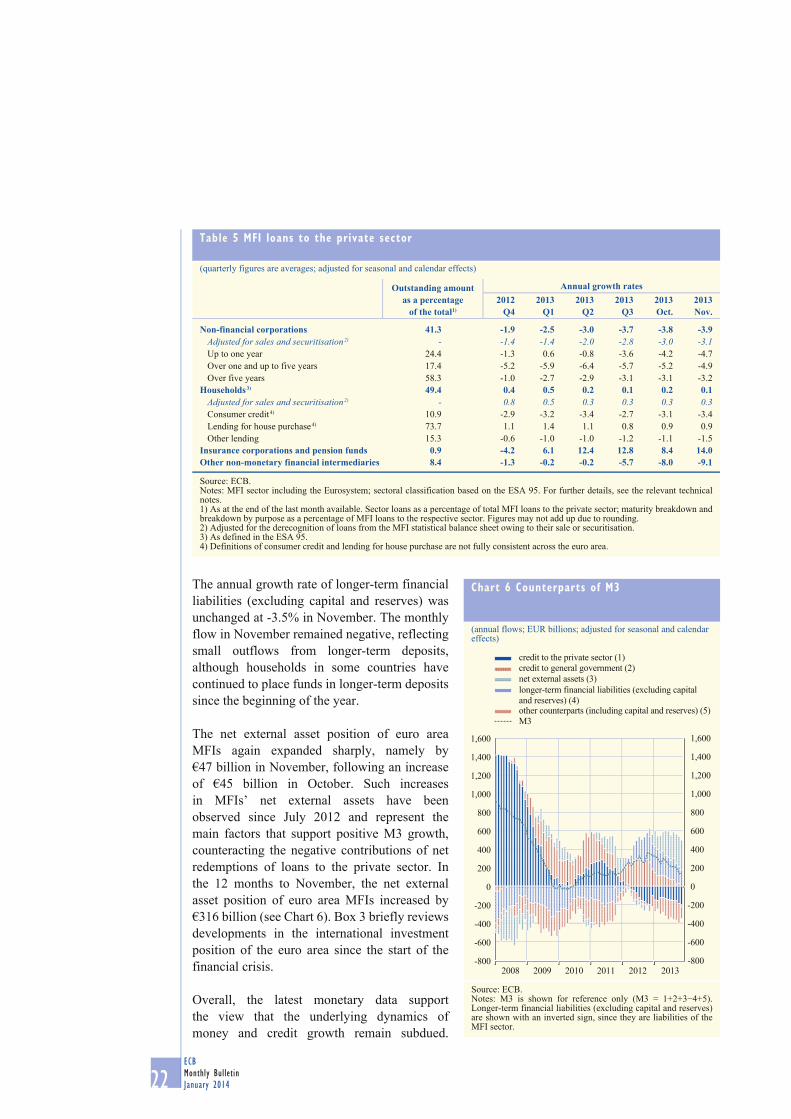
The annual growth rate of longer-term financial
liabilities (excluding capital and reserves) was
unchanged at -3.5% in November. The monthly
flow in November remained negative, reflecting
small outflows from longer-term deposits,
although households in some countries have
continued to place funds in longer-term deposits
since the beginning of the year.
The net external asset position of euro area
MFIs again expanded sharply, namely by
€47 billion in November, following an increase
of €45 billion in October. Such increases
in MFIs’ net external assets have been
observed since July 2012 and represent the
main factors that support positive M3 growth,
counteracting the negative contributions of net
redemptions of loans to the private sector. In
the 12 months to November, the net external
asset position of euro area MFIs increased by
€316 billion (see Chart 6). Box 3 briefly reviews
developments in the international investment
position of the euro area since the start of the
financial crisis.
Overall, the latest monetary data support
the view that the underlying dynamics of
money and credit growth remain subdued.
Table 5 MFI loans to the private sector
(quarterly figures are averages; adjusted for seasonal and calendar effects)
Outstanding amount as a percentage
of the total1)
Annual growth rates2012
Q42013
Q12013
Q22013
Q32013Oct.
2013Nov.
Non-financial corporations 41.3 -1.9 -2.5 -3.0 -3.7 -3.8 -3.9Adjusted for sales and securitisation 2) - -1.4 -1.4 -2.0 -2.8 -3.0 -3.1Up to one year 24.4 -1.3 0.6 -0.8 -3.6 -4.2 -4.7
Over one and up to five years 17.4 -5.2 -5.9 -6.4 -5.7 -5.2 -4.9
Over five years 58.3 -1.0 -2.7 -2.9 -3.1 -3.1 -3.2
Households 3) 49.4 0.4 0.5 0.2 0.1 0.2 0.1Adjusted for sales and securitisation 2) - 0.8 0.5 0.3 0.3 0.3 0.3Consumer credit 4) 10.9 -2.9 -3.2 -3.4 -2.7 -3.1 -3.4
Lending for house purchase 4) 73.7 1.1 1.4 1.1 0.8 0.9 0.9
Other lending 15.3 -0.6 -1.0 -1.0 -1.2 -1.1 -1.5
Insurance corporations and pension funds 0.9 -4.2 6.1 12.4 12.8 8.4 14.0Other non-monetary financial intermediaries 8.4 -1.3 -0.2 -0.2 -5.7 -8.0 -9.1
Source: ECB.Notes: MFI sector including the Eurosystem; sectoral classification based on the ESA 95. For further details, see the relevant technical notes.1) As at the end of the last month available. Sector loans as a percentage of total MFI loans to the private sector; maturity breakdown and breakdown by purpose as a percentage of MFI loans to the respective sector. Figures may not add up due to rounding.2) Adjusted for the derecognition of loans from the MFI statistical balance sheet owing to their sale or securitisation.3) As defined in the ESA 95.4) Definitions of consumer credit and lending for house purchase are not fully consistent across the euro area.
Chart 6 Counterparts of M3
(annual flows; EUR billions; adjusted for seasonal and calendar effects)
-800
-600
-400
-200
0
200
400
600
800
1,000
1,200
1,400
1,600
-800
-600
-400
-200
0
200
400
600
800
1,000
1,200
1,400
1,600
2008 2009 2010 2011 2012 2013
M3
other counterparts (including capital and reserves) (5)
longer-term financial liabilities (excluding capital
and reserves) (4)
net external assets (3)
credit to general government (2)
credit to the private sector (1)
Source: ECB.Notes: M3 is shown for reference only (M3 = 1+2+3−4+5). Longer-term financial liabilities (excluding capital and reserves) are shown with an inverted sign, since they are liabilities of the MFI sector.
23ECB
Monthly Bulletin
January 2014
Monetary and
financial
developments
ECONOMIC AND MONETARYDEVELOPMENTS
Broad money growth continues to be supported by increases in the net external assets of MFIs
and by shifts away from longer-term financial liabilities. At the same time, the weakness
of monetary dynamics also reflects a search for yield by the money-holding sector in an
environment marked by a low remuneration of monetary assets and by returning confidence.
The annual growth of MFI credit to the private sector remained negative in November 2013.
Box 3
DEVELOPMENTS IN THE INTERNATIONAL INVESTMENT POSITION OF THE EURO AREA SINCE THE
OUTBREAK OF THE FINANCIAL CRISIS
The international investment position (i.i.p.) shows total holdings of foreign assets by domestic
residents (“assets” in the i.i.p.) and total holdings of domestic assets by foreign residents
(“liabilities” in the i.i.p.) at the end of the period in question. The net position (assets minus
liabilities) measures the net creditor or debtor position of a country, or group of countries (e.g. the
euro area), vis-à-vis the rest of the world. This box reviews developments in the euro area i.i.p.
between 2007 and 2012 in order to shed light on how it has evolved since the beginning of the
financial crisis.1
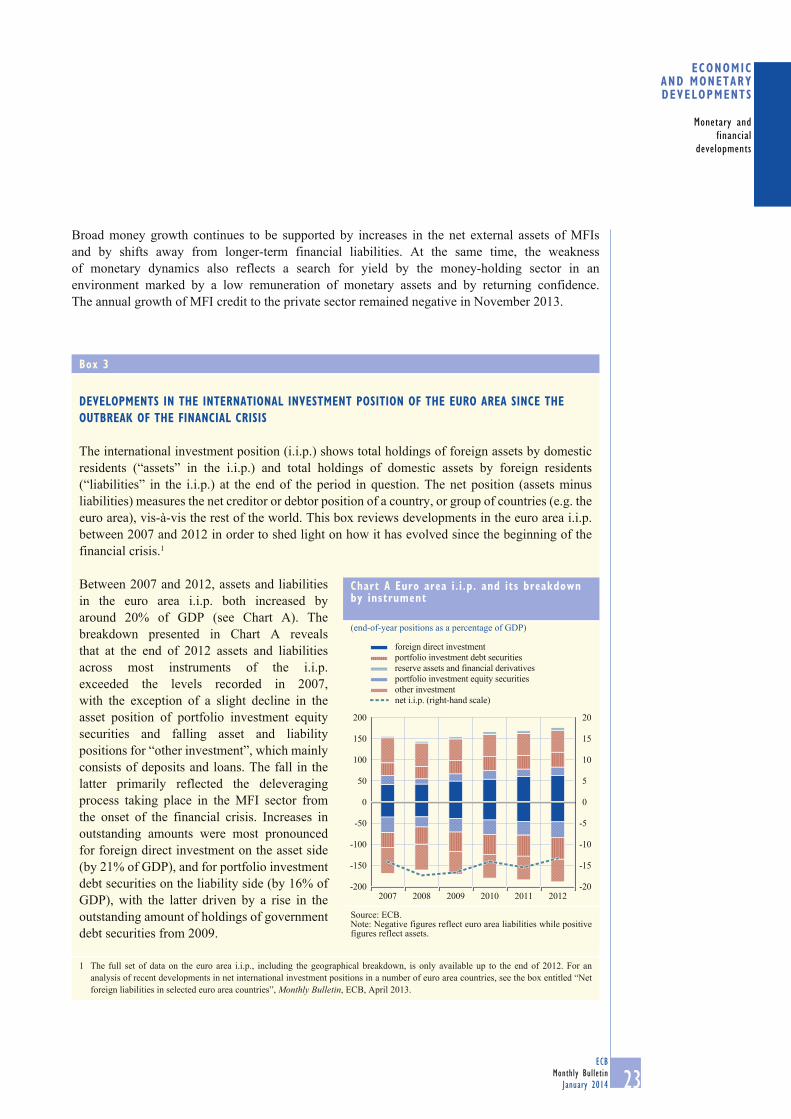
Between 2007 and 2012, assets and liabilities
in the euro area i.i.p. both increased by
around 20% of GDP (see Chart A). The
breakdown presented in Chart A reveals
that at the end of 2012 assets and liabilities
across most instruments of the i.i.p.
exceeded the levels recorded in 2007,
with the exception of a slight decline in the
asset position of portfolio investment equity
securities and falling asset and liability
positions for “other investment”, which mainly
consists of deposits and loans. The fall in the
latter primarily reflected the deleveraging
process taking place in the MFI sector from
the onset of the financial crisis. Increases in
outstanding amounts were most pronounced
for foreign direct investment on the asset side
(by 21% of GDP), and for portfolio investment
debt securities on the liability side (by 16% of
GDP), with the latter driven by a rise in the
outstanding amount of holdings of government
debt securities from 2009.
1 The full set of data on the euro area i.i.p., including the geographical breakdown, is only available up to the end of 2012. For an
analysis of recent developments in net international investment positions in a number of euro area countries, see the box entitled “Net
foreign liabilities in selected euro area countries”, Monthly Bulletin, ECB, April 2013.
Chart A Euro area i.i.p. and its breakdown by instrument
(end-of-year positions as a percentage of GDP)
-20
-15
-10
-5
0
5
10
15
20
-200
-150
-100
-50
0
50
100
150
200
2007 2008 2009 2010 2011 2012
net i.i.p. (right-hand scale)
other investment
portfolio investment equity securities
reserve assets and financial derivatives
portfolio investment debt securities
foreign direct investment
Source: ECB.Note: Negative figures reflect euro area liabilities while positive figures reflect assets.
24ECB
Monthly Bulletin
January 2014
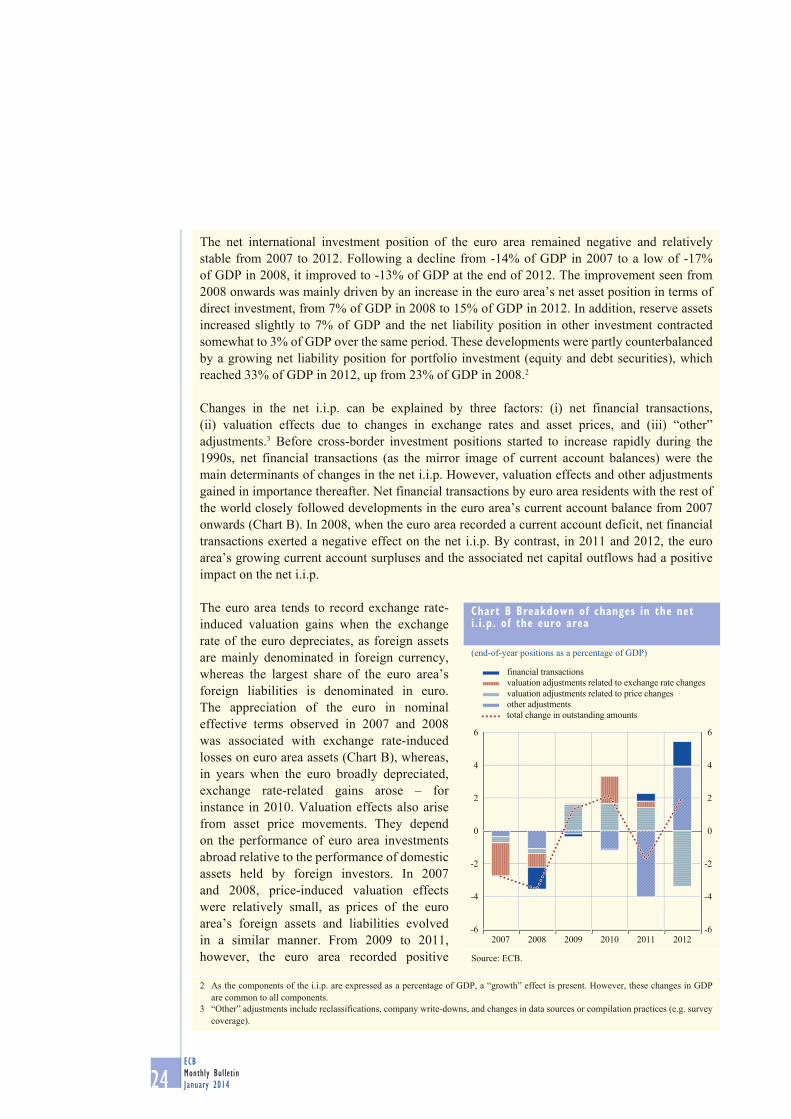
The net international investment position of the euro area remained negative and relatively
stable from 2007 to 2012. Following a decline from -14% of GDP in 2007 to a low of -17%
of GDP in 2008, it improved to -13% of GDP at the end of 2012. The improvement seen from
2008 onwards was mainly driven by an increase in the euro area’s net asset position in terms of
direct investment, from 7% of GDP in 2008 to 15% of GDP in 2012. In addition, reserve assets
increased slightly to 7% of GDP and the net liability position in other investment contracted
somewhat to 3% of GDP over the same period. These developments were partly counterbalanced
by a growing net liability position for portfolio investment (equity and debt securities), which
reached 33% of GDP in 2012, up from 23% of GDP in 2008.2
Changes in the net i.i.p. can be explained by three factors: (i) net financial transactions,
(ii) valuation effects due to changes in exchange rates and asset prices, and (iii) “other”
adjustments.3 Before cross-border investment positions started to increase rapidly during the
1990s, net financial transactions (as the mirror image of current account balances) were the
main determinants of changes in the net i.i.p. However, valuation effects and other adjustments
gained in importance thereafter. Net financial transactions by euro area residents with the rest of
the world closely followed developments in the euro area’s current account balance from 2007
onwards (Chart B). In 2008, when the euro area recorded a current account deficit, net financial
transactions exerted a negative effect on the net i.i.p. By contrast, in 2011 and 2012, the euro
area’s growing current account surpluses and the associated net capital outflows had a positive
impact on the net i.i.p.
The euro area tends to record exchange rate-
induced valuation gains when the exchange
rate of the euro depreciates, as foreign assets
are mainly denominated in foreign currency,
whereas the largest share of the euro area’s
foreign liabilities is denominated in euro.
The appreciation of the euro in nominal
effective terms observed in 2007 and 2008
was associated with exchange rate-induced
losses on euro area assets (Chart B), whereas,
in years when the euro broadly depreciated,
exchange rate-related gains arose – for
instance in 2010. Valuation effects also arise
from asset price movements. They depend
on the performance of euro area investments
abroad relative to the performance of domestic
assets held by foreign investors. In 2007
and 2008, price-induced valuation effects
were relatively small, as prices of the euro
area’s foreign assets and liabilities evolved
in a similar manner. From 2009 to 2011,
however, the euro area recorded positive
2 As the components of the i.i.p. are expressed as a percentage of GDP, a “growth” effect is present. However, these changes in GDP
are common to all components.
3 “Other” adjustments include reclassifications, company write-downs, and changes in data sources or compilation practices (e.g. survey
coverage).
Chart B Breakdown of changes in the net i.i.p. of the euro area
(end-of-year positions as a percentage of GDP)
-6
-4
-2
0
2
4
6
2007 2008 2009 2010 2011 2012-6
-4
-2
0
2
4
6
total change in outstanding amounts
other adjustments
valuation adjustments related to price changes
valuation adjustments related to exchange rate changes
financial transactions
Source: ECB.

25ECB
Monthly Bulletin
January 2014
Monetary and
financial
developments
ECONOMIC AND MONETARYDEVELOPMENTS
valuation gains from asset price developments as the foreign investments of euro area residents
outperformed the investments of foreign residents in the euro area. Conversely, the euro area
recorded substantial valuation losses in 2012 (3.4% of GDP), as the general improvement in
euro area financial markets increased the value of foreign residents’ investments in the euro
area to a larger extent than the valuation gains euro area investors recorded on their foreign
portfolios. Notably, in 2012 these price-induced valuation losses more than offset the positive
contribution of net financial transactions, which mirrored the current account surplus. The
largest contribution to changes in the euro area’s net i.i.p. in 2011 and 2012 came, however,
from “other” adjustments, which amounted to -4.0% of GDP in 2011 and 3.9% of GDP in
2012. These were mostly related to the introduction of new data sources and compilation
practices, which are being developed by national compilers ahead of the changeover to the new
international statistical standards in late 2014.4
The geographical breakdown of assets in portfolio investment equity securities showed a
rather stable development from the beginning of the financial crisis onwards (Chart C).5
The geographical distribution of equity liabilities changed considerably, however, with the surge
4 For more detail on the changeover to the new international statistical standards, consult the relevant ECB webpage: http://www.ecb.
europa.eu/stats/external/bpm6/html/index.en.html
5 The country-specific data on liabilities of equity and debt investment are retrieved from the IMF Coordinated Portfolio Investment
Survey (CPIS), while data on the total extra-euro area assets and liabilities and the country-specific data on assets are constructed by
the ECB. The countries/country blocks that are included in the calculations are: the euro area 17, offshore financial centres, Denmark,
Sweden, the United Kingdom, other EU countries, Switzerland, Canada, the United States, Japan, Brazil, India and Russia. More
information on the geographical detail of the euro area international investment position is presented in Table 9 of Section 7.3 of the
“Euro area statistics” section of the Monthly Bulletin and in the ECB’s Statistical Data Warehouse.
Chart C Country breakdown of euro area portfolio investment positions
(end-of-year positions as a percentage of GDP)
net total
otherother EU countries and Switzerlandoffshore financial centres
Brazil, India and Russia
Japan
United Kingdom
North America
Portfolio investment equity securities positions Portfolio investment debt securities positions
-40
-30
-20
-10
0
10
20
30
-40
-30
-20
-10
0
10
20
30
2007 2008 2009 2010 2011 2012
-10
-60
-50
-40
-30
-20
0
10
20
30
40
-60
-50
-40
-30
-20
-10
0
10
20
30
40
2007 2008 2009 2010 2011 2012
Sources: ECB and IMF Coordinated Portfolio Investment Survey (CPIS). Notes: Negative figures reflect euro area liabilities, while positive figures reflect assets. As China does not report its portfolio investment assets in the IMF survey, it is included in “other”, which is calculated as a residual.

26ECB
Monthly Bulletin
January 2014
2.2 SECURITIES ISSUANCE
In October 2013 debt securities issuance by euro area residents continued to contract on an annual basis. By contrast, year-on-year growth of debt securities issued by non-financial corporations remained at historically high levels. Issuance activity of quoted shares continued to be strong in the case of MFIs.
DEBT SECURITIES
In October 2013 the annual growth rate of debt securities issued by euro area residents remained
negative at -0.9%, after -0.6% in the previous month (see Table 6). Developments across sectors
were mixed. The annual growth rate of debt securities issuance increased from 9.8% in September
to 10.0% in the case of non-financial corporations. It remained at -9.0% in the case of MFIs.
of investments from the residual (“other”) group of countries.6 After a drop in 2008, the euro
area’s net liability position in portfolio investment equity securities increased by 5 percentage
points, to reach around 16% of GDP in 2012.
As regards debt instruments, portfolio investment assets of euro area residents continued to be
invested mostly in North America (predominantly the United States) from 2007, while the period
from 2008 to 2012 also witnessed rising investments in the residual “other” region, promoting
it to the second most important destination for euro area portfolio debt investment at the end of
the period.7 Developments on the liability side of euro area portfolio debt were also dominated
by “other” countries, with the United Kingdom and North America playing a rather limited role.
In fact, from 2008 investments by residents of “other” countries accounted for more than half of
total debt security liabilities in the euro area.
6 The country group “other” includes China and all the main oil-producing countries – except for Russia – and is calculated as a residual
from the total extra-euro area data.
7 The impact of offshore financial centres, already of minor importance, decreased further in the period under review.
Table 6 Securities issued by euro area residents
Issuing sector
Amount outstanding (EUR billions) October 2013
Annual growth rates 1)
2012 Q4
2013 Q1
2013 Q2
2013 Q3
2013September
2013 October
Debt securities 16,482 2.8 0.7 -0.1 -0.7 -0.6 -0.9MFIs 4,974 0.9 -3.6 -6.5 -8.7 -9.0 -9.0
Non-monetary financial corporations 3,213 0.3 0.7 -0.4 1.2 2.2 1.3
Non-financial corporations 1,075 12.9 13.4 11.5 10.0 9.8 10.0
General government 7,221 4.1 2.6 3.6 3.4 3.3 3.0
of which:Central government 6,551 3.6 2.6 4.0 4.2 4.1 3.8
Other general government 670 9.1 2.4 -0.6 -3.8 -3.8 -4.1
Quoted shares 5,407 1.0 0.8 0.6 1.1 1.0 1.1MFIs 557 5.2 3.0 2.5 7.8 7.8 7.7
Non-monetary financial corporations 445 2.6 2.6 2.6 1.6 0.7 0.9
Non-financial corporations 4,405 0.4 0.5 0.2 0.3 0.3 0.4
Source: ECB.1) For details, see the technical notes for Sections 4.3 and 4.4 of the “Euro area statistics” section.

27ECB
Monthly Bulletin
January 2014
Monetary and
financial
developments
ECONOMIC AND MONETARYDEVELOPMENTS
Moreover, the annual growth rate of debt securities issued by the general government decreased
to 3.0%, from 3.3% in September. Similarly, debt securities issuance by non-monetary financial
institutions declined in October, with the annual growth rate standing at 1.3%, after 2.2% in the
previous month.
Looking at developments across types of security, the contraction of issuance of short-term debt
securities accelerated slightly in October (to -12.8%, from -12.2% in September), while the annual
growth rate of long-term debt securities issuance decreased somewhat (to -0.3%, from -0.2% in
September). Refinancing activity continued to be concentrated on issuance in the long-term segment
of the market, notably at fixed rates. The annual growth rate of issuance of fixed rate long-term debt
securities remained at 2.3% in October, whereas the annual rate of growth in issuance of floating
rate long-term debt securities remained negative, as it has been over the past 14 months, declining
by 0.2 percentage point to -8.1% in October.
Looking at short-term trends, the six-month annualised growth rate of debt securities issuance
in October was 0.4 percentage point lower than in September and stood at -0.6% (see Chart 7).
Over the same period the corresponding rate decreased from 3.0% to -0.3% in the case of
non-monetary financial corporations, and from 3.6% to 3.2% in the case of the general government.
The pronounced contraction of issuance by MFIs decelerated somewhat from -8.5% in September
to -7.4% in October. Conversely, the six-month annualised growth rate of debt securities issued by
non-financial corporations rose from 7.9% to 8.1%.
QUOTED SHARES
In October 2013 the annual growth rate of quoted shares issued by euro area residents increased
by 0.1 percentage point to 1.1% (see Chart 8). The annual growth rate of equity issuance increased
Chart 7 Sectoral breakdown of debt securities issued by euro area residents
(six-month annualised growth rates; seasonally adjusted)
-20
-10
0
10
20
30
40
50
60
70
-20
-10
0
10
20
30
40
50
60
70
1999 2001 2003 2005 2007 2009 2011 2013
total
MFIs
non-monetary financial corporations
non-financial corporations
general government
Source: ECB.
Chart 8 Sectoral breakdown of quoted shares issued by euro area residents
(annual growth rates)
-4
-2
0
2
4
6
8
10
12
14
16
-4
-2
0
2
4
6
8
10
12
14
16
1999 2001 2003 2005 2007 2009 2011 2013
total
MFIs
non-monetary financial corporations
non-financial corporations
Source: ECB.Note: Growth rates are calculated on the basis of financial transactions.
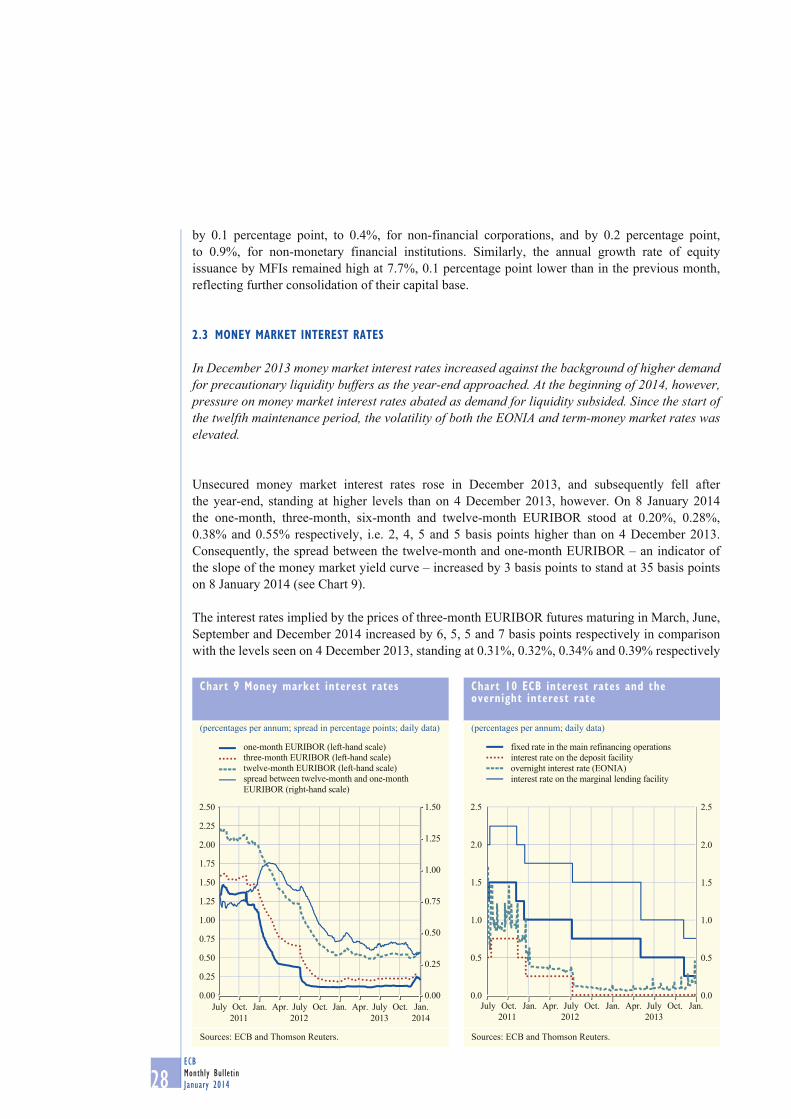
28ECB
Monthly Bulletin
January 2014
by 0.1 percentage point, to 0.4%, for non-financial corporations, and by 0.2 percentage point,
to 0.9%, for non-monetary financial institutions. Similarly, the annual growth rate of equity
issuance by MFIs remained high at 7.7%, 0.1 percentage point lower than in the previous month,
reflecting further consolidation of their capital base.
2.3 MONEY MARKET INTEREST RATES
In December 2013 money market interest rates increased against the background of higher demand for precautionary liquidity buffers as the year-end approached. At the beginning of 2014, however, pressure on money market interest rates abated as demand for liquidity subsided. Since the start of the twelfth maintenance period, the volatility of both the EONIA and term-money market rates was elevated.
Unsecured money market interest rates rose in December 2013, and subsequently fell after
the year-end, standing at higher levels than on 4 December 2013, however. On 8 January 2014
the one-month, three-month, six-month and twelve-month EURIBOR stood at 0.20%, 0.28%,
0.38% and 0.55% respectively, i.e. 2, 4, 5 and 5 basis points higher than on 4 December 2013.
Consequently, the spread between the twelve-month and one-month EURIBOR – an indicator of
the slope of the money market yield curve – increased by 3 basis points to stand at 35 basis points
on 8 January 2014 (see Chart 9).
The interest rates implied by the prices of three-month EURIBOR futures maturing in March, June,
September and December 2014 increased by 6, 5, 5 and 7 basis points respectively in comparison
with the levels seen on 4 December 2013, standing at 0.31%, 0.32%, 0.34% and 0.39% respectively
Chart 9 Money market interest rates
(percentages per annum; spread in percentage points; daily data)
0.00
0.25
0.50
0.75
1.00
1.25
1.50
0.00
0.25
0.50
0.75
1.00
1.25
1.50
1.75
2.00
2.25
2.50
spread between twelve-month and one-month
EURIBOR (right-hand scale)
twelve-month EURIBOR (left-hand scale)
three-month EURIBOR (left-hand scale)
one-month EURIBOR (left-hand scale)
July Oct.
2011 2012 2013 2014
Jan. Apr. July Oct. Jan. Jan.Apr. July Oct.
Sources: ECB and Thomson Reuters.
Chart 10 ECB interest rates and the overnight interest rate
(percentages per annum; daily data)
0.0
0.5
1.0
1.5
2.0
2.5
0.0
0.5
1.0
1.5
2.0
2.5
July Oct. Jan. Jan.Apr. July Oct. Jan. Apr. July Oct.
2011 2012 2013
interest rate on the deposit facility
overnight interest rate (EONIA)
interest rate on the marginal lending facility
fixed rate in the main refinancing operations
Sources: ECB and Thomson Reuters.

29ECB
Monthly Bulletin
January 2014
Monetary and
financial
developments
ECONOMIC AND MONETARYDEVELOPMENTS
on 8 January 2014. The three-month EONIA swap rate stood at 0.16% on the same date, 3 basis points
higher than on 4 December 2013. Thus, the spread between the three-month EURIBOR and the
three-month EONIA swap rate increased by 1 basis point.
Between 4 December and the end of the eleventh maintenance period of 2013 on 10 December,
the EONIA continued to stand at around 0.13% against the background of lower levels of excess
liquidity and an environment of receding market fragmentation. Since the start of the twelfth
maintenance period, the EONIA has increased on account of precautionary demand for liquidity
buffers towards the year-end, trading with higher volatility at levels between 0.14% and 0.22%
(see Chart 10). On 31 December 2013, the EONIA spiked to reach 0.45% before dropping to levels
between 0.10% and 0.15% at the beginning of January 2014.
Between 4 December 2013 and 8 January 2014, the Eurosystem conducted several refinancing
operations. In the main refinancing operations of the twelfth maintenance period, conducted on
10, 17, 23 and 30 December 2013, and on 7 January 2014, the Eurosystem allotted €98.5 billion,
€118.9 billion, €133.6 billion, €168.7 billion and €112.5 billion respectively. The Eurosystem also
carried out two longer-term refinancing operations (LTROs) in December 2013, both as fixed rate
tender procedures with full allotment, namely a special-term refinancing operation with a maturity
of one maintenance period on 10 December (in which €10.1 billion was allotted) and a three-month
LTRO on 18 December (in which €20.9 billion was allotted).
The Eurosystem also conducted five one-week liquidity-absorbing operations as variable rate
tender procedures with a maximum bid rate of 0.25% on 10, 17, 23 and 30 December 2013, and
on 7 January 2014. In the first and last of these operations, the ECB absorbed an amount equal to
the outstanding value of purchases made under the Securities Markets Programme (which totalled
€179 billion on 8 January 2014 on account of maturities of around €5 billion since 4 December 2013).
Instead, in the context of precautionary demand for liquidity towards the year-end, the Eurosystem
withdrew €152.3 billion, €139.8 billion and €104.8 billion in the operations that were carried out
on 17, 23 and 30 December 2013 respectively.
Moreover, counterparties opted to repay, on a weekly basis, funds borrowed in the three-year LTROs
allotted on 21 December 2011 and 29 February 2012 before maturity. On 8 January 2014, a total of
€446.4 billion had been repaid since 30 January 2013. Out of the total repayments, €259.5 billion
was related to the LTRO allotted on 21 December 2011, and the remaining €186.9 billion was
related to that allotted on 29 February 2012. Thus, of the €523 billion of net liquidity originally
injected through the two three-year LTROs, around 85% has been repaid thus far.
Excess liquidity declined further in the eleventh maintenance period of 2013, averaging
€165.1 billion, compared with €193.1 billion, on average, in the previous maintenance period. The
lower average level of excess liquidity in the eleventh maintenance period was due mainly to lower
outstanding open market operations, which accounted for around 70% of the decrease of €28 billion
in average excess liquidity (due, in particular, to LTRO repayments), with the remainder being
attributed mainly to higher autonomous factors. While average daily recourse to the deposit facility
decreased to €48.3 billion in the eleventh maintenance period, from €52.1 billion in the previous
maintenance period, average current account holdings in excess of reserve requirements decreased
from €141.1 billion to €116.9 billion. In the current twelfth maintenance period of the year,
excess liquidity first increased to levels of up to around €280 billion, mainly on account of higher
outstanding open market operations in the context of higher demand for precautionary liquidity
buffers as the year-end approached. However, on 8 January 2014 excess liquidity dropped to

30ECB
Monthly Bulletin
January 2014
€156.7 billion on account of lower recourse to the main refinancing operation and full sterilisation
of purchases under the Securities Markets Programme through the liquidity-absorbing operation,
both of which were allotted on 7 January 2014.1
2.4 BOND MARKETS
Euro area and US government bond yields increased in December 2013 and early January 2014, driven mainly by some strong economic data releases for the US economy and the decision of the Federal Open Market Committee (FOMC) about the gradual tapering of asset purchases. Intra-euro area sovereign bond yield spreads declined somewhat in most countries. Uncertainty about future bond market developments declined on both sides of the Atlantic. Financial indicators of long-term inflation expectations in the euro area increased slightly, while remaining fully consistent with price stability.
Between the end of November 2013 and 8 January 2014 AAA-rated long-term euro area government
bond yields increased by around 19 basis points to stand at about 2.1% (see Chart 11). In the same
period long-term government bond yields in the United States increased by around 25 basis points
and stood at about 3.0% on 8 January. In Japan, ten-year government bond yields increased by
around 10 basis points and stood at around 0.7% at the end of the period under review.
In December AAA-rated long-term euro area government bond yields increased somewhat, mainly
reflecting the reaction to strong economic data for the United States and the FOMC’s decision
of 18 December to reduce its asset purchases. Over the remainder of the review period AAA-rated
long-term euro area government bond yields remained broadly unchanged.
In the United States, long-term bond yields
increased slightly more than yields in the euro area
and exhibited slightly greater fluctuations over
the period under review. In addition to the factors
mentioned above, this also reflected uncertainty
surrounding the budget agreement. This
uncertainty, however, faded when agreement on
the budget accord was reached on 12 December.
Investor uncertainty about near-term bond
market developments, as measured by the
implied volatility extracted from options on
bond prices, declined marginally on both sides
of the Atlantic during the period under review
(see Chart 12). It benefited from positive data
releases, the budget agreement passed in the
United States and the FOMC’s decision of
18 December regarding asset purchases. By
early January implied volatility stood at around
4.8% in the euro area and at around 5.0% in the
United States.
1 See also the article entitled “Recent developments in excess liquidity and money market rates” in this issue of the Monthly Bulletin.
Chart 11 Long-term government bond yields
(percentages per annum; daily data)
0.4
0.6
0.8
1.0
1.2
1.4
1.6
1.8
2.0
2.2
2.4
1.2
1.4
1.6
1.8
2.0
2.2
2.4
2.6
2.8
3.0
3.2
Jan.
2012 2013 2014
Mar. May July Sep. Nov.Nov. Jan.
Japan (right-hand scale)
United States (left-hand scale)
euro area (left-hand scale)
Sources: EuroMTS, ECB, Bloomberg and Thomson Reuters.Notes: Long-term government bond yields refer to ten-year bonds or to the closest available bond maturity. The euro area bond yield is based on the ECB’s data on AAA-rated bonds, which currently include bonds from Germany, the Netherlands, Austria and Finland.

31ECB
Monthly Bulletin
January 2014
Monetary and
financial
developments
ECONOMIC AND MONETARYDEVELOPMENTS
Intra-euro area sovereign bond spreads declined somewhat in most countries. In the period under
review long-term bond yields increased in higher-rated euro area countries and declined in most
countries under stress. Spreads vis-à-vis overnight indexed swap (OIS) rates declined or remained
broadly unchanged in most euro area countries.
Developments in real bond yields, as measured by the yields on inflation-linked government bonds,2
closely corresponded to the developments in nominal bond yields described above. Real ten-year
bond yields increased by around 9 basis points to stand at around 0.5% on 8 January, while the
real yields on five-year bonds increased by around 14 basis points to around -0.1% (see Chart 13).
As a result, real long-term forward interest rates in the euro area (five-year forward rates five years
ahead) increased by around 4 basis points, to stand at around 1.1% at the end of the review period.
Financial market indicators of long-term inflation expectations in the euro area slightly increased
during the period under review. The five-year and ten-year break-even inflation rates implied by
inflation-linked bonds increased to stand at around 1.2% and 1.8% respectively. Accordingly, the
five-year forward break-even inflation rate five years ahead increased by 16 basis points to stand
at 2.45% at the beginning of January (see Chart 14). The long-term forward inflation swap rate
2 The real yield on inflation-linked euro area government bonds is calculated as the GDP-weighted average yield on German and French
inflation-linked government bonds. For more details, see the box entitled “Estimating real yields and break-even inflation rates following
the recent intensification of the sovereign debt crisis”, Monthly Bulletin, ECB, December 2011.
Chart 12 Implied government bond market volatility
(percentages per annum; five-day moving averages of daily data)
0
1
2
3
4
5
6
7
8
0
1
2
3
4
5
6
7
8
Nov. Jan. Mar. May July Sep. Nov. Jan.
Japan
United States
euro area
2012 2013 2014
Source: Bloomberg.Notes: Implied government bond market volatility is a measure of uncertainty surrounding short-term (up to three months) developments in German and US ten-year government bond prices. It is based on the market values of related traded options contracts. Bloomberg uses implied volatility of the closest to at-the-money strikes for both puts and calls using near-month expiry futures.
Chart 13 Euro area zero coupon inflation-linked bond yields
(percentages per annum; five-day moving averages of daily data; seasonally adjusted)
-1.5
-1.0
-0.5
0.0
0.5
1.0
1.5
2.0
-1.5
-1.0
-0.5
0.0
0.5
1.0
1.5
2.0
Nov. Jan. Mar. May July Sep. Nov. Jan.2012 2013 2014
ten-year spot inflation-linked bond yield
five-year spot inflation-linked bond yield
five-year forward inflation-linked bond yield five
years ahead
Sources: Thomson Reuters and ECB calculations.Note: Real bond yields have been computed as a GDP-weighted average of separate real bond yields for Germany and France.

32ECB
Monthly Bulletin
January 2014
increased slightly over the period under review to stand at 2.2% on 8 January. Overall, giving due
consideration to both the inflation risk premium and the liquidity premium, market-based indicators
suggest that inflation expectations remain fully consistent with price stability.3
The term structure of implied forward overnight interest rates in the euro area shifted upwards
slightly between the end of November and early January, mainly for bonds with medium to longer-
term maturities (see Chart 15). This suggests that expectations regarding future short-term interest
rates, and possibly the related risk premia, shifted upwards slightly over the review period.
In the period under review spreads of investment-grade corporate bonds issued by financial
corporations in the euro area (relative to the Merrill Lynch EMU AAA-rated government bond
index) remained broadly unchanged for higher-rated classes and declined somewhat for lower-rated
classes. For non-financial corporations, the spreads increased marginally for higher-rated classes
and declined for lower-rated classes. Overall, corporate bond spreads for most rating classes remain
below the levels recorded at the beginning of 2013.
3 For a more thorough analysis of the anchoring of long-term inflation expectations, see the article entitled “Assessing the anchoring of
longer-term inflation expectations”, Monthly Bulletin, ECB, November 2012.
Chart 14 Euro area zero coupon break-even inflation rates and inflation-linked swap rates
(percentages per annum; five-day moving averages of daily data; seasonally adjusted)
2.0
2.2
2.4
2.6
2.8
2.0
2.2
2.4
2.6
2.8
Nov. Jan. Mar. May July Sep. Nov. Jan.
five-year forward inflation-linked swap rate
five years ahead
five-year forward break-even inflation rate
five years ahead
2012 2013 2014
Sources: Thomson Reuters and ECB calculations.Note: Break-even inflation rates have been computed as a GDP-weighted average of separately estimated break-even rates for Germany and France.
Chart 15 Implied forward euro area overnight interest rates
(percentages per annum; daily data)
-0.5
0.0
0.5
1.0
1.5
2.0
2.5
3.0
3.5
4.0
4.5
-0.5
0.0
0.5
1.0
1.5
2.0
2.5
3.0
3.5
4.0
4.5
2013 2015 2017 2019 2021 2023
29 November 2013
8 January 2014
Sources: ECB, EuroMTS (underlying data) and Fitch Ratings (ratings).Notes: The implied forward yield curve, which is derived from the term structure of interest rates observed in the market, reflects market expectations of future levels for short-term interest rates. The method used to calculate these implied forward yield curves is outlined in the “Euro area yield curve” section of the ECB’s website. The data used in the estimate are AAA-rated euro area government bond yields.

33ECB
Monthly Bulletin
January 2014
Monetary and
financial
developments
ECONOMIC AND MONETARYDEVELOPMENTS
2.5 INTEREST RATES ON LOANS AND DEPOSITS
In November 2013 MFI lending rates on loans to households increased for both short and long maturities, while the MFI lending rates on loans to non-financial corporations exhibited mixed movements. Lending rate spreads vis-à-vis market rates widened somewhat in November, except in the case of large long-term loans.
In November 2013 MFI interest rates on short-term deposits from both non-financial corporations
and households decreased. Short-term rates on loans to households for house purchase increased
by 1 basis point, to 2.8% in November, and those on consumer credit increased by 11 basis points,
to 5.8%. With respect to non-financial corporations, short-term interest rates on large loans
(defined as loans of more than €1 million) increased by 6 basis points, to 2.3%, while those on small
loans (i.e. loans of up to €1 million) fell by 2 basis points, to 3.8% (see Chart 16). Accordingly,
the spread between short-term interest rates on small loans to non-financial corporations and
the corresponding interest rates on large loans decreased in November, to 156 basis points. The
magnitude of the spread still suggests that financing conditions remain tighter for small and
medium-sized enterprises than for large firms.
Overall, given that the three-month EURIBOR
remained broadly unchanged in November, the
spread between short-term MFI interest rates on
loans to households and the three-month money
market rate increased marginally, to 255 basis
points, while the corresponding spread for
short-term interest rates on large loans to
non-financial corporations widened to 205 basis
points (see Chart 17).
Since the beginning of 2013 short-term MFI
interest rates on loans to households for house
purchase and those on loans to non-financial
corporations have remained broadly stable.
The reductions in the key ECB interest rates,
together with the effects of the non-standard
monetary policy measures implemented or
announced by the ECB, are gradually being
passed through to bank lending rates. At the
same time, financial fragmentation and weak
economic conditions are still putting upward
pressure on bank lending rates in some euro
area countries.
Turning to longer maturities, MFI
interest rates on long-term deposits from
households and on deposits from non-
financial corporations increased marginally
in November overall. In particular,
interest rates increased by 1 basis point,
Chart 16 Short-term MFI interest rates and a short-term market rate
(percentages per annum; rates on new business)
0
1
2
3
4
5
6
7
8
9
10
2003 2005 2007 2009 2011 20130
1
2
3
4
5
6
7
8
9
10
three-month money market rate
loans to households for consumption with a floating
rate and an initial rate fixation period of up to one year
loans to households for house purchase with a floating
rate and an initial rate fixation period of up to one year
loans to non-financial corporations of over €1 million
with a floating rate and an initial rate fixation period
of up to one year
overnight deposits from non-financial corporations
deposits from households with an agreed maturity
of up to one year
deposits from households redeemable at notice
of up to three months
Source: ECB.Note: Data as of June 2010 may not be fully comparable with those prior to that date owing to methodological changes arising from the implementation of Regulations ECB/2008/32 and ECB/2009/7 (amending Regulation ECB/2001/18).
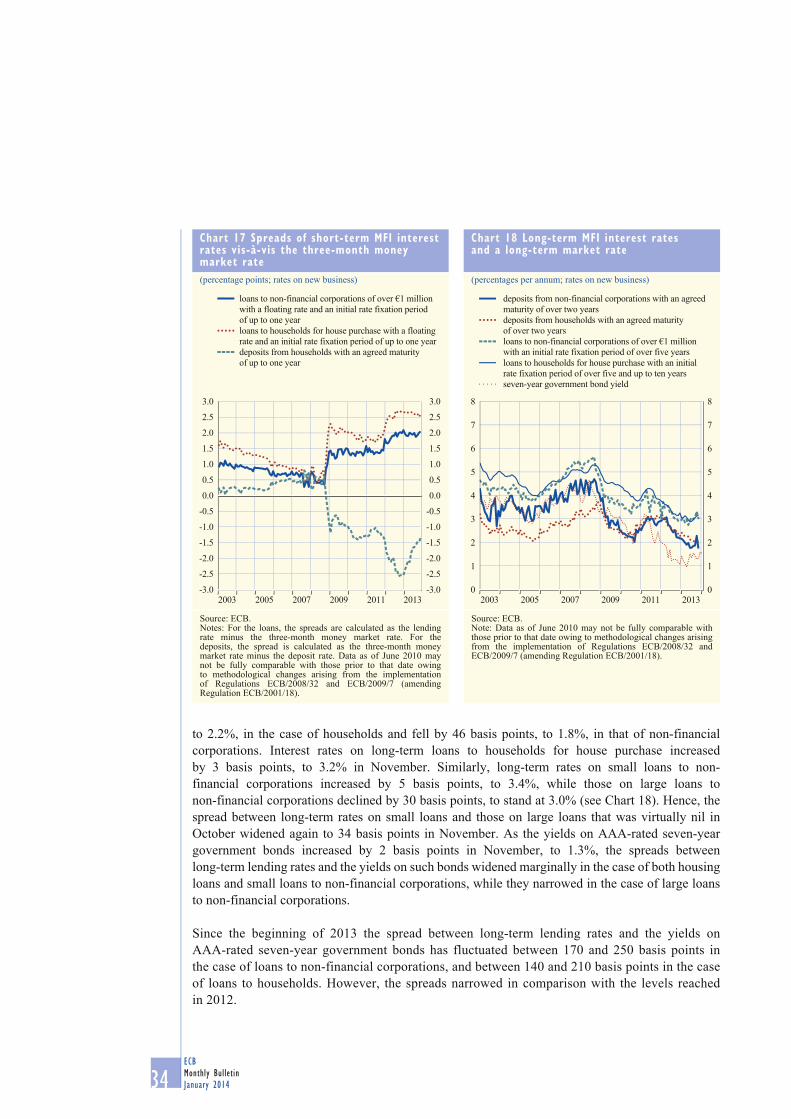
34ECB
Monthly Bulletin
January 2014
to 2.2%, in the case of households and fell by 46 basis points, to 1.8%, in that of non-financial
corporations. Interest rates on long-term loans to households for house purchase increased
by 3 basis points, to 3.2% in November. Similarly, long-term rates on small loans to non-
financial corporations increased by 5 basis points, to 3.4%, while those on large loans to
non-financial corporations declined by 30 basis points, to stand at 3.0% (see Chart 18). Hence, the
spread between long-term rates on small loans and those on large loans that was virtually nil in
October widened again to 34 basis points in November. As the yields on AAA-rated seven-year
government bonds increased by 2 basis points in November, to 1.3%, the spreads between
long-term lending rates and the yields on such bonds widened marginally in the case of both housing
loans and small loans to non-financial corporations, while they narrowed in the case of large loans
to non-financial corporations.
Since the beginning of 2013 the spread between long-term lending rates and the yields on
AAA-rated seven-year government bonds has fluctuated between 170 and 250 basis points in
the case of loans to non-financial corporations, and between 140 and 210 basis points in the case
of loans to households. However, the spreads narrowed in comparison with the levels reached
in 2012.
Chart 17 Spreads of short-term MFI interest rates vis-à-vis the three-month money market rate
(percentage points; rates on new business)
-3.0
-2.5
-2.0
-1.5
-1.0
-0.5
0.0
0.5
1.0
1.5
2.0
2.5
3.0
-3.0
-2.5
-2.0
-1.5
-1.0
-0.5
0.0
0.5
1.0
1.5
2.0
2.5
3.0
2003 2005 2007 2009 2011 2013
deposits from households with an agreed maturity
of up to one year
loans to households for house purchase with a floating
rate and an initial rate fixation period of up to one year
loans to non-financial corporations of over €1 million
with a floating rate and an initial rate fixation period
of up to one year
Source: ECB.Notes: For the loans, the spreads are calculated as the lending rate minus the three-month money market rate. For the deposits, the spread is calculated as the three-month money market rate minus the deposit rate. Data as of June 2010 may not be fully comparable with those prior to that date owing to methodological changes arising from the implementation of Regulations ECB/2008/32 and ECB/2009/7 (amending Regulation ECB/2001/18).
Chart 18 Long-term MFI interest rates and a long-term market rate
(percentages per annum; rates on new business)
0
1
2
3
4
5
6
7
8
0
1
2
3
4
5
6
7
8
2003 2005 2007 2009 2011 2013
seven-year government bond yield
loans to households for house purchase with an initial
rate fixation period of over five and up to ten years
loans to non-financial corporations of over €1 million
with an initial rate fixation period of over five years
deposits from households with an agreed maturity
of over two years
deposits from non-financial corporations with an agreed
maturity of over two years
Source: ECB.Note: Data as of June 2010 may not be fully comparable with those prior to that date owing to methodological changes arising from the implementation of Regulations ECB/2008/32 and ECB/2009/7 (amending Regulation ECB/2001/18).

35ECB
Monthly Bulletin
January 2014
Monetary and
financial
developments
ECONOMIC AND MONETARYDEVELOPMENTS
2.6 EQUITY MARKETS
Between the end of November 2013 and 8 January 2014 stock prices increased by around 1% in the euro area and by around 2% in the United States. Stock market developments were affected by possible early profit-taking ahead of the end of the year, some strong economic data releases for the US economy, and the uncertainty regarding the budget agreement in the United States, as well as the timing and intensity of the reversal of the Federal Reserve System’s monetary policy accommodation. Following the meeting of the FOMC on 18 December stock prices increased on both sides of the Atlantic. Stock market uncertainty, as measured by implied volatility, increased slightly in the euro area and remained broadly unchanged in the United States.
During the period under review stock prices in major markets increased slightly. Between the
end of November 2013 and 8 January 2014 stock prices in the euro area, as measured by the
broad-based Dow Jones EURO STOXX index, increased by around 1%. Over the same period
stock prices in the United States, as measured by the Standard & Poor’s 500 index, increased
by around 2%, while stock prices in Japan, as measured by the Nikkei 225 index, increased by
around 3% (see Chart 19).
During the first week of December euro area stock prices declined, possibly reflecting early
profit-taking ahead of the end of the year. In the remainder of the review period euro area stock
prices fluctuated only slightly and recorded
a small increase after the FOMC’s decision
of 18 December to gradually taper its asset
purchases. While economic data releases
were somewhat mixed in the euro area, they
were relatively strong in the United States.
This was to some extent reflected in stock
market developments in the United States.
In addition, US stock prices were also driven
by the uncertainty regarding the budget
agreement and the timing of the reversal of
the Federal Reserve System’s monetary policy
accommodation. Following the December
meeting of the FOMC stock prices increased,
with a decline in volatility in the latter part of
the review period.
Euro area stock prices increased across most
sectors and countries. Financial stock prices
increased by 5%, while non-financial stock
prices remained broadly unchanged, with
the utility sector and the oil and gas sector
lagging most in terms of performance. In the
Chart 19 Stock price indices
(index: 1 November 2012 = 100; daily data)
70
80
90
100
110
120
130
140
150
160
170
180
190
90
95
100
105
110
115
120
125
130
Nov. Jan. Mar. May July Sep. Nov. Jan.2012 2013 2014
Japan (right-hand scale)
United States (left-hand scale)
euro area (left-hand scale)
Source: Thomson Reuters.Note: The indices used are the Dow Jones EURO STOXX broad index for the euro area, the Standard & Poor’s 500 index for the United States and the Nikkei 225 index for Japan.
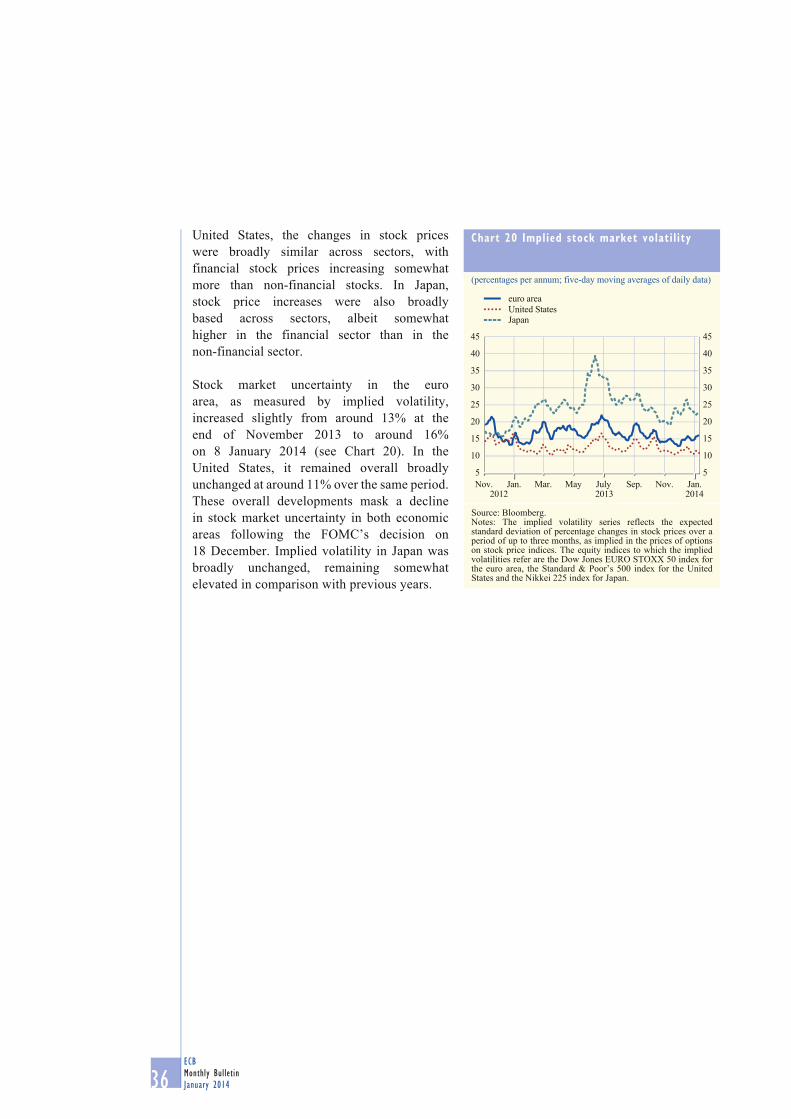
36ECB
Monthly Bulletin
January 2014
United States, the changes in stock prices
were broadly similar across sectors, with
financial stock prices increasing somewhat
more than non-financial stocks. In Japan,
stock price increases were also broadly
based across sectors, albeit somewhat
higher in the financial sector than in the
non-financial sector.
Stock market uncertainty in the euro
area, as measured by implied volatility,
increased slightly from around 13% at the
end of November 2013 to around 16%
on 8 January 2014 (see Chart 20). In the
United States, it remained overall broadly
unchanged at around 11% over the same period.
These overall developments mask a decline
in stock market uncertainty in both economic
areas following the FOMC’s decision on
18 December. Implied volatility in Japan was
broadly unchanged, remaining somewhat
elevated in comparison with previous years.
Chart 20 Implied stock market volatility
(percentages per annum; five-day moving averages of daily data)
5
10
15
20
25
30
35
40
45
5
10
15
20
25
30
35
40
45
Nov. Jan. Mar. May July Sep. Nov. Jan.2012 2013 2014
JapanUnited States
euro area
Source: Bloomberg.Notes: The implied volatility series reflects the expected standard deviation of percentage changes in stock prices over a period of up to three months, as implied in the prices of options on stock price indices. The equity indices to which the implied volatilities refer are the Dow Jones EURO STOXX 50 index for the euro area, the Standard & Poor’s 500 index for the United States and the Nikkei 225 index for Japan.

37ECB
Monthly Bulletin
January 2014
Prices
and costs
ECONOMIC AND MONETARYDEVELOPMENTS
3 PRICES AND COSTS
According to Eurostat’s flash estimate, euro area annual HICP inflation was 0.8% in December 2013, compared with 0.9% in November. The outcome was broadly as expected and reflected lower services price inflation. On the basis of prevailing futures prices for energy, annual inflation rates are expected to remain at around current levels in the coming months. Over the medium term, underlying price pressures in the euro area are expected to remain subdued. At the same time, inflation expectations for the euro area over the medium to long term continue to be firmly anchored in line with the Governing Council’s aim of maintaining inflation rates below, but close to, 2%. The risks to the outlook for price developments continue to be seen as broadly balanced over the medium term.
3.1 CONSUMER PRICES
Euro area annual HICP inflation decreased from 2.5%, on average, in 2012 to 1.3% in 2013 (on the
basis of Eurostat’s flash estimate for December 2013). This was primarily attributable to the sharp
decrease in energy price inflation from the two-digit levels seen in 2011 and part of 2012 to 0.6%,
on average, in 2013. In recent months, the rapid decline in annual food price inflation, from the
elevated levels recorded earlier in the year, contributed towards further reducing overall inflation.
Excluding the volatile components, food and energy, HICP inflation also eased, to reach an average
of 1.1% in 2013, reflecting an environment of weak economic activity.
Looking at the latest data, according to Eurostat’s flash estimate, headline HICP inflation decreased
from 0.9% in November to 0.8% in December. This essentially reflects opposite developments in
energy and services price inflation, where the increase in the former can be accounted for by an
upward base effect, together with an increase in the monthly rate, and the decline in the latter by
the drop-out of the impact related to changes in HICP price collection practices in Germany last
November (see Table 7).
Looking at the main components of the HICP in more detail, Eurostat’s flash estimate points to a
further increase in energy price inflation to 0.0% in December 2013, after negative annual rates of
change of -1.1% and -1.7% in November and October, respectively. This increase largely reflects
Table 7 Price developments
(annual percentage changes, unless otherwise indicated)
2012 2013 2013July
2013Aug.
2013Sep.
2013Oct.
2013Nov.
2013Dec.
HICP and its components 1)
Overall index 2.5 1.3 1.6 1.3 1.1 0.7 0.9 0.8Energy 7.6 0.6 1.6 -0.3 -0.9 -1.7 -1.1 0.0Food 3.1 2.7 3.5 3.2 2.6 1.9 1.6 1.8
Unprocessed food 3.0 . 5.1 4.4 2.9 1.4 0.9 .Processed food 3.1 . 2.5 2.5 2.4 2.2 2.0 .
Non-energy industrial goods 1.2 0.6 0.4 0.4 0.4 0.3 0.2 0.2Services 1.8 1.4 1.4 1.4 1.4 1.2 1.4 1.0
Other price indicatorsIndustrial producer prices 2.8 . 0.0 -0.9 -0.9 -1.3 -1.2 .
Oil prices (EUR per barrel) 86.6 81.7 81.9 82.6 83.0 80.0 80.0 80.8
Non-energy commodity prices 0.5 -8.2 -12.2 -12.9 -12.9 -12.2 -11.7 -11.4
Sources: Eurostat, ECB and ECB calculations based on Thomson Reuters data.1) HICP inflation and its components (excluding unprocessed food and processed food) in December 2013 refer to Eurostat’s flash estimates.

38ECB
Monthly Bulletin
January 2014
base effects. In November, the last month for which a detailed breakdown is available, the increase
in the annual rate of change of the energy component reflected, in particular, a smaller decline, on
an annual basis, of prices for car fuels and other liquid fuels, whereas the annual rate of increase in
electricity and gas prices declined marginally.
Eurostat’s flash estimate of inflation for the total food component, which refers to inflation
in the processed and unprocessed components taken together, increased somewhat to 1.8% in
December 2013, from 1.6% in November. No official information is yet available with regard to the
breakdown of the food component for December. In November, unprocessed food price inflation
dropped to 0.9%, from 1.4% in October, reflecting declines in the annual rates of change in meat
and fruit prices. Given that unprocessed food price inflation stood at rates above 5% from May to
July, the decline over the past few months indicates that the recent spike in food inflation is quickly
unwinding. In particular, the annual rates of change in fruit and vegetable prices stood at 0.9%
and -0.7%, respectively, in November, from peaks of 11.3% in July for fruit and 9% in June for
vegetables. Processed food price inflation also declined further to 2.0% in November, reflecting, in
particular, a decline in the annual rate of increase in the price of bread and cereals. The annual rate
of increase in the price of tobacco products remained unchanged.
Excluding the volatile components, food and energy, HICP inflation has also moderated over 2013,
albeit to a lesser extent than headline inflation. While HICP inflation excluding these items stood at
1.5%, on average, in 2012, it has fallen to rates below 1.0% over recent months, standing at 0.7%
in December according to Eurostat’s flash estimate. Excluding these two volatile groups, HICP
inflation consists of two main components, namely non-energy industrial goods and services, both
of which have recorded lower annual rates of change in recent months. The limited initial impact of
a VAT increase in Italy on 1 October 2013 contributed to keeping non-energy industrial goods and
services price inflation lower than expected. According to Eurostat’s flash estimate, non-energy
Chart 21 Breakdown of HICP inflation: main components
(annual percentage changes; monthly data)
-3
-2
-1
0
1
2
3
4
5
6
-15
-10
-5
0
5
10
15
20
25
30
2004 2005 2006 2007 2008 2009 2010 2011 2012 2013
energy (right-hand scale)
unprocessed food (left-hand scale)
total HICP (left-hand scale)
-1
0
1
2
3
4
-2
0
2
4
6
8
2004 2005 2006 2007 2008 2009 2010 2011 2012 2013
services (left-hand scale)
non-energy industrial goods (left-hand scale)
processed food (right-hand scale)
total HICP excluding energy and unprocessed food
(left-hand scale)
Source: Eurostat.

39ECB
Monthly Bulletin
January 2014
Prices
and costs
ECONOMIC AND MONETARYDEVELOPMENTS
industrial goods price inflation remained unchanged at 0.2% in December. In November, the annual
rate of change in non-energy industrial goods prices had already been unusually weak, primarily
reflecting lower annual rates of increase in semi-durable goods, and garments in particular, driven
by the price drop in Greece following the mid-season sales.
According to Eurostat’s flash estimate, services price inflation decreased to 1.0% in December,
from 1.4% and 1.2% in November and October, respectively. The high volatility in the services
component in the last two months is mainly related to the aforementioned changes in the HICP
price collection practices in Germany.
3.2 INDUSTRIAL PRODUCER PRICES
Industrial producer prices inflation excluding construction stood at -1.2% in November 2013, after
-1.3% in October (see Table 7 and Chart 22). Excluding construction and energy, the annual rate of
change in industrial producer prices remained unchanged at -0.3% in November.
Pipeline pressures for HICP non-energy industrial goods price inflation remained at subdued
levels. Annual PPI non-food consumer goods inflation decreased to 0.0% in November, from
0.2% in October, driven by declines in industries producing pharmaceuticals and books, and
partly due to a downward base effect. This fall continues a downward trend observed over the last
two years. Looking ahead, the PMI retail survey index of input prices for non-food stores in
December picked up (on a three-month moving average basis), thereby exceeding its historical
average at 58.1 and continuing an upward trend
over the last six months. Similarly, PMI survey
indices of the input costs of consumer goods
manufacturers have also increased over recent
months. At the earlier price stages, the annual
rate of change of PPI intermediate goods prices
stood at -1.7% in November, unchanged from
the previous month. In December the monthly
rates of change for raw material commodity
prices and crude oil prices in euro were slightly
positive, whilst the annual rates of change
remained in negative territory.
Pipeline pressures for HICP food price
inflation continue to fall at both the earlier and
later stages of the price chain, although from
somewhat higher levels than in the case of
non-energy industrial goods. Annual producer
price inflation for food declined in November
to 1.0%, following 1.2% in October and rates
close to 4% at the start of 2013. The PMI survey
shows a small decrease in the input price index
for food retailers in December, whilst the index
for margins increased. Earlier in the price
chain, the annual rate of increase in EU farm
Chart 22 Breakdown of industrial producer prices
(annual percentage changes; monthly data)
-10
-8
-6
-4
-2
0
2
4
6
8
10
-25
-20
-15
-10
-5
0
5
10
15
20
25
2013201220112010200920082007
energy (right-hand scale)
consumer goods (left-hand scale)
capital goods (left-hand scale)intermediate goods (left-hand scale)
total industry excluding construction (left-hand scale)
Sources: Eurostat and ECB calculations.

40ECB
Monthly Bulletin
January 2014
gate prices dropped to -3.2% in November,
from rates above 11% in the second quarter of
the year. International food commodity prices
in euro terms remained broadly unchanged in
December compared to the previous month,
whilst remaining strongly negative in annual
terms (-15.3%).
The latest information from both the PMI and
the European Commission surveys confirms
that pipeline pressures on consumer prices for
non-energy industrial goods remain subdued
and that those on consumer prices for processed
food are moderating. With regard to the headline
PMI (see Chart 23), the input price index for
the manufacturing sector increased from 53.4
in November to 54.5 in December, while the
output price index rose from 51.1 to 51.3 over
the same period. Both indices remained below
their long-term averages. According to the
European Commission survey, selling price
expectations for total industry remained broadly
unchanged in November 2013.
3.3 LABOUR COST INDICATORS
Domestic pressures on prices stemming from labour cost data remained subdued in the first
three quarters of 2013 (see Table 8 and Chart 24), in line with the continued weak labour market
situation. The relatively smooth pattern of wage growth at the euro area level conceals substantial
divergences in wage developments across countries. While nominal wages grew at robust rates
in countries with relatively resilient labour markets, nominal wages and unit labour costs grew
only slightly or even declined in countries undergoing the most significant public sector wage cuts
(related to fiscal consolidation) and experiencing persistently high levels of unemployment.
At the aggregate euro area level, compensation per employee grew at 1.5%, year on year, in the third
quarter of 2013, after increasing by 1.6% in the previous quarter. Annual unit labour cost growth
Chart 23 Producer input and output price surveys
(diffusion indices; monthly data)
20
30
40
50
60
70
80
90
20
30
40
50
60
70
80
90
2012 20132004 2005 2006 2007 2008 2009 2010 2011
services; input prices
services; prices charged
manufacturing; prices charged
manufacturing; input prices
Source: Markit.Note: An index value above 50 indicates an increase in prices, whereas a value below 50 indicates a decrease.
Table 8 Labour cost indicators
(annual percentage changes, unless otherwise indicated)
2011 2012 2012Q3
2012Q4
2013Q1
2013Q2
2013Q3
Negotiated wages 2.0 2.2 2.2 2.2 1.9 1.7 1.7
Hourly labour cost index 2.2 1.9 2.0 1.6 1.9 1.1 1.0
Compensation per employee 2.1 1.7 2.0 1.5 1.6 1.6 1.5
Memo items:Labour productivity 1.3 0.0 -0.1 -0.3 -0.1 0.4 0.5
Unit labour costs 0.8 1.7 2.1 1.8 1.8 1.2 1.0
Sources: Eurostat, national data and ECB calculations.
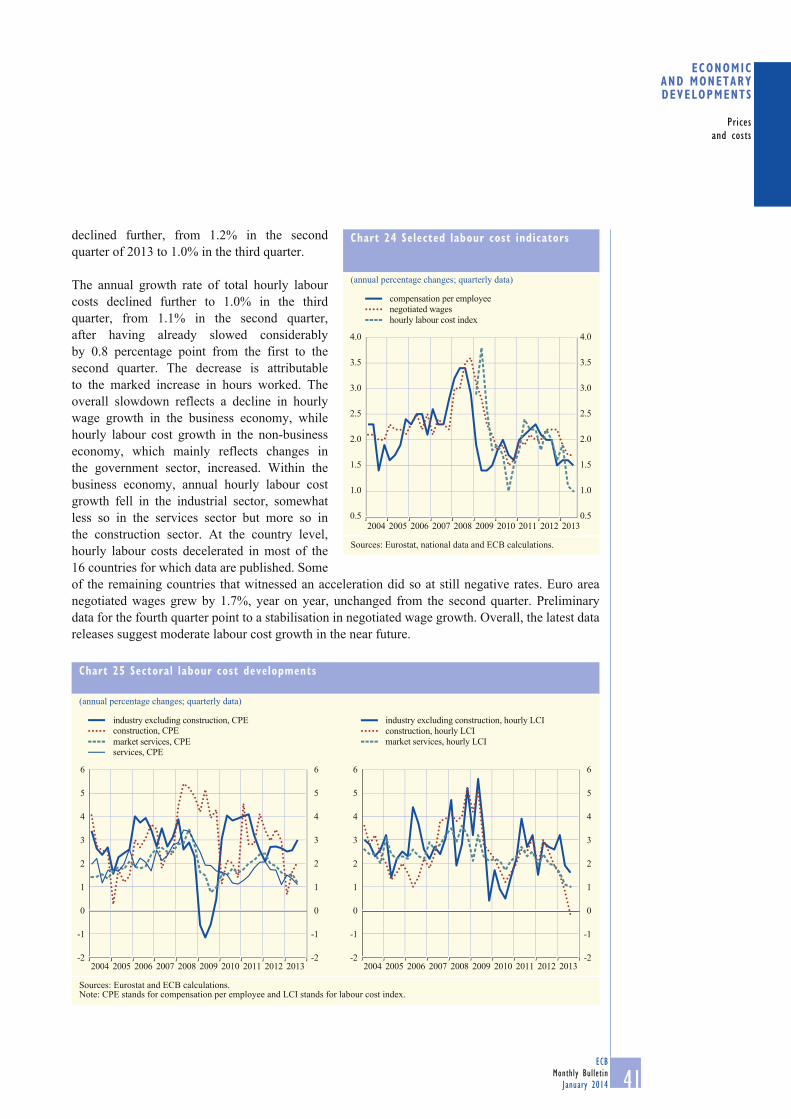
41ECB
Monthly Bulletin
January 2014
Prices
and costs
ECONOMIC AND MONETARYDEVELOPMENTS
declined further, from 1.2% in the second
quarter of 2013 to 1.0% in the third quarter.
The annual growth rate of total hourly labour
costs declined further to 1.0% in the third
quarter, from 1.1% in the second quarter,
after having already slowed considerably
by 0.8 percentage point from the first to the
second quarter. The decrease is attributable
to the marked increase in hours worked. The
overall slowdown reflects a decline in hourly
wage growth in the business economy, while
hourly labour cost growth in the non-business
economy, which mainly reflects changes in
the government sector, increased. Within the
business economy, annual hourly labour cost
growth fell in the industrial sector, somewhat
less so in the services sector but more so in
the construction sector. At the country level,
hourly labour costs decelerated in most of the
16 countries for which data are published. Some
of the remaining countries that witnessed an acceleration did so at still negative rates. Euro area
negotiated wages grew by 1.7%, year on year, unchanged from the second quarter. Preliminary
data for the fourth quarter point to a stabilisation in negotiated wage growth. Overall, the latest data
releases suggest moderate labour cost growth in the near future.
Chart 24 Selected labour cost indicators
(annual percentage changes; quarterly data)
2012 20130.5
1.0
1.5
2.0
2.5
3.0
3.5
4.0
0.5
1.0
1.5
2.0
2.5
3.0
3.5
4.0
2004 2005 2007 20092006 2008 2010 2011
hourly labour cost index
negotiated wages
compensation per employee
Sources: Eurostat, national data and ECB calculations.
Chart 25 Sectoral labour cost developments
(annual percentage changes; quarterly data)
-2
-1
0
1
2
3
4
5
6
2004 2005 2006 2007 2008 2009 2010 2011 2012 2013
services, CPEmarket services, CPE
construction, CPEindustry excluding construction, CPE
-2
-1
0
1
2
3
4
5
6
-2
-1
0
1
2
3
4
5
6
-2
-1
0
1
2
3
4
5
6
2004 2005 2006 2007 2008 2009 2010 2011 2012 2013
industry excluding construction, hourly LCI
construction, hourly LCI
market services, hourly LCI
Sources: Eurostat and ECB calculations.Note: CPE stands for compensation per employee and LCI stands for labour cost index.

42ECB
Monthly Bulletin
January 2014
3.4 THE OUTLOOK FOR INFLATION
On the basis of prevailing futures prices for energy, annual inflation rates are expected to remain
at around current levels in the coming months. Over the medium term, underlying price pressures
in the euro area are expected to remain modest. At the same time, inflation expectations for the
euro area over the medium to long term continue to be firmly anchored in line with the aim of
maintaining inflation rates below, but close to, 2%.
The risks to the outlook for price developments continue to be seen as broadly balanced over the
medium term, with upside risks relating to higher commodity prices and stronger than expected
increases in administered prices and indirect taxes, and downside risks stemming from weaker than
expected economic activity.

43ECB
Monthly Bulletin
January 2014
Output,
demand and the
labour market
ECONOMIC AND MONETARYDEVELOPMENTS
Real GDP in the euro area rose by 0.1%, quarter on quarter, in the third quarter of 2013, following an increase of 0.3% in the second quarter. While developments in industrial production data for October point to a weak start to the fourth quarter, survey-based confidence indicators up to December have improved further from low levels, overall indicating a continuation of the gradual recovery in economic activity. Looking at 2014 and 2015, output is expected to recover at a slow pace, in particular owing to some improvement in domestic demand supported by the accommodative monetary policy stance. Euro area economic activity should, in addition, benefit from a gradual strengthening of demand for exports. Furthermore, the overall improvements in financial markets seen since the summer of 2012 appear to be working their way through to the real economy, as should the progress made in fiscal consolidation. In addition, real incomes have benefited recently from lower energy price inflation. At the same time, unemployment in the euro area remains high, and the necessary balance sheet adjustments in the public and the private sector will continue to weigh on economic activity. The risks surrounding the economic outlook for the euro area continue to be on the downside.
4.1 REAL GDP AND DEMAND COMPONENTS
Real GDP rose by 0.1% in the third quarter of 2013, after having increased by 0.3% in the second
quarter (see Chart 26). Both domestic demand and changes in inventories contributed to growth
in the third quarter. At the same time, net trade made a negative contribution to growth. This was
the first time since early 2010 that net trade provided a negative contribution to quarter-on-quarter
GDP growth. In the third quarter of 2013 output still stood 3% below its pre-recession peak in the
first quarter of 2008 and around 1% below its post-recession peak in the third quarter of 2011.
Private consumption in the euro area rose by
0.1%, quarter on quarter, in the third quarter
of 2013, following a similar growth rate in the
previous quarter. The latest outcome most likely
reflects rising consumption of retail goods,
which was partly offset by lower spending on
services. At the same time, car purchases made
a neutral contribution to consumption growth in
the third quarter.
With regard to the fourth quarter, available
information tends, on balance, to suggest broadly
stable developments in private consumption. In
November the volume of retail sales rose by
1.4%, month on month, to stand at the same
level as the average reading recorded for the
third quarter of 2013, when they increased by
0.4% quarter on quarter. New car registrations
in the euro area stood in October and November
on average slightly more than 3% above their
average level in the third quarter, when they
declined, quarter on quarter, by 0.4%.
4 OUTPUT, DEMAND AND THE LABOUR MARKET
Chart 26 Real GDP growth and contributions
(quarter-on-quarter growth rate and quarterly percentage point contributions; seasonally adjusted)
-1.0
-0.8
-0.6
-0.4
-0.2
0.0
0.2
0.4
0.6
-1.0
-0.8
-0.6
-0.4
-0.2
0.0
0.2
0.4
0.6
Q3Q3 Q4 Q1 Q22012 2013
total GDP growth
net exports
changes in inventories
domestic demand (excluding inventories)
Sources: Eurostat and ECB calculations.
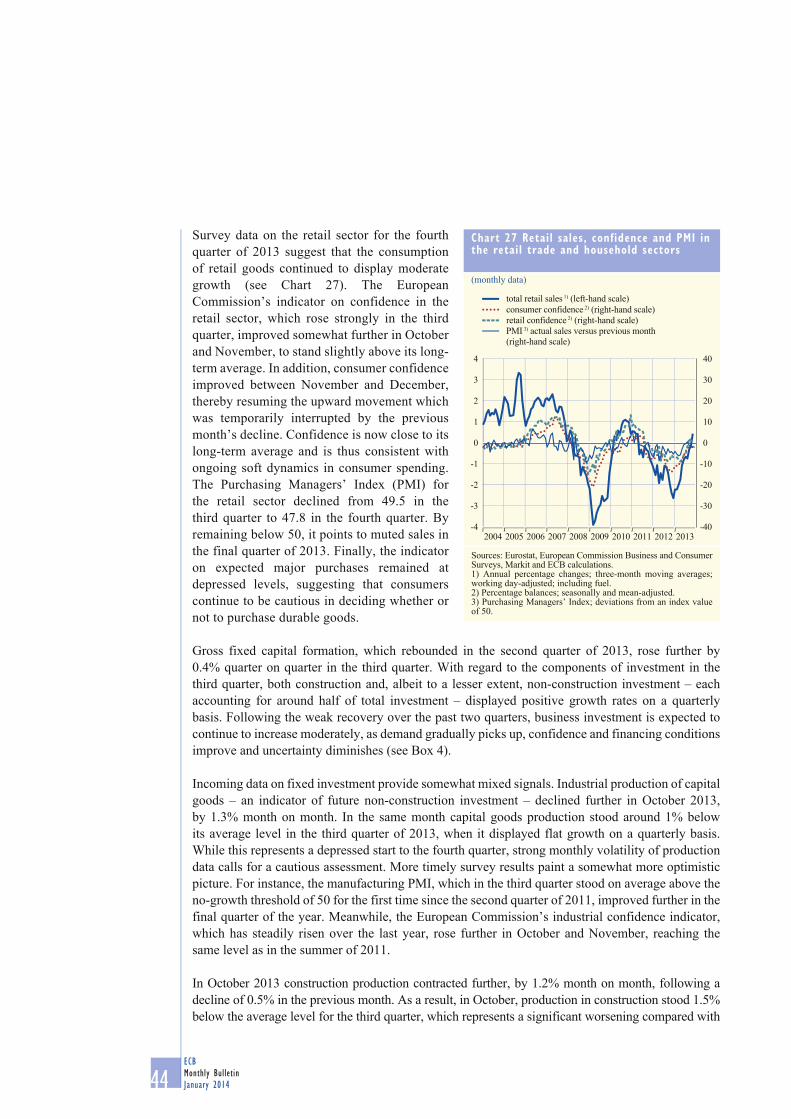
44ECB
Monthly Bulletin
January 2014
Survey data on the retail sector for the fourth
quarter of 2013 suggest that the consumption
of retail goods continued to display moderate
growth (see Chart 27). The European
Commission’s indicator on confidence in the
retail sector, which rose strongly in the third
quarter, improved somewhat further in October
and November, to stand slightly above its long-
term average. In addition, consumer confidence
improved between November and December,
thereby resuming the upward movement which
was temporarily interrupted by the previous
month’s decline. Confidence is now close to its
long-term average and is thus consistent with
ongoing soft dynamics in consumer spending.
The Purchasing Managers’ Index (PMI) for
the retail sector declined from 49.5 in the
third quarter to 47.8 in the fourth quarter. By
remaining below 50, it points to muted sales in
the final quarter of 2013. Finally, the indicator
on expected major purchases remained at
depressed levels, suggesting that consumers
continue to be cautious in deciding whether or
not to purchase durable goods.
Gross fixed capital formation, which rebounded in the second quarter of 2013, rose further by
0.4% quarter on quarter in the third quarter. With regard to the components of investment in the
third quarter, both construction and, albeit to a lesser extent, non-construction investment – each
accounting for around half of total investment – displayed positive growth rates on a quarterly
basis. Following the weak recovery over the past two quarters, business investment is expected to
continue to increase moderately, as demand gradually picks up, confidence and financing conditions
improve and uncertainty diminishes (see Box 4).
Incoming data on fixed investment provide somewhat mixed signals. Industrial production of capital
goods – an indicator of future non-construction investment – declined further in October 2013,
by 1.3% month on month. In the same month capital goods production stood around 1% below
its average level in the third quarter of 2013, when it displayed flat growth on a quarterly basis.
While this represents a depressed start to the fourth quarter, strong monthly volatility of production
data calls for a cautious assessment. More timely survey results paint a somewhat more optimistic
picture. For instance, the manufacturing PMI, which in the third quarter stood on average above the
no-growth threshold of 50 for the first time since the second quarter of 2011, improved further in the
final quarter of the year. Meanwhile, the European Commission’s industrial confidence indicator,
which has steadily risen over the last year, rose further in October and November, reaching the
same level as in the summer of 2011.
In October 2013 construction production contracted further, by 1.2% month on month, following a
decline of 0.5% in the previous month. As a result, in October, production in construction stood 1.5%
below the average level for the third quarter, which represents a significant worsening compared with
Chart 27 Retail sales, confidence and PMI in the retail trade and household sectors
(monthly data)
-4
-3
-2
-1
0
1
2
3
4
-40
-30
-20
-10
0
10
20
30
40
2012 20132004 2005 2006 2007 2008 2009 2010 2011
PMI 3) actual sales versus previous month
(right-hand scale)
retail confidence 2) (right-hand scale)
consumer confidence 2) (right-hand scale)
total retail sales 1) (left-hand scale)
Sources: Eurostat, European Commission Business and Consumer Surveys, Markit and ECB calculations.1) Annual percentage changes; three-month moving averages; working day-adjusted; including fuel.2) Percentage balances; seasonally and mean-adjusted.3) Purchasing Managers’ Index; deviations from an index value of 50.
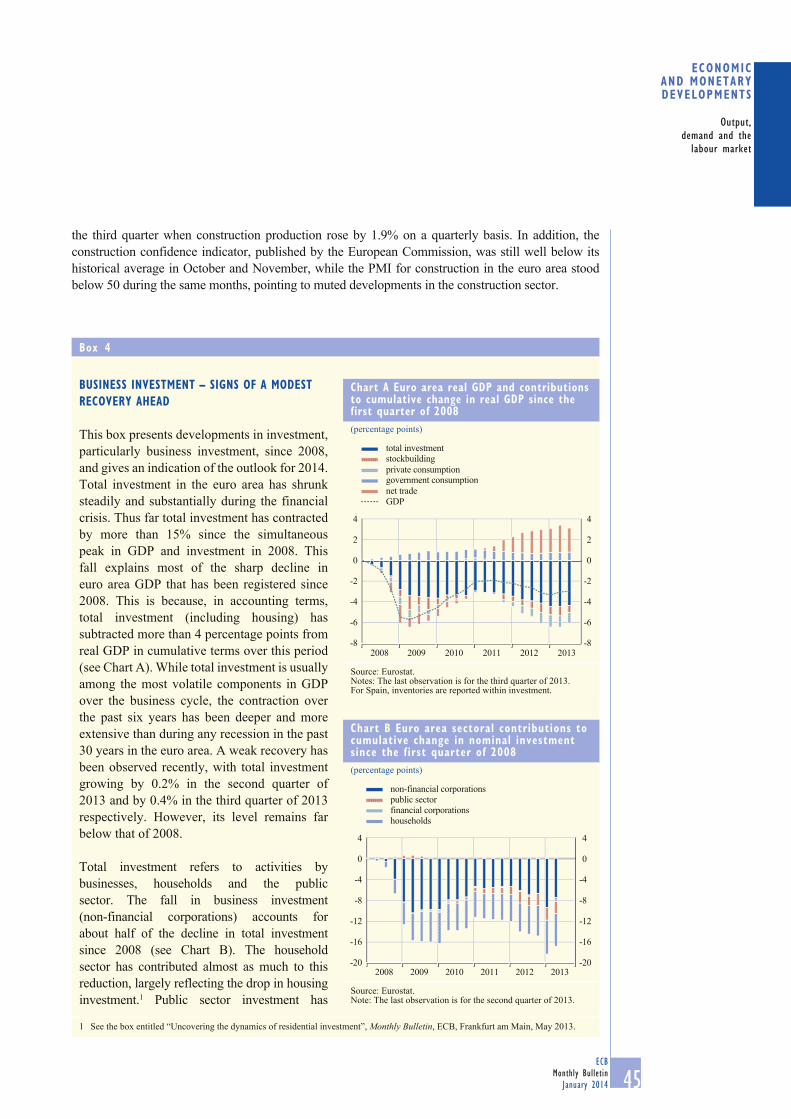
45ECB
Monthly Bulletin
January 2014
Output,
demand and the
labour market
ECONOMIC AND MONETARYDEVELOPMENTS
Box 4
BUSINESS INVESTMENT – SIGNS OF A MODEST
RECOVERY AHEAD
This box presents developments in investment,
particularly business investment, since 2008,
and gives an indication of the outlook for 2014.
Total investment in the euro area has shrunk
steadily and substantially during the financial
crisis. Thus far total investment has contracted
by more than 15% since the simultaneous
peak in GDP and investment in 2008. This
fall explains most of the sharp decline in
euro area GDP that has been registered since
2008. This is because, in accounting terms,
total investment (including housing) has
subtracted more than 4 percentage points from
real GDP in cumulative terms over this period
(see Chart A). While total investment is usually
among the most volatile components in GDP
over the business cycle, the contraction over
the past six years has been deeper and more
extensive than during any recession in the past
30 years in the euro area. A weak recovery has
been observed recently, with total investment
growing by 0.2% in the second quarter of
2013 and by 0.4% in the third quarter of 2013
respectively. However, its level remains far
below that of 2008.
Total investment refers to activities by
businesses, households and the public
sector. The fall in business investment
(non-financial corporations) accounts for
about half of the decline in total investment
since 2008 (see Chart B). The household
sector has contributed almost as much to this
reduction, largely reflecting the drop in housing
investment.1 Public sector investment has
1 See the box entitled “Uncovering the dynamics of residential investment”, Monthly Bulletin, ECB, Frankfurt am Main, May 2013.
Chart A Euro area real GDP and contributions to cumulative change in real GDP since the first quarter of 2008
(percentage points)
-8
-6
-4
-2
0
2
4
-8
-6
-4
-2
0
2
4
2008 2009 2010 2011 2012 2013
GDP
net trade
government consumptionprivate consumption
stockbuilding
total investment
Source: Eurostat.Notes: The last observation is for the third quarter of 2013.For Spain, inventories are reported within investment.
Chart B Euro area sectoral contributions to cumulative change in nominal investment since the first quarter of 2008
(percentage points)
-20
-16
-12
-8
-4
0
4
-20
-16
-12
-8
-4
0
4
2008 2009 2010 2011 2012 2013
households
financial corporations
public sector
non-financial corporations
Source: Eurostat. Note: The last observation is for the second quarter of 2013.
the third quarter when construction production rose by 1.9% on a quarterly basis. In addition, the
construction confidence indicator, published by the European Commission, was still well below its
historical average in October and November, while the PMI for construction in the euro area stood
below 50 during the same months, pointing to muted developments in the construction sector.

46ECB
Monthly Bulletin
January 2014
also contracted sharply. However, given the relatively small share of public sector investment in
total investment, its contribution is much more limited.
Looking closer at business investment, fundamental factors, such as weak demand and profits 2,
as well as abundant spare capacity, help to explain the contracting dynamics over recent years.
Particularly during the financial crisis, high levels of uncertainty 3, tight financing conditions
and deleveraging needs among firms and banks also contributed to dampening firms’
investment activity.
According to the European Commission’s November 2013 investment survey, real euro area
investment in the manufacturing industry is estimated to have decreased by a further 3% in 2013
and is expected to increase by 3% in 2014.
The survey also shows that, on balance, demand factors are expected to be more supportive
of investment growth in the euro area in 2014 than they were a year earlier. Currently demand
factors are broadly as supportive of investment growth as they have been on average since the
start of EMU. The Commission survey distinguishes between small firms with less than 50
2 See the box entitled “Sectoral contributions to rebalancing within the euro area”, Monthly Bulletin, ECB, Frankfurt am Main,
December 2013.
3 See the box entitled “How has macroeconomic uncertainty in the euro area evolved recently?”, Monthly Bulletin, ECB, Frankfurt am
Main, October 2013.
Chart C European Commission investment survey – factors influencing industrial investment in the euro area
(balances)
other
technical
financial
demand
a) small firms b) larger firms
-20
-10
0
10
20
30
40
50
-20
-10
0
10
20
30
40
50
1998 2000 2002 2004 2006 2008 2010 2012 2014-30
-20
-10
0
10
20
30
40
50
60
-30
-20
-10
0
10
20
30
40
50
60
1998 2000 2002 2004 2006 2008 2010 2012 2014
Sources: European Commission investment survey and Eurostat.Notes: Larger firms have more than 250 employees; small firms have less than 50 employees. Plotted are the levels of the balances of responses: the higher the balance, the more supportive the factor is perceived to be (and the lower the balance, the more restrictive). “Demand factors” cover the capacity utilisation rate and sales prospects; “financial factors” include the availability of resources for investment and their cost together with the return on investment and the lack of opportunities for the company to use its resources more profitably than by investment (notably by purely financial operations); “technical factors” comprise technological developments, the availability of labour and workers’ attitudes towards the new technologies, and the technical conditions set by the public authorities before they grant the investment permit; “other factors” may include the policy of the public authorities, notably with regard to taxation, and whether or not production can be transferred abroad.

47ECB
Monthly Bulletin
January 2014
Output,
demand and the
labour market
ECONOMIC AND MONETARYDEVELOPMENTS
The contribution of euro area trade to GDP growth turned negative in the third quarter of 2013.
Both export and import growth moderated in the third quarter: on a quarterly basis, exports grew by
only 0.2%, while imports increased by 1%. This moderation follows an extended period of positive
net trade. In this context, Box 5 assesses to what extent the current account adjustment for countries
under stress has been cyclical or structural.
Data on euro area trade for the fourth quarter based only on October data suggest that trade growth
was weak, but the net trade contribution to GDP growth is likely to become positive again. In
October the value of exports fell marginally on a monthly basis, whereas the value of imports
declined more strongly. The level of exports stood higher than the average for the third quarter,
while imports were lower. According to short-term indicators, trade prices fell in October,
indicating that in volume terms trade was better, with real export growth stronger than real import
growth. Survey data for the fourth quarter show an improving trade scenario. The PMI new export
orders index for the fourth quarter was consistently above the expansion threshold of 50 and stood
at the highest level since the second quarter of 2011. In addition, the European Commission survey
indicator for export order books improved compared with the third quarter.
employees and larger firms with more than 250 employees. An encouraging result is that in 2014
smaller firms expect demand factors to be more supportive than they have been on average
since 2009 (see Chart C). Unlike for larger firms, overall, the demand factors have provided
limited support for investment since 2009 for small firms. The survey also shows that financing
considerations remain heavily dependent on firm size: while larger companies expect financial
factors in 2014 to become substantially more supportive of investment decisions compared with
a year ago, small companies expect some deterioration.
All in all, following the weak recovery in recent quarters, moderate growth in business
investment is expected to continue, as demand gradually picks up, confidence and financing
conditions improve and uncertainty diminishes. The euro area bank lending survey also
shows that lending for investment purposes is expected to become less subdued. However, the
recovery is expected to take place at a modest pace, from low levels, as it remains dampened by
inter alia the continued deleveraging by both banks and firms and to some extent by difficulties
encountered by firms with bank-financing constraints to find alternative financing via market
securities issuance, foreign direct investment flows or trade credits.
Box 5
TO WHAT EXTENT HAS THE CURRENT ACCOUNT ADJUSTMENT IN THE STRESSED EURO AREA
COUNTRIES BEEN CYCLICAL OR STRUCTURAL?
Prior to the global financial crisis, a number of euro area countries recorded large current account
deficits. However, since 2008 the current account deficits of the four countries which in 2012
were subject to an economic and/or financial adjustment programme have decreased or even
turned into surpluses (see Chart A).1 In parallel, domestic demand has declined substantially in
1 This box focuses on the four countries subject to an economic and/or financial adjustment programme in 2012 (Ireland, Greece, Spain
and Portugal). Cyprus is excluded from the analysis as its programme and adjustment process started only later.

48ECB
Monthly Bulletin
January 2014
these countries. This raises the question of the extent to which the external adjustment has been
driven by a cyclical compression of domestic demand, which might be reversed at some point,
and the extent to which the adjustment is more structural in nature.
A current account deficit can be reduced through a reduction in imports and/or an expansion
of exports. During the ongoing adjustment of external imbalances in the stressed euro area
countries both channels have played a role, albeit to varying degrees (see Chart B). In Spain
and Portugal, the larger part of the improvement in current account balances is attributable to an
increase in exports relative to GDP, while in Greece the improvement is mostly attributable to
a compression of imports. In Ireland, exports have increased strongly since 2008, with imports
contracting only in the initial stages of the adjustment phase and exceeding their pre-crisis level
in 2012.
The adjustment in exports and imports, in turn, typically reflects a decline in domestic demand
relative to foreign demand or a depreciation of the real effective exchange rate of the country
concerned. In the four stressed euro area countries under review, a combination of both
mechanisms has been at work (see Chart C). While most of the contraction in relative demand
occurred in the initial stages of the adjustment, the adjustment of relative prices, i.e. a real
depreciation as measured by the harmonised competitiveness indicators deflated by unit labour
costs, occurred only later and was most pronounced in 2012 (with the exception of Ireland).
However, the adjustment in unit labour costs partly reflects productivity increases due to labour
shedding rather than nominal wage adjustment. Moreover, the pass-through from unit labour
costs to product prices has been incomplete.
Chart A Current account balances
(as a percentage of GDP)
6
4
2
0
-2
-4
-6
-8
-10
-12
-14
-16
6
4
2
0
-2
-4
-6
-8
-10
-12
-14
-16Ireland Greece Spain Portugal
2008
2012
Sources: Eurostat and national statistical institutes.
Chart B Contributions to the change in trade balances between 2008 and 2012
(percentage points of GDP)
-15
-10
-5
0
5
10
15
20
25
30
-15
-10
-5
0
5
10
15
20
25
30
Ireland Greece Spain Portugal
change in the current account balance
contribution of exports
change in the trade balance
contribution of imports
Sources: Eurostat and national statistical institutes.

49ECB
Monthly Bulletin
January 2014
Output,
demand and the
labour market
ECONOMIC AND MONETARYDEVELOPMENTS
The decline in domestic demand relative to
foreign demand appears to have been both
cyclical and structural in nature. Between
2008 and 2012 the stressed countries recorded
declines in real GDP of around 5% in the cases
of Ireland, Spain and Portugal and 20% in the
case of Greece. According to estimates by
the IMF, the European Commission and the
OECD, this only partly reflected a substantial
widening of the output gap. For instance, for
Greece the output gap is estimated to have
widened by between 14 and 19 percentage
points. However, potential output in Greece
is estimated to have declined by up to 6%
between 2008 and 2012. Also in the other
stressed countries potential growth was either
negative or fell short of world potential output
growth of about 15%. This implies that a
significant part of the decline in domestic
demand of the stressed euro area countries
relative to foreign demand is due to a decline
in their potential output relative to that of the
rest of the world.
The observed change in relative potential
output suggests that part of the external
rebalancing in the stressed euro area countries must have been of a non-cyclical nature. In order
to quantify the cyclical and non-cyclical components of the current account adjustment more
distinctly, one can draw on the empirical relationship between the current account balance and
its determinants, as captured by a standard current account model. Such a reduced-form model
relates the current account balance to a set of variables including, on the one hand, cyclical
factors, in particular the output gap of a country expressed relative to the world output gap,
and, on the other hand, non-cyclical factors, such as demographics, the medium-term growth
potential and the cyclically-adjusted fiscal position.2 It was found that non-cyclical factors have
played a significant role in the current account adjustment in the stressed euro area countries. In
fact, according to most estimates, cyclical factors explain less than half of the current account
adjustment between 2008 and 2012, with the notable exception of Greece (see Chart D). This
finding is robust to the use of different measures of the output gap, which are known to be
subject to a considerable degree of measurement uncertainty.3
While continued adjustment is needed going forward, available evidence suggests that a significant
part of the current account adjustment achieved so far is likely to be maintained in the near future,
2 For a discussion of such current account models, see External Balance Assessment (EBA) Methodology: Technical Background, Research Department, IMF, June 2013.
3 For a discussion of the measurement of the output gap and the uncertainty surrounding such estimates, see the article entitled “Trends
in potential output”, Monthly Bulletin, ECB, January 2011.
Chart C Relative demand and harmonised competitiveness indicators
(index: 2009 = 100)
75
80
85
90
95
100
105
75
80
85
90
95
100
105
60 70 80 90 100
y-axis: harmonised competitiveness indicator 2)
x-axis: relative demand 1)
2012
2012
2012
2009
2012
Portugal
Spain
Greece
Ireland
Source: ECB staff calculations.1) Ratio of domestic demand to foreign demand. 2) Deflated by unit labour costs. A decrease corresponds to a real
depreciation.

50ECB
Monthly Bulletin
January 2014
4.2 SECTORAL OUTPUT
In the third quarter of 2013 real value added increased further by 0.1% quarter on quarter, owing to
developments in services. Value added in industry displayed flat growth in the third quarter.
With regard to developments in the final quarter of 2013, production in the industrial sector
(excluding construction) declined by 1.1%, month on month, in October. As a result, production
stood almost 1% below its average level in the third quarter. This is a weak start to the fourth
quarter and a worsening compared with the quarterly decline of 0.2% in the third quarter of 2013
(see Chart 28). Meanwhile, the ECB indicator on euro area industrial new orders (excluding heavy
transport equipment) declined by 1.9%, month on month, in October, following a smaller decline
in the previous month. The level of orders therefore stood 1.5% below the level in the third quarter,
when it rose by 1.3% on a quarterly basis. Survey data, which are available up to December, point
towards a small expansion of industrial sector output in the fourth quarter (see Chart 29). For
example, the PMI manufacturing output index, which already indicated growth in the third quarter,
rose further in the fourth quarter of 2013.
Production in construction declined by 1.2% in October, to a level 1.5% below that reached in the
third quarter of the year. Moreover, survey data point to a feeble underlying growth momentum,
consistent with ongoing weakness in the construction sector.
Although the PMI index of activity in business services has declined during the last three months,
it still rose somewhat between the third and fourth quarters of 2013. The index, which averaged
broadly consistent with projections by the IMF
and the European Commission. This reflects
both the structural adjustment observed so
far but also the expectation that the negative
output gaps in the stressed euro area countries
will close only slowly. However, some
deterioration is to be expected in the current
account balances of the stressed euro area
countries once output returns to potential. In
addition, it is likely that potential growth will
increase again in the future. However, these
factors are unlikely to reverse fully the current
account correction seen to date.
Nevertheless, several countries have not adjusted
their structural current account balances to a
level that would significantly reduce their large
negative net international investment positions
in the near future. Further structural reforms,
as well as further improvements in price and
non-price competitiveness, are therefore needed
in the stressed euro area countries with a view
to strengthening export performance over the
longer term.
Chart D Contribution of cyclical factors to the change in current account balances between 2008 and 2012
(percentage points)
0
2
4
6
10
8 8
12
14
0
2
4
6
10
12
14
Greece Spain PortugalIreland
change in the current account balance
cyclical contribution based on output gaps
from the OECD
cyclical contribution based on output gaps
from the European Commission
cyclical contribution based on output gaps
from the IMF
Sources: European Commission, IMF, OECD, national statistical institutes and ECB staff estimates.

51ECB
Monthly Bulletin
January 2014
Output,
demand and the
labour market
ECONOMIC AND MONETARYDEVELOPMENTS
51.2 in the final quarter of 2013, is thus in line with another small increase in output in the services
sector in that quarter. Other business surveys, such as those of the European Commission, paint a
similar picture.
4.3 LABOUR MARKET
Labour markets are showing signs of stabilisation, which is consistent with their typically
delayed response to improvements in economic activity. Employment was stable in the third quarter
of 2013, while more recent data suggest that the unemployment rate has broadly stabilised at a
high level. Survey data have improved, but point nonetheless to subdued developments in the
period ahead.
In the third quarter of 2013 the level of employment remained stable compared with the second
quarter (see Table 9). At the same time, the reading for the second quarter has been revised up,
now displaying zero growth. The latest developments thus clearly indicate that a stabilisation is
taking place following the prolonged period of decline. At the sectoral level, the latest outcome
reflects declines in the industrial sector, which were offset by increases in the services sector.
Hours worked rose further by 0.1% quarter on quarter in the third quarter, a development which is
consistent with a normalisation of labour market conditions. Although survey results have recently
improved, they still point to continued weak labour market developments in the fourth quarter of
2013 (see Chart 30).
Chart 28 Industrial production growth and contributions
(growth rate and percentage point contributions; monthly data; seasonally adjusted)
-11
-10
-9
-8
-7
-6
-5
-4
-3
-2
-1
0
1
2
3
4
-11
-10
-9
-8
-7
-6
-5
-4
-3
-2
-1
0
1
2
3
4
2012 20132004 2005 2006 2007 2008 2009 2010 2011
total (excluding construction)
energy
intermediate goods
consumer goods
capital goods
Sources: Eurostat and ECB calculations.Note: Data shown are calculated as three-month moving averages against the corresponding average three months earlier.
Chart 29 Industrial production, industrial confidence and PMI manufacturing output
(monthly data; seasonally adjusted)
-12
-10
-8
-6
-4
-2
0
2
4
-48
-40
-32
-24
-16
-8
0
8
16
2004 2005 2006 2007 2008 2009 2010 2011 2012 2013
PMI ³) manufacturing output (right-hand scale)industrial confidence ²) (right-hand scale)
industrial production ¹) (left-hand scale)
Sources: Eurostat, European Commission Business and Consumer Surveys, Markit and ECB calculations.Note: Survey data refer to manufacturing.1) Three-month-on-three-month percentage changes.2) Percentage balances.3) Purchasing Managers’ Index; deviations from an index value of 50.

52ECB
Monthly Bulletin
January 2014
Productivity per person employed rose by 0.5% in annual terms in the third quarter of 2013,
which is slightly more than in the previous quarter (see Chart 31). The latest increase was broadly
based across sectors. At the same time, the annual growth rate of hourly labour productivity rose
by 0.2 percentage point to 0.5% between the second and third quarters. Looking ahead, the PMI
productivity index points to continued positive, albeit moderate, productivity growth in the final
quarter of 2013.
Table 9 Employment growth
(percentage changes compared with the previous period; seasonally adjusted)
Persons HoursAnnual rates Quarterly rates Annual rates Quarterly rates2011 2012 2013
Q12013
Q22013
Q32011 2012 2013
Q12013
Q22013
Q3
Whole economy 0.3 -0.7 -0.4 0.0 0.0 0.3 -1.4 -1.0 0.7 0.1
of which: Agriculture and fishing -2.0 -1.9 -1.5 1.8 -0.3 -3.1 -2.8 -0.4 0.8 -0.5
Industry -1.1 -2.1 -0.8 -0.5 -0.3 -0.8 -3.4 -1.6 1.1 -0.2
Excluding construction 0.1 -1.0 -0.4 -0.4 -0.3 0.8 -2.1 -1.2 1.4 -0.1
Construction -3.8 -4.7 -1.6 -1.0 -0.3 -3.9 -6.1 -2.4 0.6 -0.6
Services 0.8 -0.2 -0.3 0.0 0.1 0.8 -0.7 -0.8 0.6 0.2
Trade and transport 0.7 -0.8 -0.4 0.0 0.0 0.5 -1.6 -0.8 0.8 0.3
Information and communication 1.2 1.2 -0.2 0.1 -0.1 1.4 0.5 -0.1 0.3 -0.4
Finance and insurance -0.4 -0.4 -0.1 -0.1 -0.1 -0.3 -0.8 -0.2 0.4 0.1
Real estate activities 0.6 -0.4 -0.7 0.5 0.4 1.4 -1.2 -0.2 1.0 -0.3
Professional services 2.5 0.7 -0.6 0.5 0.4 2.7 0.4 -1.0 0.8 0.4
Public administration 0.3 -0.3 -0.2 -0.2 0.1 0.5 -0.5 -0.9 0.4 0.1
Other services 1) 0.1 0.7 0.0 -0.1 0.1 0.1 -0.1 -0.5 -0.1 0.4
Sources: Eurostat and ECB calculations.1) Also includes household services, the arts and activities in extraterritorial organisations.
Chart 30 Employment growth and employment expectations
(annual percentage changes; percentage balances; seasonally adjusted)
-7
-6
-5
-4
-3
-2
-1
0
1
2
3
4
5
-35
-30
-25
-20
-15
-10
-5
0
5
10
15
20
25
2012 20132004 2005 2006 2007 2008 2009 2010 2011
employment expectations in manufacturing
(right-hand scale)
employment growth in industry
(excluding construction; left-hand scale)
-25
-20
-15
-10
-5
0
5
10
15
20
25
-25
-20
-15
-10
-5
0
5
10
15
20
25
2012 20132004 2005 2006 2007 2008 2009 2010 2011
employment expectations in the services sector
employment expectations in the retail trade
employment expectations in construction
Sources: Eurostat and European Commission Business and Consumer Surveys.Note: Percentage balances are mean-adjusted.
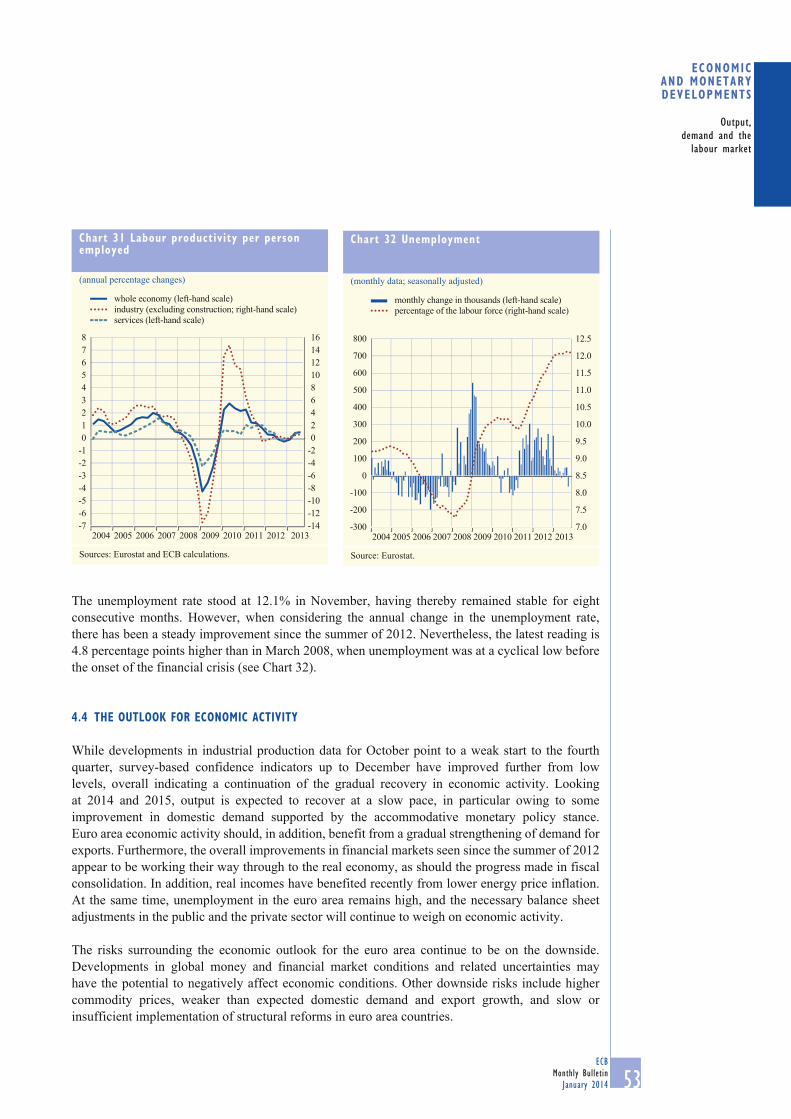
53ECB
Monthly Bulletin
January 2014
Output,
demand and the
labour market
ECONOMIC AND MONETARYDEVELOPMENTS
The unemployment rate stood at 12.1% in November, having thereby remained stable for eight
consecutive months. However, when considering the annual change in the unemployment rate,
there has been a steady improvement since the summer of 2012. Nevertheless, the latest reading is
4.8 percentage points higher than in March 2008, when unemployment was at a cyclical low before
the onset of the financial crisis (see Chart 32).
4.4 THE OUTLOOK FOR ECONOMIC ACTIVITY
While developments in industrial production data for October point to a weak start to the fourth
quarter, survey-based confidence indicators up to December have improved further from low
levels, overall indicating a continuation of the gradual recovery in economic activity. Looking
at 2014 and 2015, output is expected to recover at a slow pace, in particular owing to some
improvement in domestic demand supported by the accommodative monetary policy stance.
Euro area economic activity should, in addition, benefit from a gradual strengthening of demand for
exports. Furthermore, the overall improvements in financial markets seen since the summer of 2012
appear to be working their way through to the real economy, as should the progress made in fiscal
consolidation. In addition, real incomes have benefited recently from lower energy price inflation.
At the same time, unemployment in the euro area remains high, and the necessary balance sheet
adjustments in the public and the private sector will continue to weigh on economic activity.
The risks surrounding the economic outlook for the euro area continue to be on the downside.
Developments in global money and financial market conditions and related uncertainties may
have the potential to negatively affect economic conditions. Other downside risks include higher
commodity prices, weaker than expected domestic demand and export growth, and slow or
insufficient implementation of structural reforms in euro area countries.
Chart 31 Labour productivity per person employed
(annual percentage changes)
-7
-6
-5
-4
-3
-2
-1
0
1
2
3
4
5
6
7
8
-14
-12
-10
-8
-6
-4
-2
0
2
4
6
8
10
12
14
16
2012 20132004 2005 2006 2007 2008 2009 2010 2011
whole economy (left-hand scale)
industry (excluding construction; right-hand scale)
services (left-hand scale)
Sources: Eurostat and ECB calculations.
Chart 32 Unemployment
(monthly data; seasonally adjusted)
-300
-200
-100
0
100
200
300
400
500
600
700
800
7.0
7.5
8.0
8.5
9.0
9.5
10.0
10.5
11.0
11.5
12.0
12.5
2012 20132004 2005 2006 2007 2008 2009 2010 2011
percentage of the labour force (right-hand scale)
monthly change in thousands (left-hand scale)
Source: Eurostat.


55ECB
Monthly Bulletin
January 2014
ART ICLES
FIFTEEN YEARS OF THE ECB SURVEY OF PROFESSIONAL FORECASTERS
Fifteen years have passed since the launch of the ECB Survey of Professional Forecasters (SPF). Over this period, the SPF has made a significant contribution to the ECB’s macroeconomic analysis and monetary policy deliberations and has drawn interest from practitioners and academics alike, both from within and outside the world of central banking. This article reviews some key elements regarding the usefulness of the SPF as a source of information for the ECB’s monetary policy assessment. First, the short to medium-term expectations in the SPF offer a useful benchmark against which to assess the Eurosystem staff macroeconomic projections. Second, longer-term inflation forecasts help to assess whether private agents’ expectations are in line with the ECB’s quantitative definition of price stability, while longer-term expectations for GDP growth and unemployment offer useful insights into the broad forces underlying the euro area’s growth potential. Third, the financial crisis has highlighted the usefulness of uncertainty measures for macroeconomic analysis, including those that can be extracted from the SPF.
1 INTRODUCTION
Fifteen years have passed since the launch of the ECB Survey of Professional Forecasters (SPF).
Around the time of its inception in June 1998, the ECB began preparations, in collaboration with the
national central banks (NCBs) of the EU, to establish a survey of the private sector’s expectations
regarding key euro area macroeconomic developments.1 The first SPF was conducted in the first
quarter of 1999 and, since then, 60 surveys have been carried out on a quarterly basis – in January,
April, July and October – asking respondents to provide expectations for euro area HICP inflation,
GDP growth and the unemployment rate. Respondents provide point forecasts for rolling horizons
(one and two years ahead), fixed calendar year horizons (current year, next year and year after
next) and longer-term expectations (five years ahead). SPF participants are also asked to assign a
probability distribution to their forecasts. The individual responses are aggregated in the form of
mean point forecasts and as aggregate probability distributions. Other central banks from major
economies around the world also use surveys of professional forecasters as an independent source
of information for expectations of macroeconomic developments (see Box 1 for a comparison
between the euro area SPF and that of the United States and of the United Kingdom).
The results of the euro area SPF have drawn considerable interest from both practitioners and
academics alike. The latter have used them for a wide range of issues, including testing for rational
and efficient expectations both at the individual and aggregate levels, optimal forecast combination
methods and the measurement and behaviour of uncertainty. For the ECB, the SPF has been an
important source of information in its general economic and monetary analyses. This article assesses
three main ways in which the SPF has been used by policy-makers in its 15 years of existence.
Section 2 looks at the role of the SPF as a comparator for the Eurosystem staff macroeconomic
projections for the current year and the next year, reviewing relative performance and discussing
the role of forecasting assumptions.2 Section 3 examines the longer-term forecasts in the SPF for
GDP growth, unemployment rates and inflation in the context of the information these variables
provide on key concepts such as potential output and inflation objectives. Section 4 examines
professional forecasters’ assessments of the uncertainty surrounding their forecasts and compares
these assessments with other indicators of macroeconomic uncertainty. Section 5 concludes.
1 For more details regarding the motivation for launching the SPF, see García, J.A., “An introduction to the ECB’s Survey of Professional
Forecasters”, Occasional Paper Series, No 8, ECB, September 2003.
2 For an early assessment of the data collected in the SPF between 1999 and 2006, see Bowles, C., Friz, R., Genre, V., Kenny, G., Meyler,
A. and Rautanen, T., “The ECB Survey of Professional Forecasters (SPF) – A review after eight years’ experience”, Occasional Paper Series, No 59, ECB, April 2007.
56ECB
Monthly Bulletin
January 2014
Box 1
COMPARING SURVEYS OF PROFESSIONAL FORECASTERS ACROSS COUNTRIES
Central banks conducting surveys of professional forecasters include the Federal Reserve Bank
of Philadelphia (FRBP) for the United States, the Bank of England (BoE) for the United Kingdom
and the ECB for the euro area.1 The history of these surveys goes back to 1968 in the case of
the FRBP, to 1993 in the case of the BoE and to 1999 in the case of the ECB. The experiences
of central banks and other users over the years are important for any future adaptations of such
surveys. Against this background, this box examines some key similarities and differences across
the three surveys and summarises some of the changes introduced over time.
Key similarities and differences across surveys
The surveys of professional forecasters by the ECB, the FRBP and the BoE are comparable
in several respects. In particular, all three surveys cover inflation, real GDP growth and
unemployment as core variables. This selection of core variables allows the inflation outlook to
be assessed in terms of fundamental determinants such as economic activity and unemployment.
The FRBP SPF covers by far the broadest set of indicators, as it also requests data on components
of GDP, productivity and house prices, for example. All three surveys ask for forward-looking
information on variables that often function as assumptions or otherwise conditioning variables
in forecasts and projections. For instance, the ECB and BoE surveys ask for central bank interest
rate and exchange rate assumptions, while the ECB survey also asks for data on oil prices
and labour costs. The FRBP survey, in addition to requesting information on the three-month
Treasury bill rate, also asks for information on corporate bond yields as a variable that captures
financing conditions.
All three surveys are conducted in the first month of each quarter, with the actual deadline
depending on the release of relevant national data. The results are then published in the second
month of the quarter. The surveys thus form part of the information set available which central
banks use as a basis for preparing their own forecasts and projections. In the case of the ECB
SPF, the results are based on an average number of respondents somewhat greater than 50,
compared with fewer than 40 in the case of the FRBP SPF and between 20 and 30 in the case of
the BoE SPF.
In the ECB and FRBP surveys, forecasts are surveyed for specific calendar year horizons. This
allows the nature of the forecast revision process, such as its relationship to macroeconomic
news, to be examined. Both surveys ask for expectations related to the current calendar year, the
next year and the year after next. Additionally, longer-term expectations, relating to a horizon
of five calendar years ahead in the case of the ECB and covering the periods one to five years
and one to ten years ahead in the case of the FRBP, are surveyed. All three surveys also request
information on rolling horizons, referring to expectations one year ahead, for instance, of the
latest data released for a given variable. Such rolling horizons allow for a consistent comparison
of disagreement and uncertainty surrounding the forecasts of different survey rounds, given
that, in the case of fixed horizons, these two measures normally decrease as more information
becomes available.
1 Additional examples of the many other countries which carry out surveys of professional forecasters include Japan (Survey of Japanese
Economic Forecasts (ESPF) established in May 2009) and Canada (Private Sector Survey (PSS) established in 1975).
57ECB
Monthly Bulletin
January 2014
Fifteen years of the
ECB survey of
professional
forecasters
ARTICLES
2 USING THE SPF AS A COMPARATOR FOR PROJECTIONS
The ECB aims to achieve price stability at a medium-term horizon. In its assessment of risks to price
stability, the Eurosystem staff macroeconomic projections play an important role in condensing the
information provided by economic indicators in a coherent and structured manner. In this respect,
the SPF has provided an alternative source of information against which to assess Eurosystem staff
projections. Although the focus of this section will be on comparing SPF and staff projections in
terms of the magnitude of the projected variables for the individual years of the forecast horizon,
policy-makers also obtain highly valuable information from the time profile that the SPF expects
for the projected variables (e.g. acceleration or deceleration) over the horizon.
All three surveys ask for probability distributions around the core variables. For this purpose the
questionnaires provide so-called “bins” (with the lowest and highest bins being open-ended) that
can be used as a basis for approximating the underlying distribution. Such distributions allow the
risks that forecasters see around their point estimates to be assessed.
Key adaptations made across time and surveys
Notable changes have been made to various features of the designs of the surveys. All surveys
have, over time, requested additional variables, including core variables such as real GDP in
the case of the BoE survey and assumption variables such as labour costs in the case of the ECB
survey. Other extensions include requesting expectations for corporate bond yields in the case of
the FRBP and for the stock of assets purchased by the central bank in the case of the BoE.
Adaptations of horizons have been introduced in the FRBP and BoE surveys. In the case of the
former, this relates in particular to the introduction of the calendar year after next as an additional
fixed horizon, as well as the long-term and rolling horizons for inflation and GDP. In the case of
the BoE, there has been a switch from a mix of fixed and rolling horizons to just rolling horizons
(one, two and three years ahead).
All surveys have seen adjustments to the number and size of bins in response to the
macroeconomic developments over the last 15 years. These adjustments have occurred at
different points in time, but were most prominent in response to developments seen during
the 2008 financial crisis and recession. As point forecasts assumed historically unprecedented
values, the probability mass moved closer to the open-ended bins, with the consequence that it
was no longer possible to reasonably approximate the underlying distribution. The extension of
the range covered by closed bins restored this possibility of approximation.
Overall, the current design of the three SPF surveys by the ECB, the FRBP and the BoE and
the adaptations seen over time suggest a broad convergence of the key features of the surveys.
In particular, the adjustments suggest that an informed assessment of the survey information
requires additional information beyond that provided by the core variables, and that probabilities
are a highly useful element in the assessment of baseline forecasts. Similarly, the request for
expectations at longer horizons reflects the usefulness of assessing the anchoring of expectations
in the context of the medium-term orientation of monetary policy.

58ECB
Monthly Bulletin
January 2014
More specifically, this section compares the Eurosystem’s own projections for the current and next
calendar years with the corresponding mean forecasts from the SPF, with some focus on the reasons for
the observed forecast errors, such as different assumptions.3 In order to interpret differences between
forecasts and projections, it is useful to bear in mind the way SPF respondents form their expectations.
The results of a special questionnaire for SPF participants provide information on the prevailing
forecast practices and some changes that have been observed since 2008 (see Box 2).
3 A more detailed assessment of the forecast performance of the Eurosystem staff macroeconomic projections for the euro area, including
a comparison with those of other international institutions, can be found in the article entitled “An assessment of Eurosystem staff
macroeconomic projections”, Monthly Bulletin, ECB, May 2013.
Box 2
HOW ARE FORECASTS IN THE ECB SURVEY OF PROFESSIONAL FORECASTERS MADE? RESULTS
OF A SPECIAL QUESTIONNAIRE
Understanding how participants in the ECB SPF make their forecasts and form their expectations
is important for interpreting both the average outcomes and the heterogeneity across individual
forecasts. This box summarises the results of a special questionnaire sent to SPF participants in
the summer of 2013, aimed at taking stock of current forecasting practices and gauging potential
changes since the start of the financial crisis.1
Responses were received from 45 SPF participants, which represents around three-quarters of
the average number of responses received in the regular survey rounds. As in the first special
questionnaire conducted in 2008, there were questions on timeliness and methods of forecasting,
on the use of economic models and judgement, and on the way probability distributions and
assumptions are computed.2 These questions have been partly rephrased and extended to find out
whether and in what way the forecasting processes have changed since the start of the financial
crisis. It should be noted that on some occasions, the percentages reported may add up to more
than 100%, as respondents could indicate more than one category.
Frequency of forecast updates reported in the SPF
The majority of respondents (84%) reported that their forecasts are updated on a regular
calendar basis. Around one-third (31%) do so following important data releases that make
them change their view of the economy. A number of respondents (16%) update their forecasts
both on a calendar basis and in between scheduled updates in case of important data releases.
These percentages are broadly the same as those reported in the 2008 special questionnaire.
Of those respondents who update their forecasts regularly according to a calendar, two-thirds
reported that they do so on a quarterly basis, while a smaller share (28%) updates them each
month. Compared with the 2008 special questionnaire, a higher share of participants now reports
that they update their forecasts at least once each quarter.
1 A copy of the questionnaire and a more detailed summary of the results can be found on the ECB’s website at http://www.ecb.europa.
eu/stats/prices/indic/forecast/html/index.en.html.
2 For a summary of the 2008 SPF special questionnaire, see http://www.ecb.europa.eu/stats/prices/indic/forecast/shared/files/quest_
summary.pdf.
59ECB
Monthly Bulletin
January 2014
Fifteen years of the
ECB survey of
professional
forecasters
ARTICLES
Most respondents indicated that they provide their latest available forecast for each SPF round,
with only a small proportion preparing a new forecast specifically for the SPF. Of the forecasts
that are sent in a given SPF round, less than half are new forecasts, while around one-third are
mechanical updates of previous forecasts on the basis of the latest data or assumptions. Overall,
given the high frequency and nature of the updates, the replies suggest that the SPF expectations
are quite timely.
Forecasting techniques and models
The responses indicate that the type of model preferred to generate forecasts varies according
to the forecast horizon and to the variable being forecast. Reduced form models, such as single
equation, vector autoregressive (VAR) or vector error correction models (VECM), seem to
be commonly used for all horizons and variables, although somewhat more prominently to
forecast inflation rather than real GDP or unemployment. Structural models, such as supply and
demand-based macro models or dynamic stochastic general equilibrium (DSGE) models, are
increasingly used for the longer forecast horizons.
Most respondents (84%) reported that they use at least one type of reduced form model, with
a substantial share of respondents reporting that they use two or more types of these models
for a given variable and horizon. With regard to structural models, the responses suggest an
increased use of DSGE models in comparison with the 2008 questionnaire, putting them now
on a more or less equal footing with more traditional supply and demand-based macro models.
More generally, the use of different models for the same horizons and variables is motivated by
cross-checking results or by forecasting components of the core variables with different models
and later combining them in a bottom-up approach. Moreover, the comparative advantage of
using different models at different forecast horizons also plays a role.
SPF participants were asked to what extent their forecasts are model or judgement-based. Most
respondents (81% on average, across all variables and horizons) consider their forecasts to be,
at least in part, judgement-based – in the sense that model-based outcomes are complemented
by judgemental adjustments – with one-third of respondents reporting that their forecasts are
essentially, i.e. to a very high degree, judgement-based. Across horizons, a slightly higher
share of respondents reports essentially judgement-based forecasts for unemployment than for
HICP and GDP. When looking at the combined shares of essentially judgemental forecasts
and model-based forecasts including judgement, they are roughly the same for all three
variables. Looking at the impact of judgement on forecasts for different forecast horizons,
the share of respondents providing essentially judgement-based forecasts is higher for
longer-term horizons than for short and medium-term horizons. These results correspond to
those in the 2008 special questionnaire.
When forming their longer-term (five years ahead) inflation expectations, most respondents
make use of a wide range of information: the ECB’s inflation objective is mentioned most
often (81%), followed by trends in actual inflation (54%), long-term inflation expectations from
financial markets (43%) and trends in wages and monetary aggregates (both 38%).
Almost all respondents stated that they changed their models following the financial crisis in 2008
and that, since then, the importance of judgement in forming their expectations had increased.
Some of the changes relate to the treatment of model parameters, with some respondents placing
60ECB
Monthly Bulletin
January 2014
2.1 COMPARING THE FORECASTING PERFORMANCE OF THE SPF AND THE EUROSYSTEM STAFF
MACROECONOMIC PROJECTIONS
Since December 2000, the ECB has been publishing the Eurosystem staff macroeconomic
projections twice a year (in June and December) for the current year and the next year.4
Below, these projections are compared with the mean forecasts of the SPF for inflation and real
4 These projections have been complemented by ECB staff macroeconomic projections, published in March and September since
September 2004. In order to facilitate a comparison with the SPF, the mid-point of the projection ranges in the Eurosystem staff
macroeconomic projections is considered for those periods where point estimates have not been published.
more emphasis on the post-crisis parameters (50%) and others freezing parameters to values
derived before the pre-crisis period (22%). Around one-third of respondents introduced more real
financial linkages to their models. Most forecasters (72%) reported that they use linear models,
while others explicitly allow for non-linearities such as those captured in structural breaks, the
zero lower bound for nominal interest rates or time-varying parameters.
The euro area forecasts are formed on the basis of data and models for the euro area as a whole,
but also on the basis of aggregating from bottom up the forecasts for individual countries
(mostly the largest euro area economies). The use of both practices is mentioned by some
respondents to be due to different practices for different variables, while others mention
using bottom-up approaches as a means of cross-checking results.
SPF participants were also asked how they generate their reported probability distributions
for HICP inflation, GDP growth and the unemployment rate. A large majority of respondents
(72% on average over all variables and horizons) said that these probability distributions are
estimated on the basis of judgement, while 14% generate them from models and 13% from
models with judgmental adjustments.3
Other variables and conditioning assumptions
With regard to other variables and conditioning assumptions, most respondents produce in-house
forecasts for oil prices, exchange rates, interest rates and wage growth. In-house forecasts of
oil prices are often complemented by market data, for example futures prices or averages of
recent spot prices. A few respondents reported that they use external forecasts to complement
and cross-check in-house forecasts for oil prices. In terms of other sources, a small number of
respondents use automatic rules (e.g. a random walk or they assume a constant rate of change in
oil prices).
In summary, these replies suggest that SPF responses can reflect a relatively diverse set of views
and assumptions but also indicate that the SPF responses are quite timely. In addition, although
both structural and time series models are widely used, judgement also plays a key role, in
particular for the reported probability distributions and, to an increasing extent, following the
financial crisis in 2008.
3 The high share of probabilities based at least partly on judgement might also be explained by the fact that, for the vast majority of
respondents (around 80%), they are computed exclusively for the purposes of the SPF.

61ECB
Monthly Bulletin
January 2014
Fifteen years of the
ECB survey of
professional
forecasters
ARTICLES
GDP growth collected in the second and fourth quarters of each year.5 Performance is assessed
in terms of bias (as measured by the mean projection error) and the size of the projection errors
(as measured by the absolute mean squared error). The size of the forecasting errors could
be influenced by the particular vintage of data used to calculate the actual outcomes. Since
macroeconomic data can be revised after initial releases, real time data are used in the analysis.6
The table reports the mean error and the mean absolute error for HICP inflation and GDP
growth for the forecasts made in the period 2000-12. In order to avoid mixing projections with
different forecast horizons, the table distinguishes the forecasts made in the second quarter
from those made in the fourth quarter of each year. Considering first the results for inflation,
both SPF respondents and Eurosystem staff have tended to underestimate next year inflation in
particular (by an average of between 0.3 and 0.4 percentage point in each forecasting round).
The mean error statistics conceal large errors at individual points in time, both positive and negative,
as evidenced by the higher value of the mean absolute error statistics. As it is typically more difficult
to make accurate forecasts over longer periods, the mean absolute errors increase with the forecast
horizon and are higher for the forecast made in the second quarter than that in the fourth quarter.
Looking across projections, for the current year and for both forecasting rounds the mean absolute
errors are, on average, somewhat smaller in the projections by Eurosystem staff than in the SPF
forecasts. This slightly better performance might be due to, inter alia, the fact that the Eurosystem
projections benefit from one additional month of data, which is particularly advantageous when
5 The data collected in the SPF have normally been summarised by means of a simple average of point forecasts. The question arises
as to whether a different combination of SPF forecasts (principal components, trimmed means, performance-based weighting, etc.)
could deliver gains in terms of forecast accuracy. Evidence suggests that there is only a modest case for deviating from the simple
average as a means of better summarising the information collected in the SPF. For more details, see Genre, V., Kenny, G., Meyler,
A. and Timmermann, A., “Combining expert forecasts: Can anything beat the simple average?”, International Journal of Forecasting,
Vol. 29(1), 2013, pp. 108-121.
6 The vintage data used for inflation are for January of the following year, while for GDP the vintage data used are the third release of real
GDP growth. Revisions to historical data have been sizeable for real GDP growth and unemployment, but less so for HICP inflation. For
more details on revisions to GDP, see the article entitled “Revisions to GDP estimates in the euro area”, Monthly Bulletin, ECB, April 2009.
Forecasting errors in the Eurosystem staff macroeconomic projections and in the SPF forecasts
(percentage points)
Inflation Real GDP growthCurrent year Next year Current year Next year
Forecasts and projections made in the second quarter 1) Eurosystem staff projections
Mean error 0.0 0.4 -0.1 -0.9
Mean absolute error 0.1 0.8 0.5 1.7
SPF forecastsMean error 0.2 0.3 -0.2 -1.0
Mean absolute error 0.2 0.7 0.5 1.6
Forecasts and projections made in the fourth quarter 2)
Eurosystem staff projections Mean error 0.0 0.3 0.0 -0.6
Mean absolute error 0.0 0.5 0.1 1.0
SPF forecasts
Mean error 0.0 0.3 0.0 -0.7
Mean absolute error 0.1 0.7 0.1 1.2
Sources: ECB, Eurostat and ECB calculations.Notes: The mean error is the average difference between the realised and the forecast value and the mean absolute error is the average of the absolute errors. Forecast errors are computed for the first release of inflation data and for the third release of GDP growth data.1) Based on forecasts made from 2001 to 2012 for the current year, and from 2001 to 2011 for the next year.2) Based on forecasts made from 2000 to 2012 for the current year, and from 2000 to 2011 for the next year.
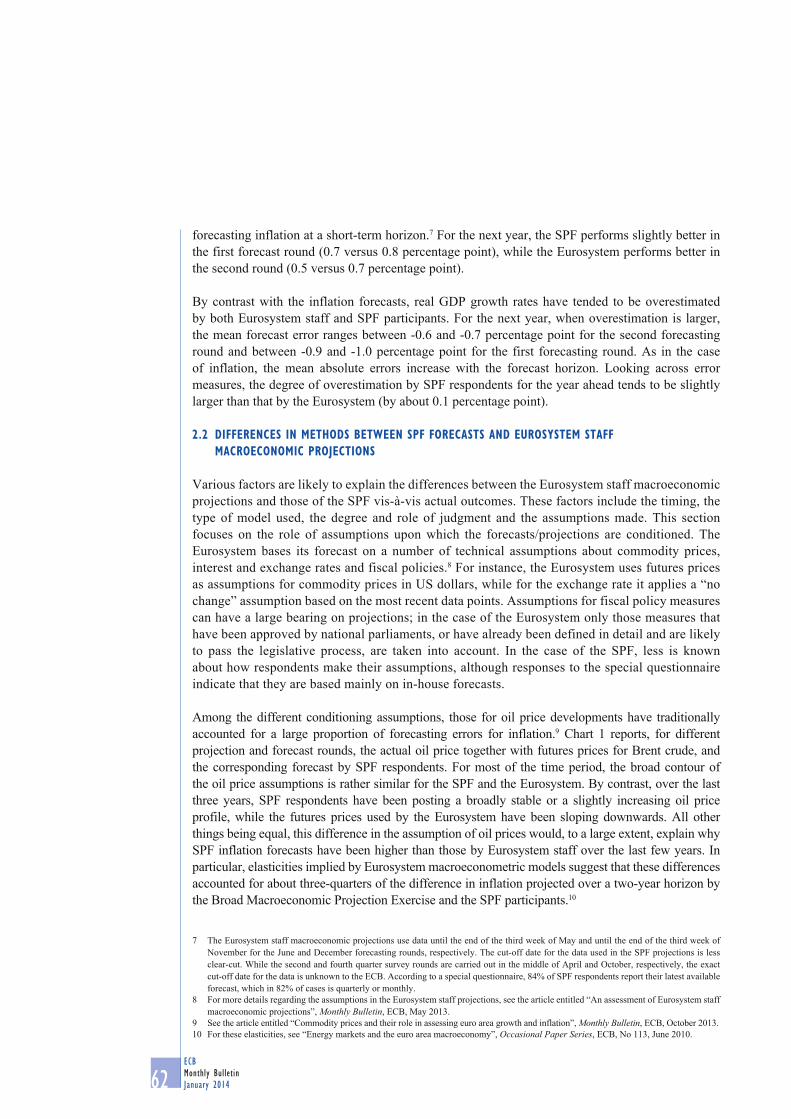
62ECB
Monthly Bulletin
January 2014
forecasting inflation at a short-term horizon.7 For the next year, the SPF performs slightly better in
the first forecast round (0.7 versus 0.8 percentage point), while the Eurosystem performs better in
the second round (0.5 versus 0.7 percentage point).
By contrast with the inflation forecasts, real GDP growth rates have tended to be overestimated
by both Eurosystem staff and SPF participants. For the next year, when overestimation is larger,
the mean forecast error ranges between -0.6 and -0.7 percentage point for the second forecasting
round and between -0.9 and -1.0 percentage point for the first forecasting round. As in the case
of inflation, the mean absolute errors increase with the forecast horizon. Looking across error
measures, the degree of overestimation by SPF respondents for the year ahead tends to be slightly
larger than that by the Eurosystem (by about 0.1 percentage point).
2.2 DIFFERENCES IN METHODS BETWEEN SPF FORECASTS AND EUROSYSTEM STAFF
MACROECONOMIC PROJECTIONS
Various factors are likely to explain the differences between the Eurosystem staff macroeconomic
projections and those of the SPF vis-à-vis actual outcomes. These factors include the timing, the
type of model used, the degree and role of judgment and the assumptions made. This section
focuses on the role of assumptions upon which the forecasts/projections are conditioned. The
Eurosystem bases its forecast on a number of technical assumptions about commodity prices,
interest and exchange rates and fiscal policies.8 For instance, the Eurosystem uses futures prices
as assumptions for commodity prices in US dollars, while for the exchange rate it applies a “no
change” assumption based on the most recent data points. Assumptions for fiscal policy measures
can have a large bearing on projections; in the case of the Eurosystem only those measures that
have been approved by national parliaments, or have already been defined in detail and are likely
to pass the legislative process, are taken into account. In the case of the SPF, less is known
about how respondents make their assumptions, although responses to the special questionnaire
indicate that they are based mainly on in-house forecasts.
Among the different conditioning assumptions, those for oil price developments have traditionally
accounted for a large proportion of forecasting errors for inflation.9 Chart 1 reports, for different
projection and forecast rounds, the actual oil price together with futures prices for Brent crude, and
the corresponding forecast by SPF respondents. For most of the time period, the broad contour of
the oil price assumptions is rather similar for the SPF and the Eurosystem. By contrast, over the last
three years, SPF respondents have been posting a broadly stable or a slightly increasing oil price
profile, while the futures prices used by the Eurosystem have been sloping downwards. All other
things being equal, this difference in the assumption of oil prices would, to a large extent, explain why
SPF inflation forecasts have been higher than those by Eurosystem staff over the last few years. In
particular, elasticities implied by Eurosystem macroeconometric models suggest that these differences
accounted for about three-quarters of the difference in inflation projected over a two-year horizon by
the Broad Macroeconomic Projection Exercise and the SPF participants.10
7 The Eurosystem staff macroeconomic projections use data until the end of the third week of May and until the end of the third week of
November for the June and December forecasting rounds, respectively. The cut-off date for the data used in the SPF projections is less
clear-cut. While the second and fourth quarter survey rounds are carried out in the middle of April and October, respectively, the exact
cut-off date for the data is unknown to the ECB. According to a special questionnaire, 84% of SPF respondents report their latest available
forecast, which in 82% of cases is quarterly or monthly.
8 For more details regarding the assumptions in the Eurosystem staff projections, see the article entitled “An assessment of Eurosystem staff
macroeconomic projections”, Monthly Bulletin, ECB, May 2013.
9 See the article entitled “Commodity prices and their role in assessing euro area growth and inflation”, Monthly Bulletin, ECB, October 2013.
10 For these elasticities, see “Energy markets and the euro area macroeconomy”, Occasional Paper Series, ECB, No 113, June 2010.
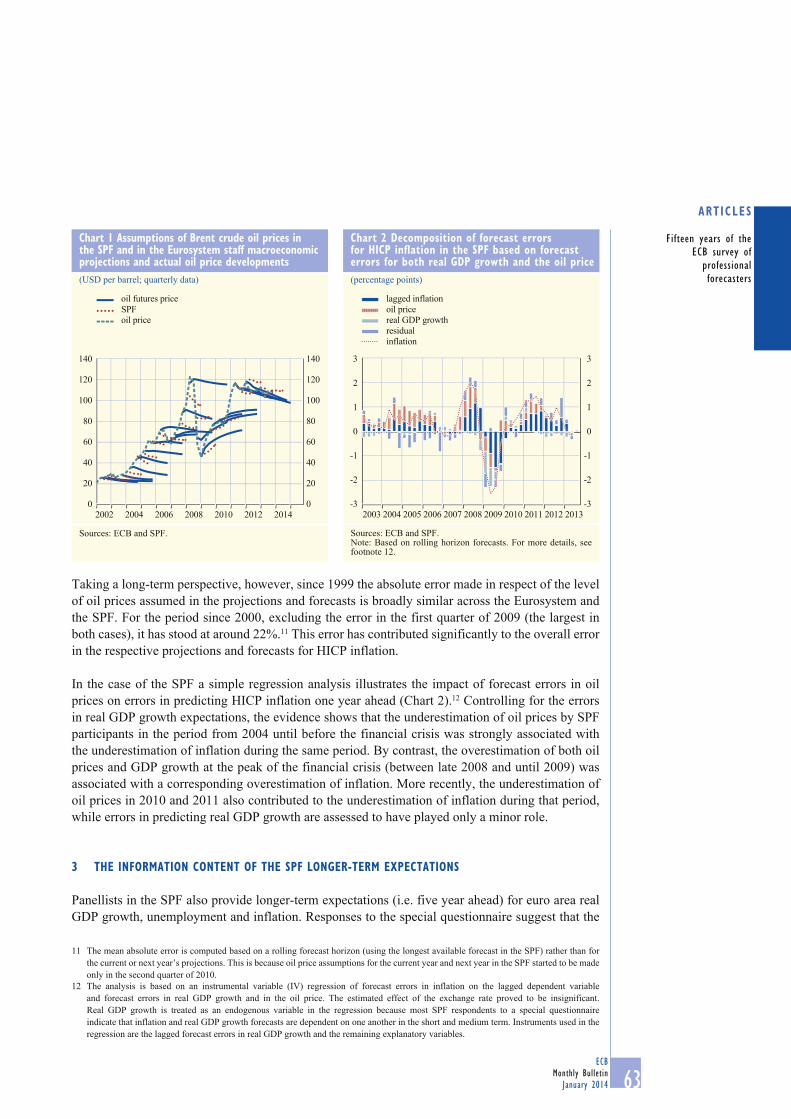
63ECB
Monthly Bulletin
January 2014
Fifteen years of the
ECB survey of
professional
forecasters
ARTICLES
Taking a long-term perspective, however, since 1999 the absolute error made in respect of the level
of oil prices assumed in the projections and forecasts is broadly similar across the Eurosystem and
the SPF. For the period since 2000, excluding the error in the first quarter of 2009 (the largest in
both cases), it has stood at around 22%.11 This error has contributed significantly to the overall error
in the respective projections and forecasts for HICP inflation.
In the case of the SPF a simple regression analysis illustrates the impact of forecast errors in oil
prices on errors in predicting HICP inflation one year ahead (Chart 2).12 Controlling for the errors
in real GDP growth expectations, the evidence shows that the underestimation of oil prices by SPF
participants in the period from 2004 until before the financial crisis was strongly associated with
the underestimation of inflation during the same period. By contrast, the overestimation of both oil
prices and GDP growth at the peak of the financial crisis (between late 2008 and until 2009) was
associated with a corresponding overestimation of inflation. More recently, the underestimation of
oil prices in 2010 and 2011 also contributed to the underestimation of inflation during that period,
while errors in predicting real GDP growth are assessed to have played only a minor role.
3 THE INFORMATION CONTENT OF THE SPF LONGER-TERM EXPECTATIONS
Panellists in the SPF also provide longer-term expectations (i.e. five year ahead) for euro area real
GDP growth, unemployment and inflation. Responses to the special questionnaire suggest that the
11 The mean absolute error is computed based on a rolling forecast horizon (using the longest available forecast in the SPF) rather than for
the current or next year’s projections. This is because oil price assumptions for the current year and next year in the SPF started to be made
only in the second quarter of 2010.
12 The analysis is based on an instrumental variable (IV) regression of forecast errors in inflation on the lagged dependent variable
and forecast errors in real GDP growth and in the oil price. The estimated effect of the exchange rate proved to be insignificant.
Real GDP growth is treated as an endogenous variable in the regression because most SPF respondents to a special questionnaire
indicate that inflation and real GDP growth forecasts are dependent on one another in the short and medium term. Instruments used in the
regression are the lagged forecast errors in real GDP growth and the remaining explanatory variables.
Chart 1 Assumptions of Brent crude oil prices in the SPF and in the Eurosystem staff macroeconomic projections and actual oil price developments
(USD per barrel; quarterly data)
0
20
40
60
80
100
120
140
0
20
40
60
80
100
120
140
2002 2004 2006 2008 2010 2012 2014
oil futures price
SPF
oil price
Sources: ECB and SPF.
Chart 2 Decomposition of forecast errors for HICP inflation in the SPF based on forecast errors for both real GDP growth and the oil price
(percentage points)
-3
-2
-1
0
1
2
3
-3
-2
-1
0
1
2
3
2003 2005 2007 2009 2011 20132004 2006 2008 2010 2012
lagged inflation
oil price
real GDP growth
residual
inflation
Sources: ECB and SPF.Note: Based on rolling horizon forecasts. For more details, see footnote 12.

64ECB
Monthly Bulletin
January 2014
longer-term expectations for real GDP growth can be interpreted as the rate of growth of potential
output (68% of respondents) and those for unemployment as the Non-Accelerating Inflation Rate
of Unemployment – NAIRU (53%). At the same time, longer-term inflation expectations may help
to assess the ECB’s credibility in terms of maintaining its objective of price stability. Respondents
stress that these expectations are determined mainly by the ECB’s price stability objective of below
but close to 2% (81% of respondents) and past inflation trends (54% of respondents).
Longer-term GDP growth expectations in the SPF declined steadily from 2.6% at the
beginning of the sample to 1.7% in the fourth quarter of 2013. The real-time forecasts by
international organisations of potential output growth five years ahead display a similarly broad
downward trend over the past decade, but have been consistently below SPF expectations over this
period. If anything, the gap between the two sets of series appears to have widened over the last few
years (Chart 3).
In the case of long-term unemployment, SPF expectations increased slightly between 2002 and the
first half of 2005, then declined and reached a minimum of 6.5% in 2007. Subsequently, expectations
increased gradually to stand at around 9½% in the fourth quarter of 2013 (Chart 4). Compared
with the real-time forecasts by international organisations for the NAIRU five years ahead, the
SPF expectations have tended to stand at the lower end, and for the period since 2008 in particular
the long-term forecasts for the NAIRU estimates have increased more strongly than the SPF
expectations, especially in the case of the European Commission.13 The recently lower long-term
13 In the case of the ECB SPF, it has been found that revisions to longer-term unemployment expectations are driven largely by revisions in
the short-term unemployment outlook, suggesting that respondents perceive a high degree of hysteresis in unemployment data. See Bowles,
C., Friz, R., Genre, V., Kenny, G., Meyler, A. and Rautanen, T., “The ECB survey of professional forecasters (SPF) – A review after eight
years’ experience”, Occasional Paper Series, No 59, ECB, April 2007.
Chart 3 Long-term real GDP growth expectations by the SPF and long-term estimates of potential output growth by international organisations
(percentages)
0.5
1.0
1.5
2.0
2.5
1.0
1.5
2.0
2.5
0.5
European Commission
IMF
SPF
2002 2004 2006 2008 2010 2012
Sources: European Commission, IMF and SPF.Notes: For the European Commission and the IMF, data refer to the autumn forecast. For the SPF, data refer to the fourth quarter round. The EC figure for 2006 has been constructed using national figures (12 countries) weighted by the GDP shares of 2005.
Chart 4 Long-term unemployment expectations by the SPF and long-term NAIRU estimates by international organisations
(percentages)
6
7
8
9
10
11
12
6
7
8
9
10
11
12
2002 2004 2006 2008 2010 2012
European Commission
IMF
SPF
Sources: European Commission, IMF and SPF.Notes: For the European Commission and the IMF, data refer to the autumn forecast. For the SPF, data refer to the fourth quarter round. The EC figure for 2006 has been constructed using national figures (12 countries) weighted by the GDP shares of 2005.
65ECB
Monthly Bulletin
January 2014
Fifteen years of the
ECB survey of
professional
forecasters
ARTICLES
unemployment expectations in the SPF compared with forecasts by international organisations are
qualitatively consistent with the higher long-term real GDP growth expectations in the SPF.
Long-term inflation expectations in the SPF have remained quite stable over recent years.
The average five-year ahead expectation has remained between around 1.9% and 2.0%, with the
median remaining even more stable. At the same time, headline HICP inflation has been subject
to fairly large fluctuations. SPF data available since the start of EMU point to a relatively weak
link between long-term inflation expectations surveyed in a particular quarter and the latest actual
inflation rate known at the time of the survey. However, the link is stronger between long-term
inflation expectations and longer-term moving averages of past inflation. It is particularly high
for the cumulative average of annual inflation rates calculated for each quarter in the period from
the first quarter of 1999. The cumulative average inflation rate can be seen as a proxy for the
track record, and the resulting credibility, of the ECB’s monetary policy in terms of the inflation
outcome.14
Overall, the analysis of long-term expectations suggests that they provide important information
on how firmly anchored expectations are around the ECB’s objective of price stability and how
forecasters perceive the evolution of the euro area’s longer-term growth potential.
4 REVIEWING PROFESSIONAL FORECASTERS’ ASSESSMENT OF UNCERTAINTY SURROUNDING
THEIR FORECASTS
Since the start of the financial crisis in 2008, the macroeconomic outlook has been characterised
by greater than normal uncertainty. Whilst it is generally accepted that uncertainty has increased,
there is no agreed metric to indicate by how much. An assessment of the degree of uncertainty is
important, as it is likely to have an impact on corporate investment and household saving decisions.15
An important feature of the ECB SPF is that it provides an insight into respondents’ assessments of
the degree of uncertainty surrounding their forecasts. More specifically, SPF participants are asked
to assign a probability distribution to their forecasts.16 Although the ECB SPF provides several
dimensions for measuring forecast uncertainty, this section extracts information on uncertainty from
(i) disagreement and (ii) probabilities, with the focus on aggregate uncertainty and more specifically
on the standard deviation of the probability distribution aggregated across all respondents.17 In the
absence of a direct measure of uncertainty, disagreement has often been used as a proxy variable.
However, it does not appear to be a good proxy for overall macroeconomic uncertainty. In the case
of the ECB SPF, across all macroeconomic variables and horizons, the spread of individual point
14 See the box entitled “The anchoring of long-term inflation expectations”, Monthly Bulletin, ECB, October 2013.
15 For a discussion on the evolution of various measures of uncertainty and their potential implications for the macroeconomic outlook,
see the box entitled “Measuring perceptions of macroeconomic uncertainty”, Monthly Bulletin, ECB, January 2010, and the box entitled
“How has macroeconomic uncertainty in the euro area evolved recently?”, Monthly Bulletin, ECB, Oct. 2013.
16 This distribution provides information about the probability, expressed as a percentage, of the future outcome being within a specific
range. The probability distribution resulting from the aggregation of responses also helps to assess how, on average, survey participants
gauge the risk of the actual outcome being above or below the most likely range.
17 Calculating the standard deviation of the SPF distributions is somewhat problematic in practice as respondents attach probabilities to
specific ranges. We present the approach that assumes that all the probability for a given range relates to the mid-point of that range.
Although this may shift the estimated standard deviation upwards, as it is more likely that more of the probability within a range is
located closer to the centre of the distribution than further away, other methods, which include fitting functional forms such as normal,
skew-normal or beta distributions, are not without their drawbacks either, particularly at the individual level.

66ECB
Monthly Bulletin
January 2014
forecasts has rarely been wide enough to encompass the actual outcome.18 Aggregate uncertainty
combines information on disagreement between (standard deviation of) individual point forecasts
and forecasters’ individual assessments of uncertainty (average individual uncertainty) measured
by the average of standard deviations of the probability distributions reported by each forecaster.19
Uncertainty can normally be expected to increase over the different forecast horizons requested
from SPF participants (i.e. next calendar year, one year ahead, calendar year after next, two
years ahead and five calendar years ahead). Chart 5 shows values for this term structure for two
sub-periods: pre-crisis (1999-2008) and post-crisis (2009-2013). There are a couple of noteworthy
features. First, although uncertainty generally increases as the forecast horizon increases, the
upward slope is relatively flat for HICP inflation and particularly for GDP growth, while it is
steeper for unemployment. Whereas longer-term expectations of inflation and GDP growth may
be anchored by monetary policy and potential growth respectively, longer-term unemployment
expectations tend to be linked to the NAIRU, which may vary substantially over time, as seen in the
previous section. Second, there has been a clear upward shift in the perceived degree of uncertainty
surrounding macroeconomic forecasts since the economic crisis began. For each variable and
forecast horizon, aggregate uncertainty has shifted upwards for the post-crisis period.
The increase in perceived uncertainty is broadly consistent with other indicators of macroeconomic
uncertainty. There has been a significant degree of co-movement with other macroeconomic
indicators of uncertainty, such as stock and bond market volatility and sentiment surveys.
Chart 6 reports the uncertainty measure for two-year ahead outcomes (unweighted average of the
uncertainty measure for HICP inflation, real GDP growth and unemployment rate forecasts), as this
is probably the forecast horizon closest to the horizons implied by the medium-term orientation of
monetary policy. This co-movement indicates that measures of uncertainty derived from the SPF may
be useful complements to financial indicators measuring the direction of movement of uncertainty.
Overall, since early 2008, all measures of forecast uncertainty from the ECB SPF have risen for
all variables across all horizons. Although some of this increase has since unwound, uncertainty
remains fairly elevated when compared with financial market indicators. This suggests that,
while perceptions of market-specific risks may have eased, perceptions of overall macroeconomic
risks have remained elevated according to forecasters.
However, in this regard, unlike for point forecasts, there is no directly observable benchmark for
forecast probabilities that could facilitate a test of how closely they correspond to the true density of
the variable under consideration. Nonetheless, there is indirect evidence that ECB SPF forecasters,
in common with many macroeconomic forecasters, appear generally to have underestimated
uncertainty over the last decade.20 Evidence from the US SPF suggests that these forecasters also
tend to be over-confident regarding the uncertainty surrounding their forecasts.21 In this regard,
it may also be that the ongoing elevated perceptions of risk depicted in Chart 6 merely reflect
the adoption of a more realistic assessment of macroeconomic uncertainty compared with before,
rather than an actual increase in the underlying degree of uncertainty.
18 D’Amico and Orphanides also suggest that disagreement may be a weak proxy for forecast uncertainty. See D’Amico, S. and Orphanides,
A., “Uncertainty and Disagreement in Economic Forecasting”, Finance and Economics Discussion Series, No 2008-56, Board of
Governors of the US Federal Reserve System, 2008.
19 Other higher moments of the aggregate distribution that might provide information on the balance of risks or tail risk events, in particular
the skew and kurtosis, are not considered here. See Kenny, G., Kostka, T and Masera, F., “How informative are the subjective density
forecasts of macroeconomists?”, Working Paper Series, No 1446, ECB, July 2012.
20 See Bowles et al. (2010) “An Evaluation of the Growth and Unemployment Forecasts in the ECB Survey of Professional Forecasters”,
OECD Journal: Journal of Business Cycle Measurement and Analysis, Vol. 2010/2.
21 See Clements, M.P., “Subjective and Ex Post Forecast Uncertainty: US Inflation and Output Growth”, The Warwick Economics Research
Paper Series (TWERPS), No 995, September 2012.

67ECB
Monthly Bulletin
January 2014
Fifteen years of the
ECB survey of
professional
forecasters
ARTICLES
5 CONCLUSION
In line with the importance of expectations for
the economy, the ECB Survey of Professional
Forecasters gathers information on the private
sector’s short to medium-term outlook. The
survey has provided very useful services to
policy-makers in their assessment of risks to price
stability, providing a rich source of information
on the outlook for euro area macroeconomic
developments and the uncertainty surrounding
these developments. In this respect, the SPF has
offered a useful comparator to the Eurosystem
staff macroeconomic projections in terms of
point forecasts. In addition, the longer-term
GDP growth, unemployment and inflation
expectations in the SPF have provided a useful
insight into the broad forces underlying the
long-term dynamics of the euro area and the
credibility of the ECB’s monetary policy with
regard to its price stability objective. Finally, the
SPF has provided information on professional
forecasters’ assessments of the uncertainty
surrounding their forecasts, which can be
considered a key value added of the SPF.
Chart 5 Term structure of macroeconomic uncertainty according to SPF respondents
average (1999-2008)
average (2009-2013)
a) HICP inflation(annual percentage change)
0.3
0.4
0.5
0.6
0.7
0.8
0.9
1.0
1.1
1.2
1.3
0.3
0.4
0.5
0.6
0.7
0.8
0.9
1.0
1.1
1.2
1.3
next
calendar
year
one
year
ahead
calendar
year
after next
two
years
ahead
five
calendar years
ahead
b) GDP growth(annual percentage change)
0.3
0.4
0.5
0.6
0.7
0.8
0.9
1.0
1.1
1.2
1.3
0.3
0.4
0.5
0.6
0.7
0.8
0.9
1.0
1.1
1.2
1.3
next
calendar
year
one
year
ahead
calendar
year
after next
two
years
ahead
five
calendar years
ahead
c) Unemployment rate(percentages)
0.3
0.4
0.5
0.6
0.7
0.8
0.9
1.0
1.1
1.2
1.3
0.3
0.4
0.5
0.6
0.7
0.8
0.9
1.0
1.1
1.2
1.3
next
calendar
year
one
year
ahead
calendar
year
after next
two
years
ahead
five
calendar years
ahead
Sources: SPF and ECB calculations.Notes: The charts show the average dispersion (as measured by the standard) of aggregated SPF probability distributions. The shaded areas illustrate the variation about the average and represent plus and minus one standard deviation from the average observed over each period. The x-axis denotes the horizon. Note that the current calendar year horizon is not reported as it is strongly impacted by seasonality in terms of how many months remain when the round is conducted.
Chart 6 Cross-checking against other selected indicators of macroeconomic uncertainty
0.4
0.5
0.6
0.7
0.8
0.9
1.0
0
15
30
45
60
75
90
20132011200920072005200320011999
implied stock market volatility
implied bond volatility
economic sentiment indicator
SPF two-year ahead uncertainty (right-hand scale)
Sources: Bloomberg, European Commission, SPF and ECB calculations.Note: Economic sentiment indicator is inverted and rescaled.

69ECB
Monthly BulletinJanuary 2014
Recent developments in excess liquidity and
money market rates
articles
Since the introduction of tender operations with fixed rate full allotments in October 2008, euro area banks have been operating in an environment of excess liquidity, which reached a peak in March 2012, following the allotment of the two three-year long-term refinancing operations (LTROs). As of early 2013, banks have had the option of repaying the three-year LTROs funds on a weekly basis, which, in turn, has led to a substantial decline in the level of excess liquidity. The purpose of this article is to explore the reasons behind the trend in excess liquidity and assess its impact on money market rates. Several conclusions can be drawn from this analysis. First, the progressive decline in excess liquidity stemming from the voluntary repayment of the three-year LTROs was mainly the result of improved market access for euro area banks. The fall in demand for excess liquidity is expected to continue throughout 2014, ceteris paribus, as the residual maturity of the three-year refinancing operations shrinks to below one year and autonomous liquidity factors continue to increase banks’ liquidity needs. Second, at the current level of excess liquidity, money market rates have largely remained stable, although autonomous liquidity factors and calendar effects have caused short-term volatility. Third, the anticipation of future money market rates becomes more challenging in an environment in which the stock of excess liquidity may become too low to anchor overnight market rates to the deposit facility rate but not low enough for the rates to draw closer to the Eurosystem’s main refinancing rate.
1 IntroductIon
The liquidity management framework of the Eurosystem was developed around the concept of neutral liquidity allotments, which endeavoured to create balanced liquidity conditions in the money market and allowed the ECB to steer very short-term interest rates close to the minimum bid rate of its main refinancing operations. However, after introducing tender operations with fixed rate full allotments in October 2008 and, in particular, following the two three-year operations in December 2011 and February 2012, the euro area banking system experienced very ample liquidity conditions. On 5 March 2012, excess liquidity (defined as deposits at the deposit facility net of the recourse to the marginal lending facility, plus current account holdings in excess of those contributing to the minimum reserve requirements) reached a peak of €812 billion. Since January 2013, however, the banking system has experienced a progressive decline in excess liquidity, as banks have been increasingly exercising the early repayment option embedded in these operations.
This article examines money market rates and expectations about future short-term rates in the context of declining excess liquidity and changing market conditions. As a result, it provides important insight into the challenges that could arise were there to be a further decline in excess liquidity. This article reviews liquidity and market developments up to 10 December 2013, which is the last day of the 11th maintenance period in 2013. More specifically, Section 2 of this article describes recent liquidity trends, analysing the main changes to the Eurosystem’s liquidity provision framework that were introduced during the financial crisis. Further, it elaborates on the factors associated with the overall decline in the outstanding amount of the Eurosystem’s refinancing operations. Section 3 explores a number of factors determining banks’ potential demand for excess liquidity in the future, explaining the behaviour of autonomous factors based on both historical trends and seasonal patterns. Section 4 analyses the impact of developments in excess liquidity on money market rates. It reviews the transmission mechanism of excess liquidity to money markets based on the historical relationship between overnight interest rates and excess liquidity. Following this, it investigates the impact of excess liquidity and volatility in short-term rates on expectations about future money market rates. Section 5 concludes by discussing some of the anticipated challenges associated with a gradual normalisation of money markets and the resulting decline in excess liquidity.
recent developments In excess lIquIdIty and money market rates
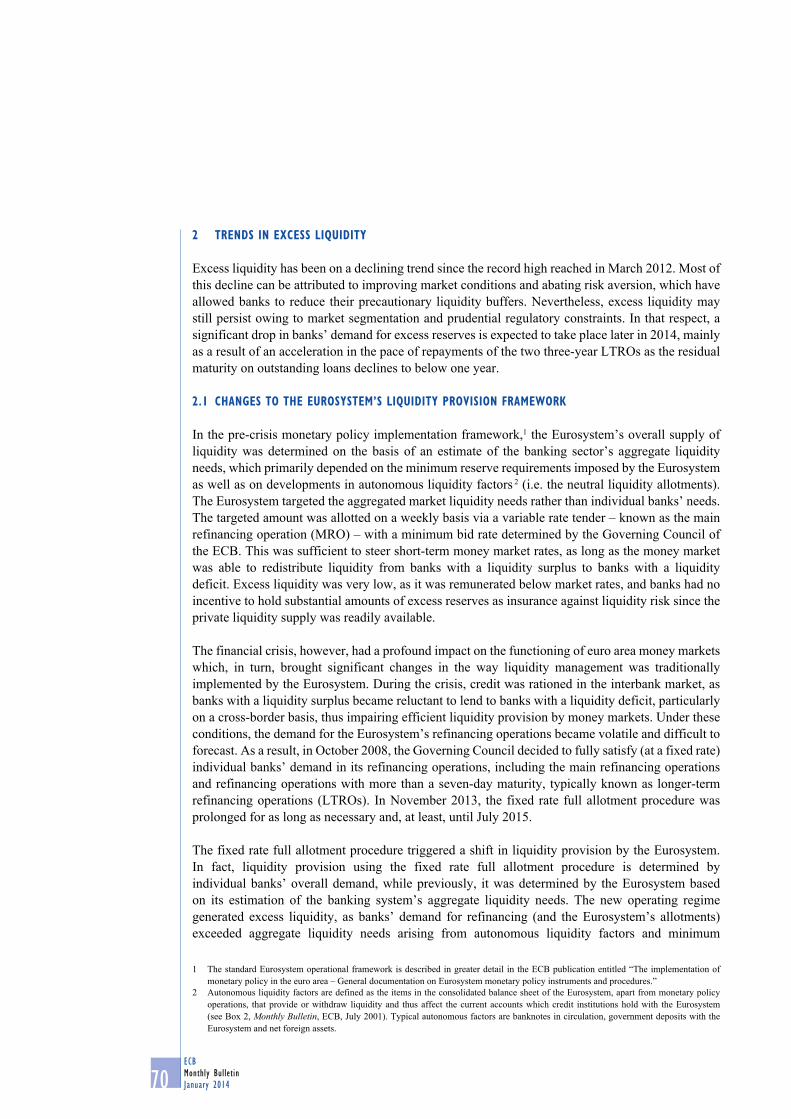
70ECBMonthly BulletinJanuary 2014
2 trends In excess lIquIdIty
Excess liquidity has been on a declining trend since the record high reached in March 2012. Most of this decline can be attributed to improving market conditions and abating risk aversion, which have allowed banks to reduce their precautionary liquidity buffers. Nevertheless, excess liquidity may still persist owing to market segmentation and prudential regulatory constraints. In that respect, a significant drop in banks’ demand for excess reserves is expected to take place later in 2014, mainly as a result of an acceleration in the pace of repayments of the two three-year LTROs as the residual maturity on outstanding loans declines to below one year.
2.1 changes to the eurosystem’s lIquIdIty provIsIon framework
In the pre-crisis monetary policy implementation framework,1 the Eurosystem’s overall supply of liquidity was determined on the basis of an estimate of the banking sector’s aggregate liquidity needs, which primarily depended on the minimum reserve requirements imposed by the Eurosystem as well as on developments in autonomous liquidity factors 2 (i.e. the neutral liquidity allotments). The Eurosystem targeted the aggregated market liquidity needs rather than individual banks’ needs. The targeted amount was allotted on a weekly basis via a variable rate tender – known as the main refinancing operation (MRO) – with a minimum bid rate determined by the Governing Council of the ECB. This was sufficient to steer short-term money market rates, as long as the money market was able to redistribute liquidity from banks with a liquidity surplus to banks with a liquidity deficit. Excess liquidity was very low, as it was remunerated below market rates, and banks had no incentive to hold substantial amounts of excess reserves as insurance against liquidity risk since the private liquidity supply was readily available.
The financial crisis, however, had a profound impact on the functioning of euro area money markets which, in turn, brought significant changes in the way liquidity management was traditionally implemented by the Eurosystem. During the crisis, credit was rationed in the interbank market, as banks with a liquidity surplus became reluctant to lend to banks with a liquidity deficit, particularly on a cross-border basis, thus impairing efficient liquidity provision by money markets. Under these conditions, the demand for the Eurosystem’s refinancing operations became volatile and difficult to forecast. As a result, in October 2008, the Governing Council decided to fully satisfy (at a fixed rate) individual banks’ demand in its refinancing operations, including the main refinancing operations and refinancing operations with more than a seven-day maturity, typically known as longer-term refinancing operations (LTROs). In November 2013, the fixed rate full allotment procedure was prolonged for as long as necessary and, at least, until July 2015.
The fixed rate full allotment procedure triggered a shift in liquidity provision by the Eurosystem. In fact, liquidity provision using the fixed rate full allotment procedure is determined by individual banks’ overall demand, while previously, it was determined by the Eurosystem based on its estimation of the banking system’s aggregate liquidity needs. The new operating regime generated excess liquidity, as banks’ demand for refinancing (and the Eurosystem’s allotments) exceeded aggregate liquidity needs arising from autonomous liquidity factors and minimum
1 The standard Eurosystem operational framework is described in greater detail in the ECB publication entitled “The implementation of monetary policy in the euro area – General documentation on Eurosystem monetary policy instruments and procedures.”
2 Autonomous liquidity factors are defined as the items in the consolidated balance sheet of the Eurosystem, apart from monetary policy operations, that provide or withdraw liquidity and thus affect the current accounts which credit institutions hold with the Eurosystem (see Box 2, Monthly Bulletin, ECB, July 2001). Typical autonomous factors are banknotes in circulation, government deposits with the Eurosystem and net foreign assets.

71ECB
Monthly Bulletin
January 2014
Recent developments
in excess liquidity and
money market rates
ARTICLES
reserve requirements. Banks voluntarily requested more liquidity than necessary as insurance
against possible difficulties in accessing the money market at a reasonable cost. Chart 1 shows
the liquidity needs arising from autonomous factors and minimum reserve requirements as well
as excess liquidity. Excess liquidity was low under the neutral liquidity allotment procedure and
increased once the fixed rate full allotment procedure was introduced. The largest increase in the
amount of excess liquidity, however, took place after the allotment of the two three-year LTROs
in December 2011 and February 2012. The high demand in the two three-year operations was
driven, on the one hand, by genuine funding needs (see Box 1) and, on the other, by the intention
to accumulate precautionary liquidity buffers, which resulted in a surge in the amount of excess
liquidity to exceptionally high levels.
2.2 RECENT TRENDS IN EXCESS LIQUIDITY
Banks’ demands for refinancing declined soon after excess liquidity reached its historical peak in
March 2012 in several ways. First, the demand for regular refinancing operations declined, while
the liquidity needs, on account of autonomous liquidity factors, continued to increase. Second,
since January 2013, banks have actively used the opportunity offered in the terms of the three-year
LTROs to repay the funds allotted early. From December 2012 to November 2013, excess liquidity,
on a maintenance-period average, declined by €452 billion to €168 billion. Approximately 89% of
this reduction, or €400 billion, is due to a decline in the recourse to the Eurosystem’s refinancing
operations, including €384 billion for three-year LTRO repayments. The remaining decline is due
to an increase in autonomous liquidity factors by €52.3 billion (see Chart 2). The excess liquidity
provided by other Eurosystem operations and facilities has also dropped by €16.3 billion since
December 2012.
Chart 1 Liquidity needs and excess liquidity since 2008
(EUR billions)
0
200
400
600
800
1,000
1,200
1,400
Fixed rate full allotmentNeutral
liquidity
allotment
0
200
400
600
800
1,000
1,200
1,400
excess liquidity
net autonomous factors
reserve requirements
Q1 Q2 Q3 Q4 Q1 Q2 Q3 Q4 Q1 Q2 Q3 Q4 Q1 Q2 Q3 Q4 Q1 Q2 Q3 Q4 Q1 Q2 Q32008 2009 2010 2011 2012 2013
Source: ECB.
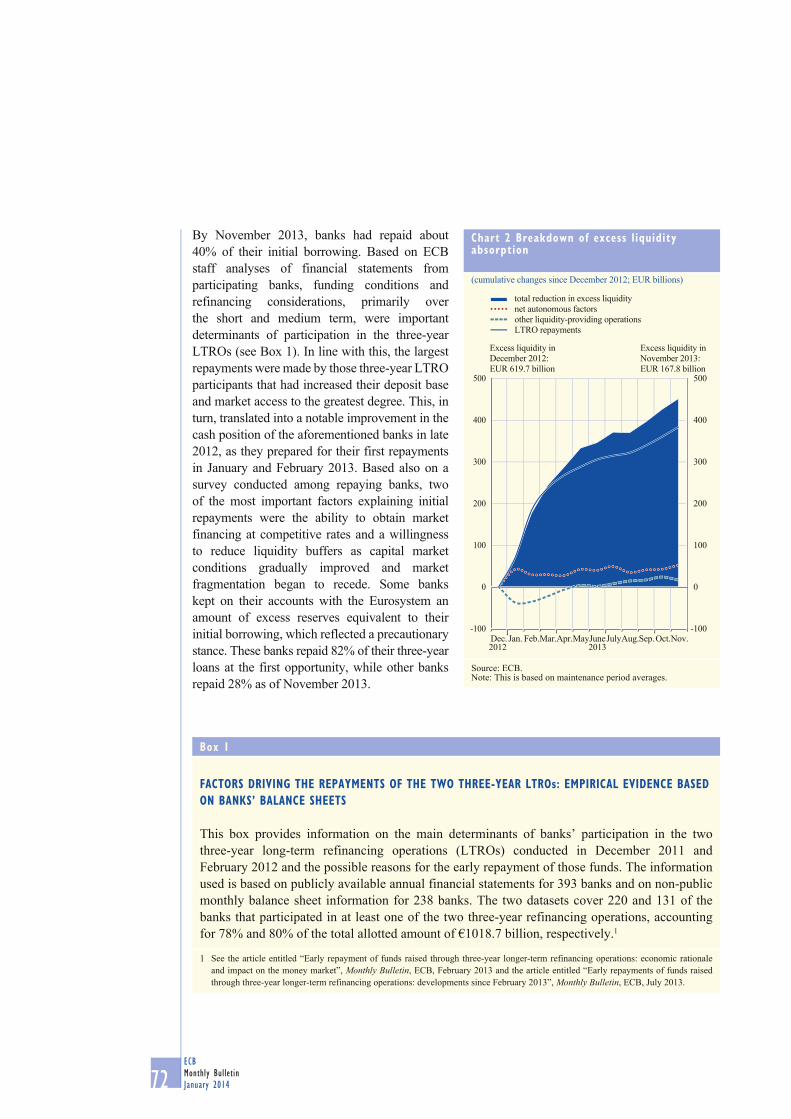
72ECB
Monthly Bulletin
January 2014
By November 2013, banks had repaid about
40% of their initial borrowing. Based on ECB
staff analyses of financial statements from
participating banks, funding conditions and
refinancing considerations, primarily over
the short and medium term, were important
determinants of participation in the three-year
LTROs (see Box 1). In line with this, the largest
repayments were made by those three-year LTRO
participants that had increased their deposit base
and market access to the greatest degree. This, in
turn, translated into a notable improvement in the
cash position of the aforementioned banks in late
2012, as they prepared for their first repayments
in January and February 2013. Based also on a
survey conducted among repaying banks, two
of the most important factors explaining initial
repayments were the ability to obtain market
financing at competitive rates and a willingness
to reduce liquidity buffers as capital market
conditions gradually improved and market
fragmentation began to recede. Some banks
kept on their accounts with the Eurosystem an
amount of excess reserves equivalent to their
initial borrowing, which reflected a precautionary
stance. These banks repaid 82% of their three-year
loans at the first opportunity, while other banks
repaid 28% as of November 2013.
Chart 2 Breakdown of excess liquidity absorption
(cumulative changes since December 2012; EUR billions)
-100
0
100
200
300
400
500
-100
0
100
200
300
400
500
total reduction in excess liquidity
net autonomous factors
other liquidity-providing operations
LTRO repayments
Excess liquidity in
November 2013:
EUR 167.8 billion
Excess liquidity in
December 2012:
EUR 619.7 billion
Dec. Jan. Feb.Mar.Apr.MayJuneJulyAug.Sep.Oct.Nov.2012 2013
Source: ECB.Note: This is based on maintenance period averages.
Box 1
FACTORS DRIVING THE REPAYMENTS OF THE TWO THREE-YEAR LTROs: EMPIRICAL EVIDENCE BASED
ON BANKS’ BALANCE SHEETS
This box provides information on the main determinants of banks’ participation in the two
three-year long-term refinancing operations (LTROs) conducted in December 2011 and
February 2012 and the possible reasons for the early repayment of those funds. The information
used is based on publicly available annual financial statements for 393 banks and on non-public
monthly balance sheet information for 238 banks. The two datasets cover 220 and 131 of the
banks that participated in at least one of the two three-year refinancing operations, accounting
for 78% and 80% of the total allotted amount of €1018.7 billion, respectively.1
1 See the article entitled “Early repayment of funds raised through three-year longer-term refinancing operations: economic rationale
and impact on the money market”, Monthly Bulletin, ECB, February 2013 and the article entitled “Early repayments of funds raised
through three-year longer-term refinancing operations: developments since February 2013”, Monthly Bulletin, ECB, July 2013.
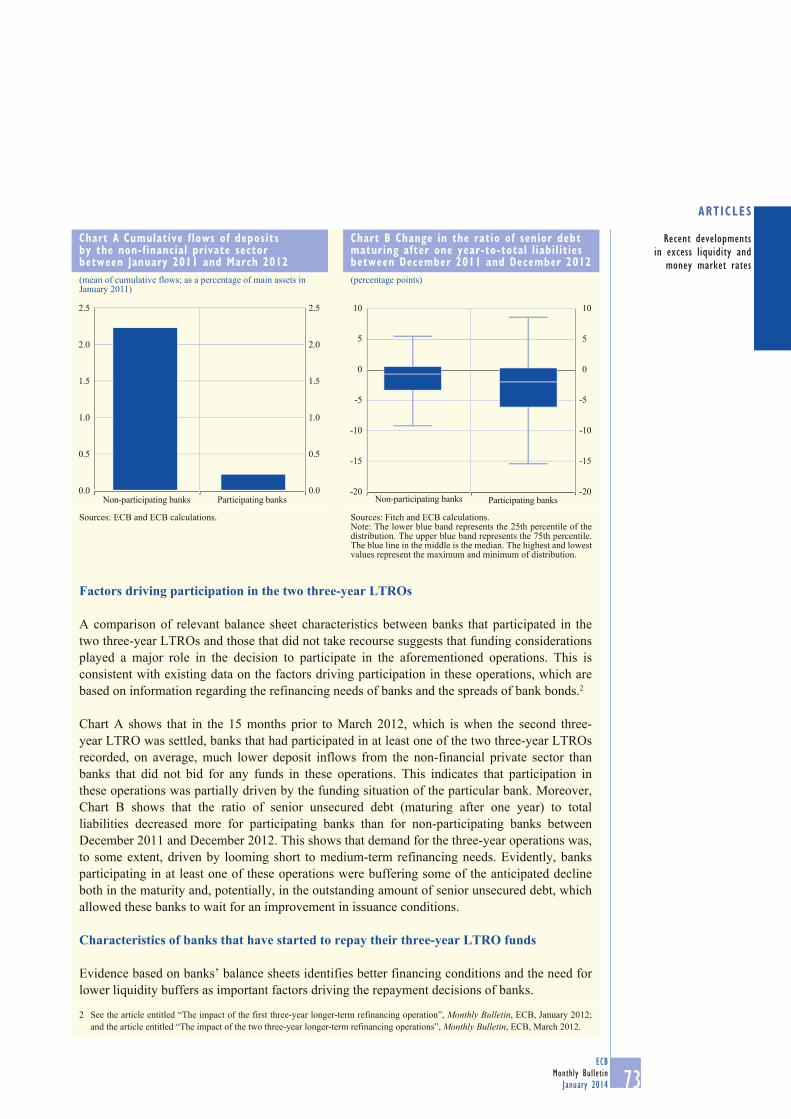
73ECB
Monthly Bulletin
January 2014
Recent developments
in excess liquidity and
money market rates
ARTICLES
Factors driving participation in the two three-year LTROs
A comparison of relevant balance sheet characteristics between banks that participated in the
two three-year LTROs and those that did not take recourse suggests that funding considerations
played a major role in the decision to participate in the aforementioned operations. This is
consistent with existing data on the factors driving participation in these operations, which are
based on information regarding the refinancing needs of banks and the spreads of bank bonds.2
Chart A shows that in the 15 months prior to March 2012, which is when the second three-
year LTRO was settled, banks that had participated in at least one of the two three-year LTROs
recorded, on average, much lower deposit inflows from the non-financial private sector than
banks that did not bid for any funds in these operations. This indicates that participation in
these operations was partially driven by the funding situation of the particular bank. Moreover,
Chart B shows that the ratio of senior unsecured debt (maturing after one year) to total
liabilities decreased more for participating banks than for non-participating banks between
December 2011 and December 2012. This shows that demand for the three-year operations was,
to some extent, driven by looming short to medium-term refinancing needs. Evidently, banks
participating in at least one of these operations were buffering some of the anticipated decline
both in the maturity and, potentially, in the outstanding amount of senior unsecured debt, which
allowed these banks to wait for an improvement in issuance conditions.
Characteristics of banks that have started to repay their three-year LTRO funds
Evidence based on banks’ balance sheets identifies better financing conditions and the need for
lower liquidity buffers as important factors driving the repayment decisions of banks.
2 See the article entitled “The impact of the first three-year longer-term refinancing operation”, Monthly Bulletin, ECB, January 2012;
and the article entitled “The impact of the two three-year longer-term refinancing operations”, Monthly Bulletin, ECB, March 2012.
Chart A Cumulative flows of deposits by the non-financial private sector between January 2011 and March 2012
(mean of cumulative flows; as a percentage of main assets in January 2011)
0.0
0.5
1.0
1.5
2.0
2.5
Non-participating banks Participating banks0.0
0.5
1.0
1.5
2.0
2.5
Sources: ECB and ECB calculations.
Chart B Change in the ratio of senior debt maturing after one year-to-total liabilities between December 2011 and December 2012
(percentage points)
-15
-10
-5
0
5
10
-15
-10
-20 -20
-5
0
5
10
Non-participating banks Participating banks
Sources: Fitch and ECB calculations.Note: The lower blue band represents the 25th percentile of the distribution. The upper blue band represents the 75th percentile.The blue line in the middle is the median. The highest and lowest values represent the maximum and minimum of distribution.
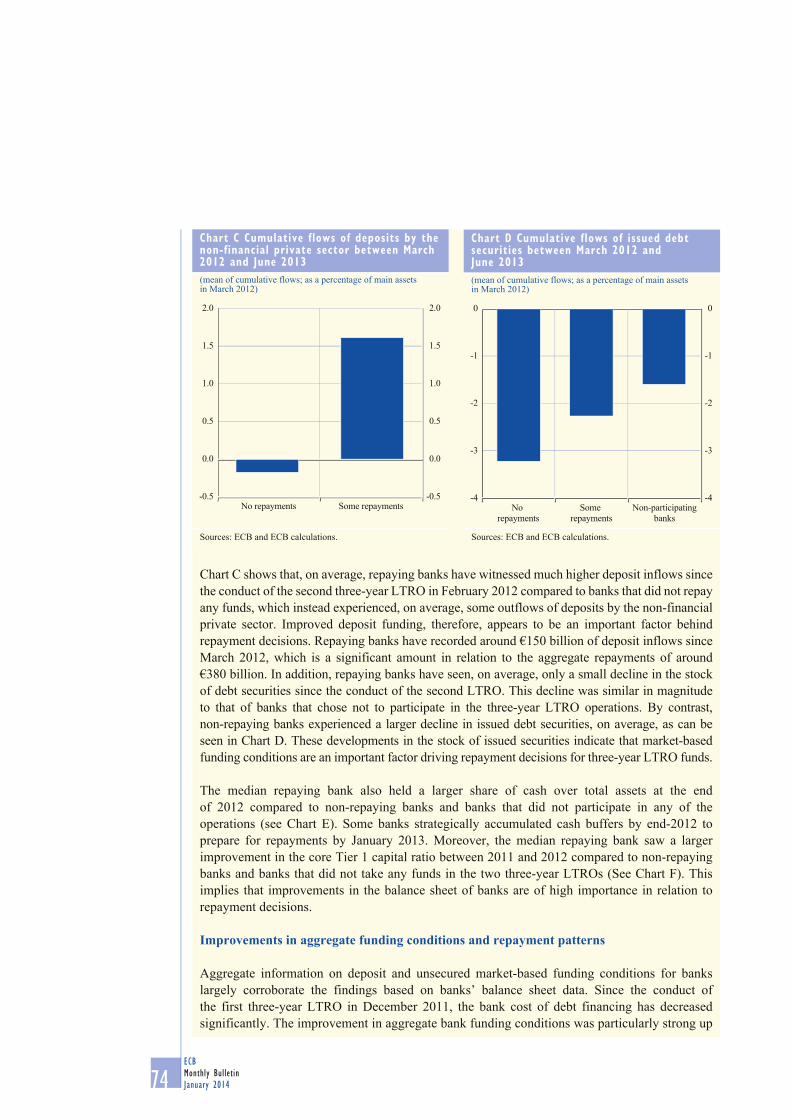
74ECB
Monthly Bulletin
January 2014
Chart C shows that, on average, repaying banks have witnessed much higher deposit inflows since
the conduct of the second three-year LTRO in February 2012 compared to banks that did not repay
any funds, which instead experienced, on average, some outflows of deposits by the non-financial
private sector. Improved deposit funding, therefore, appears to be an important factor behind
repayment decisions. Repaying banks have recorded around €150 billion of deposit inflows since
March 2012, which is a significant amount in relation to the aggregate repayments of around
€380 billion. In addition, repaying banks have seen, on average, only a small decline in the stock
of debt securities since the conduct of the second LTRO. This decline was similar in magnitude
to that of banks that chose not to participate in the three-year LTRO operations. By contrast,
non-repaying banks experienced a larger decline in issued debt securities, on average, as can be
seen in Chart D. These developments in the stock of issued securities indicate that market-based
funding conditions are an important factor driving repayment decisions for three-year LTRO funds.
The median repaying bank also held a larger share of cash over total assets at the end
of 2012 compared to non-repaying banks and banks that did not participate in any of the
operations (see Chart E). Some banks strategically accumulated cash buffers by end-2012 to
prepare for repayments by January 2013. Moreover, the median repaying bank saw a larger
improvement in the core Tier 1 capital ratio between 2011 and 2012 compared to non-repaying
banks and banks that did not take any funds in the two three-year LTROs (See Chart F). This
implies that improvements in the balance sheet of banks are of high importance in relation to
repayment decisions.
Improvements in aggregate funding conditions and repayment patterns
Aggregate information on deposit and unsecured market-based funding conditions for banks
largely corroborate the findings based on banks’ balance sheet data. Since the conduct of
the first three-year LTRO in December 2011, the bank cost of debt financing has decreased
significantly. The improvement in aggregate bank funding conditions was particularly strong up
Chart C Cumulative flows of deposits by the non-financial private sector between March 2012 and June 2013
(mean of cumulative flows; as a percentage of main assets in March 2012)
0.0
0.5
1.0
1.5
No repayments Some repayments
0.0
-0.5 -0.5
0.5
1.0
1.5
2.0 2.0
Sources: ECB and ECB calculations.
Chart D Cumulative flows of issued debt securities between March 2012 and June 2013
(mean of cumulative flows; as a percentage of main assets in March 2012)
-3
-2
-1
0
-3
-4 -4
-2
-1
0
No
repayments
Some
repayments
Non-participating
banks
Sources: ECB and ECB calculations.
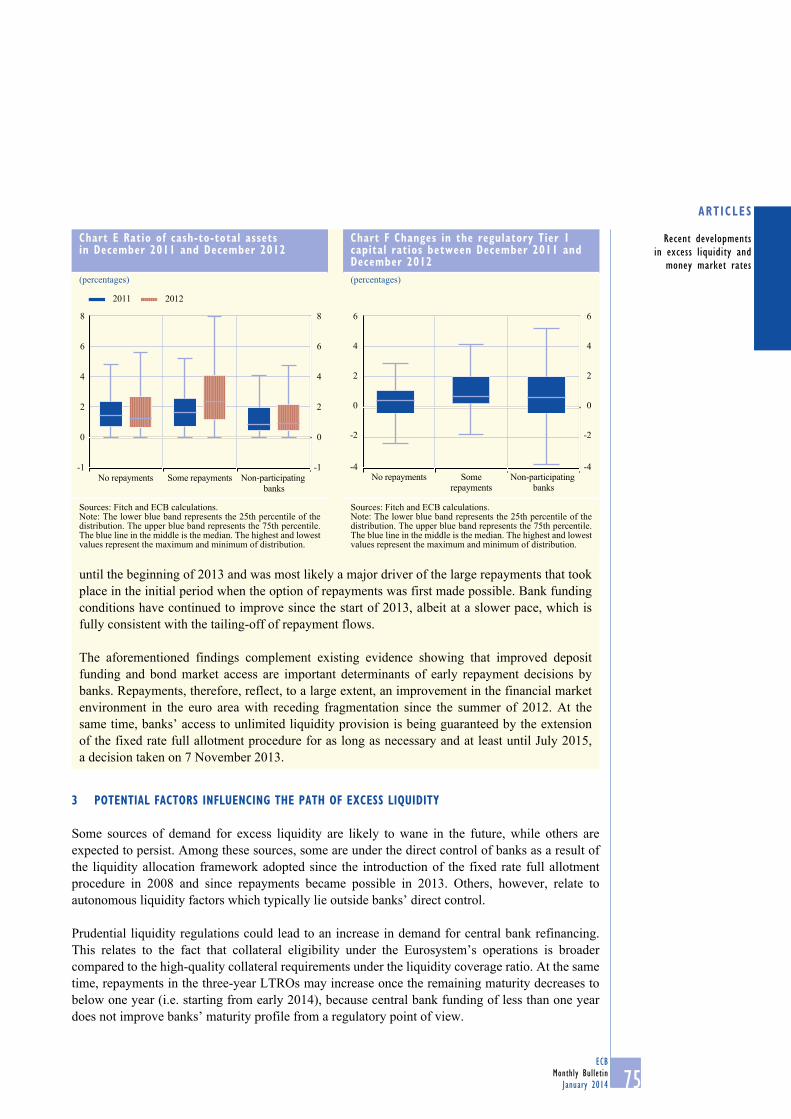
75ECB
Monthly BulletinJanuary 2014
Recent developments in excess liquidity and
money market rates
articles
3 Potential factors influencing the Path of excess liquidity
Some sources of demand for excess liquidity are likely to wane in the future, while others are expected to persist. Among these sources, some are under the direct control of banks as a result of the liquidity allocation framework adopted since the introduction of the fixed rate full allotment procedure in 2008 and since repayments became possible in 2013. Others, however, relate to autonomous liquidity factors which typically lie outside banks’ direct control.
Prudential liquidity regulations could lead to an increase in demand for central bank refinancing. This relates to the fact that collateral eligibility under the Eurosystem’s operations is broader compared to the high-quality collateral requirements under the liquidity coverage ratio. At the same time, repayments in the three-year LTROs may increase once the remaining maturity decreases to below one year (i.e. starting from early 2014), because central bank funding of less than one year does not improve banks’ maturity profile from a regulatory point of view.
until the beginning of 2013 and was most likely a major driver of the large repayments that took place in the initial period when the option of repayments was first made possible. Bank funding conditions have continued to improve since the start of 2013, albeit at a slower pace, which is fully consistent with the tailing-off of repayment flows.
The aforementioned findings complement existing evidence showing that improved deposit funding and bond market access are important determinants of early repayment decisions by banks. Repayments, therefore, reflect, to a large extent, an improvement in the financial market environment in the euro area with receding fragmentation since the summer of 2012. At the same time, banks’ access to unlimited liquidity provision is being guaranteed by the extension of the fixed rate full allotment procedure for as long as necessary and at least until July 2015, a decision taken on 7 November 2013.
chart e ratio of cash-to-total assets in december 2011 and december 2012
(percentages)
0
-1
2
4
6
8
0
-1
2
4
6
8
No repayments Some repayments Non-participating banks
2011 2012
Sources: Fitch and ECB calculations.Note: The lower blue band represents the 25th percentile of the distribution. The upper blue band represents the 75th percentile.The blue line in the middle is the median. The highest and lowest values represent the maximum and minimum of distribution.
chart f changes in the regulatory tier 1 capital ratios between december 2011 and december 2012(percentages)
-4
-2
0
2
4
6
-4
-2
0
2
4
6
No repayments Somerepayments
Non-participating banks
Sources: Fitch and ECB calculations.Note: The lower blue band represents the 25th percentile of the distribution. The upper blue band represents the 75th percentile.The blue line in the middle is the median. The highest and lowest values represent the maximum and minimum of distribution.
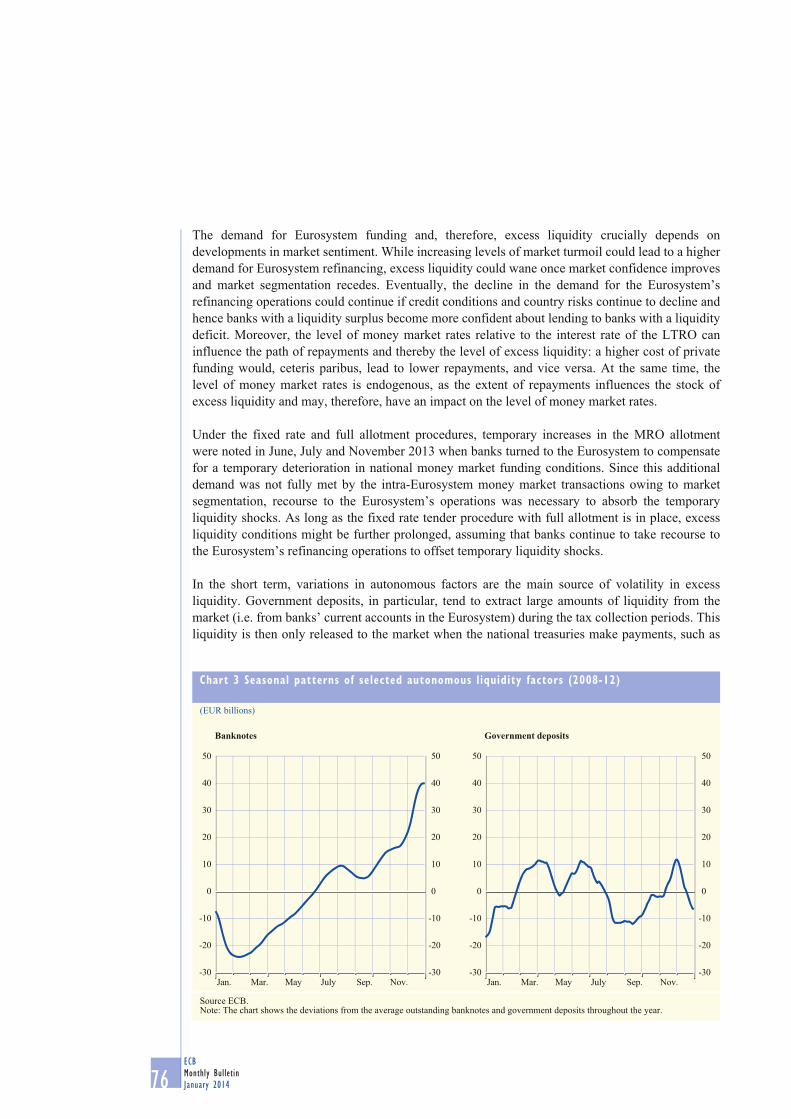
76ECB
Monthly Bulletin
January 2014
The demand for Eurosystem funding and, therefore, excess liquidity crucially depends on
developments in market sentiment. While increasing levels of market turmoil could lead to a higher
demand for Eurosystem refinancing, excess liquidity could wane once market confidence improves
and market segmentation recedes. Eventually, the decline in the demand for the Eurosystem’s
refinancing operations could continue if credit conditions and country risks continue to decline and
hence banks with a liquidity surplus become more confident about lending to banks with a liquidity
deficit. Moreover, the level of money market rates relative to the interest rate of the LTRO can
influence the path of repayments and thereby the level of excess liquidity: a higher cost of private
funding would, ceteris paribus, lead to lower repayments, and vice versa. At the same time, the
level of money market rates is endogenous, as the extent of repayments influences the stock of
excess liquidity and may, therefore, have an impact on the level of money market rates.
Under the fixed rate and full allotment procedures, temporary increases in the MRO allotment
were noted in June, July and November 2013 when banks turned to the Eurosystem to compensate
for a temporary deterioration in national money market funding conditions. Since this additional
demand was not fully met by the intra-Eurosystem money market transactions owing to market
segmentation, recourse to the Eurosystem’s operations was necessary to absorb the temporary
liquidity shocks. As long as the fixed rate tender procedure with full allotment is in place, excess
liquidity conditions might be further prolonged, assuming that banks continue to take recourse to
the Eurosystem’s refinancing operations to offset temporary liquidity shocks.
In the short term, variations in autonomous factors are the main source of volatility in excess
liquidity. Government deposits, in particular, tend to extract large amounts of liquidity from the
market (i.e. from banks’ current accounts in the Eurosystem) during the tax collection periods. This
liquidity is then only released to the market when the national treasuries make payments, such as
Chart 3 Seasonal patterns of selected autonomous liquidity factors (2008-12)
(EUR billions)
Banknotes Government deposits
-30
-20
-10
0
10
20
30
40
50
-30
-20
-10
0
10
20
30
40
50
Sep.Jan. Mar. May July Nov.-30
-20
-10
0
10
20
30
40
50
-30
-20
-10
0
10
20
30
40
50
Sep.Jan. Mar. May July Nov.
Source ECB.Note: The chart shows the deviations from the average outstanding banknotes and government deposits throughout the year.
77ECB
Monthly Bulletin
January 2014
Recent developments
in excess liquidity and
money market rates
ARTICLES
salary payments or debt redemption.3 As a result, changes in government deposits do not alter the
overall excess liquidity, on average, but can introduce volatility in the short term (see Chart 3). In
that respect, banknotes follow a regular seasonal pattern related to the holiday periods during which
the demand for physical cash is typically high.
Volatility in excess liquidity triggered by autonomous liquidity factors is not a new phenomenon.
However, given the downward trend in excess liquidity, volatility relative to the amount of excess
liquidity has risen over recent months, thus increasing the potential to influence money market
activity. Moreover, with market segmentation prevailing, intra-euro area flows do not smooth out
these domestic shocks as effectively as they did in the past.
4 IMPACT OF EXCESS LIQUIDITY ON EURO AREA MONEY MARKET RATES
Excess liquidity remained high enough to keep very short-term money market rates stable, on
average, until about June 2013. Around that time, less abundant liquidity conditions resulted in
somewhat more volatile short-term interest rates, especially towards the end of each month.
Increased volatility in short-term rates, in turn, complicates the signal extraction process and makes
it more complex for market participants to form their expectations about the course of future money
market rates.
4.1 MECHANISM OF EXCESS LIQUIDITY TRANSMISSION TO THE MONEY MARKET
The Eurosystem’s monetary policy implementation framework aims to steer very short-term
interest rates in line with the policy rate decision of the Governing Council. In the years before
the onset of the financial crisis, the achievement of this objective was underpinned by three main
elements. First, the level of very short-term rates was steered to a level close to its minimum bid rate
through the weekly provision of liquidity in the MRO.4 Second, the ECB’s marginal lending and
deposit facilities ensured that short-term money market rates – typically overnight interbank rates –
remained in a certain corridor (see Chart 4). Finally, the averaging provision in the fulfilment of the
minimum reserve requirements served as a tool to limit fluctuations in short-term rates.
Market participants usually try to anticipate changes in the policy rate in order to determine the
rates of other money market maturities. In the euro area, overnight indexed swaps (OIS) are the
main instruments used by market participants in order to take a stance on expected central bank
decisions. EONIA5 interest rate swaps indicate the average level at which market participants expect
the EONIA to be during one maintenance period – which lasts approximately one month – in the
future. For instance, a one-maintenance period EONIA swap for a sixth-month horizon priced in
at end-November 2013 indicates the expected average of prevailing EONIA rates six months later.
Funding rates, such as the euro interbank offered rate (EURIBOR), typically follow the OIS rates,
with a spread reflecting term premia and counterparty risk, as they provide an indication of the
short-term cost of funding in the future.
3 Some national treasuries actively managed their cash flows by temporarily reinvesting some of their liquidity surplus in the market, which
reduces the impact of their operations on excess liquidity. However, this strategy has not yet succeeded in smoothing out the impact of
their operations to the full extent.
4 The MRO weekly liquidity provision was based on a variable rate tender until October 2008, with a minimum bid rate. The latter is the
interest rate below which the Eurosystem would not accept any bids. Thereafter, a fixed rate tender procedure was introduced and the
minimum bid rate became the rate at which all bids were allotted.
5 The euro overnight index average (EONIA) is the effective overnight reference rate for the euro. It is computed as a weighted average
of all of the overnight unsecured lending transactions in the interbank market undertaken in the European Union and the European Free
Trade Association countries by a panel of banks.

78ECB
Monthly Bulletin
January 2014
In the pre-crisis period, up to October 2008, the Eurosystem’s monetary policy implementation
framework was able to steer overnight rates to levels close to the MRO minimum bid rate.
Previous estimates have shown that a small spread tends to persist between the EONIA and the
MRO rate during that time (see Chart 4), because the EONIA is an unsecured transaction, while
the Eurosystem’s refinancing operations are collateralised. This spread has been attributed to the
credit risk of dealing in the market on an overnight basis and to a degree of uncertainty regarding
the distribution of the allotment.
The financial crisis changed the overnight interest rate position in the interest rate corridor when the
Eurosystem departed from neutral liquidity conditions (see Chart 4). As a result of excess liquidity,
the EONIA was no longer tied to the MRO rate and it decreased to its lowest possible level, a few
basis points above the ECB deposit facility rate. This rate provides a lower bound for interest rates
in the interbank money market, as banks with access to the deposit facility are unlikely to lend on
the money market at a less favourable rate than the deposit facility rate at which they could invest
an infinite amount of their excess liquidity. Given the high level of excess liquidity prevailing
in 2012, the spread between the EONIA and the ECB deposit facility rate remained in a narrow
range between three to ten basis points. This spread could be attributed to the credit risk of dealing
with the market compared to depositing liquidity with the Eurosystem.
4.2 HISTORICAL RELATIONSHIP BETWEEN THE EONIA AND EXCESS LIQUIDITY
The EONIA rate increased, on a maintenance-period average basis, to 11.8 basis points as excess
liquidity declined to around €168.4 billion on 20 November 2013 in the 11th maintenance period.
Chart 4 EONIA, normalised ECB interest rate corridor and excess liquidity
(basis points; monthly average in EUR billions)
0
100
200
300
400
500
600
700
800
900
0
20
40
60
80
100
2003 2004 2005 2006 2007 2008 2009 2010 2011 2012 2013Q1 Q3 Q1 Q3 Q1 Q3 Q1 Q3 Q1 Q3 Q1 Q3 Q1 Q3 Q1 Q3 Q1 Q3 Q1 Q3 Q1 Q3
small spread
excess liquidity (right-hand scale)
EONIA-ECB deposit facility rate
MRO rate
marginal lending facility rate
ECB deposit facility rate
Source: ECB.Notes: The EONIA rate is normalised for a constant 100-basis point interest rate corridor. The small spread represents the interval in which the EONIA usually stood compared with the MRO rate up to the third quarter of 2008 and with the ECB deposit facility rate since the third quarter of 2008.
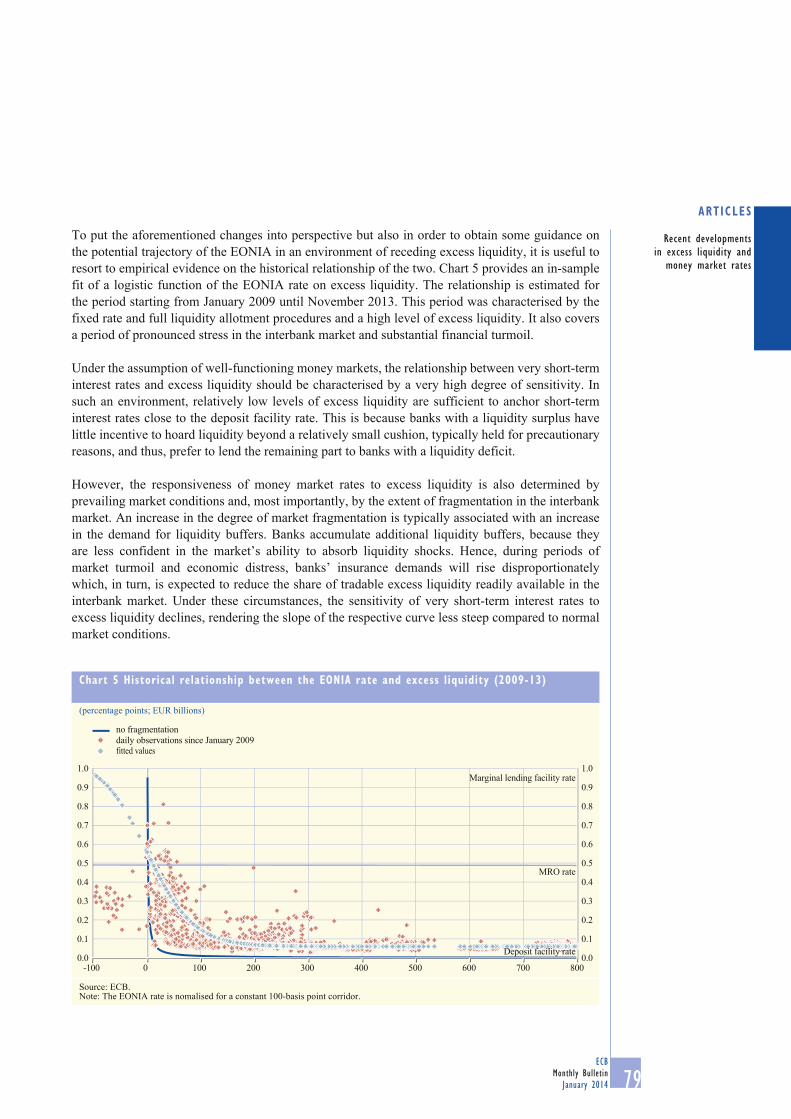
79ECB
Monthly Bulletin
January 2014
Recent developments
in excess liquidity and
money market rates
ARTICLES
To put the aforementioned changes into perspective but also in order to obtain some guidance on
the potential trajectory of the EONIA in an environment of receding excess liquidity, it is useful to
resort to empirical evidence on the historical relationship of the two. Chart 5 provides an in-sample
fit of a logistic function of the EONIA rate on excess liquidity. The relationship is estimated for
the period starting from January 2009 until November 2013. This period was characterised by the
fixed rate and full liquidity allotment procedures and a high level of excess liquidity. It also covers
a period of pronounced stress in the interbank market and substantial financial turmoil.
Under the assumption of well-functioning money markets, the relationship between very short-term
interest rates and excess liquidity should be characterised by a very high degree of sensitivity. In
such an environment, relatively low levels of excess liquidity are sufficient to anchor short-term
interest rates close to the deposit facility rate. This is because banks with a liquidity surplus have
little incentive to hoard liquidity beyond a relatively small cushion, typically held for precautionary
reasons, and thus, prefer to lend the remaining part to banks with a liquidity deficit.
However, the responsiveness of money market rates to excess liquidity is also determined by
prevailing market conditions and, most importantly, by the extent of fragmentation in the interbank
market. An increase in the degree of market fragmentation is typically associated with an increase
in the demand for liquidity buffers. Banks accumulate additional liquidity buffers, because they
are less confident in the market’s ability to absorb liquidity shocks. Hence, during periods of
market turmoil and economic distress, banks’ insurance demands will rise disproportionately
which, in turn, is expected to reduce the share of tradable excess liquidity readily available in the
interbank market. Under these circumstances, the sensitivity of very short-term interest rates to
excess liquidity declines, rendering the slope of the respective curve less steep compared to normal
market conditions.
Chart 5 Historical relationship between the EONIA rate and excess liquidity (2009-13)
(percentage points; EUR billions)
0.0
0.1
0.2
0.3
0.4
0.5
0.6
0.7
0.8
0.9
1.0
0.0
0.1
0.2
0.3
0.4
0.5
0.6
0.7
0.8
0.9
1.0
-100 0 100 200 300 400 500 600 700 800
MRO rate
Marginal lending facility rate
Deposit facility rate
no fragmentation
daily observations since January 2009fitted values
Source: ECB.Note: The EONIA rate is nomalised for a constant 100-basis point corridor.
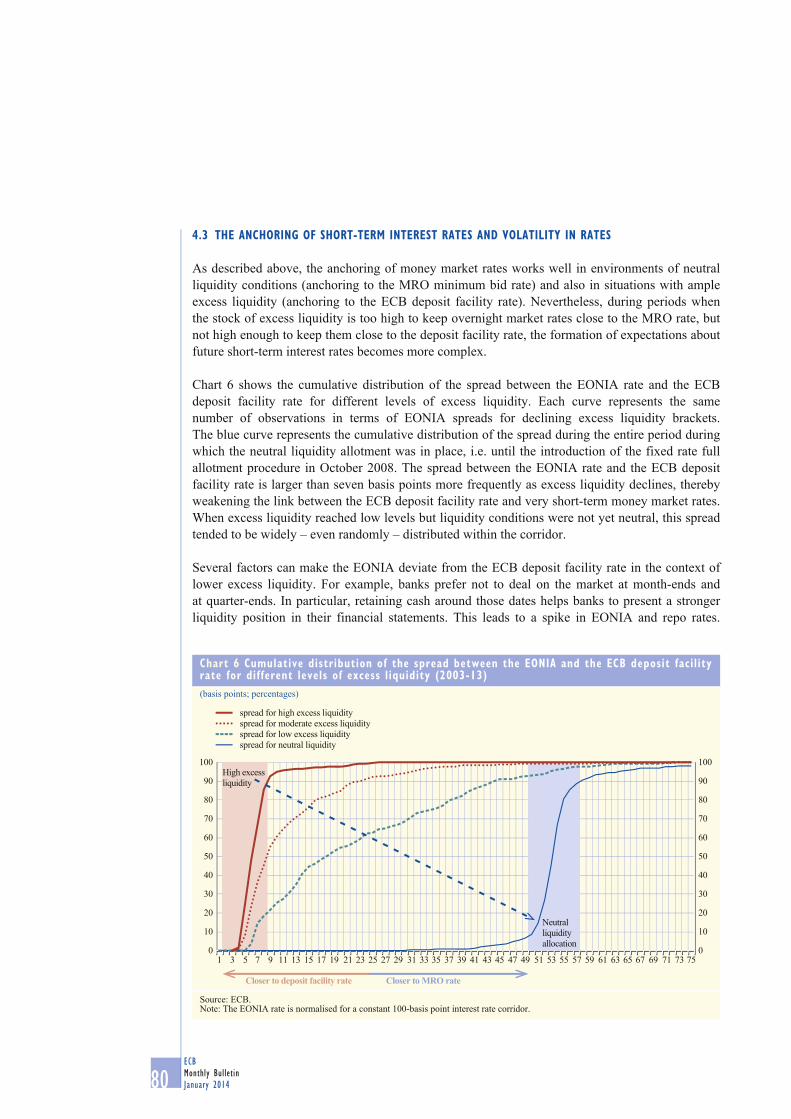
80ECB
Monthly Bulletin
January 2014
4.3 THE ANCHORING OF SHORT-TERM INTEREST RATES AND VOLATILITY IN RATES
As described above, the anchoring of money market rates works well in environments of neutral
liquidity conditions (anchoring to the MRO minimum bid rate) and also in situations with ample
excess liquidity (anchoring to the ECB deposit facility rate). Nevertheless, during periods when
the stock of excess liquidity is too high to keep overnight market rates close to the MRO rate, but
not high enough to keep them close to the deposit facility rate, the formation of expectations about
future short-term interest rates becomes more complex.
Chart 6 shows the cumulative distribution of the spread between the EONIA rate and the ECB
deposit facility rate for different levels of excess liquidity. Each curve represents the same
number of observations in terms of EONIA spreads for declining excess liquidity brackets.
The blue curve represents the cumulative distribution of the spread during the entire period during
which the neutral liquidity allotment was in place, i.e. until the introduction of the fixed rate full
allotment procedure in October 2008. The spread between the EONIA rate and the ECB deposit
facility rate is larger than seven basis points more frequently as excess liquidity declines, thereby
weakening the link between the ECB deposit facility rate and very short-term money market rates.
When excess liquidity reached low levels but liquidity conditions were not yet neutral, this spread
tended to be widely – even randomly – distributed within the corridor.
Several factors can make the EONIA deviate from the ECB deposit facility rate in the context of
lower excess liquidity. For example, banks prefer not to deal on the market at month-ends and
at quarter-ends. In particular, retaining cash around those dates helps banks to present a stronger
liquidity position in their financial statements. This leads to a spike in EONIA and repo rates.
Chart 6 Cumulative distribution of the spread between the EONIA and the ECB deposit facility rate for different levels of excess liquidity (2003-13)
(basis points; percentages)
0 0
10
20
30
40
50
60
70
80
90
100
10
20
30
40
50
60
70
80
90
100High excess
liquidity
Neutral
liquidity
allocation
1 3 5 7 9 11 13 15 17 19 21 23 25 27 29 31 33 35 37 39 41 43 45 47 49 51 53 55 57 59 61 63 65 67 69 71 73 75
Closer to deposit facility rate Closer to MRO rate
spread for high excess liquidity
spread for moderate excess liquidity
spread for low excess liquidity
spread for neutral liquidity
Source: ECB.Note: The EONIA rate is normalised for a constant 100-basis point interest rate corridor.

81ECB
Monthly Bulletin
January 2014
Recent developments
in excess liquidity and
money market rates
ARTICLES
An aggravating factor is that the size of the end-of-the month spikes depends on the liquidity needs
on the market, thus on the stock of excess liquidity, which is difficult to forecast accurately.
Government deposits can have an impact on money markets, because they create a liquidity cycle that
is not fully smoothed out by intra-Eurosystem flows. This tax-induced liquidity cycle is well-known
by market participants, but its impact on rates in a segmented market, as well as the exact size of the
corresponding liquidity swings, are difficult to forecast. The liquidity impact of tax collections in May,
June and July 2013 was particularly pronounced, representing more than 30% of excess liquidity in
June 2013. During these months, some of the national treasuries experienced relatively large tax cycles,
which resulted in noticeable increases in overnight unsecured and repo rates across local markets.
The local impact had spillover effects on the rest of the euro area money market.
4.4 TRANSMISSION OF EXCESS LIQUIDITY DEVELOPMENTS TO MONEY MARKET EXPECTATIONS
If short-term rates were less closely related to the ECB deposit facility rate, market participants
would have more difficulties predicting these rates. As a result, expected money market rates are
likely to reflect a degree of uncertainty. Day-to-day excess liquidity fluctuations are difficult to
forecast accurately, because they remain largely under the banks’ direct control and may reflect
idiosyncratic liquidity conditions. As a result of the non-linearity in the relationship between excess
liquidity and short-term rates, a decline in excess liquidity can lead to a relatively large increase in
market rates, while an increase in excess liquidity can have a smaller, dampening effect on rates.
This uncertainty should lead to expected rates that are somewhat higher, on average, than the
actual or spot rate, as market participants need to be compensated for the risks associated with less
predictable overnight rates. For each maintenance period since 2012, Chart 7 presents the curve of
average one-maintenance period EONIA swaps up to the ninth maintenance period. The history of
this curve illustrates this shift in market focus.
Chart 7 EONIA forward curves and excess liquidity
(percentages; EUR billions)
100
200
300
400
500
600
700
800
900
0.00
0.05
0.10
0.15
0.20
0.25
0.30
0.35
0.40
0.45
0.50
MP01 MP03 MP05 MP07 MP09 MP112012
MP1 MP3 MP5 MP7 MP9 MP112013
ECB deposit rate at zero Start of repayment
MRO rate cut
to 50 basis points
MRO rate cut
to 25 basis points
Excess liquidity
(right-hand scale)
EONIA forward curves
(left-hand scale)
Sources: ECB and Bloomberg.Note: MP stands for maintenance period.

82ECB
Monthly Bulletin
January 2014
From the ECB deposit facility rate cut in July 2012 to the start of the repayment period in
January 2013, the EONIA forward curve was flat, with a slight downward slope for short-dated
maturities, which reflected the tendency of the EONIA rate to decline slowly in the context of
very high excess liquidity. The December 2012 maintenance-period curve retained the same shape,
despite imminent repayments, in part, because of negative rate discussions among policy-makers.
From January to May 2013, higher than expected repayments significantly switched the market
focus towards liquidity developments compared to December 2012, as illustrated by the sharp
steepening of the curve. However, despite large repayments, the liquidity stock remained large
enough to keep overnight rates close to the ECB deposit facility rate, triggering a rapid repricing
of the curve in line with stable spot rates in the following two maintenance periods. The flattening
process culminated in May 2013 against the backdrop of renewed discussions about negative rates.
Since June 2013, improved economic data led the market to price out further rate cuts or liquidity
enhancing measures. As a result, the balance of factors that could influence market expectations
tilted in favour of higher rates, resulting in a steeper EONIA forward curve. The steepening may
also reflect market uncertainty about the path of excess liquidity – although it is still expected to
continue to decline over time — and the volatility of excess liquidity. Moreover, contrary to the
period from January to May 2013, volatility in rates actually began increasing in June and July
and overnight rates could be seen to be less dependent on the ECB deposit facility than previously.
Finally, the curve flattened in November 2013 as a consequence of the cut in the ECB’s MRO rate
to 25 basis points and to the narrowing of the interest rate corridor.
In summary, expectations about future liquidity conditions are an important factor in influencing
expectations about money market rates, but they are not the only deciding factor.
5 CONCLUSION
Excess liquidity provision by the Eurosystem reached its peak in March 2012. More recently,
the improving market conditions have reduced the demand for precautionary liquidity buffers,
while reopening access to the wholesale funding market to counterparties that had experienced
impairments in market access during 2011. This is reflected in a lower demand for excess liquidity
in the Eurosystem’s refinancing operations and in the substitution of Eurosystem funding with
market funding. As a consequence, euro area banks have been actively using the opportunity for
early repayments of the amount borrowed in the three-year LTROs. Demand for liquidity in the
other Eurosystem refinancing operations also declined.
Should excess liquidity remain abundant, money market rates would continue to be anchored at
levels close to the ECB deposit facility rates. If, however, excess liquidity were to decline towards
more neutral conditions, money market rates would tend to be anchored to the MRO rate. Any
transition period, as the liquidity provision normalises, would lead to greater volatility, which
could imply that short-term rates could become less closely anchored to the ECB deposit facility
rate. This would make expectations about future money market rates more complex to interpret, as
several factors, such as future liquidity developments and uncertainty, would be priced in overnight
index swaps, in addition to expectations about the future path of policy rates.

83ECB
Monthly Bulletin
January 2014
Medium-term prospects
for China’s economy and
the internationalisation
of the renminbi
ARTICLES
MEDIUM-TERM PROSPECTS FOR CHINA’S ECONOMY AND THE INTERNATIONALISATION OF THE RENMINBI
The impressive growth of China’s economy over the past decade has strengthened its global influence. However, although there have been substantial improvements in China’s external imbalances since 2008, internal imbalances have become accentuated. Tackling these imbalances will require the implementation of ambitious structural reforms aimed at reducing incentives that have long favoured investment and saving over consumption. Recently announced reform intentions are promising in this respect. The pursuit of the internationalisation of the renminbi by the authorities may also help to overcome these challenges. Reforms aimed at liberalising domestic financial markets, the movement of capital across China's borders and the exchange rate of the renminbi are essential before the currency can be used widely in international trade and finance. As some of the reforms that are vital for the internationalisation of the renminbi coincide with those needed to rebalance China’s growth, this may result in a virtuous circle.
1 INTRODUCTION
As China’s emergence on the international scene becomes more established, a question mark hangs
over whether its economic performance of the past few decades can continue at the same pace.
The persistence of internal imbalances suggests that reforms to the growth model are needed.
At the same time, for some years now the authorities have been taking steps to encourage greater
international use of the renminbi.
Issuing an international reserve currency brings benefits that facilitate growth, such as reduced
financing costs for domestic firms and the sovereign. To achieve international currency status,
however, economies must typically be rather large and stable, and feature highly developed
domestic financial markets, an open capital account and a floating exchange rate. These features
may all stimulate growth independently from their effect on the international use of a currency, and
are often conditional on one another. For example, capital account liberalisation enables domestic
agents to diversify their portfolio, which helps to improve the allocation of capital, thereby fostering
growth. However, in order to ensure orderly capital account liberalisation, domestic financial
markets must have achieved a minimum level of development – including sufficiently deep and
broad markets, as well as adequate risk management capabilities among financial institutions
and supervision by authorities – in order to deal with capital flows that can, at times, be volatile.
Similarly, a flexible exchange rate helps to reduce the risk that surges in capital flows may foment
currency and banking crises.
Therefore, structural and financial reforms, whether they are geared towards domestic or
international goals, are clearly linked. Some even view the policies recently adopted by the
authorities which are aimed at supporting the international role of the renminbi as catalysts to
accomplishing necessary domestic reforms. From this perspective, there seems to be a mutually
reinforcing relationship between the reforms needed in order to sustain China’s growth in the
medium term and those necessary for fostering the internationalisation of the renminbi.
By analysing the changing nature of the imbalances in the economy and of the pattern of growth in
China, this article aims to shed light on which structural reforms are crucial. Moreover, by reviewing
recent developments in the international use of the renminbi and its determinants, this article also
discusses the role that the internationalisation of the renminbi might play in the implementation of
the structural reforms that may ensure a more sustainable growth path.
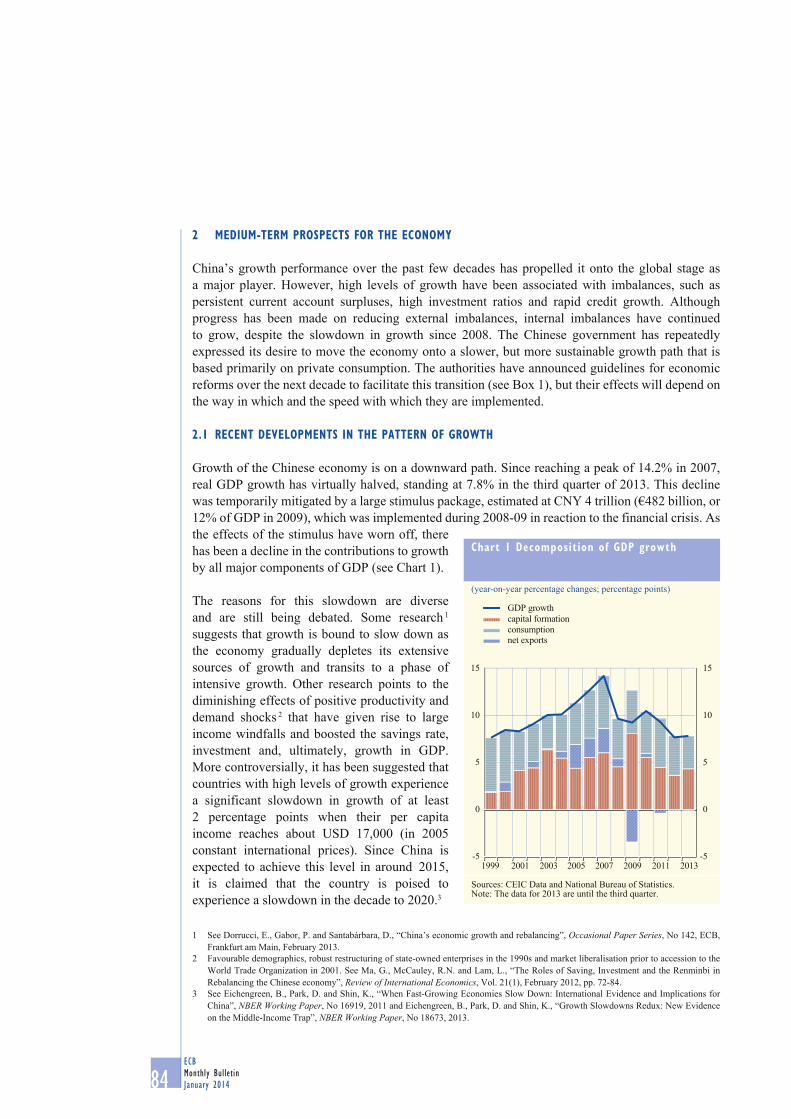
84ECB
Monthly Bulletin
January 2014
2 MEDIUM-TERM PROSPECTS FOR THE ECONOMY
China’s growth performance over the past few decades has propelled it onto the global stage as
a major player. However, high levels of growth have been associated with imbalances, such as
persistent current account surpluses, high investment ratios and rapid credit growth. Although
progress has been made on reducing external imbalances, internal imbalances have continued
to grow, despite the slowdown in growth since 2008. The Chinese government has repeatedly
expressed its desire to move the economy onto a slower, but more sustainable growth path that is
based primarily on private consumption. The authorities have announced guidelines for economic
reforms over the next decade to facilitate this transition (see Box 1), but their effects will depend on
the way in which and the speed with which they are implemented.
2.1 RECENT DEVELOPMENTS IN THE PATTERN OF GROWTH
Growth of the Chinese economy is on a downward path. Since reaching a peak of 14.2% in 2007,
real GDP growth has virtually halved, standing at 7.8% in the third quarter of 2013. This decline
was temporarily mitigated by a large stimulus package, estimated at CNY 4 trillion (€482 billion, or
12% of GDP in 2009), which was implemented during 2008-09 in reaction to the financial crisis. As
the effects of the stimulus have worn off, there
has been a decline in the contributions to growth
by all major components of GDP (see Chart 1).
The reasons for this slowdown are diverse
and are still being debated. Some research 1
suggests that growth is bound to slow down as
the economy gradually depletes its extensive
sources of growth and transits to a phase of
intensive growth. Other research points to the
diminishing effects of positive productivity and
demand shocks 2 that have given rise to large
income windfalls and boosted the savings rate,
investment and, ultimately, growth in GDP.
More controversially, it has been suggested that
countries with high levels of growth experience
a significant slowdown in growth of at least
2 percentage points when their per capita
income reaches about USD 17,000 (in 2005
constant international prices). Since China is
expected to achieve this level in around 2015,
it is claimed that the country is poised to
experience a slowdown in the decade to 2020.3
1 See Dorrucci, E., Gabor, P. and Santabárbara, D., “China’s economic growth and rebalancing”, Occasional Paper Series, No 142, ECB,
Frankfurt am Main, February 2013.
2 Favourable demographics, robust restructuring of state-owned enterprises in the 1990s and market liberalisation prior to accession to the
World Trade Organization in 2001. See Ma, G., McCauley, R.N. and Lam, L., “The Roles of Saving, Investment and the Renminbi in
Rebalancing the Chinese economy”, Review of International Economics, Vol. 21(1), February 2012, pp. 72-84.
3 See Eichengreen, B., Park, D. and Shin, K., “When Fast-Growing Economies Slow Down: International Evidence and Implications for
China”, NBER Working Paper, No 16919, 2011 and Eichengreen, B., Park, D. and Shin, K., “Growth Slowdowns Redux: New Evidence
on the Middle-Income Trap”, NBER Working Paper, No 18673, 2013.
Chart 1 Decomposition of GDP growth
(year-on-year percentage changes; percentage points)
-5
0
5
10
15
-5
0
5
10
15
capital formation
net exports
consumption
GDP growth
1999 2001 2003 2005 2007 2009 2011 2013
Sources: CEIC Data and National Bureau of Statistics. Note: The data for 2013 are until the third quarter.

85ECB
Monthly Bulletin
January 2014
Medium-term prospects
for China’s economy and
the internationalisation
of the renminbi
ARTICLES
The recent slowdown of growth in China seems
to follow historical patterns in a number of
Asian countries and other large emerging and
advanced economies since 1950, which saw
their growth rates drop as their GDP per capita
reached USD 6,500-8,000 in purchasing power
parity (PPP) terms (see Chart 2), although there
is a large degree of variation within that pattern.
China’s GDP per capita reached USD 8,000 in
2007. Whatever the precise reasons behind the
slowdown, the reduction in growth has only
gone partially hand in hand with a reduction in
the imbalances that have characterised China’s
economic development, namely its reliance on
investment and exports.
REDUCED EXTERNAL IMBALANCES
China’s current account surplus shrank from
10.2% in 2007 to 2.0% in the first three quarters
of 2013.
The extent to which the decrease in the current
account balance is structural is debatable.
Weaker global trade dynamics and slower
growth in the euro area and the United States
since the international financial crisis are
partly at play, suggesting that the external
surplus could rise again. However, the real
effective exchange rate has risen by 29.6% since
2007, while wages have also risen quickly.
Accordingly, the IMF’s October 2013 World
Economic Outlook foresees a rise in the current
account surplus to about 4% by 2018, which is
well below previous highs.
The decline in the current account surplus has
greatly reduced the accumulation of foreign
exchange reserves. Reserves, which more
than tripled from 14% of GDP in 2000 to 48%
of GDP in 2009, are hovering around USD
3.7 trillion and have even fallen in terms of
GDP, to 41% in September 2013 (see Chart 3).
REMAINING DOMESTIC CHALLENGES
Despite the reduction in the external imbalance,
the composition of domestic demand has
become even more skewed towards investment
since 2008. In 2012 the investment ratio
Chart 2 An international comparison of growth rates versus GDP per capita (1951-2011)
(x-axis: GDP per capita in PPP; y-axis: annual real GDP growth)
-5
0
5
10
15
20
-5
0
5
10
15
20
China
other economies
0 10,000 20,000 30,000 40,000
Source: Penn World Tables 8.0.Note: Other economies include Brazil, France, Germany, India, Japan, Korea, South Africa, the United Kingdom and the United States.
Chart 3 Current account and foreign exchange reserves
(percentage of GDP)
0
20
40
60
0
4
8
12
1999 2001 2003 2005 2007 2009 2011
current account
foreign exchange reserves (right-hand side)
Sources: CEIC Data, National Bureau of Statistics.Notes: Current account data are until the third quarter of 2013; foreign exchange reserves data are until September 2013.

86ECB
Monthly Bulletin
January 2014
reached 46.1% of real GDP, standing at an
all-time high. At the same time, growth has
become increasingly reliant on credit. Total
financing to the economy 4 increased from
113% of GDP at the end of 2007 to 182%
of GDP in September 2013. Such financial
leverage is much higher than that in other
countries with a similar level of development,
and is only found in high-income economies
such as the United States and United Kingdom.
Strong growth has been accompanied by a shift
in the composition of financing away from
bank lending (see Chart 4).
Local governments have contributed to the
above developments. They were instrumental in
implementing a large part of the infrastructure
investments under the 2008-09 fiscal stimulus
package, borrowing heavily by means of so-
called local government financing vehicles
(LGFVs) to do so. According to the Chinese
national audit office, the 2008-09 stimulus
package led to a doubling of local government and LGFV debt between 2008 and 2010, to
CNY 10.7 trillion (equivalent to 27% of GDP in 2010).5
China’s investment profile is also deviating increasingly from the historical experience of other
economies since 1960, including within Asia. The investment-to-GDP ratio has risen rapidly and
substantially beyond that of other major advanced and emerging economies. This could be taken
as a sign that the current investment rate might be excessive (see Chart 5). It is debatable whether
China’s capital stock is too high. Despite the very high investment rate, infrastructure needs are still
large, in part because of ongoing urbanisation. Indeed, when comparing the (urban) infrastructure,
such as (rail) road density, with that of other economies, there is still scope for expanding public
infrastructure investment. Nevertheless, the ratio of China’s productive capital stock to GDP as
estimated by the OECD, at 2.6 in 2012, is relatively high given its level of development: it has
already reached a level that is only matched by economies with a much higher GDP per capita
(such as France and Germany) and which is only surpassed by Japan. However, the OECD also
estimates that, between 1992 and 2009, profitability outside agriculture and housing remained
high by international standards, suggesting that – on an economy-wide basis – investment was still
efficient until then.6 Other measures, such as capital stock per capita, which is only a fraction of
that of high-income countries, suggest that capital stock is in line with that of other countries given
its level of development. Nonetheless, the rate of growth in capital stock per capita has accelerated
since 2000, and since 2008 it has consistently outperformed GDP growth.
4 This includes financing to the private sector through bank and non-bank lending, as well as corporate bond and equity financing. It does
not include outstanding government bonds.
5 The IMF estimates that China’s general government debt might be 45% under an augmented definition of government debt that includes
local government infrastructure spending (see “People’s Republic of China: Staff Report for the 2013 Article IV Consultation”, IMF,
July 2013).
6 See “Economic Surveys: China”, OECD, March 2013.
Chart 4 Credit and investment ratio
(percentage of GDP)
20
30
40
50
50
100
150
200
2003 2005 2007 2009 2011 2013
other financing
bank lending
total financing
investment ratio (right-hand scale)
Sources: CEIC Data, People’s Bank of China, National Bureau of Statistics, World Bank.Note: The last observation refers to September 2013.
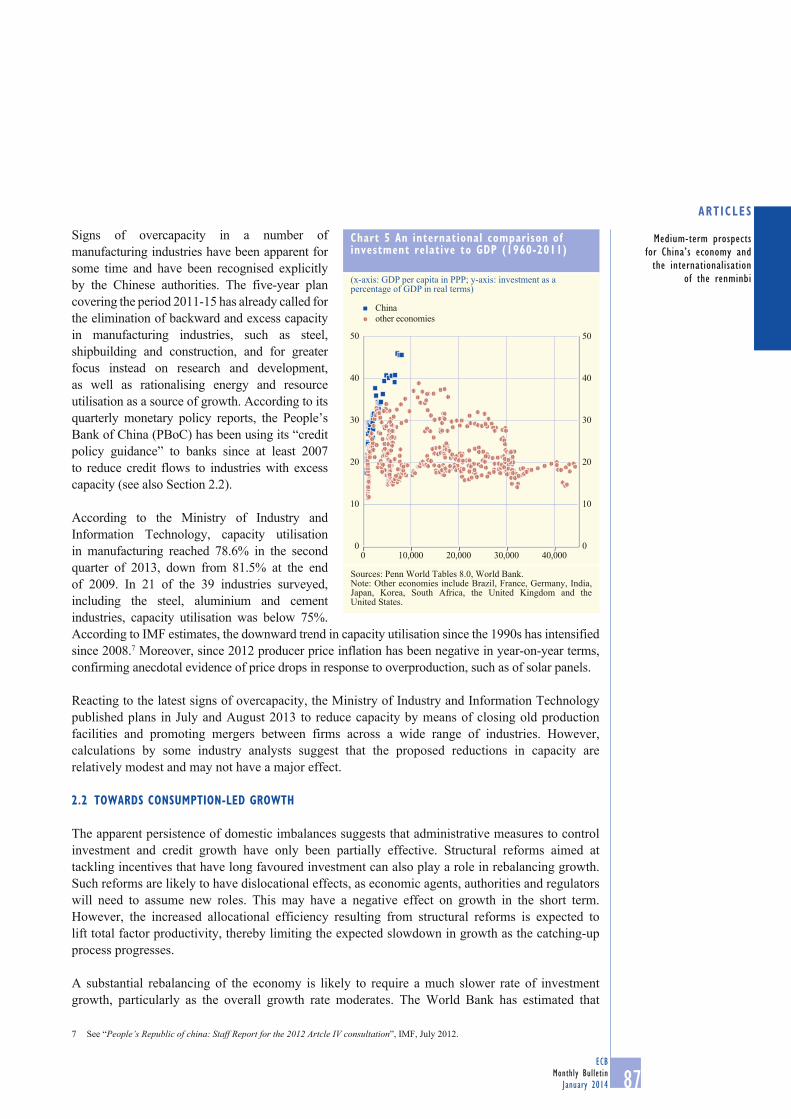
87ECB
Monthly Bulletin
January 2014
Medium-term prospects
for China’s economy and
the internationalisation
of the renminbi
ARTICLES
Signs of overcapacity in a number of
manufacturing industries have been apparent for
some time and have been recognised explicitly
by the Chinese authorities. The five-year plan
covering the period 2011-15 has already called for
the elimination of backward and excess capacity
in manufacturing industries, such as steel,
shipbuilding and construction, and for greater
focus instead on research and development,
as well as rationalising energy and resource
utilisation as a source of growth. According to its
quarterly monetary policy reports, the People’s
Bank of China (PBoC) has been using its “credit
policy guidance” to banks since at least 2007
to reduce credit flows to industries with excess
capacity (see also Section 2.2).
According to the Ministry of Industry and
Information Technology, capacity utilisation
in manufacturing reached 78.6% in the second
quarter of 2013, down from 81.5% at the end
of 2009. In 21 of the 39 industries surveyed,
including the steel, aluminium and cement
industries, capacity utilisation was below 75%.
According to IMF estimates, the downward trend in capacity utilisation since the 1990s has intensified
since 2008.7 Moreover, since 2012 producer price inflation has been negative in year-on-year terms,
confirming anecdotal evidence of price drops in response to overproduction, such as of solar panels.
Reacting to the latest signs of overcapacity, the Ministry of Industry and Information Technology
published plans in July and August 2013 to reduce capacity by means of closing old production
facilities and promoting mergers between firms across a wide range of industries. However,
calculations by some industry analysts suggest that the proposed reductions in capacity are
relatively modest and may not have a major effect.
2.2 TOWARDS CONSUMPTION-LED GROWTH
The apparent persistence of domestic imbalances suggests that administrative measures to control
investment and credit growth have only been partially effective. Structural reforms aimed at
tackling incentives that have long favoured investment can also play a role in rebalancing growth.
Such reforms are likely to have dislocational effects, as economic agents, authorities and regulators
will need to assume new roles. This may have a negative effect on growth in the short term.
However, the increased allocational efficiency resulting from structural reforms is expected to
lift total factor productivity, thereby limiting the expected slowdown in growth as the catching-up
process progresses.
A substantial rebalancing of the economy is likely to require a much slower rate of investment
growth, particularly as the overall growth rate moderates. The World Bank has estimated that
7 See “People’s Republic of china: Staff Report for the 2012 Artcle IV consultation”, IMF, July 2012.
Chart 5 An international comparison of investment relative to GDP (1960-2011)
(x-axis: GDP per capita in PPP; y-axis: investment as a percentage of GDP in real terms)
0
10
20
30
40
50
0
10
20
30
40
50
0 10,000 20,000 30,000 40,000
China
other economies
Sources: Penn World Tables 8.0, World Bank.Note: Other economies include Brazil, France, Germany, India, Japan, Korea, South Africa, the United Kingdom and the United States.
88ECB
Monthly Bulletin
January 2014
GDP growth will decline to 7% by 2020 and to 5% by 2030. If China’s GDP per capita were
to grow at a rate of 7% per year, it would reach a level of about USD 30,000 (in PPP terms) by
2030. At that level of development, investment ratios in Japan and Korea stood at about 30%.
If China wanted to achieve a similar investment ratio at that level of development, this would imply
annual investment growth of about 4-5% (and 3% if growth in GDP per capita were only 5%). Such
growth rates stand in stark contrast to the growth rates of around 10% observed until recently. It
might, therefore, take longer than expected to significantly rebalance China’s demand composition.
The following sections review some of the incentives that favour investment over consumption,
before examining the possible elements of a structural reform programme.
INCENTIVES FAVOURING INVESTMENT
China’s growth model contains a number of incentives that favour investment over consumption.
Investment has been a central part of its development model since the start of reforms in 1978.
Investment in infrastructure is also believed to promote regional growth potential and raise tax
revenues for local governments. Although such investments have proved useful, particularly in
fast-growing areas of the country that attract migrants looking for employment opportunities, there
have been exceptions, notably in more far-flung areas.
Quotas restricting cross-border investment flows and hence the scope of investments available
to savers also have a bearing on domestic investment rates. The restricted ability to invest
internationally combined with the limited development of the domestic financial markets (see
Section 3.2) inevitably leads to a bias in the structure of the economy towards remaining alternatives
such as housing. The domestic housing market has seen rapid growth, with new residential floor
space doubling from 400 million square metres in 2005 to slightly less than 800 million square
metres in the last 12 months to October 2013. Increased housing activity is supported by the
ongoing process of urbanisation, which is expected to continue for another few decades.8 Moreover,
it also reflects an upgrading of the existing housing stock and a desire for more modern and larger
housing. Nonetheless, authorities have taken measures to avoid speculative investment behaviour,
such as imposing high deposit requirements. According to IMF research,9 full capital account
liberalisation may be followed by an increase in Chinese assets abroad in the order of 15-25% of
GDP and a (smaller) increase in foreign assets in China in the order of 2-10% of GDP, resulting
in an increase of net international assets of 11-18% of GDP. According to these results, the rise in
available international investment opportunities would crowd out some domestic investment in net
terms, thereby reducing the investment intensity of growth.
The underpricing of the cost of capital has also promoted investment. Benchmark lending and
deposit rates have for a long time been set by the PBoC, guaranteeing banks a positive interest
rate margin, while keeping real rates low. Since 2000 the benchmark one-year deposit rate
has fluctuated at around 0% in real terms and has even been negative for prolonged periods of
time. The one-year lending rate has been on average 3.6%. By keeping the return on household
savings low, regulated interest rates amounted to a sizeable, forced transfer of households to
firms, which was estimated at 4% of GDP in 2008, depressing income and hence consumption.10
Furthermore, the PBoC influences the lending policies of banks to ensure that these remain in
8 The United Nations expects the percentage of people in China living in cities to rise from 49.2% in 2010 to 68.7% in 2030 and to 77.3% in
2050 (See “World Urbanization Prospects: the 2011 Revision”, United Nations, April 2012).
9 See Bayoumi, T. and Ohnsorge, F., “Do Inflows or Outflows Dominate? Global Implications of Capital Account Liberalization in China”,
Working Paper Series, IMF, No 189, 2013.
10 See Lardy, N., “Financial Repression in China”, Peterson Institute for International Economics Working Paper, No PB08-8,
September 2008.

89ECB
Monthly Bulletin
January 2014
Medium-term prospects
for China’s economy and
the internationalisation
of the renminbi
ARTICLES
line with national priorities. This system, called “window guidance”, uses moral pressure to steer
lending decisions. In addition to the window guidance system, there are other channels of political
influence over credit flows in China, including government ownership of the largest banks. As a
result, China’s state-owned enterprises seem to enjoy easier access to credit than private firms.11
ELEMENTS OF A STRUCTURAL REFORM PROGRAMME
Reducing the incentives that favour investment will require the implementation of an ambitious
programme of structural reforms. In order to correctly reflect the cost of capital, market-based
interest rates will have to play a larger role, while available capital must be increasingly allowed
to flow across borders in search of higher and more diversified returns. It is likely that any steps
taken to reduce the level of (precautionary) savings in the economy will further facilitate the
transition towards more consumption-based growth. To reduce the high degree of self-financing
by enterprises, the financial system will need to become more efficient and competitive, and
equally capable of providing financing to small and medium-sized private enterprises as to
large state-owned enterprises. Opening up the banking sector for private capital, both domestic
and foreign, could provide the necessary competitive pressure. In order to reduce precautionary
saving by households, social security coverage will have to become more comprehensive.
Increasing the supply of affordable, subsidised housing will also help, while also diminishing
speculative pressures.
Such a reform programme is more than ambitious, as it amounts to redefining the relationship
between the state and the market, increasingly allowing private enterprises and individuals to take
economic decisions. The obstacles to implementing such a reform programme are significant in
view of their inherent complexity. Moreover, in the past such reforms have proven to have their
pitfalls. For example, in many emerging market economies, these kinds of liberalisation initiatives
have entailed banking and currency crises.12
11 See Herrala, R. and Yandong, J., “Has the Chinese Growth Model Changed? A View from the Credit Market”, BOFIT Discussion Paper,
No 5, March 2012.
12 See Ishii, S. and Habermeier, K.,“Capital Account Liberalization and Financial Sector Stability”, Occasional Paper Series, IMF, No 211,
2002; and Schmukler, S., “Financial Globalisation: Gain and Pain for Developing Countries”, Economic Review, Federal Reserve Bank of
Atlanta, 2004, pp. 39-66.
Box 1
ECONOMIC POLICY PRIORITIES UP TO 2020
From 9 to 12 November 2013, the central committee of the Communist Party of China decided
on a comprehensive set of policy and reform priorities, the bulk of which should be implemented
by 2020 and will be overseen by a high-level “leading group”. This box briefly describes
these priorities and assesses their likely impact on China’s economic development and on the
internationalisation of the renminbi.
The following principles underlie the proposed economic reforms: (1) although public ownership
will continue to play a dominant role in the economy, markets will play a decisive role in
allocating resources; (2) regardless of private or public ownership, all enterprises will be able to
90ECB
Monthly Bulletin
January 2014
3 THE INTERNATIONALISATION OF THE RENMINBI
The growing economic influence of China in the global economy has led to discussions about
whether the renminbi might become an important international currency in the years to come. These
discussions have also been fuelled by the announcement of reforms that would ultimately lead to the
compete in most markets under equal and fair conditions; and (3) the Chinese government will
focus on preserving macroeconomic stability and effective regulation, rather than micromanaging
decisions by economic actors.
A wide range of reforms is proposed to achieve these aims. To increase the role of market forces, price
regulations on water, energy products, transport and telecommunication services will be reduced.
Labour mobility will be improved by increasing the possibilities for rural citizens to move to cities
and by giving them greater access to urban public services. At the same time, the transfer of property
rights will be facilitated. Furthermore, market access restrictions will be abolished for all but a limited
number of sensitive industries. Approval procedures and other administrative requirements will be
reduced and relegated to the lowest possible level of government. To ensure a level playing field for
all market participants, existing preferential treatment and hidden barriers will be eliminated, while
the legal system will be strengthened to guarantee equality before the law. To ensure that the financing
capacity of local governments remains in line with its responsibilities, the sharing of revenue between
the levels of government will be adjusted, and the powers of local governments to raise taxes will be
increased, among other things, speeding up the introduction of real estate taxes. It is also proposed to
increase the contribution to the budget of state-owned enterprise profits to 30%. With regard to the
banking sector, competition will be increased by allowing private small and medium-sized banks to
be established. The introduction of a deposit guarantee system as well as a resolution mechanism
for financial institutions is also foreseen. The development of domestic financial markets will be
promoted by strengthening supervision. Finally, market forces will also be allowed to play a greater
role in setting the renminbi exchange rate, while opportunities for cross-border capital transactions
will be increased. Further increasing market access for foreign investment is also foreseen. The
recently established free trade zone in Shanghai is an important test area in that respect.
Given that the decisions taken are broad policy intentions, rather than fully developed plans,
it is difficult to assess their economic impact. Nonetheless, some tentative conclusions can be
drawn. The greater role for market forces should increase the efficiency of labour and capital
allocation, while uniform market conditions and greater competitive pressures should reduce the
opportunities for rent-seeking and increase the scope for productivity gains. A correct pricing of
capital should reduce the investment intensity of growth, while broader access to social security
services could reduce precautionary savings and boost consumption. The further opening-up of
the capital account and development of domestic financial markets should in turn increase the
efficiency of credit allocation and promote the greater international use of the renminbi.
The proposed reforms represent a continuation and intensification of the reform and opening-
up process initiated in 1978. The systemic nature of the proposed reforms signals a desire to
tackle the underlying causes of economic imbalances that have emerged while at the same time
strengthening the economy’s capacity for growth.
91ECB
Monthly Bulletin
January 2014
Medium-term prospects
for China’s economy and
the internationalisation
of the renminbi
ARTICLES
liberalisation of its capital account, its exchange rate regime and domestic financial markets.13 It has
also been argued that the internationalisation of the renminbi has the potential to act as a catalyst for
the reforms that would address China’s imbalances (see Section 2.1), and thereby shift the economy
onto a more sustainable growth path. This section reviews recent developments in the international
use of the renminbi and the economic determinants governing this. It also looks at the prospects
going forward and discusses different views on the gradual progress of the internationalisation
process.
3.1 RECENT DEVELOPMENTS IN THE INTERNATIONAL USE OF THE RENMINBI IN TRADE AND FINANCE
Over the past few years the renminbi has been used increasingly in the settlement of China’s
international trade and financial transactions. For example, between 2010 and mid-2013 the
share of China’s trade in goods settled in renminbi increased from essentially 0% to more than
10% (see Chart 6). The growing use of the renminbi as a trade settlement currency has given
rise to sizeable renminbi deposits in Hong Kong, reaching more than USD 100 billion in mid-
2013, which is equivalent to about 10% of total local deposits (see Chart 7).14 Moreover, the
issuance of renminbi-denominated (“dim-sum”) bonds in Hong Kong has risen sharply since 2007
(see Chart 7). While the bulk of renminbi-denominated bonds issued globally have been issued in
Hong Kong, international issuance has grown in other financial centres after London, Singapore
and Taiwan took steps to become renminbi financial hubs as well. According to data from the BIS,
the international issuance of renminbi-denominated bonds rose sharply from almost none in 2007 to
USD 60 billion in the first quarter of 2013.
The international use of the renminbi as an official reserve currency has remained limited so far,
owing mainly to the fact that it is still largely inconvertible for investment purposes. Only a few
central banks (Austria, Hong Kong, Indonesia, Japan, South Africa, South Korea and Thailand)
have been given approval to participate in China’s Interbank Bond Market Program, which provides
investors with access to China’s onshore interbank bond market,15 although the amounts invested
under this program are believed to be marginal to date.16 Nevertheless, there appears to be large
potential for an expansion of the investor base, as a recent survey of reserve managers found that
37% of respondents would consider investing in the renminbi within the next five to ten years.17
13 See “The timing, path and strategies of renminbi internationalisation”, PBoC, 2006; the 12th Five-year Plan of the Chinese State Council
in 2011; and “The conditions for accelerating the opening of China’s capital account are basically mature”, PBoC, 2013.
14 Renminbi deposits in Hong Kong have stabilised since late 2011 owing to greater use of the renminbi to pay for imports from China,
thereby creating a more, although not fully, balanced receipt-to-payment ratio. It has been argued that a major reason for the decline in
the receipt-to-payment ratio has been the weakening of expectations since 2012 that the renminbi will appreciate vis-à-vis the US dollar,
see Yu, Y., “Revisiting the Internationalization of the Yuan”, ADBI Working Paper, No 366, July 2012. Another reason for the slowdown
in the growth of renminbi-denominated deposits in Hong Kong may have been the introduction of the Renminbi Qualified Institutional
Investor Scheme, which allows renminbi funds held offshore to be invested in mainland China (see Section 3.2); moreover, the growth in
offshore renminbi deposits may also have slowed down as a result of the increase in the issuance of renminbi-denominated certificates of
deposits in Hong Kong, which has grown from CNY 6.8 billion in 2010 to CNY 117.3 billion in 2012 according to data from the Hong
Kong Monetary Authority (see http://www.hkma.gov.hk/eng/key-information/insight/20130221.shtml).
15 See Ballantyne, A. Garner, M. and Wright, M., “Developments in Renminbi Internationalisation”, Bulletin, Reserve Bank of Australia,
June Quarter, 2013.
16 Some evidence suggests that only about 0.17% of global reserves are accounted for by renminbi-denominated securities, see McDowell,
D., “Taking on the Dollar: Japanese and Chinese Currency Internationalization in Comparative Perspective”, paper prepared for the
Workshop on Crisis and Change in the Global Monetary System, Ghent Institute of International Studies, Belgium, 20 March 2013.
Recently, Australia announced it would invest 5% of its foreign reserves in Chinese government bonds (see http://www.ft.com/intl/
cms/s/0/f679dad8-aca0-11e2-9454-00144feabdc0.html?siteedition=intl#axzz2iLF76J9s).
17 See “RBS Reserve Management Trends 2013”, Royal Bank of Scotland, 2013.

92ECB
Monthly Bulletin
January 2014
Despite the impressive growth in the use of the renminbi in trade and financial transactions, its use
remains limited. For example, trade settlement in renminbi is focused mainly on China’s trade with
neighbouring Asian economies: in 2012 almost 60% of trade settled in renminbi was with Hong
Kong, while together Japan, Macau, Singapore and Taiwan accounted for another 15%, according
to data from the PBoC.18 Similarly, while the amount of renminbi-denominated international bonds
and notes outstanding has grown significantly, they only account for about 0.3% of the global
amount of bonds and notes outstanding as at the second quarter of 2013.
3.2 DETERMINANTS OF THE GROWING INTERNATIONAL USE OF THE RENMINBI
Economies issuing currencies that are used widely in international trade and financial transactions
typically account for a large share of global output and trade, feature macroeconomic stability,
as well as deep, liquid and broad domestic financial markets. Beyond these classic determinants
of an international currency, it has often been argued that an economy needs to have an open
capital account and a flexible exchange rate in order for its currency to play an important role in
the international monetary system, in particular as a reserve currency.19, 20 The following sections
discuss the extent to which China and the renminbi meet these criteria.
18 See Jin, Z., “The use of RMB in international transactions: Background, development and prospect”, keynote speech held at the conference
on the “Internationalization of the Renminbi”, University of California, San Diego, 7 June 2012.
19 See Ito, T., “The internationalisation of the RMB: Opportunities and pitfalls”, Council on Foreign Relations, Washington D.C., 2011; and
Prasad, E. and Ye, L., “The Renminbi’s Role in the Global Monetary System”, Brookings, Washington DC, February 2012.
20 For discussions on whether these are necessary conditions or whether they merely help in the process of currency internationalisation,
see Prasad, E., Rumbaugh, T. and Wang, Q., “Putting the Cart Before the Horse? Capital Account Liberalization and Exchange Rate
Flexibility in China”, Policy Discussion Paper, IMF, No 05/1, 2005; and Vallée, S., “The internationalisation path of the renminbi”,
Bruegel Working Paper, 2012/05, Brussels, 2012. It has also been argued that currency convertibility is a necessary condition for a
currency to gain international reserve status, see Prasad, E. and Ye, L., ibid, 2012.
Chart 6 Share of renminbi-denominated settlements in China’s trade in goods
(percentages)
0
2
4
6
8
10
12
2010 2011 2012 2013
0
2
4
6
8
10
12
Sources: CEIC and PBoC.
Chart 7 Renminbi-denominated deposits in Hong Kong and dim-sum bond issuance
(USD billions)
0
40
80
120
160
200
0
10
20
30
40
50
2004 2005 2006 2007 2008 2009 2010 2011 2012 2013
dim-sum bond insurance
renminbi deposits in Hong Kong (right-hand scale)
Sources: CEIC and HKM for deposits and Bloomberg for dim-sum bond issuance.Note: Data for 2013 refer to August 31 for deposits and 6 October for dim-sum bonds issuance.

93ECB
Monthly Bulletin
January 2014
Medium-term prospects
for China’s economy and
the internationalisation
of the renminbi
ARTICLES
ECONOMIC WEIGHT AND MACROECONOMIC STABILITY
In terms of nominal GDP, China is currently the third largest economy in the world, having
overtaken Japan in 2010. Moreover, the IMF projects that China will soon overtake the euro
area to become the world’s second largest economy. Similarly, according to IMF data, while
China accounted for 4% of trade in global goods in 2000, this share grew to 11% in 2012, which
is comparable to the figure for the United States. However, despite the growing size of China’s
economy and its increasing share in global trade, the switch from local or vehicle currency pricing
to producer currency pricing in export settlement will depend, among other factors, on the strength
of incumbency effects (which favour the use of the US dollar or the euro in many of China’s export
markets) and on the market and bargaining power of China’s exporters, which some believe to be
limited.21 As regards macroeconomic stability, over the past decade China’s inflation and output
growth records have been remarkable. Since 2000 average inflation, at 2.3%, has been low and
average output growth has amounted to 10%. However, it is not clear whether China will manage to
maintain this performance in terms of output growth and inflation (see Section 2.1).
DOMESTIC FINANCIAL MARKET DEVELOPMENT
China’s domestic financial markets remain less developed compared with those in the United
States, for example. In 2011 China set out a programme of reforms up to 2015 to develop its
domestic financial markets in the 12th Five-year Plan for the Development and Reform of
the Financial Industry. These include more market-based determination of interest rates,
financial innovation and coverage, more sophisticated risk management and surveillance.
Some of these goals have already been achieved, such as the liberalisation of lending rates.22
However, despite these efforts, China’s financial markets remain insufficiently deep,
liquid and broad to generate substantive international demand for renminbi-denominated
financial instruments.23
CAPITAL ACCOUNT LIBERALISATION
Except for foreign direct investment, compared with advanced economies, China’s capital
account remains largely closed and subject to tight regulation. In particular, portfolio investment
is significantly more restricted than foreign direct investment and is allowed to enter mainland
China’s financial market only through special schemes. For example, foreign-currency inward
portfolio investment is channelled through the Qualified Foreign Institutional Investor (QFII)
scheme. Under the QFII scheme, investments are subject to a lock-in period of up to one year
and an aggregate ceiling of USD 150 billion (as of July 2013), the pool of eligible applicants for
participation in the scheme is limited and excludes private individuals, and repatriation of invested
capital is subject to SAFE approval, which also applies to profits under certain circumstances.
The Renminbi Qualified Foreign Institutional Investor scheme (RQFII) is similar to the QFII, but
applies to inward portfolio investment undertaken with renminbi held offshore.24 Outward portfolio
investment, in turn, is channelled through the Qualified Domestic Institutional Investor (QDII)
scheme. While absolute amounts of cross-border portfolio investment under these schemes have
21 See Jin, Z., op. cit.
22 In another attempt to introduce gradual reform, since early 2013 China’s authorities have allowed borrowers and lenders to negotiate
interest rates freely for cross-border loans in renminbi in the “Special Qianhai Financial Zone”, see Sekine, E., “Start of Chinese
experimentation in financial deregulation”, Nomura Journal of Capital Markets, Vol. 5(1), 2013.
23 See also Eichengreen, B., “Renminbi Internationalization: Tempest in a teapot?”, Asian Development Bank Distinguished Lecture,
Manila, 11 January 2013, and Yu, Y., op. cit.
24 Recently, the RQFII scheme has been expanded to include London and Singapore (see http://www.ft.com/intl/cms/s/0/9579f608-
356e-11e3-b539-00144feab7de.html?siteedition=intl#axzz2iLF76J9s and http://www.ft.com/intl/cms/s/0/f3fe0f00-3ae8-11e3-87fa-
00144feab7de.html?siteedition=intl#axzz2iLF76J9s).
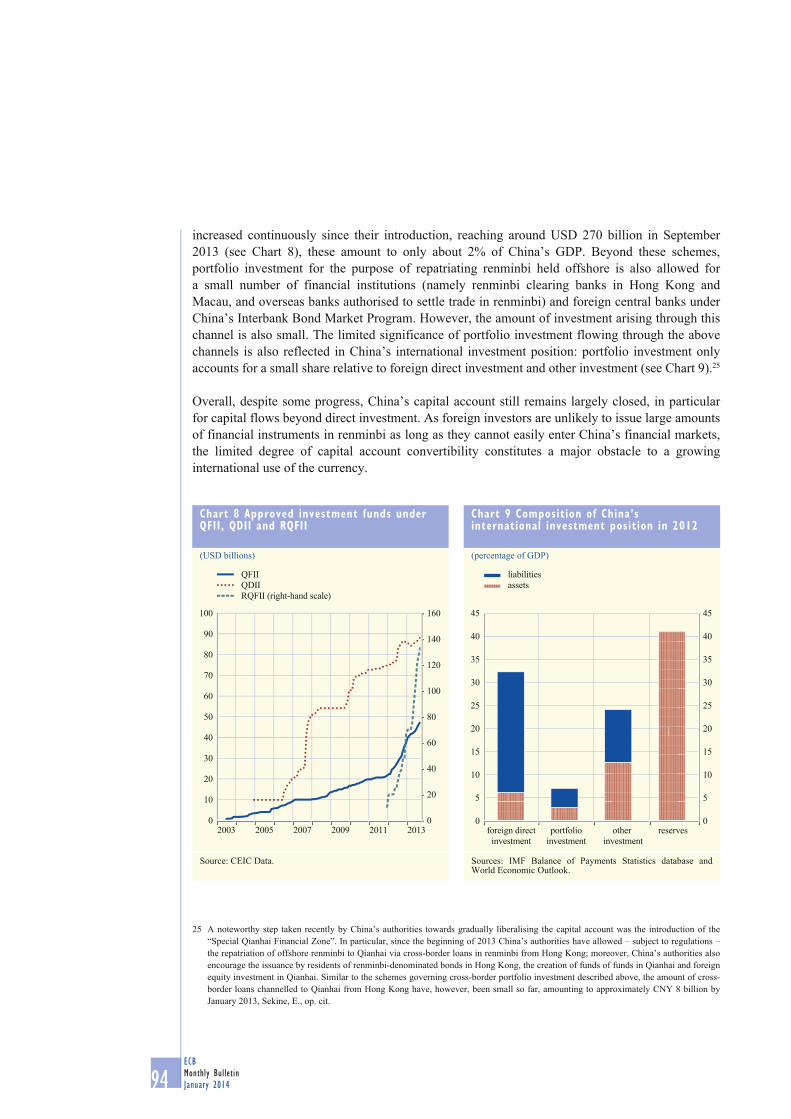
94ECB
Monthly Bulletin
January 2014
increased continuously since their introduction, reaching around USD 270 billion in September
2013 (see Chart 8), these amount to only about 2% of China’s GDP. Beyond these schemes,
portfolio investment for the purpose of repatriating renminbi held offshore is also allowed for
a small number of financial institutions (namely renminbi clearing banks in Hong Kong and
Macau, and overseas banks authorised to settle trade in renminbi) and foreign central banks under
China’s Interbank Bond Market Program. However, the amount of investment arising through this
channel is also small. The limited significance of portfolio investment flowing through the above
channels is also reflected in China’s international investment position: portfolio investment only
accounts for a small share relative to foreign direct investment and other investment (see Chart 9).25
Overall, despite some progress, China’s capital account still remains largely closed, in particular
for capital flows beyond direct investment. As foreign investors are unlikely to issue large amounts
of financial instruments in renminbi as long as they cannot easily enter China’s financial markets,
the limited degree of capital account convertibility constitutes a major obstacle to a growing
international use of the currency.
25 A noteworthy step taken recently by China’s authorities towards gradually liberalising the capital account was the introduction of the
“Special Qianhai Financial Zone”. In particular, since the beginning of 2013 China’s authorities have allowed – subject to regulations –
the repatriation of offshore renminbi to Qianhai via cross-border loans in renminbi from Hong Kong; moreover, China’s authorities also
encourage the issuance by residents of renminbi-denominated bonds in Hong Kong, the creation of funds of funds in Qianhai and foreign
equity investment in Qianhai. Similar to the schemes governing cross-border portfolio investment described above, the amount of cross-
border loans channelled to Qianhai from Hong Kong have, however, been small so far, amounting to approximately CNY 8 billion by
January 2013, Sekine, E., op. cit.
Chart 9 Composition of China’s international investment position in 2012
(percentage of GDP)
0
5
10
15
20
25
30
35
40
45
foreign direct
investment
portfolio
investment
other
investment
reserves
assets
liabilities
0
5
10
15
20
25
30
35
40
45
Sources: IMF Balance of Payments Statistics database and World Economic Outlook.
Chart 8 Approved investment funds under QFII, QDII and RQFII
(USD billions)
0
20
40
60
80
100
120
140
160
0
10
20
30
40
50
60
70
80
90
100
2003 2005 2007 2009 2011 2013
QFII
QDII
RQFII (right-hand scale)
Source: CEIC Data.
95ECB
Monthly Bulletin
January 2014
Medium-term prospects
for China’s economy and
the internationalisation
of the renminbi
ARTICLES
EXCHANGE RATE FLEXIBILITY
The experience of a number of emerging market economies has shown that limited exchange
rate flexibility after opening the capital account may increase an economy’s vulnerability to
volatile capital flows, for example through currency mismatches between short-term assets
and liabilities. By appreciating in times of surges in capital inflows, allowing an independent
monetary policy and generating incentives for domestic financial markets to develop, a flexible
exchange rate is an important precondition for successful capital account liberalisation.26
As a consequence, despite the recent widening of the trading band, the limited flexibility of
China’s exchange rate continues to be viewed as an additional obstacle to the internationalisation
of the renminbi.27, 28
3.3 POLICIES SUPPORTING THE INTERNATIONAL USE OF THE RENMINBI
Another determinant of the international use of a currency beyond economic weight, macroeconomic
stability, domestic financial market development, capital account openness and exchange rate
flexibility, is the role played by supporting policies. In China, such policies have, for example,
aimed at liberalising its current account. For example, in 2009 a pilot project for settling trade
in renminbi was launched. It was initially limited to a small number of Chinese cities, firms and
trading partners, but was extended in 2012 so that (almost) all of China’s trade can now be settled
in renminbi. In order to foster the international use of the renminbi in trade, the authorities have
also developed a network of bilateral swap agreements between the PBoC and 25 foreign central
banks in a total amount of more than USD 400 billion (as of October 2013). So far, however, only
marginal amounts have been drawn from these swap lines. 29
26 See Rajan, R. and Subramanian, A., “Exchange rate flexibility is in Asia’s interest”, Financial Times, 26 September 2004; Prasad, E.,
Rumbaugh, T. and Wang, Q., op. cit. and Yu, Y., op. cit.
27 See He, D., Cheung, L., Zhang, W.L. and Wu, T., “How would capital account liberalization affect China’s capital flows and the renminbi
real exchange rate?”, China and the World Economy, Vol. 20, 2012, pp. 29-54.
28 The renminbi exchange rate has been allowed to float within a narrow band around a central parity determined with reference to a basket
of world currencies since 2005. Since April 2012 the band has been expanded to 1% around the central parity.
29 See “The PBoC Annual Report”, PBoC, 2012.
Box 2
ESTABLISHMENT OF A BILATERAL CURRENCY SWAP AGREEMENT BETWEEN THE ECB AND THE PBOC
On 8 October 2013 the ECB and the People’s Bank of China (PBoC) established a bilateral
currency swap arrangement to purchase and subsequently repurchase Chinese renminbi and euro
from each other. The swap agreement, which will be valid for three years, has a maximum size
of CNY 350 billion when renminbi are provided to the ECB, and of €45 billion when euro are
provided to the PBoC. From the ECB’s perspective, the swap line serves as a backstop facility to
address sudden and temporary disruptions in the renminbi market owing to liquidity shortages.
The calibration of the operational parameters with which renminbi will be offered to euro area
banks will be consistent with this purpose. The euro/renminbi swap facility is not intended to
address any current malfunctioning, but to reassure market participants that a safety net is in place
to address possible future market malfunctioning and to reassure euro area banks regarding the
continuous provision of renminbi. The latter has become increasingly important given rapidly
growing bilateral trade and investment flows between China and the euro area, which have

96ECB
Monthly Bulletin
January 2014
3.4 OUTLOOK FOR INTERNATIONALISATION OF THE RENMINBI
The role of the renminbi in the future international monetary system is difficult to predict. First,
it has been argued that the adoption of a gradual approach towards the internationalisation of
the renminbi stems from the intention of China’s authorities to benefit from capital account and
exchange rate liberalisation while limiting possible risks.30 For example, it is thought that capital
account liberalisation is being pursued slowly so as not to expose underdeveloped domestic financial
markets to volatile capital flows too quickly. At the same time, it is suggested that China has
liberalised selected capital account transactions to allow limited foreign participation in domestic
financial markets in order to import technology and know-how, thereby benefiting from so-called
collateral benefits.31 The sequencing of the liberalisation of China’s capital account – according
to the principle of “inflows before outflows, long-term investment before short-term investment,
and institutional investment before private investment” – has also been ascribed to this spirit.32
Under this view, it is expected that China’s capital account and exchange rate will eventually be
liberalised to a large extent. As a result of strong fundamentals and helped by supporting policies,
it is believed that the renminbi will become an important international currency. It has also been
claimed that the policies adopted to support the internationalisation of the renminbi have acted as
catalysts for pressing forward with domestic reforms.33
30 See Yu, Y., op. cit.; and Prasad, E. and Ye, L., op. cit.
31 See Dell’Ariccia, G., Di Giovanni, J., Faria, A., Kose, A., Mauro, P. Ostry, J., Schindler, M. and Terrones, M., “Reaping the Benefits
of Financial Globalization”, Occasional Paper Series, IMF, No 264, 2008; and Kose, M.A., Prasad, E.S., Rogoff, K. and Wei, S.J.,
“Financial Globalization: A Reappraisal”, IMF Staff Papers, IMF, Vol. 56, No 1, 2009, pp. 8-62.
32 See “Financial Statistics Report”, PBoC, 2011. China’s gradual approach to capital account liberalisation and domestic financial market
reforms is broadly in line with recent recommendations by the IMF (see “The Liberalization and Management of Capital Flows: An Institutional View”, IMF, November 2012). China’s gradual approach is also in line with the implications of several empirical studies,
which find that the benefits of capital account liberalisation can only be reaped if a minimum level of domestic financial and institutional
development has been reached, see Dell’Ariccia, G., Di Giovanni, J., Faria, A., Kose, A., Mauro, P., Ostry, J., Schindler, M. and Terrones,
M., op. cit.; Kose, M.A., Prasad, E.S., Rogoff, K. and Wei, S.J., op. cit.; and Kose, A. and Taylor, A., “Thresholds in the process of
international financial integration”, Journal of International Money and Finance, 30(1), 2011, pp. 147-179; some observers have argued
that the necessary preconditions for successful capital account liberalisation have not yet been met in China, see Lardy, N., “Financial
Repression in China”, Peterson Institute for International Economics Working Paper, No PB08-8, September 2008.
33 See Frankel, J., “Historical precedents for internationalisation of the RMB”, Council on Foreign Relations, Washington DC, 2011;
Subramanian, A., “Renminbi rules: the conditional imminence of the reserve currency transition”, Peterson Institute for International Economics Working Paper, Vol. 11-14, 2012; Thornton, A., “Anaemic ascent: Why China’s currency is far from going global”, Lowy
Institute for International Policy Analysis, 2012; Yu, Y., op. cit.; and Ma, J. and Hui, M., “The impact of financial liberalization on
China’s financial sector” in Udaibir S.D., Fiechter, J. and Sun, T. (eds.), “China’s Road to Greater Financial Stability: Some Policy Perspectives”, IMF, Washington, D.C., July 2013, pp. 191-199.
increased demand for renminbi-denominated financial services within the euro area. The swap
arrangement is only intended to be used as a backstop facility to address sudden and temporary
disruptions in the renminbi market owing to liquidity shortages. It is not intended for use over an
extended period of time, and could therefore not function as an effective policy tool to affect the
exchange rate or alleviate pressures related to cross-border transfer restrictions. The establishment
of the swap line with the PBoC is consistent with the network of swap lines that the ECB has
established with other central banks in systemically important economies, the growing global
systemic importance of China, the closer ties between Europe and China, the growing offshore
renminbi market in Europe, where many euro area banks are actively engaged, and the actions of
the ECB to ensure and preserve the stability of the financial markets. Therefore, the conclusion
of the swap agreement with the PBoC reflects the uniqueness of China and its rapidly growing
systemic relevance. In this respect, the conclusion of the swap agreement with China is not
a precedent and does not pave the way for the conclusion of additional swap lines with other
countries.

97ECB
Monthly Bulletin
January 2014
Medium-term prospects
for China’s economy and
the internationalisation
of the renminbi
ARTICLES
Second, others have argued that the gradual nature of the progress made on the liberalisation of the
capital account and the renminbi exchange rate has resulted from diverging views within China’s
leadership about the desirable extent of reforms.34 From this perspective, whether the renminbi will
become an important international currency will depend on the extent to which market forces rather
than state intervention eventually determine China’s economic development.
4 CONCLUSION
Although China has made progress on reducing its external imbalances, internal imbalances – in
particular a high investment ratio and high leverage – have continued to grow. Tackling these
imbalances will require the implementation of ambitious structural reforms aimed at reducing
incentives that favour investment and saving over consumption. Such reforms will have an impact
on the real and financial sectors, and will redefine the role of the State in economic decision-
making. In this context, reforms that promote the internationalisation of the renminbi could act as a
catalyst for domestic reforms. In turn, reforms aimed at reducing imbalances also promote domestic
stability and the attractiveness of the renminbi as an investment currency.
34 See Cohen, B., “The Yuan tomorrow? Evaluating China’s currency internationalization strategy”, New Political Economy, Vol. 17(3),
July 2012; Heep, S., “China in Global Finance: Domestic Financial Repression and International Financial Power”, Springer, Berlin,
forthcoming; and Hess, P., “China’s Financial System: Past Reforms, Future Ambitions and Current State” in Rövekamp, F. and Hilpert,
H.G. (eds.), “Currency Cooperation in East Asia”, Springer, Heidelberg, forthcoming.


ECB
Monthly Bulletin
January 2014 S 1
EURO AREA STATISTICS

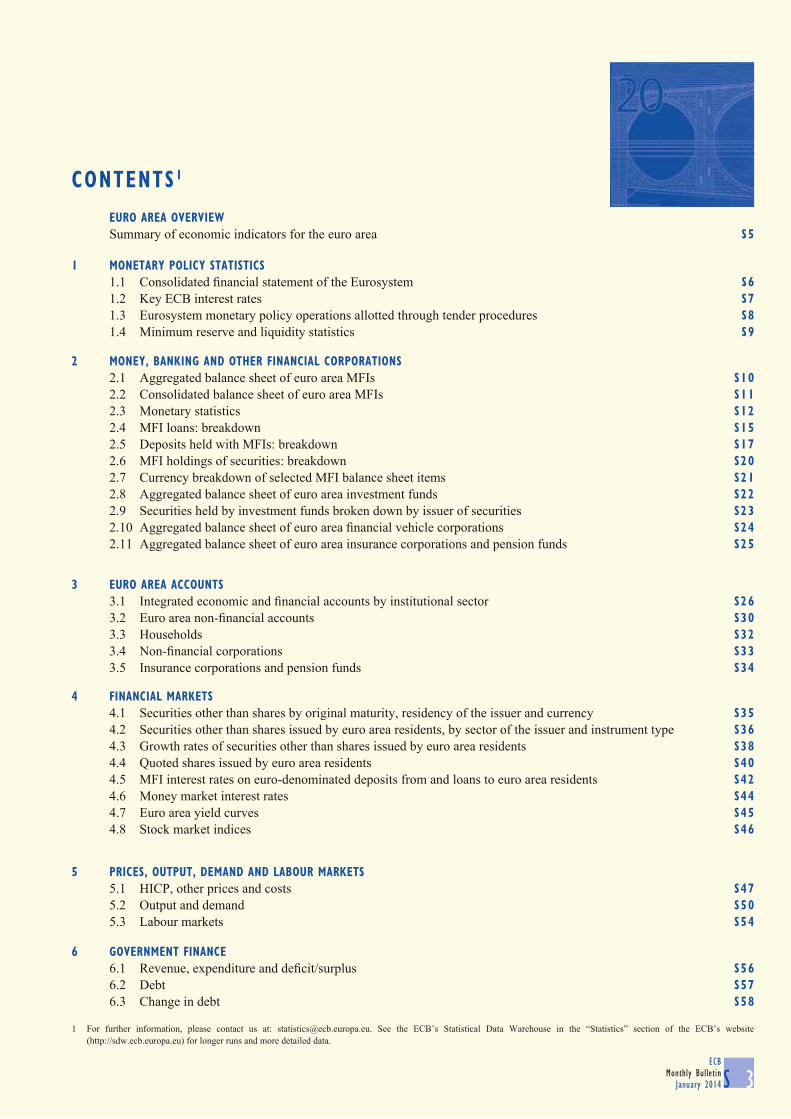
ECB
Monthly Bulletin
January 2014 S 3
CONTENTS1
EURO AREA OVERVIEW
Summary of economic indicators for the euro area S5
1 MONETARY POLICY STATISTICS
1.1 Consolidated fi nancial statement of the Eurosystem S6
1.2 Key ECB interest rates S7
1.3 Eurosystem monetary policy operations allotted through tender procedures S8
1.4 Minimum reserve and liquidity statistics S9
2 MONEY, BANKING AND OTHER FINANCIAL CORPORATIONS
2.1 Aggregated balance sheet of euro area MFIs S10
2.2 Consolidated balance sheet of euro area MFIs S11
2.3 Monetary statistics S12
2.4 MFI loans: breakdown S15
2.5 Deposits held with MFIs: breakdown S17
2.6 MFI holdings of securities: breakdown S20
2.7 Currency breakdown of selected MFI balance sheet items S21
2.8 Aggregated balance sheet of euro area investment funds S22
2.9 Securities held by investment funds broken down by issuer of securities S23
2.10 Aggregated balance sheet of euro area fi nancial vehicle corporations S24
2.11 Aggregated balance sheet of euro area insurance corporations and pension funds S25
3 EURO AREA ACCOUNTS
3.1 Integrated economic and fi nancial accounts by institutional sector S26
3.2 Euro area non-fi nancial accounts S30
3.3 Households S32
3.4 Non-fi nancial corporations S33
3.5 Insurance corporations and pension funds S34
4 FINANCIAL MARKETS
4.1 Securities other than shares by original maturity, residency of the issuer and currency S35
4.2 Securities other than shares issued by euro area residents, by sector of the issuer and instrument type S36
4.3 Growth rates of securities other than shares issued by euro area residents S38
4.4 Quoted shares issued by euro area residents S40
4.5 MFI interest rates on euro-denominated deposits from and loans to euro area residents S42
4.6 Money market interest rates S44
4.7 Euro area yield curves S45
4.8 Stock market indices S46
5 PRICES, OUTPUT, DEMAND AND LABOUR MARKETS
5.1 HICP, other prices and costs S47
5.2 Output and demand S50
5.3 Labour markets S54
6 GOVERNMENT FINANCE
6.1 Revenue, expenditure and defi cit/surplus S56
6.2 Debt S57
6.3 Change in debt S58
1 For further information, please contact us at: [email protected]. See the ECB’s Statistical Data Warehouse in the “Statistics” section of the ECB’s website
(http://sdw.ecb.europa.eu) for longer runs and more detailed data.
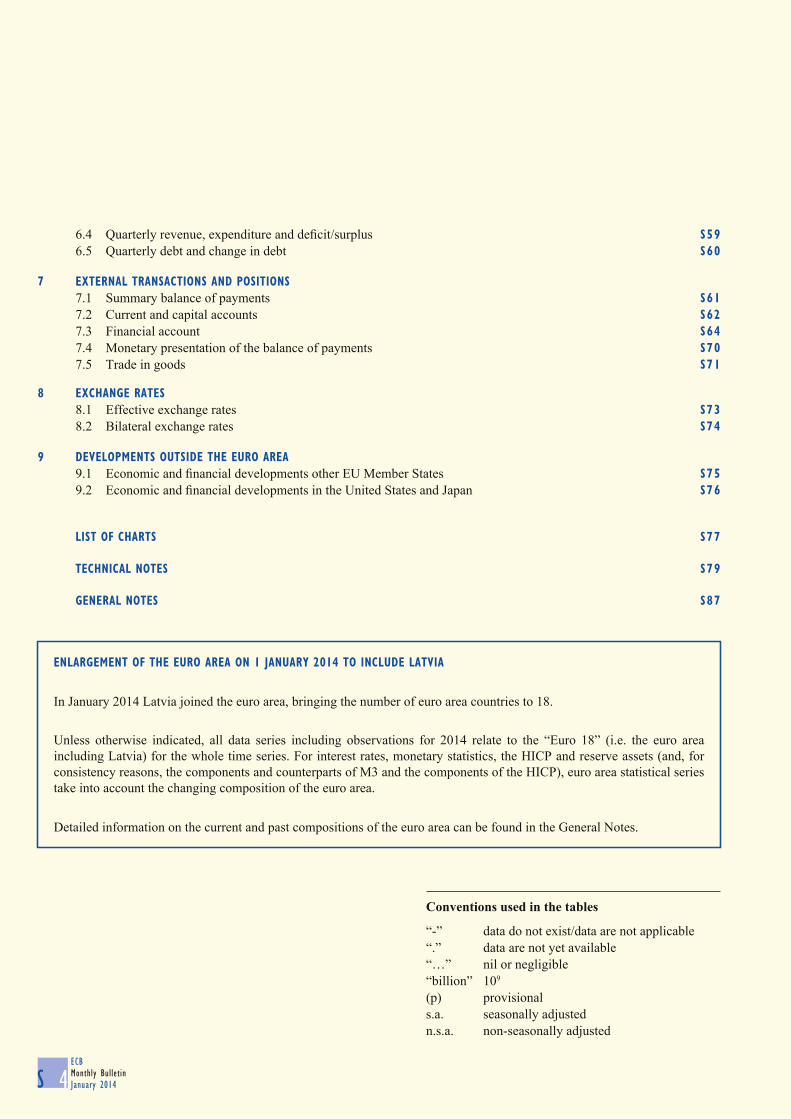
ECB
Monthly Bulletin
January 2014S 4
6.4 Quarterly revenue, expenditure and defi cit/surplus S59
6.5 Quarterly debt and change in debt S60
7 EXTERNAL TRANSACTIONS AND POSITIONS
7.1 Summary balance of payments S61
7.2 Current and capital accounts S62
7.3 Financial account S64
7.4 Monetary presentation of the balance of payments S70
7.5 Trade in goods S71
8 EXCHANGE RATES
8.1 Effective exchange rates S73
8.2 Bilateral exchange rates S74
9 DEVELOPMENTS OUTSIDE THE EURO AREA
9.1 Economic and fi nancial developments other EU Member States S75
9.2 Economic and fi nancial developments in the United States and Japan S76
LIST OF CHARTS S77
TECHNICAL NOTES S79
GENERAL NOTES S87
Conventions used in the tables
“-” data do not exist/data are not applicable
“.” data are not yet available
“…” nil or negligible
“billion” 109
(p) provisional
s.a. seasonally adjusted
n.s.a. non-seasonally adjusted
ENLARGEMENT OF THE EURO AREA ON 1 JANUARY 2014 TO INCLUDE LATVIA
In January 2014 Latvia joined the euro area, bringing the number of euro area countries to 18.
Unless otherwise indicated, all data series including observations for 2014 relate to the “Euro 18” (i.e. the euro area
including Latvia) for the whole time series. For interest rates, monetary statistics, the HICP and reserve assets (and, for
consistency reasons, the components and counterparts of M3 and the components of the HICP), euro area statistical series
take into account the changing composition of the euro area.
Detailed information on the current and past compositions of the euro area can be found in the General Notes.

EURO AREA OVERVIEW
Summary of economic indicators for the euro area (annual percentage changes, unless otherwise indicated)
S 5ECB
Monthly BulletinJanuary 2014
1. Monetary developments and interest rates 1)
M1 2) M2 2) M3 2), 3) M3 2), 3) MFI loans to Securities other 3-month 10-year3-month euro area than shares issued interest rate spot rate
moving average residents in euro by non-MFI (EURIBOR; (% per annum;(centred) excluding MFIs corporations 2) % per annum; end of
and general period period) 4)
government 2) averages)
1 2 3 4 5 6 7 8
2012 4.0 3.1 2.9 - -0.2 1.2 0.58 1.722013 . . . - . . 0.22 2.24
2013 Q1 6.8 4.3 3.2 - -0.8 1.5 0.21 1.76 Q2 8.1 4.6 2.9 - -1.1 0.2 0.21 2.14 Q3 7.0 4.1 2.2 - -1.9 1.9 0.22 2.05 Q4 . . . - . . 0.24 2.24
2013 July 7.1 4.1 2.2 2.3 -1.9 1.8 0.22 1.95 Aug. 6.8 4.0 2.3 2.2 -2.1 2.4 0.23 2.17 Sep. 6.7 3.8 2.0 1.9 -2.1 2.7 0.22 2.05 Oct. 6.6 3.2 1.4 1.7 -2.2 2.1 0.23 1.95 Nov. 6.5 3.1 1.5 . -2.3 . 0.22 1.99 Dec. . . . . . . 0.27 2.24
2. Prices, output, demand and labour markets 5)
HICP 1) Industrial Hourly Real GDP Industrial Capacity Employment Unemploymentproducer labour (s.a.) production utilisation in (s.a.) (% of labour
prices costs excluding manufacturing force; s.a.)construction (%)
1 2 3 4 5 6 7 8
2012 2.5 2.8 1.9 -0.7 -2.5 78.6 -0.7 11.42013 1.3 . . . . . . .
2013 Q2 1.4 -0.1 1.1 -0.6 -1.0 77.9 -1.0 12.1 Q3 1.3 -0.6 1.0 -0.4 -1.1 78.4 -0.8 12.1 Q4 0.8 . . . . . . .
2013 July 1.6 0.0 - - -2.0 78.3 - 12.1 Aug. 1.3 -0.9 - - -1.5 - - 12.1 Sep. 1.1 -0.9 - - 0.2 - - 12.1 Oct. 0.7 -1.3 - - 0.2 78.4 - 12.1 Nov. 0.9 -1.2 - - . - - 12.1 Dec. 0.8 . - - . - - .
3. External statistics(EUR billions, unless otherwise indicated)
Balance of payments (net transactions) Reserve assets Net Gross Effective exchange rate of USD/EUR
(end-of-period international external debt the euro: EER-21 6) exchange rateCurrent and Combined positions) investment (as a % of GDP) (index: 1999 Q1 = 100)
capital Goods direct and positionaccounts portfolio (as a % of GDP) Nominal Real (CPI)
investment1 2 3 4 5 6 7 8 9
2012 131.2 94.9 68.8 689.4 -13.3 127.5 97.9 95.5 1.28482013 . . . . . . 101.7 98.9 1.3281
2013 Q1 26.4 30.7 -7.5 687.8 -12.4 129.1 100.8 98.2 1.3206 Q2 58.1 52.1 18.4 564.3 -13.8 126.8 100.9 98.2 1.3062 Q3 58.0 41.7 -35.6 586.8 . . 101.9 99.1 1.3242 Q4 . . . . . . 103.1 99.9 1.3610
2013 July 28.4 19.7 -44.4 588.7 - - 101.5 98.9 1.3080 Aug. 13.8 8.3 17.4 613.0 - - 102.2 99.5 1.3310 Sep. 15.8 13.7 -8.6 586.8 - - 102.0 99.1 1.3348 Oct. 28.5 19.6 -6.7 579.6 - - 102.9 99.7 1.3635 Nov. . . . 561.5 - - 102.7 99.5 1.3493 Dec. . . . . - - 103.9 100.6 1.3704
Sources: ECB, European Commission (Eurostat and Economic and Financial Affairs DG) and Thomson Reuters.Note: For more information on the data, see the relevant tables later in this section.1) Data refer to the changing composition of the euro area. For further information, see the General Notes.2) Annual percentage changes for monthly data refer to the end of the month, whereas those for quarterly and yearly data refer to the annual change in the period average.
See the Technical Notes for details.3) M3 and its components exclude holdings by non-euro area residents of money market fund shares/units and debt securities with a maturity of up to two years.4) Based on AAA-rated euro area central government bond yield curves. For further information, see Section 4.7.5) Data refer to the Euro 17, unless otherwise indicated.6) For a definition of the trading partner groups and other information, please refer to the General Notes.

1 MONETARY POLICY STATISTICS
1.1 Consolidated financial statement of the Eurosystem (EUR millions)
S 6ECBMonthly BulletinJanuary 2014
1. Assets
6 December 2013 13 December 2013 20 December 2013 27 December 2013 3 January 2014
Gold and gold receivables 343,920 343,920 343,920 343,920 303,156 Claims on non-euro area residents in foreign currency 244,585 243,659 243,969 245,654 241,563 Claims on euro area residents in foreign currency 23,602 23,849 23,283 22,964 23,237 Claims on non-euro area residents in euro 20,374 20,187 19,515 19,517 20,194 Lending to euro area credit institutions in euro 709,297 713,016 723,303 717,142 752,259 Main refinancing operations 94,625 98,495 118,911 133,585 168,662 Longer-term refinancing operations 614,514 614,393 604,050 583,325 583,325 Fine-tuning reverse operations 0 0 0 0 0 Structural reverse operations 0 0 0 0 0 Marginal lending facility 158 128 341 232 270 Credits related to margin calls 1 1 1 0 2 Other claims on euro area credit institutions in euro 75,888 73,234 74,194 74,985 73,545 Securities of euro area residents in euro 591,441 591,937 585,284 586,050 591,184 Securities held for monetary policy purposes 241,421 241,251 235,412 235,412 235,929 Other securities 350,020 350,686 349,872 350,638 355,255 General government debt in euro 28,328 28,326 28,326 28,326 28,287 Other assets 243,359 244,893 245,739 246,842 245,133
Total assets 2,280,794 2,283,020 2,287,531 2,285,399 2,278,560
2. Liabilities
6 December 2013 13 December 2013 20 December 2013 27 December 2013 3 January 2014
Banknotes in circulation 935,063 938,657 950,471 958,265 952,900 Liabilities to euro area credit institutions in euro 442,136 446,054 462,481 443,733 492,037 Current accounts (covering the minimum reserve system) 203,674 223,637 256,078 244,083 298,943 Deposit facility 54,069 38,341 53,345 59,628 88,213 Fixed-term deposits 184,000 184,000 152,251 139,920 104,842 Fine-tuning reverse operations 0 0 0 0 0 Deposits related to margin calls 394 76 808 102 39 Other liabilities to euro area credit institutions in euro 5,226 4,980 4,208 4,204 3,239 Debt certificates issued 0 0 0 0 0 Liabilities to other euro area residents in euro 103,771 104,310 81,371 82,342 81,007 Liabilities to non-euro area residents in euro 114,323 110,181 109,631 115,209 114,211 Liabilities to euro area residents in foreign currency 1,976 2,049 2,372 4,434 4,791 Liabilities to non-euro area residents in foreign currency 5,590 5,042 4,024 3,193 3,170 Counterpart of special drawing rights allocated by the IMF 53,565 53,565 53,565 53,565 52,717 Other liabilities 224,190 223,226 224,454 225,500 220,911 Revaluation accounts 304,534 304,534 304,534 304,534 262,876 Capital and reserves 90,420 90,420 90,420 90,420 90,701
Total liabilities 2,280,794 2,283,020 2,287,531 2,285,399 2,278,560
Source: ECB.
1

EURO AREASTATISTICS
Monetarypolicy
statistics
1.2 Key ECB interest rates (levels in percentages per annum; changes in percentage points)
S 7ECB
Monthly BulletinJanuary 2014
With effect from: 1) Deposit facility Main refinancing operations Marginal lending facility
Fixed rate tenders Variable rate tenders Fixed rate Minimum bid rate
Level Change Level Level Change Level Change
1 2 3 4 5 6 7
1999 1 Jan. 2.00 - 3.00 - - 4.50 - 4 2) 2.75 0.75 3.00 - ... 3.25 -1.25
22 2.00 -0.75 3.00 - ... 4.50 1.259 Apr. 1.50 -0.50 2.50 - -0.50 3.50 -1.005 Nov. 2.00 0.50 3.00 - 0.50 4.00 0.50
2000 4 Feb. 2.25 0.25 3.25 - 0.25 4.25 0.2517 Mar. 2.50 0.25 3.50 - 0.25 4.50 0.2528 Apr. 2.75 0.25 3.75 - 0.25 4.75 0.25
9 June 3.25 0.50 4.25 - 0.50 5.25 0.5028 3) 3.25 ... - 4.25 ... 5.25 ...
1 Sep. 3.50 0.25 - 4.50 0.25 5.50 0.256 Oct. 3.75 0.25 - 4.75 0.25 5.75 0.25
2001 11 May 3.50 -0.25 - 4.50 -0.25 5.50 -0.2531 Aug. 3.25 -0.25 - 4.25 -0.25 5.25 -0.2518 Sep. 2.75 -0.50 - 3.75 -0.50 4.75 -0.50
9 Nov. 2.25 -0.50 - 3.25 -0.50 4.25 -0.50
2002 6 Dec. 1.75 -0.50 - 2.75 -0.50 3.75 -0.50
2003 7 Mar. 1.50 -0.25 - 2.50 -0.25 3.50 -0.256 June 1.00 -0.50 - 2.00 -0.50 3.00 -0.50
2005 6 Dec. 1.25 0.25 - 2.25 0.25 3.25 0.25
2006 8 Mar. 1.50 0.25 - 2.50 0.25 3.50 0.2515 June 1.75 0.25 - 2.75 0.25 3.75 0.25
9 Aug. 2.00 0.25 - 3.00 0.25 4.00 0.2511 Oct. 2.25 0.25 - 3.25 0.25 4.25 0.2513 Dec. 2.50 0.25 - 3.50 0.25 4.50 0.25
2007 14 Mar. 2.75 0.25 - 3.75 0.25 4.75 0.2513 June 3.00 0.25 - 4.00 0.25 5.00 0.25
2008 9 July 3.25 0.25 - 4.25 0.25 5.25 0.258 Oct. 2.75 -0.50 - - - 4.75 -0.509 4) 3.25 0.50 - - - 4.25 -0.50
15 5) 3.25 ... 3.75 - -0.50 4.25 ... 12 Nov. 2.75 -0.50 3.25 - -0.50 3.75 -0.5010 Dec. 2.00 -0.75 2.50 - -0.75 3.00 -0.75
2009 21 Jan. 1.00 -1.00 2.00 - -0.50 3.00 ... 11 Mar. 0.50 -0.50 1.50 - -0.50 2.50 -0.50
8 Apr. 0.25 -0.25 1.25 - -0.25 2.25 -0.2513 May 0.25 ... 1.00 - -0.25 1.75 -0.50
2011 13 Apr. 0.50 0.25 1.25 - 0.25 2.00 0.2513 July 0.75 0.25 1.50 - 0.25 2.25 0.25
9 Nov. 0.50 -0.25 1.25 - -0.25 2.00 -0.2514 Dec. 0.25 -0.25 1.00 - -0.25 1.75 -0.25
2012 11 July 0.00 -0.25 0.75 - -0.25 1.50 -0.25
2013 8 May 0.00 ... 0.50 - -0.25 1.00 -0.5013 Nov. 0.00 ... 0.25 - -0.25 0.75 -0.25
Source: ECB.1) From 1 January 1999 to 9 March 2004, the date refers to the deposit and marginal lending facilities. For main refinancing operations, changes in the rate are effective from the
first operation following the date indicated. The change on 18 September 2001 was effective on that same day. From 10 March 2004 onwards, the date refers both to the depositand marginal lending facilities and to the main refinancing operations (with changes effective from the first main refinancing operation following the Governing Councildecision), unless otherwise indicated.
2) On 22 December 1998 the ECB announced that, as an exceptional measure between 4 and 21 January 1999, a narrow corridor of 50 basis points would be applied between theinterest rates for the marginal lending facility and the deposit facility, aimed at facilitating the transition to the new monetary regime by market participants.
3) On 8 June 2000 the ECB announced that, starting from the operation to be settled on 28 June 2000, the main refinancing operations of the Eurosystem would be conducted asvariable rate tenders. The minimum bid rate refers to the minimum interest rate at which counterparties may place their bids.
4) As of 9 October 2008 the ECB reduced the standing facilities corridor from 200 basis points to 100 basis points around the interest rate on the main refinancing operations.The standing facilities corridor was restored to 200 basis points as of 21 January 2009.
5) On 8 October 2008 the ECB announced that, starting from the operation to be settled on 15 October, the weekly main refinancing operations would be carried out through afixed rate tender procedure with full allotment at the interest rate on the main refinancing operations. This change overrode the previous decision (made on the same day)to cut by 50 basis points the minimum bid rate on the main refinancing operations conducted as variable rate tenders.

1.3 Eurosystem monetary policy operations allotted through tender procedures 1), 2) (EUR millions; interest rates in percentages per annum)
S 8ECBMonthly BulletinJanuary 2014
1. Main and longer-term refinancing operations 3)
Main refinancing operations
Date of Bids Number of Allotment Fixed rate tender Variable rate tender Running for
settlement (amount) participants (amount) procedures procedures (...) days
Fixed rate Minimum Marginal Weightedbid rate rate 4) average rate
1 2 3 4 5 6 7 8
2013 2 Oct. 94,466 73 94,466 0.50 - - - 79 93,366 68 93,366 0.50 - - - 7
16 91,234 70 91,234 0.50 - - - 723 90,605 67 90,605 0.50 - - - 730 89,319 66 89,319 0.50 - - - 7
6 Nov. 89,524 64 89,524 0.50 - - - 713 87,744 67 87,744 0.25 - - - 720 86,881 71 86,881 0.25 - - - 727 97,210 78 97,210 0.25 - - - 7
4 Dec. 94,625 78 94,625 0.25 - - - 711 98,495 80 98,495 0.25 - - - 718 118,911 102 118,911 0.25 - - - 523 133,585 117 133,585 0.25 - - - 730 168,662 181 168,662 0.25 - - - 9
2014 8 Jan. 112,458 92 112,458 0.25 - - - 7
Longer-term refinancing operations 5)
2013 10 July 3,536 21 3,536 0.50 - - - 281 Aug. 2,683 43 2,683 0.50 - - - 917 3,910 24 3,910 0.50 - - - 35
29 6,823 38 6,823 0.46 - - - 9111 Sep. 3,430 23 3,430 0.50 - - - 2826 8,607 51 8,607 0.39 - - - 84
9 Oct. 3,447 21 3,447 0.50 - - - 3531 6) 1,930 43 1,930 . - - - 9113 Nov. 3,194 21 3,194 0.25 - - - 2828 6) 5,926 47 5,926 . - - - 9111 Dec. 10,143 31 10,143 0.25 - - - 3519 6) 20,914 76 20,914 . - - - 98
2. Other tender operations
Date of settlement Type of Bids Number of Allotment Fixed rate tender Variable rate tender Running
operation (amount) participants (amount) procedures procedures for(...) days
Fixed rate Minimum Maximum Marginal Weightedbid rate bid rate rate 4) average rate
1 2 3 4 5 6 7 8 9 10
2013 2 Oct. Collection of fixed-term deposits 265,066 117 187,500 - - 0.50 0.09 0.08 79 Collection of fixed-term deposits 251,347 117 188,000 - - 0.50 0.09 0.08 7
16 Collection of fixed-term deposits 219,440 117 188,000 - - 0.50 0.15 0.09 723 Collection of fixed-term deposits 240,212 132 188,000 - - 0.50 0.12 0.09 730 Collection of fixed-term deposits 215,802 119 188,000 - - 0.50 0.18 0.12 7
6 Nov. Collection of fixed-term deposits 257,518 131 184,000 - - 0.50 0.13 0.10 713 Collection of fixed-term deposits 254,702 126 184,000 - - 0.25 0.10 0.09 720 Collection of fixed-term deposits 218,118 122 184,000 - - 0.25 0.11 0.09 727 Collection of fixed-term deposits 157,764 108 157,764 - - 0.25 0.25 0.16 7
4 Dec. Collection of fixed-term deposits 190,189 130 184,000 - - 0.25 0.25 0.14 711 Collection of fixed-term deposits 186,728 126 184,000 - - 0.25 0.25 0.19 718 Collection of fixed-term deposits 152,251 109 152,251 - - 0.25 0.25 0.23 523 Collection of fixed-term deposits 139,920 103 139,920 - - 0.25 0.25 0.24 730 Collection of fixed-term deposits 104,842 89 104,842 - - 0.25 0.25 0.24 9
2014 8 Jan. Collection of fixed-term deposits 185,795 132 179,000 - - 0.25 0.25 0.17 7 Source: ECB.1) The amounts shown may differ slightly from those in Section 1.1 owing to operations that have been allotted but not settled.2) With effect from April 2002, split tender operations (i.e. operations with a one-week maturity conducted as standard tender procedures in parallel with a main refinancing
operation) are classified as main refinancing operations.3) On 8 June 2000 the ECB announced that, starting from the operation to be settled on 28 June 2000, the main refinancing operations of the Eurosystem would be conducted as
variable rate tender procedures. The minimum bid rate refers to the minimum interest rate at which counterparties may place their bids. On 8 October 2008 the ECB announcedthat, starting from the operation to be settled on 15 October 2008, the weekly main refinancing operations would be carried out through a fixed rate tender procedure with fullallotment at the interest rate on the main refinancing operations. On 4 March 2010 the ECB decided to return to variable rate tender procedures in the regular three-monthlonger-term refinancing operations, starting with the operation to be allotted on 28 April 2010 and settled on 29 April 2010.
4) In liquidity-providing (absorbing) operations, the marginal rate refers to the lowest (highest) rate at which bids were accepted.5) For the operations settled on 22 December 2011 and 1 March 2012, after one year counterparties have the option to repay any part of the liquidity that they have been allotted
in these operations, on any day that coincides with the settlement day of a main refinancing operation.6) In this longer-term refinancing operation, the rate at which all bids are satisfied is indexed to the average minimum bid rate in the main refinancing operations over the life of the
operation. The interest rates displayed for these indexed longer-term refinancing operations have been rounded to two decimal places. For the precise calculation method,please refer to the Technical Notes.
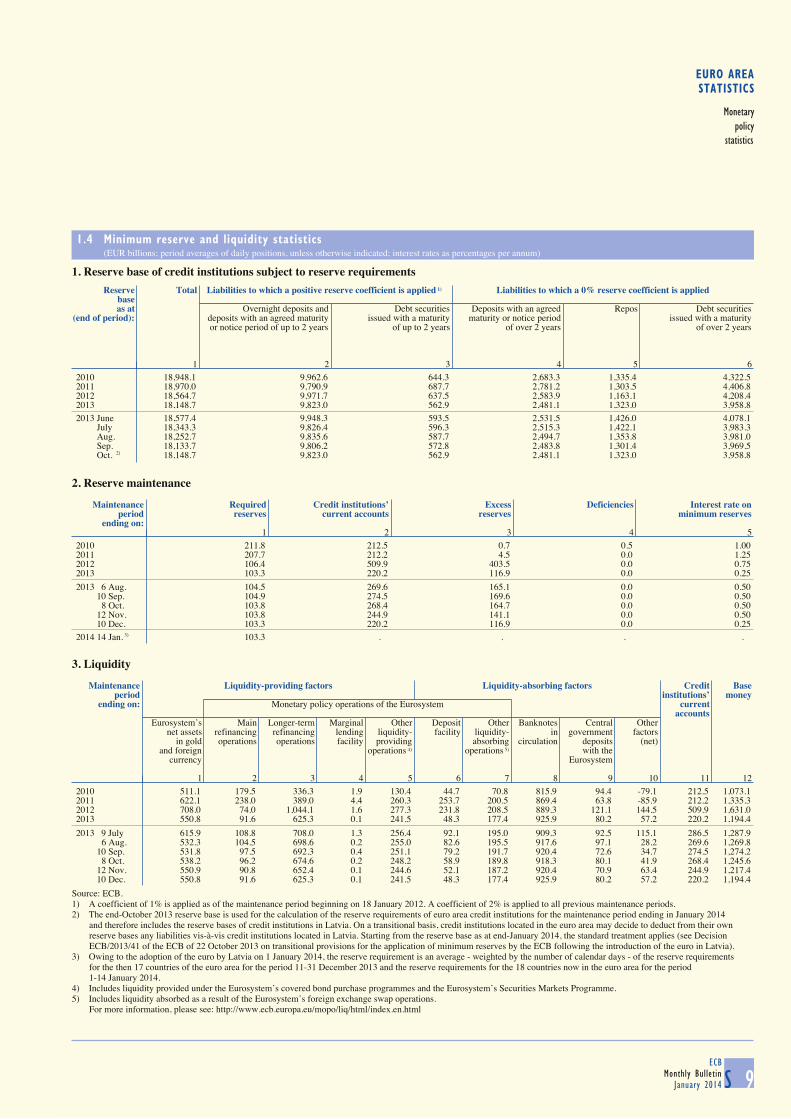
EURO AREASTATISTICS
Monetarypolicy
statistics
1.4 Minimum reserve and liquidity statistics (EUR billions; period averages of daily positions, unless otherwise indicated; interest rates as percentages per annum)
S 9ECB
Monthly BulletinJanuary 2014
1. Reserve base of credit institutions subject to reserve requirements
Reserve Total Liabilities to which a positive reserve coefficient is applied 1) Liabilities to which a 0% reserve coefficient is applied
baseas at Overnight deposits and Debt securities Deposits with an agreed Repos Debt securities
(end of period): deposits with an agreed maturity issued with a maturity maturity or notice period issued with a maturityor notice period of up to 2 years of up to 2 years of over 2 years of over 2 years
1 2 3 4 5 6
2010 18,948.1 9,962.6 644.3 2,683.3 1,335.4 4,322.52011 18,970.0 9,790.9 687.7 2,781.2 1,303.5 4,406.82012 18,564.7 9,971.7 637.5 2,583.9 1,163.1 4,208.42013 18,148.7 9,823.0 562.9 2,481.1 1,323.0 3,958.8
2013 June 18,577.4 9,948.3 593.5 2,531.5 1,426.0 4,078.1 July 18,343.3 9,826.4 596.3 2,515.3 1,422.1 3,983.3 Aug. 18,252.7 9,835.6 587.7 2,494.7 1,353.8 3,981.0 Sep. 18,133.7 9,806.2 572.8 2,483.8 1,301.4 3,969.5 Oct. 2) 18,148.7 9,823.0 562.9 2,481.1 1,323.0 3,958.8
2. Reserve maintenance
Maintenance Required Credit institutions’ Excess Deficiencies Interest rate onperiod reserves current accounts reserves minimum reserves
ending on:1 2 3 4 5
2010 211.8 212.5 0.7 0.5 1.002011 207.7 212.2 4.5 0.0 1.252012 106.4 509.9 403.5 0.0 0.752013 103.3 220.2 116.9 0.0 0.25
2013 6 Aug. 104.5 269.6 165.1 0.0 0.5010 Sep. 104.9 274.5 169.6 0.0 0.50
8 Oct. 103.8 268.4 164.7 0.0 0.5012 Nov. 103.8 244.9 141.1 0.0 0.5010 Dec. 103.3 220.2 116.9 0.0 0.25
2014 14 Jan. 3) 103.3 . . . .
3. Liquidity
Maintenance Liquidity-providing factors Liquidity-absorbing factors Credit Base
period institutions’ moneyending on: Monetary policy operations of the Eurosystem current
accountsEurosystem’s Main Longer-term Marginal Other Deposit Other Banknotes Central Other
net assets refinancing refinancing lending liquidity- facility liquidity- in government factorsin gold operations operations facility providing absorbing circulation deposits (net)
and foreign operations 4) operations 5) with thecurrency Eurosystem
1 2 3 4 5 6 7 8 9 10 11 12
2010 511.1 179.5 336.3 1.9 130.4 44.7 70.8 815.9 94.4 -79.1 212.5 1,073.12011 622.1 238.0 389.0 4.4 260.3 253.7 200.5 869.4 63.8 -85.9 212.2 1,335.32012 708.0 74.0 1,044.1 1.6 277.3 231.8 208.5 889.3 121.1 144.5 509.9 1,631.02013 550.8 91.6 625.3 0.1 241.5 48.3 177.4 925.9 80.2 57.2 220.2 1,194.4
2013 9 July 615.9 108.8 708.0 1.3 256.4 92.1 195.0 909.3 92.5 115.1 286.5 1,287.96 Aug. 532.3 104.5 698.6 0.2 255.0 82.6 195.5 917.6 97.1 28.2 269.6 1,269.8
10 Sep. 531.8 97.5 692.3 0.4 251.1 79.2 191.7 920.4 72.6 34.7 274.5 1,274.28 Oct. 538.2 96.2 674.6 0.2 248.2 58.9 189.8 918.3 80.1 41.9 268.4 1,245.6
12 Nov. 550.9 90.8 652.4 0.1 244.6 52.1 187.2 920.4 70.9 63.4 244.9 1,217.410 Dec. 550.8 91.6 625.3 0.1 241.5 48.3 177.4 925.9 80.2 57.2 220.2 1,194.4
Source: ECB.1) A coefficient of 1% is applied as of the maintenance period beginning on 18 January 2012. A coefficient of 2% is applied to all previous maintenance periods.2) The end-October 2013 reserve base is used for the calculation of the reserve requirements of euro area credit institutions for the maintenance period ending in January 2014
and therefore includes the reserve bases of credit institutions in Latvia. On a transitional basis, credit institutions located in the euro area may decide to deduct from their ownreserve bases any liabilities vis-à-vis credit institutions located in Latvia. Starting from the reserve base as at end-January 2014, the standard treatment applies (see DecisionECB/2013/41 of the ECB of 22 October 2013 on transitional provisions for the application of minimum reserves by the ECB following the introduction of the euro in Latvia).
3) Owing to the adoption of the euro by Latvia on 1 January 2014, the reserve requirement is an average - weighted by the number of calendar days - of the reserve requirementsfor the then 17 countries of the euro area for the period 11-31 December 2013 and the reserve requirements for the 18 countries now in the euro area for the period1-14 January 2014.
4) Includes liquidity provided under the Eurosystem’s covered bond purchase programmes and the Eurosystem’s Securities Markets Programme.5) Includes liquidity absorbed as a result of the Eurosystem’s foreign exchange swap operations.
For more information, please see: http://www.ecb.europa.eu/mopo/liq/html/index.en.html
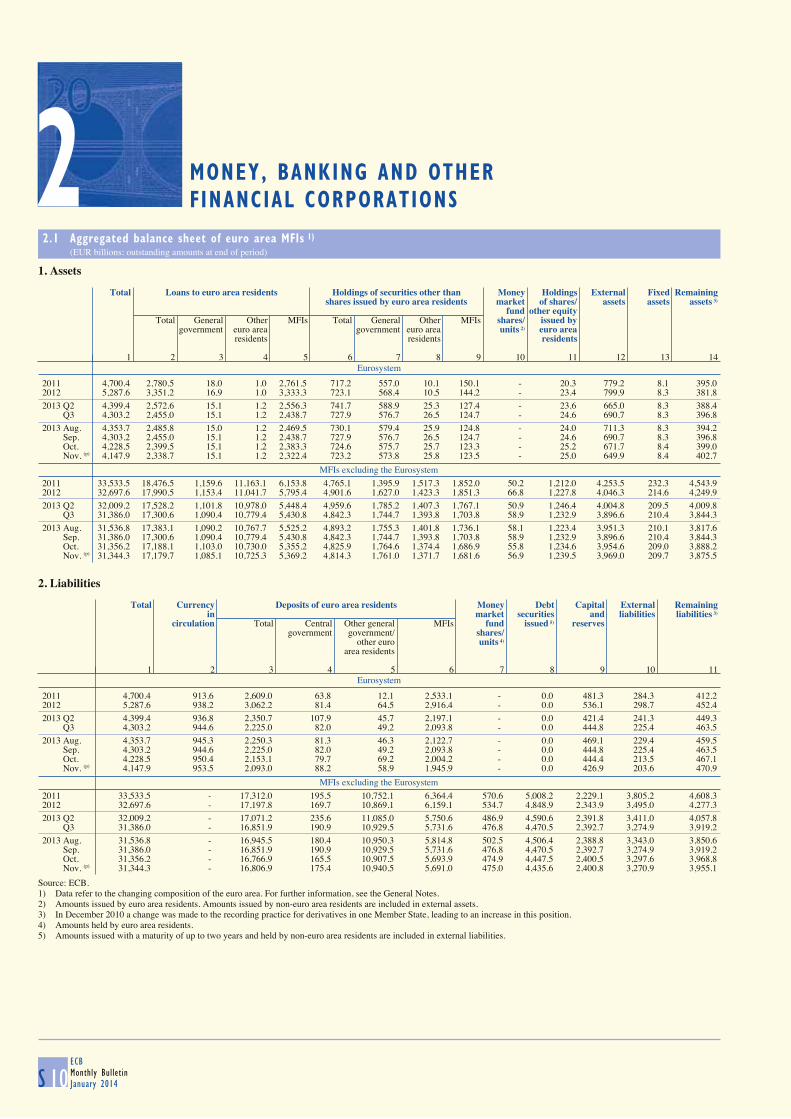
FINANCIAL CORPORATIONS2 MONEY, BANKING AND OTHER
2.1 Aggregated balance sheet of euro area MFIs 1) (EUR billions; outstanding amounts at end of period)
S 10ECBMonthly BulletinJanuary 2014
1. Assets
Eurosystem
Total Loans to euro area residents Holdings of securities other than Money Holdings External Fixed Remaining
shares issued by euro area residents market of shares/ assets assets assets 3)
fund other equityTotal General Other MFIs Total General Other MFIs shares/ issued by
government euro area government euro area units 2) euro arearesidents residents residents
1 2 3 4 5 6 7 8 9 10 11 12 13 14
2011 4,700.4 2,780.5 18.0 1.0 2,761.5 717.2 557.0 10.1 150.1 - 20.3 779.2 8.1 395.02012 5,287.6 3,351.2 16.9 1.0 3,333.3 723.1 568.4 10.5 144.2 - 23.4 799.9 8.3 381.8
2013 Q2 4,399.4 2,572.6 15.1 1.2 2,556.3 741.7 588.9 25.3 127.4 - 23.6 665.0 8.3 388.4 Q3 4,303.2 2,455.0 15.1 1.2 2,438.7 727.9 576.7 26.5 124.7 - 24.6 690.7 8.3 396.8
2013 Aug. 4,353.7 2,485.8 15.0 1.2 2,469.5 730.1 579.4 25.9 124.8 - 24.0 711.3 8.3 394.2 Sep. 4,303.2 2,455.0 15.1 1.2 2,438.7 727.9 576.7 26.5 124.7 - 24.6 690.7 8.3 396.8 Oct. 4,228.5 2,399.5 15.1 1.2 2,383.3 724.6 575.7 25.7 123.3 - 25.2 671.7 8.4 399.0 Nov. (p) 4,147.9 2,338.7 15.1 1.2 2,322.4 723.2 573.8 25.8 123.5 - 25.0 649.9 8.4 402.7
MFIs excluding the Eurosystem
2011 33,533.5 18,476.5 1,159.6 11,163.1 6,153.8 4,765.1 1,395.9 1,517.3 1,852.0 50.2 1,212.0 4,253.5 232.3 4,543.92012 32,697.6 17,990.5 1,153.4 11,041.7 5,795.4 4,901.6 1,627.0 1,423.3 1,851.3 66.8 1,227.8 4,046.3 214.6 4,249.9
2013 Q2 32,009.2 17,528.2 1,101.8 10,978.0 5,448.4 4,959.6 1,785.2 1,407.3 1,767.1 50.9 1,246.4 4,004.8 209.5 4,009.8 Q3 31,386.0 17,300.6 1,090.4 10,779.4 5,430.8 4,842.3 1,744.7 1,393.8 1,703.8 58.9 1,232.9 3,896.6 210.4 3,844.3
2013 Aug. 31,536.8 17,383.1 1,090.2 10,767.7 5,525.2 4,893.2 1,755.3 1,401.8 1,736.1 58.1 1,223.4 3,951.3 210.1 3,817.6 Sep. 31,386.0 17,300.6 1,090.4 10,779.4 5,430.8 4,842.3 1,744.7 1,393.8 1,703.8 58.9 1,232.9 3,896.6 210.4 3,844.3 Oct. 31,356.2 17,188.1 1,103.0 10,730.0 5,355.2 4,825.9 1,764.6 1,374.4 1,686.9 55.8 1,234.6 3,954.6 209.0 3,888.2 Nov. (p) 31,344.3 17,179.7 1,085.1 10,725.3 5,369.2 4,814.3 1,761.0 1,371.7 1,681.6 56.9 1,239.5 3,969.0 209.7 3,875.5
2. Liabilities
Eurosystem
Total Currency Deposits of euro area residents Money Debt Capital External Remaining
in market securities and liabilities liabilities 3)
circulation Total Central Other general MFIs fund issued 5) reservesgovernment government/ shares/
other euro units 4)
area residents
1 2 3 4 5 6 7 8 9 10 11
2011 4,700.4 913.6 2,609.0 63.8 12.1 2,533.1 - 0.0 481.3 284.3 412.22012 5,287.6 938.2 3,062.2 81.4 64.5 2,916.4 - 0.0 536.1 298.7 452.4
2013 Q2 4,399.4 936.8 2,350.7 107.9 45.7 2,197.1 - 0.0 421.4 241.3 449.3 Q3 4,303.2 944.6 2,225.0 82.0 49.2 2,093.8 - 0.0 444.8 225.4 463.5
2013 Aug. 4,353.7 945.3 2,250.3 81.3 46.3 2,122.7 - 0.0 469.1 229.4 459.5 Sep. 4,303.2 944.6 2,225.0 82.0 49.2 2,093.8 - 0.0 444.8 225.4 463.5 Oct. 4,228.5 950.4 2,153.1 79.7 69.2 2,004.2 - 0.0 444.4 213.5 467.1 Nov. (p) 4,147.9 953.5 2,093.0 88.2 58.9 1,945.9 - 0.0 426.9 203.6 470.9
MFIs excluding the Eurosystem
2011 33,533.5 - 17,312.0 195.5 10,752.1 6,364.4 570.6 5,008.2 2,229.1 3,805.2 4,608.32012 32,697.6 - 17,197.8 169.7 10,869.1 6,159.1 534.7 4,848.9 2,343.9 3,495.0 4,277.3
2013 Q2 32,009.2 - 17,071.2 235.6 11,085.0 5,750.6 486.9 4,590.6 2,391.8 3,411.0 4,057.8 Q3 31,386.0 - 16,851.9 190.9 10,929.5 5,731.6 476.8 4,470.5 2,392.7 3,274.9 3,919.2
2013 Aug. 31,536.8 - 16,945.5 180.4 10,950.3 5,814.8 502.5 4,506.4 2,388.8 3,343.0 3,850.6 Sep. 31,386.0 - 16,851.9 190.9 10,929.5 5,731.6 476.8 4,470.5 2,392.7 3,274.9 3,919.2 Oct. 31,356.2 - 16,766.9 165.5 10,907.5 5,693.9 474.9 4,447.5 2,400.5 3,297.6 3,968.8 Nov. (p) 31,344.3 - 16,806.9 175.4 10,940.5 5,691.0 475.0 4,435.6 2,400.8 3,270.9 3,955.1
Source: ECB.1) Data refer to the changing composition of the euro area. For further information, see the General Notes.2) Amounts issued by euro area residents. Amounts issued by non-euro area residents are included in external assets.3) In December 2010 a change was made to the recording practice for derivatives in one Member State, leading to an increase in this position.4) Amounts held by euro area residents.5) Amounts issued with a maturity of up to two years and held by non-euro area residents are included in external liabilities.
2

EURO AREASTATISTICS
Money, bankingand other
financial corporations
2.2 Consolidated balance sheet of euro area MFIs 1) (EUR billions; outstanding amounts at end of period; transactions during period)
S 11ECB
Monthly BulletinJanuary 2014
1. Assets
Outstanding amounts
Total Loans to euro area residents Holdings of securities other than shares Holdings External Fixed Remaining
issued by euro area residents of shares/ assets assets assets 2)
other equityTotal General Other Total General Other issued by
government euro area government euro area other euro arearesidents residents residents
1 2 3 4 5 6 7 8 9 10 11
2011 26,718.7 12,341.7 1,177.6 11,164.1 3,480.2 1,952.8 1,527.4 741.0 5,032.7 240.4 4,882.72012 26,248.6 12,213.0 1,170.3 11,042.7 3,629.2 2,195.4 1,433.8 767.0 4,846.2 222.9 4,570.3
2013 Q2 25,930.2 12,096.1 1,116.9 10,979.2 3,806.8 2,374.1 1,432.6 792.5 4,669.8 217.7 4,347.3 Q3 25,416.9 11,886.1 1,105.5 10,780.6 3,741.7 2,321.4 1,420.3 792.6 4,587.2 218.7 4,190.6
2013 Aug. 25,459.9 11,874.1 1,105.2 10,768.9 3,762.5 2,334.8 1,427.7 781.6 4,662.6 218.4 4,160.7 Sep. 25,416.9 11,886.1 1,105.5 10,780.6 3,741.7 2,321.4 1,420.3 792.6 4,587.2 218.7 4,190.6 Oct. 25,461.3 11,849.2 1,118.1 10,731.1 3,740.3 2,340.2 1,400.1 793.3 4,626.3 217.4 4,234.8 Nov. (p) 25,419.0 11,826.7 1,100.2 10,726.5 3,732.3 2,334.8 1,397.5 795.1 4,618.9 218.1 4,228.1
Transactions
2011 992.9 60.3 -55.6 115.9 127.8 151.9 -24.1 -29.9 -37.5 7.8 864.32012 87.1 -38.0 -4.7 -33.4 113.1 183.6 -70.5 38.6 -151.1 -14.1 138.6
2013 Q2 -441.0 -69.9 -23.6 -46.3 79.7 79.7 0.0 9.1 2.6 -0.3 -462.3 Q3 -431.9 -98.3 -12.5 -85.8 -70.6 -58.6 -12.0 -8.4 -75.7 1.1 -180.0
2013 Aug. -160.0 -47.0 -15.0 -32.0 -6.3 -2.8 -3.5 -2.5 -15.9 0.1 -88.5 Sep. -21.4 19.0 0.2 18.9 -24.3 -16.3 -8.1 6.1 -31.9 0.4 9.3 Oct. 65.1 -22.6 12.5 -35.0 -15.4 5.3 -20.7 -5.6 66.6 -1.2 43.3 Nov. (p) -27.7 -15.7 -17.9 2.2 -12.3 -9.1 -3.1 1.4 6.8 0.8 -8.4
2. Liabilities
Outstanding amounts
Total Currency in Deposits of Deposits of Money market Debt Capital External Remaining Excess ofcirculation central other general fund shares/ securities and liabilities liabilities 2) inter-MFI
government government/ units 3) issued 4) reserves liabilitiesother euro area over inter-MFI
residents assets
1 2 3 4 5 6 7 8 9 10
2011 26,718.7 857.5 259.3 10,764.3 520.4 3,006.2 2,219.1 4,089.5 5,020.5 -17.92012 26,248.6 876.8 251.0 10,933.5 467.9 2,853.4 2,395.9 3,793.7 4,729.7 -53.3
2013 Q2 25,930.2 885.9 343.5 11,130.7 435.9 2,696.1 2,335.8 3,652.2 4,507.1 -57.0 Q3 25,416.9 894.0 272.9 10,978.6 417.9 2,642.0 2,372.6 3,500.3 4,382.7 -44.2
2013 Aug. 25,459.9 894.2 261.7 10,996.6 444.4 2,645.5 2,392.2 3,572.5 4,310.1 -57.3 Sep. 25,416.9 894.0 272.9 10,978.6 417.9 2,642.0 2,372.6 3,500.3 4,382.7 -44.2 Oct. 25,461.3 897.9 245.2 10,976.8 419.1 2,637.3 2,378.3 3,511.1 4,435.9 -40.3 Nov. (p) 25,419.0 903.4 263.6 10,999.4 418.1 2,630.4 2,358.3 3,474.5 4,426.0 -54.7
Transactions
2011 992.9 49.1 -0.8 168.1 -29.0 50.0 141.4 -199.9 860.3 -46.12012 87.1 19.5 -5.1 186.9 -18.2 -124.8 155.4 -251.2 148.2 -23.6
2013 Q2 -441.0 18.4 42.2 85.5 -23.4 -66.7 49.4 -105.0 -437.5 -3.8 Q3 -431.9 8.1 -70.6 -63.3 -18.1 -41.6 7.0 -130.7 -152.0 29.2
2013 Aug. -160.0 1.4 -55.7 21.2 9.5 -12.5 10.6 -49.9 -99.0 14.4 Sep. -21.4 -0.2 11.2 -14.6 -26.4 4.4 -1.9 -54.8 50.7 10.2 Oct. 65.1 3.9 -28.0 13.2 1.3 2.8 -6.6 30.5 48.4 -0.4 Nov. (p) -27.7 5.4 18.4 27.9 -1.0 -6.1 -3.1 -44.3 -8.4 -16.5
Source: ECB.1) Data refer to the changing composition of the euro area. For further information, see the General Notes.2) In December 2010 a change was made to the recording practice for derivatives in one Member State, leading to an increase in this position.3) Amounts held by euro area residents.4) Amounts issued with a maturity of up to two years and held by non-euro area residents are included in external liabilities.

2.3 Monetary statistics 1) (EUR billions and annual growth rates; seasonally adjusted; outstanding amounts and growth rates at end of period; transactions during period)
S 12ECBMonthly BulletinJanuary 2014
1. Monetary aggregates 2) and counterparts
Outstanding amounts
M3 M3 Longer-term Credit to Credit to other euro area residents 3) Net
3-month financial general external M2 M3-M2 moving liabilities government Loans Loans adjusted assets 4)
average for sales andM1 M2-M1 (centred) securitisation 5)
1 2 3 4 5 6 7 8 9 10 11 12
2011 4,807.0 3,800.6 8,607.6 891.7 9,499.2 - 7,678.0 3,164.7 13,286.3 11,018.1 - 927.72012 5,109.9 3,882.3 8,992.2 790.1 9,782.3 - 7,568.4 3,406.0 13,058.6 10,857.4 - 1,035.8
2013 Q2 5,264.3 3,873.7 9,138.0 686.5 9,824.5 - 7,385.8 3,451.5 12,935.2 10,706.7 - 1,004.1 Q3 5,345.8 3,852.4 9,198.2 664.8 9,863.0 - 7,365.9 3,437.3 12,865.1 10,629.0 - 1,079.6
2013 Aug. 5,338.8 3,855.8 9,194.6 685.7 9,880.4 - 7,393.7 3,452.4 12,878.2 10,649.2 - 1,077.9 Sep. 5,345.8 3,852.4 9,198.2 664.8 9,863.0 - 7,365.9 3,437.3 12,865.1 10,629.0 - 1,079.6 Oct. 5,397.6 3,820.6 9,218.2 663.1 9,881.4 - 7,395.1 3,464.0 12,827.7 10,607.1 - 1,116.8 Nov. (p) 5,425.5 3,816.4 9,241.9 659.1 9,901.0 - 7,358.2 3,428.9 12,767.1 10,577.4 - 1,142.1
Transactions
2011 91.4 69.5 161.0 -8.1 152.8 - 211.9 95.8 49.6 104.0 130.7 162.22012 310.2 78.1 388.3 -55.4 332.8 - -116.9 184.9 -102.5 -70.8 -16.8 98.8
2013 Q2 66.3 -7.5 58.8 -33.9 24.9 - -32.9 23.2 -75.7 -94.2 -86.3 78.3 Q3 84.8 -20.4 64.4 -28.8 35.7 - -36.3 -21.2 -72.5 -71.9 -64.9 61.1
2013 Aug. 37.1 -16.3 20.8 -5.2 15.6 - -3.8 4.7 -16.8 -18.9 -16.4 22.5 Sep. 9.7 -2.3 7.5 -19.3 -11.9 - -4.2 -18.1 -11.5 -13.0 -16.4 27.8 Oct. 53.6 -30.6 23.0 -1.6 21.4 - 24.9 13.0 -36.3 -14.0 -14.3 45.1 Nov. (p) 26.9 -4.7 22.2 -2.7 19.5 - -20.1 -38.9 -59.1 -27.2 -24.2 47.2
Growth rates
2011 1.9 1.9 1.9 -0.9 1.6 1.7 2.9 3.2 0.4 1.0 1.2 162.22012 6.5 2.1 4.5 -6.5 3.5 3.6 -1.5 5.9 -0.8 -0.6 -0.2 98.8
2013 Q2 7.6 0.1 4.3 -17.0 2.4 2.5 -1.0 2.7 -1.1 -1.6 -1.0 282.0 Q3 6.7 0.1 3.8 -17.6 2.0 1.9 -1.3 0.7 -1.2 -2.1 -1.5 313.3
2013 Aug. 6.8 0.4 4.0 -16.4 2.3 2.2 -1.2 2.2 -1.2 -2.1 -1.5 282.9 Sep. 6.7 0.1 3.8 -17.6 2.0 1.9 -1.3 0.7 -1.2 -2.1 -1.5 313.3 Oct. 6.6 -1.2 3.2 -17.9 1.4 1.7 -0.8 0.8 -1.4 -2.2 -1.7 329.9 Nov. (p) 6.5 -1.5 3.1 -16.2 1.5 . -0.9 -0.6 -1.6 -2.3 -1.8 315.8
C1 Monetary aggregates 1)
(annual growth rates; seasonally adjusted)
C2 Counterparts 1)
(annual growth rates; seasonally adjusted)
-5
0
5
10
15
2000 2002 2004 2006 2008 2010 2012-5
0
5
10
15
M1M3
-10
-5
0
5
10
15
20
2000 2002 2004 2006 2008 2010 2012-10
-5
0
5
10
15
20
longer-term financial liabilitiescredit to general governmentloans to other euro area residents
Source: ECB.1) Data refer to the changing composition of the euro area. For further information, see the General Notes.2) Monetary liabilities of MFIs and central government (post office, treasury, etc.) vis-à-vis non-MFI euro area residents excluding central government.
For definitions of M1, M2 and M3, see glossary.3) Excludes reverse repos to central counterparties as of June 2010; transactions and growth rates are adjusted for this effect.4) Values in the section ‘‘growth rates’’ are sums of the transactions during the 12 months ending in the period indicated.5) Adjustment for the derecognition of loans on the MFI balance sheet on account of their sale or securitisation.

EURO AREASTATISTICS
Money, bankingand other
financial corporations
2.3 Monetary statistics 1) (EUR billions and annual growth rates; seasonally adjusted; outstanding amounts and growth rates at end of period; transactions during period)
S 13ECB
Monthly BulletinJanuary 2014
2. Components of monetary aggregates and longer-term financial liabilities
Outstanding amounts
Currency Overnight Deposits Deposits Repos 2) Money Debt Debt Deposits Deposits Capitalin deposits with an agreed redeemable market securities with securities with redeemable with an agreed and
circulation maturity of up at notice of fund a maturity of a maturity of at notice of maturity of reservesto 2 years up to 3 months shares/units up to 2 years over 2 years over 3 months over 2 years
1 2 3 4 5 6 7 8 9 10 11
2011 843.9 3,963.1 1,838.6 1,961.9 146.2 537.8 207.7 2,812.9 115.3 2,544.2 2,205.72012 863.9 4,246.0 1,801.8 2,080.6 123.7 483.3 183.2 2,685.0 106.1 2,395.2 2,382.1
2013 Q2 880.8 4,383.5 1,751.3 2,122.4 117.7 438.6 130.2 2,562.8 96.6 2,401.5 2,324.9 Q3 893.7 4,452.1 1,719.5 2,132.9 110.4 421.7 132.7 2,505.5 93.6 2,393.1 2,373.7
2013 Aug. 890.8 4,448.0 1,727.4 2,128.4 123.0 434.5 128.3 2,515.1 95.4 2,393.8 2,389.3 Sep. 893.7 4,452.1 1,719.5 2,132.9 110.4 421.7 132.7 2,505.5 93.6 2,393.1 2,373.7 Oct. 898.1 4,499.6 1,691.8 2,128.8 117.9 423.1 122.1 2,516.5 92.7 2,401.6 2,384.3 Nov. (p) 902.9 4,522.5 1,684.1 2,132.4 118.7 417.6 122.8 2,513.6 92.1 2,394.2 2,358.3
Transactions
2011 48.9 42.6 35.8 33.8 -16.8 -29.6 38.2 17.5 -2.5 56.0 140.82012 20.2 290.0 -36.5 114.6 -17.0 -20.0 -18.4 -105.8 -10.2 -156.1 155.1
2013 Q2 11.6 54.7 -27.8 20.3 -4.4 -18.7 -10.8 -54.2 -4.3 -8.0 33.7 Q3 12.9 71.9 -32.1 11.7 -15.4 -16.8 3.4 -45.8 -3.0 -6.5 19.0
2013 Aug. 5.6 31.5 -16.8 0.5 -5.9 -1.4 2.1 -13.5 -0.1 -3.0 12.8 Sep. 2.9 6.8 -7.0 4.7 -12.5 -12.7 5.8 -3.2 -1.8 -1.3 2.1 Oct. 4.3 49.3 -26.6 -4.0 7.6 1.5 -10.7 18.6 -0.9 9.0 -1.8 Nov. (p) 4.9 22.0 -8.9 4.2 1.3 -5.5 1.4 -2.8 -0.6 -7.6 -9.1
Growth rates
2011 6.1 1.1 2.0 1.8 -9.8 -5.1 29.2 0.7 -2.1 2.3 6.92012 2.4 7.3 -2.0 5.8 -11.8 -3.9 -9.6 -3.8 -8.8 -6.1 6.9
2013 Q2 2.1 8.8 -5.6 5.4 -9.3 -11.2 -35.6 -4.8 -14.8 -3.2 6.5 Q3 3.1 7.4 -4.9 4.5 -17.9 -11.9 -30.9 -6.5 -14.9 -1.5 5.5
2013 Aug. 2.7 7.6 -4.5 4.8 -9.8 -10.1 -35.4 -6.5 -14.2 -1.6 6.1 Sep. 3.1 7.4 -4.9 4.5 -17.9 -11.9 -30.9 -6.5 -14.9 -1.5 5.5 Oct. 3.7 7.1 -6.6 3.5 -10.0 -12.5 -36.0 -5.4 -14.8 -0.9 5.1 Nov. (p) 4.5 6.9 -6.8 3.1 -9.6 -12.6 -30.2 -5.5 -14.4 -0.7 4.8
C3 Components of monetary aggregates 1)
(annual growth rates; seasonally adjusted)
C4 Components of longer-term financial liabilities 1)
(annual growth rates; seasonally adjusted)
-40
-20
0
20
40
60
2000 2002 2004 2006 2008 2010 2012-40
-20
0
20
40
60
currency in circulationovernight depositsdeposits with an agreed maturity of up to 2 yearsdeposits redeemable at notice of up to 3 months
-10
-5
0
5
10
15
20
2000 2002 2004 2006 2008 2010 2012-10
-5
0
5
10
15
20
debt securities with a maturity of over 2 yearsdeposits with an agreed maturity of over 2 yearscapital and reserves
Source: ECB.1) Data refer to the changing composition of the euro area. For further information, see the General Notes.2) Excludes repurchase agreements with central counterpaties as of June 2010; transactions and growth rates are adjusted for this effect.
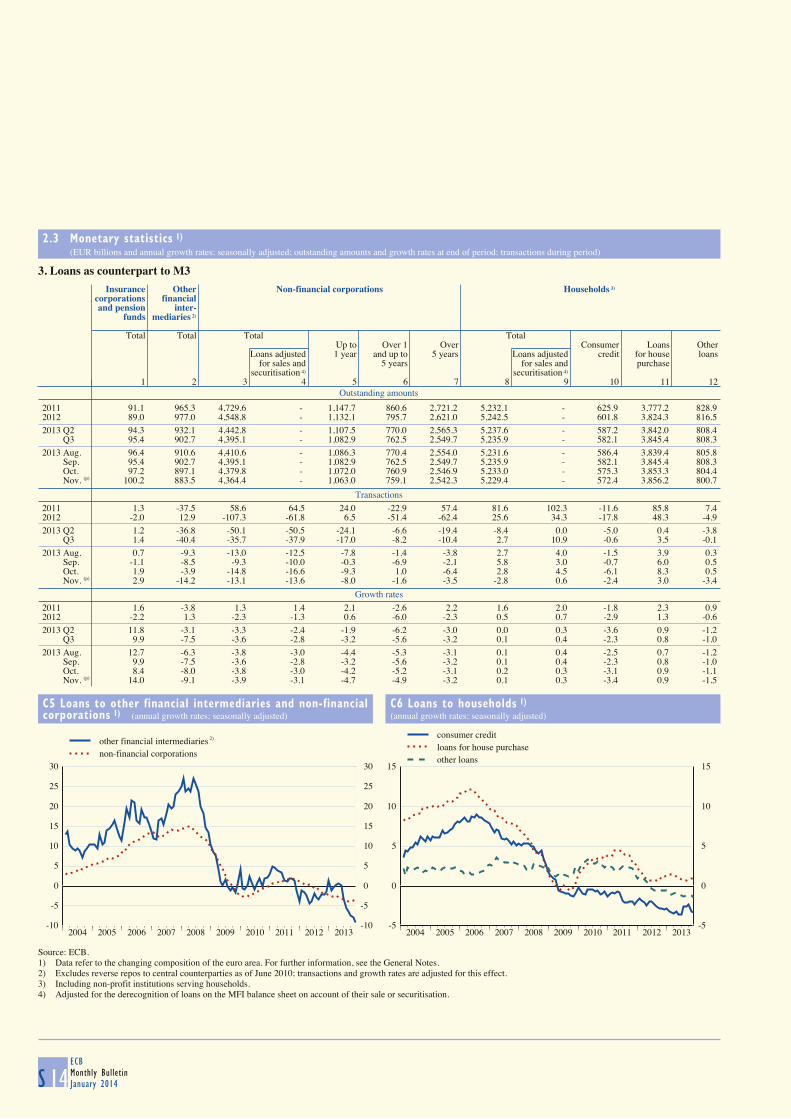
2.3 Monetary statistics 1) (EUR billions and annual growth rates; seasonally adjusted; outstanding amounts and growth rates at end of period; transactions during period)
S 14ECBMonthly BulletinJanuary 2014
3. Loans as counterpart to M3
Outstanding amounts
Insurance Other Non-financial corporations Households 3)
corporations financial and pension inter-
funds mediaries 2)
Total Total Total TotalUp to Over 1 Over Consumer Loans Other
Loans adjusted 1 year and up to 5 years Loans adjusted credit for house loansfor sales and 5 years for sales and purchase
securitisation 4) securitisation 4)
1 2 3 4 5 6 7 8 9 10 11 12
2011 91.1 965.3 4,729.6 - 1,147.7 860.6 2,721.2 5,232.1 - 625.9 3,777.2 828.92012 89.0 977.0 4,548.8 - 1,132.1 795.7 2,621.0 5,242.5 - 601.8 3,824.3 816.5
2013 Q2 94.3 932.1 4,442.8 - 1,107.5 770.0 2,565.3 5,237.6 - 587.2 3,842.0 808.4 Q3 95.4 902.7 4,395.1 - 1,082.9 762.5 2,549.7 5,235.9 - 582.1 3,845.4 808.3
2013 Aug. 96.4 910.6 4,410.6 - 1,086.3 770.4 2,554.0 5,231.6 - 586.4 3,839.4 805.8 Sep. 95.4 902.7 4,395.1 - 1,082.9 762.5 2,549.7 5,235.9 - 582.1 3,845.4 808.3 Oct. 97.2 897.1 4,379.8 - 1,072.0 760.9 2,546.9 5,233.0 - 575.3 3,853.3 804.4 Nov. (p) 100.2 883.5 4,364.4 - 1,063.0 759.1 2,542.3 5,229.4 - 572.4 3,856.2 800.7
Transactions
2011 1.3 -37.5 58.6 64.5 24.0 -22.9 57.4 81.6 102.3 -11.6 85.8 7.42012 -2.0 12.9 -107.3 -61.8 6.5 -51.4 -62.4 25.6 34.3 -17.8 48.3 -4.9
2013 Q2 1.2 -36.8 -50.1 -50.5 -24.1 -6.6 -19.4 -8.4 0.0 -5.0 0.4 -3.8 Q3 1.4 -40.4 -35.7 -37.9 -17.0 -8.2 -10.4 2.7 10.9 -0.6 3.5 -0.1
2013 Aug. 0.7 -9.3 -13.0 -12.5 -7.8 -1.4 -3.8 2.7 4.0 -1.5 3.9 0.3 Sep. -1.1 -8.5 -9.3 -10.0 -0.3 -6.9 -2.1 5.8 3.0 -0.7 6.0 0.5 Oct. 1.9 -3.9 -14.8 -16.6 -9.3 1.0 -6.4 2.8 4.5 -6.1 8.3 0.5 Nov. (p) 2.9 -14.2 -13.1 -13.6 -8.0 -1.6 -3.5 -2.8 0.6 -2.4 3.0 -3.4
Growth rates
2011 1.6 -3.8 1.3 1.4 2.1 -2.6 2.2 1.6 2.0 -1.8 2.3 0.92012 -2.2 1.3 -2.3 -1.3 0.6 -6.0 -2.3 0.5 0.7 -2.9 1.3 -0.6
2013 Q2 11.8 -3.1 -3.3 -2.4 -1.9 -6.2 -3.0 0.0 0.3 -3.6 0.9 -1.2 Q3 9.9 -7.5 -3.6 -2.8 -3.2 -5.6 -3.2 0.1 0.4 -2.3 0.8 -1.0
2013 Aug. 12.7 -6.3 -3.8 -3.0 -4.4 -5.3 -3.1 0.1 0.4 -2.5 0.7 -1.2 Sep. 9.9 -7.5 -3.6 -2.8 -3.2 -5.6 -3.2 0.1 0.4 -2.3 0.8 -1.0 Oct. 8.4 -8.0 -3.8 -3.0 -4.2 -5.2 -3.1 0.2 0.3 -3.1 0.9 -1.1 Nov. (p) 14.0 -9.1 -3.9 -3.1 -4.7 -4.9 -3.2 0.1 0.3 -3.4 0.9 -1.5
C5 Loans to other financial intermediaries and non-financial
corporations 1) (annual growth rates; seasonally adjusted)
C6 Loans to households 1)
(annual growth rates; seasonally adjusted)
-10
-5
0
5
10
15
20
25
30
2004 2005 2006 2007 2008 2009 2010 2011 2012 2013-10
-5
0
5
10
15
20
25
30
other financial intermediariesnon-financial corporations
-5
0
5
10
15
2004 2005 2006 2007 2008 2009 2010 2011 2012 2013-5
0
5
10
15
consumer creditloans for house purchaseother loans
Source: ECB.1) Data refer to the changing composition of the euro area. For further information, see the General Notes.2) Excludes reverse repos to central counterparties as of June 2010; transactions and growth rates are adjusted for this effect.3) Including non-profit institutions serving households.4) Adjusted for the derecognition of loans on the MFI balance sheet on account of their sale or securitisation.
2)
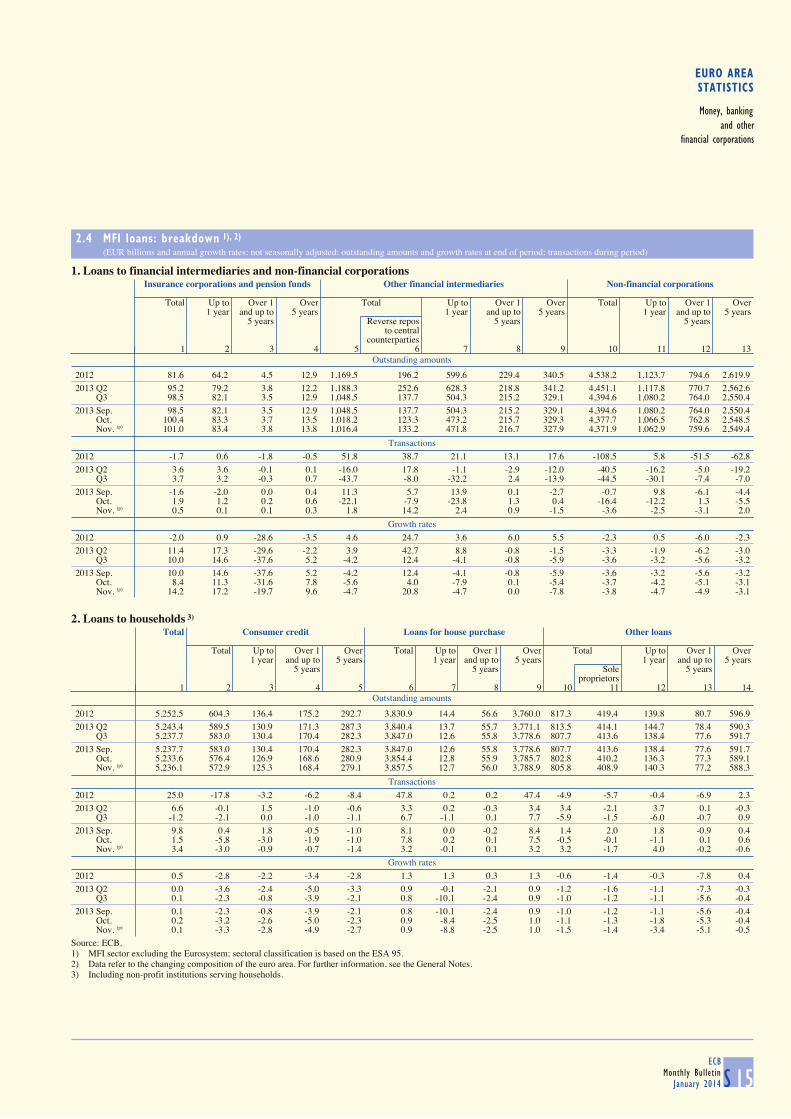
EURO AREASTATISTICS
Money, bankingand other
financial corporations
2.4 MFI loans: breakdown 1), 2) (EUR billions and annual growth rates; not seasonally adjusted; outstanding amounts and growth rates at end of period; transactions during period)
S 15ECB
Monthly BulletinJanuary 2014
1. Loans to financial intermediaries and non-financial corporations
Outstanding amounts
Insurance corporations and pension funds Other financial intermediaries Non-financial corporations
Total Up to Over 1 Over Total Up to Over 1 Over Total Up to Over 1 Over
1 year and up to 5 years 1 year and up to 5 years 1 year and up to 5 years5 years Reverse repos 5 years 5 years
to centralcounterparties
1 2 3 4 5 6 7 8 9 10 11 12 13
2012 81.6 64.2 4.5 12.9 1,169.5 196.2 599.6 229.4 340.5 4,538.2 1,123.7 794.6 2,619.9
2013 Q2 95.2 79.2 3.8 12.2 1,188.3 252.6 628.3 218.8 341.2 4,451.1 1,117.8 770.7 2,562.6 Q3 98.5 82.1 3.5 12.9 1,048.5 137.7 504.3 215.2 329.1 4,394.6 1,080.2 764.0 2,550.4
2013 Sep. 98.5 82.1 3.5 12.9 1,048.5 137.7 504.3 215.2 329.1 4,394.6 1,080.2 764.0 2,550.4 Oct. 100.4 83.3 3.7 13.5 1,018.2 123.3 473.2 215.7 329.3 4,377.7 1,066.5 762.8 2,548.5 Nov. (p) 101.0 83.4 3.8 13.8 1,016.4 133.2 471.8 216.7 327.9 4,371.9 1,062.9 759.6 2,549.4
Transactions
2012 -1.7 0.6 -1.8 -0.5 51.8 38.7 21.1 13.1 17.6 -108.5 5.8 -51.5 -62.8
2013 Q2 3.6 3.6 -0.1 0.1 -16.0 17.8 -1.1 -2.9 -12.0 -40.5 -16.2 -5.0 -19.2 Q3 3.7 3.2 -0.3 0.7 -43.7 -8.0 -32.2 2.4 -13.9 -44.5 -30.1 -7.4 -7.0
2013 Sep. -1.6 -2.0 0.0 0.4 11.3 5.7 13.9 0.1 -2.7 -0.7 9.8 -6.1 -4.4 Oct. 1.9 1.2 0.2 0.6 -22.1 -7.9 -23.8 1.3 0.4 -16.4 -12.2 1.3 -5.5 Nov. (p) 0.5 0.1 0.1 0.3 1.8 14.2 2.4 0.9 -1.5 -3.6 -2.5 -3.1 2.0
Growth rates
2012 -2.0 0.9 -28.6 -3.5 4.6 24.7 3.6 6.0 5.5 -2.3 0.5 -6.0 -2.3
2013 Q2 11.4 17.3 -29.6 -2.2 3.9 42.7 8.8 -0.8 -1.5 -3.3 -1.9 -6.2 -3.0 Q3 10.0 14.6 -37.6 5.2 -4.2 12.4 -4.1 -0.8 -5.9 -3.6 -3.2 -5.6 -3.2
2013 Sep. 10.0 14.6 -37.6 5.2 -4.2 12.4 -4.1 -0.8 -5.9 -3.6 -3.2 -5.6 -3.2 Oct. 8.4 11.3 -31.6 7.8 -5.6 4.0 -7.9 0.1 -5.4 -3.7 -4.2 -5.1 -3.1 Nov. (p) 14.2 17.2 -19.7 9.6 -4.7 20.8 -4.7 0.0 -7.8 -3.8 -4.7 -4.9 -3.1
2. Loans to households 3)
Outstanding amounts
Total Consumer credit Loans for house purchase Other loans
Total Up to Over 1 Over Total Up to Over 1 Over Total Up to Over 1 Over
1 year and up to 5 years 1 year and up to 5 years 1 year and up to 5 years5 years 5 years Sole 5 years
proprietors1 2 3 4 5 6 7 8 9 10 11 12 13 14
2012 5,252.5 604.3 136.4 175.2 292.7 3,830.9 14.4 56.6 3,760.0 817.3 419.4 139.8 80.7 596.9
2013 Q2 5,243.4 589.5 130.9 171.3 287.3 3,840.4 13.7 55.7 3,771.1 813.5 414.1 144.7 78.4 590.3 Q3 5,237.7 583.0 130.4 170.4 282.3 3,847.0 12.6 55.8 3,778.6 807.7 413.6 138.4 77.6 591.7
2013 Sep. 5,237.7 583.0 130.4 170.4 282.3 3,847.0 12.6 55.8 3,778.6 807.7 413.6 138.4 77.6 591.7 Oct. 5,233.6 576.4 126.9 168.6 280.9 3,854.4 12.8 55.9 3,785.7 802.8 410.2 136.3 77.3 589.1 Nov. (p) 5,236.1 572.9 125.3 168.4 279.1 3,857.5 12.7 56.0 3,788.9 805.8 408.9 140.3 77.2 588.3
Transactions
2012 25.0 -17.8 -3.2 -6.2 -8.4 47.8 0.2 0.2 47.4 -4.9 -5.7 -0.4 -6.9 2.3
2013 Q2 6.6 -0.1 1.5 -1.0 -0.6 3.3 0.2 -0.3 3.4 3.4 -2.1 3.7 0.1 -0.3 Q3 -1.2 -2.1 0.0 -1.0 -1.1 6.7 -1.1 0.1 7.7 -5.9 -1.5 -6.0 -0.7 0.9
2013 Sep. 9.8 0.4 1.8 -0.5 -1.0 8.1 0.0 -0.2 8.4 1.4 2.0 1.8 -0.9 0.4 Oct. 1.5 -5.8 -3.0 -1.9 -1.0 7.8 0.2 0.1 7.5 -0.5 -0.1 -1.1 0.1 0.6 Nov. (p) 3.4 -3.0 -0.9 -0.7 -1.4 3.2 -0.1 0.1 3.2 3.2 -1.7 4.0 -0.2 -0.6
Growth rates
2012 0.5 -2.8 -2.2 -3.4 -2.8 1.3 1.3 0.3 1.3 -0.6 -1.4 -0.3 -7.8 0.4
2013 Q2 0.0 -3.6 -2.4 -5.0 -3.3 0.9 -0.1 -2.1 0.9 -1.2 -1.6 -1.1 -7.3 -0.3 Q3 0.1 -2.3 -0.8 -3.9 -2.1 0.8 -10.1 -2.4 0.9 -1.0 -1.2 -1.1 -5.6 -0.4
2013 Sep. 0.1 -2.3 -0.8 -3.9 -2.1 0.8 -10.1 -2.4 0.9 -1.0 -1.2 -1.1 -5.6 -0.4 Oct. 0.2 -3.2 -2.6 -5.0 -2.3 0.9 -8.4 -2.5 1.0 -1.1 -1.3 -1.8 -5.3 -0.4 Nov. (p) 0.1 -3.3 -2.8 -4.9 -2.7 0.9 -8.8 -2.5 1.0 -1.5 -1.4 -3.4 -5.1 -0.5
Source: ECB.1) MFI sector excluding the Eurosystem; sectoral classification is based on the ESA 95.2) Data refer to the changing composition of the euro area. For further information, see the General Notes.3) Including non-profit institutions serving households.
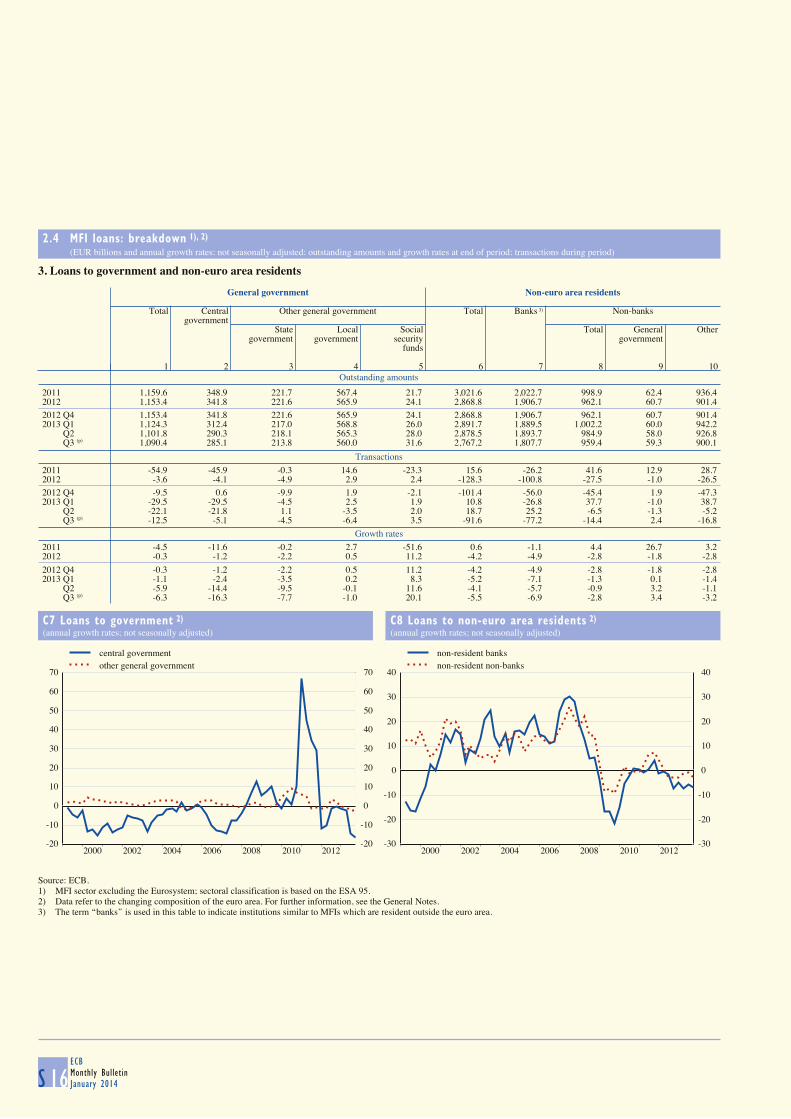
2.4 MFI loans: breakdown 1), 2) (EUR billions and annual growth rates; not seasonally adjusted; outstanding amounts and growth rates at end of period; transactions during period)
S 16ECBMonthly BulletinJanuary 2014
3. Loans to government and non-euro area residents
Outstanding amounts
General government Non-euro area residents
Total Central Other general government Total Banks 3) Non-banks
governmentState Local Social Total General Other
government government security governmentfunds
1 2 3 4 5 6 7 8 9 10
2011 1,159.6 348.9 221.7 567.4 21.7 3,021.6 2,022.7 998.9 62.4 936.42012 1,153.4 341.8 221.6 565.9 24.1 2,868.8 1,906.7 962.1 60.7 901.4
2012 Q4 1,153.4 341.8 221.6 565.9 24.1 2,868.8 1,906.7 962.1 60.7 901.42013 Q1 1,124.3 312.4 217.0 568.8 26.0 2,891.7 1,889.5 1,002.2 60.0 942.2 Q2 1,101.8 290.3 218.1 565.3 28.0 2,878.5 1,893.7 984.9 58.0 926.8 Q3 (p) 1,090.4 285.1 213.8 560.0 31.6 2,767.2 1,807.7 959.4 59.3 900.1
Transactions
2011 -54.9 -45.9 -0.3 14.6 -23.3 15.6 -26.2 41.6 12.9 28.72012 -3.6 -4.1 -4.9 2.9 2.4 -128.3 -100.8 -27.5 -1.0 -26.5
2012 Q4 -9.5 0.6 -9.9 1.9 -2.1 -101.4 -56.0 -45.4 1.9 -47.32013 Q1 -29.5 -29.5 -4.5 2.5 1.9 10.8 -26.8 37.7 -1.0 38.7 Q2 -22.1 -21.8 1.1 -3.5 2.0 18.7 25.2 -6.5 -1.3 -5.2 Q3 (p) -12.5 -5.1 -4.5 -6.4 3.5 -91.6 -77.2 -14.4 2.4 -16.8
Growth rates
2011 -4.5 -11.6 -0.2 2.7 -51.6 0.6 -1.1 4.4 26.7 3.22012 -0.3 -1.2 -2.2 0.5 11.2 -4.2 -4.9 -2.8 -1.8 -2.8
2012 Q4 -0.3 -1.2 -2.2 0.5 11.2 -4.2 -4.9 -2.8 -1.8 -2.82013 Q1 -1.1 -2.4 -3.5 0.2 8.3 -5.2 -7.1 -1.3 0.1 -1.4 Q2 -5.9 -14.4 -9.5 -0.1 11.6 -4.1 -5.7 -0.9 3.2 -1.1 Q3 (p) -6.3 -16.3 -7.7 -1.0 20.1 -5.5 -6.9 -2.8 3.4 -3.2
C7 Loans to government 2)
(annual growth rates; not seasonally adjusted)
C8 Loans to non-euro area residents 2)
(annual growth rates; not seasonally adjusted)
-20
-10
0
10
20
30
40
50
60
70
2000 2002 2004 2006 2008 2010 2012-20
-10
0
10
20
30
40
50
60
70
central governmentother general government
-30
-20
-10
0
10
20
30
40
2000 2002 2004 2006 2008 2010 2012-30
-20
-10
0
10
20
30
40
non-resident banksnon-resident non-banks
Source: ECB.1) MFI sector excluding the Eurosystem; sectoral classification is based on the ESA 95.2) Data refer to the changing composition of the euro area. For further information, see the General Notes.3) The term ‘‘banks’’ is used in this table to indicate institutions similar to MFIs which are resident outside the euro area.
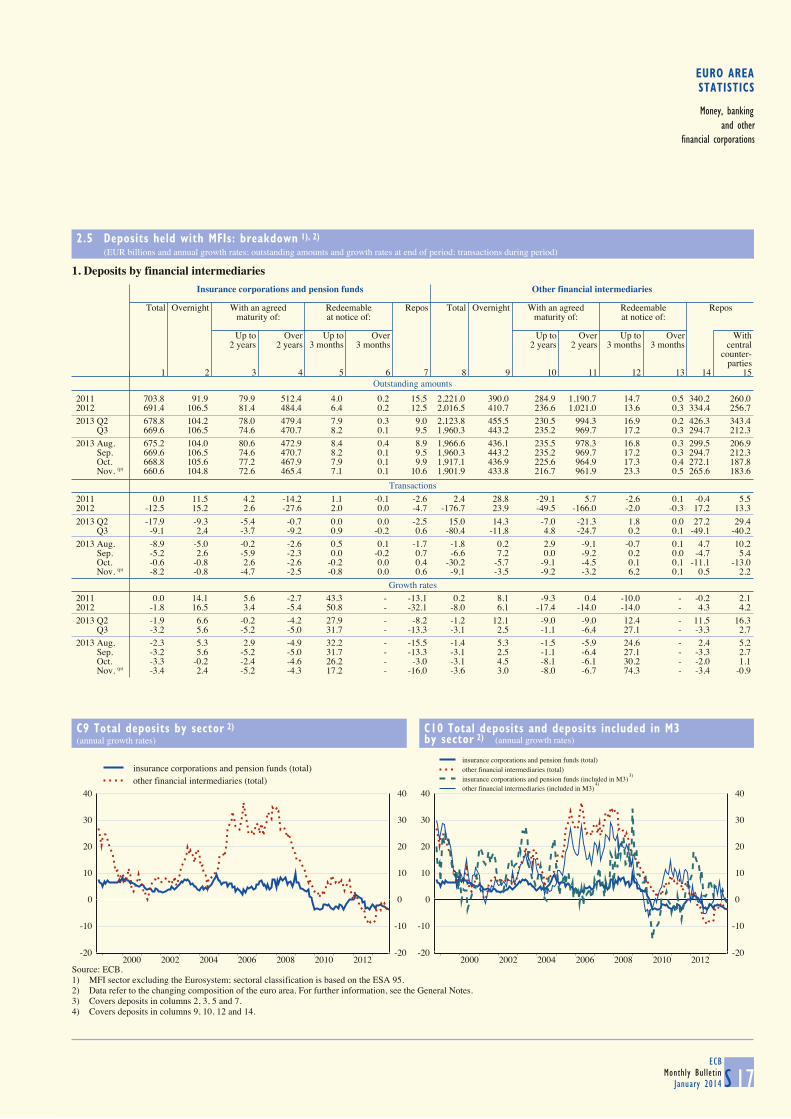
EURO AREASTATISTICS
Money, bankingand other
financial corporations
2.5 Deposits held with MFIs: breakdown 1), 2) (EUR billions and annual growth rates; outstanding amounts and growth rates at end of period; transactions during period)
S 17ECB
Monthly BulletinJanuary 2014
1. Deposits by financial intermediaries
Outstanding amounts
Insurance corporations and pension funds Other financial intermediaries
Total Overnight With an agreed Redeemable Repos Total Overnight With an agreed Redeemable Repos
maturity of: at notice of: maturity of: at notice of:
Up to Over Up to Over Up to Over Up to Over With2 years 2 years 3 months 3 months 2 years 2 years 3 months 3 months central
counter-parties
1 2 3 4 5 6 7 8 9 10 11 12 13 14 15
2011 703.8 91.9 79.9 512.4 4.0 0.2 15.5 2,221.0 390.0 284.9 1,190.7 14.7 0.5 340.2 260.02012 691.4 106.5 81.4 484.4 6.4 0.2 12.5 2,016.5 410.7 236.6 1,021.0 13.6 0.3 334.4 256.7
2013 Q2 678.8 104.2 78.0 479.4 7.9 0.3 9.0 2,123.8 455.5 230.5 994.3 16.9 0.2 426.3 343.4 Q3 669.6 106.5 74.6 470.7 8.2 0.1 9.5 1,960.3 443.2 235.2 969.7 17.2 0.3 294.7 212.3
2013 Aug. 675.2 104.0 80.6 472.9 8.4 0.4 8.9 1,966.6 436.1 235.5 978.3 16.8 0.3 299.5 206.9 Sep. 669.6 106.5 74.6 470.7 8.2 0.1 9.5 1,960.3 443.2 235.2 969.7 17.2 0.3 294.7 212.3 Oct. 668.8 105.6 77.2 467.9 7.9 0.1 9.9 1,917.1 436.9 225.6 964.9 17.3 0.4 272.1 187.8 Nov. (p) 660.6 104.8 72.6 465.4 7.1 0.1 10.6 1,901.9 433.8 216.7 961.9 23.3 0.5 265.6 183.6
Transactions
2011 0.0 11.5 4.2 -14.2 1.1 -0.1 -2.6 2.4 28.8 -29.1 5.7 -2.6 0.1 -0.4 5.52012 -12.5 15.2 2.6 -27.6 2.0 0.0 -4.7 -176.7 23.9 -49.5 -166.0 -2.0 -0.3 17.2 13.3
2013 Q2 -17.9 -9.3 -5.4 -0.7 0.0 0.0 -2.5 15.0 14.3 -7.0 -21.3 1.8 0.0 27.2 29.4 Q3 -9.1 2.4 -3.7 -9.2 0.9 -0.2 0.6 -80.4 -11.8 4.8 -24.7 0.2 0.1 -49.1 -40.2
2013 Aug. -8.9 -5.0 -0.2 -2.6 0.5 0.1 -1.7 -1.8 0.2 2.9 -9.1 -0.7 0.1 4.7 10.2 Sep. -5.2 2.6 -5.9 -2.3 0.0 -0.2 0.7 -6.6 7.2 0.0 -9.2 0.2 0.0 -4.7 5.4 Oct. -0.6 -0.8 2.6 -2.6 -0.2 0.0 0.4 -30.2 -5.7 -9.1 -4.5 0.1 0.1 -11.1 -13.0 Nov. (p) -8.2 -0.8 -4.7 -2.5 -0.8 0.0 0.6 -9.1 -3.5 -9.2 -3.2 6.2 0.1 0.5 2.2
Growth rates
2011 0.0 14.1 5.6 -2.7 43.3 - -13.1 0.2 8.1 -9.3 0.4 -10.0 - -0.2 2.12012 -1.8 16.5 3.4 -5.4 50.8 - -32.1 -8.0 6.1 -17.4 -14.0 -14.0 - 4.3 4.2
2013 Q2 -1.9 6.6 -0.2 -4.2 27.9 - -8.2 -1.2 12.1 -9.0 -9.0 12.4 - 11.5 16.3 Q3 -3.2 5.6 -5.2 -5.0 31.7 - -13.3 -3.1 2.5 -1.1 -6.4 27.1 - -3.3 2.7
2013 Aug. -2.3 5.3 2.9 -4.9 32.2 - -15.5 -1.4 5.3 -1.5 -5.9 24.6 - 2.4 5.2 Sep. -3.2 5.6 -5.2 -5.0 31.7 - -13.3 -3.1 2.5 -1.1 -6.4 27.1 - -3.3 2.7 Oct. -3.3 -0.2 -2.4 -4.6 26.2 - -3.0 -3.1 4.5 -8.1 -6.1 30.2 - -2.0 1.1 Nov. (p) -3.4 2.4 -5.2 -4.3 17.2 - -16.0 -3.6 3.0 -8.0 -6.7 74.3 - -3.4 -0.9
C9 Total deposits by sector 2)
(annual growth rates)
C10 Total deposits and deposits included in M3
by sector 2) (annual growth rates)
-20
-10
0
10
20
30
40
2000 2002 2004 2006 2008 2010 2012-20
-10
0
10
20
30
40
insurance corporations and pension funds (total)other financial intermediaries (total)
-20
-10
0
10
20
30
40
2000 2002 2004 2006 2008 2010 2012-20
-10
0
10
20
30
40
insurance corporations and pension funds (total)other financial intermediaries (total)insurance corporations and pension funds (included in M3)other financial intermediaries (included in M3)
Source: ECB.1) MFI sector excluding the Eurosystem; sectoral classification is based on the ESA 95.2) Data refer to the changing composition of the euro area. For further information, see the General Notes.3) Covers deposits in columns 2, 3, 5 and 7.4) Covers deposits in columns 9, 10, 12 and 14.
3)
4)
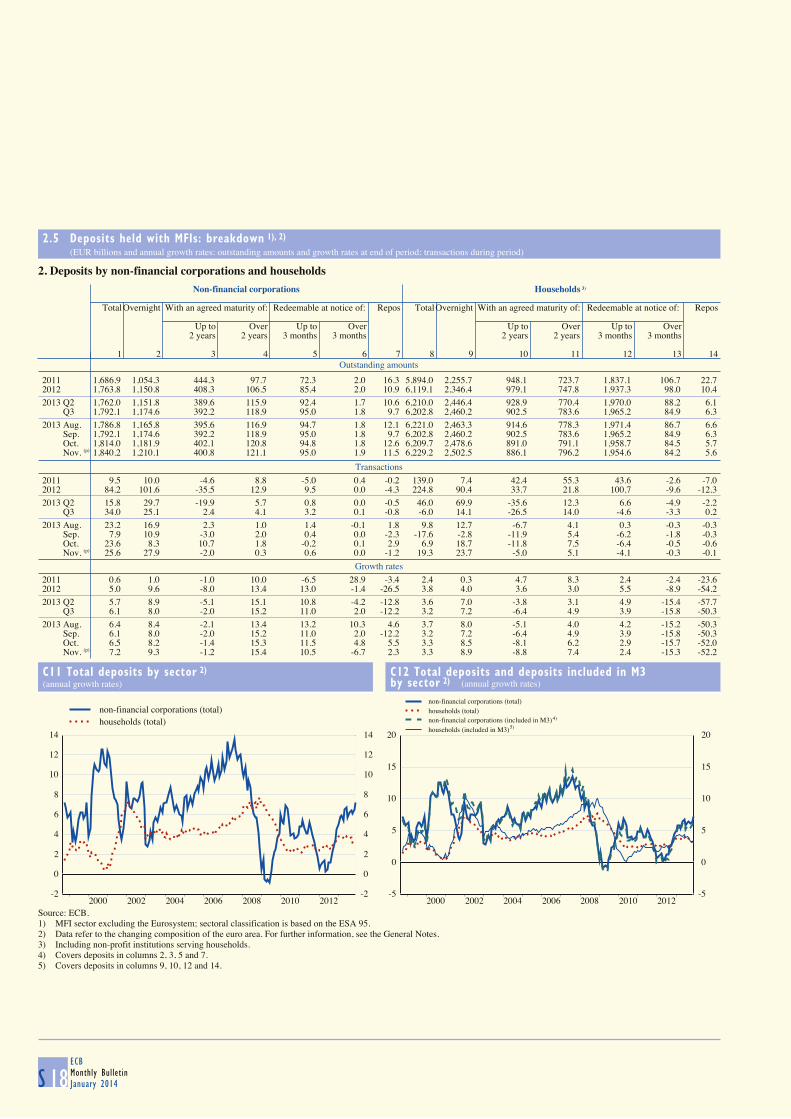
2.5 Deposits held with MFIs: breakdown 1), 2) (EUR billions and annual growth rates; outstanding amounts and growth rates at end of period; transactions during period)
S 18ECBMonthly BulletinJanuary 2014
2. Deposits by non-financial corporations and households
Outstanding amounts
Non-financial corporations Households 3)
TotalOvernight With an agreed maturity of: Redeemable at notice of: Repos TotalOvernight With an agreed maturity of: Redeemable at notice of: Repos
Up to Over Up to Over Up to Over Up to Over2 years 2 years 3 months 3 months 2 years 2 years 3 months 3 months
1 2 3 4 5 6 7 8 9 10 11 12 13 14
2011 1,686.9 1,054.3 444.3 97.7 72.3 2.0 16.3 5,894.0 2,255.7 948.1 723.7 1,837.1 106.7 22.72012 1,763.8 1,150.8 408.3 106.5 85.4 2.0 10.9 6,119.1 2,346.4 979.1 747.8 1,937.3 98.0 10.4
2013 Q2 1,762.0 1,151.8 389.6 115.9 92.4 1.7 10.6 6,210.0 2,446.4 928.9 770.4 1,970.0 88.2 6.1 Q3 1,792.1 1,174.6 392.2 118.9 95.0 1.8 9.7 6,202.8 2,460.2 902.5 783.6 1,965.2 84.9 6.3
2013 Aug. 1,786.8 1,165.8 395.6 116.9 94.7 1.8 12.1 6,221.0 2,463.3 914.6 778.3 1,971.4 86.7 6.6 Sep. 1,792.1 1,174.6 392.2 118.9 95.0 1.8 9.7 6,202.8 2,460.2 902.5 783.6 1,965.2 84.9 6.3 Oct. 1,814.0 1,181.9 402.1 120.8 94.8 1.8 12.6 6,209.7 2,478.6 891.0 791.1 1,958.7 84.5 5.7 Nov. (p) 1,840.2 1,210.1 400.8 121.1 95.0 1.9 11.5 6,229.2 2,502.5 886.1 796.2 1,954.6 84.2 5.6
Transactions
2011 9.5 10.0 -4.6 8.8 -5.0 0.4 -0.2 139.0 7.4 42.4 55.3 43.6 -2.6 -7.02012 84.2 101.6 -35.5 12.9 9.5 0.0 -4.3 224.8 90.4 33.7 21.8 100.7 -9.6 -12.3
2013 Q2 15.8 29.7 -19.9 5.7 0.8 0.0 -0.5 46.0 69.9 -35.6 12.3 6.6 -4.9 -2.2 Q3 34.0 25.1 2.4 4.1 3.2 0.1 -0.8 -6.0 14.1 -26.5 14.0 -4.6 -3.3 0.2
2013 Aug. 23.2 16.9 2.3 1.0 1.4 -0.1 1.8 9.8 12.7 -6.7 4.1 0.3 -0.3 -0.3 Sep. 7.9 10.9 -3.0 2.0 0.4 0.0 -2.3 -17.6 -2.8 -11.9 5.4 -6.2 -1.8 -0.3 Oct. 23.6 8.3 10.7 1.8 -0.2 0.1 2.9 6.9 18.7 -11.8 7.5 -6.4 -0.5 -0.6 Nov. (p) 25.6 27.9 -2.0 0.3 0.6 0.0 -1.2 19.3 23.7 -5.0 5.1 -4.1 -0.3 -0.1
Growth rates
2011 0.6 1.0 -1.0 10.0 -6.5 28.9 -3.4 2.4 0.3 4.7 8.3 2.4 -2.4 -23.62012 5.0 9.6 -8.0 13.4 13.0 -1.4 -26.5 3.8 4.0 3.6 3.0 5.5 -8.9 -54.2
2013 Q2 5.7 8.9 -5.1 15.1 10.8 -4.2 -12.8 3.6 7.0 -3.8 3.1 4.9 -15.4 -57.7 Q3 6.1 8.0 -2.0 15.2 11.0 2.0 -12.2 3.2 7.2 -6.4 4.9 3.9 -15.8 -50.3
2013 Aug. 6.4 8.4 -2.1 13.4 13.2 10.3 4.6 3.7 8.0 -5.1 4.0 4.2 -15.2 -50.3 Sep. 6.1 8.0 -2.0 15.2 11.0 2.0 -12.2 3.2 7.2 -6.4 4.9 3.9 -15.8 -50.3 Oct. 6.5 8.2 -1.4 15.3 11.5 4.8 5.5 3.3 8.5 -8.1 6.2 2.9 -15.7 -52.0 Nov. (p) 7.2 9.3 -1.2 15.4 10.5 -6.7 2.3 3.3 8.9 -8.8 7.4 2.4 -15.3 -52.2
C11 Total deposits by sector 2)
(annual growth rates)
C12 Total deposits and deposits included in M3
by sector 2) (annual growth rates)
-2
0
2
4
6
8
10
12
14
2000 2002 2004 2006 2008 2010 2012-2
0
2
4
6
8
10
12
14
non-financial corporations (total)households (total)
-5
0
5
10
15
20
2000 2002 2004 2006 2008 2010 2012-5
0
5
10
15
20
non-financial corporations (total)households (total)non-financial corporations (included in M3)households (included in M3)
Source: ECB.1) MFI sector excluding the Eurosystem; sectoral classification is based on the ESA 95.2) Data refer to the changing composition of the euro area. For further information, see the General Notes.3) Including non-profit institutions serving households.4) Covers deposits in columns 2, 3, 5 and 7.5) Covers deposits in columns 9, 10, 12 and 14.
4)
5)
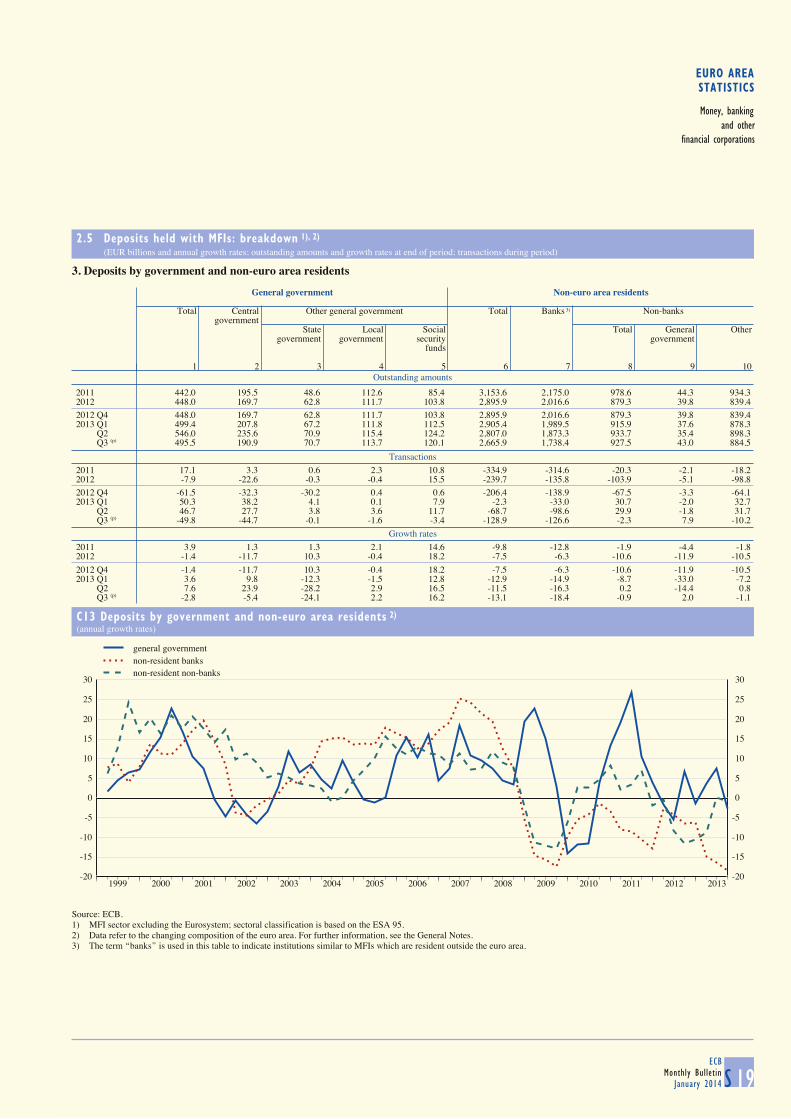
EURO AREASTATISTICS
Money, bankingand other
financial corporations
2.5 Deposits held with MFIs: breakdown 1), 2) (EUR billions and annual growth rates; outstanding amounts and growth rates at end of period; transactions during period)
S 19ECB
Monthly BulletinJanuary 2014
3. Deposits by government and non-euro area residents
Outstanding amounts
General government Non-euro area residents
Total Central Other general government Total Banks 3) Non-banks
governmentState Local Social Total General Other
government government security governmentfunds
1 2 3 4 5 6 7 8 9 10
2011 442.0 195.5 48.6 112.6 85.4 3,153.6 2,175.0 978.6 44.3 934.32012 448.0 169.7 62.8 111.7 103.8 2,895.9 2,016.6 879.3 39.8 839.4
2012 Q4 448.0 169.7 62.8 111.7 103.8 2,895.9 2,016.6 879.3 39.8 839.42013 Q1 499.4 207.8 67.2 111.8 112.5 2,905.4 1,989.5 915.9 37.6 878.3 Q2 546.0 235.6 70.9 115.4 124.2 2,807.0 1,873.3 933.7 35.4 898.3 Q3 (p) 495.5 190.9 70.7 113.7 120.1 2,665.9 1,738.4 927.5 43.0 884.5
Transactions
2011 17.1 3.3 0.6 2.3 10.8 -334.9 -314.6 -20.3 -2.1 -18.22012 -7.9 -22.6 -0.3 -0.4 15.5 -239.7 -135.8 -103.9 -5.1 -98.8
2012 Q4 -61.5 -32.3 -30.2 0.4 0.6 -206.4 -138.9 -67.5 -3.3 -64.12013 Q1 50.3 38.2 4.1 0.1 7.9 -2.3 -33.0 30.7 -2.0 32.7 Q2 46.7 27.7 3.8 3.6 11.7 -68.7 -98.6 29.9 -1.8 31.7 Q3 (p) -49.8 -44.7 -0.1 -1.6 -3.4 -128.9 -126.6 -2.3 7.9 -10.2
Growth rates
2011 3.9 1.3 1.3 2.1 14.6 -9.8 -12.8 -1.9 -4.4 -1.82012 -1.4 -11.7 10.3 -0.4 18.2 -7.5 -6.3 -10.6 -11.9 -10.5
2012 Q4 -1.4 -11.7 10.3 -0.4 18.2 -7.5 -6.3 -10.6 -11.9 -10.52013 Q1 3.6 9.8 -12.3 -1.5 12.8 -12.9 -14.9 -8.7 -33.0 -7.2 Q2 7.6 23.9 -28.2 2.9 16.5 -11.5 -16.3 0.2 -14.4 0.8 Q3 (p) -2.8 -5.4 -24.1 2.2 16.2 -13.1 -18.4 -0.9 2.0 -1.1
C13 Deposits by government and non-euro area residents 2)
(annual growth rates)
-20
-15
-10
-5
0
5
10
15
20
25
30
1999 2000 2001 2002 2003 2004 2005 2006 2007 2008 2009 2010 2011 2012 2013-20
-15
-10
-5
0
5
10
15
20
25
30
general governmentnon-resident banksnon-resident non-banks
Source: ECB.1) MFI sector excluding the Eurosystem; sectoral classification is based on the ESA 95.2) Data refer to the changing composition of the euro area. For further information, see the General Notes.3) The term ‘‘banks’’ is used in this table to indicate institutions similar to MFIs which are resident outside the euro area.

2.6 MFI holdings of securities: breakdown 1), 2) (EUR billions and annual growth rates; outstanding amounts and growth rates at end of period; transactions during period)
S 20ECBMonthly BulletinJanuary 2014
Outstanding amounts
Securities other than shares Shares and other equity
Total MFIs General Other euro Non-euro area Total MFIs Non-MFIs Non-euro area
government area residents residents residents
Euro Non-euro Euro Non-euro Euro Non-euro
1 2 3 4 5 6 7 8 9 10 11 12
2011 5,697.6 1,764.2 87.8 1,373.0 22.9 1,489.0 28.3 932.5 1,507.4 484.0 728.0 295.42012 5,774.4 1,748.4 102.9 1,594.2 32.8 1,399.6 23.6 872.8 1,528.5 475.7 752.1 300.7
2013 Q2 5,774.5 1,650.0 117.1 1,755.9 29.3 1,380.6 26.7 814.9 1,554.7 468.9 777.5 308.4 Q3 5,649.4 1,601.6 102.2 1,714.9 29.8 1,365.0 28.8 807.1 1,552.7 456.3 776.6 319.8
2013 Aug. 5,698.3 1,625.6 110.5 1,723.9 31.4 1,374.3 27.5 805.1 1,533.3 457.2 766.1 310.0 Sep. 5,649.4 1,601.6 102.2 1,714.9 29.8 1,365.0 28.8 807.1 1,552.7 456.3 776.6 319.8 Oct. 5,626.6 1,586.3 100.7 1,735.6 29.0 1,346.3 28.2 800.7 1,556.3 458.0 776.6 321.7 Nov. (p) 5,616.0 1,578.7 103.0 1,735.0 26.0 1,344.3 27.4 801.7 1,567.3 460.9 778.6 327.8
Transactions
2011 -29.2 45.1 7.8 -2.6 5.5 -24.8 -0.1 -60.1 17.0 60.2 -31.5 -11.72012 82.5 -17.8 15.9 191.7 10.5 -67.5 -3.9 -46.3 49.9 6.6 38.0 5.3
2013 Q2 7.8 -48.6 -5.2 83.4 -1.7 -0.8 0.0 -19.3 19.7 9.9 9.2 0.6 Q3 -123.7 -50.2 -14.5 -45.9 0.8 -15.4 2.3 -0.8 -13.4 -14.1 -8.7 9.4
2013 Aug. -23.5 -14.0 -8.1 1.6 2.5 -3.3 -0.2 -1.9 -25.6 -22.3 -2.6 -0.7 Sep. -51.2 -25.0 -8.8 -11.7 -1.4 -9.9 1.3 4.4 13.0 -1.0 5.9 8.1 Oct. -29.2 -16.8 -0.4 10.6 -0.5 -19.5 -0.3 -2.3 -3.7 2.2 -5.8 -0.1 Nov. (p) -17.8 -8.3 1.3 -3.2 -3.1 -2.1 -1.1 -1.2 8.9 2.7 1.7 4.5
Growth rates
2011 -0.5 2.7 7.7 -0.2 33.7 -1.6 -0.8 -6.2 1.1 13.8 -4.1 -3.82012 1.5 -1.0 18.1 14.1 47.7 -4.6 -14.2 -4.9 3.3 1.3 5.2 1.8
2013 Q2 -1.2 -7.6 19.7 10.4 -8.8 -3.5 7.7 -7.2 5.4 -1.3 8.1 9.7 Q3 -2.3 -11.0 -2.2 6.5 -2.2 0.9 15.2 -5.7 3.0 -4.7 4.5 12.3
2013 Aug. -1.4 -10.8 6.8 9.6 2.5 0.5 13.6 -6.2 2.7 -4.2 5.3 8.0 Sep. -2.3 -11.0 -2.2 6.5 -2.2 0.9 15.2 -5.7 3.0 -4.7 4.5 12.3 Oct. -2.2 -11.0 -1.9 6.4 -2.7 0.0 0.1 -4.0 2.8 -4.4 4.3 11.0 Nov. (p) -2.9 -11.2 -5.4 4.5 -18.2 0.5 17.7 -4.4 3.3 -2.0 2.6 14.1
C14 MFI holdings of securities 2)
(annual growth rates)
-10
-5
0
5
10
15
20
25
30
1999 2000 2001 2002 2003 2004 2005 2006 2007 2008 2009 2010 2011 2012 2013-10
-5
0
5
10
15
20
25
30
securities other than sharesshares and other equity
Source: ECB.1) MFI sector excluding the Eurosystem; sectoral classification is based on the ESA 95.2) Data refer to the changing composition of the euro area. For further information, see the General Notes.

EURO AREASTATISTICS
Money, bankingand other
financial corporations
2.7 Currency breakdown of selected MFI balance sheet items 1), 2) (percentages of total; outstanding amounts in EUR billions; end of period)
S 21ECB
Monthly BulletinJanuary 2014
1. Loans, holdings of securities other than shares, and deposits
Loans
MFIs 3) Non-MFIs
All Euro 4) Non-euro currencies All Euro 4) Non-euro currencies
currencies currencies (outstanding Total (outstanding Total
amount) amount)USD JPY CHF GBP USD JPY CHF GBP
1 2 3 4 5 6 7 8 9 10 11 12 13 14
To euro area residents
2011 6,153.8 - - - - - - 12,322.7 96.2 3.8 1.9 0.3 1.1 0.42012 5,795.4 - - - - - - 12,195.1 96.4 3.6 1.7 0.2 0.9 0.5
2013 Q2 5,448.4 - - - - - - 12,079.8 96.5 3.5 1.8 0.2 0.9 0.4 Q3 (p) 5,430.8 - - - - - - 11,869.8 96.6 3.4 1.7 0.1 0.9 0.4
To non-euro area residents
2011 2,022.7 44.5 55.5 35.6 2.5 2.7 9.3 998.9 38.2 61.8 41.2 2.6 3.3 7.82012 1,906.7 47.3 52.7 31.9 1.9 3.5 10.1 962.1 40.1 59.9 38.2 2.0 2.9 9.9
2013 Q2 1,893.7 44.2 55.8 35.8 2.1 2.8 9.4 984.9 39.6 60.4 39.4 2.7 2.6 9.1 Q3 (p) 1,807.7 41.8 58.2 36.6 2.4 3.6 9.9 959.4 40.3 59.7 38.6 2.6 2.6 9.1
Holdings of securities other than shares
Issued by euro area residents
2011 1,852.0 95.3 4.7 2.5 0.1 0.3 1.5 2,913.1 98.2 1.8 1.0 0.2 0.1 0.42012 1,851.3 94.4 5.6 2.7 0.1 0.4 2.0 3,050.3 98.1 1.9 1.2 0.1 0.1 0.4
2013 Q2 1,767.1 93.4 6.6 2.9 0.1 0.3 2.9 3,192.5 98.2 1.8 1.0 0.1 0.1 0.5 Q3 (p) 1,703.8 94.0 6.0 2.8 0.1 0.3 2.4 3,138.5 98.1 1.9 1.0 0.1 0.1 0.6
Issued by non-euro area residents
2011 457.0 56.4 43.6 21.1 0.3 0.3 16.0 475.5 32.2 67.8 39.4 5.8 0.7 13.72012 434.0 54.9 45.1 19.8 0.3 0.3 19.1 438.8 34.1 65.9 39.1 5.4 0.9 11.8
2013 Q2 407.8 55.1 44.9 20.9 0.2 0.2 17.1 407.2 34.7 65.3 40.5 4.8 0.9 10.4 Q3 (p) 419.8 52.6 47.4 21.3 0.2 0.2 19.2 387.3 36.6 63.4 37.6 4.3 0.9 11.0
Deposits
By euro area residents
2011 6,364.4 92.1 7.9 5.1 0.2 1.2 0.7 10,947.6 97.0 3.0 2.0 0.1 0.1 0.42012 6,159.1 93.8 6.2 3.9 0.2 1.1 0.6 11,038.7 97.0 3.0 2.0 0.1 0.1 0.4
2013 Q2 5,750.6 93.1 6.9 4.4 0.2 1.0 0.6 11,320.6 97.0 3.0 2.1 0.1 0.1 0.4 Q3 (p) 5,731.6 93.1 6.9 4.4 0.2 1.1 0.7 11,120.4 96.8 3.2 2.1 0.1 0.1 0.4
By non-euro area residents
2011 2,175.0 59.2 40.8 25.6 2.1 1.8 7.2 978.6 56.1 43.9 30.0 2.0 1.5 5.12012 2,016.6 58.3 41.7 27.7 1.6 1.0 7.3 879.3 52.4 47.6 31.3 1.9 1.2 6.3
2013 Q2 1,873.3 56.7 43.3 29.1 1.3 0.9 7.1 933.7 50.4 49.6 33.3 2.5 1.0 6.4 Q3 (p) 1,738.4 54.4 45.6 31.1 1.6 1.3 7.7 927.5 51.1 48.9 32.1 2.2 1.3 6.3
2. Debt securities issued by euro area MFIs
All Euro 4) Non-euro currencies
currencies (outstanding Total
amount)USD JPY CHF GBP
1 2 3 4 5 6 7
2011 5,236.8 82.0 18.0 9.4 1.7 2.0 2.62012 5,068.0 81.8 18.2 9.6 1.6 1.9 2.5
2013 Q2 4,825.2 81.0 19.0 10.9 1.2 1.8 2.6 Q3 (p) 4,710.1 80.7 19.3 11.0 1.2 1.8 2.7
Source: ECB.1) MFI sector excluding the Eurosystem; sectoral classification is based on the ESA 95.2) Data refer to the changing composition of the euro area. For further information, see the General Notes.3) For non-euro area residents, the term ‘‘MFIs’’ refers to institutions similar to euro area MFIs.4) Including items expressed in the national denominations of the euro.

2.8 Aggregated balance sheet of euro area investment funds 1) (EUR billions; outstanding amounts at end of period; transactions during period)
S 22ECBMonthly BulletinJanuary 2014
1. Assets
Outstanding amounts
Total Deposits and Securities other Shares and other Investment fund/ Non-financial Other assetsloan claims than shares equity (excl. money market fund assets (incl. financial
investment fund/ shares derivatives)money market fund
shares)1 2 3 4 5 6 7
2013 Apr. 7,764.7 520.4 3,134.7 2,159.9 1,042.3 248.7 658.8 May 7,825.2 519.2 3,130.8 2,191.9 1,049.8 248.2 685.4 June 7,592.6 524.1 3,045.5 2,095.2 1,018.5 249.0 660.4 July 7,707.0 527.2 3,066.8 2,168.7 1,042.8 250.6 650.8 Aug. 7,656.0 525.1 3,057.4 2,139.6 1,040.4 251.0 642.6 Sep. 7,768.3 507.5 3,099.3 2,224.3 1,064.7 251.1 621.4 Oct. (p) 7,946.7 532.5 3,114.8 2,296.9 1,094.5 251.3 656.8
Transactions
2013 Q1 228.2 25.2 82.1 34.2 32.3 1.6 52.9 Q2 152.6 31.8 55.7 19.1 2.3 1.2 42.6 Q3 53.3 -11.0 56.4 22.8 32.8 2.0 -49.7
2. Liabilities
Outstanding amounts
Total Loans and Investment fund shares issued Other
deposits liabilitiesreceived Total Held by euro area residents Held by (incl. financial
non-euro area derivatives)Investment residents
funds1 2 3 4 5 6 7
2013 Apr. 7,764.7 166.2 7,005.2 5,088.5 828.2 1,916.8 593.3 May 7,825.2 169.2 7,035.7 5,101.5 831.6 1,934.2 620.4 June 7,592.6 164.2 6,819.1 4,996.2 793.4 1,822.9 609.2 July 7,707.0 163.4 6,946.1 5,100.7 818.3 1,845.4 597.5 Aug. 7,656.0 169.6 6,890.5 5,076.6 814.7 1,813.9 595.9 Sep. 7,768.3 167.0 7,037.1 5,179.2 839.0 1,857.8 564.2 Oct. (p) 7,946.7 174.9 7,192.5 5,300.0 867.7 1,892.5 579.4
Transactions
2013 Q1 228.2 9.4 160.6 96.4 31.2 64.2 58.2 Q2 152.6 9.3 97.3 98.0 -7.6 -0.7 46.0 Q3 53.3 3.4 97.0 97.9 32.5 -1.0 -47.1
3. Investment fund shares issued broken down by investment policy and type of fund
Outstanding amounts
Total Funds by investment policy Funds by type Memo item:
Money marketBond Equity Mixed Real estate Hedge Other Open-end Closed-end fundsfunds funds funds funds funds funds funds funds
1 2 3 4 5 6 7 8 9 10
2013 Mar. 6,890.0 2,447.1 1,840.7 1,685.5 327.6 150.3 438.9 6,804.0 86.1 912.1 Apr. 7,005.2 2,505.7 1,855.4 1,717.8 330.1 151.7 444.6 6,918.8 86.5 901.7 May 7,035.7 2,499.0 1,875.2 1,724.4 331.1 154.0 452.0 6,947.2 88.5 895.0 June 6,819.1 2,416.6 1,783.0 1,683.8 331.3 153.6 450.9 6,731.6 87.6 856.2 July 6,946.1 2,431.0 1,847.3 1,721.9 333.7 151.9 460.3 6,858.3 87.8 851.1 Aug. 6,890.5 2,407.2 1,819.9 1,715.4 332.8 154.2 461.0 6,802.7 87.8 869.6 Sep. 7,037.1 2,425.2 1,906.9 1,743.1 334.6 157.1 470.1 6,947.4 89.6 846.2 Oct. (p) 7,192.5 2,443.2 1,976.6 1,795.1 335.3 159.6 482.6 7,102.2 90.3 835.1
Transactions
2013 Apr. 70.1 41.3 7.5 16.7 1.0 -0.7 4.2 70.0 0.2 -0.8 May 45.5 24.7 6.0 7.0 2.9 0.9 3.9 43.6 1.8 -5.8 June -18.3 -24.5 -11.5 8.2 2.4 1.3 5.9 -18.6 0.3 -37.0 July 57.4 18.3 16.5 18.0 2.5 -0.2 2.2 57.0 0.4 0.7 Aug. 2.8 -5.0 -0.5 6.0 0.4 1.2 0.5 2.8 0.0 14.5 Sep. 36.9 -5.1 19.9 14.4 0.8 3.6 3.4 35.4 1.4 -22.2 Oct. (p) 39.1 2.7 18.4 12.1 -0.1 2.0 3.9 39.0 0.1 -7.0
Source: ECB.1) Other than money market funds (which are shown as a memo item in column 10 in Table 3 of this section). For further details, see the General Notes.

EURO AREASTATISTICS
Money, bankingand other
financial corporations
2.9 Securities held by investment funds 1) broken down by issuer of securities (EUR billions; outstanding amounts at end of period; transactions during period)
S 23ECB
Monthly BulletinJanuary 2014
1. Securities other than shares
Outstanding amounts
Total Euro area Rest of the world
Total MFIs General Other Insurance Non-financial EU United Japangovernment financial corporations corporations Member States States
intermediaries and pension outside thefunds euro area
1 2 3 4 5 6 7 8 9 10 11
2012 Q4 2,968.2 1,623.6 416.1 747.1 241.6 7.7 211.0 1,344.6 332.2 510.2 16.22013 Q1 3,069.6 1,632.9 407.4 752.7 245.2 8.2 219.3 1,436.6 332.6 563.4 16.0 Q2 3,045.5 1,649.4 404.2 770.9 247.9 8.4 218.0 1,396.1 324.9 551.1 15.2 Q3 (p) 3,099.3 1,686.0 393.6 798.4 257.7 9.1 227.3 1,413.3 343.8 549.7 14.9
Transactions
2013 Q1 82.1 18.9 -9.9 7.9 7.5 0.5 12.9 63.2 -1.0 32.8 -0.4 Q2 55.7 28.8 -0.4 24.5 4.0 0.1 0.7 26.9 2.4 12.7 0.2 Q3 (p) 56.4 27.7 -11.9 22.1 8.7 0.5 8.3 28.7 20.8 2.5 -0.3
2. Shares and other equity (other than investment fund and money market fund shares)
Outstanding amounts
Total Euro area Rest of the world
Total MFIs General Other Insurance Non-financial EU United Japangovernment financial corporations corporations Member States States
intermediaries and pension outside thefunds euro area
1 2 3 4 5 6 7 8 9 10 11
2012 Q4 1,986.0 721.7 60.8 - 50.9 27.6 582.3 1,264.3 175.6 407.8 78.12013 Q1 2,142.1 738.8 56.4 - 49.9 27.0 605.6 1,403.2 187.7 479.0 95.0 Q2 2,095.2 738.6 58.9 - 52.4 28.1 599.1 1,356.6 181.7 482.2 109.5 Q3 (p) 2,224.3 813.5 72.6 - 56.4 30.4 654.1 1,410.8 197.2 502.7 112.4
Transactions
2013 Q1 34.2 -4.4 -0.5 - -1.7 -1.2 -0.9 38.5 3.7 16.8 5.8 Q2 19.1 1.8 1.3 - -0.3 0.2 0.6 17.3 0.7 6.3 13.8 Q3 (p) 22.8 8.9 1.2 - 0.3 0.6 6.8 13.9 3.0 11.6 0.4
3. Investment fund/money market fund shares
Outstanding amounts
Total Euro area Rest of the world
Total MFIs 2) General Other Insurance Non-financial EU United Japangovernment financial corporations corporations Member States States
intermediaries 2) and pension outside thefunds euro area
1 2 3 4 5 6 7 8 9 10 11
2012 Q4 962.8 829.6 72.1 - 757.5 - - 133.2 28.9 41.4 0.62013 Q1 1,026.1 888.7 74.5 - 814.2 - - 137.4 32.5 43.5 0.6 Q2 1,018.5 880.2 86.8 - 793.4 - - 138.3 31.4 46.0 0.6 Q3 (p) 1,064.7 925.1 86.1 - 839.0 - - 139.6 33.9 46.3 0.5
Transactions
2013 Q1 32.3 33.2 2.0 - 31.2 - - -0.9 2.1 0.9 0.0 Q2 2.3 4.2 11.8 - -7.6 - - -1.9 -0.8 -0.1 0.0 Q3 (p) 32.8 31.1 -1.4 - 32.5 - - 1.7 1.5 1.4 0.0
Source: ECB.1) Other than money market funds. For further details, see the General Notes.2) Investment fund shares (other than money market fund shares) are issued by other financial intermediaries. Money market fund shares are issued by MFIs.
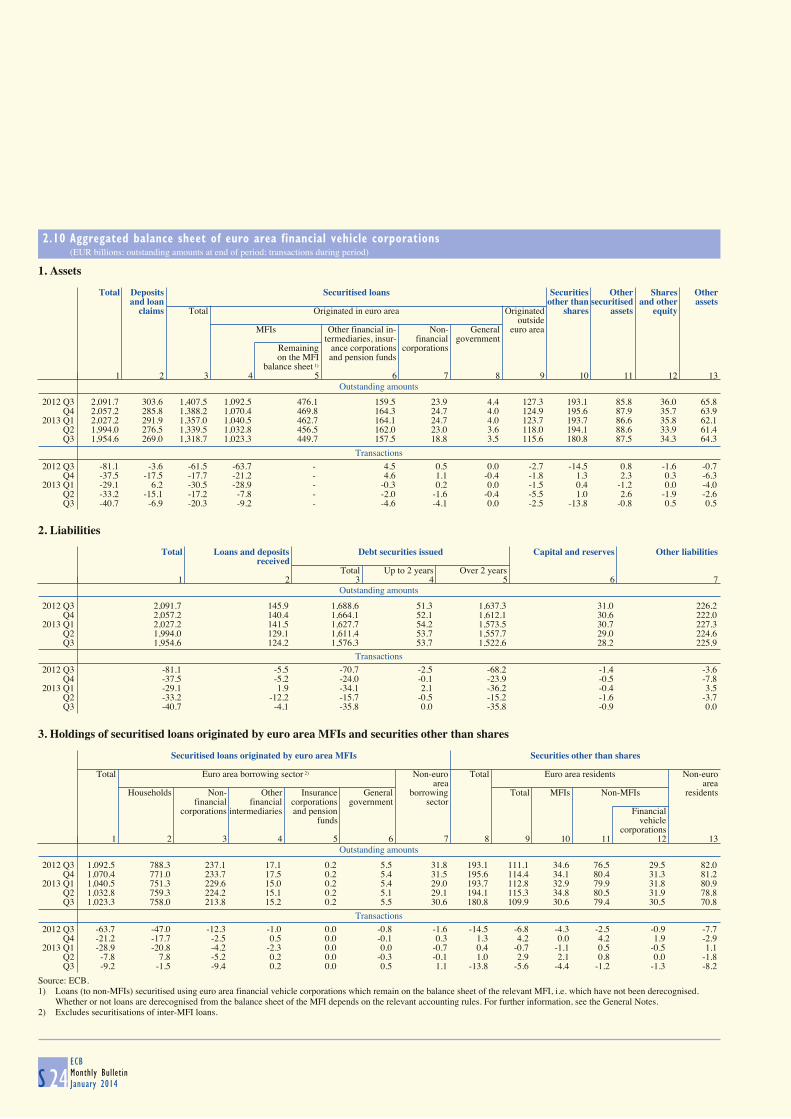
2.10 Aggregated balance sheet of euro area financial vehicle corporations (EUR billions; outstanding amounts at end of period; transactions during period)
S 24ECBMonthly BulletinJanuary 2014
1. Assets
Outstanding amounts
Total Deposits Securitised loans Securities Other Shares Other
and loan other than securitised and other assetsclaims Total Originated in euro area Originated shares assets equity
outside MFIs Other financial in- Non- General euro area
termediaries, insur- financial governmentRemaining ance corporations corporationson the MFI and pension funds
balance sheet 1)
1 2 3 4 5 6 7 8 9 10 11 12 13
2012 Q3 2,091.7 303.6 1,407.5 1,092.5 476.1 159.5 23.9 4.4 127.3 193.1 85.8 36.0 65.8 Q4 2,057.2 285.8 1,388.2 1,070.4 469.8 164.3 24.7 4.0 124.9 195.6 87.9 35.7 63.92013 Q1 2,027.2 291.9 1,357.0 1,040.5 462.7 164.1 24.7 4.0 123.7 193.7 86.6 35.8 62.1 Q2 1,994.0 276.5 1,339.5 1,032.8 456.5 162.0 23.0 3.6 118.0 194.1 88.6 33.9 61.4 Q3 1,954.6 269.0 1,318.7 1,023.3 449.7 157.5 18.8 3.5 115.6 180.8 87.5 34.3 64.3
Transactions
2012 Q3 -81.1 -3.6 -61.5 -63.7 - 4.5 0.5 0.0 -2.7 -14.5 0.8 -1.6 -0.7 Q4 -37.5 -17.5 -17.7 -21.2 - 4.6 1.1 -0.4 -1.8 1.3 2.3 0.3 -6.32013 Q1 -29.1 6.2 -30.5 -28.9 - -0.3 0.2 0.0 -1.5 0.4 -1.2 0.0 -4.0 Q2 -33.2 -15.1 -17.2 -7.8 - -2.0 -1.6 -0.4 -5.5 1.0 2.6 -1.9 -2.6 Q3 -40.7 -6.9 -20.3 -9.2 - -4.6 -4.1 0.0 -2.5 -13.8 -0.8 0.5 0.5
2. Liabilities
Outstanding amounts
Total Loans and deposits Debt securities issued Capital and reserves Other liabilities
receivedTotal Up to 2 years Over 2 years
1 2 3 4 5 6 7
2012 Q3 2,091.7 145.9 1,688.6 51.3 1,637.3 31.0 226.2 Q4 2,057.2 140.4 1,664.1 52.1 1,612.1 30.6 222.02013 Q1 2,027.2 141.5 1,627.7 54.2 1,573.5 30.7 227.3 Q2 1,994.0 129.1 1,611.4 53.7 1,557.7 29.0 224.6 Q3 1,954.6 124.2 1,576.3 53.7 1,522.6 28.2 225.9
Transactions
2012 Q3 -81.1 -5.5 -70.7 -2.5 -68.2 -1.4 -3.6 Q4 -37.5 -5.2 -24.0 -0.1 -23.9 -0.5 -7.82013 Q1 -29.1 1.9 -34.1 2.1 -36.2 -0.4 3.5 Q2 -33.2 -12.2 -15.7 -0.5 -15.2 -1.6 -3.7 Q3 -40.7 -4.1 -35.8 0.0 -35.8 -0.9 0.0
3. Holdings of securitised loans originated by euro area MFIs and securities other than shares
Outstanding amounts
Securitised loans originated by euro area MFIs Securities other than shares
Total Euro area borrowing sector 2) Non-euro Total Euro area residents Non-euro
area areaHouseholds Non- Other Insurance General borrowing Total MFIs Non-MFIs residents
financial financial corporations government sectorcorporations intermediaries and pension Financial
funds vehiclecorporations
1 2 3 4 5 6 7 8 9 10 11 12 13
2012 Q3 1,092.5 788.3 237.1 17.1 0.2 5.5 31.8 193.1 111.1 34.6 76.5 29.5 82.0 Q4 1,070.4 771.0 233.7 17.5 0.2 5.4 31.5 195.6 114.4 34.1 80.4 31.3 81.22013 Q1 1,040.5 751.3 229.6 15.0 0.2 5.4 29.0 193.7 112.8 32.9 79.9 31.8 80.9 Q2 1,032.8 759.3 224.2 15.1 0.2 5.1 29.1 194.1 115.3 34.8 80.5 31.9 78.8 Q3 1,023.3 758.0 213.8 15.2 0.2 5.5 30.6 180.8 109.9 30.6 79.4 30.5 70.8
Transactions
2012 Q3 -63.7 -47.0 -12.3 -1.0 0.0 -0.8 -1.6 -14.5 -6.8 -4.3 -2.5 -0.9 -7.7 Q4 -21.2 -17.7 -2.5 0.5 0.0 -0.1 0.3 1.3 4.2 0.0 4.2 1.9 -2.92013 Q1 -28.9 -20.8 -4.2 -2.3 0.0 0.0 -0.7 0.4 -0.7 -1.1 0.5 -0.5 1.1 Q2 -7.8 7.8 -5.2 0.2 0.0 -0.3 -0.1 1.0 2.9 2.1 0.8 0.0 -1.8 Q3 -9.2 -1.5 -9.4 0.2 0.0 0.5 1.1 -13.8 -5.6 -4.4 -1.2 -1.3 -8.2
Source: ECB.1) Loans (to non-MFIs) securitised using euro area financial vehicle corporations which remain on the balance sheet of the relevant MFI, i.e. which have not been derecognised.
Whether or not loans are derecognised from the balance sheet of the MFI depends on the relevant accounting rules. For further information, see the General Notes.2) Excludes securitisations of inter-MFI loans.
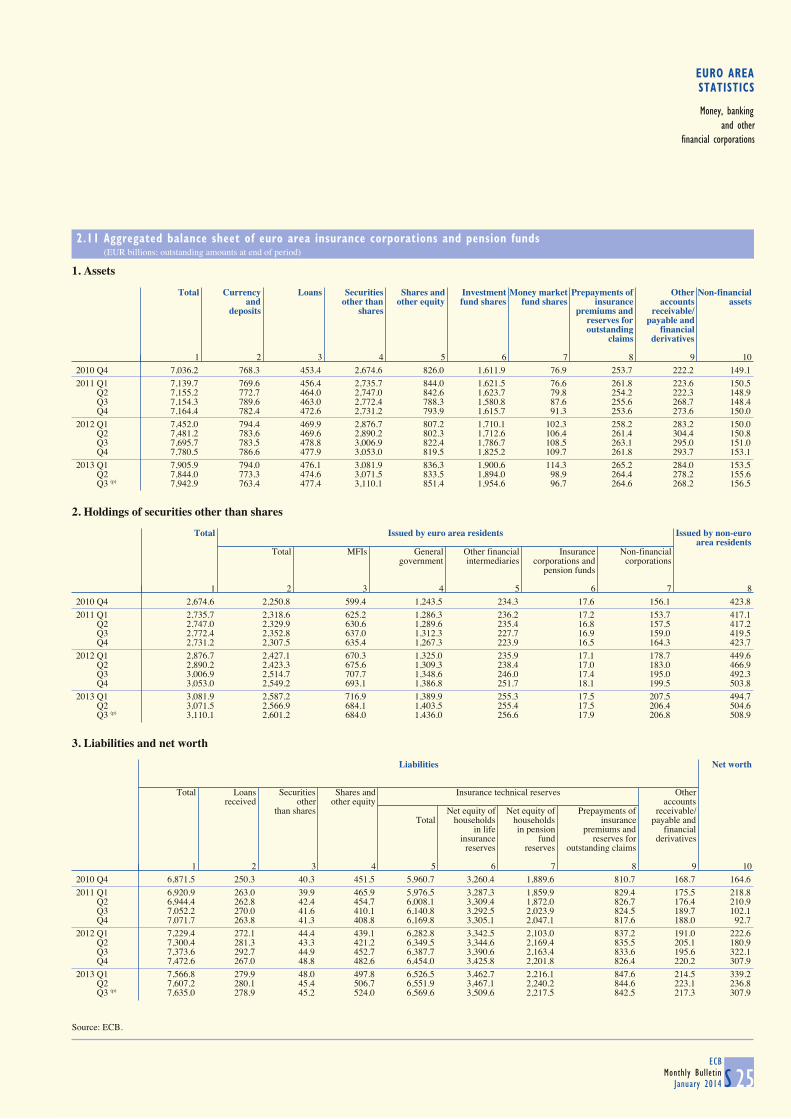
EURO AREASTATISTICS
Money, bankingand other
financial corporations
2.11 Aggregated balance sheet of euro area insurance corporations and pension funds (EUR billions; outstanding amounts at end of period)
S 25ECB
Monthly BulletinJanuary 2014
1. Assets
Total Currency Loans Securities Shares and Investment Money market Prepayments of Other Non-financialand other than other equity fund shares fund shares insurance accounts assets
deposits shares premiums and receivable/reserves for payable andoutstanding financial
claims derivatives
1 2 3 4 5 6 7 8 9 10
2010 Q4 7,036.2 768.3 453.4 2,674.6 826.0 1,611.9 76.9 253.7 222.2 149.1
2011 Q1 7,139.7 769.6 456.4 2,735.7 844.0 1,621.5 76.6 261.8 223.6 150.5 Q2 7,155.2 772.7 464.0 2,747.0 842.6 1,623.7 79.8 254.2 222.3 148.9 Q3 7,154.3 789.6 463.0 2,772.4 788.3 1,580.8 87.6 255.6 268.7 148.4 Q4 7,164.4 782.4 472.6 2,731.2 793.9 1,615.7 91.3 253.6 273.6 150.0
2012 Q1 7,452.0 794.4 469.9 2,876.7 807.2 1,710.1 102.3 258.2 283.2 150.0 Q2 7,481.2 783.6 469.6 2,890.2 802.3 1,712.6 106.4 261.4 304.4 150.8 Q3 7,695.7 783.5 478.8 3,006.9 822.4 1,786.7 108.5 263.1 295.0 151.0 Q4 7,780.5 786.6 477.9 3,053.0 819.5 1,825.2 109.7 261.8 293.7 153.1
2013 Q1 7,905.9 794.0 476.1 3,081.9 836.3 1,900.6 114.3 265.2 284.0 153.5 Q2 7,844.0 773.3 474.6 3,071.5 833.5 1,894.0 98.9 264.4 278.2 155.6 Q3 (p) 7,942.9 763.4 477.4 3,110.1 851.4 1,954.6 96.7 264.6 268.2 156.5
2. Holdings of securities other than shares
Total Issued by euro area residents Issued by non-euro
area residentsTotal MFIs General Other financial Insurance Non-financial
government intermediaries corporations and corporationspension funds
1 2 3 4 5 6 7 8
2010 Q4 2,674.6 2,250.8 599.4 1,243.5 234.3 17.6 156.1 423.8
2011 Q1 2,735.7 2,318.6 625.2 1,286.3 236.2 17.2 153.7 417.1 Q2 2,747.0 2,329.9 630.6 1,289.6 235.4 16.8 157.5 417.2 Q3 2,772.4 2,352.8 637.0 1,312.3 227.7 16.9 159.0 419.5 Q4 2,731.2 2,307.5 635.4 1,267.3 223.9 16.5 164.3 423.7
2012 Q1 2,876.7 2,427.1 670.3 1,325.0 235.9 17.1 178.7 449.6 Q2 2,890.2 2,423.3 675.6 1,309.3 238.4 17.0 183.0 466.9 Q3 3,006.9 2,514.7 707.7 1,348.6 246.0 17.4 195.0 492.3 Q4 3,053.0 2,549.2 693.1 1,386.8 251.7 18.1 199.5 503.8
2013 Q1 3,081.9 2,587.2 716.9 1,389.9 255.3 17.5 207.5 494.7 Q2 3,071.5 2,566.9 684.1 1,403.5 255.4 17.5 206.4 504.6 Q3 (p) 3,110.1 2,601.2 684.0 1,436.0 256.6 17.9 206.8 508.9
3. Liabilities and net worth
Liabilities Net worth
Total Loans Securities Shares and Insurance technical reserves Otherreceived other other equity accounts
than shares Net equity of Net equity of Prepayments of receivable/Total households households insurance payable and
in life in pension premiums and financialinsurance fund reserves for derivatives
reserves reserves outstanding claims
1 2 3 4 5 6 7 8 9 10
2010 Q4 6,871.5 250.3 40.3 451.5 5,960.7 3,260.4 1,889.6 810.7 168.7 164.6
2011 Q1 6,920.9 263.0 39.9 465.9 5,976.5 3,287.3 1,859.9 829.4 175.5 218.8 Q2 6,944.4 262.8 42.4 454.7 6,008.1 3,309.4 1,872.0 826.7 176.4 210.9 Q3 7,052.2 270.0 41.6 410.1 6,140.8 3,292.5 2,023.9 824.5 189.7 102.1 Q4 7,071.7 263.8 41.3 408.8 6,169.8 3,305.1 2,047.1 817.6 188.0 92.7
2012 Q1 7,229.4 272.1 44.4 439.1 6,282.8 3,342.5 2,103.0 837.2 191.0 222.6 Q2 7,300.4 281.3 43.3 421.2 6,349.5 3,344.6 2,169.4 835.5 205.1 180.9 Q3 7,373.6 292.7 44.9 452.7 6,387.7 3,390.6 2,163.4 833.6 195.6 322.1 Q4 7,472.6 267.0 48.8 482.6 6,454.0 3,425.8 2,201.8 826.4 220.2 307.9
2013 Q1 7,566.8 279.9 48.0 497.8 6,526.5 3,462.7 2,216.1 847.6 214.5 339.2 Q2 7,607.2 280.1 45.4 506.7 6,551.9 3,467.1 2,240.2 844.6 223.1 236.8 Q3 (p) 7,635.0 278.9 45.2 524.0 6,569.6 3,509.6 2,217.5 842.5 217.3 307.9
Source: ECB.

3 EURO AREA ACCOUNTS
3.1 Integrated economic and financial accounts by institutional sector (EUR billions)
S 26ECBMonthly BulletinJanuary 2014
Uses Euro Households Non-financial Financial General Rest ofarea corporations corporations government the world
2013 Q2
External account
Exports of goods and services 643 Trade balance 1) -73
Generation of income account
Gross value added (basic prices) Taxes less subsidies on products Gross domestic product (market prices) Compensation of employees 1,186 117 761 58 251 Other taxes less subsidies on production 40 9 24 4 4 Consumption of fixed capital 382 101 217 11 51 Net operating surplus and mixed income 1) 540 278 227 34 0
Allocation of primary income account
Net operating surplus and mixed income Compensation of employees 7 Taxes less subsidies on production Property income 892 31 462 324 76 126 Interest 328 29 53 170 76 45 Other property income 564 2 408 154 0 81 Net national income 1) 2,011 1,717 -5 60 240
Secondary distribution of income account
Net national income Current taxes on income, wealth, etc. 313 243 56 13 0 5 Social contributions 447 447 1 Social benefits other than social transfers in kind 476 1 17 36 421 1 Other current transfers 197 68 26 49 53 11 Net non-life insurance premiums 46 34 10 1 1 2 Non-life insurance claims 47 47 1 Other 103 34 16 1 52 8 Net disposable income 1) 1,987 1,519 -72 61 479
Use of income account
Net disposable income Final consumption expenditure 1,883 1,367 516 Individual consumption expenditure 1,690 1,367 322 Collective consumption expenditure 194 194 Adjustment for the change in the net equity of households in pension fund reserves 15 0 1 14 0 0 Net saving/current external account 1) 104 167 -73 47 -36 -51
Capital account
Net saving/current external account Gross capital formation 435 138 240 9 48 Gross fixed capital formation 440 139 244 8 48 Changes in inventories and acquisitions less disposals of valuables -5 -1 -4 0 0 Consumption of fixed capital Acquisitions less disposals of non-produced non-financial assets 0 -1 1 0 1 0 Capital transfers 49 9 1 5 33 5 Capital taxes 9 6 0 3 0 Other capital transfers 40 3 1 3 33 5 Net lending (+)/net borrowing (-) (from capital account) 1) 54 130 -82 60 -55 -54 Statistical discrepancy 0 -35 35 0 0 0
Sources: ECB and Eurostat.1) For details of the calculation of the balancing items, see the Technical Notes.
3

EURO AREASTATISTICS
Euro areaaccounts
3.1 Integrated economic and financial accounts by institutional sector (cont'd) (EUR billions)
S 27ECB
Monthly BulletinJanuary 2014
Resources Euro Households Non-financial Financial General Rest ofarea corporations corporations government the world
2013 Q2
External account
Imports of goods and services 570 Trade balance
Generation of income account
Gross value added (basic prices) 2,148 505 1,230 107 306 Taxes less subsidies on products 243 Gross domestic product (market prices)2) 2,391 Compensation of employees Other taxes less subsidies on production Consumption of fixed capital Net operating surplus and mixed income
Allocation of primary income account
Net operating surplus and mixed income 540 278 227 34 0 Compensation of employees 1,190 1,190 3 Taxes less subsidies on production 282 282 1 Property income 892 280 229 350 34 126 Interest 322 52 34 227 9 52 Other property income 571 228 195 123 25 74 Net national income
Secondary distribution of income account
Net national income 2,011 1,717 -5 60 240 Current taxes on income, wealth, etc. 317 317 1 Social contributions 446 1 18 50 376 2 Social benefits other than social transfers in kind 474 474 3 Other current transfers 170 87 14 48 21 37 Net non-life insurance premiums 47 47 1 Non-life insurance claims 46 36 9 1 0 2 Other 78 52 6 0 20 33 Net disposable income
Use of income account
Net disposable income 1,987 1,519 -72 61 479 Final consumption expenditure Individual consumption expenditure Collective consumption expenditure Adjustment for the change in the net equity of households in pension fund reserves 15 15 0 Net saving/current external account
Capital account
Net saving/current external account 104 167 -73 47 -36 -51 Gross capital formation Gross fixed capital formation Changes in inventories and acquisitions less disposals of valuables Consumption of fixed capital 382 101 217 11 51 Acquisitions less disposals of non-produced non-financial assets Capital transfers 51 8 16 15 12 3 Capital taxes 9 9 0 Other capital transfers 43 8 16 15 4 3 Net lending (+)/net borrowing (-) (from capital account) Statistical discrepancy
Sources: ECB and Eurostat.2) Gross domestic product is equal to the gross value added of all domestic sectors plus net taxes (i.e. taxes less subsidies) on products.

3.1 Integrated economic and financial accounts by institutional sector (cont'd) (EUR billions)
S 28ECBMonthly BulletinJanuary 2014
Assets Euro Households Non-financial MFIs Other Insurance General Rest ofarea corporations financial corporations govern- the world
inter- and pension ment2013 Q2 mediaries funds
Opening balance sheet, financial assets
Total financial assets 19,906 17,579 34,093 17,536 7,585 4,418 18,434 Monetary gold and special drawing rights (SDRs) 485 Currency and deposits 7,082 2,034 10,398 2,403 813 771 3,315 Short-term debt securities 41 67 558 416 67 37 660 Long-term debt securities 1,226 245 6,645 3,037 3,029 436 4,229 Loans 84 3,077 13,225 4,280 489 828 2,476 of which: Long-term 63 1,884 10,273 3,076 363 730 . Shares and other equity 4,615 8,326 1,885 7,001 2,786 1,543 6,897 Quoted shares 786 1,137 390 2,317 412 207 . Unquoted shares and other equity 2,411 6,812 1,199 3,522 434 1,155 . Mutual fund shares 1,418 377 295 1,162 1,940 180 . Insurance technical reserves 6,338 184 3 0 244 4 259 Other accounts receivable and financial derivatives 521 3,647 895 398 157 799 599 Net financial worth
Financial account, transactions in financial assets
Total transactions in financial assets 95 -37 -414 190 25 117 -25 Monetary gold and SDRs 0 0 Currency and deposits 60 4 -284 -1 -16 80 -92 Short-term debt securities -5 -6 -49 23 -11 -5 3 Long-term debt securities -15 -5 69 34 35 6 6 Loans 0 -10 -77 73 -2 57 43 of which: Long-term 1 -2 -47 41 1 44 . Shares and other equity 25 -19 -6 35 11 -5 44 Quoted shares 9 11 0 12 -4 15 . Unquoted shares and other equity -1 -15 14 27 3 -21 . Mutual fund shares 16 -15 -20 -5 13 1 . Insurance technical reserves 31 -1 0 0 1 0 2 Other accounts receivable and financial derivatives 0 1 -66 27 7 -17 -31 Changes in net financial worth due to transactions
Other changes account, financial assets
Total other changes in financial assets -93 -158 -293 -221 -74 -27 -159 Monetary gold and SDRs -118 Currency and deposits -2 -2 -48 19 0 0 -31 Short-term debt securities 0 0 -2 2 0 0 -9 Long-term debt securities 0 0 -84 -60 -35 -3 -41 Loans 0 -7 -31 -39 0 0 -19 of which: Long-term 0 -3 -29 -37 0 0 . Shares and other equity -58 -132 -16 -129 -37 -24 -72 Quoted shares -20 -22 -11 -77 0 6 . Unquoted shares and other equity -24 -107 -3 -45 -3 -28 . Mutual fund shares -14 -3 -2 -7 -33 -2 . Insurance technical reserves -34 -1 0 0 -2 0 0 Other accounts receivable and financial derivatives 0 -17 5 -13 0 0 12 Other changes in net financial worth
Closing balance sheet, financial assets
Total financial assets 19,908 17,385 33,387 17,505 7,536 4,508 18,250 Monetary gold and SDRs 367 Currency and deposits 7,140 2,036 10,066 2,421 797 851 3,192 Short-term debt securities 35 60 507 441 56 32 655 Long-term debt securities 1,211 240 6,630 3,011 3,029 439 4,194 Loans 84 3,060 13,117 4,315 486 886 2,500 of which: Long-term 63 1,880 10,196 3,081 364 773 . Shares and other equity 4,582 8,175 1,862 6,906 2,761 1,514 6,868 Quoted shares 776 1,126 378 2,251 408 228 . Unquoted shares and other equity 2,386 6,690 1,210 3,504 433 1,106 . Mutual fund shares 1,420 359 273 1,150 1,919 179 . Insurance technical reserves 6,336 183 3 0 243 4 261 Other accounts receivable and financial derivatives 521 3,631 834 412 164 782 580 Net financial worth
Source: ECB.

EURO AREASTATISTICS
Euro areaaccounts
3.1 Integrated economic and financial accounts by institutional sector (cont'd) (EUR billions)
S 29ECB
Monthly BulletinJanuary 2014
Liabilities Euro Households Non-financial MFIs Other Insurance General Rest ofarea corporations financial corporations govern- the world
inter- and pension ment2013 Q2 mediaries funds
Opening balance sheet, liabilities
Total liabilities 6,854 27,169 32,916 17,117 7,574 10,722 16,716 Monetary gold and special drawing rights (SDRs) Currency and deposits 33 23,837 33 0 271 2,643 Short-term debt securities 92 632 147 3 691 281 Long-term debt securities 979 4,591 3,088 53 6,863 3,273 Loans 6,160 8,388 4,000 303 2,247 3,361 of which: Long-term 5,816 6,122 2,275 110 1,959 . Shares and other equity 8 13,785 2,621 9,661 489 4 6,484 Quoted shares 3,891 379 247 136 0 . Unquoted shares and other equity 8 9,894 1,330 2,673 352 4 . Mutual fund shares 912 6,741 . Insurance technical reserves 36 350 64 1 6,580 1 Other accounts payable and financial derivatives 650 3,542 1,171 187 146 646 674 Net financial worth 1) -1,233 13,053 -9,589 1,177 419 11 -6,304
Financial account, transactions in liabilities
Total transactions in liabilities 0 10 -459 178 24 172 29 Monetary gold and SDRs Currency and deposits 0 -246 0 0 6 -11 Short-term debt securities -1 -26 -3 0 -15 -7 Long-term debt securities 14 -98 47 -2 151 16 Loans 3 -18 54 -1 33 15 of which: Long-term -2 1 35 -1 41 . Shares and other equity 0 34 -37 67 0 0 20 Quoted shares 15 38 0 0 0 . Unquoted shares and other equity 0 19 -31 -20 0 0 . Mutual fund shares -44 87 . Insurance technical reserves 0 1 2 0 32 0 Other accounts payable and financial derivatives -3 -20 -55 13 -4 -4 -5 Changes in net financial worth due to transactions 1) 54 96 -47 46 12 1 -55 -54
Other changes account, liabilities
Total other changes in liabilities -9 -224 -186 -172 -10 -36 -270 Monetary gold and SDRs Currency and deposits 0 -62 2 0 0 -3 Short-term debt securities 0 -4 -2 0 0 -3 Long-term debt securities -17 -50 -8 -1 -43 -103 Loans -6 -23 -17 0 -1 -48 of which: Long-term -7 -17 -16 0 -1 . Shares and other equity 0 -159 -74 -128 7 0 -115 Quoted shares -52 -9 13 4 0 . Unquoted shares and other equity 0 -107 -52 22 3 0 . Mutual fund shares -12 -164 . Insurance technical reserves 0 0 0 0 -37 0 Other accounts payable and financial derivatives -4 -24 4 -19 20 8 2 Other changes in net financial worth 1) -229 -84 66 -107 -49 -64 9 111
Closing balance sheet, liabilities
Total liabilities 6,844 26,955 32,270 17,122 7,587 10,858 16,474 Monetary gold and SDRs Currency and deposits 33 23,529 35 0 276 2,629 Short-term debt securities 92 602 142 2 676 272 Long-term debt securities 976 4,443 3,127 50 6,971 3,187 Loans 6,157 8,347 4,036 302 2,280 3,327 of which: Long-term 5,807 6,105 2,294 109 1,999 . Shares and other equity 8 13,659 2,510 9,600 497 4 6,389 Quoted shares 3,854 408 261 140 0 . Unquoted shares and other equity 8 9,806 1,247 2,675 355 4 . Mutual fund shares 856 6,665 . Insurance technical reserves 36 351 66 1 6,575 1 Other accounts payable and financial derivatives 643 3,497 1,120 182 162 649 671 Net financial worth 1) -1,408 13,064 -9,570 1,116 383 -51 -6,350
Source: ECB.
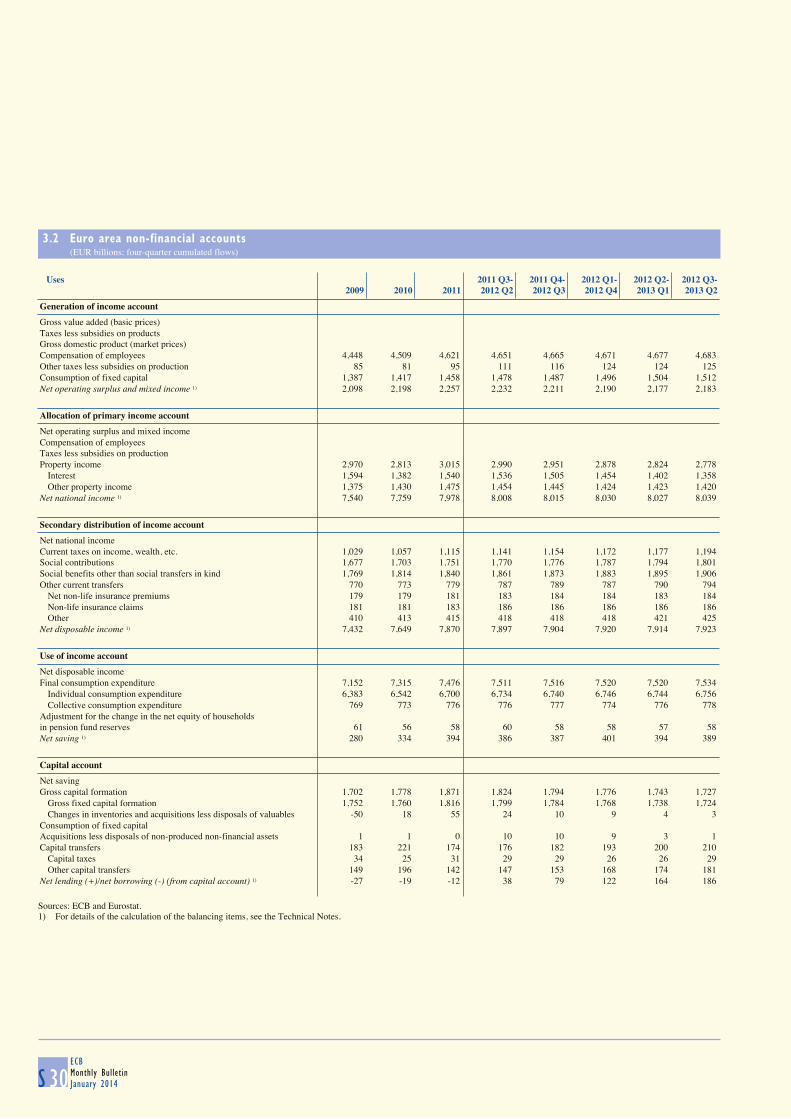
3.2 Euro area non-financial accounts (EUR billions; four-quarter cumulated flows)
S 30ECBMonthly BulletinJanuary 2014
Uses 2011 Q3- 2011 Q4- 2012 Q1- 2012 Q2- 2012 Q3-2009 2010 2011 2012 Q2 2012 Q3 2012 Q4 2013 Q1 2013 Q2
Generation of income account
Gross value added (basic prices) Taxes less subsidies on products Gross domestic product (market prices) Compensation of employees 4,448 4,509 4,621 4,651 4,665 4,671 4,677 4,683 Other taxes less subsidies on production 85 81 95 111 116 124 124 125 Consumption of fixed capital 1,387 1,417 1,458 1,478 1,487 1,496 1,504 1,512 Net operating surplus and mixed income 1) 2,098 2,198 2,257 2,232 2,211 2,190 2,177 2,183
Allocation of primary income account
Net operating surplus and mixed income Compensation of employees Taxes less subsidies on production Property income 2,970 2,813 3,015 2,990 2,951 2,878 2,824 2,778 Interest 1,594 1,382 1,540 1,536 1,505 1,454 1,402 1,358 Other property income 1,375 1,430 1,475 1,454 1,445 1,424 1,423 1,420 Net national income 1) 7,540 7,759 7,978 8,008 8,015 8,030 8,027 8,039
Secondary distribution of income account
Net national income Current taxes on income, wealth, etc. 1,029 1,057 1,115 1,141 1,154 1,172 1,177 1,194 Social contributions 1,677 1,703 1,751 1,770 1,776 1,787 1,794 1,801 Social benefits other than social transfers in kind 1,769 1,814 1,840 1,861 1,873 1,883 1,895 1,906 Other current transfers 770 773 779 787 789 787 790 794 Net non-life insurance premiums 179 179 181 183 184 184 183 184 Non-life insurance claims 181 181 183 186 186 186 186 186 Other 410 413 415 418 418 418 421 425 Net disposable income 1) 7,432 7,649 7,870 7,897 7,904 7,920 7,914 7,923
Use of income account
Net disposable income Final consumption expenditure 7,152 7,315 7,476 7,511 7,516 7,520 7,520 7,534 Individual consumption expenditure 6,383 6,542 6,700 6,734 6,740 6,746 6,744 6,756 Collective consumption expenditure 769 773 776 776 777 774 776 778 Adjustment for the change in the net equity of households in pension fund reserves 61 56 58 60 58 58 57 58 Net saving 1) 280 334 394 386 387 401 394 389
Capital account
Net saving Gross capital formation 1,702 1,778 1,871 1,824 1,794 1,776 1,743 1,727 Gross fixed capital formation 1,752 1,760 1,816 1,799 1,784 1,768 1,738 1,724 Changes in inventories and acquisitions less disposals of valuables -50 18 55 24 10 9 4 3 Consumption of fixed capital Acquisitions less disposals of non-produced non-financial assets 1 1 0 10 10 9 3 1 Capital transfers 183 221 174 176 182 193 200 210 Capital taxes 34 25 31 29 29 26 26 29 Other capital transfers 149 196 142 147 153 168 174 181 Net lending (+)/net borrowing (-) (from capital account) 1) -27 -19 -12 38 79 122 164 186
Sources: ECB and Eurostat.1) For details of the calculation of the balancing items, see the Technical Notes.

EURO AREASTATISTICS
Euro areaaccounts
3.2 Euro area non-financial accounts (cont'd) (EUR billions; four-quarter cumulated flows)
S 31ECB
Monthly BulletinJanuary 2014
Resources 2011 Q3- 2011 Q4- 2012 Q1- 2012 Q2- 2012 Q3-2009 2010 2011 2012 Q2 2012 Q3 2012 Q4 2013 Q1 2013 Q2
Generation of income account
Gross value added (basic prices) 8,018 8,206 8,431 8,471 8,478 8,481 8,482 8,503 Taxes less subsidies on products 894 942 973 974 974 977 972 977 Gross domestic product (market prices)2) 8,913 9,148 9,405 9,445 9,452 9,458 9,454 9,480 Compensation of employees Other taxes less subsidies on production Consumption of fixed capital Net operating surplus and mixed income
Allocation of primary income account
Net operating surplus and mixed income 2,098 2,198 2,257 2,232 2,211 2,190 2,177 2,183 Compensation of employees 4,458 4,520 4,633 4,664 4,678 4,684 4,691 4,697 Taxes less subsidies on production 996 1,037 1,079 1,094 1,100 1,112 1,108 1,113 Property income 2,957 2,816 3,024 3,009 2,977 2,921 2,875 2,823 Interest 1,554 1,333 1,486 1,489 1,465 1,422 1,373 1,329 Other property income 1,403 1,483 1,538 1,520 1,512 1,499 1,502 1,494 Net national income
Secondary distribution of income account
Net national income 7,540 7,759 7,978 8,008 8,015 8,030 8,027 8,039 Current taxes on income, wealth, etc. 1,034 1,060 1,121 1,146 1,160 1,178 1,182 1,200 Social contributions 1,675 1,703 1,752 1,769 1,775 1,784 1,792 1,798 Social benefits other than social transfers in kind 1,762 1,807 1,834 1,855 1,867 1,877 1,889 1,900 Other current transfers 665 665 672 677 680 681 681 681 Net non-life insurance premiums 181 181 183 186 186 186 186 186 Non-life insurance claims 177 175 176 178 179 178 178 179 Other 308 309 313 313 315 316 317 317 Net disposable income
Use of income account
Net disposable income 7,432 7,649 7,870 7,897 7,904 7,920 7,914 7,923 Final consumption expenditure Individual consumption expenditure Collective consumption expenditure Adjustment for the change in the net equity of households in pension fund reserves 61 56 58 60 58 58 57 58 Net saving
Capital account
Net saving 280 334 394 386 387 401 394 389 Gross capital formation Gross fixed capital formation Changes in inventories and acquisitions less disposals of valuables Consumption of fixed capital 1,387 1,417 1,458 1,478 1,487 1,496 1,504 1,512 Acquisitions less disposals of non-produced non-financial assets Capital transfers 192 230 180 184 191 205 212 222 Capital taxes 34 25 31 29 29 26 26 29 Other capital transfers 158 205 149 155 162 179 185 193 Net lending (+)/net borrowing (-) (from capital account)
Sources: ECB and Eurostat.2) Gross domestic product is equal to the gross value added of all domestic sectors plus net taxes (i.e. taxes less subsidies) on products.

3.3 Households (EUR billions; four-quarter cumulated flows; outstanding amounts at end of period)
S 32ECBMonthly BulletinJanuary 2014
2011 Q3- 2011 Q4- 2012 Q1- 2012 Q2- 2012 Q3-2009 2010 2011 2012 Q2 2012 Q3 2012 Q4 2013 Q1 2013 Q2
Income, saving and changes in net worth
Compensation of employees (+) 4,458 4,520 4,633 4,664 4,678 4,684 4,691 4,697 Gross operating surplus and mixed income (+) 1,439 1,448 1,490 1,494 1,495 1,496 1,499 1,504 Interest receivable (+) 233 201 227 230 228 222 216 212 Interest payable (-) 148 124 146 143 138 131 125 120 Other property income receivable (+) 729 721 749 754 748 744 737 732 Other property income payable (-) 10 10 10 10 10 10 10 10 Current taxes on income and wealth (-) 843 850 884 907 920 934 941 951 Net social contributions (-) 1,672 1,698 1,746 1,765 1,772 1,782 1,789 1,796 Net social benefits (+) 1,757 1,802 1,829 1,850 1,862 1,872 1,883 1,895 Net current transfers receivable (+) 72 71 71 70 69 71 73 74 = Gross disposable income 6,016 6,081 6,212 6,235 6,239 6,232 6,234 6,237 Final consumption expenditure (-) 5,157 5,291 5,440 5,467 5,469 5,474 5,469 5,476 Changes in net worth in pension funds (+) 60 56 58 59 57 57 57 57 = Gross saving 920 845 830 827 828 815 822 818 Consumption of fixed capital (-) 379 386 393 397 399 401 402 403 Net capital transfers receivable (+) 9 13 2 2 0 1 0 0 Other changes in net worth (+) -364 536 -235 -576 -469 -147 -603 -446 = Changes in net worth 185 1,008 204 -144 -40 269 -184 -32
Investment, financing and changes in net worth
Net acquisition of non-financial assets (+) 555 558 572 566 561 555 548 543 Consumption of fixed capital (-) 379 386 393 397 399 401 402 403 Main items of financial investment (+) Short-term assets 2 40 124 161 172 191 172 166 Currency and deposits 121 118 117 164 175 224 225 215 Money market fund shares -45 -59 -23 -19 -28 -31 -39 -30 Debt securities 1) -75 -19 29 17 25 -2 -15 -18 Long-term assets 478 420 236 225 189 142 143 133 Deposits 82 59 55 45 30 13 7 4 Debt securities -1 2 71 12 -2 -91 -125 -119 Shares and other equity 167 112 -5 65 54 92 114 96 Quoted and unquoted shares and other equity 119 104 44 95 62 55 42 18 Mutual fund shares 48 8 -50 -30 -8 37 72 78 Life insurance and pension fund reserves 230 248 115 103 107 129 147 152 Main items of financing (-) Loans 106 114 88 40 19 14 1 -12 of which: From euro area MFIs 64 146 81 13 1 25 21 0 Other changes in assets (+) Non-financial assets -628 442 134 -389 -1,024 -791 -1,089 -984 Financial assets 197 140 -410 -235 504 592 420 481 Shares and other equity 83 49 -323 -281 315 353 295 349 Life insurance and pension fund reserves 191 120 15 91 181 179 159 120 Remaining net flows (+) 67 -93 29 -34 -22 -6 26 21 = Changes in net worth 185 1,008 204 -144 -40 269 -184 -32
Balance sheet
Non-financial assets (+) 29,686 30,300 30,612 30,436 30,153 29,975 29,514 29,591 Financial assets (+) Short-term assets 5,766 5,808 5,946 6,023 6,032 6,117 6,132 6,173 Currency and deposits 5,474 5,596 5,727 5,821 5,837 5,948 5,979 6,029 Money market fund shares 242 184 166 148 136 121 112 109 Debt securities 1) 50 28 53 54 58 49 41 35 Long-term assets 11,576 12,114 11,937 12,189 12,437 12,690 12,852 12,811 Deposits 985 1,043 1,082 1,104 1,100 1,097 1,102 1,111 Debt securities 1,390 1,342 1,329 1,323 1,318 1,300 1,226 1,211 Shares and other equity 4,080 4,240 3,906 4,018 4,180 4,365 4,503 4,473 Quoted and unquoted shares and other equity 2,954 3,036 2,813 2,868 2,979 3,118 3,197 3,162 Mutual fund shares 1,126 1,204 1,093 1,150 1,200 1,247 1,306 1,311 Life insurance and pension fund reserves 5,121 5,489 5,619 5,745 5,840 5,927 6,021 6,017 Remaining net assets (+) 277 264 254 232 257 225 228 237 Liabilities (-) Loans 5,961 6,136 6,195 6,193 6,183 6,185 6,160 6,157 of which: From euro area MFIs 4,998 5,242 5,281 5,294 5,283 5,290 5,279 5,280 = Net worth 41,343 42,350 42,554 42,686 42,696 42,823 42,567 42,655Sources: ECB and Eurostat.1) Securities issued by MFIs with a maturity of less than two years and securities issued by other sectors with a maturity of less than one year.

EURO AREASTATISTICS
Euro areaaccounts
3.4 Non-financial corporations (EUR billions; four-quarter cumulated flows; outstanding amounts at end of period)
S 33ECB
Monthly BulletinJanuary 2014
2011 Q3- 2011 Q4- 2012 Q1- 2012 Q2- 2012 Q3-2009 2010 2011 2012 Q2 2012 Q3 2012 Q4 2013 Q1 2013 Q2
Income and saving
Gross value added (basic prices) (+) 4,518 4,657 4,820 4,845 4,848 4,848 4,843 4,856 Compensation of employees (-) 2,787 2,831 2,929 2,957 2,968 2,976 2,979 2,983 Other taxes less subsidies on production (-) 40 32 41 46 48 50 50 52 = Gross operating surplus (+) 1,690 1,794 1,850 1,842 1,832 1,821 1,814 1,821 Consumption of fixed capital (-) 782 798 825 838 844 849 855 860 = Net operating surplus (+) 909 996 1,025 1,004 988 972 960 961 Property income receivable (+) 534 559 569 568 572 562 560 548 Interest receivable 171 158 165 161 157 150 144 138 Other property income receivable 362 400 404 407 416 412 417 410 Interest and rents payable (-) 297 258 287 286 280 270 259 250 = Net entrepreneurial income (+) 1,146 1,296 1,307 1,286 1,281 1,264 1,261 1,260 Distributed income (-) 932 930 981 979 973 956 948 944 Taxes on income and wealth payable (-) 151 169 192 196 196 201 198 203 Social contributions receivable (+) 71 69 73 74 74 74 74 74 Social benefits payable (-) 68 69 70 70 70 70 70 70 Other net transfers (-) 48 45 48 48 49 49 48 49 = Net saving 17 152 90 67 67 62 71 68
Investment, financing and saving
Net acquisition of non-financial assets (+) 65 147 209 179 152 132 99 85 Gross fixed capital formation (+) 898 927 981 980 973 966 946 939 Consumption of fixed capital (-) 782 798 825 838 844 849 855 860 Net acquisition of other non-financial assets (+) -52 19 53 36 23 16 7 6 Main items of financial investment (+) Short-term assets 95 35 -27 2 27 61 48 44 Currency and deposits 88 67 7 16 39 77 85 89 Money market fund shares 39 -32 -46 -29 -17 -9 -8 -17 Debt securities 1) -31 0 12 15 6 -6 -29 -28 Long-term assets 146 422 481 363 297 183 168 69 Deposits 0 20 69 55 13 9 -20 -15 Debt securities 22 8 -23 -14 -11 -4 -2 -7 Shares and other equity 100 247 287 198 179 112 155 106 Other (mainly intercompany loans) 24 147 148 124 117 66 34 -16 Remaining net assets (+) 64 16 -22 -32 6 42 65 111 Main items of financing (-) Debt 25 172 261 169 178 117 90 34 of which: Loans from euro area MFIs -109 -18 85 -41 -87 -134 -122 -150 of which: Debt securities 90 66 49 93 109 119 105 92 Shares and other equity 243 230 224 211 170 170 143 133 Quoted shares 59 31 27 15 16 26 11 21 Unquoted shares and other equity 184 199 197 196 154 143 132 112 Net capital transfers receivable (-) 82 64 67 64 65 65 70 69 = Net saving 17 152 90 67 67 62 71 68
Financial balance sheet
Financial assets Short-term assets 1,932 1,957 1,932 1,919 1,931 1,989 1,955 1,946 Currency and deposits 1,632 1,695 1,706 1,697 1,717 1,780 1,764 1,774 Money market fund shares 213 182 134 131 128 128 125 111 Debt securities 1) 86 81 92 90 86 81 67 60 Long-term assets 10,274 10,759 10,763 11,069 11,385 11,523 11,793 11,626 Deposits 185 196 235 282 278 284 270 261 Debt securities 226 242 229 233 248 244 245 240 Shares and other equity 7,140 7,451 7,253 7,451 7,732 7,905 8,201 8,064 Other (mainly intercompany loans) 2,723 2,869 3,046 3,103 3,126 3,090 3,077 3,060 Remaining net assets 371 242 301 238 262 258 322 349 Liabilities Debt 9,291 9,592 9,744 9,862 9,908 9,843 9,809 9,766 of which: Loans from euro area MFIs 4,729 4,702 4,717 4,689 4,631 4,503 4,477 4,439 of which: Debt securities 814 882 886 971 1,028 1,051 1,071 1,068 Shares and other equity 12,460 13,007 12,313 12,482 12,951 13,372 13,785 13,659 Quoted shares 3,503 3,799 3,281 3,331 3,550 3,747 3,891 3,854 Unquoted shares and other equity 8,957 9,208 9,032 9,151 9,401 9,625 9,894 9,806
Sources: ECB and Eurostat.1) Securities issued by MFIs with a maturity of less than two years and securities issued by other sectors with a maturity of less than one year.

3.5 Insurance corporations and pension funds (EUR billions; four-quarter cumulated flows; outstanding amounts at end of period)
S 34ECBMonthly BulletinJanuary 2014
2011 Q3- 2011 Q4- 2012 Q1- 2012 Q2- 2012 Q3-2009 2010 2011 2012 Q2 2012 Q3 2012 Q4 2013 Q1 2013 Q2
Financial account, financial transactions
Main items of financial investment (+) Short-term assets -42 -6 54 72 51 43 19 -19 Currency and deposits -33 -9 14 15 3 16 12 8 Money market fund shares 5 -8 16 44 36 32 10 -12 Debt securities 1) -14 11 24 13 12 -5 -2 -14 Long-term assets 293 287 134 93 111 184 176 212 Deposits 15 -4 9 -6 -16 -17 -19 -16 Debt securities 104 183 44 42 79 137 95 113 Loans 8 32 12 3 15 8 13 12 Quoted shares -50 -1 -12 -14 -17 -5 2 -2 Unquoted shares and other equity -15 11 13 11 1 -1 -1 -1 Mutual fund shares 230 68 67 57 49 63 86 106 Remaining net assets (+) 18 8 -36 -7 -5 -41 -22 -24 Main items of financing (-) Debt securities 5 1 3 1 3 7 6 4 Loans -4 7 11 7 9 -15 0 -7 Shares and other equity 5 7 4 4 3 1 2 2 Insurance technical reserves 246 280 115 112 125 149 167 171 Net equity of households in life insurance and pension fund reserves 240 261 110 104 116 136 155 160 Prepayments of insurance premiums and reserves for outstanding claims 6 19 5 9 8 13 12 11 = Changes in net financial worth due to transactions 16 -4 18 34 17 45 -2 0
Other changes account
Other changes in financial assets (+) Shares and other equity 200 117 -105 -10 218 197 148 134 Other net assets 34 0 22 117 160 231 128 81 Other changes in liabilities (-) Shares and other equity 13 -1 -47 -38 39 70 52 79 Insurance technical reserves 169 136 16 99 190 188 163 122 Net equity of households in life insurance and pension fund reserves 197 125 19 94 187 186 161 120 Prepayments of insurance premiums and reserves for outstanding claims -28 11 -3 5 2 2 2 1 = Other changes in net financial worth 52 -19 -52 45 149 170 61 14
Financial balance sheet
Financial assets (+) Short-term assets 331 329 371 388 400 406 411 364 Currency and deposits 195 190 193 195 200 209 219 201 Money market fund shares 95 88 102 124 123 125 126 107 Debt securities 1) 41 51 76 70 77 72 67 56 Long-term assets 5,651 6,041 6,045 6,324 6,543 6,637 6,772 6,765 Deposits 613 607 611 608 604 594 594 596 Debt securities 2,467 2,638 2,660 2,827 2,939 2,998 3,029 3,029 Loans 434 467 479 477 487 488 489 486 Quoted shares 397 421 375 373 388 403 412 408 Unquoted shares and other equity 414 417 422 439 440 432 434 433 Mutual fund shares 1,327 1,492 1,498 1,601 1,684 1,723 1,815 1,813 Remaining net assets (+) 227 250 271 277 273 260 255 245 Liabilities (-) Debt securities 42 43 46 48 50 55 56 52 Loans 284 296 304 309 319 288 303 302 Shares and other equity 441 447 404 416 446 475 489 497 Insurance technical reserves 5,582 5,998 6,130 6,282 6,380 6,466 6,580 6,575 Net equity of households in life insurance and pension fund reserves 4,798 5,184 5,314 5,446 5,546 5,636 5,732 5,726 Prepayments of insurance premiums and reserves for outstanding claims 784 814 816 836 834 830 847 848 = Net financial wealth -140 -164 -197 -66 21 19 11 -51
Source: ECB.1) Securities issued by MFIs with a maturity of less than two years and securities issued by other sectors with a maturity of less than one year.
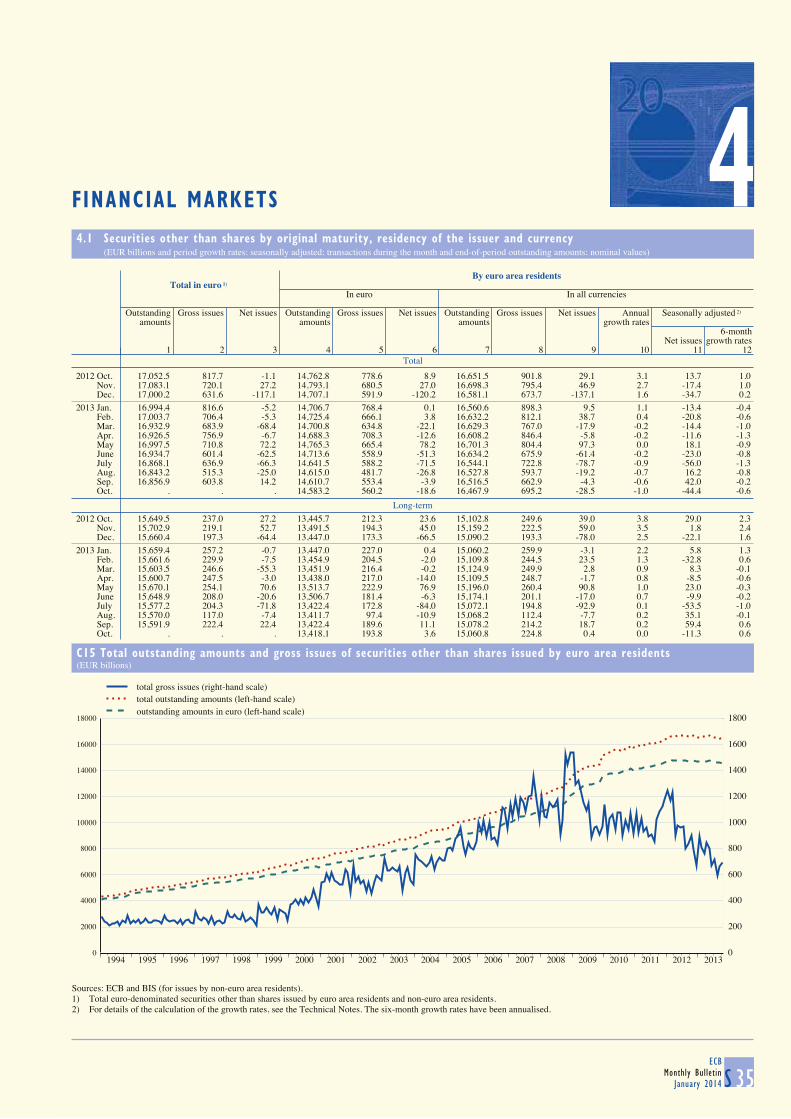
4FINANCIAL MARKETS
4.1 Securities other than shares by original maturity, residency of the issuer and currency (EUR billions and period growth rates; seasonally adjusted; transactions during the month and end-of-period outstanding amounts; nominal values)
S 35ECB
Monthly BulletinJanuary 2014
Total
By euro area residents
Total in euro 1) In euro In all currencies
Outstanding Gross issues Net issues Outstanding Gross issues Net issues Outstanding Gross issues Net issues Annual Seasonally adjusted 2)
amounts amounts amounts growth rates6-month
Net issues growth rates1 2 3 4 5 6 7 8 9 10 11 12
2012 Oct. 17,052.5 817.7 -1.1 14,762.8 778.6 8.9 16,651.5 901.8 29.1 3.1 13.7 1.0 Nov. 17,083.1 720.1 27.2 14,793.1 680.5 27.0 16,698.3 795.4 46.9 2.7 -17.4 1.0 Dec. 17,000.2 631.6 -117.1 14,707.1 591.9 -120.2 16,581.1 673.7 -137.1 1.6 -34.7 0.2
2013 Jan. 16,994.4 816.6 -5.2 14,706.7 768.4 0.1 16,560.6 898.3 9.5 1.1 -13.4 -0.4 Feb. 17,003.7 706.4 -5.3 14,725.4 666.1 3.8 16,632.2 812.1 38.7 0.4 -20.8 -0.6 Mar. 16,932.9 683.9 -68.4 14,700.8 634.8 -22.1 16,629.3 767.0 -17.9 -0.2 -14.4 -1.0 Apr. 16,926.5 756.9 -6.7 14,688.3 708.3 -12.6 16,608.2 846.4 -5.8 -0.2 -11.6 -1.3 May 16,997.5 710.8 72.2 14,765.3 665.4 78.2 16,701.3 804.4 97.3 0.0 18.1 -0.9 June 16,934.7 601.4 -62.5 14,713.6 558.9 -51.3 16,634.2 675.9 -61.4 -0.2 -23.0 -0.8 July 16,868.1 636.9 -66.3 14,641.5 588.2 -71.5 16,544.1 722.8 -78.7 -0.9 -56.0 -1.3 Aug. 16,843.2 515.3 -25.0 14,615.0 481.7 -26.8 16,527.8 593.7 -19.2 -0.7 16.2 -0.8 Sep. 16,856.9 603.8 14.2 14,610.7 553.4 -3.9 16,516.5 662.9 -4.3 -0.6 42.0 -0.2 Oct. . . . 14,583.2 560.2 -18.6 16,467.9 695.2 -28.5 -1.0 -44.4 -0.6
Long-term
2012 Oct. 15,649.5 237.0 27.2 13,445.7 212.3 23.6 15,102.8 249.6 39.0 3.8 29.0 2.3 Nov. 15,702.9 219.1 52.7 13,491.5 194.3 45.0 15,159.2 222.5 59.0 3.5 1.8 2.4 Dec. 15,660.4 197.3 -64.4 13,447.0 173.3 -66.5 15,090.2 193.3 -78.0 2.5 -22.1 1.6
2013 Jan. 15,659.4 257.2 -0.7 13,447.0 227.0 0.4 15,060.2 259.9 -3.1 2.2 5.8 1.3 Feb. 15,661.6 229.9 -7.5 13,454.9 204.5 -2.0 15,109.8 244.5 23.5 1.3 -32.8 0.6 Mar. 15,603.5 246.6 -55.3 13,451.9 216.4 -0.2 15,124.9 249.9 2.8 0.9 8.3 -0.1 Apr. 15,600.7 247.5 -3.0 13,438.0 217.0 -14.0 15,109.5 248.7 -1.7 0.8 -8.5 -0.6 May 15,670.1 254.1 70.6 13,513.7 222.9 76.9 15,196.0 260.4 90.8 1.0 23.0 -0.3 June 15,648.9 208.0 -20.6 13,506.7 181.4 -6.3 15,174.1 201.1 -17.0 0.7 -9.9 -0.2 July 15,577.2 204.3 -71.8 13,422.4 172.8 -84.0 15,072.1 194.8 -92.9 0.1 -53.5 -1.0 Aug. 15,570.0 117.0 -7.4 13,411.7 97.4 -10.9 15,068.2 112.4 -7.7 0.2 35.1 -0.1 Sep. 15,591.9 222.4 22.4 13,422.4 189.6 11.1 15,078.2 214.2 18.7 0.2 59.4 0.6 Oct. . . . 13,418.1 193.8 3.6 15,060.8 224.8 0.4 0.0 -11.3 0.6
C15 Total outstanding amounts and gross issues of securities other than shares issued by euro area residents
(EUR billions)
0
2000
4000
6000
8000
10000
12000
14000
16000
18000
1994 1995 1996 1997 1998 1999 2000 2001 2002 2003 2004 2005 2006 2007 2008 2009 2010 2011 2012 20130
200
400
600
800
1000
1200
1400
1600
1800
total gross issues (right-hand scale)total outstanding amounts (left-hand scale)outstanding amounts in euro (left-hand scale)
Sources: ECB and BIS (for issues by non-euro area residents).1) Total euro-denominated securities other than shares issued by euro area residents and non-euro area residents.2) For details of the calculation of the growth rates, see the Technical Notes. The six-month growth rates have been annualised.
4
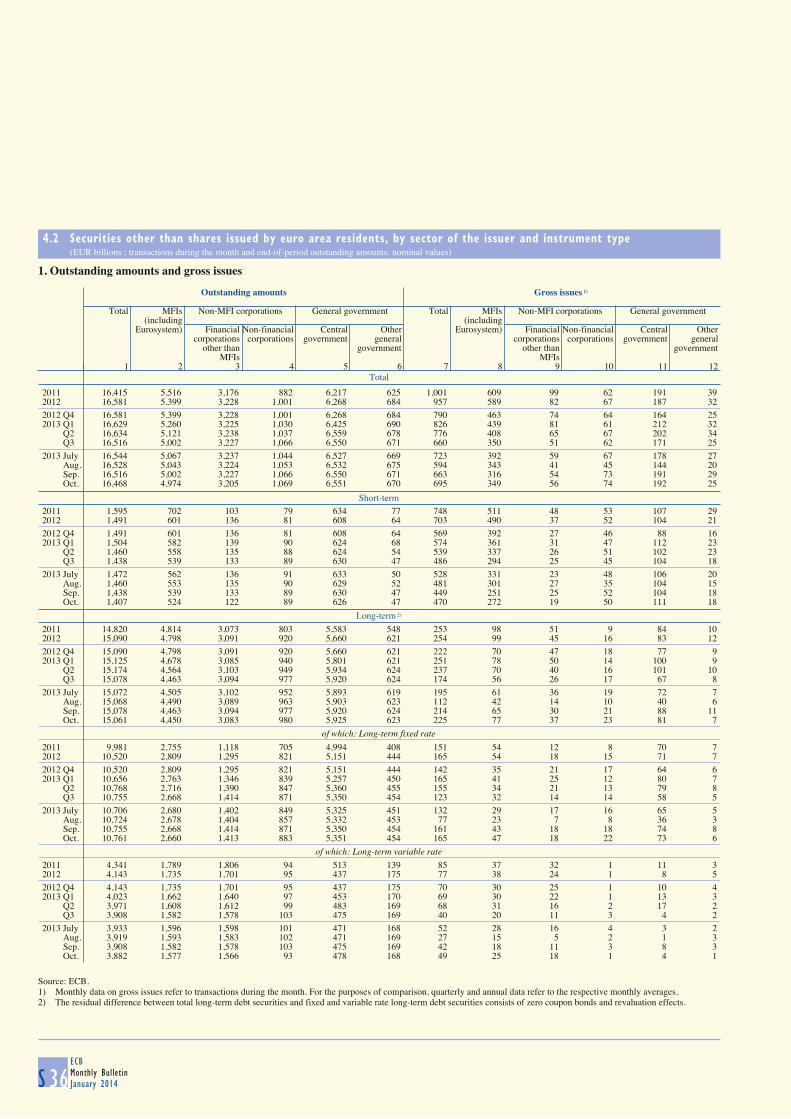
4.2 Securities other than shares issued by euro area residents, by sector of the issuer and instrument type (EUR billions ; transactions during the month and end-of-period outstanding amounts; nominal values)
S 36ECBMonthly BulletinJanuary 2014
1. Outstanding amounts and gross issues
Total
Outstanding amounts Gross issues 1)
Total MFIs Non-MFI corporations General government Total MFIs Non-MFI corporations General government
(including (includingEurosystem) Financial Non-financial Central Other Eurosystem) Financial Non-financial Central Other
corporations corporations government general corporations corporations government generalother than government other than government
MFIs MFIs1 2 3 4 5 6 7 8 9 10 11 12
2011 16,415 5,516 3,176 882 6,217 625 1,001 609 99 62 191 392012 16,581 5,399 3,228 1,001 6,268 684 957 589 82 67 187 32
2012 Q4 16,581 5,399 3,228 1,001 6,268 684 790 463 74 64 164 252013 Q1 16,629 5,260 3,225 1,030 6,425 690 826 439 81 61 212 32 Q2 16,634 5,121 3,238 1,037 6,559 678 776 408 65 67 202 34 Q3 16,516 5,002 3,227 1,066 6,550 671 660 350 51 62 171 25
2013 July 16,544 5,067 3,237 1,044 6,527 669 723 392 59 67 178 27 Aug. 16,528 5,043 3,224 1,053 6,532 675 594 343 41 45 144 20 Sep. 16,516 5,002 3,227 1,066 6,550 671 663 316 54 73 191 29 Oct. 16,468 4,974 3,205 1,069 6,551 670 695 349 56 74 192 25
Short-term
2011 1,595 702 103 79 634 77 748 511 48 53 107 292012 1,491 601 136 81 608 64 703 490 37 52 104 21
2012 Q4 1,491 601 136 81 608 64 569 392 27 46 88 162013 Q1 1,504 582 139 90 624 68 574 361 31 47 112 23 Q2 1,460 558 135 88 624 54 539 337 26 51 102 23 Q3 1,438 539 133 89 630 47 486 294 25 45 104 18
2013 July 1,472 562 136 91 633 50 528 331 23 48 106 20 Aug. 1,460 553 135 90 629 52 481 301 27 35 104 15 Sep. 1,438 539 133 89 630 47 449 251 25 52 104 18 Oct. 1,407 524 122 89 626 47 470 272 19 50 111 18
Long-term 2)
2011 14,820 4,814 3,073 803 5,583 548 253 98 51 9 84 102012 15,090 4,798 3,091 920 5,660 621 254 99 45 16 83 12
2012 Q4 15,090 4,798 3,091 920 5,660 621 222 70 47 18 77 92013 Q1 15,125 4,678 3,085 940 5,801 621 251 78 50 14 100 9 Q2 15,174 4,564 3,103 949 5,934 624 237 70 40 16 101 10 Q3 15,078 4,463 3,094 977 5,920 624 174 56 26 17 67 8
2013 July 15,072 4,505 3,102 952 5,893 619 195 61 36 19 72 7 Aug. 15,068 4,490 3,089 963 5,903 623 112 42 14 10 40 6 Sep. 15,078 4,463 3,094 977 5,920 624 214 65 30 21 88 11 Oct. 15,061 4,450 3,083 980 5,925 623 225 77 37 23 81 7
of which: Long-term fixed rate
2011 9,981 2,755 1,118 705 4,994 408 151 54 12 8 70 72012 10,520 2,809 1,295 821 5,151 444 165 54 18 15 71 7
2012 Q4 10,520 2,809 1,295 821 5,151 444 142 35 21 17 64 62013 Q1 10,656 2,763 1,346 839 5,257 450 165 41 25 12 80 7 Q2 10,768 2,716 1,390 847 5,360 455 155 34 21 13 79 8 Q3 10,755 2,668 1,414 871 5,350 454 123 32 14 14 58 5
2013 July 10,706 2,680 1,402 849 5,325 451 132 29 17 16 65 5 Aug. 10,724 2,678 1,404 857 5,332 453 77 23 7 8 36 3 Sep. 10,755 2,668 1,414 871 5,350 454 161 43 18 18 74 8 Oct. 10,761 2,660 1,413 883 5,351 454 165 47 18 22 73 6
of which: Long-term variable rate
2011 4,341 1,789 1,806 94 513 139 85 37 32 1 11 32012 4,143 1,735 1,701 95 437 175 77 38 24 1 8 5
2012 Q4 4,143 1,735 1,701 95 437 175 70 30 25 1 10 42013 Q1 4,023 1,662 1,640 97 453 170 69 30 22 1 13 3 Q2 3,971 1,608 1,612 99 483 169 68 31 16 2 17 2 Q3 3,908 1,582 1,578 103 475 169 40 20 11 3 4 2
2013 July 3,933 1,596 1,598 101 471 168 52 28 16 4 3 2 Aug. 3,919 1,593 1,583 102 471 169 27 15 5 2 1 3 Sep. 3,908 1,582 1,578 103 475 169 42 18 11 3 8 3 Oct. 3,882 1,577 1,566 93 478 168 49 25 18 1 4 1
Source: ECB.1) Monthly data on gross issues refer to transactions during the month. For the purposes of comparison, quarterly and annual data refer to the respective monthly averages.2) The residual difference between total long-term debt securities and fixed and variable rate long-term debt securities consists of zero coupon bonds and revaluation effects.
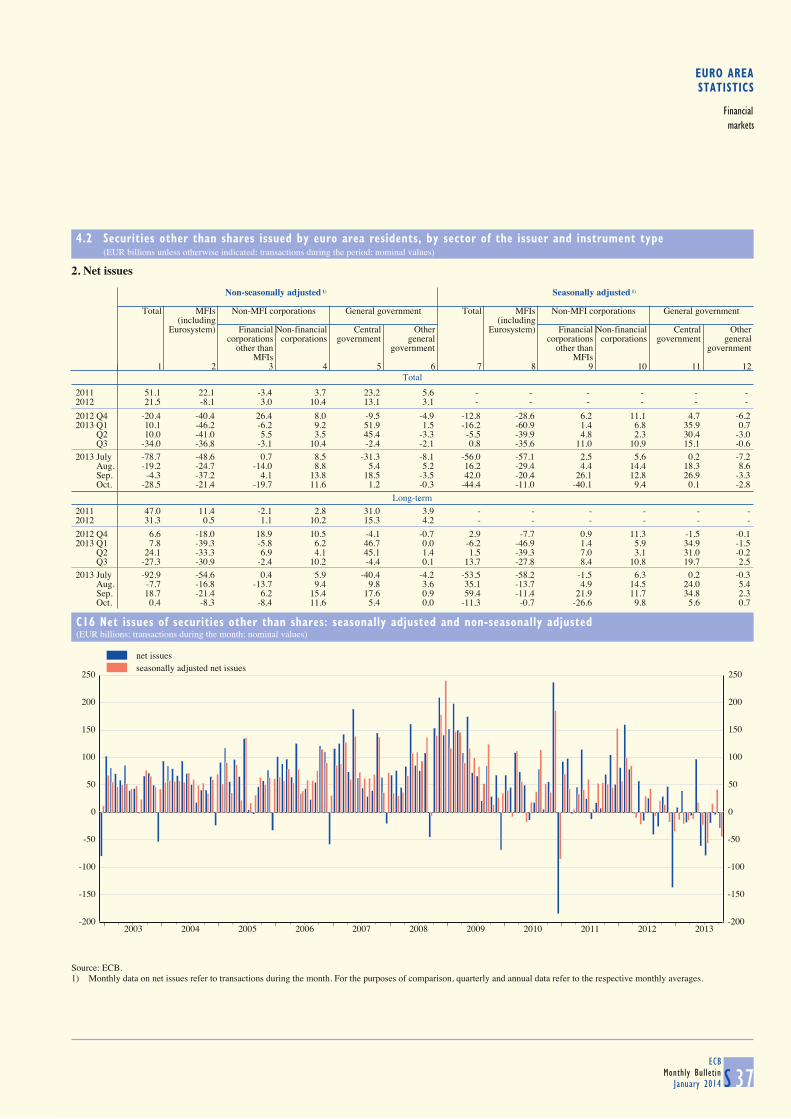
EURO AREASTATISTICS
Financialmarkets
4.2 Securities other than shares issued by euro area residents, by sector of the issuer and instrument type (EUR billions unless otherwise indicated; transactions during the period; nominal values)
S 37ECB
Monthly BulletinJanuary 2014
2. Net issues
Total
Non-seasonally adjusted 1) Seasonally adjusted 1)
Total MFIs Non-MFI corporations General government Total MFIs Non-MFI corporations General government
(including (includingEurosystem) Financial Non-financial Central Other Eurosystem) Financial Non-financial Central Other
corporations corporations government general corporations corporations government generalother than government other than government
MFIs MFIs1 2 3 4 5 6 7 8 9 10 11 12
2011 51.1 22.1 -3.4 3.7 23.2 5.6 - - - - - - 2012 21.5 -8.1 3.0 10.4 13.1 3.1 - - - - - -
2012 Q4 -20.4 -40.4 26.4 8.0 -9.5 -4.9 -12.8 -28.6 6.2 11.1 4.7 -6.22013 Q1 10.1 -46.2 -6.2 9.2 51.9 1.5 -16.2 -60.9 1.4 6.8 35.9 0.7 Q2 10.0 -41.0 5.5 3.5 45.4 -3.3 -5.5 -39.9 4.8 2.3 30.4 -3.0 Q3 -34.0 -36.8 -3.1 10.4 -2.4 -2.1 0.8 -35.6 11.0 10.9 15.1 -0.6
2013 July -78.7 -48.6 0.7 8.5 -31.3 -8.1 -56.0 -57.1 2.5 5.6 0.2 -7.2 Aug. -19.2 -24.7 -14.0 8.8 5.4 5.2 16.2 -29.4 4.4 14.4 18.3 8.6 Sep. -4.3 -37.2 4.1 13.8 18.5 -3.5 42.0 -20.4 26.1 12.8 26.9 -3.3 Oct. -28.5 -21.4 -19.7 11.6 1.2 -0.3 -44.4 -11.0 -40.1 9.4 0.1 -2.8
Long-term
2011 47.0 11.4 -2.1 2.8 31.0 3.9 - - - - - -2012 31.3 0.5 1.1 10.2 15.3 4.2 - - - - - -
2012 Q4 6.6 -18.0 18.9 10.5 -4.1 -0.7 2.9 -7.7 0.9 11.3 -1.5 -0.12013 Q1 7.8 -39.3 -5.8 6.2 46.7 0.0 -6.2 -46.9 1.4 5.9 34.9 -1.5 Q2 24.1 -33.3 6.9 4.1 45.1 1.4 1.5 -39.3 7.0 3.1 31.0 -0.2 Q3 -27.3 -30.9 -2.4 10.2 -4.4 0.1 13.7 -27.8 8.4 10.8 19.7 2.5
2013 July -92.9 -54.6 0.4 5.9 -40.4 -4.2 -53.5 -58.2 -1.5 6.3 0.2 -0.3 Aug. -7.7 -16.8 -13.7 9.4 9.8 3.6 35.1 -13.7 4.9 14.5 24.0 5.4 Sep. 18.7 -21.4 6.2 15.4 17.6 0.9 59.4 -11.4 21.9 11.7 34.8 2.3 Oct. 0.4 -8.3 -8.4 11.6 5.4 0.0 -11.3 -0.7 -26.6 9.8 5.6 0.7
C16 Net issues of securities other than shares: seasonally adjusted and non-seasonally adjusted
(EUR billions; transactions during the month; nominal values)
-200
-150
-100
-50
0
50
100
150
200
250
2003 2004 2005 2006 2007 2008 2009 2010 2011 2012 2013-200
-150
-100
-50
0
50
100
150
200
250
net issuesseasonally adjusted net issues
Source: ECB.1) Monthly data on net issues refer to transactions during the month. For the purposes of comparison, quarterly and annual data refer to the respective monthly averages.
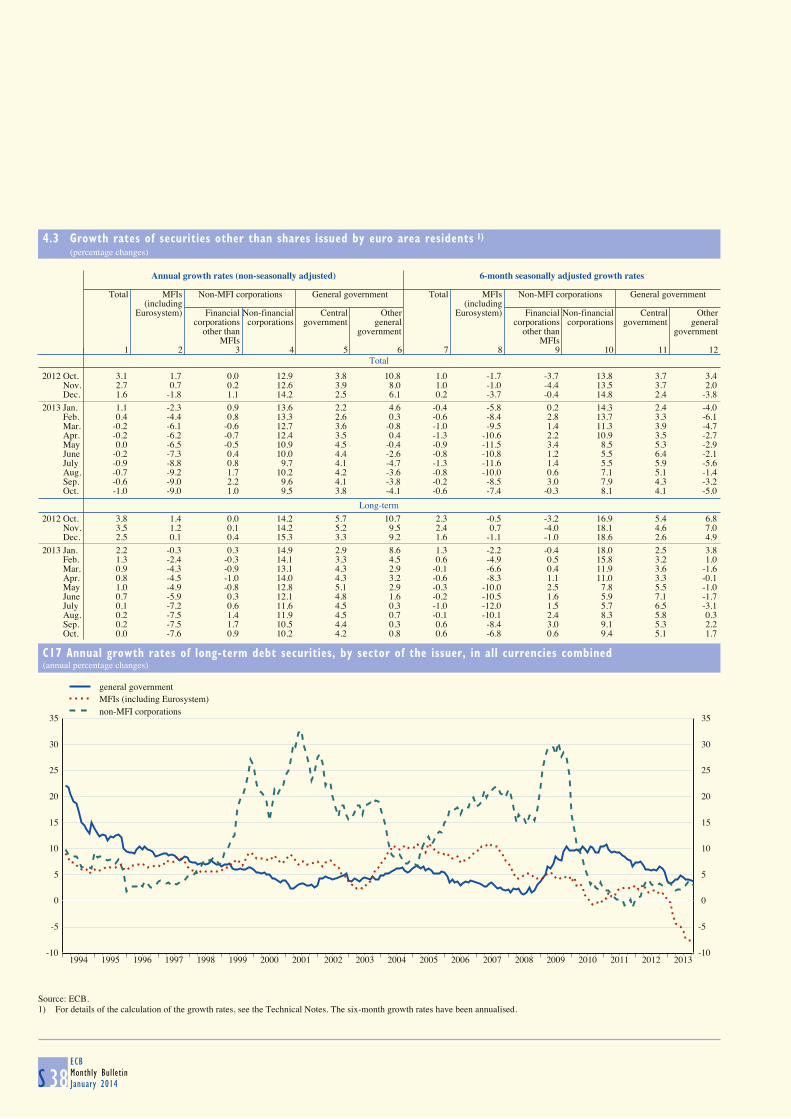
4.3 Growth rates of securities other than shares issued by euro area residents 1) (percentage changes)
S 38ECBMonthly BulletinJanuary 2014
Total
Annual growth rates (non-seasonally adjusted) 6-month seasonally adjusted growth rates
Total MFIs Non-MFI corporations General government Total MFIs Non-MFI corporations General government
(including (includingEurosystem) Financial Non-financial Central Other Eurosystem) Financial Non-financial Central Other
corporations corporations government general corporations corporations government generalother than government other than government
MFIs MFIs1 2 3 4 5 6 7 8 9 10 11 12
2012 Oct. 3.1 1.7 0.0 12.9 3.8 10.8 1.0 -1.7 -3.7 13.8 3.7 3.4 Nov. 2.7 0.7 0.2 12.6 3.9 8.0 1.0 -1.0 -4.4 13.5 3.7 2.0 Dec. 1.6 -1.8 1.1 14.2 2.5 6.1 0.2 -3.7 -0.4 14.8 2.4 -3.8
2013 Jan. 1.1 -2.3 0.9 13.6 2.2 4.6 -0.4 -5.8 0.2 14.3 2.4 -4.0 Feb. 0.4 -4.4 0.8 13.3 2.6 0.3 -0.6 -8.4 2.8 13.7 3.3 -6.1 Mar. -0.2 -6.1 -0.6 12.7 3.6 -0.8 -1.0 -9.5 1.4 11.3 3.9 -4.7 Apr. -0.2 -6.2 -0.7 12.4 3.5 0.4 -1.3 -10.6 2.2 10.9 3.5 -2.7 May 0.0 -6.5 -0.5 10.9 4.5 -0.4 -0.9 -11.5 3.4 8.5 5.3 -2.9 June -0.2 -7.3 0.4 10.0 4.4 -2.6 -0.8 -10.8 1.2 5.5 6.4 -2.1 July -0.9 -8.8 0.8 9.7 4.1 -4.7 -1.3 -11.6 1.4 5.5 5.9 -5.6 Aug. -0.7 -9.2 1.7 10.2 4.2 -3.6 -0.8 -10.0 0.6 7.1 5.1 -1.4 Sep. -0.6 -9.0 2.2 9.6 4.1 -3.8 -0.2 -8.5 3.0 7.9 4.3 -3.2 Oct. -1.0 -9.0 1.0 9.5 3.8 -4.1 -0.6 -7.4 -0.3 8.1 4.1 -5.0
Long-term
2012 Oct. 3.8 1.4 0.0 14.2 5.7 10.7 2.3 -0.5 -3.2 16.9 5.4 6.8 Nov. 3.5 1.2 0.1 14.2 5.2 9.5 2.4 0.7 -4.0 18.1 4.6 7.0 Dec. 2.5 0.1 0.4 15.3 3.3 9.2 1.6 -1.1 -1.0 18.6 2.6 4.9
2013 Jan. 2.2 -0.3 0.3 14.9 2.9 8.6 1.3 -2.2 -0.4 18.0 2.5 3.8 Feb. 1.3 -2.4 -0.3 14.1 3.3 4.5 0.6 -4.9 0.5 15.8 3.2 1.0 Mar. 0.9 -4.3 -0.9 13.1 4.3 2.9 -0.1 -6.6 0.4 11.9 3.6 -1.6 Apr. 0.8 -4.5 -1.0 14.0 4.3 3.2 -0.6 -8.3 1.1 11.0 3.3 -0.1 May 1.0 -4.9 -0.8 12.8 5.1 2.9 -0.3 -10.0 2.5 7.8 5.5 -1.0 June 0.7 -5.9 0.3 12.1 4.8 1.6 -0.2 -10.5 1.6 5.9 7.1 -1.7 July 0.1 -7.2 0.6 11.6 4.5 0.3 -1.0 -12.0 1.5 5.7 6.5 -3.1 Aug. 0.2 -7.5 1.4 11.9 4.5 0.7 -0.1 -10.1 2.4 8.3 5.8 0.3 Sep. 0.2 -7.5 1.7 10.5 4.4 0.3 0.6 -8.4 3.0 9.1 5.3 2.2 Oct. 0.0 -7.6 0.9 10.2 4.2 0.8 0.6 -6.8 0.6 9.4 5.1 1.7
C17 Annual growth rates of long-term debt securities, by sector of the issuer, in all currencies combined
(annual percentage changes)
-10
-5
0
5
10
15
20
25
30
35
1994 1995 1996 1997 1998 1999 2000 2001 2002 2003 2004 2005 2006 2007 2008 2009 2010 2011 2012 2013-10
-5
0
5
10
15
20
25
30
35
general governmentMFIs (including Eurosystem)non-MFI corporations
Source: ECB.1) For details of the calculation of the growth rates, see the Technical Notes. The six-month growth rates have been annualised.
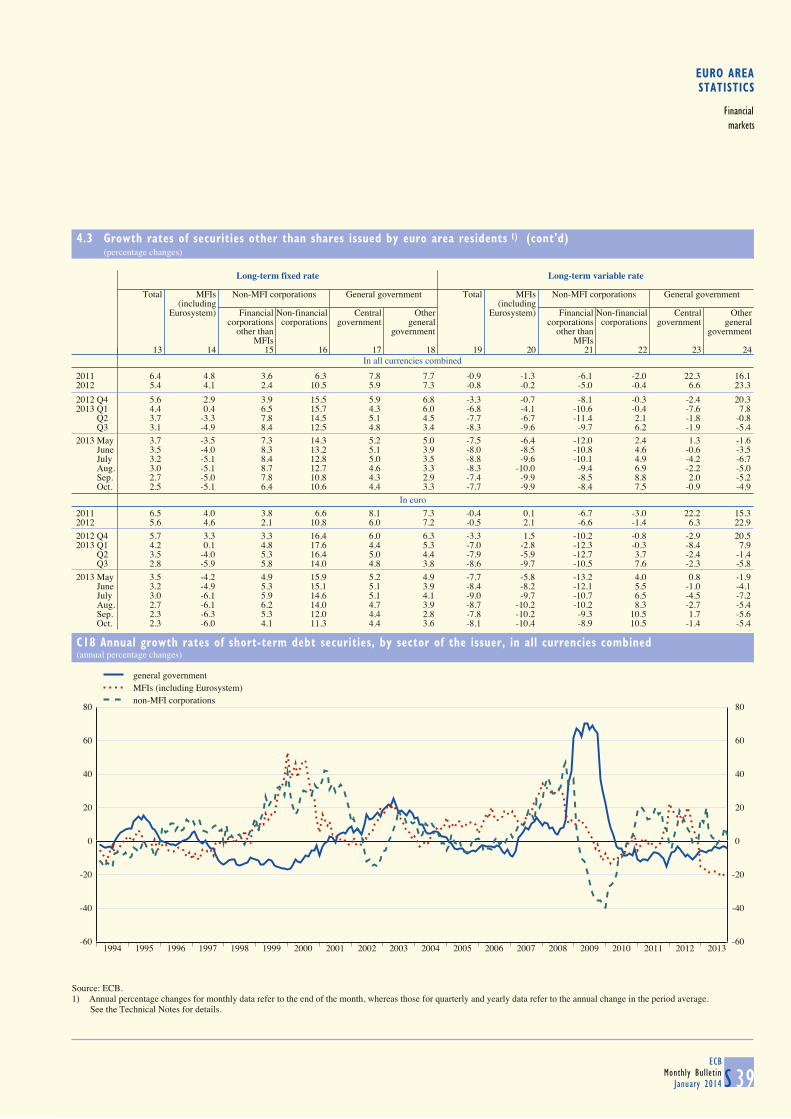
EURO AREASTATISTICS
Financialmarkets
4.3 Growth rates of securities other than shares issued by euro area residents 1) (cont'd) (percentage changes)
S 39ECB
Monthly BulletinJanuary 2014
In all currencies combined
Long-term fixed rate Long-term variable rate
Total MFIs Non-MFI corporations General government Total MFIs Non-MFI corporations General government
(including (includingEurosystem) Financial Non-financial Central Other Eurosystem) Financial Non-financial Central Other
corporations corporations government general corporations corporations government generalother than government other than government
MFIs MFIs13 14 15 16 17 18 19 20 21 22 23 24
2011 6.4 4.8 3.6 6.3 7.8 7.7 -0.9 -1.3 -6.1 -2.0 22.3 16.12012 5.4 4.1 2.4 10.5 5.9 7.3 -0.8 -0.2 -5.0 -0.4 6.6 23.3
2012 Q4 5.6 2.9 3.9 15.5 5.9 6.8 -3.3 -0.7 -8.1 -0.3 -2.4 20.32013 Q1 4.4 0.4 6.5 15.7 4.3 6.0 -6.8 -4.1 -10.6 -0.4 -7.6 7.8 Q2 3.7 -3.3 7.8 14.5 5.1 4.5 -7.7 -6.7 -11.4 2.1 -1.8 -0.8 Q3 3.1 -4.9 8.4 12.5 4.8 3.4 -8.3 -9.6 -9.7 6.2 -1.9 -5.4
2013 May 3.7 -3.5 7.3 14.3 5.2 5.0 -7.5 -6.4 -12.0 2.4 1.3 -1.6 June 3.5 -4.0 8.3 13.2 5.1 3.9 -8.0 -8.5 -10.8 4.6 -0.6 -3.5 July 3.2 -5.1 8.4 12.8 5.0 3.5 -8.8 -9.6 -10.1 4.9 -4.2 -6.7 Aug. 3.0 -5.1 8.7 12.7 4.6 3.3 -8.3 -10.0 -9.4 6.9 -2.2 -5.0 Sep. 2.7 -5.0 7.8 10.8 4.3 2.9 -7.4 -9.9 -8.5 8.8 2.0 -5.2 Oct. 2.5 -5.1 6.4 10.6 4.4 3.3 -7.7 -9.9 -8.4 7.5 -0.9 -4.9
In euro
2011 6.5 4.0 3.8 6.6 8.1 7.3 -0.4 0.1 -6.7 -3.0 22.2 15.32012 5.6 4.6 2.1 10.8 6.0 7.2 -0.5 2.1 -6.6 -1.4 6.3 22.9
2012 Q4 5.7 3.3 3.3 16.4 6.0 6.3 -3.3 1.5 -10.2 -0.8 -2.9 20.52013 Q1 4.2 0.1 4.8 17.6 4.4 5.3 -7.0 -2.8 -12.3 -0.3 -8.4 7.9 Q2 3.5 -4.0 5.3 16.4 5.0 4.4 -7.9 -5.9 -12.7 3.7 -2.4 -1.4 Q3 2.8 -5.9 5.8 14.0 4.8 3.8 -8.6 -9.7 -10.5 7.6 -2.3 -5.8
2013 May 3.5 -4.2 4.9 15.9 5.2 4.9 -7.7 -5.8 -13.2 4.0 0.8 -1.9 June 3.2 -4.9 5.3 15.1 5.1 3.9 -8.4 -8.2 -12.1 5.5 -1.0 -4.1 July 3.0 -6.1 5.9 14.6 5.1 4.1 -9.0 -9.7 -10.7 6.5 -4.5 -7.2 Aug. 2.7 -6.1 6.2 14.0 4.7 3.9 -8.7 -10.2 -10.2 8.3 -2.7 -5.4 Sep. 2.3 -6.3 5.3 12.0 4.4 2.8 -7.8 -10.2 -9.3 10.5 1.7 -5.6 Oct. 2.3 -6.0 4.1 11.3 4.4 3.6 -8.1 -10.4 -8.9 10.5 -1.4 -5.4
C18 Annual growth rates of short-term debt securities, by sector of the issuer, in all currencies combined
(annual percentage changes)
-60
-40
-20
0
20
40
60
80
1994 1995 1996 1997 1998 1999 2000 2001 2002 2003 2004 2005 2006 2007 2008 2009 2010 2011 2012 2013-60
-40
-20
0
20
40
60
80
general governmentMFIs (including Eurosystem)non-MFI corporations
Source: ECB.1) Annual percentage changes for monthly data refer to the end of the month, whereas those for quarterly and yearly data refer to the annual change in the period average. See the Technical Notes for details.

4.4 Quoted shares issued by euro area residents 1) (EUR billions, unless otherwise indicated; market values)
S 40ECBMonthly BulletinJanuary 2014
1. Outstanding amounts and annual growth rates(outstanding amounts as at end of period)
Total MFIs Financial corporations other than MFIs Non-financial corporations
Total Index: Annual Total Annual Total Annual Total AnnualDec. 2008 = 100 growth growth growth growth
rates (%) rates (%) rates (%) rates (%)
1 2 3 4 5 6 7 8 9
2011 Oct. 4,017.6 105.9 1.7 360.5 9.9 288.1 5.8 3,369.0 0.3 Nov. 3,866.8 106.0 1.5 329.8 8.9 271.6 4.6 3,265.3 0.3 Dec. 3,878.6 106.1 1.6 339.3 9.3 270.8 4.9 3,268.5 0.4
2012 Jan. 4,091.7 106.3 1.7 375.5 11.4 298.1 4.0 3,418.2 0.4 Feb. 4,257.8 106.3 1.5 394.7 10.7 311.3 3.1 3,551.9 0.3 Mar. 4,241.7 106.4 1.5 373.1 11.3 311.1 2.8 3,557.5 0.3 Apr. 4,067.5 106.5 1.4 327.3 10.7 292.0 3.1 3,448.2 0.2 May 3,761.8 106.5 1.5 280.9 10.0 265.1 3.4 3,215.8 0.4 June 3,924.4 106.6 1.1 317.6 7.7 284.7 2.8 3,322.1 0.3 July 4,050.4 106.8 1.0 309.9 5.8 291.8 2.7 3,448.7 0.3 Aug. 4,175.1 106.8 0.9 349.7 4.6 309.1 3.2 3,516.4 0.3 Sep. 4,231.4 106.9 0.9 365.0 4.9 323.6 2.7 3,542.9 0.4 Oct. 4,308.1 107.0 1.0 383.6 5.0 333.4 2.9 3,591.1 0.4 Nov. 4,396.1 106.9 0.9 395.7 5.5 342.0 2.3 3,658.4 0.3 Dec. 4,500.1 107.2 1.0 402.4 4.9 357.0 2.4 3,740.7 0.5
2013 Jan. 4,655.0 107.3 0.9 441.6 2.7 370.3 2.5 3,843.1 0.6 Feb. 4,639.6 107.1 0.8 416.1 2.7 364.2 2.7 3,859.4 0.4 Mar. 4,641.6 106.9 0.5 380.4 2.2 368.7 2.6 3,892.6 0.1 Apr. 4,743.9 106.8 0.3 410.5 0.9 394.6 2.7 3,938.8 0.1 May 4,860.6 107.1 0.5 440.6 1.9 407.6 2.5 4,012.4 0.2 June 4,660.4 107.9 1.2 413.9 7.6 394.2 2.6 3,852.2 0.4 July 4,900.1 108.0 1.1 447.0 7.9 418.3 1.8 4,034.8 0.3 Aug. 4,888.4 107.9 1.1 461.9 7.8 415.8 1.2 4,010.8 0.3 Sep. 5,132.8 107.9 1.0 492.2 7.8 427.3 0.7 4,213.3 0.3 Oct. 5,407.6 108.1 1.1 557.2 7.7 445.4 0.9 4,405.1 0.4
C19 Annual growth rates for quoted shares issued by euro area residents
(annual percentage changes)
-4
-2
0
2
4
6
8
10
12
14
2000 2001 2002 2003 2004 2005 2006 2007 2008 2009 2010 2011 2012 2013-4
-2
0
2
4
6
8
10
12
14
MFIsfinancial corporations other than MFIsnon-financial corporations
Source: ECB.1) For details of the calculation of the index and the growth rates, see the Technical Notes.

EURO AREASTATISTICS
Financialmarkets
4.4 Quoted shares issued by euro area residents (EUR billions; market values)
S 41ECB
Monthly BulletinJanuary 2014
2. Transactions during the month
Total MFIs Financial corporations other than MFIs Non-financial corporations
Gross issues Redemptions Net issues Gross issues Redemptions Net issues Gross issues Redemptions Net issues Gross issues Redemptions Net issues
1 2 3 4 5 6 7 8 9 10 11 12
2011 Oct. 2.4 0.4 2.0 0.0 0.0 0.0 0.1 0.0 0.1 2.3 0.4 1.9 Nov. 2.6 1.5 1.1 0.7 0.0 0.7 1.4 0.0 1.4 0.6 1.5 -1.0 Dec. 5.5 1.1 4.4 1.5 0.0 1.5 1.2 0.0 1.2 2.8 1.1 1.7
2012 Jan. 8.4 0.4 7.9 7.5 0.0 7.5 0.0 0.1 -0.1 0.9 0.3 0.6 Feb. 1.1 1.4 -0.3 0.0 0.0 0.0 0.0 0.2 -0.2 1.0 1.2 -0.1 Mar. 4.9 0.7 4.3 2.0 0.0 2.0 0.0 0.1 -0.1 2.9 0.6 2.3 Apr. 3.1 0.3 2.8 0.0 0.0 0.0 1.1 0.0 1.1 2.0 0.3 1.7 May 4.7 1.8 2.9 1.1 0.0 1.1 1.0 0.1 1.0 2.5 1.7 0.8 June 4.8 1.2 3.6 2.6 0.0 2.6 0.0 0.1 -0.1 2.2 1.1 1.1 July 4.7 0.3 4.4 0.2 0.0 0.2 1.1 0.0 1.1 3.5 0.3 3.2 Aug. 3.7 1.8 1.8 0.4 0.0 0.4 1.6 0.1 1.5 1.6 1.7 -0.1 Sep. 2.9 0.5 2.3 0.1 0.0 0.1 1.2 0.1 1.0 1.7 0.4 1.3 Oct. 6.3 1.8 4.5 0.5 0.0 0.5 0.5 0.1 0.4 5.3 1.7 3.6 Nov. 3.9 5.9 -2.0 2.5 0.0 2.5 0.1 0.1 0.0 1.3 5.8 -4.5 Dec. 21.6 11.4 10.2 0.0 0.5 -0.5 1.8 0.0 1.8 19.7 10.8 8.9
2013 Jan. 4.6 0.3 4.3 0.0 0.0 0.0 0.2 0.1 0.1 4.3 0.2 4.1 Feb. 4.1 11.4 -7.3 0.3 0.0 0.3 0.3 0.0 0.3 3.5 11.4 -7.8 Mar. 0.7 10.6 -9.9 0.0 0.1 -0.1 0.0 0.3 -0.3 0.6 10.1 -9.4 Apr. 3.6 5.9 -2.3 0.4 5.2 -4.8 1.7 0.0 1.6 1.6 0.7 0.9 May 13.1 1.8 11.3 5.5 0.0 5.5 0.6 0.0 0.5 7.0 1.8 5.2 June 39.0 1.7 37.3 29.2 0.0 29.1 0.3 0.1 0.3 9.6 1.7 7.9 July 5.4 3.2 2.2 1.4 0.0 1.4 0.6 1.9 -1.4 3.5 1.2 2.2 Aug. 1.1 2.3 -1.2 0.0 0.0 0.0 0.0 0.5 -0.5 1.1 1.8 -0.7 Sep. 0.8 1.7 -0.9 0.1 0.0 0.1 0.1 0.6 -0.4 0.5 1.1 -0.5 Oct. 16.9 7.5 9.4 0.1 0.0 0.1 1.3 0.1 1.2 15.5 7.4 8.1
C20 Gross issues of quoted shares by sector of the issuer
(EUR billions; transactions during the month; market values)
0
5
10
15
20
25
30
35
40
45
1999 2000 2001 2002 2003 2004 2005 2006 2007 2008 2009 2010 2011 2012 20130
5
10
15
20
25
30
35
40
45
non-financial corporationsMFIsfinancial corporations other than MFIs
Source: ECB.

4.5 MFI interest rates on euro-denominated deposits from and loans to euro area residents 1) (percentages per annum; outstanding amounts as at end of period, new business as period average, unless otherwise indicated)
S 42ECBMonthly BulletinJanuary 2014
1. Interest rates on deposits (new business)
Deposits from households Deposits from non-financial corporations Repos
Overnight With an agreed maturity of: Redeemable at notice of: 2) Overnight With an agreed maturity of:
Up to 1 year Over 1 and Over 2 years Up to 3 months Over 3 months Up to 1 year Over 1 and Over 2 yearsup to 2 years up to 2 years
1 2 3 4 5 6 7 8 9 10 11
2012 Dec. 0.39 2.73 2.59 2.25 1.59 1.59 0.42 1.08 1.92 2.16 1.53
2013 Jan. 0.37 2.61 2.37 2.42 1.53 1.53 0.39 1.09 2.00 2.16 1.17 Feb. 0.36 2.44 2.23 2.29 1.39 1.47 0.40 1.05 1.99 2.08 0.63 Mar. 0.36 2.29 2.17 2.28 1.37 1.43 0.40 0.93 1.85 1.99 1.00 Apr. 0.34 2.33 2.10 2.25 1.36 1.36 0.38 0.96 1.70 1.90 0.68 May 0.33 2.04 2.06 2.25 1.31 1.30 0.38 0.83 1.86 1.98 0.48 June 0.32 1.88 1.88 2.12 1.30 1.27 0.38 0.83 1.65 1.77 0.72 July 0.31 1.88 1.90 2.08 1.28 1.23 0.36 0.82 1.63 1.78 0.88 Aug. 0.30 1.81 1.87 2.05 1.15 1.22 0.37 0.70 1.57 1.85 0.51 Sep. 0.30 1.71 1.86 2.06 1.15 1.17 0.35 0.81 1.68 1.87 0.56 Oct. 0.29 1.72 1.83 2.07 1.13 1.14 0.34 0.78 1.65 2.28 0.29 Nov. 0.29 1.60 1.76 2.02 1.12 1.10 0.34 0.75 1.57 1.73 0.46
2. Interest rates on loans to households (new business)
Revolving Extended Consumer credit Lending for house purchase Lending to sole proprietors andloans and credit card unincorporated partnerships
overdrafts debt 3) By initial rate fixation APRC 4) By initial rate fixation APRC 4) By initial rate fixation
Floating rate Over 1 Over Floating rate Over 1 Over 5 Over Floating rate Over 1 Overand up to and up to 5 years and up to and up to and up to 10 years and up to and up to 5 years
1 year 5 years 1 year 5 years 10 years 1 year 5 years
1 2 3 4 5 6 7 8 9 10 11 12 13 14
2012 Dec. 7.94 16.93 5.36 6.05 7.55 6.94 2.87 3.25 3.25 3.45 3.41 3.15 4.12 3.01
2013 Jan. 7.97 17.06 5.77 6.11 7.88 7.27 2.87 3.17 3.03 3.35 3.34 3.19 4.06 3.08 Feb. 7.97 17.04 5.89 6.03 7.83 7.25 2.88 3.17 3.05 3.35 3.35 3.16 4.07 3.21 Mar. 7.95 17.06 5.86 5.98 7.75 7.15 2.86 3.19 3.13 3.34 3.38 3.16 4.16 3.17 Apr. 7.93 17.08 5.74 5.92 7.75 7.06 2.87 3.13 3.06 3.34 3.38 3.26 3.97 3.11 May 7.91 17.08 6.00 6.09 7.71 7.20 2.87 3.09 2.95 3.22 3.32 3.32 4.11 3.14 June 7.84 17.03 5.85 6.02 7.56 7.07 2.82 3.00 2.87 3.15 3.25 3.10 4.08 3.01 July 7.75 16.96 5.63 6.12 7.63 7.13 2.84 2.97 2.90 3.17 3.28 3.19 3.75 3.18 Aug. 7.74 17.01 5.62 6.15 7.64 7.15 2.80 3.01 2.97 3.18 3.31 3.00 4.06 3.15 Sep. 7.77 17.02 5.80 6.07 7.62 7.20 2.83 3.05 3.05 3.25 3.35 3.04 3.99 3.16 Oct. 7.67 17.02 5.70 6.04 7.63 7.13 2.77 3.04 3.12 3.27 3.35 3.10 3.95 3.26 Nov. 7.64 16.94 5.81 6.05 7.74 7.18 2.79 3.06 3.15 3.29 3.37 3.30 4.08 3.19
3. Interest rates on loans to non-financial corporations (new business)
Revolving Other loans of up to EUR 0.25 million Other loans of over EUR 1 millionloans and by initial rate fixation by initial rate fixation
overdraftsFloating rate Over 3 months Over 1 Over 3 Over 5 Over Floating rate Over 3 months Over 1 Over 3 Over 5 Over
and up to and up to and up to and up to and up to 10 years and up to and up to and up to and up to and up to 10 years3 months 1 year 3 years 5 years 10 years 3 months 1 year 3 years 5 years 10 years
1 2 3 4 5 6 7 8 9 10 11 12 13
2012 Dec. 4.19 4.62 4.55 4.24 4.24 3.68 3.51 2.17 2.79 2.84 3.32 2.79 3.01
2013 Jan. 4.21 4.68 4.70 4.03 4.16 3.62 3.68 2.09 2.88 3.32 4.29 2.92 3.02 Feb. 4.20 4.70 4.69 4.05 4.25 3.70 3.66 2.02 2.85 3.13 4.42 2.93 3.14 Mar. 4.17 4.56 4.71 4.11 4.25 3.75 3.61 2.00 2.91 3.07 4.06 2.85 2.85 Apr. 4.16 4.78 4.73 4.16 4.07 3.62 3.58 2.14 2.77 3.21 4.16 3.00 2.94 May 4.11 4.76 4.76 4.12 4.12 3.61 3.48 2.10 2.71 3.21 3.52 2.68 2.79 June 4.12 4.54 4.60 4.40 4.34 3.56 3.41 2.05 2.60 3.01 2.96 2.71 3.12 July 4.09 4.65 4.82 4.34 4.09 3.48 3.45 2.13 2.72 2.72 2.82 2.98 3.17 Aug. 4.09 4.50 4.81 4.41 4.06 3.41 3.39 2.03 2.56 2.82 3.00 2.88 3.10 Sep. 4.12 4.53 4.67 4.39 4.16 3.41 3.42 2.08 2.54 2.86 2.75 2.89 3.28 Oct. 4.14 4.60 4.83 4.39 4.14 3.51 3.50 2.16 2.64 3.10 2.86 3.28 3.38 Nov. 4.08 4.56 4.71 4.34 4.29 3.55 3.49 2.23 2.62 2.96 2.89 2.98 3.10
Source: ECB.1) Data refer to the changing composition of the euro area. For further information, see the General Notes.2) For this instrument category, households and non-financial corporations are merged and allocated to the household sector, since the outstanding amounts of non-financial
corporations are negligible compared with those of the household sector when all participating Member States are combined.3) This instrument category excludes convenience credit card debt, i.e. credit granted at an interest rate of 0% during the billing cycle.4) The annual percentage rate of charge (APRC) covers the total cost of a loan. The total cost comprises both an interest rate component and a component incorporating
other (related) charges, such as the cost of inquiries, administration, preparation of documents and guarantees.

EURO AREASTATISTICS
Financialmarkets
4.5 MFI interest rates on euro-denominated deposits from and loans to euro area residents 1), * (percentages per annum; outstanding amounts as at end of period, new business as period average, unless otherwise indicated)
S 43ECB
Monthly BulletinJanuary 2014
4. Interest rates on deposits (outstanding amounts)
Deposits from households Deposits from non-financial corporations Repos
Overnight 2) With an agreed maturity of: Redeemable at notice of: 2),3) Overnight 2) With an agreed maturity of:
Up to 2 years Over 2 years Up to 3 months Over 3 months Up to 2 years Over 2 years
1 2 3 4 5 6 7 8 9
2012 Dec. 0.39 2.64 2.73 1.59 1.59 0.42 1.80 2.91 2.65
2013 Jan. 0.37 2.58 2.71 1.53 1.53 0.39 1.75 2.87 2.32 Feb. 0.36 2.58 2.75 1.39 1.47 0.40 1.72 2.93 1.99 Mar. 0.36 2.53 2.70 1.37 1.43 0.40 1.65 2.89 2.18 Apr. 0.34 2.47 2.70 1.36 1.36 0.38 1.60 2.83 1.99 May 0.33 2.41 2.67 1.31 1.30 0.38 1.57 2.79 1.62 June 0.32 2.36 2.67 1.30 1.27 0.38 1.51 2.80 1.72 July 0.31 2.28 2.64 1.28 1.23 0.36 1.46 2.77 1.66 Aug. 0.30 2.22 2.63 1.15 1.22 0.37 1.44 2.82 1.50 Sep. 0.30 2.16 2.63 1.15 1.17 0.35 1.41 2.85 1.66 Oct. 0.29 2.09 2.60 1.13 1.14 0.34 1.34 2.83 1.35 Nov. 0.29 2.02 2.61 1.12 1.10 0.34 1.32 2.84 1.34
5. Interest rates on loans (outstanding amounts)
Loans to households Loans to non-financial corporations
Lending for house purchase Consumer credit and other loans With a maturity of:
with a maturity of: with a maturity of:
Up to 1 year Over 1 and Over 5 years Up to 1 year Over 1 and Over 5 years Up to 1 year Over 1 and Over 5 yearsup to 5 years up to 5 years up to 5 years
1 2 3 4 5 6 7 8 9
2012 Dec. 3.49 3.39 3.56 7.75 6.18 4.92 3.71 3.28 3.22
2013 Jan. 3.46 3.36 3.52 7.76 6.21 4.89 3.73 3.26 3.17 Feb. 3.45 3.35 3.51 7.77 6.24 4.91 3.72 3.26 3.19 Mar. 3.50 3.36 3.49 7.79 6.21 4.89 3.68 3.25 3.16 Apr. 3.49 3.33 3.49 7.74 6.19 4.88 3.67 3.25 3.15 May 3.47 3.30 3.46 7.65 6.14 4.86 3.65 3.24 3.13 June 3.50 3.29 3.43 7.62 6.18 4.87 3.62 3.24 3.14 July 3.51 3.24 3.40 7.59 6.18 4.84 3.62 3.26 3.14 Aug. 3.52 3.22 3.37 7.58 6.16 4.82 3.63 3.26 3.12 Sep. 3.55 3.22 3.37 7.64 6.16 4.82 3.65 3.24 3.13 Oct. 3.50 3.20 3.35 7.61 6.10 4.80 3.62 3.27 3.12 Nov. 3.51 3.22 3.34 7.52 6.11 4.79 3.59 3.28 3.12
C21 New deposits with an agreed maturity
(percentages per annum excluding charges; period averages)
C22 New loans with a floating rate and up to 1 year's initial
rate fixation (percentages per annum excluding charges; period averages)
0.50
1.00
1.50
2.00
2.50
3.00
3.50
4.00
4.50
5.00
2003 2004 2005 2006 2007 2008 2009 2010 2011 2012 20130.50
1.00
1.50
2.00
2.50
3.00
3.50
4.00
4.50
5.00
by households, up to 1 yearby non-financial corporations, up to 1 yearby households, over 2 yearsby non-financial corporations, over 2 years
1.00
2.00
3.00
4.00
5.00
6.00
7.00
8.00
9.00
2003 2004 2005 2006 2007 2008 2009 2010 2011 2012 20131.00
2.00
3.00
4.00
5.00
6.00
7.00
8.00
9.00
to households for consumptionto households for house purchaseto non-financial corporations, up to EUR 1 millionto non-financial corporations, over EUR 1 million
Source: ECB.* For the source of the data in the table and the related footnotes, please see page S42.
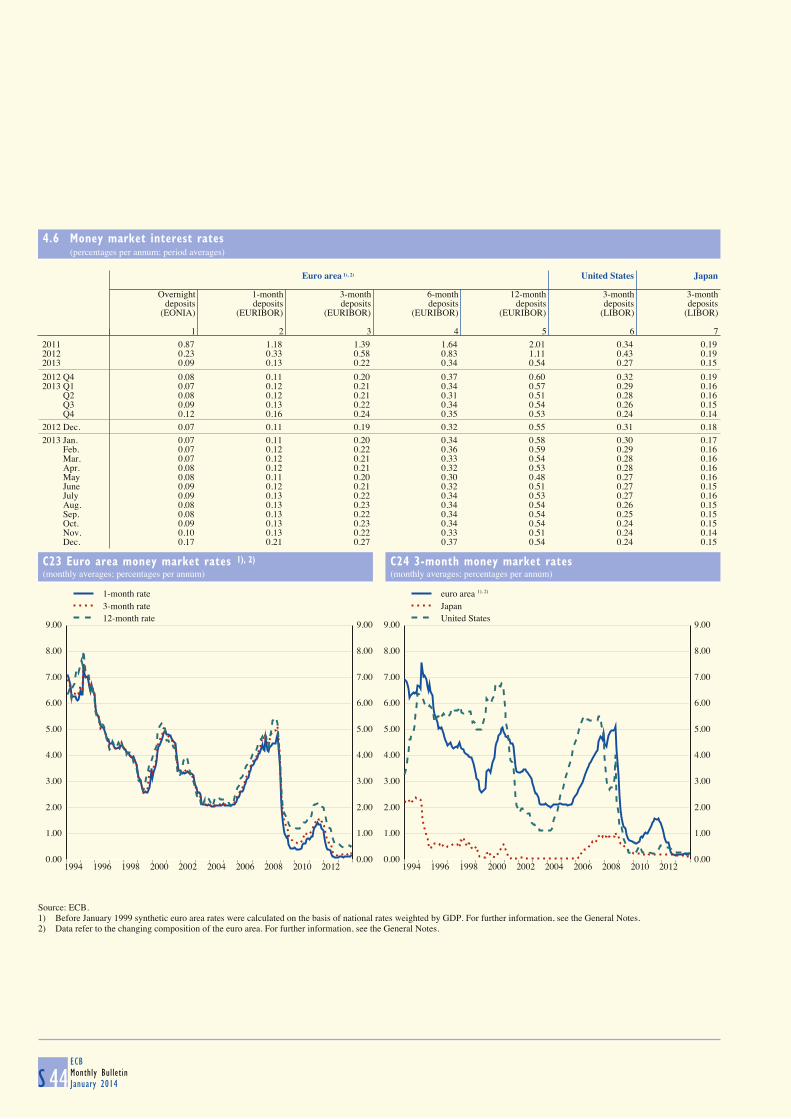
4.6 Money market interest rates (percentages per annum; period averages)
S 44ECBMonthly BulletinJanuary 2014
Euro area 1), 2) United States Japan
Overnight 1-month 3-month 6-month 12-month 3-month 3-monthdeposits deposits deposits deposits deposits deposits deposits
(EONIA) (EURIBOR) (EURIBOR) (EURIBOR) (EURIBOR) (LIBOR) (LIBOR)
1 2 3 4 5 6 7
2011 0.87 1.18 1.39 1.64 2.01 0.34 0.192012 0.23 0.33 0.58 0.83 1.11 0.43 0.192013 0.09 0.13 0.22 0.34 0.54 0.27 0.15
2012 Q4 0.08 0.11 0.20 0.37 0.60 0.32 0.192013 Q1 0.07 0.12 0.21 0.34 0.57 0.29 0.16 Q2 0.08 0.12 0.21 0.31 0.51 0.28 0.16 Q3 0.09 0.13 0.22 0.34 0.54 0.26 0.15 Q4 0.12 0.16 0.24 0.35 0.53 0.24 0.14
2012 Dec. 0.07 0.11 0.19 0.32 0.55 0.31 0.18
2013 Jan. 0.07 0.11 0.20 0.34 0.58 0.30 0.17 Feb. 0.07 0.12 0.22 0.36 0.59 0.29 0.16 Mar. 0.07 0.12 0.21 0.33 0.54 0.28 0.16 Apr. 0.08 0.12 0.21 0.32 0.53 0.28 0.16 May 0.08 0.11 0.20 0.30 0.48 0.27 0.16 June 0.09 0.12 0.21 0.32 0.51 0.27 0.15 July 0.09 0.13 0.22 0.34 0.53 0.27 0.16 Aug. 0.08 0.13 0.23 0.34 0.54 0.26 0.15 Sep. 0.08 0.13 0.22 0.34 0.54 0.25 0.15 Oct. 0.09 0.13 0.23 0.34 0.54 0.24 0.15 Nov. 0.10 0.13 0.22 0.33 0.51 0.24 0.14 Dec. 0.17 0.21 0.27 0.37 0.54 0.24 0.15
C23 Euro area money market rates 1), 2)
(monthly averages; percentages per annum)
C24 3-month money market rates
(monthly averages; percentages per annum)
0.00
1.00
2.00
3.00
4.00
5.00
6.00
7.00
8.00
9.00
1994 1996 1998 2000 2002 2004 2006 2008 2010 20120.00
1.00
2.00
3.00
4.00
5.00
6.00
7.00
8.00
9.00
1-month rate3-month rate12-month rate
0.00
1.00
2.00
3.00
4.00
5.00
6.00
7.00
8.00
9.00
1994 1996 1998 2000 2002 2004 2006 2008 2010 20120.00
1.00
2.00
3.00
4.00
5.00
6.00
7.00
8.00
9.00
euro areaJapanUnited States
Source: ECB.1) Before January 1999 synthetic euro area rates were calculated on the basis of national rates weighted by GDP. For further information, see the General Notes.2) Data refer to the changing composition of the euro area. For further information, see the General Notes.
1), 2)
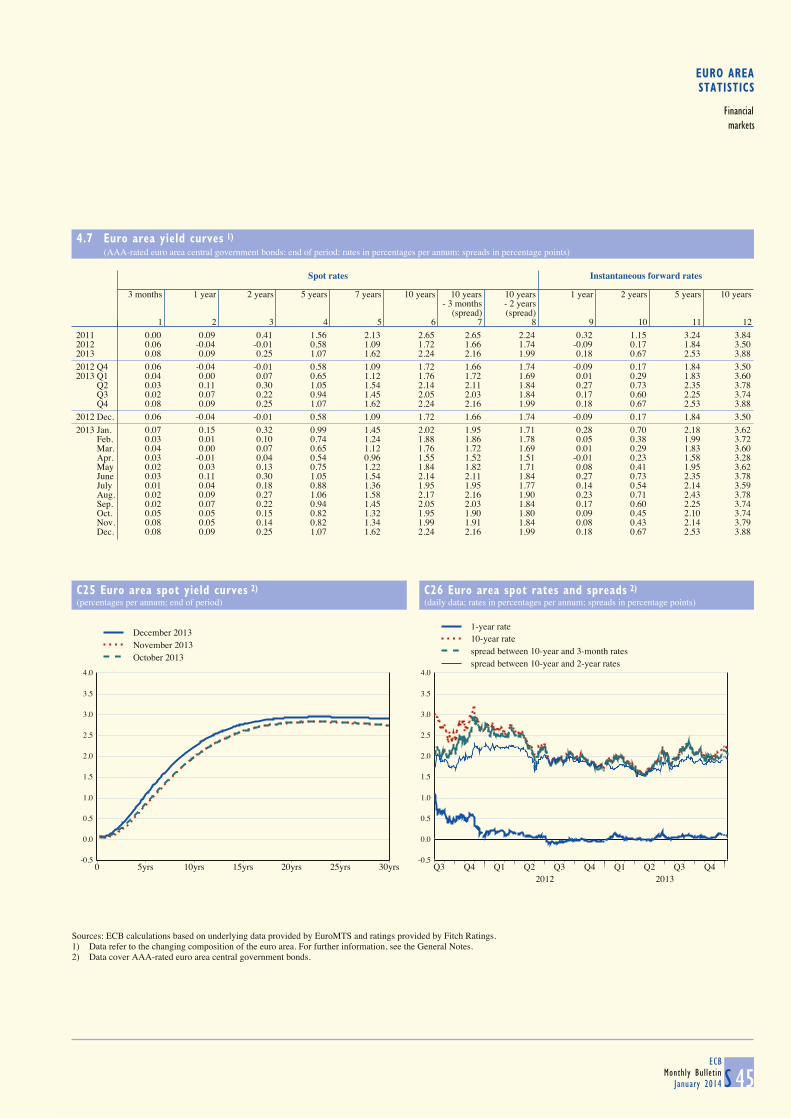
EURO AREASTATISTICS
Financialmarkets
4.7 Euro area yield curves 1)
(AAA-rated euro area central government bonds; end of period; rates in percentages per annum; spreads in percentage points)
S 45ECB
Monthly BulletinJanuary 2014
Spot rates Instantaneous forward rates
3 months 1 year 2 years 5 years 7 years 10 years 10 years 10 years 1 year 2 years 5 years 10 years- 3 months - 2 years
(spread) (spread)1 2 3 4 5 6 7 8 9 10 11 12
2011 0.00 0.09 0.41 1.56 2.13 2.65 2.65 2.24 0.32 1.15 3.24 3.842012 0.06 -0.04 -0.01 0.58 1.09 1.72 1.66 1.74 -0.09 0.17 1.84 3.502013 0.08 0.09 0.25 1.07 1.62 2.24 2.16 1.99 0.18 0.67 2.53 3.88
2012 Q4 0.06 -0.04 -0.01 0.58 1.09 1.72 1.66 1.74 -0.09 0.17 1.84 3.502013 Q1 0.04 0.00 0.07 0.65 1.12 1.76 1.72 1.69 0.01 0.29 1.83 3.60 Q2 0.03 0.11 0.30 1.05 1.54 2.14 2.11 1.84 0.27 0.73 2.35 3.78 Q3 0.02 0.07 0.22 0.94 1.45 2.05 2.03 1.84 0.17 0.60 2.25 3.74 Q4 0.08 0.09 0.25 1.07 1.62 2.24 2.16 1.99 0.18 0.67 2.53 3.88
2012 Dec. 0.06 -0.04 -0.01 0.58 1.09 1.72 1.66 1.74 -0.09 0.17 1.84 3.50
2013 Jan. 0.07 0.15 0.32 0.99 1.45 2.02 1.95 1.71 0.28 0.70 2.18 3.62 Feb. 0.03 0.01 0.10 0.74 1.24 1.88 1.86 1.78 0.05 0.38 1.99 3.72 Mar. 0.04 0.00 0.07 0.65 1.12 1.76 1.72 1.69 0.01 0.29 1.83 3.60 Apr. 0.03 -0.01 0.04 0.54 0.96 1.55 1.52 1.51 -0.01 0.23 1.58 3.28 May 0.02 0.03 0.13 0.75 1.22 1.84 1.82 1.71 0.08 0.41 1.95 3.62 June 0.03 0.11 0.30 1.05 1.54 2.14 2.11 1.84 0.27 0.73 2.35 3.78 July 0.01 0.04 0.18 0.88 1.36 1.95 1.95 1.77 0.14 0.54 2.14 3.59 Aug. 0.02 0.09 0.27 1.06 1.58 2.17 2.16 1.90 0.23 0.71 2.43 3.78 Sep. 0.02 0.07 0.22 0.94 1.45 2.05 2.03 1.84 0.17 0.60 2.25 3.74 Oct. 0.05 0.05 0.15 0.82 1.32 1.95 1.90 1.80 0.09 0.45 2.10 3.74 Nov. 0.08 0.05 0.14 0.82 1.34 1.99 1.91 1.84 0.08 0.43 2.14 3.79 Dec. 0.08 0.09 0.25 1.07 1.62 2.24 2.16 1.99 0.18 0.67 2.53 3.88
C25 Euro area spot yield curves 2)
(percentages per annum; end of period)
C26 Euro area spot rates and spreads 2)
(daily data; rates in percentages per annum; spreads in percentage points)
-0.5
0.0
0.5
1.0
1.5
2.0
2.5
3.0
3.5
4.0
0 5yrs 10yrs 15yrs 20yrs 25yrs 30yrs
December 2013November 2013October 2013
-0.5
0.0
0.5
1.0
1.5
2.0
2.5
3.0
3.5
4.0
Q3 Q4 Q1 Q2 Q3 Q4 Q1 Q2 Q3 Q42012 2013
1-year rate10-year ratespread between 10-year and 3-month ratesspread between 10-year and 2-year rates
Sources: ECB calculations based on underlying data provided by EuroMTS and ratings provided by Fitch Ratings.1) Data refer to the changing composition of the euro area. For further information, see the General Notes.2) Data cover AAA-rated euro area central government bonds.
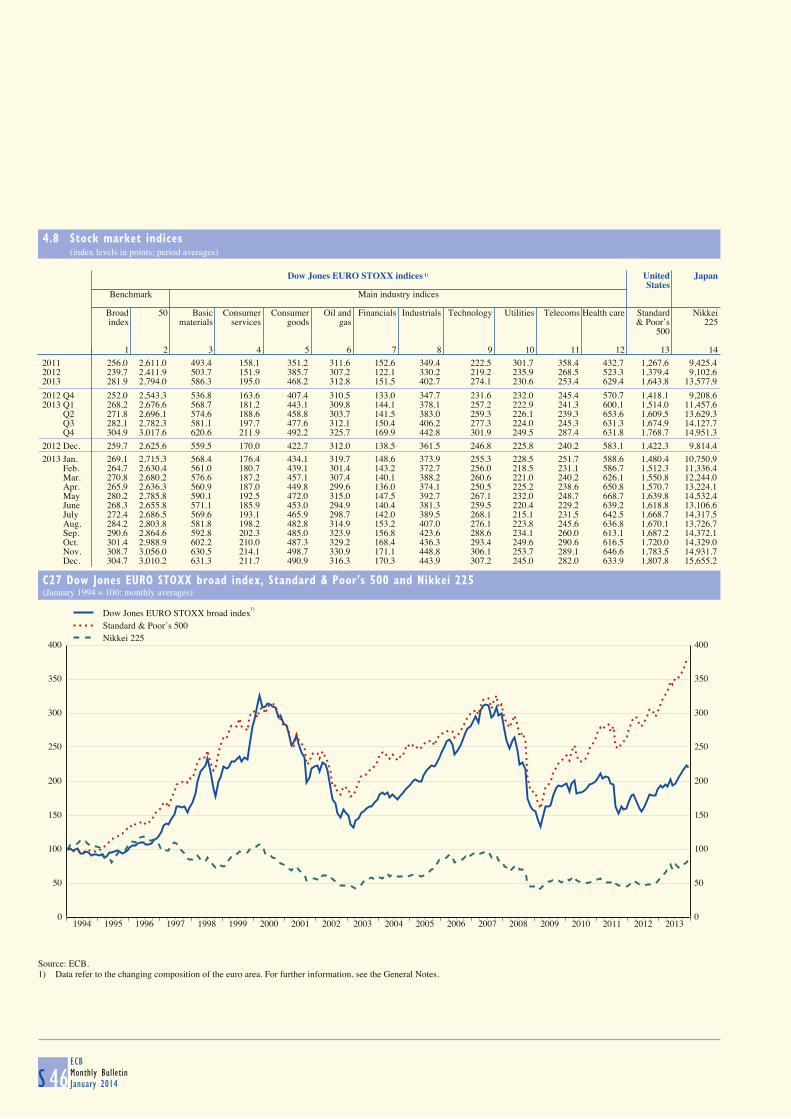
4.8 Stock market indices (index levels in points; period averages)
S 46ECBMonthly BulletinJanuary 2014
Dow Jones EURO STOXX indices 1) United Japan
States Benchmark Main industry indices
Broad 50 Basic Consumer Consumer Oil and Financials Industrials Technology Utilities Telecoms Health care Standard Nikkeiindex materials services goods gas & Poor’s 225
500
1 2 3 4 5 6 7 8 9 10 11 12 13 14
2011 256.0 2,611.0 493.4 158.1 351.2 311.6 152.6 349.4 222.5 301.7 358.4 432.7 1,267.6 9,425.42012 239.7 2,411.9 503.7 151.9 385.7 307.2 122.1 330.2 219.2 235.9 268.5 523.3 1,379.4 9,102.62013 281.9 2,794.0 586.3 195.0 468.2 312.8 151.5 402.7 274.1 230.6 253.4 629.4 1,643.8 13,577.9
2012 Q4 252.0 2,543.3 536.8 163.6 407.4 310.5 133.0 347.7 231.6 232.0 245.4 570.7 1,418.1 9,208.62013 Q1 268.2 2,676.6 568.7 181.2 443.1 309.8 144.1 378.1 257.2 222.9 241.3 600.1 1,514.0 11,457.6 Q2 271.8 2,696.1 574.6 188.6 458.8 303.7 141.5 383.0 259.3 226.1 239.3 653.6 1,609.5 13,629.3 Q3 282.1 2,782.3 581.1 197.7 477.6 312.1 150.4 406.2 277.3 224.0 245.3 631.3 1,674.9 14,127.7 Q4 304.9 3,017.6 620.6 211.9 492.2 325.7 169.9 442.8 301.9 249.5 287.4 631.8 1,768.7 14,951.3
2012 Dec. 259.7 2,625.6 559.5 170.0 422.7 312.0 138.5 361.5 246.8 225.8 240.2 583.1 1,422.3 9,814.4
2013 Jan. 269.1 2,715.3 568.4 176.4 434.1 319.7 148.6 373.9 255.3 228.5 251.7 588.6 1,480.4 10,750.9 Feb. 264.7 2,630.4 561.0 180.7 439.1 301.4 143.2 372.7 256.0 218.5 231.1 586.7 1,512.3 11,336.4 Mar. 270.8 2,680.2 576.6 187.2 457.1 307.4 140.1 388.2 260.6 221.0 240.2 626.1 1,550.8 12,244.0 Apr. 265.9 2,636.3 560.9 187.0 449.8 299.6 136.0 374.1 250.5 225.2 238.6 650.8 1,570.7 13,224.1 May 280.2 2,785.8 590.1 192.5 472.0 315.0 147.5 392.7 267.1 232.0 248.7 668.7 1,639.8 14,532.4 June 268.3 2,655.8 571.1 185.9 453.0 294.9 140.4 381.3 259.5 220.4 229.2 639.2 1,618.8 13,106.6 July 272.4 2,686.5 569.6 193.1 465.9 298.7 142.0 389.5 268.1 215.1 231.5 642.5 1,668.7 14,317.5 Aug. 284.2 2,803.8 581.8 198.2 482.8 314.9 153.2 407.0 276.1 223.8 245.6 636.8 1,670.1 13,726.7 Sep. 290.6 2,864.6 592.8 202.3 485.0 323.9 156.8 423.6 288.6 234.1 260.0 613.1 1,687.2 14,372.1 Oct. 301.4 2,988.9 602.2 210.0 487.3 329.2 168.4 436.3 293.4 249.6 290.6 616.5 1,720.0 14,329.0 Nov. 308.7 3,056.0 630.5 214.1 498.7 330.9 171.1 448.8 306.1 253.7 289.1 646.6 1,783.5 14,931.7 Dec. 304.7 3,010.2 631.3 211.7 490.9 316.3 170.3 443.9 307.2 245.0 282.0 633.9 1,807.8 15,655.2
C27 Dow Jones EURO STOXX broad index, Standard & Poor's 500 and Nikkei 225
(January 1994 = 100; monthly averages)
0
50
100
150
200
250
300
350
400
1994 1995 1996 1997 1998 1999 2000 2001 2002 2003 2004 2005 2006 2007 2008 2009 2010 2011 2012 20130
50
100
150
200
250
300
350
400
Dow Jones EURO STOXX broad indexStandard & Poor’s 500Nikkei 225
Source: ECB.1) Data refer to the changing composition of the euro area. For further information, see the General Notes.
1)
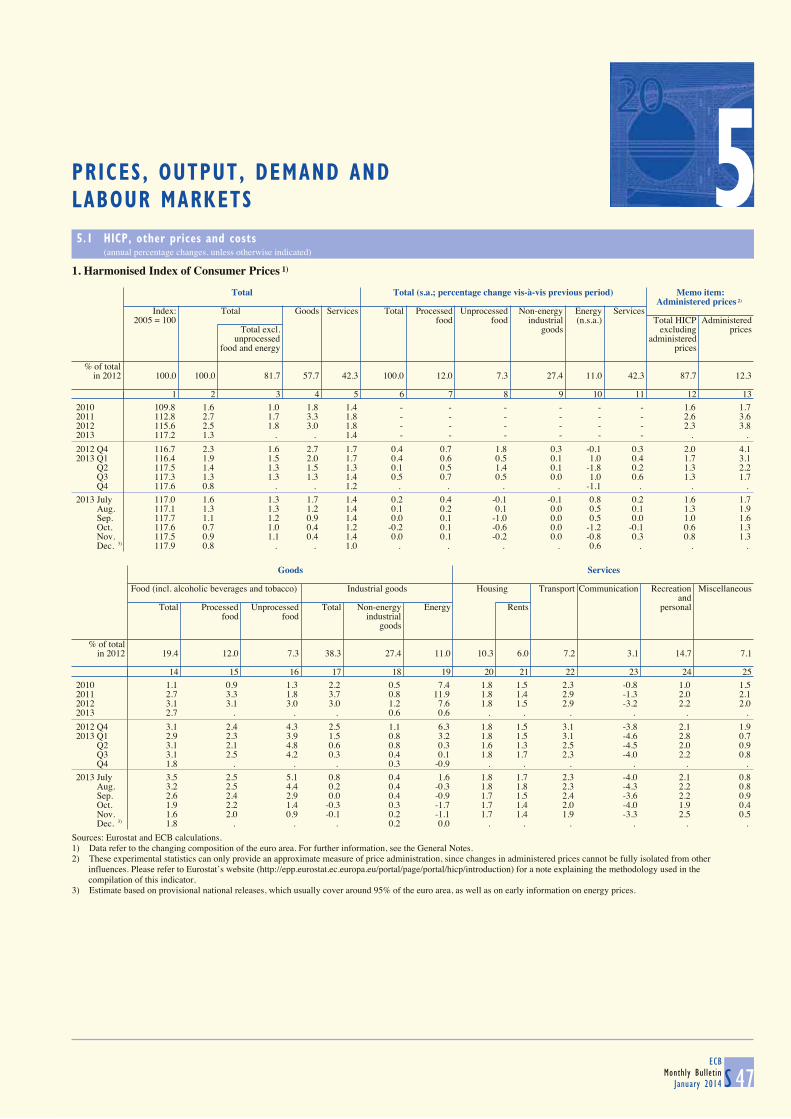
LABOUR MARKETS 5PRICES, OUTPUT, DEMAND AND
5.1 HICP, other prices and costs (annual percentage changes, unless otherwise indicated)
S 47ECB
Monthly BulletinJanuary 2014
1. Harmonised Index of Consumer Prices 1)
Total Total (s.a.; percentage change vis-à-vis previous period) Memo item: Administered prices 2)
Index: Total Goods Services Total Processed Unprocessed Non-energy Energy Services2005 = 100 food food industrial (n.s.a.) Total HICP Administered
Total excl. goods excluding pricesunprocessed administered
food and energy prices
% of totalin 2012 100.0 100.0 81.7 57.7 42.3 100.0 12.0 7.3 27.4 11.0 42.3 87.7 12.3
1 2 3 4 5 6 7 8 9 10 11 12 13
2010 109.8 1.6 1.0 1.8 1.4 - - - - - - 1.6 1.72011 112.8 2.7 1.7 3.3 1.8 - - - - - - 2.6 3.62012 115.6 2.5 1.8 3.0 1.8 - - - - - - 2.3 3.82013 117.2 1.3 . . 1.4 - - - - - - . .
2012 Q4 116.7 2.3 1.6 2.7 1.7 0.4 0.7 1.8 0.3 -0.1 0.3 2.0 4.12013 Q1 116.4 1.9 1.5 2.0 1.7 0.4 0.6 0.5 0.1 1.0 0.4 1.7 3.1 Q2 117.5 1.4 1.3 1.5 1.3 0.1 0.5 1.4 0.1 -1.8 0.2 1.3 2.2 Q3 117.3 1.3 1.3 1.3 1.4 0.5 0.7 0.5 0.0 1.0 0.6 1.3 1.7 Q4 117.6 0.8 . . 1.2 . . . . -1.1 . . .
2013 July 117.0 1.6 1.3 1.7 1.4 0.2 0.4 -0.1 -0.1 0.8 0.2 1.6 1.7 Aug. 117.1 1.3 1.3 1.2 1.4 0.1 0.2 0.1 0.0 0.5 0.1 1.3 1.9 Sep. 117.7 1.1 1.2 0.9 1.4 0.0 0.1 -1.0 0.0 0.5 0.0 1.0 1.6 Oct. 117.6 0.7 1.0 0.4 1.2 -0.2 0.1 -0.6 0.0 -1.2 -0.1 0.6 1.3 Nov. 117.5 0.9 1.1 0.4 1.4 0.0 0.1 -0.2 0.0 -0.8 0.3 0.8 1.3 Dec. 3) 117.9 0.8 . . 1.0 . . . . 0.6 . . .
Goods Services
Food (incl. alcoholic beverages and tobacco) Industrial goods Housing Transport Communication Recreation Miscellaneous
andTotal Processed Unprocessed Total Non-energy Energy Rents personal
food food industrialgoods
% of totalin 2012 19.4 12.0 7.3 38.3 27.4 11.0 10.3 6.0 7.2 3.1 14.7 7.1
14 15 16 17 18 19 20 21 22 23 24 25
2010 1.1 0.9 1.3 2.2 0.5 7.4 1.8 1.5 2.3 -0.8 1.0 1.52011 2.7 3.3 1.8 3.7 0.8 11.9 1.8 1.4 2.9 -1.3 2.0 2.12012 3.1 3.1 3.0 3.0 1.2 7.6 1.8 1.5 2.9 -3.2 2.2 2.02013 2.7 . . . 0.6 0.6 . . . . . .
2012 Q4 3.1 2.4 4.3 2.5 1.1 6.3 1.8 1.5 3.1 -3.8 2.1 1.92013 Q1 2.9 2.3 3.9 1.5 0.8 3.2 1.8 1.5 3.1 -4.6 2.8 0.7 Q2 3.1 2.1 4.8 0.6 0.8 0.3 1.6 1.3 2.5 -4.5 2.0 0.9 Q3 3.1 2.5 4.2 0.3 0.4 0.1 1.8 1.7 2.3 -4.0 2.2 0.8 Q4 1.8 . . . 0.3 -0.9 . . . . . .
2013 July 3.5 2.5 5.1 0.8 0.4 1.6 1.8 1.7 2.3 -4.0 2.1 0.8 Aug. 3.2 2.5 4.4 0.2 0.4 -0.3 1.8 1.8 2.3 -4.3 2.2 0.8 Sep. 2.6 2.4 2.9 0.0 0.4 -0.9 1.7 1.5 2.4 -3.6 2.2 0.9 Oct. 1.9 2.2 1.4 -0.3 0.3 -1.7 1.7 1.4 2.0 -4.0 1.9 0.4 Nov. 1.6 2.0 0.9 -0.1 0.2 -1.1 1.7 1.4 1.9 -3.3 2.5 0.5 Dec. 3) 1.8 . . . 0.2 0.0 . . . . . .
Sources: Eurostat and ECB calculations.1) Data refer to the changing composition of the euro area. For further information, see the General Notes.2) These experimental statistics can only provide an approximate measure of price administration, since changes in administered prices cannot be fully isolated from other influences. Please refer to Eurostat’s website (http://epp.eurostat.ec.europa.eu/portal/page/portal/hicp/introduction) for a note explaining the methodology used in the compilation of this indicator.3) Estimate based on provisional national releases, which usually cover around 95% of the euro area, as well as on early information on energy prices.
5
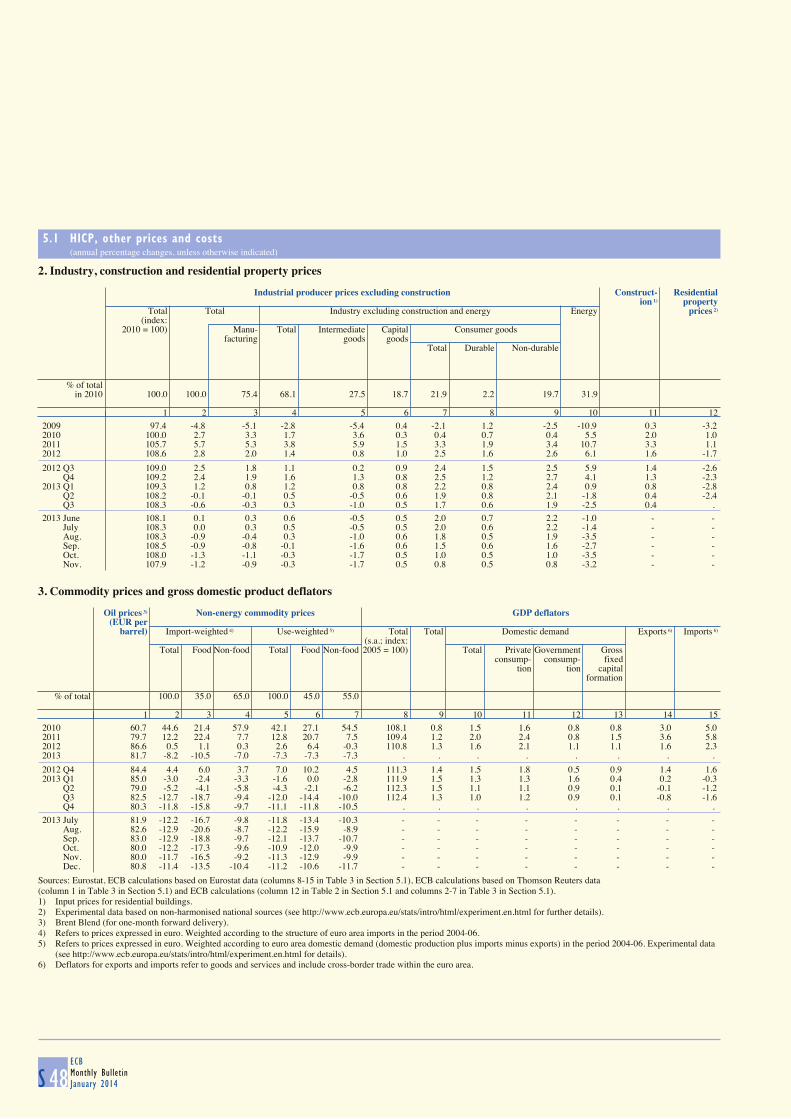
5.1 HICP, other prices and costs (annual percentage changes, unless otherwise indicated)
S 48ECBMonthly BulletinJanuary 2014
2. Industry, construction and residential property prices
Industrial producer prices excluding construction Construct- Residential
ion 1) propertyTotal Total Industry excluding construction and energy Energy prices 2)
(index: 2010 = 100) Manu- Total Intermediate Capital Consumer goods
facturing goods goodsTotal Durable Non-durable
% of totalin 2010 100.0 100.0 75.4 68.1 27.5 18.7 21.9 2.2 19.7 31.9
1 2 3 4 5 6 7 8 9 10 11 12
2009 97.4 -4.8 -5.1 -2.8 -5.4 0.4 -2.1 1.2 -2.5 -10.9 0.3 -3.22010 100.0 2.7 3.3 1.7 3.6 0.3 0.4 0.7 0.4 5.5 2.0 1.02011 105.7 5.7 5.3 3.8 5.9 1.5 3.3 1.9 3.4 10.7 3.3 1.12012 108.6 2.8 2.0 1.4 0.8 1.0 2.5 1.6 2.6 6.1 1.6 -1.7
2012 Q3 109.0 2.5 1.8 1.1 0.2 0.9 2.4 1.5 2.5 5.9 1.4 -2.6 Q4 109.2 2.4 1.9 1.6 1.3 0.8 2.5 1.2 2.7 4.1 1.3 -2.32013 Q1 109.3 1.2 0.8 1.2 0.8 0.8 2.2 0.8 2.4 0.9 0.8 -2.8 Q2 108.2 -0.1 -0.1 0.5 -0.5 0.6 1.9 0.8 2.1 -1.8 0.4 -2.4 Q3 108.3 -0.6 -0.3 0.3 -1.0 0.5 1.7 0.6 1.9 -2.5 0.4 .
2013 June 108.1 0.1 0.3 0.6 -0.5 0.5 2.0 0.7 2.2 -1.0 - - July 108.3 0.0 0.3 0.5 -0.5 0.5 2.0 0.6 2.2 -1.4 - - Aug. 108.3 -0.9 -0.4 0.3 -1.0 0.6 1.8 0.5 1.9 -3.5 - - Sep. 108.5 -0.9 -0.8 -0.1 -1.6 0.6 1.5 0.6 1.6 -2.7 - - Oct. 108.0 -1.3 -1.1 -0.3 -1.7 0.5 1.0 0.5 1.0 -3.5 - - Nov. 107.9 -1.2 -0.9 -0.3 -1.7 0.5 0.8 0.5 0.8 -3.2 - -
3. Commodity prices and gross domestic product deflators
Oil prices 3) Non-energy commodity prices GDP deflators
(EUR per barrel) Import-weighted 4) Use-weighted 5) Total Total Domestic demand Exports 6) Imports 6)
(s.a.; index:Total Food Non-food Total Food Non-food 2005 = 100) Total Private Government Gross
consump- consump- fixedtion tion capital
formation
% of total 100.0 35.0 65.0 100.0 45.0 55.0
1 2 3 4 5 6 7 8 9 10 11 12 13 14 15
2010 60.7 44.6 21.4 57.9 42.1 27.1 54.5 108.1 0.8 1.5 1.6 0.8 0.8 3.0 5.02011 79.7 12.2 22.4 7.7 12.8 20.7 7.5 109.4 1.2 2.0 2.4 0.8 1.5 3.6 5.82012 86.6 0.5 1.1 0.3 2.6 6.4 -0.3 110.8 1.3 1.6 2.1 1.1 1.1 1.6 2.32013 81.7 -8.2 -10.5 -7.0 -7.3 -7.3 -7.3 . . . . . . . .
2012 Q4 84.4 4.4 6.0 3.7 7.0 10.2 4.5 111.3 1.4 1.5 1.8 0.5 0.9 1.4 1.62013 Q1 85.0 -3.0 -2.4 -3.3 -1.6 0.0 -2.8 111.9 1.5 1.3 1.3 1.6 0.4 0.2 -0.3 Q2 79.0 -5.2 -4.1 -5.8 -4.3 -2.1 -6.2 112.3 1.5 1.1 1.1 0.9 0.1 -0.1 -1.2 Q3 82.5 -12.7 -18.7 -9.4 -12.0 -14.4 -10.0 112.4 1.3 1.0 1.2 0.9 0.1 -0.8 -1.6 Q4 80.3 -11.8 -15.8 -9.7 -11.1 -11.8 -10.5 . . . . . . . .
2013 July 81.9 -12.2 -16.7 -9.8 -11.8 -13.4 -10.3 - - - - - - - - Aug. 82.6 -12.9 -20.6 -8.7 -12.2 -15.9 -8.9 - - - - - - - - Sep. 83.0 -12.9 -18.8 -9.7 -12.1 -13.7 -10.7 - - - - - - - - Oct. 80.0 -12.2 -17.3 -9.6 -10.9 -12.0 -9.9 - - - - - - - - Nov. 80.0 -11.7 -16.5 -9.2 -11.3 -12.9 -9.9 - - - - - - - - Dec. 80.8 -11.4 -13.5 -10.4 -11.2 -10.6 -11.7 - - - - - - - -
Sources: Eurostat, ECB calculations based on Eurostat data (columns 8-15 in Table 3 in Section 5.1), ECB calculations based on Thomson Reuters data (column 1 in Table 3 in Section 5.1) and ECB calculations (column 12 in Table 2 in Section 5.1 and columns 2-7 in Table 3 in Section 5.1).1) Input prices for residential buildings.2) Experimental data based on non-harmonised national sources (see http://www.ecb.europa.eu/stats/intro/html/experiment.en.html for further details).3) Brent Blend (for one-month forward delivery).4) Refers to prices expressed in euro. Weighted according to the structure of euro area imports in the period 2004-06.5) Refers to prices expressed in euro. Weighted according to euro area domestic demand (domestic production plus imports minus exports) in the period 2004-06. Experimental data
(see http://www.ecb.europa.eu/stats/intro/html/experiment.en.html for details).6) Deflators for exports and imports refer to goods and services and include cross-border trade within the euro area.
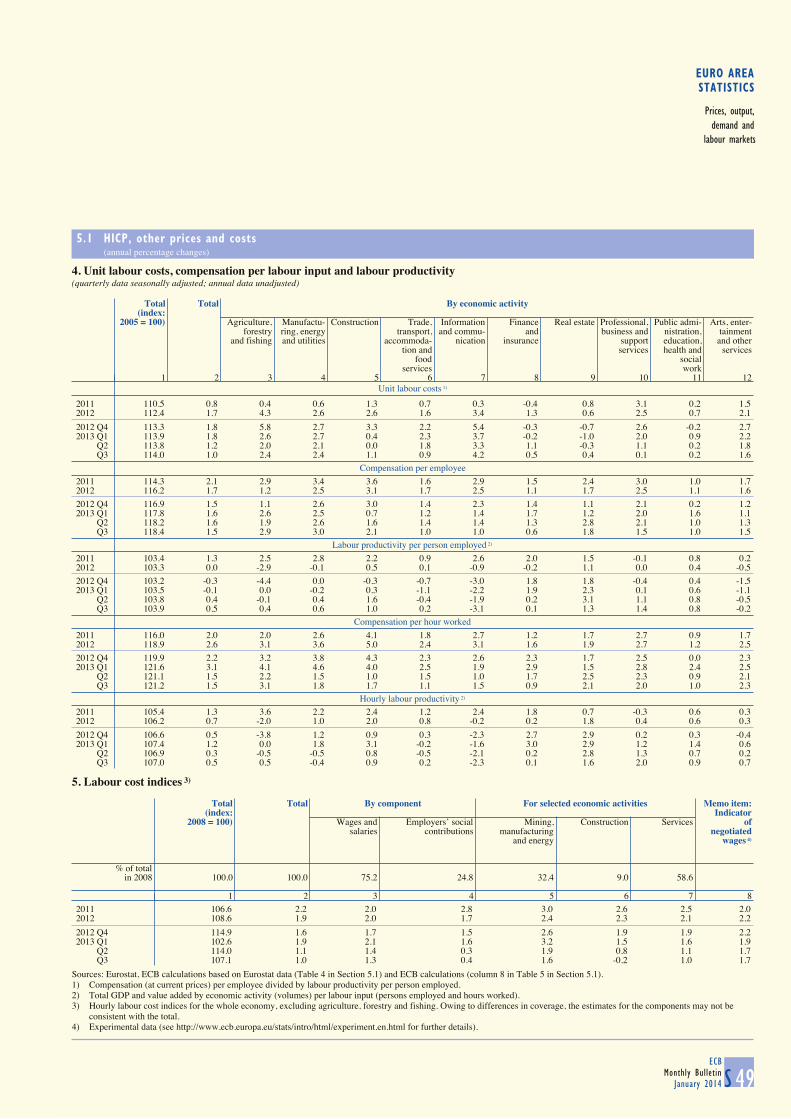
EURO AREASTATISTICS
Prices, output,demand and
labour markets
5.1 HICP, other prices and costs (annual percentage changes)
S 49ECB
Monthly BulletinJanuary 2014
4. Unit labour costs, compensation per labour input and labour productivity(quarterly data seasonally adjusted; annual data unadjusted)
Unit labour costs 1)
Total Total By economic activity
(index:2005 = 100) Agriculture, Manufactu- Construction Trade, Information Finance Real estate Professional, Public admi- Arts, enter-
forestry ring, energy transport, and commu- and business and nistration, tainmentand fishing and utilities accommoda- nication insurance support education, and other
tion and services health and servicesfood social
services work1 2 3 4 5 6 7 8 9 10 11 12
2011 110.5 0.8 0.4 0.6 1.3 0.7 0.3 -0.4 0.8 3.1 0.2 1.52012 112.4 1.7 4.3 2.6 2.6 1.6 3.4 1.3 0.6 2.5 0.7 2.1
2012 Q4 113.3 1.8 5.8 2.7 3.3 2.2 5.4 -0.3 -0.7 2.6 -0.2 2.72013 Q1 113.9 1.8 2.6 2.7 0.4 2.3 3.7 -0.2 -1.0 2.0 0.9 2.2 Q2 113.8 1.2 2.0 2.1 0.0 1.8 3.3 1.1 -0.3 1.1 0.2 1.8 Q3 114.0 1.0 2.4 2.4 1.1 0.9 4.2 0.5 0.4 0.1 0.2 1.6
Compensation per employee
2011 114.3 2.1 2.9 3.4 3.6 1.6 2.9 1.5 2.4 3.0 1.0 1.72012 116.2 1.7 1.2 2.5 3.1 1.7 2.5 1.1 1.7 2.5 1.1 1.6
2012 Q4 116.9 1.5 1.1 2.6 3.0 1.4 2.3 1.4 1.1 2.1 0.2 1.22013 Q1 117.8 1.6 2.6 2.5 0.7 1.2 1.4 1.7 1.2 2.0 1.6 1.1 Q2 118.2 1.6 1.9 2.6 1.6 1.4 1.4 1.3 2.8 2.1 1.0 1.3 Q3 118.4 1.5 2.9 3.0 2.1 1.0 1.0 0.6 1.8 1.5 1.0 1.5
Labour productivity per person employed 2)
2011 103.4 1.3 2.5 2.8 2.2 0.9 2.6 2.0 1.5 -0.1 0.8 0.22012 103.3 0.0 -2.9 -0.1 0.5 0.1 -0.9 -0.2 1.1 0.0 0.4 -0.5
2012 Q4 103.2 -0.3 -4.4 0.0 -0.3 -0.7 -3.0 1.8 1.8 -0.4 0.4 -1.52013 Q1 103.5 -0.1 0.0 -0.2 0.3 -1.1 -2.2 1.9 2.3 0.1 0.6 -1.1 Q2 103.8 0.4 -0.1 0.4 1.6 -0.4 -1.9 0.2 3.1 1.1 0.8 -0.5 Q3 103.9 0.5 0.4 0.6 1.0 0.2 -3.1 0.1 1.3 1.4 0.8 -0.2
Compensation per hour worked
2011 116.0 2.0 2.0 2.6 4.1 1.8 2.7 1.2 1.7 2.7 0.9 1.72012 118.9 2.6 3.1 3.6 5.0 2.4 3.1 1.6 1.9 2.7 1.2 2.5
2012 Q4 119.9 2.2 3.2 3.8 4.3 2.3 2.6 2.3 1.7 2.5 0.0 2.32013 Q1 121.6 3.1 4.1 4.6 4.0 2.5 1.9 2.9 1.5 2.8 2.4 2.5 Q2 121.1 1.5 2.2 1.5 1.0 1.5 1.0 1.7 2.5 2.3 0.9 2.1 Q3 121.2 1.5 3.1 1.8 1.7 1.1 1.5 0.9 2.1 2.0 1.0 2.3
Hourly labour productivity 2)
2011 105.4 1.3 3.6 2.2 2.4 1.2 2.4 1.8 0.7 -0.3 0.6 0.32012 106.2 0.7 -2.0 1.0 2.0 0.8 -0.2 0.2 1.8 0.4 0.6 0.3
2012 Q4 106.6 0.5 -3.8 1.2 0.9 0.3 -2.3 2.7 2.9 0.2 0.3 -0.42013 Q1 107.4 1.2 0.0 1.8 3.1 -0.2 -1.6 3.0 2.9 1.2 1.4 0.6 Q2 106.9 0.3 -0.5 -0.5 0.8 -0.5 -2.1 0.2 2.8 1.3 0.7 0.2 Q3 107.0 0.5 0.5 -0.4 0.9 0.2 -2.3 0.1 1.6 2.0 0.9 0.7
5. Labour cost indices 3)
Total Total By component For selected economic activities Memo item:
(index: Indicator2008 = 100) Wages and Employers’ social Mining, Construction Services of
salaries contributions manufacturing negotiatedand energy wages 4)
% of totalin 2008 100.0 100.0 75.2 24.8 32.4 9.0 58.6
1 2 3 4 5 6 7 8
2011 106.6 2.2 2.0 2.8 3.0 2.6 2.5 2.02012 108.6 1.9 2.0 1.7 2.4 2.3 2.1 2.2
2012 Q4 114.9 1.6 1.7 1.5 2.6 1.9 1.9 2.22013 Q1 102.6 1.9 2.1 1.6 3.2 1.5 1.6 1.9 Q2 114.0 1.1 1.4 0.3 1.9 0.8 1.1 1.7 Q3 107.1 1.0 1.3 0.4 1.6 -0.2 1.0 1.7
Sources: Eurostat, ECB calculations based on Eurostat data (Table 4 in Section 5.1) and ECB calculations (column 8 in Table 5 in Section 5.1).1) Compensation (at current prices) per employee divided by labour productivity per person employed.2) Total GDP and value added by economic activity (volumes) per labour input (persons employed and hours worked).3) Hourly labour cost indices for the whole economy, excluding agriculture, forestry and fishing. Owing to differences in coverage, the estimates for the components may not be
consistent with the total.4) Experimental data (see http://www.ecb.europa.eu/stats/intro/html/experiment.en.html for further details).

5.2 Output and demand (quarterly data seasonally adjusted; annual data unadjusted)
S 50ECBMonthly BulletinJanuary 2014
1. GDP and expenditure components
Current prices (EUR billions)
GDP
Total Domestic demand External balance 1)
Total Private Government Gross fixed Changes in Total Exports 1) Imports 1)
consumption consumption capital inventories 2)
formation
1 2 3 4 5 6 7 8 9
2009 8,921.5 8,804.3 5,135.4 1,988.5 1,731.1 -50.8 117.2 3,288.8 3,171.62010 9,167.6 9,046.5 5,271.3 2,016.4 1,737.8 20.9 121.1 3,784.3 3,663.22011 9,424.1 9,294.3 5,414.7 2,029.6 1,792.5 57.5 129.8 4,174.9 4,045.12012 9,483.5 9,235.8 5,449.5 2,040.3 1,738.8 7.2 247.8 4,348.2 4,100.4
2012 Q3 2,374.8 2,306.6 1,361.8 510.8 433.5 0.5 68.1 1,098.0 1,029.9 Q4 2,370.0 2,297.8 1,361.7 510.0 429.1 -3.1 72.2 1,092.3 1,020.12013 Q1 2,377.8 2,301.9 1,364.1 515.9 420.0 1.9 75.9 1,079.3 1,003.4 Q2 2,393.0 2,305.2 1,367.7 516.2 420.4 0.9 87.8 1,098.8 1,011.0 Q3 2,397.1 2,316.9 1,372.8 518.1 423.0 2.9 80.3 1,098.0 1,017.7
percentage of GDP
2012 100.0 97.4 57.5 21.5 18.3 0.1 2.6 - -
Chain-linked volumes (prices for the previous year)
quarter-on-quarter percentage changes
2012 Q3 -0.1 -0.4 -0.1 -0.2 -0.6 - - 0.7 0.3 Q4 -0.5 -0.7 -0.5 0.0 -1.2 - - -0.5 -0.92013 Q1 -0.2 -0.3 -0.1 0.3 -1.9 - - -1.0 -1.2 Q2 0.3 0.0 0.1 0.0 0.2 - - 2.1 1.6 Q3 0.1 0.4 0.1 0.2 0.4 - - 0.2 1.0
annual percentage changes
2009 -4.4 -3.7 -1.0 2.6 -12.8 - - -12.4 -10.92010 2.0 1.2 1.0 0.6 -0.4 - - 11.6 10.02011 1.6 0.7 0.3 -0.1 1.6 - - 6.5 4.52012 -0.7 -2.2 -1.4 -0.5 -4.1 - - 2.5 -1.0
2012 Q3 -0.7 -2.5 -1.6 -0.6 -4.2 - - 2.8 -1.1 Q4 -1.0 -2.3 -1.5 -0.7 -4.8 - - 1.9 -0.82013 Q1 -1.2 -2.1 -1.2 -0.1 -5.6 - - 0.1 -2.0 Q2 -0.6 -1.3 -0.6 0.2 -3.5 - - 1.3 -0.3 Q3 -0.4 -0.5 -0.4 0.6 -2.5 - - 0.8 0.5
contributions to quarter-on-quarter percentage changes in GDP; percentage points
2012 Q3 -0.1 -0.3 -0.1 0.0 -0.1 -0.1 0.2 - - Q4 -0.5 -0.7 -0.3 0.0 -0.2 -0.2 0.1 - - 2013 Q1 -0.2 -0.3 -0.1 0.1 -0.4 0.1 0.1 - - Q2 0.3 0.0 0.1 0.0 0.0 -0.1 0.3 - - Q3 0.1 0.4 0.0 0.0 0.1 0.3 -0.3 - -
contributions to annual percentage changes in GDP; percentage points
2009 -4.4 -3.7 -0.5 0.5 -2.7 -1.0 -0.7 - - 2010 2.0 1.2 0.6 0.1 -0.1 0.6 0.7 - - 2011 1.6 0.7 0.2 0.0 0.3 0.3 0.9 - - 2012 -0.7 -2.2 -0.8 -0.1 -0.8 -0.5 1.5 - -
2012 Q3 -0.7 -2.4 -0.9 -0.1 -0.8 -0.6 1.7 - - Q4 -1.0 -2.2 -0.8 -0.2 -0.9 -0.3 1.2 - - 2013 Q1 -1.2 -2.1 -0.7 0.0 -1.0 -0.3 0.9 - - Q2 -0.6 -1.3 -0.3 0.0 -0.6 -0.4 0.7 - - Q3 -0.4 -0.5 -0.2 0.1 -0.5 0.0 0.2 - -
Sources: Eurostat and ECB calculations.
1) Exports and imports cover goods and services and include cross-border intra-euro area trade. They are not fully consistent with: Section 3.1; Table 1 of Section 7.1; Table 3 of Section 7.2; or Tables 1 or 3 of Section 7.5.2) Including acquisitions less disposals of valuables.

EURO AREASTATISTICS
Prices, output,demand and
labour markets
5.2 Output and demand (quarterly data seasonally adjusted; annual data unadjusted)
S 51ECB
Monthly BulletinJanuary 2014
2. Value added by economic activity
Current prices (EUR billions)
Gross value added (basic prices) Taxes less
subsidiesTotal Agriculture, Manufactu- Construction Trade, Information Finance Real estate Professional, Public admi- Arts, enter- on
forestry ring, energy transport, and commu- and business and nistration, tainment productsand fishing and utilities accommoda- nication insurance support education, and other
tion and services health and servicesfood services social work
1 2 3 4 5 6 7 8 9 10 11 12
2009 8,028.1 124.0 1,464.6 530.2 1,532.5 369.9 421.2 902.8 806.2 1,581.8 294.8 893.32010 8,226.0 136.3 1,578.8 498.3 1,547.7 370.1 438.2 917.6 826.3 1,612.6 300.2 941.62011 8,451.6 141.1 1,639.8 501.0 1,589.1 373.7 439.5 963.9 858.4 1,637.5 307.6 972.52012 8,506.2 143.4 1,639.9 490.5 1,601.3 369.1 433.2 980.4 876.3 1,658.9 313.2 977.3
2012 Q3 2,130.3 35.9 412.3 122.2 400.5 92.3 107.2 245.6 219.9 415.8 78.6 244.5 Q4 2,126.9 36.5 409.1 120.9 401.7 91.1 107.5 247.5 220.0 413.8 78.9 243.12013 Q1 2,133.8 35.7 409.7 119.8 401.4 90.0 109.1 248.2 220.7 420.2 79.1 244.0 Q2 2,144.2 35.9 412.9 119.2 403.6 89.5 109.9 249.9 223.3 420.6 79.4 248.8 Q3 2,150.4 34.9 413.2 119.6 406.4 88.8 109.3 252.1 224.4 421.4 80.4 246.7
percentage of value added
2012 100.0 1.7 19.3 5.8 18.8 4.3 5.1 11.5 10.3 19.5 3.7 -
Chain-linked volumes (prices for the previous year)
quarter-on-quarter percentage changes
2012 Q3 -0.1 -1.4 0.0 -1.1 -0.6 0.1 0.0 0.3 0.3 0.0 0.1 -0.3 Q4 -0.5 0.0 -1.6 -1.7 -0.9 -1.1 1.0 0.4 -0.3 0.4 0.2 -1.02013 Q1 -0.2 0.3 0.0 -1.3 -0.4 -0.6 -0.9 -0.1 0.6 -0.1 -0.4 -0.3 Q2 0.3 -0.3 0.5 -0.4 0.5 -0.1 -0.9 0.4 0.9 0.2 -0.1 0.5 Q3 0.1 -0.3 0.0 0.0 0.2 -0.8 0.5 0.2 0.2 0.2 0.1 -0.1
annual percentage changes
2009 -4.5 1.2 -12.9 -8.0 -5.1 2.8 0.4 0.4 -7.9 1.5 -0.6 -4.22010 2.0 -3.0 9.5 -5.7 0.7 1.8 0.2 -0.2 2.3 1.3 0.4 1.42011 1.8 0.4 3.0 -1.6 1.7 3.9 1.5 2.1 2.4 1.1 0.3 0.12012 -0.5 -4.8 -1.1 -4.2 -0.8 0.3 -0.6 0.6 0.7 0.1 0.1 -1.9
2012 Q3 -0.6 -6.3 -0.8 -3.8 -1.1 0.2 -0.7 0.5 0.8 -0.2 0.1 -1.8 Q4 -0.9 -6.4 -1.4 -5.3 -1.7 -1.4 0.9 0.7 0.0 0.2 -0.2 -2.02013 Q1 -1.0 -3.0 -1.7 -5.3 -2.3 -1.7 0.8 0.7 0.3 0.4 -0.6 -2.6 Q2 -0.5 -1.5 -1.0 -4.5 -1.4 -1.7 -0.8 1.0 1.5 0.5 -0.2 -1.0 Q3 -0.3 -0.4 -1.1 -3.5 -0.6 -2.6 -0.3 0.9 1.4 0.6 -0.2 -0.8
contributions to quarter-on-quarter percentage changes in value added; percentage points
2012 Q3 -0.1 0.0 0.0 -0.1 -0.1 0.0 0.0 0.0 0.0 0.0 0.0 - Q4 -0.5 0.0 -0.3 -0.1 -0.2 0.0 0.1 0.0 0.0 0.1 0.0 - 2013 Q1 -0.2 0.0 0.0 -0.1 -0.1 0.0 0.0 0.0 0.1 0.0 0.0 - Q2 0.3 0.0 0.1 0.0 0.1 0.0 0.0 0.0 0.1 0.0 0.0 - Q3 0.1 0.0 0.0 0.0 0.0 0.0 0.0 0.0 0.0 0.0 0.0 -
contributions to annual percentage changes in value added; percentage points
2009 -4.5 0.0 -2.6 -0.5 -1.0 0.1 0.0 0.0 -0.8 0.3 0.0 - 2010 2.0 0.0 1.7 -0.4 0.1 0.1 0.0 0.0 0.2 0.3 0.0 - 2011 1.8 0.0 0.6 -0.1 0.3 0.2 0.1 0.2 0.2 0.2 0.0 - 2012 -0.5 -0.1 -0.2 -0.3 -0.1 0.0 0.0 0.1 0.1 0.0 0.0 -
2012 Q3 -0.6 -0.1 -0.2 -0.2 -0.2 0.0 0.0 0.1 0.1 0.0 0.0 - Q4 -0.9 -0.1 -0.3 -0.3 -0.3 -0.1 0.0 0.1 0.0 0.0 0.0 - 2013 Q1 -1.0 -0.1 -0.3 -0.3 -0.4 -0.1 0.0 0.1 0.0 0.1 0.0 - Q2 -0.5 0.0 -0.2 -0.3 -0.3 -0.1 0.0 0.1 0.2 0.1 0.0 - Q3 -0.3 0.0 -0.2 -0.2 -0.1 -0.1 0.0 0.1 0.1 0.1 0.0 -
Sources: Eurostat and ECB calculations.

5.2 Output and demand (annual percentage changes, unless otherwise indicated)
S 52ECBMonthly BulletinJanuary 2014
3. Industrial production
Total Industry excluding construction Construction
Total Total Industry excluding construction and energy Energy
(s.a.; index: 2010 = 100) Manu- Total Intermediate Capital Consumer goods
facturing goods goodsTotal Durable Non-durable
% of totalin 2010 100.0 79.4 79.4 68.3 67.7 26.7 23.2 17.8 2.3 15.5 11.7 20.6
1 2 3 4 5 6 7 8 9 10 11 12
2010 4.1 100.0 7.3 7.7 7.7 10.0 9.0 2.8 2.7 2.9 3.9 -7.62011 2.2 103.5 3.4 4.7 4.8 4.1 8.4 1.0 0.7 1.0 -4.4 -2.42012 -3.1 100.9 -2.5 -2.7 -2.8 -4.6 -1.2 -2.4 -4.9 -2.1 -0.4 -5.4
2012 Q4 -3.5 99.3 -3.3 -3.6 -3.8 -5.2 -3.3 -2.1 -5.5 -1.6 -0.5 -4.32013 Q1 -2.8 99.6 -2.2 -2.6 -2.9 -3.6 -3.4 -0.8 -4.7 -0.3 -0.1 -5.9 Q2 -1.5 100.3 -1.0 -0.9 -1.0 -2.0 -0.1 -0.7 -3.9 -0.2 -1.1 -3.7 Q3 -1.1 100.2 -1.1 -1.1 -1.0 -0.8 -1.3 -0.8 -3.8 -0.5 -1.8 -1.1
2013 June -0.7 100.6 -0.2 0.0 0.0 -1.0 1.4 -0.5 -1.7 -0.5 -1.9 -1.9 July -1.8 99.6 -2.0 -2.2 -2.1 -1.5 -3.3 -1.3 -4.4 -0.8 -1.6 -1.6 Aug. -1.2 100.5 -1.5 -1.5 -1.1 -0.8 -0.8 -2.2 -4.2 -2.0 -3.3 -0.9 Sep. -0.1 100.3 0.2 0.2 0.2 -0.1 0.3 0.8 -3.0 1.3 -0.6 -0.7 Oct. -0.1 99.2 0.2 0.6 0.5 1.6 1.2 -1.1 -5.4 -0.6 -3.4 -2.4
month-on-month percentage changes (s.a.)
2013 June 0.8 - 0.7 1.0 1.1 0.5 2.2 0.3 3.7 -0.4 -1.1 1.6 July -0.6 - -1.0 -1.1 -1.1 -0.4 -1.9 -0.8 -1.5 -0.4 -0.5 0.6 Aug. 1.0 - 0.9 1.0 1.6 0.7 1.9 0.5 -0.5 0.4 -0.8 0.2 Sep. -0.6 - -0.2 -0.3 -1.0 -0.4 -0.7 0.3 -1.5 0.3 1.5 -0.5 Oct. -0.8 - -1.1 -0.7 -0.7 0.4 -1.3 -1.4 -2.4 -0.9 -4.0 -1.2
4. Industrial new orders and turnover, retail sales and new passenger car registrations
Indicator on industrial Industrial turnover Retail sales (including automotive fuel) New passenger car
new orders 1) registrations
Manufacturing Manufacturing Current prices Constant prices (current prices)
Total Total Total Total Total Total Total Food, Non-food Fuel Total (s.a.; Total
(s.a.; index: (s.a.; index: (s.a.; index: beverages, thousands) 2)
2010 = 100) 2010 = 100) 2010 = 100) tobacco Textiles, Householdclothing, equipmentfootwear
% of totalin 2010 100.0 100.0 100.0 100.0 100.0 100.0 100.0 40.1 51.1 9.4 11.9 8.8
1 2 3 4 5 6 7 8 9 10 11 12 13 14
2010 100.0 17.7 100.0 10.1 2.1 100.0 0.5 0.4 1.3 2.2 0.2 -3.0 843 -8.52011 108.6 8.6 109.2 9.1 1.7 99.7 -0.3 -1.0 0.5 1.4 -0.2 -3.3 838 -1.12012 104.3 -3.9 108.7 -0.5 0.4 97.9 -1.8 -1.2 -1.7 -4.1 -2.6 -5.2 744 -11.0
2012 Q4 103.0 -2.5 107.3 -1.7 -0.9 96.8 -2.6 -2.0 -2.8 -4.6 -4.3 -5.9 709 -14.12013 Q1 102.5 -2.6 106.9 -2.7 -1.3 97.0 -2.0 -1.6 -2.2 -3.5 -4.6 -3.7 687 -11.3 Q2 103.2 -1.5 106.7 -2.0 -0.3 97.2 -0.8 -1.7 0.0 2.2 -3.0 -0.8 709 -7.2 Q3 105.2 0.9 107.2 -1.6 -0.1 97.6 -0.3 -0.6 0.0 1.8 -2.7 -0.1 706 -2.0
2013 July 103.7 -0.7 106.4 -1.9 0.1 97.5 -0.7 0.1 -1.0 1.2 -3.7 -1.3 703 -0.1 Aug. 105.3 0.2 108.2 -1.9 0.0 98.0 -0.2 -0.6 0.1 3.5 -2.9 -0.4 708 -4.1 Sep. 106.5 3.2 106.9 -1.0 -0.2 97.4 0.0 -1.3 1.0 1.0 -1.4 1.5 706 -2.5 Oct. 104.2 0.6 106.6 -1.2 -0.6 97.0 -0.3 -0.3 -0.7 0.5 -1.7 0.6 723 4.2 Nov. . . . . 1.4 98.3 1.6 1.4 2.4 . . 0.2 732 4.8
month-on-month percentage changes (s.a.)
2013 July - -0.4 - -0.4 0.5 - 0.5 1.1 0.4 0.0 0.3 -0.1 - -1.3 Aug. - 1.5 - 1.6 0.4 - 0.5 -0.2 0.5 1.1 0.2 -0.3 - 0.7 Sep. - 1.1 - -1.2 -0.7 - -0.6 -1.0 0.0 -1.1 0.4 -0.3 - -0.2 Oct. - -2.2 - -0.3 -0.4 - -0.4 0.5 -1.0 -1.6 -1.4 -0.6 - 2.4 Nov. - . - . 1.3 - 1.4 1.1 1.9 . . 0.1 - 1.3
Sources: Eurostat, except columns 1 and 2 in Table 4 (which show ECB experimental statistics based on national data) and columns 13 and 14 in Table 4 (which show ECBcalculations based on data from the European Automobile Manufacturers’ Association).1) For further details, see de Bondt, G.J., Dieden, H.C., Muzikarova, S. and Vincze, I., "Introducing the ECB indicator on euro area industrial new orders", Occasional Paper Series,
No 149, ECB, Frankfurt am Main, June 2013.2) Annual and quarterly figures are averages of monthly figures in the period concerned.
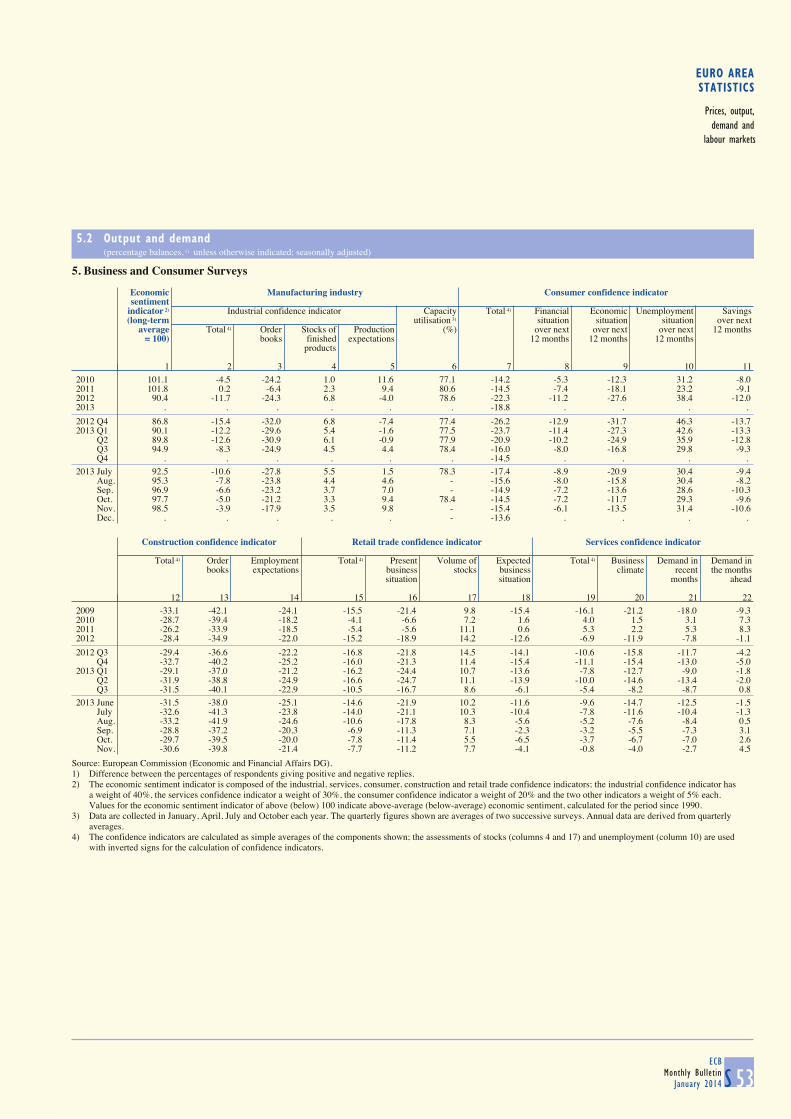
EURO AREASTATISTICS
Prices, output,demand and
labour markets
5.2 Output and demand (percentage balances, 1) unless otherwise indicated; seasonally adjusted)
S 53ECB
Monthly BulletinJanuary 2014
5. Business and Consumer Surveys
Economic Manufacturing industry Consumer confidence indicatorsentiment
indicator 2) Industrial confidence indicator Capacity Total 4) Financial Economic Unemployment Savings(long-term utilisation 3) situation situation situation over next
average Total 4) Order Stocks of Production (%) over next over next over next 12 months= 100) books finished expectations 12 months 12 months 12 months
products
1 2 3 4 5 6 7 8 9 10 11
2010 101.1 -4.5 -24.2 1.0 11.6 77.1 -14.2 -5.3 -12.3 31.2 -8.02011 101.8 0.2 -6.4 2.3 9.4 80.6 -14.5 -7.4 -18.1 23.2 -9.12012 90.4 -11.7 -24.3 6.8 -4.0 78.6 -22.3 -11.2 -27.6 38.4 -12.02013 . . . . . . -18.8 . . . .
2012 Q4 86.8 -15.4 -32.0 6.8 -7.4 77.4 -26.2 -12.9 -31.7 46.3 -13.72013 Q1 90.1 -12.2 -29.6 5.4 -1.6 77.5 -23.7 -11.4 -27.3 42.6 -13.3 Q2 89.8 -12.6 -30.9 6.1 -0.9 77.9 -20.9 -10.2 -24.9 35.9 -12.8 Q3 94.9 -8.3 -24.9 4.5 4.4 78.4 -16.0 -8.0 -16.8 29.8 -9.3 Q4 . . . . . . -14.5 . . . .
2013 July 92.5 -10.6 -27.8 5.5 1.5 78.3 -17.4 -8.9 -20.9 30.4 -9.4 Aug. 95.3 -7.8 -23.8 4.4 4.6 - -15.6 -8.0 -15.8 30.4 -8.2 Sep. 96.9 -6.6 -23.2 3.7 7.0 - -14.9 -7.2 -13.6 28.6 -10.3 Oct. 97.7 -5.0 -21.2 3.3 9.4 78.4 -14.5 -7.2 -11.7 29.3 -9.6 Nov. 98.5 -3.9 -17.9 3.5 9.8 - -15.4 -6.1 -13.5 31.4 -10.6 Dec. . . . . . - -13.6 . . . .
Construction confidence indicator Retail trade confidence indicator Services confidence indicator
Total 4) Order Employment Total 4) Present Volume of Expected Total 4) Business Demand in Demand inbooks expectations business stocks business climate recent the months
situation situation months ahead
12 13 14 15 16 17 18 19 20 21 22
2009 -33.1 -42.1 -24.1 -15.5 -21.4 9.8 -15.4 -16.1 -21.2 -18.0 -9.32010 -28.7 -39.4 -18.2 -4.1 -6.6 7.2 1.6 4.0 1.5 3.1 7.32011 -26.2 -33.9 -18.5 -5.4 -5.6 11.1 0.6 5.3 2.2 5.3 8.32012 -28.4 -34.9 -22.0 -15.2 -18.9 14.2 -12.6 -6.9 -11.9 -7.8 -1.1
2012 Q3 -29.4 -36.6 -22.2 -16.8 -21.8 14.5 -14.1 -10.6 -15.8 -11.7 -4.2 Q4 -32.7 -40.2 -25.2 -16.0 -21.3 11.4 -15.4 -11.1 -15.4 -13.0 -5.02013 Q1 -29.1 -37.0 -21.2 -16.2 -24.4 10.7 -13.6 -7.8 -12.7 -9.0 -1.8 Q2 -31.9 -38.8 -24.9 -16.6 -24.7 11.1 -13.9 -10.0 -14.6 -13.4 -2.0 Q3 -31.5 -40.1 -22.9 -10.5 -16.7 8.6 -6.1 -5.4 -8.2 -8.7 0.8
2013 June -31.5 -38.0 -25.1 -14.6 -21.9 10.2 -11.6 -9.6 -14.7 -12.5 -1.5 July -32.6 -41.3 -23.8 -14.0 -21.1 10.3 -10.4 -7.8 -11.6 -10.4 -1.3 Aug. -33.2 -41.9 -24.6 -10.6 -17.8 8.3 -5.6 -5.2 -7.6 -8.4 0.5 Sep. -28.8 -37.2 -20.3 -6.9 -11.3 7.1 -2.3 -3.2 -5.5 -7.3 3.1 Oct. -29.7 -39.5 -20.0 -7.8 -11.4 5.5 -6.5 -3.7 -6.7 -7.0 2.6 Nov. -30.6 -39.8 -21.4 -7.7 -11.2 7.7 -4.1 -0.8 -4.0 -2.7 4.5
Source: European Commission (Economic and Financial Affairs DG).1) Difference between the percentages of respondents giving positive and negative replies.2) The economic sentiment indicator is composed of the industrial, services, consumer, construction and retail trade confidence indicators; the industrial confidence indicator has
a weight of 40%, the services confidence indicator a weight of 30%, the consumer confidence indicator a weight of 20% and the two other indicators a weight of 5% each.Values for the economic sentiment indicator of above (below) 100 indicate above-average (below-average) economic sentiment, calculated for the period since 1990.
3) Data are collected in January, April, July and October each year. The quarterly figures shown are averages of two successive surveys. Annual data are derived from quarterly averages.
4) The confidence indicators are calculated as simple averages of the components shown; the assessments of stocks (columns 4 and 17) and unemployment (column 10) are used with inverted signs for the calculation of confidence indicators.
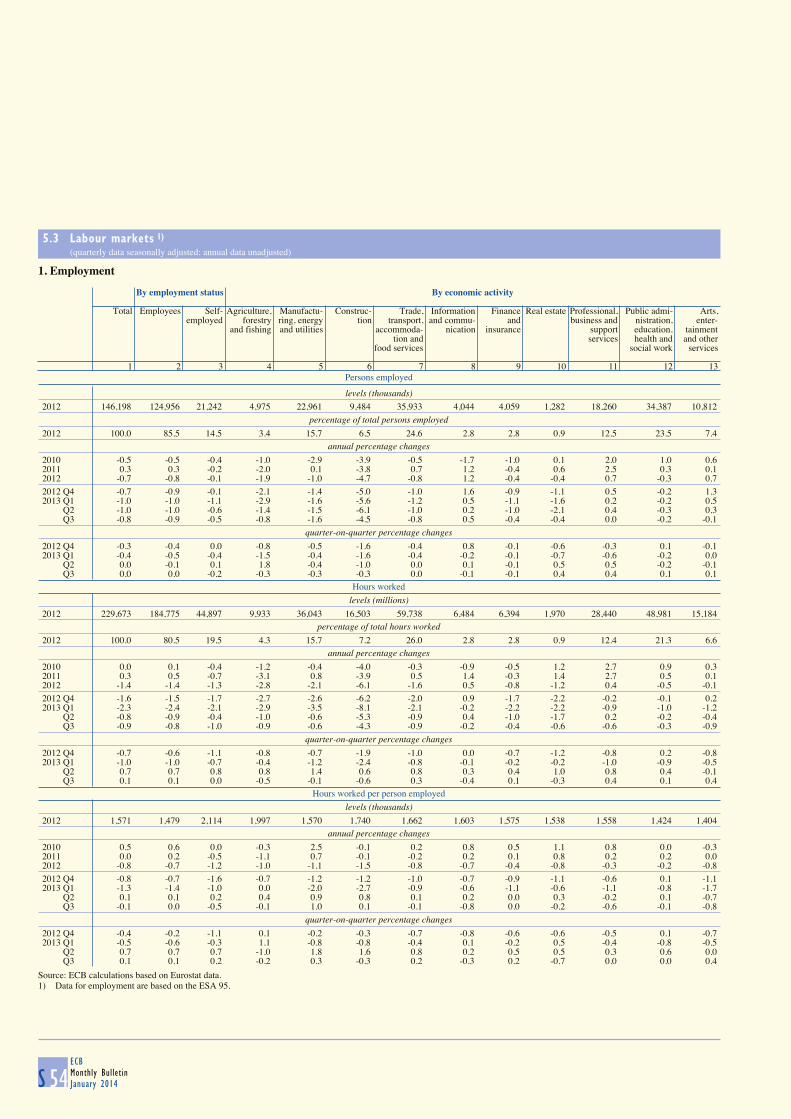
5.3 Labour markets 1)
(quarterly data seasonally adjusted; annual data unadjusted)
S 54ECBMonthly BulletinJanuary 2014
1. Employment
Persons employed
By employment status By economic activity
Total Employees Self- Agriculture, Manufactu- Construc- Trade, Information Finance Real estate Professional, Public admi- Arts,employed forestry ring, energy tion transport, and commu- and business and nistration, enter-
and fishing and utilities accommoda- nication insurance support education, tainmenttion and services health and and other
food services social work services
1 2 3 4 5 6 7 8 9 10 11 12 13
levels (thousands)
2012 146,198 124,956 21,242 4,975 22,961 9,484 35,933 4,044 4,059 1,282 18,260 34,387 10,812
percentage of total persons employed
2012 100.0 85.5 14.5 3.4 15.7 6.5 24.6 2.8 2.8 0.9 12.5 23.5 7.4annual percentage changes
2010 -0.5 -0.5 -0.4 -1.0 -2.9 -3.9 -0.5 -1.7 -1.0 0.1 2.0 1.0 0.62011 0.3 0.3 -0.2 -2.0 0.1 -3.8 0.7 1.2 -0.4 0.6 2.5 0.3 0.12012 -0.7 -0.8 -0.1 -1.9 -1.0 -4.7 -0.8 1.2 -0.4 -0.4 0.7 -0.3 0.7
2012 Q4 -0.7 -0.9 -0.1 -2.1 -1.4 -5.0 -1.0 1.6 -0.9 -1.1 0.5 -0.2 1.32013 Q1 -1.0 -1.0 -1.1 -2.9 -1.6 -5.6 -1.2 0.5 -1.1 -1.6 0.2 -0.2 0.5 Q2 -1.0 -1.0 -0.6 -1.4 -1.5 -6.1 -1.0 0.2 -1.0 -2.1 0.4 -0.3 0.3 Q3 -0.8 -0.9 -0.5 -0.8 -1.6 -4.5 -0.8 0.5 -0.4 -0.4 0.0 -0.2 -0.1
quarter-on-quarter percentage changes
2012 Q4 -0.3 -0.4 0.0 -0.8 -0.5 -1.6 -0.4 0.8 -0.1 -0.6 -0.3 0.1 -0.12013 Q1 -0.4 -0.5 -0.4 -1.5 -0.4 -1.6 -0.4 -0.2 -0.1 -0.7 -0.6 -0.2 0.0 Q2 0.0 -0.1 0.1 1.8 -0.4 -1.0 0.0 0.1 -0.1 0.5 0.5 -0.2 -0.1 Q3 0.0 0.0 -0.2 -0.3 -0.3 -0.3 0.0 -0.1 -0.1 0.4 0.4 0.1 0.1
Hours worked
levels (millions)
2012 229,673 184,775 44,897 9,933 36,043 16,503 59,738 6,484 6,394 1,970 28,440 48,981 15,184percentage of total hours worked
2012 100.0 80.5 19.5 4.3 15.7 7.2 26.0 2.8 2.8 0.9 12.4 21.3 6.6annual percentage changes
2010 0.0 0.1 -0.4 -1.2 -0.4 -4.0 -0.3 -0.9 -0.5 1.2 2.7 0.9 0.32011 0.3 0.5 -0.7 -3.1 0.8 -3.9 0.5 1.4 -0.3 1.4 2.7 0.5 0.12012 -1.4 -1.4 -1.3 -2.8 -2.1 -6.1 -1.6 0.5 -0.8 -1.2 0.4 -0.5 -0.1
2012 Q4 -1.6 -1.5 -1.7 -2.7 -2.6 -6.2 -2.0 0.9 -1.7 -2.2 -0.2 -0.1 0.22013 Q1 -2.3 -2.4 -2.1 -2.9 -3.5 -8.1 -2.1 -0.2 -2.2 -2.2 -0.9 -1.0 -1.2 Q2 -0.8 -0.9 -0.4 -1.0 -0.6 -5.3 -0.9 0.4 -1.0 -1.7 0.2 -0.2 -0.4 Q3 -0.9 -0.8 -1.0 -0.9 -0.6 -4.3 -0.9 -0.2 -0.4 -0.6 -0.6 -0.3 -0.9
quarter-on-quarter percentage changes
2012 Q4 -0.7 -0.6 -1.1 -0.8 -0.7 -1.9 -1.0 0.0 -0.7 -1.2 -0.8 0.2 -0.82013 Q1 -1.0 -1.0 -0.7 -0.4 -1.2 -2.4 -0.8 -0.1 -0.2 -0.2 -1.0 -0.9 -0.5 Q2 0.7 0.7 0.8 0.8 1.4 0.6 0.8 0.3 0.4 1.0 0.8 0.4 -0.1 Q3 0.1 0.1 0.0 -0.5 -0.1 -0.6 0.3 -0.4 0.1 -0.3 0.4 0.1 0.4
Hours worked per person employed
levels (thousands)
2012 1,571 1,479 2,114 1,997 1,570 1,740 1,662 1,603 1,575 1,538 1,558 1,424 1,404annual percentage changes
2010 0.5 0.6 0.0 -0.3 2.5 -0.1 0.2 0.8 0.5 1.1 0.8 0.0 -0.32011 0.0 0.2 -0.5 -1.1 0.7 -0.1 -0.2 0.2 0.1 0.8 0.2 0.2 0.02012 -0.8 -0.7 -1.2 -1.0 -1.1 -1.5 -0.8 -0.7 -0.4 -0.8 -0.3 -0.2 -0.8
2012 Q4 -0.8 -0.7 -1.6 -0.7 -1.2 -1.2 -1.0 -0.7 -0.9 -1.1 -0.6 0.1 -1.12013 Q1 -1.3 -1.4 -1.0 0.0 -2.0 -2.7 -0.9 -0.6 -1.1 -0.6 -1.1 -0.8 -1.7 Q2 0.1 0.1 0.2 0.4 0.9 0.8 0.1 0.2 0.0 0.3 -0.2 0.1 -0.7 Q3 -0.1 0.0 -0.5 -0.1 1.0 0.1 -0.1 -0.8 0.0 -0.2 -0.6 -0.1 -0.8
quarter-on-quarter percentage changes
2012 Q4 -0.4 -0.2 -1.1 0.1 -0.2 -0.3 -0.7 -0.8 -0.6 -0.6 -0.5 0.1 -0.72013 Q1 -0.5 -0.6 -0.3 1.1 -0.8 -0.8 -0.4 0.1 -0.2 0.5 -0.4 -0.8 -0.5 Q2 0.7 0.7 0.7 -1.0 1.8 1.6 0.8 0.2 0.5 0.5 0.3 0.6 0.0 Q3 0.1 0.1 0.2 -0.2 0.3 -0.3 0.2 -0.3 0.2 -0.7 0.0 0.0 0.4
Source: ECB calculations based on Eurostat data.1) Data for employment are based on the ESA 95.

EURO AREASTATISTICS
Prices, output,demand and
labour markets
5.3 Labour markets (seasonally adjusted, unless otherwise indicated)
S 55ECB
Monthly BulletinJanuary 2014
2. Unemployment and job vacancies 1)
Unemployment Job vacancy
rate 2)
Total By age 3) By gender 4)
Millions % of labour Adult Youth Male Femaleforce
Millions % of labour Millions % of labour Millions % of labour Millions % of labour % of totalforce force force force posts
% of totalin 2010 100.0 79.5 20.5 54.0 46.0
1 2 3 4 5 6 7 8 9 10 11
2009 15.052 9.6 11.767 8.4 3.286 20.3 8.145 9.4 6.907 9.8 1.42010 15.934 10.1 12.657 8.9 3.277 20.9 8.603 10.0 7.331 10.3 1.52011 16.030 10.2 12.826 9.0 3.205 20.9 8.540 9.9 7.490 10.5 1.72012 18.060 11.4 14.578 10.1 3.481 23.1 9.693 11.2 8.367 11.6 1.6
2012 Q3 18.318 11.5 14.791 10.3 3.526 23.5 9.833 11.4 8.484 11.7 1.4 Q4 18.774 11.8 15.204 10.6 3.570 23.8 10.060 11.6 8.714 12.0 1.62013 Q1 19.107 12.0 15.532 10.8 3.574 24.0 10.262 11.9 8.845 12.2 1.5 Q2 19.186 12.1 15.656 10.9 3.530 23.9 10.303 11.9 8.883 12.2 1.5 Q3 19.253 12.1 15.728 10.9 3.525 24.0 10.402 12.1 8.850 12.2 .
2013 June 19.187 12.1 15.665 10.9 3.522 23.9 10.331 12.0 8.855 12.2 - July 19.205 12.1 15.694 10.9 3.511 23.9 10.370 12.0 8.835 12.1 - Aug. 19.252 12.1 15.738 10.9 3.514 23.9 10.409 12.1 8.843 12.1 - Sep. 19.301 12.1 15.752 10.9 3.549 24.1 10.427 12.1 8.873 12.2 - Oct. 19.237 12.1 15.668 10.9 3.569 24.2 10.399 12.1 8.838 12.1 - Nov. 19.241 12.1 15.666 10.9 3.575 24.2 10.429 12.1 8.812 12.1 -
C28 Employment - persons employed and hours worked
(annual percentage changes)
C29 Unemployment and job vacancy 2) rates
-5.0
-4.0
-3.0
-2.0
-1.0
0.0
1.0
2.0
2002 2003 2004 2005 2006 2007 2008 2009 2010 2011 2012 2013-5.0
-4.0
-3.0
-2.0
-1.0
0.0
1.0
2.0
employment in terms of persons employedemployment in terms of hours worked
7.0
7.5
8.0
8.5
9.0
9.5
10.0
10.5
11.0
11.5
12.0
12.5
2006 2007 2008 2009 2010 2011 2012 20130.0
0.5
1.0
1.5
2.0
2.5
3.0
3.5
4.0
4.5
5.0
5.5
unemployment rate (left-hand scale)job vacancy rate (right-hand scale)
Source: Eurostat.1) Data for unemployment refer to persons and follow ILO recommendations.2) Industry, construction and services (excluding households as employers and extra-territorial organisations and bodies); non-seasonally adjusted.3) Adult: 25 years of age and over; youth: below 25 years of age; rates are expressed as a percentage of the labour force for the relevant age group.4) Rates are expressed as a percentage of the labour force for the relevant gender.

6 GOVERNMENT FINANCE
6.1 Revenue, expenditure and deficit/surplus 1) (as a percentage of GDP)
S 56ECBMonthly BulletinJanuary 2014
1. Euro area _ revenue
Total Current revenue Capital revenue Memo
item:Direct Indirect Social Sales Capital Fiscaltaxes Households Corporations taxes Received by EU contributions Employers Employees taxes burden 2)
institutions1 2 3 4 5 6 7 8 9 10 11 12 13 14
2004 44.5 44.0 11.5 8.5 2.9 13.2 0.3 15.5 8.1 4.5 2.2 0.5 0.4 40.62005 44.8 44.3 11.7 8.6 3.0 13.3 0.3 15.4 8.1 4.5 2.3 0.5 0.3 40.82006 45.3 45.0 12.3 8.7 3.4 13.4 0.3 15.3 8.0 4.5 2.3 0.3 0.3 41.32007 45.3 45.1 12.7 8.9 3.6 13.3 0.3 15.1 8.0 4.4 2.3 0.3 0.3 41.32008 45.1 44.9 12.5 9.1 3.2 12.9 0.3 15.3 8.1 4.5 2.3 0.2 0.3 40.92009 44.9 44.6 11.6 9.2 2.3 12.8 0.3 15.8 8.3 4.5 2.5 0.3 0.4 40.62010 44.8 44.6 11.6 8.9 2.5 13.0 0.3 15.7 8.2 4.5 2.6 0.3 0.3 40.52011 45.4 45.0 11.9 9.1 2.7 13.0 0.3 15.7 8.2 4.5 2.6 0.3 0.3 40.92012 46.2 46.0 12.4 9.6 2.7 13.3 0.3 15.9 8.3 4.7 2.6 0.2 0.3 41.8
2. Euro area _ expenditure
Total Current expenditure Capital expenditure Memo
item:Total Compensation Intermediate Interest Current Investment Capital Primary
of consumption transfers Social Subsidies transfers Paid by EU expenditure 3)
employees payments Paid by EU institutionsinstitutions
1 2 3 4 5 6 7 8 9 10 11 12 13 14
2004 47.4 43.5 10.5 5.0 3.1 24.9 22.1 1.7 0.5 3.9 2.5 1.5 0.1 44.32005 47.3 43.4 10.5 5.0 3.0 24.9 22.1 1.7 0.5 3.9 2.5 1.4 0.0 44.32006 46.7 42.8 10.3 5.0 2.9 24.6 21.8 1.7 0.5 3.9 2.5 1.4 0.0 43.82007 46.0 42.2 10.1 5.0 3.0 24.2 21.4 1.6 0.4 3.8 2.6 1.2 0.0 43.02008 47.2 43.3 10.3 5.2 3.0 24.8 21.9 1.6 0.4 3.9 2.6 1.3 0.0 44.22009 51.3 47.0 11.1 5.7 2.9 27.4 24.3 1.8 0.4 4.3 2.8 1.4 0.0 48.42010 51.0 46.6 10.9 5.7 2.8 27.3 24.2 1.8 0.4 4.4 2.6 1.9 0.0 48.22011 49.5 46.0 10.6 5.5 3.0 26.8 23.9 1.7 0.4 3.5 2.3 1.2 0.0 46.52012 49.9 46.2 10.5 5.5 3.1 27.1 24.3 1.6 0.4 3.7 2.1 1.6 0.1 46.8
3. Euro area _ deficit/surplus, primary deficit/surplus and government consumption
Deficit (-)/surplus (+) Primary Government consumption 4)
deficit (-)/ Total Central State Local Social surplus (+) Total Collective Individual
gov. gov. gov. security Compensation Intermediate Transfers Consumption Sales consumption consumptionfunds of employees consumption in kind of fixed (minus)
via market capitalproducers
1 2 3 4 5 6 7 8 9 10 11 12 13 14
2004 -2.9 -2.5 -0.4 -0.3 0.2 0.2 20.4 10.5 5.0 5.1 1.9 2.2 8.1 12.32005 -2.5 -2.3 -0.3 -0.2 0.2 0.5 20.5 10.5 5.0 5.2 1.9 2.3 8.0 12.52006 -1.4 -1.5 -0.1 -0.2 0.4 1.5 20.3 10.3 5.0 5.3 1.9 2.3 7.9 12.52007 -0.7 -1.2 0.0 0.0 0.6 2.3 20.1 10.1 5.0 5.2 1.9 2.3 7.7 12.32008 -2.1 -2.3 -0.2 -0.2 0.5 0.9 20.6 10.3 5.2 5.4 1.9 2.3 8.0 12.72009 -6.4 -5.2 -0.5 -0.3 -0.4 -3.5 22.4 11.1 5.7 5.9 2.1 2.5 8.6 13.82010 -6.2 -5.1 -0.7 -0.3 -0.1 -3.4 22.1 10.9 5.7 5.9 2.1 2.6 8.4 13.62011 -4.1 -3.3 -0.7 -0.2 0.0 -1.1 21.6 10.6 5.5 5.8 2.1 2.6 8.2 13.42012 -3.7 -3.4 -0.3 0.0 0.0 -0.6 21.6 10.5 5.5 5.9 2.1 2.6 8.2 13.4
4. Euro area countries _ deficit (-)/surplus (+) 5)
BE DE EE IE GR ES FR IT CY LV LU MT NL AT PT SI SK FI1 2 3 4 5 6 7 8 9 10 11 12 13 14 15 16 17 18
2009 -5.6 -3.1 -2.0 -13.7 -15.7 -11.1 -7.5 -5.5 -6.1 -9.8 -0.7 -3.7 -5.6 -4.1 -10.2 -6.3 -8.0 -2.52010 -3.7 -4.2 0.2 -30.6 -10.7 -9.6 -7.1 -4.5 -5.3 -8.1 -0.8 -3.5 -5.1 -4.5 -9.8 -5.9 -7.7 -2.52011 -3.7 -0.8 1.1 -13.1 -9.5 -9.6 -5.3 -3.8 -6.3 -3.6 0.1 -2.8 -4.3 -2.5 -4.3 -6.3 -5.1 -0.72012 -4.0 0.1 -0.2 -8.2 -9.0 -10.6 -4.8 -3.0 -6.4 -1.3 -0.6 -3.3 -4.1 -2.5 -6.4 -3.8 -4.5 -1.8
Sources: ECB for euro area aggregated data; European Commission for data relating to countries’ deficit/surplus.1) The concepts "revenue", "expenditure" and "deficit/surplus" are based on the ESA 95. Transactions involving the EU budget are included and
consolidated. Transactions among Member States’ governments are not consolidated.2) The fiscal burden comprises taxes and social contributions.3) Comprises total expenditure minus interest expenditure.4) Corresponds to final consumption expenditure (P.3) of general government in the ESA 95.5) Includes settlements under swaps and forward rate agreements.
6
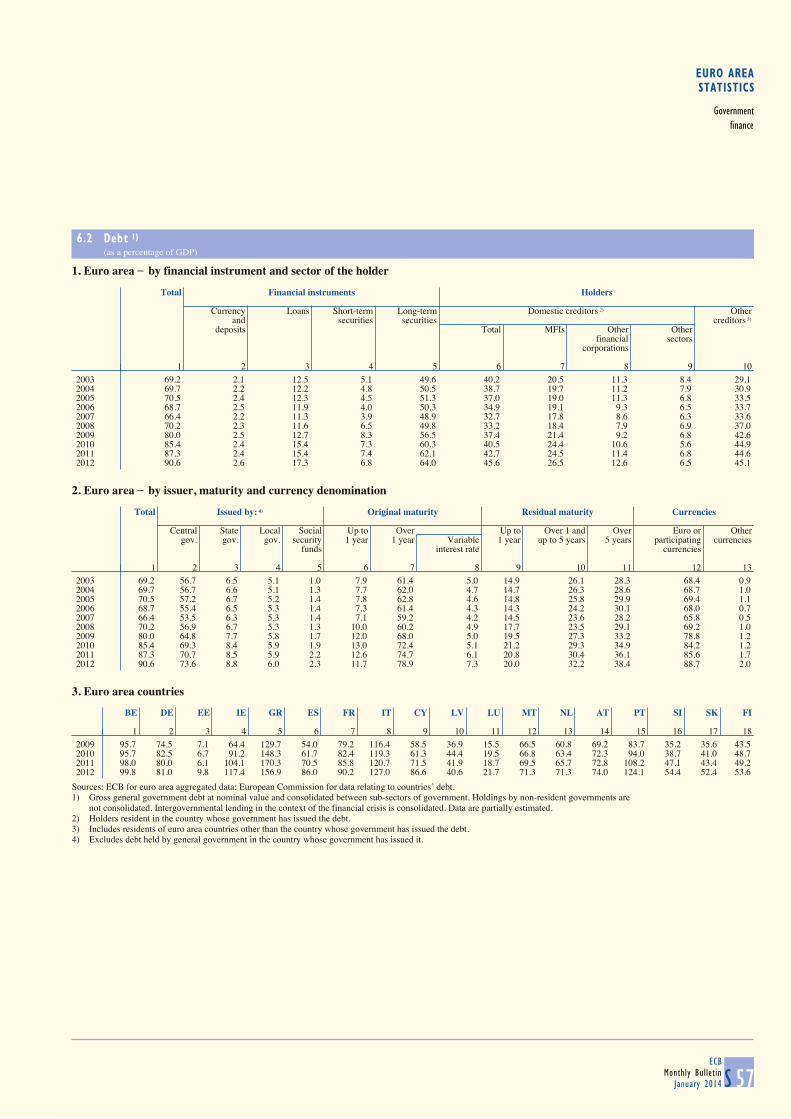
EURO AREASTATISTICS
Governmentfinance
6.2 Debt 1) (as a percentage of GDP)
S 57ECB
Monthly BulletinJanuary 2014
1. Euro area _ by financial instrument and sector of the holder
Total Financial instruments Holders
Currency Loans Short-term Long-term Domestic creditors 2) Other
and securities securities creditors 3)
deposits Total MFIs Other Otherfinancial sectors
corporations
1 2 3 4 5 6 7 8 9 10
2003 69.2 2.1 12.5 5.1 49.6 40.2 20.5 11.3 8.4 29.12004 69.7 2.2 12.2 4.8 50.5 38.7 19.7 11.2 7.9 30.92005 70.5 2.4 12.3 4.5 51.3 37.0 19.0 11.3 6.8 33.52006 68.7 2.5 11.9 4.0 50.3 34.9 19.1 9.3 6.5 33.72007 66.4 2.2 11.3 3.9 48.9 32.7 17.8 8.6 6.3 33.62008 70.2 2.3 11.6 6.5 49.8 33.2 18.4 7.9 6.9 37.02009 80.0 2.5 12.7 8.3 56.5 37.4 21.4 9.2 6.8 42.62010 85.4 2.4 15.4 7.3 60.3 40.5 24.4 10.6 5.6 44.92011 87.3 2.4 15.4 7.4 62.1 42.7 24.5 11.4 6.8 44.62012 90.6 2.6 17.3 6.8 64.0 45.6 26.5 12.6 6.5 45.1
2. Euro area _ by issuer, maturity and currency denomination
Total Issued by: 4) Original maturity Residual maturity Currencies
Central State Local Social Up to Over Up to Over 1 and Over Euro or Other
gov. gov. gov. security 1 year 1 year Variable 1 year up to 5 years 5 years participating currenciesfunds interest rate currencies
1 2 3 4 5 6 7 8 9 10 11 12 13
2003 69.2 56.7 6.5 5.1 1.0 7.9 61.4 5.0 14.9 26.1 28.3 68.4 0.92004 69.7 56.7 6.6 5.1 1.3 7.7 62.0 4.7 14.7 26.3 28.6 68.7 1.02005 70.5 57.2 6.7 5.2 1.4 7.8 62.8 4.6 14.8 25.8 29.9 69.4 1.12006 68.7 55.4 6.5 5.3 1.4 7.3 61.4 4.3 14.3 24.2 30.1 68.0 0.72007 66.4 53.5 6.3 5.3 1.4 7.1 59.2 4.2 14.5 23.6 28.2 65.8 0.52008 70.2 56.9 6.7 5.3 1.3 10.0 60.2 4.9 17.7 23.5 29.1 69.2 1.02009 80.0 64.8 7.7 5.8 1.7 12.0 68.0 5.0 19.5 27.3 33.2 78.8 1.22010 85.4 69.3 8.4 5.9 1.9 13.0 72.4 5.1 21.2 29.3 34.9 84.2 1.22011 87.3 70.7 8.5 5.9 2.2 12.6 74.7 6.1 20.8 30.4 36.1 85.6 1.72012 90.6 73.6 8.8 6.0 2.3 11.7 78.9 7.3 20.0 32.2 38.4 88.7 2.0
3. Euro area countries
BE DE EE IE GR ES FR IT CY LV LU MT NL AT PT SI SK FI
1 2 3 4 5 6 7 8 9 10 11 12 13 14 15 16 17 18
2009 95.7 74.5 7.1 64.4 129.7 54.0 79.2 116.4 58.5 36.9 15.5 66.5 60.8 69.2 83.7 35.2 35.6 43.52010 95.7 82.5 6.7 91.2 148.3 61.7 82.4 119.3 61.3 44.4 19.5 66.8 63.4 72.3 94.0 38.7 41.0 48.72011 98.0 80.0 6.1 104.1 170.3 70.5 85.8 120.7 71.5 41.9 18.7 69.5 65.7 72.8 108.2 47.1 43.4 49.22012 99.8 81.0 9.8 117.4 156.9 86.0 90.2 127.0 86.6 40.6 21.7 71.3 71.3 74.0 124.1 54.4 52.4 53.6
Sources: ECB for euro area aggregated data; European Commission for data relating to countries’ debt.1) Gross general government debt at nominal value and consolidated between sub-sectors of government. Holdings by non-resident governments are
not consolidated. Intergovernmental lending in the context of the financial crisis is consolidated. Data are partially estimated.2) Holders resident in the country whose government has issued the debt. 3) Includes residents of euro area countries other than the country whose government has issued the debt. 4) Excludes debt held by general government in the country whose government has issued it.
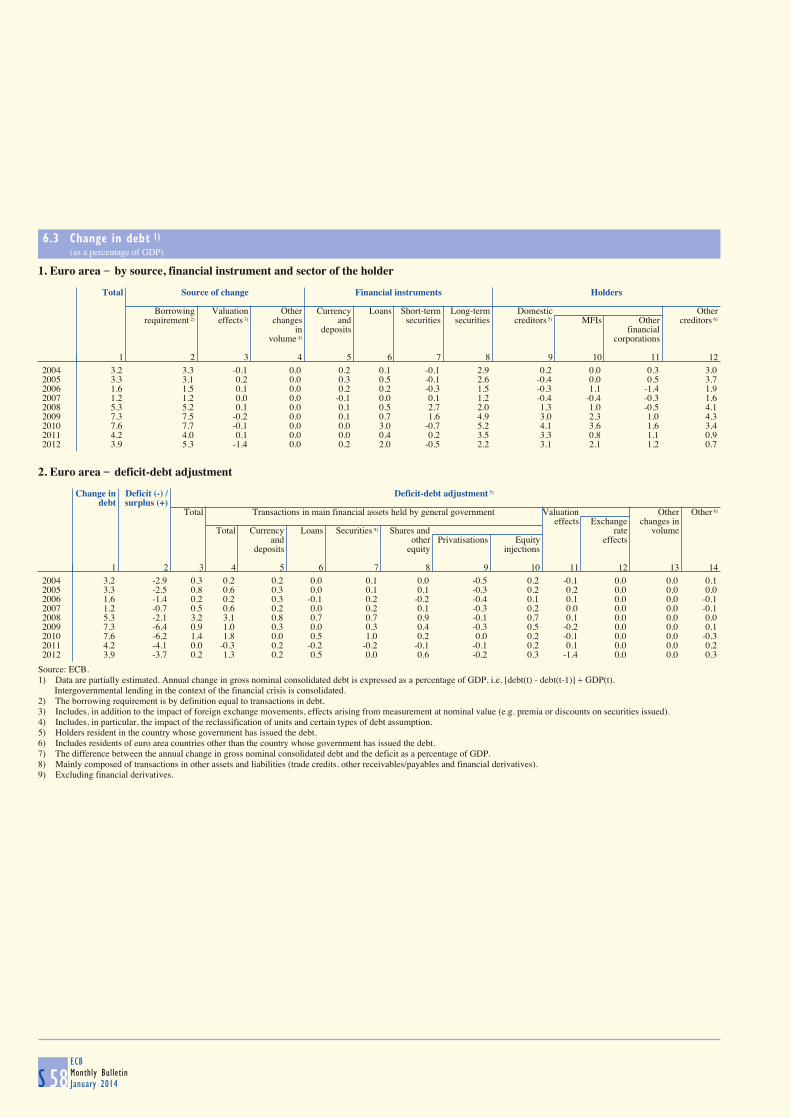
6.3 Change in debt 1) (as a percentage of GDP)
S 58ECBMonthly BulletinJanuary 2014
1. Euro area _ by source, financial instrument and sector of the holder
Total Source of change Financial instruments Holders
Borrowing Valuation Other Currency Loans Short-term Long-term Domestic Other
requirement 2) effects 3) changes and securities securities creditors 5) MFIs Other creditors 6)
in deposits financialvolume 4) corporations
1 2 3 4 5 6 7 8 9 10 11 12
2004 3.2 3.3 -0.1 0.0 0.2 0.1 -0.1 2.9 0.2 0.0 0.3 3.02005 3.3 3.1 0.2 0.0 0.3 0.5 -0.1 2.6 -0.4 0.0 0.5 3.72006 1.6 1.5 0.1 0.0 0.2 0.2 -0.3 1.5 -0.3 1.1 -1.4 1.92007 1.2 1.2 0.0 0.0 -0.1 0.0 0.1 1.2 -0.4 -0.4 -0.3 1.62008 5.3 5.2 0.1 0.0 0.1 0.5 2.7 2.0 1.3 1.0 -0.5 4.12009 7.3 7.5 -0.2 0.0 0.1 0.7 1.6 4.9 3.0 2.3 1.0 4.32010 7.6 7.7 -0.1 0.0 0.0 3.0 -0.7 5.2 4.1 3.6 1.6 3.42011 4.2 4.0 0.1 0.0 0.0 0.4 0.2 3.5 3.3 0.8 1.1 0.92012 3.9 5.3 -1.4 0.0 0.2 2.0 -0.5 2.2 3.1 2.1 1.2 0.7
2. Euro area _ deficit-debt adjustment
Change in Deficit (-) / Deficit-debt adjustment 7)
debt surplus (+) Total Transactions in main financial assets held by general government Valuation Other Other 8)
effects Exchange changes inTotal Currency Loans Securities 9) Shares and rate volume
and other Privatisations Equity effectsdeposits equity injections
1 2 3 4 5 6 7 8 9 10 11 12 13 14
2004 3.2 -2.9 0.3 0.2 0.2 0.0 0.1 0.0 -0.5 0.2 -0.1 0.0 0.0 0.12005 3.3 -2.5 0.8 0.6 0.3 0.0 0.1 0.1 -0.3 0.2 0.2 0.0 0.0 0.02006 1.6 -1.4 0.2 0.2 0.3 -0.1 0.2 -0.2 -0.4 0.1 0.1 0.0 0.0 -0.12007 1.2 -0.7 0.5 0.6 0.2 0.0 0.2 0.1 -0.3 0.2 0.0 0.0 0.0 -0.12008 5.3 -2.1 3.2 3.1 0.8 0.7 0.7 0.9 -0.1 0.7 0.1 0.0 0.0 0.02009 7.3 -6.4 0.9 1.0 0.3 0.0 0.3 0.4 -0.3 0.5 -0.2 0.0 0.0 0.12010 7.6 -6.2 1.4 1.8 0.0 0.5 1.0 0.2 0.0 0.2 -0.1 0.0 0.0 -0.32011 4.2 -4.1 0.0 -0.3 0.2 -0.2 -0.2 -0.1 -0.1 0.2 0.1 0.0 0.0 0.22012 3.9 -3.7 0.2 1.3 0.2 0.5 0.0 0.6 -0.2 0.3 -1.4 0.0 0.0 0.3
Source: ECB.1) Data are partially estimated. Annual change in gross nominal consolidated debt is expressed as a percentage of GDP, i.e. [debt(t) - debt(t-1)] ÷ GDP(t). Intergovernmental lending in the context of the financial crisis is consolidated.2) The borrowing requirement is by definition equal to transactions in debt.3) Includes, in addition to the impact of foreign exchange movements, effects arising from measurement at nominal value (e.g. premia or discounts on securities issued).4) Includes, in particular, the impact of the reclassification of units and certain types of debt assumption.5) Holders resident in the country whose government has issued the debt. 6) Includes residents of euro area countries other than the country whose government has issued the debt. 7) The difference between the annual change in gross nominal consolidated debt and the deficit as a percentage of GDP. 8) Mainly composed of transactions in other assets and liabilities (trade credits, other receivables/payables and financial derivatives).9) Excluding financial derivatives.

EURO AREASTATISTICS
Governmentfinance
6.4 Quarterly revenue, expenditure and deficit/surplus 1) (as a percentage of GDP)
S 59ECB
Monthly BulletinJanuary 2014
1. Euro area _ quarterly revenue
Total Current revenue Capital revenue Memo
item:Direct taxes Indirect taxes Social Sales Property Capital Fiscal
contributions income taxes burden 2)
1 2 3 4 5 6 7 8 9 10
2007 Q2 45.8 45.3 13.1 12.9 15.0 2.2 1.4 0.4 0.3 41.2 Q3 43.7 43.2 12.3 12.4 14.8 2.2 0.7 0.5 0.3 39.7 Q4 49.2 48.6 14.7 13.8 15.7 2.5 1.0 0.6 0.3 44.5
2008 Q1 42.4 42.1 10.9 12.3 14.8 2.2 1.1 0.3 0.2 38.3 Q2 45.3 44.9 12.9 12.3 15.1 2.3 1.5 0.4 0.3 40.6 Q3 43.4 43.0 12.1 12.1 15.0 2.3 0.8 0.4 0.3 39.5 Q4 48.7 48.2 13.9 13.4 16.4 2.6 1.1 0.5 0.3 43.8
2009 Q1 42.5 42.4 10.5 12.0 15.6 2.4 1.1 0.1 0.2 38.3 Q2 45.3 44.8 11.9 12.5 15.7 2.5 1.4 0.6 0.5 40.5 Q3 42.9 42.5 10.9 12.0 15.5 2.5 0.7 0.3 0.3 38.8 Q4 48.6 47.8 12.9 13.6 16.4 2.7 1.0 0.8 0.5 43.5
2010 Q1 42.5 42.3 10.2 12.3 15.5 2.4 0.9 0.2 0.3 38.3 Q2 45.2 44.8 11.9 12.7 15.4 2.6 1.3 0.5 0.3 40.3 Q3 43.1 42.8 10.9 12.5 15.3 2.5 0.7 0.3 0.3 39.0 Q4 48.3 47.6 13.1 13.2 16.4 2.9 1.0 0.7 0.3 43.1
2011 Q1 43.1 42.9 10.7 12.6 15.3 2.5 1.0 0.3 0.3 38.9 Q2 45.3 45.0 12.1 12.7 15.4 2.5 1.5 0.3 0.3 40.4 Q3 43.7 43.4 11.4 12.5 15.3 2.5 0.8 0.3 0.3 39.6 Q4 49.0 48.0 13.4 13.2 16.7 2.8 1.0 1.1 0.4 43.6
2012 Q1 43.7 43.4 11.0 12.8 15.4 2.5 1.0 0.3 0.2 39.4 Q2 46.3 45.9 12.6 12.8 15.6 2.6 1.4 0.3 0.3 41.4 Q3 44.7 44.3 11.9 12.7 15.5 2.6 0.8 0.4 0.3 40.4 Q4 50.2 49.5 14.1 13.6 17.0 2.9 1.0 0.7 0.3 44.9
2013 Q1 44.0 43.8 11.2 12.6 15.7 2.5 1.0 0.2 0.3 39.7 Q2 47.3 46.8 13.2 12.9 15.7 2.6 1.4 0.5 0.4 42.3
2. Euro area _ quarterly expenditure and deficit/surplus
Total Current expenditure Capital expenditure Deficit (-)/ Primary
surplus (+) deficit (-)/Total Compensation Intermediate Interest Current Investment Capital surplus (+)
of consumption transfers Social Subsidies transfersemployees benefits
1 2 3 4 5 6 7 8 9 10 11 12 13
2007 Q2 45.0 41.6 10.0 4.8 3.2 23.6 20.6 1.1 3.4 2.5 0.9 0.8 4.0 Q3 44.6 41.0 9.6 4.8 2.9 23.8 20.6 1.2 3.6 2.6 0.9 -0.9 1.9 Q4 49.3 44.7 10.8 5.9 2.9 25.1 21.2 1.5 4.5 2.8 1.7 -0.1 2.9
2008 Q1 45.4 41.8 9.9 4.5 3.0 24.4 20.8 1.2 3.6 2.3 1.2 -3.0 0.0 Q2 46.0 42.4 10.2 5.0 3.3 23.9 20.8 1.1 3.6 2.6 1.0 -0.7 2.6 Q3 45.7 42.0 9.8 5.0 3.0 24.4 21.2 1.2 3.7 2.7 1.0 -2.3 0.6 Q4 51.3 46.7 11.2 6.3 2.9 26.3 22.3 1.4 4.6 2.9 1.6 -2.6 0.3
2009 Q1 49.3 45.5 10.7 5.1 2.8 26.9 22.9 1.3 3.8 2.6 1.2 -6.8 -4.0 Q2 50.7 46.5 11.1 5.5 3.0 26.9 23.3 1.3 4.2 2.8 1.3 -5.4 -2.3 Q3 50.0 46.0 10.5 5.5 2.8 27.1 23.5 1.3 4.1 2.9 1.1 -7.2 -4.4 Q4 54.7 49.8 11.8 6.7 2.8 28.5 24.0 1.5 4.9 3.0 1.8 -6.1 -3.3
2010 Q1 50.5 46.5 10.8 5.1 2.7 27.9 23.6 1.4 3.9 2.4 1.6 -8.0 -5.3 Q2 49.6 46.1 11.0 5.5 3.0 26.7 23.2 1.3 3.5 2.5 1.1 -4.4 -1.4 Q3 50.5 45.2 10.3 5.4 2.7 26.9 23.2 1.3 5.2 2.6 2.7 -7.4 -4.7 Q4 53.5 48.8 11.5 6.7 2.9 27.8 23.7 1.5 4.7 2.7 2.0 -5.1 -2.2
2011 Q1 48.5 45.4 10.4 4.9 2.9 27.1 23.1 1.3 3.1 2.2 1.0 -5.4 -2.5 Q2 48.6 45.3 10.6 5.3 3.2 26.2 22.8 1.2 3.3 2.3 0.9 -3.2 0.0 Q3 48.0 44.5 10.0 5.2 2.9 26.4 22.9 1.2 3.5 2.3 1.1 -4.3 -1.4 Q4 52.8 48.7 11.2 6.6 3.2 27.7 23.7 1.5 4.0 2.5 1.8 -3.7 -0.5
2012 Q1 48.1 45.4 10.3 4.9 3.0 27.3 23.3 1.2 2.7 1.9 0.8 -4.4 -1.5 Q2 49.1 45.8 10.6 5.3 3.3 26.7 23.2 1.2 3.3 2.1 1.2 -2.9 0.5 Q3 48.4 44.9 10.0 5.3 2.9 26.7 23.3 1.2 3.6 2.2 1.3 -3.7 -0.8 Q4 53.9 48.9 11.0 6.5 3.2 28.1 24.1 1.4 5.1 2.3 2.8 -3.8 -0.6
2013 Q1 48.9 46.2 10.4 4.9 2.8 28.0 23.8 1.2 2.7 1.8 1.1 -4.9 -2.1 Q2 49.6 46.1 10.5 5.3 3.2 27.2 23.6 1.2 3.4 2.0 1.4 -2.3 0.9
Sources: ECB calculations based on Eurostat and national data.1) The concepts "revenue", "expenditure" and "deficit/surplus" are based on the ESA 95. Transactions between the EU budget and entities outside
the government sector are not included. Otherwise, except for different data transmission deadlines, the quarterly data are consistent with the annual data.2) The fiscal burden comprises taxes and social contributions.

6.5 Quarterly debt and change in debt 1) (as a percentage of GDP)
S 60ECBMonthly BulletinJanuary 2014
1. Euro area _ Maastricht debt by financial instrument
Total Financial instruments
Currency and deposits Loans Short-term securities Long-term securities1 2 3 4 5
2010 Q3 83.0 2.4 13.4 7.9 59.3 Q4 85.4 2.4 15.4 7.3 60.3
2011 Q1 86.3 2.4 15.2 7.4 61.2 Q2 87.2 2.4 14.9 7.5 62.3 Q3 86.8 2.4 15.1 7.8 61.4 Q4 87.3 2.4 15.4 7.4 62.1
2012 Q1 88.2 2.5 15.8 7.6 62.4 Q2 89.9 2.5 16.7 7.3 63.4 Q3 90.0 2.5 16.5 7.2 63.7 Q4 90.6 2.6 17.3 6.8 64.0
2013 Q1 92.3 2.6 16.9 7.1 65.8 Q2 93.4 2.5 16.9 6.9 67.1
2. Euro area _ deficit-debt adjustment
Change in Deficit (-)/ Deficit-debt adjustment Memo
debt surplus (+) item:Total Transactions in main financial assets held by general government Valuation effects Other Borrowing
and other changes requirementTotal Currency Loans Securities Shares and in volume
and deposits other equity1 2 3 4 5 6 7 8 9 10 11
2010 Q3 2.8 -7.4 -4.6 -2.9 -2.3 -0.6 0.0 0.1 0.0 -1.7 2.8 Q4 11.6 -5.1 6.5 5.7 -0.4 1.7 4.4 0.0 0.0 0.8 11.6
2011 Q1 6.9 -5.4 1.5 0.7 2.1 -0.8 -0.6 -0.1 0.2 0.6 6.7 Q2 5.9 -3.2 2.7 2.5 2.8 0.5 -0.3 -0.5 0.1 0.0 5.8 Q3 0.9 -4.3 -3.4 -3.7 -3.6 -0.5 0.2 0.2 0.5 -0.2 0.4 Q4 3.2 -3.7 -0.5 -0.6 -0.3 -0.2 -0.1 0.1 -0.2 0.2 3.4
2012 Q1 5.0 -4.4 0.5 3.5 4.2 -0.1 -0.6 0.0 -3.8 0.8 8.7 Q2 7.1 -2.9 4.3 4.0 1.6 1.0 0.6 0.7 -0.5 0.9 7.7 Q3 0.7 -3.7 -3.0 -2.0 -2.1 0.5 -0.6 0.1 0.1 -1.0 0.6 Q4 2.8 -3.8 -1.0 -0.3 -2.7 0.5 0.4 1.5 -1.3 0.7 4.1
2013 Q1 6.6 -4.9 1.8 1.8 1.4 0.1 -0.2 0.5 -0.1 0.0 6.7 Q2 5.2 -2.3 2.9 3.7 3.1 0.8 0.0 -0.2 -0.3 -0.5 5.5
C30 Deficit, borrowing requirement and change in debt
(four-quarter moving sum as a percentage of GDP)
C31 Maastricht debt
(annual change in the debt-to-GDP ratio and underlying factors)
0.0
1.0
2.0
3.0
4.0
5.0
6.0
7.0
8.0
9.0
10.0
2002 2004 2006 2008 2010 20120.0
1.0
2.0
3.0
4.0
5.0
6.0
7.0
8.0
9.0
10.0
deficitchange in debtborrowing requirement
-4.0
-2.0
0.0
2.0
4.0
6.0
8.0
10.0
12.0
2002 2004 2006 2008 2010 2012-4.0
-2.0
0.0
2.0
4.0
6.0
8.0
10.0
12.0
deficit-debt adjustmentprimary deficit/surplusinterest-growth differentialchange in debt-to-GDP ratio
Sources: ECB calculations based on Eurostat and national data.1) Intergovernmental lending in the context of the financial crisis is consolidated.

7EXTERNAL TRANSACTIONS AND POSITIONS
7.1 Summary balance of payments 1) (EUR billions; net transactions)
S 61ECB
Monthly BulletinJanuary 2014
Current account Net Financial account
Capital lending/ Errors andTotal Goods Services Income Current account borrowing Total Direct Portfolio Financial Other Reserve omissions
transfers to/from investment investment derivatives investment assetsrest of
the world(columns
1+6)
1 2 3 4 5 6 7 8 9 10 11 12 13 14
2010 5.3 15.6 60.4 38.0 -108.7 5.5 10.8 6.0 -79.0 109.2 10.3 -24.0 -10.5 -16.82011 8.2 2.3 72.7 39.4 -106.3 11.0 19.2 -44.2 -85.8 231.1 -5.3 -173.9 -10.3 25.02012 126.2 94.9 88.7 49.3 -106.8 5.0 131.2 -140.9 -3.6 72.3 3.4 -199.2 -13.9 9.8
2012 Q3 43.5 29.8 25.5 17.4 -29.3 3.8 47.2 -39.7 30.9 -22.7 -2.9 -45.0 -0.1 -7.5 Q4 61.9 35.0 22.1 18.7 -14.0 6.3 68.2 -100.2 -27.6 72.9 25.4 -168.1 -2.8 32.02013 Q1 24.6 30.7 17.5 18.5 -42.1 1.8 26.4 -25.1 -24.0 16.5 8.4 -26.0 0.0 -1.2 Q2 52.8 52.1 28.6 3.8 -31.7 5.3 58.1 -56.3 -48.7 67.1 2.4 -75.9 -1.1 -1.8 Q3 53.8 41.7 30.1 13.8 -31.9 4.2 58.0 -60.5 -16.6 -19.1 9.7 -31.8 -2.9 2.5
2012 Oct. 13.7 10.5 7.0 5.0 -8.8 2.3 16.0 -27.1 -50.5 59.8 9.8 -43.5 -2.6 11.1 Nov. 20.9 13.4 5.6 6.7 -4.8 2.2 23.1 -34.5 19.2 17.4 6.2 -76.3 -1.0 11.4 Dec. 27.3 11.1 9.6 7.0 -0.4 1.7 29.1 -38.5 3.8 -4.3 9.5 -48.3 0.8 9.5
2013 Jan. -6.8 -2.7 4.5 4.7 -13.3 0.1 -6.7 4.7 -10.9 26.9 4.6 -11.1 -4.8 2.0 Feb. 9.0 11.2 5.9 7.7 -15.9 1.1 10.1 -11.1 2.2 -13.9 2.7 -4.6 2.6 0.9 Mar. 22.4 22.2 7.1 6.1 -13.0 0.5 22.9 -18.8 -15.3 3.6 1.1 -10.4 2.3 -4.2 Apr. 13.9 16.4 7.9 0.6 -11.1 1.8 15.7 -18.4 -12.2 -0.2 -5.6 -0.5 0.0 2.8 May 9.9 17.2 8.5 -5.8 -10.0 2.5 12.4 -11.9 -15.9 38.7 -7.3 -26.9 -0.6 -0.5 June 29.1 18.5 12.2 9.0 -10.6 1.0 30.1 -26.0 -20.7 28.6 15.3 -48.6 -0.6 -4.1 July 26.1 19.7 11.4 4.5 -9.5 2.3 28.4 -29.6 -2.9 -41.5 -0.7 15.1 0.3 1.2 Aug. 12.4 8.3 8.0 7.6 -11.4 1.4 13.8 -13.9 -7.2 24.5 7.0 -36.3 -2.0 0.1 Sep. 15.2 13.7 10.7 1.8 -11.0 0.5 15.8 -17.0 -6.5 -2.1 3.4 -10.6 -1.2 1.2 Oct. 26.2 19.6 9.2 6.1 -8.7 2.3 28.5 -25.6 -1.9 -4.8 2.9 -22.6 0.9 -2.9
12-month cumulated transactions
2013 Oct. 205.7 168.6 100.7 55.9 -119.5 17.5 223.2 -240.6 -68.2 73.0 38.9 -281.0 -3.4 17.5
12-month cumulated transactions as a percentage of GDP
2013 Oct. 2.2 1.8 1.1 0.6 -1.3 0.2 2.3 -2.5 -0.7 0.8 0.4 -2.9 0.0 0.2
C32 Euro area b.o.p.: current account
(seasonally adjusted; 12-month cumulated transactions as a percentage of GDP)
C33 Euro area b.o.p.: direct and portfolio investment
(12-month cumulated transactions as a percentage of GDP)
-2.0
-1.5
-1.0
-0.5
0.0
0.5
1.0
1.5
2.0
2.5
2002 2004 2006 2008 2010 2012-2.0
-1.5
-1.0
-0.5
0.0
0.5
1.0
1.5
2.0
2.5
current account balance
-4.0
-3.0
-2.0
-1.0
0.0
1.0
2.0
3.0
4.0
5.0
2002 2004 2006 2008 2010 2012-4.0
-3.0
-2.0
-1.0
0.0
1.0
2.0
3.0
4.0
5.0
net direct investmentnet portfolio investment
Source: ECB.1) The sign convention is explained in the General Notes.
7
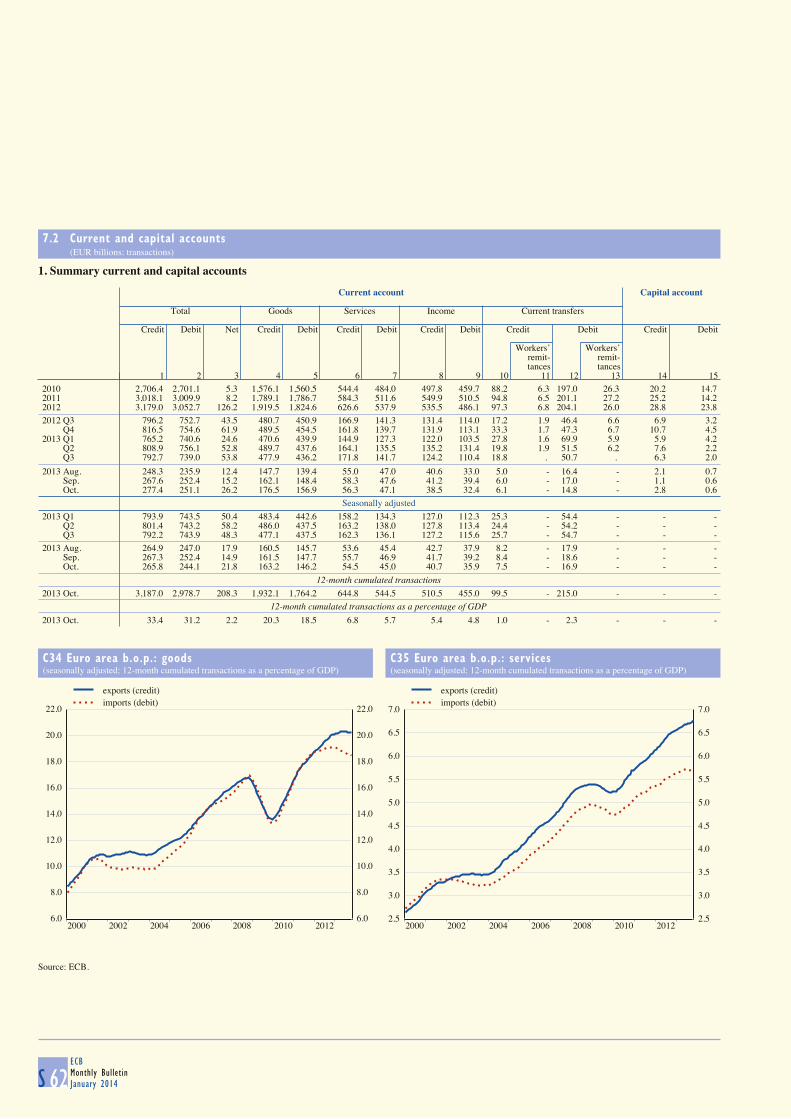
7.2 Current and capital accounts (EUR billions; transactions)
S 62ECBMonthly BulletinJanuary 2014
1. Summary current and capital accounts
Current account Capital account
Total Goods Services Income Current transfers
Credit Debit Net Credit Debit Credit Debit Credit Debit Credit Debit Credit Debit
Workers’ Workers’remit- remit-tances tances
1 2 3 4 5 6 7 8 9 10 11 12 13 14 15
2010 2,706.4 2,701.1 5.3 1,576.1 1,560.5 544.4 484.0 497.8 459.7 88.2 6.3 197.0 26.3 20.2 14.72011 3,018.1 3,009.9 8.2 1,789.1 1,786.7 584.3 511.6 549.9 510.5 94.8 6.5 201.1 27.2 25.2 14.22012 3,179.0 3,052.7 126.2 1,919.5 1,824.6 626.6 537.9 535.5 486.1 97.3 6.8 204.1 26.0 28.8 23.8
2012 Q3 796.2 752.7 43.5 480.7 450.9 166.9 141.3 131.4 114.0 17.2 1.9 46.4 6.6 6.9 3.2 Q4 816.5 754.6 61.9 489.5 454.5 161.8 139.7 131.9 113.1 33.3 1.7 47.3 6.7 10.7 4.52013 Q1 765.2 740.6 24.6 470.6 439.9 144.9 127.3 122.0 103.5 27.8 1.6 69.9 5.9 5.9 4.2 Q2 808.9 756.1 52.8 489.7 437.6 164.1 135.5 135.2 131.4 19.8 1.9 51.5 6.2 7.6 2.2 Q3 792.7 739.0 53.8 477.9 436.2 171.8 141.7 124.2 110.4 18.8 . 50.7 . 6.3 2.0
2013 Aug. 248.3 235.9 12.4 147.7 139.4 55.0 47.0 40.6 33.0 5.0 - 16.4 - 2.1 0.7 Sep. 267.6 252.4 15.2 162.1 148.4 58.3 47.6 41.2 39.4 6.0 - 17.0 - 1.1 0.6 Oct. 277.4 251.1 26.2 176.5 156.9 56.3 47.1 38.5 32.4 6.1 - 14.8 - 2.8 0.6
Seasonally adjusted
2013 Q1 793.9 743.5 50.4 483.4 442.6 158.2 134.3 127.0 112.3 25.3 - 54.4 - - - Q2 801.4 743.2 58.2 486.0 437.5 163.2 138.0 127.8 113.4 24.4 - 54.2 - - - Q3 792.2 743.9 48.3 477.1 437.5 162.3 136.1 127.2 115.6 25.7 - 54.7 - - -
2013 Aug. 264.9 247.0 17.9 160.5 145.7 53.6 45.4 42.7 37.9 8.2 - 17.9 - - - Sep. 267.3 252.4 14.9 161.5 147.7 55.7 46.9 41.7 39.2 8.4 - 18.6 - - - Oct. 265.8 244.1 21.8 163.2 146.2 54.5 45.0 40.7 35.9 7.5 - 16.9 - - -
12-month cumulated transactions
2013 Oct. 3,187.0 2,978.7 208.3 1,932.1 1,764.2 644.8 544.5 510.5 455.0 99.5 - 215.0 - - -
12-month cumulated transactions as a percentage of GDP
2013 Oct. 33.4 31.2 2.2 20.3 18.5 6.8 5.7 5.4 4.8 1.0 - 2.3 - - -
C34 Euro area b.o.p.: goods
(seasonally adjusted; 12-month cumulated transactions as a percentage of GDP)
C35 Euro area b.o.p.: services
(seasonally adjusted; 12-month cumulated transactions as a percentage of GDP)
6.0
8.0
10.0
12.0
14.0
16.0
18.0
20.0
22.0
2000 2002 2004 2006 2008 2010 20126.0
8.0
10.0
12.0
14.0
16.0
18.0
20.0
22.0
exports (credit)imports (debit)
2.5
3.0
3.5
4.0
4.5
5.0
5.5
6.0
6.5
7.0
2000 2002 2004 2006 2008 2010 20122.5
3.0
3.5
4.0
4.5
5.0
5.5
6.0
6.5
7.0
exports (credit)imports (debit)
Source: ECB.

EURO AREASTATISTICS
Externaltransactions
andpositions
7.2 Current and capital accounts (EUR billions)
S 63ECB
Monthly BulletinJanuary 2014
2. Income account(transactions)
Compensation of employees Investment income
Credit Debit Total Direct investment Portfolio investment Other investment
Credit Debit Equity Debt Equity Debt Credit Debit
Credit Debit Credit Debit Credit Debit Credit Debit
Reinv. Reinv.earnings earnings
1 2 3 4 5 6 7 8 9 10 11 12 13 14 15 16
2010 25.1 12.4 472.7 447.4 247.2 47.2 153.6 46.0 23.4 24.3 28.8 83.8 95.7 120.9 77.6 64.7 2011 27.2 12.8 522.7 497.7 271.9 38.1 171.6 58.4 40.3 35.0 36.2 98.5 97.3 124.3 77.1 68.2 2012 28.8 13.2 506.7 472.9 251.5 49.7 155.4 16.2 44.4 38.2 43.0 104.0 99.2 117.1 68.6 58.2
2012 Q2 7.1 3.5 137.0 139.7 67.6 2.3 41.2 4.0 10.9 9.2 16.1 46.0 24.8 28.5 17.5 14.8 Q3 7.1 3.9 124.3 110.1 61.1 17.4 37.7 12.4 11.3 9.0 10.0 20.4 25.2 29.2 16.7 13.8 Q4 7.5 3.3 124.3 109.8 64.0 6.2 37.5 -15.0 11.5 10.4 8.0 20.3 24.8 27.9 16.1 13.7 2013 Q1 7.1 2.5 114.9 101.0 57.4 24.1 34.3 15.4 9.9 7.9 7.5 17.5 24.6 28.6 15.4 12.6 Q2 7.3 3.3 127.9 128.1 63.1 3.3 34.6 3.0 10.0 7.5 14.5 45.2 25.1 28.3 15.2 12.5
3. Geographical breakdown(cumulated transactions)
Total EU Member States outside the euro area Brazil Canada China India Japan Russia Switzer- United Other
land StatesTotal Den- Sweden United Other EU EU
mark Kingdom countries 1) insti-2012 Q3 to tutions
2013 Q2 1 2 3 4 5 6 7 8 9 10 11 12 13 14 15 16
Credits
Current account 3,186.7 1,002.6 54.7 96.6 476.0 312.8 62.6 64.9 46.1 152.5 39.6 69.3 126.2 251.0 426.1 1,008.5 Goods 1,930.5 596.2 35.4 57.6 257.5 245.6 0.2 33.7 23.8 116.9 29.3 44.1 90.1 133.6 225.9 636.8 Services 637.7 194.1 12.5 19.1 119.8 36.0 6.7 10.8 10.7 22.6 7.7 15.0 21.0 61.0 96.3 198.5 Income 520.5 149.0 5.8 17.7 87.2 28.0 10.1 19.9 10.9 12.3 2.4 9.4 14.5 46.9 97.8 157.5 Investment income 491.4 141.3 5.0 17.6 85.7 27.2 5.8 19.9 10.8 12.2 2.4 9.3 14.4 31.7 96.3 153.0 Current transfers 98.1 63.3 1.0 2.2 11.4 3.2 45.6 0.4 0.8 0.7 0.2 0.8 0.6 9.5 6.0 15.6 Capital account 31.2 27.2 0.0 0.0 1.9 0.6 24.7 0.1 0.0 0.0 0.0 0.1 0.1 0.9 0.4 2.3
Debits
Current account 3,003.9 949.0 53.6 92.0 409.3 281.1 113.0 41.6 28.9 - 35.4 93.0 155.5 211.4 395.3 - Goods 1,782.9 506.8 30.0 51.1 199.5 226.2 0.0 27.6 13.8 197.5 26.6 44.9 137.8 106.5 149.4 572.1 Services 543.9 157.1 9.1 15.2 92.5 40.0 0.3 5.4 7.2 15.5 7.0 9.7 11.2 49.4 110.2 171.0 Income 462.1 156.2 13.3 23.9 104.9 9.5 4.6 7.3 5.8 - 0.9 37.8 5.5 45.8 129.5 - Investment income 449.0 149.3 13.2 23.8 103.4 4.3 4.6 7.2 5.6 - 0.7 37.6 5.4 45.4 128.5 - Current transfers 215.1 128.9 1.2 1.8 12.4 5.4 108.1 1.3 2.0 3.6 1.0 0.7 1.0 9.7 6.2 60.7 Capital account 14.0 4.0 0.1 0.1 3.2 0.5 0.2 0.2 0.1 0.4 0.2 0.1 0.1 0.7 1.3 7.1
Net
Current account 182.8 53.5 1.1 4.6 66.6 31.7 -50.4 23.3 17.3 - 4.2 -23.8 -29.3 39.6 30.8 - Goods 147.6 89.4 5.4 6.5 58.0 19.4 0.2 6.1 9.9 -80.5 2.8 -0.8 -47.7 27.1 76.5 64.8 Services 93.8 37.0 3.4 3.8 27.4 -4.0 6.4 5.4 3.4 7.1 0.7 5.3 9.8 11.5 -13.9 27.4 Income 58.4 -7.3 -7.4 -6.2 -17.6 18.5 5.5 12.7 5.1 - 1.5 -28.4 9.0 1.1 -31.7 - Investment income 42.4 -8.1 -8.1 -6.2 -17.8 22.9 1.2 12.7 5.2 - 1.6 -28.2 9.0 -13.7 -32.2 - Current transfers -117.0 -65.6 -0.3 0.4 -1.1 -2.2 -62.5 -0.8 -1.2 -2.9 -0.8 0.1 -0.4 -0.1 -0.2 -45.1 Capital account 17.1 23.2 0.0 0.0 -1.3 0.1 24.5 -0.2 0.0 -0.4 -0.2 0.0 0.1 0.3 -0.9 -4.8
Source: ECB.1) Excluding Croatia.

7.3 Financial account (EUR billions and annual growth rates; outstanding amounts and growth rates at end of period; transactions and other changes during period)
S 64ECBMonthly BulletinJanuary 2014
1. Summary financial account
Outstanding amounts (international investment position)
Total 1) Total Direct Portfolio Net Other Reserve
as a % of GDP investment investment financial investment assetsderivatives
Assets Liabilities Net Assets Liabilities Net Assets Liabilities Assets Liabilities Assets Liabilities
1 2 3 4 5 6 7 8 9 10 11 12 13 14
2009 13,739.1 15,225.6 -1,486.4 154.0 170.7 -16.7 4,412.8 3,532.5 4,340.9 6,863.8 -1.3 4,527.2 4,829.3 459.62010 15,183.9 16,474.3 -1,290.4 165.6 179.7 -14.1 4,930.6 3,891.9 4,898.7 7,471.2 -31.1 4,794.5 5,111.2 591.22011 15,892.7 17,348.1 -1,455.4 168.6 184.1 -15.4 5,633.2 4,339.5 4,750.9 7,721.5 -29.7 4,871.2 5,287.0 667.1
2012 Q4 16,636.5 17,899.5 -1,262.9 175.4 188.7 -13.3 5,881.3 4,444.6 5,265.0 8,375.5 -17.6 4,818.4 5,079.3 689.42013 Q1 17,085.0 18,258.0 -1,173.0 180.3 192.6 -12.4 5,957.5 4,501.4 5,535.1 8,621.7 -28.0 4,932.6 5,134.9 687.8 Q2 16,734.8 18,048.1 -1,313.3 176.1 189.9 -13.8 5,959.8 4,536.8 5,365.8 8,539.8 -25.3 4,870.2 4,971.5 564.3
Changes to outstanding amounts
2009 504.2 387.6 116.6 5.7 4.3 1.3 497.0 272.5 513.7 896.9 -0.9 -591.0 -781.8 85.42010 1,444.8 1,248.7 196.0 15.8 13.6 2.1 517.7 359.3 557.8 607.4 -29.8 267.3 282.0 131.62011 708.8 873.8 -165.0 7.5 9.3 -1.8 702.6 447.6 -147.8 250.3 1.4 76.7 175.8 75.92012 743.9 551.4 192.5 7.8 5.8 2.0 248.1 105.1 514.1 654.0 12.2 -52.8 -207.7 22.3
2013 Q1 448.5 358.5 89.9 19.3 15.4 3.9 76.2 56.8 270.1 246.2 -10.5 114.1 55.5 -1.5 Q2 -350.2 -209.9 -140.2 -14.6 -8.8 -5.9 2.3 35.3 -169.3 -81.9 2.8 -62.4 -163.4 -123.5
Transactions
2009 -89.4 -74.4 -15.0 -1.0 -0.8 -0.2 352.9 285.9 96.0 342.8 -19.0 -514.7 -703.1 -4.62010 646.5 652.6 -6.0 7.1 7.1 -0.1 352.6 273.6 130.9 240.1 -10.3 162.8 138.9 10.52011 670.3 626.2 44.2 7.1 6.6 0.5 524.0 438.2 -53.2 177.9 5.3 183.9 10.0 10.32012 522.0 381.0 140.9 5.5 4.0 1.5 329.9 326.3 186.4 258.7 -3.4 -4.8 -204.0 13.9
2013 Q1 202.4 177.3 25.1 8.7 7.6 1.1 56.7 32.7 104.5 121.0 -8.4 49.6 23.5 0.0 Q2 27.7 -28.6 56.3 1.2 -1.2 2.4 63.1 14.4 21.0 88.1 -2.4 -55.2 -131.1 1.1 Q3 21.2 -39.3 60.5 0.9 -1.6 2.5 48.3 31.7 57.4 38.3 -9.7 -77.6 -109.3 2.9
2013 June -102.3 -128.3 26.0 - - - 30.0 9.3 -42.5 -13.9 -15.3 -75.1 -123.7 0.6 July 0.4 -29.2 29.6 - - - 9.3 6.4 26.7 -14.8 0.7 -36.0 -20.8 -0.3 Aug. 11.9 -2.0 13.9 - - - 23.0 15.8 -6.0 18.5 -7.0 -0.1 -36.4 2.0 Sep. 8.9 -8.1 17.0 - - - 16.0 9.5 36.7 34.5 -3.4 -41.5 -52.1 1.2 Oct. 84.1 58.5 25.6 - - - 24.1 22.2 6.8 2.0 -2.9 57.0 34.4 -0.9
Other changes
2009 593.6 462.0 131.6 6.7 5.2 1.5 144.1 -13.4 417.6 554.1 18.2 -76.3 -78.7 90.02010 798.2 596.2 202.1 8.7 6.5 2.2 165.2 85.8 426.9 367.3 -19.4 104.5 143.1 121.12011 38.4 247.6 -209.2 0.4 2.6 -2.2 178.6 9.4 -94.6 72.5 -3.9 -107.2 165.8 65.62012 221.9 170.4 51.5 2.3 1.8 0.5 -81.7 -221.2 327.7 395.3 15.6 -48.0 -3.7 8.4
Other changes due to exchange rate changes
2009 -49.3 -56.1 6.8 -0.6 -0.6 0.1 -5.3 5.6 -29.8 -34.5 . -11.6 -27.2 -2.72010 477.4 325.0 152.4 5.2 3.5 1.7 143.4 35.0 160.0 128.5 . 160.9 161.5 13.12011 214.2 176.7 37.5 2.3 1.9 0.4 70.7 18.4 72.8 67.1 . 63.1 91.3 7.62012 -86.6 -91.4 4.8 -0.9 -1.0 0.1 -22.0 -5.6 -41.3 -37.5 . -16.7 -48.3 -6.6
Other changes due to price changes
2009 634.8 492.7 142.1 7.1 5.5 1.6 147.4 29.4 423.5 463.4 18.2 . . 45.82010 300.8 148.4 152.5 3.3 1.6 1.7 33.2 -0.8 185.5 149.2 -19.4 . . 101.62011 -116.3 -249.1 132.8 -1.2 -2.6 1.4 -38.1 7.1 -133.7 -256.2 -3.9 . . 59.42012 266.0 588.2 -322.2 2.8 6.2 -3.4 38.8 -6.4 194.7 594.6 15.6 . . 16.9
Other changes due to other adjustments
2009 8.4 25.5 -17.1 0.1 0.3 -0.2 2.0 -48.3 24.0 124.6 . -64.4 -50.8 46.92010 20.0 122.8 -102.7 0.2 1.3 -1.1 -11.4 51.6 81.4 89.6 . -56.4 -18.4 6.42011 -59.4 320.0 -379.4 -0.6 3.4 -4.0 146.0 -16.0 -33.8 261.5 . -170.3 74.5 -1.42012 42.5 -326.4 368.9 0.4 -3.4 3.9 -98.6 -209.2 174.3 -161.8 . -31.3 44.6 -1.9
Growth rates of outstanding amounts
2009 -0.7 -0.5 - . . . 8.9 8.8 2.4 5.6 . -10.1 -12.5 -1.32010 4.6 4.2 - . . . 7.7 7.5 2.9 3.4 . 3.6 2.8 2.02011 4.5 3.8 - . . . 10.7 11.2 -1.2 2.4 . 4.0 0.2 1.62012 3.3 2.2 - . . . 5.9 7.6 3.8 3.3 . -0.1 -3.8 2.0
2013 Q1 2.5 1.3 - . . . 5.5 6.1 3.3 4.1 . -1.2 -6.7 1.7 Q2 2.1 0.7 - . . . 4.9 4.9 4.8 4.7 . -3.1 -8.7 0.6 Q3 1.8 0.3 . . . . 4.9 3.7 5.1 4.9 . -4.1 -9.5 1.1
Source: ECB.1) Net financial derivatives are included in assets.
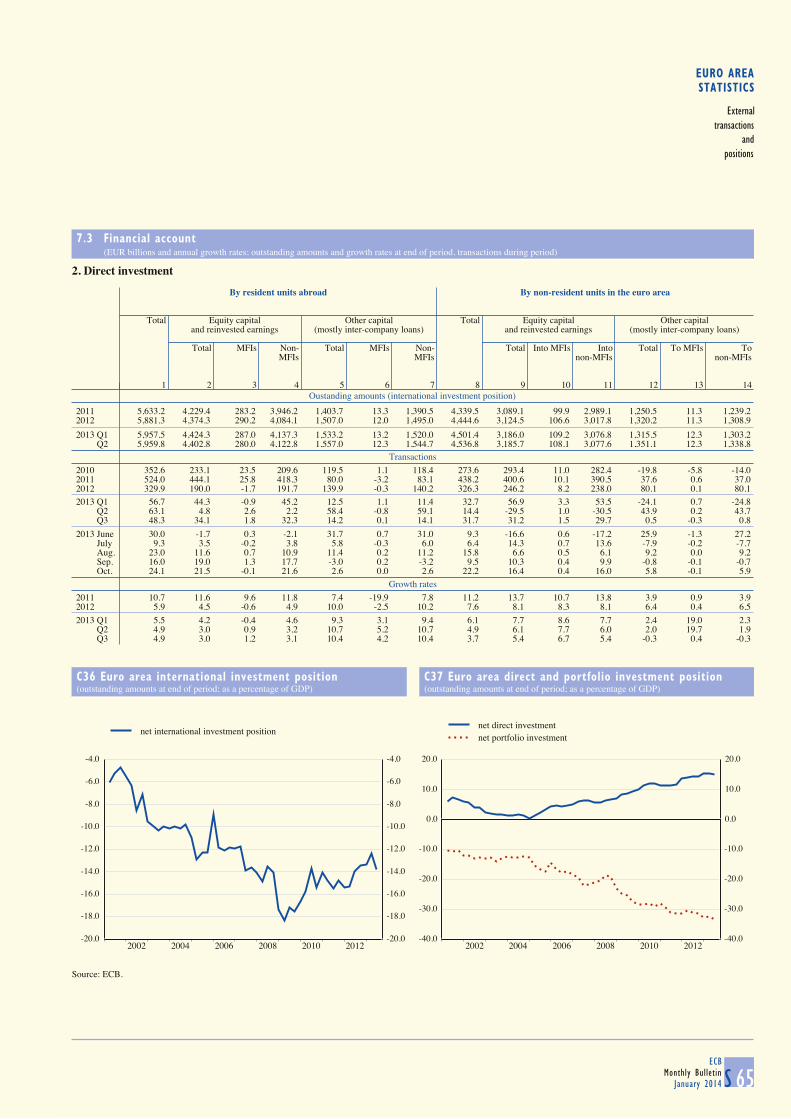
EURO AREASTATISTICS
Externaltransactions
andpositions
7.3 Financial account (EUR billions and annual growth rates; outstanding amounts and growth rates at end of period, transactions during period)
S 65ECB
Monthly BulletinJanuary 2014
2. Direct investment
Oustanding amounts (international investment position)
By resident units abroad By non-resident units in the euro area
Total Equity capital Other capital Total Equity capital Other capital and reinvested earnings (mostly inter-company loans) and reinvested earnings (mostly inter-company loans)
Total MFIs Non- Total MFIs Non- Total Into MFIs Into Total To MFIs ToMFIs MFIs non-MFIs non-MFIs
1 2 3 4 5 6 7 8 9 10 11 12 13 14
2011 5,633.2 4,229.4 283.2 3,946.2 1,403.7 13.3 1,390.5 4,339.5 3,089.1 99.9 2,989.1 1,250.5 11.3 1,239.22012 5,881.3 4,374.3 290.2 4,084.1 1,507.0 12.0 1,495.0 4,444.6 3,124.5 106.6 3,017.8 1,320.2 11.3 1,308.9
2013 Q1 5,957.5 4,424.3 287.0 4,137.3 1,533.2 13.2 1,520.0 4,501.4 3,186.0 109.2 3,076.8 1,315.5 12.3 1,303.2 Q2 5,959.8 4,402.8 280.0 4,122.8 1,557.0 12.3 1,544.7 4,536.8 3,185.7 108.1 3,077.6 1,351.1 12.3 1,338.8
Transactions
2010 352.6 233.1 23.5 209.6 119.5 1.1 118.4 273.6 293.4 11.0 282.4 -19.8 -5.8 -14.02011 524.0 444.1 25.8 418.3 80.0 -3.2 83.1 438.2 400.6 10.1 390.5 37.6 0.6 37.02012 329.9 190.0 -1.7 191.7 139.9 -0.3 140.2 326.3 246.2 8.2 238.0 80.1 0.1 80.1
2013 Q1 56.7 44.3 -0.9 45.2 12.5 1.1 11.4 32.7 56.9 3.3 53.5 -24.1 0.7 -24.8 Q2 63.1 4.8 2.6 2.2 58.4 -0.8 59.1 14.4 -29.5 1.0 -30.5 43.9 0.2 43.7 Q3 48.3 34.1 1.8 32.3 14.2 0.1 14.1 31.7 31.2 1.5 29.7 0.5 -0.3 0.8
2013 June 30.0 -1.7 0.3 -2.1 31.7 0.7 31.0 9.3 -16.6 0.6 -17.2 25.9 -1.3 27.2 July 9.3 3.5 -0.2 3.8 5.8 -0.3 6.0 6.4 14.3 0.7 13.6 -7.9 -0.2 -7.7 Aug. 23.0 11.6 0.7 10.9 11.4 0.2 11.2 15.8 6.6 0.5 6.1 9.2 0.0 9.2 Sep. 16.0 19.0 1.3 17.7 -3.0 0.2 -3.2 9.5 10.3 0.4 9.9 -0.8 -0.1 -0.7 Oct. 24.1 21.5 -0.1 21.6 2.6 0.0 2.6 22.2 16.4 0.4 16.0 5.8 -0.1 5.9
Growth rates
2011 10.7 11.6 9.6 11.8 7.4 -19.9 7.8 11.2 13.7 10.7 13.8 3.9 0.9 3.92012 5.9 4.5 -0.6 4.9 10.0 -2.5 10.2 7.6 8.1 8.3 8.1 6.4 0.4 6.5
2013 Q1 5.5 4.2 -0.4 4.6 9.3 3.1 9.4 6.1 7.7 8.6 7.7 2.4 19.0 2.3 Q2 4.9 3.0 0.9 3.2 10.7 5.2 10.7 4.9 6.1 7.7 6.0 2.0 19.7 1.9 Q3 4.9 3.0 1.2 3.1 10.4 4.2 10.4 3.7 5.4 6.7 5.4 -0.3 0.4 -0.3
C36 Euro area international investment position
(outstanding amounts at end of period; as a percentage of GDP)
C37 Euro area direct and portfolio investment position
(outstanding amounts at end of period; as a percentage of GDP)
-20.0
-18.0
-16.0
-14.0
-12.0
-10.0
-8.0
-6.0
-4.0
2002 2004 2006 2008 2010 2012-20.0
-18.0
-16.0
-14.0
-12.0
-10.0
-8.0
-6.0
-4.0
net international investment position
-40.0
-30.0
-20.0
-10.0
0.0
10.0
20.0
2002 2004 2006 2008 2010 2012-40.0
-30.0
-20.0
-10.0
0.0
10.0
20.0
net direct investmentnet portfolio investment
Source: ECB.
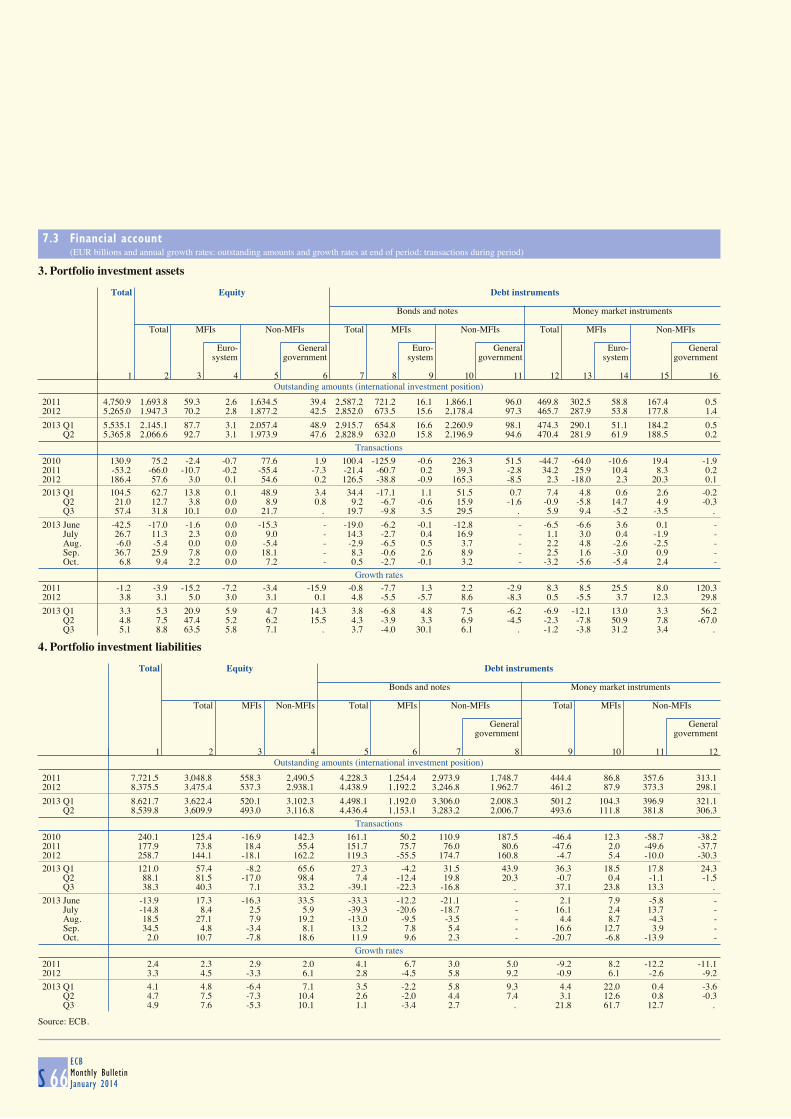
7.3 Financial account (EUR billions and annual growth rates; outstanding amounts and growth rates at end of period; transactions during period)
S 66ECBMonthly BulletinJanuary 2014
3. Portfolio investment assets
Outstanding amounts (international investment position)
Total Equity Debt instruments
Bonds and notes Money market instruments
Total MFIs Non-MFIs Total MFIs Non-MFIs Total MFIs Non-MFIs
Euro- General Euro- General Euro- Generalsystem government system government system government
1 2 3 4 5 6 7 8 9 10 11 12 13 14 15 16
2011 4,750.9 1,693.8 59.3 2.6 1,634.5 39.4 2,587.2 721.2 16.1 1,866.1 96.0 469.8 302.5 58.8 167.4 0.52012 5,265.0 1,947.3 70.2 2.8 1,877.2 42.5 2,852.0 673.5 15.6 2,178.4 97.3 465.7 287.9 53.8 177.8 1.4
2013 Q1 5,535.1 2,145.1 87.7 3.1 2,057.4 48.9 2,915.7 654.8 16.6 2,260.9 98.1 474.3 290.1 51.1 184.2 0.5 Q2 5,365.8 2,066.6 92.7 3.1 1,973.9 47.6 2,828.9 632.0 15.8 2,196.9 94.6 470.4 281.9 61.9 188.5 0.2
Transactions
2010 130.9 75.2 -2.4 -0.7 77.6 1.9 100.4 -125.9 -0.6 226.3 51.5 -44.7 -64.0 -10.6 19.4 -1.92011 -53.2 -66.0 -10.7 -0.2 -55.4 -7.3 -21.4 -60.7 0.2 39.3 -2.8 34.2 25.9 10.4 8.3 0.22012 186.4 57.6 3.0 0.1 54.6 0.2 126.5 -38.8 -0.9 165.3 -8.5 2.3 -18.0 2.3 20.3 0.1
2013 Q1 104.5 62.7 13.8 0.1 48.9 3.4 34.4 -17.1 1.1 51.5 0.7 7.4 4.8 0.6 2.6 -0.2 Q2 21.0 12.7 3.8 0.0 8.9 0.8 9.2 -6.7 -0.6 15.9 -1.6 -0.9 -5.8 14.7 4.9 -0.3 Q3 57.4 31.8 10.1 0.0 21.7 . 19.7 -9.8 3.5 29.5 . 5.9 9.4 -5.2 -3.5 .
2013 June -42.5 -17.0 -1.6 0.0 -15.3 - -19.0 -6.2 -0.1 -12.8 - -6.5 -6.6 3.6 0.1 - July 26.7 11.3 2.3 0.0 9.0 - 14.3 -2.7 0.4 16.9 - 1.1 3.0 0.4 -1.9 - Aug. -6.0 -5.4 0.0 0.0 -5.4 - -2.9 -6.5 0.5 3.7 - 2.2 4.8 -2.6 -2.5 - Sep. 36.7 25.9 7.8 0.0 18.1 - 8.3 -0.6 2.6 8.9 - 2.5 1.6 -3.0 0.9 - Oct. 6.8 9.4 2.2 0.0 7.2 - 0.5 -2.7 -0.1 3.2 - -3.2 -5.6 -5.4 2.4 -
Growth rates
2011 -1.2 -3.9 -15.2 -7.2 -3.4 -15.9 -0.8 -7.7 1.3 2.2 -2.9 8.3 8.5 25.5 8.0 120.32012 3.8 3.1 5.0 3.0 3.1 0.1 4.8 -5.5 -5.7 8.6 -8.3 0.5 -5.5 3.7 12.3 29.8
2013 Q1 3.3 5.3 20.9 5.9 4.7 14.3 3.8 -6.8 4.8 7.5 -6.2 -6.9 -12.1 13.0 3.3 56.2 Q2 4.8 7.5 47.4 5.2 6.2 15.5 4.3 -3.9 3.3 6.9 -4.5 -2.3 -7.8 50.9 7.8 -67.0 Q3 5.1 8.8 63.5 5.8 7.1 . 3.7 -4.0 30.1 6.1 . -1.2 -3.8 31.2 3.4 .
4. Portfolio investment liabilities
Outstanding amounts (international investment position)
Total Equity Debt instruments
Bonds and notes Money market instruments
Total MFIs Non-MFIs Total MFIs Non-MFIs Total MFIs Non-MFIs
General Generalgovernment government
1 2 3 4 5 6 7 8 9 10 11 12
2011 7,721.5 3,048.8 558.3 2,490.5 4,228.3 1,254.4 2,973.9 1,748.7 444.4 86.8 357.6 313.12012 8,375.5 3,475.4 537.3 2,938.1 4,438.9 1,192.2 3,246.8 1,962.7 461.2 87.9 373.3 298.1
2013 Q1 8,621.7 3,622.4 520.1 3,102.3 4,498.1 1,192.0 3,306.0 2,008.3 501.2 104.3 396.9 321.1 Q2 8,539.8 3,609.9 493.0 3,116.8 4,436.4 1,153.1 3,283.2 2,006.7 493.6 111.8 381.8 306.3
Transactions
2010 240.1 125.4 -16.9 142.3 161.1 50.2 110.9 187.5 -46.4 12.3 -58.7 -38.22011 177.9 73.8 18.4 55.4 151.7 75.7 76.0 80.6 -47.6 2.0 -49.6 -37.72012 258.7 144.1 -18.1 162.2 119.3 -55.5 174.7 160.8 -4.7 5.4 -10.0 -30.3
2013 Q1 121.0 57.4 -8.2 65.6 27.3 -4.2 31.5 43.9 36.3 18.5 17.8 24.3 Q2 88.1 81.5 -17.0 98.4 7.4 -12.4 19.8 20.3 -0.7 0.4 -1.1 -1.5 Q3 38.3 40.3 7.1 33.2 -39.1 -22.3 -16.8 . 37.1 23.8 13.3 .
2013 June -13.9 17.3 -16.3 33.5 -33.3 -12.2 -21.1 - 2.1 7.9 -5.8 - July -14.8 8.4 2.5 5.9 -39.3 -20.6 -18.7 - 16.1 2.4 13.7 - Aug. 18.5 27.1 7.9 19.2 -13.0 -9.5 -3.5 - 4.4 8.7 -4.3 - Sep. 34.5 4.8 -3.4 8.1 13.2 7.8 5.4 - 16.6 12.7 3.9 - Oct. 2.0 10.7 -7.8 18.6 11.9 9.6 2.3 - -20.7 -6.8 -13.9 -
Growth rates
2011 2.4 2.3 2.9 2.0 4.1 6.7 3.0 5.0 -9.2 8.2 -12.2 -11.12012 3.3 4.5 -3.3 6.1 2.8 -4.5 5.8 9.2 -0.9 6.1 -2.6 -9.2
2013 Q1 4.1 4.8 -6.4 7.1 3.5 -2.2 5.8 9.3 4.4 22.0 0.4 -3.6 Q2 4.7 7.5 -7.3 10.4 2.6 -2.0 4.4 7.4 3.1 12.6 0.8 -0.3 Q3 4.9 7.6 -5.3 10.1 1.1 -3.4 2.7 . 21.8 61.7 12.7 .
Source: ECB.

EURO AREASTATISTICS
Externaltransactions
andpositions
7.3 Financial account (EUR billions and annual growth rates; outstanding amounts and growth rates at end of period; transactions during period)
S 67ECB
Monthly BulletinJanuary 2014
5. Other investment assets
Outstanding amounts (international investment position)
Total Eurosystem MFIs General Other sectors
(excluding Eurosystem) government
Total Loans/ Other Total Loans/ Other Trade Loans/currency Trade Loans/currencycurrency assets currency assets credits and deposits credits and deposits
and anddeposits deposits Currency Currency
and anddeposits deposits
1 2 3 4 5 6 7 8 9 10 11 12 13 14 15
2011 4,871.2 35.5 35.2 0.3 3,069.1 3,007.5 61.6 162.7 6.8 116.4 30.2 1,604.0 247.7 1,161.4 491.32012 4,818.4 40.1 39.9 0.3 2,923.8 2,853.6 70.2 167.9 5.3 121.4 29.2 1,686.6 253.9 1,236.8 524.7
2013 Q1 4,932.6 33.1 32.8 0.3 2,954.5 2,884.7 69.8 155.0 5.2 108.0 24.2 1,790.0 249.7 1,277.7 558.0 Q2 4,870.2 17.9 17.6 0.3 2,938.7 2,871.6 67.1 150.6 5.1 103.9 23.9 1,763.0 250.7 1,241.6 556.6
Transactions
2010 162.8 -2.9 -2.8 0.0 10.1 1.3 8.9 41.5 -0.2 41.1 4.9 114.1 8.6 81.6 50.62011 183.9 -2.7 -2.8 0.1 50.5 20.7 29.9 4.4 -0.3 4.2 10.3 131.7 8.5 99.0 38.12012 -4.8 5.2 5.2 0.0 -122.4 -130.5 8.1 4.7 -1.5 6.4 -1.0 107.7 8.4 74.5 37.7
2013 Q1 49.6 -6.8 -6.8 0.0 11.9 12.7 -0.8 -10.7 -0.3 -11.0 -5.1 55.1 2.4 40.1 55.8 Q2 -55.2 -10.9 -10.9 0.0 12.3 14.5 -2.2 -4.7 0.0 -4.4 -0.2 -51.8 1.1 -56.1 -24.2 Q3 -77.6 6.2 . . -76.3 . . -2.3 . . -1.5 -5.2 . . 13.1
2013 June -75.1 -2.8 - - -39.9 - - -2.2 - - -0.7 -30.2 - - -15.5 July -36.0 3.4 - - -34.1 - - -5.2 - - -2.7 -0.1 - - 0.4 Aug. -0.1 -2.3 - - 8.8 - - 2.6 - - 0.9 -9.1 - - 7.9 Sep. -41.5 5.1 - - -50.9 - - 0.3 - - 0.3 4.0 - - 4.8 Oct. 57.0 -4.6 - - 76.7 - - 1.7 - - 2.1 -16.7 - - -2.0
Growth rates
2011 4.0 -5.4 -5.5 40.4 1.8 0.8 76.8 3.0 -3.3 4.2 51.5 8.3 3.9 8.1 9.02012 -0.1 13.1 13.2 -0.6 -3.9 -4.3 13.7 3.1 -22.2 5.9 -3.3 6.8 3.4 6.5 7.8
2013 Q1 -1.2 -9.1 -9.1 -3.2 -4.6 -5.1 22.6 3.5 -24.3 5.3 -1.7 4.8 -2.4 5.8 9.8 Q2 -3.1 -22.3 -22.5 0.1 -4.2 -4.2 -5.9 -3.7 -25.0 -4.7 -20.3 -0.7 -1.9 -2.9 2.9 Q3 -4.1 -13.4 . . -5.5 . . 0.6 . . -10.7 -1.9 . . 4.3
6. Other investment liabilities
Outstanding amounts (international investment position)
Total Eurosystem MFIs General Other sectors
(excluding Eurosystem) government
Total Loans/ Other Total Loans/ Other Total Trade Loans Other Total Trade Loans Othercurrency liabilities currency liabilities credits liabilities credits liabilities
and anddeposits deposits
1 2 3 4 5 6 7 8 9 10 11 12 13 14 15
2011 5,287.0 412.7 409.9 2.8 3,212.3 3,145.5 66.8 224.1 0.1 217.2 6.8 1,438.0 226.3 1,027.2 184.52012 5,079.3 428.9 428.0 0.9 2,963.8 2,881.1 82.7 227.5 0.1 219.9 7.4 1,459.2 228.8 994.0 236.4
2013 Q1 5,134.9 398.6 397.8 0.9 2,976.9 2,893.6 83.3 224.3 0.1 218.3 5.9 1,535.0 231.6 1,034.8 268.7 Q2 4,971.5 373.3 371.9 1.4 2,851.2 2,787.9 63.3 222.4 0.1 216.3 5.9 1,524.6 228.6 1,025.8 270.2
Transactions
2010 138.9 9.4 6.8 2.6 -8.7 -14.6 5.9 64.9 0.0 64.3 0.5 73.2 16.0 31.1 26.22011 10.0 135.1 135.3 -0.2 -289.1 -327.8 38.7 74.1 0.0 74.1 0.0 90.0 10.5 63.5 16.02012 -204.0 19.0 20.9 -1.8 -234.6 -251.7 17.2 3.7 0.0 2.7 1.0 7.8 7.4 -14.3 14.7
2013 Q1 23.5 -32.2 -32.2 0.0 -0.4 0.2 -0.7 -0.8 0.0 0.4 -1.2 57.0 2.5 31.4 23.1 Q2 -131.1 -21.4 -21.9 0.5 -93.6 -75.8 -17.8 -1.0 0.0 -1.2 0.2 -15.1 -1.5 1.3 -15.0 Q3 -109.3 -11.3 . . -100.9 . . 3.8 . . . -1.0 . . .
2013 June -123.7 -9.1 - - -81.5 - - 3.0 - - - -36.0 - - - July -20.8 -5.2 - - -24.6 - - 0.9 - - - 8.0 - - - Aug. -36.4 -2.2 - - -26.5 - - 0.7 - - - -8.3 - - - Sep. -52.1 -3.8 - - -49.9 - - 2.2 - - - -0.6 - - - Oct. 34.4 -7.1 - - 52.9 - - -3.8 - - - -7.6 - - -
Growth rates
2011 0.2 50.4 51.0 . -8.3 -9.6 90.9 50.4 . 52.7 -0.6 7.6 5.2 7.4 11.02012 -3.8 4.8 5.3 . -7.3 -8.0 25.8 1.7 . 1.2 16.0 0.5 3.3 -1.5 8.5
2013 Q1 -6.7 18.6 19.3 . -12.5 -13.3 29.0 -2.0 . -2.0 -3.0 0.2 1.0 -1.6 7.1 Q2 -8.7 -8.1 -8.0 . -12.1 -12.0 -15.8 -5.3 . -5.3 -7.1 -1.9 0.2 -2.4 -1.7 Q3 -9.5 -15.1 . . -12.9 . . -1.6 . . . -2.0 . . .
Source: ECB.

7.3 Financial account (EUR billions and annual growth rates; outstanding amounts and growth rates at end of period; transactions during period)
S 68ECBMonthly BulletinJanuary 2014
7. Reserve assets 1)
Outstanding amounts (international investment position)
Reserve assets Memo
items
Total Monetary gold SDR Reserve Foreign exchange Other Other Pre- SDR
holdings position claims foreign determined allo-In In fine in the Total Currency and Securities Financial currency short-term cations
EUR troy IMF deposits derivatives assets netbillions ounces drains
(millions) With With Total Equity Bonds Money onmonetary banks and market foreign
authorities notes instruments currencyand the BIS
1 2 3 4 5 6 7 8 9 10 11 12 13 14 15 16 17
2009 462.4 266.1 347.180 50.8 10.5 134.9 11.7 8.1 115.2 0.5 92.0 22.7 -0.1 0.0 32.1 -24.2 51.22010 591.2 366.2 346.962 54.2 15.8 155.0 7.7 16.0 131.3 0.5 111.2 19.5 0.0 0.0 26.3 -24.4 54.52011 667.0 422.1 346.846 54.0 30.2 160.8 5.3 7.8 148.1 0.8 134.1 13.3 -0.4 0.0 97.4 -86.0 55.9
2012 Q4 689.4 437.2 346.693 52.8 31.9 166.8 6.1 8.8 151.3 0.2 130.9 20.2 0.6 0.6 32.8 -35.0 55.02013 Q1 687.8 432.7 346.696 52.5 32.4 169.6 5.3 10.0 154.4 0.2 132.6 21.6 -0.1 0.6 31.2 -35.8 55.1 Q2 564.3 315.9 346.672 51.3 31.5 164.7 5.3 7.8 151.6 0.2 133.8 17.6 0.0 0.8 27.3 -31.0 54.2
2013 Oct. 579.6 336.4 346.566 50.6 29.5 162.2 5.0 9.0 148.1 0.2 135.4 12.5 0.1 0.9 22.2 -29.0 53.1 Nov. 561.5 319.0 346.566 50.7 28.9 162.0 4.5 8.8 148.5 0.2 137.2 11.1 0.3 0.9 23.0 -29.5 53.2
Transactions
2010 10.5 0.0 - -0.1 4.9 5.6 -5.4 6.6 4.3 0.0 10.6 -6.3 0.0 0.0 - - - 2011 10.3 0.0 - -1.6 13.0 -1.2 -2.3 -8.3 9.3 0.1 15.9 -6.8 0.1 0.0 - - - 2012 13.9 0.0 - -0.3 3.4 10.2 0.6 1.2 8.0 -0.4 -0.7 9.1 0.4 0.7 - - -
2013 Q1 0.0 0.0 - -0.5 0.3 0.2 -1.1 0.8 0.9 0.0 -0.8 1.7 -0.5 0.0 - - - Q2 1.1 0.0 - -0.3 -0.3 1.5 0.1 -1.8 3.5 0.0 6.3 -2.8 -0.2 0.2 - - - Q3 2.9 . - . . . . . . . . . . . - - -
Growth rates
2010 2.0 0.0 - -0.1 46.7 3.7 -43.3 75.9 3.6 -5.2 10.3 -24.5 - - - - - 2011 1.6 0.0 - -3.0 83.3 -1.3 -30.0 -52.7 6.8 27.4 14.2 -45.3 - - - - - 2012 2.0 0.0 - -0.5 11.0 6.5 12.2 15.2 5.6 -53.5 -0.6 82.5 - - - - -
2013 Q1 1.7 0.0 - -0.9 7.4 6.1 -6.6 30.5 5.5 -50.1 -0.3 67.7 - - - - - Q2 0.6 0.0 - -0.9 2.4 1.9 -19.1 -1.6 3.4 -41.8 4.7 -4.5 - - - - - Q3 1.1 . - . . . . . . . . . - - - - -
8. Gross external debt
Outstanding amounts (international investment position)
Total By instrument By sector (excluding direct investment)
Loans, Money Bonds Trade Other debt Direct investment: General Eurosystem MFIs Othercurrency market and notes credits liabilities inter-company government (excluding sectors
and instruments lending Eurosystem)deposits
1 2 3 4 5 6 7 8 9 10 11
2009 10,341.7 4,469.0 525.7 3,523.2 176.9 184.9 1,462.1 1,966.1 253.4 4,579.8 2,080.32010 10,910.7 4,708.7 453.3 3,824.0 202.5 200.0 1,522.2 2,140.9 271.0 4,743.7 2,232.92011 11,929.7 4,799.8 444.4 4,228.3 226.4 260.9 1,970.0 2,285.9 412.7 4,553.5 2,707.8
2012 Q4 12,091.6 4,522.9 461.2 4,438.9 229.0 327.5 2,112.2 2,488.3 428.9 4,243.9 2,818.42013 Q1 12,254.2 4,544.4 501.2 4,498.1 231.7 358.7 2,119.9 2,553.8 398.6 4,273.2 2,908.6 Q2 12,063.1 4,401.9 493.6 4,436.4 228.7 340.8 2,161.6 2,535.4 373.3 4,116.1 2,876.7
Outstanding amounts as a percentage of GDP
2009 116.0 50.1 5.9 39.5 2.0 2.1 16.4 22.0 2.8 51.3 23.32010 119.1 51.4 4.9 41.7 2.2 2.2 16.6 23.4 3.0 51.8 24.42011 126.7 51.0 4.7 44.9 2.4 2.8 20.9 24.3 4.4 48.3 28.7
2012 Q4 127.5 47.7 4.9 46.8 2.4 3.5 22.3 26.2 4.5 44.7 29.72013 Q1 129.1 47.9 5.3 47.4 2.4 3.8 22.3 26.9 4.2 45.0 30.6 Q2 126.8 46.3 5.2 46.6 2.4 3.6 22.7 26.6 3.9 43.3 30.2
Source: ECB.1) Data refer to the changing composition of the euro area, in line with the approach adopted for the reserve assets of the Eurosystem. For further information, see the General Notes.

EURO AREASTATISTICS
Externaltransactions
andpositions
7.3 Financial account (EUR billions; outstanding amounts at end of period; transactions during period)
S 69ECB
Monthly BulletinJanuary 2014
9. Geographical breakdown
Total EU Member States outside the euro area Canada China Japan Switzer- United Offshore Interna- Otherland States financial tional countries
Total Denmark Sweden United Other EU EU centres organisa-Kingdom countries 1) institutions tions
1 2 3 4 5 6 7 8 9 10 11 12 13 14 15
2012 Outstanding amounts (international investment position)
Direct investment 1,436.7 421.2 -16.2 19.6 135.0 284.0 -1.2 103.4 79.0 -22.3 161.0 176.1 -223.4 -0.2 741.7 Abroad 5,881.3 1,689.6 29.4 171.7 1,156.7 331.7 0.1 211.4 99.6 79.2 597.2 1,322.6 585.4 0.1 1,296.3 Equity/reinvested earnings 4,374.3 1,250.6 22.8 103.9 867.4 256.4 0.0 165.3 81.3 57.1 451.3 929.8 486.6 0.1 952.2 Other capital 1,507.0 439.0 6.5 67.8 289.4 75.2 0.1 46.1 18.3 22.1 145.9 392.7 98.8 0.0 344.2 In the euro area 4,444.6 1,268.4 45.6 152.2 1,021.7 47.7 1.3 108.0 20.6 101.5 436.1 1,146.4 808.7 0.3 554.6 Equity/reinvested earnings 3,124.5 1,017.0 36.8 136.2 810.0 32.7 1.3 86.9 7.8 88.1 262.7 856.5 425.6 0.0 379.7 Other capital 1,320.2 251.4 8.7 16.0 211.8 14.9 0.0 21.1 12.7 13.4 173.4 289.9 383.1 0.2 174.9 Portfolio investment assets 5,265.0 1,678.1 99.7 227.9 1,044.3 120.0 186.3 102.1 61.2 215.1 131.4 1,637.4 433.2 33.1 973.4 Equity 1,947.3 391.2 17.2 48.9 310.4 14.4 0.1 39.6 57.2 105.7 117.1 621.1 237.0 0.9 377.6 Debt instruments 3,317.7 1,286.9 82.4 178.9 733.8 105.6 186.1 62.4 4.0 109.5 14.3 1,016.3 196.2 32.2 595.8 Bonds and notes 2,852.0 1,135.7 75.8 148.5 621.7 104.7 185.0 58.1 2.6 36.8 11.2 855.2 184.4 31.6 536.3 Money market instruments 465.7 151.3 6.6 30.4 112.1 0.9 1.2 4.3 1.3 72.7 3.0 161.1 11.8 0.6 59.5 Other investment -260.9 -240.7 10.7 -26.1 -47.1 45.0 -223.1 1.7 -15.7 5.1 -32.8 54.5 51.3 -77.1 -7.3 Assets 4,818.4 2,188.4 77.4 85.7 1,840.4 165.6 19.3 27.9 48.9 81.9 268.0 676.7 537.3 36.6 952.8 General government 167.9 65.6 1.0 4.6 43.4 1.8 14.9 1.8 3.1 0.9 1.5 11.0 3.3 30.6 50.2 MFIs 2,963.9 1,530.7 58.4 49.8 1,292.0 128.2 2.2 16.4 24.3 65.9 146.8 394.7 392.6 5.2 387.4 Other sectors 1,686.6 592.0 18.0 31.2 505.0 35.6 2.2 9.7 21.5 15.1 119.8 270.9 141.4 0.8 515.2 Liabilities 5,079.3 2,429.0 66.8 111.7 1,887.5 120.6 242.4 26.2 64.6 76.8 300.8 622.1 485.9 113.7 960.0 General government 227.5 107.1 0.3 0.9 26.3 0.2 79.4 0.1 0.0 0.1 1.1 29.6 1.2 83.1 5.1 MFIs 3,392.7 1,644.5 56.3 86.6 1,306.0 92.9 102.7 17.0 38.2 50.7 239.2 338.5 387.9 28.1 648.5 Other sectors 1,459.2 677.4 10.1 24.2 555.1 27.6 60.3 9.1 26.4 26.0 60.6 254.0 96.8 2.5 306.5
2012 Q3 to 2013 Q2 Cumulated transactions
Direct investment 69.3 60.5 -11.6 -33.5 96.7 8.9 0.0 -12.6 7.5 1.2 11.2 -21.9 -29.3 0.0 52.7 Abroad 284.9 95.3 0.7 2.8 79.3 12.6 0.0 1.3 9.4 1.1 21.3 46.3 -8.3 0.0 118.6 Equity/reinvested earnings 130.3 82.3 0.7 8.2 68.3 5.1 0.0 -4.5 8.9 1.4 -5.1 30.5 -18.7 0.0 35.4 Other capital 154.6 13.1 0.0 -5.4 11.0 7.5 0.0 5.8 0.5 -0.3 26.3 15.7 10.4 0.0 83.2 In the euro area 215.6 34.9 12.2 36.3 -17.4 3.7 0.0 13.9 1.9 -0.1 10.0 68.2 21.1 0.0 65.9 Equity/reinvested earnings 188.1 27.4 12.6 22.9 -10.1 2.0 0.0 11.4 1.3 4.0 9.7 51.3 47.3 0.0 35.8 Other capital 27.5 7.5 -0.4 13.4 -7.3 1.7 0.0 2.5 0.6 -4.2 0.3 16.9 -26.2 0.0 30.0 Portfolio investment assets 247.6 -10.1 5.2 11.2 -45.9 9.4 10.0 6.7 5.8 37.6 0.9 65.7 4.0 -0.8 137.8 Equity 141.4 35.0 0.9 3.4 30.8 -0.1 0.0 2.8 5.0 21.4 2.7 45.9 1.3 0.0 27.3 Debt instruments 106.2 -45.1 4.4 7.8 -76.7 9.4 10.0 3.9 0.7 16.2 -1.8 19.8 2.7 -0.8 110.5 Bonds and notes 117.6 -15.2 1.4 8.3 -45.6 8.2 12.4 2.4 0.4 -8.2 -1.2 26.4 -0.6 -1.3 114.8 Money market instruments -11.5 -29.9 2.9 -0.5 -31.1 1.2 -2.4 1.5 0.3 24.4 -0.6 -6.6 3.3 0.5 -4.3 Other investment 315.0 179.5 -25.5 1.6 225.7 -17.4 -4.8 11.0 31.5 8.7 64.1 13.9 4.9 -21.4 23.0 Assets -158.4 -147.6 -20.0 -0.4 -110.4 -15.5 -1.3 7.3 0.1 4.4 -0.6 -5.1 -32.9 0.3 15.7 General government -6.0 -6.3 1.5 0.2 -7.9 -0.9 0.8 0.2 -0.1 -1.1 0.3 0.0 0.2 0.1 0.5 MFIs -137.9 -135.0 -22.9 2.3 -95.1 -17.1 -2.3 2.9 1.9 8.4 1.2 -6.0 0.9 0.1 -12.4 Other sectors -14.4 -6.3 1.4 -2.9 -7.5 2.6 0.2 4.2 -1.7 -2.9 -2.1 0.9 -34.0 0.0 27.6 Liabilities -473.4 -327.1 5.4 -1.9 -336.1 1.9 3.5 -3.7 -31.4 -4.2 -64.7 -18.9 -37.8 21.7 -7.3 General government -12.6 -18.5 0.1 0.3 -24.6 0.1 5.7 0.0 0.0 0.0 0.0 -6.3 -0.2 12.8 -0.5 MFIs -432.3 -269.9 3.6 -1.3 -265.2 -0.7 -6.3 -6.2 -31.5 -4.1 -66.4 -17.7 -36.5 8.3 -8.3 Other sectors -28.5 -38.7 1.8 -0.9 -46.4 2.5 4.2 2.5 0.1 -0.1 1.7 5.0 -1.1 0.5 1.5
Source: ECB.1) Excluding Croatia.
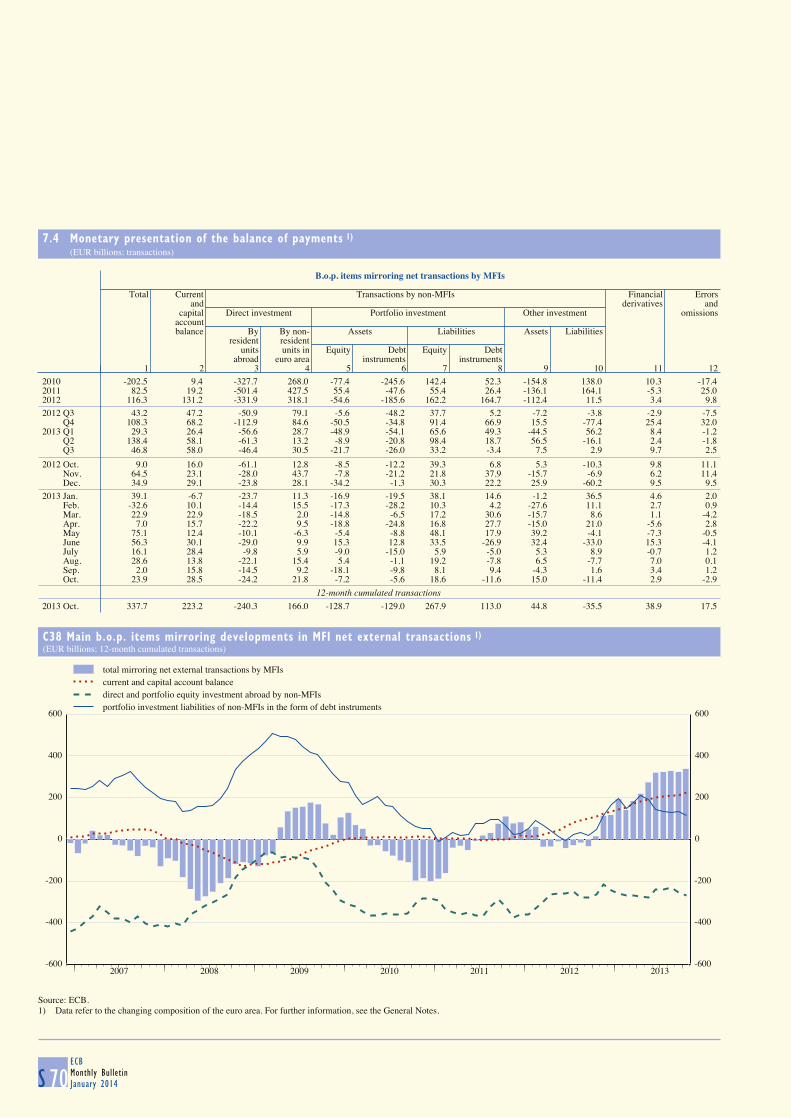
7.4 Monetary presentation of the balance of payments 1) (EUR billions; transactions)
S 70ECBMonthly BulletinJanuary 2014
B.o.p. items mirroring net transactions by MFIs
Total Current Transactions by non-MFIs Financial Errors
and derivatives andcapital Direct investment Portfolio investment Other investment omissions
account balance By By non- Assets Liabilities Assets Liabilities
resident residentunits units in Equity Debt Equity Debt
abroad euro area instruments instruments1 2 3 4 5 6 7 8 9 10 11 12
2010 -202.5 9.4 -327.7 268.0 -77.4 -245.6 142.4 52.3 -154.8 138.0 10.3 -17.42011 82.5 19.2 -501.4 427.5 55.4 -47.6 55.4 26.4 -136.1 164.1 -5.3 25.02012 116.3 131.2 -331.9 318.1 -54.6 -185.6 162.2 164.7 -112.4 11.5 3.4 9.8
2012 Q3 43.2 47.2 -50.9 79.1 -5.6 -48.2 37.7 5.2 -7.2 -3.8 -2.9 -7.5 Q4 108.3 68.2 -112.9 84.6 -50.5 -34.8 91.4 66.9 15.5 -77.4 25.4 32.02013 Q1 29.3 26.4 -56.6 28.7 -48.9 -54.1 65.6 49.3 -44.5 56.2 8.4 -1.2 Q2 138.4 58.1 -61.3 13.2 -8.9 -20.8 98.4 18.7 56.5 -16.1 2.4 -1.8 Q3 46.8 58.0 -46.4 30.5 -21.7 -26.0 33.2 -3.4 7.5 2.9 9.7 2.5
2012 Oct. 9.0 16.0 -61.1 12.8 -8.5 -12.2 39.3 6.8 5.3 -10.3 9.8 11.1 Nov. 64.5 23.1 -28.0 43.7 -7.8 -21.2 21.8 37.9 -15.7 -6.9 6.2 11.4 Dec. 34.9 29.1 -23.8 28.1 -34.2 -1.3 30.3 22.2 25.9 -60.2 9.5 9.5
2013 Jan. 39.1 -6.7 -23.7 11.3 -16.9 -19.5 38.1 14.6 -1.2 36.5 4.6 2.0 Feb. -32.6 10.1 -14.4 15.5 -17.3 -28.2 10.3 4.2 -27.6 11.1 2.7 0.9 Mar. 22.9 22.9 -18.5 2.0 -14.8 -6.5 17.2 30.6 -15.7 8.6 1.1 -4.2 Apr. 7.0 15.7 -22.2 9.5 -18.8 -24.8 16.8 27.7 -15.0 21.0 -5.6 2.8 May 75.1 12.4 -10.1 -6.3 -5.4 -8.8 48.1 17.9 39.2 -4.1 -7.3 -0.5 June 56.3 30.1 -29.0 9.9 15.3 12.8 33.5 -26.9 32.4 -33.0 15.3 -4.1 July 16.1 28.4 -9.8 5.9 -9.0 -15.0 5.9 -5.0 5.3 8.9 -0.7 1.2 Aug. 28.6 13.8 -22.1 15.4 5.4 -1.1 19.2 -7.8 6.5 -7.7 7.0 0.1 Sep. 2.0 15.8 -14.5 9.2 -18.1 -9.8 8.1 9.4 -4.3 1.6 3.4 1.2 Oct. 23.9 28.5 -24.2 21.8 -7.2 -5.6 18.6 -11.6 15.0 -11.4 2.9 -2.9
12-month cumulated transactions
2013 Oct. 337.7 223.2 -240.3 166.0 -128.7 -129.0 267.9 113.0 44.8 -35.5 38.9 17.5
C38 Main b.o.p. items mirroring developments in MFI net external transactions 1)
(EUR billions; 12-month cumulated transactions)
-600
-400
-200
0
200
400
600
2007 2008 2009 2010 2011 2012 2013-600
-400
-200
0
200
400
600
total mirroring net external transactions by MFIscurrent and capital account balancedirect and portfolio equity investment abroad by non-MFIsportfolio investment liabilities of non-MFIs in the form of debt instruments
Source: ECB.1) Data refer to the changing composition of the euro area. For further information, see the General Notes.

EURO AREASTATISTICS
Externaltransactions
andpositions
7.5 Trade in goods
S 71ECB
Monthly BulletinJanuary 2014
1. Values and volumes by product group 1) (seasonally adjusted, unless otherwise indicated)
Values (EUR billions; annual percentage changes for columns 1 and 2)
Total (n.s.a.) Exports (f.o.b.) Imports (c.i.f.)
Total Memo item: Total Memo items:
Exports Imports Intermediate Capital Consumption Manufacturing Intermediate Capital Consumption Manufacturing Oil
1 2 3 4 5 6 7 8 9 10 11 12 13
2011 13.0 13.3 1,748.1 879.3 353.7 474.5 1,426.8 1,761.6 1,128.1 240.4 367.3 1,104.9 324.42012 7.5 1.9 1,877.9 931.6 385.9 516.3 1,523.8 1,791.3 1,148.8 246.7 369.5 1,093.3 361.5
2012 Q4 5.7 1.1 468.6 231.8 96.5 128.6 378.7 439.6 280.4 59.6 91.8 268.8 90.32013 Q1 0.7 -5.1 473.5 235.6 96.0 132.7 383.3 437.2 279.0 59.9 91.3 269.4 86.9 Q2 1.6 -3.2 473.6 230.8 96.8 132.4 385.3 433.1 274.8 59.2 91.0 267.4 84.6 Q3 0.1 -2.0 471.8 229.7 93.9 133.3 383.9 436.1 274.0 59.3 93.1 269.4 85.5
2013 May -0.3 -5.6 156.1 76.1 31.6 43.4 130.3 142.9 90.4 19.5 30.2 90.7 28.1 June -2.9 -5.2 158.2 77.0 32.1 44.6 127.8 145.6 92.2 19.8 30.6 88.6 27.8 July 3.1 0.3 156.2 76.1 31.6 44.0 127.7 145.5 92.4 19.5 30.8 89.7 29.2 Aug. -6.0 -7.6 157.0 76.5 31.0 44.6 127.9 144.4 91.3 20.3 30.5 88.9 28.4 Sep. 2.9 1.5 158.6 77.1 31.3 44.7 128.2 146.2 90.2 19.5 31.8 90.8 27.9 Oct. 1.2 -3.5 159.0 . . . 129.3 144.5 . . . 88.9 .
Volume indices (2000 = 100; annual percentage changes for columns 1 and 2)
2011 7.6 3.2 108.2 107.5 111.1 107.8 108.8 103.0 103.7 103.1 100.8 104.7 98.02012 3.7 -2.9 111.9 110.2 117.0 111.8 112.6 99.6 100.8 99.4 96.1 99.8 99.3
2012 Q4 2.7 -2.3 111.3 109.5 116.9 110.7 111.5 97.9 99.0 96.2 95.1 97.8 100.32013 Q1 0.0 -4.2 113.2 111.9 116.3 115.6 113.8 98.3 99.6 96.1 95.5 98.9 97.4 Q2 1.5 -1.3 113.2 110.3 116.1 114.5 113.8 98.9 100.8 93.9 94.6 97.9 100.8 Q3 1.7 1.8 113.5 110.8 113.1 115.6 114.1 99.6 100.1 96.1 97.2 99.5 98.9
2013 Apr. 8.3 2.9 114.1 110.9 119.4 115.5 112.7 98.1 100.4 93.5 93.5 96.0 101.0 May -0.1 -3.4 112.1 109.3 113.8 112.9 115.7 98.4 100.1 93.5 94.6 100.2 101.8 June -3.0 -3.3 113.3 110.6 115.0 115.1 113.0 100.2 102.0 94.7 95.7 97.5 99.6 July 4.3 2.9 112.8 110.3 113.7 114.8 113.9 100.3 102.5 93.8 96.5 99.0 104.6 Aug. -4.0 -3.3 113.4 110.6 112.0 116.2 114.1 98.8 99.8 99.7 95.1 98.5 97.3 Sep. 4.5 5.9 114.3 111.5 113.7 115.7 114.2 99.8 98.1 94.9 99.9 100.8 94.7
2. Prices 2) (annual percentage changes, unless otherwise indicated)
Industrial producer export prices (f.o.b.) 3) Industrial import prices (c.i.f.)
Total Total Memo Total Total Memo
(index: item: (index: item:2010 = 100) Intermediate Capital Consumer Energy Manufac- 2010 = 100) Intermediate Capital Consumer Energy Manufac-
goods goods goods turing goods goods goods turing
% of total 100.0 100.0 30.1 42.0 18.5 9.4 96.4 100.0 100.0 29.0 25.4 23.3 22.4 80.4
1 2 3 4 5 6 7 8 9 10 11 12 13 14
2011 103.8 3.8 5.4 1.1 1.6 22.4 3.6 107.6 7.5 4.1 -1.5 3.6 25.5 2.92012 106.1 2.3 0.9 1.8 2.2 9.5 2.2 111.2 3.4 0.2 1.6 3.2 7.2 2.1
2013 Q1 105.8 -0.1 -0.5 0.3 1.3 -5.3 -0.1 109.9 -1.6 -0.9 -1.2 1.2 -4.1 -0.6 Q2 105.1 -0.9 -1.6 0.1 1.1 -8.8 -0.8 107.9 -2.8 -2.1 -1.6 0.6 -6.0 -1.4 Q3 105.0 -1.5 -1.8 -0.6 0.7 -9.4 -1.3 108.1 -3.3 -3.2 -2.9 -0.9 -5.5 -2.6
2013 May 105.2 -1.0 -1.8 0.1 1.1 -9.3 -0.8 107.8 -3.1 -2.1 -1.8 0.7 -6.7 -1.5 June 104.8 -0.9 -1.7 -0.5 0.7 -3.6 -0.8 107.4 -1.9 -2.7 -2.3 -0.3 -1.9 -1.7 July 105.1 -1.1 -1.5 -0.6 0.7 -5.6 -0.9 107.9 -2.8 -3.2 -3.2 -0.8 -3.8 -2.5 Aug. 105.0 -1.7 -1.8 -0.7 0.6 -11.2 -1.6 108.1 -4.1 -3.3 -3.0 -1.2 -7.4 -2.8 Sep. 104.9 -1.6 -2.1 -0.3 0.8 -11.4 -1.5 108.2 -3.1 -3.0 -2.3 -0.7 -5.3 -2.5 Oct. 104.5 -1.6 -2.1 -0.5 0.6 -11.1 -1.4 107.2 -3.4 -3.0 -2.5 -0.8 -5.7 -2.7
Source: Eurostat.1) Product groups as classified in the Broad Economic Categories. Unlike the product groups shown in Table 2, intermediate and consumption product groups include
agricultural and energy products.2) Product groups as classified in the Main Industrial Groupings. Unlike the product groups shown in Table 1, intermediate and consumer goods do not include
energy products, and agricultural goods are not covered. Manufacturing has a different composition compared with the data shown in columns 7 and 12 of Table 1. Data shownare price indices which follow the pure price change for a basket of products and are not simple ratios of the value and volume data shown in Table 1, which are affectedby changes in the composition and quality of traded goods. These indices differ from the GDP deflators for imports and exports (shown in Table 3 in Section 5.1), mainlybecause those deflators include all goods and services and cover cross-border trade within the euro area.
3) Industrial producer export prices refer to direct transactions between domestic producers and non-domestic customers. Contrary to the data shown for values and volumes in Table 1, exports from wholesalers and re-exports are not covered.
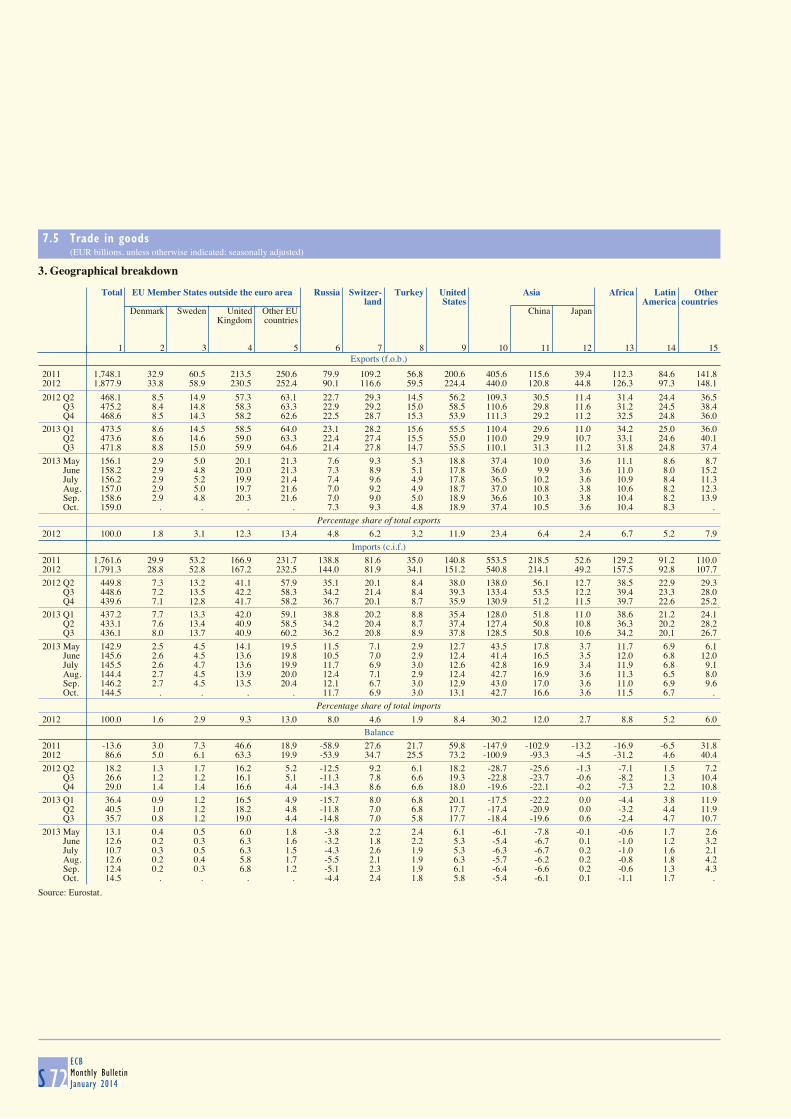
7.5 Trade in goods (EUR billions, unless otherwise indicated; seasonally adjusted)
S 72ECBMonthly BulletinJanuary 2014
3. Geographical breakdown
Exports (f.o.b.)
Total EU Member States outside the euro area Russia Switzer- Turkey United Asia Africa Latin Other
land States America countriesDenmark Sweden United Other EU China Japan
Kingdom countries
1 2 3 4 5 6 7 8 9 10 11 12 13 14 15
2011 1,748.1 32.9 60.5 213.5 250.6 79.9 109.2 56.8 200.6 405.6 115.6 39.4 112.3 84.6 141.82012 1,877.9 33.8 58.9 230.5 252.4 90.1 116.6 59.5 224.4 440.0 120.8 44.8 126.3 97.3 148.1
2012 Q2 468.1 8.5 14.9 57.3 63.1 22.7 29.3 14.5 56.2 109.3 30.5 11.4 31.4 24.4 36.5 Q3 475.2 8.4 14.8 58.3 63.3 22.9 29.2 15.0 58.5 110.6 29.8 11.6 31.2 24.5 38.4 Q4 468.6 8.5 14.3 58.2 62.6 22.5 28.7 15.3 53.9 111.3 29.2 11.2 32.5 24.8 36.0
2013 Q1 473.5 8.6 14.5 58.5 64.0 23.1 28.2 15.6 55.5 110.4 29.6 11.0 34.2 25.0 36.0 Q2 473.6 8.6 14.6 59.0 63.3 22.4 27.4 15.5 55.0 110.0 29.9 10.7 33.1 24.6 40.1 Q3 471.8 8.8 15.0 59.9 64.6 21.4 27.8 14.7 55.5 110.1 31.3 11.2 31.8 24.8 37.4
2013 May 156.1 2.9 5.0 20.1 21.3 7.6 9.3 5.3 18.8 37.4 10.0 3.6 11.1 8.6 8.7 June 158.2 2.9 4.8 20.0 21.3 7.3 8.9 5.1 17.8 36.0 9.9 3.6 11.0 8.0 15.2 July 156.2 2.9 5.2 19.9 21.4 7.4 9.6 4.9 17.8 36.5 10.2 3.6 10.9 8.4 11.3 Aug. 157.0 2.9 5.0 19.7 21.6 7.0 9.2 4.9 18.7 37.0 10.8 3.8 10.6 8.2 12.3 Sep. 158.6 2.9 4.8 20.3 21.6 7.0 9.0 5.0 18.9 36.6 10.3 3.8 10.4 8.2 13.9 Oct. 159.0 . . . . 7.3 9.3 4.8 18.9 37.4 10.5 3.6 10.4 8.3 .
Percentage share of total exports
2012 100.0 1.8 3.1 12.3 13.4 4.8 6.2 3.2 11.9 23.4 6.4 2.4 6.7 5.2 7.9
Imports (c.i.f.)
2011 1,761.6 29.9 53.2 166.9 231.7 138.8 81.6 35.0 140.8 553.5 218.5 52.6 129.2 91.2 110.02012 1,791.3 28.8 52.8 167.2 232.5 144.0 81.9 34.1 151.2 540.8 214.1 49.2 157.5 92.8 107.7
2012 Q2 449.8 7.3 13.2 41.1 57.9 35.1 20.1 8.4 38.0 138.0 56.1 12.7 38.5 22.9 29.3 Q3 448.6 7.2 13.5 42.2 58.3 34.2 21.4 8.4 39.3 133.4 53.5 12.2 39.4 23.3 28.0 Q4 439.6 7.1 12.8 41.7 58.2 36.7 20.1 8.7 35.9 130.9 51.2 11.5 39.7 22.6 25.2
2013 Q1 437.2 7.7 13.3 42.0 59.1 38.8 20.2 8.8 35.4 128.0 51.8 11.0 38.6 21.2 24.1 Q2 433.1 7.6 13.4 40.9 58.5 34.2 20.4 8.7 37.4 127.4 50.8 10.8 36.3 20.2 28.2 Q3 436.1 8.0 13.7 40.9 60.2 36.2 20.8 8.9 37.8 128.5 50.8 10.6 34.2 20.1 26.7
2013 May 142.9 2.5 4.5 14.1 19.5 11.5 7.1 2.9 12.7 43.5 17.8 3.7 11.7 6.9 6.1 June 145.6 2.6 4.5 13.6 19.8 10.5 7.0 2.9 12.4 41.4 16.5 3.5 12.0 6.8 12.0 July 145.5 2.6 4.7 13.6 19.9 11.7 6.9 3.0 12.6 42.8 16.9 3.4 11.9 6.8 9.1 Aug. 144.4 2.7 4.5 13.9 20.0 12.4 7.1 2.9 12.4 42.7 16.9 3.6 11.3 6.5 8.0 Sep. 146.2 2.7 4.5 13.5 20.4 12.1 6.7 3.0 12.9 43.0 17.0 3.6 11.0 6.9 9.6 Oct. 144.5 . . . . 11.7 6.9 3.0 13.1 42.7 16.6 3.6 11.5 6.7 .
Percentage share of total imports
2012 100.0 1.6 2.9 9.3 13.0 8.0 4.6 1.9 8.4 30.2 12.0 2.7 8.8 5.2 6.0
Balance
2011 -13.6 3.0 7.3 46.6 18.9 -58.9 27.6 21.7 59.8 -147.9 -102.9 -13.2 -16.9 -6.5 31.82012 86.6 5.0 6.1 63.3 19.9 -53.9 34.7 25.5 73.2 -100.9 -93.3 -4.5 -31.2 4.6 40.4
2012 Q2 18.2 1.3 1.7 16.2 5.2 -12.5 9.2 6.1 18.2 -28.7 -25.6 -1.3 -7.1 1.5 7.2 Q3 26.6 1.2 1.2 16.1 5.1 -11.3 7.8 6.6 19.3 -22.8 -23.7 -0.6 -8.2 1.3 10.4 Q4 29.0 1.4 1.4 16.6 4.4 -14.3 8.6 6.6 18.0 -19.6 -22.1 -0.2 -7.3 2.2 10.8
2013 Q1 36.4 0.9 1.2 16.5 4.9 -15.7 8.0 6.8 20.1 -17.5 -22.2 0.0 -4.4 3.8 11.9 Q2 40.5 1.0 1.2 18.2 4.8 -11.8 7.0 6.8 17.7 -17.4 -20.9 0.0 -3.2 4.4 11.9 Q3 35.7 0.8 1.2 19.0 4.4 -14.8 7.0 5.8 17.7 -18.4 -19.6 0.6 -2.4 4.7 10.7
2013 May 13.1 0.4 0.5 6.0 1.8 -3.8 2.2 2.4 6.1 -6.1 -7.8 -0.1 -0.6 1.7 2.6 June 12.6 0.2 0.3 6.3 1.6 -3.2 1.8 2.2 5.3 -5.4 -6.7 0.1 -1.0 1.2 3.2 July 10.7 0.3 0.5 6.3 1.5 -4.3 2.6 1.9 5.3 -6.3 -6.7 0.2 -1.0 1.6 2.1 Aug. 12.6 0.2 0.4 5.8 1.7 -5.5 2.1 1.9 6.3 -5.7 -6.2 0.2 -0.8 1.8 4.2 Sep. 12.4 0.2 0.3 6.8 1.2 -5.1 2.3 1.9 6.1 -6.4 -6.6 0.2 -0.6 1.3 4.3 Oct. 14.5 . . . . -4.4 2.4 1.8 5.8 -5.4 -6.1 0.1 -1.1 1.7 .
Source: Eurostat.
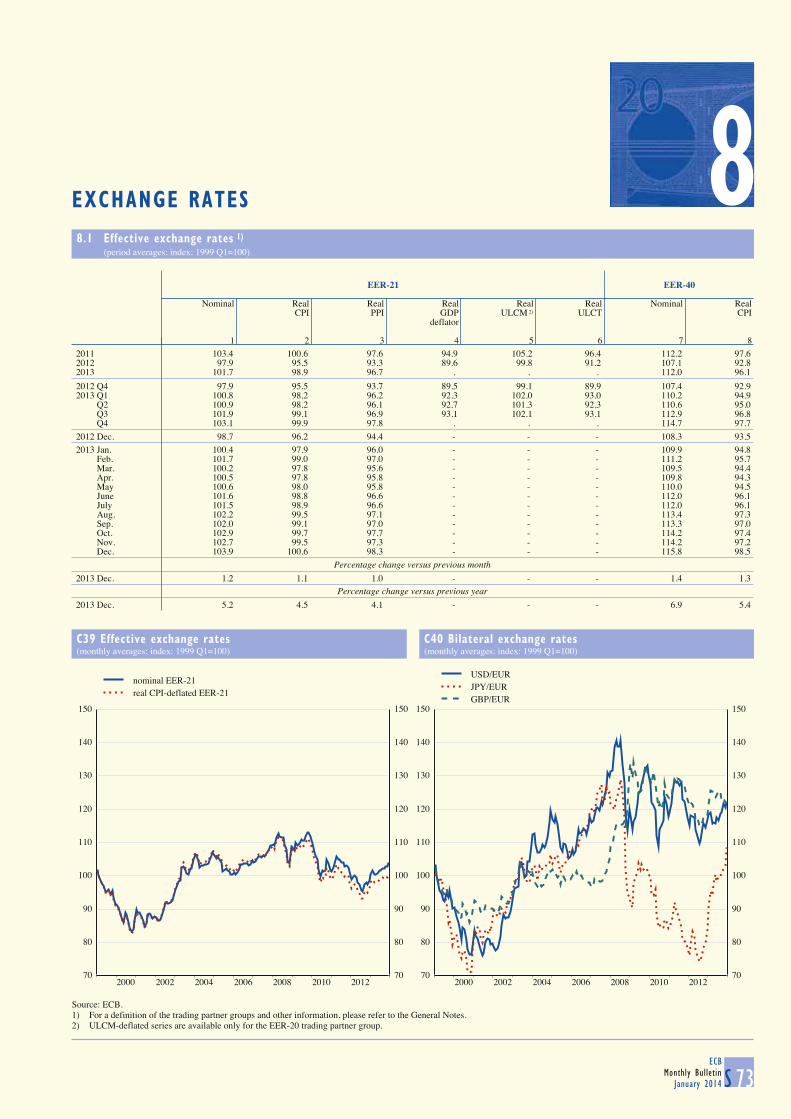
8EXCHANGE RATES
8.1 Effective exchange rates 1) (period averages; index: 1999 Q1=100)
S 73ECB
Monthly BulletinJanuary 2014
EER-21 EER-40
Nominal Real Real Real Real Real Nominal RealCPI PPI GDP ULCM 2) ULCT CPI
deflator
1 2 3 4 5 6 7 8
2011 103.4 100.6 97.6 94.9 105.2 96.4 112.2 97.62012 97.9 95.5 93.3 89.6 99.8 91.2 107.1 92.82013 101.7 98.9 96.7 . . . 112.0 96.1
2012 Q4 97.9 95.5 93.7 89.5 99.1 89.9 107.4 92.92013 Q1 100.8 98.2 96.2 92.3 102.0 93.0 110.2 94.9 Q2 100.9 98.2 96.1 92.7 101.3 92.3 110.6 95.0 Q3 101.9 99.1 96.9 93.1 102.1 93.1 112.9 96.8 Q4 103.1 99.9 97.8 . . . 114.7 97.7
2012 Dec. 98.7 96.2 94.4 - - - 108.3 93.5
2013 Jan. 100.4 97.9 96.0 - - - 109.9 94.8 Feb. 101.7 99.0 97.0 - - - 111.2 95.7 Mar. 100.2 97.8 95.6 - - - 109.5 94.4 Apr. 100.5 97.8 95.8 - - - 109.8 94.3 May 100.6 98.0 95.8 - - - 110.0 94.5 June 101.6 98.8 96.6 - - - 112.0 96.1 July 101.5 98.9 96.6 - - - 112.0 96.1 Aug. 102.2 99.5 97.1 - - - 113.4 97.3 Sep. 102.0 99.1 97.0 - - - 113.3 97.0 Oct. 102.9 99.7 97.7 - - - 114.2 97.4 Nov. 102.7 99.5 97.3 - - - 114.2 97.2 Dec. 103.9 100.6 98.3 - - - 115.8 98.5
Percentage change versus previous month
2013 Dec. 1.2 1.1 1.0 - - - 1.4 1.3Percentage change versus previous year
2013 Dec. 5.2 4.5 4.1 - - - 6.9 5.4
C39 Effective exchange rates
(monthly averages; index: 1999 Q1=100)
C40 Bilateral exchange rates
(monthly averages; index: 1999 Q1=100)
70
80
90
100
110
120
130
140
150
2000 2002 2004 2006 2008 2010 201270
80
90
100
110
120
130
140
150
nominal EER-21real CPI-deflated EER-21
70
80
90
100
110
120
130
140
150
2000 2002 2004 2006 2008 2010 201270
80
90
100
110
120
130
140
150
USD/EURJPY/EURGBP/EUR
Source: ECB.1) For a definition of the trading partner groups and other information, please refer to the General Notes.2) ULCM-deflated series are available only for the EER-20 trading partner group.
8

8.2 Bilateral exchange rates (period averages; units of national currency per euro)
S 74ECBMonthly BulletinJanuary 2014
Bulgarian Czech Danish Croatian Latvian Lithuanian Hungarian Polish New Roma- Swedish Pound New Turkishlev koruna krone kuna lats litas forint zloty nian leu krona sterling lira
1 2 3 4 5 6 7 8 9 10 11 12
2011 1.9558 24.590 7.4506 7.4390 0.7063 3.4528 279.37 4.1206 4.2391 9.0298 0.86788 2.33782012 1.9558 25.149 7.4437 7.5217 0.6973 3.4528 289.25 4.1847 4.4593 8.7041 0.81087 2.31352013 1.9558 25.980 7.4579 7.5786 0.7015 3.4528 296.87 4.1975 4.4190 8.6515 0.84926 2.5335
2013 Q2 1.9558 25.831 7.4555 7.5566 0.7009 3.4528 295.53 4.1982 4.3958 8.5652 0.85056 2.4037 Q3 1.9558 25.853 7.4580 7.5459 0.7025 3.4528 297.96 4.2477 4.4410 8.6798 0.85453 2.6092 Q4 1.9558 26.658 7.4593 7.6290 0.7028 3.4528 297.43 4.1853 4.4506 8.8575 0.84074 2.7537
2013 June 1.9558 25.759 7.4576 7.4901 0.7019 3.4528 295.70 4.2839 4.4803 8.6836 0.85191 2.5028 July 1.9558 25.944 7.4579 7.5061 0.7024 3.4528 294.90 4.2745 4.4244 8.6609 0.86192 2.5274 Aug. 1.9558 25.818 7.4580 7.5372 0.7027 3.4528 299.46 4.2299 4.4371 8.7034 0.85904 2.6125 Sep. 1.9558 25.789 7.4579 7.5985 0.7026 3.4528 299.75 4.2371 4.4633 8.6758 0.84171 2.6952 Oct. 1.9558 25.662 7.4592 7.6193 0.7028 3.4528 294.76 4.1902 4.4444 8.7479 0.84720 2.7095 Nov. 1.9558 26.927 7.4587 7.6326 0.7028 3.4528 297.68 4.1887 4.4452 8.8802 0.83780 2.7316 Dec. 1.9558 27.521 7.4602 7.6365 0.7027 3.4528 300.24 4.1760 4.4635 8.9597 0.83639 2.8276
Percentage change versus previous month
2013 Dec. 0.0 2.2 0.0 0.1 0.0 0.0 0.9 -0.3 0.4 0.9 -0.2 3.5
Percentage change versus previous year
2013 Dec. 0.0 9.2 0.0 1.4 0.9 0.0 5.1 2.0 -0.6 3.6 3.0 20.6
Australian Brazilian Canadian Chinese Hong Kong Indian Indonesian Israeli Japanese Malaysiandollar real dollar yuan renminbi dollar rupee 1) rupiah shekel yen ringgit
13 14 15 16 17 18 19 20 21 22
2011 1.3484 2.3265 1.3761 8.9960 10.8362 64.8859 12,206.51 4.9775 110.96 4.25582012 1.2407 2.5084 1.2842 8.1052 9.9663 68.5973 12,045.73 4.9536 102.49 3.96722013 1.3777 2.8687 1.3684 8.1646 10.3016 77.9300 13,857.50 4.7948 129.66 4.1855
2013 Q2 1.3203 2.6994 1.3368 8.0376 10.1383 73.0046 12,784.60 4.7407 129.07 4.0088 Q3 1.4465 3.0304 1.3760 8.1111 10.2696 82.3565 14,115.14 4.7459 131.02 4.2904 Q4 1.4662 3.0931 1.4275 8.2903 10.5522 84.4048 15,682.97 4.7994 136.48 4.3633
2013 June 1.3978 2.8613 1.3596 8.0905 10.2349 77.0284 13,033.31 4.7865 128.40 4.1488 July 1.4279 2.9438 1.3619 8.0234 10.1455 78.1762 13,189.17 4.7153 130.39 4.1746 Aug. 1.4742 3.1170 1.3853 8.1477 10.3223 83.9480 14,168.72 4.7610 130.34 4.3631 Sep. 1.4379 3.0345 1.3817 8.1690 10.3504 85.2678 15,073.16 4.7636 132.41 4.3410 Oct. 1.4328 2.9860 1.4128 8.3226 10.5724 84.0071 15,109.54 4.8232 133.32 4.3283 Nov. 1.4473 3.0959 1.4145 8.2221 10.4604 84.4990 15,575.06 4.7711 134.97 4.3176 Dec. 1.5243 3.2133 1.4580 8.3248 10.6254 84.7631 16,455.73 4.8019 141.68 4.4517
Percentage change versus previous month
2013 Dec. 5.3 3.8 3.1 1.2 1.6 0.3 5.7 0.6 5.0 3.1
Percentage change versus previous year
2013 Dec. 21.7 17.9 12.3 1.8 4.5 18.2 30.2 -3.1 29.1 11.1
Mexican New Zealand Norwegian Philippine Russian Singapore South African South Korean Swiss Thai USpeso dollar krone peso rouble dollar rand won franc baht dollar
23 24 25 26 27 28 29 30 31 32 33
2011 17.2877 1.7600 7.7934 60.260 40.8846 1.7489 10.0970 1,541.23 1.2326 42.429 1.39202012 16.9029 1.5867 7.4751 54.246 39.9262 1.6055 10.5511 1,447.69 1.2053 39.928 1.28482013 16.9641 1.6206 7.8067 56.428 42.3370 1.6619 12.8330 1,453.91 1.2311 40.830 1.3281
2013 Q2 16.2956 1.5920 7.6114 54.620 41.3464 1.6311 12.3996 1,467.08 1.2315 39.031 1.3062 Q3 17.1005 1.6612 7.9303 57.813 43.4394 1.6795 13.2329 1,469.03 1.2348 41.675 1.3242 Q4 17.7331 1.6439 8.2375 59.354 44.2920 1.7006 13.8224 1,445.53 1.2294 43.151 1.3610
2013 June 17.0716 1.6682 7.7394 56.658 42.6490 1.6613 13.2088 1,498.33 1.2322 40.664 1.3189 July 16.6893 1.6590 7.8837 56.698 42.8590 1.6595 12.9674 1,473.35 1.2366 40.714 1.3080 Aug. 17.1996 1.6829 7.9386 58.471 43.9748 1.6941 13.4190 1,485.93 1.2338 42.072 1.3310 Sep. 17.4471 1.6406 7.9725 58.346 43.5144 1.6860 13.3287 1,446.60 1.2338 42.312 1.3348 Oct. 17.7413 1.6351 8.1208 58.809 43.7440 1.6956 13.5283 1,454.73 1.2316 42.549 1.3635 Nov. 17.6340 1.6327 8.2055 58.811 44.1581 1.6833 13.7626 1,434.06 1.2316 42.695 1.3493 Dec. 17.8278 1.6659 8.4053 60.552 45.0628 1.7244 14.2234 1,446.99 1.2245 44.323 1.3704
Percentage change versus previous month
2013 Dec. 1.1 2.0 2.4 3.0 2.0 2.4 3.3 0.9 -0.6 3.8 1.6
Percentage change versus previous year
2013 Dec. 5.7 5.6 14.4 12.6 11.8 7.7 25.7 2.5 1.3 10.3 4.5
Source: ECB.1) For this currency the ECB computes and publishes euro reference exchange rates as from 1 January 2009. Previous data are indicative.
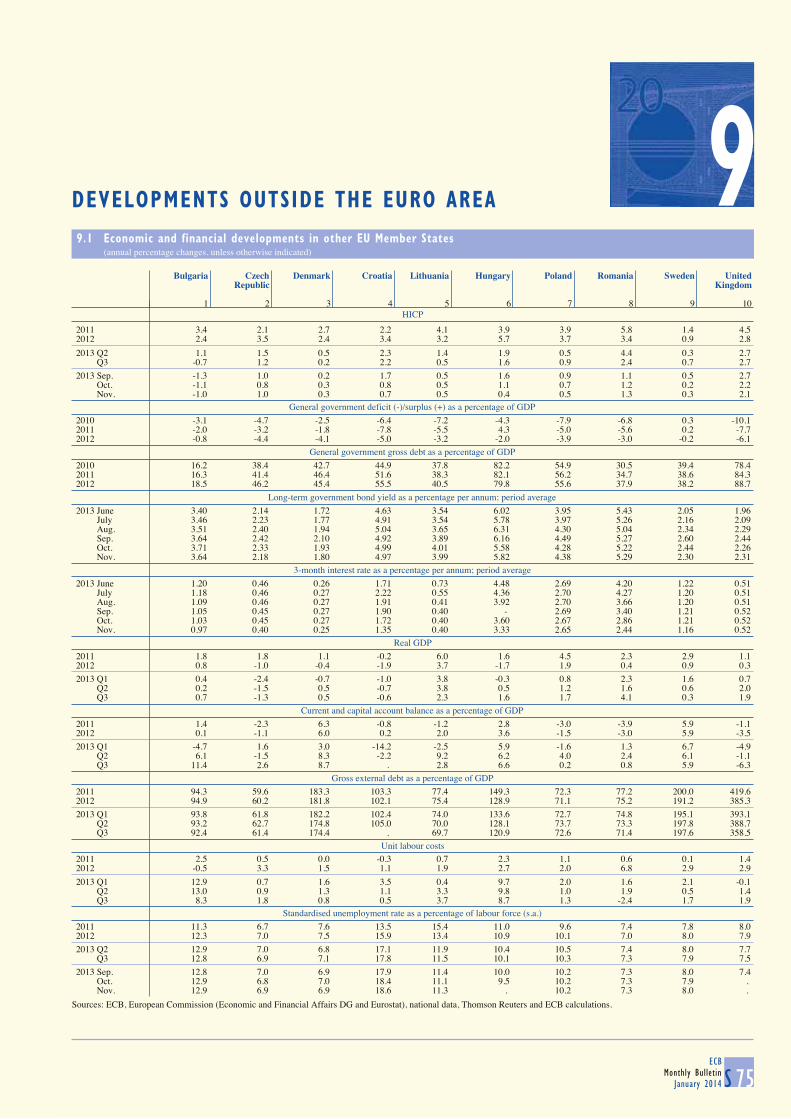
9DEVELOPMENTS OUTSIDE THE EURO AREA
9.1 Economic and financial developments in other EU Member States (annual percentage changes, unless otherwise indicated)
S 75ECB
Monthly BulletinJanuary 2014
HICP
Bulgaria Czech Denmark Croatia Lithuania Hungary Poland Romania Sweden UnitedRepublic Kingdom
1 2 3 4 5 6 7 8 9 10
2011 3.4 2.1 2.7 2.2 4.1 3.9 3.9 5.8 1.4 4.52012 2.4 3.5 2.4 3.4 3.2 5.7 3.7 3.4 0.9 2.8
2013 Q2 1.1 1.5 0.5 2.3 1.4 1.9 0.5 4.4 0.3 2.7 Q3 -0.7 1.2 0.2 2.2 0.5 1.6 0.9 2.4 0.7 2.7
2013 Sep. -1.3 1.0 0.2 1.7 0.5 1.6 0.9 1.1 0.5 2.7 Oct. -1.1 0.8 0.3 0.8 0.5 1.1 0.7 1.2 0.2 2.2 Nov. -1.0 1.0 0.3 0.7 0.5 0.4 0.5 1.3 0.3 2.1
General government deficit (-)/surplus (+) as a percentage of GDP
2010 -3.1 -4.7 -2.5 -6.4 -7.2 -4.3 -7.9 -6.8 0.3 -10.12011 -2.0 -3.2 -1.8 -7.8 -5.5 4.3 -5.0 -5.6 0.2 -7.72012 -0.8 -4.4 -4.1 -5.0 -3.2 -2.0 -3.9 -3.0 -0.2 -6.1
General government gross debt as a percentage of GDP
2010 16.2 38.4 42.7 44.9 37.8 82.2 54.9 30.5 39.4 78.42011 16.3 41.4 46.4 51.6 38.3 82.1 56.2 34.7 38.6 84.32012 18.5 46.2 45.4 55.5 40.5 79.8 55.6 37.9 38.2 88.7
Long-term government bond yield as a percentage per annum; period average
2013 June 3.40 2.14 1.72 4.63 3.54 6.02 3.95 5.43 2.05 1.96 July 3.46 2.23 1.77 4.91 3.54 5.78 3.97 5.26 2.16 2.09 Aug. 3.51 2.40 1.94 5.04 3.65 6.31 4.30 5.04 2.34 2.29 Sep. 3.64 2.42 2.10 4.92 3.89 6.16 4.49 5.27 2.60 2.44 Oct. 3.71 2.33 1.93 4.99 4.01 5.58 4.28 5.22 2.44 2.26 Nov. 3.64 2.18 1.80 4.97 3.99 5.82 4.38 5.29 2.30 2.31
3-month interest rate as a percentage per annum; period average
2013 June 1.20 0.46 0.26 1.71 0.73 4.48 2.69 4.20 1.22 0.51 July 1.18 0.46 0.27 2.22 0.55 4.36 2.70 4.27 1.20 0.51 Aug. 1.09 0.46 0.27 1.91 0.41 3.92 2.70 3.66 1.20 0.51 Sep. 1.05 0.45 0.27 1.90 0.40 - 2.69 3.40 1.21 0.52 Oct. 1.03 0.45 0.27 1.72 0.40 3.60 2.67 2.86 1.21 0.52 Nov. 0.97 0.40 0.25 1.35 0.40 3.33 2.65 2.44 1.16 0.52
Real GDP
2011 1.8 1.8 1.1 -0.2 6.0 1.6 4.5 2.3 2.9 1.12012 0.8 -1.0 -0.4 -1.9 3.7 -1.7 1.9 0.4 0.9 0.3
2013 Q1 0.4 -2.4 -0.7 -1.0 3.8 -0.3 0.8 2.3 1.6 0.7 Q2 0.2 -1.5 0.5 -0.7 3.8 0.5 1.2 1.6 0.6 2.0 Q3 0.7 -1.3 0.5 -0.6 2.3 1.6 1.7 4.1 0.3 1.9
Current and capital account balance as a percentage of GDP
2011 1.4 -2.3 6.3 -0.8 -1.2 2.8 -3.0 -3.9 5.9 -1.12012 0.1 -1.1 6.0 0.2 2.0 3.6 -1.5 -3.0 5.9 -3.5
2013 Q1 -4.7 1.6 3.0 -14.2 -2.5 5.9 -1.6 1.3 6.7 -4.9 Q2 6.1 -1.5 8.3 -2.2 9.2 6.2 4.0 2.4 6.1 -1.1 Q3 11.4 2.6 8.7 . 2.8 6.6 0.2 0.8 5.9 -6.3
Gross external debt as a percentage of GDP
2011 94.3 59.6 183.3 103.3 77.4 149.3 72.3 77.2 200.0 419.62012 94.9 60.2 181.8 102.1 75.4 128.9 71.1 75.2 191.2 385.3
2013 Q1 93.8 61.8 182.2 102.4 74.0 133.6 72.7 74.8 195.1 393.1 Q2 93.2 62.7 174.8 105.0 70.0 128.1 73.7 73.3 197.8 388.7 Q3 92.4 61.4 174.4 . 69.7 120.9 72.6 71.4 197.6 358.5
Unit labour costs
2011 2.5 0.5 0.0 -0.3 0.7 2.3 1.1 0.6 0.1 1.42012 -0.5 3.3 1.5 1.1 1.9 2.7 2.0 6.8 2.9 2.9
2013 Q1 12.9 0.7 1.6 3.5 0.4 9.7 2.0 1.6 2.1 -0.1 Q2 13.0 0.9 1.3 1.1 3.3 9.8 1.0 1.9 0.5 1.4 Q3 8.3 1.8 0.8 0.5 3.7 8.7 1.3 -2.4 1.7 1.9
Standardised unemployment rate as a percentage of labour force (s.a.)
2011 11.3 6.7 7.6 13.5 15.4 11.0 9.6 7.4 7.8 8.02012 12.3 7.0 7.5 15.9 13.4 10.9 10.1 7.0 8.0 7.9
2013 Q2 12.9 7.0 6.8 17.1 11.9 10.4 10.5 7.4 8.0 7.7 Q3 12.8 6.9 7.1 17.8 11.5 10.1 10.3 7.3 7.9 7.5
2013 Sep. 12.8 7.0 6.9 17.9 11.4 10.0 10.2 7.3 8.0 7.4 Oct. 12.9 6.8 7.0 18.4 11.1 9.5 10.2 7.3 7.9 . Nov. 12.9 6.9 6.9 18.6 11.3 . 10.2 7.3 8.0 .
Sources: ECB, European Commission (Economic and Financial Affairs DG and Eurostat), national data, Thomson Reuters and ECB calculations.
9
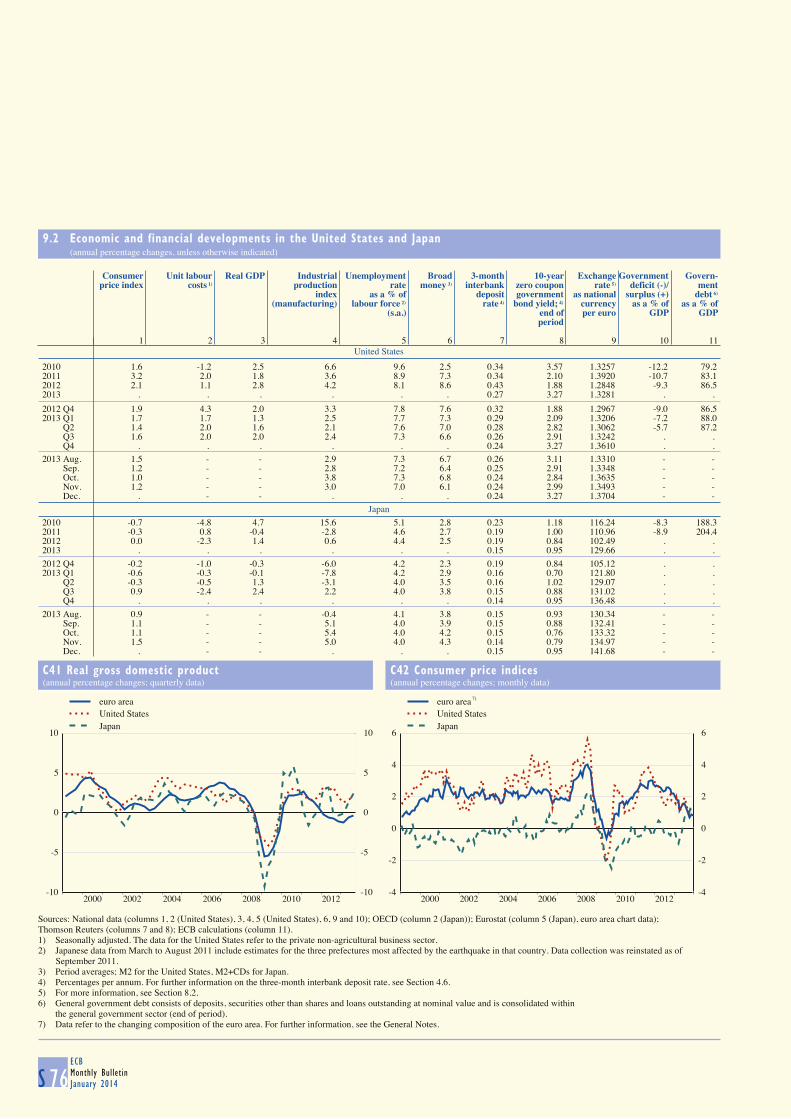
9.2 Economic and financial developments in the United States and Japan (annual percentage changes, unless otherwise indicated)
S 76ECBMonthly BulletinJanuary 2014
United States
Consumer Unit labour Real GDP Industrial Unemployment Broad 3-month 10-year Exchange Government Govern-price index costs 1) production rate money 3) interbank zero coupon rate 5) deficit (-)/ ment
index as a % of deposit government as national surplus (+) debt 6)
(manufacturing) labour force 2) rate 4) bond yield; 4) currency as a % of as a % of(s.a.) end of per euro GDP GDP
period
1 2 3 4 5 6 7 8 9 10 11
2010 1.6 -1.2 2.5 6.6 9.6 2.5 0.34 3.57 1.3257 -12.2 79.22011 3.2 2.0 1.8 3.6 8.9 7.3 0.34 2.10 1.3920 -10.7 83.12012 2.1 1.1 2.8 4.2 8.1 8.6 0.43 1.88 1.2848 -9.3 86.52013 . . . . . . 0.27 3.27 1.3281 . .
2012 Q4 1.9 4.3 2.0 3.3 7.8 7.6 0.32 1.88 1.2967 -9.0 86.52013 Q1 1.7 1.7 1.3 2.5 7.7 7.3 0.29 2.09 1.3206 -7.2 88.0 Q2 1.4 2.0 1.6 2.1 7.6 7.0 0.28 2.82 1.3062 -5.7 87.2 Q3 1.6 2.0 2.0 2.4 7.3 6.6 0.26 2.91 1.3242 . . Q4 . . . . . . 0.24 3.27 1.3610 . .
2013 Aug. 1.5 - - 2.9 7.3 6.7 0.26 3.11 1.3310 - - Sep. 1.2 - - 2.8 7.2 6.4 0.25 2.91 1.3348 - - Oct. 1.0 - - 3.8 7.3 6.8 0.24 2.84 1.3635 - - Nov. 1.2 - - 3.0 7.0 6.1 0.24 2.99 1.3493 - - Dec. . - - . . . 0.24 3.27 1.3704 - -
Japan
2010 -0.7 -4.8 4.7 15.6 5.1 2.8 0.23 1.18 116.24 -8.3 188.32011 -0.3 0.8 -0.4 -2.8 4.6 2.7 0.19 1.00 110.96 -8.9 204.42012 0.0 -2.3 1.4 0.6 4.4 2.5 0.19 0.84 102.49 . . 2013 . . . . . . 0.15 0.95 129.66 . .
2012 Q4 -0.2 -1.0 -0.3 -6.0 4.2 2.3 0.19 0.84 105.12 . . 2013 Q1 -0.6 -0.3 -0.1 -7.8 4.2 2.9 0.16 0.70 121.80 . . Q2 -0.3 -0.5 1.3 -3.1 4.0 3.5 0.16 1.02 129.07 . . Q3 0.9 -2.4 2.4 2.2 4.0 3.8 0.15 0.88 131.02 . . Q4 . . . . . . 0.14 0.95 136.48 . .
2013 Aug. 0.9 - - -0.4 4.1 3.8 0.15 0.93 130.34 - - Sep. 1.1 - - 5.1 4.0 3.9 0.15 0.88 132.41 - - Oct. 1.1 - - 5.4 4.0 4.2 0.15 0.76 133.32 - - Nov. 1.5 - - 5.0 4.0 4.3 0.14 0.79 134.97 - - Dec. . - - . . . 0.15 0.95 141.68 - -
C41 Real gross domestic product
(annual percentage changes; quarterly data)
C42 Consumer price indices
(annual percentage changes; monthly data)
-10
-5
0
5
10
2000 2002 2004 2006 2008 2010 2012-10
-5
0
5
10
euro areaUnited StatesJapan
-4
-2
0
2
4
6
2000 2002 2004 2006 2008 2010 2012-4
-2
0
2
4
6
euro areaUnited StatesJapan
Sources: National data (columns 1, 2 (United States), 3, 4, 5 (United States), 6, 9 and 10); OECD (column 2 (Japan)); Eurostat (column 5 (Japan), euro area chart data);Thomson Reuters (columns 7 and 8); ECB calculations (column 11).1) Seasonally adjusted. The data for the United States refer to the private non-agricultural business sector.2) Japanese data from March to August 2011 include estimates for the three prefectures most affected by the earthquake in that country. Data collection was reinstated as of
September 2011.3) Period averages; M2 for the United States, M2+CDs for Japan.4) Percentages per annum. For further information on the three-month interbank deposit rate, see Section 4.6.5) For more information, see Section 8.2.6) General government debt consists of deposits, securities other than shares and loans outstanding at nominal value and is consolidated within
the general government sector (end of period).7) Data refer to the changing composition of the euro area. For further information, see the General Notes.
7)

ECB
Monthly Bulletin
January 2014 S 77
LIST OF CHARTS
C1 Monetary aggregates S12
C2 Counterparts S12
C3 Components of monetary aggregates S13
C4 Components of longer-term fi nancial liabilities S13
C5 Loans to other fi nancial intermediaries and non-fi nancial corporations S14
C6 Loans to households S14
C7 Loans to government S16
C8 Loans to non-euro area residents S16
C9 Total deposits by sector (fi nancial intermediaries) S17
C10 Total deposits and deposits included in M3 by sector (fi nancial intermediaries) S17
C11 Total deposits by sector (non-fi nancial corporations and households) S18
C12 Total deposits and deposits included in M3 by sector (non-fi nancial corporations and households) S18
C13 Deposits by government and non-euro area residents S19
C14 MFI holdings of securities S20
C15 Total outstanding amounts and gross issues of securities other than shares issued by euro area residents S35
C16 Net issues of securities other than shares: seasonally adjusted and non-seasonally adjusted S37
C17 Annual growth rates of long-term debt securities, by sector of the issuer, in all currencies combined S38
C18 Annual growth rates of short-term debt securities, by sector of the issuer, in all currencies combined S39
C19 Annual growth rates for quoted shares issued by euro area residents S40
C20 Gross issues of quoted shares by sector of the issuer S41
C21 New deposits with an agreed maturity S43
C22 New loans with a fl oating rate and up to 1 year’s initial rate fi xation S43
C23 Euro area money market rates S44
C24 3-month money market rates S44
C25 Euro area spot yield curves S45
C26 Euro area spot rates and spreads S45
C27 Dow Jones EURO STOXX broad index, Standard & Poor’s 500 and Nikkei 225 S46
C28 Employment – persons employed and hours worked S55
C29 Unemployment and job vacancy rates S55
C30 Defi cit, borrowing requirement and change in debt S60
C31 Maastricht debt S60
C32 Euro area b.o.p: current account S61
C33 Euro area b.o.p: direct and portfolio investment S61
C34 Euro area b.o.p: goods S62
C35 Euro area b.o.p: services S62
C36 Euro area international investment position S65
C37 Euro area direct and portfolio investment position S65
C38 Main b.o.p. items mirroring developments in MFI net external transactions S70
C39 Effective exchange rates S73
C40 Bilateral exchange rates S73
C41 Real gross domestic product S76
C42 Consumer price indices S76


ECB
Monthly Bulletin
January 2014 S 79
TECHNICAL NOTES
EURO AREA OVERVIEW
CALCULATION OF GROWTH RATES FOR MONETARY DEVELOPMENTS
The average growth rate for the quarter ending in month t is calculated as:
where It is the index of adjusted outstanding amounts as at month t (see also below). Likewise, for
the year ending in month t, the average growth rate is calculated as:
SECTION 1.3
CALCULATION OF INTEREST RATES ON INDEXED LONGER-TERM REFINANCING OPERATIONS
The interest rate on an indexed longer-term refi nancing operation (LTRO) is equal to the average
of the minimum bid rates on the main refi nancing operations (MROs) over the life of that LTRO.
According to this defi nition, if an LTRO is outstanding for D number of days and the minimum
bid rates prevailing in MROs are R1, MRO
(over D1 days), R
2, MRO (over D
2 days), etc., until R
i, MRO
(over Di days), where D
1+D
2+…+D
i=D, the applicable annualised rate (R
LTRO) is calculated as:
SECTIONS 2.1 TO 2.6
CALCULATION OF TRANSACTIONS
Monthly transactions are calculated from monthly differences in outstanding amounts adjusted for
reclassifi cations, other revaluations, exchange rate variations and any other changes which do not
arise from transactions.
If Lt represents the outstanding amount at the end of month t, C
t
M the reclassifi cation adjustment
in month t, E t
M the exchange rate adjustment and V t
M the other revaluation adjustments, the
transactions F t
M in month t are defi ned as:
−1
⎞
⎠
⎟⎟⎟⎟
⎞
⎠
⎟⎟⎟⎟
×100
0.5It−12 + ∑ It−i−12 + 0.5It−15
2
i=1
0.5It + ∑ It−i + 0.5It−3
2
i=1a)
⎞
⎠
⎟⎟⎟⎟
⎞
⎠
⎟⎟⎟⎟
−1 ×1000.5It + ∑ It−i + 0.5It−12
11
i=1
0.5It−12 + ∑ It−i−12 + 0.5It−24
11
i=1
b)
RLTRO
D1R
1,MRO D2R
2,MRO Di Ri,MRO
D. . .c)
Ft = (Lt – Lt–1) – Ct – Et – VtM M M Md)

ECB
Monthly Bulletin
January 2014S 80
Similarly, the quarterly transactions F t
Q for the quarter ending in month t are defi ned as:
where Lt-3
is the amount outstanding at the end of month t-3 (the end of the previous quarter) and,
for example, C t
Q is the reclassifi cation adjustment in the quarter ending in month t.
For those quarterly series for which monthly observations are now available (see below), the
quarterly transactions can be derived as the sum of the three monthly transactions in the quarter.
CALCULATION OF GROWTH RATES FOR MONTHLY SERIES
Growth rates can be calculated from transactions or from the index of adjusted outstanding
amounts. If F t
M and Lt are defi ned as above, the index I
t of adjusted outstanding amounts in month t
is defi ned as:
The base of the index (for the non-seasonally adjusted series) is currently set as December 2010 = 100.
Time series for the index of adjusted outstanding amounts are available on the ECB’s website
(www.ecb.europa.eu) in the “Monetary and fi nancial statistics” sub-section of the “Statistics” section.
The annual growth rate at for month t – i.e. the change in the 12 months ending in month t – can be
calculated using either of the following two formulae:
Unless otherwise indicated, the annual growth rates refer to the end of the indicated period. For
example, the annual percentage change for the year 2002 is calculated in h) by dividing the index
for December 2002 by the index for December 2001.
Growth rates for intra-annual periods can be derived by adapting formula h). For example, the
month-on-month growth rate aM
t can be calculated as:
Finally, the three-month moving average (centred) for the annual growth rate of M3 is obtained
as (at+1
+ at + a
t-1)/3, where a
t is defi ned as in g) or h) above.
Ft = (Lt – Lt–3) – Ct – Et – VtQ Q Q Qe)
I t = It−1 ×Ft
Lt−1
M⎛
⎝⎜
⎞
⎠⎟1+f )
at =Ft−i
Lt−1−i
M
i=0
⎛
⎝⎜
⎞
⎠⎟
⎡
⎣⎢
⎤
⎦⎥×100∏ 1 + −1
11
g)
at =It
It−12
⎛⎝⎜
⎞⎠⎟× 100−1h)
ItIt−1
at =M −1
⎛
⎝⎜
⎞
⎠⎟ ×100i)
ECB
Monthly Bulletin
January 2014 S 81
EURO AREASTATISTICS
Technical Notes
CALCULATION OF GROWTH RATES FOR QUARTERLY SERIES
If F t
Q and Lt-3
are defi ned as above, the index It of adjusted outstanding amounts for the quarter
ending in month t is defi ned as:
The annual growth rate in the four quarters ending in month t (i.e. at) can be calculated using
formula h).
SEASONAL ADJUSTMENT OF THE EURO AREA MONETARY STATISTICS 1
The approach used is based on multiplicative decomposition using X-12-ARIMA.2 The seasonal
adjustment may include a day-of-the-week adjustment, and for some series it is carried out indirectly
by means of a linear combination of components. This is the case for M3, which is derived by
aggregating the seasonally adjusted series for M1, M2 less M1, and M3 less M2.
The seasonal adjustment procedures are fi rst applied to the index of adjusted outstanding amounts.3
The resulting estimates of seasonal factors are then applied to the levels and to the adjustments
arising from reclassifi cations and revaluations, in turn yielding seasonally adjusted transactions.
Seasonal (and trading day) factors are revised at annual intervals or as required.
SECTIONS 3.1 TO 3.5
EQUALITY OF USES AND RESOURCES
In Section 3.1 the data conform to a basic accounting identity. For non-fi nancial transactions, total
uses equal total resources for each transaction category. This accounting identity is also refl ected
in the fi nancial account – i.e. for each fi nancial instrument category, total transactions in fi nancial
assets equal total transactions in liabilities. In the other changes in assets account and the fi nancial
balance sheets, total fi nancial assets equal total liabilities for each fi nancial instrument category,
with the exception of monetary gold and special drawing rights, which are by defi nition not a
liability of any sector.
It = It−3 ×⎛
⎝⎜
⎞
⎠⎟Lt−3
FtQ
1+j)
1 For details, see “Seasonal adjustment of monetary aggregates and HICP for the euro area”, ECB (August 2000) and the “Monetary and
fi nancial statistics” sub-section of the “Statistics” section of the ECB’s website (www.ecb.europa. eu).
2 For details, see Findley, D., Monsell, B., Bell, W., Otto, M. and Chen, B. C. (1998), “New Capabilities and Methods of the X-12-ARIMA
Seasonal Adjustment Program”, Journal of Business and Economic Statistics, 16, 2, pp.127-152, or“X-12-ARIMA Reference Manual”,
Time Series Staff, Bureau of the Census, Washington, D.C.
For internal purposes, the model-based approach of TRAMO-SEATS is also used. For details of TRAMO-SEATS, see Gomez, V. and
Maravall, A. (1996), “Programs TRAMO and SEATS: Instructions for the User”, Banco de España, Working Paper No 9628, Madrid.
3 It follows that for the seasonally adjusted series, the level of the index for the base period (i.e. December 2010) generally differs from 100,
refl ecting the seasonality of that month.

ECB
Monthly Bulletin
January 2014S 82
CALCULATION OF BALANCING ITEMS
The balancing items at the end of each account in Sections 3.1, 3.2 and 3.3 are computed as follows.
The trade balance equals euro area imports minus exports vis-à-vis the rest of the world for goods
and services.
Net operating surplus and mixed income is defi ned for resident sectors only and is calculated as
gross value added (gross domestic product at market prices for the euro area) minus compensation
of employees (uses) minus other taxes less subsidies on production (uses) minus consumption of
fi xed capital (uses).
Net national income is defi ned for resident sectors only and is computed as net operating surplus and
mixed income plus compensation of employees (resources) plus taxes less subsidies on production
(resources) plus net property income (resources minus uses).
Net disposable income is also defi ned only for resident sectors and equals net national income
plus net current taxes on income and wealth (resources minus uses) plus net social contributions
(resources minus uses) plus net social benefi ts other than social transfers in kind (resources minus
uses) plus net other current transfers (resources minus uses).
Net saving is defi ned for resident sectors and is calculated as net disposable income plus the net
adjustment for the change in the net equity of households in pension fund reserves (resources minus
uses) minus fi nal consumption expenditure (uses). For the rest of the world, the current external
account is compiled as the trade balance plus all net income (resources minus uses).
Net lending/net borrowing is computed from the capital account as net saving plus net capital
transfers (resources minus uses) minus gross capital formation (uses) minus acquisitions
less disposals of non-produced non-fi nancial assets (uses) plus consumption of fi xed capital
(resources). It can also be calculated in the fi nancial account as total transactions in fi nancial
assets minus total transactions in liabilities (also known as changes in net fi nancial worth (wealth)
due to transactions). For the household and non-fi nancial corporation sectors, there is a statistical
discrepancy between the balancing items computed from the capital account and the fi nancial
account.
Changes in net fi nancial worth (wealth) due to transactions are computed as total transactions in
fi nancial assets minus total transactions in liabilities, whereas other changes in net fi nancial worth
(wealth) are calculated as (total) other changes in fi nancial assets minus (total) other changes in
liabilities.
Net fi nancial worth (wealth) is calculated as total fi nancial assets minus total liabilities, whereas
changes in net fi nancial worth (wealth) are equal to the sum of changes in net fi nancial worth
(wealth) due to transactions (lending/net borrowing from the fi nancial account) and other changes
in net fi nancial worth (wealth).
Changes in net worth (wealth) are calculated as changes in net worth (wealth) due to savings
and capital transfers plus other changes in net fi nancial worth (wealth) and other changes in non-
fi nancial assets.

ECB
Monthly Bulletin
January 2014 S 83
EURO AREASTATISTICS
Technical Notes
The net worth (wealth) of households is calculated as the sum of the non-fi nancial assets and net
fi nancial worth (wealth) of households.
SECTIONS 4.3 AND 4.4
CALCULATION OF GROWTH RATES FOR DEBT SECURITIES AND QUOTED SHARES
Growth rates are calculated on the basis of fi nancial transactions and therefore exclude
reclassifi cations, revaluations, exchange rate variations and any other changes which do not arise
from transactions. They can be calculated from transactions or from the index of notional stocks.
If Nt
M represents the transactions (net issues) in month t and Lt the level outstanding at the end of
month t, the index It of notional stocks in month t is defi ned as:
As a base, the index is set equal to 100 in December 2008. The growth rate at for month t,
corresponding to the change in the 12 months ending in month t, can be calculated using either of
the following two formulae:
The method used to calculate the growth rates for securities other than shares is the same as that
used for the monetary aggregates, the only difference being that an “N” is used instead of an “F”.
This is to show that the method used to obtain “net issues” for securities issues statistics differs
from that used to calculate equivalent “transactions” for the monetary aggregates.
The average growth rate for the quarter ending in month t is calculated as:
where It is the index of notional stocks as at month t. Likewise, for the year ending in month t,
the average growth rate is calculated as:
I t = It−1 ×Nt
Lt−1
⎛
⎝⎜
⎞
⎠⎟1+k)
at =Nt−i
Lt−1−i
M
i=0
⎛
⎝⎜
⎞
⎠⎟
⎡
⎣⎢
⎤
⎦⎥×100∏ 1 + −1
11
l)
at =It
It−12
⎛⎝⎜
⎞⎠⎟×100−1m)
−1
⎞
⎠
⎟⎟⎟⎟
⎞
⎠
⎟⎟⎟⎟
×1002
0.5It−12 + ∑ It−i−12 + 0.5It−15i=1
0.5It + ∑ It−i + 0.5It−3
2
i=1n)
⎞
⎠
⎟⎟⎟⎟
⎞
⎠
⎟⎟⎟⎟
−1 ×1000.5It + ∑ It−i + 0.5It−12
11
i=1
0.5It−12 + ∑ It−i−12 + 0.5It−24
11
i=1
o)

ECB
Monthly Bulletin
January 2014S 84
The calculation formula used for Section 4.3 is also used for Section 4.4 and is likewise based on
that used for the monetary aggregates. Section 4.4 is based on market values, and the calculations are
based on fi nancial transactions, which exclude reclassifi cations, revaluations and any other changes
that do not arise from transactions. Exchange rate variations are not included, as all quoted shares
covered are denominated in euro.
SEASONAL ADJUSTMENT OF SECURITIES ISSUES STATISTICS 4
The approach used is based on multiplicative decomposition using X-12-ARIMA. The seasonal
adjustment of total securities issues is carried out indirectly by means of a linear combination of sector
and maturity component breakdowns.
The seasonal adjustment procedures are applied to the index of notional stocks. The resulting
estimates of seasonal factors are then applied to the outstanding amounts, from which seasonally
adjusted net issues are derived. Seasonal factors are revised at annual intervals or as required.
As in formulae l) and m), the growth rate at for month t, corresponding to the change in the six
months ending in month t, can be calculated using either of the following two formulae:
TABLE 1 IN SECTION 5.1
SEASONAL ADJUSTMENT OF THE HICP 4
The approach used is based on multiplicative decomposition using X-12-ARIMA (see footnote 2
on page S81). The seasonal adjustment of the overall HICP for the euro area is carried out
indirectly by aggregating the seasonally adjusted euro area series for processed food, unprocessed
food, industrial goods excluding energy, and services. Energy is added without adjustment, since
there is no statistical evidence of seasonality. Seasonal factors are revised at annual intervals or
as required.
TABLE 2 IN SECTION 7.1
SEASONAL ADJUSTMENT OF THE BALANCE OF PAYMENTS CURRENT ACCOUNT
The approach used is based on multiplicative decomposition, using X-12-ARIMA or TRAMO-
SEATS depending on the item. The raw data for goods, services, income and current transfers are
4 For details, see “Seasonal adjustment of monetary aggregates and HICP for the euro area”, ECB (August 2000) and the “Monetary and
fi nancial statistics” sub-section of the “Statistics” section of the ECB’s website (www.ecb.europa.eu).
at =Nt−i
Lt−1−i
M
i=0
⎛
⎝⎜
⎞
⎠⎟
⎡
⎣⎢
⎤
⎦⎥×100∏ 1 + −1
5
p)
at =ItIt−6
⎛⎝⎜
⎞⎠⎟×100−1q)

ECB
Monthly Bulletin
January 2014 S 85
EURO AREASTATISTICS
Technical Notes
pre-adjusted in order to take into account signifi cant working day effects. The working day adjustment
for goods and services takes account of national public holidays. The seasonal adjustment of these
items is carried out using these pre-adjusted series. The seasonal adjustment of the total current
account is carried out by aggregating the seasonally adjusted euro area series for goods, services,
income and current transfers. Seasonal (and trading day) factors are revised at biannual intervals or as
required.
SECTION 7.3
CALCULATION OF GROWTH RATES FOR THE QUARTERLY AND ANNUAL SERIES
The annual growth rate for quarter t is calculated on the basis of quarterly transactions (Ft) and
positions (Lt) as follows:
The growth rate for the annual series is equal to the growth rate in the last quarter of the year.
at
t
= ×100⎛⎝⎜
⎛⎝⎜
⎞⎠⎟
⎞⎠⎟
i=t–3∏ 1 + Fi
Li–l
— −1r)


ECB
Monthly Bulletin
January 2014 S 87
GENERAL NOTES
The “Euro area statistics” section of the Monthly Bulletin focuses on statistics for the euro area
as a whole. More detailed and longer runs of data, with further explanatory notes, are available
in the “Statistics” section of the ECB’s website (www.ecb.europa.eu). This allows user-friendly
access to data via the ECB’s Statistical Data Warehouse (http://sdw.ecb.europa.eu), which includes
search and download facilities. Further services available in the “Data services” sub-section include
subscriptions to different datasets and a repository of compressed Comma Separated Value (CSV)
fi les. For further information, please contact us at: [email protected].
In general, the cut-off date for the statistics included in the Monthly Bulletin is the day preceding
the Governing Council of the ECB’s fi rst meeting of the month. For this issue, the cut-off date was
8 January 2014.
Unless otherwise indicated, all data series relate to the group of 18 countries that are members
of the euro area (the Euro 18) for the whole time series. For interest rates, monetary statistics,
the HICP and reserve assets (and, for consistency reasons, the components and counterparts of
M3 and the components of the HICP), euro area statistical series take into account the changing
composition of the euro area.
The composition of the euro area has changed a number of times over the years. When the euro was
introduced in 1999, the euro area comprised the following 11 countries (the Euro 11): Belgium,
Germany, Ireland, Spain, France, Italy, Luxembourg, the Netherlands, Austria, Portugal and Finland.
Greece then joined in 2001, forming the Euro 12. Slovenia joined in 2007, forming the Euro 13;
Cyprus and Malta joined in 2008, forming the Euro 15; Slovakia joined in 2009, forming the Euro 16;
and Estonia joined in 2011, forming the Euro 17. Latvia joined in 2014, bringing the number of euro
area countries to 18. From October 2012, the euro area statistics also include the European Stability
Mechanism, an international organisation resident in the euro area for statistical purposes.
EURO AREA SERIES WITH A FIXED COMPOSITION
Aggregated statistical series for fi xed compositions of the euro area relate to a given fi xed
composition for the whole time series, regardless of the composition at the time to which the
statistics relate. For example, aggregated series are calculated for the Euro 18 for all years, despite
the fact that the euro area has only had this composition since 1 January 2014. Unless otherwise
indicated, the ECB’s Monthly Bulletin provides statistical series for the current composition.
EURO AREA SERIES WITH A CHANGING COMPOSITION
Aggregated statistical series with a changing composition take into account the composition of the
euro area at the time to which the statistics relate. For example, euro area statistical series with a
changing composition aggregate the data of the Euro 11 for the period up to the end of 2000, the
Euro 12 for the period from 2001 to the end of 2006, and so on. With this approach, each individual
statistical series covers all of the various compositions of the euro area.
For the HICP, as well as statistics based on the balance sheet of the MFI sector (“monetary
statistics”), rates of change are compiled from chain-linked indices, with the new composition
introduced by the linking factor at the point of enlargement. Thus, if a country joins the euro

ECB
Monthly Bulletin
January 2014S 88
area in January of a given year, the factors contributing to the chain-linked indices relate to the
previous composition of the euro area up to and including December of the previous year, and
the enlarged composition of the euro area thereafter. For further details on monetary statistics,
refer to the “Manual on MFI balance sheet statistics”, available in the “Statistics” section of the
ECB’s website.
Given that the composition of the European currency unit (ECU) does not coincide with the former
currencies of the countries that have adopted the single currency, pre-1999 amounts originally
expressed in the participating currencies and converted into ECU at current ECU exchange rates
are affected by movements in the currencies of EU Member States that have not adopted the euro.
To avoid this effect on the monetary statistics, pre-1999 data 1 are expressed in units converted from
national currencies at the irrevocable euro exchange rates established on 31 December 1998. Unless
otherwise indicated, price and cost statistics before 1999 are based on data expressed in national
currency terms.
Methods of aggregation and/or consolidation (including cross-country consolidation) have been
used where appropriate.
Recent data are often provisional and may be revised. Discrepancies between totals and their
components may arise from rounding.
The group “Other EU Member States” comprises Bulgaria, the Czech Republic, Denmark, Croatia,
Lithuania, Hungary, Poland, Romania, Sweden and the United Kingdom.
In most cases, the terminology used within the tables follows international standards, such as
those contained in the European System of Accounts 1995 and the IMF Balance of Payments
Manual. Transactions refer to voluntary exchanges (measured directly or derived), while fl ows also
encompass changes in outstanding amounts owing to price and exchange rate changes, write-offs
and other changes.
In the tables, the wording “up to (x) years” means “up to and including (x) years”.
OVERVIEW
Developments in key indicators for the euro area are summarised in an overview table.
MONETARY POLICY STATISTICS
Section 1.4 shows statistics on minimum reserve and liquidity factors. Maintenance periods for
minimum reserve requirements start every month on the settlement day of the main refi nancing
operation (MRO) following the Governing Council meeting for which the monthly assessment
of the monetary policy stance is scheduled. They end on the day preceding the corresponding
settlement day in the following month. Annual/quarterly observations refer to averages for the last
reserve maintenance period of the year/quarter.
1 Data on monetary statistics in Sections 2.1 to 2.8 are available for periods prior to January 1999 on the ECB’s website (http://www.ecb.
europa.eu/stats/services/downloads/html/index.en.html) and in the SDW (http://sdw.ecb.europa.eu/browse.do?node=2018811).
ECB
Monthly Bulletin
January 2014 S 89
EURO AREASTATISTICS
General Notes
Table 1 in Section 1.4 shows the components of the reserve base of credit institutions subject to
reserve requirements. Liabilities vis-à-vis other credit institutions subject to the ESCB’s minimum
reserve system, the ECB and participating national central banks are excluded from the reserve
base. When a credit institution cannot provide evidence of the amount of its issues of debt securities
with a maturity of up to two years which are held by the institutions mentioned above, it may deduct
a certain percentage of these liabilities from its reserve base. The percentage used to calculate the
reserve base was 10% until November 1999 and has been 30% since that date.
Table 2 in Section 1.4 contains average data for completed maintenance periods. First, the reserve
requirement of each individual credit institution is calculated by applying the reserve ratios for the
corresponding categories of liability to the eligible liabilities, using the balance sheet data from
the end of each calendar month. Subsequently, each credit institution deducts from this fi gure a
lump-sum allowance of €100,000. The resulting required reserves are then aggregated at the euro
area level (column 1). Current account holdings (column 2) are the aggregate average daily current
account holdings of credit institutions, including those that serve to fulfi l reserve requirements.
Excess reserves (column 3) are the average current account holdings over the maintenance period
in excess of the required reserves. Defi ciencies (column 4) are defi ned as the average shortfalls
of current account holdings from required reserves over the maintenance period, computed on
the basis of those credit institutions that have not fulfi lled their reserve requirements. The interest
rate on minimum reserves (column 5) is equal to the average, over the maintenance period, of
the ECB’s rate (weighted according to the number of calendar days) on the Eurosystem’s MROs
(see Section 1.3).
Table 3 in Section 1.4 shows the banking system’s liquidity position, which is defi ned as euro
area credit institutions’ current account holdings with the Eurosystem in euro. All amounts are
derived from the consolidated fi nancial statement of the Eurosystem. Other liquidity-absorbing
operations (column 7) exclude the issuance of debt certifi cates initiated by NCBs in Stage Two
of EMU. Net other factors (column 10) represent the netted remaining items in the consolidated
fi nancial statement of the Eurosystem. Credit institutions’ current accounts (column 11) are equal
to the difference between the sum of liquidity-providing factors (columns 1 to 5) and the sum of
liquidity-absorbing factors (columns 6 to 10). Base money (column 12) is calculated as the sum of
the deposit facility (column 6), banknotes in circulation (column 8) and credit institutions’ current
account holdings (column 11).
MONEY, BANKING AND OTHER FINANCIAL CORPORATIONS
Chapter 2 shows balance sheet statistics for MFIs and other fi nancial corporations. Other fi nancial
corporations comprise investment funds (other than money market funds, which are part of the MFI
sector), fi nancial vehicle corporations, insurance corporations and pension funds.
Section 2.1 shows the aggregated balance sheet of the MFI sector, i.e. the sum of the harmonised
balance sheets of all MFIs resident in the euro area. MFIs comprise central banks, credit institutions
as defi ned under EU law, money market funds and other institutions whose business it is to
receive deposits and/or close substitutes for deposits from entities other than MFIs and, for their
own account (at least in economic terms), to grant credit and/or make investments in securities.
A complete list of MFIs is published on the ECB’s website.
ECB
Monthly Bulletin
January 2014S 90
Section 2.2 shows the consolidated balance sheet of the MFI sector, which is obtained by netting the
aggregated balance sheet positions of MFIs in the euro area. Owing to a small amount of heterogeneity
in recording practices, the sum of the inter-MFI positions is not necessarily zero; the balance is
shown in column 10 of the liabilities side of Section 2.2. Section 2.3 sets out the euro area monetary
aggregates and counterparts. These are derived from the consolidated MFI balance sheet and include
positions of non-MFIs resident in the euro area held with MFIs resident in the euro area; they also take
account of some monetary assets/liabilities of central government. Statistics on monetary aggregates
and counterparts are adjusted for seasonal and trading day effects. The external liabilities item in
Sections 2.1 and 2.2 shows the holdings by non-euro area residents of: (i) shares/units issued by
money market funds located in the euro area; and (ii) debt securities issued with a maturity of up to
two years by MFIs located in the euro area. In Section 2.3, however, these holdings are excluded from
the monetary aggregates and contribute to the item “net external assets”.
Section 2.4 provides analysis, broken down by sector, type and original maturity, of loans granted
by MFIs other than the Eurosystem (i.e. the banking system) resident in the euro area. Section 2.5
provides analysis, broken down by sector and instrument, of deposits held with the euro area
banking system. Section 2.6 shows the securities held by the euro area banking system, broken
down by type of issuer. Section 2.7 shows a quarterly currency breakdown for selected MFI balance
sheet items.
Sections 2.2 to 2.6 also provide growth rates based on those transactions in the form of annual
percentage changes.
Since 1 January 1999 statistical information has been collected and compiled on the basis of
various ECB regulations concerning the balance sheet of the monetary fi nancial institution sector.
Since July 2010 this has been carried out on the basis of Regulation ECB/2008/32 2. Detailed sector
defi nitions are set out in the third edition of the “Monetary fi nancial institutions and markets statistics
sector manual – Guidance for the statistical classifi cation of customers” (ECB, March 2007).
Section 2.8 shows outstanding amounts and transactions on the balance sheet of euro area
investment funds (other than money market funds, which are included in the MFI balance sheet
statistics). An investment fund is a collective investment undertaking that invests capital raised
from the public in fi nancial and/or non-fi nancial assets. A complete list of euro area investment
funds is published on the ECB’s website. The balance sheet is aggregated, so investment funds’
assets include their holdings of shares/units issued by other investment funds. Shares/units issued
by investment funds are also broken down by investment policy (i.e. into bond funds, equity funds,
mixed funds, real estate funds, hedge funds and other funds) and by type (i.e. into open-end funds
and closed-end funds). Section 2.9 provides further details on the main types of asset held by euro
area investment funds. This section contains a geographical breakdown of the issuers of securities
held by investment funds, as well as breaking issuers down by economic sector where they are
resident in the euro area.
Since December 2008 harmonised statistical information has been collected and compiled on the
basis of Regulation ECB/2007/8 3 concerning statistics on the assets and liabilities of investment
funds. Further information on these investment fund statistics can be found in the “Manual on
investment fund statistics” (ECB, May 2009).
2 OJ L 15, 20.01.2009, p. 14.
3 OJ L 211, 11.08.2007, p. 8.

ECB
Monthly Bulletin
January 2014 S 91
EURO AREASTATISTICS
General Notes
Section 2.10 shows the aggregated balance sheet of fi nancial vehicle corporations (FVCs) resident
in the euro area. FVCs are entities which are set up in order to carry out securitisation transactions.
Securitisation generally involves the transfer of an asset or pool of assets to an FVC, with such
assets reported on the FVC’s balance sheet as securitised loans, securities other than shares, or
other securitised assets. Alternatively, the credit risk relating to an asset or pool of assets may
be transferred to an FVC through credit default swaps, guarantees or other such mechanisms.
Collateral held by the FVC against these exposures is typically a deposit held with an MFI or
invested in securities other than shares. FVCs typically securitise loans which have been originated
by the MFI sector. FVCs must report such loans on their statistical balance sheet, regardless of
whether the relevant accounting rules allow the MFI to derecognise the loans. Data on loans which
are securitised by FVCs but remain on the balance sheet of the relevant MFI (and thus remain in
the MFI statistics) are provided separately. These quarterly data are collected under Regulation
ECB/2008/30 4 as of December 2009.
Section 2.11 shows the aggregated balance sheet of insurance corporations and pension funds
resident in the euro area. Insurance corporations cover both the insurance and reinsurance sectors,
while pension funds include entities which have autonomy in terms of decision-making and keep a
complete set of accounts (i.e. autonomous pension funds). This section also contains a geographical
and sectoral breakdown of issuing counterparties for securities other than shares held by insurance
corporations and pension funds.
EURO AREA ACCOUNTS
Section 3.1 shows quarterly integrated euro area accounts data, which provide comprehensive
information on the economic activities of households (including non-profi t institutions serving
households), non-fi nancial corporations, fi nancial corporations and general government, as well as
on the interaction between these sectors and both the euro area and the rest of the world. Non-
seasonally adjusted data at current prices are displayed for the last available quarter, following a
simplifi ed sequence of accounts in accordance with the methodological framework of the European
System of Accounts 1995.
In short, the sequence of accounts (transactions) comprises: (1) the generation of income account,
which shows how production activity translates into various categories of income; (2) the
allocation of primary income account, which records receipts and expenses relating to various
forms of property income (for the economy as a whole; the balancing item of the primary income
account is national income); (3) the secondary distribution of income account, which shows how
the national income of an institutional sector changes because of current transfers; (4) the use of
income account, which shows how disposable income is spent on consumption or saved; (5) the
capital account, which shows how savings and net capital transfers are spent in the acquisition
of non-fi nancial assets (the balancing item of the capital account is net lending/net borrowing);
and (6) the fi nancial account, which records the net acquisitions of fi nancial assets and the net
incurrence of liabilities. As each non-fi nancial transaction is mirrored by a fi nancial transaction,
the balancing item of the fi nancial account conceptually also equals net lending/net borrowing as
calculated from the capital account.
4 OJ L 15, 20.01.2009, p. 1.

ECB
Monthly Bulletin
January 2014S 92
In addition, opening and closing fi nancial balance sheets are presented, which provide a picture
of the fi nancial wealth of each individual sector at a given point in time. Finally, other changes in
fi nancial assets and liabilities (e.g. those resulting from the impact of changes in asset prices) are
also shown.
The sectoral coverage of the fi nancial account and the fi nancial balance sheets is more detailed for
the fi nancial corporation sector, which is broken down into MFIs, other fi nancial intermediaries
(including fi nancial auxiliaries), and insurance corporations and pension funds.
Section 3.2 shows four-quarter cumulated fl ows (transactions) for the “non-fi nancial accounts” of
the euro area (i.e. accounts (1) to (5) above), also following the simplifi ed sequence of accounts.
Section 3.3 shows four-quarter cumulated fl ows (transactions and other changes) for households’
income, expenditure and accumulation accounts, as well as outstanding amounts in the fi nancial and
non-fi nancial balance sheet accounts, presenting data in a more analytical manner. Sector-specifi c
transactions and balancing items are arranged in a way that more clearly depicts the fi nancing
and investment decisions of households, while respecting the accounting identities presented in
Sections 3.1 and 3.2.
Section 3.4 displays four-quarter cumulated fl ows (transactions) for non-fi nancial corporations’
income and accumulation accounts, as well as outstanding amounts for the fi nancial balance sheet
accounts, presenting data in a more analytical manner.
Section 3.5 shows four-quarter cumulated fi nancial fl ows (transactions and other changes) and
outstanding amounts for the fi nancial balance sheets of insurance corporations and pension funds.
FINANCIAL MARKETS
The series on fi nancial market statistics for the euro area cover those EU Member States that had
adopted the euro at the time to which the statistics relate (i.e. a changing composition), with the
exception of statistics on securities issues (Sections 4.1 to 4.4), which relate to the Euro 17 for the
whole time series (i.e. a fi xed composition).
Statistics on securities other than shares and statistics on quoted shares (Sections 4.1 to 4.4) are
produced by the ECB using data from the ESCB and the BIS. Section 4.5 presents MFI interest
rates on euro-denominated deposits from and loans to euro area residents. Statistics on money
market interest rates, long-term government bond yields and stock market indices (Sections 4.6
to 4.8) are produced by the ECB using data from wire services.
Statistics on securities issues cover: (i) securities other than shares, excluding fi nancial derivatives;
and (ii) quoted shares. The former are presented in Sections 4.1, 4.2 and 4.3, while the latter
are presented in Section 4.4. Debt securities are broken down into short-term and long-term
securities. “Short-term” means securities with an original maturity of one year or less (in exceptional
cases, two years or less). Securities with (i) a longer maturity, (ii) optional maturity dates, the latest
of which is more than one year away, or (iii) indefi nite maturity dates are classifi ed as “long-term”.
Long-term debt securities issued by euro area residents are broken down further into fi xed and
variable rate issues. Fixed rate issues consist of issues where the coupon rate does not change during
the life of the issue. Variable rate issues comprise all issues where the coupon is periodically refi xed

ECB
Monthly Bulletin
January 2014 S 93
EURO AREASTATISTICS
General Notes
with reference to an independent interest rate or index. The euro-denominated securities indicated
in Sections 4.1, 4.2 and 4.3 also include items expressed in national denominations of the euro.
Section 4.1 shows securities other than shares, broken down by original maturity, residency of
the issuer and currency. It presents outstanding amounts, gross issues and net issues of securities
other than shares, broken down into: (i) issues denominated in euro and issues in all currencies;
(ii) issues by euro area residents and total issues; and (iii) total and long-term maturities. Net issues
differ from the changes in outstanding amounts owing to valuation changes, reclassifi cations and
other adjustments. This section also presents seasonally adjusted statistics, including six-month
annualised seasonally adjusted growth rates for total and long-term debt securities. Seasonally
adjusted data are derived from the index of notional stocks, from which the seasonal effects have
been removed. See the Technical Notes for details.
Section 4.2 contains a sectoral breakdown of outstanding amounts, gross issues and net issues for
issuers resident in the euro area in line with the ESA 95. The ECB is included in the Eurosystem.
The total outstanding amounts for total and long-term debt securities in column 1 of Table 1 in
Section 4.2 correspond to the data on outstanding amounts for total and long-term debt securities
issued by euro area residents in column 7 of Section 4.1. The outstanding amounts for total
and long-term debt securities issued by MFIs in column 2 of Table 1 in Section 4.2 are broadly
comparable with the data on debt securities issued on the liabilities side of the aggregated MFI
balance sheet in column 8 of Table 2 in Section 2.1. The total net issues for total debt securities in
column 1 of Table 2 in Section 4.2 correspond to the data on total net issues by euro area residents
in column 9 of Section 4.1. The residual difference between long-term debt securities and total
fi xed and variable rate long-term debt securities in Table 1 of Section 4.2 consists of zero coupon
bonds and revaluation effects.
Section 4.3 shows seasonally adjusted and non-seasonally adjusted growth rates for debt securities
issued by euro area residents (broken down by maturity, type of instrument, sector of the issuer and
currency), which are based on fi nancial transactions that occur when an institutional unit incurs
or redeems liabilities. The growth rates therefore exclude reclassifi cations, revaluations, exchange
rate variations and any other changes that do not arise from transactions. The seasonally adjusted
growth rates have been annualised for presentational purposes. See the Technical Notes for details.
Columns 1, 4, 6 and 8 in Table 1 of Section 4.4 show the outstanding amounts of quoted shares
issued by euro area residents broken down by issuing sector. The monthly data for quoted shares
issued by non-fi nancial corporations correspond to the quarterly series shown in Section 3.4
(fi nancial balance sheet; quoted shares).
Columns 3, 5, 7 and 9 in Table 1 of Section 4.4 show annual growth rates for quoted shares issued
by euro area residents (broken down by the sector of the issuer), which are based on fi nancial
transactions that occur when an issuer issues or redeems shares for cash, excluding investments
in the issuer’s own shares. The calculation of annual growth rates excludes reclassifi cations,
revaluations and any other changes that do not arise from transactions.
Section 4.5 presents statistics on all the interest rates that MFIs resident in the euro area apply to
euro-denominated deposits and loans vis-à-vis households and non-fi nancial corporations resident
in the euro area. Euro area MFI interest rates are calculated as a weighted average (by corresponding
business volume) of the euro area countries’ interest rates for each category.
ECB
Monthly Bulletin
January 2014S 94
MFI interest rate statistics are broken down by type of business coverage, sector, instrument
category and maturity, period of notice or initial period of interest rate fi xation. These MFI interest
rate statistics replaced the ten transitional statistical series on euro area retail interest rates that had
been published in the Monthly Bulletin as of January 1999.
Section 4.6 presents money market interest rates for the euro area, the United States and Japan. For
the euro area, a broad spectrum of money market interest rates is covered, ranging from interest rates
on overnight deposits to those on twelve-month deposits. Before January 1999, synthetic euro area
interest rates were calculated on the basis of national rates weighted by GDP. With the exception of
the overnight rate prior to January 1999, monthly, quarterly and yearly values are period averages.
Overnight deposits are represented by end-of-period interbank deposit bid rates up to and including
December 1998 and period averages for the euro overnight index average (EONIA) thereafter.
As of January 1999, euro area interest rates on one, three, six and twelve-month deposits are euro
interbank offered rates (EURIBOR); prior to that date, they are London interbank offered rates
(LIBOR) where available. For the United States and Japan, interest rates on three-month deposits
are represented by LIBOR.
Section 4.7 shows end-of-period rates estimated from nominal spot yield curves based on AAA-
rated euro-denominated bonds issued by euro area central governments. The yield curves are
estimated using the Svensson model 5. Spreads between the ten-year rates and the three-month and
two-year rates are also released. Additional yield curves (daily releases, including charts and tables)
and the corresponding methodological information are available at: http://www.ecb.europa.eu/stats/
money/yc/html/index.en.html. Daily data can also be downloaded.
Section 4.8 shows stock market indices for the euro area, the United States and Japan.
PRICES, OUTPUT, DEMAND AND LABOUR MARKETS
Most of the data described in this section are produced by the European Commission (mainly
Eurostat) and national statistical authorities. Euro area results are obtained by aggregating data
for individual countries. As far as possible, the data are harmonised and comparable. Statistics
on labour costs indices, GDP and expenditure components, value added by economic activity,
industrial production, retail sales passenger car registrations and employment in terms of hours
worked are working day-adjusted.
The Harmonised Index of Consumer Prices (HICP) for the euro area (Table 1 in Section 5.1) is
available from 1995 onwards. It is based on national HICPs, which follow the same methodology
in all euro area countries. The breakdown into goods and services components is derived from the
classifi cation of individual consumption by purpose (Coicop/HICP). The HICP covers monetary
expenditure by households on fi nal consumption in the economic territory of the euro area. The table
includes seasonally adjusted HICP data, which are compiled by the ECB, and experimental
HICP-based indices of administered prices.
Industrial producer prices (Table 2 in Section 5.1), industrial production, industrial turnover and
retail sales (Section 5.2) are covered by Council Regulation (EC) No 1165/98 of 19 May 1998
5 Svensson, L.E., “Estimating and Interpreting Forward Interest Rates: Sweden 1992-1994”, CEPR Discussion Papers, No 1051. Centre for
Economic Policy Research, London, 1994.
ECB
Monthly Bulletin
January 2014 S 95
EURO AREASTATISTICS
General Notes
concerning short-term statistics 6. Since January 2009 the revised classifi cation of economic
activities (NACE Revision 2), as covered by Regulation (EC) No 1893/2006 of the European
Parliament and of the Council of 20 December 2006 establishing the statistical classifi cation of
economic activities NACE Revision 2 and amending Council Regulation (EEC) No 3037/90, as
well as certain EC Regulations on specifi c statistical domains 7, has been applied in the production
of short-term statistics. The breakdown by end use of product for industrial producer prices and
industrial production is the harmonised sub-division of industry excluding construction (NACE
Revision 2, sections B to E) into Main Industrial Groupings (MIGs) as defi ned by Commission
Regulation (EC) No 656/2007 of 14 June 2007 8. Industrial producer prices refl ect the ex-factory
gate prices of producers. They include indirect taxes except VAT and other deductible taxes.
Industrial production refl ects the value added of the industries concerned.
The two non-energy commodity price indices shown in Table 3 in Section 5.1 are compiled with the
same commodity coverage, but using two different weighting schemes: one based on the respective
commodity imports of the euro area (columns 2-4), and the other (columns 5-7) based on estimated
euro area domestic demand, or “use”, taking into account information on imports, exports and the
domestic production of each commodity (ignoring, for the sake of simplicity, inventories, which are
assumed to be relatively stable over the observed period). The import-weighted commodity price
index is appropriate for analysing external developments, while the use-weighted index is suitable
for the specifi c purpose of analysing international commodity price pressures on euro area infl ation.
The use-weighted commodity price indices are experimental data. For more details as regards the
compilation of the ECB commodity price indices, see Box 1 in the December 2008 issue of the
Monthly Bulletin.
The labour cost indices (Table 5 in Section 5.1) measure the changes in labour costs per
hour worked in industry (including construction) and market services. Their methodology
is laid down in Regulation (EC) No 450/2003 of the European Parliament and of the Council
of 27 February 2003 concerning the labour cost index 9 and in the implementing Commission
Regulation (EC) No 1216/2003 of 7 July 2003 10. A breakdown of the labour cost indices for the
euro area is available by labour cost component (wages and salaries, and employers’ social
contributions plus employment-related taxes paid by the employer less subsidies received by the
employer) and by economic activity. The ECB calculates the indicator of negotiated wages
(memo item in Table 5 of Section 5.1) on the basis of non-harmonised, national-defi nition data.
Unit labour cost components (Table 4 in Section 5.1), GDP and its components (Tables 1 and 2
in Section 5.2), GDP defl ators (Table 3 in Section 5.1) and employment statistics (Table 1 in
Section 5.3) are derived from the ESA 95 11 quarterly national accounts. The ESA 95 was amended
by Commission Regulation (EU) No 715/2010 of 10 August 2010 12 introducing NACE Revision 2,
the updated statistical classifi cation of economic activities. The publication of euro area national
accounts data applying this new classifi cation began in December 2011.
Indices for turnover in industry and for the retail trade (Table 4 in Section 5.2) measure the turnover,
including all duties and taxes (with the exception of VAT), invoiced during the reference period.
6 OJ L 162, 5.6.1998, p. 1.
7 OJ L 393, 30.12.2006, p. 1.
8 OJ L 155, 15.6.2007, p. 3.
9 OJ L 69, 13.3.2003, p. 1.
10 OJ L 169, 8.7.2003, p. 37.
11 OJ L 310, 30.11.1996, p. 1.
12 OJ L 210, 11.8.2010, p. 1.

ECB
Monthly Bulletin
January 2014S 96
Retail trade turnover covers all retail trade (excluding sales of motor vehicles and motorcycles),
including automotive fuel. New passenger car registrations cover registrations of both private and
commercial passenger cars.
Qualitative business and consumer survey data (Table 5 in Section 5.2) draw on the European
Commission Business and Consumer Surveys.
Unemployment rates (Table 4 in Section 5.3) conform to International Labour Organization
guidelines. They refer to persons actively seeking work as a share of the labour force, using
harmonised criteria and defi nitions. The labour force estimates underlying the unemployment rate
are different from the sum of the employment and unemployment levels published in Section 5.3.
GOVERNMENT FINANCE
Sections 6.1 to 6.5 show the general government fi scal position in the euro area. The data are
mainly consolidated and are based on the ESA 95 methodology. The annual euro area aggregates
in Sections 6.1 to 6.3 are compiled by the ECB on the basis of statistical reporting requirements
laid down in the ECB Guideline of 31 July 2009 on government fi nance statistics (ECB/2009/20)13.
Harmonised data provided by the NCBs are regularly updated. The annual defi cit and debt data for
the euro area aggregates may therefore differ from those published by the European Commission.
The quarterly euro area aggregates in Sections 6.4 and 6.5 are compiled by the ECB on the basis of
Eurostat and national data.
Section 6.1 presents annual fi gures on general government revenue and expenditure on the basis of
defi nitions laid down in Commission Regulation (EC) No 1500/2000 of 10 July 2000 14 amending
the ESA 95. Section 6.2 shows details of general government gross consolidated debt at nominal
value in line with the Treaty provisions on the excessive defi cit procedure. Sections 6.1 and 6.2
include government defi cit/surplus and debt data for the individual euro area countries owing to their
importance within the framework of the Stability and Growth Pact as reported to the Commission
under Council Regulation (EU) No 679/2010. Section 6.3 presents changes in general government
debt. The difference between the change in the government debt and the government defi cit – the
defi cit-debt adjustment – is mainly explained by government transactions in fi nancial assets and
by foreign exchange valuation effects. Section 6.4 presents non-seasonally adjusted quarterly
fi gures on general government revenue and expenditure on the basis of defi nitions laid down in
Regulation (EC) No 1221/2002 of the European Parliament and of the Council of 10 June 2002
on quarterly non-fi nancial accounts for general government 15. Section 6.5 presents quarterly fi gures
on gross consolidated government debt, the defi cit-debt adjustment and the government borrowing
requirement. These fi gures are compiled using data provided by the Member States under Regulation
(EC) No 501/2004 and Regulation (EC) No 222/2004 and data provided by the NCBs.
EXTERNAL TRANSACTIONS AND POSITIONS
The concepts and defi nitions used in balance of payments and international investment position
(i.i.p.) statistics (Sections 7.1 to 7.4) are generally in line with the IMF Balance of Payments
13 OJ L 228. 1.9.2009, p. 25.
14 OJ L 172, 12.7.2000, p. 3.
15 OJ L 179, 9.7.2002, p. 1.

ECB
Monthly Bulletin
January 2014 S 97
EURO AREASTATISTICS
General Notes
Manual (fi fth edition, October 1993), the ECB Guideline of 16 July 2004 on the statistical reporting
requirements of the ECB (ECB/2004/15) 16 and the amending ECB Guideline of 31 May 2007
(ECB/2007/3) 17. Additional information regarding the methodologies and sources used in the
euro area b.o.p. and i.i.p. statistics can be found in the ECB publication entitled “European Union
balance of payments/international investment position statistical methods” (May 2007) and in the
reports of the Task Force on Portfolio Investment Collection Systems (June 2002), the Task Force
on Portfolio Investment Income (August 2003) and the Task Force on Foreign Direct Investment
(March 2004), all of which can be downloaded from the ECB’s website. In addition, a report by the
ECB/European Commission (Eurostat) Task Force on Quality looking at balance of payments and
international investment position statistics (June 2004) is available on the website of the Committee
on Monetary, Financial and Balance of Payments Statistics (www.cmfb.org). The annual quality
report on the euro area b.o.p./i.i.p., which is based on the Task Force’s recommendations and
follows the basic principles of the ECB Statistics Quality Framework published in April 2008, is
available on the ECB’s website.
On 9 December 2011 the ECB Guideline on the statistical requirements of the European Central
Bank in the fi eld of external statistics (ECB/2011/23) 18 was adopted by the Governing Council
of the ECB. This legal act lays down new reporting requirements in the fi eld of external statistics,
which mainly refl ect methodological changes introduced in the sixth edition of the IMF’s Balance
of Payments and International Investment Position Manual (BPM6). The ECB will begin publishing
the euro area’s b.o.p., i.i.p. and international reserves statistics in accordance with Guideline
ECB/2011/23 and the BPM6 in 2014, with backdata. The tables in Sections 7.1 and 7.4 follow the
sign convention in the IMF Balance of Payments Manual – i.e. surpluses in the current account and
the capital account have a plus sign, while in the fi nancial account a plus sign denotes an increase in
liabilities or a decrease in assets. In the tables in Section 7.2, both credit and debit transactions are
presented with a plus sign. Furthermore, as of the February 2008 issue of the Monthly Bulletin, the
tables in Section 7.3 have been restructured in order to allow the data on the balance of payments,
the international investment position and related growth rates to be presented together; in the new
tables, transactions in assets and liabilities that correspond to increases in positions are shown with
a plus sign.
The euro area b.o.p. is compiled by the ECB. Recent monthly fi gures should be regarded as
provisional. Data are revised when fi gures for the following month and/or the detailed quarterly
b.o.p. are published. Earlier data are revised periodically or as a result of methodological changes in
the compilation of the source data.
Table 1 in Section 7.2 also contains seasonally adjusted data for the current account. Where
appropriate, the adjustment also covers working day, leap year and/or Easter-related effects.
Table 3 in Section 7.2 and Table 9 in Section 7.3 present a breakdown of the euro area b.o.p. and
i.i.p. vis-à-vis major partner countries, both individually and as a group, distinguishing between
EU Member States outside the euro area and countries or areas outside the European Union.
The breakdown also shows transactions and positions vis-à-vis EU institutions and international
organisations (which, with the exception of the ECB and the European Stability Mechanism, are
considered to be outside the euro area for statistical purposes, regardless of their physical location)
as well as offshore centres. The breakdown does not cover transactions or positions in portfolio
investment liabilities, fi nancial derivatives or international reserves. In addition, separate data
16 OJ L 354, 30.11.2004, p. 34.
17 OJ L 159, 20.6.2007, p. 48.
18 OJ L 65, 3.3.2012, p. 1.

ECB
Monthly Bulletin
January 2014S 98
are not provided for investment income payable to Brazil, mainland China, India or Russia. The
geographical breakdown is described in the article entitled “Euro area balance of payments and
international investment position vis-à-vis main counterparts” in the February 2005 issue of the
Monthly Bulletin.
The data on the euro area b.o.p. fi nancial account and i.i.p. in Section 7.3 are based on transactions
and positions vis-à-vis non-residents of the euro area, regarding the euro area as a single economic
entity (see also Box 9 in the December 2002 issue of the Monthly Bulletin, Box 5 in the January 2007
issue of the Monthly Bulletin and Box 6 in the January 2008 issue of the Monthly Bulletin). The
i.i.p. is valued at current market prices, with the exception of direct investment, where book values
are used for unquoted shares, and other investment (e.g. loans and deposits). The quarterly i.i.p.
is compiled on the basis of the same methodological framework as the annual i.i.p. As some
data sources are not available on a quarterly basis (or are available with a delay), the quarterly
i.i.p. is partly estimated on the basis of fi nancial transactions, asset prices and foreign exchange
developments.
Table 1 in Section 7.3 summarises the i.i.p. and fi nancial transactions in the euro area b.o.p.
The breakdown of the change in the annual i.i.p. is obtained by applying a statistical model to i.i.p.
changes other than transactions, using information from the geographical breakdown and currency
composition of assets and liabilities, as well as price indices for different fi nancial assets. In this
table, columns 5 and 6 refer to direct investment by resident units abroad and direct investment by
non-resident units in the euro area.
In Table 5 in Section 7.3, the breakdown into “loans” and “currency and deposits” is based on the
sector of the non-resident counterpart – i.e. assets vis-à-vis non-resident banks are classifi ed as
deposits, whereas assets vis-à-vis other non-resident sectors are classifi ed as loans. This breakdown
follows the distinction made in other statistics, such as the MFI consolidated balance sheet, and
conforms to the IMF Balance of Payments Manual.
The outstanding amounts for the Eurosystem’s international reserves and related assets and
liabilities are shown in Table 7 of Section 7.3. These fi gures are not fully comparable with those
in the Eurosystem’s weekly fi nancial statement owing to differences in coverage and valuation.
The data in Table 7 are in line with the recommendations for the template on international reserves
and foreign currency liquidity. By defi nition, the assets included in the Eurosystem’s international
reserves take account of the changing composition of the euro area. Before countries join the euro
area, the assets of their national central banks are included in portfolio investment (in the case of
securities) or other investment (in the case of other assets). Changes in the gold holdings of the
Eurosystem (column 3) are due to transactions in gold within the terms of the Central Bank Gold
Agreement of 26 September 1999, which was updated on 27 September 2009. More information
on the statistical treatment of the Eurosystem’s international reserves can be found in a publication
entitled “Statistical treatment of the Eurosystem’s international reserves” (October 2000), which
can be downloaded from the ECB’s website. The website also contains more comprehensive data in
accordance with the template on international reserves and foreign currency liquidity.
The euro area’s gross external debt statistics in Table 8 of Section 7.3 represent outstanding
actual (rather than contingent) liabilities vis-à-vis non-euro area residents that require the payment
of principal and/or interest by the debtor at one or more points in the future. Table 8 shows a
breakdown of gross external debt by instrument and institutional sector.

ECB
Monthly Bulletin
January 2014 S 99
EURO AREASTATISTICS
General Notes
Section 7.4 contains a monetary presentation of the euro area balance of payments, showing
the transactions by non-MFIs that mirror the net external transactions by MFIs. Included in the
transactions by non-MFIs are b.o.p. transactions for which a sectoral breakdown is not available.
These concern the current and capital accounts (column 2) and fi nancial derivatives (column 11). An
up-to-date methodological note on the monetary presentation of the euro area balance of payments
is available in the “Statistics” section of the ECB’s website. See also Box 1 in the June 2003 issue
of the Monthly Bulletin.
Section 7.5 shows data on euro area external trade in goods. The source is Eurostat. Value data
and volume indices are seasonally and working day-adjusted. The breakdown by product group
in columns 4 to 6 and 9 to 11 of Table 1 in Section 7.5 is in line with the classifi cation contained
in the Broad Economic Categories and corresponds to the basic classes of goods in the System
of National Accounts. Manufactured goods (columns 7 and 12) and oil (column 13) are in line
with the SITC Rev. 4 defi nition. The geographical breakdown (Table 3 in Section 7.5) shows
major trading partners both individually and in regional groups. China excludes Hong Kong. On
account of differences in defi nitions, classifi cation, coverage and time of recording, external trade
data, in particular for imports, are not fully comparable with the goods item in the b.o.p. statistics
(Sections 7.1 and 7.2). Part of the difference arises from the inclusion of insurance and freight
services in the recording of imported goods in external trade data.
Industrial import prices and industrial producer export prices (or industrial output prices for
the non-domestic market) shown in Table 2 in Section 7.5 were introduced by Regulation (EC)
No 1158/2005 of the European Parliament and of the Council of 6 July 2005 amending Council
Regulation (EC) No 1165/98, which is the principal legal basis for short-term statistics. The
industrial import price index covers industrial products imported from outside the euro area under
sections B to E of the Statistical Classifi cation of Products by Activity in the European Economic
Community (CPA) and all institutional import sectors except households, governments and
non-profi t institutions. It refl ects the cost, insurance and freight price excluding import duties and
taxes, and refers to actual transactions in euro recorded at the point when ownership of the goods
is transferred. The industrial producer export prices cover all industrial products exported directly
by euro area producers to the extra-euro area market under sections B to E of NACE Revision 2.
Exports from wholesalers and re-exports are not covered. The indices refl ect the free on board
price expressed in euro and calculated at the euro area frontier, including any indirect taxes except
VAT and other deductible taxes. Industrial import prices and industrial producer export prices are
available by Main Industrial Grouping as defi ned by Commission Regulation (EC) No 656/2007 of
14 June 2007. For more details, see Box 11 in the December 2008 issue of the Monthly Bulletin.
EXCHANGE RATES
Section 8.1 shows nominal and real effective exchange rate indices for the euro, which are calculated
by the ECB on the basis of weighted averages of the euro’s bilateral exchange rates against the
currencies of the selected trading partners of the euro area. A positive change denotes an appreciation
of the euro. Weights are based on trade in manufactured goods with those trading partners in the
periods 1995-1997, 1998-2000, 2001-2003, 2004-2006 and 2007-2009 and are calculated to account
for third-market effects. The EER indices are obtained by chain-linking the indicators based on each
of these fi ve sets of trade weights at the end of each three-year period. The base period of the resulting
EER index is the fi rst quarter of 1999. The EER-21 group of trading partners is composed of the
11 non-euro area EU Member States plus Australia, Canada, China, Hong Kong, Japan, Norway,

ECB
Monthly Bulletin
January 2014S 100
Singapore, South Korea, Switzerland and the United States. The EER-20 group excludes Croatia.
The EER-40 group comprises the EER-21 plus the following countries: Algeria, Argentina, Brazil,
Chile, Iceland, India, Indonesia, Israel, Malaysia, Mexico, Morocco, New Zealand, the Philippines,
Russia, South Africa, Taiwan, Thailand, Turkey and Venezuela. Real EERs are calculated using
consumer price indices (CPIs), producer price indices (PPIs), gross domestic product defl ators and
unit labour costs, both for the manufacturing sector (ULCM) and for the total economy (ULCT).
ULCM-defl ated EERs are available only for the EER-20.
For more detailed information on the calculation of the EERs, see the relevant methodological note
and ECB Occasional Paper No 134 (“Revisiting the effective exchange rates of the euro” by Martin
Schmitz, Maarten De Clercq, Michael Fidora, Bernadette Lauro and Cristina Pinheiro, June 2012),
which can be downloaded from the ECB’s website.
The bilateral rates shown in Section 8.2 are monthly averages of those published daily as reference
rates for these currencies. The most recent rate for the Icelandic krona is 290.0 per euro and refers
to 3 December 2008.
DEVELOPMENTS OUTSIDE THE EURO AREA
Statistics on other EU Member States (Section 9.1) follow the same principles as data relating to the
euro area. However, data shown in this table on current and capital accounts and gross external debt
follow the respective national concept and do not include special-purpose vehicles. The data for the
United States and Japan contained in Section 9.2 are obtained from national sources.
ECB
Monthly Bulletin
January 2014 I
ANNEXES
CHRONOLOGY OF MONETARY POLICY MEASURES OF THE EUROSYSTEM1
1 The chronology of monetary policy measures taken by the Eurosystem between 1999 and 2010 can be found in the ECB’s Annual Report
for the respective years.
12 JANUARY 2012
The Governing Council of the ECB decides that the interest rate on the main refi nancing operations
and the interest rates on the marginal lending facility and the deposit facility will remain unchanged
at 1.00%, 1.75% and 0.25% respectively.
9 FEBRUARY 2012
The Governing Council of the ECB decides that the interest rate on the main refi nancing operations
and the interest rates on the marginal lending facility and the deposit facility will remain unchanged
at 1.00%, 1.75% and 0.25% respectively. It also approves specifi c national eligibility criteria and
risk control measures for the temporary acceptance in a number of countries of additional credit
claims as collateral in Eurosystem credit operations.
8 MARCH, 4 APRIL AND 3 MAY 2012
The Governing Council of the ECB decides that the interest rate on the main refi nancing operations
and the interest rates on the marginal lending facility and the deposit facility will remain unchanged
at 1.00%, 1.75% and 0.25% respectively.
6 JUNE 2012
The Governing Council of the ECB decides that the interest rate on the main refi nancing operations
and the interest rates on the marginal lending facility and the deposit facility will remain unchanged
at 1.00%, 1.75% and 0.25% respectively. It also decides on the details as regards the tender
procedures and modalities to be applied in its refi nancing operations up to 15 January 2013, notably
to continue its fi xed rate tender procedures with full allotment.
5 JULY 2012
The Governing Council of the ECB decides to decrease the interest rate on the main refi nancing
operations by 25 basis points to 0.75%, starting from the operation to be settled on 11 July 2012.
In addition, it decides to decrease the interest rates on both the marginal lending facility and the deposit
facility by 25 basis points, to 1.50% and 0.00% respectively, both with effect from 11 July 2012.
2 AUGUST 2012
The Governing Council of the ECB decides that the interest rate on the main refi nancing operations
and the interest rates on the marginal lending facility and the deposit facility will remain unchanged
at 0.75%, 1.50% and 0.00% respectively.
ECB
Monthly Bulletin
January 2014II
6 SEPTEMBER 2012
The Governing Council of the ECB decides that the interest rate on the main refi nancing operations
and the interest rates on the marginal lending facility and the deposit facility will remain unchanged
at 0.75%, 1.50% and 0.00% respectively. It also decides on the modalities for undertaking Outright
Monetary Transactions (OMTs) in secondary markets for sovereign bonds in the euro area.
4 OCTOBER AND 8 NOVEMBER 2012
The Governing Council of the ECB decides that the interest rate on the main refi nancing operations
and the interest rates on the marginal lending facility and the deposit facility will remain unchanged
at 0.75%, 1.50% and 0.00% respectively.
6 DECEMBER 2012
The Governing Council of the ECB decides that the interest rate on the main refi nancing operations
and the interest rates on the marginal lending facility and the deposit facility will remain unchanged
at 0.75%, 1.50% and 0.00% respectively. It also decides on the details as regards the tender
procedures and modalities to be applied in its refi nancing operations up to 9 July 2013, notably to
continue its fi xed rate tender procedures with full allotment.
10 JANUARY, 7 FEBRUARY, 7 MARCH AND 4 APRIL 2013
The Governing Council of the ECB decides that the interest rate on the main refi nancing operations
and the interest rates on the marginal lending facility and the deposit facility will remain unchanged
at 0.75%, 1.50% and 0.00% respectively.
2 MAY 2013
The Governing Council of the ECB decides to decrease the interest rate on the main refi nancing
operations by 25 basis points to 0.50%, starting from the operation to be settled on 8 May 2013.
In addition, it decides to decrease the interest rate on the marginal lending facility by 50 basis
points to 1.00%, with effect from 8 May 2013, and to keep the interest rate on the deposit facility
unchanged at 0.00%. It also decides on the details as regards the tender procedures and modalities
to be applied in its refi nancing operations up to 8 July 2014, notably to continue its fi xed rate tender
procedures with full allotment.
6 JUNE, 4 JULY, 1 AUGUST, 5 SEPTEMBER AND 2 OCTOBER 2013
The Governing Council of the ECB decides that the interest rate on the main refi nancing operations
and the interest rates on the marginal lending facility and the deposit facility will remain unchanged
at 0.50%, 1.00% and 0.00% respectively.

ECB
Monthly Bulletin
January 2014
CHRONOLOGY
III
7 NOVEMBER 2013
The Governing Council of the ECB decides to decrease the interest rate on the main
refi nancing operations by 25 basis points to 0.25%, starting from the operation to be settled on
13 November 2013. In addition, it decides to decrease the interest rate on the marginal lending
facility by 25 basis points to 0.75%, with effect from 13 November 2013, and to keep the interest
rate on the deposit facility unchanged at 0.00%. It also decides on the details as regards the tender
procedures and modalities to be applied in its refi nancing operations up to 7 July 2015, notably to
continue its fi xed rate tender procedures with full allotment.
5 DECEMBER 2013 AND 9 JANUARY 2014
The Governing Council of the ECB decides that the interest rate on the main refi nancing operations
and the interest rates on the marginal lending facility and the deposit facility will remain unchanged
at 0.25%, 0.75% and 0.00% respectively.

ECB
Monthly Bulletin
January 2014
PUBLICATIONS PRODUCED BY THE EUROPEAN CENTRAL BANK
The ECB produces a number of publications which provide information about its core activities:
monetary policy, statistics, payment and securities settlement systems, fi nancial stability and
supervision, international and European cooperation, and legal matters. These include the following:
STATUTORY PUBLICATIONS
– Annual Report
– Convergence Report
– Monthly Bulletin
RESEARCH PAPERS
– Legal Working Paper Series
– Occasional Paper Series
– Research Bulletin
– Working Paper Series
OTHER/TASK-RELATED PUBLICATIONS
– Enhancing monetary analysis
– Financial integration in Europe
– Financial Stability Review
– Statistics Pocket Book
– The European Central Bank: history, role and functions
– The international role of the euro
– The implementation of monetary policy in the euro area (“General Documentation”)
– The monetary policy of the ECB
– The payment system
The ECB also publishes brochures and information materials on a variety of topics, such as the euro
banknotes and coins, as well as seminar and conference proceedings.
For a complete list of documents (in PDF format) published by the ECB and the European
Monetary Institute, the ECB’s forerunner from 1994 to 1998, please visit the ECB’s website at
http://www.ecb.europa.eu/pub/. Language codes indicate the languages in which each publication
is available.
Unless otherwise indicated, hard copies can be obtained or subscribed to free of charge, stock
permitting, by contacting [email protected]
V


ECB
Monthly Bulletin
January 2014
GLOSSARY
This glossary contains selected items that are frequently used in the Monthly Bulletin. A more
comprehensive and detailed glossary can be found on the ECB’s website (www.ecb.europa.eu/
home/glossary/html/index.en.html).
Autonomous liquidity factors: liquidity factors that do not normally stem from the use of
monetary policy instruments. Such factors are, for example, banknotes in circulation, government
deposits with the central bank and the net foreign assets of the central bank.
Balance of payments (b.o.p.): a statistical statement that summarises, for a specifi c period of time,
the economic transactions of an economy with the rest of the world.
Bank lending survey (BLS): a quarterly survey on lending policies that has been conducted by
the Eurosystem since January 2003. It addresses qualitative questions on developments in credit
standards, terms and conditions of loans and loan demand for both enterprises and households to a
predefi ned sample group of banks in the euro area.
Borrowing requirement (general government): net incurrence of debt by the general government.
Break-even infl ation rate: the spread between the yield on a nominal bond and that on an infl ation-
linked bond of the same (or as similar as possible) maturity.
Capital account: a b.o.p. account that covers all capital transfers and acquisitions/disposals of
non-produced, non-fi nancial assets between residents and non-residents.
Capital accounts: part of the system of national (or euro area) accounts consisting of the change in
net worth that is due to net saving, net capital transfers and net acquisitions of non-fi nancial assets.
Central parity (or central rate): the exchange rate of each ERM II member currency vis-à-vis the
euro, around which the ERM II fl uctuation margins are defi ned.
Compensation per employee or per hour worked: the total remuneration, in cash or in kind, that
is payable by employers to employees, i.e. gross wages and salaries, as well as bonuses, overtime
payments and employers’ social security contributions, divided by the total number of employees
or by the total number of employees’ hours worked.
Consolidated balance sheet of the MFI sector: a balance sheet obtained by netting out
inter-MFI positions (e.g. inter-MFI loans and deposits) in the aggregated MFI balance sheet.
It provides statistical information on the MFI sector’s assets and liabilities vis-à-vis residents of the
euro area not belonging to this sector (i.e. the general government and other euro area residents)
and vis-à-vis non-euro area residents. It is the main statistical source for the calculation of monetary
aggregates, and it provides the basis for the regular analysis of the counterparts of M3.
Collateral: assets pledged or transferred in some form as a guarantee for the repayment of
loans, as well as assets sold under repurchase agreements. Collateral used in Eurosystem reverse
transactions must fulfi l certain eligibility criteria.
Current account: a b.o.p. account that covers all transactions in goods and services, income and
current transfers between residents and non-residents.
VII

ECB
Monthly Bulletin
January 2014
Current transfers account: a technical b.o.p. account in which the value of real resources or
fi nancial items is recorded when these are transferred without receiving anything in exchange.
Current transfers cover all transfers that are not capital transfers.
Debt (fi nancial accounts): loans taken out by households, as well as the loans, debt securities and
pension fund reserves (resulting from employers’ direct pension commitments on behalf of their
employees) of non-fi nancial corporations, valued at market prices at the end of the period.
Debt (general government): the gross debt (currency and deposits, loans and debt securities) at
nominal value outstanding at the end of the year and consolidated between and within the sectors of
general government.
Debt security: a promise on the part of the issuer (i.e. the borrower) to make one or more
payment(s) to the holder (the lender) on a specifi ed future date or dates. Such securities usually
carry a specifi c rate of interest (the coupon) and/or are sold at a discount to the amount that will
be repaid at maturity. Debt securities issued with an original maturity of more than one year are
classifi ed as long-term.
Debt-to-GDP ratio (general government): the ratio of general government debt to GDP at current
market prices. It is the subject of one of the fi scal criteria laid down in Article 126(2) of the Treaty
on the Functioning of the European Union to defi ne the existence of an excessive defi cit.
Defi cit (general government): the general government’s net borrowing, i.e. the difference between
total government revenue and total government expenditure.
Defi cit-debt adjustment (general government): the difference between the general government
defi cit and the change in general government debt.
Defi cit ratio (general government): the ratio of the general government defi cit to GDP at current
market prices. It is the subject of one of the fi scal criteria laid down in Article 126(2) of the Treaty
on the Functioning of the European Union to defi ne the existence of an excessive defi cit. It is also
referred to as the budget defi cit ratio or the fi scal defi cit ratio.
Defl ation: a signifi cant and persistent decline in the prices of a very broad set of consumer goods
and services that becomes entrenched in expectations.
Deposit facility: a standing facility of the Eurosystem enabling eligible counterparties to make, on
their own initiative, overnight deposits with the NCB in their respective jurisdiction. Deposits are
remunerated at a pre-specifi ed rate that normally provides a fl oor for overnight market interest rates.
Disinfl ation: a process of decelerating infl ation that may lead to negative infl ation rates of a
temporary nature.
Direct investment: cross-border investment for the purpose of obtaining a lasting interest in an
enterprise resident in another economy (assumed, in practice, for ownership of at least 10% of
the ordinary shares or voting power). Included are equity capital, reinvested earnings and other
capital associated with inter-company operations. The direct investment account records net
transactions/positions in assets abroad by euro area residents (as “direct investment abroad”) and net
transactions/positions in euro area assets by non-residents (as “direct investment in the euro area”).
VIII

ECB
Monthly Bulletin
January 2014
GLOSSARY
Effective exchange rates (EERs) of the euro (nominal/real): weighted averages of bilateral euro
exchange rates against the currencies of the euro area’s main trading partners. The EER indices
of the euro are calculated against different groups of trading partners: the EER-20 comprises the
ten non-euro area EU Member States and ten trading partners outside the EU, and the EER-40
encompasses the EER-20 and 20 additional countries. The weights used refl ect the share of each
partner country in the euro area’s trade in manufactured goods and account for competition in
third markets. Real EERs are nominal EERs defl ated by a weighted average of foreign, relative to
domestic, prices or costs. They are thus measures of price and cost competitiveness.
Enhanced credit support: the non-standard measures taken by the ECB/Eurosystem during the
fi nancial crisis with a view to supporting fi nancing conditions and credit fl ows above and beyond
what could be achieved through reductions in key ECB interest rates alone.
EONIA (euro overnight index average): a measure of the effective interest rate prevailing in
the euro interbank overnight market. It is calculated as a weighted average of the interest rates
on unsecured overnight lending transactions denominated in euro, as reported by a panel of
contributing banks.
Equities: securities representing ownership of a stake in a corporation, e.g. shares traded on stock
exchanges (quoted shares), unquoted shares and other forms of equity. Equities usually produce
income in the form of dividends.
ERM II (exchange rate mechanism II): the exchange rate arrangement that provides the
framework for exchange rate policy cooperation between the euro area countries and the EU
Member States not participating in Stage Three of EMU.
EURIBOR (euro interbank offered rate): the rate at which what is known as a prime bank is
willing to lend funds (denominated in euro) to another prime bank. The EURIBOR is computed
daily, based on the rates of a sample of selected banks, for different maturities of up to 12 months.
Euro area: the area formed by those EU Member States in which the euro has been adopted as the
single currency in accordance with the Treaty on the Functioning of the European Union.
European Commission surveys: harmonised surveys of business and/or consumer sentiment
conducted on behalf of the European Commission in each of the EU Member States. Such
questionnaire-based surveys are addressed to managers in the manufacturing, construction, retail
and services industries, as well as to consumers. From each monthly survey, composite indicators
are calculated that summarise the replies to a number of different questions in a single indicator
(confi dence indicators).
Eurosystem: the central banking system made up of the ECB and the NCBs of those EU Member
States whose currency is the euro.
Eurozone Purchasing Managers’ Surveys: surveys of business conditions in manufacturing and
in services industries conducted for a number of countries in the euro area and used to compile
indices. The Eurozone Manufacturing Purchasing Managers’ Index (PMI) is a weighted indicator
calculated from indices of output, new orders, employment, suppliers’ delivery times and stocks
of purchases. The services sector survey asks questions on business activity, expectations of future
business activity, the amount of business outstanding, incoming new business, employment, input
IX
ECB
Monthly Bulletin
January 2014
prices and prices charged. The Eurozone Composite Index is calculated by combining the results
from the manufacturing and services sector surveys.
Excess liquidity: the amount of central bank reserves held by banks in excess of the aggregate
needs of the banking system, which are determined by reserve requirements and autonomous
factors.
External trade in goods: exports and imports of goods with countries outside the euro area,
measured in terms of value and as indices of volume and unit value. External trade statistics are
not comparable with the exports and imports recorded in the national accounts, as the latter include
both intra-euro area and extra-euro area transactions, and also combine goods and services. Nor are
they fully comparable with the goods item in b.o.p. statistics. Besides methodological adjustments,
the main difference is that imports in external trade statistics are recorded including insurance and
freight services, whereas they are recorded free on board in the goods item in the b.o.p. statistics.
Financial account: a b.o.p. account that covers transactions between residents and non-residents in
direct investment, portfolio investment, other investment, fi nancial derivatives and reserve assets.
Financial accounts: part of the system of national (or euro area) accounts showing the fi nancial
positions (stocks or balance sheets), fi nancial transactions and other changes of the different
institutional sectors of an economy by type of fi nancial asset.
Financial vehicle corporation (FVC): an entity whose principal activity is to carry out
securitisation transactions. An FVC typically issues marketable securities that are offered for sale
to the general public, or sold in the form of private placements. These securities are backed by
a portfolio of assets (typically loans) which are held by the FVC. In some cases, a securitisation
transaction may involve a number of FVCs, where one FVC holds the securitised assets and another
issues the securities backed by those assets.
Fixed rate tender: a tender procedure in which the interest rate is specifi ed in advance by the
central bank and in which participating counterparties bid the amount of money they wish to
transact at the fi xed interest rate.
Fixed rate full-allotment tender procedure: a tender procedure in which the interest rate is
pre-specifi ed by the central bank (fi xed rate) and in which counterparties bid the amount of
money they want to transact at that rate, knowing in advance that all their bids will be satisfi ed
(full allotment).
Forward guidance: communication by a central bank on the orientation of monetary policy with
respect to the future path of policy interest rates.
General government: a sector defi ned in the ESA 95 as comprising resident entities that are
engaged primarily in the production of non-market goods and services intended for individual and
collective consumption and/or in the redistribution of national income and wealth. Included are
central, regional and local government authorities as well as social security funds. Excluded are
government-owned entities that conduct commercial operations, such as public enterprises.
Gross domestic product (GDP): the value of an economy’s total output of goods and services less
intermediate consumption, plus net taxes on products and imports. GDP can be broken down by
X
ECB
Monthly Bulletin
January 2014
GLOSSARY
output, expenditure or income components. The main expenditure aggregates that make up GDP are
household fi nal consumption, government fi nal consumption, gross fi xed capital formation, changes
in inventories, and imports and exports of goods and services (including intra-euro area trade).
Gross external debt: the outstanding amount of an economy’s actual (i.e. non-contingent) current
liabilities that require payment of principal and/or interest to non-residents at some point in the
future.
Harmonised Index of Consumer Prices (HICP): a measure of the development of consumer
prices that is compiled by Eurostat and harmonised for all EU Member States.
Hourly labour cost index: a measure of labour costs, including gross wages and salaries (in cash
and in kind, including bonuses) and other labour costs (employers’ social contributions plus
employment-related taxes paid by the employer minus subsidies received by the employer), per
hour actually worked (including overtime).
Implied volatility: the expected volatility (i.e. standard deviation) in the rates of change of the
price of an asset (e.g. a share or a bond). It can be derived from the asset’s price, maturity date and
exercise price of its options, as well as from a riskless rate of return, using an option pricing model
such as the Black-Scholes model.
Income account: a b.o.p. account that covers two types of transactions with non-residents, namely
(i) those involving compensation of employees that is paid to non-resident workers (e.g., cross-
border, seasonal, and other short-term workers) and (ii) those involving investment income receipts
and payments on external fi nancial assets and liabilities, with the latter including receipts and
payments on direct investment, portfolio investment and other investment, as well as receipts on
reserve assets.
Index of negotiated wages: a measure of the direct outcome of collective bargaining in terms of
basic pay (i.e. excluding bonuses) at the euro area level. It refers to the implied average change in
monthly wages and salaries.
Industrial producer prices: factory-gate prices (transportation costs are not included) of
all products sold by industry, excluding construction, on the domestic markets of the euro area
countries, excluding imports.
Industrial production: the gross value added created by industry at constant prices.
Infl ation: an increase in the general price level, e.g. in the consumer price index.
Infl ation-indexed government bonds: debt securities issued by the general government, the
coupon payments and principal of which are linked to a specifi c consumer price index.
Insurance corporations and pension funds: fi nancial corporations and quasi-corporations that are
engaged primarily in fi nancial intermediation as the consequence of the pooling of risks.
International investment position (i.i.p.): the value and composition of an economy’s outstanding
net fi nancial claims on (or fi nancial liabilities to) the rest of the world.
XI

ECB
Monthly Bulletin
January 2014
International reserves: external assets readily available to and controlled by monetary authorities
for directly fi nancing or regulating the magnitude of payment imbalances through intervention in
exchange markets. The international reserves of the euro area comprise non-euro-denominated
claims on non-euro area residents, gold, special drawing rights and the reserve positions in the IMF
which are held by the Eurosystem.
Investment funds (except money market funds): fi nancial institutions that pool capital raised
from the public and invest it in fi nancial and non-fi nancial assets. See also MFIs.
Job vacancies: a collective term covering newly created jobs, unoccupied jobs or jobs about to
become vacant in the near future, for which the employer has recently taken active steps to fi nd a
suitable candidate.
Key ECB interest rates: the interest rates, set by the Governing Council, which refl ect the
monetary policy stance of the ECB. They are the rates at the main refi nancing operations, on the
marginal lending facility and on the deposit facility.
Labour force: the sum total of persons in employment and the number of unemployed.
Labour productivity: the output that can be produced with a given input of labour. It can be
measured in several ways, but is commonly measured as GDP (volume) divided by either total
employment or total hours worked.
Liquidity-absorbing operation: an operation through which the Eurosystem absorbs liquidity
in order to reduce excess liquidity, or to create a shortage of liquidity. Such operations can be
conducted by issuing debt certifi cates or fi xed-term deposits.
Longer-term refi nancing operation (LTRO): an open market operation with a maturity of more
than one week that is executed by the Eurosystem in the form of a reverse transaction. The regular
monthly operations have a maturity of three months. During the fi nancial market turmoil that started
in August 2007, supplementary operations with maturities ranging from one maintenance period to
36 months were conducted, the frequency of which varied.
M1: a narrow monetary aggregate that comprises currency in circulation plus overnight deposits
held with MFIs and central government (e.g. at the post offi ce or treasury).
M2: an intermediate monetary aggregate that comprises M1 plus deposits redeemable at a period
of notice of up to and including three months (i.e. short-term savings deposits) and deposits with an
agreed maturity of up to and including two years (i.e. short-term time deposits) held with MFIs and
central government.
M3: a broad monetary aggregate that comprises M2 plus marketable instruments, in particular
repurchase agreements, money market fund shares and units, and debt securities with a maturity of
up to and including two years issued by MFIs.
Main refi nancing operation (MRO): a regular open market operation executed by the Eurosystem
in the form of reverse transactions. Such operations are carried out through a weekly standard
tender and normally have a maturity of one week.
XII

ECB
Monthly Bulletin
January 2014
GLOSSARY
Marginal lending facility: a standing facility of the Eurosystem enabling eligible counterparties,
on their own initiative, to receive overnight credit from the NCB in their jurisdiction at a
pre-specifi ed rate in the form of a reverse transaction. The rate on loans extended within the scope of
the marginal lending facility normally provides an upper bound for overnight market interest rates.
Maximum bid rate: the upper limit to the interest rates at which counterparties may submit bids in
variable rate liquidity-absorbing tender operations.
MFI credit to euro area residents: MFI loans granted to non-MFI euro area residents (including
general government and the private sector) and MFI holdings of securities (shares, other equity and
debt securities) issued by non-MFI euro area residents.
MFI interest rates: the interest rates that are applied by resident credit institutions and other MFIs,
excluding central banks and money market funds, to euro-denominated deposits and loans vis-à-vis
households and non-fi nancial corporations resident in the euro area.
MFI longer-term fi nancial liabilities: deposits with an agreed maturity of over two years, deposits
redeemable at a period of notice of over three months, debt securities issued by euro area MFIs with
an original maturity of more than two years and the capital and reserves of the euro area MFI sector.
MFI net external assets: the external assets of the euro area MFI sector (such as gold, foreign
currency banknotes and coins, securities issued by non-euro area residents and loans granted to
non-euro area residents) minus the external liabilities of the euro area MFI sector (such as non-euro
area residents’ deposits and repurchase agreements, as well as their holdings of money market fund
shares/units and debt securities issued by MFIs with a maturity of up to and including two years).
MFIs (monetary fi nancial institutions): fi nancial institutions which together form the money-
issuing sector of the euro area. These include (i) the Eurosystem, (ii) resident credit institutions
(as defi ned in EU law), (iii) other fi nancial institutions whose business is to receive deposits
and/or close substitutes for deposits from entities other than MFIs and, for their own account
(at least in economic terms), to grant credit and/or invest in securities, as well as electronic money
institutions that are principally engaged in fi nancial intermediation in the form of issuing electronic
money, and (iv) money market funds, i.e. collective investment undertakings that invest in
short-term and low-risk instruments.
Minimum bid rate: the lower limit to the interest rates at which counterparties may submit bids in
variable rate liquidity-providing tender operations.
Open market operation: a fi nancial market operation executed on the initiative of the central
bank. These operations include reverse transactions, outright transactions as well as the issuance of
fi xed-term deposits or debt certifi cates or foreign exchange swaps. The open market operations can
be liquidity providing or liquidity absorbing.
Other investment: an item in the b.o.p. and the i.i.p. that covers the fi nancial transactions/positions
with non-residents in trade credits, deposits and loans, and other accounts receivable and payable.
Portfolio investment: euro area residents’ net transactions and/or positions in securities issued
by non-residents of the euro area (“assets”) and non-residents’ net transactions and/or positions
in securities issued by euro area residents (“liabilities”). Included are equity securities and debt
XIII
ECB
Monthly Bulletin
January 2014
securities (bonds and notes, and money market instruments). Transactions are recorded at the
effective price paid or received, less commissions and expenses. To be regarded as a portfolio asset,
ownership in an enterprise must be equivalent to less than 10% of the ordinary shares or voting
power.
Price stability: as defi ned by the Governing Council, a year-on-year increase in the HICP for the
euro area of below 2%. The Governing Council has also made it clear that, in the pursuit of price
stability, it aims to maintain infl ation rates below, but close to, 2% over the medium term.
Purchasing power parity (PPP): the rate at which one currency is converted into another so as
to equalise the purchasing power of the two currencies by eliminating the differences in the price
levels prevailing in the countries concerned. In their simplest form, PPPs show the ratio of the
prices in national currency of the same good or service in different countries.
Reference value for M3 growth: the annual growth rate of M3 that is deemed to be compatible
with price stability over the medium term.
Reserve requirement: the requirement for institutions to hold minimum reserves with the central
bank over a maintenance period. Compliance with the requirement is determined on the basis of the
average of the daily balances in the reserve accounts over the maintenance period.
Reverse transaction: an operation whereby the NCB buys or sells assets under a repurchase
agreement or conducts credit operations against collateral.
Securitisation: a transaction or scheme whereby an asset or a pool of cash fl ow-producing assets,
often consisting of loans (mortgages, consumer loans, etc.), is transferred from an originator
(usually a credit institution) to a fi nancial vehicle corporation (FVC). The FVC effectively converts
these assets into marketable securities by issuing debt instruments with principal and interest
serviced through the cash fl ows produced by the asset pool.
Structural fi scal balance (general government): the actual budget balance corrected for cyclical
factors (i.e. the cyclically adjusted balance) and one-off fi scal measures.
Survey of Professional Forecasters (SPF): a quarterly survey that has been conducted by the
ECB since 1999 to collect macroeconomic forecasts on euro area infl ation, real GDP growth and
unemployment from a panel of experts affi liated to fi nancial and non-fi nancial organisations based
in the EU.
Unit labour costs: a measure of total labour costs per unit of output calculated for the euro area as
the ratio of total compensation per employee to labour productivity (defi ned as GDP (volume) per
person employed).
Variable rate tender: a tender procedure where the counterparties bid both the amount of money
they wish to transact with the central bank and the interest rate at which they wish to enter into the
transaction.
Volatility: the degree of fl uctuation in a given variable.
XIV

ECB
Monthly Bulletin
January 2014
GLOSSARY
XV
Write-down: a downward adjustment to the value of loans recorded in the balance sheets of MFIs
when it is recognised that the loans have become partly unrecoverable.
Write-off: the removal of the value of loans from the balance sheets of MFIs when the loans are
considered to be totally unrecoverable.
Yield curve: a graphical representation of the relationship between the interest rate or yield and the
residual maturity at a given point in time for suffi ciently homogenous debt securities with different
maturity dates. The slope of the yield curve can be measured as the difference between the interest
rates or yield at two selected maturities.


MONTHLY BULLET INJaNUarY
011201402120140312014041201405120140612014071201408120140912014101201411120141212014
EUrO
PEaN
CEN
TraL
BaN
K M
ONTH
LY B
ULLE
TIN
EN
0112
014
MONTHLY BULLET INJaNUarY
011201402120140312014041201405120140612014071201408120140912014101201411120141212014
Related Documents