University of Nebraska - Lincoln DigitalCommons@University of Nebraska - Lincoln Historical Materials from University of Nebraska- Lincoln Extension Extension 4-1946 EC841 Revised 1946 Annual Farm Business Report Follow this and additional works at: hp://digitalcommons.unl.edu/extensionhist is Article is brought to you for free and open access by the Extension at DigitalCommons@University of Nebraska - Lincoln. It has been accepted for inclusion in Historical Materials from University of Nebraska-Lincoln Extension by an authorized administrator of DigitalCommons@University of Nebraska - Lincoln. "EC841 Revised 1946 Annual Farm Business Report" (1946). Historical Materials om University of Nebraska-Lincoln Extension. 2316. hp://digitalcommons.unl.edu/extensionhist/2316

Welcome message from author
This document is posted to help you gain knowledge. Please leave a comment to let me know what you think about it! Share it to your friends and learn new things together.
Transcript

University of Nebraska - LincolnDigitalCommons@University of Nebraska - LincolnHistorical Materials from University of Nebraska-Lincoln Extension Extension
4-1946
EC841 Revised 1946 Annual Farm BusinessReport
Follow this and additional works at: http://digitalcommons.unl.edu/extensionhist
This Article is brought to you for free and open access by the Extension at DigitalCommons@University of Nebraska - Lincoln. It has been accepted forinclusion in Historical Materials from University of Nebraska-Lincoln Extension by an authorized administrator of DigitalCommons@University ofNebraska - Lincoln.
"EC841 Revised 1946 Annual Farm Business Report" (1946). Historical Materials from University of Nebraska-Lincoln Extension. 2316.http://digitalcommons.unl.edu/extensionhist/2316

I April 1946 ---
E. C. 841 Rev.
Ai.T.NlJ.AL F .AID! BUS UTESS REPORT
Forty:-eight sout;hee.st Nebraska f arms in Cas s, Gage,
Jef:::' e;rson, . ~oh.:-.".1.son, Lancaster,. Ner:1aha, Otoe, Pa\.rnee, Richard.son,
nnd Saline .Cou..'l:ties.
1~, ~' ~i£.1 ,:. ·s ~ ,._, J ;:::::>
~ ~~ ~ <::J cr
17 ~ C\J L.J.. &§ This report: h::>.s been prepc>.red by :r:nembers of the ~ ~ ~:::; ~ :te. De,tmen~ of . Rural Economics and the . .l\;ricul tural Extensio!l
S~i .ce . ~~ : _enable each f ar m operator to compare his business
1..ri th othe r ~arm businesses - in the area. Special emphasis has
b e en p;t.aced. upon those fa-cto:;-s t!fat have the most influence
1pon · the retru:n:~ to th·~ f arm operator. By study ing this
anal;\'sis it is hoped . :l!h~t the farmer will be able to make
change3 tha.t \..ril~ .. increase hi s net earnings •
. -! • I
Nebraska . COOP:ERATIVE EXTENSIOU i'lORK
IN AGR I CtJL 'IURE AlTD EO!v'Lill ECONOMI CS ·u. of N. Agr. Colleg e and U. S. Dent. of Agr. Cooperating
. \~. R. BrokA.t-r , Director, Lincoln

-2-
AlOOJAL FARM :BUSU!ESS REPORT
This report presents an analysis of farm income and expenses and soine·.reasons for differences in net returns. Special emphasis is placed upon a~ examination of the factors that influenced the 1945 labor inco:nes of the farmers who . kept _th~ records.
Farm businesses in Southeast !l!ebraska include a wide diversity of enterprises. Corn, oats, 'I'Theat, and alfalfa are the principal crops.. ·Corn constitutes about _34 per cent of the total 'crop acres, and \-theat is t he next largest crop comprising 18 per cent of the total crop acres. Brome grass is becoming increasir~ly important on t he rolling upland. Beef cattle, dairy cows, hogs, and chickens are the major livestock enterprises. The hog returns represent 33 per cent of the total receipts and ne t increases, and cattle returns represent 24 per cent, while feed and grain represent only 18 per cent. This indicates that most of the grains are fed to livestock.
roPOGR.APHY, SOIL, and WEATHER
The eastern part of the area incl~ed in this report is in the East Loess Hill region including all or pa rt of the counties bordering the Missour:i River and extending into the northeastern· p?xt of Johnson and Lancaster Counties. About one-fifth of t l is area. is level· ·a."ld :can be farmed without giving particular· attention to erosion control measures. and on another fifth, simple erosion control pract.ice·s need to be applied • . The remaining part should be protected from '~ater erosion b;y· the use of intensive erosion control measures.
The remainder of ·the Southeast Nebraska area, with the ~xception of the s outh~test corner of Jefferson Count y and the northwestern half of Saline Coun.ty which is in the Nebraska Plains (Loess Plains) area, is Loess Drift Hills . Most of t he soils in this area are formed from glacial material. About 'one-fourth of the soils in t~is part of Southeast Nebraska are clay loam with tight clay or claypan subsoils. Another 33 per cent have moderately tight or semi-clqypan subsoils. The topography varies from gently rolling to hilly and broken. The general surface presents the appeexa"lce of a plain sloping towcrd the southeast. Erosion is quite rapid and can be very serious; consequently, the type of crops grown and the tillage practi?es used in this area are very important.
29294jg-;-l0/45
:
I .
-3-
. -Table 1.. Mqnt[l~y and .Annual Precipi ta.t·ion at S~rracuse.
Lincoln (.Agronom;r Farm), an.:t Pa,,mee City , 1945, \Y" i-th depar tures from normal.
Pr ecipita tion Precipit at ion Pr ecipita tion Departure Depa:rture Dept:>..rtur e
Month from normal from norrrw.l from normal
Inches Inches Inches
1945 Lincoln Syracuse Pawnee City
J anuary 0.49 -0.19 0.14 -o.65 0.56 -0.12
Febru ary 1.4S +0.67 0.75 -0.35 2.09 +1.07
March 1.56 +0.27 l.qq -- ~
+o.Go 2.12 +0.68
April 4.4o +2 .17 11 o6 '"!- . _,~ +2.44 5-12 +2.28
May 5.24 +2.43 6 .03 +1.93 6.45 +2.07
June 5.28 +1.29 3.42 -1.05 6.21 -t-1.69
J uly 2. 47 -o.Go 3·27 -0.21 2.06 . ~1.)4
August ~ :-4 . ./ · ) +0.25 3 .15 - 0 . 10 2 . 28 -1.64
Septemb er 3 .15 -0.23 3 -62 +0.21 5-56 +1.76
October 0.04 -1.50 0.13 -2 .11 0 . 20 -2.21
Nov ember 0.08 -0.96 0.64 -0.67 0.76 -0.85
December 1.69 +0.91 1.61 +0.64 1.4o +0.47
1945 total 29.42 +4.51 29-71 +0.68 34.81 +3.86 1944 total 34.49 +9-58 39-80 +10. 77 44.52 -t-13.57 194 3 total 24.17 -4.22 27.73 -2.78 25.42 - 6.74
Norm.:.l Precipi t-at ion 24.91 29·03 ·30.95
Monthly and arillual precipit~tion figures ?..regiven in Ta.ble 1 for Lincoln, Pa,_.,rnee City, and Syracuse. R.<tin.fall at these points was above normal for the y ear rw..gir..g from a plus 0.68 at Syracuse to a plus 4.51 inche~ at Lincoln. Heavy rains in the spring of 1945 delayed crop planting . During July and August crops suffered from lack of moisture because there was less rainfall than normal,
29294jg-10/46
-4-
. ' '
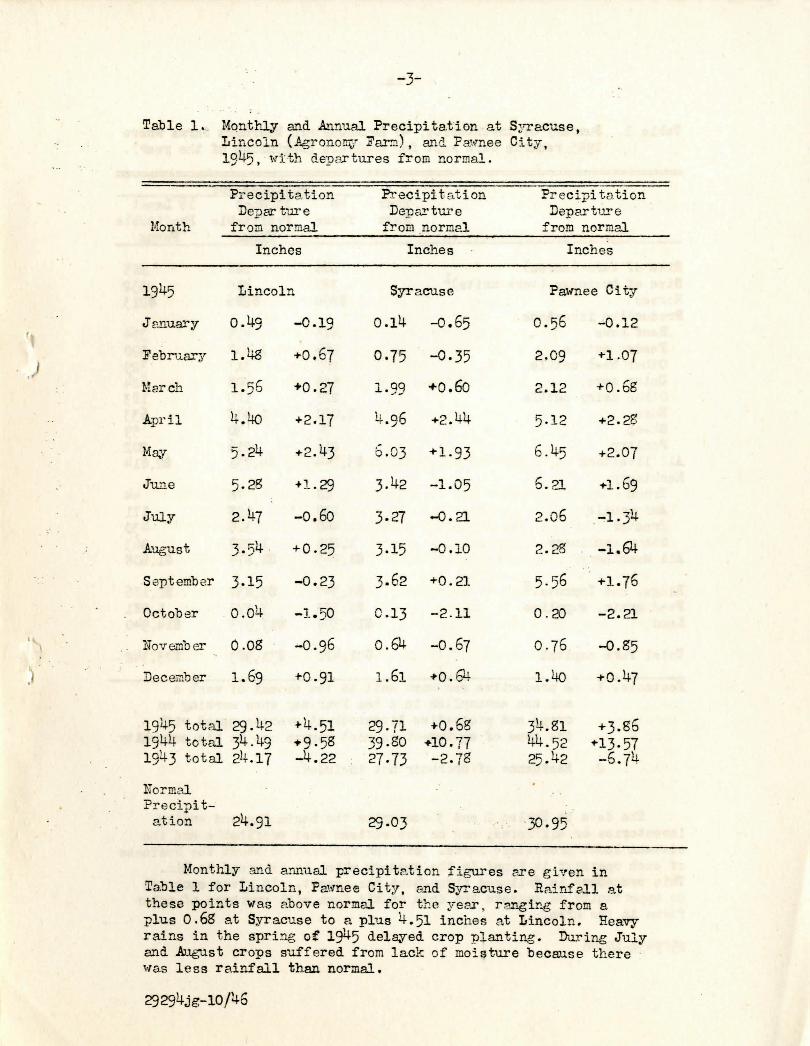
Table 2. Sun;.a;y :·of inventories, ·48 Southeastern Nebraska farms where 1945 record_s \of ere kept for analysis · (Begin..'ling of t he year).
S·ize of farm (acres} · · .. Size of busi-n~ss ( \.J'ork units )l Horses Productive liv~stock
Beef cows Feeder cattl~ · Other beef cattle Dairy cmrs Ot her dairy cattle Hogs Sheep Poultry
All livestock ~!e .. ch ir1: ery
Trucl~ Automogile Trac t or Other machinery
All i<!achinery
Blc'.gs . a.'l~l Impr~ts. 2 Fe eC. grain, supplies La:fJ.d
Total farm capital
;Your ·F¥m
48 Aver~es for:
16 Host farms Profitable
Farms
286 288 ~so _, 415
$256 $286
415 479 964 1,668 285 317 535 408 225 165
1,070 1,448 ~4 30 -" .
216. 216 $3,744, $4,731
68 78 230 198 44o 376
1,205 1,227 $1,943 $1,879
$3,347 $3,837 $2,773 .. 3. 275
$19,359 $17.975
$31,422 $31,~83
16 Least Pro f itable
Farms
285 332
$21 ~ -"
~q4 _;_,.
390 329 624 183 633
!'::0 ..I ..I
C:02 $2,814
44 171 430 963
$1,608
$2,186 1,581
$14,940
$23,342
Footnotes 1. A productive man '\'rork unit is t he a.."'lount of 'I'!OrlC a man can accomplish in a ten hour .day \·then working on crqps C'..L'1d pr od.uctive livestock a t .. aver· age speed t-ri th the type of equipner t in most co~~on use in his cosmunity.
2. Residence of operator not included.
The da ta in Tgbles 2 2.nd 3 summarize the begin:1ing and. ending inventori e s on all forms, ~mel .on t h e sixteen most profi tabJ.e and the sixteen ·least · pi·ofi tabl~ farms. Similar information about t he business of ea ch operator . is t ~~ed in the summ2ry wh~ ch is returned to him. This procedure is -. follo't'led tl-..Toughout the report. It gives each man &"l opportunity ~o compare the data on his farm tvith a.verages of other f~·ms in t he area • .
29294jg-l0/46 ..
/

)
-5-
The aver age investment in farm business did not cha~ge materia~ly during t he year. TI1e decline in value of feed, grain, &~d supplies '·:as offset by a..11 i ncrease of the investment in product ive livestock , princ.ipally hogs. Incr eases in ell productive livestock "~<rer e mo st mark ed ·i n: the six teen least :profitable farms. Most all f arms showed an i ncrease of the investmen t in machiner~r .
Table 3· Su:mnar y of inventories, 48 Southeastern l~ebrasl::a farms wher e 1945 records ''' ere kep t for analysis (End of year)
Averages for: Your 48 16 Most 16 Least
Item Farm :f~.rms Profitable Profitable Farms Farms
Horses $209 $226 $175 Productive lives t ock
Beef cows 4o7 392 465 Feeder cat tle 1,020 1,532 806 Ot her beef cattle 314 304 342 Datry CO'.rlS 509 424 596 Other dairy cattle 247 176 225 Hogs 1,297 1 64::<
' J
1,011 Sheep 41 41. 83 Poultry 217 200 213
All livestock $4,052 $4,768 $3.741 1'-lach j_ nery and equip:
Truck 64 53 35 Automobile 107 188 142 -'·' Tractor 439 395 4~2 Other machinery 1,397 1,491 1,1 6
All mac~in.ery 2,097 2,127 1,814 Feed, gr a in, supplies 2,333 3 ,017. . . 1,372 Buildi:ngs, improvements .... $3,21+3 $3,300 $2,102 Land . $19 .• 359 $17.975 $14,9l.!o
Total farm capital $31,348 $31,913 $24,144
29294jg-10/46
. .-·6-
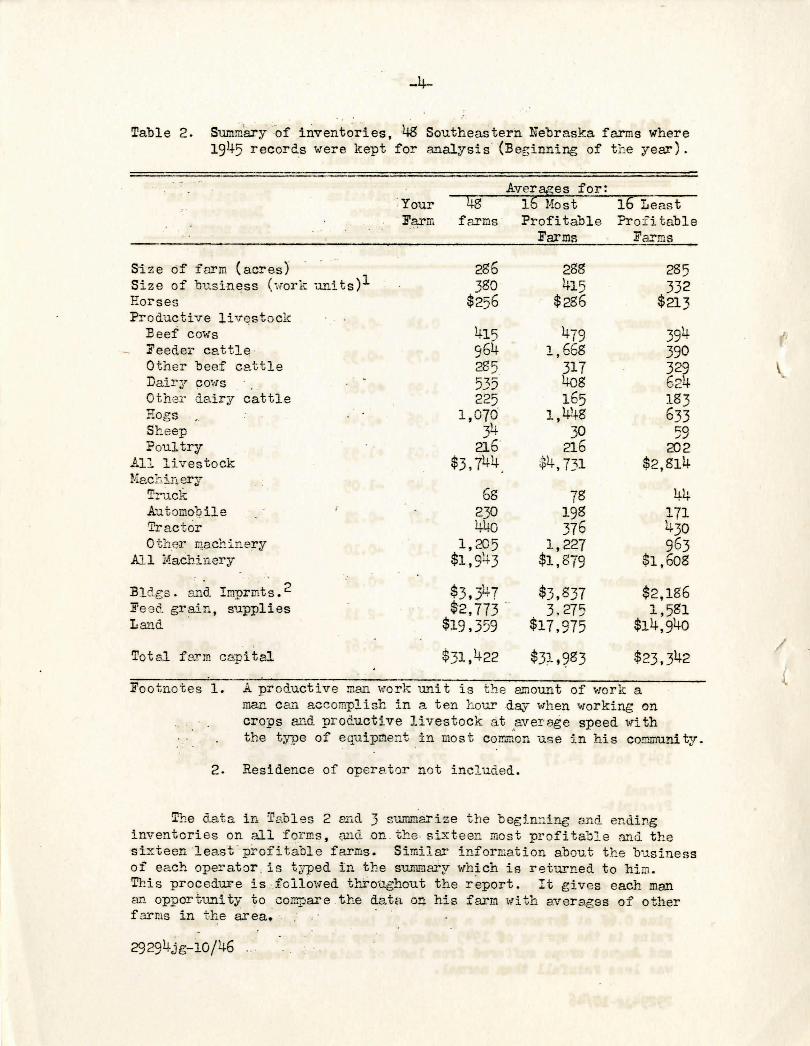
Productive man work required for major crops a...'ld types of livestock for Eastern Hebras·k~t .
Item
Milk cow producing:
Less than 16o lts. of butt erfa t
lv!ore t h a..."l 160 lbs. of -butterfat
·o·ther dai.ry cattle Feeder cattle :Beef cot.;s
Other :Beef cattle Hogs
··Sheep, farm flock Poultry
Corn, husked Cor·n, hogged Corn, silage i'lhea.t Oats or barley .Alfalfa hay Seed (Alfalfa br clover) · Other hay Grain Sorghum For age Sorghum · Temporary Pasture Soybeans
Footno te 3:
Unit
1 head
1 head
1 animal unit3 1 head 1 head
1 animal unit 100 pou.."ld gain 1 animal U.."li t 100 head
1 acre 1 acre , a cre .l.
1 acre 1 acre 1 acre 1 acre 1 a cre 1 acre 1 acre 1 acre 1 acre
Hours of labor reuuired
100
130
4o 15 4o
·4o 3
35 200
8 4
14 6 6
12 10
6 10 12 3 9
~ productiye livestock &"limal unit repr esents one cow, one bull, . one feeder steer or heifer, t,ro hea.d of
. · stock cat tle .1 ·to 2 years old, four cal Yes under 1 year old, seven sl!eep, 1000 pounds of hogs produced, or 100 head of poultry .
29294jg-10j46

" .I
-7-1
Table 4. Summar~! of l a..Tl d us e on l.jg Southeast'ern lfebre.ska f arms , 1945 account records.
Av erage acres for: kr es 16 most 16 l e.=_s t
Item on your 48 Profitable · I:rofi table farm farms Farms Fe...rms
Corn 71 82 55 Oat s 28 28 28 \!The at 37 38 30 Alf alfa 18 17 . 19 Corn or Sorghum Fodder 1 1 1 Corn or Sorghum Silage 2 -, 2 :J Legume and other tilled.
Pasture 35 41 26 tVild hay 10 6 16 Other cropland 7 3· 5
Total Cropl and CD9 219 182 Permaner.t Pastui·e 59 53 82 Farmstead, ro ads cmd waste 18 16 21
Total l and in fe.rm 286 288 285
Per Cent of Total Acr eage in Each Use
Cor n 24.8 28 ·5 19-3 Oa ts / .. 9-8 9-7 9-8 Wheat - 1? 0
-- L. • ..) 13.2 10.5 Alfal f_a 6.3 5.9 6.7 Corn or Sorghum Fodder .4 .4 .4 Corn or Sorghum Silage ·1 1.0 ·1 LegU!lle and other tilled
:pas ture 12.3 14.2 9-1 i'iiJ.d hay 3- 5 2.1 5.6 Otl:er C4:o:pl and 2.4 1.0 1.8
Total Cropla..nd 73. 1 76.0 63.9 Permsnen t :pasture 3:).6 18.4 28.8 Farmstes.d., roads and waste 6 ..,
·) 5;6 1·3 Total land in farm 100.0 100.0 100.0
The acreage and type s of crops grmm on t:-.e mo s t profitable f arms did not YaiY gree.t l y from the land use on all f p...rms and on the least :profi tabl e units excep t \·ri th respect t o the corn acreage . The most profitable farms exce eded t he aver 2g e acr ea€e of corn for all f arms by ov8r t en a c:ces and exceeded t he averc:Jge acr eage of corn on the l east :profitable f a.rms by more t hen h;en ty- f'ive ncr es . ~Je i ther the most prof.i t able f axns nor the leas t pr ofitabl e g:rou:p varied materially from the average of all f a rms in tot al land area, however , the mos t profit able group diO. e.'C ceecl t he leas t profitable gr o'~:P by thirt y-seven acres in t otal crop land.
29294jg-10j 46

-8-
Data in T&ble 5 shows the average number of livestock on each group of farms at the begir..ning a11d end of the year. Pigs showed the most signifiC&it cha~ge from the begirilling to the ending inventory by an increase of almost ten for all farms and an increase of almost tt..renty for the least profitable group.
Table 5. Summary of livestock organization on 48 Southeastern Nebraska farms, 1945 account records (Uumber of Head).
:Beginning of ;y:ear invent,or;z: :Elnd of ;z:ear invent9r;y: 16 most 16 least 16 most 16 least
Type of Your 48 profit- profit- Your 48 profit- profit-Livestock farm f arms able able f?...rm farms able able
farms farms farms farms
Horses 4.4 4.6 3·8 3-9 4.1 ..., I" )•0
Colts .1 .1 .1 .1 .2 .1 :Beef cows 5.4 6.2 5.6 5.1 4;5 6.3 Feeder
cattle 14.3 24.0 5·9 12.9 3').8 10.5 Other beef
cattle 5 .8 5.3 7·~ 5·9 4.9 6.4 Dairy cows 6.0 5.4 6. 5.8 5.4 6.4 Other dcdry
cattle 5.4 4.6 5·3 5·7 4.8 5.4 Brood So•tls 10.8 15.1 6.3 11.1 16.6 6·.4 Pigs 16.7 23.2 5A0 26.5 3Q.2 24.6 Other hogs 19:5 28.1 12.5 2).3 23.5 2'J. 2 Sheep 3·4 3.4 5.8 4.5 5.7 1·9 Poultry 22lL5 228.0 216.9 231.1 210.2 231.8
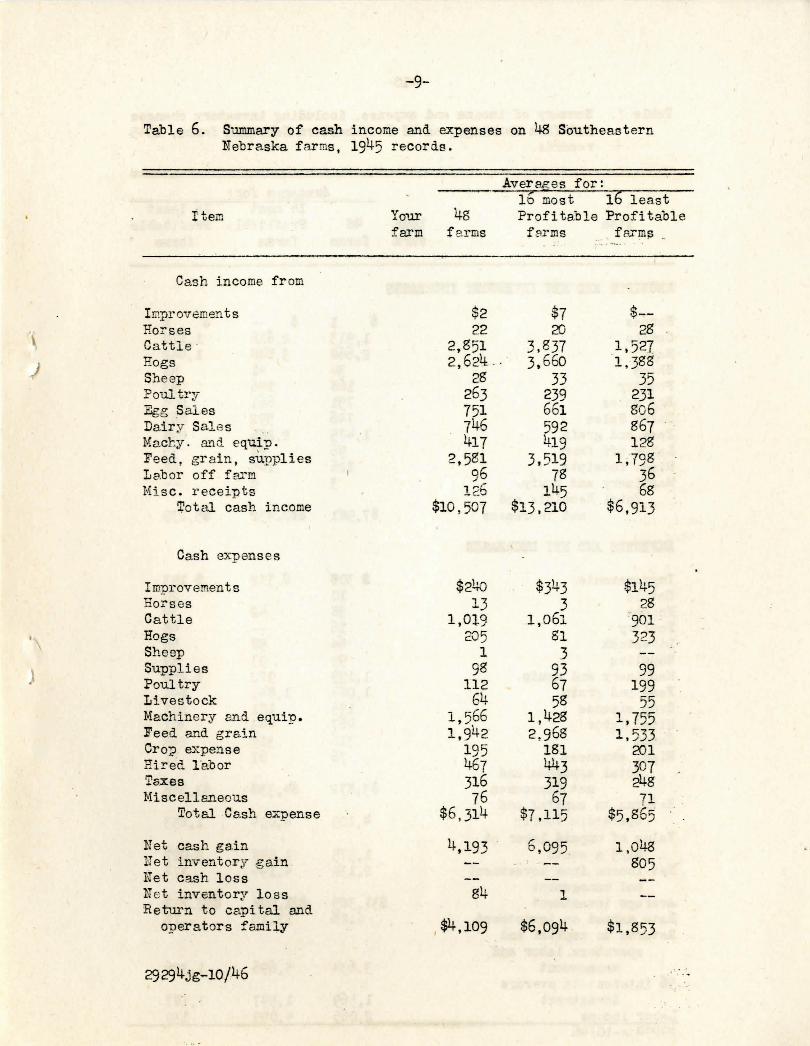
Cash incowes and expenses ~for the various groups of farms are presented in Table 6. The data in Table 7 shows t he farm earnings including cash receipts, expenses, · and net inventory chal'lges. Eogs, cattle, a::1d gra.in 1vere t he principal sources of income on the nost profitable farms. Hogs, and cattle also 'led on the least profitable f a rms, but dairy co'!rlS and poultry con tz-i'buted a. larger portion of the to tal net returns than on the most profitable farms.
Labor incomes varied from $11,346 to a minus $3,760 . . Tne average labor incomes of t h e sixteen operators who earned the highest p ercentage on the total investment v!ere $4,099. T:b.e sixteen >'lho Ntrned the lowest percentage rece ived only $139 for t heir labor and managemer.t after deducting 5 per cent i~terest on the investment in the farm business and allO\ving >vages at $125 a month to members of tl-·e f e.mily \vho replaced hired labor and. tv ere not :paid regD .. ?~r t~?..ges. Climat ic conditions 2-nd type of soil may be a cause for the differences a..-•1c .. t h es-e cannot be controlled by the farm operator, but m&J.y changes that will improv·e net income can be made in most farm businesses.
29294jg-l0/46
I
-9-
Table 6. Summary of cash income and expenses on 48 Southeastern Nebraska farms, 1945 records.
Aver?..ges for: 16 most 16 least
Item Your 48 Profitable Profitable farm f arms fro-ms farm~ -
Cash income from
Improvements $2 $7 $--Horses 22 20 2g Cattle · 2,851 3.837 1,527
,J Hogs 2,624 - . 3,660 1,388 Sheep 28 33 35 Poultry 263 239 231 Egg Sales 751 661 806 Dairy Sales . . 746 592 867 Macty. a7ld equi n. 417 lllQ 128
' -. _,
Feed, grain, su~plies 2,581 3,519 1,798 Labor off farm 96 78 36 His c. receipts 1 ,....~
- c O 145 68 'J;otal cash income $10,507 $13,210 $6,913
Cash expenses
Improvements $24o $343 $145 Horses 13 3 28 Cattle l,Ol-9 1,061 .901 Hogs 205 81 323 Sheep 1 3 Supplies 98 93 99 Poultry 112 67 199 Livestock 64 58 55 Machinery and equip. 1,566 1,428 1,755 Feed a11d grain 1,942 2,968 1,533 Cro::? expense 195 181 201 Hired h1.bor 467 443 307 Ts.xes 316 319 248 Miscellaneous 76 67 71
Total Cash expense $6,314 $7,115 $5,865
Net cash gain 4,193 6,095 1,048 1:r et inventory gain 805 Net cash loss Net inventory loss 84 1 Retur·n to capital and
operators family ' $4,109 $6,094 $1,853
29294jg-l0/46 •. ~ .

-10-
Table 7. Summary of income and expense, including inventory changes and farm earnings, on 48 Southeastern Nebraska f~rms, 1945 records.
Item Your farm
RECEIPr.::'S AND UET Dr\"ENTORY Ii:JCRW.A.CiES
Eorses Cattle Eogs Sheep Poultry Egg Sales Dairj7 Sales Feed a.'ld. grain Labor off farm Misc . recei::pts Machinery a."'ld equip .
Total Receipts and net increases
EXPENSES All-:D 1-TET DECREASES
Improvements Cattle Bo:r ses Poultry Liv estock Supplies Machinery and equip. Feed aYJ.d grain Crop expense Hired labor Taxes 1'1isc. expenses
Total expenses and net decreases
Returns to capital ancl operators famil~r
Value of unpaid labor at ··• $125 a wonth
Net income from investment and manage;;1ent
Average investment Rat e earned on investment Returns to capital and
operators labor and
5~ management
interest on average investment
Labor income 29?C14.j,<;-10/46
Averf!ges for: 16 most
48 Profitable farms farms
$ 1 1,913 2,668
34 168 751 746
1,475 96
126 3
$7,981
$ 308 10 38 16 64 99
1,199 1,084
195 467 316
76
$3,872
4,109
1,915 2,134
$31,385 6.8%
3.634
1,569 2,065
$ 2,616 3,848
41 156 661 592
2, 286 78
145 9
$10,432
$ 372
42
58 93
922 1,841
181. 443 319 .67
$4,338
6,094
1,898 4,196
$31,948 13.1%
5.696
1,597 4,099
16 least Profitable
farms
$ 1 1,170 1,442
58 93
806 867 698 36 68
$5,239
$ 193 29 39 48 56 99
1,454 641 201 307 248 71
$3,386
. 1,353
2,027 1-ll ( .
$23,743 -.7%
1,326
1,187 139
i
J
~

'\
.1
- :
-11-
Table 8. Comparison of some factors that affect farm income, 48 Southeastern Nebraska Farms, 1945 Account Records.
Aver~,;;es for: 16 most 16 least
Iter:! Your 48 Proftiable Profitable .farm . farms farms farms
P.ate e?rned on investment 6.8% 13.1 --7% Labor and l·fanagernen t 1'i age $2,065 $4,099 $139 Si ze of Business:
Acres in Farm 286 . . 2S8 285 Acres in Cropland a:l9 219 182 lmn Equi valent 1.7 1.6 1.6 Productive work units 380 : ·. . 415 332 Lives tock units 49·3 66.4 34!1 Cows milked 5·9 5-2 6.1 Litters of pigs 11. 7 .. 15·3 7-9 Pigs '"eaned 73-2 96.6 48.6 Cattle on feed 13.6 22.4 8.2 Nuinber of hens 211 205 216
Volume . of production Bushels of grain ···
Corn 2,4o3 3,012 1,481 Oats 598 ... 577 690 ~The at -~724· .. 826 592
. Hay, tons Alfalfa ' 31..2 27 ·3 30.8 Silage .· 12.7 ---13. 5 9.8 Other hay 11.9 12.2 14.1
Livestock and prpducts Lbs. of hogs prod~ced 19,759 26,453 11,816 Cattle sold 22.9 28.9· 15.4 Dairy sales $746 $592 $867 Egg sales $738 $629 $799
. . . '•
Rates_ of production . -. ·~· ~ . : Crop yields
Corn .. . . . 30.7 31.8 26 ~ .. .
Oats 21.9 19.6 27.6 " Whea~ ' 14.5 17.1 12.0 Alfalfa. 2.0 2.1 1.7
Pigs '¥eaned per 1~tt.er . . . : ' 5.4 5-6 4.4
Dairy Sales per. co~..r . .. .. $102.12 $89-31 $116.27 Ee~ Sales per hen 3-34 3-10 3-51
29294 jg-10 /46

~:1:2-
Ta·ole 8 (Continued)_ . . , , .. _
Averages for:
. Your Farm
16 :nost 48 Profitable
Farms Farms
16 least Profi t c-,ble F.arms
:Efficiency ?reductive man work ~~its ac
complished ~er worker 223
Power, machinery a~d labor· cost per productive man ~tJork unit $1,099 912 $1,216
Returns from productiv-e livestock per $100 wor'th of feed fed 151 l4o
:B alance . . Percentage productive work spent
on crops
Percentage of productive work spent on lives tock
Productive livestoc~uni-ts per 100 acr e s in f2Xm
SIZE oF ::susnrnss
37-l
62.9 64.6
-22.6
This factor can be controlled to a considerable extent by the operator. H.e ·can usually- (1) rent or buy additional land. (2) increase the number of livestock ," (J) change from lo,·r labor requiring animals such as beef cattle and -sheep to high labor requiring 8.nimals such as dairy cattle a.~d poul t!"y , (4) or shift froi:l extensive type crops such as hay and pasture to intensive· crops like corn and soybea~s. if his l&~d is suitable for these crops.
36.4
14.0
The enterprises included in the business should be adjusted to the use suitability of the land and to the other resmrrces available on the fpxm, such as the ~~ount of capital for providing livestock and equipment, and the number of the family workers. Intensive crops ca~ be planted several years in succession on fertile level land. Rolling land that is subject to serious erosipn ·should be kept in hay and pasture crops a considera.ble part of the time. : If the operating unit is made up of this t ;rpe of land, the most feasible method of adjustment may be an expansion of the acreage so enough hay ana pasture is available to feed a good dairy herd. The ty-pe of adjustment that '. should be t~ade depends to a large exten-t upon -the physical . .Characteristics of the available land.
29294jg-10/46
I
l
I
t

.l
-13-
A wide diversity of ent~rprises are included in this group of Southeaste rn Nebra.ska farm businesses. For this reason the average anount of labor required to take care of all ent11r prises is used as a measure of size in Table 9. Farms on ,.,.hich the crops and livestock reouired an averag e of 580 units of productive work returned $3 ,001 labor income . Those reg~iring only 218 uni t s returned $1,508 f or labor and managemen t of the operator .
Table 9 · Relation of size of business to labor income on 48 Southeastern Nebraska farms, 1945 account records .
Range
270 and below 271 to 4ol 4ol a nd above
Average
CROP YIELDS
Numb er of
farms
16 16 16
Average labor income
$1 , 508 $1,701 $3,001
i'lithin t he J.imi ts of proven pra ctices in D...7J. a rea, h i gh r a te£' of producti on t end. to lOi•!er the cost p er unit and increas e the net returns. This statement does not mean t!la:t a ID8.!"1 ca n increase his net gain on a crop like corn b y cultivating it five tioes instead of t h ree to get a few addi tional pounds p er acre, or t hat he will profit by feeding his milk cows in a mann er that \oTill give him the greatest number o±' pounds of milk each cow will produce. The value of the increased product must equal or ex ceed the cost of getting it or the a dded expense w·ill red.uce the ne t income. Crop yields can be increas ed by u s i ng l egu mes in a s ys t emP..tic rota tion, by pl r-mt ing the best ad~pted varie ti es, by cons erving moisture t hro gh contour or subsurface tillage, and by ge tting e c>.ch t ~'Jle of 'Jrork done in its proper season •
Operators who~e yields were only 84 p er cent of the average for all f o.r :ns r ec etv ed $1 , 8l59 f or thei r l abor and manag<·ment . Those ~vho obtained ~.rie lds avera.ging 20 pt~r cen t above tee av erag e of the ent i ~· e group rece i ved $2 , 276 for the ir l abor income .
The rate of g " in on f a t t ening. animals, the quantity of milk · produced per co"', and t be number of eggs l a i d p e r hen can b~? incr eased by · f eeding b;:;.lanced rations.
Table 10. Relation of crop vields to labor income on 48 Southeastern Uebrasr.:a f.a.rms, -1945 records.
Crop Yield I ndex RaP~e Av erag e
92 and below s4 93 to 107 100
107 and above 120
29294jg-l0/46
Number of f arms
18 16 14
Aver c.~ge Labor Income
$1,889 $2,094 $2 , 276

-14-
LIVEs roc~ .
Most of the farme r s in Southeastern Nebraska keep enough livestock to consume the grain and hay they grow . A few who fe~d large numbers of ca.ttl.e or hogs' or \oJho have large dairy herds .. ouy some feed from the minority '~ho are cash crop operators, _If efficiently managed, livestock usually return a profit in excess of the mex,~et prices of tee feed they consume. They convert grass a~d crop residues into salable products, help in maintaining soil fertility by leaving ~ manure on the farm, aDd help to provide productive employment for the farm frumily throughout the year. Careful selection for high r a tes of production in proportion to feed consumed, control of dise?..ses and parasites;·· bel anced r ati "'ns, a:'ld skill in feeding ~md me.n~ing the ru1imals are ti1e principal problems e.ssocie.ted -ri th livestock production . l•ien who P.re proficient in these tasks usually receive good returns f or tteir l abor . Da ta in Table 11 shows the relationship behreen the number of animal units on farms and labor income. Operators 1.orith an average of 17 .9 units of productive livestock received $1,347 labor income . Those who had 91.4 units Teceived t he largest sum of $3,081 for their l abor and management . · ·
In 1945 the men who had beef cattle ~nd hogs received higher labor incomes than t hose who had dairy catt le. This situation probably refle cts the fact th8.t . the ceiling price on milk aDd bu tterf?.t did not give t}le operator very high t-Jages for t~e time spent milking covrs.
Table .11. Relation. of anime.l. lli"'li ts of prod",lctive livestock to l~bor income pn 48 Southeastern Nebraska farms, 1945 account rec.ords .
Animal Unite Number Aver age of Labor
Range Avere.ge farms I-r.come
30 and below 17.9 16 $1 , 347 31 to 51· 38.6 16 1,782 51 and nbove 91.4 16 3,081
EFFICIEKCY IN T.fU:!l USE OF FEED
... . .. ... T'te value of the f eed consuincd. by the animals usually is 50 t o 85 per cent of the cost in livestock production . The exe.c t proportion that feed is or the total cost varies with the cl~ss of llve~tock , the nuober of animals on the individuals far m, t he tJ~e of equipment, and the managerial ability of the herdsman. The cash receipts and net
. inventory ir>~cl~e.ases from lives t ock a.Dd ru1imal products were enough to leave a marg in above the value of the feed fed on most of the farms.
29294jg-l0/46
' <
I
l.
(,J
-15-
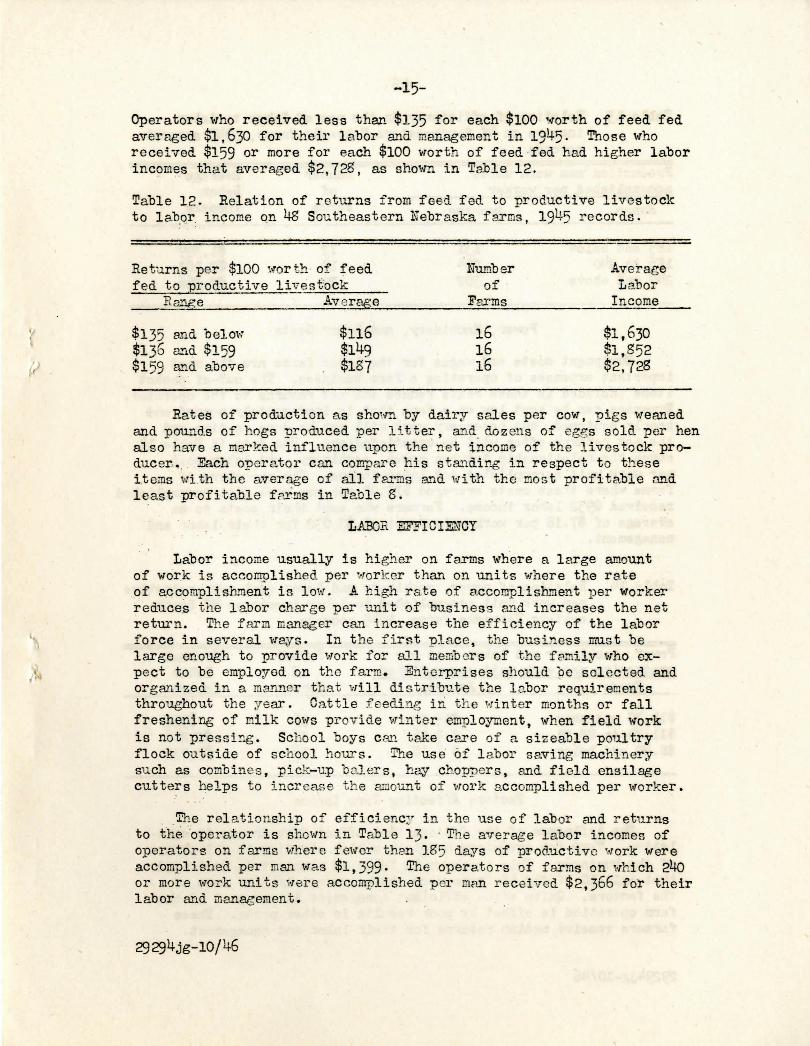
Operators who received less than $135 for each $100 ·~orth of feed fed aver8ged $1,630 for their labor and management in 1945. Those who received $159 or more for each $100 worth of feed ·fed had higher labor incomes that averaged $2,728, as shown in Table 12.
Table 12. Relation of r eturns from feed fed to productive livestock to l abpr : income Qn 48 Southeast ern Nebraska farms, 1945 records .
Retu rns per $100 wor th- of feed Number Average f ed to Eroductive livestock of Le.bor
Ra.71ge Av er age Farms Income
$135 and bela;.: $116 16 $1,630 $136 a'ld $159 $149 16 $1,852 $159 and abov-e $187 16 $2,728
Rates of production e.s shmm by dairy sales per cow, pigs 'l'reaned and pounds of hogs produced per litter, and_ doz ens of eggs sold per hen also have a merked influence upon t he net income of the livestock producer. •.. Each operator can compare his standii"_g in respect to these items wi .th the average of all farms a'ld tv i th the mos t profite.b1e nnd least profitable f.?.l~!lls in Table S .
LABOE ~'B'ICIENCY
_Labor income usually is higher on farms where a lc-.rge amount of work is accomplished per <·rork er than on units where the r ate .of accomplishment is lo1:1 . A high r a te of accomplis:b..ment :per worker reduces the labor charge per unit of business and increases the net return. The farm manager call increase the eff iciency of the labor force in several ways. In the firs t place, the business mus t be large enough to provide vork for all memb ers of the femily who ·exp ect to be employod on tho farm. Enterprises should pe selected and organized in a maTmer that \·Till distribute the l abor requirements throughout the year. Cattle fe eding i n t h e Hinter months or fall freshening of I!lilk CO\vS provicle \'linter employment, when field work is not pressing . Scl-ool boys c ar: take care of a sizeable poultry flock outside of sch ool hours . T:r'J.e use of l abor saving machinery su ch as co;:nbine s , pick- up bal ers, hay chopp ers, and fi eld ensilage cutters helps to :1.ncrease tr e amount of \..rork accomplished per "'orker .
. . The rel ationship of efficienc.r in the use of labor and returns to the ·.operator is shcvrn in Table 13. · The average labor incomes of operators on far!!ls 'Yfhere f ev;er than 185 days of proctuctivo vork were accomplished per man was $1,399· The operators of farms on vhich 24o or more 11rork units \vere accomplished per man re cei •red $2,366 for their labor a.:."l.d management.
29294jg-10/46

-16-
Table 13. Relation of eff iciency in t he us e of labor to labor incomes on 48 Southeastern Nebra s ka farms, 1945 account records.
Production man "~>rork U..Tli ts Number accompli shed. :Qer worker of
Range Aver age Farms
185 and belo'l!r 131 12 186 to 24o 214 14 24o and above 302 22
Power , Mach inery, a..Tld Labor Costs
Aver age Labor I ncome s
$1,399 $2,181
. $2,366
Equi pmen t costs and \·lages for t he l abor for c e a re the most i mpo·r t an t exp enses of oper ating a f arm business . T:Ce ou t-of po cke t items included i n thes e cost s reduce t he ne t re t urns to t h e op er ator. Exp enses c an be kep t low on a far.n t ha t i s inadeque.tcly manned and poor ly egui .o-p ed, but n ecess ro.·y l·!ork will not b e done on time and the net r eturns of t en \oJill b e unsatis f ac t or y . The data in Table 14 gho"'s t he rel ationshi p beh·1een po~-rer , machiner y , and l a·oor cost per work unit ac co;npli s:ted and l ab or j_n co!lle . The oper a t or·s of farms ~·:here t:h.es e costs averf!g ed $15 .94 per man 11To r k UJJ. i t a ccomplished r ece i ved. $932 l abor i ncome . Farmer s 1.;-ho kep t t h ei r cos t s to a.11
av e r age of $7 .18 p er \vork unit recei v ed $3,032 f or t heir l abor and · mane>.gem en t .
Tabl e 1u. Rel a t ion of p o1trer, mach i ner y and l abor co s t per product ive man "~<rork uni t accomplish ed to l abor i ncome on 48 So"utheas t ern Nebr a ska farms, 1945 records .
Pm,rer, machi ner y and l abor cost p er pro due t i v e man 1:1or k uni t accompli shed
Range · Ave r a.ge
$11.75 an~ above $11.(4 to $8 .51 $8 . 50 and b etow
·$15-94 $ 9 .86 $ 7.18
Numb er of
Farms
16 16 16
Fa c tors Affectir~ Farm I ncome
Aver age Labor
Income
The influence of t he factors that affect f ar m i ncome is cumul a ti ' e . Ver y f ew oper ators ma i nt a.i n a h :l.sh standing i n al l phas es of the busin es s . T:11is i s shotm .in Tabl e 15 ¥!here it is indicated t ha t onl y 10 of the 48 f arms •rere abov e aver qge in 5 or more of the fC~.ctors. Quite of ten ef fi cient m8n agement in one p art of t l:e farm op er ati on is offset by poor results i n ot h er par ts . The se far mers r eceive medi um r eturns for t heir labor and management.
29294jg-l0/46
I

I') I
-17-
Tho s e who are l ow in all factors get small r eturns . The fe-,, ,.,ho maintai n a high standing in mo s t phases of the business receive r eturns '"ell ab ove t he ~wer a.€e.
Table 15 . F.el a t i on of ntl..ll'b er of f a c t or s aboYe aver ag e t o l ab or income on 48 Sou t heas t er n 1\ebr a ska f er ms, 1945 ac count r e cords .
Number of fac t ors abov e aver age Numb er of Aver age labor f arms income
0 t h r ough 1 12 $929
2 12 $1 ,889
3 t hrough 4 14 $2, 100
10 $3, 615 ,... or mor e J
29294jg- l0/46
Related Documents